Corporate Debt Issuance and the Historical Level of Interest Rates
18
Corporate Debt Issuance and the Historical Level of Interest Rates Christopher B. Barry, Steven C. Mann, Vassil T. Mihov, and Mauricio Rodr´ ıguez ∗ Using a sample that comprises more than 14,000 new issues of corporate debt for the period 1970-2001, we examine the relation between debt issues and the level of interest rates relative to historical levels. Consistent with recent survey evidence, we find that companies issue more debt, more debt relative to investment spending, and more debt compared to equity when interest rates are low relative to historical rates. The effects continue to hold when we control for other variables that influence debt issuance and when we account for refinancing. In the neoclassical theory of investment, a drop in the cost of capital results in increased investment spending. As firms increase their investments, all else equal, they also tend to issue new debt to finance a portion of those investments. Thus, debt issuance can be a function of the level of capital investment by firms. Alternatively, firms may try to time debt issuance if they believe that interest rates are advantageous relative to where rates were previously. We define “timing of interest rates” as the practice of issuing debt, relative to financing needs and capital expenditures, when interest rates are low compared to historical levels. We provide evidence that links debt issuance to changes in interest rates relative to their his- torical levels. To distinguish between a timing theory and a more standard neoclassical story, we ask whether firms issue more debt relative to their investment plans (capital expenditures) or relative to equity issuance, following changes in interest rates. We find that past interest rates have prominent effects on the issuance of debt: when current interest rates are low rel- ative to historical levels, firms tend to issue more debt. These effects occur even after we account for other factors that can lead to debt issuance, such as capital expenditures, refinancing, firm size and profitability, the level of corporate cash flow, interest rate spreads, and equity valuation. Consistent with Graham and Harvey’s (2001) survey evidence that “managers attempt to time interest rates by issuing debt when they feel that market interest rates are particularly low,” we The authors are grateful to Stan Block, Mike Cliff, Michel Dubois, Espen Eckbo, Wayne Ferson, John Graham, Robin Greenwood, Robert Kieschnick, Erik Lie, Steve Lim, Pete Locke, Ehud Ronn, Andy Waisburd, the seminar participants at the 2004 Winter Finance Workshop, the 2004 European Meetings of the Financial Management Association, the 2004 Meetings of the Financial Management Association, the University of Alabama, University of Connecticut, Ohio University, and the editor and referees for their helpful comments. We appreciate helpful discussions about corporate borrowing strategies and practices with Tom Hund, CFO, and Linda Hurt, Treasurer, of Burlington Northern Santa Fe. Professors Mann, Mihov, and Rodriguez acknowledge research funding from the Charles Tandy American Enterprise Center and the Luther King Capital Management Center for Financial Studies at Texas Christian University. ∗ Christopher B. Barry is a Professor of Finance and the Robert and Maria Lowdon Chair in Business Administration, M.J. Neeley School of Business at Texas Christian University, Fort Worth, TX. Steven C. Mann and Vassil T. Mihov are Associate Professors of Finance, M.J. Neeley School of Business at Texas Christian University, Fort Worth, TX. Mauricio Rodr´ ıguez is a Professor of Finance and Real Estate, M.J. Neeley School of Business at Texas Christian University, Fort Worth, TX. Financial Management • Autumn 2008 • pages 413 - 430
-
Upload
independent -
Category
Documents
-
view
0 -
download
0
Transcript of Corporate Debt Issuance and the Historical Level of Interest Rates

Corporate Debt Issuance and theHistorical Level of Interest Rates
Christopher B. Barry, Steven C. Mann, Vassil T. Mihov,and Mauricio Rodrı́guez∗
Using a sample that comprises more than 14,000 new issues of corporate debt for the period1970-2001, we examine the relation between debt issues and the level of interest rates relativeto historical levels. Consistent with recent survey evidence, we find that companies issue moredebt, more debt relative to investment spending, and more debt compared to equity when interestrates are low relative to historical rates. The effects continue to hold when we control for othervariables that influence debt issuance and when we account for refinancing.
In the neoclassical theory of investment, a drop in the cost of capital results in increasedinvestment spending. As firms increase their investments, all else equal, they also tend to issuenew debt to finance a portion of those investments. Thus, debt issuance can be a function of thelevel of capital investment by firms. Alternatively, firms may try to time debt issuance if theybelieve that interest rates are advantageous relative to where rates were previously. We define“timing of interest rates” as the practice of issuing debt, relative to financing needs and capitalexpenditures, when interest rates are low compared to historical levels.
We provide evidence that links debt issuance to changes in interest rates relative to their his-torical levels. To distinguish between a timing theory and a more standard neoclassical story,we ask whether firms issue more debt relative to their investment plans (capital expenditures)or relative to equity issuance, following changes in interest rates. We find that past interestrates have prominent effects on the issuance of debt: when current interest rates are low rel-ative to historical levels, firms tend to issue more debt. These effects occur even after weaccount for other factors that can lead to debt issuance, such as capital expenditures, refinancing,firm size and profitability, the level of corporate cash flow, interest rate spreads, and equityvaluation.
Consistent with Graham and Harvey’s (2001) survey evidence that “managers attempt to timeinterest rates by issuing debt when they feel that market interest rates are particularly low,” we
The authors are grateful to Stan Block, Mike Cliff, Michel Dubois, Espen Eckbo, Wayne Ferson, John Graham, RobinGreenwood, Robert Kieschnick, Erik Lie, Steve Lim, Pete Locke, Ehud Ronn, Andy Waisburd, the seminar participantsat the 2004 Winter Finance Workshop, the 2004 European Meetings of the Financial Management Association, the2004 Meetings of the Financial Management Association, the University of Alabama, University of Connecticut, OhioUniversity, and the editor and referees for their helpful comments. We appreciate helpful discussions about corporateborrowing strategies and practices with Tom Hund, CFO, and Linda Hurt, Treasurer, of Burlington Northern Santa Fe.Professors Mann, Mihov, and Rodriguez acknowledge research funding from the Charles Tandy American EnterpriseCenter and the Luther King Capital Management Center for Financial Studies at Texas Christian University.
∗Christopher B. Barry is a Professor of Finance and the Robert and Maria Lowdon Chair in Business Administration,M.J. Neeley School of Business at Texas Christian University, Fort Worth, TX. Steven C. Mann and Vassil T. Mihov areAssociate Professors of Finance, M.J. Neeley School of Business at Texas Christian University, Fort Worth, TX. MauricioRodrı́guez is a Professor of Finance and Real Estate, M.J. Neeley School of Business at Texas Christian University, FortWorth, TX.
Financial Management • Autumn 2008 • pages 413 - 430
414 Financial Management • Autumn 2008
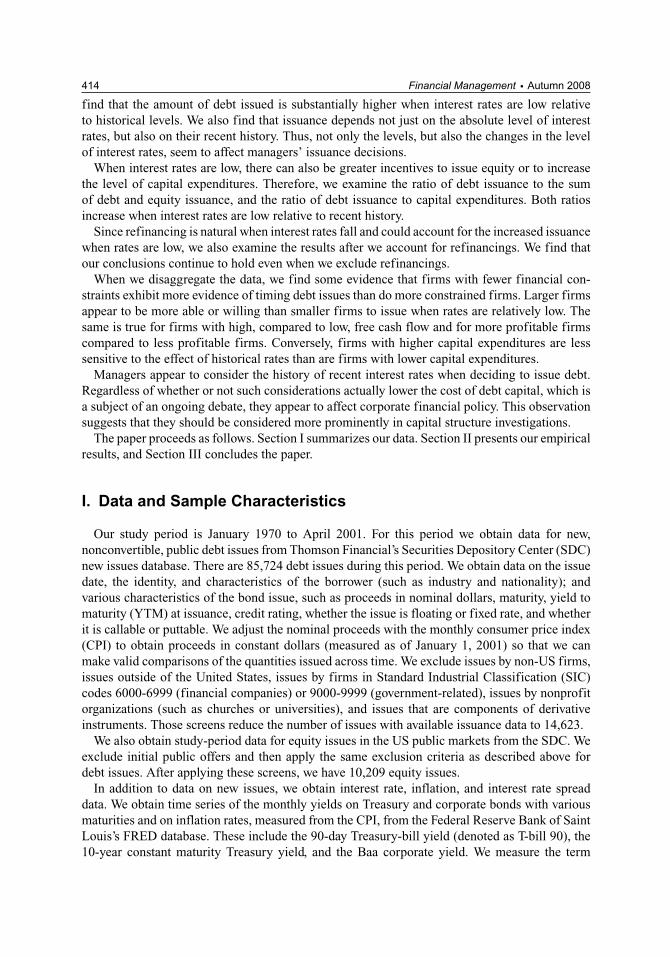
find that the amount of debt issued is substantially higher when interest rates are low relativeto historical levels. We also find that issuance depends not just on the absolute level of interestrates, but also on their recent history. Thus, not only the levels, but also the changes in the levelof interest rates, seem to affect managers’ issuance decisions.
When interest rates are low, there can also be greater incentives to issue equity or to increasethe level of capital expenditures. Therefore, we examine the ratio of debt issuance to the sumof debt and equity issuance, and the ratio of debt issuance to capital expenditures. Both ratiosincrease when interest rates are low relative to recent history.
Since refinancing is natural when interest rates fall and could account for the increased issuancewhen rates are low, we also examine the results after we account for refinancings. We find thatour conclusions continue to hold even when we exclude refinancings.
When we disaggregate the data, we find some evidence that firms with fewer financial con-straints exhibit more evidence of timing debt issues than do more constrained firms. Larger firmsappear to be more able or willing than smaller firms to issue when rates are relatively low. Thesame is true for firms with high, compared to low, free cash flow and for more profitable firmscompared to less profitable firms. Conversely, firms with higher capital expenditures are lesssensitive to the effect of historical rates than are firms with lower capital expenditures.
Managers appear to consider the history of recent interest rates when deciding to issue debt.Regardless of whether or not such considerations actually lower the cost of debt capital, which isa subject of an ongoing debate, they appear to affect corporate financial policy. This observationsuggests that they should be considered more prominently in capital structure investigations.
The paper proceeds as follows. Section I summarizes our data. Section II presents our empiricalresults, and Section III concludes the paper.
I. Data and Sample Characteristics
Our study period is January 1970 to April 2001. For this period we obtain data for new,nonconvertible, public debt issues from Thomson Financial’s Securities Depository Center (SDC)new issues database. There are 85,724 debt issues during this period. We obtain data on the issuedate, the identity, and characteristics of the borrower (such as industry and nationality); andvarious characteristics of the bond issue, such as proceeds in nominal dollars, maturity, yield tomaturity (YTM) at issuance, credit rating, whether the issue is floating or fixed rate, and whetherit is callable or puttable. We adjust the nominal proceeds with the monthly consumer price index(CPI) to obtain proceeds in constant dollars (measured as of January 1, 2001) so that we canmake valid comparisons of the quantities issued across time. We exclude issues by non-US firms,issues outside of the United States, issues by firms in Standard Industrial Classification (SIC)codes 6000-6999 (financial companies) or 9000-9999 (government-related), issues by nonprofitorganizations (such as churches or universities), and issues that are components of derivativeinstruments. Those screens reduce the number of issues with available issuance data to 14,623.
We also obtain study-period data for equity issues in the US public markets from the SDC. Weexclude initial public offers and then apply the same exclusion criteria as described above fordebt issues. After applying these screens, we have 10,209 equity issues.
In addition to data on new issues, we obtain interest rate, inflation, and interest rate spreaddata. We obtain time series of the monthly yields on Treasury and corporate bonds with variousmaturities and on inflation rates, measured from the CPI, from the Federal Reserve Bank of SaintLouis’s FRED database. These include the 90-day Treasury-bill yield (denoted as T-bill 90), the10-year constant maturity Treasury yield, and the Baa corporate yield. We measure the term

Barry, Mann, Mihov, & Rodrı́guez • Corporate Debt Issuance 415
spread as the difference between the 10-year constant maturity Treasury yield and the T-bill 90yield, and we measure the default spread as the difference between the Baa yield and the 10-yearconstant maturity Treasury yield.
We also obtain Compustat data for the issuers. We obtain firm Compustat data for 9,614 ofthe 14,623 issues, or approximately two-thirds of our issuance sample. For some of our tests, weobtain firm-level data on capital expenditures (Compustat data item 128). For each debt-issuingfirm, we aggregate the annual amount of debt issued (from the SDC) and scale it by annual capitalexpenditures. The number of observations in our firm-level tests varies due to the availability ofdifferent data items. We also collect data that characterize (in the aggregate) the stock market,such as the price-earnings ratio and market-to-book value ratio of the S&P 500 index (from CRSPand Compustat).
In Figure 1, Panel A shows the patterns of the SDC’s monthly debt issuance. Panel B shows theCompustat annual net debt issuance compared to mean monthly Baa yields. Compustat debt datainclude bank debt, which firms could use as a substitute for public debt. We calculate Compustatnet debt issues, which we obtain from the cash flow statement, as data item 111 (issuance oflong-term debt) minus data item 114 (reduction in long-term debt). We measure Compustat grossdebt issuance as data item 111. We use the CPI to convert the dollar amounts into January 2001dollars. For ease of comparison, we divide annual Compustat issuance by 12 to show the averagemonthly issuance. We exclude financial firms and foreign issuers on Compustat.
Both panels in Figure 1 show that debt issuance tends to increase when interest rates drop.When we compare the panels, Panel A shows considerable within-year variations in yields anddebt issuance, thus confirming the benefit of using monthly data to examine timing attempts.The correlation between the annualized SDC debt issuance and annual Compustat net (gross)debt issued is 35% (78%), and the correlation between the annualized SDC debt issuance and theannualized Baa yield series is –54%. In comparison, the correlation between the Baa yield andthe Compustat net (gross) issuance is –18% (–47%).
Table I provides stylized facts about debt issuance and shows yields on issued debt, Treasurybills, and 10-year Treasury securities over the sample period. Measured in January 2001 dollars,the total amount of debt issued in our sample is $2.60 trillion. The largest dollar amount of issuesin a single year is $182 billion in 1993, which coincides with the second largest number of issues(1,049). The year 1993 shows the lowest median level of short-term rates (measured by T-bill90s) and the fourth lowest median level of long-term rates (measured by 10-year Treasuries)across the 32 years of our sample. When we exclude 2001, for which we use only five months ofissuance data, the smallest annual amount raised ($28 billion) and fifth smallest number of issues(221) occur in 1983, when median short-term rates and long-term rates are at their sixth and fifthhighest levels, respectively, across the sample.
Table I shows the ratio of debt issued to the sum of debt and seasoned equity offerings (SEOs).The lowest mean and median values of the ratio occur in 1983, the year that also has the minimumamount of total debt issuance. The highest ratios occur in 1988 and 1989.
Table I also provides an overview of the fraction of issues that were callable or puttable acrosstime. As noted above, we do not report data on callable or puttable debt prior to 1976, since theSDC did not consistently report those features prior to 1976. Overall, about 42% of the issues werecallable. Callability was very common prior to the 1990s, and was used in an average of more than75% of all debt issues. Since 1990, the callability has averaged less than 25% of the debt issues.The year 1981 has the maximum callability level in our sample (88.5%), the same year for whichour data show the maximum yields on debt issues. This finding shows that when the cost of debtis highest, the greatest percentage of callable debt is issued. Callability provides companies withthe ability to reduce the effective maturity of their debt issues at the highest interest rate levels.

416 Financial Management • Autumn 2008
Figure 1. Monthly Debt Issuance Proceeds and Baa Yields: SDC Compared toCompustat
Panel A shows the monthly amounts issued (right axis) for a sample of 14,623 public debt issues by USnonfinancial firms from January 1970 through April 2001. Panel B shows average monthly net debt issueproceeds by US nonfinancial firms from January 1971 through December 2000. We measure dollar amountsin millions of constant (January 2001) dollars. The Baa yields are shown as lines. The proceeds are shownas bars.

Barry, Mann, Mihov, & Rodrı́guez • Corporate Debt Issuance 417T
able
I.C
har
acte
rist
ics
of
Deb
tIs
sues
Thi
sta
ble
repo
rts
the
annu
alch
arac
teri
stic
sof
asa
mpl
eof
14,6
23pu
blic
stra
ight
debt
issu
esan
d10
,209
seas
oned
equi
tyof
fers
(SE
Os)
byU
Sno
nfin
anci
alfi
rms
duri
ngJa
nuar
y19
70-A
pril
2001
repo
rted
byT
hom
son
Fina
ncia
l.A
mou
nts
are
inm
illi
ons
ofco
nsta
nt(J
anua
ry20
01)
doll
ars.
We
calc
ulat
ede
btas
apr
opor
tion
ofto
tali
ssue
sby
usin
gm
onth
lyde
btis
sue
amou
nts
divi
ded
byth
esu
mof
debt
issu
esan
dS
EO
s.“T
-bil
ls”
are
US
Tre
asur
ybi
lls.
Sin
ceth
eS
DC
does
notc
onsi
sten
tlyre
port
data
onca
llab
ilit
y,pu
ttab
ilit
y,an
dca
llan
dpu
tdat
esun
til1
976,
the
sam
ple
peri
odfo
rth
efr
acti
onof
call
able
issu
es,f
ract
ion
ofpu
ttab
leis
sues
,and
effe
ctiv
em
atur
ity
isJa
nuar
y19
76-A
pril
2001
.
Yea
rN
um
ber
Ave
rag
eA
vera
ge
Fra
ctio
nF
ract
ion
Ave
rag
eM
ean
Mea
n(M
edia
n)
of
Deb
tM
on
thly
(Med
ian
)R
atio
of
Issu
eso
fIs
sues
(Med
ian
)Y
ield
(Med
ian
)10
-Yea
rIs
sues
Am
ou
nt
of
Deb
tto
Th
atW
ere
Th
atW
ere
toM
atu
rity
Yie
ldo
f90
-T
reas
ury
of
SD
CT
ota
lMo
nth
lyC
alla
ble
Pu
ttab
leD
ayT
-bill
sC
on
stan
tD
ebt
Issu
eA
mo
un
tM
atu
rity
Rat
eIs
sued
(Deb
t+
SE
Os)
1970
408
86,0
2788
%(8
8%)
N/A
N/A
9.2
(9.1
)6.
39(6
.48)
7.35
(7.3
9)19
7137
375
,002
68%
(64%
)N
/AN
/A7.
9(7
.8)
4.33
(4.3
3)6.
16(6
.13)
1972
268
45,9
3158
%(5
7%)
N/A
N/A
7.5
(7.5
)4.
07(3
.95)
6.21
(6.1
6)19
7318
537
,997
70%
(69%
)N
/AN
/A8.
0(7
.9)
7.03
(7.2
1)6.
84(6
.77)
1974
291
71,3
7288
%(8
8%)
N/A
N/A
9.5
(9.4
)7.
83(7
.84)
7.56
(7.5
6)19
7539
885
,772
80%
(82%
)N
/AN
/A9.
7(9
.5)
5.78
(5.5
6)7.
99(8
.06)
1976
276
54,8
0372
%(7
2%)
0.73
80.
000
8.8
(8.7
)4.
97(4
.96)
7.61
(7.7
4)19
7725
941
,940
73%
(78%
)0.
765
0.00
48.
5(8
.4)
5.27
(5.1
1)7.
42(7
.40)
1978
211
31,7
9972
%(7
2%)
0.83
10.
005
9.7
(9.3
)7.
19(6
.87)
8.41
(8.4
2)19
7920
338
,415
75%
(75%
)0.
877
0.02
510
.8(1
0.5)
10.0
7(9
.50)
9.44
(9.1
5)19
8031
856
,341
65%
(69%
)0.
840
0.00
612
.8(1
2.5)
11.4
3(1
1.81
)11
.46
(11.
49)
1981
261
42,4
0965
%(6
5%)
0.88
50.
011
15.8
(15.
7)14
.03
(14.
72)
13.9
1(1
3.70
)19
8228
738
,715
58%
(61%
)0.
850
0.05
614
.5(1
4.7)
10.6
1(1
1.72
)13
.00
(13.
74)
1983
221
28,5
5039
%(3
6%)
0.82
80.
081
12.5
(12.
5)8.
61(8
.70)
11.1
1(1
1.12
)19
8421
639
,433
81%
(82%
)0.
704
0.09
313
.9(1
3.6)
9.52
(9.7
2)12
.44
(12.
42)
1985
386
65,4
5577
%(7
7%)
0.77
20.
044
12.2
(11.
8)7.
48(7
.20)
10.6
2(1
0.35
)19
8670
714
9,31
787
%(8
7%)
0.74
80.
038
9.9
(9.4
)5.
98(5
.95)
7.68
(7.4
4)19
8744
189
,786
87%
(90%
)0.
700
0.05
210
.4(9
.9)
5.78
(5.6
8)8.
38(8
.53)
1988
356
77,6
3892
%(9
3%)
0.80
10.
067
10.8
(10.
0)6.
67(6
.60)
8.85
(8.9
4)19
8934
076
,242
90%
(91%
)0.
644
0.15
910
.7(9
.9)
8.11
(8.0
3)8.
50(8
.24)
1990
293
52,1
6383
%(8
5%)
0.31
40.
041
9.8
(9.8
)7.
49(7
.63)
8.55
(8.5
4)

418 Financial Management • Autumn 2008
Tab
leI.
Ch
arac
teri
stic
so
fD
ebt
Issu
es(C
on
tin
ued
)
Yea
rN
um
ber
Ave
rag
eA
vera
ge
Fra
ctio
nF
ract
ion
Ave
rag
eM
ean
Mea
n(M
edia
n)
of
Deb
tM
on
thly
(Med
ian
)R
atio
of
Issu
eso
fIs
sues
(Med
ian
)Y
ield
(Med
ian
)10
-Yea
rIs
sues
Am
ou
nt
of
Deb
tto
Th
atW
ere
Th
atW
ere
toM
atu
rity
Yie
ldo
f90
-T
reas
ury
of
SD
CT
ota
lMo
nth
lyC
alla
ble
Pu
ttab
leD
ayT
-bill
sC
on
stan
tD
ebt
Issu
eA
mo
un
tM
atu
rity
Rat
eIs
sued
(Deb
t+
SE
Os)
1991
605
100,
033
76%
(75%
)0.
188
0.04
69.
0(9
.0)
5.38
(5.5
2)7.
86(7
.97)
1992
852
151,
290
83%
(83%
)0.
344
0.14
18.
3(8
.1)
3.43
(3.4
3)7.
01(6
.95)
1993
1,04
918
1,64
582
%(8
2%)
0.41
00.
189
7.5
(7.1
)3.
00(3
.01)
5.87
(5.8
9)19
9449
772
,288
74%
(77%
)0.
306
0.21
58.
4(8
.0)
4.25
(4.2
4)7.
08(7
.21)
1995
612
91,9
0968
%(7
0%)
0.19
60.
113
7.7
(7.3
)5.
49(5
.45)
6.58
(6.3
9)19
9673
910
5,41
269
%(6
7%)
0.16
50.
146
7.7
(7.2
)5.
01(5
.01)
6.44
(6.5
2)19
971,
003
110,
239
72%
(73%
)0.
062
0.07
77.
1(6
.9)
5.06
(5.0
5)6.
35(6
.36)
1998
1,15
216
9,73
680
%(7
9%)
0.13
10.
082
6.6
(6.5
)4.
78(4
.96)
5.26
(5.4
8)19
9968
014
6,68
766
%(6
9%)
0.12
80.
063
7.0
(6.9
)4.
64(4
.56)
5.64
(5.8
5)20
0051
812
6,39
762
%(6
6%)
0.25
70.
050
7.9
(7.8
)5.
82(5
.78)
6.03
(6.0
2)20
0121
864
,134
84%
(85%
)0.
349
0.04
16.
9(6
.8)
4.58
(4.6
5)5.
07(5
.12)
All
year
s14
,623
2,60
4,87
774
%(7
7%)
0.41
80.
087
9.0
(8.4
)6.
61(5
.81)
8.15
(7.5
7)

Barry, Mann, Mihov, & Rodrı́guez • Corporate Debt Issuance 419
We also examine the relation between call features and interest rate levels. The correlationsbetween callability and the yields on T-bills, 10-year Treasury bonds, and Baa debt are 61%,69%, and 68%, respectively. We also measure the correlation between the fraction of proceedsthat are callable and interest rate volatility, defined as the standard deviation of the yields onBaa-rated debt over 12, 36, and 60 months prior to issuance. The correlations are 40%, 57%,and 60%, respectively. In unreported multivariate analyses, we regress the fraction of proceedsthat are callable on interest rates, interest rate volatility, time dummies, and control variables. Wethen confirm the positive relation between callables and interest rates and rate volatility and thesecular trend toward a decline in callables.
About 8% of the overall debt issues include put provisions, and a similar percentage of issueshave floating rates (not reported). The period prior to 1989 shows very small percentages ofputtable debt issues. During the peak interest rate year (1981), just over 1% of debt issues includeput options. The year 1994 was a year in which the interest rates of debt issues were at aboutone-half the level for 1981. Thus, the 1994 issues have the maximum percentage of put options(21.5%). Despite the relatively low interest rates during the latter few years of our sample, theyears following 1994 show sharply lessened levels of put options.
II. Interest Rate Levels and Debt Issuance
Many factors affect the decisions by companies to issue new debt and the features they selectfor the debt.1 Graham and Harvey (2001) find that managers are interested in the current levelsof interest rates relative to historical rates. They describe the finding as follows: “We inquirewhether executives attempt to time interest rates by issuing debt when they feel that marketinterest rates are particularly low.” They provide “ . . . moderately strong evidence that firms tryto time the market in this sense.”2 We examine the extent to which debt issues are associatedwith the level of interest rates relative to historical levels, and we account for financing needsand capital expenditures. Graham and Harvey also find that “ . . . market timing is especiallyimportant for large firms,” an item that we examine in addition to other characteristics of issuingfirms. Bancel and Mittoo (2004) find similar results from their survey of European financialmanagers. Other studies that suggest timing considerations might affect debt decisions includeTaggart (1977), Marsh (1982), and Faulkender (2005).
A. Interest Rate Levels and Historical Rates
We construct two measures of historical interest rates. The first measure identifies the decileranking of current interest rates against rates over the previous 10 years. The first decile refersto rates that were below the 10th percentile of average monthly rates in the prior 10 years. Thesecond decile pertains to those rates from the 10th percentile to below the 20th percentile, andso on. Like Graham and Harvey (2001), we also refer to the rates as “low” if they are in one of
1Studies that examine factors related to decisions to issue debt include Fisher (1930), Myers (1977), Myers and Majluf(1984), Diamond (1991), Barclay and Smith (1995), Guedes and Opler (1996), Hoven and Mauer (1996), Jung, Kim, andStulz (1996), Houston and James (1996), Hovakimian, Opler, and Titman (2001), and Brounen, de Jong, and Koedijk(2004), among others.2John Graham explained in private communication with us on this topic that although CFOs in the Graham and Harvey(2001) survey were not explicit about what “particularly low” meant to them, it was his interpretation, based in part onhis conversations with the executives who responded to their survey, that they were referring to current interest ratescompared to their historical levels.

420 Financial Management • Autumn 2008
the bottom three deciles, as “high” if they are in one of the top three deciles, and “medium” forrates in the middle deciles. A given interest rate could be high or low relative to historical rates.For example, each of the 10-year constant maturity Treasury rates from 5% to 9% are relativelylow rates in some periods and relatively high rates in other periods. A manager who faces a 10%cost of new debt might be more willing to issue debt at that rate if it is among the lowest rates inrecent memory.
Our second method of accounting for historical rates is to use the lagged values of interestrates, in addition to their current value.
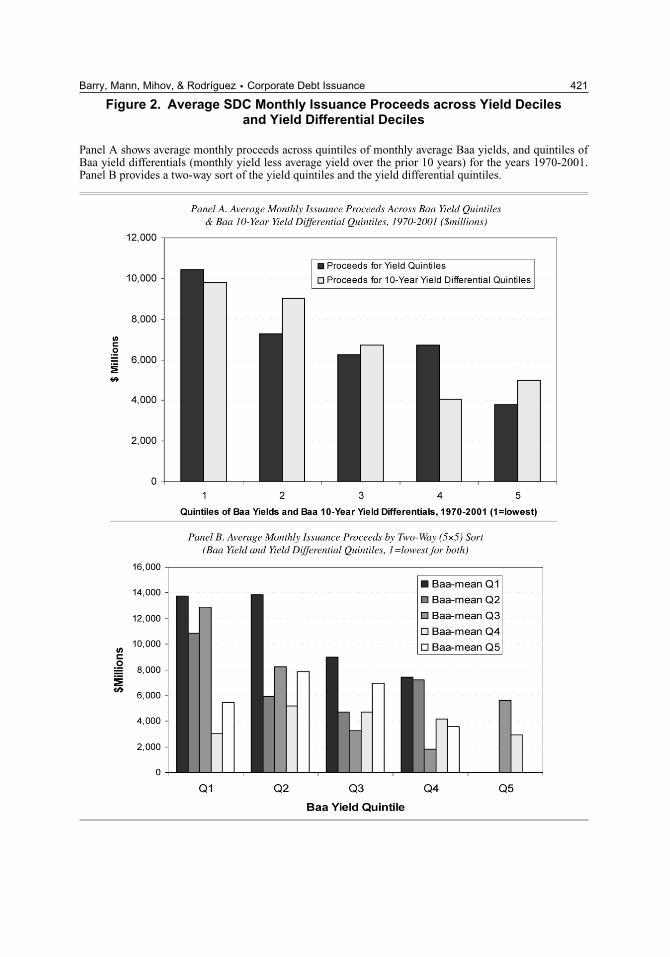
Figure 2 illustrates the point using quintiles of current interest rates relative to historical levels.3
Panel A shows the average monthly SDC debt issue proceeds across quintiles of monthly averageBaa yields. We define 1 as the lowest quintile and 5 as the highest. Clearly, more debt is issuedwhen yields are lower.
Panel A also shows the average monthly proceeds across yield differential quintiles. We identifyyield differential quintiles based on the difference between the current month’s Baa yield and theaverage yield over the prior 10 years. Thus, quintile 1 represents the lowest differential. Moredebt is issued when yields are low as well as when they are low compared to the average yieldover the prior 10 years.
Panel B of Figure 2 illustrates both the level effect (the raw yield level) and the change effect(the deviation from the past 10-year average) by using a two-way sort to compare the averagemonthly proceeds against the quintiles of monthly yields and yield differentials. For example,Panel B shows that the highest amount of debt issues occurs when yields are low and the 10-yearyield differentials are also low. Panel B shows that both the level of the yield and the 10-yearyield differential appear to affect issuance. Proceeds are generally highest in months in whichrates are lower than the prior 10-year average. Thus, Panel B demonstrates a tendency towarddebt issuance when interest rates are low relative to prior levels.
We note that several of the two-way sort categories have no observations. For example, thereare no months in which the yield is at the highest-level quintile and also at the lowest quintileof the 10-year yield differential. Similarly, there are no months with lowest-quintile yields buthighest-quintile 10-year yield differentials.
B. Debt Issuance, Interest Rates, Spreads, and Growth
Table II provides ordinary least squares (OLS) tests that incorporate a number of variables thatmight affect debt issuance. These variables include interest rates (either 10-year constant maturityTreasury rates or Baa rates), rate deciles (relative to historical rates), credit and term spreads,and price-earnings and market-to-book ratios, factors that indicate market growth. In half of theregressions, instead of interest rate deciles, we use five-year and 10-year lagged rates.
We are concerned that debt issuance might occur not because of low rates relative to historicallevels, but because of attractive credit spreads and term spreads. Thus, the regressions in Table IIincorporate such spreads. The term spreads, which we measure as the difference between 90-dayT-bills and 10-year Treasuries, are not significantly associated with debt issuance. Credit spreads,which we measure as the difference between the 10-year constant maturity Treasury rates andBaa rates, are significantly and positively associated with debt issuance. This finding indicateshigher credit spreads during periods of high issuance. The positive association is not consistentwith attempts to time the credit spread, but it is consistent with timing the level of rates. Unlessthe demand to purchase debt issues increases along with the increased supply of debt issues at low
3We thank an anonymous referee for suggesting the figure.
Barry, Mann, Mihov, & Rodrı́guez • Corporate Debt Issuance 421
Figure 2. Average SDC Monthly Issuance Proceeds across Yield Decilesand Yield Differential Deciles
Panel A shows average monthly proceeds across quintiles of monthly average Baa yields, and quintiles ofBaa yield differentials (monthly yield less average yield over the prior 10 years) for the years 1970-2001.Panel B provides a two-way sort of the yield quintiles and the yield differential quintiles.

422 Financial Management • Autumn 2008
Table II. Debt Issued across Relative Rates and Growth Measures
This table presents OLS tests of the monthly amount of debt issued (Panel A), the ratio of debt to secondaryequity offers (SEOs) (Panel B), and the firm-level ratio of the annual amount of debt issued to the annualcapital expenditures (Panel C) as a function of the historical distribution of interest rates, interest rate levels,and control variables. The sample consists of 14,623 public straight debt issues and 10,209 SEOs by USnonfinancial firms during 1970-2001. Amounts are in millions of constant (January 2001) dollars. Wemeasure all independent variables as of the month immediately preceding the month of issuance. Baa isthe Moody’s Seasoned Baa Corporate Bond Yield. The Baa decile is the decile rating of the rate at thetime of issuance among rates over the prior 10 years. We define term spread as the difference betweenthe 10-year Treasury constant maturity rate and the yield on 90-day T-bills. We define credit spread as thedifference between Baa and 10-year Treasury constant maturity rate. Parameter estimates show p-valuesin parentheses. In Panel C, for each firm-year, we calculate the annual amount of debt issued reported byThomson Financial. We then form the ratio of annual amount of debt issued to annual capital expenditures(Compustat item 128). We measure the independent variables as of the end of the year of issuance.
Panel A. Amount Issued per Month in 2001 Constant Dollars
Intercept 3,018.4∗∗ (0.033) 5,174.7∗∗∗ (0.000) −250.3 (0.854)Baa decile −360.9∗∗∗ (0.000) −411.0∗∗∗ (0.000)Level of Baa atissuance, %
−257.5∗∗ (0.014) −397.9∗∗∗ (0.000) −550.4∗∗∗ (0.000)
Credit spread 2,336.8∗∗∗ (0.000) 2,754.5∗∗∗ (0.000) 2,471.7∗∗∗ (0.000)Term spread −263.8∗ (0.057) −100.8 (0.497) −278.1∗∗ (0.040)S&P 500 P/E ratio 249.4∗∗∗ (0.000) 241.6∗∗∗ (0.000)S&P 500 market/book ratio 1,179.1∗∗∗ (0.000)Baa lagged 60 months 180.0∗∗ (0.018)Baa lagged 120 months 286.8∗∗∗ (0.000)Adjusted R2 0.48 0.464 0.497Number of observations 375 375 375
Panel B. Proportion of Debt Issued to Total Issues (Debt Plus SEOs)
Intercept 1.115∗∗∗ (0.000) 1.111∗∗∗ (0.000) 0.901∗∗∗ (0.000)Baa decile −0.017∗∗∗ (0.000) −0.018∗∗∗ (0.000)Level of Baa at issuance, % −0.018∗∗∗ (0.000) −0.017∗∗∗ (0.000) −0.030∗∗∗ (0.000)Credit spread 0.031∗ (0.071) 0.024 (0.126) 0.018 (0.280)Term spread −0.004 (0.568) −0.014∗∗ (0.027) −0.003 (0.619)S&P 500 P/E ratio −0.010∗∗∗ (0.000) −0.007∗∗∗ (0.000)S&P 500 market/book ratio −0.070∗∗∗ (0.000)Baa lagged60 months
0.021∗∗∗ (0.000)
Baa lagged120 months
0.003 (0.330)
Adjusted R2 0.114 0.137 0.179Number of observations 375 375 375

Barry, Mann, Mihov, & Rodrı́guez • Corporate Debt Issuance 423
Table II. Debt Issued across Relative Rates and Growth Measures (Continued)
Panel C. Firm-Level Ratio of Debt Issued Divided by Capital Expenditures
Intercept 3.610∗∗∗ (0.000) 3.234∗∗∗ (0.000) 1.149∗∗ (0.031)Baa decile −0.022∗∗∗ (0.000) −0.019∗∗∗ (0.000)Level of Baa atissuance, %
−0.037 (0.391) −0.012 (0.783) −0.156∗∗∗ (0.000)
Credit spread 0.173 (0.216) 0.004 (0.977) −0.251∗ (0.085)Term spread 0.068 (0.133) 0.036 (0.445) 0.127∗∗∗ (0.004)S&P 500 P/E ratio −0.057∗∗∗ (0.000) 0.018 (0.239)S&P 500market/book ratio
−0.245∗∗∗ (0.002)
Baa lagged60 months
0.258∗∗∗ (0.000)
Baa lagged120 months
−0.033 (0.277)
Adjusted R2 0.021 0.020 0.029Number ofobservations
4,314 4,314 4,314
∗∗∗Significant at the 0.01 level.∗∗Significant at the 0.05 level.∗Significant at the 0.10 level.
rates, then during periods of high supply relative to demand, the demand and supply interactionshould lead to lower relative bond prices and thus to higher credit spreads.
A second concern on the apparent relation between issuance and relative interest rates is thatlow relative interest rates might also reflect high contemporaneous levels of corporate growthexpectations. Such a result would be consistent with the neoclassical theory of investment, sinceincreased investment could be a natural part of the growth expectations. To account for thepossibility of such effects, in Table II we include two measures that characterize market-widegrowth expectations, the price-earnings (P/E) ratio, and the market price-to-book value ratio(M/B) for the S&P 500 index.
Even after we incorporate the spread and growth variables, the historical interest rate decilesremain highly significant. The highest levels of debt issuance occur when growth proxies are highand interest rates are historically low. The lowest levels of debt issuance occur when rates arehigh and expected growth is low. Therefore, the effects of relative interest rates on debt issuanceremain even after we account for the effect of expected overall economic growth.
Variation in rates affects issuance in an economically meaningful way. For example, Panel Aof Table I indicates that if the decile rank of the relative rate increases by 1, on average, issuancedecreases by $361 million in a month. For comparison, if the rate itself increases by 1%, theamount issued in a month decreases by $257 million.
In Table II, the panels extend the regressions to utilize historical rate lags instead of the decilesof current rates relative to historical rates. The five- and 10-year lagged rates are positive andsignificant in each regression. The current level of 10-year constant maturity Treasury rates andBaa rates at the time of issuance remain negative and significant. Therefore, whether we measureinterest rates as deciles relative to historical rates or whether we use lagged rates, we see that theysignificantly affect debt issuance.

424 Financial Management • Autumn 2008
In an untabulated analysis (available on request), we also investigate the horizon of relevant ratechanges. We do not have a strict theoretical justification for choosing the 10-year horizon overwhich we calculate the decile ranking of interest rates relative to past rates (our first measure).The relevant horizon should reflect the “memory” of the decision maker for the history of interestrates. For example, one proxy for the length of the decision maker’s “memory” could be the tenureof the CEO or the CFO. Therefore, we examine a model with the current Baa rate and its laggedvalue plus control variables, where the lags range from one year to 20 years. The lagged rate ispositive and significant as early as three years back and as far back as 19 years, with the adjustedR2 and the t-value of the lagged variable maximized at 11 years.
C. Debt Issuance as a Proportion of Total Issuance
An important question is whether the effect is a case of issuing debt to time the interest rates,or if it is a case of raising funds in general. For example, Burch, Christie, and Nanda (2004)specifically examine whether firms time equity offerings. In Panel B of Table II, we examine theissuance of debt and equity and calculate the ratio of debt issued to the sum of debt and equityissued. The equity issues are in the form of SEOs that, like public debt issues, are reported in theSDC. As noted earlier, during the period of our study we find more than 14,000 debt issues and10,000 equity issues. The question is whether the ratio of the amount of debt issued to the totalamount of debt and equity issued increases as interest rates become lower relative to historicallevels. If so, interest rates relative to historical rates do specifically affect debt issuance, not justtotal firm issuance of new funding.
The results in Panel B of Table II demonstrate significantly higher debt-to-total issuance as afunction of lower deciles of current rates relative to historical rates or higher lagged interest rates.The rate deciles remain highly significant, as do the five-year lagged rates, although the 10-yearlagged rates do not. The results hold whether we use 10-year Treasuries or Baa rates. The levelsof interest rates also continue to hold strongly.
Thus, even if more attractive economic conditions do attract equity issuance, the amount ofdebt issuance relative to the total of debt and equity issuance is still greater when interest ratesare lower relative to historical rates. These results remain consistent with the survey results inGraham and Harvey (2001).
D. Debt Timing and Capital Expenditures
When interest rates decline to relatively low levels, the net present value of some capitalinvestment projects may become positive because of the lower discount rate. Thus, what weobserve may not be debt timing per se, but the result of firms issuing debt because of increasedopportunities for capital spending.
We measure debt issuance relative to capital expenditures and examine the impact of changesin rates on this ratio. We obtain data on capital expenditures from Compustat (item 128). Foreach firm-year within our SDC sample for which the capital expenditure data are available fromCompustat, we calculate the annual amount of SDC debt issued and divide it by the annual amountof capital expenditures. We exclude the extreme top 1% of the observations, limiting the ratio toa range of 0 to 38.4. The resulting sample size is 4,313 firm-years. We then regress the ratio ofthe quantity of debt issued divided by capital expenditures of each of the issuing firms on theinterest rate level, interest rate deciles, or lagged interest rates, and control measures.
Panel C in Table II presents the results of regressions with a dependent variable equal tothe quantity of debt issued divided by capital expenditures of the issuing firms. The historicaldecile ranks of current interest rates are strongly associated with the ratio of debt issued to

Barry, Mann, Mihov, & Rodrı́guez • Corporate Debt Issuance 425
capital expenditures. The lagged historical rates with a five-year lag remain significant, and, asin Panel B, the 10-year lags are not significant. Unlike the previous tests, the current level ofinterest rates (as opposed to its historical decile) does not remain significant when we include thehistorical rate deciles, but they do remain significant when we use lagged historical rates instead.
The results of Panel C in Table II further illustrate that debt timing, based on the current ratesrelative to historical rates, remains significant and is not caused merely by the need for capitalexpenditures. This evidence of timing is a noteworthy result, since the neoclassical theory ofinvestment suggests increased capital expenditures when the cost of capital is low. Although in-creased expenditures do occur, they do not fully account for the quantity of debt issued. To accountfor the potential impact of interest rate persistence, we re-estimate the regressions in Table IIby using a first-order autoregressive error model. The autoregressive results produce lower re-gression R2 and lower t-values for the independent variables. However, the overall inferences onthe relation between issuance and historical rates are consistent with those we find when we useOLS, in that the coefficients and the significance of the relative rate variables remain qualitativelysimilar. For example, in the first model specification in Panel A of Table II, the coefficient on theBaa decile variable changes from –360.91, with a t-value of –5.30 and a p-value less than 0.0001,to –284.62 with a t-value of –2.89 and a p-value of 0.004. The R2 of the autoregressive model is0.56 (including the autoregressive term), and 0.29 for the original regressors, compared to 0.48in the original model. When we use second- or third-order autoregressive models, the variableremains significant and has a coefficient of similar magnitude.
E. Debt Timing, Refinancing, and Net Stock Issuance
The timing of debt issuance relative to historical rates can be influenced by the desire torefinance expensive existing debt. Therefore, we examine the robustness of the interest ratetiming results with respect to the use of the proceeds. We also study the effects of net stockrepurchases compared to net stock issuance, since repurchases could represent another type ofrefinancing. If firms issue new debt to retire expensive existing debt, then that decision mightbe driven entirely by the potential for reducing the cost of existing debt rather than for theissuance of further debt. Therefore, we divide our sample into subsets of firms that are net issuersof debt compared to firms that apparently use the proceeds to refinance existing debt. Sinceshare repurchases can also be a form of refinancing, we break the samples into those with debtrefinancing that do or do not make net share repurchases.
We calculate the net issuance of debt for each firm in each fiscal year as the difference betweenthe amount of debt issued (Compustat item 111) and the amount of debt retired (Compustatitem 114). We then divide firms into a net issuers subsample if the difference is positive, anda refinancing subsample if the difference is 0 or negative. We present our results in Panel A ofTable III.
Panel A of Table III documents the significant effects of relative interest rates in both therefinancing subsample and the net issuers subsample. Refinancing is strongly associated with therelative levels of interest rates compared to historical levels (measured, again, by low, medium,or high deciles). Nevertheless, even when there is no refinancing, there continues to be a sig-nificant association between debt issuance and the historical decile levels of current interestrates.
We further split the net issuers into firms that use some of the proceeds for refinancing andfirms whose net debt increases by more than the amount of the public debt issued, indicatingthat in addition to issuing public debt, those firms borrow from other sources. Once again,although it appears that there is more timing by the firms that use at least part of the proceeds for

426 Financial Management • Autumn 2008
Table III. Timing of Net Issues versus Refinancings
The table presents comparisons of the timing of net debt issues and debt refinancings. Panels A and B showthe monthly amount of debt issued across historical interest rate deciles and use of proceeds. The amountissued is in millions of constant (January 2001) dollars. “Low” indicates that the Baa rate falls into the lowestthree deciles of relative rates in the preceding 10 years. “Medium” indicates that the rate falls into decilesfour to seven. “High” indicates that the rate falls into the highest three deciles. We use Compustat data toclassify issues as debt refinancings if the net amount of debt by the firm for the fiscal year is negative, andotherwise classify issues as net debt issues. Among the net debt issues, we classify those cases in which thenet debt was lower than the annual amount issued as “some refinancing.” We use Compustat data to furtherclassify debt issues by net stock repurchasers if the net amount of stock issued by the firm for the fiscal yearis negative, and otherwise classify issues as net stock issuers. We present in parentheses t-statistics for thetest that the mean in category “Low” is equal to the mean in category “High.”
Panel A. Net Debt Issues Compared to Refinancings
Relative Category of the Baa Rate Debt Net Debt Issuers, Net DebtRefinancing Some Refinancing Issuers
Low 1,396.7 2,876.0 1,424.7Medium 504.2 1,654.5 1,245.2High 92.1 1,082.5 564.9t-test: Low compared to high (11.57)∗∗∗ (10.02)∗∗∗ (7.93)∗∗∗
Panel B. Net Debt and Stock Issues Compared to Refinancings
Relative Category Debt Net Debt Issuers, Net Debtof the Baa Rate Refinancing Some Refinancing Issuers
Negative Positive Negative Positive Negative PositiveStock Stock Stock Stock Stock Stock
Issuance Issuance Issuance Issuance Issuance Issuance
Low 848.7 418.1 1,542.6 1,098.43 734.6 519.1Medium 264.8 183.1 861.0 698.0 719.9 464.9High 38.2 48.4 320.3 733.7 175.1 380.3t-test: Low compared to high (10.83)∗∗∗ (7.87)∗∗∗ (12.76)∗∗∗ (3.41)∗∗∗ (7.80)∗∗∗ (2.51)∗∗
∗∗∗Significant at the 0.01 level.∗∗Significant at the 0.05 level.∗Significant at the 0.10 level.
refinancing, there continues to be significant timing by the firms that use all of their proceeds asnew financing. Therefore, consistent with the evidence discussed earlier, the results continue toshow that whether or not refinancing is a part of their debt issuance decision, managers tend toissue more debt when interest rates are at low levels relative to historical rates.
We also break each of the three debt samples into subsamples with positive or negative netstock issuance. We calculate the net issuance of common and preferred stock for each firm ineach fiscal year as the difference between the amount of stock issued (Compustat item 108) andthe amount of stock repurchased (Compustat item 115). The results from this further subsamplingare presented in Panel B of Table III. Our results for historically based debt timing remain robustacross the stock issuance categories. In all cases, the evidence supports the hypothesis that theamount of debt issuance depends on where interest rates are relative to historical levels.
We also perform multivariate regressions, using the same structure and the same explanatoryvariables as those reported in Table II. In these regressions we redefine the dependent variable

Barry, Mann, Mihov, & Rodrı́guez • Corporate Debt Issuance 427
to be the aggregate monthly ratio of net debt to the sum of net debt and equity issued. Thisspecification requires the assumption that annual net equity issuance and net debt issuance areevenly distributed across the months of the fiscal year. We define net long-term debt issuanceas the minimum of either the total annual SDC debt issues or the increase in (annually reported)Compustat debt, thus eliminating all potential refinancing from the sample. We allocate eachfirm’s net annual debt increase to months by using each firm’s monthly proportion of its annualissuance. We then allocate net equity issuance, which is available only annually, to months byassuming that the issuance of net equity during the year is on the same monthly schedule as debtissuance.
The untabulated results (available on request) strongly support the results in Table II. Whencurrent rates are low relative to historical rates, companies issue a significantly higher proportionof net debt compared to net equity. For example, for the specification that uses the level of the Baayield, the Baa decile, the credit spread, the term spread, and the S&P 500 P/E ratio as dependentvariables, the adjusted R2 is 0.074, and the coefficient on the Baa decile is –0.006 with a t-valueof 2.97, and a p-value of 0.003. The results are similar for the rest of the specifications.
F. Corporate Characteristics, Debt Issuance, and Interest Rates
Graham and Harvey (2001) report that managers of larger firms tend to attempt interest ratetiming more than do the managers of smaller firms. There can be other characteristics of firmsthat also influence the tendency to time debt issuance based on relative interest rates. For example,firms with greater financial flexibility may be better able to time their issuance than can firms thatare financially constrained, either due to lower cash flows or large investment intensity.
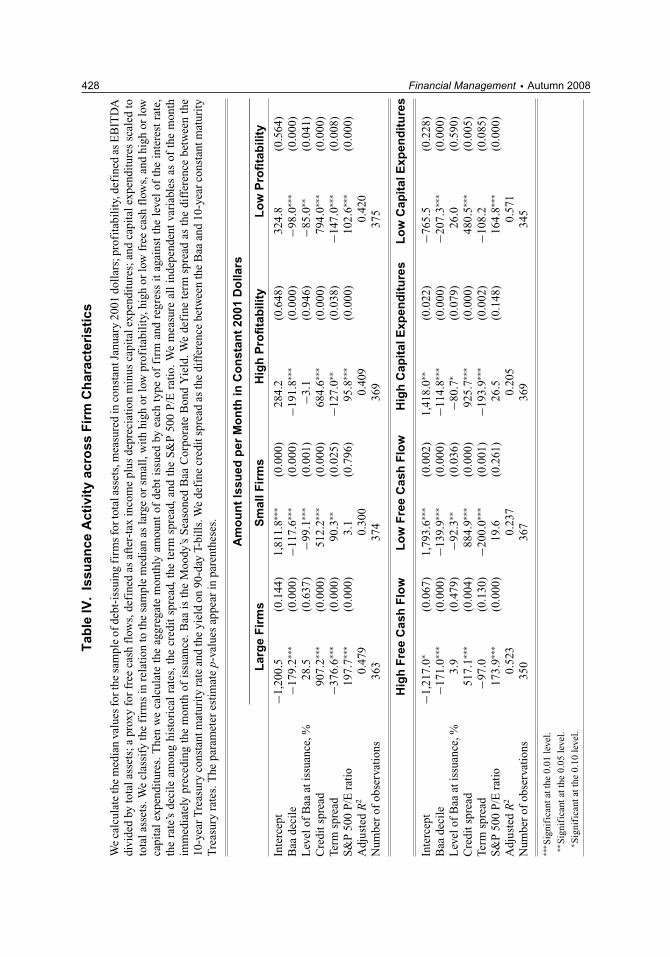
In Table IV we consider the effects of corporate profitability, the amount of free cash flow afterfunding investments (scaled by total assets), and the intensity of capital expenditures upon thetendency to issue debt. Table IV presents regression results based on the comparisons of largefirms compared to small firms, highly profitable firms compared to less profitable firms, firmswith high free cash flow compared to firms with low free cash flow, and firms with high capitalexpenditures compared to firms with low capital expenditures. In each of the paired subsamples,we break the samples into the upper and lower half of firms relative to the median of the variableof interest.
The results in Table IV show that for all the cases we examine, the level of interest ratesmeasured as deciles based on historical rates is consistently significant in determining debtissuance. Small firms and large firms both issue more debt when the rate decile is lower. The ratecoefficient is more negative for larger firms, indicating that larger firms are more able or willingto issue when rates are relatively low. Highly profitable firms and less profitable firms all issuemore debt when rates are historically lower, although, like the results for larger firms, the moreprofitable firms show stronger negative coefficients than do the less profitable firms. The samepattern holds for firms with high compared to low free cash flow. Conversely, firms with highercapital expenditures are less responsive to where interest rates are relative to historical rates thanare firms with lower capital expenditures.
We test for the differences in coefficients across firm types. We pool the subsamples to combinefirm types and add interactive variables consisting of each dependent variable multiplied by adummy variable for the firm type. We then examine the significance of the coefficients on theinteractive terms.
The coefficient for the large firm dummy (set equal to 1 for large firms) times the Baa decilevariable is –109.3 with a t-value of –2.64 and p-value of 0.009. Thus, issuance of debt by largefirms is more sensitive to the relative level of interest than is small firm issuance. The coefficient
428 Financial Management • Autumn 2008T
able
IV.
Issu
ance
Act
ivit
yac
ross
Fir
mC
har
acte
rist
ics
We
calc
ulat
eth
em
edia
nva
lues
fort
hesa
mpl
eof
debt
-iss
uing
firm
sfo
rtot
alas
sets
,mea
sure
din
cons
tant
Janu
ary
2001
doll
ars;
prof
itab
ilit
y,de
fine
das
EB
ITD
Adi
vide
dby
tota
lass
ets;
apr
oxy
for
free
cash
flow
s,de
fine
das
afte
r-ta
xin
com
epl
usde
prec
iati
onm
inus
capi
tale
xpen
ditu
res;
and
capi
tale
xpen
ditu
res
scal
edto
tota
lass
ets.
We
clas
sify
the
firm
sin
rela
tion
toth
esa
mpl
em
edia
nas
larg
eor
smal
l,w
ith
high
orlo
wpr
ofit
abil
ity,
high
orlo
wfr
eeca
shfl
ows,
and
high
orlo
wca
pita
lex
pend
itur
es.T
hen
we
calc
ulat
eth
eag
greg
ate
mon
thly
amou
ntof
debt
issu
edby
each
type
offi
rman
dre
gres
sit
agai
nst
the
leve
lof
the
inte
rest
rate
,th
era
te’s
deci
leam
ong
hist
oric
alra
tes,
the
cred
itsp
read
,th
ete
rmsp
read
,an
dth
eS
&P
500
P/E
rati
o.W
em
easu
real
lin
depe
nden
tva
riab
les
asof
the
mon
thim
med
iate
lypr
eced
ing
the
mon
thof
issu
ance
.Baa
isth
eM
oody
’sS
easo
ned
Baa
Cor
pora
teB
ond
Yie
ld.W
ede
fine
term
spre
adas
the
diff
eren
cebe
twee
nth
e10
-yea
rT
reas
ury
cons
tant
mat
urit
yra
tean
dth
eyi
eld
on90
-day
T-bi
lls.
We
defi
necr
edit
spre
adas
the
diff
eren
cebe
twee
nth
eB
aaan
d10
-yea
rco
nsta
ntm
atur
ity
Tre
asur
yra
tes.
The
para
met
eres
tim
ate
p-va
lues
appe
arin
pare
nthe
ses.
Am
ou
nt
Issu
edp
erM
on
thin
Co
nst
ant
2001
Do
llars
Lar
ge
Fir
ms
Sm
allF
irm
sH
igh
Pro
fita
bili
tyL
ow
Pro
fita
bili
ty
Inte
rcep
t−1
,200
.5(0
.144
)1,
811.
8∗∗∗
(0.0
00)
284.
2(0
.648
)32
4.8
(0.5
64)
Baa
deci
le−1
79.2
∗∗∗
(0.0
00)
−117
.6∗∗
∗(0
.000
)−1
91.8
∗∗∗
(0.0
00)
−98.
0∗∗∗
(0.0
00)
Lev
elof
Baa
atis
suan
ce,%
28.5
(0.6
37)
−99.
1∗∗∗
(0.0
01)
−3.1
(0.9
46)
−85.
0∗∗(0
.041
)C
redi
tspr
ead
907.
2∗∗∗
(0.0
00)
512.
2∗∗∗
(0.0
00)
684.
6∗∗∗
(0.0
00)
794.
0∗∗∗
(0.0
00)
Term
spre
ad−3
76.6
∗∗∗
(0.0
00)
90.3
∗∗(0
.025
)−1
27.0
∗∗(0
.038
)−1
47.0
∗∗∗
(0.0
08)
S&
P50
0P
/Era
tio
197.
7∗∗∗
(0.0
00)
3.1
(0.7
96)
95.8
∗∗∗
(0.0
00)
102.
6∗∗∗
(0.0
00)
Adj
uste
dR
20.
479
0.30
00.
409
0.42
0N
umbe
rof
obse
rvat
ions
363
374
369
375
Hig
hF
ree
Cas
hF
low
Lo
wF
ree
Cas
hF
low
Hig
hC
apit
alE
xpen
dit
ure
sL
ow
Cap
ital
Exp
end
itu
res
Inte
rcep
t−1
,217
.0∗
(0.0
67)
1,79
3.6∗∗
∗(0
.002
)1,
418.
0∗∗(0
.022
)−7
65.5
(0.2
28)
Baa
deci
le−1
71.0
∗∗∗
(0.0
00)
−139
.9∗∗
∗(0
.000
)−1
14.8
∗∗∗
(0.0
00)
−207
.3∗∗
∗(0
.000
)L
evel
ofB
aaat
issu
ance
,%3.
9(0
.479
)−9
2.3∗∗
(0.0
36)
−80.
7∗(0
.079
)26
.0(0
.590
)C
redi
tspr
ead
517.
1∗∗∗
(0.0
04)
884.
9∗∗∗
(0.0
00)
925.
7∗∗∗
(0.0
00)
480.
5∗∗∗
(0.0
05)
Term
spre
ad−9
7.0
(0.1
30)
−200
.0∗∗
∗(0
.001
)−1
93.9
∗∗∗
(0.0
02)
−108
.2(0
.085
)S
&P
500
P/E
rati
o17
3.9∗∗
∗(0
.000
)19
.6(0
.261
)26
.5(0
.148
)16
4.8∗∗
∗(0
.000
)A
djus
ted
R2
0.52
30.
237
0.20
50.
571
Num
ber
ofob
serv
atio
ns35
036
736
934
5
∗∗∗ S
igni
fica
ntat
the
0.01
leve
l.∗∗
Sig
nifi
cant
atth
e0.
05le
vel.
∗ Sig
nifi
cant
atth
e0.
10le
vel.

Barry, Mann, Mihov, & Rodrı́guez • Corporate Debt Issuance 429
for the more profitable firm dummy (set equal to 1 for more profitable firms) times the Baadecile variable is –94.5 with a t-value of –2.47 and p-value of 0.014. This result shows that moreprofitable firms exhibit more timing than do less profitable firms. The coefficient for the highercapital expenditure firm dummy (set equal to 1 for high capital expenditure firms) times the Baadecile variable is 124.3 with a t-value of 3.01 and a p-value of 0.003, showing that firms withhigher capital expenditures exhibit less timing than do firms with lower capital expenditures.Finally, the coefficient for the greater free cash flow firm dummy (set equal to 1 for high free cashflow firms) times the Baa decile variable is –75.3 with a t-value of 1.82 and a p-value of 0.069,showing that firms with higher free cash flow exhibit more timing than do firms with lower freecash flow. Thus, it appears that larger firms and firms with less financial constraints are morelikely to attempt to time debt markets.
III. Conclusion
We examine whether the timing of debt issuance is affected by the current level of interest ratesrelative to historical rates, after we have accounted for total financing and capital expenditures.While controlling for other factors that affect the issuance decision, we examine empiricallywhether corporate managers time the issuance of external debt with respect to interest rates. Wefind that debt issuance activity is very much affected by the level of interest rates relative tohistorical rates.
Our results on debt issuance are consistent with the survey results on debt timing in Grahamand Harvey (2001) and Bancel and Mittoo (2004). Like these two studies, our results indicatethat financial managers try to issue debt when rates are “particularly low” if the interpretation of“particularly low” is low relative to previous levels. We show that debt issuance, measured by totalamount issued and number of issues of new debt, relates to the relative level of interest rates incomparison to their historical values over the prior 10 years and/or by the lagged historical levels.Our evidence indicates that debt issuance as a proportion of total capital issuance (includingequity) reflects timing effects, and that debt issuance relative to capital expenditures also reflectstiming.
We find strong evidence that the amount of debt issued and the number of debt issues arerelated, both to the absolute level of interest rates and to their levels relative to historical rates.After controlling for other market conditions or corporate characteristics that can affect issuance,we find that the firms in our sample issue significantly higher amounts of long-term debt whenlong-term interest rates are low in either absolute or relative terms.
When interest rates decline, companies tend to refinance past debt that is eligible for refinanc-ing. Therefore, we also consider the effects of refinancing transactions on debt issuance related tolevels of interest rates. We find that refinancing is more common in our sample when interest ratesare at low levels relative to their history. Even when we focus on the non-refinancing transactions,we still find that debt issuance is significantly greater when relative interest rate levels are low.Thus, debt timing is not merely driven by refinancing.�
References
Bancel, F. and U. Mittoo, 2004, “Cross-Country Determinants of Capital Structure Choice: A Survey ofEuropean Firms,” Financial Management 33, 103-132.

430 Financial Management • Autumn 2008
Barclay, M. and C. Smith, 1995, “The Maturity Structure of Corporate Debt,” Journal of Finance 50,609-632.
Brounen, D., A. de Jong, and K. Koedijk, 2004, “Corporate Finance in Europe: Confronting Theory withPractice,” Financial Management 33, 71-101.
Burch, T., W. Christie, and V. Nanda, 2004, “Do Firms Time Equity Offerings? Evidence from the 1930sand 1940s,” Financial Management 33, 5-23.
Diamond, D. W., 1991, “Debt Maturity Structure and Liquidity Risk,” Quarterly Journal of Economics 33,341-368.
Faulkender, M., 2005, “Hedging or Market Timing? Selecting the Interest Rate Exposure of CorporateDebt,” Journal of Finance 60, 931-962.
Fisher, I., 1930, The Theory of Interest, as Determined by Impatience to Spend Income and Opportunity toInvest It, New York, NY, Macmillan.
Graham, J. and C. Harvey, 2001, “The Theory and Practice of Corporate Finance: Evidence from the Field,”Journal of Financial Economics 60, 187-243.
Guedes, J. and T. Opler, 1996, “The Determinants of Maturity of Corporate Debt Issues,” Journal of Finance51, 1809-1833.
Houston, J. and C. James, 1996, “Bank Information Monopolies and the Mix of Private and Public DebtClaims,” Journal of Finance 51, 1863-1889.
Hovakimian, A., T. Opler, and S. Titman, 2001, “The Debt-Equity Choice,” Journal of Financial andQuantitative Analysis 36, 1-24.
Hoven, S. M. and D. C. Mauer, 1996, “The Determinants of Corporate Debt Maturity Structure,” Journalof Business 69, 279-312.
Jung, K., Y. Kim, and R. M. Stulz, 1996, “Timing, Investment Opportunities, Managerial Discretion, andthe Securities Issue Decision,” Journal of Financial Economics 42, 159-185.
Marsh, P., 1982, “The Choice between Equity and Debt: An Empirical Study,” Journal of Finance 37,121-144.
Myers, S.C., 1977, “Determinants of Corporate Borrowing,” Journal of Financial Economics 5, 147-175.
Myers, S.C. and N.S. Majluf, 1984, “Corporate Financing and Investment Decisions When Firms HaveInformation That Investors Do Not Have,” Journal of Financial Economics 13, 187-221.
Taggart, R.A., Jr., 1977, “A Model of Corporate Financing Decisions,” Journal of Finance 32, 1467-1484.