Corneal confocal microscopy for diagnosis of diabetic
159
Corneal confocal microscopy for diagnosis of diabetic peripheral neuropathy: an analysis of patients with diabetes screened as part of the South Manchester Diabetic Retinopathy Screening Service Submitted by Josie Carmichael, to the University of Exeter as a thesis for the degree of Master of Philosophy in Medical Studies, December 2020 This thesis is available for Library use on the understanding that it is copyright material and that no quotation from the thesis may be published without proper acknowledgement. I certify that all material in this thesis which is not my own work has been identified and that any material that has previously been submitted and approved for the award of a degree by this or any other University has been acknowledged. (Signature) ………………………………………………………………………………
-
Upload
khangminh22 -
Category
Documents
-
view
1 -
download
0
Transcript of Corneal confocal microscopy for diagnosis of diabetic

Corneal confocal microscopy for diagnosis of diabetic
peripheral neuropathy: an analysis of patients with diabetes
screened as part of the South Manchester Diabetic
Retinopathy Screening Service
Submitted by Josie Carmichael, to the University of Exeter as a thesis for the degree of Master of
Philosophy in Medical Studies, December 2020
This thesis is available for Library use on the understanding that it is copyright material and that no
quotation from the thesis may be published without proper acknowledgement.
I certify that all material in this thesis which is not my own work has been identified and that any
material that has previously been submitted and approved for the award of a degree by this or any
other University has been acknowledged.
(Signature) ………………………………………………………………………………

1
ABSTRACT
Background and Aims: Quantitative assessment of small nerve fibre damage
is key to the early diagnosis of diabetic peripheral neuropathy (DPN) and
assessment of its progression. Corneal confocal microscopy (CCM) is a non-
invasive, in-vivo diagnostic technique that provides an accurate surrogate
biomarker for small fibre neuropathy. Its diagnostic efficacy has been previously
validated in several studies. This thesis uses CCM images obtained, for the first
time, in a large cohort of patients whose CCM examinations were undertaken
during retinopathy screening in primary care. The following were the primary
aims of the study:
1. To determine the prevalence of diabetic peripheral neuropathy, as defined by
CCM parameters in a cohort of people with diabetes
2.To assess whether abnormalities in corneal nerve fibre morphology are
present during the first two years following diabetes diagnosis.
3. To assess whether abnormalities in corneal nerve morphology are present
prior to any retinopathy, defined as grade 1 or more.
4. To assess whether abnormalities in corneal nerve morphology are present
prior to clinical evidence of diabetic neuropathy, as defined by diabetic
neuropathic symptom (DNS) scoring of 1 or more
The hypotheses for these main aims were that firstly, the prevalence of diabetic
peripheral neuropathy, defined using CCM parameters would be lower in this
population in comparison to previous CCM studies using patients under the
hospital eye service to determine prevalence of DPN. There will be evidence of
abnormalities in corneal nerve fibre morphology in some, but not all, patients
with diabetic disease duration of less than or equal to 2 years, patients with
retinopathy and maculopathy grade 0 and patients with a DNS score of 0.
Methods: In this retrospective, primary care, cross-sectional study, 427 patients
with diabetes (18 T1DM, 407 T2DM, 2 unknown) and 40 healthy controls
underwent quantification of corneal nerve parameters using both automated
and semi-automated analysis software. Clinical levels of neuropathy were
assessed via diabetic neuropathy symptom score (DNS). Diabetic Retinopathy

2
(DR) was graded using the Early Treatment Diabetic Retinopathy Study
(ETDRS) grading scale.
Results: Patients with diabetes demonstrated significant differences in all nerve
parameters in comparison to healthy control subjects (p<0.05). CCM detected
significant differences in nerve parameters of patients with diabetes in the first
two years after diagnosis and in those who had no evidence of DR (grade 0) or
symptomatic DPN (DNS score 0) (p<0.05), in comparison to heathy control
subjects. Corneal nerve parameters were significantly altered in patients with
proliferative DR compared to non-proliferative and no DR (p<0.05), however no
relationship was observed between DNS score and changes to corneal nerve
fibres (p>0.05). There was no significant difference in any CCM parameters
between white and black patients with diabetes (p>0.05). Automated software
showed poor agreement with semi-automated results, with a general
underestimation for CNFD, CNFL and CNBD.
Conclusion: In patients attending primary care screening, CCM in a sensitive
biomarker for DPN. Semi-automated CCM quantification reliably detected
corneal nerve abnormalities soon after diagnosis of diabetes. Changes in
corneal nerve morphology were present prior to any neuropathy symptoms or
retinopathy. CCM measured using automatic software requires development to
improve agreement with semi-automated analysis.

3
ACKNOWLEDGEMENTS
My thanks go to my supervisors, Professor Mitra Tavakoli and Professor Angela
Shore, for their guidance and support during this research. I greatly appreciate
the time spent reading my work and providing invaluable feedback.
Another thank you to Dr Tavakoli, who's work collecting data as the chief
investigator of 'Corneal Confocal Microscopy in Primary Care Optometry
Practices for Screening and Early Detection of Diabetic Neuropathy: a feasibility
study', enabled me to undertake this MPhil project.
A special thanks to Natalia Rolinska for taking me under her wing during my
time at Exeter. Thank you for your patience and for helping me with my
countless questions.
Finally, I would like to acknowledge with gratitude, the support and love of Rory
Robson. Thank you for always being so proud of my achievements.

4
TABLE OF CONTENTS ABBREVIATIONS ......................................................................................................... 8
LIST OF FIGURES ..................................................................................................... 10
LIST OF TABLES ....................................................................................................... 12
1. INTRODUCTION .................................................................................................... 14
1.1 Introduction to Diabetes Mellitus ........................................................................ 14
1.2 The Nervous System ......................................................................................... 14
1.3 Diabetic Peripheral Neuropathy ......................................................................... 17
i) Pathophysiology ............................................................................................... 17
ii) Prevalence ....................................................................................................... 17
iii) Classification ................................................................................................... 18
iv) Risk Factors .................................................................................................... 19
v) Further Complications ...................................................................................... 20
vi) Treatment ....................................................................................................... 21
2. DIAGNOSTIC TESTS FOR DPN ............................................................................ 23
2.1 Symptoms and Signs......................................................................................... 24
i) Symptoms ......................................................................................................... 24
ii) Signs ................................................................................................................ 25
iii) Composite Scoring Systems ........................................................................... 25
2.2 Large Fibre Tests .............................................................................................. 26
i) Nerve Conduction Studies (NCS) ...................................................................... 26
ii) DPNCheck ....................................................................................................... 27
2.3 Small Fibre Tests .............................................................................................. 28
i) Punch Skin Biopsy ............................................................................................ 28
iii) Quantitative Sudomotor Axon Reflex Test QSART .......................................... 30
iii) Neuropad ........................................................................................................ 31
iv) Sudoscan ........................................................................................................ 32
2.4 Quantitative Sensory Testing (QST) .................................................................. 34
3. CORNEAL NERVES AS A BIOMARKER FOR DPN ............................................... 37
3.1 Introduction to Corneal Confocal Microscopy .................................................... 37
3.2 Principle of Confocal Microscopy ....................................................................... 37
3.3 Corneal Confocal Microscopy (CCM) Devices ................................................... 39
i) Slit Scanning Microscopes ................................................................................ 39
ii) Laser Scanning Microscopes ........................................................................... 40
i) Epithelium ......................................................................................................... 42
ii) Bowman's layer ................................................................................................ 42
iii) Stroma ............................................................................................................ 43
iv) Descemet's Membrane ................................................................................... 43
V) Endothelium .................................................................................................... 43

5
VI) Dua's Layer .................................................................................................... 44
3.5 Corneal Nerve Morphology ................................................................................ 45
3.6 CCM imaging of Corneal Nerves ....................................................................... 45
i) Corneal Nerve Parameters ............................................................................... 46
ii) Langerhans Cells ............................................................................................. 47
3.7 CCM for the Detection of DPN ........................................................................... 48
i) Diagnostic Performance for Clinical DPN .......................................................... 49
3.8 Early Detection of Mild Neuropathy ................................................................... 54
3.9 Normative Database .......................................................................................... 55
3.10 Langerhans Cells in DPN ................................................................................ 55
3.11 Comparing CCM and IENFD ........................................................................... 56
3.12 Longitudinal Studies - The Use of CCM for DPN ............................................. 57
3.13 CCM application in Clinical Trials .................................................................... 59
3.14 A Potential Limitation of CCM .......................................................................... 60
3.15 Diabetic Retinopathy ....................................................................................... 61
i) Screening Programme for Diabetic Retinopathy .............................................. 61
ii) Diabetic Retinopathy and CCM ........................................................................ 62
3.16 The Potential use of CCM in Screening for Pre-clinical Neuropathy ................ 64
3.17 Aims and Objectives ........................................................................................ 65
4. METHODOLOGY.................................................................................................... 67
4.2 Selection of Practices ........................................................................................ 68
4.3 Recruitment ....................................................................................................... 68
4.4 Patient History ................................................................................................... 70
4.5 Assessment of Clinical Neuropathy ................................................................... 70
4.6 Assessment of Retinopathy ............................................................................... 70
4.7 Patient Examination with CCM .......................................................................... 72
4.8 Selection of Images ........................................................................................... 72
4.9 Image analysis .................................................................................................. 73
i) Semi-automated Analysis ................................................................................. 73
ii) Automated Analysis ......................................................................................... 75
4.10 Analysis Validation .......................................................................................... 77
i) Analysis Training .............................................................................................. 77
ii) Inter-observer Agreement ................................................................................ 78
ii) Repeatability .................................................................................................... 80
4.11 Statistical Methodology .................................................................................... 83
5. RESULTS ............................................................................................................... 84
5.1 Assessment of corneal confocal microscopy (CCM) image quality obtained in
primary care whilst considering the reasons for excluded cases.............................. 84
i) Grading of CCM images by different examiners ................................................ 84

6
ii) Reasons for Exclusion ..................................................................................... 86
5.2 Demographics and Clinical Information ............................................................. 87
5.3 Comparison of corneal nerve data derived using manual and automated analysis
of the same CCM images in patients with diabetes. ................................................ 90
i) Corneal Nerve Fibre Density ............................................................................. 90
ii) Corneal Nerve Fibre Length ............................................................................. 91
iii) Corneal Nerve Branch Density ........................................................................ 92
5.4 The Effect of Age on CCM Parameters ............................................................. 95
5.5 Prevalence of DPN in a cohort of people with diabetes, as defined by CCM
parameters, compared to age-corrected control subjects. ....................................... 96
i) Comparison of CCM parameters in patients with DM compared to controls ...... 96
ii) Comparison of CCM parameters in patients with diabetes compared to controls -
age adjusted analysis…………………………………..……………………………….98
iii) Comparison of CCM parameters in patients compared to normative values .... 99
5.6 CCM parameters of patients with diabetes, diagnosed ≤ 2 years, compared to
healthy control subjects. ........................................................................................ 102
5.7 Comparison of CCM parameters in patients with different duration since
diagnosis of diabetes. ............................................................................................ 104
5.8 CCM parameters in patients with no clinical levels of diabetic retinopathy,
compared to healthy control subjects. ................................................................... 108
5.9 CCM parameters in patients with increasing grades of retinopathy from none to
proliferative ........................................................................................................... 110
5.10 Comparison of CCM parameters of patients with diabetes and different
ethnicities .............................................................................................................. 115
5.11 Comparison of CCM parameters between healthy control subjects and patients
with diabetes but no clinical evidence of diabetic peripheral neuropathy, as defined
by diabetic neuropathic symptom scoring of 1 or more. ......................................... 117
i) Prevalence of Symptoms ................................................................................ 117
ii) CCM and DNS Score 0 .................................................................................. 118
5.12 To assess whether changes in corneal morphological nerve parameters
correlate with DNS scoring .................................................................................... 121
i) A comparison of CCM parameters in patients with no symptoms compared to
patients with symptoms of burning………………..………………………………….125
6. DISCUSSION ....................................................................................................... 127
6.1. Evaluation of automated methods for assessing corneal nerve parameters,
compared to manual methods, whilst also determining if image quality influences
automated method accuracy. ................................................................................ 127
6.2 The prevalence of diabetic peripheral neuropathy in the cohort of people with
diabetes, as defined by corneal confocal microscopy parameters, compared to age-
corrected control subjects. ..................................................................................... 129
6.3 Changes in corneal nerve fibre morphology, detected by corneal confocal
microscopy, during the first two years following diabetes diagnosis. ...................... 132

7
6.4 Changes in corneal nerve morphology, in relation to time since diagnosis of
diabetes, in order to determine the relative risk of developing diabetic peripheral
neuropathy as diabetes duration increases. ......................................................... .134
6.5 Confocal microscopy in the detection of subclinical diabetic peripheral
neuropathy prior to any retinopathy (defined as grade R1/M1 or higher) ............... 136
6.6 Corneal nerve fibre morphology in relation to increasing grades of retinopathy
from 0 to proliferative. ............................................................................................ 137
6.7 Corneal nerve parameters of patients with diabetes and differing ethnicities. .. 139
6.8 Corneal nerve morphology in patients with no clinical evidence of diabetic
sensory peripheral neuropathy, as defined by diabetic neuropathic symptom scoring
of 1 or more. .......................................................................................................... 140
6.9 Corneal Nerve Morphology in patients with diabetic neuropathy symptom score,
from 0-4. ................................................................................................................ 141
6.10 Limitations ..................................................................................................... 144
6.11 Conclusions ................................................................................................... 145
7. REFERENCES ..................................................................................................... 146

8
ABBREVIATIONS
Abbreviation Definition
ACCORD Action to Control Cardiovascular Risk in Diabetes
ACE Angiotensin Converting Enzyme
ANCOVA Analysis of Covariance
ANOVA Analysis of Variance
BFI Bright Field Immunohistochemistry
BMI Body Mass Index
CCM Corneal Confocal Microscopy
CLAHRC Collaboration for Leadership in Applied Health Research and Care
CNBD Corneal Nerve Branch Density
CNFA Corneal Nerve Fibre Area
CNFD Corneal Nerve Fibre Density
CNFL Corneal Nerve Fibre Length
CNFW Corneal Nerve Fibre Width
CNS Central Nervous System
CoV Coefficient of Variation
CTBD Corneal Total Branch Density
DAN Diabetic Autonomic Neuropathy
DNS Diabetic Neuropathy Score
DPN Diabetic Peripheral Neuropathy
DR Diabetic Retinopathy
DRSS Diabetic Retinopathy Screening Service
DSPN Distal Symmetrical Polyneuropathy
EDIC The Diabetes Interventions and Complications Trial
ESC Electrochemical Skin Conductance
ETDRS Early Treatment Diabetic Retinopathy Study
GDM Gestational Diabetes Mellitus
HbA1c Glycated Haemoglobin
HDL High Density Lipoprotein
HES Hospital Eye Service
HRT Heidelberg Retinal Tomograph
ICC Intra-class Correlation Coefficient
IENFD Intra-epidermal Nerve Fibre Density

9
IF Indirect Immunofluorescence
IGT Impaired Glucose Tolerance
IWL Inferior Whorl Length
LC Langerhans Cell
LDL Low Density Lipoprotein
MNSI Michigan Neuropathy Screening Instrument
MRI Magnetic Resonance Imaging
MTHFR Methylenetetrahydrofolate Reductase
NCS Nerve Conduction Studies
NDS Neuropathy Disability Score
NeuPSIG International Association for the Study of Pain
NEURODIAB Diabetic Neuropathy Study Group of the European Association for the Study of Diabetes
NIHR National Institute for Health Research
NSS Neuropathy Symptoms Score
PNS Peripheral Nervous System
QSART Quantitative Sudomotor Axon Testing
QST Quantitative Sensory Testing
ROC Receiver Operating Curve
SD Standard Deviation
SEM Standard Error of Mean
SFN Small Fibre Neuropathy
SMDRSS South Manchester Diabetic Screening Service
SNRI Serotonin and Noradrenaline Reuptake Inhibitor
T1DM Type 1 Diabetes Mellitus
T2DM Type 2 Diabetes Mellitus
TC Tortuosity Coefficient
TCA Tricyclic Anti-depressant

10
LIST OF FIGURES
Figure Description
Figure 1 Types of somatic and autonomic nerve fibres
Figure 2 Intra-epidermal nerve fibre density measurement in skin biopsies
Figure 3 Neuropad testing method and results
Figure 4 Sudoscan patient set up
Figure 5 Optical principle of confocal microscopy
Figure 6 Corneal sub-basal nerve images taken using slit-scanning vs laser-scanning corneal confocal microscopy
Figure 7 Histology of the human corneal layers
Figure 8 Corneal confocal microscopy images of healthy corneal layers
Figure 9 Corneal sub-basal nerve plexus diagrammatic
Figure 10 Fundus images of four diabetic retinopathy stages
Figure 11 Diabetic neuropathy symptoms scoring questions and guidelines
Figure 12 Comparison of good and bad quality corneal confocal microscopy images
Figure 13 Unanalysed corneal confocal microscopy image of the sub-basal nerve plexus viewed using CCMetrics
Figure 14 Corneal confocal microscopy images of the corneal sub-basal nerve plexus analysed with CCMetrics vs ACCMetrics
Figure 15 Bland-Altman plots representing inter-observer agreement
Figure 16 Bar chart representing corneal confocal microscopy image quality grading
Figure 17 Pie chart representing reasons for image exclusion
Figure 18 Examples of corneal confocal microscopy images where automated software produced higher corneal nerve fibre length values than semi-automated software
Figure 19 Bland-Altman plots representing agreement between automated and semi-automated corneal confocal microscopy image analysis
Figure 20 Error bar plots representing measures of corneal nerve fibre length and corneal nerve fibre density in patients within different groups based on diabetes duration
Figure 21 Box plots representing measures of corneal nerve branch density and tortuosity coefficient in patients within different groups, based on diabetes disease duration

11
Figure 22 Error bar plots representing measures of corneal nerve fibre length and corneal nerve fibre density in patients within groups based on retinopathy grading
Figure 23 Box plots representing measures of cornea nerve branch density and tortuosity coefficient in patients within groups based on retinopathy grading
Figure 24 Pie charts representing the percentage of patients experiences different symptoms of diabetic peripheral neuropathy
Figure 25 Error bar plots representing measures of corneal nerve fibre length and corneal nerve fibre density in patients within groups based on diabetic neuropathy symptom score
Figure 26 Box plots representing measures of corneal nerve branch density and tortuosity coefficient in patients within groups based on diabetic neuropathy symptom score
Figure 27 Representative image of original CCM images (A) with its associated automated analyses

12
LIST OF TABLES
Table Description
Table 1 Erlanger and Gasser classification of nerve fibres
Table 2 Summary of diagnostic tests available for assessing diabetic peripheral neuropathy
Table 3 Summary of studies assessing clinical utility of corneal nerve parameters for diagnosis of clinical level diabetic peripheral neuropathy
Table 4 Inclusion and exclusion criteria for the original feasibility study
Table 5 The criteria used for grading diabetic retinopathy in England with typical management in primary care
Table 6 Summary of corneal nerve parameters reported by CCMetrics and ACCMetrics.
Table 7 Inter-observer agreement of corneal confocal microscopy image analysis
Table 8 Intra-observer repeatability for corneal confocal microscopy image analysis
Table 9 Comparison between investigator and expert grading of images
Table 10 Summary of the characteristics of the diabetic cohort (Patients) and control subjects
Table 11 Comparison of automated and semi-automated measurements of corneal nerve fibres in corneal confocal microscopy images
Table 12 Summary of the corneal parameters in patients with diabetes and control subjects, calculated using semi-automated and automated methods.
Table 13 Comparison of parameters between control subjects and patients with diabetes, including correction for age differences between the groups
Table 14 Comparison of corneal nerve fibre length and corneal nerve fibre density in females with diabetes compared to age-matched published normative values
Table 15 Comparison of corneal nerve fibre length and corneal nerve fibre density in males with diabetes compared to age-matched published normative values
Table 16 Classification of males within the cohort with diabetes as having pathological corneal nerve fibre length when compared to suggested published cut-off values
Table 17
Classification of females within the cohort with diabetes as having pathological corneal nerve fibre length when compared to suggested published cut-off values
Table 18 Comparison of nerve parameters between control subjects and patient group with diabetes disease duration ≤ 2 years
Table 19 Summary of the known characteristics and clinical grading information for patients with type 2 diabetes split into 5 age groups and control subjects
Table 20 Comparison of nerve parameters between control subjects and patient group with diabetic retinopathy grade 0

13
Table 21 Summary of the known characteristics and clinical grading information for patients, assorted into 4 groups, based on retinopathy grade, as well as controls
Table 22 Comparison of nerve parameters between patient groups based on their ethnicity
Table 23 Comparison of nerve parameters between controls and patients with diabetic neuropathy symptom score of 0
Table 24 Classification of males within the diabetic cohort, and with a diabetic neuropathy score of 0, as having pathological CNFL length or not, based on published normal values
Table 25 Classification of females within the diabetic cohort, and with a diabetic neuropathy score of 0, as having pathological CNFL length or not, based on published normal values
Table 26 Summary of the known characteristics and clinical grading information for patients, assorted into 4 groups, based on diabetic neuropathy symptom score
Table 27 Summary of the known characteristics, clinical grading information, and corneal nerve parameters for patients with no symptoms of peripheral neuropathy vs patients reporting 'yes' to experiencing burning

14
1. INTRODUCTION
1.1 Introduction to Diabetes Mellitus
Diabetes mellitus (DM) has become a global epidemic (Neeland and Patel,
2019). The International Diabetes Federation reported that in 2014, there were
463 million people worldwide with diabetes and predicted a rise to around 582
million by 2035 (Saeedi et al., 2019).
DM is considered a multifactorial syndrome of several diseases, all of which
have similar signs, symptoms and associated complications. They may broadly
be classified by aetiology and pathology into four groups; type 1 diabetes
mellitus (T1DM), type 2 diabetes mellitus (T2DM), gestational diabetes mellitus
(GDM) and "other". The class "other" includes monogenic diabetes and
diseases of the exocrine pancreas (Saeedi et al., 2019).
The defining feature amongst all groups is the presence of hyperglycaemia due
to chronic and/or relative insulin insufficiency (Saeedi et al., 2019). T1DM
aetiology is that of autoimmune destruction of pancreatic β-cells leading to
subsequent loss of insulin production (Jessup, 2012) and accounts for 5-10%
(Neeland and Patel, 2019) of the diabetic population . T2DM, in simplified
terms, is a combination of insulin resistance and insulin deficiency, and affects a
significantly larger proportion (90%) (Neeland and Patel, 2019) of the diabetic
population. Both genetics and obesity are considered to play a significant role in
the development of T2DM, with a weaker association with positive family history
for patients with T1DM (Jessup, 2012).
DM is strongly associated with both microvascular and macrovascular
complications. Macrovascular complications pose a significant risk for
cardiovascular and cerebrovascular disease, whereas microvascular
complications can lead to nephropathy, retinopathy and abnormalities of the
peripheral nervous systems. The abnormalities of the peripheral nerves are
termed diabetic peripheral neuropathy (DPN) and are the focus of my thesis
and thus the introduction.
1.2 The Nervous System
Broadly, the nervous system can be divided into two major regions: the central
nervous system (CNS); made up of the brain and spinal cord, and

15
the peripheral nervous system (PNS); made up of the nerves lying outside of
the CNS.
The PNS is then further divided into the somatic (voluntary) and autonomic
(involuntary) systems. The somatic system co-ordinates voluntary muscle
systems via skeletal muscles and is made up of two groups of neurones divided
by their primary sensory or motor function. Sensory, or afferent, neurones carry
impulses from a peripheral receptor to the CNS, and have their cell
bodies located in the dorsal ganglia of the spinal cord (Meskell, 2010). Motor
neurones, or efferent neurones, carry impulses from CNS to directly or indirectly
control an effector such as a gland or muscle, and have their cell bodies located
in the motor cortex, brainstem or the spinal cord (Meskell, 2010).
The autonomic nervous system has (largely) unconscious control over the
smooth muscles and glands which influence internal organs and regulate bodily
functions, such as heart rate, respiration, digestion, pupillary response and
sexual arousal (Johnson, 2013). The sympathetic division of the autonomic
nervous system, known as the 'fight or flight' system, typically functions in
actions requiring quick responses. Antagonistically, the parasympathetic
division known as the 'rest and digest' system typically functions in actions that
do not require immediate reaction (Gibbons, 2019).
Peripheral nerve fibres can be classified using Erlanger and Gasser's
classification, which defines nerves based on diameter, conduction speed and
the level of myelination (Table 1). A-fibres have the largest diameter, with the
thickest myelination and fastest conduction speed, and act as sensory and
motor fibres within the somatic nervous system (Figure 1). They may be further
divided into large nerve fibres that have sensory and motor functions (Aα and
Aβ), and small nerve fibres (Aγ which has motor functions, and Aδ which may
be autonomic or sensory fibres) (Table 1)(Manzano et al., 2008).
Group B-fibres (Table 1) are small, with moderate myelination and slower
conduction velocities that A-fibres. B-fibres act mainly as general visceral
afferent and pre-ganglionic fibres (Manzano et al., 2008) and are found only in
the autonomic nervous system (Figure 1, Table 1).

16
Group C-fibres have a small diameter, low conduction velocity and are the only
unmyelinated group. They act as somatic, afferent fibres that carry sensory
information relating to temperature and pain, as well as having autonomic
functions such as the stimulation of the sweat glands (Manzano et al., 2008).
Classification Myelination Diameter (um)
Conduction Velocity
(m/s)
Type Function
Aα ✓ 12-22 70-120 Sensory/motor Proprioception, touch sensory, somatic motor to extrafusal muscles
Aβ ✓ 5-12 30-70 Sensory/motor Proprioception, touch/pressure sensory, somatic motor to intrafusal muscles
Aδ ✓ 1-5 5-30 Sensory Touch and temperature sensory, nociception
Aγ ✓ 2-8 15-30 Motor Somatic motor to intrafusal muscles
B ✓ <3 3-15 Autonomic Visceral afferent fibres and preganglionic efferent fibres
C x 0.1-1.3 0.6-2 Sensory/ autonomic
Temperature and pain perception, nociception, itching
Table 1: Modified Erlanger and Gasser classification of nerve fibres in the peripheral nervous
system. Synthesised from (Manzano et al., 2008)
Figure 1: The nerve fibres that makeup the somatic and autonomic nervous systems.
jjjjjjjjFibre type, properties and function shown for each class of nerve fibres. Adopted from
(Vinik and Mehrabyan, 2004)

17
1.3 Diabetic Peripheral Neuropathy
i) Pathophysiology
Diabetic peripheral neuropathy (DPN) is a neurodegenerative disorder of the
peripheral nervous system that preferentially targets sensory axons, autonomic
axons and later, to a lesser extent, motor axons. Initially, chronic
hyperglycaemia instigates Schwann cell damage, and given the close mutual
support between these cells and nerve axons, this progresses to alterations in
the nerves.
The earliest damage begins in C-fibres (Feldman et al., 2019), resulting in
progressive retraction of terminal sensory axons in the periphery, with relative
preservation of the cell bodies (Feldman et al., 2019). It has been theorised that
initiation of nerve dysfunction and death are due to oxidative stress and
inflammation which lead to endothelial dysfunction in the capillaries (Feldman et
al., 2017). This causes axonal hypoxia with resultant reduction in axonal energy
stores and axonal injury, promoting peripheral neuropathy (Feldman et al.,
2017). More severe cases of DPN tend to include features of demyelination and
resultant degeneration (Dunnigan et al., 2013), that lead to progressive damage
in a distal-to-proximal course, characteristic of DPN (Hicks and Selvin, 2019).
ii) Prevalence
Diabetic peripheral neuropathy (DPN) is the most common diabetes associated
complication, occurring in around 50% of individuals with DM (Hicks and Selvin,
2019). The prevalence of DPN is somewhat higher in patients with T2DM when
compared to T1DM (Hicks and Selvin, 2019). The 'Action to Control
Cardiovascular Risk in Diabetes' (ACCORD)(Ismail-Beigi et al., 2010) trial and
the 'Veteran Affairs Diabetes Trial' (Duckworth et al., 2009) found that DPN was
present in 42% and 39% of adults with type 2 diabetes, respectively, at baseline
measurement. Comparatively, the prevalence of DPN in patients with type 1
diabetes in a study of patients on conventional insulin therapy, has been
reported as just 8% at baseline, increasing to 20% after 5 years of follow-up
(Martin et al., 2014).
A study comparing magnetic resonance imaging (MRI) scans of the sciatic
nerve in T1DM and T2DM patients with DPN found that the predominant type of

18
nerve lesion differed between the two (Jende et al., 2018). This study found that
in T1DM, lesions were predominantly associated with poor glycaemic control
and loss of nerve conduction, whereas in T2DM lesions were associated with
changes in lipid metabolism.
This raises the question of whether damage to peripheral nerves results in
different patterns of nerve damage, and thus would require different types of
preventive treatment.
iii) Classification
The most common type of DPN is distal symmetric polyneuropathy (DSPN),
which accounts for around 75% of all DPN cases (Pop-Busui et al., 2017).
DSPN affects the peripheral nerve system, typically beginning distally resulting
in symptoms and signs that are symmetrical between the left and right side of
the body. Further classification into primarily small-fibre, primarily large-fibre, or
mixed can be made depending on which nerve fibres are predominantly
affected (Pop-Busui et al., 2017). Common symptoms include burning,
numbness, tingling, pain and/or weakness starting in the distal lower
extremities. This progresses into more extreme symptoms of neuropathic pain
in around 10-30% of affected patients (Sloan et al., 2018, Albers et al., 2010).
Symptoms may be sporadic or constant but can be debilitating and in many
people lead to depression, sleep disorders and overall reduced quality of life
(Kioskli et al., 2019).
Autonomic neuropathies are a class of DPN which share a similar diffuse
pathophysiology with DSPN, but differ by being largely non-sensory(Hicks and
Selvin, 2019). These typically affect the cardiovascular, urogenital and
gastrointestinal systems. Patients may also suffer from sudomotor dysfunction,
hypoglycaemia obliviousness, and abnormal pupillary function (Pop-Busui et al.,
2017).
Rare forms of DPN include mononeuropathies, polyradiculopathies and
treatment-induced neuropathies (Pop-Busui et al., 2017). These atypical forms
are generally self-limiting, and resolve with medical management and physical
therapy, usually over several months (Smith, 2014). Mononeuropathies
commonly affect the peroneal nerve (Smith, 2014) and radiculopathies typically
involve the lumbosacral plexus, presenting with unilateral thigh pain and weight

19
loss with resultant motor weakness (Pop-Busui et al., 2017). Treatment-induced
neuropathy is a rare event that can occur following extreme metabolic
dysregulation (i.e. ketoacidosis) or a sudden and significant change in
glycaemic control.
iv) Risk Factors
In both main types of DM, prevalence and severity of DPN increases with
duration of diabetes and increasing age (Tesfaye et al., 2005). A large study of
1172 patients with diabetes assessed for neuropathy at baseline reported that
patients who had developed neuropathy by roughly 10 year follow-up were on
average 3.8 years older and had diabetes for 3.3 years longer at baseline
(Tesfaye et al., 2005). Furthermore, the study found that in both T1DM and
T2DM, higher haemoglobin A1c (HbA1c) level was a major predictor of the
development of diabetic neuropathy (Tesfaye et al., 2005) and cardiovascular
risk factors, such as hypertension, smoking, obesity, and elevated triglyceride
levels, appeared related to newly diagnosed neuropathy.
In cohorts of patients with T2DM, several metabolic syndromes such as
hypertension, abdominal obesity, lower high-density lipoprotein (HDL) levels
and hypertriglyceridemia have been consistently associated with DPN
development (Andersen et al., 2018b), with additional independent risk factors
including alcohol abuse and increased height (Feldman et al., 2019). In a cohort
of patients with T1DM, the EURODIAB prospective complications (Tesfaye et
al., 1996) study reported similar modifiable risk factors to those identified in
T2DM, specifically having an association with raised triglyceride level, obesity,
smoking and hypertension. Several genes have also been linked to an
increased risk of diabetic neuropathy, but only ACE (encoding angiotensin
converting enzyme) and MTHFR (encoding methylenetetrahydrofolate
reductase) polymorphisms have been confirmed using large patient cohorts in
multiple populations (Feldman et al., 2019). Research into the role of genetics
in diabetic neuropathy is currently limited and many more studies are required.
Significantly lower levels of clinical neuropathy in South Asian patients have
been reported in comparison to Europeans and Afro-Caribbeans (Abbott et al.,
2005). A recent study found that in a population of people with type 2 diabetes,
South Asians had significantly better-preserved small nerve fibre integrity than

20
equivalent Europeans (Fadavi et al., 2018). However, this patient cohort was
recruited from primary care and most patients had no or mild neuropathy, so it
was not representative of the diabetic population overall. A proposed
explanation for the reduced risk was the differences in transcutaneous partial
pressure of oxygen (TCpO2) and height between the ethnicities (Fadavi et al.,
2018). The study suggesting this explanation, however, did not adjust for a
range of possible confounders such as obesity, alcohol intake and more,
between ethnicities, all of which are established risk factors for developing DPN.
A more recent study suggested that the variation may be due to differences in
height and adiposity between the ethnic groups, as adjustment for these factors
rendered the difference insignificant (Tahrani et al., 2017).
v) Further Complications
Diabetic foot ulceration is usually a result of an interaction between risk factors
and patient behaviours, but it is often DPN that is the primary, initiating cause
(neuropathic ulcer) (Singh et al., 2005, Ndip et al., 2012). Damage to motor
neurones leads to minor muscle wasting, resulting in foot deformities, such as
claw toes or prominent metatarsal heads that create pressure points
more prone to ulceration (Ndip et al., 2012). Damage to sensory neurones can
cause existing ulcers or abrasions to remain undetected due to numbness in
the feet (Ndip et al., 2012), thus corrective actions are not taken nor advice
sought at early stages of disease.
Ulcerations may lead on to irreversible tissue damage and lower limb
amputation, with almost 50% of all amputations in England being a result of
diabetic complications (Holman et al., 2012). Amputations in patients with DM
lead to significant morbidity, with five-year mortality ranging from 52 to 80
percent after major amputation (Thorud et al., 2016). Furthermore, amputation
poses a considerable cost to providers of healthcare, while the burden on
patients and their families can be colossal in countries without a free national
healthcare service (Ali et al., 2008). Hence, it is important to identify early
sensory deficits in patients with diabetes to improve the modifiable risk factors
and limit progression of DPN.
21
vi) Treatment
There is currently no Food and Drug Administration-approved therapy to
prevent or reverse human DPN (Hicks and Selvin, 2019), with the current
approach for management focusing on good glycaemic control, lifestyle
modifications and management of associated pain.
Studies have found that improving glycaemic control does not affect
progression of DPN in patients with T2DM (Ismail-Beigi et al., 2010, Gaede et
al., 2008). The Diabetes Interventions and Complications (EDIC) trial reported
that intensive glucose control significantly delayed the development and
progression of diabetic neuropathy in T1DM patients over time (Martin et al.,
2014). Another study, following a cohort of T1DM patients over 24 years
confirmed these findings. Patients who had stable, near normal HbA1c levels
(mean <7.0%) had significantly less deterioration in nerve fibre function when
measured using electrophysiology and quantitative sensory methods (p<0.05
for all measures at 24 years follow-up) (Ziegler et al., 2015).
For patients with T2DM, the focus to prevent or limit progression of neuropathy
is on lifestyle changes (Feldman et al., 2019). Several studies have
demonstrated a potential for improved outcomes in patients with diagnosed
DPN through exercise regimes put in place over a period of 10 weeks (Kluding
et al., 2012) to 12 months (Smith et al., 2006). Despite insignificant
improvements in body mass index (BMI), these studies reported a significant
improvement in objective measures of nerve function as well as reduced
neuropathy symptoms. Neither of these studies included a control group, which
is essential to provide a measure of the change in neuropathy which could be
expected over time without intervention but with the same amount of scrutiny,
for example additional contact time with healthcare professionals or individuals
paying more attention to their own health due to taking part in a study. Without
a control group it is difficult to be sure that the improvements in neuropathy are
truly due to modifications in exercise regimes alone.
For cases of confirmed neuropathic pain, medication may be prescribed for
relief. The consensus from multiple guidelines and systematic reviews is that
serotonin and noradrenaline reuptake inhibitors (SNRIs), anticonvulsants and
tricyclic antidepressants (TCAs) have the supportive evidence for their use in

22
neuropathic pain (Waldfogel et al., 2017). Cost and adverse effects also
strongly influence the best option for each patient (Feldman et al., 2019).
However, studies comparing these medications and providing guidance on
appropriate choice for an individual are currently lacking (Feldman et al., 2019).
Due to an association of a high risk of addiction, opioids are not recommended
as a first or second-line treatment for treating pain associated with DPN, despite
the evidence of their efficacy for pain relief (Feldman et al., 2019).

23
2. DIAGNOSTIC TESTS FOR DPN
Class of Fibres
Advantages
Limitations
Small Fibre
Tests
Skin Biopsy (IENFD)
Small (C-fibres)
Quantitative, Detects early nerve changes(Ragé et al., 2011,
Loseth et al., 2008)
Invasive, Risk of infection, Requires trained personnel and
special labs(Petropoulos et al., 2018)
CCM
Small (Aδ and C-
fibres)
Non-invasive ,Good reproducibility(Ostrovski et al.,
2015), Rapid and Objective(Tavakoli et al., 2010,
Tavakoli and Malik, 2011)
Requires specialist equipment and personnel, manual
analysis is time consuming(Petropoulos et al., 2018)
Large Fibre Tests
DPNCheck
Large, sural nerve ( Aβ-fibre)
Quick, Easy to perform,
Good sensitivity (92-95%) compared to NCS(Lee et al.,
2014, Perkins et al., 2006)
Relies on accessibility of sural nerve(Killian and Foreman, 2001)
Validation studies had small patient numbers(Lee et al., 2014,
Perkins et al., 2006)
NCS Large (Aβ-fibres) Sensitive measure of large
nerve function(shabeeb et al.,
2018), Reproducible(Bril, 1994)
Does not assess early neuropathic changes
Uncomfortable
QST
Large (Aβ-fibres) and
Small (Aδ and C-fibres)
Measures small and large fibre
function(Petropoulos et al., 2018) Good repeatability(Zaslansky
and Yarnitsky, 1998)
Unable to differentiate between peripheral and central
abnormalities(Themistocleous et al., 2014) High inter-operator variability(Lin
et al., 2005a)
Large and Small Fibre
Tests
NDS
Large (Aβ-fibres) and
Small (Aδ and C-fibres)
Does not require specialist equipment,
Assesses large and small fibre function(Young et al.,
1993)
Poor correlation with small fibre quantitative tests(Zilliox et al., 2015)
Questionnaires Large (Aβ-fibres)
and Small (Aδ and C-fibres)
Easy to administer Used for monitoring
symptoms(Petropoulos et al., 2018)
Subjective May not detect early nerve
changes (Meijer et al., 2002)
Neuropad
Small (C-fibres) Can be self-administered, Non-invasive
Low specificity (50-67%)(Tentolouris et al., 2008, Quattrini et al.,
2008, Ponirakis et al., 2014, Perkins et al., 2006,
Papanas et al., 2005)
No standardised results interpretation
Autonomic Tests
Sudoscan
Small (C-fibres) Non-invasive, Easy to perform,
Good sensitivity (Yajnik et al.,
2012, Smith et al., 2014, Selvarajah et al.,
2015, Krieger et al., 2018, Casellini et al.,
2013)
Unclear if measuring sudomotor function
Variable specificity (53-92%)(Yajnik et al., 2012, Smith et al., 2014,
Selvarajah et al., 2015, Krieger et al., 2018,
Casellini et al., 2013)
QSART
Small (C-fibres) Sensitive for SFN (82%)(Thaisetthawatkul et al., 2013)
Gold standard for measuring sudomotor
function
Time consuming, Requires specialist equipment and trained personnel(Buchmann et
al., 2019) Uncomfortable
Table 2: Diagnostic tests available for assessing DPN. Type of nerve fibres assessed,
advantages and disadvantages summarised for each method. (IENFD) Intra-epidermal nerve
fibre density, (NCS) Nerve conduction studies, (QSART) Quantitative sudomotor axon reflex
test, (IVCCM) Corneal confocal microscopy (CCM). (NDS) Neuropathy disability score. (QST)
Quantitative sensory testing. (SFN) Small fibre neuropathy.

24
There are numerous testing methods available for assessing the structure and
function of the peripheral nervous system, with each test having their own
advantages and disadvantages. These are summarised in table 2 and details of
the tests are provided in the text.
2.1 Symptoms and Signs
Various clinical scoring systems are available for DPN screening which involve
symptom scoring, sign scoring or both. These systems may enhance diagnostic
accuracy through a composite score of different combined tests and are useful
tools for aiding diagnosis of DPN, along with quantitative measures. Each
questionnaire has a scoring system which can diagnose, and in some, stratify
disease severity. The main scoring systems used in research and clinical
practice are discussed in the current section.
i) Symptoms
The Neurological Symptom Score (NSS) is a 17 question, interview-based
assessment of sensory, motor, and autonomic function used for screening of
DPN (Asad et al., 2010), but is considered too extensive to be used efficiently in
clinical practice. The diabetic neuropathy score (DNS) is an adaptation of the
NSS that is a much quicker screening method, with only 4 questions and still
offering moderate sensitivity (79%) and specificity (78%), but with slightly lower
reliability for diagnosing DPN (Meijer et al., 2002) when using a diagnostic score
of 1 or more.
Other symptom scoring systems focus only on pain and differentiating
neuropathic from other causes. Pain descriptors that are used by patients with
neuropathic pain are commonly recognised by clinicians. The McGill pain
questionnaire was the first questionnaire designed to offer a multidimensional
assessment of pain which included an assessment of severity or intensity,
emotional impact, and significance to the pain sufferer (Melzack and Katz,
2001). This questionnaire is one of the most commonly used multi-dimensional
pain scales in the world and a short-form is available for use in screening which
has shown good agreement with the original version (Melzack, 1987).

25
ii) Signs
The Neuropathy disability score (NDS) is a commonly used method of clinical
examination that assesses the signs of neuropathy. Thirty-five items are used
for both sides which evaluate cranial nerve damage, muscle strength, sensation
loss and reflex delay/loss (Dyck et al., 1980). However, some items have been
found not to be strongly related with DPN, and the full scoring system is too
long to be used in clinical practice, therefore a revised NDS has been created.
This system is more commonly used and tests for four signs of neuropathy;
ankle reflex, vibration, pinprick and temperature sensation at both sides of the
largest toes. A maximum score is 10 and usually ≥6 is considered abnormal
(Abbott et al., 2002)
iii) Composite Scoring Systems
The reliance on symptoms or signs alone may lead to poor diagnostic accuracy
for the presence of DPN, and results may be made more accurate through a
combination of both for a more thorough assessment. Several scoring systems
assess both signs and symptoms of DPN to produce a composite score. The
Toronto clinical neuropathy score (TCNS) consists of three parts: symptom
scores, reflex test scores and sensory test scores. The maximum score is 19
and the test is able to stratify patients into no DPN, mild DPN, moderate DPN
and severe DPN depending on the overall score (Bril and Perkins, 2002).
Testing has proven validity and reliability for the diagnosis and staging of DPN
when compared to electrophysiology measures (Bril and Perkins, 2002).
The Michigan neuropathy screening instrument (MNSI) is another commonly
used composite scoring system that includes a questionnaire and a foot
examination (Feldman et al., 1994). The questionnaire covers history of sensory
symptoms, cramps and muscle weakness, foots ulcers and amputation.
Neuropathy can be defined as seven or more positive responses on this
symptoms section alone (Feldman et al., 1994) but the foot examination is more
frequently used and encompasses foot appearance (including ulcers), ankle
reflex and the 128‐Hz tuning fork test. Left and right limbs are independently
assessed and a score of ≥2 is positive for DPN in this section (Feldman et al.,
1994). One study (Moghtaderi et al., 2006) found a range of sensitivity (35-
79%) and specificity (65-94%) in comparison to NCS depending on the cut -off

26
value used for abnormality in MNSI. The higher specificity values indicate a
potential high diagnostic impact for MNSI scoring; however, the lower sensitivity
range indicates that milder cases of DPN are likely to not get picked up.
Scoring of symptoms and signs is a convenient and easy to perform method of
screening for DPN. These tests are easily interpreted, making them a useful
tool in supporting decisions on which patients should be referred on for
specialist assessment. Quantitative, objective measures should be considered
when the patient has signs and symptoms other than those rated by the scoring
test used.
2.2 Large Fibre Tests
i) Nerve Conduction Studies (NCS)
The current 'gold standard' for clinical diagnosis of DPN is through nerve
conduction studies (NCS) by a trained neurophysiologist. In 2010, the Toronto
Consensus, by an expert panel (Tesfaye et al., 2010) recommended that one
abnormal finding as part of NCS, in combination with a symptom or sign of
neuropathy should be used to confirm DPN (Tesfaye et al., 2010). NCS is a
validated method of assessing large myelinated nerve fibre function, through
the measurement of the speed and strength of impulses in response to
stimulation with comparison to normative data for abnormality detection
(Kazamel and Warren, 2017).
For reliable NCS results, close attention must be paid to factors such as filter
setting, limb temperature, and location of the recording, as results can be
vulnerable to variations. Trials have demonstrated that NCS consistently
demonstrate excellent intra-observer agreement (Litchy et al., 2014, Dyck et al.,
2010), however poor inter-observer agreement between expert clinical
neurophysiologists is common (Dyck et al., 2010) when no standardised,
specific technique is followed. One study (Litchy et al., 2014) assessed the
results of 4 neurophysiologists, from 4 different centres, testing 8 attributes of
nerve conduction of the leg. Specific methods of assessment were provided in a
specially prepared syllabus and a training session was provided beforehand.
The outcome was a significant improvement in inter-observer agreement with a
standardised approach, and although not entirely eliminated, levels of

27
disagreement were consequently considered clinically significant for medical
practice (Litchy et al., 2014).
Conversely, when considering use of NCS in therapeutic clinical trials, even
small inter-observer variability may be significant enough to impact results
through impacting the statistical power of a study and thus the trial's outcomes.
This may partially explain why previous clinical trials that have used NCS as a
primary outcome to detect treatment efficacy and have reported failed outcomes
(Wahren et al., 2016, Ruggenenti et al., 2011, Dyck et al., 2007). Evidence
supports the use of a single observer to repeat electrophysiological tests on
each patient in these trials.
Furthermore, Standard NCS testing is not easily applicable as a screening tool
for DPN since it is time-consuming, requires a specialist operator and can be
uncomfortable for the patient (Dyck et al., 2010). Electrodiagnostic studies have
also been identified as one of the largest drivers of health care costs related to
neuropathy evaluation (Callaghan et al., 2013) and results are often found to be
normal in patients with diabetes who have early or small fibre predominant
neuropathy.
ii) DPNCheck
To overcome some of the shortcomings of standard NCS testing, a novel point-
of-care nerve conduction device (DPN-Check, Neurometrix Inc., Waltham, MA)
has been developed with the potential to serve as an acceptable proxy to
standard NCS. This test for sural nerve conduction only, is much quicker to
perform than conventional electrodiagnostic testing and has been validated in
type 1 and 2 diabetes populations through comparison with the Neuropathy
Disability Score (NDS)(Killian and Foreman, 2001) and standard NCS (Perkins
et al., 2006, Lee et al., 2014). These studies have reported a high sensitivity of
92-95% for detecting abnormalities. However, the cohorts for these studies
have been small, with two of the three studies assessing very low numbers of
patients with T1DM (Sharma et al., 2015, Perkins et al., 2006, Lee et al., 2014).
Such small sample sizes would make it very difficult to confidently conclude
there was no significant difference in the techniques, as differences as large as
2 standard deviations would be missed with these group sizes. Furthermore, the
DPNCheck device is also dependent on the presence of an accessible sural

28
nerve which can be anatomically absent in up to 9% of healthy subjects (Killian
and Foreman, 2001).
2.3 Small Fibre Tests
i) Punch Skin Biopsy
The evidence strongly suggests that in DPN, damage to small fibres precedes
damage to large fibres (Umapathi et al., 2007, Quattrini et al., 2007) and punch
skin biopsy is currently considered the gold-standard single test for diagnosing
small fibre neuropathy (Lauria et al., 2010b). From these biopsies, a measure
intra-epidermal nerve fibre density (IENFD) can be quantified which is a method
of documenting the density of terminal branches of peripheral nerves within the
epidermis (no/mm2). The European Federation of Neurological Societies has
published guidelines for its use in the diagnosis of peripheral neuropathies
(Lauria et al., 2005). IENFD is typically measured from a distal-leg 3-mm punch
skin biopsy based on the assumption that SFN is a length-dependent process
with nerve degeneration occurring in a distal-proximal direction (Lauria et al.,
2010b). Published rules state that to be counted, an intra-epidermal nerve fibre
must cross or originate at the dermal–epidermal junction, and secondary
branches and fragments should not be included (Kennedy et al., 2005).
The density of IENF is measured on at least three 50-um thick biopsy sections
that have been immuno-stained with antibodies against markers expressed by
peripheral nerve fibres (Lauria and Lombardi, 2007) (Figure 2)
Two immuno-staining methods have become the most widely used in IENFD
measurement: indirect immunofluorescence (IF) and bright-field
immunohistochemistry (BFI). Although IF is considered a slightly more sensitive
technique due to higher signal/noise ratio (Provitera et al., 2015), the two
methods have excellent correlation (Nolano et al., 2015) and both can
comparably detect SFN (Provitera et al., 2015). At present, age-related
normative values exist only for BFI, published by a multi-national group of 8
centres (Lauria et al., 2010a). This collaboration found a significant age-
dependent decrease of IENFD values lower densities in men compared to
women up to 70 years of age, with equal measures in the older age groups
(Lauria et al., 2010a). Additionally, they concluded that height did not influence
IENFD, whereas weight and BMI had a small inverse correlation in men only.

29
Figure 2: Skin biopsy images taken from a healthy control (A), a patient with T1DM and no
diagnosed DPN (B) and a patient with T1DM and DPN (C). Red arrows point to intra-epidermal
nerve fibres. Brown areas of staining represent the basement membrane of the epidermis,
separating it from the dermis (Alam et al., 2017).
For both IF and BFI techniques, IENFs are typically counted directly through the
oculars of an epifluorescence microscope, by focussing through the optical
planes (Provitera et al., 2015). For IF only, the more detailed, but time-
consuming technique confocal microscopy (CM) can be used to analyse optical
sections of 3-dimensional images using computer software(Provitera et al.,
2015). The 2 techniques have shown excellent correlation (Provitera et al.,
2015) and the latter is usually used when more complex, second level analysis
is needed.
IENFD measurements have been shown to detect small fibre neuropathy with
depletion of IENFD detected in patients with normal NCS and no clinical signs
or symptoms of neuropathy(Løseth et al., 2008, Ragé et al., 2011). A recent
study reported a low sensitivity of just 61% when using a cut off of 4.5fibres/mm
IENFD to diagnose clinical DPN in T1DM patients (Alam et al., 2017). Earlier
studies have published significantly higher values for sensitivity (80%) (Vlčková-
Moravcová et al., 2008) and specificity (95%) (Chien et al., 2001), however

30
these studies were comparing healthy controls to DPN patients rather than the
test's ability to identify DPN in a diabetic cohort. Other studies have found a
decrease in IENFD correlating with progression of neuropathy and duration of
diabetes (Shun et al., 2004, Lauria et al., 2003) with reports that IENFD may
also be lower in patients with painful DPN compared to painless DPN
(Sorensen et al., 2006).
A 5-year follow-up study investigating progression of DPN in T1DM and T2DM,
reported a significant reduction of IENFD in T2DM patients, with IENFD
measurement being the single most abnormal parameter(Løseth et al., 2016).
Overall, the reduction in IENFD was not significant in T1DM subjects, however
this may be explained by the lower number of patients in the T1DM group
making it more challenging to prove statistically significant changes (Løseth et
al., 2016).
The main issue with the use of IENFD measurement as a biomarker for small
fibre neuropathy is that it is an invasive procedure. Obtaining a biopsy can
cause side effects such as a mild infection due to improper wound management
or, less commonly, excessive bleeding. Even though reported side effects are
rare (1.9/1000) (Lauria et al., 2010a), the nature of this technique limits its
practical use, particularly when a repeat biopsy is required in longitudinal
studies or clinical intervention trials.
iii) Quantitative Sudomotor Axon Reflex Test QSART
The assessment of sudomotor nerve (sweat) function has also been used to
assess small autonomic c-fibres, as anhidrosis can be characteristic of the
presence of peripheral autonomic neuropathy.
The reference standard for measuring sudomotor function is the quantitative
sudomotor axon reflex test (QSART). This test uses local sweat production,
measured as a change of relative humidity over time, during and after skin
activation. Software is used to digitalise, plot and analyse the temporal
resolution, latency, magnitude and duration of the sudomotor response (Illigens
and Gibbons, 2008). However, due to highly technical demands and relative
discomfort of the examination, QSART remains mostly limited to research
centres and is not considered a potential screening tool for DPN (Buchmann et
al., 2019)

31
iii) Neuropad
Neuropad is a non-invasive, painless screening tool that has been created to
assess the sweat function (small autonomic c-fibres) in the feet of patients with
suspected neuropathy. An adhesive pad containing cobalt salts is stuck onto
the plantar aspect of the foot and changes colour from blue to pink within 10
minutes if sudomotor function is normal (Papanas et al., 2005). If there is
decreased function, the pad remains blue or turns patchy in colour (Figure 3)
Figure 3: Neuropad test on the plantar aspect of the foot. (A) demonstrates the colour of the
pad when it is first applied. It also demonstrates an abnormal result, 10 minutes after
application, due to anhidrosis. (B) also demonstrated an abnormal, patchy result with
incomplete change of colour. (C) demonstrates a 'normal' result, 10 minutes after application,
with complete colour change (Neuropad, 2020).
The main advantage of this test is that patients can self-administer at home,
which reduces clinical contact time and aims to visually reinforce abnormal
results to patients. Instructions have been confirmed as clear for patients to
follow, and the test is easy to use for most patients (Tentolouris et al., 2008).
However, due to older age, visual and kinetic problems, a fifth of patients still
needed help when self-testing.
Studies have found good-excellent (70-97.8%) sensitivity for the detection of
DPN when comparing Neuropad to a range of different small and large fibre
diagnostic tests (Tentolouris et al., 2008, Quattrini et al., 2008, Ponirakis et al.,
2014, Papanas et al., 2005). However, studies are not consistent in terms of the
position of the Neuropad on the foot and the NDS cut-off value chosen to
indicate clinical DPN presence. Furthermore, some studies graded the
Neuropad colour change as a percentage (Ponirakis et al., 2014) or score out of
1 (Quattrini et al., 2008) whereas others simply classified the results as normal
or abnormal (Tentolouris et al., 2008, Papanas et al., 2005). This highlights a
need for development of software that can consistently grade the colour change

32
of each test over time, to enable continuous and more accurate monitoring of
sudomotor dysfunction. The published results for specificity have been
generally poorer (50-67%) meaning its benefit of a cheap unit cost (NICE, 2018.
https://www.nice.org.uk/guidance/mtg38/chapter/1-Recommendations) may be
outweighed by an increase clinic follow-up costs due to 'false positive' results.
Although Neuropad has shown good potential as a screening tool for DPN,
recent NICE recommendations have concluded that at present, the case for its
adoption to detect pre-clinical DPN is not supported enough by the evidence
(NICE, 2018. https://www.nice.org.uk/guidance/mtg38/chapter/1-
Recommendations).
iv) Sudoscan
Sudoscan™ (Impeto Medical) is another quick, simple and non-invasive test
that aims to assess sudomotor function (small autonomic c-fibres) (Mayaudon
et al., 2010, Gin et al., 2011). The machine uses a method known as 'reverse
iontophoresis', which is based on an electrochemical reaction between
electrodes and chloride ions present in sweat. The subject's hands and feet are
placed onto two sets of large-area, electrode containing, stainless steel plates
and a low-voltage current (<4V) is applied (Eh Schwarz et al., 2011, Casellini et
al., 2013). The current attracts chloride ions from sweat in the glands, which are
densely concentrated in the palms of the hands and soles of the feet. A
measurement of electrochemical skin conductance (ESC), expressed in
microSiemens (uS) is given, which is the ratio between the current generated
and the constant DC stimulus (4 V) applied to the electrodes (Figure 4).

33
Figure 4: Sudoscan patient set up (Medical, 2020)
A reduced ESC result, compared to age-corrected normal data, may indicate
degeneration of small c-fibres which innervate the sweat glands, and therefore
lead to reduced sweat gland function (Smith et al., 2014).
The ESC measurements from the feet are considered more sensitive for the
detection of DPN when compared to the hands(Selvarajah et al., 2015), with
less variation in results (Bordier et al., 2016). This is likely due to a fluctuation in
the contact of the hands on the electrodes, whereas the feet are aided by
gravity to maintain constant pressure on the electrodes throughout the test.
Reference values in healthy subjects are available from a global collaborative
analysis comparing different ethnic groups, age, and gender (Vinik et al., 2016).
This study noted a significantly lower hands and feet ESC for African-American,
Indian, and Chinese populations compared with the Caucasian population,
highlighting the need to match groups for ethnicity in electrochemical skin
conductance studies. The same study also observed no significant difference
between women and men at the hands or feet, and a weak decline in ESC with
increased age.
ESC measurements may also be associated with subjects' weight (Novak,
2016), perhaps due to a weight-dependent change in sensitivity of the stainless-
steel electrodes, or sweat gland density, when the subject is in the standing
position. This could also be due to the correlation between higher weight and
larger feet only (Novak, 2016). These hypotheses are yet to be assessed;

34
however, the findings of these studies emphasise the importance of profile
matching different subject groups for weight. It should be noted that this did not
take place in some validation studies (Smith et al., 2014, Casellini et al., 2013).
Validation studies have reported consistently good values for sensitivity (70-
87.5%) when using foot ESC results to screen for DPN (Yajnik et al., 2012,
Smith et al., 2014, Selvarajah et al., 2015, Casellini et al., 2013). However,
there are inconsistencies in the ESC cut-off values used for identifying
sudomotor dysfunction, ranging from 52uS(Yajnik et al., 2012) to 77uS
(Selvarajah et al., 2015). This variation along with inconsistencies in the
neuropathy tests being used as a reference standard are the likely cause of the
large range in reported specificity of between 53-92% (Yajnik et al., 2012, Smith
et al., 2014, Selvarajah et al., 2015, Casellini et al., 2013), and highlight the
need for standardisation of the classification criteria used. Patient cohorts also
differed in their severity of DPN, with participants in one study (Casellini et al.,
2013) having significantly more advanced in comparison to those in the study
by Smith and colleagues (Smith et al., 2014), therefore the test performed better
in the former.
Overall, Sudoscan appears to be a promising DPN screening test that is non-
invasive, easy to perform and eliminates the subjective component of clinician
error, demonstrating good correlation with IENFD (Novak, 2016). However,
there is some doubt over whether both Sudoscan and Neuropad are measuring
sudomotor function with a recent systematic review concluding that ESC was
unable to distinguish between patients with DPN and control individuals(Rajan
et al., 2019). Therefore, longitudinal and larger cohort validation studies are
needed, along with standardisation of diagnostic criteria before Sudoscan can
be used as a screening tool for small fibre neuropathy.
2.4 Quantitative Sensory Testing (QST)
Quantitative sensory testing (QST) has become a common method for
evaluating the function of small nerve fibres using thermal threshold and
thermal pain measurements as well as large fibre function using vibration
thresholds (Lin et al., 2005a). Commonly, the Medoc TSA-II NeuroSensory
Analyser (Medoc Advanced Medical Systems, Israel) is used to determine
thermal thresholds. A cheaper, more portable device has been designed,

35
NerveCheck (Phi Med Europe S.L., Barcelona, Spain), which has shown good
reproducibility (ICC values = 0.79, 0.71 and 0.86 for vibration, warm and cold
sensation respectively) and comparable diagnostic accuracy (86%, 72% and
79% for vibration, warm and cold sensation testing respectively) in comparison
to established QST equipment for the diagnosis of DPN (Ponirakis et al., 2016).
Cold thresholds can be used to evaluate the function of myelinated A-delta
fibres, whereas warm thresholds are used to evaluate the function of
unmyelinated C-fibres. Published normative data sets are available for heat
threshold detection (Yarnitsky et al., 2012, Rolke et al., 2006b, Rolke et al.,
2006a, Magerl et al., 2010, Dyck et al., 1998, Dyck et al., 1987) and
recommendations for conducting QST in both clinical practice and research
have previously been published by The International Association for the Study
of Pain (NeuPSIG)(Backonja et al., 2013).
QST has been found to have reasonable repeatability (Zaslansky and
Yarnitsky, 1998) however inter-operator and inter-patient variability depends on
a number of factors. Training of both examiner and patient, methodology of
assessment, baseline skin temperature, stimulus characteristics, location and
number of stimuli sites and duration of intervals between tests have all been
found to affect QST measurements(Lin et al., 2005a). Using standardised
methodology with extensive training has been shown to significantly reduce
interobserver variability (Attal et al., 2008, Attal et al., 2009), however this may
be too time consuming to be implemented.
Another factor to consider is the positioning of the sensor. This has been found
to affect results, with sensory thresholds of the foot being higher than those of
the hand (i.e. elevated warm threshold temperatures and reduced cold
threshold temperatures). This may be due to the pathways from sensory
receptors to the sensory cortex differing in length. When it comes to the effects
of body fat on thermal detection thresholds, there are conflicting findings.
Malmström et al. (2016) failed to detect differences between obese and other
groups for cold and warm thresholds at the suprailiac site (Malmström et al.,
2016), whereas Pryce and colleagues (Price et al., 2013) found that obese
participants had significantly higher cold and warm detection thresholds than
normal BMI participants on the abdomen.

36
Two psychophysical algorithms can be used to determine thermal thresholds.
These are the method of limits and the method of level, with the method of limits
used more commonly due to it being less time-consuming (Backonja et al.,
2013). For the method of limits, the machine delivers stimuli of increasing
intensities from a baseline value, and the subject pushes the button when the
stimulus is detected. An average of four results is calculated (Meier et al.,
2001). For the method of Level, the intensity of the stimulus is either increased
or decreased by a fixed ratio depending on the response of the subject to a
constant stimulus, until a predetermined difference in the intensities is reached.
The mean of the final two stimuli is considered the threshold (Zaslansky and
Yarnitsky, 1998). Measurements determined using limits have been reported as
significantly higher than those measured by Level, irrespective of test location
(Lin et al., 2005b). However, the two methods correlate well with each other (Lin
et al., 2005b) and the 2013 consensus concluded that both were
reliable(Backonja et al., 2013). The major difference between these two
methods is the effect of reaction time. For the method of limits, a patient has a
longer reaction time due to age or height (causing a longer sensory pathway)
which may erroneously give a higher threshold.
Both warm and cold thresholds can be affected in DPN patients, irrespective of
how long the course of diabetes is, but the abnormality frequency of warm
thresholds is significantly higher (Rolke et al., 2006b). A study found that cold
detection thresholds had a significant trend in reduction from DM patients with
no DPN, pre-clinical and clinical DPN respectively (Lysy et al., 2014). A
longitudinal study also found a significant positive correlation between
deterioration of cold detection thresholds and intensity of pain in painful DN,
with warm detection thresholds also correlating at non-significant value (Krämer
et al., 2004).
One major issue with the use of QST is that it cannot differentiate between
peripheral and central causes of temperature perception as it involves sensory
receptors, spinal cord pathways and termination sites in the thalamus. This
means that if there is poor concentration, a language barrier or cognitive defect,
this may affect the results obtained from subjects due to its subjective nature
(Themistocleous et al., 2014).

37
3. CORNEAL NERVES AS A BIOMARKER FOR DPN 3.1 Introduction to Corneal Confocal Microscopy
To summarise the preceding chapter, conventional methods for assessing DPN
typically evaluate the presence of functional deficits in small and large nerve
fibres. It has been shown that the earliest damage appears in the small fibres,
yet most commonly used diagnostics test assesses large fibre dysfunction
(NCS). Punch-skin biopsy allows a direct examination of unmyelinated c-nerve
fibres but is an invasive procedure, requiring considerable expertise and
laboratory procedures are time-consuming.
Anatomically and developmentally, the eye can be considered as an extension
of the CNS. The retina for example consists of retinal ganglion cells, whose
axons form the optic nerve, which in effect are CNS axons (Shah et al., 2017).
Hence, several neurodegenerative conditions that affect the CNS are known to
have manifestations in the eye, implying that the eye and brain may share
common disease-specific mechanisms(London et al., 2013). One major
advantage of imaging the eye is that visualisation of structures can be made
non-invasively, in-vivo. This advantage over traditional methods of biopsies
makes the eye an attractive possible option as a surrogate biomarker for
systemic disease.
Corneal confocal microscopy (CCM) is a non-invasive, in vivo ophthalmic
imaging technique that allows a detailed examination of the cornea, at high
magnification, on a cellular level (Tavakoli et al., 2008). Through capturing
multiple two-dimensional images at different depths, CCM imaging can
delineate the corneal layers of the cornea (Tavakoli et al., 2008), providing
superior magnification in comparison to standard slit lamp biomicroscopy.
These properties make CCM an effective tool for the diagnosis and monitoring
of corneal infection and disease which affect the cornea at any of its layers.
3.2 Principle of Confocal Microscopy
The overall principle of a confocal microscope is that a single point of tissue is
illuminated by a point light source and simultaneously imaged by a camera in
the same plane(Tavakoli et al., 2008)(Figure 5).

38
A specimen is illuminated with a light beam that passes through a light source
aperture, and beam splitter before being focussed by an objective lens into a
small spot of light in a small focal volume(Robinson, 2001)(Figure 5).Within this
illuminated spot of the specimen, the structures in the tissue create differences
in the reflection and backscattering of light, with highly refractive/reflective
structures, appearing bright/white providing contrast to surrounding tissue
(Guthoff et al., 2009). On the path to the detector the signal passes again
through the beam splitter which separates the reflected light mixture and directs
the light into the detection apparatus (Tavakoli et al., 2008). Any out-of-focus
light is essentially removed by passing the emitted light through a pin hole
apparatus so that light let through by the aperture is coming from the focal point
of the tissue (Robinson, 2001). This method creates a thin optical section of a
background free image (Robinson, 2001). Finally, the signal is detected by a
photodetection device, which transforms the light signal into an electrical signal.
The method described produces an image with a very high resolution, but
virtually no field of view due to using a single illumination and detection point
(Tavakoli et al., 2008). To overcome this problem, the instrument synchronously
images a small region of tissue with thousands of tiny spots. These can then be
reconstructed to create an image with high resolution and magnification as a
usable visual field (Tavakoli et al., 2008).
Figure 5: The optical principle of confocal microscopy implemented in the Heidelberg retina
tomograph (HRT)‐II with Rostock cornea module (RCM) imaging of the cornea. Image from
Guthoff et al, (2009).

39
3.3 Corneal Confocal Microscopy Devices
Three main CCM systems have been developed previously: The Tandem
Scanning Confocal Microscope, the Confoscan 4 (Nidek Technologies Srl,
Padova, Italy) and the Heidelberg Retinal Tomograph with Rostock Corneal
Module (HRT-RCM, Heidelberg Engineering, GmBH, Dossenheim, Germany).
The early generation of CCM systems used a conventional white-light confocal
microscope such as the TSCM (tandem scanning confocal microscope) and the
SSCM (slit scanning CM). As the TSCM has not been used for this study, or in
any of the studies reviewed as part of the literature review, it will not be
discussed further. Detailed information about this type of CCM can be found
elsewhere (Lemp et al., 1985).
i) Slit Scanning Microscopes
One type of slit-scanning machine that was previously commonly used is the
Tomey ConfoScan P4 (Erlangen, Germany) in-vivo, real time microscope. In
this method of confocal microscopy, the moving halogen light-source forms a
line which is then used to scan the cornea (Givan, 2001). This method of
scanning is considerably faster than a moving-spot scan, so can produce image
sets more quickly (Givan, 2001).
The slit height and width can also be adjusted. The slight height allows the user
to vary the thickness of the optical section and the slit width adjustment allows
control of the amount of light reaching the cornea (Guthoff et al., 2009). This
system is able to capture 25 images per second (Patel and McGhee, 2007).
The images are reconstructed to create an image offering 1um lateral resolution
and a magnification of 680x. The cornea can be split into 'optical sections',
which are viewed en-face and are only 10 um thick observed at any one time
(Patel and McGhee, 2007). This allows structures of the cornea to be viewed at
a cellular level, with structures viewed as lighter against a dark background. 768
pixels × 576 pixels (Efron et al., 2001). Images are viewed in real time on a
computer screen and are stored on video tape for analysis and subsequent
examination.

40
ii) Laser Scanning Microscopes
Based on numerous published studies within the past 10 years, the HRT-RCM
CCM is now more commonly used. This is due to this system offering higher
image brightness and contrast of images due to the use of laser scanning to
create images with a higher signal to noise ratios (Petroll and Robertson, 2015)
(Figure 6). This system operates using a 670 nm laser beam in a raster pattern
using a high numerical aperture 63x objective lens (Petroll and Robertson,
2015). The resultant en-face 2D images are of a lateral resolution of 1.04
μm/pixel; dimensions, 384 x 384 pixels (~400 μm field of view) (Petroll and
Robertson, 2015). The images produced have a better axial resolution (7.6 µm)
than the other in vivo confocal systems (9 µm for the TSCM and 24 µm for the
Confoscan) (Petroll and Robertson, 2015) and LCSM can produce serial
images of thin corneal layers (Tavakoli et al., 2008). This means that subtle
qualitative differences in the appearance of some features of the cornea can be
observed (Patel and McGhee, 2007, Patel and McGhee, 2009). Using a LSCM,
Kobayashi et al (Kobayashi et al., 2006) were the first to report the presence
of microstructures (called K-structures) at the level of Bowman’s layer in all
normal subjects that were not evident when using SSCM also suggesting
significantly clearer and more detailed images with LSCM.
Another benefit of the laser scanning system is that in addition to collecting 2D
sections of corneal cell layers, the machine can acquire automated 'Volume
scans' covering approximated 80 µm of thickness across the z-axis (40 images
with a 2um step). These “volume scans” have been used to produce 3-D
reconstructions of the corneal epithelium in humans. (Stachs et al., 2007)
3.4 Corneal Anatomy
As discussed, CCM can be used to image the cornea on a cellular level and de-
lineate its layers into distinct zones. This section covers the corneal anatomy
and the appearance of its layers when viewed using CCM.
B

41
Figure 6: CCM images of the sub-basal nerve plexus acquired using a Tomey ConfoScan P4
slit scanning device (Tavakoli et al., 2010) (A and B) and the HRT-RCM laser scanning device
(C and D). Images C and D demonstrate superior image contrast between nerve fibres and the
surrounded corneal layer. Images A - D taken from 4 different subjects so are not directly
comparable.
Figure 7: Histology of the normal human cornea. The cornea consists of five layers; the
epithelium, Bowman’s layer, stroma, Descemet’s membrane, and endothelium. Original image
from (Feizi, 2018).

42
i) Epithelium
The epithelium is the outermost layer of the cornea and is made up of three
layers of cells - the superficial cells, the wing cells and the basal cells (Eckard et
al., 2006)(Figure 6).
Superficial cells (Figure 8A) are typically 40-50um in diameter, polygonal in cell
pattern, and have an illuminated cytoplasm. Small, bright rounded nuclei, about
10um in diameter, are also visible in a small number of cells (Efron et al., 2001).
Large variation in cytoplasmic reflectivity from cell to cell has been observed,
which is thought to represent different stages of progression towards cell death,
the darker cells being those about to desquamate(Wilson and Hong, 2000).
This superficial cell layer is difficult to image using CCM and thus is only
occasionally captured. It may however become more visible when the
epithelium has been disturbed, such as in contact lens wear (Efron et al., 2001).
The cells of the intermediate layer, or wing cells, form a regular mosaic with
sharp and reflecting cellular borders. These cells are smaller than the superficial
cells (about 20 um), regular in form (Guthoff et al., 2009) and can be subdivided
into upper and lower wing cells, with the latter being the smallest in size
(Guthoff et al., 2009). As with superficial cells, wing cells appear to have varying
cytoplasmic reflectivity, but the difference is less marked in comparison(Efron et
al., 2001). Small, bright nuclei, approximately 5-8 um in diameter, are marked
and visible in the centre of all wing cells (Efron et al., 2001).
Basal epithelial cells (Figure 8B) have the smallest diameter of the epithelial
cells (8–10 mm) and are tightly packed as a uniform layer of cylindrical cells
with bright cell borders, dark cytoplasm and no visible nuclei (Efron et al., 2001,
Guthoff et al., 2009).
ii) Bowman's layer
The Bowman’s layer is an 8–10 um thick, amorphous membrane, that consists
of randomly arranged collagen fibrils located in between the basal cells and the
anterior stroma (Guthoff et al., 2009). The location of this layer is apparent
when focusing posteriorly through the basal epithelial cell layer, as the image
becomes featureless and grey (Efron et al., 2001). It is within this layer that the
sub-basal nerve plexus can be imaged as highly reflective c-fibres, running
parallel to the corneal surface (Figure 8C) (Section 3.2).

43
iii) Stroma
The corneal stroma is the largest corneal layer, forming 80-90% of the total
corneal volume (Guthoff et al., 2009). It is primarily made up of collagen fibres,
keratocytes, nerve fibres and acellular material (Efron et al., 2001). Only the
keratocytes and nerve fibres can be imaged using CCM, with the acellular
material and collagen fibres forming the darker non-reflective background.
Keratocytes are identified by their nuclei, which are seen as discrete bright
entities forming various shapes dependent on orientation with a range of
diameter size (5-30um) (Efron et al., 2001). Keratocytes density is highest in
the anterior stroma(Figure 6D) (Guthoff et al., 2009). In the posterior stroma
(Figure 6E), they become less densely packed with the nuclei appearing slightly
larger and flatter.
Myelinated Aδ nerve fibres can occasionally be seen within the anterior stroma,
with their diameter ranging from 4 to 8um (Müller et al., 2003). These are thicker
and brighter than those in the Bowman's layer, with their size and orientation
highly variable which makes them difficult to accurately quantify (Tavakoli et al.,
2008).
iv) Descemet's Membrane
Descemet’s membrane is a thin (6-10um) featureless basement membrane of
the corneal endothelium. A normal Descemet's membrane is not visible in
young subjects but becomes more granular and visible in elderly patients (Efron
et al., 2001). Confocal images of this structure have a generalised hazy
appearance with no identifiable cellular structure (Tavakoli et al., 2008).
V) Endothelium
The endothelium (Figure 8F) is a monolayer of cells that is arranged in a
hexagonal pattern as a regular honeycomb mosaic (Guthoff et al., 2009). This
layer of cells is the opposite polarity of basal epithelial cells demonstrated as a
lightly reflective cytoplasm with a black, defined cell border with a dark, faint
nucleus observed in some cells (Efron et al., 2001).
Irregularities in the endothelial structure become more common with older age,
where signs such as polymegathism (cell size variability), pleomorphism (cell

44
size and shape variability) and guttate (excrescences) are observed, and may
be identified using CCM (Efron et al., 2001).
Figure 8: In vivo CCM images of the healthy cornea (A) Superficial epithelial cells (B) Basal
cells (C) Sub-basal nerve plexus (D) Anterior stroma (E) Posterior stroma (F) Endothelium.
Adapted figure (Gambato et al., 2015).
VI) Dua's Layer
In 2013 paper by a study by Dua and colleagues (Dua et al., 2013) reported a
new layer of the cornea, located between Descemet's membrane and the
stroma that had not been detected previously. Even though this layer is thin (15
um thick) it is very strong and impervious to air (Dua et al., 2013). However
there is some disagreement between scientists over the existence of this layer,
although further studies by different research groups have used Dua's layer with
their work, (GamalElDin et al., 2016, Costet and Touboul, 2016) other scientists
met the claim "with incredulity" (McKee et al., 2014).

45
3.5 Corneal Nerve Morphology
The cornea is the most densely innervated tissue in the body and is richly
supplied by a large number of sensory nerve fibres, as well as a lesser number
of autonomic fibres (Müller et al., 2003). As mentioned in the preceding section,
the cornea possesses both unmyelinated C-fibres and myelinated Aδ-fibres for
sensory innervation, and these fibres are visible on CCM imaging. Corneal
nerves are derived from the ophthalmic division of the trigeminal nerve and
enter the corneal stroma at its periphery, in a radial fashion parallel to the
corneal surface. As the fibres run forward towards the centre of the cornea, they
lose their myelin sheath; a necessary step to maintain corneal transparency
(Müller et al., 2003).
Corneal C-fibres form a delicate three-dimensional network known as the ‘sub-
basal nerve plexus’ (Marfurt et al., 2019)(Figures 8C and 9), which is located
beneath the basal layer of the corneal epithelium. Mapping of the cornea using
CCM (He et al., 2010, Kalteniece et al., 2018) has shown that this plexus forms
a spiral or ‘whorl like’ pattern. The centre of the spiral, often called the vortex, is
located approximately 2-3 mm inferior and nasal to the corneal apex in humans.
Due to this arrangement, sub-basal nerves in the superior and apical human
cornea are oriented vertically, whereas sub-basal nerves in other corneal
regions may be orientated horizontally or obliquely, consistent with their
locations within the whorl-like plexus (Kalteniece et al., 2018).
3.6 CCM imaging of Corneal Nerves
Due to the ability of CCM to acquire high quality, in-vivo, non-invasive images of
the corneal C-fibres, and the known relationship between damage to these
fibres and diabetic peripheral neuropathy, potential for using this imaging as a
surrogate biomarker for DPN has been identified. Since the first two novel
studies reported the correlation between increasing severity of DPN and
progressive loss of corneal sub-basal nerve fibres (Malik et al., 2003,
Rosenberg et al., 2000) in the early 2000s, there has been a huge increase in
the use of CCM parameters for diagnosing and monitoring DPN.

46
Figure 9: A Left image adapted from (Cruzat et al., 2017).Diagrammatic representation of
human corneal nerves showing the position and orientation of the sub-basal nerve plexus (red
dashed square). The image on the right demonstrates the appearance of a 384x384 pixel, 2D
image of the sub-basal nerve plexus, taken using an HRT (III) CCM.
i) Corneal Nerve Parameters
When analysing the sub-basal nerve plexus, most studies report results from
four morphological parameters: Corneal nerve fibre density (CNFD) which is the
total number of main nerve fibres per mm2, corneal nerve fibre length (CNFL)
which is the sum of the length of all nerve fibres and branches (mm/mm2),
tortuosity coefficient (TC) which is a unitless measurement that uses deviation
from a straight line to measure the tortuosity of the main nerve fibres
independent of their orientation, and corneal nerve branch density (CNBD)
which is defined as the number of branches emanating from all main nerve
fibres. There is, however, a discrepancy in how this can be quantified between
studies. The established protocol for these parameters has been described
elsewhere (Tavakoli et al., 2010).
Of these 4 parameters, CNFL has been the parameter with the most interest for
DPN, with one study reporting superior reliability in comparison with other
parameters (Hertz et al., 2011). Some studies have assessed the diagnostic
performance of CCM for DPN and reported the results for CNFL only (Ahmed et
al., 2012, Pritchard et al., 2015). Hertz et al., (2011) reported that CNFL
produced the highest intra-observer and inter-observer reproducibility (ICC of
0.72 and 0.73 respectively), with TC demonstrating the lowest (0.23 and 0.29
respectively). It must be noted however that this study used a small cohort of 46
patients with DPN, meaning it would be challenging to determine significant
differences between the parameters.

47
Two other parameters that have received some interest in research are nerve
reflectivity (Oliveira-Soto and Efron, 2001) and nerve fibre beading (number/100
µm) (Maddaloni et al., 2015, Ishibashi et al., 2016). Nerve fibre reflectivity is
usually assessed using grades as first outlined by Oliveira-Soto and Efron
(2001)(Oliveira-Soto and Efron, 2001), whereby classification can be split into
four grades according to a comparison with reference images. Nerve reflectivity
has be found to have significant correlation in eye conditions such as
meibomian gland dysfunction severity and resulting dry eye symptom scores
(Fu et al., 2019). The number of beadings is defined as the number of beadings
in a length of 100um of sub-basal nerves within a frame (Labbé et al., 2012).
Both parameters have demonstrated changes in conditions such as dry eye,
where patients with Sjogren's syndrome have demonstrated significantly higher
beading than dry eye patients of other primary causes (del Castillo et al., 2004).
However, both measures require subjective judgement. Beading can be very
difficult to quantify, and thus may have poor repeatability and reproducibility
(Labbé et al., 2012).
More recently, newer corneal parameters have been investigated. These
include inferior whorl length (IWL) (Petropoulos et al., 2015a) defined as the
length of the nerves at the inferior whorl of the superficial nerve plexus, nerve
fibre width (Kowtharapu et al., 2017) and nerve fibre area (Brines et al., 2018).
All these new measures have previously shown significant differences between
the non-neuropathic and clinically neuropathic groups in DM (Chen et al., 2017)
with CNFW and CNFA previously also demonstrating 74% and 66% sensitivity-
specificity at the equal error rate point, respectively when identifying non-
neuropathic patients compared to control subjects (Chen et al., 2017). This
indicates that these new measures may have the capacity to identify individuals
with early neuropathy, however research into these new parameters is currently
limited.
ii) Langerhans Cells
Another type of cell that can be found in the sub-basal layer and have been of
interest in DPN research are dendritic cells. These antigen-presenting cells of
the cornea are of paramount importance as they play a critical role in activating
other immune systems in the ocular surface, which influence both suppression
and induction of inflammation (Dana, 2004, Kalogeropoulos et al., 2020).

48
Langerhans cells are usually up to 15μm in diameter and can be seen in
various forms (Alzahrani et al., 2017). In their immature form, these cells have
small dendritic processes or lack dendrites completely and are mainly located in
the epithelium of the peripheral cornea (Resch et al., 2015). In pathological
states Langerhans cells mature, form interlocking dendritic processes which
may form a net-like structure, and migrate from the periphery into the central
cornea (Resch et al., 2015).
Cross-sectional studies have shown an increase in the densities of Langerhans
cells in the central cornea related to conditions such as dry eye with and without
contact lens wear (Alzahrani et al., 2017, Machetta et al., 2014) bacterial
keratitis (Su et al., 2006), thyroid eye disease (Wu et al., 2016) and diabetes
(Zhivov et al., 2005, Tavakoli et al., 2011a)(see Section 3.9).
3.7 CCM for the Detection of DPN
As mentioned in section 3.3, in the early 2000s, two novel studies reported the
correlation between increasing severity of DPN and progressive loss of corneal
sub-basal nerve fibres (Malik et al., 2003, Rosenberg et al., 2000). Rosenberg
and colleagues (Rosenberg et al., 2000), were the first to report a significant
reduction in sub-basal nerve fibres in patients with DPN. They found a
significant reduction in the number of long corneal nerve fibre bundles per
image in patients with clinically significant neuropathy as determined using
MNSI scoring system, when compared to both control patients and subjects
with DM but without neuropathy. However, the results of this study may have
been affected by the age of the control subjects being somewhat younger than
the subjects with diabetes, in particular those with neuropathy, as it has been
shown that CNFL reduces with age (Tavakoli et al., 2015). This was closely
followed by a similar study published in 2003 (Malik et al., 2003) which found
that CCM was able to detect abnormalities in the corneal nerves of patients
deemed to have only mild neuropathy using conventional tests. Corneal nerve
fibre density, length and branch density were all significantly reduced in patients
with diabetes compared with control subjects, with a tendency for greater
reduction in these measures with increasing severity of neuropathy. Similarly,
Midena and colleagues (Midena et al., 2006) reported a significant decrease in
corneal nerve fibre and branch number, along with decreased beading in
patients with diabetes. It should be noted that these three studies used an older

49
confocal imaging device with inferior image quality in comparison to the
methods now commonly used and that the sample sizes were very small.
Nevertheless, since these studies were published, there have been many
studies into the use of CCM as a method of detecting and monitoring DPN,
which are addressed in subsequent sections.
i) Diagnostic Performance for Clinical DPN
Several cross-sectional studies have evaluated the ability of CCM to diagnose
clinical levels of DPN in comparison to a range of other diagnostic tests (Table
3). It must be noted that most of these studies assessed patients with T1DM
only, meaning there is limited published data available for the diagnostic
sensitivity and specificity values when assessing patients with T2DM.
Each of these studies used a cut-off point for the reference neuropathy
test/combination of tests in order to define whether a patient had DPN.
However, the reference test and cut-off points varied between studies meaning
there was no universal diagnostic reference criteria. Some studies validated
CCM against a single test of nerve conduction studies (NCS) (Ahmed et al.,
2012, Alam et al., 2017) or neuropathy disability score (NDS) (Tavakoli et al.,
2010) whereas other studies used a combination of the two (Chen et al., 2015)
or NCS along with clinical examination (Perkins et al., 2018, Scarr et al.,
2017a). A combination of diagnostic tests will likely increase the efficiency to
detect DPN in comparison to one test used alone. This is significant as some
studies are comparing CCM to one single test, which in the case of NDS is not
the gold standard. NCS, as mentioned previously, only measures large fibre
function, which are affected later that small nerve fibres in DPN. One study
(Halpern et al., 2013a), demonstrated that diagnostic ability of CNFL
measurement in DM patients is significantly worse if using clinical signs and
symptoms as a reference standard in comparison to electrophysiology, plus one
sign/symptom as per the Toronto consensus guidelines, which highlights the
importance of a standardised diagnostic reference(Halpern et al., 2013a).
To explore which of the many measurements derived from CCM could best
distinguish patients with and without clinical DPN, as part of each study, the
same patients were examined using CCM and all nerve parameters were
derived. For each of the nerve parameters tested, ROC curves were plotted to

50
determine a CCM cut-off point used to distinguish between patients with and
without DPN in the diabetic cohort only. A range of cut-off points were studied in
order to identify which gave the best sensitivity/specificity value for diagnosing
DPN for each nerve parameter.
CNFL was the most commonly reported nerve parameter for these studies, with
all eight assessing its diagnostic ability and finding significant differences
between patients with and without DPN. A range of sensitivity values between
59 and 86% were found and a specificity range of 61-84%, depending on cut off
value used for diagnosis. The earliest of these studies (Tavakoli et al., 2010),
examined patients using a Tomey confoscan CCM. It is well known that these
images are of poorer quality, making it more difficult to identify nerve fibres
during analysis. This is likely the explanation for the significantly lower
diagnostic threshold value reported in this study in comparison to the others
(Table 3)
For corneal nerve fibre density (CNFD) all six of the cross-sectional studies
(table 3) reported a significant reduction in DM patients with DPN compared to
both DM patients without DPN and healthy controls (Tavakoli et al., 2010, Scarr
et al., 2017a, Perkins et al., 2018, Chen et al., 2015, Alam et al., 2017, Ahmed
et al., 2012). These studies reported ranges of sensitivity and specificity as 65-
82% and 41-79% respectively. A significantly higher cut off point of 39.2
CNFD/mm2 was defined in type 2 DM patients in the consortium study, resulting
in an increased sensitivity value to 69% (Perkins et al., 2018).This may explain
why its specificity is the lowest value of only 41%, as a higher cut-off value
would create more false positive results.
It is notable that based on their cohort, Scarr et al, (2017) defined the lowest
thresholds for diagnosis for both CNFD and CNFL out of the studies using the
Heidelberg retinal tomograph (HRT) (III) CCM. This is likely due to their
significantly older-aged cohort in comparison to the other cross-sectional
studies. As CNFD and CNFL have both been shown to reduce with age
(Tavakoli et al., 2015).
For corneal nerve branch density (CNBD) all 6 studies again reported a
significant reduction in DM with DPN compared to without DPN. For diagnostic
value the sensitivity (17-100%) and specificity (45-96%) values were
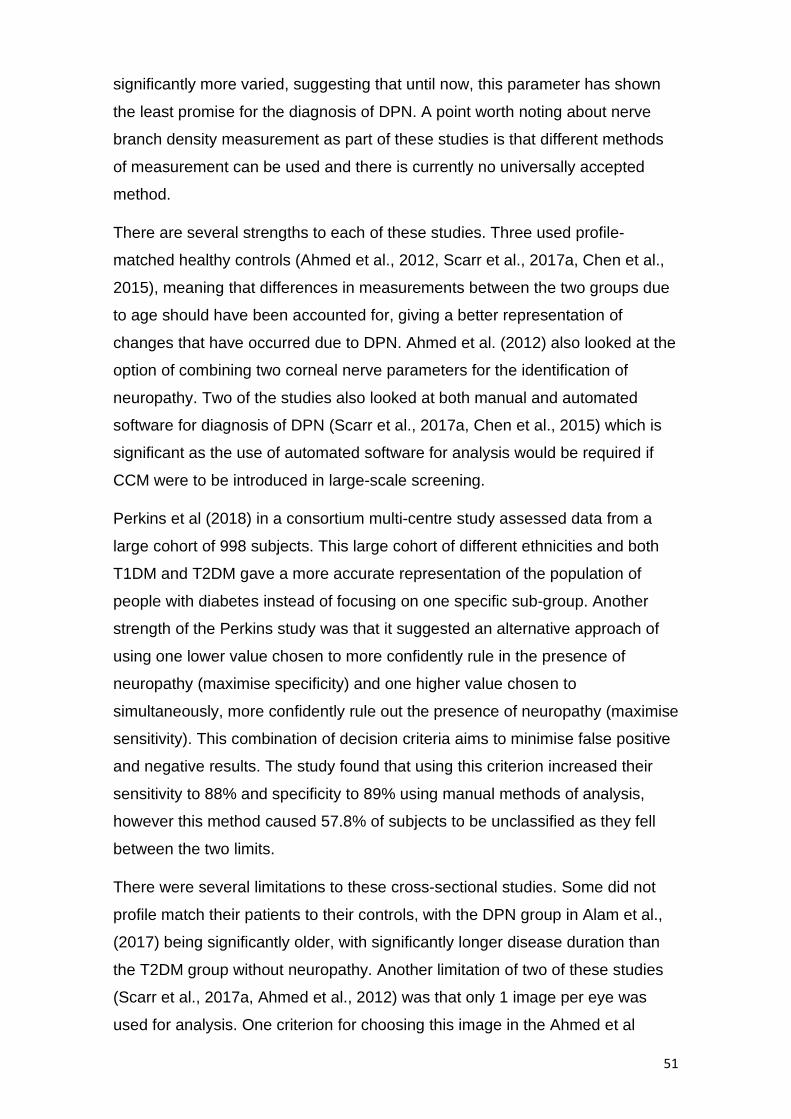
51
significantly more varied, suggesting that until now, this parameter has shown
the least promise for the diagnosis of DPN. A point worth noting about nerve
branch density measurement as part of these studies is that different methods
of measurement can be used and there is currently no universally accepted
method.
There are several strengths to each of these studies. Three used profile-
matched healthy controls (Ahmed et al., 2012, Scarr et al., 2017a, Chen et al.,
2015), meaning that differences in measurements between the two groups due
to age should have been accounted for, giving a better representation of
changes that have occurred due to DPN. Ahmed et al. (2012) also looked at the
option of combining two corneal nerve parameters for the identification of
neuropathy. Two of the studies also looked at both manual and automated
software for diagnosis of DPN (Scarr et al., 2017a, Chen et al., 2015) which is
significant as the use of automated software for analysis would be required if
CCM were to be introduced in large-scale screening.
Perkins et al (2018) in a consortium multi-centre study assessed data from a
large cohort of 998 subjects. This large cohort of different ethnicities and both
T1DM and T2DM gave a more accurate representation of the population of
people with diabetes instead of focusing on one specific sub-group. Another
strength of the Perkins study was that it suggested an alternative approach of
using one lower value chosen to more confidently rule in the presence of
neuropathy (maximise specificity) and one higher value chosen to
simultaneously, more confidently rule out the presence of neuropathy (maximise
sensitivity). This combination of decision criteria aims to minimise false positive
and negative results. The study found that using this criterion increased their
sensitivity to 88% and specificity to 89% using manual methods of analysis,
however this method caused 57.8% of subjects to be unclassified as they fell
between the two limits.
There were several limitations to these cross-sectional studies. Some did not
profile match their patients to their controls, with the DPN group in Alam et al.,
(2017) being significantly older, with significantly longer disease duration than
the T2DM group without neuropathy. Another limitation of two of these studies
(Scarr et al., 2017a, Ahmed et al., 2012) was that only 1 image per eye was
used for analysis. One criterion for choosing this image in the Ahmed et al

52
(2012) study was the frame with the most nerves. Using this method to choose
1 image per eye instead of calculating an average of 3 images or more may be
less time consuming for analysis, however it is likely to give false elevation of
measurements per patient instead if representing a true average.
Another significant issue with these studies is that most of them use the Toronto
consensus as the diagnostic criteria for DPN (Scarr et al., 2017a, Perkins et al.,
2018, Chen et al., 2015, Alam et al., 2017, Ahmed et al., 2012) i.e. one
abnormal finding as part NCS, in combination with a symptom or sign of
neuropathy (Tesfaye et al., 2010). As mentioned previously, NCS assesses
large fibre function whereas CCM assesses small fibre function.
Despite the variation in results and limitations of the studies, these findings
supported the expanded role of CCM in the assessment of diagnostic DPN as a
supplement to the wide array of neurological tests currently in use.

53
Tab
le 3
: S
um
mary
of stu
die
s a
ssessin
g c
linic
al utilit
y o
f corn
ea
l n
erv
e p
ara
me
ters
for
dia
gnosis
of clin
ical le
vels
of d
iabetic ne
uro
pa
thy c
om
pare
d to
chosen
refe
rence
sta
ndard
s.
Stu
die
s p
resente
d a
re a
ll p
ub
lish
ed
stu
die
s,
with
wh
ich
acce
ss c
ould
be g
ain
ed,
that
ha
ve
pub
lish
ed
optim
ise
d s
en
sitiv
ity a
nd s
pecific
ity
valu
es f
or
a c
hose
n thre
sh
old
(sho
wn
in t
ab
le f
or
each
para
mete
r used in e
ach
stu
dy)
calc
ula
ted
usin
g R
eceiv
er
opera
ting
curv
es (
RO
C).
Data
pre
sente
d a
s
sta
ndard
un
its o
r m
ean
±sta
ndard
devia
tion.
Info
rmation
synth
esiz
ed
fro
m (
Tava
koli
et a
l.,
201
0, S
carr
et a
l.,
201
7a,
Pritc
hard
et a
l., 2
015,
Perk
ins e
t a
l., 2
018
,
Lovblo
m e
t a
l., 2
01
5, C
hen e
t a
l., 2
015
, A
lam
et
al., 20
17,
Ahm
ed e
t a
l.,
201
2)

54
3.8 Early Detection of Mild Neuropathy
As there are currently no therapeutic agents approved for the treatment of DPN,
early detection is essential in order to modify any risk factors. Several studies
have specifically investigated CCM findings in early stages of DM and mild
levels of DPN.
The published baseline characteristics of T1DM patients as part of the
LANDMark study (Pritchard et al., 2014) were that corneal nerve fibre length
was reduced in patients without clinical neuropathy, based on the Toronto
criteria. Another paper written from the same study (Edwards et al., 2012b)
assessed the use of CCM for distinguishing between control patients and DM
patients (156 T1DM, 75 T2DM) with and without clinical DPN, and for the
patients with DPN, all cases were defined as mild (as defined by QST plus
neurophysiology). This study reported a significant reduction in CNFL when
comparing patients with and without mild neuropathy, suggesting that CNFL
changes may occur early in the course of the disease.
One study (Ziegler et al., 2014) assessed the corneal sub-basal plexus in
patients with recently diagnosed T2DM (mean duration 2.1± 1.6 years).This
study reported significant differences between CNFD, CNBD and CNFL
parameters when comparing the patient cohort to the control group, with CNFD
emerging as the most sensitive in detecting corneal nerve pathology, indeed
21% of the patients fell below the 2.5th percentile of the control group. For this
study, high-adapted software was used which produced an image of the sub-
basal nerve plexus that was composed from an image stack and reconstructed
to a combined mosaic image which had an expanded field of view compared to
standard imaging using CCM. This software is also able to correct for artefacts.
As this method is not widely used, there is no direct comparison to other studies
and as far as we are aware, there are no other studies assessing recently
diagnosed patients with DM (<2 years duration). It must also be considered that
in this study, even though patients were diagnosed recently, there may have
been a delay in diagnosis, which could have varied between patients.
Another study assessing early nerve changes assessed patients with impaired
glucose tolerance (IGT) (Asghar et al., 2014). This study reported evidence that
CCM may detect changes in nerve parameters prior to established diabetes.

55
Asghar et al (Asghar et al., 2014) reported that in patients with IGT, CNFD and
CNBD were significantly reduced with 40.5% of subjects with IGT having
significant small-fibre damage based on CNFD reduction compared to controls.
This agreed with a decrease in IENFD and significantly higher warm thresholds
and vibration perception thresholds in the same cohort.
3.9 Normative Database
In 2015, a consortium study of six academic clinical centres published a robust
worldwide normative database from a large cohort of 343 healthy volunteers
(Tavakoli et al., 2015). This created readily available normative reference
values for corneal nerve parameters, which could be used in research and
clinical practice in the study of peripheral neuropathies. This study found a
significant linear age-dependent decrease in CNFD and a decrease in CNFL in
both men and women. There was also a significant increase in CNFT per year,
however no age-related change in CNBD was found.
3.10 Langerhans Cells in DPN
Although there have been numerous published studies investigating changes in
corneal nerve fibres in patients with diabetes, the research into the presence
and density of corneal Langerhans cells is limited, with no published normative
reference data available for this parameter. As part of a study, Zhivov et al
(Zhivov et al., 2005) assessed the corneal basal epithelial layer and the sub-
basal nerve plexus for the presence of LCs in healthy subjects and found that
31% of subjects had LCs present.
Tavakoli and colleagues (Tavakoli et al., 2011a) were the first to assess
Langerhans cell density with differing severities of diabetic neuropathy (based
on NDS scoring compared to controls). This study found a significant increase
in the proportion of individuals with LCs in patients with T1DM and T2DM
(73.8%) compared to control subjects (46.1%). The study also found that LC
density was significantly increased in the patients with diabetes (17.73 ± 1.45)
compared to control subjects (6.94 ± 1.58). However, with progression of
neuropathy, patients with moderate and severe neuropathy showed a reduction
in the LC density in comparison to patients with mild neuropathy and were not
significantly different from control subjects. This may suggest that LCs have a
role in the early phase of nerve damage. This study only focused on Bowman’s

56
layer which has been shown to have a lower density of LCs in comparison to
the epithelial layer (Hamrah et al., 2002), so is not a true representation of
overall LC density in the central cornea. Another limitation of the study was that
the Tomey Confoscan CCM was used for imaging which has been shown to
underestimate LC density compared to newer the Heidelberg HRT III CCM
(Zhivov et al., 2005)and cannot differentiate mature from immature LCs (Zhivov
et al., 2005).
A more recent study (Ferdousi et al., 2019), used the HRT (III) CCM to assess
the density of LCs in a cohort of children and adolescents with diabetes and
found a higher percentage of patients (85.9%) and controls (69.1%) with LCs
present when compared to the previous 2 studies (Zhivov et al., 2005, Tavakoli
et al., 2011a). This study was also able to distinguish between mature and
immature cells by classing LCs of less than 50 µm in length, without dendritic
structures as immature cells and those greater than 50 µm with dendritic
structures were considered as mature cells. A significant increase in both
mature and immature cells was found as well as a correlation between CNFD
and LC density (Ferdousi et al., 2019). However, this study only assessed a
specific group of the diabetic cohort so is not representative of the whole
diabetic population. Overall, studies investigating LC density in patients with
diabetes are still limited and more information is required to conclude the effect
of diabetes on LCs.
3.11 Comparing CCM and IENFD
Sural nerve biopsy and/or punch skin biopsy are currently considered as gold
standard for assessing small nerve fibres (Lauria et al., 2010b). Studies have
found CCM to be comparable with measures of IENFD from biopsies in their
diagnostic performance for detecting patients with clinical levels of DPN (Alam
et al., 2017, Chen et al., 2015). Both studies found no significant difference in
their diagnostic efficacy in patients with T1DM.
An older study using the Tomoscan confocal microscope (Quattrini et al., 2007)
also concluded that both IENFD and CCM assessment accurately quantify
small nerve fibre damage in patients with diabetes. Intraepidermal and corneal
nerve fibre lengths were also both further reduced in patients with painful
compared with painless diabetic neuropathy.
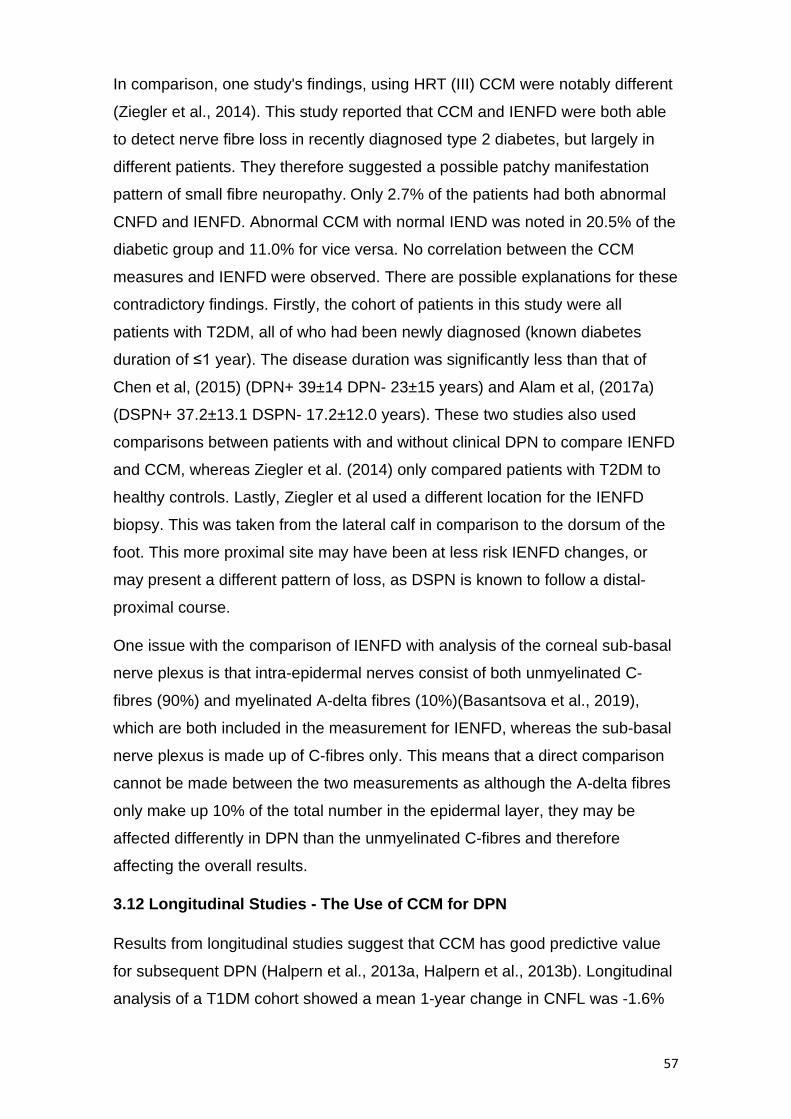
57
In comparison, one study's findings, using HRT (III) CCM were notably different
(Ziegler et al., 2014). This study reported that CCM and IENFD were both able
to detect nerve fibre loss in recently diagnosed type 2 diabetes, but largely in
different patients. They therefore suggested a possible patchy manifestation
pattern of small fibre neuropathy. Only 2.7% of the patients had both abnormal
CNFD and IENFD. Abnormal CCM with normal IEND was noted in 20.5% of the
diabetic group and 11.0% for vice versa. No correlation between the CCM
measures and IENFD were observed. There are possible explanations for these
contradictory findings. Firstly, the cohort of patients in this study were all
patients with T2DM, all of who had been newly diagnosed (known diabetes
duration of ≤1 year). The disease duration was significantly less than that of
Chen et al, (2015) (DPN+ 39±14 DPN- 23±15 years) and Alam et al, (2017a)
(DSPN+ 37.2±13.1 DSPN- 17.2±12.0 years). These two studies also used
comparisons between patients with and without clinical DPN to compare IENFD
and CCM, whereas Ziegler et al. (2014) only compared patients with T2DM to
healthy controls. Lastly, Ziegler et al used a different location for the IENFD
biopsy. This was taken from the lateral calf in comparison to the dorsum of the
foot. This more proximal site may have been at less risk IENFD changes, or
may present a different pattern of loss, as DSPN is known to follow a distal-
proximal course.
One issue with the comparison of IENFD with analysis of the corneal sub-basal
nerve plexus is that intra-epidermal nerves consist of both unmyelinated C-
fibres (90%) and myelinated A-delta fibres (10%)(Basantsova et al., 2019),
which are both included in the measurement for IENFD, whereas the sub-basal
nerve plexus is made up of C-fibres only. This means that a direct comparison
cannot be made between the two measurements as although the A-delta fibres
only make up 10% of the total number in the epidermal layer, they may be
affected differently in DPN than the unmyelinated C-fibres and therefore
affecting the overall results.
3.12 Longitudinal Studies - The Use of CCM for DPN
Results from longitudinal studies suggest that CCM has good predictive value
for subsequent DPN (Halpern et al., 2013a, Halpern et al., 2013b). Longitudinal
analysis of a T1DM cohort showed a mean 1-year change in CNFL was -1.6%

58
in patients with unstable T1DM, while healthy volunteers showed a 5% increase
per year (Halpern et al., 2013b)
As part of a 4-year follow up study, a study (Lovblom et al., 2015) found that 3
corneal nerve parameters were all significant predictors for the development of
DPN, with a baseline CNFL of <14.9mm/mm2 being the strongest single
predictor when compared to 11 other small and large fibre tests. Other studies
(Edwards et al., 2017, Pritchard et al., 2015) also reported an association
between lower baseline CNFL and development of DPN. Pritchard et al, (2015)
found a significant association with longer diabetes duration, higher
triglycerides, worsening retinopathy and nephropathy, impaired sensation to
temperature and vibration and slower peroneal and sural nerve conduction
velocities. However, studies with larger cohorts and patients with type 2
diabetes are needed to confirm the findings from these studies as well as a
longer period of monitoring. Studies should also ensure a set number of follow-
ups over a set period as for Lovblom et al, (2015) more than half of the patients
had just 1 follow up visit, meaning that true progression is statistically difficult to
prove.
Another prospective study specifically looked at a group of patients with IGT at
first visit (Azmi et al., 2015). They found that in subjects with IGT, lower
baseline CNFD, CNBD, CNFL and lower mean dendritic length of IENF were
the strongest predictors of progression to T2DM over 3 years. Although
significance was not recorded, there appeared to be very similar baseline
HbA1c measures between those patients who remained IGT vs those
developing T2DM over the 3 years follow up ( 42.8 ± 1.2 and 42.4 ± 1.0
respectively(mmol/mol), suggesting that corneal nerve parameters may have
been stronger predictors of conversion to T2DM in comparison to baseline
HbA1c. Those subjects who returned to normoglycemia showed a significant
improvement in their CCM parameters while IENF length continued to decline
during the same period. These findings may suggest that corneal nerve fibres
regenerate quicker than IENF when glycaemic control is improved (Azmi et al.,
2015).
Another observational follow up study, (Tavakoli et al., 2011b) examined a small
cohort of patients with diabetes (15 T1DM and 10 T2DM) at baseline and follow-
up at 2 years. At follow up, an improvement in glycaemic control, cholesterol

59
levels and blood pressure were found, as well as increase CNFD, with a
significant correlation between decrease in HbA1c and CNFD. This
demonstrated that improvements in HbA1c may lead to morphological repair of
corneal nerve fibres, however due to the very small sample size and mixing of
T1DM and T2DM in analysis, it is unclear if these differences are occurring in
both types. It must also be noted that this was not planned as an interventional
study, meaning there were no placebo controls or randomisation, which would
need to take place to confirm or reject these findings.
CCM has been used to investigate the changes in the sub-basal nerve plexus in
patients with T1DM post-simultaneous pancreas and Kidney (SPK) transplant.
Tavakoli et al, 2013 (Tavakoli et al., 2013) assessed 15 patients at 6 and 12
months SPK transplant and found a significant improvement in all CCM
parameters at 12 months. Symptoms, neurophysiology, quantitative sensory
testing and skin biopsy results remained unchanged in the same patients. A
similar, earlier study using an older CCM model also reported similar findings,
with CNFD and CNFL increasing significantly after just 6 months (Mehra et al.,
2007). These studies may demonstrate that CCM can provide a novel non-
invasive means to evidence early nerve repair that is missed by currently
advocated assessment techniques. However, an alternative interpretation of
this data could be that corneal nerves respond well to restoration of insulin and
normoglycemia, whereas other peripheral nerves do not therefore CCM may be
measuring something unique that is not an accurate biomarker of the condition
of peripheral nerves.
3.13 CCM application in Clinical Trials
Several DPN intervention trials have focused on large fibre function and have
generally had ineffective outcomes. More recently, some studies have instead
focused on CCM measures as markers for clinical trials of potential new
treatments. In a recent pilot trial of seal oil omega-3, polyunsaturated fatty acid
supplementation in patients with type 1 diabetes (disease duration 27±14 years)
over 12 months (Lewis et al., 2017), there was a significant increase (30.4%) in
corneal nerve fibre length, with no change found in NCS velocity or sensory
function. Those subjects at high risk for future DPN and those with already
diagnosed DPN (as determined by a Toronto clinical neuropathy score of ≥ 1)
showed the best response to treatment. This study was a single-arm, open-

60
label, proof of concept trial, therefore no placebo group was used. A placebo
group is necessary to reduce the bias of a trial through providing a measure of
the change in measurements which could be expected over time without the
intervention but with the same amount of additional scrutiny.
Another study to determine whether the peptide, ARA 290 improves metabolic
control and neuropathic pain in patients with type 2 diabetes used CCM
measurements as a co-primary endpoint. This study found that ARA 290
treatment was associated with an increase in corneal nerve fibre density which
were correlated with changes in neuropathic symptoms (Brines et al., 2015).
This study was a double blind, placebo-controlled investigator-initiated phase II
clinical trial, whose inclusion criteria were patients with T2DM who also had
symptoms of small fibre neuropathy. Whether allocation to the treatment and
placebo groups was randomised was not discussed in the article. Randomised
assignment would have further reduced any bias in the study and allowed the
use of statistics to calculate the likelihood that any difference in outcome
between the treatment and placebo groups was indicated by chance. Another
limitation of this study was that patients assigned to both groups generally had
excellent metabolic control (HbA1c = 7.3 ± 0.4 and 6.9 ± 0.2 for treatment and
placebo groups respectively), which does not truly represent the clinical
population of patients with T2DM. It may be that this treatment is less or more
effective for patients with poor metabolic control, comparatively. Finally, disease
duration was also not mentioned, so it was unclear if there was a significant
difference between the two groups.
These trials may be evidence that, similar to small fibre damage occurring prior
to large fibre damage, small fibres are also the first to start regenerating after
damage. Trials over a longer period, including other measures of small fibre
neuropathy are required before these findings can be confirmed.
3.14 A Potential Limitation of CCM
One limitation of using standard CCM image acquisition is the limited field of
view that it provides with each image covering only 2% of the 3mm central
cornea. This may be overcome by either mapping standard CCM images
manually or using automated software to create a composite image (Allgeier et
al., 2011, Edwards et al., 2012a, Turuwhenua et al., 2012), however, this

61
automated software is not widely available and a recent study (Kheirkhah et al.,
2015) found no significant difference in nerve and dendritic cell densities from
the same participants using either three representative CCM images or wide
field composite images.
3.15 Diabetic Retinopathy
Diabetic retinopathy (DR) is a common complication of diabetes, caused by
microvascular changes in the retina (Heng et al., 2013). Mild diabetic changes
are typically non-sight threatening and include small microaneurysms and/or dot
haemorrhages, whereas advanced retinopathy can lead to new fragile vessels
causing large haemorrhages, retinal detachments and potentially significant
visual loss (Figure 10). Diabetic changes may also affect the macula, with cases
of diabetic maculopathy (Figure 10) typically consisting of macular oedema and
ischaemia (Heng et al., 2013). Once established, the latter becomes
untreatable and irreversible.
Different interconnected biochemical mechanisms have been implicated in the
pathogenesis of DR, including oxidative stress, polyol and hexosamine pathway
activity, advanced glycation end-product formation and activation of protein
kinase C isoforms (Heng et al., 2013). Several factors including age, duration of
DM, and glycaemic control are associated with the onset and progression of
DR, however, a common factor in all processes is the presence of
hyperglycaemia.
i) Screening Programme for Diabetic Retinopathy
In the UK, the National Health Service (NHS) offers annual digital fundus
photography to all patients with diabetes over the age of 12 years as part of the
Diabetic retinopathy screening programme (DRSS). As part of this screening
programme, in England, all patients attending have two-field mydriatic digital
photographs taken of each eye (Scanlon, 2017). The images taken are then
reviewed and graded remotely by suitably trained clinical staff, based on the
presence and level of retinopathy. If potentially sight-threatening retinopathy is
identified, referral to a specialist hospital eye care service is organised where
further assessment and treatment is available. These robust annual screening
programmes have been hugely successful, with 2.14 million successfully
screened in England between 2015-2016 (Scanlon, 2017) and diabetic

62
retinopathy/maculopathy no longer being the leading cause of blindness of the
working population in the UK (Liew et al., 2014).
Figure 10: Four stages of diabetic retinopathy: (a) R1 Background retinopathy with
multiple microaneurysms and minimal small dot haemorrhages (b) R2 Pre-proliferative
retinopathy with multiple larger 'blot' haemorrhages and intraretinal microvascular
abnormalities (IRMAs) (c) R3a Proliferative retinopathy which is similar to (b) but also
with new abnormal vessels located both at the optic disc (NVD) and elsewhere (NVE),
(d) M1 Maculopathy with hard exudates and haemorrhages located within the macula.
Image from (Heng et al., 2013)
ii) Diabetic Retinopathy and CCM
Diabetic retinopathy is considered one of the earliest microvascular
complications and can be an indicator of diabetic management in a patient.
However, during the last decade, numerous studies have suggested that
corneal nerve changes may precede diabetic retinopathy in patients with both
T1DM (Szalai et al., 2016, Petropoulos et al., 2015b) and T2DM (Bitirgen et al.,
2014, Nitoda et al., 2012).
When assessing patients with T1DM, two similar studies (Szalai et al., 2016,
Petropoulos et al., 2015b) reported a reduction in CNFD, CNFL and CNBD,

63
prior to any retinopathy, when compared to control subjects. Furthermore,
patients with apparent retinopathy demonstrated a further reduction in all three
parameters when compared to patients with no retinopathy. Using ACCMetrics
automated software for analysis, a study (Szalai et al., 2016) also reported
significantly higher cornea nerve fibre width (CNFW), in patients prior to
retinopathy, suggesting that it may be the smaller branches, with the thinner
width, that are reduced in the early stages of neuropathy. A limitation to this
study was that it only assessed young patients (mean age 22.86 ± 9.05 years)
so was not overall representative of the T1DM diabetic population. The patients
were also not screened for possible other causes of neuropathy meaning that
there may have been other factors contributing to the nerve changes.
Studies assessing patients specifically with T2DM also demonstrated significant
alterations in the corneal nerve fibres with a reduction in CNFL occurring in
parallel with both DR (Bitirgen et al., 2014, Nitoda et al., 2012) and peripheral
DPN status (Nitoda et al., 2012). In Nitoda et al, (2012), the mean age of the
control subjects (61 ± 9 years) and the mean age of the patients with diabetes
(63 ± 2 years) were said to be age-matched (no p-value given). The mean
duration of DM was 7± 7 years, 16 ± 7 years, and 20 ±10 years, for no DR, non-
proliferative DR and proliferative respectively, showing an increase with relation
to DR (no p value given). For the Bitirgen at al study, (2014) the controls and
patients with DM were again age matched, with control patients having a mean
age of 60.6± 7.6 and patients with T2DM having a mean age of 60.3 ±8.3. The
duration of diabetes was significantly lower (as expected) in the group of
patients with no DR (9.3±5.5 years) when compared to patients with non-
proliferative DR (16.3±7.0) and proliferative DR (16.8 ±6.9 years) (p<0.001 for
both).
DR has also been found to correlate with reductions in corneal basal epithelial
cell, anterior stromal keratocyte and endothelial cell densities (Bitirgen et al.,
2014). A similar study concluded an insignificant difference between corneal
nerve parameters of patients with and without DR (Zhivov et al., 2013),
however, this study used automated nerve analysis software and assessed
different nerve parameters to the two studies using semi-automated analysis.
The ethnicity of the patients was also not stated in any of the publications and

64
there was a significant lack of recently diagnosed patients (less than <2 years)
(Nitoda et al., 2012).
One study (Messmer et al., 2010) assessed patients with both T1DM and T2DM
(grouped together for analysis) using semi-automated software and found that
CNFL was significantly reduced between patients without diabetic retinopathy
and controls (p = 0.028).They also found that in patients with DR, CNFD, CNFL,
and CNBD all showed a difference with increasing significance compared to
healthy persons as DR increased from non-proliferative to proliferative.
Overall, the findings of these studies suggest that CCM may be highlighting
corneal nerve changes prior to any detected retinopathy and challenges current
screening strategies used to detect microvascular complications of CM. This
may suggest that CCM identification of neuropathy may be identifying the
earliest point at which to intervene and prevent progression of complications.
3.16 The Potential use of CCM in Screening for Pre-clinical Neuropathy
Previous studies, addressed throughout this section, into the use of CCM to
detect corneal nerve changes in cohorts of patients with diabetes have
indicated that it may be a feasible method for the screening of early, pre-clinical
neuropathy. CCM also shows promise as an instrument to be used as a marker
to be used in clinical trials in order to assess progress with treatment and pick
up subtle, early changes in nerve fibres.
However, until now, the use of CCM has been confined only to research
departments, typically testing cohorts of patients attending hospital clinics. If
CCM is to be used as a wider screening tool in the future, it would need to be
carried out in a clinical environment, ideally within the community to provide
good access for all patients needing screening. Analysis of images would also
need to be fully automated in order to allow results to be generated in larger
numbers of patients in a time-efficient manner.
In 2015 a study into the implementation of CCM in primary care optometry
practices for Screening and Early Detection of Diabetic Neuropathy (Tavakoli et
al., 2016) (See methods section) was set up to assess whether or not it would
be feasible to introduce CCM screening into community practice, alongside
diabetic screening.

65
3.17 Aims and Objectives
The implementation of CCM in primary care optometry practices for Screening
and Early Detection of Diabetic Neuropathy study recruited 450 patients with
diabetes who underwent corneal nerve fibre imaging using CCM.
My study will involve analysing the images from this first large cohort of patients
screened in primary care using CCM, a cohort more representative of the true
clinic population in whom CCM could be utilised in the future as a monitoring
tool. This group represents patients, mostly with T2DM who are not seen in the
hospital clinical and have less severe complications of diabetes than those who
have previously been investigated with CCM. It thus provides an opportunity to
explore CCM as a biomarker for diabetic neuropathy in a novel cohort. Using
the data, I will address the following aims:
Primary Aims and Hypotheses:
1. Aim: To determine the prevalence of diabetic peripheral neuropathy, as
defined by CCM parameters in a cohort of people with diabetes, who were
screened in primary care, compared to age-corrected control subjects.
Hypothesis: The prevalence of diabetic peripheral neuropathy, defined
using CCM parameters will be lower in this population in comparison to
previous CCM studies using patients under the hospital eye service to
determine prevalence of DPN.
2. Aim: To assess whether abnormalities in corneal nerve fibre morphology are
present during the first two years following diabetes diagnosis.
Hypothesis: There will be evidence of abnormalities in corneal nerve fibre
morphology in some, but not all, patients with diabetic disease duration of less
than or equal to 2 years.
3. Aim: To assess whether abnormalities in corneal nerve morphology are
present prior to any retinopathy, defined as grade 1 or more.
Hypothesis: There will be evidence of abnormalities in corneal nerve fibre
morphology in some, but not all, patients with retinopathy and maculopathy
grade 0.

66
4. Aim: To assess whether abnormalities in corneal nerve morphology are
present prior to clinical evidence of diabetic neuropathy, as defined by diabetic
neuropathic symptom (DNS) scoring of 1 or more
Hypothesis: There will be evidence of abnormalities in corneal nerve fibre
morphology in some, but not all, patients with a DNS score of 0.
Secondary Aims:
1. To evaluate if automated software can assess corneal nerve parameters with
no significant differences from manual software and to determine if image
quality influences the software's accuracy.
2. To assess the changes in corneal nerve morphology, in relation to diabetes
duration, in order to determine the relative risk of developing diabetic peripheral
neuropathy as diabetes duration increases.
3. To assess if corneal nerve fibre morphology alters with increasing grades of
retinopathy from 0 to pre-proliferative.
4. To assess whether there is a significant difference in corneal nerve
parameters between patients with diabetes of different ethnic backgrounds.
5. To assess if nerve morphology alters with increasing diabetic neuropathy
symptom (DNS) from 0-4.

67
4. METHODOLOGY To address the aims of my thesis I analysed data collected during the study:
Implementation of Corneal Confocal Microscopy in Primary Care Optometry
Practices for Screening and Early Detection of Diabetic Neuropathy: a feasibility
study (Tavakoli et al., 2016). This study was funded by the National Institute for
Health Research Collaboration for Leadership in Applied Health Research and
Care (NIHR CLAHRC) Greater Manchester and Heidelberg Engineering UK and
International as a grant to the chief investigator Dr Mitra Tavakoli. The study
ethics were granted by the South Manchester research ethics committee (REC
reference 15/EM/0079, IRAS project ID 149169).
My involvement in this study commenced after it was completed, and databases
locked. I was therefore not involved in any of the set-up, management,
governance, data collection, archiving or close of the study. My role has been to
take the raw images collected in primary care, analyse the images to derive
quantitate data and to statistical analyse the data to address the aims above.
I am extremely grateful to the chief investigator of this study (Dr Tavakoli) who
is my MPhil supervisor as her data has enabled me to undertake this MPhil
project.
4.1 Dataset
Between April 2020- September 2020 I analysed this retrospective dataset,
originally collected as part of the study to investigate the feasibility of using
CCM screening in primary care. The full details of this study have been
published as an NIHR report (Tavakoli et al., 2016). The data were collected
from a cohort of 450 patients with diabetes who participated in a screening
program as part of the South Manchester Diabetic Retinopathy Screening
Service (SMDRSS) at four primary care optometry practices in Manchester, UK
between 2015-16. The forty healthy control (HC) subjects, analysed in this
thesis, were recruited previously as part of several REC approved studies,
including (Tavakoli et al., 2015). These HCs were volunteers who were students
and staff members at the University of Manchester. These control subjects
underwent CCM examination and image analysis, but all other clinical tests
were performed on the patient cohort only.

68
The research adhered to the tenets of the Declaration of Helsinki. Informed
consent forms were completed prior to assessments. Participant data was
stored securely, anonymised and randomised to ensure that the individual
analysing the images was not aware of the centre where the images were
collected or the patient characteristics.
4.2 Selection of Practices
South Manchester Diabetic Retinopathy Screening Service (SMDRSS) is one of
the programmes in the Greater Manchester area delivering diabetic retinopathy
screening. Four of the 78 practices providing screening as part of the SMDRSS
during the time of recruitment were approached and agreed to participate in the
study. These 4 were chosen based on there being a sufficient number of
patients attending the practice for screening to allow delivery the study within
the project timeline. They also reflected the different types of optometry
practices across Greater Manchester, i.e. practices that were part of a multiple
chain and those that were independent. The patient cohort at each practice
varied in terms of diversity and ethnicity, socio-economic status and age.
Each practice gave an estimate of their typical population in terms of age,
gender and ethnicity. Three of the 4 practices had a patient cohort of majority
white ethnicity (>90%). The fourth practice had a patient cohort of a majority
black ethnicity (80%). All four practices saw mostly patients with type 2 diabetes
(85-95%). For socio-economic factors, data from the national general practice
profiles was used. This was sourced and reported in the original NIHR report so
was already available for this study (Tavakoli et al., 2016). It was assumed that
patients attending for SMDRSS screening would approach a practice in the
vicinity of their home and therefore recruited patients would likely reflect the
local population demographics for each of the four practices.
At each practice, a participating optometrist received in-house training at the
NIHR-Wellcome Trust Clinical Research Facility in Manchester on how to
conduct CCM tests as well as associated theoretical knowledge of CCM
imaging applications and interpretation (Tavakoli et al., 2016).
4.3 Recruitment
Inclusion/exclusion criteria were set out prior to recruitment (Table 4).

69
Each of the 4 practices were asked to offer to perform CCM on all eligible
patients and to recruit between100-125 patients. Practices were reimbursed for
their time at a rate calculated based on hourly rate for optometrists, with
consideration of the practice's involvement (Tavakoli et al., 2016).
Inclusion Criteria Exclusion Criteria
Aged 16 years and older Under the age of 16
Signed written informed consent
Unable to give written consent themselves
Have type 1 or type 2 diabetes
Concurrent ocular inflammation or infection which may affect the cornea*
Participant of SMDRSS History of ocular or systemic disease that has affected the cornea (e.g. keratoconus, corneal dystrophies, refractive surgery)*
Wear rigid contact lenses*
* Exclusion criteria were applied because of the effect on natural structure/function of, or damage to, the cornea.
Table 4: Inclusion and exclusion criteria for the original feasibility study. Table adapted from
original study report (Tavakoli et al., 2016)
Patients with diabetes (T1DM and T2DM) aged 16 years and over were invited
to take part by each practice administration team when they contacted the
practice to book their annual retinopathy screening test. In most cases, CCM
was booked alongside the retinopathy screening appointment; and when this
was not feasible, CCM was scheduled as a separate appointment on a
separate day.
Eligible and interested patients were provided with a participant information
sheet and invitation letter at least 24 hours prior to their CCM test. At the
appointment, the optometrist further discussed the study with the patient,
checked clinical eligibility (Table 4) and took written informed consent (Tavakoli
et al., 2016)
Between April and September 2015, 449 of the 716 (63%) patients approached
across the four practices agreed to take part in the study. Full details of the
study methods can be found in the NIHR report (Tavakoli et al., 2016)

70
4.4 Patient History
Data were collected regarding gender, age, ethnicity, diabetes type and
duration. Patients' history was also recorded which included previous laser
photocoagulation treatment and history of any previously diagnosed;
retinopathy, foot ulceration, or diabetic neuropathy.
4.5 Assessment of Clinical Neuropathy
The Diabetic neuropathy symptom (DNS) score (Figure 11) was used to assess
each subject with diabetes for clinically evident DPN. The DNS score is a four-
item symptom score for assessing diabetic neuropathy, developed by an expert
panel and has been described in detail previously (Meijer et al., 2002). The
DNS score assesses the presence of the following four items. (i) un-steadiness
in walking, (ii) pain, burning or aching at legs or feet, (iii) prickling sensations in
legs or feet, and (iv) numbness in legs or feet (see figure 1 for published
guidance). A symptom was marked as present if it was experienced during the
previous 2 weeks. Presence was scored as 1 for each item, and absence was
scored as 0. The maximum score was therefore 4 points. A score of 1 or more
indicated clinically detectable DPN (Meijer et al., 2002).
Figure 11: DNS-score questions and guidelines for symptoms that would indicate a positive
response to each question. Figure adapted from (Meijer et al., 2002)
4.6 Assessment of Retinopathy
As part of the SMDRS, all patients with diabetes received screening for diabetic
retinopathy and maculopathy. A detailed description of the English Diabetic
Retinopathy Screening Service (DRSS) (Scanlon, 2017) and the retinopathy
grading criteria (Harding et al., 2003) have been published previously. The aim
of the English NHS Diabetic Eye Screening Programme is to reduce the risk of
sight loss amongst people with diabetes by prompt identification and treatment,

71
if necessary, of sight-threatening diabetic retinopathy. All people with diabetes
aged 12 years and over are invited for annual diabetic retinopathy screening.
Mydriatic, 2-dimensonal fundus photography was carried out on each patient.
Two images were taken per eye with one image field centred on the fovea and
another image field centred on the optic nerve. Images were graded by the
appropriately qualified, attending optometrist for level of diabetic retinopathy.
Based on the presence of several distinguishing features first outlined as a
result of the Early Treatment Diabetic Retinopathy Study (ETDRS)(Solomon
and Goldberg, 2019), depending on the level of retinopathy present, patients
with diabetes either continued to be monitored in the DRSS or were referred
into the hospital eye service (HES). A summary of the features of diabetic
retinopathy with corresponding grading and management guidelines can be
seen in Table 5.
Grading and Typical
Management Features
R0 (Monitor yearly) Normal. No signs of retinopathy.
R1 'Background'
(Monitor yearly in DRSS)
• Microaneurysms
• Dot or flame haems
• Cotton wool spots in the presence of non-referable DR
• A venous loop
R2 'Pre-proliferative'
(Referral to ophthalmologist)
• Multiple blot haems - ref images to decide if warranting referral
• IRMA on colour and red-free images - not just red free
• Venous beading
• Venous reduplication (dilation of a vessel adjacent to and the same calibre as the original vein so that they look like a loop/tangled)
R3A 'Active proliferative'
(Urgent referral to ophthalmologist)
• NVD/NVE
• Iris rubeosis
• Pre-retinal/vitreous haemorrhages
• Pre-retinal fibrosis
• Tractional RD
• Reactivation of previously stable R3
R3S 'Stable proliferative'
(Monitor yearly in DRSS)
• An image from discharge or within 3 months of discharge needed to compare to when screening.
• Stable NVD/NVE with peripheral scatter laser
• Stable pre-retinal fibrosis with peripheral scatter laser
• Stable R1/R2 features with peripheral scatter laser
M0 No maculopathy
M1
(Urgent referral to Ophthalmologist)
• Any exudate with 1DD of the fovea
• A group of exudates (greater than or equal to 1/2 DD in size) all within the macula
• Microaneurysms and/or haems within 1DD of the fovea + VA of less than or equal to 6/12
U • Un-assessable

72
Table 5: The criteria used for grading diabetic retinopathy in England with typical management
in primary care. Adapted from (Solomon and Goldberg, 2019).
4.7 Patient Examination with CCM
After retinal photography to assess DR, each subject had their corneal nerve
morphology imaged using laser CCM (Heidelberg Retinal Tomograph III
Rostock Cornea Module (HRT III RCM); Heidelberg Engineering GmbH,
Heidelberg, Germany) by a trained optometrist at each practice. An in-depth
protocol of this imaging technique has been described previously (Tavakoli and
Malik, 2011). Briefly, both eyes of each subject were anaesthetised using 0.4%
benoxinate hydrochloride and Viscotears gel was inserted to both eyes. This
acted as a coupling agent between the surface of the cornea and the CCM lens.
The system was adjusted to align the subject's outer canthi with the positioning
markers before they positioned themselves with their chin placed onto the
chinrest and their forehead pressed firmly against the headrest. They were then
instructed to fixate on a fixation target with the eye not being tested, to limit the
movement of the eyes. The objective lens was moved towards the patient until
there was very light contact with the cornea. The focal depth was set to 0μm, at
the corneal epithelial layer, and a scan of the entire depth of the cornea was
achieved yielding upwards of 100 images. This process was repeated in both
eyes and took between 5-15 minutes per patient. All resulting images were then
saved to each patient's file to be used in analysis.
4.8 Selection of Images
For analysis, images of the sub-basal nerve plexus were evaluated for; clarity,
resolution, pressure lines, and other artefacts. Based on this evaluation, I
selected images of the sub-basal nerve plexus, ensuring a minimum of five non-
overlapping images per patient. During selection (and analysis) of CCM images,
I was blinded to any other parameters relating to the participants. Ideally, 6
images were selected for analysis per patient, 3 images per eye. If images were
not of good enough quality to obtain 3 per one eye, then a minimum of 2
images in total (1 for each eye) were accepted. If less than 2 images of good
enough quality were available, then this subject was excluded from the
analysis. If more than 6 images were available, I chose 6 out of the available
images based on the following:
a. No pressure artefacts (Figure 12C).

73
b. Good image brightness, avoiding dark corners/edges (Figure 12B).
c. Minimised overlap of images (if possible) to avoid analysing the
same nerves.
d. Avoiding choosing the images with the most nerves, but with the
highest quality.
Good Quality Poor Quality
Figure 12: Representative CCM images of good and poor image quality. All images show
corneal nerve fibres running parallel to the Bowman’s cell layer. (A) Good image quality with
main nerve fibres and branches clearly visible throughout the image frame. No artefacts can be
seen. (B) Poor image quality with the centre of the image much brighter than the periphery. In
some of the periphery the course of the nerve fibres is not visible. (C) An area of poor image
quality. The red arrow points to a pressure artefact, which is caused by too much pressure
being applied to the cornea when capturing the image.
4.9 Image analysis
i) Semi-automated Analysis
Numerous manual/semi-automated programmes are available for the analysis
of the CCM images obtained, with no universally accepted method at present.
CCMetrics (MA Dabbah; Imaging Science and biomedical engineering,
University of Manchester, Manchester, UK) (Figure 13) was designed using
Matlab, and involves manual tracing of nerve fibres and branches, to determine
corneal nerve fibre length (CNFL), corneal nerve fibre density(CNFD), corneal
nerve branch density (CNBD) and tortuosity coefficient (TC). A 384 x 384 pixel
image is analysed which the programme converts into measurements per mm2
(Dehghani et al., 2014).
B A C

74
CCMetrics was used in this study to analyse 2-6 bilateral IVCCM images per
subject (Figure 13). Firstly, I exported each image onto the CCMetrics semi-
automated software (MA Dabbah; Imaging Science and biomedical
engineering, University of Manchester, Manchester, UK). I analysed all the
images, and at the time of analysis did not have access to any other information
about each patient, such as DNS score, date of birth or retinopathy grading. All
images were analysed using the same Wacom Intuos graphic tablet and tracing
pen.
Figure 13: An unanalysed 2D image of the corneal sub-basal nerve plexus viewed on
CCMetrics. Each image is 384 x 384 pixels in size and saved as a Bitmap file. When analysing
each image manually, the examiner must choose the correct parameter from the options in the
'Metrics' section of the viewing window. If tracing a main nerve fibre, 'TC and NFD' is chosen
first. If tracing a nerve branch, 'NFL' is chosen. Main nerve branches/branching points are
dotted using the 'NBD' option.
The following corneal nerve parameters were quantified; CNFL (mm/mm2),
CNFD (no./mm2), CNBD (no. /mm2), CNFT displayed as either of two
coefficients; implementation or deviation, and Langerhans cell density (LC)
(no. /mm2). For each parameter, an average value was calculated per patient.
A summary of parameter definitions can be found in table 6.

75
Parameter Units Definition
CNFA
mm2 /mm2 Total nerve fibre area per mm2.
CNBD
no./mm2 Number of main branches per mm2
CNFD
no./mm2 Number of main nerve fibres per mm2
CNFL
mm/mm2 Total length of all main nerves and branches per mm2.
CNFT
-*
The average deviation of each main nerve from a straight line*.
CNFW
mm/mm2 Average width of main nerve fibres per frame.
CTBD
no./mm2 Total number of branch points per mm2.
LC Density
no./mm2 Number of Langerhans cells per mm2
* CNFT is given as 2 values: CNFT deviation (between 0-1) and CNFT implementation (≥0)
Table 6: Summary of corneal nerve parameters reported by CCMetrics and ACCMetrics.
ii) Automated Analysis
Most of the research in the fields of CCM has been completed using semi-
automated analysis, however this is a time consuming, resource intensive
procedure, even for experienced examiners(Scarr et al., 2017b). This is a key
barrier to the implementation of CCM, particularly in clinical settings where time
and resources are more limited. In light of this, fully automated, algorithmic
defined, software has been developed to eliminate the manual input of analysis
(ACCMetrics Image Analysis Software v2.0, developed by M. Dabbah and X.
Chen, University of Manchester). For this protocol, the examiner must choose

76
and upload images per patient for analysis, usually based on a set criterion for
that specific study.
Ostrovski et al, 2015 (Ostrovski et al., 2015) also found a reduced
measurement biased in comparison to manual software when measuring the
same CCM image. However, some small cohort studies have previously
reported problems of automated software such as false positive and false
negative identification of nerve structures (Dehghani et al., 2014, Petropoulos et
al., 2014).
Scarr and colleagues (Scarr et al., 2017b) systematically examined the
measurement bias between automated and manual software. They found that
the automated protocol provided measures of CNFL that were systematically
lower than manually derived CNFL for all subgroups. No statistically significant
difference in the percentage underestimation across the range of values and in
each subgroup (28-33%underestimation) were found, however CNFL
measurements between the 2 methods were highly correlated (Rs=0.84). Chen
and colleagues (Chen et al., 2017) also found that automatic quantification of
nerve morphology showed a high correlation with previously reported, manually
measured, features. Again, automated measures were overall lower for CNFL,
as well as CNFD and CNBD however, no values are given to indicated whether
this difference was significant.
If automated software is to be used for analysis, measures should be taken to
resolve the measurement bias. Ideally, the software will be improved and
updated to resolve the measurements bias, however as we await technological
advances, we must either accept the underestimation bias whilst acknowledging
it is consistent across values and patient characteristics, or re-calibrate
threshold values adjusted to represent published reference standards for
manual methods by way of an estimating equation (Scarr et al., 2017b).
As part of my study, ACCMetrics automated software was also used to analyse
each subject, including healthy controls. The automated software produces
three parameters which are comparable to the manual software (CNFL, CNFD
and CNBD), as well as three additional parameters (Table 6) : CTBD defined as
the total number of branch points from a main nerve in each frame, CNFA
defined as total nerve fibre area, and CNFW defined as the average nerve fibre

77
width. As with the semi-automated software, 2-6 images were analysed and
average values were calculated automatically. Only the average values were
exported onto the data spreadsheet.
Original Image CCMetrics Analysis
Figure 14: Representative images of original IVCCM images (A,C) alongside their associated
semi-automated analyses using CCMetrics software (B,D). Main nerve fibres, nerve branches
and main branch start, and end points are denoted with red lines, blue lines and green circles,
respectively.
4.10 Analysis Validation
i) Analysis Training
Prior to working on this study, I attended a CCMetrics analysis training session
held at the University of Exeter Diabetes and Vascular Research Centre
(DVRC). During this session, the study PI went through how to use CCMetrics
manual software to trace corneal nerves and branches accurately, as well as
how to identify Langerhans cell presence based on established protocol
(Tavakoli and Malik, 2011). The study PI used examples of correct and incorrect
A B
D C

78
analyses to highlight aspects of images that are commonly analysed
erroneously.
Over the course of 3 weeks, I analysed 49 patients from the full SMDRSS
cohort of these patients and reviewed the annotated images with the CCM
expert to assess the accuracy. During this meeting I also presented any images
I had found difficult order to gain expert opinion and resolve any errors.
In addition to my training as described above to confirm appropriate consistent
analysis of the study images, the PI, who is the supervisor of my MPhil thesis,
chose 10% of the images that I had analysed from the patient cohort and
confirmed that the accuracy of my nerve analysis was acceptable.
ii) Inter-observer Agreement
To confirm that my analysis of the images was at an acceptable standard to
commence analysis of the cohort data, data from 24 subjects were analysed by
both myself (the investigator) and by a CCM expert, who can be considered as
the 'reference standard' due to a large amount of experience in CCM image
analysis. Corneal nerves were assessed by the CCM expert; however,
Langerhans cell presence and density were not. The CCM expert presented
CNFT using the implementation value so this value was assessed for tortuosity
agreement.
Six images were analysed per patient and an average was calculated for each
of the parameters. If more than 6 images were available for analysis, observer 2
chose 6 of these to analyse based on the previously mentioned guidance (see
section 4.8). Observer 1 then analysed the same 6 images. Both observers
were blinded to the results of the other until all images had been analysed.
Statistics were performed in Microsoft Excel for Office 365 (Microsoft Corp,
Seattle, WA, USA) and SPSS for Windows version 26 (SPSS Inc, Chicago, IL,
USA). Inter-observer agreement analysis was carried out on the average values
of the six images analysed for each subject. For both observers' values, the
mean, standard deviation (SD) standard error of mean (SEM) and range were
calculated. This was calculated for each nerve parameter. For each patient, the
difference in values between the two observers was calculated and a T-test was
carried out to test for significance. A p-value of <0.05 was considered a
significant difference. A two-way, mixed-effects model intraclass correlation test

79
was conducted for absolute agreement. This was expressed as ICC and 95%
confidence interval with values: <0.5, 0.5-0.75, 0.75-0.9, and >0.9 indicating
poor, moderate, good, and excellent reliability, respectively (Table 7). Bland-
Altman plots were created to illustrate the level of agreement between the two
observers (Figure 14).
The inter-observer agreement results displayed in Table 7 and Figure 15
demonstrate a good level of agreement between observers 1 and 2 for all nerve
parameters with no significant differences found. ICC values indicate excellent
agreement for all nerve parameters with small 95% confidence interval ranges.
This good inter-observer agreement statistically confirmed that the investigator
(myself) could accurately analyse CCM images when compared to the
'reference' standard.
NFD NBD NFL TC
Expert
Mean 29.49 85.3 18.03 16.87
±SD 6.98 29.56 3.59 4.69
SEM 0.29 1.23 0.15 0.20
Range 28.12 115.03 12.99 16.12
Investigator
Mean 29.14 82.43 18.60 17.30
±SD 6.47 33.53 3.98 4.99
SEM 0.27 1.40 0.17 0.21
Range 25 137.5 15.01 20.06
Mean difference -0.35 2.87 -0.57 -0.43
p-value 0.63 0.138 0.085 0.418
ICC value 0.960 0.974 0.973 0.915
Confidence
Interval 0.908-0.983 0.941-0.989 0.936-0.988 0.806-0.963
Table 7: Inter-observer agreement of 24 patients using CCMetrics. Values for expert are
considered the 'reference standard'. P-values calculated using a T-Test and all parameters
demonstrate a non-significant difference between observers.

80
Figure 15: Bland-Altman plot of differences between observer 1 and observer 2's CCM
analysis. NFD, NFL, NBD and TC agreement is represented in A, B, C and D respectively. The
plots display difference between results from Observer 1 and Observer 2 (y-axis) vs. the mean
of the two results (X-Axis). Each data point represents 1 of 24 patients analysed by both
observers using CCMetrics. The solid line at the y-axis position represents the mean of all the
differences between the two observers. The two dashed lines represent the 95% confidence
intervals, calculated as 1.96 Standard deviations away from the mean value for upper and lower
limits.
ii) Repeatability
To assess the level of repeatability of my analyses using CCMetrics, 12
subjects were chosen from the 49 subjects previously analysed. Three subjects
were chosen from each of the four practices to represent each practice equally.
For random selection, each subject was allocated a number from 1 to N for the
subjects in each practice. N in this case was dependent on the number of
subjects in the 'practise' dataset from each optometry practice. An online
random number generator was used to choose 3 subjects from each practice to
be analysed for repeatability.
6 images per subject were analysed and mean values were calculated per
subject on three separate occasions. The time period between each occasion

81
was 1-2 months to reduce the chance of good repeatability from memory of
previous analysis. I stored each analysis results separately and remained
blinded to the previous analysis results until all 3 analyses per patient were
complete.
Statistical analysis was performed in Microsoft Excel for Office 365 (Microsoft
Corp, Seattle, WA, USA), and SPSS for Windows version 26 (SPSS Inc,
Chicago, IL, USA). Repeatability analysis was carried out on the mean values
from each subject. SD, SEM, range and Coefficient of Variation (CoV) were
calculated for the 12 patients for analysis 1-3. These were calculated for each
nerve parameter. The coefficient of variance F-value was calculated using
SPSS in order to calculate any significance in results from the 3 analyses. A p-
value of <0.05 was considered a significant difference. A three-way, mixed-
effects model intraclass correlation test was conducted for absolute agreement
between the 3 analyses for each subject. This was expressed as ICC and 95%
confidence interval with values: <0.5, 0.5-0.75, 0.75-0.9, and >0.9 indicating
poor, moderate, good, and excellent agreement, respectively (Table 8).
All parameters demonstrated excellent agreement with small confidence
intervals, which meant that I was consistent with my analysis of each of the
patients and there was not a significant amount of variation when at different
analyses.

82
NFD NBD NFL TC TDev LC
Analysis 1
Mean 22.396 64.496 15.996 0.171 18.133 29.774
±SD 10.477 43.299 7.328 0.034 7.914 32.712
SEM 0.146 0.601 0.102 0.000 0.115 0.454
Range 50.000 162.499 32.298 0.136 42.037 168.74
9
CoV 0.468 0.671 0.458 0.197 0.436 1.099
Analysis 2
Mean 22.222 66.232 15.961 0.171 17.943 29.427
±SD 10.110 44.413 7.280 0.032 7.446 33.245
SEM 0.140 0.617 0.101 0.000 0.108 0.462
Range 43.750 174.999 31.556 0.147 40.701 168.74
9
CoV 0.455 0.671 0.456 0.189 0.415 1.130
Mean 22.309 66.319 15.876 0.181 17.938 28.559
Analysis 3
±SD 10.279 44.708 7.121 0.036 7.355 32.935
SEM 0.145 0.621 0.099 0.001 0.107 0.457
Range 43.750 200.000 30.260 0.150 41.232 168.74
9
CoV 0.460 0.674 0.448 0.199 0.410 1.153
ICC value 0.993 0.988 0.998 0.939 0.978 0.998
Confidence
Interval 0.990-0.995
0.982-0.992
0.997-0.999
0.909-0.961
0.968-0.986
0.997-0.999
Table 8: Analysis of intra-observer repeatability. Results from 3 separate analyses of 12
patients (72 images) using CCMetrics software.

83
4.11 Statistical Methodology
A sample size of 400 patients with a 95% confidence interval of ±5%, was
calculated to allow estimations of the proportions on study outcomes. This
decision was made in consideration of equipment availability and the feasibility
for the practices to recruit enough participants during the timeframe of the
original NIHR study.
For all analysis in the following section (Section 3. Results) statistical analysis
was performed in Microsoft Excel for Office 365 (Microsoft Corp, Seattle, WA,
USA), and SPSS for Windows version 26 (SPSS Inc, Chicago, IL, USA). When
addressing each research aim, data were tested for normal distribution. If, for
each parameter, data appeared be normally distributed then values are
expressed as mean ± SD and parametric tests were used to check for
significance. If data were not normally distributed, values were expressed using
median with range and non-parametric tests were used.
If any significant difference between the age distributions of any groups were
significantly different, analysis of covariance (ANCOVA) was used to evaluate
whether the values for the dependent variable were equal across ages and
statistically controlling for the age effects to produce an adjusted p-value.
For agreement analysis of automated vs semi-automated software, a two way,
mixed-effects model intraclass correlation test was conducted for absolute
agreement between the values for each patient/control. This was expressed as
ICC and 95% confidence interval with values: <0.5, 0.5-0.75, 0.75-0.9, and >0.9
indicating poor, moderate, good, and excellent agreement, respectively (Table
8).
To test if there was a correlation between nerve parameters and age, duration
of diabetes and DNS score, spearman's correlation analysis was carried out on
the diabetic cohort. This analysis produced an r value to demonstrate strong,
weak or no correlation. A p-value was also produced to indicate if this
correlation should be considered significant.
For the following sections of this thesis, CCMetrics software will be referred to
as manual analysis and ACCMetrics will be referred to as automated analysis.
This is so that when presenting data, it is clear which is being discussed.

84
5. RESULTS This section presents the results of this study, addressing the aims set out in
section 3.17. Details of the statistical methods used this section can be found in
the methods chapter.
5.1 Assessment of corneal CCM image quality obtained in primary care
whilst considering the reasons for excluded cases.
Before we could address the set out aims, we first had to assess whether the
images from primary care were of acceptable quality for analysis.
i) Grading of CCM images by different examiners
If CCM is to be introduced into primary care screening, then it is imperative that
corneal images can be taken successfully by trained individuals, in this case 4
optometrists, and that the images obtained are of satisfactory quality for
analysis as assessed by the optometrists themselves, myself as investigator
and a CCM expert (MT). Thus, we firstly assessed the number of patients
categorised into one of four groups based on image quality. Only patients in the
'excluded' group were excluded from further analysis.
At the four participating optometry practices, each optometrist taking the CCM
images graded image quality for the patients at their practice. For our analysis,
we have grouped these optometrist's gradings together, and have represented
them together as one examined represented by 'optometrist', to compare the
whole dataset to the myself (the investigator) and the CCM expert. More
detailed analysis of each optometrist's gradings can be found in the original
NIHR report (Tavakoli et al., 2016).
The majority of the 450 patients were graded as 'acceptable', by all three image
assessors (optometrists = 238(52.9%), investigator= 303(67.3%) and expert =
275 (61.1%) (Figure 15). The CCM expert graded more images as 'excellent' in
comparison to the optometrist and investigator (optometrist = 116(25.8%),
investigator=102(22.7%) and expert =142(32.7%)) (Figure 16 and Table 9). The
'optometrist', representing the clinician obtaining the scans, graded significantly
more images as 'poor' (optometrist =74(16.4%), investigator =22(4.9%) and
expert=9(2%)). The assessors excluded a similar number of cases (optometrist

85
= 22 (4.9%), investigator=23((5.1%) and expert =24(5.3%)). When comparing
the investigator and expert, 338 (75.3%) images were given the same grade
(Table 1). For 107 (23.8%) of the images there was a one grade difference
between the examiner and investigator. Seventy-four of these (16.5%) were
graded higher by the expert and the remaining 33 (7.3%) were graded higher by
the investigator. There was a two-grade difference in only 5 cases, whereby the
expert had graded highest in all 4 cases. Twenty of the same cases were
excluded by both assessors (Table 9). Three cases were excluded by the
investigator and not the expert, and 4 cases were excluded by the expert and
not the investigator.
Figure 16: The number of patients allocated different grades for image quality by the trained
optometrists (blue), the investigator (green) and a CCM expert (red). Data assessed from 450
subjects. Images that were classed as 'Exclude' by the investigator (n=23) were not included in
any further analysis.

86
Investigator
Exclude (n=23)
Poor (n=22)
Acceptable (n=303)
Excellent (n=102)
Expert
Exclude(n=24) 20 4
Poor(n=9) 5 4
Acceptable (n=275)
3 11 236 25
Excellent (n=142) 2 63 77
Table 9: Comparison between investigator and expert grading of each subject. Grey cells
indicate agreement of image grade between each assessor (n=338). For 107 subjects there
was a difference of 1 grade between assessors. For 5 patients there was a difference of 2
grades.
ii) Reasons for Exclusion
There were 4 main reasons for exclusion of the 23 cases by the investigator
(Figure 17). Most patients (65.2%) were excluded as no images were available.
This was due to unsuccessful scanning of these patients. For 1 patient, only 1
image was available. Although this image was of reasonable quality, the patient
was excluded as we were unable to obtain an average value for CCM results
from just one image of one eye. For 1 patient, insufficient information was
available regarding demographics and diabetic disease. For the remaining 6
patients, the quality of images obtained was considered too poor for reliable
analysis of the sub-basal nerve plexus.

87
Figure 17: The reasons for exclusion of patients by the investigator. Numbers represent the
number of patients out of a total 23 patients excluded.
5.2 Demographics and Clinical Information
The demographics, relevant patient history, and clinical information for the
patients and controls are summarised in Table 10. Of the 450 patients recruited
for the study, 23(5.1%) were excluded, leaving 427 patients with DM for
analysis. Most of the patients had T2DM (95%) with a small percentage having
T1DM (4%), as expected from the prevalence of diabetes in the UK. For 1% of
patients this information was not available (recorded as 'unknown'). The median
duration of diabetes was 6 years (range 0.1-51). Patients with DM were
significantly older than control subjects(p<0.001).The majority of patients with
DM were white(81%), 15% were black, 3% south Asian, 1% mixed and for 1%
information about ethnicity was not available (recorded as unknown).In the
patient cohort, there was a higher percentage of males (61%) compared to the
controls (52%). Seven percent of patients reported a history of diabetic
neuropathy (DN) with 4% of the cohort reporting history of foot ulcer. For <1%
of patients, the information was not available for DN or foot ulcer history
(recorded as 'unknown'). The majority of patients (61%) scored 0 on the DNS
for, by answering 'no' to experiencing all 4 symptoms as part of the

88
questionnaire. Seventeen percent of patients scored 1, 12% scored 2, 5%
scored 3 and 5% scored 4, with 4 being the maximum scoring for the DNS.
Most patients had no history of previous diabetic retinopathy (DR) (64%). Thirty-
four percent of patients had a history of previously recorded retinopathy and 2%
had received previous retinal laser treatment. For 2% of patients, information
regarding history of retinopathy was unavailable. On the day of the examination,
most patients were graded as R0 (67%), and M0 (97%), meaning no detectable
diabetic retinopathy or maculopathy respectively. Thirty-one percent of patients
were graded as R1, indicating 'background' levels. One percent were graded as
R2, or pre-proliferative retinopathy and 1% as R3, or proliferative retinopathy
which both would have required onward referral to the hospital eye service.

89
Table 10: Summary of the characteristics of the diabetic cohort (Patients) and control subjects
(Controls). Age and duration of DM are represented by median(range) due to a non-normal
distribution. Retinopathy grading based on the ETDRS criteria: 0 = no retinopathy, 1=
background, 2= pre-proliferative, 3=proliferative. Maculopathy grading: 0=no maculopathy 1=
maculopathy. 'Unknown' represents patients for whom information was not available. Excluded
cases were those with image quality that was deemed unacceptable, or there were < 2 images
available for analysis.
Characteristic Patients (N=427)
Controls (N=40)
p-value
No. 450 40 -
Excluded Cases 23 0 -
Gender Female Male
167 (39%) 260 (61%)
19 (48%) 21 (52%)
0.30
Age, years 67.9 (21-93) 37.5 (19-83) <0.001
Type of Diabetes T1 T2 Unknown
18 (4%) 407 (95%)
2 (1%)
- -
Duration of DM, years 6 (0.1-51) - -
Ethnicity White Black Asian Mixed Other/unknown
347 (81%) 65 (15%) 12 (3%) 2 (1%) 3 (1%)
- -
History of DN Y N Unknown
28 (6.5%) 397(93%) 2(0.5%)
History of Foot Ulcer Y N Unknown
16 (4%)
410 (96%) 1(<0.5%)
History of Retinopathy Y N Unknown
146(34%) 273(64%)
8(2%)
History of Laser Eye Treatment Y N Unknown
9(2%) 417(98%) 1(<0.5%)
DNS Score 0 1 2 3 4
262 (61%) 73 (17%) 49 (12%) 21 (5%) 22 (5%)
- -
Retinopathy Grading R0 R1 R2 R3
288 (67%) 132 (31%)
4 (1%) 3 (1%)
- -
Maculopathy Grading M0 M1
414 (97%)
13 (3%) - -

90
5.3 Comparison of corneal nerve data derived using manual and
automated analysis of the same CCM images in patients with diabetes.
In order to compare agreement between automated and manual corneal nerve
analysis, values for CNFD, CNFL and CNBD for each method were assessed.
Image quality grading of the investigator was used for each patient to explore
the potential effect of image quality on agreement between methods.
Table 11 : Comparison of automated and manually quantified measurements for CNFD, CNFL,
and CNBD. Analysis conducted on diabetic cohort (n = 427). Results reported as mean,
standard deviation (SD) and standard error of the mean (SEM). Mean difference value
represents the mean difference between results from each method. Mean % difference
represents the average difference expressed as a percentage of the manual analysis result (i.e.
if the manual CNFL result for a parameter was 20mm/mm2 and for automated software is was
10mm/mm2 then the % difference would be 50% as the difference is 50% of the manual CNFL).
Two-way mixed-models for ICC are shown with 95% confidence intervals and statistical
significance reported to represent agreement between manual and automated software. All p-
values calculated with a paired samples T-test. Statistical significance determined by p ≤0.05.
i) Corneal Nerve Fibre Density
For most of the patients examined (88.3%), a higher measurement for CNFD
was obtained manually in comparison to the automated method (Figure 19A).
Overall, the mean difference between the two measurements was 4.26
CNFD(no./mm2) CNFL(mm/mm2) CNBD(no./mm2)
Manual Analysis
Mean 25.83 19.35 77.3
±SD 7.08 5.69 37.92
SEM 0.34 0.28 1.83
Automated Analysis
Mean 21.57 13.62 30.96
±SD 7.11 3.56 16.45
SEM 0.34 0.17 0.79
Mean Difference 4.26 5.73 46.34
Mean % Difference 16.49 29.61 59.95
P-value <0.001 <0.001 <0.001
ICC 0.75 0.63 0.41
95% Confidence Interval 0.039-0.912 -0.183-0.876 -0.204 - 0.723

91
(no/mm2) and the mean percentage difference was 16.49%, with a mean higher
value for manual analysis. ICC values gave moderate agreement (ICC=0.75)
between the two measures, as defined by Koo et al (2016)(Koo and Li, 2016).
However, confidence intervals for ICC values were broad. There was no
correlation between mean CNFD number and the difference between the two
measurements (Figure 19A).
Remembering that all unacceptable images had been removed prior to
analysis, there were only a small number of images which were judged as poor
quality. These poor-quality images are shown as red dots on the graph below
(Figure 19A). From these figures it seems that the images of poor quality
tended to cluster in the group of images which had larger difference between
the two measures, but they were not the only images with large differences
between the two measures so some other factors –not identified here -must
also contribute to the ability of the two methods to accurately replicate data.
With the small numbers of poor images available in this study it was not
possible to formally assess these effects.
ii) Corneal Nerve Fibre Length
For most patients (97.0%), a higher measurement for CNFL was obtained
manually in comparison to automated software (Figure 19B). Overall, the mean
difference between the two measurements was 5.73(mm/mm2) and the mean
percentage difference between the two measurements was 29.61% with overall
higher mean for manual analysis. ICC values again gave moderate agreement
(ICC =0.63)(Koo and Li, 2016) between the two measures, however confidence
intervals for ICC values were broad (Table 11). There was modest positive
correlation between mean CNFL and the difference between the two
measurements (Figure 19B), indicating that the discrepancy between the
methods becomes greater as the fibre length increases.
Again, considering that all unacceptable images had been removed prior to
analysis, with only a small number of images which were judged as poor quality.
These poor-quality images are shown as red dots on the graph below (Figure
18B). From this figure it appears that a higher percentage of the poor-quality
images tended to fall in the group of images which were determined as having
longer CNFL with automated analysis (difference <0). However, images graded

92
as 'poor' were not the only images for which automated analysis determined a
larger CNFL (Figure 18), so some other factors –not identified here -must also
contribute to this difference. Again, with the small numbers of poor images
available in this study it was not possible to formally assess these effects.
iii) Corneal Nerve Branch Density
Overall, the mean difference between the two methods was 46.34 (no/mm2) and
the mean percentage difference was 59.95%, making CNBD the parameter with
the largest % disagreement between the two methods. ICC values gave poor
agreement (ICC=0.41) between the two methods and confidence intervals for
ICC values were broad (Table 11). There was modest positive correlation
between mean CNBD and the difference between the two measurements
(Figure 19C).
There appears to be no effect of image quality grade on the agreement
between the two measures (Figure 19C). As with the CNFD and CNFL, poor-
quality images are shown as red dots on the graph below (Figure 18C), but with
the small numbers of poor images available in this study it was not possible to
formally assess these effects of image grading on agreement of CNBD.
The published normative age-related CCM values by Tavakoli and colleagues
(Tavakoli et al., 2015) were determined using manual CCM software, thus in
order to compare the current data with these normative values, manual analysis
will need to be used. The results presented here in section 3.2 have shown a
general underestimation of CCM parameters when using automated software,
the subsequent sections of my thesis will initially compare the data outcomes
using both manual and automated analyses but more detailed statistical
analysis of the data will concentrate on the data obtained by manual analysis.

93
Figure 18: Images representing manual (B,E,H and K) and automated (C,D,I and L) analysis of
CCM images, whereby automated analysis gave outputs for longer CNFL in comparison to
manual results. A, D, G and J represent the original images. A and D represent images graded
as 'poor' quality. G and J represent images graded as 'acceptable' quality). Main nerve fibres,
nerve branches and main branch start, and end points are denoted with red lines, blue lines and
green circles, respectively.
Original Image Manual Analysis Automated Analysis
A B C
D E F
G I
J K L
H

94
B
A

95
Figure 19: Comparison of automated vs manual (semi-automated) analysis of CNFD (A), CNFL
(B) and CNBD (C) using Bland-Altman plots. X-axis of each plot represents the mean
measurement between the two methods of analysis for each subject. Y-axis represents the
difference in values between the two methods for each subject, calculated by (manual value -
automated value) for each patient. Data from diabetic cohort used in analysis (n=427). Solid line
represents the mean difference between the two methods. Dashed lines represent +/- (1.96 x
2SD). Red, blue and green markers represent images graded as poor, acceptable and excellent
by the investigator, respectively.
5.4 The Effect of Age on CCM Parameters
Overall, there was a significant negative age-related correlation with manually
derived CNFD, CNFL and CNBD (p<0.001 for all 3) (Table 12). Similarly, there
was a significant negative correlation between age and all three parameters
measured using automated software (p<0.01 for CNFL and CNFD, p=0.002 for
CNBD). The only other parameter with a significant negative correlation to age
was corneal total branch density (CTBD) derived using automated software.
There was no correlation of tortuosity (using either coefficient), LCs density,
corneal nerve fibre width (CNFW) and corneal nerve fibre area (CNFA) with
age.
C

96
Statistic Age (Years) Diabetes Duration (Years) DNS Score
n Rs p-value Rs p-value Rs p-value
CNFD Manual 427 -0.26 <0.001 -0.14 0.003 -0.02 0.80
(no/mm2) Automated 427 -0.27 <0.001 -0.167 0.001 0.02 0.70
CNBD Manual 427 -0.2 <0.001 -0.16 0.001 0.007 0.80
(no./mm2) Automated 427 -0.15 0.002 -0.1 0.04 0.03 0.50
CNFL Manual 427 -0.24 <0.001 -0.13 0.008 0.003 >0.90
(mm/mm2) Automated 427 -0.2 <0.001 -0.14 0.004 -0.02 0.70
TC (0-1) 427 0.07 0.10 0.1 0.04 0.001 >0.90
(0-20) 427 0.07 0.20 0.06 0.20 0.1 0.04
LCs Density (no./mm2) 427 0.09 0.06 -0.009 0.90 -0.08 0.10
CTBD
(no./mm2 ) 427 -0.12 0.02 -0.08 0.10 -0.005 0.90
CNFA
(mm2/mm2) 427 0.002 >0.90 -0.03 0.60 0.02 0.70
CNFW
(mm/mm2) 426 0.02 0.70 -0.002 >0.90 0.02 0.70
Table 12: Spearman’s correlation (Rs) and statistical significance (p-value) of manual and
automated CCM image analysis with age, disease duration and DNS score. Data analysed
from patient cohort and included patients with T1 and T2 DM. Significant correlations are
highlighted in red.
5.5 Prevalence of DPN in a cohort of people with diabetes, as defined by
CCM parameters, compared to age-corrected control subjects.
i) Comparison of CCM parameters in patients with diabetes
compared to controls
In order to assess whether there were any significant corneal nerve changes
that may be related to diabetes, the results for CCM parameters from the
patient and control groups were compared.
Corneal nerve fibre density (CNFD) was significantly lower in patients with
diabetes compared to control subjects for both manual (p<0.001) and

97
automated (p<0.001) analysis methods (Table 13). Similarly, corneal neve fibre
length (CNFL) (p<0.001 for both methods) and corneal nerve branch density
(p<0.001 and p=0.01 for manual and automated respectively) were both
significantly lower in patients with diabetes (Table 13). Tortuosity of the main
nerve fibres, determined using manual analysis, was significantly higher in
patients with diabetes vs control subjects, when using both tortuosity coefficient
(TC) values (p<0.001 for both) (Table 13). Langerhans cells were detected in
97.7% of patients with diabetes compared to 87.5% of control subjects,
however this difference was not statistically significant (p=0.06) and there was
no significant difference in LC density between the two groups (p=0.91).
CCM Parameter Patients (N=427)
Controls (N=40) p-value
CNFD (no./mm²) Manual Automated
25.84 ± 7.08 21.6 ± 7.10
33.90 ± 6.27 26.26 ± 6.71
<0.001 <0.001
CNFL (mm/mm²) Manual Automated
19.37 ± 5.68 13.62 ± 3.55
25.08 ± 4.79 16.66 ± 2.76
<0.001 <0.001
CNBD (no./mm²) Manual Automated
75.00(0-212.50) 29.16(0-82.29)
113.54(12.50-252.08)
37.50(8.33-89,58)
<0.001
0.01
TC (0-1) 0.20(0.12-0.26) 0.17(0.13-0.22) <0.001
TC (0-20) 16.90(9.60-24.02) 14.91(8.18-32.66) <0.001
CNFW (mm/mm²) 0.21(0.02-0.03) 0.21(0.02-0.03) 0.60
CNFA (mm²/mm²) 0.006(0.00-0.01) 0.007(0.00-0.01) <0.001
CTBD (no./mm²) 46.87(0-138.5) 59.89(15.62-117.20) 0.005
LCs Presence Y N
417(97.7%)
10(2.3%)
35(87.5%) 5(12.5%)
0.06
LCs Density (no./mm²) 22.92(8.18-32.66) 19.27(0-391.70) 0.90
Table 13: Summary of CCM parameters calculated using manual and automated methods.
Results are for the cohort with diabetes (Patients) and the control group (Controls). Values for
CNFD and CNFL are represented by the mean (±SD) and p-values were calculated using an
unpaired t-test due to a normal distribution. LC presence is represented by the number of 'yes'
or 'no' results for each cohort. All other parameters are represented by the median(range), with
Mann-Whitney U-test used to calculate p-value, due to a non-normal distribution.

98
ii) Comparison of CCM parameters in patients with diabetes
compared to controls - age adjusted analysis
It is clear from table 2 that the control group, although well matched for gender
was significantly younger than the patient group. In order to assess whether the
differences observed above in section 5.4i) were due to age differences rather
than diabetes, the analyses were repeated with adjustment for age as a
confounder. After adjusting for age, using analysis of covariance (ANCOVA),
the manually derived parameters; CNFD(p<0.001), CNFL(p=0.001),
CNBD(p<0.001) and TC (P=0.04) continued to demonstrate a significant
difference between the patient cohort and control subjects (Table 14). LC
density was not significantly different between the two groups with (p=0.09) or
without (p=0.01) adjustment for age difference.
N Age (years)
CNFD (no/mm2)
CNFL (mm/mm2)
CNBD (no/mm2) TC (0-20) LC Density
(no/mm2)
Controls 40 37.5 (19-83)
33.90 ± 4.79
25.08 ± 4.79
113.54 (12.5--252.08)
14.9 (8.18-32.66)
19.27 (0-391.70)
Patients 427 67.9 (21-93)
25.84 ± 7.08
19.37 ± 5.68 75(0-212.50) 16.9
(9.60-24.02) 22.92
(8.18-32.66)
p-value - <0.001 <0.001 <0.001 <0.001 <0.001 0.90
Adjusted p-value - - <0.001 0.001 <0.001 0.04 0.09
Table 14: Comparison of manually derived nerve parameters between control subjects
(Controls) and cohort with diabetes (Patients). N represents the number of subjects in each
group. For CNFL and CNFD the mean ± SD is given, and an unpaired t-test was used to test
significance, due to a normal distribution of data. Median values are given for all other
parameters with Mann-Whitney U test used to test significance. Data shows a significant
difference between the average age of the groups, therefore an adjusted p-value calculated for
each nerve parameter using analysis of covariance. After adjustment all parameters, except LC
density demonstrated a significant difference between the two groups.

99
iii) Comparison of CCM parameters in patients compared to
normative published values
Section 5.4 presents the comparison between the CCM data in patients with
diabetes and a smaller, younger group of individuals without diabetes collected
by the same investigators. An alternative opportunity to assess whether the
patients' data differ to those expected in healthy individuals arises from the
publication of an age-segregated normative range by an international
consortium in six different countries in 2015 (Tavakoli et al., 2015).
Tables 15 and 16 display the median values for the male and female subjects
with diabetes, separated into 6 groups, based on age at the point of
examination. Data are presented for manually derived CNFD and CNFL only,
compared to the published normative median values for each age group. All
age groups in the cohort of male individuals with diabetes demonstrate a
median value for CNFL less than that of the normative published data (values
shown in red) (Table 15). This was also true for all but one of the age groups in
the female cohort (Table 16), where the median of the 56-65 age group was
0.57mm/mm2 higher than that of the published normative median.
For both male and female patient groups, the median CNFD was lower than the
normative published median CNFD for the three youngest age groups; 16-25,
26-35 and 36-45. In contrast, the median CNFD was higher than the normative
published median CNFD for males and females in the three oldest age groups;
46-55, 56-65 and over 65.
Age-corrected values at which CNFL may be considered abnormal have
previously been published (Tavakoli et al., 2015). When compared to these
values, 35 (13.46%) of males in the patient cohort were below the CNFL cut-off,
that is abnormally low (Table 9). Of these 35 males, 2 had T1DM and 33 had
T2DM. Overall, 20% of males with T1DM and 13.25% of males with T2DM were
classed as being abnormal using CNFL alone (Table 17).
For females, overall, a lower percentage were classified as abnormal in
comparison to the males. Twenty (11.98%) were below the CNFL cut-off. Of
these 20 females, 2 had type 1 diabetes and 18 had type 2 diabetes. Overall,

100
25% of patients with T1DM and 11.39% with T2DM were classed as being
abnormal (Table 18).
Table 15: Male Data. Comparison of 2 corneal nerve parameters (CNFD and CNFL) with age-
matched published normative values (Tavakoli et al., 2015). 'Cohort Median' represents the
median value for the males in each age group of the patient cohort (n=260)..'Normative Median'
represents the published median values for males in each age group (Tavakoli et al., 2015).
The difference between the normative and cohort medians were calculated as (Normative
median - Cohort median). Positive values are represented in red whereas negative values are
shown in black.(* unable to calculate median as n=1)
Table 16: Female Data. Comparison of 2 manually derived corneal nerve parameters (CNFD
and CNFL) with age-matched published normative values (Tavakoli et al., 2015). 'Cohort
Median' represents the median value for the females in each age group of the patient cohort
(n=167). 'Normative Median' represents the published median values for females in each age
group (Tavakoli et al., 2015). The difference between the normative and cohort medians were
calculated as (Normative median - Cohort median). Positive values are represented in red
whereas negative values are shown in black. (* unable to calculate median as n=1)
CNFD CNFL
Age n Cohort Median
Normative Median
Difference Cohort Median
Normative Median
Difference
16-25 2 22.40 31.85 9.45 16.07 26.43 10.36
26-35 1* 20.83 30.20 9.37 13.24 25.45 12.21
36-45 5 26.04 28.56 2.52 21.84 24.37 2.53
46-55 29 30.21 26.91 -3.3 21.87 23.28 1.41
56-65 36 27.08 25.27 -1.81 22.77 22.20 -0.57
>65 94 23.96 23.54 -0.42 18.86 21.11 2.25
Total 167

101
MALES n CNFL Cut-off
Value (mm/mm2)
< CNFL Cut-off (no)
< CNFL Cut-off (%)
16-25 1 15.93 0 0
25-35 3 14.05 1 33.33
36-45 9 13.2 1 11.11
46-55 26 13.01 3 11.54
55-65 66 13.12 7 10.61
>65 155 13.15 23 14.84
Type of Diabetes 1 2 Unknown
10 249
1 -
2 33 0
20% 13.25%
0%
Total 260 - 35 13.46%
Table 17: Classification of males within the patient cohort as having pathological CNFL length,
that is less than the suggested cut-off value. Subjects were classified based on their age group.
The manual CNFL value for each subject was compared to published cut-off values (Tavakoli et
al., 2015) (0.05th quantile of normative database). 'n' represents the number of male subjects
within each age group. The number and % of subjects classified as having pathological CNFL is
given for each age group as well as overall for males.
FEMALES n CNFL Cut-off
Value (mm/mm2)
< CNFL Cut-off (no)
< CNFL Cut-off (%)
16-25 2 15.08 1 50.00
25-35 1 13.17 0 0.00
36-45 5 12.48 1 20.00
46-55 29 12.48 1 3.45
55-65 36 12.9 3 8.33
>65 94 13.67 14 14.89
Type of Diabetes 1 2 Unknown
8 158
1
- 2
18 0
25% 11.39%
0%
Total 167 - 20 11.98%
Table 18: Classification of females within the diabetic cohort as having pathological CNFL.
Subjects were classified based on their age group. The manual CNFL value for each subject
was compared to published cut-off values (Tavakoli et al., 2015) (0.05th quantile of normative
database). 'n' represents the number of female subjects within each age group. The number
and % of subjects classified as having pathological CNFL is given for each age group as well as
overall for females.

102
5.6 CCM parameters of patients with diabetes, diagnosed ≤ 2 years,
compared to healthy control subjects.
In order to assess whether there may be any corneal nerve changes early in the
course of diabetes, a group of patients within the cohort who were diagnosed
with diabetes ≤ 2 years ago were compared with the control cohort.
When comparing the group of patients with ≤ 2 years duration of diabetes (2
T1DM and 98 T2DM) to the control subjects (n=40), the patients were
significantly older (p<0.001) (Table 19). The percentage of males and females
in each group did not differ significantly (p=0.09). After adjustment for age
difference, the manual CNFL of the patient group, in comparison to the control
subjects, was significantly lower (p<0.001). Overall, 9.18% of patients with short
duration of disease were classified as below the age-corrected published cut-off
point for CNFL (Tavakoli et al., 2015) and would have been considered
abnormal for this parameter alone. Similarly, the patient group had significantly
lower CNFD (p=0.01) and CNBD (p<0.001). Values for tortuosity and LCs
density were higher in patients compared to controls, however the differences
between the 2 groups were not significant (p=0.50 and 0.49 for TC and LCs
density respectively) (Table 19).
Due to the very small number of patients with T1DM (n=2), the patients with
T2DM were also considered alone, for this group of patients (n=98). When
testing without the patients with T1DM, there was no change to the results
showing significant differences in CNFD (p=0.01), CNFL(p=0.01),
CNBD(p<0.001), compared to controls but no significant differences in TC
(p=0.70) or LC density (p=0.61).

103
Controls ≤ 2 Years DM p-value Adjusted p-value
n 40 100 - -
Age (years) 37.5 (19-83) 60.85(21-89) <0.001 -
Type of Diabetes 1 2 Unknown
- 2
98 0
- -
Gender F M
19(48%) 21(52%)
40(40%) 60(60%)
0.09
-
Ethnicity White Black Asian Mixed Other
-
81(81%) 15(15%)
3(3%) 1(1%)
0
- -
DNS Score 0 1 2 3 4
-
73(73% 13(13%)
7(7%) 3(3% 4(4%)
- -
Retinopathy Grade R0 R1 R2 R3
- 78 (78%) 22(22%)
0 0
- -
Maculopathy Grade M0 M1
97(97%) 3(3%)
- -
CNFD (no/mm2) 33.90 ± 4.79 27.74 ± 6.93 <0.001 0.01
CNFL (mm/mm2) 25.08 ± 4.79 20.79±5.40 <0.001 0.004
CNBD (no/mm2) 113.54(12.50-
252.08) 79.17(6.25-
194.79) <0.001 <0.001
TC (0-20) 14.91(9.60-
25.02) 16.42(10.86-
31.33) 0.01 0.50
LCs Density (no/mm2)
19.27(0-391.66) 28.85(0-225) 0.60 0.50
Table 19: Comparison of manually derived nerve parameters between control subjects and
patient group with DM of duration ≤ 2 years. N represents the number of subjects in each group.
Retinopathy grading based on the ETDRS criteria: 0 = no retinopathy, 1= background, 2= pre-
proliferative, 3=proliferative. Maculopathy grading: 0=no maculopathy 1= maculopathy. For
CNFL, Age and CNFD the mean ± SD is given, and an unpaired t-test was used to test
significance, due to a normal distribution of data. Median values are given for all other
parameters with Mann-Whitney U test used to test significance. Data show a significant
difference between the average age of the two groups; therefore, an adjusted p-value was
calculated for each nerve parameter using analysis of covariance. CNFL and CNBD
demonstrated a significant difference between the two groups. When adjusted for age-
difference, CNFD, TC and LCs density were not significantly different.

104
5.7 Comparison of CCM parameters in patients with different duration
since diagnosis of diabetes.
Section 5.6 shows that within the first two years of diabetic life, abnormalities in
CCM parameter can be demonstrated. In this section, we assessed whether
there are significant differences in CCM parameters between patients based on
the time since their diabetes diagnosis. In section 5.4, Table 12 demonstrates
an overall significant correlation between CNFD, CNFL, and CNBD with disease
duration, when analysed using both manual and automated software. The
tortuosity, measured using the TC 0-1 parameter, was significantly positively
correlated with disease duration. Langerhans cells (LCs) and three parameters
measured only using automated software (CTBD, CNFA, CNFW) all showed no
significant correlation with diabetes duration. It must however be noted that age
differences between the patients was not adjusted for when calculating
correlation in Table 12.
In order to explore this further and to assess if increased duration of diabetes
increase the risk of corneal nerve degeneration, the patient cohort was split into
groups depending on duration of diabetes. Due to the small number of patients
with T1 diabetes (n=18) and considering the difference in disease aetiology
between the two types, patients with T1DM were excluded for this section and
focus was placed solely on the effect of duration of diabetes on the cohort with
T2 diabetes (n=408).
When split into 5 groups, according to disease duration, a significant difference
in age was found, with a significant trend in older age relating to longer disease
duration (p<0.001) (Table 20). After adjustment for age differences, patients
demonstrated no significant difference in CNFD, CNFL, CNBD, Tortuosity
(Figures 20 and 21) or LCs density (p=0.47) between the 5 groups. This
indicates that in this cohort, none of these parameters changed significantly in
relation to diabetes duration. The percentage of patients falling below the
normative published cut-off value were similar across the middle three duration
groups (12.05-13.74%) (Table 20). The group with the shortest duration had a
smaller percentage of patients falling below the cut-off value (9.18%) and the
group with the longest duration of diabetes (>20 years) had the highest

105
percentage of patients falling below the cut-off value (15.38%) however this
difference was not significant (p=0.47).
≤ 2 Years 2-5 Years 5-10 Years 10-20 Years >20 Years p-value
n 98 83 131 82 13 -
Age (years) 60.85(21-89)
63.30(34-87)
69.10(45-92)
72.45(46-93)
77.20(57-86)
<0.001
Gender F M
39(40%) 59(60%)
32(39%) 51(61%)
53(40%) 78(60%)
27(33%) 55(67%)
7(54%) 6(46%)
Ethnicity White Black Asian Mixed Other
79(81%) 15(15%)
3(3%) 1(1%)
0
65(78%) 15(18%)
3(4%) 0 0
110(84%) 16(12%) 2(1.5%) 1(1%)
2(1.5%)
65(79%) 13(16%)
4(5%) 0 0
9(69%) 4(31%)
0 0 0
-
DNS Score 0 1 2 3 4
71(72.5%) 13 (13.5%)
7(7%) 3(3%) 4(4%)
51(61.5%) 12(14.5%)
6(7%) 10(12%)
4(5%)
70(53.5%) 29(22.5%) 20(15%)
3(2%) 9(7%)
45(55%) 15(18%) 13(16%)
4(5%) 5(6%)
9(69%) 1(8%)
2(15%) 1(8%)
0
-
Retinopathy Grade R0 R1 R2 R3
78(80%) 20(20%)
0 0
63(76%) 20(24%)
0 0
94(72%) 36(27%)
1(1%) 0
41(50%) 39(48%)
2(2%) 0
5(38%) 7(54%)
0 1(8%)
-
Maculopathy Grade M0 M1
95(97%) 3(3%)
82(99%) 1(1%)
130(99%) 1(1%)
77(94%) 5(6%)
11(85%) 2(15%)
-
No of patients < CNFL cut-off 9(9.18%) 10(12.05%) 18(13.74%) 11(12.20%) 2(15.38%)
Table 20: Summary of the known characteristics and clinical grading information for patients
with T2DM, split into 5 age groups and control subjects (Controls). Age is represented by
median(range) due to a non-normal distribution. Retinopathy grading: 0 = no retinopathy, 1=
background, 2= pre-proliferative, 3=proliferative. Maculopathy grading: 0=no maculopathy 1=
maculopathy. See methods section for detailed grading characteristics. 'Unknown' represents
patients for which information was not available. Number of patients <cut-off was calculated
using published age-corrected values (Tavakoli et al., 2015)

106
Figure 20: Comparison of manual CNFD (A) and CNFL (B) across 5 groups, allocated
depending on duration since diagnosis of diabetes (years). Central marker represents the mean
value for each group. Error bars represent +/- 2SD. For the 5 duration groups, n=100 for ≤2
years, n=85 for 2-5 years, n=135 for 5-10 years, n=90 and n=17 for >20 years. *The p-value
calculated using ANOVA, and was adjusted for the effect of the significant difference in age
between the groups
*p=0.54
*p=0.08
A
B

107
Figure 21: Comparison of CNBD (A) and TC (B) across 5 groups, allocated depending on
duration of diabetes (years). Central line represents the median value for each group. Coloured
area represents the interquartile range (IQR) Error bars represent Q1-IQR and Q3+IQR. For the
5 duration groups, n=100 for ≤2 years, n=85 for 2-5 years, n=135 for 5-10 years, n=90 and
n=17 for >20 years. 17. Outliers are plotted as white circles with a black border. *p-value
calculated using Krystal-Wallis ANOVA and was adjusted for the effect of the significant
difference in age between the groups.
B
*p=0.50
*p=0.20
A A

108
5.8 CCM parameters in patients with no clinical levels of diabetic
retinopathy, compared to healthy control subjects.
According to the ETDRS Grading of diabetic retinopathy (Solomon and
Goldberg, 2019) R0 and M0 represent no detectable retinopathy and
maculopathy, respectively on screening for retinopathy. Therefore, the group of
patients meeting these criteria were compared to the control patients in order to
assess if any corneal nerve parameters were significantly altered prior to
detectable retinopathy.
In comparison to controls, patients were significantly older (Table 21) (p<0.001).
The patient group consisted of mainly patients with T2DM (97.5%), with no
significant difference between the number of males/females between the two
groups (p=0.26). Most of the patient group had a DNS score of 0 (65%), with
35% of patients scoring positively on the DNS scale for symptoms of
neuropathy (Score 1-4).After age adjustment, CNFD (p<0.001) and CNBD
(p=0.001) were both significantly lower in the patient group. Similarly, CNFL
was significantly lower in the patient group (p=0.01) when compared to control
subjects. Based on CNFL length alone, 11.89% of patients were below the age-
dependent published cut-off point, suggesting that 11.89% of patients with no
evidence of retinopathy may have significant corneal nerve fibre length
reduction.LC density and tortuosity were higher in the patient cohort, however
when age adjusted, this difference was significant for LC density only (p=0.03).

109
Controls Retinopathy Grade
0 p-value
Adjusted p-value
n 40 286 - -
Age (years) 37.5 (19-83)
60.85(21-89)
<0.001
-
Type of Diabetes 1 2 Unknown
- 5(1.5%) 279(97.5%)
2(1%)
- -
Duration of DM(Years)
- 6(0.10-51) - -
Gender F M
19(48%) 21(52%)
109(38%) 177(62%)
0.30
-
DNS Score 0 11111 22222 33333 44444
-
185(65%) 44(15%) 30(10%) 13(5%) 14(5%)
- -
CNFD (no/mm2) 33.90 ± 4.79 26.18 ± 7.03 <0.001 0.01
CNFL (mm/mm2)
25.08 ± 4.79 19.7 ± 5.65 <0.001 0.02
No. Patients <CNFL Cut-off T1DM T2DM
Unknown TOTAL
-
1 (20%) 33(11.74%)
0 11.89%
- -
CNBD (no/mm2) 113.54(12.50-252.08) 77.08 (0-212.50) <0.001 0.001
TC (0-20) 14.91(9.60-25.02) 16.77 (0.13-31.33) <0.001 0.20
LCs Density (no/mm2)
19.27(0-391.66) 22.92 (0-225) 0.90 0.03
Table 21: Comparison of manually derived nerve parameters between control subjects and
patient group with diabetic retinopathy grade 0. N represents the number of subjects in each
group. For CNFL, Age and CNFD the mean ± SD is given, and an unpaired t-test was used to
test significance, due to a normal distribution of data. Median values are given for all other
parameters with Mann-Whitney U test used to test significance. Data shows a significant
difference between the average age of the two groups; therefore, an adjusted p-value was also
calculated for each nerve parameter using analysis of covariance. After adjustment, TC was the
only parameter that did not demonstrate a significant difference between the two groups
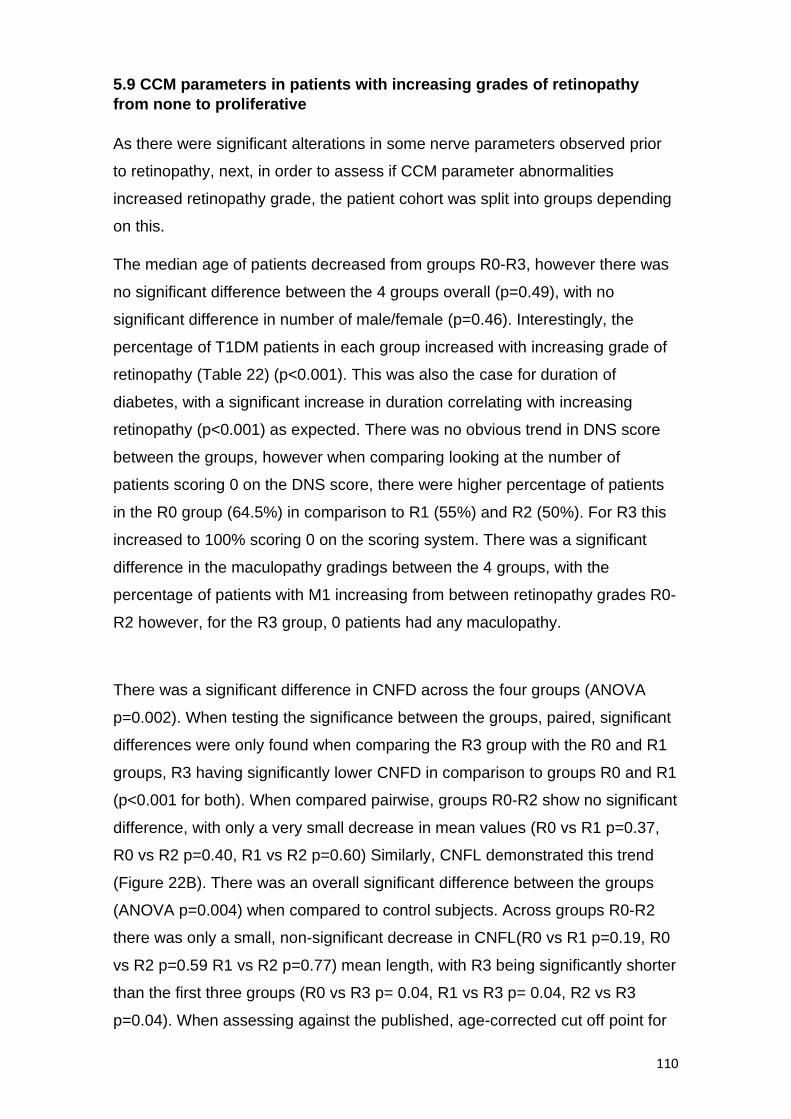
110
5.9 CCM parameters in patients with increasing grades of retinopathy
from none to proliferative
As there were significant alterations in some nerve parameters observed prior
to retinopathy, next, in order to assess if CCM parameter abnormalities
increased retinopathy grade, the patient cohort was split into groups depending
on this.
The median age of patients decreased from groups R0-R3, however there was
no significant difference between the 4 groups overall (p=0.49), with no
significant difference in number of male/female (p=0.46). Interestingly, the
percentage of T1DM patients in each group increased with increasing grade of
retinopathy (Table 22) (p<0.001). This was also the case for duration of
diabetes, with a significant increase in duration correlating with increasing
retinopathy (p<0.001) as expected. There was no obvious trend in DNS score
between the groups, however when comparing looking at the number of
patients scoring 0 on the DNS score, there were higher percentage of patients
in the R0 group (64.5%) in comparison to R1 (55%) and R2 (50%). For R3 this
increased to 100% scoring 0 on the scoring system. There was a significant
difference in the maculopathy gradings between the 4 groups, with the
percentage of patients with M1 increasing from between retinopathy grades R0-
R2 however, for the R3 group, 0 patients had any maculopathy.
There was a significant difference in CNFD across the four groups (ANOVA
p=0.002). When testing the significance between the groups, paired, significant
differences were only found when comparing the R3 group with the R0 and R1
groups, R3 having significantly lower CNFD in comparison to groups R0 and R1
(p<0.001 for both). When compared pairwise, groups R0-R2 show no significant
difference, with only a very small decrease in mean values (R0 vs R1 p=0.37,
R0 vs R2 p=0.40, R1 vs R2 p=0.60) Similarly, CNFL demonstrated this trend
(Figure 22B). There was an overall significant difference between the groups
(ANOVA p=0.004) when compared to control subjects. Across groups R0-R2
there was only a small, non-significant decrease in CNFL(R0 vs R1 p=0.19, R0
vs R2 p=0.59 R1 vs R2 p=0.77) mean length, with R3 being significantly shorter
than the first three groups (R0 vs R3 p= 0.04, R1 vs R3 p= 0.04, R2 vs R3
p=0.04). When assessing against the published, age-corrected cut off point for

111
each group, 11.81% of patients with R0 fell below the cut-off point, this
increased to 13.64% in the R1 group and 100% in the R3 group, however none
of the R2 group fell below the cut-off point.
CNBD followed the same trend as CNFL and CNFD (Figure 23A). There was an
overall significant difference across the groups (ANOVA p=0.03) when
compared to control subjects. Groups R0-R2 demonstrated only a small, non-
significant decrease in CNBD (R0 vs R1 p=0.14, R0 vs R2 p=0.21 R1 vs R2
p=0.33) with R3 being having significantly lower density than the first two
groups (R0 vs R3 p=0.02, R1 vs R3 p= 0.03. There was no significant
difference between groups R2 and R3 (p=0.48). For tortuosity there was no
overall significant difference between the groups (Figure 23B) (ANOVA p=0.42)

112
Retinopathy Grade
R0 R1 R2 R3 p-value
n 288 132 4 3 -
Age (years) 68.35(23-92) 67.50(21-93) 65.90(30-69) 50.40(41-77) 0.50
Type of DM T1 T2 Unknown
5(2%) 281(97.5%)
2 (0.5%)
10(7.5%) 122(92.5%)
0
1(25%) 3(75%)
0
2 (66.5%) 1(33.5%)
0
Duration of DM 6(0.10-51) 9(0.20-35) 14(6-20) 21(11-35) <0.001
Gender F M
109(38%) 179(62%)
54(41%) 78(59%)
3(75%) 1(25%)
1(33.5%) 2(66.5%)
0.50
Ethnicity White Black Asian Mixed Other
233(81%) 42(14.5%)
9(3%) 2(0.5%) 2(0.5%)
106(80.5%) 23(17.5%)
3(2%) 0 0
4 (100%) 0 0 0 0
3 (100%) 0 0 0 0
0.70
DNS Score 0 1 2 3 4
186(64.5%) 44(15%)
30(10.5%) 14(5%) 14(5%)
72(55%) 29(22%)
18(13.5%) 7(5%)
6(4.5%)
2(50%) 0 0 0
2(50%)
2(66.5%) 0
1(33.5%) 0 0
0.20
Maculopathy Grade M0 M1
286(99.5%) 2(0.5%)
125(94.5%) 7(5.5%)
0 4(100%)
3(100%) 0
<0.001
No of patients < CNFL cut-off
34(11.81%) 18(13.64%) 0 3(100%)
Table 22: Summary of the known characteristics and clinical grading information for patients,
assorted into 4 groups, based on retinopathy grade, as well as controls. Age and duration of DM
are represented by median(range) due to a non-normal distribution. Retinopathy grading: 0 = no
retinopathy, 1= background, 2= pre-proliferative, 3=proliferative. Maculopathy grading: 0=no
maculopathy 1= maculopathy. See methods section for detailed grading characteristics.
'Unknown' represents patients for which information was not available. The number of patients
below cut-off was calculated using published age-corrected values (Tavakoli et al., 2015)

113
Figure 22: Comparison of CNFD (A) and CNFL (B) across 4 groups, allocated depending on
grade of retinopathy. Error bars represent ± 1 SD from the mean value. Both graphs show a
subtle decrease in CNFL and CNFD across the groups. For the groups R0-R3 n= 288, 132, 4
and 3 respectively. *One-way ANOVA used to test for significant differences across groups.
A
B
*p=0.002
*p=0.004

114
Figure 23: Comparison of CNBD (A), TC (B) and LC density (C) across 4 groups, allocated
depending on grade of retinopathy. Central horizontal line represents the median value for each
group. Coloured area represents the interquartile range (IQR) Error bars represent Q1-IQR and
Q3+IQR. Outliers are plotted as white circles with a black border. For the groups R0-R3 n= 288,
132, 4 and 3 respectively. *Krystal-Wallis on way ANOVA used to test for significance of
differences across groups.
*p=0.03
*p=0.40
B
A

115
5.10 Comparison of CCM parameters of patients with diabetes and
different ethnicities
Cornea nerve parameters were compared between white and black patients
within the cohort of diabetes. (Due to the very small number of patients of Asian
(n=12), mixed (n= 2) or other (n=3) ethnicities, these were excluded from
analysis for the following section.)
White and black ethnic groups did not differ significantly with respect to age
(p=0.58) and duration of DM (n=0.74) (Table 23). Most patients in both ethnic
groups had T2DM, (95%, 97% for white and black respectively) and there was
no significant difference in the percentage of males and females in each group
(p=0.07). Significantly more patients (p<0.001) of black ethnicity had a DNS
symptom score of 0 (85%) compared to white patients (56%), therefore a
positive result on the DNS scoring system of 1 or more was more common in
white patients (44% vs 15%). There was no significant difference in retinopathy
gradings (p=0.98) overall, however only the white group contained patients
graded with R2 or R3 retinopathy. Similarly, only the white group contained
patients with detectable maculopathy(M1) (4%). No black patients would have
fallen into the criteria for referral to the hospital eye service based on
retinopathy screening guidelines. For all manually derived CCM parameters,
there was no significant difference found (Table 23).

116
* Black British/Caribbean/Afro-Caribbean/African/Black other
Table 23: Comparison of manually derived nerve parameters between patient groups based on
their ethnicity. N represents the number of patients in each group. Retinopathy grading based
on the ETDRS criteria: 0 = no retinopathy, 1= background, 2= pre-proliferative, 3=proliferative.
Maculopathy grading: 0=no maculopathy 1= maculopathy. For CNFD and CNFL the mean ± SD
is given, and an unpaired t-test was used to test significance, due to a normal distribution.
Median values are given for all other parameters with Mann-Whitney U test used to test
significance. Data shows no significance between age and duration of DM. All p-values for CCM
parameters show no significant difference.
Ethnicity
White Black* p-value
n 346 65 -
Age (years) 68.4 65.7 0.60
Type of Diabetes 1 2 Unknown
16(5%) 328(95%) 2(<1%)
2(3%) 63(97%)
0
Duration of DM(Years) 6(0.1-51) 6(0.2-30) 0.70
Gender F M
139(39%) 207(61%)
24(37%) 41(63%)
0.07
DNS Score 0 1 2 3 4
193(56%) 65(19%) 49(14%) 20(6%) 19(5%)
56(86%) 6(9%)
0 1(2%) 2(3%)
<0.001
Retinopathy Grade R0 R1 R2 R3
233(67%) 106(31%)
4(1%) 3(1%)
42(65%) 23(35%)
0 0
>0.90
Maculopathy Grade M0 M1
333(96%) 13(4%)
65 (100%) 0
CNFD (no/mm2) 25.67±7.08 26.59±7.39 0.30
CNFL (mm/mm2) 19.2± 5.72 19.83± 5.51 0.50
CNBD (no/mm2) 75.1(0-200) 75.1(8.33-191.25) 0.90
TC (0-20) 17.04(8.18-32.66) 16.01(8.85-30.04) 0.20
LCs Density (no/mm2) 22.92(0-225) 26.04(0-212.50) 0.30

117
5.11 Comparison of CCM parameters between healthy control subjects
and patients with diabetes but no clinical evidence of diabetic peripheral
neuropathy, as defined by diabetic neuropathic symptom scoring of 1 or
more.
i) Prevalence of Symptoms
For DNS scoring of symptoms of diabetic peripheral neuropathy (DPN), the
majority of patients (61%) scored 0 i.e answered 'no' to experiencing any of the
four symptoms as part of the questionnaire. Seventeen percent of patients
scored 1, 12% scored 2 and 10% scored 3 or 4 combined, with 4 being the
maximum scoring for the DNS.The percentage of patients that reported
experience of each individual symptom are displayed in Figure 24. The
symptom with the highest percentage of patients responding with 'yes' was
burning (23.65%). Prickling was the least common with 14.05% reporting
experience of this symptom. Very similar numbers of patients reported
experiencing unsteadiness (18.97%) and numbness (18.74%).
Figure 24: Percentage of patients answering 'yes' and 'no' to each of the four symptom
questions of the DNS scoring system, relating to symptoms of peripheral neuropathy. For each
of the four charts, n=427.

118
ii) CCM and DNS Score 0
In our cohort, as DNS scoring was used to determine clinical neuropathy, a
score of DNS 0 represented no clinical neuropathy. The group of patients
meeting this criterion were compared to the control patients in order to assess if
any corneal nerve parameters were significantly altered prior to experiencing
symptoms.
The group of patients with DNS score of 0, were significantly older than the
control subjects (Table 24) (p<0.001). The patient group consisted mainly of
patients with T2DM (94%). There was no significant difference between the
number of males and females in each group (p=0.19). Most patients (71%)
were given a retinopathy grade of 0 after assessment, with 97% having no
maculopathy (m0). When adjusted for age differences between groups, CNFD
(p<0.001) and CNBD (p<0.001) were both significantly lower in the patient
group. Similarly, CNFL was significantly lower in the patient group (p<0.001)
when compared to control subjects. Based on CNFL length alone, overall
11.35% of patients with DNS score 0, were below the age-dependent published
cut-off point (Tables 25 and 26) suggesting that 11.35% of patients with no
evidence of clinical neuropathy may have significant corneal nerve fibre length
reduction.LC density and tortuosity were both higher in the patient cohort,
however when age adjusted, this difference was not significant for either
measure (p=0.18 and p=0.06 respectively).

119
Controls DNS Score 0 p-value Adjusted p-
value
n 40 262 - -
Age (years) 37.5 (19-83) 66.95(21-89) <0.001 -
Type of Diabetes 1 2 Unknown
- 14(5%) 246(94%)
2(15)
- -
Duration of DM(Years)
- 6 (0.17-51) - -
Gender F M
19(48%) 21(52%)
96 (37%) 166 (63%)
0.20 -
Ethnicity White Black Asian Mixed Other
-
193(74%) 56(21%) 11(4%)
0 2(1%)
- -
Retinopathy Grade R0 R1 R2 R3
- 186(71%) 72(27%) 2 (1%) 2 (1%)
- -
Maculopathy Grade M0 M1
254(97%) 8(3%)
- -
CNFD (no/mm2) 33.90 ± 4.79 25.84 ± 7.08 <0.001 <0.001
CNFL (mm/mm2) 25.08 ± 4.79 19.37 ± 5.68 <0.001 <0.001
CNBD (no/mm2) 113.54(12.50-
252.08) 75(0-194.79) <0.001 <0.001
TC (0-20) 14.91(9.60-25.02) 16.9(8.85-31.67) <0.001 0.20
LCs Density (no/mm2)
19.27(0-391.66) 22.92(0-212.50) >0.90 0.06
Table 24: Comparison of manually derived nerve parameters between controls and patients
with DPN grade 0 (DNS 0). N represents the number of subjects in each group. Retinopathy
grading based on the ETDRS criteria: 0 = no retinopathy, 1= background, 2= pre-proliferative,
3=proliferative. Maculopathy grading: 0=no maculopathy 1= maculopathy. For CNFL and CNFD
the mean ± SD is given, and an unpaired T-test was used to test significance, due to a normal
distribution of data. Median values are given for all other parameters with Mann-Whitney U test
used to test significance. Data shows a significant difference between the average age of the
two groups; therefore, an adjusted p-value was also calculated for each nerve parameter using
analysis of covariance. After adjustment, TC and LC density did not demonstrate a significant
difference between the two groups. CNFD, CNFL and CNBD all demonstrated a significant
difference with and without adjustment for age.
Tortuosity (0-20), measured manually, was weakly correlated with DNS score (r

120
Table 25: Classification of males within the diabetic cohort, and with a DNS score of 0, as
having pathological CNFL length or not. Subjects were classified based on their age group. The
manual CNFL value for each subject was compared to published cut-off values (Tavakoli et al.,
2015) (0.05th quantile of normative database). N represents the number of male subjects within
each age group. The number and % of subjects classified as having pathological CNFL is given
for each age group and overall for males.
Table 26: Classification of females within the diabetic cohort, and with a DNS score of 0, as
having pathological CNFL length or not. Subjects were classified based on their age group. The
manual CNFL value for each subject was compared to published cut-off values (Tavakoli et al.,
2015) (0.05th quantile of normative database). n represents the number of female subjects
within each age group. The number and % of subjects classified as having pathological CNFL is
given for each age group and overall for females.

121
5.12 To assess whether changes in corneal morphological nerve
parameters correlate with DNS scoring
As there were significant alterations in some corneal nerve parameters
observed prior to reported symptoms, in order to assess if increased corneal
morphological abnormalities increased with increased DNS score, the patient
cohort was split into groups by DNS.
In section 3.3, tortuosity (0-20), measured manually, was weakly correlated with
DNS score (r = 0.1) (p=0.04) (Table 27). This was the only parameter that
demonstrated a significant correlation. This correlation was very weak, and
most likely a result of chance given the multiple statistical tests being
undertaken. Had DNS score been correlated across more CCM parameters one
would have had more confidence that this was a true finding.
The current section sought to demonstrate if there were differences between
groups when divided according to DNS scores. There was no significant
difference between the groups of varying DNS score with respect to age
(p=0.11), duration of diabetes (0.63), gender (0.63) or type of diabetes (0.51).
Testing for significance did, however indicate a difference between the ethnicity
makeup of each group (p=001).There was no obvious trend in retinopathy as
DNS score increased(p=0.45) however when comparing DNS score 0 to scores
1-4, there were a higher proportion of patients with R0 grade retinopathy in the
DNS 0 group (71%)(Table 27) suggesting that a positive result on the DNS
scoring system may relate to detectable retinopathy. There was a higher
percentage of patients with maculopathy in the groups with the highest DNS
scores (3 and 4) compared to groups with DNS score 0-2.There was no
significant difference across the groups for CNFD (p=0.86), CNFL (p=0.79),
CNBD (p=0.97) or tortuosity (p=0.09) (Figures 25 and 26), however, when
determining patients that fell below the age-corrected published normative cut
off point for CNFL, the groups with higher DNS scores (3 and 4) contained a
higher percentage of patients falling below the cut-off, in comparison to the
other 3 groups(Table 27)

122
0 1 2 3 4 p-value
n 262 73 49 21 22
Age (years) 66.95(21-89) 68.50(47-89) 69.80(28-93) 69.60(49-91) 65.20(52-83) 0.10
Type of DM T1 T2 Unknown
14(5%) 246(94%)
2(1%)
3(4%) 70(96%)
0
1(2%) 48(98%)
0
0 21(100%)
0
0 22(100%)
0
0.50
Duration of DM 6(0.17-51) 7(0.1-25) 8(0.3-28) 5(1-22) 8(0.1-16) 0.60
Gender F M
96(37%) 166(63%)
32(44%) 41(56%)
19(39%) 30(61%)
9(43%) 12(57%)
11(50%) 11(50%)
0.60
Ethnicity White Black Asian Mixed Other
193(74%) 56(21%) 11(4%)
0 2(1%)
65(89%) 6(8%)
1(1.5%) 1(1.5%)
0
49(100%) 0 0 0 0
20(95%) 1(5%)
0 0 0
19(86.5%) 2(9%)
0 1(4.5%)
0
0.001
Retinopathy Grade R0 R1 R2 R3
186(71%) 72(27%) 2 (1%) 2 (1%)
44(60.5) 29(39.5%)
0 0
30(61%) 18(37%)
0 1(2%)
14(66.5%) 7(33.5%)
0 0
14(63.5%) 6(27.5%)
2(9%) 0
0.50
Maculopathy Grade M0 M1
254(97%) 8(3%)
72(95.5%) 1(1.5%)
49(100%) 0
19(90.5%) 2(9.1%)
20(91%) 2(9%)
0.09
No of patients < CNFL cut-off Value
31(11.83%) 9(12.33%) 6(12.24%) 5(23.8%) 4(18.18%)
Table 27: Summary of the known characteristics and clinical grading information for patients,
assorted into 4 groups, based on DNS score. Age and duration of DM are represented by
median(range) due to a non-normal distribution. Retinopathy grading: 0 = no retinopathy, 1=
background, 2= pre-proliferative, 3=proliferative. Maculopathy grading: 0=no maculopathy 1=
maculopathy 'Unknown' represents patients for which information was not available. The
number of patients below cut-off was calculated using published age-corrected values (Tavakoli
et al., 2015)

123
Figure 25: Comparison of CNFD (A) and CNFL (B) across 5 groups, allocated depending on
DNS score. Error bars represent ± 1 SD from the mean value. For scores 0-4, n= 262, 73, 49,
21 and 22 with increasing score. Both graphs show no obvious increase or decrease in
parameters across the 5 groups. One-way ANOVA was used to test for significant differences
across the groups.
B
A *p=0.90
*p=0.80

124
Figure 26: Comparison of CNBD (A), TC (B) across 5 groups, allocated depending on DNS
scoring. Central horizontal line represents the median value for each group. Coloured area
represents the interquartile range (IQR) Error bars represent Q1-IQR and Q3+IQR. Outliers are
plotted as white circles with a black border. For scores 0-4, n= 262, 73, 49, 21 and 22 with
increasing score. Krystal-Wallis one-way ANOVA was used to test for significance of differences
across the groups.
*p= >0.90
*p=0.09
A
B

125
i) A comparison of CCM parameters in patients with no symptoms
compared to patients with symptoms of burning.
As there was no significant difference found between the groups with increasing
DNS scores, for any of the 4 nerve parameters, the group of patients who had
reported experiencing burning symptoms, either as an isolated symptom or
along with others, were compared to the group with DNS score 0. This was due
to burning being the only symptom that is part of the DNS score representing
small fibre function which are the fibres CCM examines and thus may be a
more meaningful comparison.
There was no significant difference in age (p=0.09), duration of DM (p=0.67)
and number of males/females (p=0.19) between the two groups. Both groups
consisted mainly of patients with T2DM (Table 28). There was no significant
difference in retinopathy or maculopathy grades.
None of the CCM nerve parameters were significantly different between the two
groups (Table 28). LCs density was lower in patients experiencing burning
(p=0.03).

126
DNS Score 0 Burning (+) p-value
n 262 101 -
Age (years) 66.95(21-89) 68.40(48-93) 0.09
Type of Diabetes 1 2 Unknown
14(5%) 246(94%)
2(1%)
2(2%) 99(98%)
0
-
Duration of DM(Years)
6 (0.17-51) 6(0.10-28.0) 0.70
Gender F M
96 (37%) 166 (63%)
49(49%) 52(51%)
0.20
Ethnicity White Black Asian Mixed Other
193(74%) 56(21%) 11(4%)
0 2(1%)
95(94%) 4(4%) 1(1%) 1(1%)
0
-
Retinopathy Grade R0 R1 R2 R3
186(71%) 72(27%) 2 (1%) 2 (1%)
69(68%) 30(30%) 2(2%)
0
0.06
Maculopathy Grade M0 M1
254(97%) 8(3%)
97(96%) 4(4%)
0.08
CNFD (no/mm2) 25.84 ± 7.08 25.81±7.44 0.90
CNFL (mm/mm2) 19.37 ± 5.68 19.50±6.24 >0.90
CNBD (no/mm2) 75(0-194.79) 72.92(0-212.50) 0.70
TC (0-20) 16.9(8.85-31.67) 16.70(8.98-29.72) 0.07
LCs Density (no/mm2)
22.92(0-212.50) 15.62(0-224.50) 0.03
Table 28: Summary of the known characteristics, clinical grading information, and manual CCM
parameters for patients with no symptoms of peripheral neuropathy (DNS 0) and patients
reporting 'yes' to experiencing burning. For CNFL and CNFD the mean ± SD is given, and an
unpaired t-test was used to test significance, due to a normal distribution of data. Median values
are given for all other parameters with Mann-Whitney U test used to test significance.
Retinopathy grading based on the ETDRS criteria: 0 = no retinopathy, 1= background, 2= pre-
proliferative, 3=proliferative. Maculopathy grading: 0=no maculopathy 1= maculopathy.
'Unknown' represents patients for which information was not available. LCs Density was the
only parameter significantly different between the two groups.

127
6. DISCUSSION
The overarching aim of this thesis was to assess a large cohort of patients with
diabetes screened in primary care, using CCM alongside retinopathy screening
to assess the prevalence and severity of neuropathy (DPN). This novel study, to
our knowledge, is the first to assess these features in this cohort of patients
attending routine DR screening. The main findings are reviewed and discussed
here along with considering this work in the context of understanding corneal
nerve changes, related to diabetic peripheral neuropathy (DPN) in patients with
diabetes (DM). The primary care clinicians produced high quality images with
very few patients having to be excluded, this was facilitated by the fact that their
training enabled them to understand which images produced were of an
acceptable quality for analysis.
6.1. Evaluation of automated methods for assessing corneal nerve
parameters, compared to manual methods, whilst also determining if
image quality influences automated method accuracy.
Automated software is significantly quicker when analysing images in
comparison to manual software. This indicates that it would be the only viable
option for analysis if using CCM to screen for neuropathy in the future. In our
study when comparing results from automated and manual analysis, the results
for CNFD, CNFL and CNBD were all significantly lower. This is in agreement
with previous studies, also finding an underestimation when using ACCMetrics
automated software (Scarr et al., 2017b, Petropoulos et al., 2014).
The largest percentage difference between the two methods was found for
CNBD (59.95%). This can partially be explained as CNBD being the most
subjective to quantify of the three, producing the most variation between
examiners (Petropoulos et al., 2013b). Another strong contributing factor is that,
CNBD was measured using slightly different methods. ACCMetrics determines
CNBD by identifying the number of branching points from each main nerve,
whereas for CCMetrics the method of marking each main branch twice, at its
branching point and end, was used. This means that all main branches were
marked twice whereas for ACCMetrics, if a main branch only intercepted with a
main nerve once, then it was marked and counted as one branch.

128
Standardisation is required so that direct comparisons can be made between
studies in the future, and clear normative ranges can be set out.
CNFD was the parameter with the smallest mean difference between the two
methods (16.49%). The difference in CNFD between the two methods did not
correlate with mean CNFD (Figure 18A) between the two methods, suggesting
that it may be appropriate to compute a correction factor for CNFD when using
ACCMetrics that can be applied across a range of CNFD values. For CNFD and
CNBD, poor image quality did not significantly affect the agreement between
the two methods, which again, provides support for a CNFD correction factor
that may be used even for poor image quality.
For CNFL, the mean difference between the two methods was 29.61%, which is
very similar to the Scarr et al study (Scarr et al., 2017b) who reported between
28-33% difference, irrespective of level of clinical neuropathy. There was
correlation between the mean CNFL and the difference between the two
measures, making the potential use of a single correction factor difficult.This
also implies that if CNFL and CNFD are small/low the methods agree better but
if CNFL/CNFD is large/high the methods do not agree as well, the automated
system undercounts, which will mean that differences between groups will be
minimised. Unlike for CNBD and CNFD, image quality grade influenced which
method measured the longer CNFL. For images graded as poor, 6/22 were
measured with longer CNFL using automated software. This was a higher
percentage of images in comparison to that of grades acceptable or excellent.
This may be due to images of poor-quality containing artefacts such as
pressure lines, which the automated software erroneously identifies as a nerve
fibre (Figure 27).
Both automated and manual methods did show similar correlations for the
important findings of duration of diabetes and age, which demonstrates some
utility of automated analysis. However, due to the underestimation of measures
compared to manual methods, clinicians and researchers must carefully
consider the question they are seeking to address when deciding which method
to use.
If automated software is to be used for DPN screening, software needs to be
improved and updated to resolve the measurements bias. As we await these

129
technological advances, adjustment factors must be put in place to compare to
manual analysis as well features that identify and report poor image quality to
evaluate reliability of the output.
Figure 27. Representative image of original CCM images (A) with its associated automated
analyses (B). Main nerve fibres, nerve branches and main branch points denoted with red lines,
blue lines and green dots, respectively. Pressure line (yellow arrow) mistakenly identified as a
nerve fibre by the software.
6.2 The prevalence of diabetic peripheral neuropathy in the cohort of
people with diabetes, as defined by CCM parameters, compared to age-
corrected control subjects.
Corneal confocal microscopy (CCM), as a measure of the corneal sub-basal
nerve plexus, provides a potential surrogate biomarker for assessing small
nerve fibre changes in patients with DM. Several studies which recruited
patients from hospital clinics have confirmed CCM's ability to detect nerve
alterations when compared to healthy controls, (Ahmed et al., 2012, Alam et al.,
2017, Chen et al., 2015, Perkins et al., 2018, Scarr et al., 2017a, Tavakoli et al.,
2010, Ziegler et al., 2014) as well as to distinguish between patients with and
without clinical DPN (Scarr et al., 2017a, Chen et al., 2015, Alam et al., 2017).
CCM has shown promise for predicting future neuropathy from baseline
measurements (Lovblom et al., 2015, Pritchard et al., 2015) and has detected
nerve regeneration post-therapeutic intervention (Tavakoli et al., 2013).
In our study, when adjusted for age, patients in the diabetic cohort
demonstrated significantly lower corneal nerve fibre density (CNFD) and
corneal nerve fibre length (CNFL) in comparison to healthy controls. This
supports several published studies (Ahmed et al., 2012, Alam et al., 2017, Chen

130
et al., 2015, Perkins et al., 2018, Scarr et al., 2017a, Tavakoli et al., 2010) that
have also reported significant differences between these two cohorts.
With reference to CCM published normative values (Tavakoli et al., 2015), 20
females (11.98%) and 35 (13.46%) males were classified as having abnormal
CNFL that could be considered clinically significant (12.88% overall). This
implies that in our cohort, 12.88% of patients may be deemed to have small
fibre neuropathy if using CNFL as a single diagnostic measure. This percentage
is less than that of Anderson et al (2018) (Andersen et al., 2018a), who in a
cohort of patients with T2DM, found a prevalence of 19% DPN when using the
Toronto consensus for diagnosis. CCM is identifying small fibre damage, which
has been shown to precede large fibre changes (Umapathi et al., 2007,
Quattrini et al., 2007) thus, we would expect a higher percentage of abnormality
in this study, identified using CCM in comparison to Andersen and colleagues
(Andersen et al., 2018a). This highlights the problematic nature of comparing
prevalence of DPN across studies using a range of definitions to classify DPN.
The impact of varying diagnostic testing procedures on the percentage of
identified DPN, was exemplified by the Diabetes Control and Complications
Trial (DCCT) data. In this cohort, the prevalence of DPN at baseline varied from
0.3% (abnormalities of reflexes, sensory examination and neuropathic
symptoms) to 21.8% (abnormal nerve conduction in at least two nerves)
depending on the criteria used for detection (DCCT, 1995).
Furthermore, studies are never identical with respect to demographics of their
patients, with a significant factor for our study being that patients were tested
during community screening. Although this would need to be confirmed with
further studies, it is likely that the relative stability of patients attending
community retinopathy screening would make them less susceptible to
developing diabetic complications such as DPN, and associated reduction in
corneal nerve fibres.
The significantly lower corneal nerve branch density (CNBD) in patients with
diabetes compared to control subjects is something that has been reported in
several studies using hospital cohorts (Tavakoli et al., 2010, Scarr et al., 2017a,
Chen et al., 2015, Alam et al., 2017). The use of CNBD as a diagnostic tool for
DPN has, however, been challenged and the pathophysiological importance is
uncertain. This is largely due to reports of high variability (Petropoulos et al.,

131
2013b) and inadequate validity when diagnosing DPN (Ahmed et al., 2012,
Alam et al., 2017, Chen et al., 2015, Scarr et al., 2017a). Nonetheless, CNBD
can be informative when assessed in conjunction with CNFL to identify early
corneal nerve pathology (that is, "pruning" of nerves), as both parameters may
represent changes in the most distal peripheral nerves, prior to any changes in
CNFD. CNBD has also been identified as the first parameter to show
regeneration post-simultaneous pancreas-kidney transplantation in patients with
T1DM(Tavakoli et al., 2013), suggesting that it may be a useful parameter in the
use of clinical trials to identify early therapeutic responses.
Main nerve tortuosity (TC0-20) was significantly higher in my patients from
primary care compared to controls. This supports early studies, with much
smaller cohorts from a hospital setting, which reported similar findings (Mocan
et al., 2006, Kallinikos et al., 2004). Mocan et al. (2006) studied patients with
T2DM, whereas Kallinikos et al (2004), studied patients with both T1DM and
T2DM. The physiological significance of changes in tortuosity are not currently
well understood and more recent studies have found no significant difference
between patients with DM and healthy controls (Ziegler et al., 2014, Ahmed et
al., 2012). However, one of these studies specifically examined patients with
T2DM who were newly diagnosed (Ziegler et al., 2014), therefore changes in
tortuosity may have been too mild to detect or may occur later in the disease
process.
Tortuosity as a measurement can be highly variable, with poor inter and intra-
observer variability (Hertz et al., 2011). Such variability might at least in part
explain differences between studies. Our study found excellent inter-observer
(ICC=0.915) and intra-observer (ICC= 0.978) agreement when measuring TC
using manual software. This may be due to graphic tablet-based analyses,
which allows better control during manual analysis in comparison to using a
computer mouse; however, this has not been proven and is beyond the scope
of this study. Such good repeatability would have facilitated the detection of
small differences between groups and might explain the positive findings in my
results compared to other negative studies. The use of tortuosity measurement
in patients with DM currently remains disputed.
I found no significant difference between the presence (p=0.06) and density
(p=0.91) of Langerhans cells. This finding contrasts that of two studies, which

132
have reported increased LC density within the sub-basal nerve plexus of the
cornea in patients with diabetes (Tavakoli et al., 2011a, Ferdousi et al., 2019).
Ferdousi and colleagues (2019) examined 64 children, all with T1DM (age:
14.6 ± 2.5 years, duration diabetes: 9.1 ± 2.7 years). This cohort is very different
to the cohort in this thesis, which was predominantly patients with T2DM and
adults, thus results cannot be directly compared.
However, Tavakoli and colleagues (2011) examined a cohort with similar
demographics to those examined for this thesis. They examined 128 patients
with predominantly T2DM (106/128), aged 58 ± 1 years with a mean diabetes
duration of 15 ± 1 years. Thus, it is unclear why there was a difference between
this published study and my findings with respect to Langerhans cells. Although
Tavakoli and colleagues did not describe how their patients were recruited, an
average HbA1c level of 8.16 ± 0.14 was given for their cohort. This may indicate
that their patients generally did not have well-controlled diabetes which may
have been less controlled in comparison to my primary care screening cohort,
thus having a more significant effect on Langerhans cells density. I had no
access to HbA1c information for this thesis, meaning a further study including
HbA1c measurement along with CCM measures would be required to test this
theory.
The potential implication of Langerhans cells to provide insight into immune-
mediated inflammation and neuronal damage in patients with diabetes has not
been established. Further longitudinal studies are imperative for understanding
the potential importance of neuro-immune responses and interactions in the
corneas of people with diabetes.
6.3 Changes in corneal nerve fibre morphology, detected by CCM, during
the first two years following diabetes diagnosis.
To assess the potential role of CCM to identify early nerve changes in patients
with diabetes, it was important to compare control subjects with patients of
duration ≤ 2 years since diagnosis. This was to determine if corneal changes
were occurring early in diabetes.
Our results suggested that significant changes had occurred in CNFD, CNFL
and CNBD as all measurements were significantly lower in the patient group

133
(p=0.01, p=0.004 and p<0.001 respectively, with age adjustment). This
indicates that even during the earliest stages of diabetes, nerve degeneration
occurs in small peripheral fibres, as detected using CCM. Tortuosity and
Langerhans cells density did not differ significantly between the two groups. Our
findings support Ziegler et al, (2014a) who reported that in a group of 86
patients with duration of T2DM 2.1± 1.6 years, there was a significant reduction
in CNFD, CNFL and CNBD when compared to age-matched controls.
Ziegler et al (2014a) concluded, using their own control cohort that CNFD was
the most sensitive parameter for detecting neuropathy in patients with diabetes,
as it detected 21% of patients who fell below the 2.5th percentile of the control
group. CNFL was the second most sensitive with 17% falling below the 2.5th
percentile (Ziegler et al., 2014). This percentage for CNFL abnormality is
significantly higher than that of abnormal CNFL, in patients with diabetes, found
in our study (9.18%), in comparison to age-corrected published values (Tavakoli
et al., 2015). It is likely that the significantly lower comparative percentage is
largely due to a difference in percentile cut-off points used to define an
abnormality. As mentioned, Ziegler et al (2014a) used the 2.5th percentile of
their control group, whereas we used the 0.5th percentile, therefore identifying
less patients as outside of this range.
It is difficult to directly compare the results of these two studies as although
sample sizes were similar (86 vs 100), our study evaluated only patients with ≤
2 years disease duration whereas the mean disease duration of the patients in
the Ziegler et al (2014) study was 2.1± 1.6 years. The longer duration of
diabetes in some of their cohort may have caused more significant corneal
nerve changes. Furthermore, due to frequent delays in diabetes diagnosis, the
exact time of disease onset is uncertain. Patients classed as having disease
duration of ≤ 2 years may be wildly different from the precise time since disease
onset, thus erroneously suggesting more significant changes to corneal nerve
fibres early on.
Lastly, high-adapted software was used for the Ziegler et al (2014) study, which
produced an image of the sub-basal nerve plexus composed from an image
stack, reconstructed into a combined mosaic image. This had an expanded field
of view in comparison to standard imaging using CCM. This software is not

134
widely used, and the different technique would likely cause no image overlap,
so may be a better representative of a wider area of the cornea.
One recently published study (Lyu et al., 2019) found that there was no
significant difference in CNFL between a patient groups with T2DM of duration
<10 years (5+/-3) and control subjects. This contradicts the findings of our study
and that of Ziegler and colleagues (Ziegler et al., 2014), however this may be
attributed to the study's strict inclusion/exclusion criteria - patients with Hba1c
levels of >7.8%, or history of proliferative retinopathy were excluded.
Despite the limited research into patients during the very early stages of
diabetes, our findings suggest that corneal nerve fibre changes may be
occurring very early on and may be an indicator of changes in the sensory
nervous system overall.
6.4 Changes in corneal nerve morphology, in relation to time since
diagnosis of diabetes, in order to determine the relative risk of developing
diabetic peripheral neuropathy as diabetes duration increases.
Increased duration of diabetes is a known risk factor for developing DPN
(Tesfaye et al., 2005), so it would be reasonable to predict a decrease in CNFD,
CNFL and CNBD across the patient groups when divided based on disease
duration. A recent cross-sectional study (Lyu et al., 2019) found a significant
decrease in CNFL when comparing T2DM patients with <10 years disease
duration (5 ± 3) and > 10 years disease duration (19 ± 6). The groups did not
differ with respect to age or Hba1c, which suggests that disease duration is
contributing factor. However, this study only assessed Chinese patients, and
may not apply to other ethnicities.
A longitudinal study (Pritchard et al., 2015) found that longer disease duration at
baseline visit (p=0.002) was a predictor of 4-year incidence of clinically evident
DPN in T1DM patients. Conversely, a similar study (Lovblom et al., 2015) found
no significant association between the same two factors. An explanation for this
may be due to the latter cohort lacking patients with a short duration of diabetes
(mean 18 ± 12 years). Their study followed a cohort of patients with T1DM, but
no clinical DPN at baseline, over 3.5 ± 0.9 years. At the end of the period,
patients were classified as new onset DPN or DM control group depending on

135
the development of DPN during the monitoring period. The 11 (17%) new-onset
cases of PN were similar, at baseline, to the 54 (83%) DM controls in age,
diabetes duration, gender, glycated haemoglobin levels and electrophysiologic
parameters (p≥0.20). However, cases of new onset clinical DPN had
significantly lower baseline CNFL and CNBD (p<0.05), again providing more
evidence for CCM as an early predictor of peripheral nerve changes.
In our cohort, we found no significant difference in any of the manually derived
corneal nerve parameters when assessing T2DM patients divided into 5 groups
based on duration of diabetes, the first being <2 years. This may suggest that in
this cohort of patients a longer duration of diabetes is not a risk factor for
developing DPN or was not evident in this cohort perhaps due to cohort
characteristics. When assessing CNFL alone, the percentage of patients falling
below the published cut off point for pathological length, increased from 9.18%
to 15.35% when comparing <2 years to >20 years disease duration. It must be
noted that the number of patients in the >20 years group was very small in
comparison to the other 4 groups, so this percentage may be misleading, as
one abnormal patient would represent a much larger percentage in this duration
group. Furthermore, this increase in percentage was not significantly significant
(p=0.47).
Similarly, Dehghani et al, (2016), found that in T1DM patients, there was no
significant correlation between corneal nerve parameters, measured using
CCM, and duration of diabetes (Dehghani et al., 2016). These patients were
monitored across a period of 4 years and were described as having stable
health, with stable clinical parameters throughout the study visits. This likely
reflected a desirable level of diabetic care and good diabetic education among
the participants.
Our cohort, recruited solely from community screening, are monitored within the
screening programme because of their stability with regards to retinopathy. Any
patients with uncontrolled diabetes or retinopathy above R1/M0 grade are
referred onto the hospital eye service for monitoring and management. Thus,
the findings of our study may be indicative of these patients' good diabetic
control. However, this suggestion is speculative as no HbA1c levels were
recorded during the study to confirm this.

136
In our cohort, the percentage of patients with diabetic retinopathy grade 0
decreased as the duration of diabetes increased. This may suggest that in this
cohort of patients in screening, progression of retinopathy from grade 0 to
detectable levels is related to disease duration which has been found previously
in patients with T2DM (Bitirgen et al., 2014, Nitoda et al., 2012). It suggests that
neuropathy and retinopathy may follow different patterns of progression through
increasing disease duration as DNS score also did not increase with disease
duration. However, the counter argument to this may be that retinopathy
screening is more sensitive to picking up changes that DNS scoring and that
other methods of DPN assessment might have detected change in neuropathy
with increasing disease duration.
6.5 CCM in the detection of subclinical diabetic peripheral neuropathy
prior to any retinopathy (defined as grade R1/M1 or higher)
At present, retinal photography is a successful screening method for diabetic
retinopathy (DR) and can detect early microvascular changes. Our findings
suggest that changes in corneal nerves may precede detectable retinopathy.
Measurements for CNFD (p=0.01), CNFL (p=0.02) and CNBD (p=0.001) were
all significantly less in patients with retinopathy and maculopathy grades 0, in
comparison to control subjects.
These finding confirm those of (Bitirgen et al., 2014), which also reported in
patients with T2DM and no DR, a significant reduction in CNFD (p<0.001),
CNFL (p=0.02) and CNBD (p =0.001), when assessed using automated
software. An earlier study (Nitoda et al., 2012) found a significant difference in
all three parameters, however this study used their own custom written routines
in MATLAB, rather than a commonly used software such as CCMetrics. Like our
findings, Nitoda et al (2012) found no significant difference in main nerve
tortuosity between these two groups.
When assessing patients withT1DM, two similar studies (Szalai et al., 2016,
Petropoulos et al., 2015b) also reported a reduction in CNFD, CNFL and CNBD,
prior to any retinopathy. However, Szalai et al, (2016) only assessed young
patients (mean age 22.86 ± 9.05 years), which was not overall representative of

137
the T1DM diabetic population. This cohort was very different to ours which was
(1) mainly T2DM patients and (2) of significantly older age.
Our study into this area is novel in that we have assessed patients in primary
care along with DR screening. This has allowed us to assess a larger cohort of
286 patients with no retinopathy, larger than that of the previous studies. Of
these patients, 31 (11.98%) had a CNFL measurement that was less than the
published age-corrected reference value. This may suggest that there are
several patients, who do not meet the referral criteria based on retinopathy but
may require further investigation and closer monitoring of peripheral nerve
changes. More studies are needed to investigate the cost-effectiveness of this
increase in referrals and the benefits to the patients.
Although our study demonstrates good agreement with the current literature,
the four previous studies discussed were completed in a hospital setting, by a
trained expert, thus were not representative of a cohort attending community
DR screening. There was also a significant lack of recently diagnosed patients
(less than <2 years), most notably in one of these studies in particular (Nitoda et
al., 2012). Nevertheless, the findings of these, and our study challenges the
current screening strategies deployed to detect the complications of diabetes.
Using CCM to identify corneal nerve changes may be the earliest window of
opportunity to intervene and prevent the progression of the triad of
microvascular complications; nephropathy, neuropathy and retinopathy.
6.6 Corneal nerve fibre morphology in relation to increasing grades of
retinopathy from 0 to proliferative.
Our findings confirm that of Nitoda et al (2012) and Bitirgen et al (2014), both of
which reported significant changes in nerve parameters of T2DM patients,
without diabetic retinopathy, in comparison to those with proliferative diabetic
retinopathy (grade R3). However, when Bitirgen et al (2014) tested for DPN
using electrodiagnostic and clinical examination testing, all patients with
proliferative DR had clinical levels of DPN so could be detected without the use
of CCM.
In our study we found only a small decrease in CNFD, CNFL and CNBD across
the first 3 retinopathy grades (R0-R2), with a significant difference in CNFD

138
(p=0.002), CNFL (p=0.004) and CNBD (p=0.03) only evident in patients with
proliferative DR (R3)(n=3). The two previous studies (Nitoda et al., 2012,
Bitirgen et al., 2014), in contrast found a significant change in nerve parameters
in parallel with increasing DR grade, however these studies grouped grade 1
and grade 2 together as 'non-proliferative', whereas our study assessed the
groups individually. As our study took place in community screening, there was
a very small number of patients with grade 2 retinopathy in our cohort (n=4).
This may explain the insignificant difference of CCM parameters in comparison
to grade 0. With such a small number of patients it would be difficult to find
statistical significance if the difference was only small.
A very recent study (Wang et al., 2020) also found a significant difference
between CNFD (p=0.015) and CNFL(p=0.015) in T2DM patients with and
without DR. However, this study did not specify their classification of DR, so it is
unclear if what proportion were at different levels of retinopathy.
Although studies, including ours have found a significant reduction of corneal
nerve parameters in patients with proliferative DR (R3), it is questionable,
whether these changes are due to the diabetes. In our cohort, 2/3 of the
patients with R3 retinopathy reported a history of retinal laser treatment.
Similarly, in Bitirgen et al.'s (2014) study, 23 patients (71.9%) of the patients
with R3 grade retinopathy had previously undergone retinal laser. It has
previously been suggested that pan-retinal argon laser photocoagulation may
directly cause corneal hypoesthesia, linked to associated with damage to the
short ciliary nerves. In two studies, patients with proliferative DR who had
received previous laser treatment had significantly lower cornea nerve fibres
compared to patients with proliferative DR and no previous laser (Cillà et al.,
2009, Bitirgen et al., 2014). This may indicate that in our cohort, the significant
reduction in nerve fibres in patients with grade 3 retinopathy may be directly
caused by the treatment itself. Our patient number was too small to divide into
patients with and without laser for grade 3 retinopathy, so we were unable to
confirm whether significant changes were related to the retinopathy grade
alone.

139
6.7 Corneal nerve parameters of patients with diabetes and differing
ethnicities.
In the UK population, amputation risk in patients with diabetes is reduced in
African-Caribbean men by around two-thirds, when compared to white men
(Abbott et al., 2005, Leggetter et al., 2002). As peripheral neuropathy is the
single most important contributor to diabetic foot ulceration and amputation
(Khanolkar et al., 2008), we may therefore predict that CCM parameters would
be more reduced in the white population of our study. CCM measures have
previously been compared between white and south-east Asian populations
(Fadavi et al., 2018). This ethnic group is also reported to have less lower limb
amputations (Fadavi et al., 2018), even though they are at significantly higher
risk of developing T2DM and ischemic heart disease (Mather et al., 1998). This
previous study reported significantly lower CNFL (p=0.04) and CNBD(p=0.02),
however no difference in CNFD (p=0.76) or CNFT (p=0.16) in Europeans when
compared to age‐ and sex‐matched south east Asians (Fadavi et al., 2018).
Interestingly, there was no difference between measures of small nerve fibre
function; warm and cold perception thresholds. Measures of sural nerve
conduction, which assesses large fibre function, were higher in South-East
Asians, suggesting they may have less sural nerve damage (p=0.006).
In our study, we found no significant difference between any CCM parameters
of white and black patients. Interestingly, our data does demonstrate a higher
percentage of white patients having a history of both DN and foot ulcer, as well
as having >0 DNS score at the time of visit. This is in line with the literature,
reporting that African-Caribbean's have less history of foot ulcer, and lower
NDS scores (Abbott et al., 2005). Also carried out in a community screening
setting, this previous study found a significant difference in vibration perception
threshold(VPT), which measures large nerve fibres, with a significantly lower
rate of abnormality in African-Caribbeans vs Europeans (13.2% vs. 23.6% p <
0.0001)(Abbott et al., 2005). Despite this, there was no difference in
temperature sensation, which would be a measure of small nerve fibre
functions.
Taking previous, albeit a limited number of, studies into consideration, there
may be several possible explanations for our findings. Firstly, this is the only

140
study, to our knowledge, investigating the difference in CCM parameters
between white and black populations with diabetes in the UK. There may be no
significant difference in corneal nerves between these groups. Taking Abbott et
al's (2005) study into account, perhaps a significant difference in large nerve
fibres increases the risk of foot ulcer in white populations, thus variations in
neuropathy prevalence occurring between the ethnic groups are dependent on
the nerve fibre type tested, for reasons yet unknown. This would need further
investigation using neurophysiology as a quantitative, objective measure of
large fibre function to confirm or dismiss this idea.
It must again be highlighted that our cohort attend primary care screening, so
doesn't include any patients under the hospital eye service and is not
representative of the whole diabetic population. As these patients are typically
stable, and appropriate for community screening, differences of corneal nerve
parameters may be too mild to detect between the ethnicities at this stage.
Furthermore, when making conclusions, we must consider established risk
factors for diabetic neuropathy. These include increased height, heart rate,
smoking, alcohol intake, insulin resistance, BMI, severity of microvascular
disease and most significantly, glycaemic control (Tesfaye et al., 2005). None of
this information was available for the cohort of patients in our study; therefore,
we cannot estimate their influence on the risk of neuropathy. A recent study
suggested that the variation in neuropathy between white populations and
South-east Asians is due to differences in height and adiposity between the
ethnic groups, as adjustment for these factors rendered the difference
insignificant (Tahrani et al., 2017). There is therefore a need for future studies
with these independent factors recorded and, if necessary, adjusted for.
6.8 Corneal nerve morphology in patients with no clinical evidence of
diabetic sensory peripheral neuropathy, as defined by diabetic
neuropathic symptom scoring of 1 or more.
Our results have demonstrated significant differences between CCM measures
of small nerve fibres using CCM (<0.001 for CNFD, CNFL and CNBD) when
comparing controls to patients with no symptoms of neuropathy (DNS score 0).
This suggests that changes may be occurring prior to any symptoms of DPN,

141
which supports the potential use of CCM as a tool to identify pre-clinical small
fibre neuropathy. It is known that symptoms alone are not sensitive for detecting
mild DPN, as in early stages, patients are often asymptomatic (Tesfaye et al.,
2010). It is difficult to compare these finding to that of the literature, as studies
typically use a clinical examination (signs and symptoms) or electrodiagnostic
tests along with symptoms to classify and stratify patients, as this is the current
recommended method for identifying clinical levels of DPN (Tesfaye et al.,
2010). As this information was not available to us for this study, a direct
comparison was not possible.
When comparing this group of patients to age-corrected published normative
values, 13.25% of males and 10.42% of females were below the cut off point for
CNFL. This may suggest that there is a percentage of patients with no
symptoms that have abnormal CNFD and may need further investigation for
early stages of neuropathy. These patients may fall into the classification of
'subclinical DPN' which Tesfaye et al. (2010) previously described as 'the
presence of no signs or symptoms of neuropathy are confirmed with abnormal
NCs or a validated measure of small fibre neuropathy'.
Interestingly, a higher percentage of the T1DM patients with no symptoms on
the DNS score were below the cut-off point in comparison to T2DM (28.5% vs
11.38%). This may suggest that that T1DM patients may not experience any
neuropathy symptoms until damage is more pronounced. Studies with larger
cohorts are needed before this can be confirmed.
6.9 Corneal Nerve Morphology in patients with diabetic neuropathy
symptom score, from 0-4.
Of the four symptoms assessed by the DNS, burning is the only one that is
thought to be caused by small fibre neuropathy (Cazzato and Lauria, 2017). It
would therefore be reasonable to predict that when developing this symptom,
small corneal C-fibres may have also changed significantly in comparison to
pre-symptoms, causing an onset of burning sensation. However, we found no
significant difference for any of the nerve parameters between the group of
patients with a DNS score of 0 (no symptoms) and those experiencing burning.
We may also predict that CCM parameters would reduce as DNS score

142
increases. We, however, did not find any difference between any of the groups
with DNS score 0-4 (p≥0.09 for CNFD, CNFL, CNBD and CNFT).
Several studies have found a significant reduction in CNFL in patients with
diabetes, and DPN (Alam et al., 2017, Chen et al., 2015, Scarr et al., 2017a,
Wang et al., 2020), compared to no DPN, so our findings could not confirm
these. There are several possible reasons for the discrepancy between our
findings and these studies. Firstly, three of the studies assessed a cohort of
patients with T1DM only, with only Wang et al (2020) assessing T2DM patients,
similar to our study which was majority T2DM (95%). Another significant
difference was that the cohort in the Scarr et al. (2017a) study had significantly
longer disease duration (median 54 years) and focused only on a cohort of
older patients (65 ± 7 years). Similarly, the disease duration for the patients was
also longer for the Chen et al. (2015)(Chen et al., 2015) study (23±16 (DPN-)
39±14 (DPN+). Most significantly, these previous studies used the Toronto
consensus for evaluating the presence of clinic DPN. This meant that they used
a quantitative measure of large nerve conduction studies (NCS) along with
assessment of symptoms and scoring. Chen et al. (2015) classified their
patients as having DPN if there was an abnormality of electrophysiology using
nerve conduction studies along with either a score of ≥ 1 on DNS scoring or ≥ 5
on the neuropathy disability score. In comparison, we relied on a single
measure of DNS scoring as this was all that was feasible in the setting of
primary care screening centre.
A very recent study (Yan et al., 2020) assessing T2DM patients only, found a
progressive- stepwise decline in CNFD, CNFL, CNBD and inferior whorl length
(IWL) as severity of peripheral neuropathy increased. This study used the total
neuropathy score (TNS) to stratify severity of neuropathy, which assesses both
quantitative signs as well as symptoms of neuropathy.
The DNS score is a fast and easy to perform symptom score which has
previously been validated using standard clinical methods (Meijer et al., 2002).
However, there are issues with using the DNS alone as an indicator of
neuropathy. Firstly, as part of the original study, DNS scoring was validated
against the diabetic neuropathy exam (DNE), Monofilament and VPT. Of these
3 tests, VPT is the only quantitative measure used, and all measures were
subjective, either from the patient of the examiner. Furthermore, these tests

143
detect large fibre neuropathy, but not small fibre changes. Validation against
electrodiagnostic which are considered the gold standard for large nerve fibre
changes has not taken place. This makes us question the validity of the DNS
score. The original validation also reports a sensitivity of 79% when detecting
clinical levels of DPN as determined by the DNE. In comparison, VPT sensitivity
was a superior 81% sensitive, even though it assesses large fibres only. The
authors of the study themselves advise that DNS may be too short to provide
reliable follow-up when used alone and recommend its use along with another
diagnostic tests (Meijer et al., 2002).
When tested against nerve conduction studies (NCS), DNS lacked sensitivity in
patients without any evidence of clinical neuropathy (using DNE score). It was
also unable to detect mild neuropathy in T2DM patients (Khan et al., 2015).
Ideally, patients should have DNS scoring along with other tests such as NCS
when looking at clinical levels of neuropathy. As CCM levels are pre-clinical it is
difficult to correlate this with DNS score. We cannot directly compare DNS
symptoms score with CCM as they are very different methods for assessing
nerve fibres. CCM is objective, quantitative and measuring small fibre structure.
The DNS score is simply yes or no, subjective and is focused on neuropathy
function rather than structure (Meijer et al., 2002). A more comprehensive
assessment of neuropathic symptoms such as using a presence/absence
symptoms questionnaire along with a scalar measure of intensity may have
provided a more in detail assessment of neuropathic symptoms. For example, a
very recent study (Kalteniece et al., 2020),used a small fibre neuropathy
symptom inventory questionnaire (SFN-SIQ) along with the neuropathic pain
scale (NPS) to assess symptoms of neuropathic pain, and found that there was
a significant association between all CCM parameters and the severity of
painful neuropathic symptoms.
We must emphasise that carrying out this study in a primary care setting, within
an optometry practice meant that there were time restraints and limitations to
resources. Electrophysiology must be carried out and interpreted by a
neurophysiologist which was not available in primary care, and more
comprehensive assessments of signs and symptoms would have been
impractical for the nature of the study.

144
Another explanation for the lack of significant change in CCM parameters
across the DNS scores may be that corneal nerve changes are the very earliest
to occur in the early stages of disease, but then stay constant in our specific
cohort of patients. As mentioned previously, because these patients are
attending screening programmes, they are transferred out of the programme
and into the hospital service if there are any concerns, leaving only stable
patients in the screening programme.
Another previous study also demonstrated that corneal nerve fibres change
significantly from no neuropathy to severe neuropathy in T1DM and T2DM
patients grouped together. In this study, patients were grouped into having no,
mild, moderate and severe neuropathy based on the Toronto classification.
However, when comparing patients with mild and no neuropathy, there were no
overall significant differences in CCM parameters between these two groups.
Only when DPN changes were classed as moderate or severe was CCM able
to distinguish them from no neuropathy (Petropoulos et al., 2015b, Petropoulos
et al., 2013a) . This may support our findings as, we generalise from our cohort
that patients are stable, and therefore have generally mild levels of retinopathy
and likely neuropathy due to them attending community screening. However, an
explanation for Petropoulous et al. (2013) is that this study used only small
number for patients with mild neuropathy (n=26), therefore making it difficult to
detect small differences between this group and the group with no neuropathy.
6.10 Limitations
For practical reasons, we were unable to age-match the control subjects with
the patient cohort. Although this was corrected for statistically, this method was
an estimate of the effect of age within these cohort. Age-matching the control
cohort may have automatically controlled for the confounding role of age in
changing CCM parameters and allowed a more direct comparison between the
two groups.
Another limitation of the study was that there was no available information
regarding height, triglyceride levels or Hba1c levels, which have previously
been associated with increased risk of neuropathy (Tesfaye et al., 2005). A very
recent study by Wang et al (2020), found that patients with T2DM and DPN had
significantly higher levels of HbA1c(p=0.035), high-density lipoprotein(p=0.003)

145
and fasting blood glucose(p=0.026). This meant that we were unable to
confidently conclude that any changes we found/did not find, between
subgroups of patients with DM, were down to the grouping factor and no other
independent factors such as HbA1c control.
Furthermore, our cohort was made up of mainly older patients with T2DM in the
screening population. This may be considered partially as a limitation, as we
were unable to confidently analyse data from younger patients and patients with
T1DM. However, it may be that our cohort, in Manchester, mirrors the
demographic of patients attending the retinal screening service in the UK, and
therefore adequately acts as a representative population of this specific group.
Lastly, the use of DNS only, as a measure of clinical neuropathy is a limitation
for addressing questions regarding level of DPN. Symptoms alone are not a
sensitive enough measure of DPN, especially in mild cases (Tesfaye et al.,
2010). It is also subjective and not quantifiable, therefore future validation
against quantitative measures of small fibre structure/function would be
necessary in a screening cohort in order to confirm some of the findings.
6.11 Conclusions
This study has been the first to use CCM to assess a large cohort of patients
with diabetes in primary care screening. Our study presents robust evidence
that CCM can be used in the primary care community to accurately detect
corneal nerve abnormalities in recently diagnosed patients with T2DM, prior to
evident retinopathy and prior to symptoms of neuropathy. The findings overall
support the current literature that CCM is a sensitive surrogate biomarker for
DPN. In line with current literature, the data in this thesis have highlighted the
significant underestimations made by current automated software when
assessing corneal nerves but recognise that before CCM may be implemented
in primary care, developments in automated software are imperative. Further
research should therefore focus on developing this software and validating its
diagnostic validity for detecting early DPN in larger, age-matched cohorts in
primary care.

146
7. REFERENCES
ABBOTT, C. A., CARRINGTON, A. L., ASHE, H., BATH, S., EVERY, L. C., GRIFFITHS, J., HANN, A. W., HUSSEIN, A., JACKSON, N., JOHNSON, K. E., RYDER, C. H., TORKINGTON, R., VAN ROSS, E. R., WHALLEY, A. M., WIDDOWS, P., WILLIAMSON, S. & BOULTON, A. J. 2002. The North-West Diabetes Foot Care Study: incidence of, and risk factors for, new diabetic foot ulceration in a community-based patient cohort. Diabet Med, 19, 377-84.
ABBOTT, C. A., GARROW, A. P., CARRINGTON, A. L., MORRIS, J., VAN ROSS, E. R. & BOULTON, A. J. 2005. Foot Ulcer Risk Is Lower in South-Asian and African-Caribbean Compared With European Diabetic Patients in the U.K. Diabetes Care, 28, 1869-1875.
AHMED, A., BRIL, V., ORSZAG, A., PAULSON, J., YEUNG, E., NGO, M., ORLOV, S. & PERKINS, B. A. 2012. Detection of diabetic sensorimotor polyneuropathy by corneal confocal microscopy in type 1 diabetes: a concurrent validity study. Diabetes care, 35, 821-828.
ALAM, U., JEZIORSKA, M., PETROPOULOS, I. N., ASGHAR, O., FADAVI, H., PONIRAKIS, G., MARSHALL, A., TAVAKOLI, M., BOULTON, A. J. M., EFRON, N. & MALIK, R. A. 2017. Diagnostic utility of corneal confocal microscopy and intra-epidermal nerve fibre density in diabetic neuropathy. PLoS One, 12, e0180175.
ALBERS, J. W., HERMAN, W. H., POP-BUSUI, R., FELDMAN, E. L., MARTIN, C. L., CLEARY, P. A., WABERSKI, B. H., LACHIN, J. M., DIABETES, C., COMPLICATIONS TRIAL /EPIDEMIOLOGY OF DIABETES, I. & COMPLICATIONS RESEARCH, G. 2010. Effect of prior intensive insulin treatment during the Diabetes Control and Complications Trial (DCCT) on peripheral neuropathy in type 1 diabetes during the Epidemiology of Diabetes Interventions and Complications (EDIC) Study. Diabetes care, 33, 1090-1096.
ALI, S. M., FAREED, A., HUMAIL, S. M., BASIT, A., AHMEDANI, M. Y., FAWWAD, A. & MIYAN, Z. 2008. The personal cost of diabetic foot disease in the developing world—a study from Pakistan. Diabetic Medicine, 25, 1231-1233.
ALLGEIER, S., ZHIVOV, A., EBERLE, F., KOEHLER, B., MAIER, S., BRETTHAUER, G., GUTHOFF, R. F. & STACHS, O. 2011. Image Reconstruction of the Subbasal Nerve Plexus with In Vivo Confocal Microscopy. Investigative Ophthalmology & Visual Science, 52, 5022-5028.
ALZAHRANI, Y., COLORADO, L. H., PRITCHARD, N. & EFRON, N. 2017. Longitudinal changes in Langerhans cell density of the cornea and conjunctiva in contact lens-induced dry eye. Clin Exp Optom, 100, 33-40.
ANDERSEN, S. T., GROSEN, K., TANKISI, H., CHARLES, M., ANDERSEN, N. T., ANDERSEN, H., PETROPOULOS, I. N., MALIK, R. A., JENSEN, T. S. & KARLSSON, P. 2018a. Corneal confocal microscopy as a tool for detecting diabetic polyneuropathy in a cohort with screen-detected type 2 diabetes: ADDITION-Denmark. J Diabetes Complications, 32, 1153-1159.
ANDERSEN, S. T., WITTE, D. R., DALSGAARD, E. M., ANDERSEN, H., NAWROTH, P., FLEMING, T., JENSEN, T. M., FINNERUP, N. B., JENSEN, T. S., LAURITZEN, T., FELDMAN, E. L., CALLAGHAN, B. C. & CHARLES, M. 2018b. Risk Factors for Incident Diabetic Polyneuropathy in a Cohort With Screen-Detected Type 2 Diabetes Followed for 13 Years: ADDITION-Denmark. Diabetes Care, 41, 1068-1075.
ASAD, A., HAMEED, M. A., KHAN, U. A., AHMED, N. & BUTT, M. U. 2010. Reliability of the neurological scores for assessment of sensorimotor neuropathy in type 2 diabetics. J Pak Med Assoc, 60, 166-70.
ASGHAR, O., PETROPOULOS, I. N., ALAM, U., JONES, W., JEZIORSKA, M., MARSHALL, A., PONIRAKIS, G., FADAVI, H., BOULTON, A. J., TAVAKOLI, M. & MALIK, R. A. 2014. Corneal confocal microscopy detects neuropathy in subjects with impaired glucose tolerance. Diabetes Care, 37, 2643-6.
ATTAL, N., BOUHASSIRA, D., GAUTRON, M., VAILLANT, J. N., MITRY, E., LEPÈRE, C., ROUGIER, P. & GUIRIMAND, F. 2009. Thermal hyperalgesia as a marker of oxaliplatin neurotoxicity: A prospective quantified sensory assessment study. Pain, 144, 245-252.
ATTAL, N., FERMANIAN, C., FERMANIAN, J., LANTERI-MINET, M., ALCHAAR, H. & BOUHASSIRA, D. 2008. Neuropathic pain: are there distinct subtypes depending on the aetiology or anatomical lesion? Pain, 138, 343-53.
AZMI, S., FERDOUSI, M., PETROPOULOS, I. N., PONIRAKIS, G., ALAM, U., FADAVI, H., ASGHAR, O., MARSHALL, A., ATKINSON, A. J., JONES, W., BOULTON, A. J. M., TAVAKOLI, M., JEZIORSKA, M. & MALIK, R. A. 2015. Corneal Confocal Microscopy

147
Identifies Small-Fiber Neuropathy in Subjects With Impaired Glucose Tolerance Who Develop Type 2 Diabetes. Diabetes care, 38, 1502-1508.
BACKONJA, M. M., ATTAL, N., BARON, R., BOUHASSIRA, D., DRANGHOLT, M., DYCK, P. J., EDWARDS, R. R., FREEMAN, R., GRACELY, R., HAANPAA, M. H., HANSSON, P., HATEM, S. M., KRUMOVA, E. K., JENSEN, T. S., MAIER, C., MICK, G., RICE, A. S., ROLKE, R., TREEDE, R.-D., SERRA, J., TOELLE, T., TUGNOLI, V., WALK, D., WALALCE, M. S., WARE, M., YARNITSKY, D. & ZIEGLER, D. 2013. Value of quantitative sensory testing in neurological and pain disorders: NeuPSIG consensus. Pain, 154, 1807-1819.
BASANTSOVA, N. Y., STARSHINOVA, A. A., DORI, A., ZINCHENKO, Y. S., YABLONSKIY, P. K. & SHOENFELD, Y. 2019. Small-fiber neuropathy definition, diagnosis, and treatment. Neurol Sci, 40, 1343-1350.
BITIRGEN, G., OZKAGNICI, A., MALIK, R. A. & KERIMOGLU, H. 2014. Corneal nerve fibre damage precedes diabetic retinopathy in patients with type 2 diabetes mellitus. Diabet Med, 31, 431-8.
BORDIER, L., DOLZ, M., MONTEIRO, L., NÉVORET, M.-L., CALVET, J.-H. & BAUDUCEAU, B. 2016. Accuracy of a Rapid and Non-Invasive Method for the Assessment of Small Fiber Neuropathy Based on Measurement of Electrochemical Skin Conductances. Frontiers in endocrinology, 7, 7-18.
BRIL, V. 1994. Role of Electrophysiological Studies in Diabetic Neuropathy. Canadian Journal of Neurological Sciences / Journal Canadien des Sciences Neurologiques, 21, S8-S12.
BRIL, V. & PERKINS, B. A. 2002. Validation of the Toronto Clinical Scoring System for diabetic polyneuropathy. Diabetes Care, 25, 2048-52.
BRINES, M., CULVER, D. A., FERDOUSI, M., TANNEMAAT, M. R., VAN VELZEN, M., DAHAN, A. & MALIK, R. A. 2018. Corneal nerve fiber size adds utility to the diagnosis and assessment of therapeutic response in patients with small fiber neuropathy. Scientific reports, 8, 4734.
BRINES, M., DUNNE, A. N., VAN VELZEN, M., PROTO, P. L., OSTENSON, C.-G., KIRK, R. I., PETROPOULOS, I. N., JAVED, S., MALIK, R. A., CERAMI, A. & DAHAN, A. 2015. ARA 290, a nonerythropoietic peptide engineered from erythropoietin, improves metabolic control and neuropathic symptoms in patients with type 2 diabetes. Molecular medicine (Cambridge, Mass.), 20, 658-666.
BUCHMANN, S. J., PENZLIN, A. I., KUBASCH, M. L., ILLIGENS, B. M. & SIEPMANN, T. 2019. Assessment of sudomotor function. Clin Auton Res, 29, 41-53.
CALLAGHAN, B. C., BURKE, J. F., RODGERS, A., MCCAMMON, R., LANGA, K. M., FELDMAN, E. L. & KERBER, K. A. 2013. Expenditures in the elderly with peripheral neuropathy: Where should we focus cost-control efforts? Neurol Clin Pract, 3, 421-430.
CASELLINI, C. M., PARSON, H. K., RICHARDSON, M. S., NEVORET, M. L. & VINIK, A. I. 2013. Sudoscan, a noninvasive tool for detecting diabetic small fiber neuropathy and autonomic dysfunction. Diabetes technology & therapeutics, 15, 948-953.
CAZZATO, D. & LAURIA, G. 2017. Small fibre neuropathy. Current Opinion in Neurology, 30, 490-499.
CHEN, X., GRAHAM, J., DABBAH, M. A., PETROPOULOS, I. N., PONIRAKIS, G., ASGHAR, O., ALAM, U., MARSHALL, A., FADAVI, H., FERDOUSI, M., AZMI, S., TAVAKOLI, M., EFRON, N., JEZIORSKA, M. & MALIK, R. A. 2015. Small nerve fiber quantification in the diagnosis of diabetic sensorimotor polyneuropathy: comparing corneal confocal microscopy with intraepidermal nerve fiber density. Diabetes Care, 38, 1138-44.
CHEN, X., GRAHAM, J., DABBAH, M. A., PETROPOULOS, I. N., TAVAKOLI, M. & MALIK, R. A. 2017. An Automatic Tool for Quantification of Nerve Fibers in Corneal Confocal Microscopy Images. IEEE Trans Biomed Eng, 64, 786-794.
CHIEN, H. F., TSENG, T. J., LIN, W. M., YANG, C. C., CHANG, Y. C., CHEN, R. C. & HSIEH, S. T. 2001. Quantitative pathology of cutaneous nerve terminal degeneration in the human skin. Acta Neuropathol, 102, 455-61.
CILLÀ, S. D., RANNO, S., CARINI, E., FOGAGNOLO, P., CERESARA, G., ORZALESI, N. & ROSSETTI, L. M. 2009. Corneal Subbasal Nerves Changes in Patients with Diabetic Retinopathy: An In Vivo Confocal Study. Investigative Ophthalmology & Visual Science, 50, 5155-5158.
COSTET, C. & TOUBOUL, D. 2016. [Viscodissection of dua's layer after partial big bubble]. J Fr Ophtalmol, 39, 404.
CRUZAT, A., QAZI, Y. & HAMRAH, P. 2017. In Vivo Confocal Microscopy of Corneal Nerves in Health and Disease. The ocular surface, 15, 15-47.
DANA, M. R. 2004. Corneal Antigen-Presenting Cells: Diversity, Plasticity, and Disguise The Cogan Lecture. Investigative Ophthalmology & Visual Science, 45, 722-727.

148
DCCT 1995. The effect of intensive diabetes therapy on the development and progression of neuropathy. The Diabetes Control and Complications Trial Research Group. Ann Intern Med, 122, 561-8.
DEHGHANI, C., PRITCHARD, N., EDWARDS, K., RUSSELL, A. W., MALIK, R. A. & EFRON, N. 2014. Fully automated, semiautomated, and manual morphometric analysis of corneal subbasal nerve plexus in individuals with and without diabetes. Cornea, 33, 696-702.
DEHGHANI, C., PRITCHARD, N., EDWARDS, K., RUSSELL, A. W., MALIK, R. A. & EFRON, N. 2016. Risk Factors Associated With Corneal Nerve Alteration in Type 1 Diabetes in the Absence of Neuropathy: A Longitudinal In Vivo Corneal Confocal Microscopy Study. Cornea, 35, 847-52.
DEL CASTILLO, J. M. B. T., WASFY, M. A. S., FERNANDEZ, C. & GARCIA-SANCHEZ, J. 2004. An In Vivo Confocal Masked Study on Corneal Epithelium and Subbasal Nerves in Patients with Dry Eye. Investigative Ophthalmology & Visual Science, 45, 3030-3035.
DUA, H. S., FARAJ, L. A., SAID, D. G., GRAY, T. & LOWE, J. 2013. Human corneal anatomy redefined: a novel pre-Descemet's layer (Dua's layer). Ophthalmology, 120, 1778-85.
DUCKWORTH, W., ABRAIRA, C., MORITZ, T., REDA, D., EMANUELE, N., REAVEN, P. D., ZIEVE, F. J., MARKS, J., DAVIS, S. N., HAYWARD, R., WARREN, S. R., GOLDMAN, S., MCCARREN, M., VITEK, M. E., HENDERSON, W. G. & HUANG, G. D. 2009. Glucose control and vascular complications in veterans with type 2 diabetes. N Engl J Med, 360, 129-39.
DUNNIGAN, S. K., EBADI, H., BREINER, A., KATZBERG, H. D., LOVBLOM, L. E., PERKINS, B. A. & BRIL, V. 2013. Conduction Slowing in Diabetic Sensorimotor Polyneuropathy. Diabetes Care, 36, 3684-3690.
DYCK, P. J., BUSHEK, W., SPRING, E. M., KARNES, J. L., LITCHY, W. J., O'BRIEN, P. C. & SERVICE, F. J. 1987. Vibratory and cooling detection thresholds compared with other tests in diagnosing and staging diabetic neuropathy. Diabetes Care, 10, 432-40.
DYCK, P. J., DYCK, P. J., KENNEDY, W. R., KESSERWANI, H., MELANSON, M., OCHOA, J., SHY, M., STEVENS, J. C., SUAREZ, G. A. & O'BRIEN, P. C. 1998. Limitations of quantitative sensory testing when patients are biased toward a bad outcome. Neurology, 50, 894-5.
DYCK, P. J., NORELL, J. E., TRITSCHLER, H., SCHUETTE, K., SAMIGULLIN, R., ZIEGLER, D., BASTYR, E. J., 3RD, LITCHY, W. J. & O'BRIEN, P. C. 2007. Challenges in design of multicenter trials: end points assessed longitudinally for change and monotonicity. Diabetes Care, 30, 2619-25.
DYCK, P. J., OVERLAND, C. J., LOW, P. A., LITCHY, W. J., DAVIES, J. L., DYCK, P. J. B., O'BRIEN, P. C. & INVESTIGATORS, F. T. C. V. N. T. 2010. Signs and symptoms versus nerve conduction studies to diagnose diabetic sensorimotor polyneuropathy: Cl vs. NPhys trial. Muscle & Nerve, 42, 157-164.
DYCK, P. J., SHERMAN, W. R., HALLCHER, L. M., JOHN SERVICE, F., O'BRIEN, P. C., GRINA, L. A., PALUMBO, P. J. & SWANSON, C. J. 1980. Human diabetic endoneurial sorbitol, fructose, and myo-inositol related to sural nerve morphometry. Annals of Neurology, 8, 590-596.
ECKARD, A., STAVE, J. & GUTHOFF, R. F. 2006. In vivo investigations of the corneal epithelium with the confocal Rostock Laser Scanning Microscope (RLSM). Cornea, 25, 127-31.
EDWARDS, K., PRITCHARD, N., DEHGHANI, C., VAGENAS, D., RUSSELL, A., MALIK, R. A. & EFRON, N. 2017. Corneal confocal microscopy best identifies the development and progression of neuropathy in patients with type 1 diabetes. J Diabetes Complications, 31, 1325-1327.
EDWARDS, K., PRITCHARD, N., GOSSCHALK, K., SAMPSON, G. P., RUSSELL, A., MALIK, R. A. & EFRON, N. 2012a. Wide-field assessment of the human corneal subbasal nerve plexus in diabetic neuropathy using a novel mapping technique. Cornea, 31, 1078-82.
EDWARDS, K., PRITCHARD, N., VAGENAS, D., RUSSELL, A., MALIK, R. A. & EFRON, N. 2012b. Utility of corneal confocal microscopy for assessing mild diabetic neuropathy: baseline findings of the LANDMark study. Clinical and Experimental Optometry, 95, 348-354.
EFRON, N., PEREZ-GOMEZ, I., MUTALIB, H. A. & HOLLINGSWORTH, J. 2001. Confocal microscopy of the normal human cornea. Contact Lens and Anterior Eye, 24, 16-24.
EH SCHWARZ, P., BRUNSWICK, P. & CALVET, J.-H. 2011. EZSCAN™ a new technology to detect diabetes risk. The British Journal of Diabetes & Vascular Disease, 11, 204-209.

149
FADAVI, H., TAVAKOLI, M., FODEN, P., FERDOUSI, M., PETROPOULOS, I. N., JEZIORSKA, M., CHATURVEDI, N., BOULTON, A. J. M., MALIK, R. A. & ABBOTT, C. A. 2018. Explanations for less small fibre neuropathy in South Asian versus European subjects with type 2 diabetes in the UK. Diabetes/metabolism research and reviews, 34, e3044. 1-9.
FEIZI, S. 2018. Corneal endothelial cell dysfunction: etiologies and management. Ther Adv Ophthalmol, 10, 2515841418815802.
FELDMAN, E. L., CALLAGHAN, B. C., POP-BUSUI, R., ZOCHODNE, D. W., WRIGHT, D. E., BENNETT, D. L., BRIL, V., RUSSELL, J. W. & VISWANATHAN, V. 2019. Diabetic neuropathy. Nat Rev Dis Primers, 5, 41.
FELDMAN, E. L., NAVE, K. A., JENSEN, T. S. & BENNETT, D. L. H. 2017. New Horizons in Diabetic Neuropathy: Mechanisms, Bioenergetics, and Pain. Neuron, 93, 1296-1313.
FELDMAN, E. L., STEVENS, M. J., THOMAS, P. K., BROWN, M. B., CANAL, N. & GREENE, D. A. 1994. A practical two-step quantitative clinical and electrophysiological assessment for the diagnosis and staging of diabetic neuropathy. Diabetes Care, 17, 1281-89.
FERDOUSI, M., ROMANCHUK, K., MAH, J. K., VIRTANEN, H., MILLAR, C., MALIK, R. A. & PACAUD, D. 2019. Early corneal nerve fibre damage and increased Langerhans cell density in children with type 1 diabetes mellitus. Scientific reports, 9, 8758.
FU, J., CHOU, Y., HAO, R., JIANG, X., LIU, Y. & LI, X. 2019. Evaluation of ocular surface impairment in meibomian gland dysfunction of varying severity using a comprehensive grading scale. Medicine (Baltimore), 98, e16547.
GAEDE, P., LUND-ANDERSEN, H., PARVING, H. H. & PEDERSEN, O. 2008. Effect of a multifactorial intervention on mortality in type 2 diabetes. N Engl J Med, 358, 580-91.
GAMALELDIN, S. A., SALAMA, M. M. & ELSHAZLY, M. I. 2016. Seven-day storage of pneumatically dissected Descemet's endothelial grafts with and without Dua's layer. Acta Ophthalmol, 94, e130-4.
GAMBATO, C., LONGHIN, E., CATANIA, A. G., LAZZARINI, D., PARROZZANI, R. & MIDENA, E. 2015. Aging and corneal layers: an in vivo corneal confocal microscopy study. Graefes Arch Clin Exp Ophthalmol, 253, 267-75.
GIBBONS, C. H. 2019. Basics of autonomic nervous system function. Handb Clin Neurol, 160, 407-418.
GIN, H., BAUDOIN, R., RAFFAITIN, C. H., RIGALLEAU, V. & GONZALEZ, C. 2011. Non-invasive and quantitative assessment of sudomotor function for peripheral diabetic neuropathy evaluation. Diabetes & Metabolism, 37, 527-532.
GIVAN, A. L. 2001. Chapter 2 Principles of flow cytometry: An overview. Methods in Cell Biology. Academic Press.
GUTHOFF, R. F., ZHIVOV, A. & STACHS, O. 2009. In vivo confocal microscopy, an inner vision of the cornea - a major review. Clin Exp Ophthalmol, 37, 100-17.
HALPERN, E. M., LOVBLOM, L. E., ORLOV, S., AHMED, A., BRIL, V. & PERKINS, B. A. 2013a. The impact of common variation in the definition of diabetic sensorimotor polyneuropathy on the validity of corneal in vivo confocal microscopy in patients with type 1 diabetes: a brief report. Journal of Diabetes and its Complications, 27, 240-242.
HALPERN, E. M., LOVBLOM, L. E., ORLOV, S., BRIL, V. & PERKINS, B. A. The existence of rapid small fiber decline in type 1 diabetes: a potential proxy for neuropathy progression using in vivo corneal confocal microscopy. Diabetes, 2013b In 22nd Annual Meeting of the Diabetic Neuropathy Study Group. Dresden, Germany.
HAMRAH, P., ZHANG, Q., LIU, Y. & DANA, M. R. 2002. Novel characterization of MHC class II-negative population of resident corneal Langerhans cell-type dendritic cells. Invest Ophthalmol Vis Sci, 43, 639-46.
HARDING, S., GREENWOOD, R., ALDINGTON, S., GIBSON, J., OWENS, D., TAYLOR, R., KOHNER, E., SCANLON, P., LEESE, G., THE DIABETIC RETINOPATHY, G. & DISEASE MANAGEMENT WORKING, P. 2003. Grading and disease management in national screening for diabetic retinopathy in England and Wales. Diabetic Medicine, 20, 965-971.
HE, J., BAZAN, N. G. & BAZAN, H. E. P. 2010. Mapping the entire human corneal nerve architecture. Experimental eye research, 91, 513-523.
HENG, L. Z., COMYN, O., PETO, T., TADROS, C., NG, E., SIVAPRASAD, S. & HYKIN, P. G. 2013. Diabetic retinopathy: pathogenesis, clinical grading, management and future developments. Diabet Med, 30, 640-50.
HERTZ, P., BRIL, V., ORSZAG, A., AHMED, A., NG, E., NWE, P., NGO, M. & PERKINS, B. A. 2011. Reproducibility of in vivo corneal confocal microscopy as a novel screening test for early diabetic sensorimotor polyneuropathy. Diabet Med, 28, 1253-60.

150
HICKS, C. W. & SELVIN, E. 2019. Epidemiology of Peripheral Neuropathy and Lower Extremity Disease in Diabetes. Current diabetes reports, 19, 86-98.
HOLMAN, N., YOUNG, R. J. & JEFFCOATE, W. J. 2012. Variation in the recorded incidence of amputation of the lower limb in England. Diabetologia, 55, 1919-1925.
ILLIGENS, B. M. W. & GIBBONS, C. H. 2008. Sweat testing to evaluate autonomic function. Clinical Autonomic Research, 19, 79-87.
ISHIBASHI, F., KOJIMA, R., TANIGUCHI, M., KOSAKA, A., UETAKE, H. & TAVAKOLI, M. 2016. The Expanded Bead Size of Corneal C-Nerve Fibers Visualized by Corneal Confocal Microscopy Is Associated with Slow Conduction Velocity of the Peripheral Nerves in Patients with Type 2 Diabetes Mellitus. J Diabetes Res, 7, e3653459.
ISMAIL-BEIGI, F., CRAVEN, T., BANERJI, M. A., BASILE, J., CALLES, J., COHEN, R. M., CUDDIHY, R., CUSHMAN, W. C., GENUTH, S., GRIMM, R. H., JR., HAMILTON, B. P., HOOGWERF, B., KARL, D., KATZ, L., KRIKORIAN, A., O'CONNOR, P., POP-BUSUI, R., SCHUBART, U., SIMMONS, D., TAYLOR, H., THOMAS, A., WEISS, D. & HRAMIAK, I. 2010. Effect of intensive treatment of hyperglycaemia on microvascular outcomes in type 2 diabetes: an analysis of the ACCORD randomised trial. The Lancet, 376, 419-430.
JENDE, J. M. E., GROENER, J. B., OIKONOMOU, D., HEILAND, S., KOPF, S., PHAM, M., NAWROTH, P., BENDSZUS, M. & KURZ, F. T. 2018. Diabetic neuropathy differs between type 1 and type 2 diabetes: Insights from magnetic resonance neurography. Ann Neurol, 83, 588-598.
JESSUP, A. N. 2012. Chapter 8 - Diabetes Mellitus: A Nursing Perspective. In: BAGCHI, D. & SREEJAYAN, N. (eds.) Nutritional and Therapeutic Interventions for Diabetes and Metabolic Syndrome. San Diego: Academic Press.
JOHNSON, J. O. 2013. Chapter 12 - Autonomic Nervous System Physiology. In: HEMMINGS, H. C. & EGAN, T. D. (eds.) Pharmacology and Physiology for Anesthesia. Philadelphia: W.B. Saunders.
KALLINIKOS, P., BERHANU, M., O’DONNELL, C., BOULTON, A. J. M., EFRON, N. & MALIK, R. A. 2004. Corneal Nerve Tortuosity in Diabetic Patients with Neuropathy. Investigative Ophthalmology & Visual Science, 45, 418-422.
KALOGEROPOULOS, D., PAPOUDOU-BAI, A., LANE, M., GOUSSIA, A., CHARCHANTI, A., MOSCHOS, M., KANAVAROS, P. & KALOGEROPOULOS, C. 2020. Antigen-presenting cells in ocular surface diseases. International Ophthalmology, 40, 1603-18.
KALTENIECE, A., FERDOUSI, M., AZMI, S., MUBITA, W. M., MARSHALL, A., LAURIA, G., FABER, C. G., SORAN, H. & MALIK, R. A. 2020. Corneal confocal microscopy detects small nerve fibre damage in patients with painful diabetic neuropathy. Sci Rep, 10, 3371.
KALTENIECE, A., FERDOUSI, M., PETROPOULOS, I., AZMI, S., ADAM, S., FADAVI, H., MARSHALL, A., BOULTON, A. J. M., EFRON, N., FABER, C. G., LAURIA, G., SORAN, H. & MALIK, R. A. 2018. Greater corneal nerve loss at the inferior whorl is related to the presence of diabetic neuropathy and painful diabetic neuropathy. Scientific Reports, 8, 3283.
KAZAMEL, M. & WARREN, P. P. 2017. History of electromyography and nerve conduction studies: A tribute to the founding fathers. J Clin Neurosci, 43, 54-60.
KENNEDY, W. R., WENDELSCHAFER-CRABB, G., POLYDEFKIS, M. & MCARTHUR, J. C. 2005. Chapter 34 - Pathology and Quantitation of Cutaneous Innervation. In: DYCK, P. J. & THOMAS, P. K. (eds.) Peripheral Neuropathy (Fourth Edition). Philadelphia: W.B. Saunders.
KHAN, F. F., NUMAN, A., KHAWAJA, K. I., ATIF, A., FATIMA, A. & MASUD, F. 2015. PERFORMANCE OF TWO DIFFERENT CLINICAL SCORING SYSTEMS IN DIAGNOSING DISTAL SENSORY POLYNEUROPATHY IN PATIENTS WITH TYPE-2 DIABETES. Journal of Ayub Medical College, Abbottabad : JAMC, 27 1, 187-91.
KHANOLKAR, M. P., BAIN, S. C. & STEPHENS, J. W. 2008. The diabetic foot. QJM: An International Journal of Medicine, 101, 685-695.
KHEIRKHAH, A., MULLER, R., MIKOLAJCZAK, J., REN, A., KADAS, E. M., ZIMMERMANN, H., PRUESS, H., PAUL, F., BRANDT, A. U. & HAMRAH, P. 2015. Comparison of Standard Versus Wide-Field Composite Images of the Corneal Subbasal Layer by In Vivo Confocal Microscopy. Invest Ophthalmol Vis Sci, 56, 5801-7.
KILLIAN, J. M. & FOREMAN, P. J. 2001. Clinical utility of dorsal sural nerve conduction studies. Muscle & Nerve, 24, 817-820.
KIOSKLI, K., SCOTT, W., WINKLEY, K., KYLAKOS, S. & MCCRACKEN, L. M. 2019. Psychosocial Factors in Painful Diabetic Neuropathy: A Systematic Review of Treatment Trials and Survey Studies. Pain Med, 20, 1756-1773.

151
KLUDING, P. M., PASNOOR, M., SINGH, R., JERNIGAN, S., FARMER, K., RUCKER, J., SHARMA, N. K. & WRIGHT, D. E. 2012. The effect of exercise on neuropathic symptoms, nerve function, and cutaneous innervation in people with diabetic peripheral neuropathy. J Diabetes Complications, 26, 424-9.
KOBAYASHI, A., YOKOGAWA, H. & SUGIYAMA, K. 2006. In Vivo Laser Confocal Microscopy of Bowman’s Layer of the Cornea. Ophthalmology, 113, 2203-2208.
KOO, T. K. & LI, M. Y. 2016. A Guideline of Selecting and Reporting Intraclass Correlation Coefficients for Reliability Research. Journal of Chiropractic Medicine, 15, 155-163.
KOWTHARAPU, B. S., WINTER, K., MARFURT, C., ALLGEIER, S., KOHLER, B., HOVAKIMYAN, M., STAHNKE, T., WREE, A., STACHS, O. & GUTHOFF, R. F. 2017. Comparative quantitative assessment of the human corneal sub-basal nerve plexus by in vivo confocal microscopy and histological staining. Eye (Lond), 31, 481-490.
KRÄMER, H. H., ROLKE, R., BICKEL, A. & BIRKLEIN, F. 2004. Thermal thresholds predict painfulness of diabetic neuropathies. Diabetes Care, 27, 2386-91.
KRIEGER, S.-M., REIMANN, M., HAASE, R., HENKEL, E., HANEFELD, M. & ZIEMSSEN, T. 2018. Sudomotor Testing of Diabetes Polyneuropathy. Frontiers in neurology, 9, 803.
LABBÉ, A., ALALWANI, H., VAN WENT, C., BRASNU, E., GEORGESCU, D. & BAUDOUIN, C. 2012. The relationship between subbasal nerve morphology and corneal sensation in ocular surface disease. Invest Ophthalmol Vis Sci, 53, 4926-31.
LAURIA, G., BAKKERS, M., SCHMITZ, C., LOMBARDI, R., PENZA, P., DEVIGILI, G., SMITH, A. G., HSIEH, S.-T., MELLGREN, S. I., UMAPATHI, T., ZIEGLER, D., FABER, C. G. & MERKIES, I. S. J. 2010a. Intraepidermal nerve fiber density at the distal leg: a worldwide normative reference study. Journal of the Peripheral Nervous System, 15, 202-207.
LAURIA, G., CORNBLATH, D. R., JOHANSSON, O., MCARTHUR, J. C., MELLGREN, S. I., NOLANO, M., ROSENBERG, N. & SOMMER, C. 2005. EFNS guidelines on the use of skin biopsy in the diagnosis of peripheral neuropathy. Eur J Neurol, 12, 747-58.
LAURIA, G., HSIEH, S. T., JOHANSSON, O., KENNEDY, W. R., LEGER, J. M., MELLGREN, S. I., NOLANO, M., MERKIES, I. S. J., POLYDEFKIS, M., SMITH, A. G., SOMMER, C. & VALLS-SOLÉ, J. 2010b. European Federation of Neurological Societies/Peripheral Nerve Society Guideline on the use of skin biopsy in the diagnosis of small fiber neuropathy. Report of a joint task force of the European Fe-deration of Neurological Societies and the Peripheral Nerve Society. European Journal of Neurology, 17, 903-e49.
LAURIA, G. & LOMBARDI, R. 2007. Skin biopsy: a new tool for diagnosing peripheral neuropathy. BMJ (Clinical research ed.), 334, 1159-1162.
LAURIA, G., MORBIN, M., LOMBARDI, R., BORGNA, M., MAZZOLENI, G., SGHIRLANZONI, A. & PAREYSON, D. 2003. Axonal swellings predict the degeneration of epidermal nerve fibers in painful neuropathies. Neurology, 61, 631-636.
LEE, J. A., HALPERN, E. M., LOVBLOM, L. E., YEUNG, E., BRIL, V. & PERKINS, B. A. 2014. Reliability and validity of a point-of-care sural nerve conduction device for identification of diabetic neuropathy. PloS one, 9, e86515.
LEGGETTER, S., CHATURVEDI, N., FULLER, J. H. & EDMONDS, M. E. 2002. Ethnicity and risk of diabetes-related lower extremity amputation: a population-based, case-control study of African Caribbeans and Europeans in the United kingdom. Arch Intern Med, 162, 73-8.
LEMP, M. A., DILLY, P. N. & BOYDE, A. 1985. Tandem-scanning (confocal) microscopy of the full-thickness cornea. Cornea, 4, 205-9.
LEWIS, E. J. H., PERKINS, B. A., LOVBLOM, L. E., BAZINET, R. P., WOLEVER, T. M. S. & BRIL, V. 2017. Effect of omega-3 supplementation on neuropathy in type 1 diabetes: A 12-month pilot trial. Neurology, 88, 2294-2301.
LIEW, G., MICHAELIDES, M. & BUNCE, C. 2014. A comparison of the causes of blindness certifications in England and Wales in working age adults (16-64 years), 1999-2000 with 2009-2010. BMJ Open, 4.
LIN, Y.-H., HSIEH, S.-C., CHAO, C.-C., CHANG, Y.-C. & HSIEH, S.-T. 2005a. Influence of aging on thermal and vibratory thresholds of quantitative sensory testing. Journal of the Peripheral Nervous System, 10, 269-281.
LIN, Y. H., HSIEH, S. C., CHAO, C. C., CHANG, Y. C. & HSIEH, S. T. 2005b. Influence of aging on thermal and vibratory thresholds of quantitative sensory testing. J Peripher Nerv Syst, 10, 269-81.
LITCHY, W. J., ALBERS, J. W., WOLFE, J., BOLTON, C. F., WALSH, N., KLEIN, C. J., ZAFFT, A. J., RUSSELL, J. W., ZWIRLEIN, M., OVERLAND, C. J., DAVIES, J. L., CARTER, R.

152
E. & DYCK, P. J. 2014. Proficiency of nerve conduction using standard methods and reference values (Cl. NPhys Trial 4). Muscle Nerve, 50, 900-8.
LONDON, A., BENHAR, I. & SCHWARTZ, M. 2013. The retina as a window to the brain-from eye research to CNS disorders. Nat Rev Neurol, 9, 44-53.
LOSETH, S., STALBERG, E., JORDE, R. & MELLGREN, S. I. 2008. Early diabetic neuropathy: thermal thresholds and intraepidermal nerve fibre density in patients with normal nerve conduction studies. J Neurol, 255, 1197-202.
LØSETH, S., STÅLBERG, E., JORDE, R. & MELLGREN, S. I. 2008. Early diabetic neuropathy: thermal thresholds and intraepidermal nerve fibre density in patients with normal nerve conduction studies. Journal of Neurology, 255, 1197-1202.
LØSETH, S., STÅLBERG, E. V., LINDAL, S., OLSEN, E., JORDE, R. & MELLGREN, S. I. 2016. Small and large fiber neuropathy in those with type 1 and type 2 diabetes: a 5-year follow-up study. Journal of the Peripheral Nervous System, 21, 15-21.
LOVBLOM, L. E., HALPERN, E. M., WU, T., KELLY, D., AHMED, A., BOULET, G., ORSZAG, A., NG, E., NGO, M., BRIL, V. & PERKINS, B. A. 2015. In Vivo Corneal Confocal Microscopy and Prediction of Future-Incident Neuropathy in Type 1 Diabetes: A Preliminary & Longitudinal Analysis. Canadian Journal of Diabetes, 39, 390-397.
LYSY, Z., LOVBLOM, L. E., HALPERN, E. M., NGO, M., NG, E., ORSZAG, A., BREINER, A., BRIL, V. & PERKINS, B. A. 2014. Measurement of cooling detection thresholds for identification of diabetic sensorimotor polyneuropathy in type 1 diabetes. PLoS One, 9, e106995.
LYU, Y., ZENG, X., LI, F. & ZHAO, S. 2019. The effect of the duration of diabetes on dry eye and corneal nerves. Contact Lens and Anterior Eye, 42, 380-385.
MACHETTA, F., FEA, A. M., ACTIS, A. G., DE SANCTIS, U., DALMASSO, P. & GRIGNOLO, F. M. 2014. In vivo confocal microscopic evaluation of corneal langerhans cells in dry eye patients. The open ophthalmology journal, 8, 51-59.
MADDALONI, E., SABATINO, F., DEL TORO, R., CRUGLIANO, S., GRANDE, S., LAURIA PANTANO, A., MAURIZI, A. R., PALERMO, A., BONINI, S., POZZILLI, P. & MANFRINI, S. 2015. In vivo corneal confocal microscopy as a novel non-invasive tool to investigate cardiac autonomic neuropathy in Type 1 diabetes. Diabet Med, 32, 262-6.
MAGERL, W., KRUMOVA, E. K., BARON, R., TÖLLE, T., TREEDE, R.-D. & MAIER, C. 2010. Reference data for quantitative sensory testing (QST): Refined stratification for age and a novel method for statistical comparison of group data. Pain, 151, 598-605.
MALIK, R. A., KALLINIKOS, P., ABBOTT, C. A., VAN SCHIE, C. H. M., MORGAN, P., EFRON, N. & BOULTON, A. J. M. 2003. Corneal confocal microscopy: a non-invasive surrogate of nerve fibre damage and repair in diabetic patients. Diabetologia, 46, 683-688.
MALMSTRÖM, E. M., STJERNA, J., HÖGESTÄTT, E. D. & WESTERGREN, H. 2016. Quantitative sensory testing of temperature thresholds: Possible biomarkers for persistent pain? J Rehabil Med, 48, 43-7.
MANZANO, G. M., GIULIANO, L. M. P. & NÓBREGA, J. A. M. 2008. A brief historical note on the classification of nerve fibers. Arquivos de Neuro-Psiquiatria, 66, 117-119.
MARFURT, C., ANOKWUTE, M. C., FETCKO, K., MAHONY-PEREZ, E., FAROOQ, H., ROSS, E., BAUMANIS, M. M., WEINBERG, R. L., MCCARRON, M. E. & MANKOWSKI, J. L. 2019. Comparative Anatomy of the Mammalian Corneal Subbasal Nerve Plexus. Invest Ophthalmol Vis Sci, 60, 4972-4984.
MARTIN, C. L., ALBERS, J. W. & POP-BUSUI, R. 2014. Neuropathy and Related Findings in the Diabetes Control and Complications Trial/Epidemiology of Diabetes Interventions and Complications Study. Diabetes Care, 37, 31-38.
MATHER, H. M., CHATURVEDI, N. & FULLER, J. H. 1998. Mortality and morbidity from diabetes in South Asians and Europeans: 11-year follow-up of the Southall Diabetes Survey, London, UK. Diabet Med, 15, 53-9.
MAYAUDON, H., MILOCHE, P. O. & BAUDUCEAU, B. 2010. A new simple method for assessing sudomotor function: Relevance in type 2 diabetes. Diabetes & Metabolism, 36, 450-454.
MCKEE, H. D., IRION, L. C., CARLEY, F. M., BRAHMA, A. K., JAFARINASAB, M. R., RAHMATI-KAMEL, M., KANAVI, M. R. & FEIZI, S. 2014. Re: Dua et al.: Human corneal anatomy redefined: a novel pre-Descemet layer (Dua's layer) (Ophthalmology 2013;120:1778-85). Ophthalmology, 121, e24-5.
MEDICAL, I. 2020. Sudoscan [Online]. Available: https://www.sudoscan.com/for-patients/ [Accessed 16/09 2020].
MEHRA, S., TAVAKOLI, M., KALLINIKOS, P. A., EFRON, N., BOULTON, A. J., AUGUSTINE, T. & MALIK, R. A. 2007. Corneal confocal microscopy detects early nerve regeneration

153
after pancreas transplantation in patients with type 1 diabetes. Diabetes Care, 30, 2608-12.
MEIER, P. M., BERDE, C. B., DICANZIO, J., ZURAKOWSKI, D. & SETHNA, N. F. 2001. Quantitative assessment of cutaneous thermal and vibration sensation and thermal pain detection thresholds in healthy children and adolescents. Muscle Nerve, 24, 1339-45.
MEIJER, J. W., SMIT, A. J., SONDEREN, E. V., GROOTHOFF, J. W., EISMA, W. H. & LINKS, T. P. 2002. Symptom scoring systems to diagnose distal polyneuropathy in diabetes: the Diabetic Neuropathy Symptom score. Diabet Med, 19, 962-5.
MELZACK, R. 1987. The short-form McGill Pain Questionnaire. Pain, 30, 191-7. MELZACK, R. & KATZ, J. 2001. The McGill Pain Questionnaire: Appraisal and current status.
Handbook of pain assessment, 2nd ed. New York, NY, US: The Guilford Press. MESKELL, M. 2010. Principles of Anatomy and Physiology. Journal of Anatomy, 217, 631-631. MESSMER, E. M., SCHMID-TANNWALD, C., ZAPP, D. & KAMPIK, A. 2010. In vivo confocal
microscopy of corneal small fiber damage in diabetes mellitus. Graefes Arch Clin Exp Ophthalmol, 248, 1307-12.
MIDENA, E., BRUGIN, E., GHIRLANDO, A., SOMMAVILLA, M. & AVOGARO, A. 2006. Corneal diabetic neuropathy: a confocal microscopy study. J Refract Surg, 22, 1047-52.
MOCAN, M. C., DURUKAN, I., IRKEC, M. & ORHAN, M. 2006. Morphologic Alterations of Both the Stromal and Subbasal Nerves in the Corneas of Patients with Diabetes. Cornea, 25.
MOGHTADERI, A., BAKHSHIPOUR, A. & RASHIDI, H. 2006. Validation of Michigan neuropathy screening instrument for diabetic peripheral neuropathy. Clinical Neurology and Neurosurgery, 108, 477-481.
MÜLLER, L. J., MARFURT, C. F., KRUSE, F. & TERVO, T. M. T. 2003. Corneal nerves: structure, contents and function. Experimental Eye Research, 76, 521-542.
NDIP, A., EBAH, L. & MBAKO, A. 2012. Neuropathic diabetic foot ulcers - evidence-to-practice. International journal of general medicine, 5, 129-134.
NEELAND, I. J. & PATEL, K. V. 2019. Chapter 4 - Diabetes: Key Markers of Injury and Prognosis. In: NAMBI, V. (ed.) Biomarkers in Cardiovascular Disease. Elsevier.
NEUROPAD. 2020. Screening with Neuropad [Online]. TRIGOcare International GmbH. Available: https://www.neuropad.co.uk/neuropad-test-public/ [Accessed 16/09/2020 2020].
NICE 2018. https://www.nice.org.uk/guidance/mtg38/chapter/1-Recommendations. Neuropad for detecting preclinical diabetic peripheral neuropathy. National Institute for Health and Care Excellence.
NITODA, E., KALLINIKOS, P., PALLIKARIS, A., MOSCHANDREA, J., AMOIRIDIS, G., GANOTAKIS, E. S. & TSILIMBARIS, M. 2012. Correlation of diabetic retinopathy and corneal neuropathy using confocal microscopy. Curr Eye Res, 37, 898-906.
NOLANO, M., BIASIOTTA, A., LOMBARDI, R., PROVITERA, V., STANCANELLI, A., CAPORASO, G., SANTORO, L., MERKIES, I. S., TRUINI, A., PORRETTA-SERAPIGLIA, C., CAZZATO, D., DACCI, P., VITALE, D. F. & LAURIA, G. 2015. Epidermal innervation morphometry by immunofluorescence and bright-field microscopy. J Peripher Nerv Syst, 20, 387-91.
NOVAK, P. 2016. Electrochemical Skin Conductance Correlates with Skin Nerve Fiber Density. Frontiers in aging neuroscience, 8, 199-199.
OLIVEIRA-SOTO, L. & EFRON, N. 2001. Morphology of corneal nerves using confocal microscopy. Cornea, 20, 374-84.
OSTROVSKI, I., LOVBLOM, L. E., FAROOQI, M. A., SCARR, D., BOULET, G., HERTZ, P., WU, T., HALPERN, E. M., NGO, M., NG, E., ORSZAG, A., BRIL, V. & PERKINS, B. A. 2015. Reproducibility of In Vivo Corneal Confocal Microscopy Using an Automated Analysis Program for Detection of Diabetic Sensorimotor Polyneuropathy. PloS one, 10, e0142309.
PAPANAS, N., PAPATHEODOROU, K., CHRISTAKIDIS, D., PAPAZOGLOU, D., GIASSAKIS, G., PIPERIDOU, H., MONASTIRIOTIS, C. & MALTEZOS, E. 2005. Evaluation of a new indicator test for sudomotor function (Neuropad) in the diagnosis of peripheral neuropathy in type 2 diabetic patients. Exp Clin Endocrinol Diabetes, 113, 195-8.
PATEL, D. V. & MCGHEE, C. N. 2007. Contemporary in vivo confocal microscopy of the living human cornea using white light and laser scanning techniques: a major review. Clin Exp Ophthalmol, 35, 71-88.
PATEL, D. V. & MCGHEE, C. N. 2009. In vivo confocal microscopy of human corneal nerves in health, in ocular and systemic disease, and following corneal surgery: a review. Br J Ophthalmol, 93, 853-60.

154
PERKINS, B. A., GREWAL, J., NG, E., NGO, M. & BRIL, V. 2006. Validation of a Novel Point-of-Care Nerve Conduction Device for the Detection of Diabetic Sensorimotor Polyneuropathy. Diabetes Care, 29, 2023-27.
PERKINS, B. A., LOVBLOM, L. E., BRIL, V., SCARR, D., OSTROVSKI, I., ORSZAG, A., EDWARDS, K., PRITCHARD, N., RUSSELL, A., DEHGHANI, C., PACAUD, D., ROMANCHUK, K., MAH, J. K., JEZIORSKA, M., MARSHALL, A., SHTEIN, R. M., POP-BUSUI, R., LENTZ, S. I., BOULTON, A. J. M., TAVAKOLI, M., EFRON, N. & MALIK, R. A. 2018. Corneal confocal microscopy for identification of diabetic sensorimotor polyneuropathy: a pooled multinational consortium study. Diabetologia, 61, 1856-1861.
PETROLL, W. M. & ROBERTSON, D. M. 2015. In Vivo Confocal Microscopy of the Cornea: New Developments in Image Acquisition, Reconstruction, and Analysis Using the HRT-Rostock Corneal Module. The ocular surface, 13, 187-203.
PETROPOULOS, I. N., ALAM, U., FADAVI, H., ASGHAR, O., GREEN, P., PONIRAKIS, G., MARSHALL, A., BOULTON, A. J., TAVAKOLI, M. & MALIK, R. A. 2013a. Corneal nerve loss detected with corneal confocal microscopy is symmetrical and related to the severity of diabetic polyneuropathy. Diabetes Care, 36, 3646-51.
PETROPOULOS, I. N., ALAM, U., FADAVI, H., MARSHALL, A., ASGHAR, O., DABBAH, M. A., CHEN, X., GRAHAM, J., PONIRAKIS, G., BOULTON, A. J. M., TAVAKOLI, M. & MALIK, R. A. 2014. Rapid Automated Diagnosis of Diabetic Peripheral Neuropathy With In Vivo Corneal Confocal Microscopy. Investigative Ophthalmology & Visual Science, 55, 2071-2078.
PETROPOULOS, I. N., FERDOUSI, M., MARSHALL, A., ALAM, U., PONIRAKIS, G., AZMI, S., FADAVI, H., EFRON, N., TAVAKOLI, M. & MALIK, R. A. 2015a. The Inferior Whorl For Detecting Diabetic Peripheral Neuropathy Using Corneal Confocal Microscopy. Investigative ophthalmology & visual science, 56, 2498-2504.
PETROPOULOS, I. N., GREEN, P., CHAN, A. W. S., ALAM, U., FADAVI, H., MARSHALL, A., ASGHAR, O., EFRON, N., TAVAKOLI, M. & MALIK, R. A. 2015b. Corneal confocal microscopy detects neuropathy in patients with type 1 diabetes without retinopathy or microalbuminuria. PloS one, 10, e0123517-e0123517.
PETROPOULOS, I. N., MANZOOR, T., MORGAN, P., FADAVI, H., ASGHAR, O., ALAM, U., PONIRAKIS, G., DABBAH, M. A., CHEN, X., GRAHAM, J., TAVAKOLI, M. & MALIK, R. A. 2013b. Repeatability of in vivo corneal confocal microscopy to quantify corneal nerve morphology. Cornea, 32, e83-9.
PETROPOULOS, I. N., PONIRAKIS, G., KHAN, A., ALMUHANNADI, H., GAD, H. & MALIK, R. A. 2018. Diagnosing Diabetic Neuropathy: Something Old, Something New. Diabetes & metabolism journal, 42, 255-269.
PONIRAKIS, G., ODRIOZOLA, M. N., ODRIOZOLA, S., PETROPOULOS, I. N., AZMI, S., FADAVI, H., ALAM, U., ASGHAR, O., MARSHALL, A., MIRO, A., KHEYAMI, A., AL-AHMAR, A., ODRIOZOLA, M. B., ODRIOZOLA, A. & MALIK, R. A. 2016. NerveCheck: An inexpensive quantitative sensory testing device for patients with diabetic neuropathy. Diabetes Research and Clinical Practice, 113, 101-107.
PONIRAKIS, G., PETROPOULOS, I. N., FADAVI, H., ALAM, U., ASGHAR, O., MARSHALL, A., TAVAKOLI, M. & MALIK, R. A. 2014. The diagnostic accuracy of Neuropad for assessing large and small fibre diabetic neuropathy. Diabetic medicine : a journal of the British Diabetic Association, 31, 1673-1680.
POP-BUSUI, R., BOULTON, A. J. M., FELDMAN, E. L., BRIL, V., FREEMAN, R., MALIK, R. A., SOSENKO, J. M. & ZIEGLER, D. 2017. Diabetic Neuropathy: A Position Statement by the American Diabetes Association. Diabetes Care, 40, 136.
PRICE, R. C., ASENJO, J. F., CHRISTOU, N. V., BACKMAN, S. B. & SCHWEINHARDT, P. 2013. The role of excess subcutaneous fat in pain and sensory sensitivity in obesity. European Journal of Pain, 17, 1316-1326.
PRITCHARD, N., EDWARDS, K., DEHGHANI, C., FADAVI, H., JEZIORSKA, M., MARSHALL, A., PETROPOULOS, I. N., PONIRAKIS, G., RUSSELL, A. W., SAMPSON, G. P., SHAHIDI, A. M., SRINIVASAN, S., TAVAKOLI, M., VAGENAS, D., MALIK, R. A. & EFRON, N. 2014. Longitudinal assessment of neuropathy in type 1 diabetes using novel ophthalmic markers (LANDMark): study design and baseline characteristics. Diabetes Res Clin Pract, 104, 248-56.
PRITCHARD, N., EDWARDS, K., RUSSELL, A. W., PERKINS, B. A., MALIK, R. A. & EFRON, N. 2015. Corneal Confocal Microscopy Predicts 4-Year Incident Peripheral Neuropathy in Type 1 Diabetes. Diabetes Care, 38, 671-5.
PROVITERA, V., NOLANO, M., STANCANELLI, A., CAPORASO, G., VITALE, D. F. & SANTORO, L. 2015. Intraepidermal nerve fiber analysis using immunofluorescence with and without confocal microscopy. Muscle & Nerve, 51, 501-504.

155
QUATTRINI, C., JEZIORSKA, M., TAVAKOLI, M., BEGUM, P., BOULTON, A. J. M. & MALIK, R. A. 2008. The Neuropad test: a visual indicator test for human diabetic neuropathy. Diabetologia, 51, 1046-1050.
QUATTRINI, C., TAVAKOLI, M., JEZIORSKA, M., KALLINIKOS, P., TESFAYE, S., FINNIGAN, J., MARSHALL, A., BOULTON, A. J., EFRON, N. & MALIK, R. A. 2007. Surrogate markers of small fiber damage in human diabetic neuropathy. Diabetes, 56, 2148-54.
RAGÉ, M., VAN ACKER, N., KNAAPEN, M. W., TIMMERS, M., STREFFER, J., HERMANS, M. P., SINDIC, C., MEERT, T. & PLAGHKI, L. 2011. Asymptomatic small fiber neuropathy in diabetes mellitus: investigations with intraepidermal nerve fiber density, quantitative sensory testing and laser-evoked potentials. J Neurol, 258, 1852-64.
RAJAN, S., CAMPAGNOLO, M., CALLAGHAN, B. & GIBBONS, C. H. 2019. Sudomotor function testing by electrochemical skin conductance: does it really measure sudomotor function? Clinical Autonomic Research, 29, 31-39.
RESCH, M. D., MARSOVSZKY, L., NÉMETH, J., BOCSKAI, M., KOVÁCS, L. & BALOG, A. 2015. Dry eye and corneal langerhans cells in systemic lupus erythematosus. J Ophthalmol, 2015, 543835.
ROBINSON, J. P. 2001. Chapter 4 Principles of confocal microscopy. Methods in Cell Biology. Academic Press.
ROLKE, R., BARON, R., MAIER, C., TÖLLE, T. R., TREEDE, R. D., BEYER, A., BINDER, A., BIRBAUMER, N., BIRKLEIN, F., BÖTEFÜR, I. C., BRAUNE, S., FLOR, H., HUGE, V., KLUG, R., LANDWEHRMEYER, G. B., MAGERL, W., MAIHÖFNER, C., ROLKO, C., SCHAUB, C., SCHERENS, A., SPRENGER, T., VALET, M. & WASSERKA, B. 2006a. Quantitative sensory testing in the German Research Network on Neuropathic Pain (DFNS): Standardized protocol and reference values. Pain, 123, 231-243.
ROLKE, R., MAGERL, W., CAMPBELL, K. A., SCHALBER, C., CASPARI, S., BIRKLEIN, F. & TREEDE, R. D. 2006b. Quantitative sensory testing: a comprehensive protocol for clinical trials. European Journal of Pain, 10, 77-88.
ROSENBERG, M. E., TERVO, T. M., IMMONEN, I. J., MÜLLER, L. J., GRÖNHAGEN-RISKA, C. & VESALUOMA, M. H. 2000. Corneal structure and sensitivity in type 1 diabetes mellitus. Invest Ophthalmol Vis Sci, 41, 2915-21.
RUGGENENTI, P., LAURIA, G., ILIEV, I. P., FASSI, A., ILIEVA, A. P., ROTA, S., CHIURCHIU, C., BARLOVIC, D. P., SGHIRLANZONI, A., LOMBARDI, R., PENZA, P., CAVALETTI, G., PIATTI, M. L., FRIGENI, B., FILIPPONI, M., RUBIS, N., NORIS, G., MOTTERLINI, N., ENE-IORDACHE, B., GASPARI, F., PERNA, A., ZALETEL, J., BOSSI, A., DODESINI, A. R., TREVISAN, R. & REMUZZI, G. 2011. Effects of manidipine and delapril in hypertensive patients with type 2 diabetes mellitus: the delapril and manidipine for nephroprotection in diabetes (DEMAND) randomized clinical trial. Hypertension, 58, 776-83.
SAEEDI, P., PETERSOHN, I., SALPEA, P., MALANDA, B., KARURANGA, S., UNWIN, N., COLAGIURI, S., GUARIGUATA, L., MOTALA, A. A., OGURTSOVA, K., SHAW, J. E., BRIGHT, D. & WILLIAMS, R. 2019. Global and regional diabetes prevalence estimates for 2019 and projections for 2030 and 2045: Results from the International Diabetes Federation Diabetes Atlas, 9(th) edition. Diabetes Res Clin Pract, 157, 107843.
SCANLON, P. H. 2017. The English National Screening Programme for diabetic retinopathy 2003–2016. Acta Diabetologica, 54, 515-525.
SCARR, D., LOVBLOM, L. E., LOVSHIN, J. A., BOULET, G., FAROOQI, M. A., ORSZAG, A., WEISMAN, A., CARDINEZ, N., LYTVYN, Y., NGO, M., KEENAN, H. A., BRENT, M. H., PAUL, N., BRIL, V., CHERNEY, D. Z. I. & PERKINS, B. A. 2017a. Lower corneal nerve fibre length identifies diabetic neuropathy in older adults with diabetes: results from the Canadian Study of Longevity in Type 1 Diabetes. Diabetologia, 60, 2529-2531.
SCARR, D., LOVBLOM, L. E., OSTROVSKI, I., KELLY, D., WU, T., FAROOQI, M. A., HALPERN, E. M., NGO, M., NG, E., ORSZAG, A., BRIL, V. & PERKINS, B. A. 2017b. Agreement between automated and manual quantification of corneal nerve fiber length: Implications for diabetic neuropathy research. Journal of Diabetes and its Complications, 31, 1066-1073.
SELVARAJAH, D., CASH, T., DAVIES, J., SANKAR, A., RAO, G., GRIEG, M., PALLAI, S., GANDHI, R., WILKINSON, I. D. & TESFAYE, S. 2015. SUDOSCAN: A Simple, Rapid, and Objective Method with Potential for Screening for Diabetic Peripheral Neuropathy. PLoS One, 10, e0138224.
SHABEEB, D., NAJAFI, M., HASANZADEH, G., HADIAN, M. R., MUSA, A. E. & SHIRAZI, A. 2018. Electrophysiological measurements of diabetic peripheral neuropathy: A systematic review. Diabetes & Metabolic Syndrome: Clinical Research & Reviews, 12, 591-600.

156
SHAH, T. M., GUPTA, S. M., CHATTERJEE, P., CAMPBELL, M. & MARTINS, R. N. 2017. Beta-amyloid sequelae in the eye: a critical review on its diagnostic significance and clinical relevance in Alzheimer's disease. Mol Psychiatry, 22, 353-363.
SHARMA, S., VAS, P. R. & RAYMAN, G. 2015. Assessment of diabetic neuropathy using a point-of-care nerve conduction device shows significant associations with the LDIFLARE method and clinical neuropathy scoring. Journal of diabetes science and technology, 9, 123-131.
SHUN, C. T., CHANG, Y. C., WU, H. P., HSIEH, S. C., LIN, W. M., LIN, Y. H., TAI, T. Y. & HSIEH, S. T. 2004. Skin denervation in type 2 diabetes: correlations with diabetic duration and functional impairments. Brain, 127, 1593-605.
SINGH, N., ARMSTRONG, D. G. & LIPSKY, B. A. 2005. Preventing foot ulcers in patients with diabetes. Jama, 293, 217-28.
SLOAN, G., SHILLO, P., SELVARAJAH, D., WU, J., WILKINSON, I. D., TRACEY, I., ANAND, P. & TESFAYE, S. 2018. A new look at painful diabetic neuropathy. Diabetes Research and Clinical Practice, 144, 177-191.
SMITH, A. G., LESSARD, M., REYNA, S., DOUDOVA, M. & SINGLETON, J. R. 2014. The diagnostic utility of Sudoscan for distal symmetric peripheral neuropathy. Journal of diabetes and its complications, 28, 511-516.
SMITH, A. G., RUSSELL, J., FELDMAN, E. L., GOLDSTEIN, J., PELTIER, A., SMITH, S., HAMWI, J., POLLARI, D., BIXBY, B., HOWARD, J. & SINGLETON, J. R. 2006. Lifestyle Intervention for Pre-Diabetic Neuropathy. Diabetes Care, 29, 1294-1299.
SMITH, B. E. 2014. Chapter 3 - Focal and entrapment neuropathies. In: ZOCHODNE, D. W. & MALIK, R. A. (eds.) Handbook of Clinical Neurology. Elsevier.
SOLOMON, S. D. & GOLDBERG, M. F. 2019. ETDRS Grading of Diabetic Retinopathy: Still the Gold Standard? Ophthalmic Res, 62, 190-195.
SORENSEN, L., MOLYNEAUX, L. & YUE, D. K. 2006. The relationship among pain, sensory loss, and small nerve fibers in diabetes. Diabetes Care, 29, 883-7.
STACHS, O., ZHIVOV, A., KRAAK, R., STAVE, J. & GUTHOFF, R. 2007. In vivo three-dimensional confocal laser scanning microscopy of the epithelial nerve structure in the human cornea. Graefes Arch Clin Exp Ophthalmol, 245, 569-75.
SU, P.-Y., HU, F.-R., CHEN, Y.-M., HAN, J.-H. & CHEN, W.-L. 2006. Dendritiform Cells Found in Central Cornea by In-Vivo Confocal Microscopy in a Patient with Mixed Bacterial Keratitis. Ocular immunology and inflammation, 14, 241-4.
SZALAI, E., DEÁK, E., MÓDIS, L., JR, NÉMETH, G., BERTA, A., NAGY, A., FELSZEGHY, E., KÁPOSZTA, R., MALIK, R. A. & CSUTAK, A. 2016. Early Corneal Cellular and Nerve Fiber Pathology in Young Patients With Type 1 Diabetes Mellitus Identified Using Corneal Confocal Microscopy. Investigative Ophthalmology & Visual Science, 57, 853-858.
TAHRANI, A. A., ALTAF, Q. A., PIYA, M. K. & BARNETT, A. H. 2017. Peripheral and Autonomic Neuropathy in South Asians and White Caucasians with Type 2 Diabetes Mellitus: Possible Explanations for Epidemiological Differences. Journal of diabetes research, 2017, 1273789.
TAVAKOLI, M., BOULTON, A. J. M., EFRON, N. & MALIK, R. A. 2011a. Increased Langerhan cell density and corneal nerve damage in diabetic patients: role of immune mechanisms in human diabetic neuropathy. Contact lens & anterior eye : the journal of the British Contact Lens Association, 34, 7-11.
TAVAKOLI, M., BRESNEN, M., DAVISON, N., COTTERILL, S., HOWARD, S., PERRY, C., SOILAND-REYES, C. & SPENCER, R. 2016. Implementation of Corneal Confocal Microscopy in Primary Care Optometry Practices for Screening and Early Detection of Diabetic Neuropathy: a Feasibility Study.
TAVAKOLI, M., FERDOUSI, M., PETROPOULOS, I. N., MORRIS, J., PRITCHARD, N., ZHIVOV, A., ZIEGLER, D., PACAUD, D., ROMANCHUK, K., PERKINS, B. A., LOVBLOM, L. E., BRIL, V., SINGLETON, J. R., SMITH, G., BOULTON, A. J. M., EFRON, N. & MALIK, R. A. 2015. Normative values for corneal nerve morphology assessed using corneal confocal microscopy: a multinational normative data set. Diabetes care, 38, 838-843.
TAVAKOLI, M., HOSSAIN, P. & MALIK, R. A. 2008. Clinical applications of corneal confocal microscopy. Clinical ophthalmology (Auckland, N.Z.), 2, 435-445.
TAVAKOLI, M., KALLINIKOS, P., IQBAL, A., HERBERT, A., FADAVI, H., EFRON, N., BOULTON, A. J. M. & A MALIK, R. 2011b. Corneal confocal microscopy detects improvement in corneal nerve morphology with an improvement in risk factors for diabetic neuropathy. Diabetic medicine : a journal of the British Diabetic Association, 28, 1261-1267.

157
TAVAKOLI, M. & MALIK, R. A. 2011. Corneal confocal microscopy: a novel non-invasive technique to quantify small fibre pathology in peripheral neuropathies. Journal of visualized experiments 47, 2194.
TAVAKOLI, M., MITU-PRETORIAN, M., PETROPOULOS, I. N., FADAVI, H., ASGHAR, O., ALAM, U., PONIRAKIS, G., JEZIORSKA, M., MARSHALL, A., EFRON, N., BOULTON, A. J., AUGUSTINE, T. & MALIK, R. A. 2013. Corneal confocal microscopy detects early nerve regeneration in diabetic neuropathy after simultaneous pancreas and kidney transplantation. Diabetes, 62, 254-260.
TAVAKOLI, M., QUATTRINI, C., ABBOTT, C., KALLINIKOS, P., MARSHALL, A., FINNIGAN, J., MORGAN, P., EFRON, N., BOULTON, A. J. & MALIK, R. A. 2010. Corneal confocal microscopy: a novel noninvasive test to diagnose and stratify the severity of human diabetic neuropathy. Diabetes Care, 33, 1792-7.
TENTOLOURIS, N., ACHTSIDIS, V., MARINOU, K. & KATSILAMBROS, N. 2008. Evaluation of the Self-Administered Indicator Plaster Neuropad for the Diagnosis of Neuropathy in Diabetes. Diabetes Care, 31, 236-37.
TESFAYE, S., BOULTON, A. J. M., DYCK, P. J., FREEMAN, R., HOROWITZ, M., KEMPLER, P., LAURIA, G., MALIK, R. A., SPALLONE, V., VINIK, A., BERNARDI, L., VALENSI, P. & TORONTO DIABETIC NEUROPATHY EXPERT, G. 2010. Diabetic neuropathies: update on definitions, diagnostic criteria, estimation of severity, and treatments. Diabetes care, 33, 2285-2293.
TESFAYE, S., CHATURVEDI, N., EATON, S. E., WARD, J. D., MANES, C., IONESCU-TIRGOVISTE, C., WITTE, D. R. & FULLER, J. H. 2005. Vascular risk factors and diabetic neuropathy. N Engl J Med, 352, 341-50.
TESFAYE, S., STEVENS, L. K., STEPHENSON, J. M., FULLER, J. H., PLATER, M., IONESCU-TIRGOVISTE, C., NUBER, A., POZZA, G. & WARD, J. D. 1996. Prevalence of diabetic peripheral neuropathy and its relation to glycaemic control and potential risk factors: the EURODIAB IDDM Complications Study. Diabetologia, 39, 1377-84.
THAISETTHAWATKUL, P., FERNANDES FILHO, J. A. & HERRMANN, D. N. 2013. Contribution of QSART to the diagnosis of small fiber neuropathy. Muscle Nerve, 48, 883-8.
THEMISTOCLEOUS, A. C., RAMIREZ, J. D., SERRA, J. & BENNETT, D. L. 2014. The clinical approach to small fibre neuropathy and painful channelopathy. Pract Neurol, 14, 368-79.
THORUD, J. C., PLEMMONS, B., BUCKLEY, C. J., SHIBUYA, N. & JUPITER, D. C. 2016. Mortality After Nontraumatic Major Amputation Among Patients With Diabetes and Peripheral Vascular Disease: A Systematic Review. J Foot Ankle Surg, 55, 591-9.
TURUWHENUA, J. T., PATEL, D. V. & MCGHEE, C. N. J. 2012. Fully Automated Montaging of Laser Scanning In Vivo Confocal Microscopy Images of the Human Corneal Subbasal Nerve Plexus. Investigative Ophthalmology & Visual Science, 53, 2235-2242.
UMAPATHI, T., TAN, W. L., LOKE, S. C., SOON, P. C., TAVINTHARAN, S. & CHAN, Y. H. 2007. Intraepidermal nerve fiber density as a marker of early diabetic neuropathy. Muscle Nerve, 35, 591-8.
VINIK, A. I. & MEHRABYAN, A. 2004. Diabetic neuropathies. Medical Clinics of North America, 88, 947-999.
VINIK, A. I., SMITH, A. G., SINGLETON, J. R., CALLAGHAN, B., FREEDMAN, B. I., TUOMILEHTO, J., BORDIER, L., BAUDUCEAU, B. & ROCHE, F. 2016. Normative Values for Electrochemical Skin Conductances and Impact of Ethnicity on Quantitative Assessment of Sudomotor Function. Diabetes Technol Ther, 18, 391-8.
VLČKOVÁ-MORAVCOVÁ, E., BEDNAŘÍK, J., DUŠEK, L., TOYKA, K. V. & SOMMER, C. 2008. Diagnostic validity of epidermal nerve fiber densities in painful sensory neuropathies. Muscle & Nerve, 37, 50-60.
WAHREN, J., FOYT, H., DANIELS, M. & AREZZO, J. C. 2016. Long-Acting C-Peptide and Neuropathy in Type 1 Diabetes: A 12-Month Clinical Trial. Diabetes Care, 39, 596-602.
WALDFOGEL, J. M., NESBIT, S. A., DY, S. M., SHARMA, R., ZHANG, A., WILSON, L. M., BENNETT, W. L., YEH, H. C., CHELLADURAI, Y., FELDMAN, D. & ROBINSON, K. A. 2017. Pharmacotherapy for diabetic peripheral neuropathy pain and quality of life: A systematic review. Neurology, 88, 1958-1967.
WANG, M., ZHANG, C., ZUO, A., LI, L., CHEN, L. & HOU, X. 2020. Diagnostic utility of corneal confocal microscopy in type 2 diabetic peripheral neuropathy. J Diabetes Investig.
WILSON, S. E. & HONG, J. W. 2000. Bowman's layer structure and function: critical or dispensable to corneal function? A hypothesis. Cornea, 19, 417-20.

158
WU, L. Q., CHENG, J. W., CAI, J. P., LE, Q. H., MA, X. Y., GAO, L. D. & WEI, R. L. 2016. Observation of Corneal Langerhans Cells by In Vivo Confocal Microscopy in Thyroid-Associated Ophthalmopathy. Curr Eye Res, 41, 927-32.
YAJNIK, C. S., KANTIKAR, V. V., PANDE, A. J. & DESLYPERE, J. P. 2012. Quick and simple evaluation of sudomotor function for screening of diabetic neuropathy. ISRN endocrinology, 2012, 103714.
YAN, A., ISSAR, T., TUMMANAPALLI, S. S., MARKOULLI, M., KWAI, N. C. G., POYNTEN, A. M. & KRISHNAN, A. V. 2020. Relationship between corneal confocal microscopy and markers of peripheral nerve structure and function in Type 2 diabetes. Diabet Med, 37, 326-334.
YARNITSKY, D., GRANOT, M., NAHMAN-AVERBUCH, H., KHAMAISI, M. & GRANOVSKY, Y. 2012. Conditioned pain modulation predicts duloxetine efficacy in painful diabetic neuropathy. PAIN, 153, 1193-1198.
YOUNG, M. J., BOULTON, A. J., MACLEOD, A. F., WILLIAMS, D. R. & SONKSEN, P. H. 1993. A multicentre study of the prevalence of diabetic peripheral neuropathy in the United Kingdom hospital clinic population. Diabetologia, 36, 150-4.
ZASLANSKY, R. & YARNITSKY, D. 1998. Clinical applications of quantitative sensory testing (QST). Journal of the Neurological Sciences, 153, 215-238.
ZHIVOV, A., STAVE, J., VOLLMAR, B. & GUTHOFF, R. 2005. In vivo confocal microscopic evaluation of Langerhans cell density and distribution in the normal human corneal epithelium. Graefe's Archive for Clinical and Experimental Ophthalmology, 243, 1056-1061.
ZHIVOV, A., WINTER, K., HOVAKIMYAN, M., PESCHEL, S., HARDER, V., SCHOBER, H. C., KUNDT, G., BALTRUSCH, S., GUTHOFF, R. F. & STACHS, O. 2013. Imaging and quantification of subbasal nerve plexus in healthy volunteers and diabetic patients with or without retinopathy. PLoS One, 8, e52157.
ZIEGLER, D., BEHLER, M., SCHROERS-TEUBER, M. & RODEN, M. 2015. Near-normoglycaemia and development of neuropathy: a 24-year prospective study from diagnosis of type 1 diabetes. BMJ Open, 5.
ZIEGLER, D., PAPANAS, N., ZHIVOV, A., ALLGEIER, S., WINTER, K., ZIEGLER, I., BRÜGGEMANN, J., STROM, A., PESCHEL, S., KÖHLER, B., STACHS, O., GUTHOFF, R. F. & RODEN, M. 2014. Early detection of nerve fiber loss by corneal confocal microscopy and skin biopsy in recently diagnosed type 2 diabetes. Diabetes, 63, 2454-63.
ZILLIOX, L. A., RUBY, S. K., SINGH, S., ZHAN, M. & RUSSELL, J. W. 2015. Clinical neuropathy scales in neuropathy associated with impaired glucose tolerance. J Diabetes Complications, 29, 372-7.