Copyright is owned by the Author of the thesis. Permission is given ...
333
Copyright is owned by the Author of the thesis. Permission is given for a copy to be downloaded by an individual for the purpose of research and private study only. The thesis may not be reproduced elsewhere without the permission of the Author.
-
Upload
khangminh22 -
Category
Documents
-
view
0 -
download
0
Transcript of Copyright is owned by the Author of the thesis. Permission is given ...

Copyright is owned by the Author of the thesis. Permission is given for a copy to be downloaded by an individual for the purpose of research and private study only. The thesis may not be reproduced elsewhere without the permission of the Author.
A search for quantitative trait loci involved in
physiological processes related to milk production
in dairy cattle
A thesis presented in partial fulfilment of the requirements
for the degree of
Doctor of Philosophy in Animal Science
at Massey University, Palmerston North
New Zealand
Kathryn Joy Hutchinson
2008

11
Abstract
Metabolic chal lenges have previously been used to identify physiological markers to assist with
the selection of both sexes dairy cattle at an early age to increase rate of genetic gain.
Physiological markers have not been implemented in selection programmes due to low
accuracy. An experiment was undertaken to investigate the use of metabolic quantitative trait
l oci (QTL) for improving the rate of genetic gain in dairy cattle. Three metabolic chal lenges
(adrenaline, glucose, and thyrotropin-releasing hormone) were conducted on 882 18-month-old
Friesian-Jersey F2 crossbred heifers. An initial whole genome scan was conducted by
genotyping 1679 animals within the trial pedigree for 283 microsate l lite markers, obtained
primarily from published marker maps. QTL analyses were performed on the Friesian-Jersey
crossbred trial data using metabolic and milk production phenotypes. 581 QTL were significant
at the 1% level and 275 of them were QTL of metabolic phenotypes. An objective of this study
was to identify chromosomal regions in which endocrine and milk production QTL were co
located, in the hope that these regions would contain genes with a significant impact on the
control of milk production. The region selected for a candidate gene study was 47-51 cM of
BTAI4 due to the close proximity of metabolic and milk production QTL co-located in this
region. Comparative mapping was used to generate a list of 105 genes in the region of interest.
The genes considered the most suitab le candidates for the QTL in the region were tripartite
motif-containing 55, ubiquitin-conjugating enzyme E2W (putative), nuclear receptor coactivator
2, serum/glucocorticoid regulated kinase family, member 3, opioid receptor, kappa I,
proenkephalin, corticotropin releasing honnone. A major finding of this study was that there
were very few chromosomal regions in which metabolic and milk production QTL were co
l ocated. This is likely to be due to the highly complex and integrated molecular networks
controlled by many genes that influence milk production traits. The data generated in this thesis
will be suitable for more advanced examinations of the genetic control of milk production using
the new generations of single nucleotide polymorphism chips .
III

IV

Dedicated to my mother Ellen Hutchinson,
who always nurtured my love of learning.
For you my love and gratitude knows no bounds.
v

VI

Acknowledgments
Firstly I would l i ke to sincerely thank my supervisors: Professor Hugh Blair and Associate
Professor Duncan Mackenzie. Both have encouraged, supported and guided me through this
PhD. I am grateful for our many discussions and your strong focus on the end product. Your
wi l l ingness to read the many drafts [ sent you and the excellent suggestions and constructive
criticism were always appreciated. I am gratefu l for their unfai l ing belief that r would get this
PhD finished . . . eventually! I am extremely grateful for the privi lege of working with you both.
Thank you to Dr Dean Revell who was a supervisor during the early stages of my PhD and
provided valuable guidance and a friendly face whenever I needed it . Thanks also to Dr
Richard Spelman and Dr Steve Davis for their advice and guidance.
I would l ike to thank a largc number of people for their invaluable practical assistance during
the complet ion of my PhD. The fantastic and knowledgeable Dexcel staff, particularly Gwyn
Verkerk, Peter Gore, Stuart Morgan, and the always entertaining Javier Dupuy for the smooth
and efficient running of the metabol ic chal lenges; at Livestock Improvement Corporation (L IC) :
Maria Thielen, Jack Hooper, Steve Harcourt, and Renae Bennett for trial organisation; Loma
McNaughton, Gabrielle Stanley, and Suzanne Young for sending me data and infom1ation that I
needed; Ross McKee and the rest of the Dexcel laboratory staff for preparation of the infusates;
AgResearch farm staff : Ken Jones, Jock Clayton, and l an Clarke for your patience and animal
management; Alpha-Scienti fic staff for sample processing and analyses, particularly Cameron
Walker for sending me those elusive methods and co-efficient of variation documents; and the
vet students who helped during the running of the trials: Teresa Soppet, Karl Mathis, Lucy Nel l ,
Nicola Hooper, Nick Dymond, Dan Schluter, Bart Karalus, I lana Burton, Anna Graham,
Stephanie Bonner, and Antonia Baird. At Massey University thanks to: N icolas Lopez
Vil lalobos for statistical assistance; Al lain Scot! for her friendly smile and effic ient handl ing of
any questions I had; and Matthew I rwin for computer and technical assistance. I really enjoyed
working with you a l l .
VII

Vlll

During my PhD I was supported financial ly by a Doctoral scholarship from the Agricultural and
Marketing Research and Development Trust (AGMARDT), Helen E Akers PhD Scholarship,
John Alexander Hurley Scholarship, MacMil lan Brown Agricultural Research Scholarship, G 0
Anstiss Scholarship, and by a Lie Scholarship, for which I am truly grateful . This PhD
research was funded by LIC and ViaLactia B iosciences. Travel to a scientific conference and
workshop was made possible by grants from AGMARDT, Massey University I nstitute of
Veterinary, Animal and Biomedical Sciences, L IC, and The Royal Society of New Zealand.
Thanks to Loma McNaughton for letting me sleep on her floor. Special thanks to Alex and
Garry Udy for sharing your home with me while I was doing experimental work in Hamilton,
you are fantastic.
Thanks to my wonderful friends Helena, Amy, Tricia and Aure l ie and flatmates Gordy and
Georgia for making sure I remember there is l ife outside a PhD. Thanks also to my office mates
Jeremy, Gina, Kavitha, Folushia, and Francisco I could not have wished for a better bunch of
pcoplc to share an office with. B ig thanks to the 'Mafia ' : Beck, N icola, Rcne, Dannie and Jo
you girls rock! I am so glad to have experienced post-grad l ife with you, thanks for your
friendships and all the laughs. Thanks especial ly to Jo, who have been such an amazing
flatmate, office mate and most importantly friend over the past three years. Thanks for the fun,
laughter, and countless discussions.
Thanks and a big hug to my Dad, Col in, for always being there, for your love and support
throughout this PhD and for the phone calls checking up on how [ ' m getting on! I can finally
get a j ob! Thanks also to my sisters Beverly and Rachel for their love and support.
The biggest thanks and huge hugs and k isses must go to my wonderful fiance Matthew, who has
helped me through some very difficult times and supported me during the many ups and downs
that go with doing a PhD. [ am deeply grateful for all the help, encouragement, laughter and
love you have given me, w ithout you [ would not have made it this far.
Love doesn't make the world go round; love is what makes the ride worthwhile.
Franklin P. lones.
IX

x
Table of Contents
Abstract ---------------------------------------------------------------------------------------------------- i i i
A c kn 0 W I ed gem e n ts-------------------------------------------------------------------------------------- vi i
Lis t 0 f Fi g u res -------------------------------------------------------------------------------------------- x v
Lis t 0 f Tab I es --------------------------------------------------------------------------------------------x vi i
List of Ab brevi a tio n s ---------------------------------------------------------------------------------- xi x
CH A PT E R I --------------------------------------------------------------------------------------------- I
C HA PT E R 2 ----------------------------------------------------------------------------------------------- 5
2. 1 1ntroduction----------------------------------------------------------------------------------------------- 6
2.2 B reedi ng schemes ---------------------------------------------------------------------------------------- 6 2.3 Quantitative Trait Loci and Marker Assisted Selection--------------------------------------------- 9
2.4 The Major Metabolic Pathways in the Lactating DailY Cow ------------------------------------- 1 1
2.5 Carbohydrate Metabolism in the Rum inant --------------------------------------------------------- 14
2.6 Carbohydrate metabolism in the lactating ruminant----------------------------------------------- 1 5 G lucose uptake and ut i I i sati on-------------------------------------------------------------------------------- 1 5 Ci rculating i nsul in concentrations --------------------------------------------------------------------------- 1 7 Changes in insulin responsiveness and glucose use in peripheral tissues------------------------------- 1 8 The role of growth hormone in insul in resistance----------------------------------------------------------2 1 The role 0 f gl ucagon ---------------------------------------------------- ---------------------------------------2 1 G lucose uptake by mammary gland ------------------------------------------------------------------------- 23 Differences between high and low genetic merit dairy cattle -------------------------------------------- 23 S umma ry ------------------------------------------------------------------------------------------ -------------- 24
2. 7 Lipid Met abolism ---------------------------------------------------------------------------------------2 5 Ca tech 0 I a i me s --------------------------------------------------------------------------------------------------29 Le p tin ------------------------------------------------------------------------------------------------------------30 S um mary -------------------------------------------------------------------------------------------------------- 30
2.8 Protein Met abo! is m -------------------------------------------------------------------------------------3 I S umma ry -------------------------------------------------------------- ---------------------------- -------------- 34
2. 9 Liver ------------------------------------------------------------------------------------------------------ 34
2. 10 Metabolic Pathways Summwy --------------------------------- ---------------------------------------35
2. 1 1 Challenges ----------------------------------------------------------------------------------------------- 35 F asti ng a nd feed i ng --------------------------------------------------------------------------------------------3 7 Ins u I i n -----------------------------------------------------------------------------------------------------------3 8 Growth h 0 rm 0 n e ------------------------------------- ----------------------------------------------------------39 A drena I i ne --------------------------------------------------------------- ---------------------------------------43 S umma ry --------------------------------------------------------------------------------------------------------44
2. 12 Purpose and Scope--------------------------------------------------------------------------------------4 7
CH A PT ER 3 --------------------------------------------------------------------------------------------- 49
3. 1 Animal Eth ics -------------------------------------------------------------------------------------------- 50
XI
3. 2 Loc a t i on --------------------------------------------------------------------------------------------------50
3.3 Generation of experimental animals ----------------------------------------------------------------- 50
3. 4 Heifer rearing and management ---------------------------------------------------------------------- 52
H a Iter tra i n i n g --------------------------------------------------------------------------------------------------53
Feed --------------------------------------------------------------------------------------------------------------53
3. 5 Experimental animals and groups -------------------------------------------------------------------- 53
3. 6 Challenge procedure ----------------------------------------------------------------------------------- 57
T i m e seq uen ce --------------------------------------------------------------------------------------------------57 Live weight measurements -----------------------------------------------------------------------------------60
Ca the teri sa t i on ------------------------------------------------------------------------------------------------- 60
Cha I I en ges ------------------------------------------------------------------------------------------------------6 I
3. 7 Hormone Assays ---------------------------------------------------------------------------------------- 64
Growth Hormone ---------------------------------------------------------------------------------------------- 64 [nsul i n -I i ke growth factor [ -----------------------------------------------------------------------------------64
Pro I act i n ---------------------------------------------------------------------------------------------------------65 Thyroid Sti m u lati ng H ormone -------------------------------------------------------------------------------65 [n suI i n ----------------------------------------------------------------------------------------------------------- 65
3.8 Metabol i te A ssays --------------------------------------------------------------------------------------- 66 N on-esteri fied Fatty Acids ------------------------------------------------------------------------------------66
G I uc ose ----------------------------------------------------------------------------------------------------------66
G I yce ro I ---------------------------------------------------------------------------------------------------------66
3.9 Other data collect ion ----------------------------------------------------------------------------------- 67
Mil k Yi e Ids ----------------------------------------------------------------------------------------------------- 67
G en 0 typ i n g -----------------------------------------------------------------------------------------------------67
3.10 Data Process i ng ---------------------------------------------------------------------------------------- 68
3.11 Data ad} us tmen (----------------------------------------------------------------------------------------- 72
Unbalanced materna I grands ire d istri buti on ---------------------------------------------------------------- 72
Da ta a na I ys i s---------------------------------------------------------------------------------------------------- 73
C HAPT E R 4 ---------------------------------------------------------------------------------------------- 75
4.1 Introduction --------------------------------------------------------------------------------------------- 76
4.2 Mean response curves ---------------------------------------------------------------------------------- 76
4.3 Adrenal ine challenge ----------------------------------------------------------------------------------- 76 Res u I ts ----------------------------------------------------------------------------------------------------------- 78
D i s c us s i on ------------------------------------------------------------------------------------------------------81
4.4 G lucose challenge --------------------------------------------------------------------------------------82 Res u I ts -----------------------------------------------------------------------------------------------------------84
D i s c us s i on ------------------------------------------------------------------------------------------------------92
4.5 Thyrotropi IHeleasing hormone cha! lenge ---------------------------------------------------------- 96 Res u Its ----------------------------------------------------------------------------------------------------------- 97
D i scu s s i on ---------------------------------------------------------------------------------------------------- I 04
4. 6 Finalised phenotypes --------------------------------------------------------------------------------- 105
Adrenal ine challenge phenotypes -------------------------------------------------------------------------- 105
Glucose chal lenge phenotypes ----------------------------------------------------------------------------- 106
TRH challenge phenotypes ----------------------------------------------------------------- ---------------- 107
S urn mary ------------------------------------------------------------------------------------------------------ I 07
C HA PT ER 5 ------------------------------------------------------------------------------------------- 1 09
Xll
5. 1 1 ntroduc (ion ------------------------------------------------------------------------------------------- I I 0
5.2 Phenotype generation -------------------------------------------------------------------------------- 110 5.3 QTL analysis using WEBQTLANA ----------------------------------------------------------------- I I I
Example output from WEBQTLA NA --------------------------------------------------------------------- I 1 3
5.4 Endocrine and milk production QTL --------------------------------------------------------------- 1 1 7
5.5 Candidate genes--------------------------------------------------------------------------------------- 1 20
5.6 Summa 'y ----------------------------------------------------------------------------------------------- 122
C HAPT E R 6 -------------------------------------------------------------------------------------------- 1 25
6. J I ntroduct ion------------------------------------------------------------------- --- ---------------------- 1 26
6.2 Phenotypes in the region ----------------------------------------------------------------------------- 1 29
6. 3 Candidate genes --------------------------------------------------------------------------------------- 1 33
6.4 Protein metabolism candidate genes --------------------------------------------------------------- 1 33 Ribosomal protei n L7 and ribosomal protei n S20 ------------------------------------------------------- 1 34 Ribosome biogenesis regulator homolog (S . cerevisiae) ----------------------------------------------- 1 38 Mitochondrial ribosomal protei n L 1 5 -------------------------------------------------------------------- 1 40 Ubiquitin-conj ugating enzyme E2W (putati ve) --------------------------------------------------------- 1 4 1 COP9 constitutive photomorphogenic homolog subunit 5 (Arabidopsis) ---------------------------- 1 44 Tripartite moti f-containi ng 5 5 ----------------------------------------------------------------------------- 1 46 Musculin (activated B-cel! factor- I ) ---------------------------------------------------------------------- 148 Summary ------------------------------------------------------------------------------------------------------ 1 49
6.5 Control points in metabolic pathways-------------------------------------------------------------- 1 50 N uclear receptor coactivator 2 ----------------------------------------------------------------------------- 1 5 1 Serum/glucocorticoid regulated kinase fami ly, member 3 --------------------------------------------- 1 55 Regulator of G-protei n signal! ing 20 --------------------------------------------------------------------- 1 57 RAB2, member RAS oncogene fami ly ------------------------------------------------------------------- 1 60 ADP-ribosylation factor guanine nucleotide-exchange factor I (brefeldin A-inhibited) ----------- 1 64 ATPase, H+ transporting, lysosomal 50/57kDa, V I subunit H --------------------------------------- 1 66 S um ma ry ------------------------------------------------------------------------------------------------------ I 70
6. 6 Food intake control candidate genes --------------------------------------------------------------- 1 70 Opioid receptor, kappa I (OPRK I ) ------------------------------------------------------------------------ 1 7 1 P roen kepha I i n (P ENK ) -------------------------------------------------------------------------------------- I 74 Corticotropin releasing hormone (CRH) ------------------------------------------------------------------ 1 79 Neuropeptides B/w receptor I (NPBWR I ) -------------------------------------------------------------- 1 82 Summary ------------------------------------------------------------------------------------------ ------------ 1 84
6. 7 Summmy ----------------------------------------------------------------------------------------------- 1 85
C HA PT E R 7 -------------------------------------------------------------------------------------------- 187
7. J The challenges----------------------------------------------------------------------------------------- 1 88
7. 2 Mapping QTL------------------------------------------------------------------------------------------ 1 9 1
7. 3 Usefitlness of metabolic challenges----------------------------------------------------------------- 1 92
7.4 QTL and genom ic select ion-------------------------------------------------------------------------- 1 96
7. 5 Concl us ion --------------------------------------------------------------------------------------------- I 99
C HA PT E R 8 -------------------------------------------------------------------------------------------- 2 0 1
C H A PT E R 9 -------------------------------------------------------------------------------------------- 245
Appendix A: Cat heterisat ion Procedures --------------------------------------------------------------------- 246 Co ns u m ab I es -------------------------------------------------------------------------------------------------- 246 I nserti on proced ure ---------------------------- -------------------------------------------------------------- 248
Appendix B: Infusate preparation ----------------------------------------------------------------------------- 25 1 A dren a I i ne ------------- --------------------------------------------------------------------------------- ------ 25 I G lucose -------------------------------------------------------------------------------------------------------- 253 TRH ------------------------------------------------------------------------------------------------------------ 255
XIII
Appendix C: J odi nation procedu res --------------------------------------------------------------------------- 258 Iodination of bovine GH using Iodogen ------------------------------------------------------------------ 258 Iodination of bovine TSH using Chloramine T ---------------------------------------------------------- 260
Appendix D. Sign iJicance tables ------------------------------------------------------------------------------- 263
Appendix E: Metabolic Phenotypes --------------------------------------------------------------------------- 265 Adrena I ine chal lenge ---------------------------------------------------------------------------------------- 265 Glucose c ha I I e n ge -------------------------------------------------------------------------------------------- 267 TRH challenge ----------------------------------------------------------------------------------------------- 269
Appendix F: QTL I oeat ions ------------------------------------------------------------------------------------ 272
Appendix G: List of genes in region of interest on BTA i 4 ------------------------------------------------ 290
Appendix H: information on genes discarded from candidate gene study ------------------------------- 294 L YPLA 1 - Jysophospholipase I ------ ---------------------------------------------------------------------- 294 Potassium voltage-gated channel, Shab-related subfamily, member 2 ------------------------------- 294 CP A6 - carbox ypeptidase A6 ------------------------------------------------------------------------------ 295 SULF I - sulfatase I ----------------------------------------------------------------------------------------- 296 TGS I - trimethylguanosine synthase homolog (S. cerevisiae) ---------------------------------------- 296 MYB L I - v-myb myeloblastosis viral oncogene homolog (avian)-l ike 1 ---------------------------- 297
Appendix i: P henotypic correlations -------------------------------------------------------------------------- 300
XIV

List of Figures
Figure 2 . 1 Example of the structure of a dairy cattle breeding scheme in ew Zealand .............. . . . . ....... . . . . 8
Figure 2 .2 Schematic representation of some of the metabol ic changes that occur in the periparturient dairy cow . . . . . . . . . . . . . . . . . . . . . . . . . . . . . . . . . . . . . . . . . . . . . . . . . . . . . . . . . . . . . . . . . . . . . . . . . . . . . . . . . . . . . . . . . . . . . . . . . . . . . . . . . . . . . . . . . . . . . . . . . . . . . . . . . . . . . . . . . 1 3
Figure 2.3 Some metabolic pathways of adipocytes and their adaptations to lactation ........ . . .. . . .............. 27
F igure 3 . 1 Experimental design for Friesian-Jersey crossbred trial ............................. . . . . . ....................... 5 1
Figure 3 .2 Diagrammatic representation of the segregation that occurs in an F2 experimental design ...... 52
Figure 3 .3 Live weight of heifer at the time they underwent challenges ............................. . . . . ................ 55
Figure 3 .4 Age of heifers at the t ime they received the chal lenges ......................... ......... . . . . . . ................... 56
Figure 3 .5 Time between heifers receiving challenges and when they calved .................... . . . . . ................. 56
F igure 3 .6 Percentage of hei fers in each challenge group that did not have a calving date . . . . . .................. 57
Figure 3 . 7 Mean insulin release for each challenge group before and after a glucose infusion at time zero .. ................ . . . . . . . . . ...................................... .. . . . ........................................ . ................................. . . . . . ..... 70
Figure 3 . 8 Mean NEFA release for each challenge group before and after a glucose infusion at time zero ... . . . . . . . . . . . . . . . . . . . . . . . . . . . . . . . . . . . . . . . . . . . . . . . . . . . . . . . . . . . . . . . . . . . . . . . . . . . . . . . . . . . . . . . . . . . . . . . . . . . . . . . . . . . . . . . . . . . . . . . . . . . . . . . . . . . . . . . . . . . . . . . . . . . . . . . 70
Figure 3.9 Mean insulin release for two subgroups in group 4 before and after a glucose infusion at time zero ......... . . . .. . . ..................... . . . . . . . . . ............ . . . ........... ......... . ............ ............................ ... . . . . . ................ 7 1
Figure 4 . 1 Mean plasma glycerol concentrations before and after an intravenous adrenaline injection at t ime zero . .. . . ................................................. .................... .......................................... . . . . . . . . . . . . . . ......... 79
Figure 4 .2 Mean plasma glycerol concentrations, by challenge year and by sire, before and after an intravenous adrenal ine injection at time zero . . . . . ............................... . . ... . . . . . . . . . . .. . . . ...... . . . . . . ............... 79
Figure 4 .3 Mean plasma NEFA concentrations before and after an intravenous adrenaline injection at time zero . .................... ...................................... . . . . . . . . .................................................. .. . ..... . . . ...... ............. 80
Figure 4.4 Mean plasma glucose concentrations before and after an intravenous adrenaline injection at time zero .............. . . . . . . ................................................................... .............. .......... . . . . . . . . . . . ................. 8 1
Figure 4 .5 Mean glucose concentrations in the plasma of heifers, before and after an intravenous glucose infusion at time zero . . . . . . . . . ................ . . ....... . . . . . . . . . . . . ......... . . . . . .. . . .............. . . .... .......................... . . . . . . . . . . . 84
Figure 4 .6 Mean insul in concentrations in the plasma of heifers, before and after an intravenous glucose infusion at t ime zero ................................... . . . ................................ ........... . . .. . . . ........... ...................... 85
Figure 4.7 Linear regression between glucose c learance and insulin peak . . . . . . . . . . . . . . . . . . . . . . . . . ...... . . . . . ........... 86
Figure 4.8 Mean insulin concentrations in the p lasma by chal lenge year and by sire before and after an intravenous glucose infusion at time zero . . . . . . . . . ........................................ ...................... .. . . . . ........... 87
F igure 4.9 Mean glucose concentrations in the plasma by challenge year and by sire, before and after an intravenous glucose infusion at time zero . . . . ..................................................................................... 87
Figure 4 . 1 0 Mean NEFA concentrations in the plasma of heifers, before and after an intravenous glucose infusion at t ime zero . . . . . . . . . .. . . . . . . . ....................................... . . . . . . . . . . .. . . . . . . . . . ........................ ....... . . . . . . . . . . . 88
Figure 4 . 1 1 Mean plasma insulin concentrations and peak concentrations of glucose in plasma in response to an intravenous glucose challenge ... . . . . . . . . . . . . ............................. . ................... .......... . . . . . . . . ............. 89
Figure 4 . 1 2 Regression between a subset of original and re-analysed plasma insulin samples taken 1 0 minutes post glucose infusion . . . . . . . ....................... . . .. . . . . . . . . . . . . . . . . . . . . ......... .................. . . . . . . . .................. 90
xv

Figure 4. 1 3 Mean GH concentrations in the plasma of hcifcrs, before and after an intravenous TRH injection at time zero ............. . .. . . . . . . ........... . .. . . . . . . . . . . . . . . . . . ....... . . . . . . . . . . . . . . . . . . . . . . . . . . . . . . ........ . . . . .. . . . . . . . . . . . . . . . 98
Figure 4. 14 Mean plasma GH concentrations of all heifers, grouped by challenge year and by sire, before and after an intravenous TRH injection at time zero . . . . ....... . . . . . . .. . . . . . . . . . . . . . . . . . . . . . . . . . . . ......................... 98
Figure 4. 1 5 Mean prolactin concentrations in the plasma of heifers, before and after an intravenous TRH injection at t ime zero . . . . . . . . . . . . . . . . . ......... . . . .. . . . . . ............ . . . . . . . . . . . . . . . . . . . .. . . ........ . . . . . . . ........... . . . . . . . . . . .. . . . . . . . . . . 99
Figure 4. 1 6 Linear regression between group means of the prolactin concentration in plasma samples taken 5 minutes after an intravenous TRH injection and the day length in minutes on the day each group was challenged . . . . . . . . . . . . . . . . .......... . . . . . .......... . . . . . . . . .. . . . . . . . . . .......... . . . .. . . ............ . . . . . ......... . . ........... 1 00
Figure 4. 1 7 Mean TSH concentrations in the plasma of heifers, before and after an intravenous TRH injection at time zero ...... . . . .. . . . . . . . . . .. . . . . . . . .. . . . . . . . . . ..... . . . . . . . . . . . . . .. . . . .. . . ....... . . . . . . ........... . . . ....................... 1 0 I
Figure 4.18 P lasma TSH concentrations of individual heifers before and after an intravenous TRH injection at time zero . . . . . . . . . .. . . . . . . . .. . . .. . . . . . . . . . . . . . . . . . . . . . . . . . . . .. . . . . . . . . . . . . . . . . . . . . .............. . . . . . . . . . . . . .. . .. . . .......... . 10 I
Figure 4. 1 9 Mean plasma TS H concentrat ions of all heifers, grouped by challenge year and by sire, before and after an intravenous TRH injection at t ime zero . . . ......... . . . . . . ............ . . . . . . . . . . . . .. . . . . . . . . . . . .. . ... . ....... 1 02
Figure 4.20 Mean plasma NE FA concentrations of heifers, before and after an intravenous TRH injection (�J Ilg TRHlkg Iwt) at time zero .. . . . . . . . . . .................................. ... . . . . ......... .. . . . . . ....... . . . . . . . . . . . . . . . . . ...... 1 03
Figure 4 .2 1 Mean plasma IGF- I concentrations of all hei fers, grouped by challenge year and by sire, before and after an intravenous TRH injection at time zero ..... . . . . . . . . .......... . . . . . ......... . . . . . . . .............. 1 03
Figure 4.22 Mean plasma N EFA, GH, TSH, and prolactin concentrations in response to an intravenous TRH injection at time zero, grouped by challenge group . . ............. . . . . . . . . . . . . . . . . . . . . . .. . . . . . . . . . . . . . ........... 1 04
Figure 5.1 Example of the output generated by QTLANA from a 'multimasher' scan ... . . ......... . .. . . . ...... 1 1 2
Figure 6. 1 Schematic representation of some of the metabol ic changes that occur in the periparturient dairy cow . . . . . . . . _ . . . . . . . . . . . . . . . . . . . . . ........... ................ . . . . . . . . . . . . . . . .. . . . . ............... . . . . . . . ................................... 1 30
Figure 6.2 Diagram showing the major routes of secretion across the mammary epithelial cell . . . ......... 1 63
Figure 6.3 A diagrammatic representation of the bovine V -ATPase . . . ...... ....... . . . . . .. . . . . . . . . . . . . ........ . . . . . .. . . .. . 1 67
Figure 7. 1 The diagram constructed in the literature review of this thesis and an i l lustration of a target gene network and a protein to protein interaction network .. . . .......... . . .... . . . . . .. . .......... . . . . .. . . . . . . . . . . . . . . . . . 1 94
Figure 7 .2 Enlarged images of the corresponding boxes on the network diagram presented in Figure 7. 1 ............ . . . . ............. . . . . . . . ........... . . . . . . . . .. . . . . . . . . . .... . . . .. . . . . .. . . . . . . . . . . . . . . ....... . . . . . ............... . . . .. . . . . . . .. . . . . . .. . .......... 1 95
XVI

List of Tables
Table 3 . 1 Number of animals per group and cohort, their age and live weight at the time they were challenged ...... . . . . . . . .. . . ................................ . . . . . ............................. . . . .. . . . . . . . . . . . . . . . .. . . . . ... ......................... 54
Table 3.2 Example schedule for one week during the challenge period ........................... . . ...... ................ 59
Table 3.3 Description of the types of errors identified in the data ............................................. . . . . . .......... 69
Table 4. 1 The significance of the effect of fixed and environmental parameters on insulin concentrations in dairy heifers, before and times after a intravenous infusion of glucose . . . . .... ................ . . . .. . .......... 9 1
Table 4.2 The significance of the effect of fixed parameters on insulin concentrations in dairy heifers, before and after an intravenous infusion of glucose . . . ............ . . ....... . . . . . .......... ........................ . . . . . . .. . 9 1
Table 5 . 1 Examples o f regions o f interest found using the metabolic and milk production QTL . . .......... 1 1 7
Table 6. 1 The predicted locations, level of significance, maximum F-value and 95% confidence intervals for the QTL locations in the region of interest on BTA 14 ........................ ............ ............ . ............. 1 26
Table 6.2 Genes that were investigated for relevance to QTL of interest between 47 and 5 1 cM on BTAI4 . . . . . . . . . . . . . . .............................................. . . . .................... . . .. . . . . . . . . . ................................. . . . . . . ................. 1 2 8
Table 9. 1 Significance levels of fixed effects on responses to a thyrotropin-releasing hormone chal lenge . . . . . . . . . . . . . . . . . . . . . . . . . . . . . . . . . . . . . . . . . . . . . . . . . . . . . . . . . . . . . . . . . . . . . . . . . . . . . . . . . . . . . . . . . . . . . . . . . . . . . . . . . . . . . . . . . . . . . . . . . . . . . . . . . . . . . . . . . . . . . . . . . . . . . . . . . 263
Table 9.2 Significance levels of fixed effects on responses to an adrenaline challenge ............ . . . . ........... 264
Table 9.3 Methods used to calculate metabolic phenotypes from adrenaline challenge response data .... 265
Table 9.4 Methods used to calculate metabolic phenotypes from glucose challenge response data ........ 267
Table 9.5 Methods used to calculate metabolic phenotypes from TRH chal lenge response data ............ 269
Table 9.6 The best predicted location for the metabolic and milk production QTL together with the level of significance, maximum F-value, and 95% confidence intervals of the QTL location . . . .. . . . ........ 272
Table 9.7 Explanation of the abbreviations used for milk production phenotypes and QTL ................... 289
Table 9.8 List of genes candidate genes generated for the region 47-5 1 cM on BT A 14 . . . . . . . . . . . . . . . . . . . . . . . . 290
Table 9.9 Pearson Correlation Coefficients between glucose challenge response and milk production phenotypes fol lowed by the probabil ity that R is di fferent from zero and the number of observations . . . . .. . . . . ......................... . . . . . . . . . . . . ... . . ............................... .. . . . ........................... . . . . . . . . . . . . . .. .. 300
Table 9. 1 0 Pearson Correlation Coefficients between glucose challenge response and milk production phenotypes, fol lowed by the probabil ity that R is di fferent from zero and the number of observations . . ............... ....... . . . . . . . . . . . . . . . . . . . ...................................... . ....................... .. . . . . . . ....... . . . . . . .. . . . 30 I
Table 9. 1 1 Pearson Correlation Coefficients between glucose challenge response and milk production phenotypes, fol lowed by the probabil ity that R is different from zero and the number of observations . ............................... ..... . . .. . .......... .. . . . . ...................................... . . . . . . . . . ........................... 302
Table 9. 1 2 Pearson Correlation Coefficients between glucose challenge response and milk production phenotypes, followed by the probabi l ity that R is di fferent from zero and the number of observations . ..... .. . . . ... . . ........................ .............. . ........................... . . . .. . . . . . . .. . . . . . ................................ 303
Table 9. 1 3 Pearson Correlation Coefficients between adrenaline challenge response and milk production phenotypes, fol lowed by the probabi l ity that R is different from zero and the number of observations . ........................................................................... . . . . . . . ...................................... . . . . . . ..... 304
Table 9. 1 4 Pearson Correlation Coefficients between adrenaline challenge response and milk production phenotypes, followed by the probability that R is different from zero and the number of observations . . . . . . . . . . . ...................................... .............. ................. ............. . . . .. . ....... . . . . . . . ................... 305
XVII
Table 9. 1 5 Pearson Correlation Coefficients between adrenaline challenge response and milk production phenotypes, followed by the probabi lity that R is different from zero and the number of observations . . . . . . . . . . . . . . . . . .. . . . . . . . . . . . . . . . . . . . . . . . . .. . . . . . . . . . . . . . . . . . . . . . . . ... . . .. . . . . . . . . . . .. . . . . . . . . . . . . . . . . . . . . . . . . . . . .. . . . . . . . . . . . . . . . . 306
Table 9. 1 6 Pearson Correlation Coefficients between adrenal ine challenge response and milk production phenotypes, followed by the probabi lity that R is different from zero and the number of observations . . . . . . . . . . . . . . . . . . . . . . . . . . . . . . . . . . . . . . . . . . . . . . . . . . . . . . . . . . . . . . . . . . . . . . . . . . . . . . . . . . . . . . . . . . . .. . . . . . . . . . . . . . . . . . . . . . . . . . . . . . . . . . . . . . .. 307
Table 9. 1 7 Pearson Correlation Coefficients between TRH challenge response and milk production phenotypes, followed by the probabi lity that R is different from zero and the number of observations . . . . .. . . . . . . . . . . . . . . . . . . . . . . . . . . . . . . . . . . .. . . . . . . . . . . . . . . .. . . . . . . . . . . . . . . . . . . .. . . . . . . . . . . . . . . . . . . . . . . . . . . . . . . . . . . . . . . . . . . . . . . . . . . . . . . 308
Table 9. 1 8 Pearson Correlation Coefficients between TRH challenge response and milk production phenotypes, fol lowed by the probabi lity that R is different from zero and the number of observations . .. . . . . . . . . . . . . . . . . . . . . . . .. . . .. . . . . . . . . . . . . . . . . . . . . . . . . . . . . . . . . . .. . . . . . . . . . . . . . . . . . . . .. . . . . . . . . . . . . . . . . . . . . . . . . . . . . . . . . . . . . . . . . . . . . . 309
Table 9. 1 9 Pearson Correlation Coefficients between TRH challenge response and milk production phenotypes, fol lowed by the probabi lity that R is different from zero and the number of observations . . . . . . .. . . .. . . . . . . . . . . . . . . . . . . . . . . . . . . . . . . . . . . . . . . . . . . . . . . . . .. . . . . . . . . . . . . . . . . . . . . . . . . . . . . . . . . . . . . . . . . . . . . . . . . . . . . . . . . . . . . . . . . . . . . . . 3 1 0
Table 9.20 Pearson Correlation Coefficients between TRH challenge response and milk production phenotypes, fol lowed by the probabil ity that R is different from zero and the number of observations . . . . . . . . . . . . . . . . . . . . . . . . . . . . . . . . . . . . . . . . . . . . . .. . .. . . . . . . . . . . . . . .. . . . . . . . . . . . . . . . . . . . . . . . . . . . . . . . . . .. . . . . . . . . . . . . . . . . . . . .. . . . . . . . . . . . 3 1 1
Table 9.2 1 Pearson Correlation Coefficients between TRH challenge response and milk production phenotypes, followed by the probabi lity that R is different from zero and the number of observations . . . . . . . . . . . . . . . . . . . . . . . . . . . . . . . . . . . .. . . . . . . . . . . . . . . . . . . . . . . . . . . . . . . . . . . . . . .. . . . . . . . . . . . . . . . .. . . .. . . . . . . . . . . . . . . . . . . . . . . . . . . . . . . . . . . . 3 1 2
Table 9.22 Pearson Correlation Coefficients between TRH challenge response and milk production phenotypes, followed by the probabi lity that R is different from zero and the number of observations . . . . . . . . . . . . . . . . . . . . . . . . . . . . . . . . . . . . . . . . . . . . . . . . . . . . . . . . . . . . . . . . . . . . . . . . . . . . . . . . .. . . . .. . . . . . . . . . . . . . . . . . . . . . . . . . . . . . . . . . . . . . . . . . . . . . 3 1 3
XVIll

ALS
ARF
ARC
ATP
AUC
BCS
BTA
BI
cAMP
CNS
COP
DM I
DNA
EB
ER
ERGIC
FAS
FFA
FJXB
GAP
GAPDH
GDP
GEF
GH
GHR
GHRH
G LUT
GM
GPCR
GTP
HBI
HGM
HPA
ICV
IGF- I
List of Abbreviations
Acid labile subunit
ADP-ribosyIation factor
Arcuate nucleus
Adenosine tripho phate
Area under the ( response) curve
Body condition score
80S taurus autosome
Breeding index
Cycl ic adenosine-3' ,5' -monophosphate
Central nervous system
Coat protein complex
Dry matter intake
Deoxyribonucleic acid
Energy balance
Endoplasmic reticulum
Endoplasmic reticulum-Golgi intermediate complex
Fatty acid synthetase
Free fatty acids
Friesian-Jersey crossbred
GTPase-activating protein
Glyceraldehyde 3-phosphate dehydrogenase
Guanosine dipho phate
Guanine nucleotide-exchange factor
Growth hormone
Growth hormone receptor
Growth hormone releasing homlone
Solute carrier family 2 ( faci l itated glucose transporter)
Genetic merit
7-membrane-spanning G-protein coupled receptor
Guanosine-S'-triphosphate
High breeding index
H igh genetic merit
Hypothalamo-pituitary-adrenal
Intracerebroventricular
Insulin-l ike growth factor I
XIX
IGFBP Insul in-l i ke growth factor binding protein
LBI Low breeding index
LIC Livestock I mprovement Corporation
LPL Lipoprotein l ipase
MAS Marker assisted selection
ME Metabolisable energy
MEC Mammary epithelial cell
N R Nuclear receptor
PC Pyruvate carboxylase
POMC Pro-opiomelanocortin
PVN Para ventricular nucleus
mRNA Messenger ribonucleic acid
NEFA Non-esterified fatty acids
NPY Neuropeptide Y
NZ New Zealand
QTL Quantitative trait loci/locus
rRNA Ribosomal ribonucleic acid
TIDA Tuberoinfundibular dopamine
TRH Thyrotropin-releasing hormone
TSH Thyroid stimulating hormone
UPP Ubiquitin-proteasome pathway
VFAs Volatile fatty acids
VMH Ventromedial nuclei
3-MH 3-methyl histidine
xx

CHAPTER 1
Introduction

Chapter 1
Lactation and female reproduction are the principal traits of economic importance to the dairy
industry. After many years of selective breeding there is no evidence to suggest that genetic
variation is reducing in traits under selection pressure in out-bred dairy cattle populations (Pryce
et al. 2007). Hence, there is st i l l considerable potential for future genetic improvement in traits
of economic importance. The focus of the research described in this thesis was to investigate
ways to improve the capture of this genetic potential and in turn increase the rate of genetic gain
in dairy cattle.
Genetic progress in milk production of dairy cattle is hampered because milk yield i s a sex
l imited trait, expressed only in the lactating cow. This is a particular l imitation for sire
selection, as the sire contributes hal f of the genes to the next generation, but genetic merit for
milk production cannot be measured directly. Progeny testing to evaluate the performance of
daughters is necessary to obtain accurate estimates of the bul ls ' genetic merit for traits such as
milk production. This a l lows the extensive use of genetically superior bulls via mating using
art ificial insemination. Al though progeny testing schemes currently are the best and most
accurate method of selecting bulls, they have the associated disadvantage of increasing the
generation interval and therefore slow the annual rate of genetic change. Genetic progress could
be increased considerably if the genetic merit of potential sires could be predicted directly early
in l i fe .
The onset of copious milk synthesis and secretion i s accompanied by changes in hormone
concentrations as well as t issue sensitivity and responsiveness to these hormones, which co
ordinate changes in physiology that partit ion nutrients towards milk production. Differences in
gene expression and/or a l lele variants underlie the metabol ic pathways involved in milk
production. Therefore, the rate-l imi ting steps that influence mjlk production wi l l be observable
in both sexes. Selection of animals using a physiological marker or a genetic marker (a segment
of DNA with an identifiable physical location on a chromosome, whose inheritance can be
fol lowed and is associated with a phenotype) for a mi lk production trait could improve the
2

Introduction
current rates of genetic gain through increased selection pressure in both dam and sire selection
as well selection of replacement heifers.
A metabol ic chal lenge broadly involves administration of an exogenous hormone or metaboli te
into the circulation fol lowed by collection of a series of blood samples over t ime to assess the
induction of hormone or metabolite release. Various challenges have been used in an attempt to
find rel iable physiological markers of merit for milk yield that could be measured in calves of
both sexes to identify those animals of superior genetic merit. Selection of cal ves rather than
adult animals would shorten the generation interval and accelerate the rate of genetic gain.
Differences in hormone or metabolite concentrations have been found among animals that
differed in genetic merit in some experiments, however, results among experiments were often
inconsistent. Very few studies have been reported in which animal selection was based on
physiological markers. Experiments that have been reported show that selection based on a
physiological marker does not improve the correlated production traits. Thus, attempts to
identify physiological markers that could be used to select high genetic merit animals of both
sexes, for mi lk production traits at an early age were not successful .
The work described in this thesis focuses on a number of parameters that de cri be the essential
features of hormone and substrate responses to exogenous hormone or metabolite challenges. I t
is anticipated that these responses w i l l be the most important aspects of metabolic pathways
involved in milk production. These parameters wil l be referred to as "metabol ic phenotypes"
and were used to search for QTL. Thus, the current study combined the previously used
chal lenge methodology with the more recent QTL mapping technology. The intention was to
discover QTL that are associated with genes underlying some of the important metabolic
pathways involved in milk production. The overall aim of this thesis was to explore the use of
metabolic phenotypes as a means of improving the rate of genetic gain in dairy cattle.
3

Chapter 1
The objectives of the work presented in this thesis were to:
I . Describe the current breeding schemes being used for genetic improvement in the dairy
industry and how the use of marker assisted selection through the identification of
quantitative trait loci could impact on the current rates of genetic improvement. Provide an
overview of the major metabol ic pathways involved in lactation in the dairy cow. Describe
the metabolic and hormonal challenges that have been used in previous research, how they
provide potential physiological indicators of milk production and discuss the reasons for
selecting the challenges used in the current work (Chapter 2) .
2 . Define the metabolic phenotypes for the variables measured in response to each challenge
and discuss the reason for selection of these phenotypes. Discuss the possible impact of
environmental variables and present the models used for adjusting the data (Chapter 4) .
3 . Define the process employed to map QTL using the metabolic phenotypes generated from
the endocrine and milk production phenotypes. Select a chromosomal region to investigate
and generate a l ist of candidate genes (Chapter 5 ) .
4 . Identify the process used to investigate each gene in the candidate gene l ist. Integrate the
information to conclude which i s most l ikely candidate gene and how it may be involved in
the genetic control mechanisms of the QTL (Chapter 6) .
5. Determine the implications of the findings of this thesis, the usefulness of metabolic
phenotypes for the detection of QTL for milk production the direction of future research
(Chapter 7) .
4
CHAPTER 2
Literature Review
Chapter 2
2.1 Introduction
The principal characteristics of economic importance to the dairy industry are lactation and
female reproduct ion (Garrick and Snel l 2005) . Despite many years of selection and breeding,
there is sti l l large variation in the abi l i ty of individual cows to produce milk . In a study of 3 1 7
cows over 3 lactations, more than 72% of the variabi l ity in energy-corrected mi lk yield was due
to between cow differences ( lngvartsen and Friggens 2005 ) . Without the creation of new
variation by mutation, response to selection can not continue indefinitely and a selection limit
wil l be reached when the genes segregating in the population are brought to fixation. A
selection l imit is reached in about 1 0 generations in selection experiments in inbred populations
( Falconer and M ackay 1 996). After many years of selective breeding, there is no evidence to
suggest that genetic variation is reducing in traits under selection pressure in out-bred dairy
cattle populations ( Pryce et al. 2007). Rates of genetic gain in domestic l ivestock species
expressed as percentages of the means, are mostly in the range from I to 2% per year (Falconer
and Mackay 1 996) . Hence, there is considerable potential for increasing the population mean
for traits of economic importance. This has led to the development of various breeding schemes
to exploit this potential, but these schemes have l imitations. The objective of this thesis was to
explore the use of metabolic phenotypes as a means of improving the rate of genetic gain in
dairy cattle in New Zealand.
2.2 Breeding schemes
Genetic progress in mi lk production of dairy cattle is l imited because milk yield i s a sex-limited
trait, expressed only in the lactating cow (Sejrsen and L0vendahl 1 986, Sinnett-Smith et af.
1 987) . This is a particular l imitation for sire selection, as the sire contributes half of the genes
to the next generation, but genetic merit for milk production cannot be measured directly
(Garrick et at. 1 993, Sejrsen and L0vendahl 1 986).
In the New Zealand dairy industry replacement sires are generated using arti ficial insemination
to mate the highest ranking sires with the elite females that remain in the ownership of
6
Literature Review
individual farmers (Garrick and Snell 2005) . These are the si re-to-breed sire (SS ) and dam-to
breed sire (DS) pathways ( Figure 2 . 1 ) . The estimated genetic merit of the resulting male
offspring is the average merit of their parents, however, some bulls will have inherited a sample
of genes from their parents that eonfer above average genetic merit, as a result of Mendel ian
Sampling, while others wi l l have inherited a below average sample. Therefore, progeny testing
to evaluate the performance of their daughters is necessary to obtain a reliable assessment of
each bul l ' s genetic merit (Garrick and SneIl 2005). While this strategy provides an accurate
prediction of the young bul l ' s genetic merit, it results in a long generation interval which in turn
reduces the rate of genetic gain. Th is l imitation could be overcome and genetic progress
increased considerably if the genetic merit of potential sires could be predicted directly in the
bull itself early in l i fe ( Sejrsen et at. 1 984). Furthermore, the genetic merit of replacement
heifers, the dam-to-breed dam (DD) and sire-to-breed dam (SD) pathways ( Figure 2 . 1 ), is not
accurately reflected by their production records as mature cows (Garrick and Snell 2005 ).
There is potential to enhance the accuracy of the cow genetic merit estimates.
The introduction of herd testing and progeny testing, along with advances in semen technology
have a l l had a major impact on the improvement in rates of genetic gain that have occurred in
the past 50-60 years (Baker et at. 1 990, Davis 2005) . Significant improvements in the rate of
genetic gain, under current breeding schemes, wi l l only result if there are major changes in the
structure of the industry, technology or economics (Garrick and Snell 2005). Thus, a new
technology could be included in the selection programme if the economic benefit from
increased genetic gain outweighed the cost of the new technology.
7
Chapter 2
20 bulls/yr selected as a result of daughter
performance in progeny
test herds
(DD)
300 bulls/year
Sire Proving Scheme
Progeny testing herds - different environments throughout NZ 75-100 heifers tested per bull
Proven Sires I--__ (S
_S_
)_-+I Bulls for sire proving
L-___ ,-___ -' scheme
(SO)
Used to breed with commercial cows to improve genetic merit of commercial herd
Replacement Heifers
Commercial Herd
(OS)
Nucleus sector
Possible bull mothers
Herd test data, live weight, longevity, TOP etc are used to select cows to be potential bull mothers
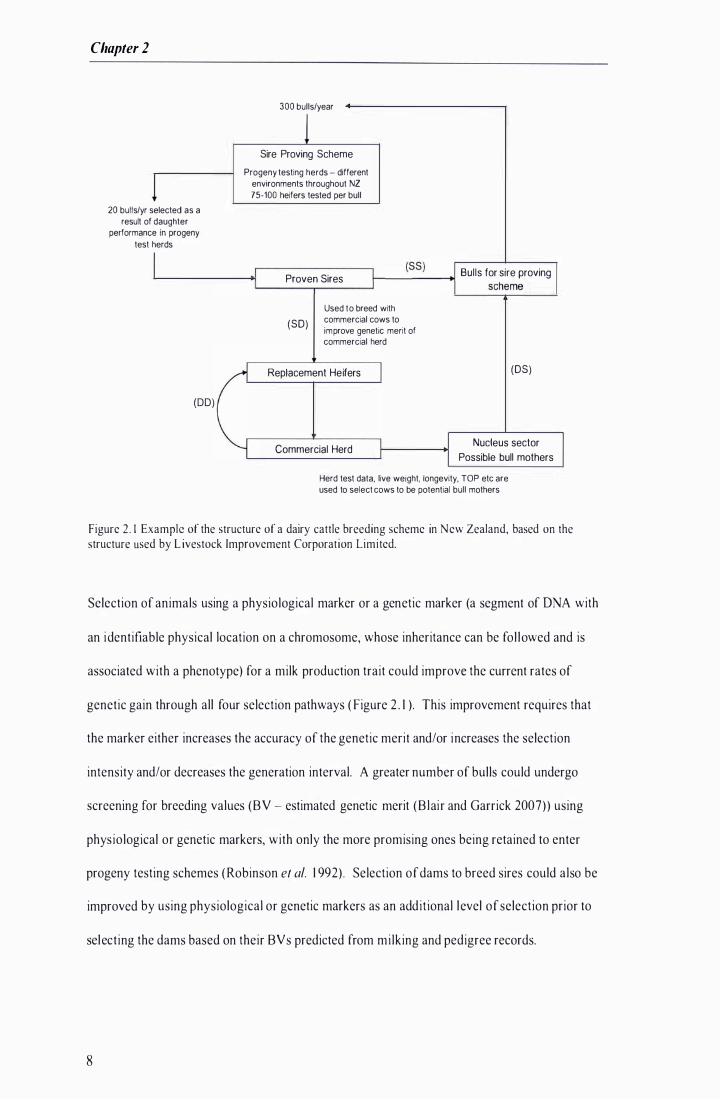
Figure 2 . 1 Example of the structure of a dairy cattle breeding scheme in New Zealand, based on the structure used by L ivestock Improvement Corporation Limited.
Selection of animals using a physiological marker or a genetic marker (a segment of DNA with
an identifiable physical location on a chromosome, whose inheritance can be fol lowed and is
associated with a phenotype) for a milk production trait could improve the current rates of
genetic gain through all four selection pathways ( Figure 2 . 1 ). This improvement requires that
the marker either increases the accuracy of the genetic merit and/or increases the selection
intensity and/or decreases the generation interval. A greater number of bulls could undergo
screening for breeding values (BV - estimated genetic merit (B lair and Garrick 2007)) using
physiological or genetic markers, with only the more promising ones being retained to enter
progeny testing schemes (Robinson et at. 1 992) . Selection of dams to breed sires could also be
improved by using physiological or genetic markers as an additional level of selection prior to
selecting the dams based on their BVs predicted from milking and pedigree records.
8
Literature Review
2.3 Quantitative Trait Loci and Marker Assisted Selection
A quantitative trait locus (QTL) is defined as a chromosomal region with a Mendelian
transmission pattern and with an effect on the trait of interest (Boichard et al. 2003 , Schrooten
et al. 2005) . The major objective of QTL studies is to ident i fy l inkage between genetic markers
and speci fic QTL that can be used in breeding programs through marker assisted selection
(M AS) ( Khatkar et at. 2004, Schrooten et at. 2005 ). If genetic markers control a significant
proportion of the genetic variation in a specific quantitative trait this may enable more precise
prediction of an animal 's BY than collecting phenotypic information or may be added to the
phenotypic information ( Khatkar et at. 2004, Stam 1 986) .
The potential of MAS to increase the rate of genetic gain is dependent on QTL size and
frequency in the bull population (Spelman and Garrick 1 997, Stam 1 986) . Marker assisted
selection could be particularly valuable in dairy cattle because most traits of interest are sex
l imited, the generation interval is long ( the widespread use of a progeny test bull occurs when
accurate estimates of BY are avai lable by which t ime the bull is 5 years and 2 months of age
(Spelman and Garrick 1 997)) , and progeny testing is costly (Druet et al. 2006). Effective MAS
would enable screening and pre-selection of a larger number of young candidate bull calves
increasing the selection intensity of bulls entering the progeny testing scheme or MAS could be
used in a two stage selection process where pedigree records, MAS and progeny testing could
all be used to increase accuracy, thus increasing genetic gain (Khatkar et af. 2004, Mackinnon
and Georges 1 998) .
Despite their potential, there are no published examples of QTL selection improving national
rates of genetic gain and out-competing traditional selection approaches in dairy cattle (Garrick
and Snell 2005) . Marker al leles surrounding a favourable QTL allele may be in a different
al ignment to the marker alleles that surround the favourable allele in another fami ly. This
makes within-fami ly studies necessary to identify the favourable marker al leles surrounding a
known QTL. An exception being, when the markers are in l inkage disequi l ibrium, which occurs
9

Chapter 2
when the QTL al lele is a recent occurrence in the population so the same marker a l leles may be
useable across famil ies (Garrick and Sne l l 2005, Liu and Dekkers 1 998, Mackinnon and
Georges 1 998) . The second reason that QTL selection has not been shown to improve rates of
genetic over and above traditional selection approaches is that currently, known QTL only
influence a smal l proportion, less than 1 5%, of the genetic variation associated with the
production trait (Cowan et af. 1 990, Garrick and Snell 2005, Spelman et af. 1 999), thus do not
provide greater accuracy than the currently used progeny testing schemes.
Genetic variation wil l involve a smal l number of major genes, a larger number of genes with
moderate effects, and a very large number of genes with minor effects ( Liu and Dekkers 1 998) .
The infinitesimal genetic model , which assumes a large number of genes each contributing a
small fraction of the total genetic variation in a trait (polygenes), forms the basis of quantitative
genetic theory and is used to generate breeding values used in animal selection schemes.
(Garrick and Snel l 2005, Liu and Dekkers 1 998) . However, major genes (genetic variation due
to segregation of a l leles at a single locus) have been reported in a number of species such as the
Booroola fecundity gene in merino sheep (Davis and Kelly 1 983 ) and the ob ( Ieptin) gene which
is a recessive single-gene obesity mutation in mice (Houseknecht et af. 1 998) . Major genes
contributing very large effects may already be fixed in el ite populations, although variabi l ity
might be detectable between breeds selected for di fferent production traits (Cowan et af. 1 990).
[f genes contributing very large effects are not fixed or at h igh frequency, caution is needed as
they may have deleterious pleiotropic effects or be tightly l inked to other genes with detrimental
effects (Spelman and Garrick 1 997 ). For example, a major gene for milk and fat yield was
found to be tightly l inked to a recessive lethal genetic disorder (bovine progressive degenerative
myeloencephalopathy) in Brown Swiss (Hoeschele 1 990).
Only a few genetic markers or genes that regulate mi lk production have been identified to date
( Davis 2005 ), which is a major factor l imiting widespread use of DNA tests (e.g. microsatelites
or single nucleotide polymorphisms ( SNPs) ( B lair and Garrick 2007) ) in genetic evaluation
schemes. However, research over the past two decades has identified many bovine
1 0
Literatllre Review
chromosomal regions that are associated with variation in milk production, composition and
other traits in dairy cattle (Davis 2005) and can be viewed in integrated databases of bovine
QTL such as that described by Polineni et 01. ( 2006) accessed at http://bovinegtl . tamu.edu. A
large scale project involving the col lection of milk production and physiological phenotypic
data wi l l l ikely lead to the discovery of novel QTL, and possibly genes, that would contribute to
the current knowledge of the bovine genome and make the use of genetic markers in genetic
evaluation schemes possible. Once QTL have been discovered, and candidate genes identified
using bioinformatics too ls, biochemical function can then be investigated and this information
used to look for the gene responsible for the QTL. In addition to being useful for selection
schemes, identification of single al leles l inked to differences in performance could yield insights
into the biochemical control of lactation (Cowan et 01. 1 990).
Metabo lic pathways involved in mi lk production and the control of these pathways wi l l be
discussed in the remainder of this review of l i terature. Differences in gene expression and/or
allele variants wil l underl ie these pathways, and their rate-limiting steps, and wi l l influence milk
production. The fol lowing sections contain a review of the current scope and depth of
understanding of the important metabol ic pathways of nutrient partitioning particularly during
lactation. The discussion in the fol lowing sections focuses on metabolic pathways in lactating
ruminants, however, the experiments conducted for the current study assessed traits in young
non-lactating animals. The objective of the fol lowing sections is to develop the theoretical
framework for a systematic search for QTL, which is first step in identifying genetic markers or
the actual genes for traits of interest.
2.4 The Major Metabolic Pathways in the Lactating Dairy Cow
Lactation greatly increases nutrient requirements of the dairy cow (Yemon 1 989) . At peak
lactation, the energy requirements for milk synthesis can be up to 80% of a cow's net energy
intake (Coll ier 1 985) . Genetic selection programmes based solely on increased mi lk production
have resulted in cows that are genetically predisposed to a greater degree of negative energy
I I

Chapter 2
balance (NEB) in early lactation. The NEB occurs because increased dry matter intake only
accounts for about half of the milk yield response to selection (Yeerkamp 1 998, Yeerkamp and
Koenen 1 999) . Thus, high producing dairy cows go into negative energy balance after calving,
because dietary supply of nutrients is insufficient to meet the nutrient requirements for milk
synthesis and maintenance (Bel l 1 995, de Yries and Yeerkamp 2000, Yan den Top et al. 2005 ) .
Th is necessitates substantial mobil isation of body reserves to support mi lk production (Yemon
1 998, Yemon and Pond 1 997), which is in part faci l i tated by altered concentrations of metabolic
regulatory hormones such as insul in and GH ( Bonczek et al. 1 988, Sartin et at. 1 988) . I t has
been reported that for the first third of lactation, concentrate fed cows were in negative energy
balance and used body energy reserves to meet their nutrient requirements (Bauman and Currie
1 980) . Use of I3C as a marker revealed that 43-54% of the C in milk fat in early lactation,
forage fed, cows was from body reserves (Wi lson et al. 1 988) .
A change in physiological state alters the serum concentrations of chronically-acting hormones
that have tissue specific effects on both the amounts and activity of metabol ic enzymes
( influencing hormonal sensitivity and responsiveness) and also the proteins which regulate them
( Rhoads et at. 2004, Yemon 1 998) . These effects of chronically-acting hormones are through,
both, changes in gene expression and changes in intracellular signal l ing systems, thus elicit
homeorhetic adaptations (Yemon 1 998) . The metabolic adaptations that occur during
lactogenesis are homeorhetic mechanisms that enable the animal to upply the substantial
demands of the mammary gland by uti l ising body reserves of l ipid, protein and minerals whi le
maintaining metabolic and physiological equil ibrium (Col lier 1 985) .
Nutrient partitioning is controlled by a complex and integrated system invo lving most if not al l
tissucs in thc body ( Figure 2.2) . There are many control points or rate-l imiting steps in
numerous metabolic pathways that may be involved in causing variation between animals.
1 2
Literature Review
GI TRACT r I feed and water intake
1 energy balance . . 1 absorpllve capacity
PANCREAS
HYPOTHALAMUS ..
\ Leptin
hypertrophy
TAG
1 responsiveness to insul inotropic agents
J insulin release
J insulin:glucagon
LIVER
I gluconeogenesis - I uptake and use of Ms, lactate and glycerol
1 GHR - IGF-I
J I ns responsiveness
J glucose uptake
fatty acid oxidation
I ketogenesis VFAs
AAs
I I _ - - - � I lipoprotein synthesis ; J protein synthesis
HEART
1 cardiac output
1 Ins responiveness
I Glu and actetate use
I NEFA use
protein synthesis
I proteolysis
GLUT4
IGF-I
NEFA
Leptin 4
I ADIPOSE TISSUE
J Ins responsiveness
- 1 Glu and acetate use
1 leptin secretion
1 FAS, LPL & ACAC activity
l IGFBP-3 & ALS I
I I
Lipoprotein , IGF-I
Glycerol
I uptake of preformed fatty acids
lipogenesis
I responsiveness to catecholamines
I HSL activity
I lipolysis J esterification
I GLUT1
BONE
Calcium
mobilisation I requirements for Glu, Ms, TAGs and minerals
I synthesis of milk constituents�
MILK
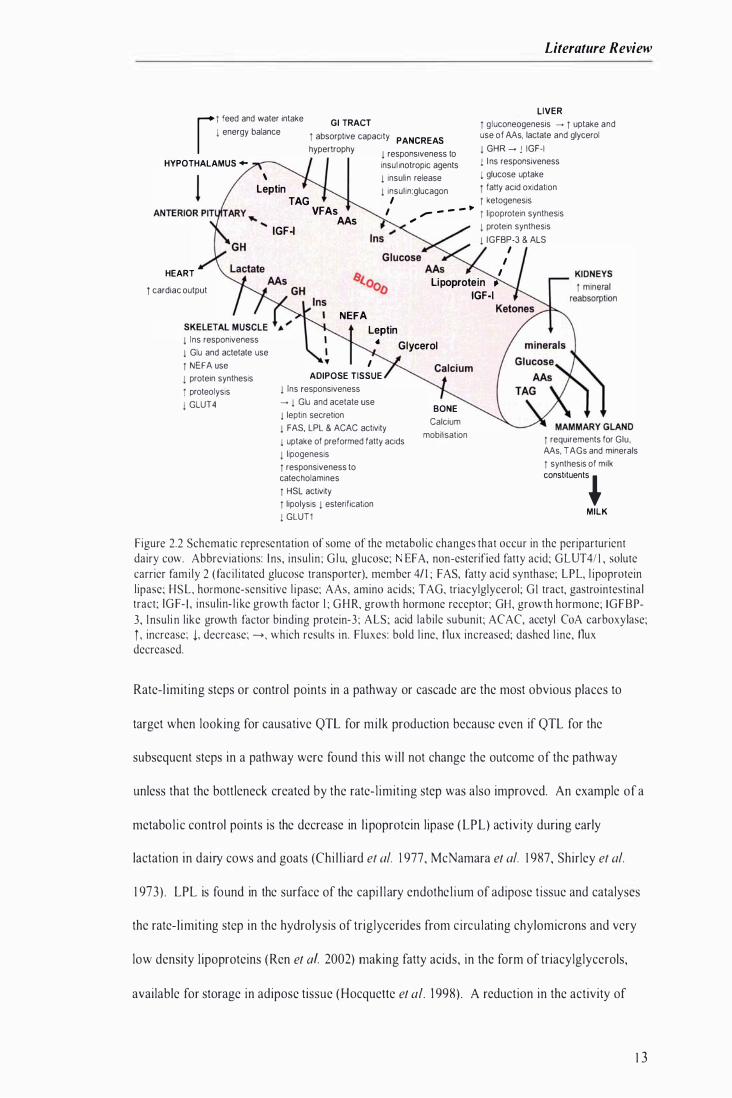
Figure 2.2 Schematic representation of some of the metabolic changes that occur in the periparturient dairy cow. Abbreviations: Ins, insulin; G lu, glucose; EFA, non-esterified fatty acid; GLUT41 I , solute carrier family 2 (facil itated glucose transporter), member 4/ 1 ; FAS, fatty acid synthase; LPL, l ipoprotein lipase; HSL, hormone-sensitive l ipase; AAs, amino acids; TAG, triacylglycerol; GI tract, gastrointestinal tract; IGF- I , insulin- l ike growth factor I ; GHR, growth hormone receptor; GH, growth hormone; IGFBP-
3, I nsulin like growth factor binding protein-3; ALS; acid labile subunit; ACAC, acetyl CoA carboxylase; t , increase; !, decrease; ->, which results in. Fluxes: bold line, flux increased; dashed l ine, flux decreased.
Rate-l imiting steps or control points in a pathway or cascade are the most obvious places to
target when looking for causative QTL for mi lk production because even if QTL for the
subsequent steps in a pathway were found this wi l l not change the outcome of the pathway
unless that the bottleneck created by the rate-l imiting step was also improved. An example of a
metabol ic control points is the decrease in l ipoprotein lipase ( LPL) activity during early
lactation in dairy cows and goats (Chi l l iard et 01. 1 977, McNamara et 01. 1 987, Shirley et al.
1 973) , LPL is found in the surface of the capi l lary endothel ium of adipose tissue and catalyses
the rate-l imiting step in the hydrolysis of triglycerides from circulating chylomicrons and very
low density Iipoproteins (Ren et of. 2002) making fatty acids, in the form of triacylglycerols,
available for storage in adipose tissue (Hocquette et al. 1 998) . A reduction in the activity of
1 3
Chapter 2
LPL during early lactation causes a reduction in the uptake and storage of fatty acids by adipose
t issue making this energy source available to other tissues to support lactation. The activities of
a number of other key enzymes are also altered in adipose tissue with the onset of lactation and
wi l l be discussed in a subsequent section of this review.
A second example is the dramatic increase in the number of p-adrenergic receptors per
adipocyte that occurs during the periparturient period (Jaster and Wegner 1 98 1 ) . Increased p
adrenergic receptor number coincident with l actation is a mechanism that increases the release
of free fatty acids and glycerol from adipose tissue (Jaster and Wegner 1 98 1 ) . Dairy cows differ
in the extent to which they mobi l i se body fat reserves (Bryant and Trigg 1 98 1 , Davey et af.
1 983 ), it is possible that variation might exist between cows in the control mechan isms
involving catecholamines and their receptors on adipose tissue ( Bauman et al. 1 985) .
It is important to understand the control of nutrient partitioning during lactation, particularly the
rate-l imiting points of control . I f these rate- l imiting points are differential ly regulated by
genetic variants ( al leles) they would be ideal targets when conducting QTL searches. In the
fol lowing sections the partitioning of nutrients during lactation, summarised in Figure 2 .2 , wi l l
be discussed.
2.5 Carbohydrate Metabolism in the Ruminant
S imple-stomached species digest dietary carbohydrates to glucose and other simple sugars,
which are then ab orbed into the portal blood to act as a source of glucose for body metabol ism.
In contrast, ruminants have evolved an alimentary tract that harbour micro-organisms capable of
digesting structural carbohydrates, such as cel lulose, that constitute plant fibre ( Faichney 1 993) .
Most of the dietary carbohydrates undergo microbial fermentation in the reticulo-rumen to
produce volati le fatty acids, the most important of which are acetate, propionate and butyrate
(Bergman et al. 1 974, Brockman 1 993) . As a result, ruminants only absorb smal l amounts of
dietary glucose (Danfrer et af. 1 995), therefore, they must rely almost entirely on
1 4

Literature Review
gluconeogenesis in the l iver and to a lesser extent in the kidney to supply their glucose
requirements (Bel l and Bauman 1 997) .
Hepatic output of glucose normally accounts for 80-90% of glucose-entry rate and whi le renal
production of glucose accounts for 5- 1 0% of the whole body glucose turnover (Bergman et af.
1 974) it may increase to 1 5% during lactation (Brockman 1 993) . Other adaptations to
intermediary metabolism that have occurred in ruminants due to low dietary glucose absorption
are l imited use of glucose for oxidation and the use of acetate in place of glucose for fatty acid
synthesis (Danfcer et af. 1 995) . The tissues of ruminants are less responsive to insulin than
those of simple-stomached species. It is thought, this is due to the pattern of feeding and the
continual fermentation in the rumen, both of which minimise surges in nutrients, particularly
glucose, entering the portal vein, decreasing the need for insulin to act rapidly to divert nutrients
to storage as glycogen and fat (Vernon and Sasaki 1 99 1 ) . Although l itt le glucose is absorbed
from the al imentary tract in ruminants, it st i l l has a central role in their metabolism as in al l
mammalian species.
2.6 Carbohydrate metabolism in the lactating ruminant
Glucose uptake and utilisation
Lactation greatly increases the glucose requirement of ruminants, for example, basal util isation
rate is approximately 3 times higher in lactating than in dry goats (Debras et af. 1 989).
Moreover, mammary uptake can account for 50-80% of whole body glucose uti l isation
(Annison 1 983, Knight et af. 1 994) because it is a vital substrate for mammary metabolism and
mi lk synthesis (Bel l and Bauman 1 997, Coll ier 1 985, Zhao et af. 2004). Up to 67% of the total
irreversible loss rate of glucose in dairy cows is used for lactose synthesis (Bauman et at. 1 988) .
Lactose, which is unique to mi lk , is a disaccharide of glucose and galactose (Col l ier 1 985) .
Because i t draws water osmotical ly into the milk, the rate of lactose synthesis and secretion
largely determines mi lk yield (Danfcer et al. 1 995, Zhao et at. 1 996) . The final step in the
1 5
Chapter 2
synthesis of lactose is the formation of lactose from free glucose and UDP-galactose. While
most of the latter is derived from glucose i t may also be derived by gluconeogenesis from
glycerol and gluconeogenic amino acids (Col lier 1 985) . However, ruminant mammary tissue
does not have the necessary enzymes for synthesising free glucose, so i t is absolutely rel iant on
the uptake of blood glucose for the glucose moiety (Kn ight et at. 1 994). Glucose uptake into
the mammary gland i s considered to be a rate-l imiting step for milk production (Zhao et at.
2004) thus, a high rate of glucose supply to the mammary gland is a necessity for high milk
yields.
Intensive selection for high milk production in dairy breeds has changed metabolism compared
to beef breeds ( Pareek et at. 2007, Shingu et af. 2002) . Mammary parenchymal tissue mass, the
proportion of mammary epithelial cells differentiated to an active secretory state cows and the
and the activity per cell found to greater in dairy than in beef cows (Akers et at. 2006, Keys et
al. ( 989) . In comparative studies, particularly in early lactation, milk production and dry matter
intake (DMI) were higher in dairy than in beef cows, a greater proportion of metabol i sable
energy (ME) intake was partitioned into milk and less into body tissue in dairy cows while body
condition score ( BCS) and energy and nitrogen balances were higher in beef cows ( Pareek et at.
2007, Yan et al. 2006). Baseline insul in and glucose concentrations and insuli n concentrations
in response to a glucose chal lenge were higher in beef that dairy cows ( Pareek et af. 2007,
Shingu et at. 2002). When nutrient partitioning was compared in dairy and beef cows fed at two
different feeding levels, a higher proportion (66% vs 37%) of the addit ional ME intake with the
h igh concentrate diet compared with the low concentrate diet was partitioned to mi lk energy in
dairy compared with beef cows, particularly in early lactation (Yan et af. 2006). The onset of
lactation is associated with a large glucose demand in dairy cows resulting in decreased
pancreatic insul in secretion, whereas the h igher insulin secretion in beef cows would support
greater protein accretion ( Pareek et af. 2007) . Thus, the exceptional demand for glucose
experienced during lactation in the high genetic merit dairy cow is not a l imitation in lower
1 6
Literature Review
producing animals and there have been changes in metabol ism relating to the differing selection
objectives as a result.
The increase in glucose demand during lactation is met by a number of changes in carbohydrate
metabolism (Figure 2 .2 ) . The rate of gluconeogenesis increases in the l iver with the onset of
lactation (Bauman 2000, Vernon et at. 1 984). Reduced glucose use by peripheral t issues has
been indicated by a marked reduction in whole-body glucose oxidation in newly parturient dairy
cows (Bennink et af. 1 972), and is l i kely to be mediated by very low plasma insulin
concentrations and decreased sensit ivity of tissues to insulin ( Holtenius et at. 2003 , Lomax et at.
1 979, Vernon et al. 1 990). Thus, carbohydrate metabolism and its control play a critical role in
milk production.
Circulating insulin concentrations
Despite ruminant tissues being less responsive to insulin than the equivalent tissues in
monogastrics, insulin is still the dominant anabolic hormone and regulator of the energy
metabol ism in resting ruminants (Brockman 1 986) . Insul in stimulates the uptake and util isation
of glucose and acetate by peripheral tissues, i nhibits gluconeogenesis and glucose release from
the l iver and stimulates l ipogenesis ( Bassett 1 974). In early lactation dairy cows, the
concentration of plasma insul in at baseline or in response to insulinotropic agents is much lower
than in pregnant or dry cows and remains low for many weeks post partum (Accorsi et af. 2005,
Gulay et al. 2004, Holtenius et af. 2003, Komatsu et af. 2005, Lomax et af. 1 979, Lukes et af.
1 989, Rhoads et at. 2004). The fal l in insul in concentration during lactation has been attributed
to negative energy balance, and loss of pancreatic responsiveness to insul inotropic agents, such
as glucose and propionate, and possibly increased insul in clearance rates ( Debras et at. 1 989,
Faulkner and Pol lock 1 990a, Faulkner and Mart in 1 999, Hart et af. 1 980, Holtenius et al. 2003,
Hubinont et al. 1 986, Lomax et al. 1 979, Moussavi et al. 2007). The calculated secretion rate of
insul in was more than twice as high in low- compared with high-yielding cows (Hart et al.
1 980).
1 7
Chapter 2
High genetic merit cows have lower (P<0.05) p lasma insul in concentrations, during lactation,
than cows of average genetic merit (Knight et af. 2004) and there is a negative relationship
between circulating insul in concentrations and milk yield (Walsh et af. 1 980). Administration
of insulin suppresses milk yields in cattle unless exogenous glucose is suppl ied (Beck and
Tucker 1 978) . The proportion of basal glucose uptake that was mediated by insulin in mid
lactation dairy cows was approximately 7% (Rose et at. 1 997) . This smal l value was due to the
large non-insul in mediated requirement of the mammary gland. When insul in was increased 6-
fold above basal concentrations, i nsulin mediated glucose uptake increased to 38 .5% and
hepatic glucose production was decreased (Rose et at. 1 997) . Experiments using 4 day
hyperinsulinemic-euglycemic clamps in early lactation, in which insul in concentrations were
increased 7-fold compared to the pre-c1amp period or controls, caused a decrease in plasma
NEF A, P-hydroxybutyrate, urea ni trogen, true protein and growth hormone concentrations and
increased plasma IGF-I concentrat ions (Butler et af. 2003, Mashek et af. 200 I ) . As lactation
progresses, milk yield decl ines and energy balance becomes positive, p lasma insulin
concentrations gradually increase ( Lukes et at. 1 989, Mashek et at. 200 1 , Shingu et af. 2002) .
Taken together, these experiments i l lustrate the importance of low insulin concentrations on
mediating changes in energy metabolism during lactation, particularly early lactation.
Changes in insulin responsiveness and glucose use in peripheral tissues
The abi l i ty of insulin to maximally stimulate glucose util i sation above basal concentrations was
greatly impaired in early lactation goats when compared with the dry period (Debras et af.
\ 989) . However, when assessed using circulating plasma insul in concentrations, lactating sheep
showed a more sensitive (P<O.O I ) response to insulin, with respect to glucose uti l isation, than
non-lactating sheep ( Faulkner and Pollock 1 990a). But, overall endogenous glucose production
was not suppressed by insulin to the same extent in lactating as in non-lactating sheep, glucose
production was 54% of basal production in lactating sheep and 23% of basal in non-lactating
sheep ( Faulkner and Pol lock 1 990a). I nsulin resistance, both in vivo and in vitro, was apparent
in adipose tissue (Guesnet et af. 1 99 1 , Yemon and Finley 1 988, Yemon and Taylor 1 988) and
1 8

Literature Review
skeletal musc le (Yemon et af. 1990) of lactating ruminants. That is, the sensitivity and
responsiveness to insulin were reduced in the peripheral tissues of lactating compared with non
lactating sheep (Yemon et af. 1990) .
Insulin resistance during lactation does not appear to be the result of a decrease in the number of
insulin receptors or impaired binding affinity of insulin receptors in skeletal musc le or adipose
tissue ( Balage et al. 1992, Guesnet et al. 1991, Metcalf et al. 1986, 1991, Yemon and Taylor
1988, Yemon et af. 1981 , Wilson et al. 1996). Insulin binding was increased in pregnancy and
remained elevated during lactation in isolated hepatocytes from cows and sheep (Gill and Hart
1980, 1984) . Therefore, the ability of these tissues to bind insulin appears to be unimpaired by
lactation, suggesting that adaptations lie downstream of receptor binding (Wilson et af. 1996).
Glucose transport across plasma membranes is mediated by members of the facilitative glucose
transporter family ( solute carriers SLC2A, protein symbol GLUT). GLUTs mediate a
bidirectional and energy-independent process of glucose transport in most tissues (Zhao et al.
2004). GLUT I is the most abundantly distributed glucose transporter and mediates basal
cellular glucose uptake (Abe et al. 2001 ). The other GLUTs are distributed less widely, GLUT2
to 5 are only present in certain tissues ( Zhao et af. 1993). GLUT4 is the major insulin
responsive glucose transporter and is most abundant in skeletal muscle ( Abe et al. 200 I , Zhao et
al. 1993).
Glucose transporters have been reported to change in peripheral tissues in response to lactation
( Komatsu et af. 2005, Zhao et af. 1996). GLUTI mRNA concentrations in adipose tissue of late
or non-lactating cows were six times greater ( P<0.05) than those in cows at peak-lactation
( Komatsu et al. 2005). The abundance of GLUT4 mRNA in adipose tissue was not altered by
lactation ( Komatsu et al. 2005). Administration of bovine growth hormone from day 118 to day
181 post-partum decreased (P < 0.03) GLUT4 m RNA by 44% in skeletal muscle (Zhao et al.
1996). This experiment appears to mimic the increase in the concentration of circulating G H
that occurs i n dairy cows during early lactation ( Bell e t al. 2000, Rhoads et af. 2004). The
19
Chapter 2
results of this study may indicate that one action of increased GH during early lactation is to
reduce GLUT4 mRNA, thus reducing glucose utilisation in skeletal muscle. However, another
experiment did not find changes in abundance of GLUT4 mRNA in skeletal muscle during
lactation ( Komatsu et at. 2005). Changes in GLUT! and 4 in adipose tissue and skeletal
muscle, respectively, are likely to assist in reducing glucose uptake by these tissues thus making
more glucose available to the mammary gland.
Activities of enzymes that utilise glucose are decreased in muscle and adipose tissue during
lactation. The activities of the glycolytic enzymes phosphofructokinase and pyruvate kinase
decreased in skeletal muscle of lactating compared with non-lactating sheep (Vemon et at.
1984, Vemon et at. 1987), and could account for the decrease in glucose utilisation in the hind
limb during lactation ( Pethick and Lindsay 1982, Vemon et at. 1990). Pyruvate dehydrogenase
activity was also decreased in muscle, due to a fal l in the proportion of the enzyme in the active
state which is probably the major reason for the increased proportion of glucose-derived carbon
released as lactate by the hind-limb during lactation (Vemon et at. 1984). Hexokinase and
glucose-6-phosphate dehydrogenase activities per mil l igram of protein increased in the skeletal
muscle of lactating comparcd with non-lactating animals ( Vemon et at. 1 987). Activities of
glycerol-3-phosphate dehydrogenase, glucose-6-phosphate dehydrogenase, fatty acid
synthetase, 6-phosphogluconate dehydrogenase and acetyl coA carboxylase were decreased in
the adipose tissue of lactating ruminants, thus aiding a reduction in glucose utilisation by the
adipose tissue (Chilliard et at. 1991 b, Travers et at. 1997, Vemon et at. 1991).
Studies in humans have shown that elevated concentrations of non-esterified fatty acids (NEFA)
markedly decreased insulin-stimulated glucose uptake in skeletal muscle ( Krebs and Roden
2005). Onset of lactation causes a dramatic increase in p lasma NEF A concentrations in high
producing dairy ruminants ( Murondoti et at. 2004, Sidhu and Emery 1973). This increase in
NEF A concentrations may prevent glucose uptake by skeletal muscle in ruminants as it does in
humans.
20
Literature Review
Changes in the activities of a number of enzymes, in abundance of GLUT I and 4 mRNA and
adaptations downstream of insul in receptors in both skeletal muscle and adipose tissue ( Figure
2 .2) , contribute to the co-ordinated reduction in glucose and acetate use and increasing the
availabi l i ty of nutrient sources for milk synthesis. However, although these changes are
important for repartitioning of nutrients during lactation they can not be assessed using
metabol ic challenges.
The role of growth hormone in insulin resistance
Plasma GH concentration increases with the onset of lactation ( Bel l et af. 2000, lngvartsen and
Andersen 2000, Rhoads et al. 2004) . Glucose uptake in response to elevated p lasma insulin
concentrations was inhibited during GH treatment of lactating dairy cows compared with
controls (Rose et af. 1 998, Sechen et al. 1 990). Treatment with exogenous GH caused a
reduction in glucose uptake by the hindl imb muscle in lactating, mult iparous dairy cows
(McDowell et al. 1 987) . In vitro studies have shown that treatment of adipose tissue cultures,
taken from lactating sheep, with i nsulin caused a marked increase in fatty acid synthesis from
24 h of culture onwards but addition of GH to the culture medium inhibited the insulin i nduced
increase in fatty acid synthesis ( Borland et af. 1 994, Yemon 1 982, Yemon and Finley 1 988) .
Consequently, in ruminants GH is thought to be antagonistic to the action of insulin, preventing
glucose uptake in insul in sensitive tissues, and directing glucose to mammary tissues, which are
insensitive to insul in ( Rose et al. 1 996) .
The role of glucagon
Glucagon has l i ttle effect on the peripheral tissues of ruminants (Brockman and Laarveld 1 986,
She et al. 1 999b) . The rate of gluconeogenesis is stimulated by glucagon and inhibited by
insul in (Danfrer et af. 1 995, Drackley et al. 200 I ). Glucagon stimulated conversion of
propionate to glucose in cultured hepatocytes from calves (Donkin and Armentano 1 995) and
sheep ( Faulkner and Polloek 1 990b) . Glucagon also stimulated glycogen breakdown in cultured
hepatocytes from sheep ( Faulkner and Pollock 1 990b). Studies with multi-catheterised sheep
2 1
Chapter 2
showed that glucagon stimulated glycogenolysis and gluconeogenesi s (Brockman and Bergman
1 975, Brockman et af. ( 975) and i nfusions of glucagon increased plasma glucose and insulin
concentrations in early lactation dairy cows (Bobe et at. 2003, H ippen et at. \ 999). The effects
of glucagon appeared to be due to enhanced hepatic uptake of glucose precursors (a lanine,
glycine, glutamine, arginine, asparagines, serine and lactate) and increased activity of pyruvate
carboxylase ( PC) (Brockman and Bergman 1 975, Brockman and Laarveld 1 986). PC is one of
the three key enzymes in the gluconeogenesis pathway and plays a vital role in the process of
catalysing pyruvate to generate oxaloacetic acid. PC catalyses a thermo-dynamically
irreversible reaction, which may be a rate-limit ing step in hepatic gluconeogenesis (Xu and
Wang 2006). Infusion of glucagon into early lactation dairy cows increased hepatic abundance
of PC mRNA ( She et at. 1 999a), which may act to direct carbon, derived from amino acids, to
gluconeogenesis (Drackley et at. 200 I ) .
Studies have found that plasma glucagon concentration showed a sma l l i ncrease during early
l actation in goats and dairy cows and then remained reasonably constant throughout the
remainder of lactation (Debras et at. 1 989, Herbein et al. 1 985) . As mentioned earlier, insulin
concentrations are very low during early lactation (Accorsi et at. 2005, Gulay et al. 2004,
Holtenius et at. 2003, Rhoads et at. 2004) consequently gluconeogenesis is increased in early
l actation when the insul in to glucagon ratio is low (Herbein et at. 1 985) . G lucagon
concentrations were not altered by infusions of insulin and glucose or glucose alone in dairy
cows in early lactation (Laarveld et at. 1 98 1 ) but glucagon concentrat ions were increased by
amino acid infusion in lactating goats (Danfrer et at. 1 995) . This supports the suggestion that
glucagon stimulates gluconeogenesis to a greater extent from glucogenic amino acids ( e.g.
a lanine, glutamate and glutamine) than from propionate (Brockman and Bergman, 1 975) and
may be important for stimulating use of amino acids for glucose production in early lactation.
A lthough the circulating concentrations of glucagon may not change greatly during lactation,
the low circulating concentration of insul in ( Figure 2 .2) remove much of the inhibitory action of
i nsulin enabling glucagon st imulation of the rate-l imit ing steps in gluconeogenesis.
22
Literature Review
Glucose uptake by mammary gland
Experiments in which hyperinsulinaemia was induced in early lactation dairy cows, showed that
i nsulin did not stimulate mammary glucose extraction and only caused a small increase in
amino acid uptake (Laarveld et of. 1 98 1 , Laarveld et of. 1 985) . Consistent with these studies,
the insulin-dependent glucose transporter, GLUT4 mRNA is only present in the mammary
gland of lactating cows at low (Zhao et 01. 1 993 ) or undetectable levels (Komatsu et of. 2003,
Komatsu et of. 2005) . GLUT l was found to be a major glucose transporter in the lactating
bovine mammary gland and GLUT l mRNA level of the mammary gland was three t imes
greater in peak- and late- lactating cows than in non-lactating cows (Komatsu et of. 2005, Zhao
et 01. 1 993) .
From the discussion in the previous sections it can be concluded that increased plasma GH and
decreased plasma insulin concentrations, low insul in to glucagon ratio and reduced sensitivity
and responsiveness of peripheral tissues to insul in during early lactation result in increased
mobil isation of body reserves, increased gluconeogenesis and increased glucose sparing by non
mammary tissues with the overall outcome being greater nutrient avai labi l ity to the mammary
gland. It has been suggested that substrate avai labi l i ty is more important than direct hormonal
influences in the regulation of mammary gland metabol ism as insul in does not stimulate
mammary glucose extraction (Laarveld et of. 1 98 1 ) . Thus, the mammary gland seems to be at
an advantage over insul in dependent tissues in the competi tion for nutrients when insulin
concentrations are low, such as during early lactation (Laarveld et of. 1 985) .
Differences between high and low genetic merit dairy cattle
I t has been demonstrated that p lasma insul in concentrations during lactation were lower in cows
selected for high milk production than in control cows (Bonczek et of. 1 988, Hart et of. 1 980,
Knight et of. 2004). Other studies found no difference in insulin concentration between
selection l ines, throughout lactation (Lukes et 01. 1 989). However, Lukes et 01. ( 1 989)
conducted their study on first lactation heifers. Heifers have lower milk production and respond
23
Chapter 2
differently to a glucose challenge than mature cows ( Lukes et al. 1 989) and this may be due to
the heifers partitioning some nutrients towards growth. In another study, h igh B I cows had
higher baseline and peak concentrations of p lasma insul in than low Bl cows, in response to an
intravenous glucose infusion, but glucose concentrations did not fal l at a greater rate in the high
B I cows (Davey et al. 1 983). Thus, the removal of glucose was less sensitive to insul in
concentration in the high BI group (Davey et af. 1 983) , which may indicate peripheral ti ssues in
high B I cows were less sensitive to insu l in than in low B l cows. Michel et of. ( 1 99 1 ) also
found that insul in peak in response to a glucose chal lenge was greater in high BI cows during
lactat ion but, in contrast with Davey et al. ( 1 983 ), found that glucose concentration decl ined
more rapidly in the h igh B I cows.
Results in calves are also inconsistent. Concentrations of insul in at baseline, and in response to
fasting fol lowed by a propionate chal lenge were not different between high and low genetic
merit calves ( Land et of. 1 983, S innett-Smith et at. 1 987) . Conversely, basel ine plasma insulin
and peak insulin in response to a glucose challenge were greater in high B I compared with low
BI calves (Mackenzie et af. 1 988, Xing et at. 1 993) . Many factors influence basel ine hormone
and metabolite concentrations and responses to a challenge such as energy and protein balance,
feed intake (pasture or concentrate), stage of l actation, parity and milk yield (McClary et at.
1 988, Sechen et af. 1 990, Waghom et of. 1 987, Wool l iams and L0vendahl 1 99 1 , Xing et 01.
1 99 1 ) which may account for the variable results in the aforementioned studies. However, what
is c lear is that animals that vary in genetic merit for milk production also must vary in their
abi l ity to partition nutrients towards milk production, therefore it is important to investigate the
abi l ity of animals to control energy homeostasis.
Summary
Metabolic pathways that enable glucose sparing and nutrient mobil i sation from body reserves
are important during early lactation when there is a massive glucose demand for mi lk synthesis
without a corresponding increase in feed intake (Figure 2 .2) . It is possible that cows differ in
24
Literature Review
their abi l ity to spare glucose and mobil i se reserves in non-mammary tissues. They may d iffer in
the rate-l imiting control points of the metabolic pathways that are involved in these processes.
The use of insulin or glucose chal lenges should give an indication of each anjmal 's abi l ity to
partition nutrients, therefore, may also give an indication of their abi l i ty to supply nutrients to
the mammary gland.
2.7 Lipid Metabolism
The metabol ism of energy-yielding compounds in adipose t issues has a pivotal role in supplying
the energy demands of lactation (McNamara 1 995) . H igh milk yields in dairy cows are related
to the abi l i ty to mobil i se body energy reserves in early lactation (Bauman et al. 1 985,
McNamara and Hi l lers 1 986b). Therefore, identifying genetic markers in hormonal control and
metabolic pathways of adipose tissue accretion and mobil isation may be a key area in
improving milk production.
In early lactation mminants, the concentration of plasma NEF As, glycerol and p
hydroxybutyrate are al l higher than in the non-lactating state ( Faulkner and Pollock 1 990a,
Murondoti et of. 2004, S idhu and Emery 1 973, Vernon et of. 1 98 1 ) . Triacylglycerol uptake
from plasma, fatty acid synthesis ( McNamara and H i l lers 1 986c, Vernon and Finley 1 988,
Vernon et of. 1 98 1 ), mean volume of subcutaneous adipocytes (Vernon et 01. 1 98 1 ), and fatty
acid re-e terification (McNamara and Hi l l ers 1 986c, Metz and van den Bergh 1 977, Sidhu and
Emery 1 973 ) are all reduced (Chi l l i ard 1 999) while l ipolyt ic act ivi ty is increased in adipose
tissue during early lactation (McNamara and Hi l lers 1 986b, Metz and van den Bergh 1 977,
Yang and Baldwin 1 973) ( Figure 2 .2) . Consequently, there is a decreased uptake of glucose,
acetate and preformed fatty acids by adipose t issue ( Phi l l ips et of. 2003) . These changes in
adipose t issue metabol ism ensure the preferential use of l ipogenic precursors by the mammary
gland (Vernon et of. 200 1 ) .
Before parturition, about two thirds of the FF A produced by l ipolysis are re-esterified, but
during early lactation re-esterification of fatty acids appears to almost ccase in adipose tissue of
25
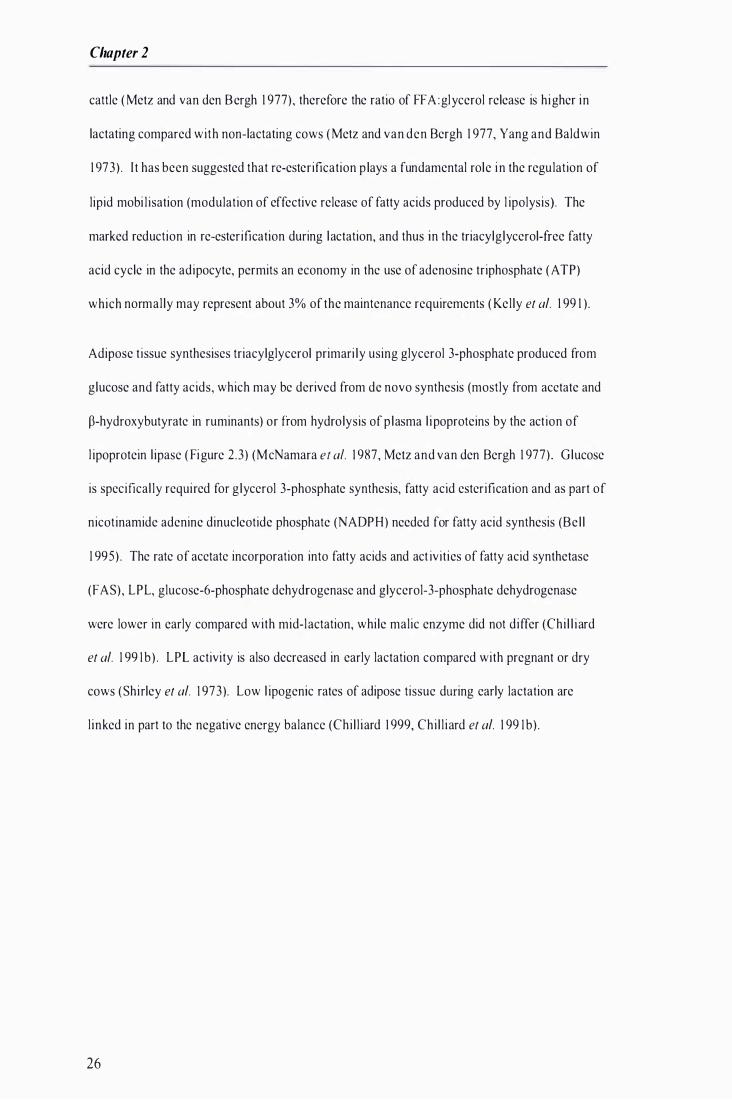
Chapter 2
cattle ( Metz and van den Bergh 1 977), therefore the ratio of FF A :glycerol release is higher in
lactating compared with non-lactating cows ( Metz and van den Bergh 1 977, Yang and Baldwin
1 973) . I t has been suggested that re-esterification p lays a fundamental role i n the regulation of
lipid mobi l isation (modulation of effective release of fatty acids produced by l ipolysis). The
marked reduction in re-esterification during lactation, and thus in the triacylglycerol-free fatty
acid cycle in the adipocyte, permits an economy in the use of adenosine triphosphate ( ATP)
which normally may represent about 3% of the maintenance requirements ( Kelly et at. 1 99 1 ) .
Adipose t issue synthesises triacylglycerol primari ly using glycerol 3-phosphate produced from
glucose and fatty acids, which may be derived from de novo synthesis (mostly from acetate and
p-hydroxybutyrate in ruminants) or from hydrolysis of p lasma l ipoproteins by the action of
l ipoprotein l ipase ( Figure 2 .3) (McNamara et al. 1 987, Metz and van den Bergh 1 977) . Glucose
is specifical ly required for glycerol 3-phosphate synthesis, fatty acid esterification and as part of
nicotinamide adenine dinucleotide phosphate (NADPH) needed for fatty acid synthesis (Bel l
1 995) . The rate of acetate incorporation into fatty acids and act ivities of fatty acid synthetase
(FAS), LPL, glucose-6-phosphate dehydrogenase and glycerol-3-phosphate dehydrogenase
were lower in early compared with mid-lactation, while malic enzyme did not differ (Chil l i ard
et at. 1 99 1 b ) . LPL activity is also decreased in early lactation compared with pregnant or dry
cows (Shirley et at. 1 973). Low l ipogenic rates of adipose tissue during early lactation are
l inked in part to the negative energy balance (Chi l l iard 1 999, Chi l l iard et at. 1 99 1 b) .
26
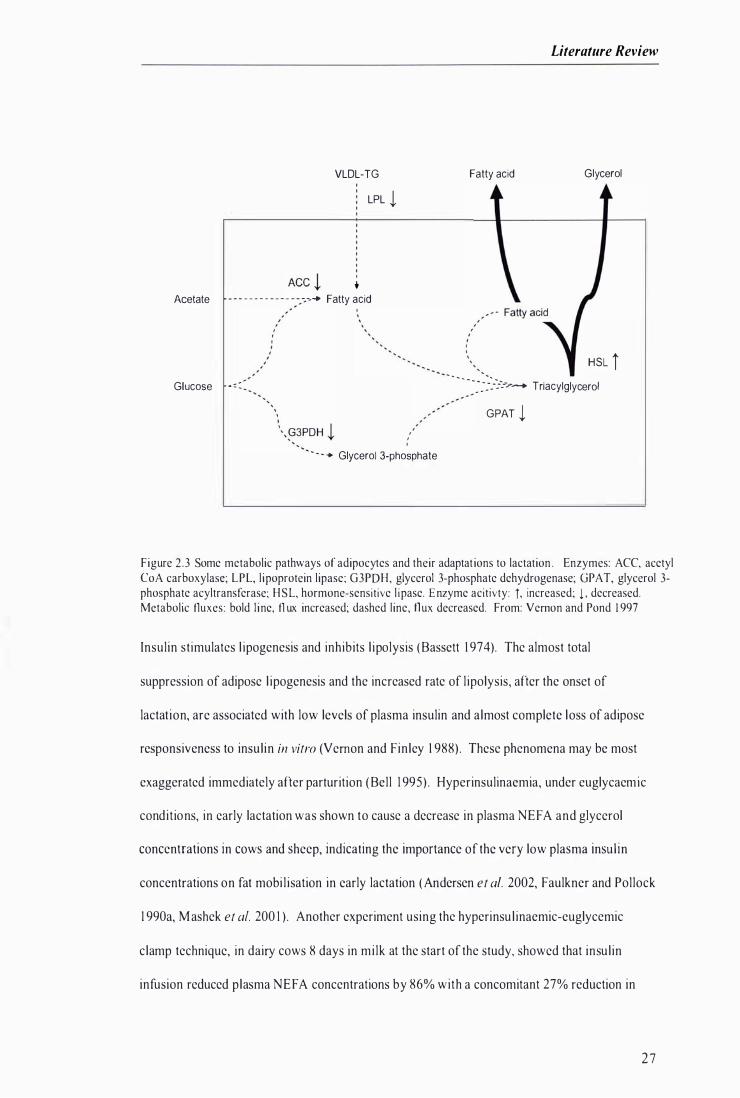
Literature Review
VLDL-TG
LPL 1
, ..
Acetate - - - - - - - - - - - - -.-.-.---+ Fatty acid
Glucose - : :
, , ,
. '
- - - .. Glycerol 3-phosphate
Fatty acid Glycerol
HSL i - - - - - -: __ :�-�-:-�- Tnacylglycerol
GPAT 1
Figure 2 .3 Some metabolic pathways of adipocytes and their adaptat ions to lactation . Enzymes: ACC, acetyl CoA carboxylase; LPL, l ipoprotein lipase; G3PDH, glycerol 3-phosphate dehydrogenase; GPAT, glycerol 3-
phosphate acyltransferase; HSL, hormone-sensitive l ipase. Enzyme acitivty: j, increased; L decreased. Metabolic fluxes: bold l ine, fl ux increased; dashed line, fl ux decreased. From: Vemon and Pond 1 997
Insulin stimulates l ipogenesis and inhibits l ipolysis (Bassett 1 974). The almost total
suppression of adipose l ipogenesis and the increased rate of l ipolysis, after the onset of
lactat ion, are associated with low levels of plasma insulin and almost complete loss of adipose
responsiveness to insul in in vitro (Vemon and Finley 1 988) . These phenomena may be most
exaggerated immediately after parturition ( Bell 1 995) . Hyperinsulinaemia, under euglycaemic
conditions, in early lactation was shown to cause a decrease in plasma NEF A and glycerol
concentrations in cows and sheep, indicating the importance of the very low plasma insul in
concentrations on fat mobi l isation in early lactation (Andersen et of. 2002, Faulkner and Pollock
1 990a, Mashek et of. 200 I ) . Another experiment using the hyperinsu l inaemic-euglycemic
clamp technique, in dairy cows 8 days in milk at the start of the study, showed that insul in
infusion reduced plasma NEF A concentrations by 86% with a concomitant 27% reduction in
2 7

Chapter 2
milk fat yield compared with the baseline period (Corl et af. 2006). The reduction in milk fat
yield was almost exclusively due to a decrease in the use of longer chain fatty acids taken up
from the circulation. The changes that occurred with elevated insul in were due to reduced rates
of adipose lipolysis, thereby l imiting the supply of preformed fatty acid precursors (Corl et af.
2006).
Basal release of FF A from in vitro adipose t issue cell cultures was inhibited by glucose at
concentrations normally found in plasma ( 3 . 5 mM). Glucose inhibits fat mobi l isation by
stimulating the re-esterification process through formation of glycerol-3-phosphate (F igure 2 . 3 )
(Metz and van den Bergh 1 977) . However, in adipose tissue samples taken from cows in early
lactation, glucose did not have an inhibitory effect on FF A release. Addition of insulin to the
medium did not affect the production and release of FF A (Metz and van den Bergh 1 977) .
Lipogenic capacity of adipose tissue, cultured for 48 h in the absence of any hormones, was
markedly decreased (Etherton and Evock 1 986, Vernon and F inley 1 988) . Addition of
physiological concentrations of insulin increased l ipogenic rate in short-term in vitro adipose
tissue incubations (Etherton and Evock 1 986, Vernon 1 982), suggesting that insul in acts to
maintain enzyme protein mass in adipose t issue (Etherton and Evock 1 986) . Addition of GH to
adipose tissue cultures containing physiological concentrations of insul in caused decreased
(P<0.05) rates of fatty acid synthesis from acetate (Vernon 1 982) .
The dramatically a ltered response to insulin in early lactation could not be attributed to any
change in i nsulin binding by adipocytes (Vernon et al. 1 98 1 ), implying a post receptor defect or
alteration (Wi lson et at. 1 996). Impairment i n the insul in signal l ing system is thought to be
downstream of P I 3 k inase therefore is at a rel at ively late step in the insulin signal l ing system in
adipocytes (Wi lson et at. 1 996) . I t has been suggested that GH may play a role in the a ltered
response of adipose t issue to insulin during early lactation because GH antagonises insul in
action. [n vitro studies in adipocytes have shown that GH prevented insulin activation of actyl
CoA carboxylase ( Borland et al. 1 994, Vernon et al. 1 99 1 ) .
28
Literature Review
Catecholaimes
Catecholamines ( adrenaline and noradrenaline) are secreted by the adrenal glands and the
sympathetic nervous system. Adipose cel l s of the dairy cow are sensitive and responsive to
catecholamines (Yang and Baldwin 1 973) . Glycerol and NEFA release from adipose tissue i n
response t o adrenaline was increased from day 30 prepartum t o day 30 postpartum and remained
elevated unti l day 240 of lacation (McNamara 1 988) . Catecholamjnes can modify adipocyte
metabol ism to a variable extent, depending upon cell membrane p- and a-2-adrenergic
receptors, which stimulate and inhibit l ipolysis, respectively. Stimulation of FFA and glycerol
release from adipose tissue by noradrenaline, in vitro, is increased after parturition ( Metz and
van den Bergh 1 977) . From 30 days pre-partum to 30 days post-parium there was a 60%
increase in the number of p-adrenergic receptors per cel l , although binding kinetics were
unchanged (Jaster and Wegner 1 98 1 ) . Because cows differ in the extent to which they mobil ise
body fat reserves (Bryant and Trigg 1 98 1 , Davey et at. 1 983 ), it is possible that variation might
exist between cows in the control mechanisms involving catecholamines and their receptors on
adipose tissue (Bauman et at. 1 985) . Thus, the effect of adrenal ine on fat mobi l isation may be
an important area to investigate for genetic control of milk production.
Treatment of multiparous mid- to late lactation dairy cows with exogenous GH caused greater
p lasma concentrations of NEF A and glycerol both at baseline and in response to an adrenaline
challenge when compared with controls ( Houseknecht et af. 1 995, McCutcheon and Bauman
1 986, Sechen et al. 1 990). At maximal respon iveness to adrenaline challenge plasma NEFA
concentrations were increased approximately 6-fold, whereas glycerol concentrations were
increased approximately 3-fold. The authors suggested that GH treatment was reducing
adrenaline-stimulated rates of re-esterification of fatty acids in adipocytes and increasing
l ipolysis (Sechen et at. 1 990).
The mechanism of adrenal ine action on l ipolysis presumably is due to adenyl cyclase which in
turn catalyzes conversion of ATP to adenosine-3 ' , 5 ' -monophosphate, cycl ic AMP (cAMP), the
29

Chapter 2
latter then activating hormone sensitive l ipase (Yang and Baldwin 1 973). The regulation of
l ipolysis involves cAMP and a signal transduction system that i ncludes stimulatory G proteins
(Gs) and inhibitory G proteins (G;) . Catecholamines affect l ipolysis through the Gs system, and
GH treatment dramatically increases the l ipolytic response to catecholamines in lactating cows.
The G inhibitory system is a major mechanism by which GH alters l ipolysis (Etherton and
Bauman 1 998).
Leptin
Leptin is a protein hormone synthesised a lmost exclusively in white adipose tissue. I t acts
predominantly on regions of the brain involved in regulation or energy metabolism ( Leury et at.
2003 ). Leptin is synthesised in proportion to the overall degree of adiposity. Plasma leptin
content i s a good indicator of body fatness in ruminants fed near their maintenance requirements
(Delavaud et at. 2000, Rosen and Spiegelman 2006, Trayhurn and B ing 2006) . P lasma
concentrations of leptin in dairy cows were reduced around the time of parturition and coincided
with increased use of endogenous l ipids as an energy source but occurred prior to significant
depletion of white adipose tissue (Block et al. 200 I , Holtenius et al. 2003, Leury et al. 2003).
The onset of negative energy balance appears to be partly responsible for the lower
concentration of p lasma leptin in early lactating dairy cows ( Block et al. 200 I ) . Increased
plasma leptin in response to food intake or increased adiposity is a key signal that decreases
food intake and increases energy expenditure by acting on specific receptors in the
hypothalamus (Okamoto et al. 200 I , Rosen and Spiegelman 2006). Thus, the increase in food
intake that occurs during early lactation may be influenced by low plasma leptin concentrations.
Summary
Nutrient demands increase dramatical ly due to the onset of copious mi lk synthesis and
secretion. Early l actation in dairy cows is often associated with a period of negative energy
balance as increase in food intake is insufficient to meet the nutrient requirements for mi lk
production and maintenance (de Vries and Veerkamp 2000, Van den Top et al. 2005) . Fatty
30
Literatllre Review
acids are a major source of energy for mo t t issues during periods of negative energy balance
( Yemon 2005) . Mobil isation of l ipid reserves during early lactation is achieved through a
considerable reduction in fatty acid synthesis, a decrease in LPL activity and a decrease in fatty
acid esterification. This ensures that precursors for triacylglycerol are avai lable for use in the
mammary gland. Thus, the control points in pathways involved in l ipid metabolism are
important for milk production, particularly in early lactation. Release ofNEF A and glycerol
from adipose t issue in response to an adrenal ine challenge may provide indicators of adipose
t issue mobil isation and the abi l ity to supp ly nutrient to the mammary gland for lactation.
2.8 Protein Metabolism
Much of the ruminants' protein requirements are met by digestion and absorption of mmen
microbes in the abomasum and small intestine (Clarenburg 1 992). However, the substantial
requirement for glucogenic precursors during early lactation can not be met by dietary intake in
high producing dairy mminants ( Bel l et at. 2000) . During, at least, the first 7- 1 0 days of
lactation, it was estimated that h igh-yielding dairy cows may need to mobi l ise up to I OOOg of
tissue protein/d to satisfy amino acids and glucose demands of the mammary gland ( 8ell et at.
2000). Mobi l isation of endogenous protein and increased lactate release from muscle as wel l as
glucose and acetate sparing mechanisms, contribute to supplying some of the glucogenic
precursor shortfal l in early lactation (Hough et at. 1 985, Pethick and Lindsay 1 982 ) . There is
also an increased uptake of ketones, such as P-hydroxybutyrate, for oxidative purposes (Yemon
et al. 1 990) .
I nsulin stimulates the uptake and incorporat ion of amino acids into protein and i nh ibits
proteolysis (8assett 1 974). Studies in humans indicate that IGF-I stimulates amino acid uptake
and protein synthesis, whi le insul in inhibits protein degradation in skeletal muscle (Liu et al.
2006). Insul in and IGF-I concentrations decrease around the time of parturit ion and onset of
lactation (Abribat et at. 1 990, Accorsi et at. 2005, 8 10ck et at. 200 I , Rhoads et al. 2004), which
may p lay a role in increasing precursors avai lable for use in the mammary gland and l iver.
3 1
Chapter 2
There is some evidence for a loss of skeletal muscle protein during lactation. Change in body
protein has been calculated in several experiments in high produc ing dairy cows and have
demonstrated a loss ( 8-2 1 kg) of body protein in early lactation (Chi l l iard and Robelin 1 983,
Komaragiri and Erdman 1 997, Phi l l ips et af. 2003) . Variation in body protein loss between
experiments is dependent of the l ive weight and milk potential of the experimental animals and
feeding level (Chi l l iard et al. 1 998a). Loss of muscle fibre diameter or area of 9-30% have
been reported for the period immediately after calving (Kokkonen et al. 2005 , Reid et af. 1 980,
Roberts and Turfrey 1 983 ) . The proportions of carbon in mi lk constituents derived from feed
and body tissues in dairy cows have been estimated by exploiting the natural variation in the
ratio 1 3e : 1 2C present in C)- and C4-plant species (Wilson et al. 1 988) . During early lactation
34% of casein and 24% of lactose in mi lk was estimated to be derived from body tissue protein
in h igh genetic merit cows (Wilson et af. 1 988) . Interestingly there was considerable variation
between animals in the proportional contribution of body-tissue C to individual milk
constituents, which was suggested to be associated with genetic merit or the size of the body
reserves avai lable for mobi l i sation (Wi lson et al. 1 988) . Another experiment also demonstrated
variation between individual cows in protein mobi l isation (from 1 1 .2 kg mobi l isation to 6 kg
retention) during early lactation (Tamminga et af. 1 997).
Measurement of 3-methyl histidine concentration in plasma or urine on its own or a ratio of 3-
MH to creatinine can be used as an indicator of muscle protein degradation ( B lum et af. 1 985,
Overton et af. 1 998, Phil l ips et al. 2003 ). 3-MH was found to i ncrease dramatically in dairy
cows during the first week postpartum, suggesting rapid protein mobi l isation during this t ime.
By 2 to 4 weeks postpartum 3-MH and returned to prepartum concentrations, or lower (B lum et
al. 1 985, Kokkonen et al. 2005, Overton et af. 1 998, Phi l l ips et al. 2003) . However, protein
mobi l isati on may continue beyond the first 4 weeks of lactat ion. A 30% decrease in plasma
creatinine ( indicat ing a decrease in total body protein mass) was found in all treatment groups
from day 1 to 2 1 of lactat ion . Plasma creatinine continued to decrease in the group that was not
32
Literature Review
given a glucogenic supplement, until that last sample was taken on day 56 of lactation
(Kokkonen et af. 2005) .
A decreased capacity of skeletal muscle to synthesise protein in lactating sheep is i ndicated by
the decreased ratio of RNA: DNA in early l actation (Smith et al. 1 98 1 ) . The absolute synthesis
rate of skin protein was 48% lower (P < 0.05), muscle protein was 34% lower (P < 0.05 ), and
bone marrow was 29% lower (not significant) in lactating compared with non-lactating dairy
goats ( Baracos et af. 1 99 1 ) . The reduction in musc le protein synthesis contributed 72% of the
total reduction in protein synthesis in the h ind l imb tissues of dairy goats during early lactation
(Baracos et af. 1 99 1 ) .
Amino acids released from skeletal muscl e are probably used either for protein synthesis in the
mammary gland or gluconeogenesis in the l iver. Potential uti l isation of amino acids for
gluconeogenesis is greatest during the first few weeks of lactation (Overton et al. 1 998) . The
upper l imit to the amount of body protein that can be mobil ised, even if an animal is subjected
to severe underfeeding, is about 20% of body protein (Chi l l iard and Robelin 1 983) . The
contribution of body proteins to the energy requirements of lactation is smal l but quantitatively
important in the ruminant. Body protein mobi l isation provides essential amino acids or glucose
precursors, which general ly constitute the principal l imiting nutritional factors for milk
production. These nutrients are l imiting because of feed intake capacity l imitations and energy
nitrogen interactions in the rumen (Chi l l iard 1 999). Experiments in dairy cows have shown that
increased dietary protein supply increased milk, protein and lactose yields from week 1 of
lactation onwards and induced greater mobi l isation of fatty acids from adipose tissue. These
findings indicate the l imited potential of cows to compensate for a deficit of feed protein supply
by mobi l ising tissue proteins (Kokkonen et al. 2002, 0rskov et al. 1 98 1 ), thus support the
suggestion that amino acids and glucose precursors are l imiting to milk production.
33

Chapter 2
Summary
Mobil i sation of body protein reserves may be important in supplying amino acids for protein
synthesis in the mammary gland and gluconeogenesi s in the l iver. However, using a metabolic
challenge to assess changes in amino acid uptake and release from body protein reserves would
be difficult.
2.9 Liver
The l iver has a central role in metabolism. Nutrients absorbed in the portal vein must pass
through the l i ver before reaching the vena cava and ultimately the rest of the body, thus it
controls the amount and nature of nutrients avai lable to the rest of the body (Lobley et al. 2000,
Reynolds 1 995) . The l iver is extremely metabolically active, accounting for 2 to 3% of body
mass, but up to 25% of body oxygen consumption and also receives approximately 25% of
cardiac output ( Lobley et at. 2000, Reynolds 1 995) .
The major metabolic activit ies o f the ruminant l iver, with respect to metabolism and milk
production, inc lude gluconeogenesis, ketogenesis and synthesis of l ipoproteins r ich in
triacylglycerol for transport to other tissues (Baldwin and Kim 1 993) . Most of the increased
glucose requirement associated with the onset of lactation must be met by increased hepatic
gluconeogenesis ( Drackley et al. 200 I ) because in ruminants most dietary carbohydrates
undergo microbial fermentation in the reticulo-rumen meaning ruminants only absorb smal l
amounts of dietary glucose. Given the importance of glucose to lactation, metabolic processes
that occur in the l iver are l ikely to be l imiting to production in the lactating cow.
Whi le the metabol ic pathways that occur in the l iver are crucial in the supply of nutrients during
lactation, testing these pathways using a metabol ic chal lenge does not seem feasible.
34
Literature Review
2.10 Metabolic Pathways Summary
The metabol ic control of milk production is an area that has been extensively reviewed and
therefore the current work is not an exhaustive or original review of the l iterature. Rather,
emphasis has been placed on metabolic processes that are important in supplying nutrients for
lactation and may be quantified using metabolic challenges. Insulin plays an important role in
carbohydrate metabolism and alterations in the plasma concentrations and signal l ing
mechanisms during l actation contribute to repartitioning of nutrients towards the mammary
gland. GH influences many aspects of energy homeostasis. The increase in circulat ing GH
concentration with the onset of lactation p lays an important role in partitioning nutrients
towards the mammary gland . GH actions include increasing l ipolysis, decreasing l ipogenesis,
increasing gluconeogenesis, impairing the actions of insul in and increasing cardiac output and
blood flow to the mammary gland. Mobil isation of fat reserves during lactation is caused by
increased l ipolytic activity and decreased triacylglycerol uptake, fatty acid synthesis and fatty
acid re-esteri fication. These changes in adipose tissue metabolism ensure the preferential use of
l ipogenic precursors by the mammary gland. H igh milk yields in dairy cows are related to the
abi l ity to i ncrease food intake and mobi l ise body energy reserves in early lactation. Therefore,
identifying genetic markers in hormonal control and metabolic pathways of body reserve
accretion and mobi l isation may be a key area in improving milk production.
2.11 Challenges
There is a well established difference between h igh- and low-yielding dairy cows in their abi l ity
to partition available energy towards milk production (L0vendahl and Sej rsen 1 993) . Co
ordination of partitioning of energy towards milk production is orchestrated by changes in
hormone concentrations as well as tissue sensit ivity and responsiveness to these hormones
(Bauman and Currie 1 980, Bel l 1 995, Grummer 1 995, Yemon 1 988, 1 998) . Early evidence
that genetic differences in the tendency to produce mi lk are associated with the genetic variation
in the physiology of energy control in cattle was provided in experiments by Hart et al. ( 1 978) .
35
Chapter 2
This work has lead to many studies examining the concentrations of metabolites and hormones
under a number of different experimental challenge situations with the objective of determining
physiological indicators of genetic merit for milk yield in dairy cattle ( Wool l iams and
LeJVendahl 1 99 1 ) .
The blood concentration of a hormone represents the balance between the rates of release and
degradation of a hormone (Bauman et al. 1 985, Hart et af. 1 980). Concentrations of plasma
hormones or metabol ites measured in blood samples taken as one off samples or serial samples
over time have given highly variable and non-repeatable results. These results could not be
related to genetic merit of milk production ( Hart et al. 1 98 1 , Osmond et af. 1 98 1 , Ti lakaratne et
al. 1 980, Wool l iams et af. 1 993 ) . Artificial induction of hormone release, through
administration of exogenous hormones or metabol i tes, can efficiently reduce the variation due
to normally occurring random spikes and diurnal fluctuations ( L0vendahl and Sejrsen 1 993) .
There are three approaches that have been used to investigate the effects of genetic merit for
mi lk production on physiological indicators (Wool l iams and L0vendahl 1 99 1 ) . One approach
has been to carry out physiological studies on bul l s in progeny testing schemes and correlate
results from the physiological tests with the progeny test results ( Joakimsen et af. 1 97 1 , Kl indt
1 988, Osmond et al. 1 98 1 , Robinson et af. 1 992) . Another approach was to use an imals from
selection experiments (Blair et at. 1 990); groups of animals that, through selective breeding,
were divergent in genetic merit for milk production traits ( L0vendahl et at. 1 99 1 a, Mackenzie et
al. 1 988, Min et al. 1 993, Sejrsen et at. 1 984, Ti lakaratne et at. 1 980). The other approach was
to compare between breeds such as a dairy breed and a dairy beef crossbred animals ( Land et at.
1 983) . However, interpretation of physiological results, in young animals, from the third
approach is d ifficult due to possible specialisation of the breeds (Wool l iams and L0vendahl
1 99 1 ) .
Differences between cattle in energy and protein metabol ism are associated with differences in
genetic merit for milk production traits (Mackenzie et al. 1 988) . Challenge methods were used
36
Literature Review
to try and find reliable physiological indicators of genetic merit for milk yield that can be
measured in both sexes before reproductive age ( Baker et 01. 1990, Sejrsen et 01. 1984,
Tilakaratne et al. 1980, Woolliams and Smith 1988). Selection of calves rather than adult
animals may increase sel ection accuracy, shorten the generation interval and accelerate the rate
of genetic gain (Baker et 01. 1990, Sasaki et 01. 2003). The value of an indicator trait in
increasing selection response wil l depend largely on the magnitude of the co-heritability, which
is a function of the heritabilites of the indicator trait and of the economic trait to be improved
and the genetic correlation bctwecn them ( Baker er of. 1990, Wool l iams and Smith 1988). The
methods used for assessing potential physiological indicators of milk production wil l be
discussed in the fo l lowing sections.
Fasting and feeding
Measurement of blood metabolites ( such as FF A, urea and glucose) and hormones (such as GH)
was the simplest method used in attempts to finding physiological markers for genetic merit for
milk production. A number of studies investigated changes in blood metabolites and hormones
before and after feeding or during a period of fasting and re-feeding (H0j et 01. 1993, Mackenzie
et 01. 1988, Min et 01. 1993, Sejrsen et 01. 1984, Sinnett-Smith et of. 1987, Tilakaratne et al.
1980, Xing et af. 1991). These studies were conducted in young (3.5 - 10 months of age)
animals with high or low genetic merit for milk production. Although the metabo lites and
hormones did respond to fasting a re-feeding, there were no consistent differences in these
responses that could be attributed to genetic merit (Wool liams and Levendahl 1991).
Differences in feed composition (pasture vs. concentrate) and basal plasma concentrations prior
to the fast, sex and age affects may have accounted for the differences among the studies
conducted (Min et 01. 1993). Thus, fasting and refeeding methods for assessing physiological
indicators have yielded variab le results. Using fasting in combination with other challenges
may be a better option for generating repeatab le and interpretable physiological responses.
37
Chapter 2
Insulin
Changes in energy metabol ism are crucial to partitioning nutrients towards the mammary gland
during lactation in the dairy cow. Insulin concentrations are very low during early lactation
compared with pregnant, dry or late lactation cows (Accorsi et al. 2005, Gulay et af. 2004,
Holtenius et af. 2003, Komatsu et al. 2005, Lomax et af. 1 979, Lukes et at. 1 989, Rhoads et af.
2004) and in some cases are lower in cows selected for high milk production than in control
cows ( Bonczek et al. 1 988, Hart et af. 1 980, Knight et al. 2004) . Pancreatic responsiveness to
insulinotropic substances such as propionate is reduced ( Holtenius et al. 2003 , Leury et al.
2003, Lomax et at. 1 979, Sano et al. 1 993, Shingu et al. 2002) and responsiveness of pcripheral
tissues to insulin is also decreased ( Yemon and Finley 1 988, Yemon et af. 1 990) in lactating
compared with non-lactating ruminants. Intravenous glucose challenge is a well establ ished
method for assessing pancreatic insul in release and the rate of tissue uptake of glucose in
ruminants (Akerlind et al. 1 999) . Therefore, use of an intravenous glucose challenge in heifers,
prior to the age that lactation occurs, may provide information on the abil ity of the animal to
produce milk .
Several experiments have shown that insul in concentrations were greater in dairy cattle with a
high genetic merit for mi lk fat or mi lk yield compared with those that had a low genetic merit
( Bames et al. 1 985, Mackenzie et al. 1 988, Xing et al. 1 993 ) . In other studies, comparison of
pancreati c insulin release from high and low genetic merit calves did not show significant
differences (Land et af. 1 983, Sinnett-Smith et al. 1 987) . An experiment in l actating dairy cows
showed the removal of glucose was less sensitive to insulin concentration in the high genetic
merit group (Davey et al. 1 983) . In support of this suggestion, an experiment in which
Coopworth rams were selected on the basis of their response to glucose tolerance tests produced
l ines of sheep with differences in the action of insul in on peripheral tissues as wel l as the release
of insul in from the pancreas ( Francis et af. 1 990). Conversely, an increased sensitivity to
insulin was in h igh genetic merit 8-month old bull calves ( Mackenzie et af. 1 988) but no
difference was found between genetic merit groups in other studies ( Bames et af. 1 985, Land et
3 8
Literature Review
al. 1 983) . An intravenous glucose challenge was conducted on 329 Gennan Holstein progeny
test bul ls after an overnight fast, they ranged in age from I to 5 years ( Panicke et al. 2002) . The
calculated correlation coefficients, of the bulls in their 3'd half year of l ife, showed that glucose
half-l ife and glucose area are suitable parameters for milk yield, fat yield and protein yield
( Panicke et al. 2002).
Numerous studies have demonstrated differences in energy metabol ism among l ines of animals
divergently selected for aspects of milk production. This indicates that there is a heritable
component to energy metabol ism. However, the di fferences between selection l ines are highly
inconsistent among experiments. This is probably due to differences in many variables such as
age, energy balance and feed composition (forage vs concentrate). Nevertheless, as long as
environmental conditions are closely controlled, an intravenous glucose challenge is l ikely to
provide useful data on insulin release and sensiti vity for phenotype generation.
Growth hormone
GH has a key role in regulation of manunary gland developmcnt and lactation, consequently,
the GH gene has potential as a marker for genetic variation in milk production ( H0j et al. 1 993) .
Basal blood concentrations of GH increase during early lactation, and the concentration of GH
is greater in dairy cows selected for high mi lk yield than average or low yielding cow
(Beerepoot et al. 1 99 1 , Hart et al. 1 978, Kazmer et al. 1 986, Knight et al. 2004, Lukes et al.
1 989, Roche et al. 2006b). In 1 937 preprations from the anterior pituitary administered to
lactating dairy cows were reported to increase milk yield (Asimov and Krouze 1 937). Since that
t ime, treatment of mult iparous mid- to late lactation cows with exogenous bovine GH for short
periods, 7- 1 2 day periods, has been shown to increase milk production (23-4 1 %) and milk fat
percentage compared with controls (Cohick et al. 1 989, Houseknecht et al. 1 995, McCutcheon
and Bauman 1 986, McDowell et al. 1 987) . These experiements along with many others
demonstrate the strong galactopoietic effect of GH (McDowell et al. 1 987). However, not a l l
39
Chapter 2
experiments have reported a significant relationship between GH concentration and milk
production ( Herbein et at. 1 985) .
Growth hormone is released episodically from the pituitary into the c irculation, resulting in
intermittent spikes in blood GH concentration (Anfinson et al. 1 975, Wool l iams et al. 1 993) .
Pulse frequency and ampl itude vary between and animals and are affected by many factors such
as diurnal variations, feed intake and ambient temperature ( Evans et al. 1 99 1 , Levendahl and
Sejrsen 1 993, Woo l l iams et at. 1 993 ) . Thus, when testing individual animal GH
responsiveness, injection of an exogenous G H secretagogue under control led environmental
conditions is the most effective method ( Levendahl and Sej rsen 1 993) . GH release is h ighly
dependent on many factors including age of calves, energy balance, type and dose of
secretagogues and GH concentrat ion prior to secretagogue administration ( H0j et at. 1 993,
Levendahl et at. 1 99 1 a, L0vendahl et al. 1 99 1 b, Shingu et al. 200 I ) .
Thyrotropin-Releasing Hormone
Thyrotropin-releasing hormone (TRH) is a tripeptide hypothalamic hormone that has been
isolated from hypothalamic tissue. Growth hormone releasing hormone (GHRH), TRH and
arginine have all been used as GH secretagogues in cattle ( Hodate et at. 1 985 , Hej et at. 1 993 ,
Lapierre et at. 1 990, Levendahl et at. 1 99 1 a, McCutcheon and Bauman 1 986, S0rensen et al.
2002, Wool l iams et al. 1 993) . GH release in response to arginine administration was often
small and delayed compared with responses to G H RH or TRH. In some cases there was no G H
response t o arginine administration (H0j et at. 1 993, L0vendahl et al. 1 99 1 a, Romo et at. 1 997) .
Thus, arginine wi l l not be considered further in th is discussion.
For both G HRH and TRH, size of the GH response may depend in part on the size of the
releasable GH pool in the pituitary, and this would be affected by the time since the most recent
peak ( L0vendahl et al. 1 99 1 b). GH response to TRH is smal ler than the response to GHRH
( L0vendahl et at. 1 99 1 b, Wool l iams et al. 1 993) . GHRH has been lIsed successfully in a large
number of experiments i nvestigating the secretion of GH in dairy cattle breeds. However,
40

Literature Review
GHRH is not approved for use in New Zealand, thus could not be used for conducting an
endocrine challenge in the current study.
When TRH is administered to cattle, prolactin and GH are released from the anterior pituitary.
I t is uncertain i f TRH controls secret ion of prolactin or GH under normal physiological
condit ions. Both hormones are impl icated in several aspects of mammary function (Tucker
1 985) .
Prolactin has a clearly estab l ished role in lactogenesis in thc dairy cow (Tucker 2000) and is a
primary st imulator of mammary cell differentiation (Akers 2006). Experiments in which the
surge in prolactin secretion, which occurs several hours before parturition in the cow, was
b locked through the administration of bromoergocryptine caused a marked decrease in mi lk
production and administration of exogenous prolactin prevented the decrease in mi lk production
caused by bromoergocryptine (Akers et af. 1 98 1 ) . Prolactin does not appear to affect
establ i shed lactation in the dairy cow. Increased or decreased plasma prolactin concentrations
did not al ter mi lk production in dairy cows either in early or late lactation ( Plaut et af. 1 987) .
There were no differences in stimulated secretion or basal prolactin concentrations when cows
selected for h igh y ield were compared with controls (Bonczek et al. 1 988, Kazmer et al. 1 986) .
Conversely, basal and response period plasma prolactin concentrations were greater in selection
than control cows on the day of parturition but were greater in control cows on days 45 and 90
and did not differ on day 1 80 post partum (Lukes et af. 1 989) . In another experiment, cows
exposed to short day photoperiod during the dry period had reduced prolactin but increased mi lk
yield and expression of prolactin receptor mRNA in Iymphocytes and mammary gland
compared with cows exposed to long day photoperiod. These authors suggested these findings
indicated that greater responsiveness and sensi t ivity to prolactin during transition to lactation
may be associated with an increase in subsequent lactation (Auchtung et af. 2005 ).
TRH acts upon the anterior pituitary to stimulate the release of thyroid-st imulating hormone
(TSH) (Veerkamp et af. 2003 ) . TSH is recognised as being directly responsible for the release
4 1
Chapter 2
of thyroxine (T4) and, in lesser amounts, 3,5,3 ' -triiodothyronine (T3 ) by the thyroid gland
( Lacasse et al. 1 99 1 , Veerkamp et al. 2003) . T4 is the predominant thyroid hormone in the
circulation but has l ittle biological activity and essential ly serves as a prohormone (Akers 2002) .
Enzymatic 5 'deiodination of T4 within the thyroid and peripheral tissues produces the most
metabol ical l y active thyroid hormone, T 3 (Akers 2002, Chopra et al. 1 978) .
Thyroid hormones are involved in metabolic homeostasis and maintenance of lactation ( Perera
et af. 1 985) . During early lactation in cows there is a decrease in T4 and T3 concentrations and a
number of studies have found a negative relationship between milk yield and circulat ing
concentration of thyroid hormones ( Hart et af. 1 978, Nixon et af. 1 988, Pezzi et af. 2003 ,
Walsh et al. 1 980). Thus, lactation in dairy cows is characterised by a physiological
hypothyroid state which is in contrast with the enhancement of milk production induced by T3
and T4 administration ( Perera et af. 1 985, Swanson and Mil ler 1 973) . Stimulation of milk
production through administration of thyroid hormones was found to be unsustainable due to the
increase in general metabol ism causing severe body weight loss (B laxter et al. 1 949, Knight et
al. 2004) . In contrast to the general increase in metabol ism that occurs in response to thyroid
hormone supplementation, it is I ikely that organ-specific changes in thyroid hormone
metabolism during lactogenesis fac i l i tate adaptation to a lactation state by promoting
differential rates of energy uti l isation (Akers 2002, Pezzi et af. 2003 ) .
A posit ive genetic association has been reported between daily T4 degradation and genetic merit
for fat-corrected mi lk yield in AI stud bulls of 3 dairy breeds (Joakimsen et al. 1 97 1 ). There
was a tendency for circulating T4 concentrations during lactation to be lower in dairy cows
selected for high mi lk yield ( Bonczek et af. 1 988, Hart et af. 1 978) . Plasma T4 concentrat ions
during refeeding were negatively correlated with the breeding value of dairy bul ls at 7 months
of age (Sej rsen et af. 1 984). However, other studies did not find differences between selection
l ines of dairy calves in the plasma concentrations of T 3 and T4 ( Land et al. 1 983) . In a partial
least square model the proportion of the variation in energy corrected milk yield explained by
blood T3 concentrat ions was approximately 1 9% ( range 1 2-28%), th is figure varied depending
42

Literature Review
on parity, breed and stage of lactation ( lngvartsen and Friggens 2005 ). Although, there are
inconsistent findings with regard to circulating thyroid hormone concentrations in relation to
milk production, measurement of TSH may give an indirect indication of genetic potential for
mi lk production.
Adrenaline
Adipose t issue is a vital energy source during lactation in the dairy cow. The plasma NEF A,
glycerol and P-hydroxybutyrate concentrations are all h igher in early lactation ruminants than in
the non-lactating state ( Faulkner and Pol lock 1 990a, Murondoti et al. 2004, Sidhu and Emery
1 973, Vernon et al. 1 98 1 ) . Between 20 to 43% of a cow's Iipids may be mobi l ised during the
first two months of lactation to supply the energy demands imposed by milk synthesis (Chi l l iard
et af. 1 984, Chi l l iard et af. 1 99 1 a). During early lactation the NEF A released by adipose tissue
contribute directly and substantial ly to milk fat secretion. It has been estimated that the
proportion of milk fat dcrivcd from body fat was bctwcen 0. 54-0.43 in early lactation (Wi lson et
al. 1 988) . In addition, NEF A mobi l isation contributes to oxidative energy metabolism in non
mammary tissucs, in doing so, spares glucose and amino acids for use by thc mammary gland
(Chi l l iard et af. 2000). Therefore, the abi l ity of an animal to mobil ise adipose t issue may affect
its abi lity to sustain high levels of milk production, particularly during early lactation when feed
intake does not increase as rapidly as the energy requirements.
Catecholamines are among the most effective regulators of adipose tissue l ipo lysis (Lafontan
1 994) . Adipose tissues have an increased responsiveness to catecholamines during early
lactation ( Metz and van den Bergh 1 977) . This may be due to an increase in the number of P
adrenergic receptors per cell ( Jaster and Wegner 1 98 1 ) . Animals with a higher genetic merit for
milk production have consistently h igher rates of l ipo lysis and hormone sensitive l ipase activity
(McNamara 1 994) . Adipose tissue l ipolytic potential can be estimated in vivo by plasma
glycerol or NEF A response to injection or infusion of catecholamines (Chil l iard et al. 1 998b,
Kolver et af. 200 1 , McCutcheon and Bauman 1 986, Xing et af. 1 99 1 ) . The increase in plasma
43

Chapter 2
NEF A concentrations in response to an adrenal ine or fasting chal lenge were not different
between high and low genetic merit selection l i nes ( Mackenzie et al. 1 988, M ichel et al. 1 99 1 ,
Xing et at. 1 99 1 ) . However, a signi ficant (P<O.O I ) l inear relationship was found between daily
milk energy secretion and NEFA area response to an adrenaline chal lenge. The regression
accounted for 67% of the variation in mi lk energy output (McCutcheon and Bauman 1 986) .
NEF A l iberated during l ipolysis can be released into the circulation or re-esterified into newly
formed triacylglycerols. Conversely, glycerol k inase is absent from bovine adipose tissue
which means reuti l isation of glyccrol for triacylglycerol synthesis is negligible (Metz et at.
1 973 ) and glycerol released during l ipolysis must enter the c irculation (Dunshea et al. 1 990).
Plasma NEF A, glycerol and glucose concentrations measured in response to an adrenal ine
chal lenge wi l l provide information on the abi l ity of animals to mobi l ise triacylglycerol from
adipose tissue and glycogen from the l iver.
Summary
Differences between cattle in energy and protein metabol ism are associated with differences in
genetic merit for milk production traits ( Mackenzie et at. 1 988) . Various chal lenges have been
used in an attempt to find rel iable indicators of genetic merit for milk yield. In some
experiments differences in hormone or metabol i te concentrations were found between animals
that differed in genetic merit ( Barnes et al. 1 985, Mackenzie et al. 1 988, Sejrsen et al. 1 984,
Tilakaratne et al. 1 980, Wool l iams et al. 1 993, Xing et al. 1 99 1 , X ing et al. 1 993) . However,
the response variables measured were affected by many different factors including age,
physiological state and feeding regime, therefore the results across experiments were often
inconsistent (Wooll iams and Levendahl 1 99 1 ) . It has been suggested that selection for one
physiological indicator is unl ikely to result in greater genetic gain than using progeny testing.
Rather an index of physiological traits would be necessary to enhance the rate of genetic gain
( Blair et al. 1 990).
44

Literature Review
There have been very few studies that have reported the selection of animals based
physiological traits, such as p lasma IGF-I concentration (Blair et af. 2002, Davis et al. 1 995) .
Those experiments that have been reported show that selection based on a physiological trait
does not improve the correlated production traits. For example, after 5 generations of selection
for high or low plasma IGF-I concentrations in Romney sheep there was a significant difference
in plasma IGF- I concentrations between h igh, low and control (randomly selected). In contrast
there was no difference between l i nes in lamb weani ng weight (Kenyon et al. 2007) . Thus,
attempts to identify physiological indicators of mi lk production traits that could be used to
select h igh genetic merit animals, of both sexes at an early age, have not been successful. No
examples of the appl ication of physiological indicator traits in commercial breeding schemes
have been reported.
In the current study, glucose, adrenal ine and TRH challenges wi l l be conducted on 1 8-month
old dairy heifers that are in the first trimester of pregnancy. I t is l ikely that a genotype showing
increased mi lk output will exhibi t multiple changes in honnone sensitivi ty and nutrient flow
rather than an alteration in a single pathway. Thus, three chal lenges were chosen to provide
data on a number of metabol ic systems regulating nutrient delivery to the mammary gland. This
was expected to give a much clearer overall picture of nutrient part i tioning.
The challenges were chosen in an attempt to simulate aspects of metabol ism that have important
roles in supplying nutrients for lactation. Measurement of plasma NEFA, glycerol and glucose
concentrations in response to an adrenal ine challenge may provide indicators triacylglycerol
mobi l isation from adipose t issue and glycogen from the l i ver. Mobil isation of Iipids from
adipose t i ssues i s l ikely to affect levels of milk production. Plasma insul in, glucose and NE FA
concentrations wi l l be measured in response to a glucose chal lenge. These variables wi l l be
used to quantify pancreatic responsiveness to glucose, uptake of glucose in response to insu l in
and adipose t issue responsiveness to insulin. Insul in p lays an important role in control l ing
carbohydrate metabol ism in the lactating cow (section 2 .6) . Plasma GH, TSH, prolactin and
NEF A wi l l be measured in response to a TRH challenge. Responsiveness of prolactin, GH and
45

Chapter 2
TSH secretion to a TRH chal lenge may provide useful indicators of mi lk production potential .
I n particular, basal or art ificially stimulated p lasma concentrations of GH are greater in dairy
cows and calves selected for high milk yield or yield of a milk component, than average or low
yielding cows ( Beerepoot et al. 1 99 1 , Kazmer et al. 1 986, Levendahl and Sejrsen 1 993,
Levendahl et al. 1 99 1 a, Lukes et al. 1 989, Mackenzie et af. 1 988, Roche et af. 2006b) . GH is
thought to play a crucial role in part itioning nutrients towards the mammary gland during
lactation.
Some studies have demonstrated that responsiveness to chal lenges changes with the age and
energy intake of the animals ( Levendahl and Sejrsen 1 993, Plouzek and Trenkle 1 99 1 ) . Other
studies have shown that endocrine chal lenges conducted when cows are lactating elicit
responses that are more relevant to milk production data compared with challenges conducted i n
pre-partum o r pre-pubertal heifers ( Ingvartsen and Friggens 2005, Lacasse et af. 1 994,
Mantysaari et af. 1 999, Taylor et al. 2006). However, responses to a chal lenge in the lactating
cow may either retlect metabol ic pathways that cause differences in mi lk yield or may retlect
differences in energy balance. Thus, responses to metabol ic chal lenges conducted during
lactation are confounded with energy balance. Response to metabol ic challenges in non
lactating animals may be easier to interpret because energy balance can be controlled more
effectively than in the lactating animal. It is antic ipated that conducting challenges in 1 8-
month-old heifers that are i n the first trimester of pregnancy wi l l minimise compl ications caused
by lactation in interpreting physiological data. There is evidence that the regulation of
metabolic homeostasis is programmed early in l i fe (Barker 2004). Therefore, it seems l ikely
that animals that possess desirable metabol ic characteristics, in terms of nutrient delivery to the
mammary gland during lactation, wi l l give some indication of these characteristics when
chal lenged with hormones or metabolites earl ier in l ife.
46
Literature Review
2.12 Purpose and Scope
Selection of animals for superior milk production has resulted in changes in the production of,
and t i ssue sensitivity to, key metabol ic hormones. The genes regulating these hormones are
prime candidates for investigation through the use of metabol ic challenges ( Roche et at. 2006a).
Many studies have used metabolic challenges in an attempt to find physiological markers for
genetic merit for milk production. Previous studies have not used metabol ic chal lenges to find
metabol ic QTL.
The work described i n this thesis focuses on a number of parameters that describe the essential
features of hormone and substrate responses to exogenous hom10ne or metabolite challenges. It
is anticipated that these responses will be indicative of important aspects of metabolic pathways
involved in milk production. These parameters wi l l be referred to as "metabol ic phenotypes"
and were used to search for QTL.
The New Zealand Holstein-Friesian and Jersey breeds are two populations of cows that had
been segregated for many generations. As such, they might be expected to differ in their genetic
makeup at a substantial number of alleles, some of which might be of economic importance.
Therefore the primary reason the New Zealand Holstein-Friesian and Jersey breeds were used i n
this experiment was that they are l ikely to differ for a number of m i lk characteristic traits. In
this thesis, QTL were identified by investigating the relationship between genetic (DNA)
marker al leles and physical (phenotypic) measurements.
Thus, the current study combined previously used chal lenge methodology with more recent
QTL mapping technology. The objective was to discover QTL that are associated with genes
underlying some of the important metabolic pathways involved in mi lk production. The overall
aim of this thesis was to explore the use of metabol ic phenotypes as a means of improving the
rate of genetic gai n in dairy cattle.
47

Chapter 2
48
CHAPTER 3
Materials and Methods

Chapter 3
3.1 Animal Ethics
Ethical approval for all experimental procedures on animals resulting from the endocrine
chal lenges was obtained from the AgResearch Ethics committee, protocol number 532.
3.2 Location
Experiments were conducted at the AgResearch, Tokanui Research Fam1 on Te Mawhai Road,
Kihikihi, Waikato, New Zealand ( latitude 6345330 S, longitude 27 1 4480 E, New Zealand map
grid reference). 38 04 23 S 1 75 1 9 4 1 E World Geodetic System 1 984.
3.3 Generation of experimental animals
The Holstein-Friesian, Jersey crossbred (FJX8) QTL experiment was designed with thc primary
objective being to identify the chromosomal regions that contribute to the genetic differences
between these two breeds ( Spelman et af. 1 998) . Reciprocal crosses of purebred or 7/8ths
Holstein-Friesian and Jersey animals were carried out to produce six F, bul ls of high genetic
merit. The six F, bulls had an average breeding worth of 1 55 ( Spelman et af. 2004). The F ,
bul ls were sired by 3 Jersey bul ls mated to Holstein-Friesian cows and 3 Holstein-Friesian bulls
mated to Jersey cows ( Spelman et af. 200 I ) . These F, bul ls wi l l be heterozygous at a l l loci that
are fixed (homozygous) for different al lel ic forms in the two breeds. The F, bul ls were mated to
F, cows that were selected from commercial herds. The selection criteria were: a ful ly recorded
three generation pedigree; a level of genetic merit that placed the cow in the top 1 0% of cows in
the country; preferably sired by the same sires as the F, bul ls (Spe1man et al. 200 I ) . To
generate the 800 F2 animals, the 6 F , sires were contract mated to the selected F, cows in
approximately 400 commercial herds (F igure 3 . 1 ). For logistical reasons contract matings
occurred over two consecutive years, 1 999 and 2000.
Parentage testing was undertaken with 1 2 microsate l l i te markers, sire and dam were tested for
F2 animals, while sire only was tested for the F , animals. 1 5 7 F2 animals fai led parentage
50
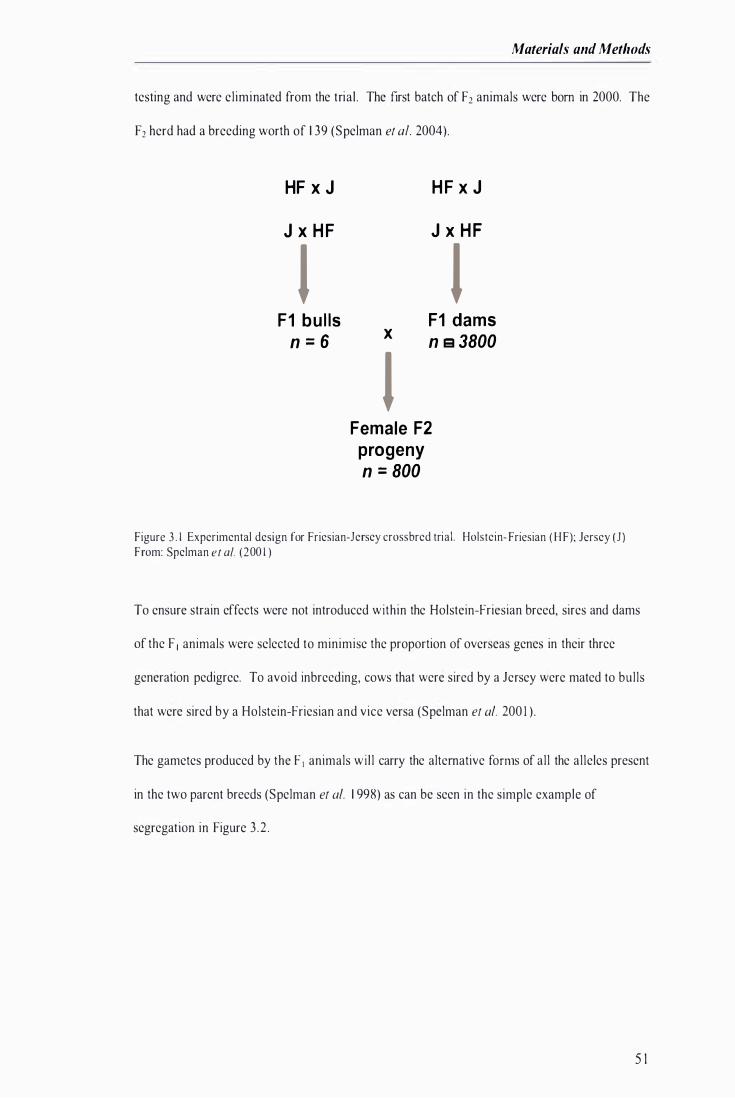
Materials and Methods
testing and were eliminated from the trial . The first batch of F2 animals were born in 2000. The
F2 herd had a breeding worth of 1 39 (Spelman et 01. 2004).
HF X J
J X H F
l F1 b u l ls
n = 6
H F X J
J X H F
l X
F1 dams n 8 3800
l Female F2
progeny n = 800
Figure 3 . 1 Experimental design for Friesian-Jersey crossbred trial . Holstein- Friesian ( HF); Jersey (1 ) From: Spelman et al. (200 1)
To ensure strain effects were not introduced within the Holstein-Friesian breed, sires and dams
of the F I animals were selected to minimise the proportion of overseas genes in their three
generation pedigree. To avoid inbreeding, cows that were sired by a Jersey were mated to bulls
that were sired by a Holstein-Friesian and vice versa (Spelman et al. 200 I ) .
The gametes produced by the F , animals wi l l carry the alternative fon11S of all the alleles present
in the two parent breeds (Spelman et al. 1 998) as can be seen in the simple example of
segregation in Figure 3 .2 .
5 1
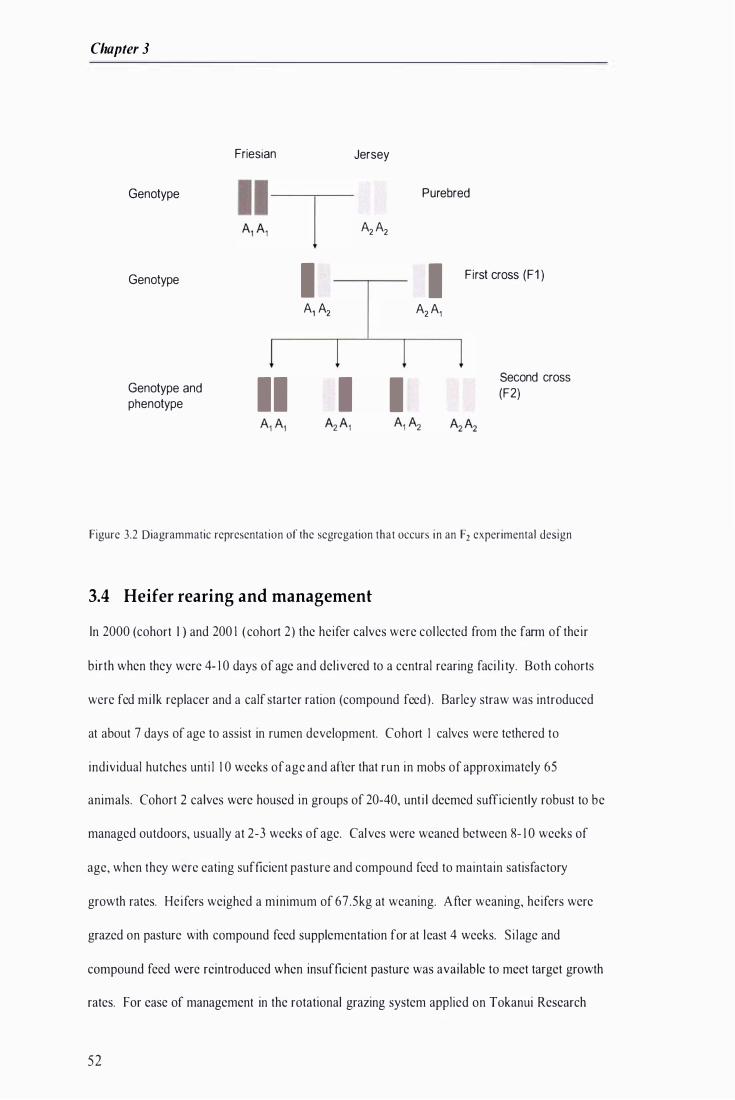
Chapter 3
Genotype
Genotype
Genotype and phenotype
Friesian
�,!T 1 A1 A2
11 1
Jersey
A2 A2
1
Purebred
1 A2 A1
First cross (F1 )
Second cross (F2)
Figure 3.2 Diagrammatic representation of the segregation that occurs in an F2 experimental design
3.4 Heifer rearing and management
ln 2000 (cohort I ) and 200 1 ( cohort 2 ) the heifer calves were col lected from the fann of their
birth when they were 4- 1 0 days of age and delivered to a central rearing faci l i ty. Both cohorts
were fed mi lk replacer and a calf starter ration (compound feed) . Barley straw was introduced
at about 7 days of age to assist in rumen development. Cohort I calves were tethered to
individual hutches unti l 1 0 weeks of age and after that run in mobs of approximately 65
animals. Cohort 2 calves were housed in groups of 20-40, unt i l deemed sufficiently robust to be
managed outdoors, usually at 2-3 weeks of age. Calves were weaned between 8- 1 0 weeks of
age, when they were eating sufficient pasture and compound feed to maintain satisfactory
growth rates. Heifers weighed a minimum of 67.5kg at weaning. After weaning, heifers were
grazed on pasture with compound feed supplementation for at least 4 weeks. Si lage and
compound feed were reintroduced when insufficient pasture was available to meet target growth
rates. For ease of management in the rotational grazing system applied on Tokanui Research
5 2
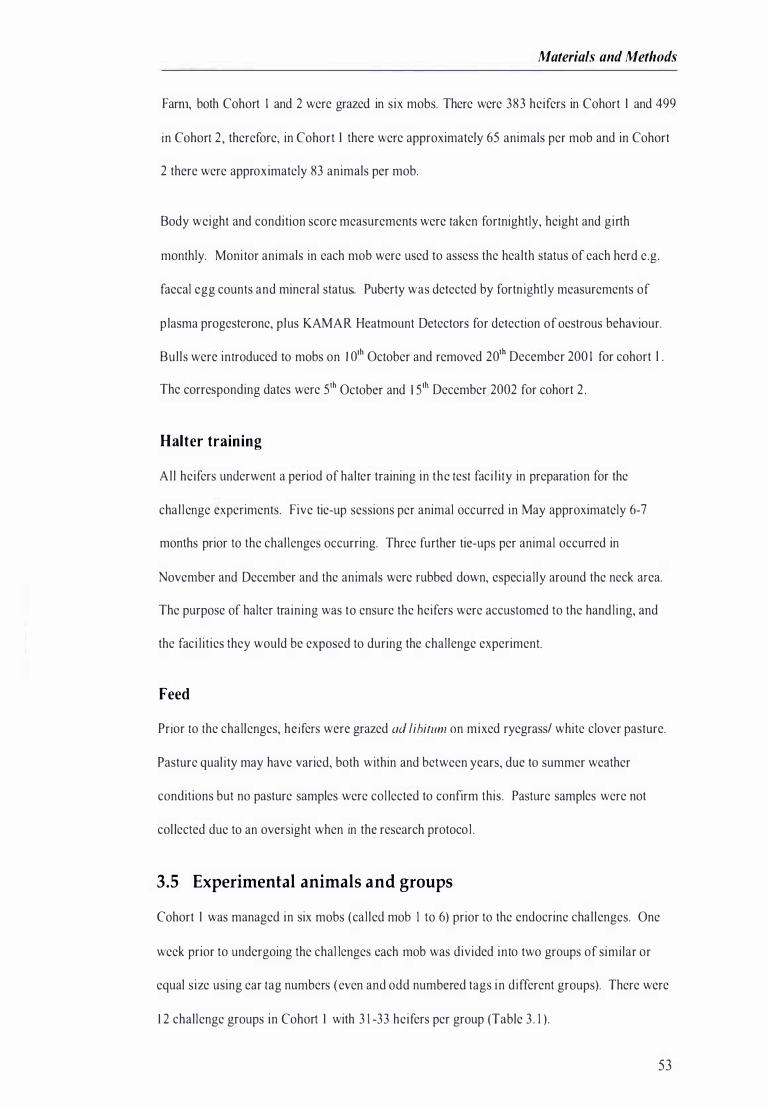
Materials and Methods
Fam1, both Cohort I and 2 were grazed in six mobs. There were 383 heifers in Cohort I and 499
in Cohort 2 , therefore, in Cohort I there were approximately 65 animals per mob and in Cohort
2 there were approximately 83 animals per mob.
Body weight and condition score measurements were taken fortnightly, height and girth
monthly. Moni tor animals in each mob were used to assess the health status of each herd e.g.
faecal egg counts and mineral statu . Puberty was detected by fortnightly measurements of
p lasma progesterone, plus KAMAR Heatmount Detectors for detection of oestrous behaviour.
Bul ls were introduced to mobs on 1 01" October and removed 20lh December 200 I for cohort I .
The corresponding dates were Slh October and I Slh December 2002 for cohort 2 .
Halter training
Al l heifers underwent a period of halter training in the test faci l ity in preparation for the
chal lenge experiments. Five tie-up sessions per animal occurred in May approximately 6-7
months prior to the challenges occurring. Three further tie-ups per animal occurred in
November and December and the animals were rubbed down, especial ly around the neck area.
The purpose of halter training was to ensure the heifers were accustomed to the handling, and
the faci l ities they would be exposed to during the challenge experiment.
Feed
Prior to the challenges, heifers were grazed ad libitum on mixed ryegrassl white clover pasture.
Pasture qual ity may have varied, both within and between years, due to summer weather
conditions but no pasture samples were col lected to confirm this. Pasture samples were not
col lected due to an oversight when in the research protocol .
3.5 Experimental animals and groups
Cohort I was managed in six mobs (cal led mob I to 6) prior to the endocrine chal lenges. One
week prior to undergoing the chal lenges each mob was divided into two groups of similar or
equal size using ear tag numbers ( even and odd numbered tags in different groups). There were
1 2 challenge groups in Cohort I with 3 1 -33 heifers per group (Table 3 . 1 ) .
53

Chapter 3
Table 3 . 1 Number of animals per group and cohort, their age (days) and l ive weight (kg) at the time they were challenged
Age, mean ± sd Age range Li ve weight Live weight
Group N (days) (days) mean ± sd (kg) range (kg)
32 533 ± 4.3 527-550 355 .3 ± 2 1 .5 3 1 1 -397
2 3 1 538 ± 5 .7 532-558 352 . 1 ± 25 .5 297-420
3 32 535 ± 3 .5 528-542 342 .6 ± 20.0 305-388
4 3 1 540 ± 5 .0 532-558 344.7 ± 22.5 294-385
5 32 536 ± 4.8 525-545 345.2 ± 24.9 288-4 1 4
6 32 543 ± 6 .2 530-564 34 1 .6 ± 29.8 30 1 -420
7 32 544 ± 1 2. 1 529-578 343 . 1 ± 29.5 285-399
8 3 3 546 ± 8 .7 536-568 339. 1 ± 28.5 28 1 -379
9 3 1 544 ± 1 2 .5 528-57 1 344.4 ± 29.6 29 1 -4 1 2
1 0 32 549 ± 1 5 . 1 535-586 347.7 ± 27.5 277-399
1 1 33 556 ± 1 9 .2 523-582 346.3 ± 25 .2 290-399
1 2 32 56 1 ± 2 1 .7 528-605 346.3 ± 3 1 .5 263-4 1 4
Cohort 1 383 544 ± 1 4. 1 523-605 345.7 ± 27.0 263-420
1 3 3 6 528 ± 1 1 .4 507-557 358.2 ± 2 1 .8 3 1 5-404
1 4 3 7 528 ± 1 1 . 8 508-552 355 .6 ± 22 .8 3 1 7-407
1 5 3 7 5 35 ± 1 1 .3 5 1 8-569 358 .0 ± 24.9 290-4 1 5
1 6 35 535 ± 1 3 .6 508-559 364. 1 ± 2 1 . 3 320-42 1
1 7 37 530 ± 1 1 .0 5 1 6-564 345 .7 ± 23 . 1 303-396
1 8 35 533 ± 1 0 . 1 5 1 3-552 344.7 ± 22.4 293-398
1 9 35 546 ± 1 1 .0 5 1 7-564 357 .0 ± 22.3 3 1 6-408
20 34 550 ± 1 2 .4 524-580 353 .8 ± 1 9 .5 305-390
2 1 3 3 544 ± 1 2 .0 5 1 7-565 346.6 ± 27 .7 258-393
22 35 549 ± 1 3 .5 522-574 347.5 ± 24.6 295-4 1 7
23 35 552 ± 1 3 .0 52 1 -576 343 .8 ± 27 .9 275-40 I
24 37 556 ± 1 1 . 7 522-576 340.9 ± 1 9 .0 309-379
25 36 564 ± 1 2 .9 532-586 378.2 ± 33 .5 3 1 5-45 1
26 37 563 ± 1 2 . 1 532-584 380.3 ± 33 . 1 270-434
Cohort 2 499 544 ± 1 7.0 507-586 355.4 ± 27.7 258-451
Total 882 544 ± 1 5.8 507-605 3 5 1 . 1 ± 27.8 258-45 1
The purpose built , chal lenge faci l ity could hold a maximum of 37 animals per chal lenge. The
six mobs in Cohort 2 had approximately 83 animals per mob mobs. Thus if they were split into
two groups of 4 1 or 42 animals this would exceed the capacity of the challenge fac i l ity.
54
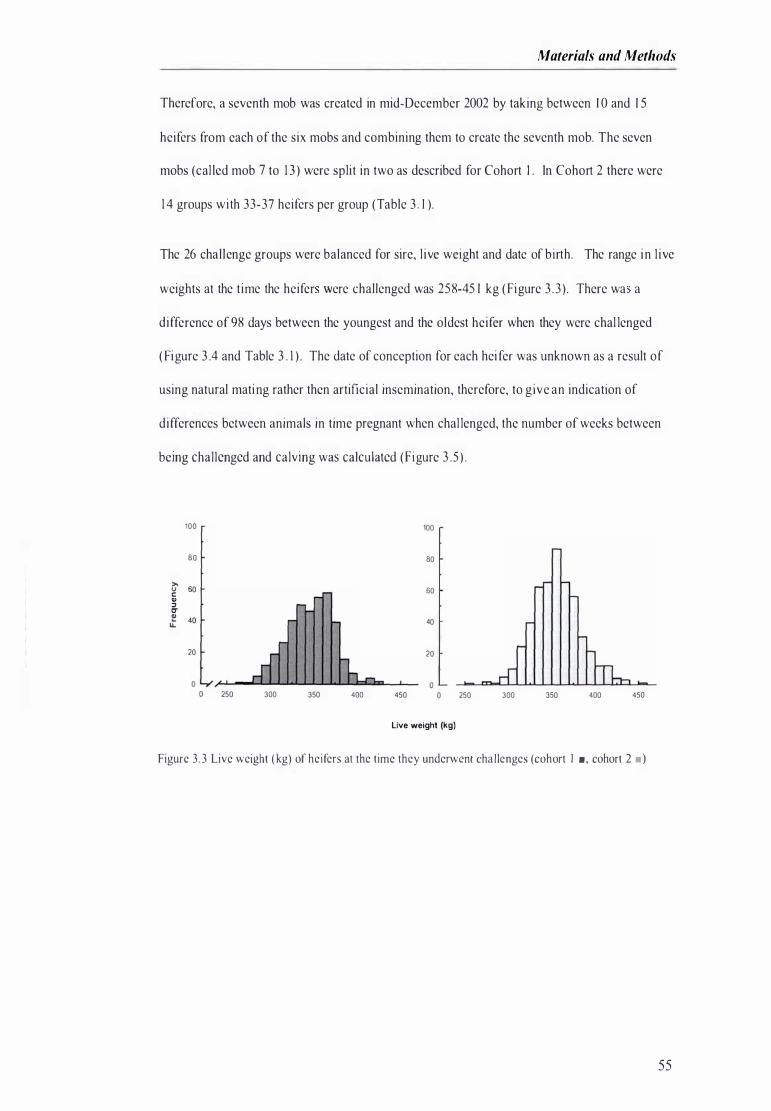
Materials and Methods
Therefore, a seventh mob was created in mid-December 2002 by taking between 1 0 and 1 5
heifers from each of the six mobs and combining them to create the seventh mob. The seven
mobs (cal led mob 7 to 1 3 ) were split in two as described for Cohort I . In Cohort 2 there were
1 4 groups with 33-37 heifers per group (Table 3 . 1 ).
The 26 chal lenge groups were balanced for sire, l ive weight and date of birth. The range in l ive
weights at the t ime the heifer were challenged was 258-45 1 kg ( Figure 3 . 3 ) . There wa a
difference of 98 days between the youngest and the oldest heifer when they were chal lenged
( Figure 3 .4 and Table 3 . 1 ) . The date of conception for each hei fer was unknown as a result of
using natural mating rather then artificial insemination, therefore, to give an indication of
differences between animals in time pregnant when chal lenged, the number of weeks between
being challenged and calving was calculated (Figure 3 .5 ) .
100
80
� 60 c Cl) ::l a � 40
20
250 300
100
80
60
40
20
350 400 450 250
Live weight (kg)
300 350 400 450
Figure 3 .3 Live weight ( kg) of heifers at the time they underwent chal lenges (cohort 1 . , cohort 2 .)
55
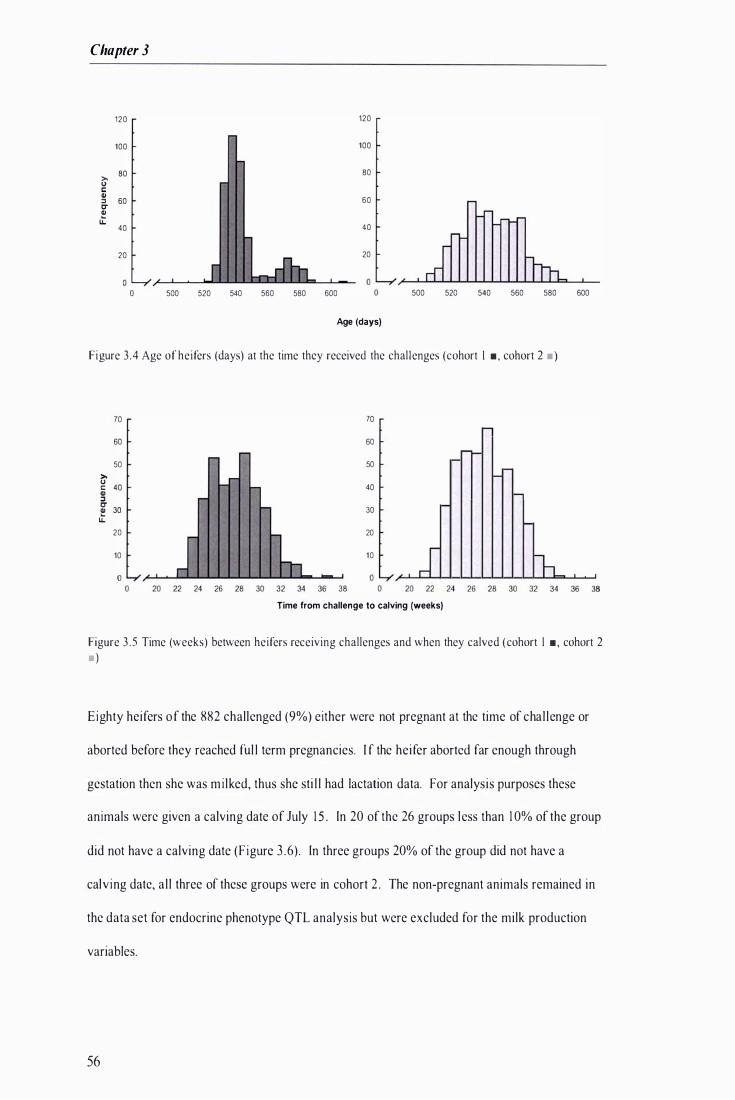
Chapter 3
120
100
>- 80 u I: .. ::l 60 c-Ol � 40
20
o
120
100
80
60
40
20
500 520 540 560 580 600 500 520 540 560 580 600
Age (days)
Figure 3 .4 Age of heifers (days) at the time they received the chal lenges (cohort I . , cohort 2 .)
>U
70 60 50
I: 40 .. ::l g- 30 �
20 10
70 60
r-I-50 40 30 20 10 J h
Time from challenge to calving (weeks)
Figure 3 . 5 Time (weeks) between heifers receiving challenges and when they calved (cohort I . , cohort 2 .)
Eighty heifers of the 882 challenged (9%) either were not pregnant at the time of chal lenge or
aborted before they reached ful l term pregnancies. I f the heifer aborted far enough through
gestation then she was mi lked, thus she sti l l had lactation data. For analysis purposes these
animals were given a calving date of July I S . In 20 of the 26 groups less than 1 0% of the group
did not have a calving date (Figure 3 .6) . In three groups 20% of the group did not have a
calving date, a l l three of these groups were in cohort 2 . The non-pregnant animals remained in
the data set for endocrine phenotype QTL analysis but were excluded for the milk production
variables.
56
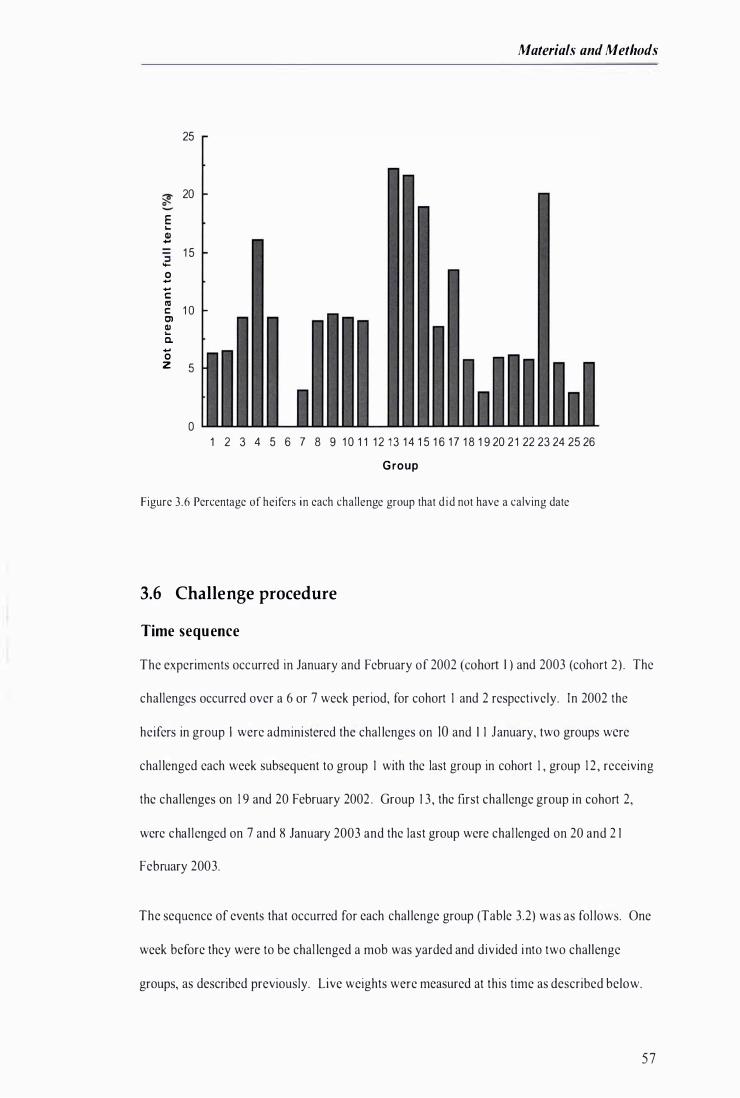
Materials and Methods
25
� 20
E "-Cl) ...
::l 1 5 ..... 0 ...
... c: lIS c: 1 0 Cl Cl) "-Q.
... 0 z 5
o 1 2 3 4 5 6 7 8 9 1 0 1 1 1 2 1 3 1 4 1 5 1 6 1 7 1 8 1 9 20 2 1 22 23 24 25 26
G roup
Figure 3 .6 Percentage of heifers in each challenge group that d id not have a calving date
3.6 Challenge procedure
Time sequence
The experiments occurred in January and February of 2002 (cohort I ) and 2003 (cohort 2 ) . The
challenges occurred over a 6 or 7 week period, for cohort I and 2 respectively. In 2002 the
heifers in group I were administered the chal lenges on 10 and I I January, two groups were
chal lenged each week subsequent to group I with the last group in cohort I , group 1 2 , receiving
the challenges on 1 9 and 20 February 2002 . Group 1 3 , the first challenge group in cohort 2,
were chal lenged on 7 and 8 January 2003 and the last group were chal lenged on 20 and 2 1
February 2003.
The sequence of events that occurred for each chal lenge group (Table 3.2) was as fol lows. One
week before they were to be chal lenged a mob was yarded and divided into two challenge
groups, as described previously. Live weights were measured at this time as described below.
5 7
Chapter 3
On day I of the chal lenge period the chal lenge group was brought into the yards and jugular
catheters were inserted, described below. The group was returned to pasture for approximately
3 hours before they were brought into a holding yard with a sand base at 1 9 JOh for an overnight
fast. When each group was yarded for the overnight fast a health check was carried out to
ensure all animals were in good health after the catheters had been in place for several hours,
described below.
Two challenges were performed on day two of the challenge period while the animals were kept
fasting. The tests were an adrenal ine chal lenge at 8 .00h, and a glucose tolerance test at 1 2 .00h.
After the completion of the glucose tolerance test hei fers were returned to pasture at
approximately 1 5 JOh. A thyrotropin-releasing hormone (TRH) challenge was performed on
day three of the chal lenge period. Heifers were returned to pasture after the 4 h blood sample.
58
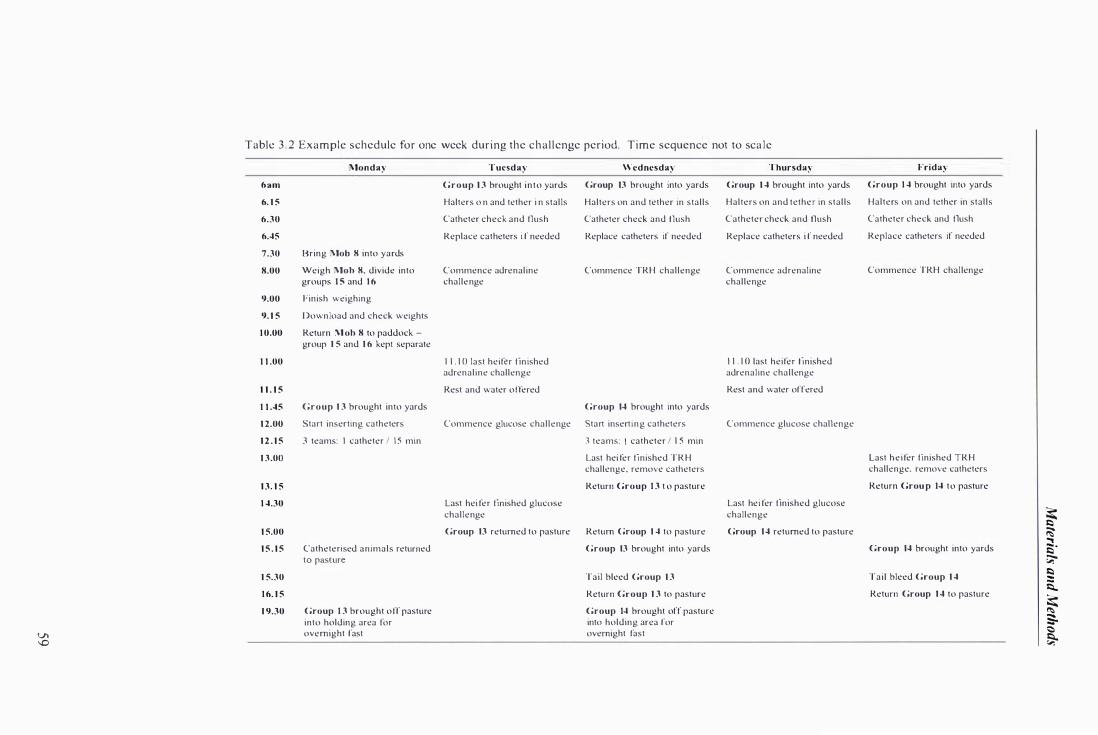
Table 3 . 2 Example schedule for one week during the c h a l l enge period. Time sequence not to scale
Monday Tuesday Wednesday Thursday Friday 6am Group 1 3 brought into yards Group 13 brought into yards Group 1 4 brought into yards Group 1 4 brought into yards
6. 1 5 Halters o n and tether i n stalls Halters on and tether in stalls Halters on and tether in stalls Halters on and tether in stalls
6.30 Catheter check and flush Catheter check and flush Catheter check and flush Catheter check and flush
6.45 Replace catheters i f needed Replace catheters if needed Replace catheters i f needed Replace catheters if needed
7.30 Bring Mob 8 into yards
8.00 Weigh Mob 8. divide into Commence adrenaline Commence TRH challenge Commence adrenaline Commence TRH challenge
groups I S and 1 6 challenge challenge
9.00 Finish weighing
9. 1 5 Download and check weights
1 0.00 Return M ob 8 to paddock -group 1 5 and 1 6 kept separate
1 1 .00 1 1 . 1 0 last heifer finished 1 1 . 1 0 last heifer finished adrenaline challenge adrenaline challenge
1 1 . 1 5 Rest and water offered Rest and water offered
1 1 .45 Group 1 3 brought into yards Group 14 brought into yards
1 2.00 Start inserting catheters Commence glucose challenge Start inserting catheters Commence glucose challenge
1 2 . 1 5 3 teams: I catheter / 1 5 min 3 teams: I catheter / 1 5 min
1 3.00 Last hei fer finished TRH Last hei fer finished TRH
challenge. remove catheters challenge. remove catheters
1 3. 1 5 Return Group 1 3 t o pasture Return Grou p 14 to pasture
1 4.30 Last hei fer finished glucose Last hei fer finished glucose
� challenge challenge
1 5.00 Group 13 returned to pasture Return Group 1 4 to pasture Group 1 4 returned to pasture � ... 1 5 . 1 5 Catheterised animals returned Group 13 brought into yards Group 14 brought into yards is'
to pasture � 1 5.30 Tail bleed Group 1 3 Tail bleed Group 1 4
� ::: 1 6. 1 5 Return Group 1 3 to pasture Return Group 1 4 to pasture
l::I.. � 1 9.30 Group 1 3 brought off pasture Group 14 brought off pasture
into holding area for into holding area for So overnight fast overnight fast <::> V'I � \0
Chapter 3
Live weight measurements
Animals were weighed, one week prior to being challenged, using load-cell scales (Trutest, NZ
Ltd) . The l ive weights were used to determine the doses of epinephrine, glucose and TRH
given in the chal lenges.
Catheterisation
Catheter insertion
Jugular catheters (Becton-Dickinson Angiocath ™ (product # 382268) - 1 4 Ga, 3 .25"; 2 . 1 x 83
mm, coated with fluorinated ethylene polymer (FEP) to reduce the incidence of bui ld-up of
fibrin c lots), were inserted under local anaesthesia ( Lignocaine 2%) in a jugular vein on the day
before the first chal lenge. An extension assembly was attached to the end of the catheter
al lowing easy access to the side of the neck for b lood sampl ing. This catheter was used for both
infusion of solution and blood sampling. Once the catheter was in p lace each animal was given
an intravenous infusion, via the catheter, of I Oml of an oxytetracycl ine based broad spectrum
antibiotic (B ivatop® 200, Boehringer l ngelheim (NZ) Ltd) to reduce the risk of infection. The
catheters were kept patent overnight with heparinised (50rU/ml ) steri le sal i ne. A detailed
description of the catheter insertion procedure and the equipment and consumables used can be
found in Appendix A. Each group of heifers was taken off pasture at I I :45h, once catheters had
been inserted in a l l animals the group was returned to pasture at approximately l 5 :00h. The
paddock to which they were returned and the holding yards used for the overnight fast had no
objects such as tree stumps and the fences, gates and edge of the water troughs had electric
fence outriggers attached to them so the heifers were not able to rub and pull their catheter out.
Catheter patency
On both challenge days, hei fers were brought i nto the yards at 6 .00h, fitted with halters and
taken to their pre-allocated stal ls in the challenge fac il ity. Because numerical tag order would
reflect the age of the animals, stalls were al located randomly to avoid any possible confounding
effects of age and stall position. The same sta l l al location was used on both chal lenge days.
Once the animals were tethered the catheters were checked for patency and flushed with 5ml of
60

Materials and Methods
heparinised (501U1ml) sterile saline. Any animals found to have a non-patent catheter had a
new catheter inserted and the event recorded. Thirty-eight, of the 882 (4 .3%) heifers that were
catheterised for this trial, needed a second catheter to be inserted, either because the catheter
was no longer patent or it had been pul led out through the animal rubbing.
Catheter removal
Fol lowing the col lection of the 4 h blood samples, for the TRH challenge, heifers were injected
intravenously, through the catheter, with 10 ml of Bivatop 200 ( Boehringer lngelheim (NZ) Ltd)
to reduce the risk of infection, then the catheters were removed. Pressure was applied to the site
for a minimum of I minute to ensure the puncture wound into the vein closed adequate ly. The
heifers were then returned to pasture.
Health management
The animals were monitored closely for il l-effects on their health caused by the experimental
procedure, in particular in relation to the indwelling catheters. Whilst catheters were in place,
and for 5 days after catheter removal, the animals were checked twice dai Iy. They were then
checked once a day for a further 5 days. I f any problems were noted the on-cal l veterinarian
was to be notified and action taken. No animal s required veterinary attention in relation to the
procedures conducted in this experiment.
Challenges
Adrenaline challenge
The product used for the adrenaline chal lenge was (±)-Adrenaline hydrochloride ( Sigma
Aldrich, product number E4642, batch number I I OK 1576). The dose administered for the
adrenaline challenge was l A Ilg per kilogram of heifer live weight, this dose was used
successfully, in an experiment by Kolver et a!. (200 I), to elicit an increase in EF As, glycerol
and glucose above baseline concentrations in early lactation Holstein-Friesian cows. The
concentration of the stock solution was 80 Ilg per ml of steri le saline. Adrenaline Hel solution
is light and air-sensitive therefore, the stock solution was not prepared until the night before use
6 1

Chapter 3
to minimise any loss of activity. Syringes fi l led with adrenaline solution were wrapped in
aluminium foi l to protect the contents from l ight before administration. L-ascorbic acid was
added to the stock solution to act as an antioxidant. Methods used for mixing up chal lenge
stock solution and calculating the dose for each heifer are given in Appendix B .
The adrenal ine challenge was administered through the catheter as a bolus dose over a 1 0
second period. B lood was sampled serial ly through the catheter at -20, - 1 0, -5, 4, 1 0, 1 5, 20, 30,
45, 60, 90, 1 20 m inutes relative to the time of adrenaline injection. The catheter was flushed
with 5 ml heparin ised (50 IU/ml) sterile sal ine between bleeds. B lood was transferred to 1 0 ml
heparinised blood collection tubes (Becton D ickinson Vacutainer®, Becton-Dickinson and
Company, USA) and stored on ice.
Glucose challenge
For the glucose chal lenge, a dose of OJ g glucose (Bomac Laboratories Limited, Wiri Station
Road, Manukau C ity, Auckland, New Zealand) per ki logram of heifer l i ve weight was
administered as a bolus injection of the stock solution (400 g/L) from 500 ml Bomaflex ready to
use packs ( separate pack for each animal) . Refer to Appendix B for a description of the
methods used for calculating the dose for each heifer.
The glucose solution was administered through the catheter over a period of 1 -2 minutes. The
exact t ime taken for each animal to receive her dose was recorded. B lood was sampled serially
through the catheter at -20, - 1 0, -5, 2 , 5 , 1 0, 1 5, 20, 30, 45, 60, 90, 1 20 minutes relative to the
start of the glucose administration for the pre-chal lenge samples and relative to the end of
glucose administration for the samples col lected after the chal lenge. The catheter was flushed
with 5 ml heparinised (50IU/ml) steri le saline after each sample col lection. B lood samples were
transferred to 1 0 ml heparinised blood collection tubes (BD Vacutainer®, Beckton, Dickson and
Company, USA) and stored on ice.
62

Materials and Methods
After the completion of the glucose tolerance test al l heifers received a 1 0 ml dose of Bivatop
200 (Boehringer lngelheim (NZ) Lld) through the catheter fol lowed by a 1 0 ml flush with
heparinised saline. Animals were returned to pasture at approximately 1 5 .30h.
Thyrotropin-Releasing Hormone challenge
The product used for the TRH chal lenge was Sigma Aldrich, product number 83 1 77,
Thyrotropin releasing hom10ne B ioChemika �98.0% (HPLC ), batch number 36 1 393. The dose
administered was 0.3 Ilg TRH per ki logram of heifer live weight. The concentration of the
stock solution was 1 5 Ilg per ml of sterile sal ine. The TRH solution is l ight and air sensitive,
therefore, the stock solution was not prepared until the night before use to minimise loss of
activity. Syringes fi l led with TRH solution were wrapped in aluminium foil to protect the
contents from light before administration. The method used for mixing chal lenge stock solution
and calculating the dose for each heifer is in Appendix B.
The TRH challenge was administered through the catheter as a bolus over a 10 second period.
Blood samples were collected at -20, - 1 0, -5, 2 , 5, 1 0, 1 5, 20, 30, 45, 60, 90, 1 20, 1 50 minutes
relative to the time of the TRH infusion. The catheter was flushed with 5 m1 heparinised
(50IU/ml) sterile sal ine after each sample was col lected. Blood from samples col lected from -
30 to 1 50 minutes were transferred to 1 0 ml heparinised blood co llection tubes (BD
Vacutainer�, Beckton, Dickson and Company, USA) and stored on ice and processed as
described in the next sect ion.
Blood processing
All blood samples collected were processed in the same way. Plasma was separated by
centrifugation (2700rpm, 5°C, 5min) within 2 hours of collection. The plasma was dispensed
into 6 pre-labelled cryovials, refrigerated at 4°C then at the end of the each chal lenge day
transported on ice to the storage faci l ity where they were placed in -86°C freezers until analysed
for hormones and metabol i tes.
63
Chapter 3
3.7 Hormone Assays
All the hormone and metabol ite assays were carried out in a commercial laboratory, Alpha
Scientific Ltd. ( Hami lton, New Zealand) unless otherwise stated.
Growth Hormone
Concentrations of GH in plasma were determined using double antibody radioimmunoassay that
was validated for bovine use by Alpha Scientific Ltd. GH (bovine GH, AFP 1 1 1 82B) for
iodination and the standards, and also the primary antibody of rabbit, anti-Ovine GH-3 (AFP
AFP08022 I ORb) were obtained from the National Hormone and Peptide Program, Cal ifornia,
USA courtesy of Dr Parlow. The GH was iodinated using the l odogen method (Appendix C) .
The second antibody ( sheep anti-rabbit) IgG was raised in-house.
Briefly, on day I standards and controls ( I OOfll standard or control, 1 00fll fi l ler plasma and
1 00fll protein buffer), samples ( l OOfll sample and 200fll protein buffer) had primary antibody
( I OOfll, at a I : 1 30,000 dilution, 1 0,000 to 1 5,000 counts per minute) added and were i ncubated
for 24 hours at room temperature. Iodinated GH was added the next day ( I OOfll ) and i ncubated
for a further 24 hours at room temperature. The second antibody was added on day 3 ( I OOfll,
I : 80,000 dilution ) and tubes were incubated for - 1 8 hours at 4°C. Final ly, 1 ml of wash buffer
was added, tubes were centrifuged for 20 minutes at 2500rpm and at 4°C; the supernatant t ipped
off and counts per minute determined on a gamma counter ( Packard Cobra-I I , Auto Gamma).
The intra-assay coefficient of variation (CV) was 9 .67% and the inter-assay CV was 1 9.0 I %.
The maximum detectable concentration for GH assay was 40 nglmL. The minimum detection
l imit for the GH was 0.25 nglmL.
Insul in-like growth factor I
The concentration of IGF-I was measured using a two-site immunoenzymometric assay
(OCTEl A IGF- I ; Immunodiagnostic Systems Ltd, Boldon, U .K . ) based on the work of
Daughaday et af. ( 1 980) . The mean value of control I was 56 flg/I with a CV of 8 .4% and the
mean value of control 2 was 208 flg/I with a CV of 8.2%.
64

Materials and Methods
Prolactin
Concentrations of plasma prolactin were determined using a commercially avai lable enzyme
l inked immunosorbent assay (ELISA) kit (Bovine Prolactin, E IA- 1 549, DRG International Inc. ,
Mountainside, J , USA) based on the sandwich principle. Three controls were run, a h igh,
medium and low concentration contro l . The mean and inter assay CVs were: high 48.9 nglml
and 1 1 . 3%; medium 22.7 ng/ml and 1 3 .9%; low 8.3 ng/ml and 30%.
Thyroid Stimulating Hormone
Concentrations of TSH in plasma were determined using double antibody radioimmunoassay as
was validated for bovine use by Alpha Scientific Ltd. TSH (bovine TSH, AFP8755B) for
iodination and the standards, and also the primary antibody of rabbit, anti-Bovine TSH (AFP
AFP642482) were obtained from the National Hormone and Peptide Program, Cal ifornia, USA
courtesy of Dr Parlow. The TSH was iodinated using the Chloramine T method (Appendix C) .
The second antibody (sheep anti-rabbit) IgG was raised in-house.
Briefly, on day I standards and controls ( 1 00111 standard or control , 1 00111 fil ler plasma and
1 00111 protein buffer), samples ( 1 00111 sample and 200f.l1 protein buffer) had primary antibody
( 1 00111, at a I : 70,000 di lution) added and were incubated for 24 hours at room temperature.
Iodinated TSH was added the next day ( 1 0011 1 ) and incubated for a further 24 hours at room
temperature. On the third day, the second antibody was added ( 1 00111 , 1 : 75 ,000 di lution) and
tubes were incubated for - 1 8 hours at 4°C. Final ly, I ml of wash buffer was added, the
centri fuge was primed to 4°C before use, and tubes were centrifuged for 20 minutes at 2500rpm;
the supernatant was decanted and counts per minute determined on a 1 470 Wizard Automatic
Gamma Counter ( Perkin-Elmer L ife Sciences, Wallac, Turku, Finland ) .
I nsulin
I nsul in concentrations in plasma were measured in a chemiluminescence assay as per the
method given in the IMMULITE® Insul in (P ILKIN-6, 2002-07- 1 8 ) kit insert in the Alpha
Scient ific Ltd Laboratory, Hamilton, New Zealand. The assay uses monocIonal and polycIonal
65
Chapter 3
antibodies for the capture and detection, respecti vely, of insulin and was carried out in the
Immulite® ( Diagnostic Products Corporation, Los Angeles, CA, USA). The mean, standard
deviation and inter assay CVs were: high 3 .62 ± 0. 1 9 nglml and 5 .23%; low 1 .45 ± 0.08 nglml
and 5 . 1 8%.
3.8 Metabolite Assays
Metabol i te concentrations were determined by Alpha Scientific Ltd, Hamilton, New Zealand
using enzyme immunoassay, read on a spectrophotometric auto-analyser ( Hitachi 7 1 7, H itachi
Ltd, Tokyo, Japan) . Intra-assay coefficients of variation were not assessed by Alpha Scientific
Ltd for the metabolite assays.
Non-esterified Fatty Acids
Concentrations of NEFA in plasma samples were determined using a commercially avai lable
acyl-CoA oxidase-based colorimetric kit (Wako NEF A-C, Wako Pure Chemical Industries,
Os aka, Japan) . The inter-assay coefficient of variation was 5%.
Glucose
Plasma glucose concentrations were detem1ined using the Roche Glucose HK l iquid assay kit
(catalogue number 1 44752 1 , Roche Diagnostics Corporation, [ndianapolis, IN, USA). This kit
is based on the work of Peterson and Young ( 1 968) . The inter-assay coefficient of variation
was 3%. The minimum detectable concentration of this assay is 0. 1 1 mmolllitre.
Glycerol
Glycerol concentrations in p lasma samples were determined using an enzymatic, colorimetric
method using a commercial kit ( Randox glycerol kit, catalogue number GY 1 05, Randox
Laboratories Ltd, Crumlin, UK) or ( Randox, Mississauga, ON, Canada). The inter-assay
coefficient of variation was 5%. Minimum detectable concentration for glycerol was I mmolll,
therefore anything less than I mmolll was recorded as zero.
66
3.9 Other data collection
Milk Yields
Materials and Methods
A very dry summer, resulting in insufficient food supply to support optimal lactation, occurred
during the first lactation of cohort 1 . To reduce the impact of feed and weather differences
between the cohorts, phenotypes generated from the second lactation data were used for
conducting QTL searches in this study.
Daily milk volumes, both am and pm, were col lected. In addition, every fortnight mi lk fat, mi lk
protein, casein, and lactose yield over a 24 hour period were col lected (Spelman et al. 2004) .
Once the animals had calved they had weekly condition scores and l ive weight measurements at
least twice a week. During the econd lactation for cohort I , and the first lactation for cohort 2 ,
an automatic weighing sy tem was instal led in the mi lking shed which ensured that on average
over 80% of the animals had two l ive weights recorded each day ( Spelman et al. 2004 ). There
was not a 1 00% rate or recording animal weights twice a day due to errors that occurred in the
weighing process or due to other unknown factors, for example, if a cow was not correctly on
the weighing platfonn an over or under estimation or the weight would have occurred and the
measurement was not entered into the database.
Genotyping
Genomic DNA was prepared from whole blood from a total of 1 679 animals within the trial
pedigree (846 F2 daughters, six FI sires, 796 FI dams, and 1 3 selected Fo sires ). An initial
whole genome scan was conducted by genotyping each animal for 283 microsatel l ite markers,
obtained primari ly from published marker maps. The mean interval between microsatel l ite
markers was 1 0.56 ± 7 .67 cM. This marker density was considered adequate for an initial
investigation of the genome. This map wi l l be added to with a 50,000 SNP genome scan on
which the phenotypes wi l l be run again and wi l l provide greater accuracy of estimation of QTL
locations due to the greater density of markers.
67
Chapter 3
3.10 Data Processing
Approximately 27,300 blood samples were collected from the 882 heifers that were chal lenged,
as a result, \ 64,000 cryovials of p lasma were stored and subsequently analysed for \ -5
metabolites/hormones. Despite appl ication of qual i ty control procedures to each stage of
sample collection, storage, analysis and data entry, errors were st i l l introduced. Because of the
large scale of this trial, it was not possible for one person to have control over every process,
meaning that there was a very real opportunity for errors to occur. Therefore, to have
confidence in the data systematic checks were conducted.
Data c leaning is the process of detecting, diagnosing and editing faulty data (Van den Broeck et
al. 2005) and was carried out on the data set used for this thesis to correct errors or at least
minimise their impact on the study. Random errors in a large data set such as in the current
study are expected but would not have a major influence on the results, rather would simply
contribute to the error variance. Conversely, systemic errors may have a considerable impact on
the outcomes. A number of systemic errors were identi fied in the endocrine chal lenge data
(Table 3 . 3 ) . These systemic errors generally affected the results of al l the animals in a challenge
group for a particular time point, causing the effect of chal lenge group on the endocrine results
to be greater than it should be. Therefore it was important to identity and correct these types of
errors to ensure the most accurate data set was used to commence analyses.
Response curves of each animal and the means per chal lenge group were p lotted and assessed
visually. General trends and patterns of responses were identified and data points that did not
fol low these general trends or apparent systemic errors (Figure 3 .7 to 3 .9 ) were noted for further
investigation. Once identi fied, analysis of the questionable data were undertaken to determine
whether it was val id or erroneous. The major types of errors found are given in Table 3 . 3 .
68
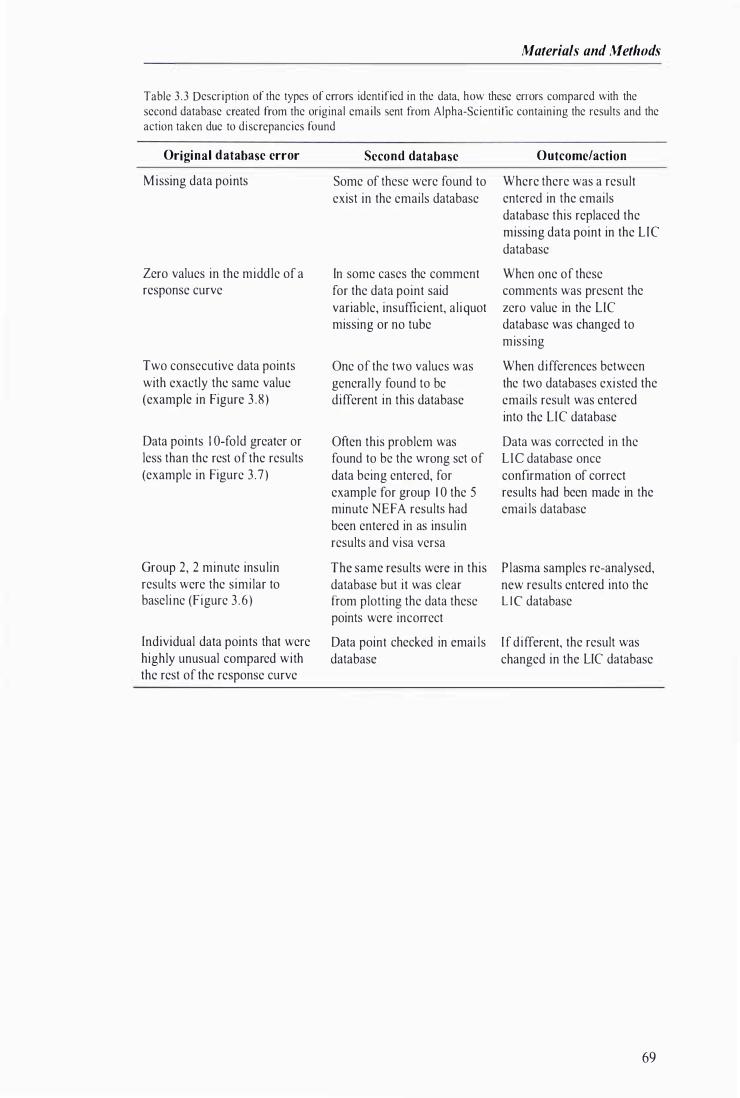
Materials and Methods
Table 3 .3 Description of the types of errors identified in the data, how these errors compared with the second database created from the original emails sent from Alpha-Scientific containing the results and the action taken due to discrepancies found
Original d atabase error Second database Outcome/action
Missing data points Some of these were found to Where there was a result exist in the emails database entered in the emails
database this replaced the missing data point in the LIe database
Zero values in the middle of a In some cases the comment When one of these response curve for the data point said comments was present the
variable, insufficient, aliquot zero value in the LIe missing or no tube database was changed to
mlssll1g
Two consecutive data points One of the two values was When differences between with exactly the same value generally found to be the two databases existed the (example in Figure 3 . 8 ) different in this database emails result was entered
into the LIe database
Data points I O-fold greater or Often this problem was Data was corrected in the less than the rest of the results found to be the wrong set of LIe database once (example in Figure 3 .7 ) data being entered, for confirmation of correct
example for group 1 0 the 5 results had been made in the minute NEF A results had emai ls database been entered in as insulin results and visa versa
Group 2, 2 minute insulin The same results were in this Plasma samples re-analysed, results were the similar to database but it was clear new results entered into the baseline (Figure 3 .6 ) from plotting the data these L Ie database
points were incorrect
Individual data points that were Data point checked in emai ls I f different, the result was highly unusual compared with database changed in the LIe database the rest of the response curve
69
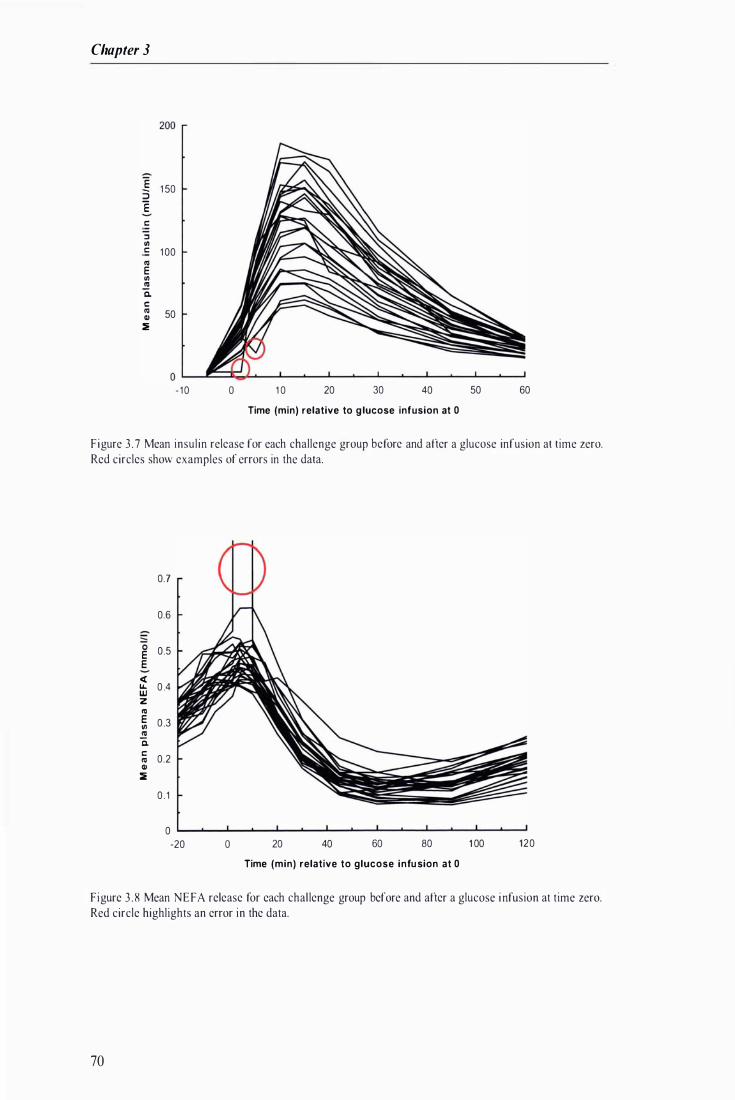
Chapter 3
E 1 50 3
E c :J en c 1 00 IQ E en � Co C IQ
50 Cl) !lE
- 1 0 o 1 0 20 30 40 50 60
Time (min) relative to g lucose infusion at 0
Figure 3 .7 Mean insulin release for each challenge group before and after a glucose infusion at time zero. Red circles show examples of errors in the data.
0.7
0.6
-
0 0.5
E E
c( u.. 0 .4 w z IQ E 0 .3 en � Co c
0.2 IQ Cl) !lE
0 . 1
0
-20 o 20 40 60 80 1 00 120
Time (min) relative to glucose infu sion at 0
Figure 3 . 8 Mean NEFA release for each chal lenge group before and after a glucose infusion at time zero. Red circle highlights an error in the data.
70

Materials and Methods
1 60
1 40
E 120 :>
I c: 1 00
:s en c: 80 "' E en
60 "' Co c: "'
40 Cl �
20
0
- 1 0 o 1 0 20 30 40 50 60
Time (min) re lative to g lucose infusion at 0
Figure 3 .9 Mean insulin release for two subgroups in group 4 before and after a glucose infusion at time zero. Red el l ipses highlight consecutive time points that had the same mean value for one subgroup.
Data generated from laboratory analyses conducted by Alpha-Scientific Limited were sent as
small subsets in emai ls to LIe. Emai ls that had been archived were obtained from LIC and used
to generate a new database of results. The questionable data identified in the LIC database were
compared with the results in the emai l database. Where differences were found these were
assessed and corrections made to the L1C database.
A total of 87,736 data points were plotted and viewed, 1 ,4 1 5 ( 1 .6%) were identified as
questionable data and investigated further. Following diagnosis, 803 (0.9%) data points were
found to be incorrect and the value changed. Reports of data error rates in the l iterature range
from 0.34 to 1 5% over a wide range or study types including cl inical laboratory and
professional data entry qual ity control studies ( Kawado et al. 2003 , Nibler 1 995, Plebani and
Carraro 1 997) . Studies have indicated that the proportion of the mistakes in laboratory testing
can be distributed over 3 areas: pre-analytical 40-68%, analytical 4- 1 3% and post-analytical 1 8-
55% ( Boone et al. 1 995, Plebani and Carraro 1 997) . Data c leaning in the current study could
only assess analytical and post-analytical errors, it seems l ikely that errors introduced in the pre-
analytical stage also exist, however, it was not feasible to assess these errors. Therefore, it is
7 1
Chapter 3
probable that errors sti l l exist in the current study data set. The majority of errors identified
during the data cleaning process were due to incorrect values being entered into the database.
For future work of this nature it is important that the person entering metabolic data has a strong
understanding of the expected concentrations for each type of analyses so that they can
recognise when values that are wel l outside the expected range are being entered and the error
corrected immediately. In addition, double entry of the data is recommended as a means of
reducing typographical errors (Kawado et af. 2003).
3.11 Data adjustment
Detai ls of the data analyses and the resulting models that were used to adjust the data are
discussed in this section.
Unbalanced maternal grandsire distribution
The distribution of maternal grandsires across the F2 population was unbalanced. In the data set
there were 33 maternal grandsires that had five or less F2 heifers and 30 maternal grandsires that
had six or more F2 heifers. The unbalanced distribution of the maternal grandsires across the F2
population caused the maternal grandsi res to have a disproportionately large influence on the
residuals when included in the model. Several ways of grouping the maternal grandsires with
only a small number of offspring wa investigated. All methods of grouping were done within
breed, i .e . , Holstein Friesian and Jersey. The F2 animals were grouped when there were 3 or
less, 5 or less or 9 or less F2 animals per maternal grand sire. The year of the maternal
grandsires' birth was also used to group within the aforementioned groupings, this was to ensure
that genetic improvement in the maternal grandsires over time was taken into consideration.
The variation explained by the model was not increased by dividing the groups up by year of
birth of the maternal grandsires. Grouping F2 heifers with maternal grandsires that had 9 or less
F2 animals did not explain anymore of the variation than when the criterion was 5 or less F2
heifers. Therefore, animals were grouped within breed when the maternal grandsire had 5 or
less F2 animals in the trial .
72
Materials and Methods
Data analysis
All fixed effects and co-variates were tested at each time point, using PROC GLM in SAS
(version 8.2, 1 999-200 I by SAS I nstitute Inc. , Cary, NC, USA), to establish which ones have a
significant influence on the plasma concentrations of hormones and metabol ites tested.
Environmental effects were confounded within challenge group. Therefore, environmental
variables were removed from the model and group nested within year was included to account
for all affects which occurred at a group level. Possible interactions were also tested but none
were included because they were not significant at more than 3 sample times. The models used
for the data from each challenge are shown below. Residuals were obtained using these models
and added to the overall group mean, to obtain adjusted results. These adjusted results were
used for analyses and generating phenotypes.
Models
Glucose chal lenge: Yijkl",lIop = 11 + Yi + g/Yi) + Sk + rnl + age", + wg!1I + /wgn + eijklmllop
Adrenaline challenge: Yijkl",lIop = 11 + Yi + &'(Yi) + Sk + rnl + age", + wgtll + lwgo + stallp + eijkl",lIopq
TRH challenge: Yijklmllup = 11 + Yi + gj(y;) + Sk + rnl + age", + wg!1I + wtco + /wgp + stallq + eijkl",lIopqr
where: 11 is the overall intercept; y, is the fixed effect of the year in which the heifer underwent
the endocrine challenges; &(y;) is the fixed effect of challenge group nested within year; Sk is the
fixed effect of sire (each heifer was the offspring of one of six sires); rnl is the fixed effect of
maternal grandsire (maternal grandsire was grouped within breed if there were 5 or less F2
heifers) ; agem is number of weeks of age at the time of chal lenge fitted in the model as a
covariate; wg!1I is the l ive weight at the time of chal lenge fitted as a covariate; wtco is the
number of weeks between being chal lenged and parturition fitted as a covariate; stallp and stallq
are the fixed effect of stall (within group al location individual tie stalls, grouped in sets of two
(TRH challenge) or three (adrenal ine chal l enge) (adjacent animals)) ; /wgo and /wgp are the daily
l ive weight gain calculated from the difference between challenge weight and a weight
73
Chapter 3
measured at the end of each cohorts chal lenge period fitted as a covariate; eijkllllllop and eijklmllop
and eijkllllllop are the random residual .
74

CHAPTER 4
Description of response variables and phenotypes

Chapter 4
4.1 Introduction
The objectives for this chapter were to choose a number of parameters that described the
essential features of hormone and substrate responses to exogenous hormone challenges. These
parameters wi l l be referred to as "metabolic phenotypes" and wil l be used in later chapters to
search for QTL. The data generated in this experiment represent the most extensive metabolic
dataset avai lable international ly for pregnant dairy heifers and accordingly offer a unique
opportunity to examine the relat ionship between metabolic phenotypes and genetic markers.
In the current study animals were not housed nor fed a formulated diet. Therefore,
environmental variables such as ambient temperature, day l ight hours and quality and quantity
of feed the animals consumed were l ikely to vary between groups. Adjustment for the effects of
these environmental factors on the blood metabol i tes and hormones provided a more accurate
data set for use in generating phenotypic variables that were used in QTL searches.
In this chapter, the response curves for each of the chal lenges are presented and the important
features of the curves are described. The impact of environmental variables is then discussed
and the models used for adjusting the data are presented. Finally the metabolic phenotypes
calculated for use in the QTL searches are explained.
4.2 Mean response curves
A description of the parameters measured in response to the glucose, adrenal ine and TRH
chal lenges is given in this section. The mean curve of each of the response parameters i s given,
fol lowed by a discussion of the factors that were found to influence each of the response
variables.
4.3 Adrenaline challenge
Adipose tissue is a vital energy source during lactation in the dairy cow. During early lactation
the NEF A released by adipose tissue contribute directly and substantial ly to milk fat secretion
and to oxidative energy metabol ism in different tissues, in doing so, spare glucose and amino
76

Response variables and phenotypes
acids for use by the mammary gland (Chi l l iard et 01. 2000) . Between 20 to 43% of a cow's
J ipids may be mobi l ised during the first two months of lactation to supply the energy demands
imposed by mi lk synthesis (Chi l l iard et at. 1 984, Chi l l iard et at. 1 99 1 a). The extent of
mobi l isation is dependent on factors such as milk production, body condition, age of the cow,
parity and diet (Komaragiri and Erdman 1 997, McNamara 1 994). Selection based on increased
mi lk yield has a correlated response in feed intake that only covers about one-half of the extra
energy requirements for the increase in yield. Hence, energy balance progressively decreases
with increasing genetic merit for yield and this energy gap is most l ikely fi l led by changes in
energy partitioning and fat mobi l isation (Veerkamp et of. 2003 ) . Therefore, the abi l i ty of an
animal to mobi l ise adipose tissue for this purpose may affect her abi l i ty to sustain high levels of
milk production, particularly during early lactation when feed intake does not increase as
rapidly as the energy requirements.
Catecholamines are among the most effective regulators of adipose t issue l ipolysis, which is
stimulated through the p-adrenoreceptors (P-AR) and inhibited through a2-AR (Lafontan 1 994).
The major storage form of l ipid is triacylglycerol which yields NEF A and glycerol when
l ipolysis occurs (Dunshea et at. 1 990). Adipose tissue l ipolytic potential can be estimated in
vivo by plasma glycerol or NEFA response to injection or infusion of catecholamines (Chi l l iard
et of. 1 998b, Kolver et at. 200 I , McCutcheon and Bauman 1 986, Xing et of. 1 99 1 ) . Changes in
p lasma NEF A concentrations in response to an adrenal ine or fasting chal lenges were not
different between high and low selection l ines (Mackenzie et at. 1 988 , Michel et of. 1 99 1 , Xing
et of. 1 99 1 ) . However, a significant (P<O.O I ) l inear relationship was found between daily milk
energy secretion and NEF A area response to an adrenal ine chal lenge, the regression accounted
for 67% of the variation in milk energy output (McCutcheon and Bauman 1 986) . Animals of
higher genetic merit for milk production have consistently higher rates of l ipolysis and hormone
sensitive l ipase activity (McNamara 1 994) . NE FA liberated during l ipolysis can be released
into the circulation or re-esterified into newly formed triacylglycerols . Conversely, glycerol
kinase is absent from bovine adipose ti ssue which means reuti l isation of glycerol for
77

Chapter 4
triacylglycerol synthesis is negligible (Metz et al. 1 973) and glycerol released during l ipolysis
must enter the c irculation (Dunshea et at. 1 990). Plasma glycerol concentrations in response to
an adrenal ine chal lenge more accurately reflect l ipolysis as opposed to p lasma NEF A which
reflects l ipolysis and re-esterification (Kolver et at. 200 I , McNamara and H i l lers 1 986a).
Plasma NEFA, glycerol and glucose concentrations measured in response to an adrenaline
chal lenge wi l l provide information on the abi l ity of animals to mobi l ise triacylglycerol from
adipose tissue and glycogen from the l iver.
Results
Basel ine p lasma glycerol concentrations increased with t ime, in the pre-challenge samples
(Figure 4. 1 ) . After adrenal ine was infused p lasma glycerol concentrations increased rapidly
with maxima reached 4 minutes after chal lenge in 60% of heifers, and 90% within 1 5 minutes.
In all heifers there was a steady dec l ine in p lasma glycerol concentrations after maximum
concentrations were reached, however only 26% of heifers had returned to the concentration
measured at the -20 minute sample time, by the end of the sampl ing period, 90 minutes after the
chal lenge. There was large variation between heifers in the magnitude of their g lycerol
response to the adrenal ine challenge as shown by the large standard deviations. This is l ikely to
be due to differences between an imals in triacylglycerol mobil isation in response to the
adrenal ine chal lenge and the speed at which glycerol was c leared from the circulation.
78
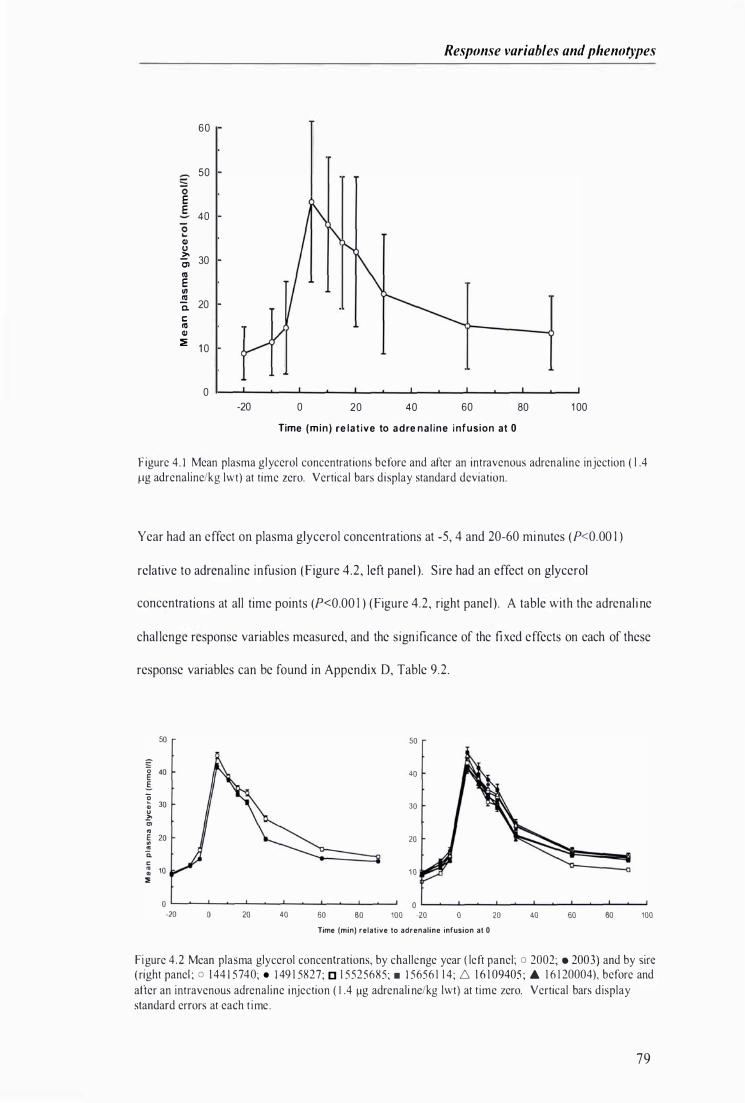
Response variables and phenotypes
60
50 -
0 E E
40
� GI U :?;o
30 Cl <11 E 1/1
� 20 c.
c: <11 GI �
1 0
0
-20 0 20 40 60 80 1 00
Time (min) re lat ive to adre nal ine i nfusion at 0
F igure 4. 1 Mean plasma glycerol concentrat ions before and after an intravenous adrenaline injection ( l A �lg adrenaline/kg Iwt) at time zero. Vertical bars display standard deviation.
Year had an effect on plasma glycerol concentrations at -5, 4 and 20-60 minutes (P<O.OO I )
relative to adrenaline infusion (Figure 4.2, left panel ). Sire had an effect on glycerol
concentrations at all time points (P<O.OO 1 ) (Figure 4.2, right panel ). A table with the adrenali ne
chal lenge response variables measured, and the significance of the fixed effects on each of these
response variables can be found in Appendix D, Table 9.2 .
50
� 40 E-o ;; 30 � '" ..
E 20 .. ..
c. c : 10 �
-20 20
50
40
30
20
10
o����--���--����--� 40 60 80 100 -20 0 20 40 60 80 100
Time (min) relative to adrenaline infusion at 0
Figure 4 .2 Mean plasma glycerol concentrations, by challenge year ( left panel; 0 2002; . 2003) and by sire ( right panel ; 0 1 44 1 5740; . 1 49 1 5827; [] 1 5 525685; . 1 5656 1 1 4; 6 1 6 1 09405 ; '" 1 6 1 20004), before and after an intravenous adrenaline injection ( l A I1g adrenali ne/kg Iwt) at time zero. Vertical bars display standard errors at each t ime .
79
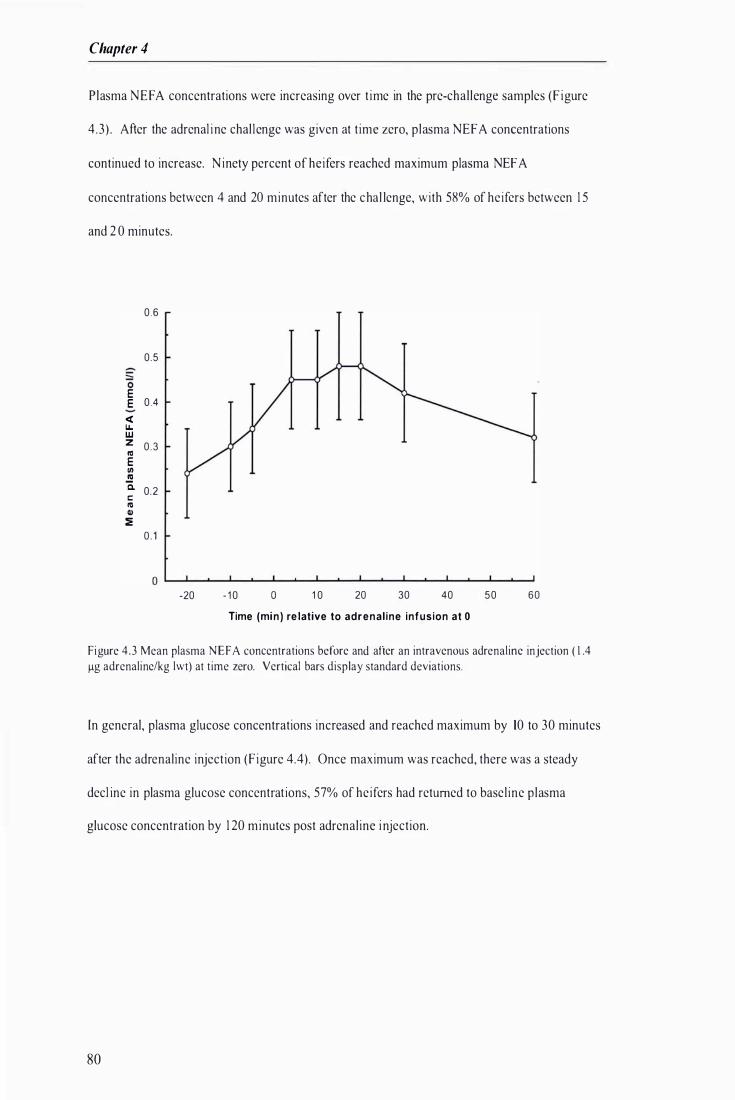
Chapter 4
Plasma NEFA concentrations were increasing over t ime in the pre-chal lenge samples (Figure
4 .3) . After the adrenal ine challenge was given at time zero, plasma NEFA concentrations
continued to increase. Ninety percent of heifers reached maximum plasma NEF A
concentrations between 4 and 20 minutes after the chal lenge, with 58% of heifers between 1 5
and 2 0 minutes.
0.6
0 .5
-
0 E E 0.4
« LI. w z 0.3 III
E VI .!l! Co
0.2 t: III III ::E
0 . 1
-20 - 1 0 o 1 0 20 30 40 50 60
Time (min ) re lative to adrenal ine infusion at 0
Figure 4 .3 Mean plasma NEFA concentrations before and after an intravenous adrenaline injection ( 1 .4 Ilg adrenaline/kg Iwt) at time zero. Vertical bars display standard deviations.
[n general, plasma glucose concentrations increased and reached maximum by 10 to 30 minutes
after the adrenaline injection (Figure 4.4). Once maximum was reached, there was a steady
decl ine in plasma glucose concentrations, 57% of heifers had returned to baseline plasma
glucose concentration by 1 20 minutes post adrenaline injection.
80
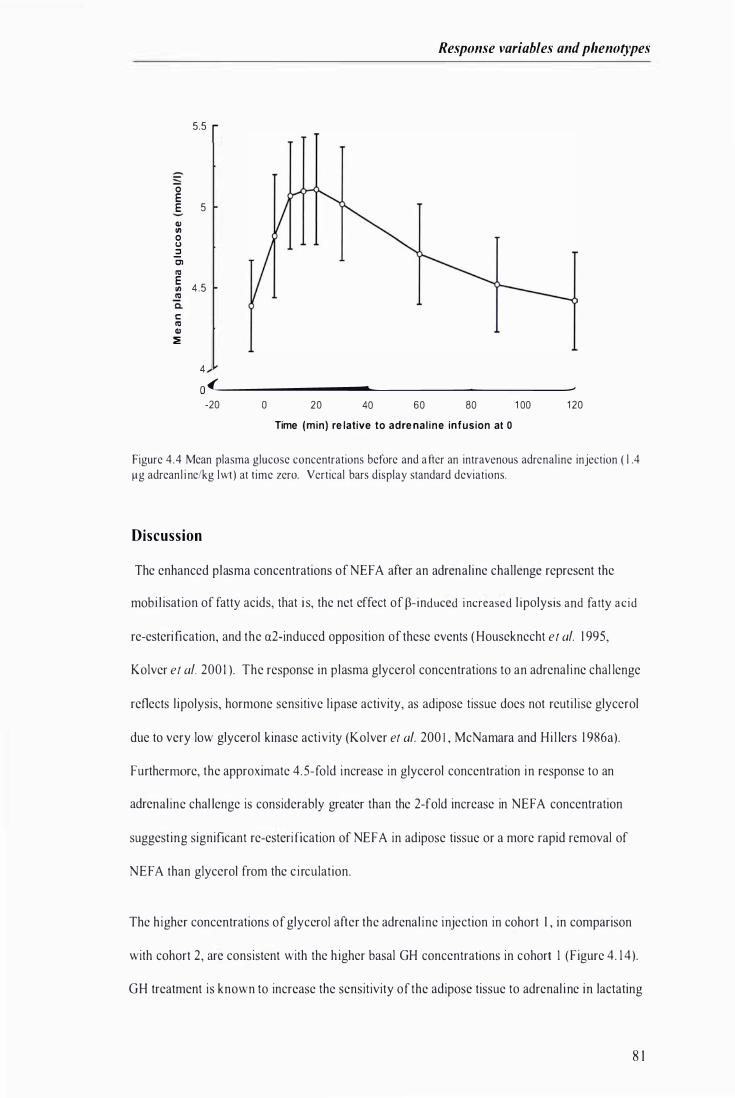
Response variables and phenotypes
5.5
--
0 E E 5 Cl> VI 0 c.J 2 01 IQ E 4.5 VI IQ Co C IQ Cl> �
4 O ���--��--��--��--��--��--���
-20 o 20 40 60 80 1 00 1 20
Time (min) re lative to adre nal ine infusion at 0
Figure 4.4 Mean plasma glucose concentrations before and a fter an intravenous adrenaline injection ( l A �g adreanl ine/kg Iwt) at time zero. Vertical bars display standard deviations.
Discussion
The enhanced plasma concentrations of NEF A after an adrenaline challenge represent the
mobi l isation of fatty acids, that i s, the net effect of p-induced increased l ipolysis and fatty acid
re-esterification, and the a2-induced opposition of these events ( Houseknecht et 01. 1 995,
Kolver et 01. 200 I ). The response in plasma glycerol concentrations to an adrenal ine chal lenge
reflects l ipolysis, hormone sensitive l ipase activity, as adipose tissue does not reuti l ise glycerol
due to very low glycerol kinase activity (Kolver et 01. 200 I , McNamara and Hi l lers 1 986a).
FurthemlOre, the approximate 4. 5-fold increase in glycerol concentration in response to an
adrenaline chal lenge is considerably greater than the 2-fold increase in NEF A concentration
suggesting significant re-esteri fication of NE FA in adipose tissue or a more rapid removal of
NEF A than glycerol from the c irculation.
The higher concentrations of glycerol after the adrenal ine injection in cohort I , in comparison
with cohort 2, are consistent with the h igher basal GH concentrations in cohort I (Figure 4 . 1 4 ).
GH treatment is known to increase the sensitivity of the adipose tissue to adrenal ine in lactating
8 1
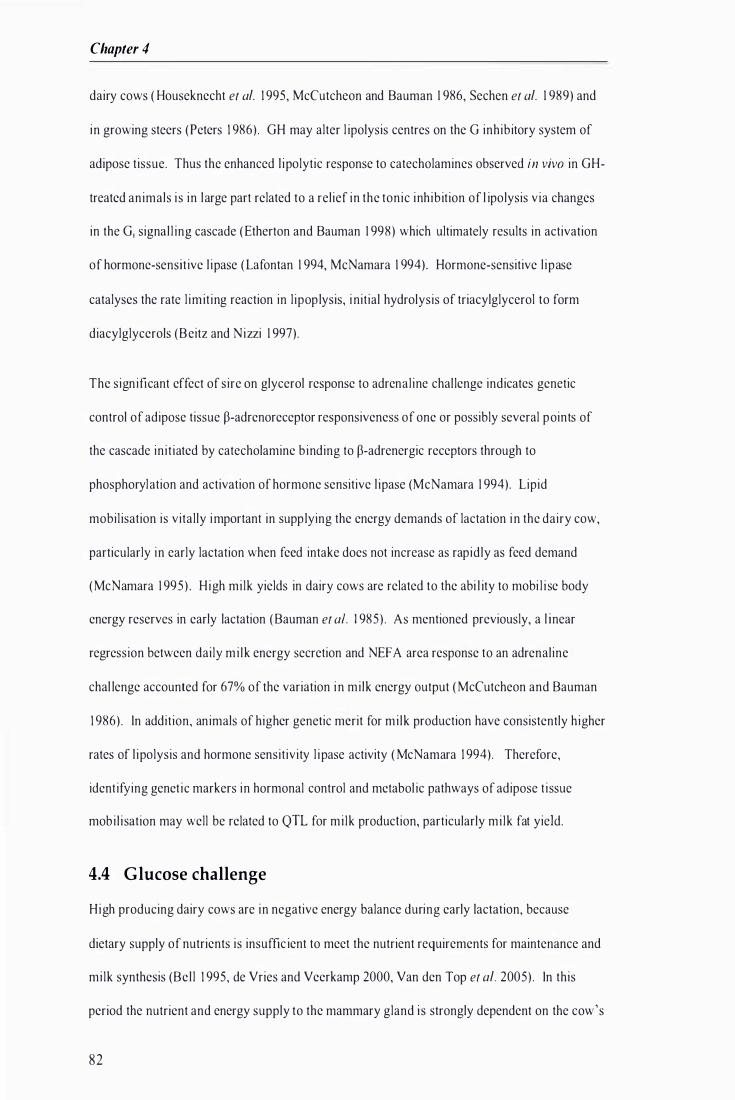
Chapter 4
dairy cows ( Houseknecht et af. 1 995, McCutcheon and Bauman 1 986, Sechen et af. 1 989) and
in growing steers (peters 1 986) . GH may alter l ipolysis centres on the G inhibitory system of
adipose tissue. Thus the enhanced l ipolytic response to catecholamines observed in vivo in GH
treated animals i s in large part related to a relief in the tonic inhibition of l ipolysis via changes
in the G; signal l ing cascade (Etherton and Bauman 1 998) which ultimately results in activation
of hormone-sensit ive l ipase ( Lafontan 1 994, McNamara 1 994). Hormone-sensitive l ipase
catalyses the rate l imiting reaction in l ipop lysis, i nitial hydrolysis of triacylglycerol to form
diacylglycerols (Beitz and Nizzi 1 997).
The significant effect of sire on glycerol response to adrenaline challenge indicates genetic
control of adipose tissue p-adrenoreceptor responsiveness of one or possibly several points of
the cascade init iated by catecholamine binding to p-adrenergic receptors through to
phosphorylation and activation of hormone sensitive l ipase (McNamara 1 994). Lipid
mobil isation is vitally important in supp lying the energy demands of lactation in the dairy cow,
particularly in early lactation when feed intake does not increase as rapidly as feed demand
(McNamara 1 995) . High milk yields in dairy cows are related to the abi l ity to mobi l i se body
energy reserves in early lactation ( Bauman et al. \ 985) . As mentioned previously, a l inear
regression between daily mi lk energy secretion and NEF A area response to an adrenaline
chal lenge accounted for 67% of the variation in milk energy output ( McCutcheon and Bauman
1 986) . In addition, animals of higher genetic merit for mi lk production have consistently higher
rates of l ipolysis and hormone sensitivity l ipase activity ( McNamara 1 994). Therefore,
identifying genetic markers in hormonal control and metabol ic pathways of adipose t issue
mobi l isation may well be related to QTL for milk production, particularly milk fat yield.
4A Glucose challenge
High producing dairy cows are in negative energy balance during early lactation, because
dietary supply of nutrients is insufficient to meet the nutrient requirements for maintenance and
milk synthesis (Bel l 1 995, de Vries and Veerkamp 2000, Van den Top et af. 2005) . In this
period the nutrient and energy supply to the mammary gland i s strongly dependent on the cow's
82

Response variables and phenotypes
abi l ity to mobi l ise body reserves and possibly the abi l i ty to reduce the requirements of
peripheral t issues (Sejrsen et 01. 1 984, Vernon 1 998, Vernon and Pond 1 997). Changes in
nutrient use by peripheral tissues is partly facil itated by altered concentrations of metabol ic
regulatory honnones such as insul in and GH (Sartin et 01. 1 988). I nsul in is the dominant
honnonal regulator of the energy metabolism in resting ruminants (Brockman 1 986) . Plasma
insulin concentrations are low in early lactation ( Lukes et of. 1 989) promoting greater
gluconeogenesis in the l iver and reduced use of nutrients by peripheral tissues (Brockman
1 986). Thus, differences between dairy cows in the way glucose and insulin metabol ism are
affected at the onset of lactation is l ikely to influence their abi l i ty to produce milk .
The concentration of i nsulin was found to be h igher in the low- (Hereford x Friesian) than in the
high-yielding (Friesian) group during lactation ( Hart et al. 1 978) . Also, plasma NEF A
concentrations were significantly higher in the high- compared to low-yielding cattle (Hart et of.
1 978) . These findings were fol lowed by numerous investigations into the relationship between
plasma insulin concentrations and mi lk yield with highly inconsistent results ( Wooll iams and
L0vendahl 1 99 1 ) . D ifferences between high and low milk yield selection l ines in glucose and
insulin metabolism have been reported in a number of studies ( Mackenzie et al. 1 988, Min et of.
1 993, X ing et 01. 1 993) . But these differences have not been present or were reversed in other
studies ( Barnes et al. 1 985, Lukes et of. 1 989, Osmond et af. 1 98 1 ) , however, in some cases this
may have been due to experimental design, i .e. measurement of steady-state conditions rather
than perturbing the system.
The intravenous injection of glucose is a well established physiological chal lenge for assessing
the responsiveness of the pancreas and its abil i ty to release insul in as well as the rate of tissue
uptake of glucose (Akerlind et 01. 1 999, Kaneko 1 997, McCann et of. 1 986). Investigations in
non-lactating dairy cattle i ndicate an association between genetic improvement and changes in
insul in secretion in response to a glucose chal lenge ( Mackenzie et of. 1 988). I t is thought that
lactating cows, which partition nutrients away from the adipose t issue and toward mammary
gland are insul in resistant because there is a decrease in the sensit ivity of their adipose and
83
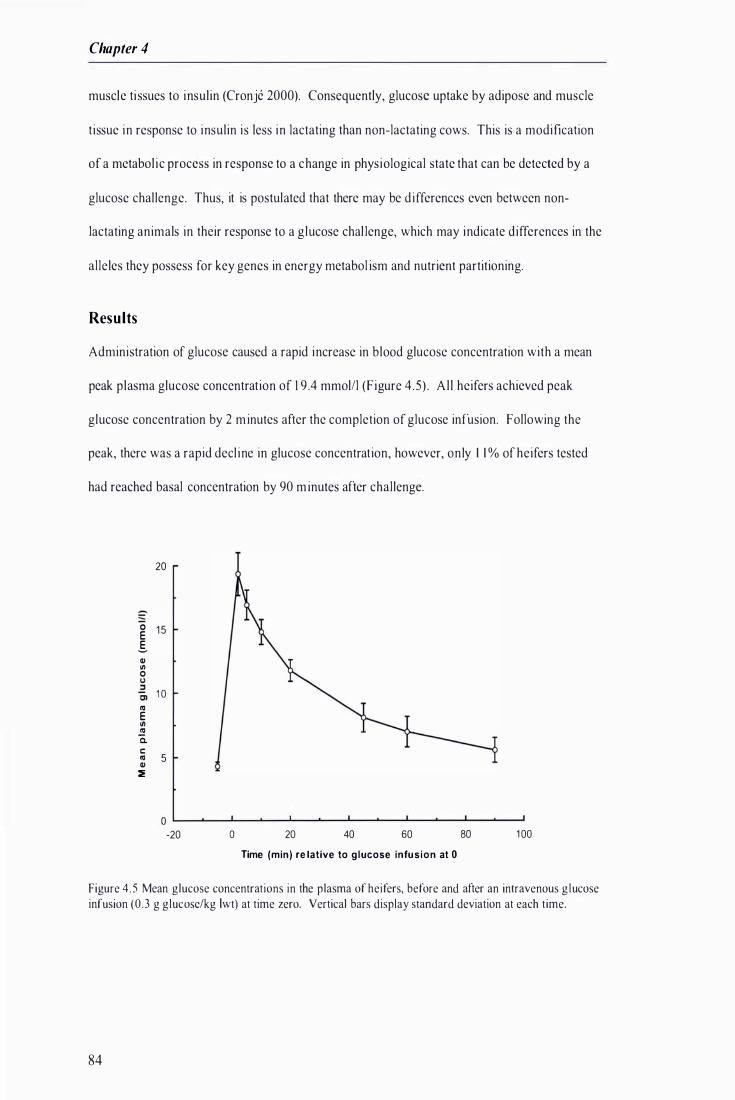
Chapter 4
muscle ti ssues to insulin (Cronje 2000). Consequently, glucose uptake by adipose and muscle
t issue in response to insulin is less in lactating than non-lactating cows. This is a modification
of a metabol ic process in response to a change in physiological state that can be detected by a
glucose challenge. Thus, it is postulated that there may be d ifferences even between non-
lactating animals in their response to a glucose chal lenge, which may indicate differences in the
alleles they possess for key genes in energy metabol ism and nutrient partitioning.
Results
Administration of glucose caused a rapid increase in blood glucose concentration with a mean
peak plasma glucose concentration of 1 9 .4 mmolll (Figure 4 .5 ) . A l l heifers achieved peak
glucose concentration by 2 m inutes after the completion of glucose infusion. Following the
peak, there was a rapid decl ine in glucose concentration, however, only I I % of heifers tested
had reached basal concentration by 90 minutes after challenge.
20
-
0 1 5 E E Cl) III 0 U :::s
1 0 Cl III E III � a. c: III 5 Cl) :::l!:
o L-� __ � __ � __ L-� __ � __ � __ L-� __ � __ ��
-20 o 20 40 60 80 1 00
Time (min) re lative to g lucose infus ion at 0
Figure 4 .5 Mean glucose concentrations in the plasma of heifers, before and after an intravenous g lucose infusion (0 .3 g glucose/kg Iwt) at time zero. Vertical bars display standard deviation at each time.
84
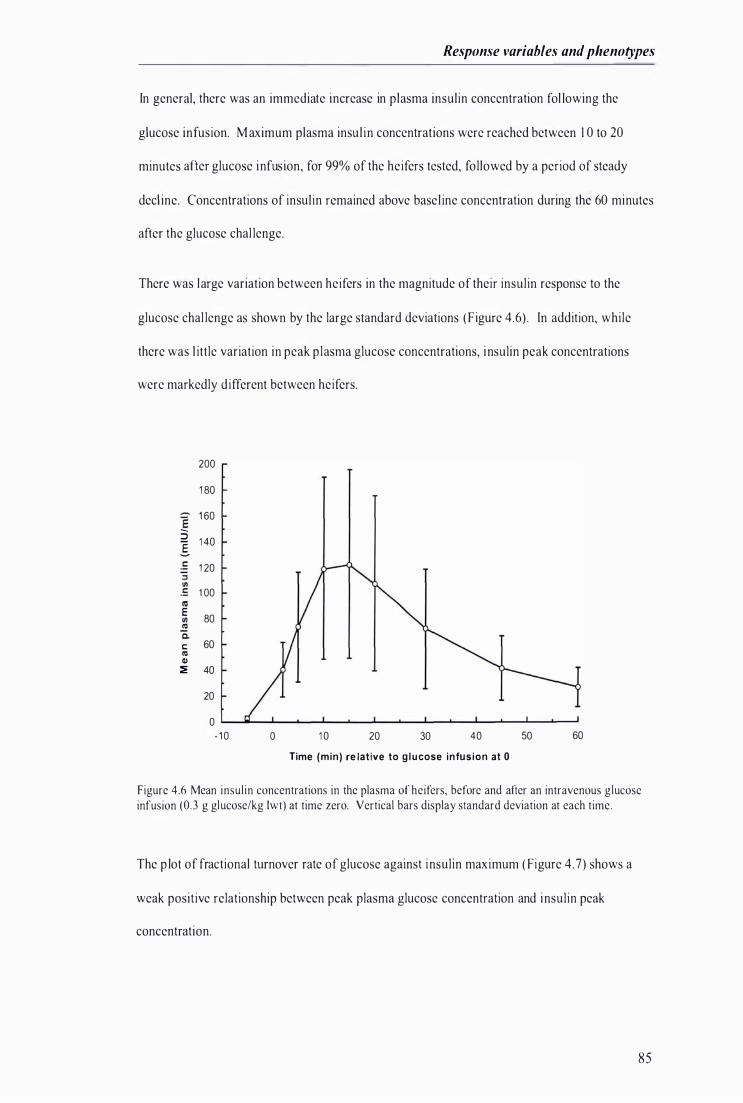
Response variables and phenotypes
In general, there was an immediate increase in plasma insulin concentration fol lowing the
glucose infusion. Maximum plasma insul in concentrations were reached between 1 0 to 20
minutes after glucose infusion, for 99% of the heifers tested, followed by a period of steady
decl ine. Concentrations of insulin remained above basel ine concentration during the 60 minutes
after the glucose chal lenge.
There was large variation between heifers in the magnitude of their insulin response to the
glucose chal lenge as shown by the large standard deviations (Figure 4.6) . In addition, while
there was l ittle variation in peak plasma glucose concentrations, insulin peak concentrations
were markedly different between heifers.
200
1 80
E 1 60
:; 1 40 I
.S 1 20 :::l Ul c 1 00 Cl) E
80 VI III c-c 60 III Q)
� 40
20
0
- 1 0 o 1 0 20 30 40 50 60
Time (min) re lative to g l u cose infusion at 0
Figure 4.6 Mean insulin concentrations in the plasma of heifers, before and after an intravenous glucose infusion (OJ g glucose/kg Iwt) at time zero. Vertical bars display standard deviation at each time.
The p lot of fractional turnover rate of glucose against insulin maximum ( Figure 4 .7 ) shows a
weak positive relationship between peak plasma glucose concentration and insulin peak
concentration.
85

Chapter 4
� 0 � 2 .5 4) 0 III 0 CD 0 0 0 � u 0 0 ::J 0) 0 Cl 0
... 2 0 4)
.. IV ..
.. 4) > 1 . 5 0 I: ..
::J ..
IV I: 0 .2 0
.. U IV 0 ..
u..
0 1 0 1 00 200 300 400
I nsu l in peak (mIUlml)
Figure 4.7 Linear regression between glucose clearance and insulin peak, Y = 0.00 1 9X + 1 .3779, R2 =
0.2224
There was a significant effect of year, group nested within year, and sire (P<O.OO I ) on p lasma
insul in concentration at all t ime points measured (F igure 4 .8) . Figure 4.8 shows the mean
insulin concentrations calculated from al l heifers chal lenged in each of the chal lenge years ( left
panel ) . Figure 4.8, right panel , shows the mean insul in concentrations of al l heifers challenged
in both years grouped by the six sires used in this experiment. Maternal grandsire also had a
sign ificant effect on plasma insulin concentrations, 2-45 minutes (P<O.OO I ), 60 minutes
(P<O.O I ) and -5 minutes (P<0.05) relative to the time of challenge.
86
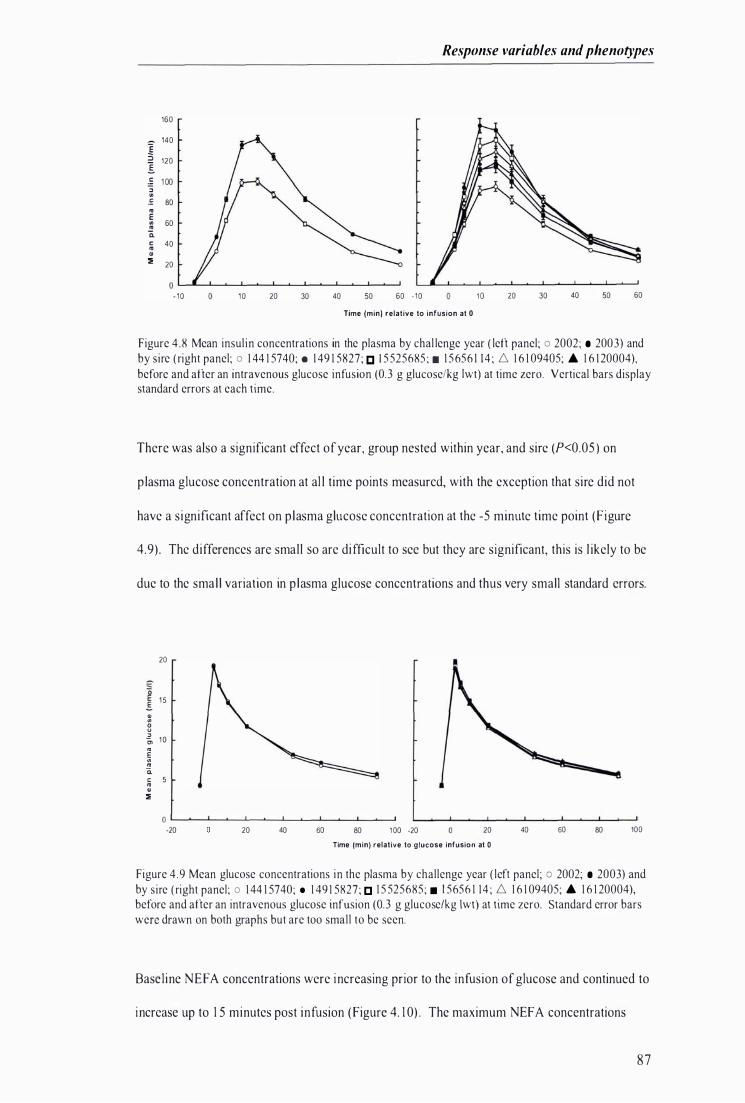
Response variables and phenotypes
160
140 E :5 120 I � 1 00 � ..
. : 80 � E .. 60 � ii c 40 � � ::.
20
- 1 0 1 0 20 30 40 50 60 - 1 0 1 0 20 30 40 50 60
Time (min) relative to infusion at 0
Figure 4 .8 Mean insul in concentrations in the plasma by chal lenge year ( left panel; 0 2002; • 2003) and by sire ( right panel; 0 1 44 1 5740; . 1 49 1 5827; [J 1 5525685 ; . 1 5656 1 14 ; D. 1 6 1 09405; ... 1 6 1 20004), before and after an intravenous glucose infusion (OJ g glucose/kg Iwt) at time zero. Vertical bars display standard errors at each time.
There was also a significant effect of year, group nested within year, and sire (P<0.05 ) on
p lasma glucose concentration at al l time points measurcd, with the exception that sire did not
have a significant affect on p lasma glucose concentration at the -5 minute time point (Figure
4.9) . The differences are smal l so are difficult to see but they are significant, this is l ikely to be
due to the smal l variation in p lasma glucose concentrations and thus very small standard errors.
20
'0 E 1 5 E. � .. o u � 1 0
� E .. � c. c 5 � �
�
O L-�-L� __ L-�-L����� __ � -20 20 40 60 80 1 00 -20 20
Time (min) relative to glucose infusion at 0
40 60 80 100
Figure 4 .9 Mean glucose concentrations in the plasma by challenge year ( left panel; 0 2002; • 2003) and by sire ( right panel; 0 1 44 1 5740; • 1 49 1 5827; [] 1 5 525685; • 1 5656 1 14 ; D. 1 6 1 09405; ... 1 6 1 20004), before and after an intravenous glucose infusion (�J g glucose/kg Iwt) at time zero. Standard error bars were drawn on both graphs but are too small to be seen.
Basel ine NEF A concentrations were increasing prior to the infusion of glucose and continued to
increase up to 1 5 minutes post infusion (Figure 4. 1 0) . The maximum NEF A concentrations
8 7

Chapter 4
occurred between -5 and 10 minutes relative to glucose infusion, in 89% of the heifers, with the
greatest proportion (34% of heifers) at 5 minutes after glucose infusion. Following the
maximum NEF A concentration, there was a rapid decline in NEF A concentration until a nadir
was reached at 60 or 90 minutes after glucose infusion, in 87% of heifers. Once the nadir was
reached, plasma NEF A concentration began to increase.
0.6
0.5 -
-
0
E E 0.4
cl: LL W z 0 .3 III
E VI III
c. 0.2
r::: III
Q)
�
0 . 1
0
-20 0 20 40 60 80 1 00 1 20
Time (min) re lative to glucose infusion at 0
Figure 4. 1 0 Mean NEFA concentrations in the plasma of heifers, before and after an intravenous glucose infusion (OJ g glucose/kg lwt) at time zero. Vertical bars display standard deviation at each time.
There was a significant effect of sire and group, nested within year, (P<O.OOI) on plasma NEFA
concentration at all time points measured. Maternal grandsire had a significant effect on p lasma
NEF A concentrations at all time points except at 60 and 90 minutes and the effect of year was
only significant at -10 to -5 minutes relative to time of chal lenge (P<O.OO 1 ).
Analysis of the insulin data showed that the mean response to the glucose challenge varied
markedly between groups. There was large variation between groups in mean insulin response
at 10 minutes after the glucose infusion, despite the reasonably consistent mean glucose peak
across groups (Figure 4.11) . The peak glucose concentration wil l be reflective of the glucose
88
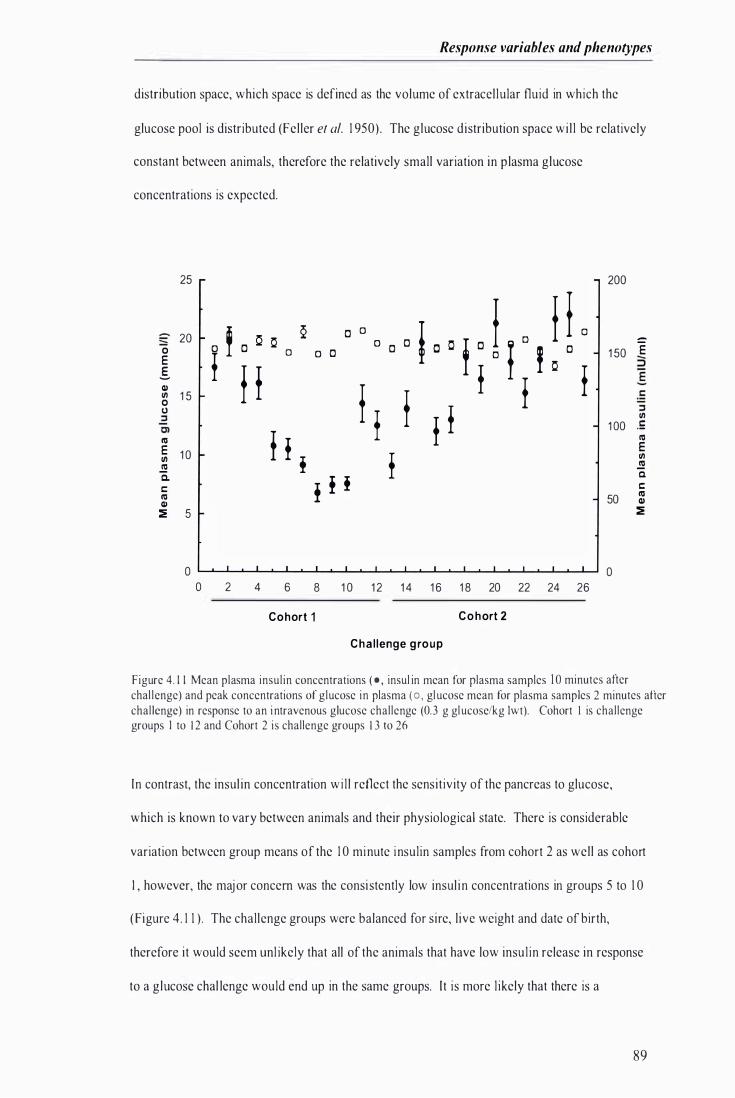
Response variables and phenotypes
distribution space, which space is defined as the volume of extracel lular fluid in which the
glucose pool is distributed (Feller et al. 1 950) . The glucose distribution space wi l l be relatively
constant between animals, therefore the relatively small variation in p lasma glucose
concentrations is expected.
25 200
� 20 o , c 1:1 0 2 c 0 f 0 0 t o ! I D , I L - o c c =
0 0 o c c 1 50 E E
f I 0 ::; .s f f f f E QI
I ! f I: III 1 5 0 u
f f :::l
:::l III Cl 1 00 .E cu
H I cu
E E III 1 0 f III .!!! .!!! Cl. � ! t
c. I: I: cu 50 cu QI QI :::iE 5 :::iE
o o o 2 4 6 8 1 0 1 2 1 4 1 6 1 8 20 22 24 26
Cohort 1 C o h ort 2
C h a l lenge g ro u p
Figure 4. 1 1 Mean plasma insulin concentrations ( . , insul in mean for plasma samples 1 0 minutes after chal lenge) and peak concentrations of glucose in plasma ( 0 , glucose mean for plasma samples 2 minutes after challenge) in response to an intravenous glucose challenge (OJ g glucose/kg Iwt). Cohort 1 is challenge groups I to 1 2 and Cohort 2 is challenge groups 1 3 to 26
In contrast, the insul in concentration wi l l reflect the sensitivity of the pancreas to glucose,
which is known to vary between animals and their physiological state. There is considerable
variation between group means of the 1 0 minute insulin samples from cohort 2 as well as cohort
I , however, the major concern was the consistently low insul in concentrations in groups 5 to 1 0
(Figure 4 . 1 1 ) . The challenge groups were balanced for sire, l ive weight and date of birth,
therefore it would seem unl ikely that all of the animals that have low insul in release in response
to a glucose chal lenge would end up in the same groups. It is more l ikely that there is a
89
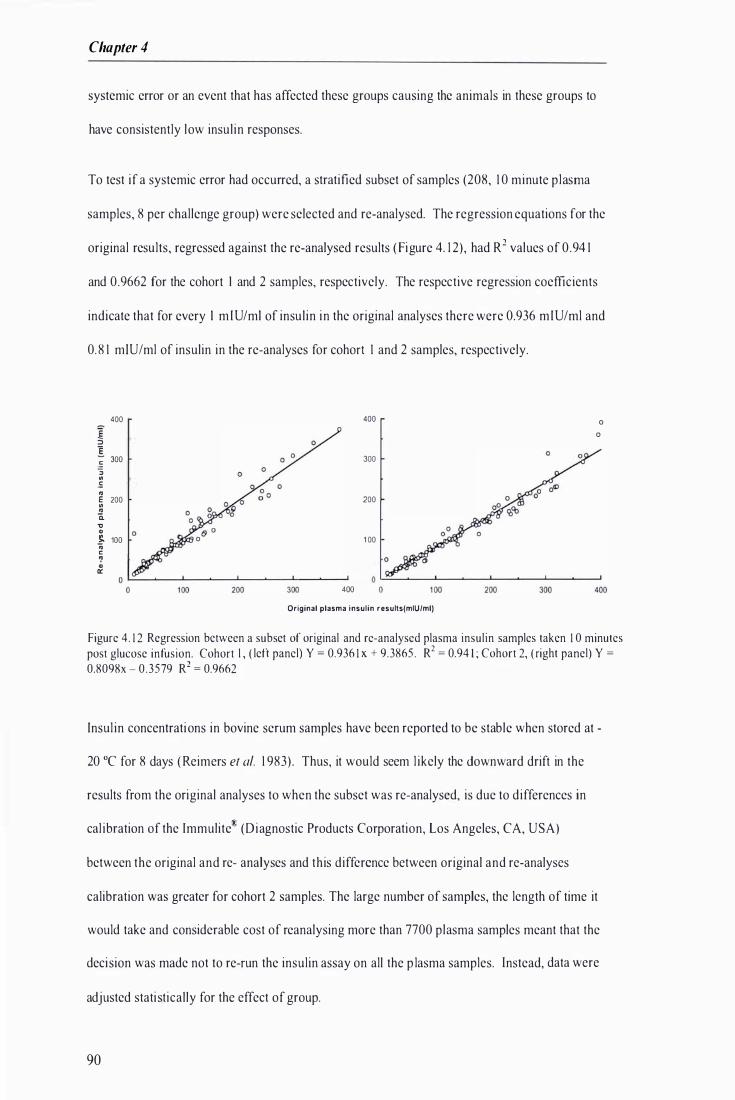
Chapter 4
systemic error or an event that has affected these groups causing the animals in these groups to
have consistently low insul in responses.
To test if a systemic error had occurred, a stratified subset of samples (208, 1 0 minute plasma
samples, 8 per challenge group) were selected and re-analysed. The regression equations for the
original results, regressed against the re-analysed results ( Figure 4. 1 2), had R2 values of 0 .94 1
and 0.9662 for the cohort I and 2 samples, respectively. The respective regression coefficients
indicate that for every I m IU/ml of insul in in the original analyses there were 0.936 mIU/ml and
0. 8 1 mlU/ml of insulin in the re-analyses for cohort 1 and 2 samples, respectively.
400 400 Q E Q :; Q E :i 300 300
� co .s co E 200 200 co co C. .., .. � 100 1 00 ;; c � .. Cl:
400
Original plasma insulin results(mIU/ml)
Figure 4. 1 2 Regression between a subset of original and re-analysed plasma insulin samples taken 1 0 minutes post glucose infusion. Cohort I , ( left panel) Y = 0.936 1 x + 9.3865 . R2
= 0.94 1 ; Cohort 2, ( right panel) Y =
0.8098x - 0 .3579 R2 = 0.9662
Insul in concentrations in bovine serum samples have been reported to be stable when stored at -
20 QC for 8 days ( Reimers et at. 1 983) . Thus, it would seem l ikely the downward drift in the
results from the original analyses to when the subset was re-analysed, is due to differences in
cal ibration of the Immulite® (Diagnostic Products Corporation, Los Angeles, CA, USA)
between the original and re- analyses and this difference between original and re-analyses
calibration was greater for cohort 2 samples. The large number of samples, the length of time it
would take and considerable cost of reanalysing more than 7700 plasma samples meant that the
decision was made not to re-run the insulin assay on all the p lasma samples. instead, data were
adjusted stati stically for the effect of group.
90
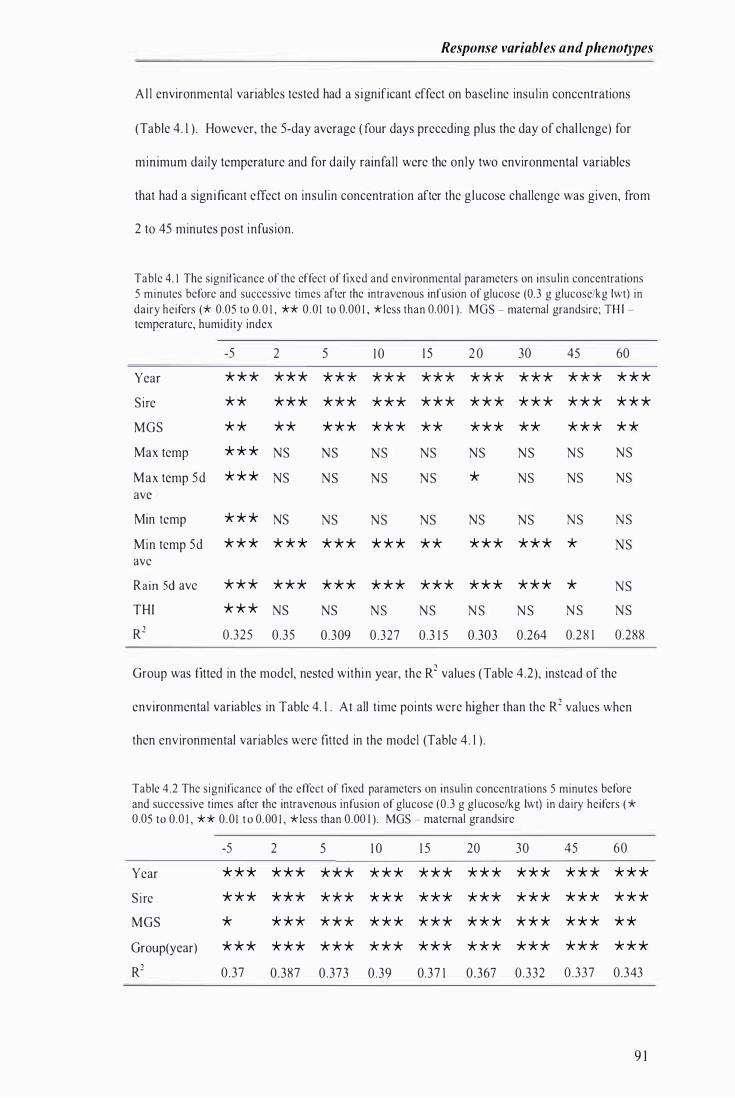
Response variables and phenotypes
Al l environmental variables tested had a s ignificant effect on basel ine insulin concentrations
(Table 4 . 1 ) . However, the 5-day average ( four days preceding plus the day of chal lenge) for
minimum daily temperature and for daily rainfall were the only two environmental variables
that had a signi ficant effect on insulin concentrat ion after the glucose challenge was given, from
2 to 45 minutes post infusion.
Table 4. 1 The significance of the effect of fixed and environmental parameters on insulin concentrations 5 minutes before and successive times after the intravenous infusion of glucose (�J g glucose/kg Iwt) in dairy heifers (* 0.05 to 0. 0 1 , ** 0 .0 1 to 0.00 1 , * Iess than 0.00 1 ) . MGS - maternal grandsire; TH I -temperature, humidity index
-5 2 5 1 0 1 5 2 0 30 45 60
Year * * * * * * * * * * * * * * * * * * * * * * * * * * * Sire * * * * * * * * * * * * * * * * * * * * * * * * * * MGS * * * * * * * * * * * * * * * * * * * * * * Max temp * * * NS NS S NS NS NS NS NS
Max temp 5d * * * NS NS NS NS * NS NS NS ave
Min temp * * * NS NS NS NS NS NS NS NS
Min temp 5d * * * * * * * * * * * * * * * * * * * * * S ave
Rain 5d ave * * * * * * * * * * * * * * * * * * * * * * NS
THI * * * NS NS NS NS NS NS NS NS
R2 0.325 0.35 0.309 0.327 0.3 1 5 0.303 0.264 0.28 1 0.288
Group was fitted in the model, nested within year, the R2 values (Table 4 .2), instead of the
environmental variables in Table 4. 1 . At all t ime points were higher than the R2 values when
then environmental variables were fitted in the model (Table 4 . 1 ) .
Table 4.2 The significance of the effect of fixed parameters on insulin concentrations 5 minutes before and successive times after the intravenous infusion of glucose (�J g glucose/kg Iwt) in dairy heifers ( * 0.05 to 0.0 1 , * * 0 .0 1 t o 0.00 1 , * Iess than 0.00 1 ) . MGS - maternal grandsire
-5 2 5 1 0 1 5 20 30 45 60
Year * * * * * * * * * * * * * * * * * * * * * * * * * * * Sire * * * * * * * * * * * * * * * * * * * * * * * * * * * MGS * * * * * * * * * * * * * * * * * * * * * * * * Group(year) * * * * * * * * * * * * * * * * * * * * * * * * * * * R2 0.37 0.387 0.373 0 .39 0.37 1 0.367 0.332 0 .337 0.343
9 1
Chapter 4
Discussion
These glucose results are consistent with another experiment that found that basal
concentrations of glucose in heifers were not reached until 1 20 minutes after a glucose
chal lenge (Xing et al. 1 99 1 ) . The weak relationship between peak plasma glucose peak plasma
insulin peak concentrations (Figure 4 .7) may indicate that some heifers are more responsive to a
glucose challenge than others, that is, the amount of insulin released in response to the glucose
challenge may vary between heifers possibly due to differences in each animal 's sensit ivity and
or responsiveness to the glucose stimulus. Non-insul in mediated glucose uptake (N IMGU)
accounted for 62.5% of glucose uti l i sation when insulin concentrations were elevated above
basal in dairy cows in mid-lactation (Rose et al. 1 997) . However, 82-88% of NIMGU was
attributed to glucose uptake by mammary gland (Rose et al. 1 997), which would be a much
smaller proportion in non-lactating heifers. Nevertheless, N IMGU may sti l l di ffer between the
heifers in this experiment, and may be another factor causing variation in the relationship
between fractional turnover of glucose and insul in peak.
Some of the difference in plasma insul in concentrations between the two chal lenge years ( left
panel, Figure 4 .8 ) can be attributed to the analytical error that has occurred in the insul in
immunoenzymometric assay. However, the downward drift in plasma insulin concentrations in
groups 5 to l O in the 2002 chal lenge year ( Figure 4 . 1 1 ) is not due to analytical error but rather is
l ikely to be due to one, or a number of factors. These factors include environmental factors
such maximum and minimum ambient temperature, relative humidity, rainfall and day length.
Pasture qual ity in the time leading up to the chal lenge may have influenced plane of nutrition of
the heifers, and plane of nutrition may influence plasma insul in concentration in response to a
glucose chal lenge.
Basal insul in and glucose concentrations, in early-pregnant, non-lactating, Holstein-Friesian
cows, were found to be significantly lower in a hot compared to a thermoneutral environment
( Itoh et at. 1 998) . Peak insulin concentrations after glucose infusion were significantly lower
during exposure to high temperatures ( Itoh et at. 1 998) . I t was suggested that lower basal and
92

Response variables and phenotypes
peak plasma insulin concentrations in response to glucose infusion during heat exposure was
due to a lower insulin secretory response. However, there was no difference in insul in AUC
between thermal environments ( ltoh et af. 1 998) which may indicate that the actual secretion of
insul in in response to a glucose challenge was the same, there was no evidence of a more
sustained release of insulin which would affect A UC, the peak was only lower in the hot
environment due to the lower basal concentration.
In the current study, plasma insul in concentration in the 1 0 minute post infusion sample and the
insulin AUC were highly correlated (0.93, P<.OOO I ) . Consequently, the group means for the
insul in AUC had a very simi lar pattern to the group means of the 1 0 minute p lasma
concentrations ( Figure 4 . 1 1 ) . In addition, the mean baseline concentrations also showed a
simi lar pattern. Thus, the group effect is consistent across time points, both pre- and post
glucose infusion, and is sti l l apparent for AUC. Tt appears that the factor causing lower plasma
insul in concentrations in groups 5- 1 0 may be reducing both the basal concentrations and the
glucose stimulated insulin secretory response.
It has been reported that a temperature-humidity index (TH I ) based on the minimum daily
temperature was more closely correlated with dry matter intake than was the THI based on the
maximum daily temperature (Holter et af. 1 996). Heat stress does not cause such a dramatic
reduction in feed intake of cows if they are exposed to a minimum daily temperature of less than
1 0° C for at least 4 hours per day as this al lows dissipation of thermal heat loads ( Roseler et al.
1 993) . This is consistent with the current study results (Table 4. 1 ), where the average minimum
temperature had a significant effect on plasma insulin concentration up to 45 minutes after the
challenge. The range in average minimum temperature was 6.4- 1 6 0c. Average maximum
temperature only had a significant effect on basel ine insulin and at 20 minutes after glucose
chal lenge. In lactating cows, milk yield was found to be significantly correlated with weather
conditions 2, 3 and 4 days previous but not on the same day as the mi lk yield measurement
(Maust et al. 1 972). Reduction in milk yield was thought to be related to a rise in body
temperature causing a depression in feed intake (Maust et al. 1 972) and elevated maintenance
93

Chapter 4
energy requirements as a consequence of cows attempting to lose body heat (Roseler et af.
1 993 ). It is possible that there was a simil ar effect of ambient temperature, in the days prior to
the day of challenge, on p lasma insulin concentration in the pregnant heifers in this trial, which
is why the 5 day average minimum temperature was significant rather than the minimum
temperature on the day of chal lenge.
H igh feeding levels have been hown to increase plasma insulin concentrations compared with
low feeding levels i n prepubertal and 6-8 month old heifers (Stelwagen and Grieve 1 992,
Vestergaard et at. 2003, Xing et al. 1 99 1 ) . In addition, both energy and nitrogen content of the
diet have been demonstrated to have a significant affect on plasma insul in concentration in
Romney wether sheep (Waghom et al. 1 987) . I t is possible that pasture availab le to groups 5 to
1 0 was of a l ower qual ity and quantity, causing lower plasma insulin concentrations at basel ine
and in response to glucose chal lenge, than in other chal lenge groups. January and February are
sununer months in New Zealand and usual ly coinc ide with low rainfa l l and high evapo
transpiration rates (evaporation from soi l plus transpiration by plants), which may cause reduced
pasture production and qual i ty (McKenzie et af. 1 999) . During summer there is often a high
proportion of mature pasture in the sward. Mature pasture has a high fibre content and a
reduced proportion of protein and readi ly digestible carbohydrate. Thus, energy and protein
intake are often l imited from summer pasture compared with pasture at other t imes of the year
(Hodgson and B rookes 1 999) .
Since pasture samples were not taken on a regular basis during the challenge periods, the 5 day
average daily rainfal l (DADR) variable was included in the model . It was included as an
indirect indicator of feed qua lity leading up to the chal lenge because rainfal l promotes pasture
growth and hence influences pasture quality. DADR may have had a significant effect on
plasma insulin concentration both pre- and post-glucose infusion (-5 to 45 minutes) either
because of its effect on pasture quality or because higher rainfa l l reduced heat stress.
94

Response variables and phenotypes
Plasma IGF-I concentrations have also been shown to be related to feed intake, when feed
intake is low IGF-I concentrations are also low compared with those of animals on high feed
intake (Breier et af. 1 986, Ronge and B lum 1 989) . If plasma insulin concentrations were low in
challenge groups 5- 1 0 of the current study, their p lasma IGF-I concentrations could also be
expected to be low. The Pearson correlation coefficient between baseline insul in and mean
IGF-I concentrations in p lasma while significant (P<O.OOO I ), is weak (R=0. 1 5 ), which suggests
there are other factors, in addition to energy intake, that are influencing insulin concentration.
In addition, the plasma IGF-I concentrations used for this correlation were measured the day
after the glucose chal lenge, fol lowing overnight re-feeding. This is l ikely to reduce the strength
of the relationship between plasma IGF-I and insulin concentrations. Even so, animals in
groups 5- 1 0 may sti l l have experienced a lower level of nutrition than other chal lenge groups
but it not sufficient to reduce p lasma IGF-I concentrations. The finding that only the animals
fed to below maintenance had significantly reduced plasma IGF-I concentrations compared with
the high and medium feeding level groups (Breier et al. 1 986), is consistent with this theory.
The environmental variables tested in the model (Table 4. 1 ) were only measured at one weather
station si te. Therefore, the same data were applied to a l l animals in one chal lenge group, as a
result, of these data were confounded within group. When group was fitted in the model, nested
within year, the R2 values (Table 4 .2), at all time points were higher than the R2 values when
then environmental variables were titted in the model (Table 4 . 1 ) . Thus, fitting group nested
within year explained more of the variation in insulin concentration than was explained by
fitting the environmental variables. It is l ikely there are other variables which affected insulin
concentration and were confounded within group that were not measured, therefore, by fitting
group in the model al l of these variables both unknown and known were adjusted for.
Future studies that involve metabolic challenges should include collection of a complete set of
data for quantifying environmental conditions (Wool liams and L0vendahl 1 99 1 ) . This could be
achieved by taking daily pasture samples to try and account for the influence of feed intake and
p lane of nutrition on responses to a glucose chal lenge, IGF-I should be measured at the same
95
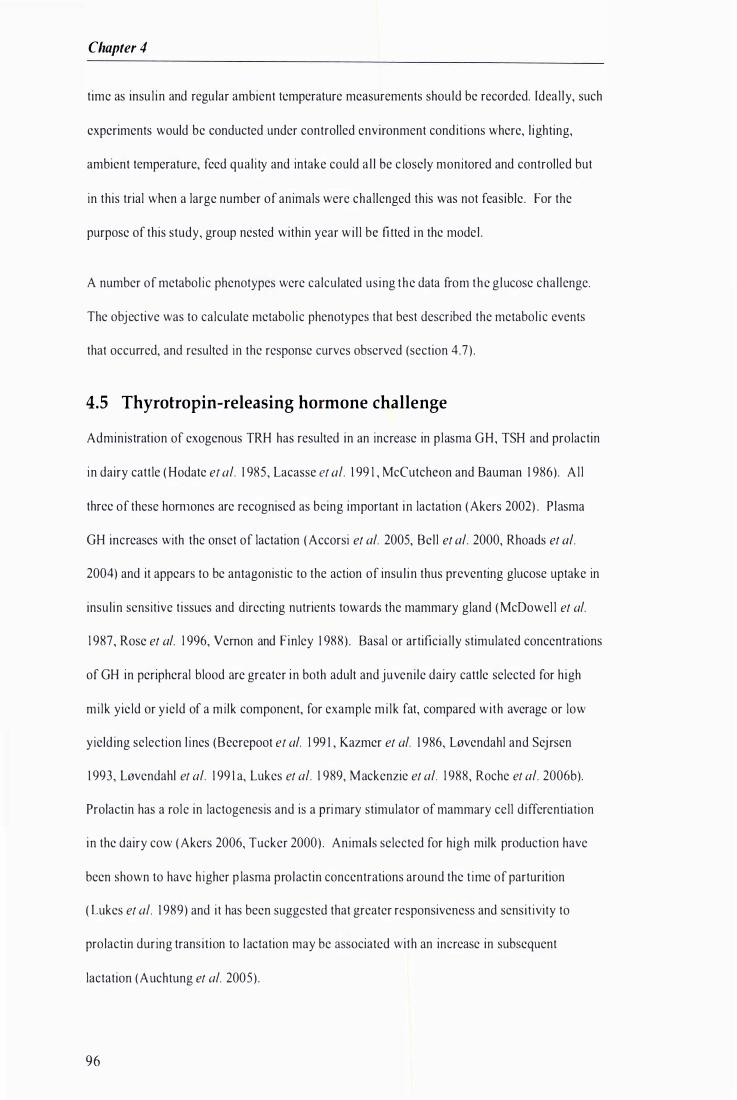
Chapter 4
time as insul in and regular ambient temperature measurements should be recorded. Ideal ly, such
experiments would be conducted under controlled environment conditions where, l ighting,
ambient temperature, feed quality and intake could a l l be c losely monitored and controlled but
in this trial when a large number of animals were challenged this was not feasible. For the
purpose of this study, group nested within year wi l l be fitted in the model .
A number of metabol ic phenotypes were calculated using the data from the glucose challenge.
The objective was to calculate metabolic phenotypes that best described the metabol ic events
that occurred, and resulted in the response curves observed (section 4.7) .
4.5 Thyrotropin-releasing hormone challenge
Administration of exogenous TRH has resulted in an increase in plasma GH, TSH and prolactin
in dairy cattle ( Hodate et af. 1 985, Lacasse et af. 1 99 1 , McCutcheon and Bauman 1 986). Al l
three of these hormones are recognised as being important in lactation (Akers 2002) . Plasma
GH increases with the onset of lactation (Accorsi et al. 2005, Bell et al. 2000, Rhoads et al.
2004) and it appears to be antagonistic to the action of insul in thus preventing glucose uptake in
insulin sensitive tissues and directing nutrients towards the mammary gland (McDowel l et af.
1 987, Rose et af. 1 996, Vemon and Finley 1 988) . Basal or artificially stimulated concentrations
of GH in peripheral blood are greater in both adult and juvenile dairy cattle selected for high
milk yield or yield of a milk component, for example milk fat, compared with average or low
yielding selection l ines (Beerepoot et al. 1 99 1 , Kazmer et af. 1 986, L0vendahl and Sejrsen
1 993, L0vendahl et al. 1 99 1 a, Lukes et af. 1 989, Mackenzie et al. 1 988, Roche et al. 2006b).
Prolactin has a role in lactogenesis and is a primary stimulator of mammary cell differentiation
in the dairy cow (Akers 2006, Tucker 2000) . Animals selected for high milk production have
been shown to have higher p lasma prolactin concentrations around the t ime of parturition
( Lukes et af. 1 989) and it has been suggested that greater responsiveness and sensitivity to
prolactin during transition to lactation may be associated with an increase in subsequent
lactation (Auchtung et al. 2005) .
96

Response variables and phenotypes
Thyroid honnones arc involved in metabol ic homeostasis and maintenance of lactation ( Perera
et af. 1 985) . During early lactation in cows there is a decrease in T4 and T3 concentrations and a
number of studies have found a negative relationship between milk yield and circulating
concentrations of thyroid honnones (Hart et af. 1 978, N ixon et af. 1 988, Pezzi et al. 2003 ,
Walsh et al. 1 980). Consistent with this, there was a tendency for c irculating T4 concentrations
during lactation to be lower in dairy cows selected for high milk yield (Bonczek et 01. 1 988,
Hart et al. 1 978) . In addition, 10akimsen et al. ( 1 97 1 ) reported a positive genetic association
between daily T4 degradation and genetic merit for fat-corrected milk yield in AI stud bul ls of 3
dairy breeds.
Adipose tissue is particularly important during lactation when increased l ipolysis and decreased
rates of l ipogenesis contribute to meeting the energy demands of milk synthesis (Bauman and
Vemon 1 993, Etherton and Bauman 1 998) . Studies have shown that treatment mid-lactation
cows with exogenous GH caused greater p lasma concentrations of NE FA and glycerol both at
baseline and in response to an adrenal ine chal lcnge when compared with controls (Houseknecht
et 01. 1 995, McCutchcon and Bauman 1 986, Scchen et 01. 1 990). At maximal responsiveness to
adrenaline chal lenge plasma NEF A concentrations were increased approximately 6-fo ld,
whereas glycerol concentrations were increased approximately 3-fold. It has been suggested
that GH treatment reduces adrenal ine-stimulatcd rates of re-esterification of fatty acids in
adipocytes and increases l ipolysis ( Sechen et 01. 1 990). Measurement of NE FA concentrations
in this chal lenge may give an indication of the action ofGH on adipose tissue. Measurement of
GH, pro lactin and TSH concentrations may give some indication of genetic potential for mi lk
production.
Results
Maximum concentrations of GH were reached 2- 1 5 minutes after TRH infusion, in 93% of
heifers. A steady decl ine in GH concentration followed the maximum. There was large
variation between heifers in their GH response to the TRH challenge as shown by the large
standard deviations (Figure 4. 1 3 ), particularly at 2 and 5 minutes after the chal lenge.
97
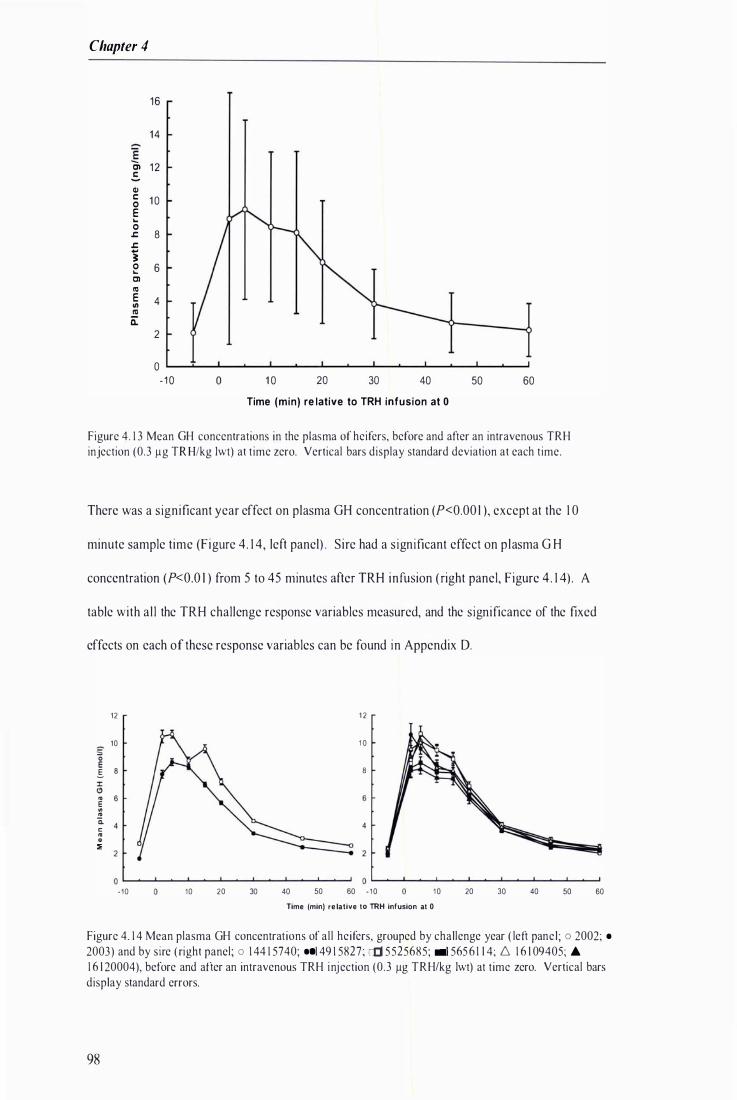
Chapter 4
16
14 � Cl 12 .s Q) c: 1 0 0 E ... 0
.J:. 8 .J:. .. � 0 6 ... Cl III E 4 '" III ii:
2
0 - 10 o 1 0 20 30 40 50 60
Time (min) re lative to TRH infusion at 0
Figure 4. 1 3 Mean GH concentrations in the plasma of heifers, before and after an intravenous TRH injection (OJ �g TR H/kg Iwt) at time zero. Vertical bars display standard deviation at each time.
There was a significant year effect on plasma GH concentration (P<O.OO I ), except at the 1 0
minute sample time (Figure 4 . 1 4, left panel) . Sire had a significant effect on p lasma G H
concentration (P<O.O I ) from 5 to 45 minutes after TRH infusion ( right panel, Figure 4 . 1 4) . A
table with a l l the TRH challenge response variables measured, and the significance of the fixed
effects on each of these response variables can be found in Appendix D.
12
10
'0 E E. 8
E 6
" .. Q. c .. � :11
-10 10 20 30
1 2
1 0
8
40 50 60 - 1 0 1 0 20
Time Imin) re lalive 10 TRH infusion al 0 30 40 50 60
Figure 4. 1 4 Mean plasma GH concentrations of al l heifers, grouped by challenge year ( left panel; 0 2002; • 2003) and by sire ( right panel; 0 1 44 1 5740; .. 1 49 1 5827; c0 5525685; .-I 565 6 1 1 4; 6. 1 6 1 09405; ... 1 6 1 20004), before and after an intravenous TRH injection (OJ �g TRH/kg Iwt) at time zero. Vertical bars display standard errors.
98

Response variables and phenotypes
Maximum concentrations of prolactin were reached between 2- 1 0 minutes post TRH infusion
(Figure 4 . 1 5 ), in 90% of heifers, fol lowed by a rapid decl ine in prolactin concentrations.
Approximately, 47% of heifers had p lasma prolactin concentrations that reached baseline, by
1 50 minutes after the TRH infusion.
1 80
1 60 �
:§ 140 Cl c: c: 1 20 U ra 1 00 0 .. c. ra 80 E VI ra c. 60 c: ra CIl 40 ::E
20
0 o 20 40 60 80 1 00 1 20 140 1 60
Time (min ) re lat ive to TRH infus ion at 0
Figure 4. l 5 Mean prolactin concentrat ions in the plasma of heifers, before and after an intravenous TRH injection ( �J flg TRH/kg Iwt) at time zero. Vertical bars display standard deviations at each sample time.
Plasma prolactin concentrations were s ignificantly correlated with day length (P<O.OO I ) both
before and after the TRH chal lenge, with the exception of the 2 minute plasma sample. Heifers
exposed to longer days at the time of TRH challenge tended to have greater plasma prolactin
concentrations than those exposed shorter days (Figure 4. 1 6) . This finding is consistent with
contro lled l ighting studies that have shown hei fers or cows exposed to a greater number of l ight
hours have greater mean serum prolactin concentrations than heifers or cows exposed to fewer
l ight hours (Auchtung et al. 2005, ewbold et al. 1 99 1 ) . Environmental variables were fitted in
the mode l for correcting the chal lenge data but as with the glucose chal lenge data fitting a
group, nested within year, effect explained more of the variation in the data than fitting
environmental variables.
99
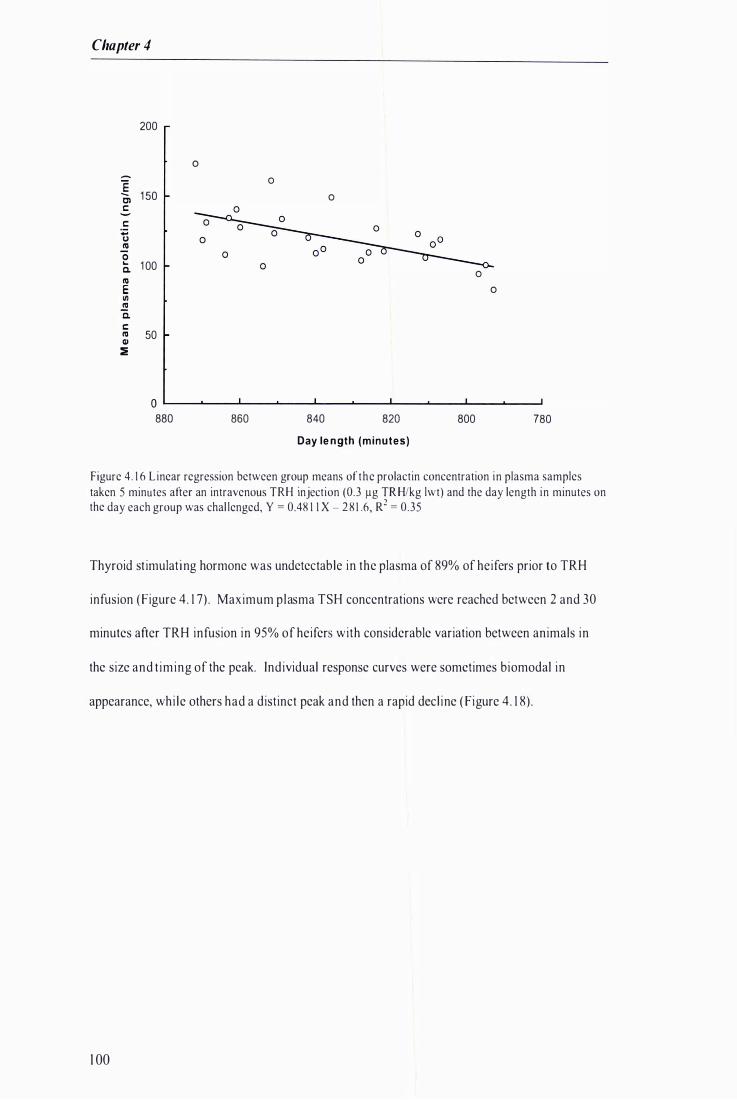
Chapter 4
200
0 - 0 � 1 50 0 Cl c: c:
.. U IV 0 ... 1 00 c. 0 IV E 0 1/1
� C. c: IV 50 QI :E
o �--�--�----�--�--�----�--�--��--�--� 880 860 840 820 800 780
Day le ngth (minutes)
Figure 4. 1 6 Linear regression between group means of the prolactin concentration in plasma samples taken 5 minutes after an intravenous TRH injection (�J �g TR H/kg lwt) and the day length in minutes on the day each group was chal lenged, Y = 0.48 1 1 X - 2 8 1 .6, R2 = OJ5
Thyroid stimulating hormone was undetectable in the plasma of 89% of heifers prior to TRH
infusion (Figure 4 . 1 7) . Maximum plasma TSH concentrations were reached between 2 and 30
minutes after TRH infusion in 95% of heifers with considerable variation between animals in
the size and t iming of the peak. Individual response curves were sometimes biomodal in
appearance, whi le others had a distinct peak and then a rapid decl ine ( Figure 4 . 1 8) .
1 00
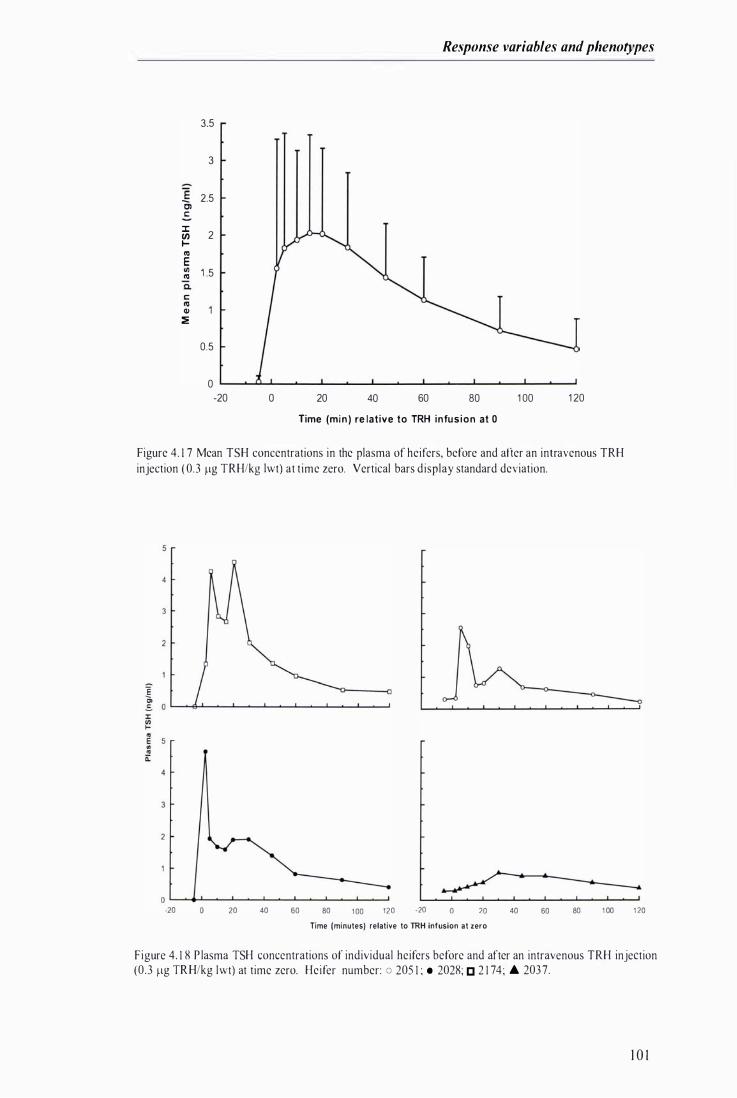
Re!Jponse variables and phenotypes
3.5
3
E 2.5 Cl E. J:
2 Cl) I-(IJ E IJJ 1 .5 (IJ Co J:: (IJ OIl
�
0.5
0
-20 o 20 40 60 80 1 00 1 20
Time (min ) re lative to TRH infus ion at 0
Figure 4. 1 7 Mean TSH concentrations in the plasma of heifers, before and after an intravenous TRH injection ( OJ Ilg TRH/kg Iwt) at time zero. Vertical bars display standard deviation.
-20 20 40 60 80 1 00 120 -20 o 20
Time (minutes) relative to TRH infusion at zero 40 60 80 1 00 1 20
Figure 4. 1 8 P lasma TSH concentrations of individual heifers before and after an intravenous TRH injection (0.3 Ilg TR H/kg Iwt) at time zero. Heifer number: 0 205 1 ; • 2028; [] 2 1 74; .. 2037.
1 0 1

Chapter 4
There was a significant effect of year (P<O.OO I ) on plasma TSH concentrations at a l l time
points. S ire did not affect TSH basel ine concentrations, due to most baseline concentrations
being below the detectable concentration of the assay, but did have a significant effect
(P<O.OO I ) on a l l time points measured after the TRH chal lenge (Figure 4. 1 9 and Appendix D) .
_ 2.5 E c;, oS 2 J: I!! E 1 .5 VI to ii 1 c to .. lE 0.5
·20 20 40 60
2.5
1 .5
0.5
80 100 120 -20 TIme (min) relative to TRH Infusion at 0
20 40 60 80 100 120
Figure 4. 1 9 Mean plasma TSH concentrations of al l heifers, grouped by challenge year ( left panel; 0 2002; • 2003 ) and by sire (right panel; 0 1 44 1 5740; . 149 1 5827; 0 1 5 525685; • 1 5656 1 14; L. 1 6 1 09405; ... 1 6 1 20004), before and after an intravenous TRH injection (0.3 �g TRH/kg Iwt) at time zero. Vertical bars display standard errors at each time.
Plasma NEF A concentrations prior to TRH chal lenge were increasing with time (Figure 4.20),
and continued to increase after the TRH infusion, until maximum concentrations were reached
2- 1 5 minutes post challenge in 84% of heifers. In general, there was a decl ine in p lasma NEFA
concentration fol lowing the maximum. Refer to Appendix D for the significance of fixed
effects on plasma NEFA.
1 02
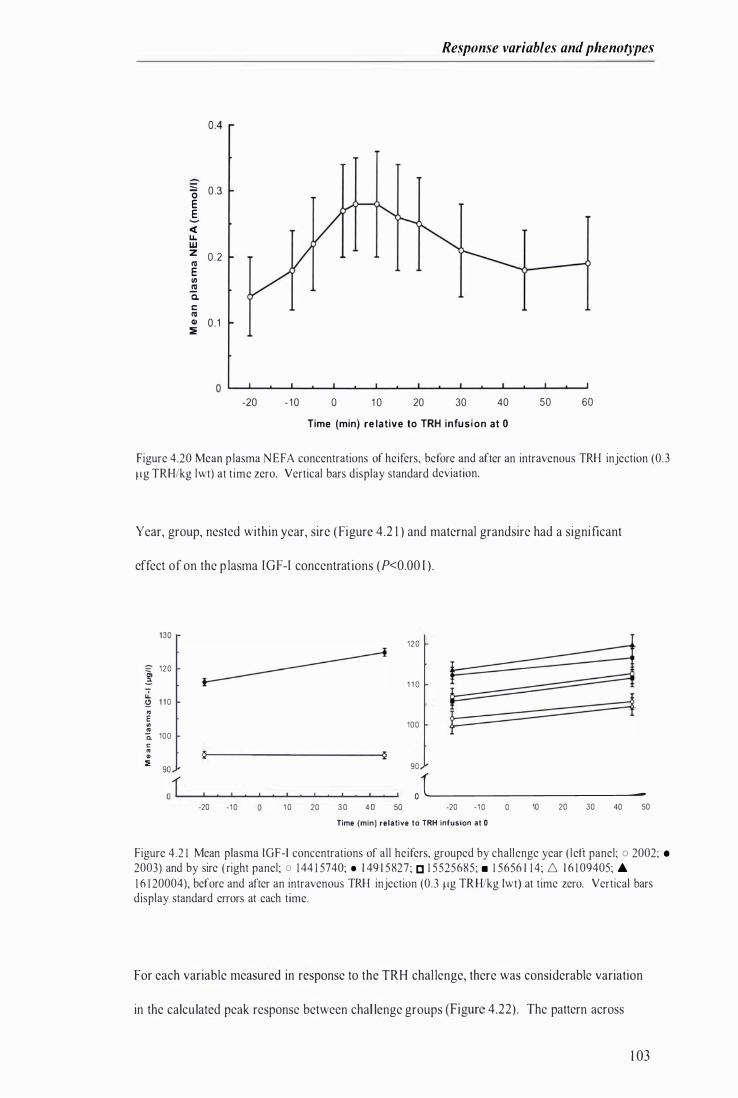
Response variables and phenotypes
S 0.3 0 E E <1: u.. w z
0 . 2 IQ E 11) � Co c: IQ Q) 0 . 1 �
-20 - 1 0 o 1 0 20 30 40 50 60
Time (min) re lat ive to TRH infusion at 0
Figure 4.20 Mean p lasma N EFA concentrations of heifers, before and after an intravenous TRH injection (OJ Ilg TRH/kg Iwt) at t ime zero. Vertical bars display standard deviation.
Year, group, nested within year, sire ( Figure 4 .2 1 ) and maternal grandsire had a significant
effect of on the p lasma IGF-I concentrat ions (P<O.OO I ) .
130
C, 120 .: u. Q 1 10 � E ., !! 100 c. c � "
:=; 90
J � �--------------------��
-20 - 10 1 0 20 30 40 50
120
1 1 0
100
90
01��������� -20 - 10 0 10 20 30 40 50
Time (min) relative to TRH infusion at 0
Figure 4 .2 1 Mean plasma IGF-I concentrations of all heifers, grouped by challenge year ( left panel; 0 2002; • 2003) and by sire ( right panel; 0 1 44 1 5740; • 1 49 1 5827; [] 1 5525685; • 1 5656 1 1 4; f:::, 1 6 1 09405; • 1 6 1 20004), before and after an intravenous TRH injection (OJ �lg TR H/kg Iwt) at time zero. Vertical bars display standard errors at each time.
For each variable measured in response to the TRH chal lenge, there was considerable variation
in the calculated peak response between chal lenge groups (Figure 4.22) . The pattern across
1 03
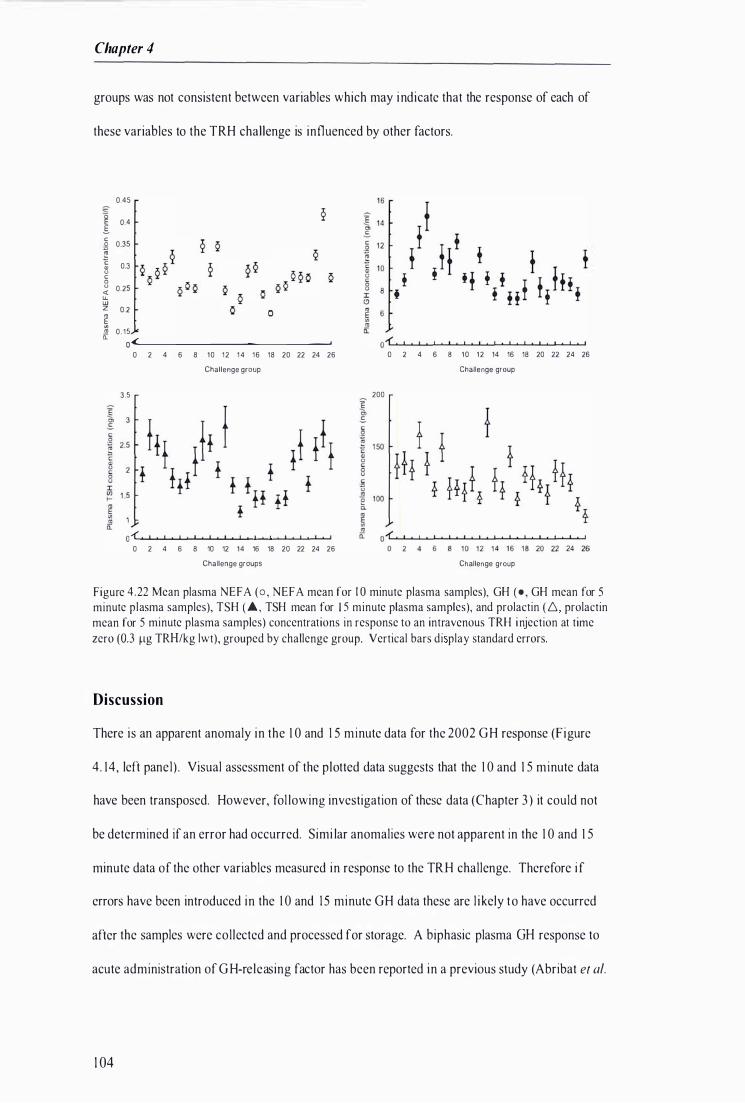
Chapter 4
groups was not consistent between variables which may indicate that the response of each of
these variables to the TRH challenge is influenced by other factors.
0.45 o 1 0.4 c .2 0.35 � � 0.3 c 8 « 0.25
u. w o Z 0.2
� £ 0. 15 O�L�����I�I�I�I�����
3.5
o 2 4 6 8 10 12 1 4 16 18 20 22 24 26 Challenge group
01' I I I I I I I I I o 2 4 6 8 10 12 14 16 18 20 22 24 26
Challenge groups
o 2 4 6 8 10 12 14 16 18 20 22 24 26 Challenge group
200
Challenge group
Figure 4 .22 Mean plasma NEFA (0 , NEFA mean for 1 0 minute plasma samples), GH (e , GH mean for 5 minute plasma samples), TSH (A , TSH mean for 1 5 minute plasma samples), and prolactin ( ,0" prolactin mean for 5 minute plasma samples) concentrations in response to an intravenous TRH injection at time zero (�J J.lg TRH/kg lwt), grouped by challenge group. Vertical bars di play standard errors.
Discussion
There is an apparent anomaly in the 1 0 and 1 5 minute data for the 2002 GH response (Figure
4 . 14 , left panel) . Visual assessment of the plotted data suggests that the 1 0 and 1 5 minute data
have been transposed. However, fol lowing investigation of these data (Chapter 3 ) it could not
be determined if an error had occurred. Simi lar anomalies were not apparent in the 1 0 and 1 5
minute data of the other variables measured in response to the TRH challenge. Therefore i f
errors have been introduced in the 1 0 and 1 5 minute GH data these are l ikely to have occurred
after the samples were collected and processed for storage. A biphasic plasma OH response to
acute administration of G H-releasing factor has been reported in a previous study (Abribat et al.
1 04
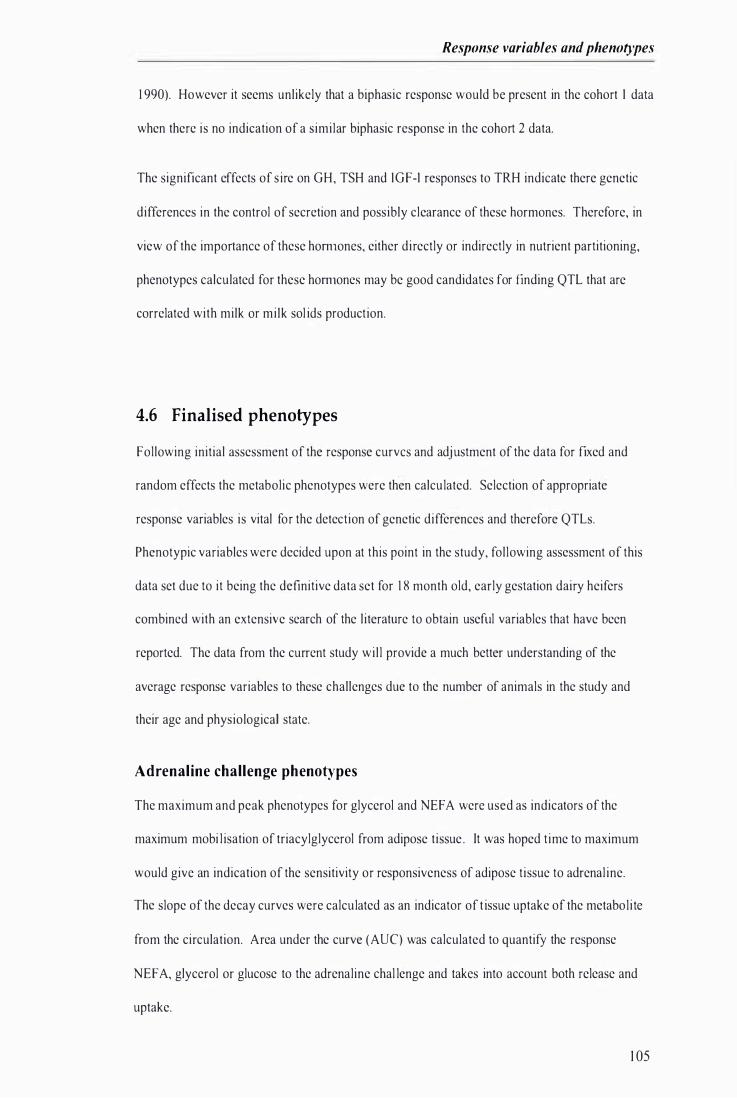
Response variables and phenotypes
1 990). However it seems unlikely that a biphasic response would be present in the cohort I data
when there is no indication of a similar biphasic response in the cohort 2 data.
The significant effects of s ire on GH, TSH and IGF-I responses to TRH indicate there genetic
differences in the control of secretion and possibly clearance of these hormones. Therefore, in
view of the importance of these hormones, either directly or indirectly in nutrient partitioning,
phenotypes calculated for these hormones may be good candidates for finding QTL that are
correlated with milk or mi lk sol ids production.
4.6 Finalised phenotypes
Following initial assessment of the response curvcs and adjustment of the data for fixed and
random effects the metabolic phenotypes were then calculated. Selection of appropriate
response variables is vital for the detection of genetic differences and therefore QTLs.
Phenotypic variables were decided upon at this point in the study, following assessment of this
data set due to it being the definitive data set for 1 8 month old, early gestation dairy heifers
combined with an extensive search of the l iterature to obtain useful variables that have been
reported. The data from the current study wi l l provide a much better understanding of the
average response variables to these challenges due to the number of animals in the study and
their age and physiological state.
Adrenaline challenge phenotypes
The maximum and peak phenotypes for glycerol and NEFA were used as indicators of the
maximum mobi l isation of triacylglycerol from adipose tissue . Tt was hoped t ime to maximum
would give an indication of the sensitivity or responsiveness of adipose tissue to adrenal ine.
The slope of the decay curves were calculated as an indicator of t issue uptake of the metabol i te
from the circulation. Area under the curve (AUC) was calculated to quantify the response
NEF A, glycerol or glucose to the adrenaline chal lenge and takes into account both release and
uptake.
1 05
Chapter 4
Glucose challenge phenotypes
Several variables were calculated to give an indication of the slope of the glucose decay curve,
these were k (fractional turnover rate (%/min)), T� (glucose clearance half times), rate of
decrease calculated as the slope of the glucose response curve after the peak. S lope of the
glucose decay curve reflects the insulin concentration and the sensitivity of the tissues to insulin
as wel l as sensitivity of the tissues to glucose in terms of non insulin mediated glucose uptake.
G lucose concentrations declined more rapidly in high breeding index compared with low
breeding index 8 month old bul l calves as wel l as lactating heifers and multiparous cows after a
glucose infusion (Mackenzie et al. 1 988, Michel et al. 1 99 1 ).
There is likely to be a genetic component to control the sensitivity of the pancreas to glucose,
therefore, insulin variables that give an indication of this would be useful. The slope of the
insulin response curve from baseline to peak, the AUC up to 1 5 minutes post-glucose infusion,
peak, insulin maximum and time to insulin maximum (definitions Appendix E, Table 9.4) were
the phenotypes calculated to give an indication of sensitivity of the pancreas to glucose. Insulin
concentrations were significantly greater in heifers and bulls with a high breeding index for
milk fat yield than those with a low breeding index in response to exogenous glucose
(Mackenzie et af. 1988, Michel et af. 199 1 , Xing et al. 1 993), indicating that insulin response to
exogenous glucose has a genetic level of control .
Insulin c learance was determined using two methods to calculate the slope of the response curve
after the peak. If insulin is cleared from the circulation quickly there will be less time for it to
cause glucose uptake compared with an animal where the insulin is c leared more slowly.
Minimum NEFA concentration, time to minimum NEFA concentration and the slope of the
disappearance of NEF A were calculated as variables to give an indication of the effect of insulin
on adipose tissue.
1 06
Response variables and phenotypes
TRH challenge phenotypes
The trapezoidal method, which involved summing the areas of adjacent sample times, was used
for calculating area under the curve, which means that the possible reversal of the 1 0 and 1 5
minute sample concentrations wi l l not change the calculated values. Simi larly, the peak i n the
response curve was the average of the 5, 1 0 and I S minutes samples and would be unaffected by
transposing the values for the 1 0 and 1 5 minute samples. However, the rate of clearance of the
GH would be affected by the 1 0 and I S minute samples being transposed. Consequently, the
phenotypes used for QTL analyses should not be affected by this possible error, except the GH
rate of clearance phenotype.
Summary
After reviewing the endocrine chal lenge l iterature and integrating the challenge data, the main
phenotypes chosen were:
• baseline, mean of the pre-challenge samples ( Frbhli and Blum 1 988, Grochowska et af.
200 I , L0vendahl et af. 1 994, Pere et af. 2000, Shingu et af. 2002 )
• peak, mean of the two time points at which the majority of animals reached maximum
concentration (Baumgard et at. 2002, Lemosquet et af. 1 997, S0rensen et at. 2002) or the
concentration at the sample time which the most animals reached maximum
( Grochowska et at. 200 I )
• maximum, the greatest plasma concentration of the hormone or metabol ite after the
chal lenge ( Baumgard et at. 2002, Lapierre et at. 1 990, Perriello et al. 2005, Radcl iff et at.
2003 )
• time to maximum (Baumgard et at. 2002, PerrielIo et al. 2005)
• AVC, calculated using the trapezoidal method after exclusion of baseline (Bunting et at.
1 994, Lacasse et af. 1 99 1 , Lapierre et af. 1 990, Lemosquet et at. 1 997, Radcl iff et af.
1 07
Chapter 4
2003) correction for basel ine al lowed calculation of AUC without the confounding
effects of variation in pre-challenge values ( Kolver et at. 200 1 )
• slope of the decay part of the curve, calculated using several different methods
(Appendix E) ( Itoh et at. 1 998, Kaneko 1 997, L0vendahl et at. 1 994, Wilmink 1 987) .
A l ist of the phenotypes generated and calculation methods used are in Appendix E . These
phenotypes were calculated to provide informative indicators of metabolic control points that
are important to milk production. Thus, these phenotypes provide the best data for finding
metabolic QTL that are co-located with milk production QTL. The method used to conduct
QTL searches with the metabolic phenotypes and the results are described in Chapter 5 .
1 08

CHAPTER S
QTL mapping and selection
Chapter 5
5.1 Introduction
The purpose of this chapter is to outline the data manipulation and processing required to
generate a l ist of candidate genes. The candidate genes were then assessed for their relevance to
the QTL in the region of interest. Discussion of the genes wi l l occur in the next chapter. The
key steps in the process were:
I . generation of phenotypes from adjusted phenotypic data
2. run the data through the QTL mapping interface
3 . generate output for the significant QTL
4. assess the output and decide which chromosomal regions are of interest and warrant
further investigation
5 . generate a l ist of candidate genes for the region of interest
6. investigate the biochemical function of these candidate genes to try and establ ish which
are the most l ikely to be causing the QTL seen that region.
Each of these steps will be discussed in this chapter.
5.2 Phenotype generation
An overview of the phenotypes calculated using SAS (version 8 .2, 1 999-200 1 by SAS [nstitute
Inc., Cary, NC, USA) was given in Chapter 4. In total 1 07 (2 1 glucose chal lenge; 23 adrenal ine
chal lenge; 5 1 TRH challenge) phenotypes were calculated for each heifer that underwent the
experimental chal lenges. Once these phenotypes had been generated, the data were transferred
into tables, one per challenge. These files were then used to run the preliminary 'multimasher'
analyses.
1 1 0

QTL mapping and selection
5.3 QTL analysis using WEBQTLAN A
WEBQTLANA is a tool developed by scientists at Livestock I mprovement Corporation ( LIC),
which enabled web-based QTL analysis to be performed on the FJXB experiment data. This
web-based tool was developed by Dr Richard Spelman in Fortran 90 for mapping QTL and uses
a suite of Haley Knott regression programs based on least squares regression methodology
(Knot! et at. 1 996). Three QTL models were fitted: additive, additive + dominance in a l ine of
descent sett ing and a half sib model . For each putative QTL position, l inear least squares can be
used to regress the trait value for each animal onto their addit ive (a) and dominance (d)
coefficients ( Haley et al. 1 994). The model gives estimates for a and d for that position. The
procedure is repeated for chosen fixed posit ions (every cM) through a l inkage group and the
best estimate of the QTL effects and position are given where the residual sum of squares is
minimised (Haley et al. 1 994). For a fixed posit ion of QTL, the ratio of the regression mean
square to the residual mean square provides the variance (F) ratio test statistic ( Haley et al.
1 994).
Init ial ly the phenotypes were run through a 'mul timasher' scan in WEBQTLA A, this involved
a genome wide scan for each phenotype. The 'multimasher' scan was run at 500 permutations
to estimate critical values. It gave an output that contained the phenotype, the chromosome and
p-values for each of the three QTL models fitted ( Figure 5. I ) . This output was used to identi fy
which chromosomes had potentially significant QTL for each phenotype and therefore required
further investigation.
Following identification of the potentially sign ificant QTL from the 'multimasher' scans, an
individual fi le for each of the phenotypes with the corresponding animals key (an identification
number that is unique for each animal in the Friesian-Jersey crossbred trial database) were
generated. These phenotype fi les were used to run further QTL analyses on the chromosomes
that had been identified by the 'multimasher' scans. These analyses were of a greater accuracy
than the ini tial 'multimasher' scan due to the greater number of permutation tests (the number of
repetitions of the analysis) and bootstrapping ( used to determine a confidence interval for the
I I I

Chapter 5
location of the QTL), which were 1 0,000 and 1 000, respectively. The pem1Utation tests
determine an experiment-wide significance level for the QTL by re-computing the test statistic
for each new sample, generating an empirical distribution from the null hypothesis. The null
hypothesis was that there was no phenotype-genotype associations. Datasets for the null
hypothesis were generated by using random shuffling to assign genotypes to the phenotypic data
for the permutations tests and the analysis was re-run 1 0,000 times (Spelman et al. 1 996) .
M u lti Masher: The resu lts from a scan . Phenotype Chromosome
L-o-O a P- L-o-O a+d P- half-sib P-value
value % value % % G H auc total -1 - 1 1 3
G H auc total 2 -1 1 7 .2 1 .4
G H auc total 3 -1 - 1 84.2
G H auc total 4 -1 - 1 23.8
G H auc total 5 1 5 22.2 87
GH auc total 6 - 1 - 1 23
G H_auc_total 7 - 1 - 1 76 .8
GH auc total 8 1 1 .6 21 .2 70.2
GH auc total 9 5.2 1 6.6 3.8
GH auc total 1 0 - 1 0.8 68.8
GH auc total 1 1 - 1 23.2 8.6
GH auc total 1 2 - 1 1 5.8 1 3 .8
GH auc total 1 3 3.6 5.2 0.8
G H auc total 1 4 - 1 - 1 27
Figure 5 . 1 Example of the output generated by QTLANA from a 'mult imasher' scan. The output shows the phenotype used in the analyses, the chromosomes scanned and the P-value expressed as a percent for the three QTL models fitted; additive (a), additive dominance (a+d) in a l ine of descent ( L-o-D) setting and half sib model. The highl ighted values are those that are significant at the 5% level. The - 1 P-values occur where the F-values were too low for P-values to be estimated via permutation, this saved computational time.
QTL mapping was conducted for each phenotype on each chromosome that the multimasher
scan found a signi ficance level of 5% or less. This resulted in more than 1 ,300 separate QTL
analyses being run in WEBQTLANA. Only those QTL that were significant at the I % level
were included in the next stage of the analyses ( Appendix F) . An example of the output
generated for a single chromosome, BT A 1 4, and phenotype, IGF-I mean, is shown in the
subsequent section. The text in italics provides an explanation of each part of the output.
1 1 2
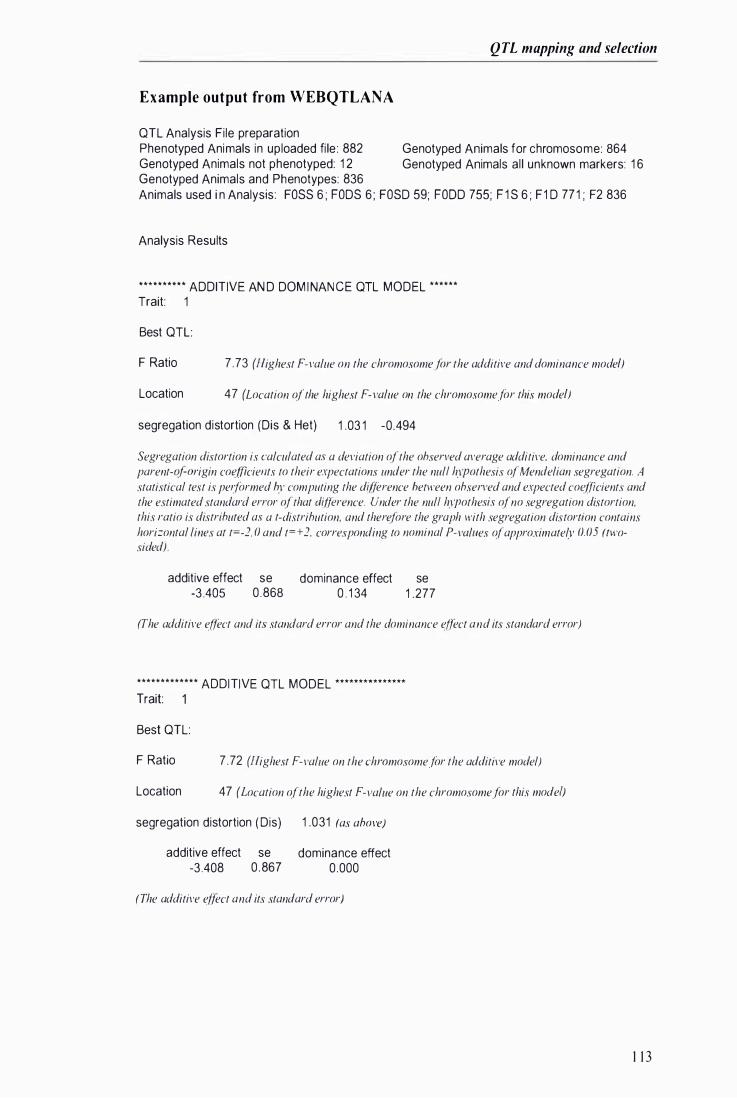
QTL mapping and selection
Example output from WEBQTLANA
QTL Analysis Fi le preparation Phenotyped Animals in uploaded fi le : 882 Genotyped Animals not phenotyped: 1 2 Genotyped Animals and Phenotypes: 836
Genotyped Animals for chromosome: 864 Genotyped Animals al l unknown markers: 1 6
Animals used i n Analysis: FOSS 6 ; FODS 6 ; FOSD 59; FOOD 755; F 1 S 6 ; F1 D 77 1 ; F2 836
Analysis Results
• • • • • • • • • • ADDITIVE AN D DOM I NAN CE QTL MODEL • • • • • •
Trait: 1
Best QTL:
F Ratio
Location
7 .73 (Highest F-value on the chromosome for the additive and dominance model)
47 (Location of the highest F-value on the chromosomefor this model)
segregation distortion (Dis & Het) 1 .03 1 -0.494
Segregation distortion is calculated as a deviation of the observed average additive, dominance and parent-% rigin coefficients to their expectations under the nul! hypothesis of Mendelian segregation. A statistical test is performed by computing the difference between observed and expected coefficients and the estimated standard error of that difference. Under the nul! hypothesis of no segregation distortion, this ratio is distributed as a t-distribution, and therefore the graph with segregation distortion contains horizontal lines at t=-2. 0 and t=+2, corresponding to nominal P-values of approximately 0.05 (twosided).
additive effect se -3 .405 0 .868
dominance effect se 0 . 1 34 1 .277
(The additive effect and its standard error and the dominance effect and its standard error)
• • • • • • • • • • • • • ADDITIVE QTL MODEL .............. .
Trait:
Best QTL:
F Ratio 7 .72 (Highest F-value on the chromosome for the additive model)
Location 47 (Location of the highest F-value on the chromosome for this model)
segregation distortion ( Dis) 1 .031 (as above)
additive effect se -3 .408 0 .867
dominance effect 0 .000
(The additive effect and its standard error)
1 1 3
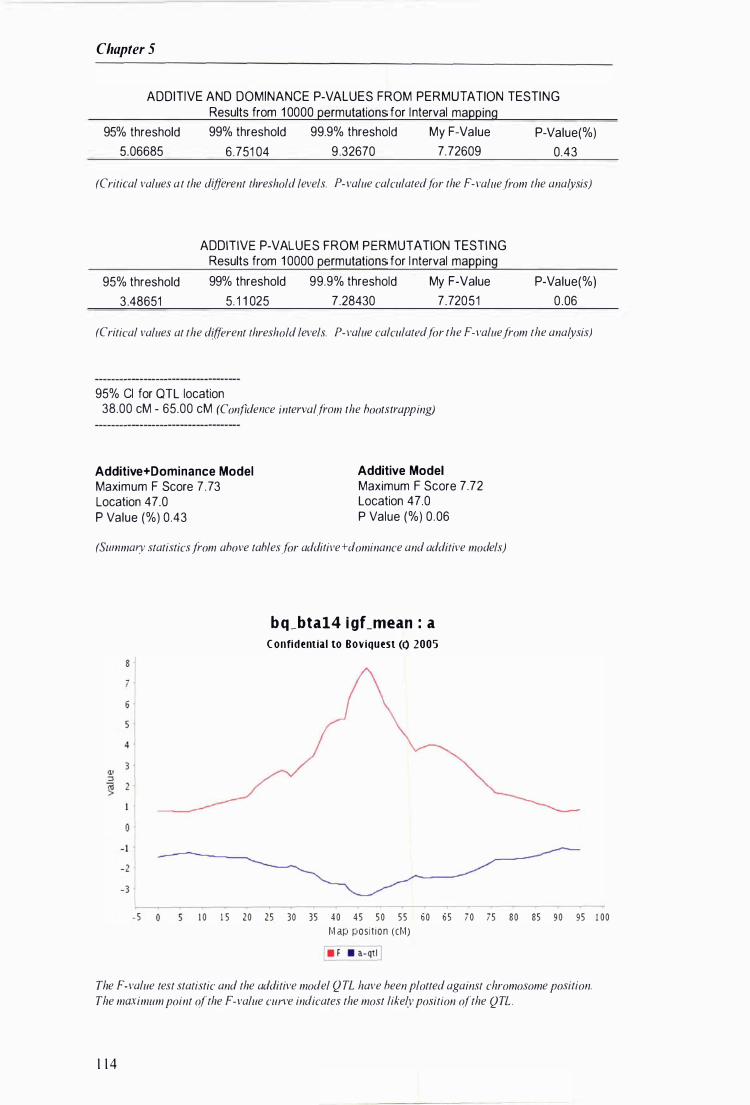
Chapter 5
ADDITIVE AND DOMINANCE P-VALUES FROM PERMUTATION TESTING Results from 1 0000 permutations for I nterval mapping
95% threshold
5.06685
99% threshold 99.9% threshold My F-Value
6 .751 04 9 .32670 7.72609
P-Value(%)
0 .43
(Critical values at the different threshold levels. P-value calculated for the F-value from the analysis)
95% threshold
3 .48651
ADDITIVE P-VALUES FROM PERMUTATION TESTI NG Results from 1 0000 permutations for I nterval mapping
99% threshold 99.9% threshold My F-Value
5. 1 1 025 7 .28430 7 .72051
P-Value(%)
0 .06
(Critical values at the different threshold levels. P-value calculated for the F-value from the analysis)
95% Cl for QTL location 38.00 cM - 65.00 cM (Confidence intervalfram the boots trapping)
Additive+Dominance Model Maximum F Score 7 .73 Location 47.0 P Value (%) 0 .43
Additive Model Maximum F Score 7.72 Location 47.0 P Value (%) 0 .06
(SwnmGlY statistics from above tables for addilive+dominance and additive models)
b q _bta14 i gLmean : a
C onfidential to Boviquest (0 2005
- 5 1 0 1 5 20 2 5 30 35 40 45 5 0 5 5 60 6 5 7 0 75 80 85 9 0 95 1 00 M ap pos i t ion (cM)
� � The F-value test statistic and the additive model Q TL have been plotted against chromosome position. The maximum point of the F-value curve indicates the most likely position of the QTL .
1 1 4
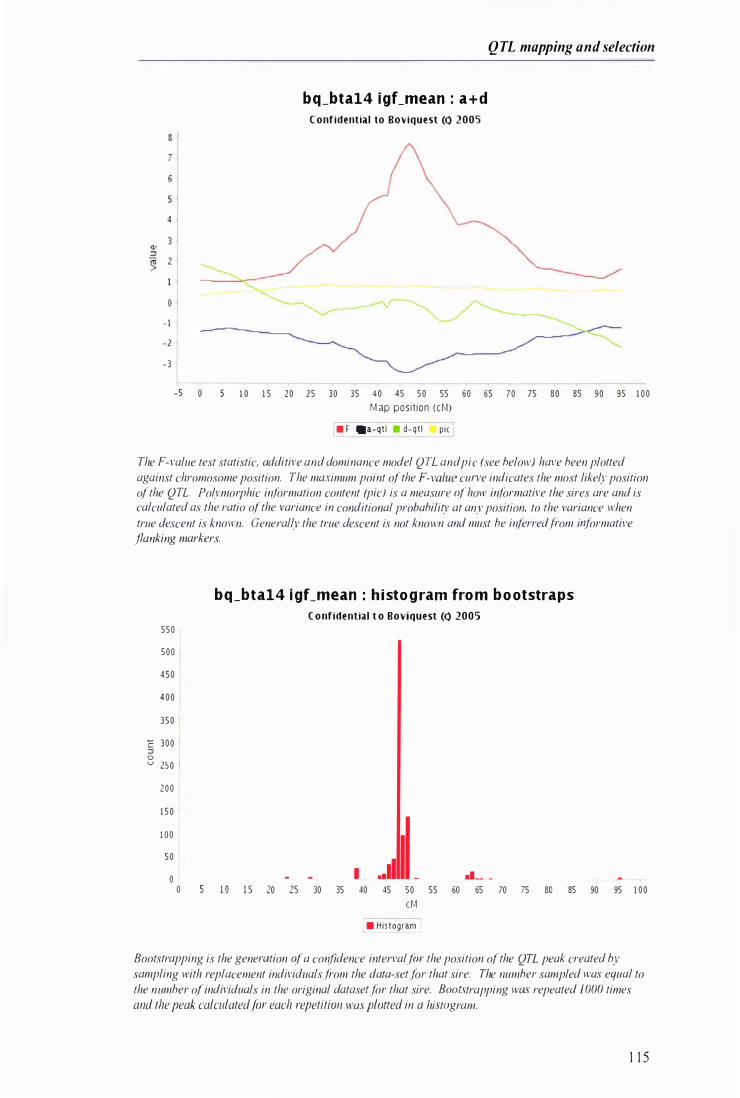
4
- I -2 -3
-5
QTL mapping and selection
b q _bta14 i gLmean : a + d
Confidential to Boviquest (0 2005
1 0 1 5 20 25 30 35 40 45 50 55 60 65 70 75 BO B5 90 95 100
M ap posit ion (c/vl) • f .a-qt l • d-qt l pie
The F-value test statistic, additive and dominance model QTL and pic (see below) have been plolted against chromosome position. The maximum point o/the F-value curve indicates the most likely position o/the QTL. Polymorphic information content (pic) is a measure 0/ how informative the sires are and is calculated as the ratio o/the variance in conditional probability at any position, to the variance when true descent is known. Generally the true descent is not known and must be in/erredfrom informative flanking markers.
550
500
450
4 0 0
350
E 300 :::l 0 u 250
200
150
100
50
0
0
b q _bta14 i gLmean : h i sto g ram fro m b o otstraps
C o nfidential t o Boviquest (0 2005
I .1 __ _
1 0 1 5 20 25 30 35 40 45 50 55 60 65 70 75 BO B5 90 95 1 0 0
cM • Histogram
Bootstrapping is the generation 0/ a confidence interval/OI' the position o/the QTL peak created by sampling with replacement individuals from the data-set for that sire. The number sampled was equal to the number o/individuals in the original datasef for that sire. Bootstrapping was repeated 1 000 times and the peak calculated Jor each repetition was ploued in a histogram.
1 1 5
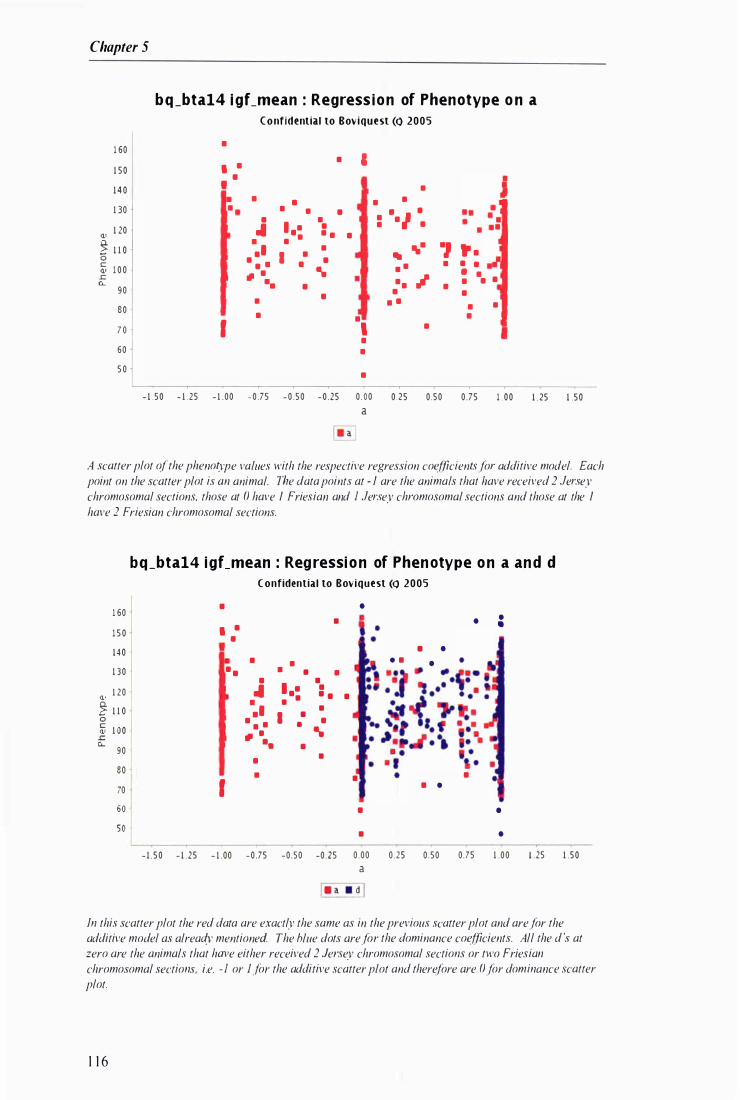
Chapter 5
b q _bta14 i gLmean : Regress i o n of Phen otype o n a
Confidential to Boviquest (0 2005
1 60 •
• I 1 50 • •
• J 1 4 0 • •
• • • • 1 30 • • • . I · • • • • •
III 1 20 .. I •• • • • • •
� 1 1 0 • • •
... ., • 1 • t • I • ... 0 • • c 1 0 0
• • • • • • • • III iI • .. • •• • £: � Q.. .. • • • 90
• • • • •
• • • • 80 •
• • • 7 0 I I •
• 60 •
5 0 •
-1 . 50 - 1 .25 - 1 .00 - 0 .75 -0 .50 -0 .25 0 . 00 0 .25 0 .50 0 .75 1 . 00 1 . 25 1 . 50
a
� A scatter plot of the phenotype values with the respective regression coefficients for additive model. Each point on the scatter plot is an animal. The data points at - 1 are the animals that have received 2 Jersey chromosomal sections, those at 0 have 1 Friesian and I Jersey chromosomal sections and those at the 1 have 2 Friesian chromosomal sections.
b q _bta14 i gLmean : Reg ressi o n of Phen otype o n a an d d
C onfidential to Boviquest (<) 2005 • •
1 60 • • • • 1 5 0 • •
• 140
• • • • • • •
1 30 • • • • • • I ••
•
'" 1 20 .. • • • •
� 1 1 0 • • •
.- • I • 0 • • • • c
1 00 • .. III il l J:: Q.. .. •
90 • • 80 • • 70 J •
I • •
:: I • •
• •
- 1 . 5 0 - 1 . 2 5 - 1 .00 -0 .75 -0 .50 -0.25 0 .00 0 . 25 0 .50 0.75 1 .00 1 . 25 1 .50
a
�dJ
In this scatter plot the red data are exactly the same as in the previous scatter plot and are for the additive model as already mentioned. The blue dots are for the dominance coefficients. All the d 's at zero are the animals that have either received 2 Jersey chromosomal sections or two Friesian chromosomal sections, i.e. -I or 1 for the additive scatter plot and therefore are 0 for dominance scatter plot.
1 1 6
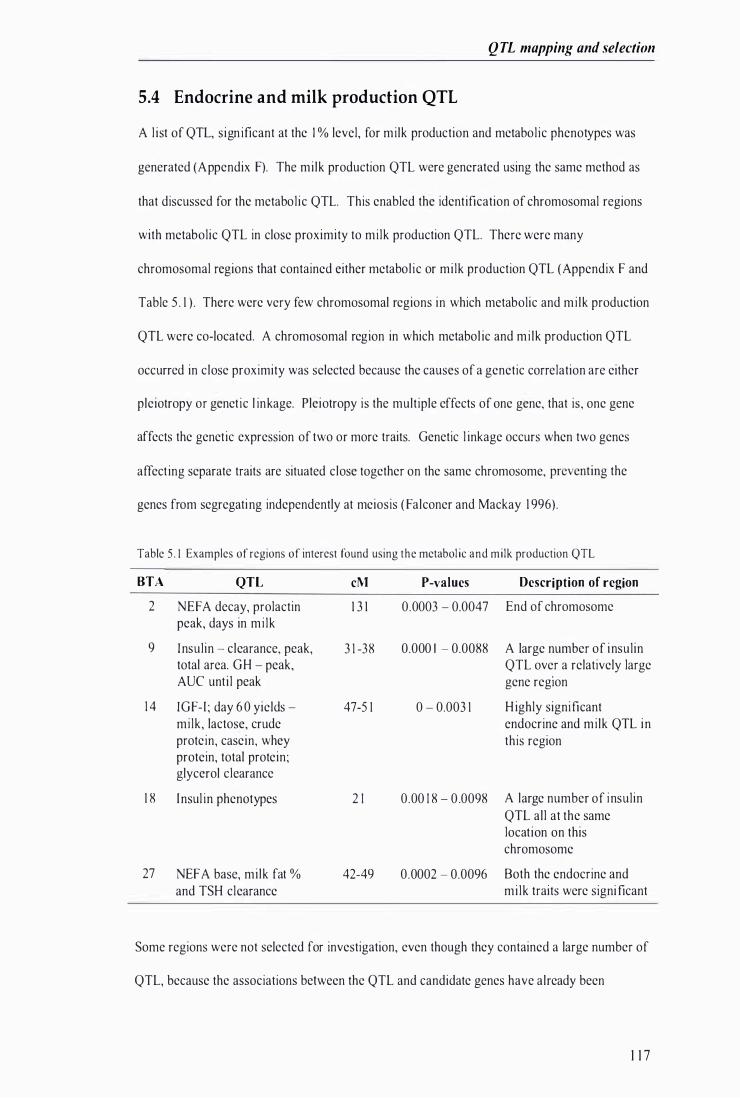
QTL mapping and selection
5.4 Endocrine and milk production QTL
A l ist of QTL, sign ificant at the I % level, for milk production and metabolic phenotypes was
generated (Appendix F). The milk production QTL were generated using the same method as
that discussed for the metabolic QTL. This enabled the identification of chromosomal regions
with metabolic QTL in close proximity to milk production QTL. There were many
chromosomal regions that contained either metabol ic or milk production QTL (Appendix F and
Table 5 . 1 ) . There were very few chromosomal regions in which metabolic and mi lk production
QTL were co-located. A chromosomal region in which metabol ic and mi lk production QTL
occurred in close proximity was selected because the causes of a genetic correlation are either
pleiotropy or genetic l inkage. Pleiotropy is the multiple effects of one gene, that is, one gene
affects the genetic expression of two or more traits. Genetic l inkage occurs when two genes
affect ing separate traits are situated close together on the same chromosome, preventing the
genes from segregating independently at meiosis ( Falconer and Mackay 1 996).
Table 5 . 1 Examples of regions of interest found using the metabol ic and milk production QTL
BTA QTL cM P-values Description of region
2 NEF A decay, prolactin 1 3 1 0.0003 - 0.0047 End of chromosome peak, days in mi lk
9 Insulin - clearance, peak, 3 1 -38 0.000 I - 0.0088 A large number of insulin total area. GH - peak, QTL over a relatively large AUC unti l peak gene regIon
1 4 IGF-I ; day 6 0 yields - 47-5 1 0 - 0.003 1 H ighly significant milk, lactose, crude endocrine and milk QTL in protein, casein, whey this region protein, total protein; glycerol clearance
1 8 Insul in phenotypes 2 1 0.00 1 8 - 0 .0098 A large number of insulin QTL all at the same location on this chromosome
27 NEF A base, mi lk fat % 42-49 0.0002 - 0.0096 Both the endocrine and and TSH clearance mi lk traits were significant
Some regions were not selected for investigation, even though they contained a large number of
QTL, because the associations between the QTL and candidate genes have already been
1 1 7
Chapter 5
established. For example, at 0 CM on BTA 1 4 in the current study there were QTL for milk fat
percentage at a l l stages of lactation. This region was not considered further because the QTL
and the gene most l ikely responsible, DGA T l , have already been reported (Grisart et af. 2002).
Even though these regions were not investigated further in this study, confidence in the
techniques used to identify QTL and their rel ationships with phenotypes i s warranted given that
simi lar regions have been identified in other studies.
The chromosomal regions to be considered for candidate gene studies were selected on the basis
of low P-values, high F-values, a well-defined location and a high density of QTL of similar
phenotypes. The regions that contained either milk production or metabolic QTL, were
excluded as the purpose of the study was to find candidate genes that affect both metabol ic and
milk production phenotypes significantly. The region selected for a candidate gene study was
BT A 1 4 due to the region containing both endocrine and mi lk production QTL, the low P
values and high F-values of the QTL.
A primary objective of this study was to identify chromosomal regions in which metabol ic and
milk production QTL were co-located. It was hoped that these regions would contain genes that
had a significant impact on the control of milk production. However, one of the major findings
from this study was that there are only a very smal l number of regions that contained both
metabolic and milk production QTL located within a few cM of each other. There were a large
number of chromosomal regions where clusters of similar metabolic or milk production QTL
were co-located but it was rare for metabol ic and milk production QTL to be co-located
(Appendix F) . Perhaps this is not a surprising finding, given the difficulty in establishing
consistent and repeatable physiological indicators of milk production demonstrated in previous
studies, reviewed by Wool l iams and L0vendahl ( 1 99 1 ). On a number of chromosomes (BT A I ,
5, 6, 8, 1 1 , 1 4, 25 and 27), c lusters of metabolic QTL were co-located and mi lk production QTL
were co-located on distinct regions of the same chromosome. I t may be that genes underlying
the clusters of metabol ic and interact with genes underlying milk production QTL due to
chromosome folding. Thus, expression of genes influencing mi lk production traits may be
1 1 8

QTL mapping and selection
activated by genes control l ing metabol ic traits at distant locations on the same chromosome
(Kleinjan and van Heyningen 2005) .
Chromatin is a highly organised and dynamic nucleoprotein structure that plays a pivotal role in
gene regulation by modulating access to DNA during gene repl ication and transcription ( Joyce
2007, O'Rei l ly and Greaves 2007). Changes in chromatin architecture and formation of
chromatin loops have been proposed as a mechanism for bringing together DNA and proteins
within a defined sub-region of the nucleus to fac i l itate activation or si lencing of gene expression
(O'Rei l ly and Greaves 2007). The genomic regions containing regulatory elements can stretch
as much as I megabase in either direction from the transcription unit. Some or all of these
regulatory elements can be situated within the introns of neighbouring gene(s) , often with a
function that is unrelated to the regulated gene (Kleinjan and van Heyningen 2005 ) . The
regulatory domain is first activated by transcription factor binding and chromatin modifications
at the remote upstream elements. These changes then extend along the chromatin domain from
the upstream elements to the promoter, producing a ful ly poised state at each of the conserved
elements (enhancers and promoters) throughout the regulatory domain (Veminunen et at. 2007).
Remote regulatory elements appear to play an important role within the stepwise orchestration
of promoter assembly. They bring about a physical interaction between promoters and the pre
init iation complex (a complex of general transcription factors and RNA polymerase 11 ) leading
to chromatin remodel l ing and transcriptional initiation (Verninunen et at. 2007). Thus, it would
seem that there is long-range regulation of gene expression. This has important impl ications for
conducting QTL searches. A QTL location may be identified at the site of chromosomal
rearrangement, that apparently affects one gene, however, the rearrangement may dissociate
remote control elements from a more meaningful candidate gene located some distance away
(Kleinjan and van Heyningen 2005) . The long-range regulation of gene expression wil l need to
be considered in future studies. In the current study only milk production and metabol ic QTL
that were in close proximity were considered. This imposed a reasonable l imit on the number of
1 1 9
Chapter 5
possible QTL combinations requiring consideration and consequently also placed a l imit on the
potential candidate genes that required investigation.
5.5 Candidate genes
Once the chromosomal region to be studied was selected, there were a number of steps taken to
generate the l ist of candidate genes. Fol lowed by assessment of which genes were most l ikely
to be responsible for the QTL in the region of interest. The steps were:
1 20
I . Obtain the estimate of the best location for the QTL from the WEBQTLANA output.
2. Look up the gene markers that were s ituated close to this locat ion in the FJXB gene
maker file. One nearest to the QTL location and two that were approximately I OcM
either side of the QTL location.
3. Comparative l ivestock annotation system (CLAS) was used to generate the l ist of
candidate genes. CLAS is an LIC inhouse (developed by Alexander Kvasz and Wouter
Coppieters, Molecular Genetics, Faculty of Ye teri nary Medicine, University of Liege,
Belgium) bioinformatics p latform that a l lows the bovine and human genomes to be
al igned. Thus, it uti lises gene annotation that has occurred for the human genome.
Firstly, the chromosome of interest and the gene maps to be used were selected then the
comparative view window was opened. The gene maps used were from the USDA
(United States Department of Agriculture) and SlAG (Shirakawa I nstitute of Animal
Genetics) along with the gene marker map for the Friesian-Jersey crossbred trial . At
the time these steps were conducted for the current study the bovine map had not been
annotated so comparative mapping was used to generate the l ist of candidate genes.
4. Once the comparative view window was open then the gene markers near the QTL of
interest, obtained in step 2, were searched for and identified on the three gene maps
(USDA, SlAG and FJXB) . The markers were used to define the region from which the
candidate gene l ist was generated.
QTL mapping and selection
5 . A report was generated for the sclcctcd region. The report contained the following, for
each gene, where known:
• HGNC ( HUGO (The Human Genome Organisation) Gene Nomenclature
Committee) symbols
• Ensembl gene identification numbers. Ensembl is a joint project between EMBL -
European Bioinformatics I nstitute (EBI ) and the Wellcome Trust Sanger I nstitute
(WTSI ) to develop a software system that produces and maintains automatic
annotation on selected eukaryotic genomes.
• A description of the gene function
• A RefSeq or Swiss-ProtlTrEMBL accession number. The Reference Sequence
(RefSeq) is the public database of nucleotide and protein sequences built by the
National Centre for B iotechnology Infomlation (NCBI ) ( Pruitt et at. 2005 ). Swiss
Prot/TrEMBL accession numbers were obtained from the Universal Protein
Resource ( UniProt) database. UniProt is a centralised resource for protein
sequences and functional information, formed in 2002 through the amalgamation of
the Swiss-Prot + TrEMBL (created by the Swiss I nstitute of Bioinformatics and
European B ioinformatics Institute) and P IR-PSD (created by the Protein
Information Resource group at Georgetown University Medical Center and National
Biomedical Research Foundation) protein databases ( Bairoch et at. 2005).
6 . The Ensembl gene identification numbers were extracted from the report.
7 . The l ist of Ensembl numbers was entered into a gene identification ( ID) code converter
website located at http://idconverter.bioinfo.cipf.es/ ( 1 5 March 2007) . The website was
used to convert the Ensembl numbers to Locusl ink ID (NeBl ) . LocusLi nk was
developed by NCBI as a cross-referencing tool that anchors an official gene name, gene
1 2 1
Chapter 5
al iases, database lDs, phenotypes, map posi tions, sequence accession numbers, and
other identifiers to a stable LocusL ink ID number (Pruitt and Maglott 200 1 ) .
8 . An initial investigation of each gene was conducted. Gene networks and gene function
information were generated through the use of Ingenuity Pathways Analysis
( I ngenuity® Systems, http://www. ingenuity.com/. (5 April 2007)) and GeneCards®
(Rebhan et at. 1 997) .
9 . Once the init ial investigation of each gene in the candidate l ist was completed, the
information was assessed. Genes that did not have a function that could logically be
related to the QTL and genes for which there was no information were discarded. The
genes that had functions that could potentia l ly be related to the QTL of interest were
then investigated in published l iterature for their relevance the mi lk and metabolic
phenotypes in the region of interest. One of the major difficulties with this work is the
numerous synonyms or al iases for each gene. This meant that l i terature searches had to
encompass as many synonyms as possible. If not all synonyms were known this would
have reduced the effectiveness of the l iterature searches.
5.6 Summary
In total 1 07 ( 2 1 glucose challenge; 23 adrenali ne challenge; 5 1 TRH challenge) phenotypes
were calculated on adjusted data for each heifer that underwent the experimental challenges
(Chapter 4). These data were then subjected to preliminary analyses in WEBQTLANA that
involved a genome wide scan of each phenotype. The output was used to identify the
chromosomes that had potentially significant QTL at a significance level of 5% or less. More
than 1 ,300 separate analyses were then run through WEBQTLANA again using parameters that
conferred greater accuracy to the analyses. A l ist of QTL, significant at the I % level, for mi lk
production and endocrine phenotypes was generated (Appendix F) .
The processes described in th is chapter led to a large number of QTL being mapped using the
metabolic and mi lk production phenotypes. 58 1 QTL were significant at the 1% level and 275
1 22
QTL mapping and selection
of them wcrc QTL of endocrine phenotypes (Appendix F) . The large number of QTL suggests
that the metabolic challenges did perturb the physiology of the animals in such a way that it
al lowed l ikely genetic control mechanisms to be identified. Certain phenotypes were strongly
associated with particular chromosomes, for example QTL for insul in phenotypes were found
on chromosomes 9, 1 5 , 1 8 and 25, and QTL for TSH were found on chromosomes 3, I I and 1 3
(Appendix F) .
A major finding of this study was the very small number of regions in which metabolic and milk
production QTL were co-located. However, it is possible that gene regulatory elements are
remotely located, as much as I megabase, in either direction from the transcription unit. Some
or all of these e lements may be situated within the introns of neighbouring gene(s), often with a
function that is unrelated to the regulated gene (Kleinjan and van Heyningen 2005) . Long-range
regulation of gene expression adds another level of complexity to conducting QTL searches
(Kleinjan and van Heyningen 2005).
The region selected for a candidate gene study was 47-5 1 cM of BT A 14 due to the region
containing both endocrine and milk production QTL, the low P-values and high F-values of the
QTL. The candidate gene l ist was generated using a comparative gene map annotation
programme. An initial investigation of each gene and its function was carried out using two
websites that mine data from a number of l iterature sources. Assessment of this information
was conducted and a number of genes were discarded from the study. The genes that had
functions that could potentially be related to the QTL of interest were then further investigated
using published I iterature. Investigation of the selected genes is described in the Chapter 6.
1 23
Chapter 5
1 24
CHAPTER 6
Candidate genes in region of interest on chromosome 14

Chapter 6
6.1 Introduction
[n previous chapters, the metabol ic challenges, generation of phenotypes, QTL analyses and
generation of a l ist of genes in the chromosomal region of interest have been discussed. The
objectives of this chapter are to investigate the function of each of the genes in the l ist and draw
conclusions as to which of these genes would be the most l ikely to act as genetic control
mechanisms of the metabolic and milk production QTL.
A region from 47 to 5 1 cM on 80S Taurus autosome 1 4 (BT A 1 4) was selected as the region of
interest due to the proximity of metabol ic and milk production QTL and the high F-values and
low P-values (Chapter 5 ) . This region includes QTL for baseline insulin-l ike growth factor-J
( lGF-l), 60 day yields for milk, lactose, crude protein, total protein, casein and whey protein
(Table 6. 1 ).
Table 6. 1 The predicted locations (cM) for the QTL for mean concentrations of baseline insulin-l ike growth factor I ( igCmean), the first 60 days of lactation (d60) milk yield (pmy), lactose yield (ply), crude protein yield (pcPY), total protein yield (ptpy), casein yield (pcy) and whey protein yield (pwpy) as determined by the additive (A) and additive + dominance (A+D) QTL models together with the level of significance ( P-value) the maximum F-value and the 95% confidence interval (95% C l ) of the QTL location (cM).
Predicted Max im u m Analysis Phenotype location (cM) P-value F-value 95% Cl
A igCmean 47 0.0006 7.72 38 - 65
A+D igCmean 47 0.0043 7.73 3 8 - 65
A+D d60ymy 48 < 0.000 1 1 1 .07 1 3 - 56
A+D d60yly 48 0.000 1 1 1 . 1 8 2 1 - 56
A d60yly 49 < 0.000 1 1 0.37 2 1 - 56
A d60ymy 49 0.000 1 1 0.09 1 3 - 56
A+D d60ycpy 5 1 < 0.000 1 1 1 .72 37 - 55
A d60ycpy 5 1 < 0.000 1 1 1 . 3 1 37 - 55
A d60ytpy 5 1 < 0.000 1 1 1 .26 38 - 54
A d60ycy 5 1 0.000 1 1 1 . 1 4 35 - 56
A+D d60ytpy 5 1 0.000 1 1 1 .59 38 - 54
A+D d60ycy 5 1 0.0002 1 1 . 57 35 - 56
A d60ymsy 5 1 0.0002 8.72 22 - 60
A d60ywpy 5 1 0.00 1 2 7.92 20 - 54
1 26
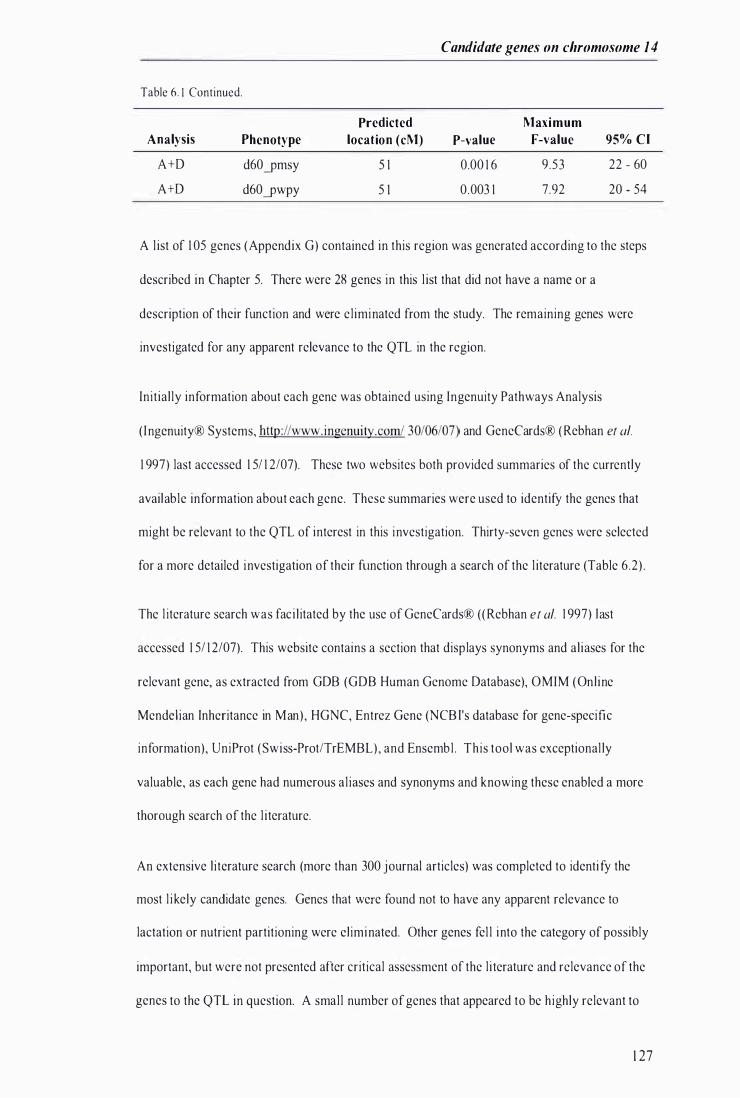
Candidate genes on chromosome 14
Table 6. 1 Continued.
Predicted Maxi mum Analysis Phenotype location (cM) P-value F-value 95% Cl
A+D d60�msy 5 1 0.00 1 6 9 .53 22 - 60
A+D d60�wpy 5 1 0.003 1 7.92 20 - 54
A l ist of 1 05 genes (Appendix G) contained in this region was generated according to the steps
described in Chapter 5. There were 28 genes in this l ist that did not have a name or a
description of their function and were el iminated from the study. The remaining genes were
investigated for any apparent relevance to the QTL in the region.
Init ial ly information about each gene was obtained using Ingenuity Pathways Analysis
( Ingenuity® Systems, http://www. ingenuity.com/ 30/06/07 ) and GeneCards® (Rebhan et 01.
1 997) last accessed 1 5/ 1 2/07). These two websites both provided summaries of the currently
available information about each gene. These summaries were used to identify the genes that
might be relevant to the QTL of interest in this investigation. Thirty-seven genes were selected
for a more detailed investigation of their function through a search of the l iterature (Table 6 .2) .
The l iterature search was fac i l itated by the use of GeneCards® ((Rebhan et 01. 1 997) last
accessed 1 5/ 1 2/07). This website contains a section that displays synonyms and al iases for the
relevant gene, as extracted from GDB (GDB Human Genome Database), OMIM (Onl ine
Mendelian Inheritance in Man) , HGNC, Entrez Gene (NCB ['s database for gene-specific
information), UniProt (Swiss-ProtlTrEMBL), and Ensembl . This tool was exceptional ly
valuable, as each gene had numerous al iases and synonyms and knowing these enabled a more
thorough search of the l i terature.
An extensive l i terature search (more than 300 journal articles) was completed to identify the
most l ikely candidate genes. Genes that were found not to have any apparent relevance to
lactation or nutrient partitioning were eliminated. Other genes fel l into the category of possibly
important, but were not presented after critical assessment of the l i terature and relevance of the
genes to the QTL in question. A small number of genes that appeared to be highly relevant to
1 27
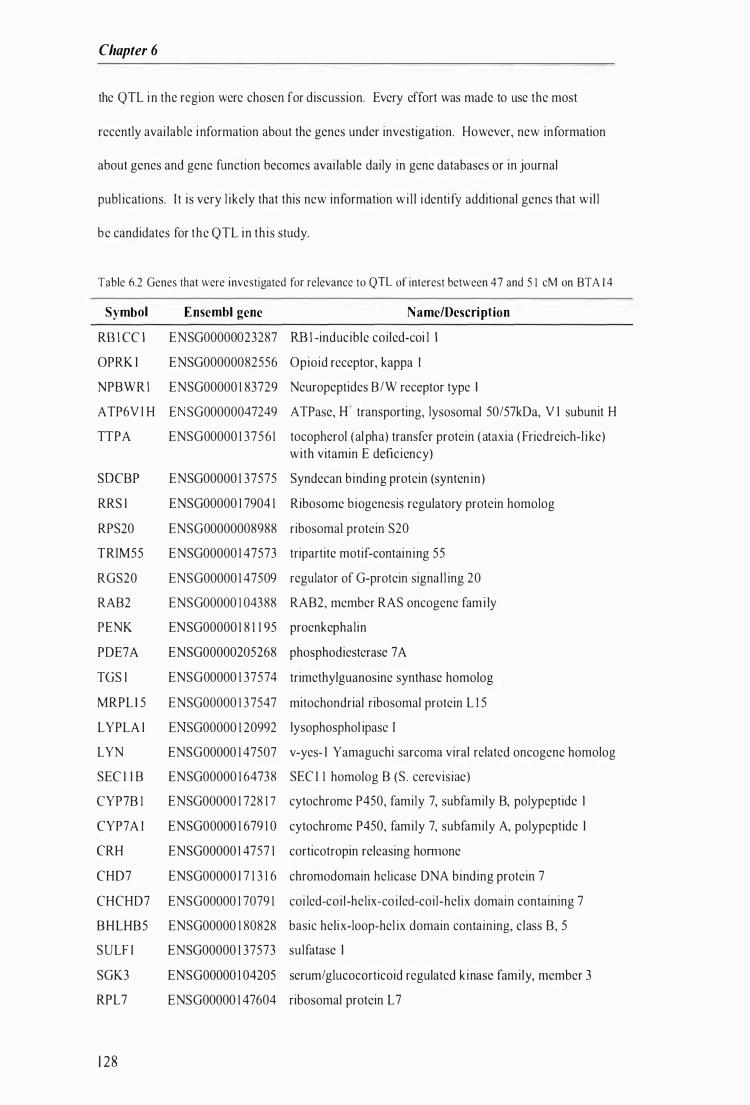
Chapter 6
the QTL in the region were chosen for discussion. Every effort was made to use the most
recently avai lable i nformation about the genes under investigation. However, new information
about genes and gene function becomes avai lable daily in gene databases or in journal
publ ications. I t is very l ikely that this new information wi l l identi fy additional genes that wi l l
be candidates for the QTL in this study.
Table 6.2 Genes that were investigated for relevance to QTL of interest between 47 and 5 1 cM on BT A 1 4
Symbol E nsembl gene N ame/Description
RE I CC I ENSGOOOOO023287 RE I -inducible coiled-coi l I
OPRK I ENSGOOOOO082556 Opioid receptor, kappa I
NPBWR I ENSGOOOOO 1 83729 Neuropeptides B/W receptor type I
ATP6V l H E SGOOOOO047249 ATPase, I t transporting, lysosomal 50/57kDa, V I subunit H
TTPA ENSGOOOOO 1 3756 1 tocopherol (al pha) transfer protein ( ataxia ( Friedreich-l ike) with vitamin E deficiency)
SOCBP ENSGOOOOO 1 37575 Syndecan binding protein (syntenin)
RRS I ENSGOOOOO 1 7904 1 Ribosome biogenesis regulatory protein homolog
RPS20 ENSGOOOOOO08988 ribosomal protein S20
TRlM55 ENSGOOOOO 1 47573 tripartite motif-containing 55
RGS20 EN SGOOOOO 1 47509 regulator of G-protein signal l ing 20
RAB2 ENSGOOOOO I 04388 RAB2, member RAS oncogene fami ly
PENK ENSGOOOOO 1 8 1 1 95 proenkephalin
PDE7A ENSGOOOO0205268 phosphodiesterase 7 A
TGS I ENSGOOOOO 1 37574 trimethylguanosine synthase homolog
MRPL J 5 EN SGOOOOO 1 3 7547 mitochondrial ribosomal protein L J 5
LYPLA I E SGOOOOO 1 20992 Iysophosphol ipase I
LYN ENSGOOOOO 1 47507 v-yes- I Yamaguchi sarcoma viral related oncogene homolog
SEC I I B ENSGOOOOO 1 64738 SEC I 1 homo log B (S . cerevisiae)
CYP7B I ENSGOOOOO 1 728 1 7 cytochrome P450, family 7, subfamily B, polypeptide I
CYP7A I ENSGOOOOO 1 679 1 0 cytochrome P450, family 7, subfamily A, polypeptide I
CRH ENSGOOOOO 1 4757 1 corticotropin releasing hormone
CH07 ENSGOOOOO I 7 1 3 1 6 chromodomain helicase DNA binding protein 7
CHCHD7 ENSGOOOOO 1 7079 1 coi led-coil-helix-co i led-coil-helix domain containing 7
BHLHB5 ENSGOOOOO 1 80828 basic helix-loop-hel ix domain containing, class B, 5
SULF I ENSGOOOOO 1 3 7573 sulfatase I
SGK3 ENSGOOOOO 1 04205 serum/glucocorticoid regulated kinase family, member 3
RPL7 ENSGOOOOO 1 47604 ribosomal protein L 7
1 28

Tablc 6.2 Continued.
Symbol Ensembl gene
YCPIP I ENSGOOOOO 1 75073
UBE2W ENSGOOOOO I 04343
NCOA2 ENSGOOOOO 1 40396
MYB L I ENSGOOOOO 1 85697
MSC ENSGOOOOO 1 78860
KCNB2 ENSGOOOOO 1 82674
CPA6 ENSGOOOOO 1 65078
COPS5 ENSGOOOOO 1 2 1 022
ARFGEF I ENSGOOOOO066777
ADHFE I ENSGOOOOO l 47576
Candidate genes on chromosome 14
Na melDescri ption
valosin containing protein (P97)/p47 complex interacting protein I
ubiquitin-conjugat ing enzyme E2W (putative)
nuclear receptor coactivator 2
v-myb myeloblastosis v iral oncogene homo log ( avian)- l ike I
musculin ( activated B-cell factor- I )
potassium voltage-gated channel, Shab-related subfamily, member 2
carboxypeptidase A6
COP9 constitutive photomorphogenic homolog subunit 5 (Arabidopsis)
ADP-ribosylation factor guanine nucleotide-exchange factor I (brefeldin A-inhibited)
alcohol dehydrogenase, iron containing, 1
The fol lowing sections contain a discussion of the QTL found in the region of interest, fol lowed
by a discussion of the most l ikely candidate genes.
6.2 Phenotypes in the region
The co-ordinated changes in nutrient partitioning that occur during early lactation in dairy cows
were discussed in Chapter 2 and were summarised in a diagram that has been replicated in the
current chapter (Figure 6. 1 ) . The QTL that are in the region of interest on BT A 14 have
relevance to particular aspects of control of nutrient partitioning that occur during early lactation
(Figure 6 . 1 ) . Circulating IGF-I concentrations are decreased during early lactation. Changes in
circulating IGF-I concentrations play an important role in increasing the avai l abi l ity of nutrients
for milk synthesis and secretion. Therefore, the basel ine IGF-I QTL may be related to the 60
day mi lk yield QTL that are also found in the region of interest on BT A 1 4. The QTL found in
this region may be genetically correlated, which would require that there is either p leiotropy or
genetic l inkage (Chapter 5 ) . However, i t is also possible that the QTL of interest are not
genetically correlated and occur in the same region of BTA 1 4 by chance.
1 29
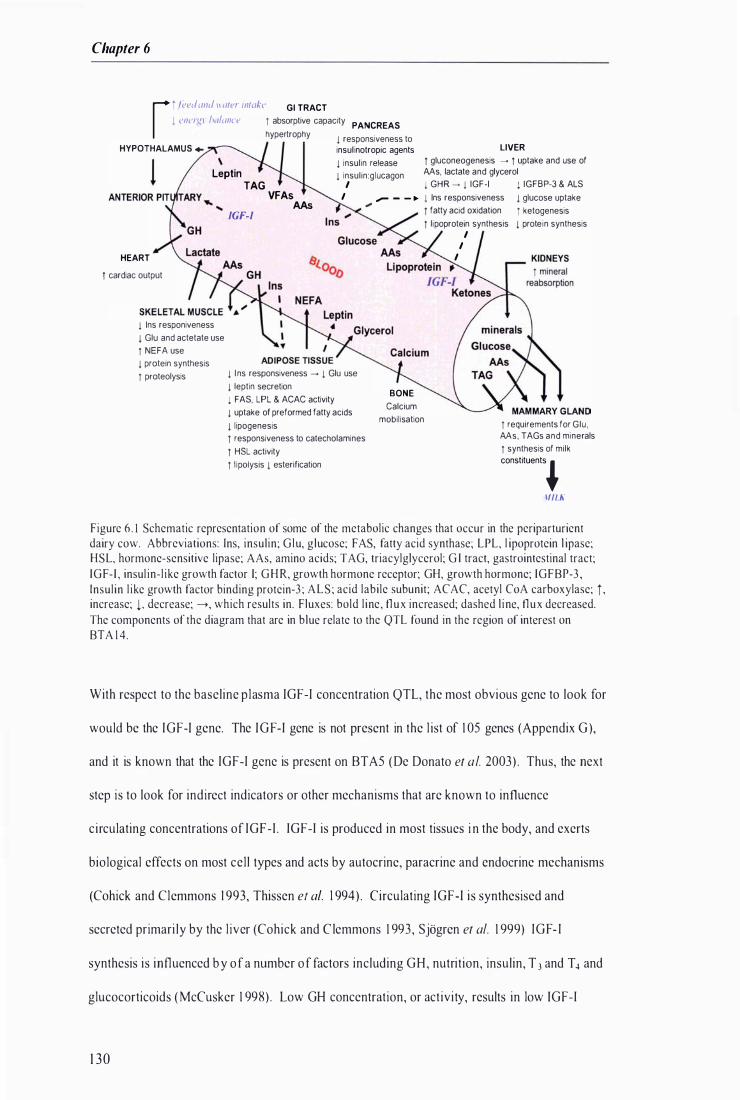
Chapter 6
r feed alltl " aler illlok" GI TRACT
1 ell(,/:�\ />"/W/Ct' r absorptive capacity PANCREAS
hypertrophy j responsiveness to
HYPOTHALAMUS • insul inotropic agents LIVER
\ Leptin
TAG
lGF-l
HEART
VFAs AAs
j insulin release
j insulin:glucagon I
r gluconeogenesis - r uptake and use of Ms, lactate and glycerol
j GHR - j IGF-I l IGFBP-3 & ALS
I _ - - � j Ins responsiveness j glucose uptake
r ketogenesis " r fatty acid oxidation
r lipoprotein synthesis j protein synthesis I
I I
r cardiac output
1 Ins responiveness
I Glu and actetate use
r NEFA use
j protein synthesis
r proteolysis j I ns responsiveness - j Glu use
j leptin secretion
j FAS, LPL & ACAC activity
1 uptake of preformed fatty acids
j lipogenesis
r responsiveness to catecholamines
r HSL activity
r l ipolysis j esterification
BONE
Calcium
mobilisation i requirements for Glu, Ms, TAGs and minerals
r synthesis of milk
constituents, IIILIi
Figure 6 . 1 Schematic representation of some of the metabolic changes that occur in the periparturient dairy cow. Abbreviations: Ins, insulin; Glu, glucose; FAS, fatty acid synthase; LPL, l ipoprotein l ipase; HSL, hormone-sensitive lipase; AAs, amino acids; TAG, triacylglycerol; G I tract, gastrointestinal tract; IGF- I , insul in-l ike growth factor I; G H R, growth hormone receptor; GH, growth hormone; IGFBP-3 , Insulin l ike growth factor binding protein-3 ; ALS ; acid labile subunit; ACAC, acetyl CoA carboxylase; i , increase; L decrease; -->, which results in. Fluxes: bold l ine, flux increased; dashed l ine, flux decreased. The components of the diagram that are in blue relate to the QTL found in the region of interest on BTA I 4.
With respect to the baseline plasma IGF-I concentration QTL, the most obvious gene to look for
would be the IGF-I gene. The IGF-I gene is not present in the l ist of 1 05 genes (Appendix G ),
and it is known that the IGF-I gene is present on BTA5 (De Donato et af. 2003) . Thus, the next
step is to look for indirect indicators or other mechanisms that are known to influence
circulating concentrations of IGF-I . IGF-I is produced in most tissues i n the body, and exerts
biological effects on most cel l types and acts by autocrine, paracrine and endocrine mechanisms
(Cohick and Clemmons 1 993, Thissen et al. 1 994) . Circulating IGF-I is synthesised and
secreted primari ly by the l iver (Cohick and C lemmons 1 993, Sjbgren et af. 1 999) IGF- I
synthesis is influenced by ofa number of factors including GH, nutrition, insulin, T 3 and T4 and
glucocorticoids ( McCusker 1 998) . Low GH concentration, or activity, results in low fGF-I
1 30

Candidate genes on chromosome 14
concentrations, low insu l in concentrations are a lso associated with low IGF-I secretion
(McCusker 1 998, Thissen et af. 1 994).
Many studies have demonstrated that energy balance in high producing dai ry cows becomes
negative at parturition wi th the onset of mi lk synthesis and secretion (Bel l 1 995, B lock et af.
200 1 , de Vries and Veerkamp 2000, Van den Top et af. 2005) . In high producing dairy cows
the rate at which consumption of nutrients, required for maintenance and lactation, increases
lags behind the rate at which nutrient requirements increase, resulting in reliance on body
reserves to meet the deficit in requirements ( Lucy et a!. 200 I , Spicer et a!. 1 990). An
experiment in dai ry cows from weeks I to 26 of lactation showed mi lk yield was positively
correlated with feed intake, l ive weight immediately post-calving, and l iveweight loss over the
lactation period (Neilson et al. 1 983) . Thus, i t would seem the abi l ity of an animal to increase
intake as well as mobi l ise body reserves both contribute to the greater milk yield.
The period of negative energy and protein balance in early lactation is accompanied by a drastic
decrease in circulating concentrations of IGF-I and insul in and increased p lasma G H and NEF A
concentrations ( Ronge et al. 1 988 , Vicini et al. 1 99 1 ) . There is a gradual increase in IGF-I
concentrations as lactation progresses (Abribat et a!. 1 990, Rhoads et af. 2004, Vega et al.
1 99 1 ) . Post-partum IGF-I concentrations have negative phenotypic correlations with rrillk
production, protein yields (Lacasse et al. 1 994) and fat-corrected mi lk yield ( Ronge et a!. 1 988) .
I n weeks 2- 1 0 post-partum, IGF-I concentrat ions were lower in dairy cows that had a high
genetic merit for mi lk fat, protein and yield and higher cumulative milk production over the first
1 20 days of lactation (P<0.05 ) compared with cows that had an intermediate genetic merit for
these mi lk production traits (Snijders et a!. 200 I ). Phenotypic correlations between mean IGF-I
concentrations and mi lk production, calculated for the FJXB animals in the current study, were
moderate to low, but more importantly a l l were negative (Harris et a!. 2005). C irculat ing IGF-I
concentrations appear to be influenced by nutritional stahls of the animal ; a positive rel at ionship
between plasma IGF-I concentration and energy balance has been reported in lactating dairy
cows (Cisse et af. 1 99 1 , Ronge et af. 1 988, Spicer et a!. 1 990). During early lactation, high
1 3 1
Chapter 6
milk yield is associated with low serum IGF-I concentrations and decreased energy balance,
therefore greater nutritional stress (Spicer et al. 1 990). Low insul in and IGF-I concentrations at
the onset of lactation may be related to a decrease in the drive to partition nutrients to tissues
other than the mammary gland ( Spicer et al. 1 990) .
Lactose concentrations in mi lk are tightly contro l led in dairy cows, mi lk protein shows some
s l ight variation whereas fat concentration is much more variable (Akers 2002, lenkins and
McGuire 2006) . The metabolic adaptations that al low this greater variabi l i ty in fat
concentration are unclear but may be related to the abi lity to mobilise significant amounts of
triacylglycerol from body reserves. It is important to note that there werc no QTL for milk fat
yield in the region of interest on BT A 14 . This may suggest that because the QTL for 60 day
milk, lactose and protein yield are located together in this region that their regulation is
coordinated in some way, possibly through protein metabol ism. It may be that genes in this
region are involved in regulat ion of protein metabolism and are modi fied by the action of IGF-I
( Liu et af. 2006) . Or IGF-I may be an indicator offeed intake, energy balance and efficiency of
feed util isation as shown in a number of animal feeding experiments ( Breier et af. 1 986,
Elsasser et al. 1 989, Hegarty et al. 2006, Hua et at. 1 993, Johnston et al. 2002, Lapierre et al.
1 992, Lean et al. 2004, Rausch et al. 2002, Ronge and B lum 1 989). It is possible that animals
with the favourable al lele for growth QTL, which are also found in this region (Kneeland et af.
2004, Mizoshita et al. 2004), have greater protein reserves that can then be mobil ised during
early lactation and used for milk protein synthesis or gluconeogenesis . These suggested
mechanisms could have important roles in determining lactation yield particularly in early
lactation.
The objectives of this chapter are to investigate the function of the genes in Table 6.2 and to
determine putative candidate genes. Genes that are most l ikely to be involved in genetic control
mechanisms influencing baseline IGF-I, milk, l actose, crude protein, total protein, casein and
whey protein yields in the first 60 days of lactation wil l be selected as putative candidate genes.
1 32
---- -- ---
Candidate genes on chromosome 14
6.3 Candidate genes
The function of the genes discussed in this section may be related to the QTL for the mean
concentration of plasma IGF-I or the 60 day milk, l actose and protein QTL. It is possible that
the IGF-I QTL is an indicator of energy balance or feed intake. Therefore candidate genes that
may be involved in control of feed intake or energy balance are discussed. Genes that may be
involved in protein or glucose metabolism will also be considered in relation to the
aforementioned early lactation milk QTL.
6.4 Protein metabolism candidate genes
During early lactation the demand for nutrients i ncreases rapidly due to the large increase in
milk synthesis and secretion (de Vries and Veerkamp 2000, Van den Top et af. 2005 ). Nutrient
intake does not keep pace with demand resulting in high-producing dairy cows often being in
negative energy balance in early lactation (Spicer et af. 1 990). Mobi l isation of protein reserves
is relatively smal l in comparison to fat mobil isation. Even so, it has been suggested that protein
mobi l isation is an important process that provides essential amino acids for protein synthesis in
the mammary gland or for use as glucose precursors for gluconeogenesis in the l iver (Bell et af.
2000, Bequette et af. 1 998, Chi l l iard 1 999, Schei et af. 2007 ). Large differences between cows
in the amount of body protein mobil isation that they achieve in early lactation have been
reported (Tamminga et al. 1 997) . Another study found that the proportion of carbon in milk
casein and lactose derived from body protein was greater in high genetic merit than low genetic
merit cows ( Wi lson et al. 1 988). Thus, genes that may be involved in the mobi l isation of body
protein reserves were considered as possible candidate genes for the QTL in the region of
interest. Nevertheless, the QTL in the region of interest may not be related to supply of
precursors to thc mammary gland but instead may be related to the abil ity of the animal to
synthesise proteins. Therefore genes that may be involved in the synthesis of proteins were also
considered.
1 33

Chapter 6
The genes that wi l l be discussed in this section are:
• Ribosome biogenesis regulator homolog (S . cerevisiae) ( RRS I ),
• Ribosomal protein L7 ( RPL7),
• Ribosomal protein S20 ( RPS20),
• Mitochondrial ribosomal protein L I S (MRPL l S),
• Ubiquitin-conjugating enzyme E2W (putative) (U BE2W) and
• COP9 constitutive photomorphogenic homolog subunit 5 ( Arab idopsis) (COPS5) .
• Tripartite motif-containing 5S (TRlMSS)
• Muscul in (activated B-cel l factor- I ) (MSC)
They have been selected because they appear to be related to some aspect of protein
metabol ism. The currently known function of each of the gene products and the relevance they
have to the QTL wi l l be discussed in the fol lowing sections.
Ribosomal protein L 7 (RPL 7) and ribosomal protein S20 (RPS20)
Ribosomes are complex macromolecules and are the protein-synthesising organelles responsible
for translation and therefore construction of every protein in all l iving cells. In the case of
eukaryotic cells, ribosomes consist of a small (40S) and a large (60S) ribosomal subunit (L i lj as
2004). These two subunits are built from about 80 ribosomal proteins and 4 ribosomal RNAs
( rRNA) (Brodersen and Nissen 200S, Zemp and Kutay 2007 ). The rRNAs are not translated but
are l arge molecules that form the core of the ribosomal subunits ( Li ljas 2004) . The two subunits
exist separately in the cytosol and when a strand of RNA binds to the smal l subunit this enables
the small and large subunit to bind and form the ribosome. Ribosome assembly in eukaryotic
cel l s is another level of control of gene expression (Ko et al. 2006) . More than I SO non
ribosomal proteins are i nvo lved in the complex process of ribosome biogenesis, which includes
1 34
Candidate genes on chromosome 14
the formation of the constituents of the ribosome subunits, their assembly, and their transport to
the sites of protein synthesis. (Zemp and Kutay 2007).
There is a large rRNA molecule contained in each of the ribosomal subunits, which provides the
binding sites for ribosomal proteins. The ribosomal proteins stabil ise the rRNA and confer its
functional three-dimensional structure (L i ljas 2004). Crystal structure analyses of ribosomes
have demonstrated that a number of ribosomal proteins were located in positions of functional
importance, for example, L 1 l is involved in translation factor binding (Wilson and Nierhaus
2005). Difficulty in attributing a specific function, in terms of ribosomal translational activity,
to individual ribosomal proteins is primarily due to the highly cooperative nature of the
interactions between rRNA and ribosomal proteins and between ribosomal proteins (Wi lson and
Nierhaus 2005 ) . The two genes encoding ribosomal proteins found in the region of interest in
th is investigation are ribosomal protein L7 ( RPL7) and ribosomal protein S20 (RPS20)
The RPL7 gene encodes a ribosomal protein that is a structural constituent of the 60S subunit.
Thus, it is involved in RNA binding, protein binding and also has transcription regulation
activity. Current evidence suggests that the RPL 7 protein is essential for making a functional
ribosome (Ko et af. 2006). The protein can inhibit cell-free translation of mRNAs, suggesting
that it plays a regulatory role in the translation apparatus. These authors also suggested that
RPL7 may be involved in ribosome assembly and that maturation of the large ribosomal subunit
might involve the membrane binding property of RPL 7 (Ko et al. 2006).
RPS20 is a constituent of the 40S subunit and as a result is involved in translation regulation,
RNA binding and protein biosynthesis. An experiment in which individual smal l subunit
ribosomal proteins were deleted from the bacterial Escherichia coli (£. coli) chromosome
showed that RPS20 was one of 6 ribosomal small subunit proteins that were not essential for
cel l growth (Bubunenko et af. 2007) . Conversely, in a study of medulloblastomas (a common
mal ignant brain tumour of childhood) in 64 humans, expression levels of RPS20 were found to
be negatively associated with survival of patients (De Bortoli et al. 2006).
1 3 5
Chapter 6
There is a dramatic increase in anabolic processes in the mammary gland that occur around the
time of onset of copious mi lk synthesis and secretion. Because the majority of bovine
mammary gland secretory t issue prol iferates during gestation when mammary growth i s
exponential (Capuco and El l is 2005, Knight et al. 1 994), t o achieve increased milk production
after parturi tion mi lk secretory activity per mammary epithelial cel l must increase (Capuco and
El l is 2005) .
The majority of milk proteins are specific proteins unique to lactation ( Larson 1 985). m RNA
for milk-spec i fic proteins are transcribed from chromosomal DNA and are then translated on
ribosomes that are attached to the rough endoplasmic reticulum in mammary secretory cel ls
(Holmes et af. 2002, Mercier and Gaye 1 982). There was a four-fold increase in the fractional
rate of mammary protein synthesis in lactating compared with non-lactating dairy goats and it
has been suggested that this i s indicative of changes in transcriptional regulation (Baracos et af.
1 99 1 , Toerien and Cant 2007) . Parenchymal RNA content and mass were greater in late
lactation compared with non-lactating dairy cows representing a greater quantity of translational
machinery. [n addit ion the mRNA translation rate was estimated to be 4-fold higher in the
lactating mammary ti ssue (Toerien and Cant 2007). I t has been suggested that post
transcriptional mechanisms p lay a key role in governing milk protein expression. This i s
supported by findings that transgenic dairy heifers, with additional copies of the genes encoding
bovine p- and K-casein, only exhibited an 8-20% increase in p-casein, however, there was a
twofold increase in K-casein concentration (Brophy et al. 2003, Moshel et al. 2006) .
In a study investigating hepatic gene expression during the dry and early lactation periods of
high producing dairy cows, 62 genes were identi fied as being differentially expressed in relation
to physiological state, none of these were ribosomal proteins ( Loor et af. 2005 ). However, they
found that the expression pattern of the gene that encodes eukaryotic translation initiation factor
4B (elF4B) was up-regulated from day I until day 28 of lactation (Loor et af. 2005 ). e IF4B
regulates the activ ity of e[F2 which mediates the first rate- l imiting step of mRNA transl ation
initiation. This step involves binding of initiator methinyl-tRNA to the small ribosomal ubunit
1 36
Candidate genes on chromosome 14
(Vary and Lynch 2007) . e IF4S stimulates the activity of eIF4A, a subunit of the e IF4F complex
that directs the translation machinery to the 5' -end of the mRNA (Raught et af. 200 I ,
Shahbazian et af. 2006). These are steps that lead to recruitment of the large ribosomal subunit
to form a functional ribosome (Vary and Lynch 2007). Another experiment compared gene
expression profiles of lactating bovine mammary tissue with non-lactating tissue on a bovine
mammary gland microarray. There were no genes encoding ribosomal proteins that were
identified as being up-regulated in the lactating mammary gland (Suchyta et af. 2003) .
However, eIF4G (a subunit of the eIF4F complex) expression was found to be decreased
compared with non-lactating mammary tissue ( Suchyta et af. 2003) . This seems unusual
considering the higher rate of mRNA translation that has been observed even in late-lactating
compared with non-lactating mammary glands (Toerien and Cant 2007). In a more recent
experiment, expression of the e IF4E gene ( the third subunit of the e lF4F complex ) was found to
increase dramatically by day 1 5 of lactation and remained elevated unti l day 240 of lactation
(Bionaz and Loor 2007b). Thus, it would seem that increased expression of the eukaryotic
translation initiation factors plays a key role in increasing the activity of ribosome in response to
lactation. Further evidence supporting the hypothesis that the expression of genes encoding
ribosomal proteins is not an important l imiting factor in lactation is provided by an experiment
that investigated nine genes for use as internal control genes. Ideal internal control genes have a
relatively constant expression in the mammary gland throughout the lactation cycle. After
correction for the dilution effect caused by increased RNA concentration in the mammary gland,
RPS9 and RPS 1 5 were found to have stable gene expression across the lactation cycle ( Sionaz
and Loor 2007a). It is possible that if the expression of these two genes encoding ribosomal
proteins is not increased, genes encoding other ribosomal proteins, such as RPS20 and RPL7,
would not be increased either.
I t seems l ikely that protein synthesis in the lactating mammary gland is increased by
acceleration of mRNA translation initiation rather than transcription of the individual ribosomal
1 37
Chapter 6
protein genes. Thus, the genes that encode RPS20 and RPL 7 are unlikely to be the genes
responsible for the QTLs present in the region of interest on BT A 1 4.
Ribosome biogenesis regulator homolog (S. cerevisiae) (RRSI)
Ribosome biogenesis regulator homolog (s. cerevisiae), as the name suggests, i s a gene that is
homologous to the yeast (Saccharomyces cerevisiae) RRS I regulator of ribosome synthesis 1
( Rebhan et at. 1 997). A study in yeast showed that the protein product of RRS I is localised in
the nucleoplasm and the nucleolus (Tsuno et af. 2000). In cells that the R RS 1 protein was
depleted, precursor rRNA processing was reduced and the appearance of the 60S ribosomal
subunit was reduced compared with the 40S subunit, suggesting this protein has a role in
maturation of certain precursor rRNAs and 60S subunit assembly ( Tsuno et al. 2000). The
RRS I protein also recruits ribosomal protein L l l and a molecule that is a complex of the
ribosomal protein L5 and a precursor rRNA to the 60S precursor subunits, which is a necessary
step in the processing of the large subunit precursor (Nariai et al. 2005) . Another experiment
demonstrated that the RRS I protein stays on the precursor 60S particle from early to very late
stage maturation and is required for export of the 60S ribosomal subunit from the nucleus to the
cytoplasm ( Miyoshi et af. 2004).
The functional protein derived from the human RRS I homologue has been purified from the
nucleol i and metaphase chromosomes from human cell l ines (Scherl et af. 2002, Uchiyama et
al. 2005 ). It has been suggested from results of RNA interference studies that RRS I may have a
functional role in chromatid cohesion. Chromatid cohesion is a chromosomal protein complex
that uses a large proteinaceous ring to tie sister chromatids together to al low pairs to be
recognised and aligned during mitosis and distributed correct ly during anaphase ( Fukui et af.
2006, Uhlmann 2004). RRS 1 has also been impl icated in a number of disease states including
Huntington' s disease and is induced by influenza virus repl ication ( Nariai et af. 2005 ).
The functional protein of the RRS I gene has been impli cated in mitosis and viral replication
( Fukui et al. 2006, Nariai et al. 2005, Uhlmann 2004), therefore, it is possible that RRS l may be
1 3 8
Candidate genes on chromosome J 4
up-regulated during cel l proliferation in the mammary gland. The majority of bovine
mammary gland secretory t issue pro l iferates during gestation when mammary growth is
exponential (Capuco and Ell is 2005, Knight et al. 1 994). Processes of pro l iferation and cell
turnover have been shown to accelerate from approximately 77 days pre-partum and are h ighest
around the time of parturition (Capuco et at. 1 997, Sorensen et at. 2006). Mi lk yield is a
function of the number and secretory activity of mammary epithelial cells (Capuco and El l i s
2005 ) . I t has been suggested that selection for increased milk production promotes both
increased cellular differentiation and incrcascd ccl l prol iferation (Akers et af. 2006). Thus it is
possible that RRS I may be more strongly upregulated result ing in greater cel l proliferation in
cows with h igher mi Lk production.
Alternatively, the RRS I functional protein is important in the processing of the 60S ribosomal
subunit in yeast (Tsuno et at. 2000). Comparison of the protein product of RRS I sequence with
database sequences showed that the protein is conserved throughout eukaryotes (Tsuno et at.
2000) . However, sequence simi larity does not necessari ly mean that there wi l l be functional
similarity (Gerlt and Babbitt 2000, Wi lson et at. 2000). To confirm the function of a gene
precisely, requires investigation of both its sequence and expression characteristics (Zhou and
Gibson 2004). By way of i l lustration, experiments have been conducted that identi fied a set of
co-expressed genes, known to be associated with a particular function, in one organism. A set
of sequence homologs were then identi fied in another organism and their expression measured,
only a subset of the genes were co-expressed in the second organism. The genes that were not
co-expressed were not considered to be functionally conserved homologs ( Bergmann et af.
2004, Zhou and Gibson 2004). Thus, functional assignment based on homology alone should
be considered with caution (Gerlt and Babbitt 2000). Nevertheless, it is possible that the RRS I
gene may be important for processing of the 60S ribosomal in bovine cells. After parturition,
the initial rise to peak mi lk production is primari ly due to increased milk secretory activity per
mammary epithel ial cell (Capuco and E l l is 2005) . There is a dramatic i ncrease in anabolic
processes in the mammary gland that occur around the t ime of onset of copious mi lk synthesis
1 3 9
Chapter 6
and secretion. For example, in vitro studies of mammary tissue showed a 280% increase in a
lactalbumin release ( 1 03 ng/mg to 289 ng/mg) from day 260 of gestation to day 49 of lactation
(Keys et af. 1 989) . Up-regulation of RRS I may result in a greater maturation rate of the 60S
ribosomal subunit . Thus, more 60S ribosomal subunits would be avai lable to bind to the 40S
ribosomal subunit to form functioning ribosomes and subsequently translate and synthesise the
proteins necessary for milk production. Perhaps cows with a greater propensity for transcription
and translation of the RRS I gene in early lactation have a greater proportion of 60S subunits in
a mature state, which may result in more matures ribosomes and production of greater quantity
of proteins required for mi lk production.
Mitochondrial ribosomal protein L 1 5 (MRPL I 5)
Mammalian mitochondrial ribosomal proteins are encoded by nuclear genes and help in protein
synthesis within the mitochondria. Mammal i an mitochondria synthesise 1 3 proteins ( in
humans) from mitochondrial 0 A within the inner mitochondrial membrane (Smits et al.
2007) . These proteins are components of complexes that are essential for oxidative
phosphorylation and synthesise approximately 90% of the A TP in eukaryotic organisms.
Mitochondrial ribosomes (mitoribosomes) are made up of ribosomal proteins and ribosomal
RNA ( rRNA) that contribute to the structure and function of the two ribosomal subunits
(Wilson and N ierhaus 2005 ), a small 28S subunit and a large 39S subunit ( Koc et 01. 200 1 ).
MRPL l 5 encodes a 39S sub unit protein and is l ikely to be involved in protein synthesis and
translational regulat ion. MRPL l 5 may be a methyitransferase and may bind S-adenosyl-L
methionine and RNA (Wi lson and Nierhaus 2005) . Among different species, the proteins
comprising the mitoribosome differ greatly in sequence, and sometimes in biochemical
properties, which prevents easy recognition by sequence homology.
The number of mitochondria increase in mammary epithelial cells with the onset of lactation.
They are the site of production of ATP by the process of oxidative phosphorylation, and
generation of precursors for synthesis of non-essential amino acids and fatty acids ( Akers 2002 ).
1 40
Candidate genes on chromosome 14
Currently there are no reports in the literature about the function of the protein encoded by
MRP L l 5 or changes in its expression in relation to different physiological states. In an
experiment that corrected for the dilution effect caused by increased RNA concentration due to
lactation, there was a significant effect of time on MRPL39 expression. Indicating that the
MRPL39 gene had differential transcriptional regulation during the lactation cycle (B ionaz and
Loor 2007a). If there is co-ordinated control of transcription of mitochondrial ribosomal
proteins, it is possible that a similar pattern of differential transcriptional regulation may occur
for the MRPL l 5 gene during lactation. The crucial role that mitochondria play in energy
metabol ism within the cell means that they are potential candidates for influencing milk
production. However, i f the MRPL 15 gene was affect ing the energy generated by mitochondria
and therefore milk production, it would l ikely affect mi lk fat as well as mi lk protein and lactose.
Since there are no mi lk fat QTL currently known in the region of interest in this investigation an
effect of this gene on milk, lactose and protein yields does not seem l ikely. However, as new
information becomes available about the function and expression ofMRPL l 5, it may become
clearer if further research on this gene in relation to milk production is required.
Uhiquitin-conjugating enzyme E2W (putative) (U BE2W)
The UBE2W gene product is an ubiquitin-conjugating enzyme or ubiquitin-carrier protein (E2 )
that i s involved in the second step of ubiquitin conjugation in the ub iquitin-proteasome pathway
(UPP)(Attaix et of. 1 998). The UPP is the major system responsible for proteolysis in cells and
is required for targeted degradation of most short-lived proteins in the eukaryotic cell (Genini
and Catapano 2006).
The sole ubiquitin-activating enzyme (E 1 ) hydrolyses A TP and activates ubiquitin, an abundant
and highly conserved 76 amino acid polypeptide (Attaix et at. 1 998, Ciechanover et al. 2000) .
Ubiquitin-conjugating enzymes ( E2s) transfer the activated ubiquitin from E l to a member of
the ubiquitin-protein ligase family (E3) . E2s function with E3s to mediate covalent binding of
ubiquitin to target proteins (Attaix et al. 1 998, Baek 2003, Genini and Catapano 2006, Wing
2003 ) . E3s play a role in the selection of proteins for conjugation and catalyse the formation of
1 4 1
Chapter 6
polyubiquitin chains on target proteins (Attaix et al. 1 998) . Polyubiquitin chains are recognised
by 26S proteasomes as a degradation signal and as such result in degradation of the
polyubiquitylated proteins by the 26S proteasome (Attaix et at. 1 998, Ciechanover et at. 2000).
Ubiquitylated proteins can be rescued prior to proteasome degradation by the rapid removal of
ubiquitin chains catalysed by deubiquitinating enzymes (Wing 2003) . Thus, these cycles of
ubiquitylation-deubiquitination reactions can rapidly modulate protein level and act ivity (Genini
and Catapano 2006) .
The E2s are a superfamily of related proteins with a molecular weight range of 1 4 to 35 kDa
(Attaix e t at. 1 998) . The UniProtKB/Swiss-Prot entry indicates that the unprocessed precursor
of UBE2W is 1 5 1 amino acids in length and has a molecular weight of 1 7 kDa. An assessment
of the amino acid sequence shows simi larity to the ubiquitin-conjugating enzyme ( E2) family
(http://au.expasy. org/uniprotlQ96B02#ref, 16 March 2007). To date, various E2 species have
been found in muscle, these include the 1 4-, 1 7- and 20-kOa species of E2 (Attaix et al. 1 998) .
It has been shown in a number of experiments that mobi l isation of endogenous protein occurs
during early lactation (Chil l i ard and Robelin 1 983, Kokkonen et at. 2005, Overton et at. 1 998,
Phi l l ips et al. 2003, Wilson et at. 1 988) . Mobil isation of muscle protein in early lactating
ruminants possibly results from a decrease in synthesis, but is mostly a result of increased
degradation (Baracos et at. 1 99 1 , Chi l l iard et at. 1 998a, Overton et at. 1 998, Phil l ips et at. 2003,
Smith et al. 1 98 1 , Wilson et al. 1 988) . During a 6-hour hyperinsuliaemic-euglycaemic c lamp,
the 40-fold increase in c irculating insulin concentrations caused a decrease in ubiquitin mRNA
in fast-twitch or mixed (fast- and slow-twitch) skeletal muscle but did not affect the abundance
of 1 4-kDa E2 mRNA in the same muscles compared with saline infused control goats ( Larbaud
et at. 1 996). Thus, the low circulating insulin concentrations that occur at the onset of lactation
in dairy cows ( Accorsi et al. 2005, Holtenius et at. 2003, Komatsu et al. 2005 ) may influence
the UPP. Alterations in the UPP may contribute to mobi l isation of body protein from skeletal
muscle for the purpose of supporting lactation.
1 42

Candidate genes on chromosome 14
The contribution of body proteins to the energy requirements of lactation is small but
quantitatively important in the ruminant. Mobil ised proteins supply essential amino acids for
protein synthesis in the mammary gland or amino acids for gluconeogenesis in the l iver (Bel l et
af. 2000, Bequette et af. 1 998, Chil l iard 1 999, Schei et at. 2007). [t has been suggested that the
greater persistency of milk production in h igh genetic merit dairy cows is related to size of body
protein reserves and the abil i ty to mobil ise them during early lactation to support mi lk protein
and lactose synthesis ( Bequette et af. 1 998). Conversely, it has been suggested that relocation
of body protein reserves as a result of hypertrophy of gut and l iver ti ssues may be more
important than the contribution to milk protein (Sutter and Beever 2000). Experiments in dairy
cows have shown that an increase in dietary protein supply increased milk, protein and lactose
yields from week I of lactation onwards and some experiments induced greater mobil isation of
fatty acids from adipose tissue (de Boer et at. 1 99 1 , Kokkonen et at. 2002, Moussa vi et at.
2007, 0rskov et at. 1 98 1 ) . These findings indicate the l imited potential of cows to compensate
for a deficit of feed protein supply by mobi l ising tissue proteins (Kokkonen et at. 2002, 0rskov
et at. 1 98 1 ), thus supporting the suggestion that amino acids and glucose precursors are l imiting
to milk production.
I t i s not clear how important mobil isation of protein reserves is for providing precursors for
mi lk production, however, it is possible that the functional product of the UBE2W gene is
important in break down of protein reserves in early lactation. This idea is supported by the fact
that the QTL in the region are all mi lk traits up to day 60 of lactation, not for periods later in
lactation. Experimental work conducted to date, indicates that protein breakdown on ly occurs
very early in lactation ( Phi l l ips et at. 2003, Tamminga et at. 1 997), consequently UBE2W may
p lay a role in protein breakdown in early lactation.
Alternatively, there is considerable protein turnover within mammary secretory cells including
catabolism of signal proteins as wel l as a significant degradation of intracel lular proteins, such
as enzymes and structural proteins, and even milk proteins (Bequette et at. 1 998, Holmes et at.
2002). I t is thought that protein turnover in the mammary gland is important for providing a
1 43
Chapter 6
constant supply and the correct balance of amino acids necessary for both milk protein and
lactose synthesis (Bequette et al. 1 998). Perhaps the action of UBE2W is important in the
mammary gland, as well as in skeletal muscle, where it may play a role in the ubiquitylation of
proteins to target them for degradation. Differential regulation of this gene may result in
different rates of protein degradation or perhaps targeting of different proteins for degradation.
Perhaps certain genotypes result in more appropriate amino acid concentrations for synthesis of
lactose and mi lk proteins, which would fit with the mi lk , lactose and protein QTL found in the
region. If this were the case it would seem l ikely the differences between genotypes would
continue throughout lactation and since the QTL in this region are for the first 60 days of
lactation only, this hypothesis needs to be taken with caution. However, once food intake is
sufficient to supply the nutrient requirements of lactation, which usual ly occurs a few weeks
after peak lactation, then the protein degradation processes described in this section may not be
as important as they would be in early lactation. This would explain why the QTL in the region
of interest are only for the first 60 days of lactation.
COP9 constitutive photomorphogenic homoiog subunit 5 (Arabidopsis)
(COPS5)
The COPS5 gene product was first identified as a transcriptional coactivator of AP I proteins
cal led Iun �ctivating domain 11.inding protein I (Jab I ) (Claret et al. 1 996) . I t is also termed
CS 5, as it is the fifth component of the �OP9 �ignalosome fomplex (CSN ), which is made lip
of eight subunits (CSN 1 -8 ) in mammals. CSN5 is possibly the key subunit that integrates the
multiple functions of the CSN complex (Wei and Deng 2003) . CSN5 is a cytosolic and nuclear
protein and has both CSN-associated and CSN-independent activities in UPP protein turnover
and signal transduct ion, respectively ( Lue et af. 2006).
The broad functions of CSN have been mainly attributed to its role i n the UPP mediated protein
degradation ( Rose I and KimmeI 2006) . Ubiquitin l igases termed SKP I -Cul l inlCDC53-F-box
protein (SCF) complexes catalyse the polyubiquitinylation of proteins to target them for
degradation. Cul l in subunits are an integral part of SCF and require addition of the lIbiqllitin-
1 44
Candidate genes on chromosome 14
l ike protein Nedd8 for its function ( Rose I and Kimmel 2006) . The CSN complex is an essential
regulator of the ub iquitin conjugation pathway by mediating the removal ofNedd8 from the
cul l in subunits of the SCF-type E3 l igase complexes. CS 5 probably acts as the catalytic
centre that mediates the cleavage ofNedd8 from cull ins, result ing in cessation of the
polyubiquitinylation process. This al lows the subsequent degradation of the polyubiquitinylated
substrates by proteasomes (Call ige et af. 2005, Rosel and Kimmel 2006) .
Knockout or mutational studies in a variety of organisms indicate that CSN5 is involved in cell
cycle progression, checkpoint activation, genome stabi l i ty, and cell survival . CSN5, either as a
monomer or part of the CS complex, plays a critical role in nuclear export and directly
interacts with and regulates the activity, stabi l ity and degradation of multiple intracellular
regulatory molecules, such as c-jun (major component of the AP- I transcription factor, AP- I
regulates various aspects of cell prol iferation and differentiation), p27 ( invo lved in inducing G 1
cell cycle arrest), p53 ( transcription factor involved i n regulating the cel l cycle), Cull in, Smad4
(transcription factor that mediate TGF-� ignal l ing to regulate cell growth and differentiation),
M IF ( involved in signal transduction that regulates cel l functions such as gene expression,
proli feration and apoptosis), and H I F I a ( Lue et al. 2006, Oh et al. 2006, Wang et al. 2006).
Therefore, CSN5 and the CSN complex are important in the regulation of molecules involved in
multiple signal l ing pathways in various cel lular and developmental processes, such as early
embryonic development and cel l prol iferation (Tomoda et al. 2004).
From this infornlation it does not seem that the COPS5 gene is a l ikely candidate for the milk
QTL in the region of interest unless it is involved in the cel l prol iferation process that the
mammary gland undergoes during pregnancy and the epithelial cell turnover that continues into
lactation (Capuco et al. 200 1 , Sorensen et al. 2006). CSN5 interacts with diverse proteins that
play roles in many cell processes (Chamovitz and Segal 200 I ) . There is sti l l much to be learnt
about the roles of the COPS5 gene product, CSN5, in the cel l . It is possible that an as yet
unknown function may be important in controll ing early lactation mi lk, lactose and milk protein
yields. New functions are stil l being discovered, for example, two recently reported
1 45
Chapter 6
experiments have indicated that CSN5 interacts with the a l e subunit of the L-type Ca2+ channels
and inhibits channel activities in the rat heart (Kameda et af. 2006), and CSN is l ikely to play a
role in a phosphorylation event that is necessary for oestrogen receptor a that is complexed with
oestradiol and/or a coactivator to bind to target DNA and recruit a preinitiation complex
enabl ing translation of target genes (Cal l ige et af. 2005 ) . Oestrogen is one of the major stimuli
for mammary gland growth during pregnancy so it is possible that this recently discovered role
of CSN may be important in mammogenesis (Akers 2002, Holmes et al. 2002). Further study is
required to investigate a role, if any, for this gene in influencing the QTL in the region of
interest.
Tripartite motif-containing 55 (TRIM55)
Tripartite motif-containing 55 (TRIM55) i s also known as Muscle-specific RING finger protein
2 (MURF-2) or RING finger protein 29 (RNF29) (Zhang et af. 2006) . Four alternatively spliced
transcript variants encoding distinct isoforms have been described for the TRIM55 gene (Zhang
et af. 2006). TRlM55 may regulate gene expression and protein turnover in muscle cells. In
vitro studies have shown that the highest levels of TRIM55 expression in skeletal muscle cells
occurred early after the onset of differentiation and the TRIM55 protein associates transiently
with microtubules, myosin, and t i tin during muscle sarcomere assembly ( Pizon et af. 2002) .
TRIM55 is involved in the establ ishment and/or rearrangement of cytoskeletal arrays formed
during muscle development ( McElhinny et af. 2004). It has been suggested that TRIM55 may
have a signal l ing role in differentiation prior to cytoskeletal formation and may be involved in
transcription during differentiation of myocytes, thus influencing expression or activity of other
molecules involved i n formation and function of cytoskeletal arrays ( McElhinny et af. 2004,
Pizon et af. 2002) .
Experiments conducted using skeletal muscle samples collected from pigs a t various stages of
development showed that TRlM55 expression levels were up-regulated during embryo stages
and down-regulated during post-natal stages of development (Zhang et al. 2006) . Studies using
rat tissue demonstrated down regulation of TRIM55 in mature cardiac and skeletal tissues
1 46
Candidate genes on chromosome 14
(Centner et a/. 200 I , Pizon et a/. 2002) . A study in humans, who had developed skeletal muscle
wasting as a result of chronic heart fai lure, were found to have increased TRlM55 and decreased
IGF-I and myostatin gene expression compared with healthy controls ( Le Jemtel et a!. 2005) .
TRlM55 has been mapped to porcine chromosome 4 and BT A 14 and in both species sign ificant
QTL affecting growth, muscle and fat deposition and carcass weight have been identified in
those regions (Mizoshita et a/. 2004, Varona et a/. 2002 ). Current data on the role of TRlM55
suggests that this gene plays an important role in normal muscle development and is a candidate
gene for traits related to skeletal muscle development and further investigation is required
(Zhang et a!. 2006).
A possible role for this gene in lactation may be through influencing mobil isation of muscle
protein in early lactation. Dairy cows mobil ise body protein reserves in early lactation (section
2.8 and page 1 43 ) . The mobil isation of these reserves assists in meeting the energy and protein
deficits in early lactation by providing amino acids for mi lk protein synthesis and glucogenic
amino acids for gluconeogenesis l iver ( Bel l et a!. 2000, Schei et a!. 2007). TRlM55 appears to
have a specific role in muscle tissues, therefore, may enable mobil isation of labile protein
reserves.
During the peri-partum period and particularly after parturition when the onset of copious milk
synthesis and secretion occurs the circulating concentrations of IGF-l are dramatically reduced
(Rhoads et a/. 2004, Ronge et a/. 1 988, Vicini et a/. 1 99 1 ). There are some similarities between
the mechanisms operating in humans with skeletal muscle wasting and mobil isation of protein
reserves in early lactation dairy cows, in both situations IGF-I was decreased either in the
circulation or decreased gene expression ( Le Jemtel et a!. 2005 , Rhoads et a!. 2004) . Perhaps as
is the case in human skeletal muscle wasting, the expression of the TRl M55 gene is increased in
the muscle of dairy cows enabl ing protein mobi l isation during early lactation. Interestingly, in
an experiment investigating the effect of pre-partum nutrition on hepatic gene expression of
Holstein cows during the dry period and in early lactation, TRlM55 was found to be
differential ly expressed due to pre-partum nutritional treatments ( Loor et a/. 2006) .
1 47
Chapter 6
I n a study that exploited the natural differences in the I 3C concentration in C3 and C4 plants, the
proportion of carbon in casein (0.34 vs 0.25) and lactose (0.24 vs 0. 1 1 ) derived from body
reserves was greater in HGM compared with LGM dairy cows in early lactation (Wi lson et al.
1 988) . The estimated p lasma amino acid pool size was consistently higher in HGM than LGM
cows and the authors speculated that plasma amino acid pool size may be a factor that
influences milk production (Wi lson et af. 1 988) . TRIM55 is l i kely to play an important role in
normal muscle development (Zhang et af. 2006), and is a candidate gene for growth QTL in
both pigs and cattle (Mizoshita et al. 2004, Varona et al. 2002). The size of the body protein
reserves and the abi l i ty to mobil ise the reserves may be influenced by the level of expression of
the TRIM55 gene and may be important factors influencing 60 day milk, lactose and protein
yield QTL.
Musculin (activated B-cell factor- I ) (MSC)
Musculin (MSC, also cal led repressor of myogenesis (MyoR) or activated B-cell factor- I (ABF
I )) appears to be a transcription repressor (Zhao and Hoffman 2006). MSC is expressed and
may play a role in embryogenesis and foetal development (Yu et al. 2003) . MyoR is expressed
as early as the blastocyst stage, 3-3 .5 days post coitum, in mouse embryos. Over expression of
MyoR inhibits retinoic acid induced di fferentiation in an embryonal carcinoma cel l l ine and is
lethal to early mouse embryos leading the authors to suggest that MyoR has a general role in the
repression and/or determination of embryonic cell differentiation (Yu et al. 2003 ) . Low level
expression of MyoR has been detected in some adult tissues from mice, including the brain,
spleen and muscle but not in l iver, lung, thymus or kidney ( Robb et al. 1 998) . In another
experiment MyoR expression was detected in brain, lung, heart, smal l intestine, spleen and
thymus but not in kidney, skeletal muscle, skin, stomach and testis (Yu et af. 2003 ) .
MyoD is one of four known myogenic regulators that activate muscle gene expression during
both myogenesis (fonnation of muscular tissue, in particular during embryonic development)
and muscle regeneration (Zhao and Hoffman 2006) . Adult mice were injected with cardiotoxin
into the gastrocnemius muscle on both sides to induce muscle degeneration/regeneration.
1 48

Candidate genes on chromosome 14
MyoD peaked at 1 2h and then again at 3 days after injection, fol lowed by down-regulation at
day 4-5 of muscle regeneration (Zhao et al. 2003 ). Up-regulation of MSC was found to occur at
the time of transcriptional down-regulation of MyoD. 11 has been suggested that MSC is a
l ikely key negative transcriptional regulator of My oD during muscle regeneration in vivo and
may bind the MyoD promoter to directly down-regulate MyoD transcription (Zhao and
Hoffman 2006). In addition, MSC is down-regulated during regenerative processes in adult
mice k idneys (Hishikawa et al. 2005 ) and has high expression levels in activated human B cel ls
(Massari et af. 1 998) .
A possible mechanism by which the MSC gene may be involved in lactation is through its role
in down-regulation of muscle regeneration ( Hishikawa et al. 2005, Zhao and Hoffu1an 2006). It
may be that MSC is up-regulated in muscle tissue during early lactation to prevent amino acids
being uti l ised for muscle protein synthesis. During early lactation in ruminants mobil isation of
protein reserves is a result of decreased protein synthesis and increased protein degradation
(Baracos et al. 1 99 1 , Wi lson et al. 1 988) . Thus, it i possible that the MSC gene is involved in
lactose and protein yields in the first 60 days of lactat ion, however more research is required to
test this hypothesis.
Summary
Eight genes were discussed in this section, which focus sed on genes l ikely to be involved in
some aspect of protein metabol ism. Following assessment of the currently known functions of
each gene, Tripartite motif-containing 55 and Ubiquitin-conjugating enzyme E2W (putative)
were considered to be the most suitable candidates because of relevance of their functions to
milk production in the first 60 days of lactation. The size of the body protein reserves and the
abi l ity to mobi l ise these reserves may be influenced by the level of expression of the TRlM55
gene. These may be important factors in supply of amino acids for milk protein synthesis and
glucogenic amino acids for glucose synthesis in the l iver and therefore influence 60 day milk,
lactose and protein QTL. Mobil isation of protein reserves may be of particular importance in
cows selected for New Zealand farming systems because spring pasture, the vast majority of the
1 49
Chapter 6
diet in early lactation, does not supply adequate quantities of dry matter or readi ly fermcntable
carbohydrate which are associated with glucogenic volat i le fatty acids ( Waghorn 2002) . In
addition, it has been suggested that there is an association between TRIM55 and IGF-I
concentrations during muscle wasting, which fits well with the IGF-I QTL present in the region
of interest in this study. The protein product of UBE2W may also contribute to supply of amino
acids for mi lk protein synthesis and l iver gluconeogenesis through mobi l i sation of l abi le protein
reserves and protein turnover in mammary secretory cel ls . Perhaps up-regulation of the
UBE2W gene occurs in both skeletal muscle and the mammary gland increasing proteolysis in
both tissues thus contributing to mi lk, l actose, crude protein, total protein, casein, and whey
protein yields in the first 60 days of lactation.
6.5 Control points in metabolic pathways
The genes in this section may play a role in some aspect of a metabol ic pathway important in
lactation. Many changes occur in metabolic pathways in the peri-parturient period to enable the
dai ry cow to synthesise and secrete mi lk (Chapter 2). For example, in adipose t issues there are
changes in a number of enzymes. Activities of fatty acid synthetase, l ipoprotein l ipase, glucose-
6-phosphate dehydrogenase and glycerol-3-phosphate dehydrogenase were decreased in early
lactation (Chi l l iard et af. 1 99 1 b, Shirley et af. 1 973) . Meanwhile an increase in the number of
�-adrenergic receptors per ccll (Jastcr and Wegner 1 98 1 ) contributes to an increase in l ipolysis
and a decrease in l ipogenesis. There are also changes in circulating hormone concentrations
( (Abribat et af. 1 990, Rhoads et af. 2004, Ronge et af. 1 988, V icini et at. 1 99 1 ) and increased
synthesis and secretion of the constituents of milk within the mammary gland (Keys et af. 1 989,
Nevi l le et al. 2002) . These processes are l ikely to have control points at a cellular level,
therefore, genes that may be involved in any of the vast number of changes in metabolic and
physiological pathways that occur to support lactation were investigated.
The genes that w i l l be discussed are:
• Nuclear receptor coactivator 2 (NCOA2),
I SO
Candidate genes on chromosome 14
.. Serum/glucocorticoid regulated k inase fami ly, member 3 ( SGK3),
.. Regulator of G-protein signal l ing 20 ( RGS20/RGSZ I ) ,
.. RAB2, member RAS oncogene fami ly (RAB2),
.. ADP-ribosylation factor guanine nucleotide-exchange factor I (brefeldin A-inhibited )
( ARFGEF I ) and
.. ATPase, H+ transporting, lysosomal 50/57kDa, V I subunit H (A TP6V I H) .
The currently known functions and how these functions may be important in the production of
mi lk, lactose and milk proteins wil l be discussed for each of the genes in th is sect ion.
Nuclear receptor coactivator 2 (NCOA2)
Nuclear receptor coactivator 2 (NcoA2) i s also known as transcriptional intermediary factor-2
(TfF-2), glucocorticoid receptor interacting protein- I (GRIP- I ), and steroid receptor coactivator-
2 (SCR-2) ( Picard et al. 2002, Xu and Li 2003 ). NcoA2 is a member of the p l 60 family of
transcriptional coactivators (SRCs) for nuclear receptors (NRs) (Jeong et al. 2006). These
coactivators interact with histone acetyltransferases and methyltransferases to recruit them to
specific promoter regions in a l igand-dependent manner. NcoA2 is able to interact with
multiple NRs in a l igand-dependent manner and significantly enhance NR-dependent
transcription. NcoA2 can also interact with and coactivate other transcription factors. On its
own and as part of transcription factor complexes, coA2 stimulates chromatin remodel l ing,
recruits general transcription factors, and ultimately enhances gene expression (Xu and Li
2003 ). NcoA2 and the other SRCs are i nvolved in an extremely complex system, integrating
multiple incoming stimuli into an appropriate cellular response by controll ing up and down
regulation of transcription activation ( McKenna and O'Malley 2002, Rogatsky et af. 200 I ) .
Coactivators may also be the factors that mediate many downstream NR-related events
(McKenna and O'Malley 2002) .
1 5 1
Chapter 6
The cellular balance of co activators and corepressors affords a smooth and tightly controlled
induction curve for NR-mediated gene expression. Increased coactivator would l ikely provide a
more rapid transcription response. NcoA2 has also recently been shown to change ECso ( half
maximal effective conccntration), which may be of considerable impOltance for responding to
changes in physiological state. Coactivator/corepressor levels in different individuals might
explain, at least in part, some of the variabi l ity in individual phenotypes observed throughout
species populations (McKenna and O'Malley 2002) . Given that co activators act at the
ampl ification step in gene expression, a few percent difference in the inherited coactivator levels
in the population could underlie major alterations in hormone-mediated development of, for
example, the musculo-skeletal and organ systems (McKenna and O'Mal ley 2002) .
NcoA2 is widely expressed, its mRNA has been detected in many t issues including the p lacenta,
testis, brain, heart, l iver, pancreas and uterus, expression levels are tissue and cell-type
dependent (Xu and Li 2003) . Studies conducted with NcoA2 nul l mice have demonstrated that
both male and female adult NcoA2 null mice had low fert i l ity compared to wild type mice
(Gehin et af. 2002, Mukherjee et af. 2006) . NcoA2 also had an essential role in progesterone
induced mammary ductal side-branching and alveologenesis, cel lular processes that normal ly
occur with pregnancy onset (Mukherjee et af. 2006).
NcoA2 null mice were resistant to obesity, despite them eating more than the wild-type mice
( Picard et al. 2002). Whole body insulin sensitivity appeared to be enhanced in the absence of
NcoA2. Thus, NcoA2 null mice had lower fasting glycemia, lower one hour postprandia l
insulin concentration despite simi lar glucose, and higher insulin stimulated glucose c learance.
They also had lower fast ing triglyceride concentrations. Lipolysis was higher in NcoA2 null
mice cells under both basal conditions and after exposure to adrenal ine . They had lower levels
of anti l ipolytic proteins, lower expression of genes involved in fatty acid uptake, lower leptin
mRNA levels in adipose tissue and lower p lasma leptin concentrations. Al tered gene
expression due to absence ofNcoA2 enhanced l ipo lysis and impaired fat uptake and storage
(Picard et al. 2002) . In the l ivers of NcoA2 nul l mice, glucose transporter 2 (GLUT2) and
1 52
Candidate genes on chromosome 14
glucokinase (Gck) gene expression were decreased in the NcoA2 null mice. These two
enzymes catalyse the initial step in the use of glucose by p-cells and l iver at physiological
glucose concentrations ( Jeong et af. 2006).
Thus, NcoA2 is involved in the control of uptake and storage of glucose. Fatty acid degradation
and glycolysis pathways are up-regulated and fatty acid, cholesterol, and steroid biosynthesis
pathways are down-regulated in the l iver of NcoA2 null mice ( Jeong et af. 2006). These results
are consistent with the phenotype observed in NcoA2 null mice, having increased energy
expenditure (Jeong et af. 2006, Pi card et af. 2002 ). NcoA2 null mice had an overal l down
regulation of target genes, indicating a largely promotional activity on target gene expression
(Jeong et af. 2006).
There are two possible ways the NcoA2 gene may influence the QTL in the region of interest in
this study. Firstly, by affect ing mammogenesis during pregnancy or secondly, by i nfluencing
changes in the metabolism of tissues that are important in nutrient partitioning in early lactation.
NcoA2 has an essential role in progesterone-induced manm1ary ductal side-branching,
alveologenesis and epithelium prol iferation in the mouse during pregnancy (Mukherjee et af.
2006) . The amount of tissue in the bovine mammary gland i s subject to exponential growth
during pregnancy. The increase in the first half of pregnancy is mainly an extension of the duct
system and prol iferation of the supporting tissues, while in the 5th to 6th month of pregnancy
alveoli appear and increase in number throughout the remainder of pregnancy (Holmes et af.
2002 ). The concentrations of oestrogen and progesterone are simultaneously elevated during
much of gestation in cows, particu larly during the l ater portion of gestation and are essential for
much of the mammary growth during gestation ( Holmes et af. 2002, Schams et af. 2003 ) . I t is
possible that the NcoA2 gene product plays a simi lar role in mammogenesis during pregnancy
in the bovine mammary gland as it does in the mouse. Differential expression of the gene may
infl uence the extent of mammary gland tissue growth, which in turn may affect mi lk production,
a relationship that has been suggested in previous studies (Akers et af. 2006, Capuco and E l Iis
2005) .
1 53
Chapter 6
Fatty acid mobil isation from adipose tissue has a pivotal role in supplying energy in the
lactating dairy cow (McNamara 1 995) . It is apparent from the experimental work conducted
with NcoA2 null mice that this gene has an important role in energy homeostasi s ( Picard et af.
2002) . S ince adaptations that occur in energy metabol ism, around the time of onset of copious
milk synthesis and secretion, play a key role in early lactation in the high producing dairy cow,
it seems possible that the NcoA2 gene has a role in these adaptations. NcoA2 may be down
regulated in the l iver and adipose tissue of dairy cows resulting in decreased glucose uptake and
increased energy generation by the l iver, and increased l ipolysis in adipose tissue as seen in
NcoA2 nul l mice ( Picard et af. 2002). During the period of negative energy balance that usually
occurs in early lactation, NEF As are released from adipose ti ssue and contribute substantial ly to
oxidative energy metabol ism in non-mammary tissues, which spares glucose and amino acids
for use in the mammary gland (Chil l iard et af. 2000, Vernon 1 998) . Animals of higher genetic
merit for mi lk production have higher rates of l ipolysis compared with low genetic merit cows
(McNamara and H i l lers 1 986b) and milk yield was positively correlated with l ive weight loss
during lactation (Nei lson et af. 1 983) . Further evidence is provided by an experiment in which
a hyperinsul inaemic-euglyceamic c lamp was administered to dairy cows during week two of
lactation. The clamp caused a 68% reduction in plasma NEF A, a 27% reduction in mi lk fat
yield and the milk fat was composed of a lower proportion of long chain fatty acids (Corl et af.
2006) . This demonstrated the important contribution that mobil isation of fatty acids from body
fat reserves makes to mi lk fat yield and concentration in early lactation (Corl et af. 2006) .
I f the NcoA2 gene was differential ly regulated during the onset of lactation then it would be
reasonable to expect an affect on mi lk fat yie ld as wel l as the other mi lk components. However,
there were no mi lk fat yield QTL identi fied in the region of interest in this study. On the other
hand, NcoA2 was involved in several aspects of energy homeostasis in the mouse and it is
possible that the various functions of this gene combine to improve the availab i l i ty of precursors
for milk proteins and lactose. Alternatively, the functional protein encoded by this gene is a
member of a family of coactivators/corepressor, and may play a role in lactation in this capacity.
1 54
Candidate genes on chromosome 14
For example, NcoA2 may increase the expression of a gene or genes in response to a particular
stimulus during parturition or the onset of lactation, which in turn could impact on as yet
unidentified pathways important to milk production. NcoA2 may act at the ampl ification step i n
gene expression and a few percent difference i n the inherited coactivator levels in the population
could underlie major alterations in hormone-mediated changes in physiology (McKenna and
O'Malley 2002 ). The gene(s ) that NcoA2 acts upon could either be in close proximity on the
chromosome but it does not have to be (Chapter 5 ) . If the genes were not close by and the QTL
mapped to the location of the coactivator this may indicate either the level of coactivator
expression or the allele expressed is important in mediating the changes that support lactation
but would not give any information on the genes that NcoA2 acts upon . Further research into
the importance of this gene to lactation is required.
Serum/glucocorticoid regulated kinase family, member 3 (SG K3)
This gene is one of the three members (SGK I , SGK2 and SGK3 ) of the serum and
glucocorticoid-inducible fami ly, a novel serine/threonine protein kinase family (Tessier and
Woodgett 2006). SGK3 mRNA concentrations were simi lar in all human tissues tested,
including heart, brain, l iver and pancreas (Kobayashi et 01. 1 999a). SGK3 is activated by
oxidation. Insulin and IGF-I activate SGK3 through a signal l ing cascade involving P13-kinase,
PDK I and PDK2/H-motif k inase (Kobayashi et al. 1 999a, Lang et al. 2006). The SGK3 protein
has a role in the activation of potassium, chloride, sodium and calcium channels ( Lang et af.
2006). Experiments using Xenopus oocytes injected with human, bovine or rat cRNA (cRNA is
RNA derived from complementary D A, which is D A synthesized from mature messenger
RNA) encoding SGK3 and various amino acid transporters, have shown that SGK3 up-regulates
a variety of amino acid transporters (Boehmer et al. 2003, Boehmer et 01. 2005, Bohmer et af.
2004, Palmada et al. 2005, Shojaiefard et af. 2005 ). SGK3 knockout mice (sgk3 -1- ) showed
decreased glucose transport across the intestine (Sandu et af. 2005) . Experiments using
Xenopus oocytes demonstrated a strong stimulatory effect of SGK3 on the Na +-coupled glucose
transporter 1 (SG LT I ), known to be involved in intestinal and renal glucose transport (Dieter et
1 55
Chapter 6
of. 2004) . SGLT I is present in the bovine mammary gland (Zhao et of. 1 999). Although it is
not the major glucose transporter present, SGLT I mRNA levels were increased 4-fold (P<O.O I )
from 40 days before birth to 7 days after birth. It may have a role in substrate transport,
possibly within the mammary gland, during lactation (Zhao et of. 2005, Zhao et of. 2004). I n
addition, SGLT is expressed along the gastrointestinal tract of dairy cows (Drackley e t al. 2006,
Zhao et 01. 2005) . The number and activity of these transporters were increased 60- and 90-
fold, respectively, in response to glucose infusion, despite only a 2-fold increase in mRNA
abundance (Drackley et of. 2006) . Thus, post-translational modi fications appear to be an
important factor in the control of SGLT I (Drackley et of. 2006) . SGK3 may play an important
role in increasing the activity of SGL T I , which would help to increase nutrient absorption
across the gastrointestinal tract and increase nutrient availabi l i ty for lactation.
Kinases, including SGK3, stimulate the voltage-gated K+ channel complex KCN E I IKCNQ I
(Embark et at. 2003 ) . The channels contribute to the maintenance of the electrical potential
difference across the apical cell membrane, which is a critical driving force for glucose and
amino acid transport ( Rexhepaj et 01. 2007) . All three SGK isoforms stimulate the Na+/K+-
A TPase, which is required for maintenance of the Na + gradient, an important driving force for
Na+-coupled nutrient transport ( Henke et of. 2004). SGK3 may participate in the regulation of
Na+/K+-ATPase activity through its activation by hormones such as insulin and IGF- l ( Henke et
01. 2004) .
SGK3 influences cell survival in a number of ways. SGK3 effectively b locks apoptosis induced
by the withdrawal of the cytokine interleukin-3. I n addition, SGK3 has been shown to up
regulate Kv l .3 (Kv channels are voltage-dependent (activated by depolarisation) potassium
channels that are expressed in a wide range of cel ls and tissues) (Henke et 01. 2004). IGF-l
induced cel l pro l iferation in human embryonic kidney cells ( HEK293 ) and up-regulated Kv
channels. P I3-kinase, PDK I and SGK I were shown to be involved in the IGF-I signal l ing
pathway that caused this up-regulation (Gamper et 01. 2002) . The prol iferative effect of IGF-I
was d isrupted by b lockade of Kv channels, indicating a role for Kv channels in the proliferative
1 56
Candidate genes on chromosome 14
action of IGF-I (Gamper et af. 2002) . Up-regulation of Kv l .3 channel activity, in part by the
stimulation of SGK3, may be important for the prol iferative effect of IGF-I (Henke et af. 2004) .
Current knowledge of the SGK3 protein indicate that i t has a role in the activation of ion
channels ( Lang et al. 2006), up-regulates a variety of amino acid transporters (Boehmer et af.
2003, Palmada et af. 2005, Shojaiefard et al. 2005) and has a stimulatory effect on SGLT I
(Dieter et al. 2004). Thus, a change in the expression of SGK3 may result in alteration in the
activation of amino acid transporters and ion channels with a concomitant change in the drive to
take up glucose and amino acids.
Differential regulation of proteins, such as changes in number or activity, occurs during early
lactation, for example, the activity of the enzyme l ipoprotein l ipase is down-regulated in adipose
tissue while i t is up-regulated in the mammary gland during early lactation (Chi l l iard et al.
1 977, McNamara et af. 1 987, Shirley et al. 1 973) . Thus, it seems feasible that differential
regulation of the SGK3 gene could occur during lactation and i t may be regulated by changes in
insul in and IGF-I concentrations in early lactation (Henke et al. 2004, Kobayashi et al. 1 999a,
Lang et af. 2006, Rhoads et al. 2004). Down-regulation of SGK3 may occur in tissues, such as
skeletal muscle, that exhibit a reduction in uti l isation of amino acids, glucose and acetate during
lactation (Baracos et af. 1 99 1 , Pethick and Lindsay 1 982, Yemon et af. 1 990). The SGK3 gene
may be up-regulated in tissues that must increase uptake of these substrates during lactation,
such as the mammary gland and gastrointestinal tract (Annison 1 983, Bickerstaff et al. 1 974, H a
and Kennel ly 1 984, Okine et af. 1 994).
Regulator of G-protein signaUing 20 (RGS20/RGSZl )
Regulator of G protein signal l ing ( RGS) proteins are a family o f GTPase-activating proteins
(GAPs) for heterotrimeric guanine nucleotide binding proteins (G proteins ) . They share a
conserved 1 20 amino acid RGS domain that binds directly to the Ga subunits to modulate G
protein signal l ing ( Hol linger and Hepler 2002) . Extracellular signals, such as, l ight, hormones,
neurotransmitters, and proteins activate 7-membrane-spanning G-protein coupled receptors
1 57
Chapter 6
(GPCRs). These signals are then transmitted by G-proteins, to effector proteins inside the cel l
which initiates changes in cel l behaviour (Abramow-Newerly et af. 2006, G l ick et af. 1 998,
Nunn et af. 2006). Activation of GPCRs causes a conformational change that catalyses GDP
(guanosine d iphosphate) dissociation and GTP (guanosine-S'-triphosphate) binding on the Ga
subunit, this leads to activation of its effectors and propagation of downstream signal l ing
pathways (Nunn et al. 2006). GTP hydrolysis is accelerated by GAPs and terminates G protein
activation (Wang et al. 1 998) . RGS protein were initially identified as GAPs that increased the
rate of hydrolysis of GTP-bound Ga subunit to inactivate it. Later it was found that they can
regulate G protein-effector i nteractions in other ways that are not currently wel l understood
(Abramow-Newerly et af. 2006, Nunn et al. 2006 ).
The RGS20 gene contains multiple introns, altemative spl icing of this gene produces at least six
mRNAs that encode protein variants that differ in size and sequence of their N-terminal
domains. Therefore, they are l ikely to differ in their attachment to membranes and their
subcel lular distribution ( Barker et al. 200 I ). These proteins include RGSZ I , Ret-RGS and four
other proteins that have not yet been characterised (Barker et af. 200 I ) . The expression of Ret
RGS proteins is l imited to retinal interneurons ( Barker et af. 200 I ) . RGSZ I was first isolated
from bovine brain and subsequent studies have shown that RGSZ I mRNA is expressed in
multiple areas throughout the human brain (Barker et al. 200 I , Wang et af. 1 998) . RGSZ I
protein exhibits high selectivity for Gaz and is able to increase the rate of GTP hydrolysis for
Gaz up to 400-fold (Mao et al. 2004, Wang et af. 1 998), i t is strongly hydrophobic and firmly
membrane-bound (Barker et al. 200 I ) . Gaz hydrolyses bound GTP very slowly, suggesting that
activated Gaz does not turn off immediately after receptor activation and implies that an
efficient Gaz GAP is a required component of the Gaz signal l ing system (NUM et af. 2006,
Wang et af. 1 998) . Further studies suggest that RGSZ I also interacts directly with members of
Ga; subfami ly and regulates Ga; mediated cell signall ing (Mao et af. 2004, Wang et al. 2002)
and lead to the suggestion that RGSZ I is a selective Gaz GTPase-activating protein and a
general inhibitor of signals mediated via members of the Ga; subfamily (Mao et af. 2004) .
1 58

Candidate genes on chromosome 14
RGSZ I blocked TRH-stimulated Ca2+ mobi l i sation in cultured cell l ines either by acting as a
GAP or by interacting with the G-protein to inhibit its interaction with the signall ing effector
(Mao et al. 2004) . Studies in rat and mice pancreatic islet �- cells have demonstrated that Gaz
mediated prostaglandin E inhibition of glucose-stimulated insulin secretion and RGSZ I blocked
the effects of Gaz ( Kimple et al. 2005). A study in mice showed that RGSZ I regulates the
activity of opioids at Jl but not I) receptors in the central nervous system (CNS) (Garz6n et al.
2004).
As a result of the small amount of research that has been conducted on the RGS20 gene, it
seems possible that the protein products of this gene may have a wide range of functions
particularly considering there are six spl ice variants, which code for proteins of differing size
and binding capabi l ities ( Barker et al. 200 I ) . Of particular note are the results that demonstrate
an involvement of the RGSZ I protein in regulating insulin secretion and the activity of opioids.
Insulin secretion in response to insul inotropic substrates is reduced during lactation and is one
of the many important adaptations in the physiological control of nutrient partitioning that
contribute to redirecting nutrients towards the mammary gland during lactation ( Holtenius et al.
2003 , Lomax et al. 1 979). RGSZ I blocked Gaz mediated prostaglandin E inhibit ion of gl ucose
stimulated insulin secretion from rat and mice pancreatic islet �- cells (K imple et af. 2005 ).
RGSZ I may be down-regulated during lactation, which would enable Gaz to reduce insul in
secretion in response to insul inotropic agents. In addition, the RGSZ I protein may also have a
role in mediating opioid activity in the C S (Garzon et al. 2004), opioids have a number of
possible roles in physiological changes that occur during lactation (section 6.6), therefore this
may be another way in which RGSZ I plays a role in lactation. Currently there has been no
research that has investigated whether RGSZ I , or any of the other RGS20 splice variants, have
a role in the lactating animal . Thus, new research is required to investigate if this gene has a
role in control l ing any of the QTL in the chromosomal region of interest on BT A 14 .
1 59

Chapter 6
RAB2, member RAS oncogene family (RAB2)
The product of the Rab2 gene is a member of the Rab family of smal l molecular weight,
monomeric GTPases that interconvert between GDP- and GTP-bound states (Tisdale 1 999).
Rab protcins are required for vesicle targeting and fusion in both exocytic and endocytic
pathways (Sal lese et al. 2006) . Rab2 is bel ieved to modulate retrograde transport, which is
transport from the Golgi to the endoplasmic reticulum ( ER) . Retrograde transport is essential
for retrieval of ER or Golgi resident proteins. This protein retrieval is necessary to maintain
organelle homeostasis and recycle components of the transport machinery required for
anterograde, E R to Golgi, transport (Dong and Wu 2007, Tisdale et at. 1 992 ).
The ER-Golgi intermediate complex ( ERGIC) i s a complex membrane system between the
rough ER and the Golgi. It is the first post-ER sorting station for anterograde and retrograde
protein traffic and thus p lays a critical role in separating proteins for anterograde and retrograde
transport in the early secretory pathway (Appenzel ler-Herzog and Hauri 2006). Rab2 is
localised to the ERGIC (Tisdale et at. 1 992) and is thought to be a key p layer in intermediate
compartment function (Tisdale 1 999). It has been proposed to modulate retrograde protein
transport spec ifical ly from the ERCIG to the ER by recruitment of soluble components
necessary for protein sorting and recycling from pre-Golgi intennediates resulting in the
generation of retrograde transported vesicles (Tisdale 1 999) .
Rab2 promotes Src membrane association to the ERGIC (Tisdale and Artalejo 2006). Src i s a
member of the non-receptor tyrosine kinase family that is expressed in most tissues and is
involved in signal transduct ion events that regulate cell growth, survival, moti l ity,
differentiation, adhesion and migration ( Thomas and 8rugge 1 997) . Rab2 bound to ERCIG
stimulates recruitment of atypical protein kinase C vA (aPKCvA) and glyceraldehyde 3-
phosphate dehydrogenase (GAPDH) to E RGICs. Both of these proteins bind directly to Rab2
and also interact with each other (Tisdale 1 999, 2003, Tisdale et al. 2004). Src mcdiatcd
phosphorylation of atypical protein kinase C vA ( aPKCvA) is essential for interaction with
Rab2-GAPDH-Src on the ERGIC (Tisdale and Artalejo 2006). aPKCvA promotes the binding
1 60
Candidate genes on chromosome 14
of COPT ( coat protein complex I , a protein complex crucial ly involved in transport vesicle
assembly and intra-Golgi traffic) to intermediate compartment membranes, and phosphorylates
GAPDH . GAPDH influences microtubule dynamics and transport in the early secretory
pathway (Tisdale 2003, Tisdale and Artalejo 2006, Tisdale et al. 2004).
Recent studies have shown that Rab2-coordinated protein transport has an essential role in the
anterograde transport and cell-surface targeting of a2B-adrenergic receptor (AR) and P2-AR
(Dong and Wu 2007) . These authors postulated that retrograde transport from the Golgi
through the ERGIC to the ER may control the specificity of G protein-coup led receptors
targeting to the p lasma membrane (Dong and Wu 2007 ).
Transport of milk constituents through the mammary epithelial cel l ( MEC) can occur in a
number of ways and is dependent on whether the constituent is synthesised within the MEC or
is transported from plasma across the MEC into the lumen. There are three intracel lular
pathways that are represented diagrammatical ly in Figure 6.2 and are described below:
• In pathway I ( Figure 6.2) milk constituents are synthesised in the MEC, transferred in
vesicles, in which they are transported through the ccl l and expel led from the cel l by
exocytosis. Caseins, a-lactalbumin and other milk specific proteins are synthesised in the
ER, which is extensive in the lactating MECs (Mather and Keenan 1998, Ol livier
Bousquet 2002). Lamellar cisternae of the ER, in close proximity to the cis side of the
Golgi apparatus, form the ERGIC ( Boisgard et al. 2001 ). The ERGIC plays a central role
in the early part of the secretory pathway in the MEC ( Pechoux et at. 2005) . Vesicles
then bud from the ER and fuse with the ERG IC at the eis-side of the Golgi apparatus
( Mather and Keenan 1998, Ol livier-Bousquet 2002). These anterograde-directed vesicles
are coated with a set of proteins termed COPI I ( Pechoux et al. 2005) . COP" differs from
COPI because it coats vesicles that are involved in anterograde transport whereas COPI
coated vesic les move bi-directionally between the ER and the Golgi (Pechoux et af.
2005). Maturation of the milk proteins, in particular caseins, may occur as they pass
1 6 1
Chapter 6
through the Golgi apparatus. It has been suggested that proteins move across the Golgi
stack as the cis c isternae mature to become medial and then trans c isternae ( Boisgard et
al. 200 I ) . In addit ion, lactose i s synthesised by the action of the galactosyltransferase a
lactalbumin complex i nside the Golgi apparatus (Mather and Keenan 1 998) . On the trans
side of the Golgi apparatus, budding of secretory vesicles occurs from the trans Golgi
network ( Boisgard et al. 200 I ) . Secretory vesicles containing mature case i ns, whey
proteins, lactose, c itrate and soluble salts release their contents into the lumen of the
acinus by exocytosis (Boisgard et al. 200 I , Oll ivier-Bousquet 2002 ). More recent studies
have suggested that tubular structures are involved in the transport of milk proteins in the
secretory pathway ( Pechoux et al. 2005 ) . In addition, a smal l quantity of newly
synthesised proteins, including mi lk proteins, hormones, receptors and enzymes are
carried along a basolateral pathway to the basement/lateral membranes (Boisgard et al.
200 I , 011 ivier-Bousquet 2002) .
� An endocytotic and transcytotic pathway (pathway 2, Figure 6 .2) that involves
internalisation of plasma-derived components into the cell and their transport i nto the
milk . During transport, a sorting of internal ised molecules strictly controls the
destination of the transcytosed products (Ol l iv ier-Bousquet 2002) .
� Milk fat droplets ( pathway 3 , Figure 6 .2 ) are carried from the ER where they are
synthesised to the apical region; they then bud from the apical membrane and are
released i nto the lumen encased in the mammary fat globule membrane (Ol l ivier
Bousquet 2002 ).
1 62

Candidate genes on chromosome 14
LUMEN
all!�III'I�·ROIJGH E.R.
.....
BASEMENT MYOEPITHE IAL HEMIDESMOSOME MEMBRANE CELL
Figure 6.2 Diagram showing the major routes of secretion across the mammary epithel ia l cel l . The pathways shown by arrows through the cell are: I . pathways that ends with exocytosis; 2. endocytotic and transcytotic pathways; and 3. milk fat droplet pathway. Adapted from Linzell and Pcaker ( 1 97 1 )
Members of the Rab family of smal l molecular weight, monomeric GTPases localise to specific
subcel lular compartments and are implicated at virtual ly al l steps of membrane transport that
have been studied (Gruenberg and Maxfield 1995). Rab2 bound to the ERG IC participates and
stimulates interaction of a number of molecules resulting in binding of COPI to intermediate
compartment membranes and phosphorylated GAPDH influences microtubule dynamics and
transport in the early secretory pathway (Tisdale 2003, Tisdale and Artalejo 2006, Tisdale et af.
2004). COP I-coated vesicles mediate the anterograde transport from the ERG IC to the cis-most
cisternae of the Golgi or the recycling from the Golgi and ERGIC to the ER ( Pechoux et al.
2005).
It has been suggested that ER-to-Golgi trafficking could be perturbed if the recycling of
molecules needed for the formation of anterograde vesi c les was impaired ( Pechoux et af. 2005).
1 63

Chapter 6
It was observed in mammary epithelial cells from lactating rabbits that incubation with
bromoenol lactone slowed down the transport of caseins from the ER to the Golgi stacks. The
authors suggested that inhibition of retrograde transport of components involved in the forward
transport of newly synthesised milk proteins to the Golgi complex could impair their transport
(pechoux et al. 2005). Thus, mechanisms that control vesicular traffic in both directions
between the ER and the Golgi could be critical to the efficient and effective secretion of
synthesised mi lk proteins from within the MEC. S ince Rab2 is important for retrieval of ER or
Golgi resident proteins (Dong and Wu 2007, Tisdale et al. 1 992) it seems possible that this
protein could have a role in the efficient functioning of MEC. If the ER and Golgi resident
proteins and components of transport machinery are not recycled in a t imely fashion this may
reduce the efficiency of the secretory cells and reduce the speed at which proteins are
transported from the ER to the Golgi apparatus. I n addition, this pathway is particularly
important in the secretion of mi lk proteins, which fits wel l with the QTL found in the region of
interest in this study. I f Rab2 was the gene underlying the 60 day mi lk QTL, i t is unclear why it
would only affect these parameters in early lactat ion. Nevertheless, in view of the huge amount
of vesicular movement in the secretory cel l it would be unwise to ignore the possibil ity that this
gene is invo lved.
ADP-ribosylation factor guanine n ucleotide-exchange factor l (brefeldin A
inh ibited) (ARFGEFl )
The ADP-ribosylation factor guaninc nucleotide-exchange factor I ( brefeldin A-inhibited)
(ARFGEF I ) gene product was first isolated from bovine brain cel l cytosol and i s a -200-kDa
molecule which is also known as B IG I ( for hrefeldin A-inhibited guanine nucleotide-exchange
protein) ( Morinaga et al. 1 996, Togawa et at. 1 999). ARFGEF I was primarily located in the
cytosol and associated with the Golgi in cells growing in culture medium ( Padilla et at. 2004).
A large percentage of these proteins were found in the nuclei when these cel ls were incubated
without serum (Padil la et al. 2004). As a result the authors suggested that ARFGEF I
participates in both nuclear and Golgi systems. It may be a signal l ing and scaffolding protein for
1 64
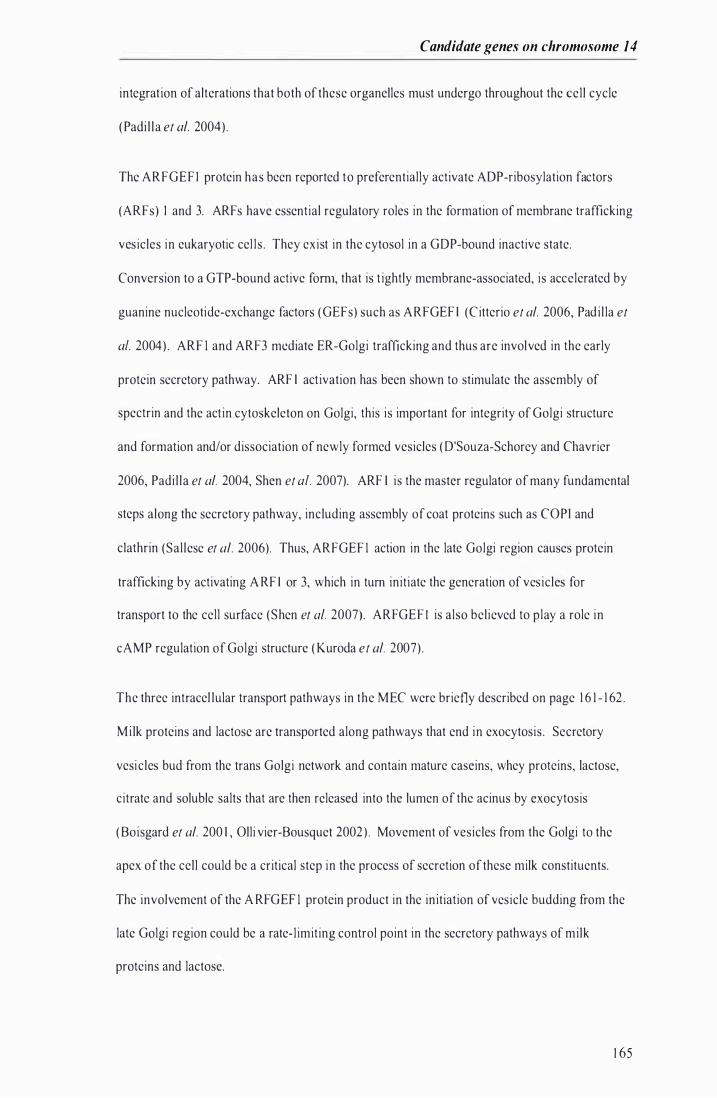
Candidate genes on chromosome 14
integration of alterations that both of these organelles must undergo throughout the cel l cycle
( Padi l l a et al. 2004) .
The ARFGEF I protein has been reported to preferentially activate ADP-ribosylation factors
(ARFs) I and 3. ARFs have essential regulatory roles in the formation of membrane trafficking
vesicles in eukaryotic cel ls . They exist in the cytosol in a GDP-bound inactive state.
Conversion to a GTP-bound active forn1, that is t ightly membrane-associated, is accelerated by
guanine nucleotide-exchange factors (GEFs) such as ARFGEF I (C itterio et al. 2006, Padi l la et
af. 2004) . ARF I and ARF3 mediate ER-Golgi trafficking and thus are involved in the early
protein secretory pathway. ARF I activation has been shown to stimulate the assembly of
spectrin and the actin cytoskeleton on Golgi, this is important for integrity of Golgi structure
and formation and/or dissociation of newly formed vesicles (D'Souza-Schorey and Chavrier
2006, Padi l la et al. 2004, Shen et af. 2007). ARF I is the master regulator of many fundamental
steps along the secretory pathway, including assembly of coat proteins such as COPI and
c1athrin (Sal lese et al. 2006). Thus, ARFGEF I action in the late Golgi region causes protein
trafficking by activating A RF I or 3, which in turn initiate the generation of vesicles for
transport to the cell surface (Shen et al. 2007). ARFGEF I is also believed to play a role in
cAMP regulation of Golgi structure ( Kuroda et al. 2007) .
The three intracel lular transport pathways in the MEC were briefly described on page 1 6 1 - 1 62 .
Milk proteins and lactose are transported along pathways that end in exocytosis . Secretory
vesicles bud from the trans Golgi network and contain mature caseins, whey proteins, lactose,
citrate and soluble salts that are then released into the lumen of the acinus by exocytosis
( Boisgard et al. 200 I , Olli vier-Bousquet 2002 ) . Movement of vesicles from the Golgi to the
apex of the cell could be a critical step in the process of secretion of these milk constituents.
The involvement of the A RFGEF I protein product in the initiation of vesicle budding from the
late Golgi region could be a rate-l imiting control point in the secretory pathways of milk
proteins and lactose.
1 65

Chapter 6
The very h igh levels of milk production achieved by some cows may be dependent on the
abi l i ty of the MECs to secrete milk proteins and l actose. ARFGEFI may p lay a role in the
timing and regularity of vesicle formation. Differences between an imals may result from
differences in gene expression, different al leles or post-translational modifications. Despite not
knowing the ful l extent of the actions of the ARFGEF I protein, it can not be discounted as a
possible candidate gene for the early lactation mi lk production QTL found in the region of
interest on BT A 1 4. Perhaps the secretory pathways are under the greatest l oad during early
lactation when mi lk production is increasing to a peak and it is during this time that differences
between animals in the control of secretory pathways has consequential effects on their mi lk and
protein yields.
ATPase, H+ transportin g, lysosomal 50/57kDa, VI subunit H (ATP6V I H)
The ATP6V I H gene encodes the H subunit of the VI sector of the vacuolar H+-ATPase (V
ATPase). The V -ATPase is a multi-subunit enzyme that is divided into two distinct domains or
sectors (Figure 6.3) . V-ATPase is thought to be expressed in virtual ly a l l eukaryotic cel ls and is
involved in the translocation of protons across the membrane of various intracel lu lar organelles,
resulting in their acidification ( Beyenbach and Wieczorek 2006, Breton and Brown 2007, Morel
2003 ) .
1 66
Candidate genes on chromosome 14
Figure 6.3 A diagrammatic representation of the bovine V -ATPase adapted from: Gregorini et al. 2007, Sun-Wada et al. 2004, Wilkens et al. 2004). The transmembrane Vo sector is responsible for proton translocation and is composed of 6 subunits (subunits designated by lower case letters), while the VI sector forms a large cytosol ic complex composed of 8 subunits (designated A-H) and carries out A TP hydrolysis and nucleotide binding ( I noue et al. 2005, N ishi and Forgac 2002, XU et al. 1 999) . The V-A TPase uses the energy from ATP hydrolysis to drive proton transport across membranes (Sun-Wada et al. 2004) . Three copies of the A subunit alternate with three copies of the B subunit to form the part of the VI sector, which is connected to the Vo sector via two or more stalks, composed of sub units C to H. ( Brcton and Brown 2007, XU et al. 1 999).
Three alternatively spl iced transcript variants encode two isofornls of the H subunit, both of
which are present in the stalk of the V-ATPase enzyme, connecting the Vo and VI sectors ( Lu et
af. 2002, Wilkens et al. 2004). Studies in yeast have shown that the V-ATPase enzyme is sti l l
assembled in cells that are devoid of subunit H but i t i s less stable and more importantly, the
enzyme is inactive (Ho et al. 1 993) . Studies in bovine cells demonstrated that loss of sub unit H
results in loss of activity in V-ATPase (Xu et al. 1 999). V-ATPase is involved in endocytosis
mediated by c1athrin-coated pits, and is required for the formation of endosomes. Subunit H
interacts with the AP-2 adaptor protein involved in c1athrin-mediated endocytosis (Breton and
Brown 2007).
V-ATPase is responsible for providing most of the energy required for transport processes in the
vacuolar system. V -A TPase dependent organelle acidification is necessary for intracel lular
processes such as protein processing and degradation, zymogen activation, receptor-mediated
1 67
Chapter 6
endocytosis, synaptic vesicle proton gradient generation, and the coupled transport of smal l
molecules such as neurotransmitters ( I noue et at. 2005, Morel 2003) . I n exocytotic pathways,
peptides and proteins in acidic secretory vesicles are often processed from pro-proteins by acid
proteases or enzymes to yield, for example, enkephalin or i nsulin ( Beyenbach and Wieczorek
2006, Sun-Wada et al. 2006).
Mice with a subunit of the V-ATPase deleted had significantly lower plasma insul in
concentrations, decreased islet insulin content and decreased insul in secretion compared with
wi ld-type mice; leading to the suggest ion that this deletion caused the exocytosis step of
secretory granules to be defective (Sun-Wada et at. 2006) . In addition to its l ikely role in the
pancreas, V -A TPase may be important in other endocrine organs. Subunits of V -A TPase are
expressed in the secretory granules in organs including the adrenal gland, parathyroid gland,
pituitary gland and pineal gland, all of which have important endocrine functions in
maintenance of whole body homeostasis (Sun-Wada et al. 2006) . The presence of V -ATPase
subunits in the secretory granules of many endocrine organs may indicate that this enzyme has a
role in hormone secretion.
The period of negative energy and protein balance in early lactation i s accompanied by changes
in circulating concentrations of important homeorhetic hormones, including decreased insul in
and IGF- I and increased GH p lasma concentrations (Accorsi et al. 2005, Bel l et al. 2000, Gulay
et at. 2004, Holtenius et al. 2003, [ngvartscn and Andersen 2000, Komatsu et al. 2005, Lacasse
et al. 1 994, Rhoads et al. 2004, Spicer et at. 1 990, Vega et at. 1 99 1 ). The changes in hormone
concentrations at the onset of copious mi lk synthesis and secretion affect the partit ioning of
nutrients between mi lk production in the mammary gland and the needs of non-mammary
t issues (Bauman and Currie 1 980, Chil l iard 1 999). Cows that differ in genetic merit and
measured mi lk production have different p lasma hormone concentrations, for example IGF- I ,
insul in and GH ( Bonczek et al. 1 988, Hart et al. 1 980, Kazmer et al. \ 986, Knight et al. 2004,
Snijders et al. 200 \ ).
1 68

Candidate genes on chromosome 14
I t is possible that changes in gene transcription, translation or post-translational modifications of
V-A TPase in the secretory granules of endocrine glands would alter the secretion of the
hormone it is carrying. Hom10ne secretion may either be increased or decreased depending on
the changes to V -A TPase. Thus, changes in circulating hormone concentrations in early
lactation may be a result of changes in secretion due to alterations in V-ATPase. The H subunit
of the V-ATPase, encoded by A TP6V I H, is a good candidate, particularly for decreasing
hormone secret ion, because loss of subunit H from bovine cel ls results in loss of activity in the
V-ATPase (Xu et at. 1 999).
V-ATPase in the plasma membrane functions in renal acidification, bone resorption, tumour
metastasis, sperm motil ity and maturation and maintenance of pH in the inner ear (Nishi and
Forgac 2002, Xu et 01. 1 999) . V-ATPase enzymes are expressed and functionally active in
ovine rumen epithelial cells and it has been suggested that they play a role in intracellular pH
regulation and establishment of transport gradients (Etschmann et 01. 2006). The increase in
nutrient demands brought about by the onset of lactation is accompanied by an increase in food
intake and an increase in the absorptive capacity of the gastrointestinal tract, as a result of
greater mass, greater enzyme activities and greater transport capabi l ity (Fell et 01. 1 972, Ha and
Kennelly 1 984, Okine et 01. 1 994, Reynolds et 01. 2004, Sutter and Beever 2000, Weekes 1 972) .
It is possible the increase in absorptive capacity has a crucial role in increasing nutrient uptake
in early lactation dairy cows. Differences may exist between cows in their abil ity to increase
absorptive capacity of the gastrointestinal tract and V -ATPase may play a role in this. Perhaps
some al leles for subunits of the V -ATPase enzyme confer greater efficiency to the enzyme than
others so cows that possess the al leles with greater efficiency would be able to increase the
absorptive capacity of the gastrointestinal tract more effectively than others.
However, the weakness with both of these hypotheses is that there no milk fat yield QTL in the
region of the chromosome under consideration. It could be argued that an increase in supply of
nutrients to the mammary gland, either from greater nutrient partitioning towards the mammary
gland or increased absorptive capacity in the gastrointestinal tract, would result in changes in al l
1 69
Chapter 6
components of mi lk not just proteins and lactose. However, some studies have indicated that
the supply of amino acids are l imiting to mi lk production ( Kim et al. 2000, Kokkonen et al.
2002, Mackle et al. 1 999). I f the hypothesised actions of V-ATPase in the lactating animal
increased the availab i l ity of amino acids then perhaps i t would influence lactose and mi lk
protein yield more so than fat yield. Further knowledge of the function of this enzyme, in
particular in relation to lactation, is needed before a firm conclusion can be drawn.
Summary
The functions of six genes were discussed in the section. Genes with a function that could be
logical ly considered to be involved in any one of the vast number of changes in metabolic and
secretory pathways that support lactation were investigated. Nuclear receptor coactivator 2 is a
transcriptional coactivator that has an important role in energy homeostasis and possibly
mammogenesis during pregnancy. The serum/glucocorticoid regulated kinase fami ly, member
3 protein has a role in the activation of ion channels, up-regulates a variety of amino acid
transporters, has a stimulatory effect on SGLT 1 and may in part be regulated by i nsulin and
IGF-I . NcoA2 and SGK3 were considered to be the most suitable candidates because the
protein products of these genes could be involved in key regulatory steps in a number of
pathways that are l ikely to be relevant to mi lk production in the first 60 days of lactation.
6.6 Food intake control candidate genes
Loss of live weight in early-lactation, high-producing dairy cows has been reported in numerous
studies. This reflects a general inabil ity of high-producing dairy cow to sufficiently increase
post-partum feed intake to meet energy demands caused by the rapid increase in mi lk
production (Cl ark et af. 2005, Gulay et af. 2004, Roche et al. 2006a, Spicer et af. 1 990, Van et
af. 2006) . This is particularly so in the case of pasture fed cows (Clark et af. 2005) due to
pasture diets not being as ideal ly suited to the requirements of mi lk production as total mixed
ration diets ( (Burke et af. 2002, Waghom 2002) . A number of experiments have demonstrated
that high genetic merit cows produced more mi lk and have a greater OMI than medium or low
genetic merit cows ( Kennedy et al. 2003 , Linnane et al. 2004, Snijders et af. 200 1 , Van et af.
1 70
Candidate genes on chromosome 14
2006). In an experiment studying dairy cows in the first 26 weeks of lactation, milk yield was
positively correlated with feed intake, l ive weight immediately post-calving, and l ive weight
loss over the lactation period ( Nei lson et af. 1 983) . In addition, positive genetic (0 .28) and
phenotypic (0.34) correlations have been reported between OMI and milk yield (Veerkamp et
a!. 2000) . Consequently, the abi l i ty of a dairy cow to increase intake is an important factor in
achieving greater milk yield, particularly in early lactation. Therefore, genes involved in
controll ing food intake are discussed in this section.
The genes that wi l l be discussed in this section arc:
• Opioid receptor, kappa I (OPRK I ),
• Proenkephalin ( PENK),
• Corticotropin releasing hormone (CRH) and
• Neuropeptides B/W receptor I (NPBWR I ).
These genes have been included in this section because onc of the ir functions is an involvement
in an aspect of the control of food intake. Thus, the current ly known functions and the possible
role each gene may play in influencing the QTL in the region of interest in this investigation
wi l l be discussed in this section.
Opioid receptor, kappa 1 (OPRK l )
Opioid receptor, kappa I (OPRK I , also known as kappa opioid receptor- I ( KOR- I ) ) i s the K I
subtype of one of four known types of opioid receptors ( 11, 8, K and nociception) (Bodnar 2004) .
Opioid receptors are a class of receptors that belong to the large super family of GPCRs
(Waldhoer et a!. 2004) . Opioid receptors occur in a variety of hypothalamic and pituitary sites
(Kim et a!. 1 997) . They are bound/activated by opioid peptides with subsequent activation of G
proteins that in turn alter membrane conductances of K + and Ca + and alter levels of second
messengers such as cAMP and inositol I ,4,5-trisphophate ( [ P3 ) (Uhl et a!. 1 994). OPRK I may
1 7 1
Chapter 6
play a role in arousal and regulation of autonomic and neuroendocrine functions, such as
immune response, signal transduction, G-protein coupled receptor protein signall ing, adenylate
cyclase inh ib it ing pathway, synaptic transmission, sensory perception and behaviour (Chefer et
al. 2005).
Systemic administration of K-agonists has been shown to i ncrease food intake in rodents,
rabbits, pigs and humans ( Baldwin et af. 1 990, Bodnar 2004, lackson and Cooper 1 985, S ipols
et af. 2002). B lockade of opioid receptors, by ventricular administration of K-antagonists,
decreased food intake induced by a number stimul i including neuropeptide Y (NPY) and agouti
related protein ( AgRP), glucose deprivation, food deprivation and offering a high fat diet
(Arjune and Bodnar 1 990, Barton et af. 1 996, Bodnar 2004, Brugman et af. 2002, Israel et al.
2005, Kotz et af. 1 993, Levine et af. 1 990, S ilva et al. 2002b). In addition,
intracerebroventricular ( ICV) administration of insulin in rats abolished the doubl ing of feed
intake caused by K-opioid receptor agonist administration (Sipols et al. 2002) . This evidence
suggests that the K-opioid receptor is involved in mediation of food intake and possibly involved
in increased food intake associated with energy needs.
Treatment of lactating rats with opioid antagonists resulted in a smal l reduction in spontaneous
nocturnal food intake in one study and no change in feed intake in another study compared with
controls (Kim et al. 1 997, Wager-Srdar et al. 1 985) . OPRK I is a receptor for dynorphin, a type
of opioid peptide. mRNA concentrations of prodynorphin were signifi cantly lower in the
arcuate nucleus (ARC) of lactating rats compared with non-lactating control rats (Kim et af.
1 997) . The large energy demands experienced due to the onset copious milk synthesis and
secretion was l ikened to the animal being chronically food restricted (Kim et af. 1 997) .
Evidence for this is shown by the significantly higher NPY concentrations in the para ventricular
nucleus ( PVN) of rats subjected to a 48 hour fast, or the ARC in lactating rats, compared with
control rats ( Kotz et al. 1 997, Lambert et al. 1 994, Smith 1 993) . [n addition, the lower
prodynorphin concentrations during lactation were consistent with a previous study in which
food intake was either chronically restricted by 10 to 40% or when food deprivation was
1 72
Candidate genes on chromosome 14
imposed for 48 hours resulting in significantly decreased prodynorphin mRNA concentrations
in the ARC (Kim et al. 1 996) .
Conversely, other studies have shown prodynorphin mRNA and dynorphin increase in certain
brain regions in response to lactation and food restriction. A study in rats showed the mRNA
concentrations of prodynorphin in the PVN and the supraoptic nucleus in the hypothalamus
increased during lactation compared with non-lactating rats ( Lightman and Young 1 987) .
Chronic food restriction in rats produced an increase in dynorphin A I _ 1 7 in three regions, al l
components of the medial hypothalamus and increased prodynorphin mRNA concentrations in
the central amygdale and the lateral hypothalamus ( Berman et al. 1 994, Berman et al. 1 997) .
Furthermore, injection of dynorphin into the ventral medial hypothalamus increased food intake
in non-food-deprived rats (Gosnell et al. 1 986) . The effect of medial hypothalamic dynorphin is
l ikely to be mediated by K-receptors as this region of the brain has dense K-receptor binding and
virtua l ly no 11- or b-receptor binding (Mansour et al. 1 987) . Further evidence for the
involvement of K-receptors was provided in an experiment in which consumption of a high-fat
diet was reduced, compared with controls, in rats fasted for 20 hours when a K-receptor
antagonist was injected into the lateral cerebral ventricle immediately prior to the introduction
of food (Barton et af. 1 996).
Thus, opioid peptide and mRNA response to food deprivation and lactation are highly variable.
This variabi l i ty is influenced by the brain site examined, duration of feed restriction, time of
sampl ing (due to strong circadian rhythms), and time since last meal ( Kim et al. 1 996).
Although the aforementioned results are inconsistent, there is a considerable body of evidence
indicat ing that opioid peptides and their receptors are involved in the control of food intake. In
particular, dynorphin peptide and mRNA concentrations change in response to food restriction
and lactation. Since K-receptors have been shown to be the primary receptor mediating the
effects of dynorphin on feed intake ( Si lva et al. 2002a, S i lva et al. 2002b) it is possible that
expression of the OPRK I gene is important in the control of food intake. Given that opioids
and their receptors are l ikely to influence food intake, it seems possible that the increase in food
1 73
Chapter 6
intake in dairy cows, which occurs steadi ly over early lactation ( Bauman and Currie 1 980,
I ngvartsen and Andersen 2000, Moussavi et af. 2007, Sutter and Beever 2000), may involve the
opioid system. Thus, OPRK I may have an effect on the first 60 days mi lk production and
baseline IGF- I QTL through its affects on food intake.
One further consideration for a role of OPRK I in early lactation is its role in regulating
prolactin secretion. Agonist activation of K-receptor stimulates prolactin secretion ( Krulich et
af. 1 986). I n addition, administration of K- and fl-receptor antagonists prevent the nocturnal
plasma prolactin surge that occurs during early pregnancy, the ante-partum prolactin surge and
the prolactin surge that occurs in response to suckl ing during lactation ( Andrews and Grattan
2003 , Baumann and Rabii 1 99 1 ) . It has been suggested that prolactin secretion during
pregnancy and l actation is enhanced by opioid-mediated i nhibition of tuberoinfundibular
dopamine (TIDA) neurones (TIDA neurons are the predominant source of dopamine which acts
to inhibit prolactin secretion) acting at the K- and fl-receptors (Andrews and Grattan 2003) . This
may be important with respect to the 60 day milk production QTL in this region. Cows treated
with 2-Br-a-ergokryptin during the periparturient period had reduced basal serum prolactin and
the normal prolactin surges that occur at parturition and milking were blocked resulting in a
considerable reduction in mi lk production during the first 1 0 days of lactation (Akers et al.
1 98 1 ). in addition, prolactin promotes milk protein gene expression including the casein gene
in mammary t issue (Yang et af. 2000), and is l ikely to be involved in mammary cell
prol iferation (Akers 2006) . Thus, OPRK I may p lay a role in lactation through increasing food
intake and regulating prolactin secretion.
Proenkephalin (PENK)
Proenkephal in belongs to the opioid neuropeptide precursor family. Proenkephalin is the
precursor peptide of enkephali ns, a type of opioid peptide, and contains four copies of
methionine-enkephal in (met-en kephal in) and s ingle copies of leucine-enkephalin ( Ieu
enkephal in) , ME-Arg-Gly-Leu ( ME-RGL) and ME-Arg-Phe (Nod a et af. 1 982) . Met- and leu
enkephalins play a role in a number of physiological functions, including pain perception and
1 74
Candidate genes on chromosome 14
response to stress, however only those which were considered relevant to the QTL in the
region of interest are included here. Enkephal ins act predominantly at f.l.- and 8-opioid receptors
(Clarke et al. 2003, Krulich et at. 1 986) . Enkephalin-containing neurons are located in many
regions of the brain including a number of nuclei in the hypothalamus (Bai le et at. 1 987, Zamir
et at. 1 985) .
A number of experiments have investigated a possible role for PE K in the regulation of food
intake. In one experiment chronically restricted food intake in rats caused decreased PENK
mRNA levels in the ARC in comparison with the levels in ad libitum fed controls and there was
a correlation between body weight change and mR A levels of PENK (r = 0.455, P = 0.0028) .
(Kim et at. 1 996). However, food deprivation for 48 hours d id not affect PENK mRNA
expression (Kim et at. 1 996). Administration of a 8-opioid receptor antagonist into the lateral
ventricle of the brain blocked the anticipated increase in food intake fol lowing treatment with a
free fatty acid oxidation inhibitor (Stein et al. 2000), thus supports the findings of Kim et at.
( 1 996) . In contrast, PENK mRNA tended to be down-regulated in the striatum of rats that had
recently consumed a mcal and up-regulated in rats that were denied food during their normal
feeding period (Wi l l et at. 2007 ) . This pattem was observed regardless of whether the rats had
been kept on a chron ic food restricted diet or not, leading these authors to suggest that PENK
may be involved in immediate aspects of food consumption and short-term satiety (Will et al.
2007). Food intake was inhibited by ICY injection of leu-enkephalin in sheep leading to the
suggestion that 8 agonists suppress feed intake ( 8aile et at. 1 987) . In addition, insulin
deficiency caused by alloxan injection resulted in decreased met-enkephalin in both the anterior
and neuro-intermediate lobes of the pituitary (Tang 1 99 1 ) , which may suggest that PENK has
some involvement in energy homeostasis.
Enkephal ins were decreased in the paraventricular ( PYN) and ventromedial (YMH) nuclei of
the hypothalamus in chronically food-restricted sheep. The VMH is important in the central
satiety response and regulation of energy expenditure, thus alterat ions in PENK cxpression in
the YMH may be directly involved in appetite and energy homeostasis (Henry et al. 2000).
1 75
Chapter 6
Two experiments were conducted in adult Corriedale ewes, using the same animal treatment
protocol, in which one treatment group were fed to maintain a body weight of 60 kg (FAT) and
the other to maintain a body weight of around 38 kg ( LEAN) ( Henry et at. 2000, Igbal et at.
2005 ). In one of these experiments enkephal in expression was increased in the periventricular
nucleus (Pe V) of the hypothalamus in LEAN compared with FAT treatment ewes. In the other
experiment somatostatin immunoreactive cells immunostained for PENK, which indicated co
expression between PENK and somatostatin (Henry et at. 2000, Igbal et at. 2005 ). Although
the relationship is not yet clear, the co-expression of PENK and somatostatin in the PeV is
suggestive of an association between these peptides. Thus, PENK may play a role in the control
of GH secretion ( lgbal et at. 2005), which shows a dramatic increase in circulating
concentrations in dairy cows in early lactation (Ronge et al. 1 988, Vicini et al. 1 99 1 ) .
A number of experiments have demonstrated that PEN K mRNA expression increased, in certain
regions of the hypothalamus, preoptic regions and nucleus accumbens, in lactating compared
w ith non-lactating rats, mice and sheep (Broad et al. 1 993, Gammie et af. 2005, Ottinger et al.
1 995, White and McKelvy 1 986, Xiao et at. 2005). Morphine interacts preferentially with Il
opioid receptors and has been shown to stimulate release of prolactin and growth hormone
( Krul ich et at. 1 986). Thus, the increase in PENK mRNA expression in lactating animals and
the resulting increase in enkephalin neuropeptides may be involved in the regulation of prolactin
and growth hormone, which fits well with the co-local i sation of PENK and somatostatin
immunoreactive cells in the PeV, d iscussed previously (Ottinger et al. 1 995, White and
McKelvy 1 986). Contradictory to other studies, Kim et af. ( 1 997) reported that mRNA levels
of PENK were lower in the ARC of lactating rats than in post-lactating rats.
An experiment in lactating rats demonstrated that prolactin provided the primary regulatory
influence for the suckling-induced increase in proenkephalin gene expression specific to the
hypothalamic nuclei (Nahi and Arbogast 2003), while blockade of Il- and K-opioid receptors
prevented prolactin sccrction in response to suckl ing (Andrews and Grattan 2003, Baumann and
Rabi i 1 99 1 ) . Another experiment in rats showed that during lactation there is a significant up-
1 76
Candidate genes on chromosome 14
regulation of enkephalin immunoreactivity and mRNA in the TIDA neurons (pagc 1 74)
compared with male rats and cycl ing female rats (Merchenthaler 1 993) . The increased
enkephal in in the TIDA neurons in lactating animals may cause the reduced act ivity of TIDA
neurons observed during lactation (Andrews and Grattan 2003, Merchenthaler 1 993, Xiao et af.
2005), and the concomitant decrease in dopamine activity with suckl ing-induced prolactin
secretion.
The exact role of the opioid system in the control of food intake remains uncertain. An
experiment i n sheep demonstrated that regions of the hypothalamus vary in their enkephalin
response to underfeeding. Enkephalin increased in some regions and decreased in others in
response to the animals being maintained at a l ive weight 40% less than controls (Henry et al.
2000). This may explain why some experiments find increases and others find decreases in
PENK in various regions of the brain in response to changes in food intake and as a result of
lactation. In addition, experiments may not be comparable i f the lactating animals are in
different energy balance or on different planes of nutrition. Given the large number of different
regions in the brain that PE K and its opioid receptors are expressed in, it is l ikely their role
encompasses a number of aspects of ingestion behaviour and interactions with hypothalamic
peptides, thus the opioid system may play a role in long-term regulation of energy balance
(Brugman et al. 2002 ).
There are several potential roles for PE K in lactation. As already mentioned, PENK appears
to be involved in prolactin and GH release (Broad et al. 1 993, Henry et al. 2000, Iqbal et al.
2005, Nahi and Arbogast 2003, Ottinger et al. 1 995, White and McKelvy 1 986). The
importance of prolactin during lactation was discussed on page 1 74. In high-producing dairy
cows blood concentrat ions of GH increase dramatically around the t ime of onset of lactation
(Accorsi et at. 2005, Kobayashi et at. 1 999b, Kunz et al. 1 985) . The increase in circulating GH
concentration plays an important role in partit ioning nutrients towards the mammary gland by
increasing l ipolysis, decreasing l ipogenesis, increas ing gluconeogenesis, impairing the actions
of insulin and increasing cardiac output and b lood flow to the mammary gland ( Borland et al.
1 77
Chapter 6
1 994, Davis et af. 1 988, Etherton and Bauman 1 998, Houseknecht and Bauman 1 997, Knapp et
at. 1 992, Rose et at. 1 996, Sechen et at. 1 990, Vernon 1 982, Vernon and F in\ey 1 988, Watt et
at. 1 99 1 ) . Dairy cows that have been selected for high mi lk production, and have a greater
measured milk production, have higher plasma GH concentrations than unselected or control
animals (Barnes et at. 1 985, Kazmer et at. 1 986, Lukes et at. 1 989, Roche et af. 2006b, Sartin et
af. 1 988, Weber et af. 2007) . Associations between milk yield and plasma concentrations of
GH, both between cows and throughout lactation, indicates a lactotrophic effect of this hormone
in cattle (Hart et at. 1 978, Llwendahl et at. 1 99 1 a) .
Food intake increases progressively for the first 8- 1 2 weeks of lactation in the dairy cow
( Bauman and Currie 1 980, Kokkonen et al. 2002, Kunz et af. 1 985, Ordway et af. 2002) . I n
general, increase in food intake i s relatively slow in relation t o the increase i n observed milk
yield ( Bauman and Currie 1 980, Friggens et al. 1 998) . Adaptation in feed intake i s an important
component in the regulation of nutrient partitioning occurring in an integrated manner with the
alterations in other processes during early lactation (Bauman et al. 1 985). The rate and extent of
increase in feed intake is highly variable between lactating cows ( lngvartsen and Andersen
2000) . Experiments have found that dry matter intake is greater in cows with high genetic merit
for mi lk production and higher actual milk production compared with low or medium genetic
merit cows (Bryant and Trigg 1 98 1 , Kennedy et al. 2003, Roche et al. 2006b, Yan et al. 2006).
Consequently, the action of PENK in the control of food intake may be important in relation to
lactation. Differences in the abi l ity of animals to increase food intake at the onset of lactation
may be a factor influencing differences between animals in their abi l i ty to produce milk.
PENK may be an excellent candidate gene for the QTL in the region of interest due to its
possible functions in both control of food intake and secretion of hormones that are important to
lactation. This gene may play a key role in co-ordinating the physiological changes that must
occur at the onset of lactation.
1 78

Candidate genes on chromosome 14
Corticotropin releasing hormone (CRH)
Corticotropin-releasing hormone (CRH) is a 4 1 -amino acid peptide and was first isolated from
ovine hypothalamic extracts in 1 98 1 (Yale et al. 1 98 1 ) and is synthesised in the parvocellular
neurons of the paraventricular nucleus ( PYN ) of the hypothalamus (Carrol l et al. 2007) . It i s an
important ACTH secretagogue and is the major hypothalamic activator of the hypothalamo
pituitary-adrenal ( HPA) axis during basal and stressful condit ions (Mastorakos and Zapanti
2004, Watts 2005, White 2006) .
CRH is secreted from the CRH neuroendocrine terminals in the median eminence and travel via
the hypophysial portal vasculature to the p ituitary. In the anterior pituitary i t binds to the type I
CRH receptor on the corticotrophs and st imulates adenylate cyclase activity increasing cAMP
levels (Carrol l et al. 2007, Majzoub 2006, Watts 2005) . The result is the secretion of preformed
ACTH and other pro-opiomelanocortin ( POMC)-derived peptides whi le simultaneously
stimulating POMC gene transcription, peptide synthesis and post-translational processing
(Mastorakos and Zapanti 2004, White 2006) . ACTH stimulates the adrenal gland to synthesise
and secrete progesterone, androgen and glucocorticoids (Carrol l et al. 2007) . Glucocorticoids
exert diverse affects on target ti ssues to mobi lise energy for the body to deal with the stressor
(Yao and Denver 2007) .
CRH mRNA and the peptide synthesised from it are widely expressed throughout the CNS ( in
the hypothalamus and other regions) and in peripheral tissues, such as the adrenal gland, spleen
heart and placenta, suggesting that CRH has wide ranging actions ( Richard et af. 2002, Yao and
Denver 2007). CRH has a number of other neuroendocrine actions, including the modulation of
GnRH secretion in the hypothalamus to suppress reproductive hormone secretion (CaJogero et
af. 2002 ), and it is also involved in i nduction of inflammatory response and other aspects of the
immune system (Zoumakis et af. 2006).
An acute infusion of CRH into the third ventricle of rats or an ICY infusion into sheep caused a
decrease in food intake (Arase et al. 1 988, Ruckebusch and Malbert 1 986). Chronic CRH
1 79
Chapter 6
infusion caused a prolonged and steady decline in body weight, while thermogenesis was
increased under both treatment regimes (Arase et al. 1 988) . CRH gene expression and peptide
synthesis in the rat hypothalamus were increased by ICV administration of leptin. Leptin is
prcdominantly secreted by white adipose t issue, circulating concentrations are positively
correlated with percent body fat (Rosen and Spiegelman 2006, Trayhurn and B ing 2006) .
Increased plasma leptin in response to food intake or increased adiposity is a key s ignal that
decreases food intake and increases energy expenditure by acting on specific receptors in the
hypothalamus (Okamoto et of. 200 I , Rosen and Spiegelman 2006). Leptin action to decrease
food intake was partially blocked by either CRH receptor anatagonists or an anti-CRH antibody
(Gardner et of. 1 998, Gotoh et of. 2005, Okamoto et of. 200 I , Uehara et of. 1 998) . ICV
administration of a melanocortin receptor agonist, into freely moving rats, increased CRH
mRNA expression in the PVN and the suppressive effect of the melanocortin receptor agonist
on food intake was impaired by a CRH receptor antatgonist ( Lu et of. 2003 ) . These findings
suggest that CRH in the PVN is thc downstream mediator of both leptin and melanocortin
signal l ing (Shimizu et af. 2007) . It has also been postulated that prolactin-releasing peptide
may e l icit anorectic effects partly through CRH neurons ( Lawrence et 01. 2004) .
A few studies have investigated the role of the H PA axis in lactation in the dairy cow. One
study found that a high level of milk production and the concomitant negative energy balance
were associated with greater pituitary ( re)activity ( increased baseline ACTH concentrations and
response to CRH ) and decreased adrenocortical reactivity ( cortisol responses to ACTH)
compared with cows that were low producers ( Beerda et af. 2004). Baseline plasma ACTH
concentrations were significantly h igher in early lactation than in the 2 weeks before calving
( Beerda et af. 2004) . The CRH-induced ACTH response was negatively correlated with plasma
glucose concentrations (Beerda et af. 2004). Another experiment in dairy cows showed that
milk, non-fat sol ids and milk fat solids yields were higher in cows being fed 5 or 1 0 Ilg of a
synthetic glucocorticoid than animals fed 0 or 20 Ilg of a synthetic glucocorticoid (Swanson and
Lind 1 976). This suggests there is an optimal range of endogenous corticosteroid production
1 80
Candidate genes on chromosome 14
that will assist in maximising lactation potential ( Holmes et at. 2002). Corticosteroids may
affect the availabil ity of nutrients to the mammary gland, they drive protein degradation,
decrease protein synthesis and inhibit glucose uptake by skeletal muscle in addition to
promoting hepatic gluconeogenesis (Vegiopoulos and Herzig 2007). However, experiments in
lactating rats have demonstrated a possible uncoupl ing of the HP A axis from adrenocortical
activity, that i s, ACTH does not appear to be responsible for the high circulating concentrations
of cortisol as both ACTH concentration and C RH mRNA were low during lactation (Fischer et
al. 1 995) . I t is uncertain if CRH, in its role as the major activator of the H P A-axis, has an
influence on the control of lactation.
Plasma concentrations of leptin in dairy cows were reduced around the time of parturition and
coincided with increased use of endogenous l ipids as an energy source but occurred prior to
significant depletion of white adipose tissue ( B lock et at. 200 1 , Leury et at. 2003 ). The onset of
negative energy balance appears to be partly responsible for the lower concentration of plasma
leptin in early lactating dairy cows ( Block el at. 200 I ). As mentioned previously, central ly
administered leptin causes an increase in CRH, while CRH receptor antagonists partially block
the action of leptin in decreasing food intake (Gardner el at. 1 998, Gotoh et at. 2005, Okamoto
et at. 200 I , Uehara et at. 1 998) . In addition, experiments in lactating rats have demonstrated
that throughout lactation C RH gene transcript levels in the hypothalamus were significantly
lower than that measured in control virgin cycl ing rats ( Fischer et at. 1 995 ). Thus, the decrease
in circulating leptin at the onset of lactation may enhance appetite and food intake partly
through the CRH pathway. Perhaps dairy cows that have a greater down-regulation of the CRH
gene in response to decreased leptin concentrations are able to increase food intake more
readily. Greater food intake would result in a greater supply of nutrients for milk production,
thus may influence the 60 day lactation yield QTLs identified in the region of i nterest in the
current study.
1 8 1
Chapter 6
��---- ------
Neuropeptides BIW receptor 1 (NPBWRl)
NPBWR l (neuropeptide BIW receptor I ) i s a G protein-coupled receptor, which was originally
identified by cloning of opioid-somatotropin- l ike receptor genes from human genomic DNA
(O'Dowd et 01. 1 995, Schulz et al. 2007). Recently, two peptides named neuropeptide W
(NPW) and neuropeptide B (NPB) were identified as the endogenous l igands for NPBWR l
(Shimomura et of. 2002, Tanaka et of. 2003 ) . RT-PCR analysis of a number of human tissues
showed a predominant central nervous system (CNS) distribution ofNPBWR I mRNA
( Brezi l lon et 01. 2003 ) . In situ hybridisation showed h igh expression of NPBWR l mRNA in
various nuclei of the amygdaloid ( located at the tail end of the caudate nucleus of the l imbic
system) and hypothalamus ( Lee et al. 1 999) . Neuronal activation after ICV NPW injection was
detected mainly in the hypothalamic nuclei, thalamus and brain stem ( Levine et al. 2005).
There was dense expression ofNPBWR l mRNA in the VMH, PVN and dorsomedial nuclei of
the hypothalamus, a l l of which are strongly associated with modulation of feeding behaviour
and metabol ic disorders ( Lee et 01. 1 999, S ingh and Davenport 2006) .
Physiological studies have shown that ICV o r PVN administration ofNPW into male rats
caused a significant increase in short term food intake compared to controls (Baker et af. 2003,
Levine et of. 2005, Shimomura et of. 2002) . In contrast, NPW administration decreased feeding
at the 24-hour time point and suppressed fasting induced food intake ( Levine et al. 200S,
Mondal et at. 2003). In mice, ICV administration of NPB caused an initial short term
orexigenic effect foJlowed by a more marked anorexic effect ofNPB after 2 hours of ICV
injection (Tanaka et of. 2003) . Chronic ICV infusion of NPW for five days caused a persistent
decrease in food intake and suppressed body weight gain, while body temperature, oxygen
consumption and heat production were increased compared with saline-infused controls,
suggesting NPW increases energy expenditure (Mondal et of. 2003) . This is consistent with the
findings that NPW suppresses food intake, ICV administration of anti-NPW IgG stimulated
feeding (Mondal et al. 2003 ) .
1 82
Candidate genes on chromosome 14
Rat NPB WR I mRNA is expressed in the stomach and intestine (Tanaka et af. 2003 ) . NPW
immunoreactive endocrine cells were abundant in the mucosal layer of the antrum in the rat,
mouse and human stomachs ( Mondal et al. 2006). Plasma NPW concentration of the gastric
antrum decreased upon fasting and increased after re-feeding (Mondal et al. 2006) findings
which as consistent with the hypothesis that NPW acts as a suppressant to feeding.
Male mice, with a targeted disruption of the gene encoding NPBWR I (NPBWRI -n, displayed
a moderate, adult onset obesity, caused by increased food i ntake and decreased energy
expenditure ( Ishii et al. 2003) . At 52 weeks of age NPBWR I -r mjce had increased plasma
concentrations of glucose, insul in and leptin compared with wild type mjce. Leptin
concentrations were disproportionately high for the degree of adiposity. Hypothalamic NPY
RNA levels were decreased and POMC RNA levels were increased in NPBWR I -r compared
with wild type mice, which is indicative of an underfed state ( Ishii et af. 2003 ). Further
investigation showed the mechanism of obesity was independent of leptin and melanocortin
signa l l ing ( Ishii et af. 2003). The differences between NPBWRI -r and wild-type mice were
only displayed in malc mice.
ICV administration of NPW elevated plasma concentrations of prolactin and corticosterone and
suppressed p lasma growth hormone concentrations (Baker et al. 2003 ) . S ince these
neuroendocine changes are also seen as acute responses to stress, these authors hypothesised
NPW and NPB WR I are a necessary signal l ing system for the expression of the hypothalamic
response to stress (Baker et al. 2003 ). Results of a further study indicated that the receptors
encoded by NPBWR I are present on cel ls in the parvocel lular PYN nucleus and perhaps on
CRH-producing neurons in the nucleus (Taylor et af. 2005) . Therefore, the central role of NPW
to activate the hypothalamic-pituitary-adrenal axis is mediated by increased act ivity of CRH
neurons (Taylor et al. 2005) . Intraperitoneal injection of NPB into rats was found to increase
p lasma concentrations of thyroxine (T4), parathyroid hormone (PTH), corticosterone and
testosterone, while NPW increased plasma concentrations of ACTH, PTH, corticosterone,
testosterone and oestradiol ( Hochol et al. 2006).
1 83
Chapter 6
As already discussed, food intake is an important factor in influencing milk yield. Cows that eat
more produce more mi lk. The NPBWR I gene encodes a receptor that mediates the actions of
two peptides, NPW and NPB (O'Dowd et al. 1 995 , Schulz et at. 2007, Shimomura et at. 2002,
Tanaka et al. 2003 ) . A number of studies have investigated the effects of NPW and the current
view is that this peptide decreases food intake and increases energy expenditure ( Levine et at.
2005, Mondal et at. 2003, Tanaka et at. 2003 ) . It is possible that the NPBWR I gene is down
regulated during early lactation, which would reduce the suppressive affects ofNPW on food
intake enabl ing food intake to increase in response to the increase in nutrient demand caused by
the onset of lactation. A major challenge to the hypothesis that NPBWR I influences food
intake in response to lactation is that the effects on energy homeostasis have only been
demonstrated in males, females did not show significant effects of NPBWR I knockout ( lshi i et
at. 2003. Experiments would need to be conducted in dairy cows to estab l ish if NPBWR I does
have an effect in bovine females.
Summary
Four genes were discussed in this section due to their possible functions in some aspect of food
intake control . Results of a study in which cows were fed a predominantly pasture diet showed
that cows with simi lar metabolisable energy required for production had very different energy
balances. The authors suggested that there was potential for selection of cows in early lactation
to maximise intake to meet the energetic demands of production, therefore, minimise rel iance
on body reserves (Clark et at. 2005) . A number of experiments have reported higher dry matter
intake in h igh compared with low genetic merit cows (Kennedy et at. 2003, Kolver et al. 2005,
Linnane et at. 2004, Roche et al. 2006b) . The QTL in the region of interest are for milk, protein
and lactose yields in the first 60 days of lactation and baseline IGF-I concentration . Opioid
receptor, kappa I (OPRK I ), proenkephalin ( PENK), corticotropin releasing hormone (CRH)
were considered the most suitable candidates due to their roles in control of food intake because
the increase in nutrient requirements that accompanies the onset of lactation plays crucial rol e in
greater milk production. The presence of the IGF-I QTL in this region also seems to fit with
1 84
Candidate genes on chromosome 14
this hypothesis due to p lasma concentrations of IGF-I being an indicator of feed intake, energy
balance and efficiency of feed uti l isation (section 6.2) . In addition, a positive relationship
between plasma IGF-I concentration and energy balance has been reported in l actating dairy
cows (Cisse et al. 1 99 1 , Ronge et al. 1 988, Spicer et al. 1 990).
6.7 Summary
A number of the genes discussed above have not previously been related to mi lk production in
the l iterature. Each gene was reported to have multiple functions therefore they may affect mi lk
production as wel l as other physiological processes. Recent research suggests that no one gene
is responsible for a complex trait, such as the chal lenge response and milk production traits
investigated in the study. Complex traits may be emergent properties of highly interconnected
molecular networks that are modulated by many genes (Chen et at. 2008) . The milk production
and metabol ic phenotypes identified in thi study are l ikely to be the measurable outcomes of
integrated metabolic processes control led by hundreds or possibly thousands of genes. Thus, i t
is possible that that expression of a number of genes were up or down regulated in the region of
interest to influence the QTL mapped to this region.
Some genes discussed in this study had a suggested function based on sequence similarity with
a gene in another species. However, sequence similarity does not necessarily result in
functional similarity. In addition, comparative map information was used to predict the genes in
the region of interest. It is l ikely there would be differences between the l ist of genes generated
in the current study using comparative mapping and a l i st of genes for the same region
generated using the bovine gene map that is now being assembled. Furthermore, new
information about genes and gene function becomes avai lable dai ly in databases or in journal
publications. Therefore, it is l ikely that new information wi l l enable some of the candidate
genes discussed in this study to be e l iminated and identification of other candidate genes for the
QTL in the region of interest.
1 85
Chapter 6
The candidate genes discussed in this chapter have been considered for their relevance to mi lk
production and metabolic QTL. Further work could investigate the relevance of these genes to
other traits of importance such as reproductive performance. For example, the musculin gene
may have a role in the poor reproductive performance of some h igh producing dairy cows. If
musculin expression was up-regulated during early lactation decreasing protein synthesis in
skeletal muscle, this could have a negative impact on blastocyst development as a mouse model
showed over expression of muscul in is lethal to early mouse embryos (Yu et al. 2003 ) .
Due to the very detai led investigation conducted into the region of interest on BT A 14 it was not
feasible to investigate more than one region on one chromosome. Many chromosomal regions
that were strongly associated with certain QTL were identified (Chapter 5 ) . These interesting
chromosomal regions should be investigated in future research.
1 86

CHAPTER 7
General Discussion

Chapter 7
The focus of the research described in this thesis was to investigate ways to improve the capture
of the genetic potential for milk production and increase the rate of genetic gain in dairy cattle
above that which is achieved using current methods of animal evaluation (Chapter 2 ) .
The onset of copious milk synthesis and secretion is accompanied by changes in physiology that
partition nutrients towards mi lk production. Numerous studies have examined concentrations of
metabol i tes and hormones under a number of experimentally induced challenge conditions in
dairy cattle. The objective was to determine physiological markers that could be measured in
calves of both sexes to identify animals of superior genetic merit for m i lk production traits
(Wool l iams and L0vendahl 1 99 1 ) . However, very few studies have reported the selection of
animals based on physiological traits (Chapter 2 ) . Thus, attempts to identify physiological
indicator traits that could be used to select high genetic merit animals of both sexes, for mi lk
production traits at an early age were not successful . Despite this, hormones and the
physiological pathways they influence are vital for dctcrmining variabi l ity between animals in
their abil ity to produce milk. Determining genetic markers for these physiological traits could
avoid the influence of environmental effects and therefore provide a more accurate means of
indirectly selecting animals with superior genetic merit for milk production.
The current study combined previously used challenge methodology with the more recent QTL
mapping technology. The intention was discover QTL that are associated with genes that
underl ie some of the important metabolic pathways involved in milk production. The overal l
aim of this thesis was to explore the use of metabolic phenotypes as a means of improving the
rate of genetic gain in dairy cattle.
7.1 The challenges
The challenges were chosen i n an attempt to emulate aspects of metabolism that have important
roles in supplying nutrients for lactation. The individual chal lenges selected were deemed the
most promising based on current understanding of the biology of the dairy cow and the
experience of others reported in the l iterature. The adrenaline chal lenge was used because the
1 88
General discussion
responses were expected to provide information on thc animals ability to mobi l ise
triacylglycerol from adipose tissue and glycogen from the l iver. Mobil isation of l ip id reserves
may affect the abi l ity to sustain h igh levels of milk production in dairy cows, particularly during
early lactation when intake does not increase sufficiently to meet nutrient demands of lactation.
The glucose challenge was used because the response was expected to retlect that animals
abi l ity to control blood glucose concentrations and metabolise carbohydrates. Carbohydrate
metabol ism has a critical role in providing glucose for lactose synthesis in the lactating cow.
The TRH chal lenge was used because the responses were expected to retlect the control of
homlOnes important to energy homeostasis and mammary gland development. Responses to
metabolic challenges are confounded with energy balance if they are conducted during lactation.
Thus, challenges were conducted when the heifers were approximately 1 8-months old and in
early pregnancy to minimise the complications caused by lactation in interpreting physiological
data (Chapter 2) .
There was significant between-sire variation in al l the response variables measured, except for
NEF A rcsponse to the TRH challenge. This suggests that there is a genetic component to the
control of the metabol ic traits measured and provided confidence for continuing on to conduct
QTL mapping (Chapter 4) .
When conducting an experiment that involves the collection and processing of a large number
of samples from a large number of animals it is inevitable that a very large data set wil l be
generated. I t is essential that the logistics of col lecting these data a carefully p lanned and
processes are put in p lace to assess and maintain the integrity of the data. in addition, it is
essential that statistical checks are carried out to ensure systemic errors are identified and if
possible corrected prior to commencement of data analyses (Chapter 3 ) .
The decision to keep hei fers outdoors on pasture during the challenge closely simulated
standard management practices for dairy hei fers in New Zealand. However, this did introduce
variability between experimental groups in quantity and quality of feed as well as variabi l ity in
1 89

Chapter 7
environmental conditions (Chapter 4) . Thc cffect of environmental factors on response
variables could have been better accounted for in the statistical analyses if data on the quantity
and qual i ty of feed preceding the chal lenges and a complete set of local c l imatic conditions
during the chal lenges had been measured. These data should be col lected in future experiments.
Selection of appropriate response variables is vital for the detection of genetic differences and
therefore QTLs (Chapter 4 and Appendix E) . The metabolic phenotypes calculated from the
glucose chal lenge data gave an indication of sensitivity of the pancreas to glucose, the
sensitivity of the adipose tissues to insulin, and glucose clearance. The metabolic phenotypes
calculated from adrenal ine chal lenge data quantified the rate and quantity of NE FA and glycerol
released from adipose tissues and glycogen released from the l i ver. The metabol ic phenotypes
generated from the TRH challenge response variables provided an indication of the abil ity of the
heifers to release GH, prolactin and TSH into the circulation.
Although there were some minor problems with the data, these data are the definitive data set
for l 8-month-old, early gestation heifers. No other data set of this size and on this age of animal
has been reported. Thus, these data are an invaluable resource for meeting two objectives. The
first was for generating metabolic phenotypes that can be used for QTL searches for production
traits. The second was to obtain a deeper insight into the physiology and its genetic variabi l ity in
a group of animals in a similar physiological state, heifers in early gestation, and ascertain
whether these metabolic phenotypes were related to subsequent lactation performance. Thus,
while the pattern of the responses to the various challenges are consistent with those observed in
previous experiments (Kolver et at. 200 I , L0vendahl and Sejrsen 1 993, Mackenzie et al. 1 988,
Xing et af. 1 99 1 ) and with knowledge of basic physiology, the potential to correlate the
metabolic phenotypes to the genotype of such a l arge number of animals may be extremely
valuable.
1 90
General discussion
7.2 Mapping QTL
An init ial whole genome scan was conducted by genotyping 1 679 animals for 283 microsatel l ite
markers, obtained primari ly from published marker maps (Chapter 5 ) . 58 1 QTL were
signi ficant at the I % level and 275 of them were QTL of metabolic phenotypes (Appendix F) .
From the large number of metabol ic QTL i t is clear that the chal lenges conducted did perturb
the physiology of the animals in such a way that it al lowed control of metabolic processes to be
indicated at a genetic level . However, QTL for basel ine measurements were also identified,
thus, in these cases the system did not need to be perturbed.
There were a large number of clusters of simi lar QTL, either metabolic or milk production QTL,
that were co-located. Certain phenotypes were strongly associated with particular
chromosomes, for example c lusters of QTL for insulin response phenotypes were found on
chromosomes 9, 1 5, 1 8 and 25 . These regions deserve further investigation as they may
harbour important regulatory genes for energy metabol ism in the dairy cow. They may also
have impl ications for human health research, in particular relating to the insul in QTL and their
possible role in diabetes.
An objective of this study was to identify chromosomal regions where metabolic and milk
production QTL were co-located. I t was anticipated that these regions would contain genes that
had a significant impact on the control of milk production. However, a major finding of this
study was that there were very few chromosomal regions in which both metabolic and mi lk
production QTL were co-located (Chapter 5 ) . Thus, neither pleiotropy nor genetic l inkage
appeared to occur between metabolic and milk phenotypes for the majority of chromosomal
regions identified by the QTL mapping conducted in this study. Perhaps this is not a surprising
finding, given the difficulty in establishing consistent and repeatable physiological indicators of
mi lk production demonstrated in previous studies (Wool l iams and L0vendahl 1 99 1 ) .
The findings of the current study suggest that honnone and metabolite concentrations in heifers
during growth and gestation are not indicative of subsequent milk production at a phenotypic
1 9 1
Chapter 7
level. Thus, while some phenotypic corrcl ations calculated using data from the current study
were significant (P < 0.05) , they were al l low (R < 0. 1 5 ) (Appendix I ) . Furthermore, previous
reports have shown few phenotypic associations between mi lk yield and pre-partum or pre
pubertal plasma hormone and metabolite concentrations ( Lacasse et al. 1 994, Mantysaari et al.
1 999, Taylor et al. 2006) . The lack of a relationship between the metabol ic and milk production
phenotypes may be due to differences in physiological state of the animals when the phenotypes
were measured. The metabol ic phenotypes were measured in 1 8-month-old, early-gestation
heifers that were growing as well as pregnant (anabolic) , while the mi lk production phenotypes
were measured in lactating, mature animals ( catabol ic) . Further, it has been suggested that
maiden heifers and lactating cows may differ in the quantitative and qual i tative expression of
their genes because of the differences in their physiological state (Veerkamp et al. 2003) .
Genetic correlations between metabol ic and mi lk production phenotypes were not calculated in
the current study. However, these data would be suitable for calculating genetic correlations
and further research should include such calculations.
The control of gene expression i s highly complex and some aspect of control may be remote
from the gene of i nterest. Therefore, it is possib le that when clusters of metabol ic and milk
production QTL occur in distinct regions on the same chromosome, the genes underlying the
metabolic QTL may influence the genes underlying the milk production QTL by to long-range
regulation of gene expression (Chapter 5 ) . Co-regulation of genes on different chromosomes
also needs to be i nvestigated, for example, mi lk protein genes on different chromosomes may
share common control mechanisms (Oll ivier-Bousquet 2002) . Thus, long-range regulation of
gene expression wi l l need to be considered in future QTL studies ( Kleinj an and van Heyningen
2005) . Other types of analyses wi l l be needed to investigate the complex interactions and
networks that control gene expression and function.
7.3 Usefulness of metabolic challenges
It may be that the choice of chal lenges was not appropriate to locate chromosomal regions that
contain QTL for most of the mi lk production traits. A lternatively, i t may be that the concept
1 92

General discussion
that it is possiblc to detect milk production QTL by identifying metabo l ic phenotypes is wrong.
Confidence in the techniques used to identify QTL and their relationships with phenotypes in
the current study is warranted given that similar regions have been identified in other studies.
For example, in the current study milk fat percentage QTL were mapped to OcM on BTA I 4.
This chromosomal region, milk production QTL and the gene most l ikely responsible, DGA T I ,
have been reported previously (Grisart et al. 2002) . The DGAT I gene encodes the acyl
CoA:diacylglycerol acyltransferase I . This protein has a number of functions related to l ipid
physiology and in particular catalyses the attachment of the third fatty acid to complete
triacylglycerol formation (Cases et af. 1 998) . Adrenal ine causes l ipolysis, consequently an
adrenal ine chal lenge would not give an indication of triacylglycerol formation. The chal lenges
appl ied in this study were directed towards the control of metabolic process, which is also true
for most challenges reported in the l iterature (Chapter 2) . Measurement of hormones and
metabol ites in plasma samples are unl ikely to provide information of specific steps in
biochemical pathways. Therefore, the chal lenges chosen were not able to identify many of the
QTL for mi lk production. Nevertheless, the metabol ic phenotypes and QTL identified may sti l l
be useful, particularly for improving understanding of the control of metabolic processes.
At the commencement of this study a diagram was presented (Chapter 2) that attempted to
integrate physiological changes that support lactation. However, control of quantitative traits,
such as mi lk production, is by complex networks that are l ikely to be influenced by hundreds or
possibly thousands of genes ( Figure 7. 1 and Figure 7.2). Thus, understanding physiological
systems can not be achieved by consideration of a subset of metabolic pathways. Rather they
must be viewed as a complex set of integrated networks that control metabol ism. Metabolic
networks and the rapidly increasing genetic and biological information are too much for the
human brain to comprehend. As a result the discipl ine of computational biology has evolved
and numerous websites, such as KEGG (Kyoto Encyclopedia of Genes and Genomes) and
Ingenuity Pathways Analysis, have been developed. These websites mine genetic and
biological information in the l i terature and integrate it into a useable network form.
1 93
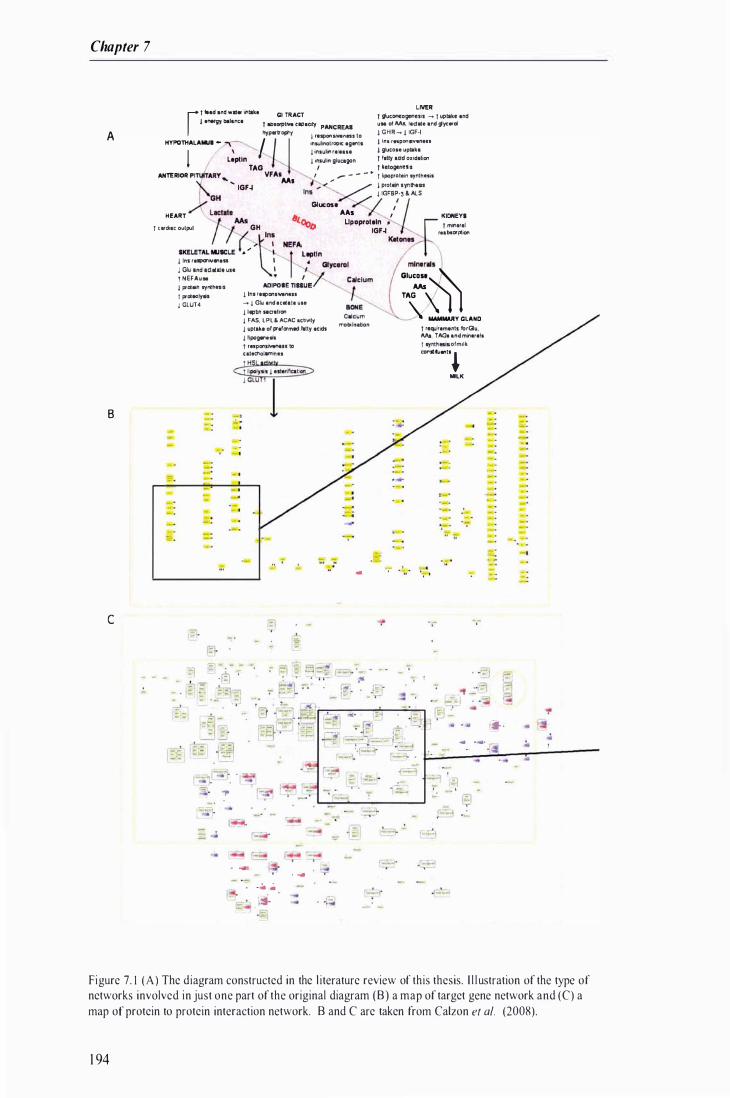
Chapter 7
A
B
c
Cl TRACT r t ... d and wat. ltltakl J energy bIIlanc. , absorptive cap.city PANCREAS hyp.'ophy 1 ruponm"n, to
inlUlrnotlopic .genl.
LMR , gluconeogenesis -- t uptake .nd 1,1 .. of Ms, I.dc. and �yc.rA J GHR- J IGF·I
HYPOTHALAMJI - � J Insulin r.l.as.
J in.ulin :gluClgon
I In. '"pc)I'1Iiv.neu J glucose uptllka
t fatty ICld oxidation
, t ketogennis
ANTERIO: Pit AllY L
�pt
ln
TAG VFAI , .... M. I .- - - _ .. f lipoprotein symh .. i.
IGF� GH
'" "'" � ./ I ptot.!n .ynltl.sis Ins "X / J IGFBP·3 l ALS
�UCOS. 'X " HEART
t ,.the output
J Ins r.IpCI\;""u,
J Glu .nd .et_li, use 1 NEFAu. l prat.n synth"is
t prat.oty ••
J GlUT4
.:. .
..
a Ails , GH
lOo� Upop
roJlln , 1nl IGF� . ; � NE
f
FA Lop
tln �� "J::)GJYCI"'I
, � CoIclum ADIPOSE n nUE �
J In. r.�anIJWn •• '
-- J GIY .nd u.tat. use
I llpbn sea.lron J FAS, lPl' ACAC activity J uptake of pr.formed fatty .cid, J lipogenUls T rnpan.1YeM1S to c.l.chollmln ..
BONE
mobilisation
KIDNEYS
, min.r.1 r .. bt:oq:iion
mlnorllll'J
:::=� � �Y CLAND t r'CJ.Iir.ment. forGlu, Ma, TAGs and min.,.I. t synth n •• ofmilk
"",,,;w"''', !ILK
. ....
=
':' -
;"J . r:J " : . [= .:-� = : '� ';'=1
[-• ..! , - ,-=. "!'
c · �
� - .-
liii-- �
-:] ,-
-. �
.,-
� �
-4 ..-fii -:='
.. .'
r� -�
. ....
. .
-� ',� . - ' -'
� ....
;.
- ,
Ij- . ,.
...
Figure 7. 1 (A) The diagram constructed in the l iterature review of this thesis. I l l ustration of the type of networks involved in just one part of the original diagram (8) a map of target gene network and (C) a map of protein to protein interaction network. 8 and C are taken from Calzon et al. (2008).
1 94

o
E
I - -
lc�m l ' I F1l1 1
GWl I
Sltl J I
_ 1 - _
General disclIssion
1
-.- .- .-
.- .-
.- .-
1 • • _ _ • • 1. _ _ _
c -
- - -
.., --:. - -= - ,. - ::-- - - . 1 - - -
-
- _ - _ --
- - - :.. - - -
- -
1
- -
- I� sO- � '-� -:_� -_-::� ' ::�-_:-� - •
1
- - -
1
- - - - :: : I = : .1
l _ _ _
1 _ . -
. 1
,. - : -
• - • 1 _ • _ _ , - - - I - - '1
I " - --
.
1 - _
Figure 7 .2 Enlarged images of the corresponding boxes on the network diagram presented in Figure 7 . 1 . (D) Map of target genes of E2F transcription factors. Each E2F associates with di fferent cofactors to acti vate or inhibit the transcription of many genes (ye l low boxes): pointed arrows mean activation, flat arrows mean inhibition. ( E) Map or protein to protein interaction network. Tumour suppressor proteins in blue, oncogenes in red and other proteins in green. Several proteins inside a box is a complex. Sol id circle to an arrow i s an association, double circle to an arrow is a disassociation, a l ine from a prote in or complex that ends in a circle is catalysis Taken from Calzon et at. (2008).
1 95
Chapter 7
It is sti l l feasible that the control of metabolic processes, which are themselves l ikely to be
controlled by numerous genes, are important factors influencing milk production. However,
they wi l l only comprise one part of a complex molecular network modulated by the expression
of many genes, therefore co-location of mi lk production and metabolic QTL would seem
unlikely. The original diagram of the control of lactation needs to be expanded to take into
account the complex nature of interactions that occur within a metabol ic network and the genes
that influence this network.
There are a vast number of proteins and control points associated with gene expression and
functions of gene products. These include transcription factors that either activate or repress
transcription, transcription co-regulators, RNA polymerase complexes, the spl ice variants
produced, microRNA, translation initiat ion factors, post-translational modifications and protein
to protein interactions (Calzon et al. 2008, Rosenfeld et al. 2006, Van Tassell et af. 2007, Vary
and Lynch 2007). It is through the use of molecular networks that a l l aspects of control can be
integrated to develop a more accurate understanding of the system (Calzon et al. 2008, Chen et
al. 2008) .
Perhaps there is sti l l a use for metabolic challenges in the future i f a more sophisticated
assessment of responses to the challenge could be used. Rather than measuring changes in
concentrations of metabolites and hormones in blood, gene expression could be measured in
various tissues such as the l iver and adipose tissue. Gene expression studies could then be
conducted on the same tissues from lactating animals al lowing the construction of co-expression
networks with the intention of finding causal relationships with milk production traits.
7.4 QTL and genomic selection
Marker assisted selection has been appl ied in some dairy cattle breeding schemes but to date has
only resulted in minor improvements in genetic gain (Spelman et af. 2007) . Difficulty in
developing rel iable and effective tests from QTL results was due to inadequate approaches to
finding quantitative trait nucleotides. These include fine mapping with l imited markers,
1 96
General discussion
comparative mapping, and candidate gene/marker associations (Van Tassel l et al. 2007) . I f
marker information from a sparse marker map were t o be included a s selection criteria i n an
outbreeding species, the l inkage phase between a marker and a QTL would have to be
estab l ished for every family in which the markers were to be used. Consequently, this type of
marker information is of l imited use ( Meuwissen et al. 200 1 ) . As a result of the above, the
promise of molecular i nformation in ruminant geneti c improvement schemes has not yet been
achieved.
Genetic marker technology has advanced dramatically since the commencement of this study.
The use of dense marker maps for genomic selection was first proposed in 200 I . It was
suggested that predicting breeding values using genomic information with a marker spacing of
I cM would enable an accuracy of selection of between 0. 73-0.85 ( Meuwissen et al. 200 I ) .
Since that time, sequencing of the bovine genome has been completed, which has resultcd in a
large number of single nucleotide polymorphisms (SNP) being placed in the public domain.
This combined with the considerably lower cost of conducting SNP genotyping compared with
genotyping using microsatel l ite markers wi l l result in a dramatic increase in the uti l isation of
genetic markers for breeding schemes (Spelman et al. 2007) .
A 7,500 SNP chip is now available for the Holstein-Friesian by Jersey crossbred cows used in
the current study and a genomic selection experiment with 3000 bulls using a 60,000 SNP chip
i currently being conducted (Spelman et al. 2007) . These maps wil l enable vastly greater
power in identifying QTL than the 283 microsatellite marker map used in the current study.
Therefore, the metabolic phenotypes derived in this study need to be re-run against the new
SNP chip data to obtain more accurate QTL locat ions.
As the density of the SNP maps continue to increase the power of the studies wi l l also continue
to increase and identification of markers for desirable phenotypes wi l l be possible with very
sma l l numbers of animals. Technically it wi l l be possible to have a complete genome sequence
of every individual animal . The l imitation wi l l then become the abil ity of the scientists dea ling
1 97
Chapter 7
with these vast amounts of data to envisage ways in which to effect ively use the information. It
is anticipated that in the New Zealand situation, SNP chips will be used to screen animal s. The
most l ikely cohort to be screened wi l l be bul l calves born from artificial i nsemination.
Providing the accuracy of selection using the SNP is moderate, the rate of genetic gain may be
increased by 75-80% due to increased selection intensity and decreased generation interval
(Spelman et al. 2007). In time, formal progeny testing of young bul ls may disappear due to the
expense associated with this process. However, bulls wil l be retrospectively progeny tested
when their daughters are mi lked in commercial herds, providing an accurate animal
ident ification and herd testing system remains in p lace.
An exc it ing new era in animal genetic improvement is about to commence due to the
appl ication of SNP markers. The use of SNP associations does not require knowledge of the
genes being selected for. This raises the question of whether there is a need to know the genes
and their functions that underl ie traits of interest. Current methods of animal evaluation and
selection have resulted in rates of genetic gain of about I % of the trait mcan pcr ycar. Such
slow rates of change are l ikely to allow the population to balance genetic gains in the traits of
economic importance with natural selection on the traits that affect the general wel lbeing of the
an imals. If more intense selection is placed on economic traits through the use of SNP chips, i t
may be that balancing selection wi l l not have the opportunity to work on important (but
undefined) adaptive traits. For example, if some of the genes identified in Chapter 6 are driven
to homozygosity by intense selection, the question at least ought to be asked as to whether it is
desirable for the long-term health of the population. Maybe some fundamentally important
cellular functions wi l l be upset. From a scientific perspect ive, research wi l l most l ikely
continue into search ing for the genes that underlie the QTL identified via SNP chips. This is
l ikely to involve the construction of molecular networks and gene atlases, which include al l
transcript types expressed in the total RNA of a cel l , to elucidate the control of complex traits.
However, such research may take a decade, whereas the appl ication of SNP-based selection is
al most ccrtain to begin in the New Zealand dairy industry in 2008. There is a danger that the
1 98
General discussion
rapid commercial exploitation of this new science may inadvertently lead to genetic i l l-health in
the national dairy herd.
7.5 Conclusion
The overall aim of this work was to explore the use of metabolic phenotypes as a means of
improving the rate of genetic gain in dairy cattle. The research has shown that metabolic
chal lenges did not provide useful information for the detection of QTL for mi lk production
traits. This is l ikely to be due to the highly complex and integrated molecular networks
control led by many genes that influence complex milk production traits. The data generated in
this programme of work wi l l be suitable for more advanced examinations of the genetic control
of mi lk production using the new generations of SNP chips.
1 99
Chapter 7
200

CHAPTER 8
References
Chapter 8
Abe H. , Kawakita Y . , Hodate K. and Saito M . 200 I . Postnatal development of glucose transporter proteins in bovine skeletal muscle and adipose t issue. Journal of Veterinary Medical Science 63 : 1 07 1 - 1 075 .
Abramow-Newerly M., Roy A .A . , Nunn C. and Chidiac P. 2006. RGS proteins have a signal l ing complex: Interactions between RGS proteins and GPCRs, effectors, and auxi l iary protein . Cellular Signalling 1 8 : 579-59 1 .
Abribat T. , Lapierre H . , Dubreui l P . , Pel letier G . , Gaudreau P . , Brazeau P. and Petitclerc D . 1 990. I nsulin-like growth factor-I concentration in H olstein female cattle: variations with age, stage of lactation and growth hormone-releasing factor administration. Domestic Animal Endocrinology 7: 93- 1 02.
Accorsi P .A. , Govoni N., Gaiani R. , Pezzi c., Seren E. and Tamanini C . 2005. Leptin, GH, PRL, insulin and metabol ic parameters throughout the dry period and lactation in dairy cows. Reproduction in Domestic Animals 40: 2 1 7-223 .
Akerlind M. , Emanuelson M. , Dahlborn K. and Holtenius K. 1 999. G lucose challenge in early lactating dairy cows selected for high or low milk-fat concentration. Animal Science 68: 7 1 7-722 .
Akers R.M. 2002. Lactation and the mammary gland, 1 st edn. Ames, Iowa: Iowa State Press. pp. 278
Akers R.M. 2006. Major advances associated with hormone and growth factor regulation of mammary growth and lactation in dairy cows. Journal of Dairy Science 89: 1 222- 1 234.
Akers R.M., Capuco A.V. and Keys 1 .E . 2006. Mammary histology and alveolar cel l different iation during late gestation and early lactation in mammary t issue of beef and dairy heifers. Livestock Science 1 05 : 44-49.
Akers R .M. , Bauman D.E . , Capuco AV, Goodman G.T. and A l ien Tucker H . 1 98 1 . Prolactin regulation of milk secretion and biochemical different iation of mammary epithel ial cells in periparturient cows. Endocrinology 1 09 : 23-30.
Andcrscn J.B., Mashek D.G. , Larsen T. , Nielsen M .O. and Ingvartsen K.L. 2002. Effects of hyperinsulinaemia under euglycaemic condition on l iver fat metabolism in dairy cows in early and mid-lactation. Journal of Veterinary Medicine Series A: Physiology, Pathology, Clinical Medicine 49: 65-7 1 .
Andrews Z .B . and Grattan D.R . 2003 . Opioid receptor subtypes involved i n the regulation of prolactin secretion during pregnancy and l actation. Journal of Neuroendocrinology 1 5 : 227-236 .
Anfinson M.S . , Christian E. , Everson D.O. and Davis S . L. 1 975 . Daily GH secretory patterns in bul ls and steers. Journal of Animal Science 4 1 : 342 .
Annison E .F . 1 983 . Metabolite uti l ization by the ruminant mammary gland. In : Biochemistry of Lactation. Ed. T .B . Mepham. Amsterdam; New York: Elsevier Science Publishers, pp. 399-436
Appenzeller-Herzog C. and Hauri H .P. 2006. The ER-Golgi intermediate compartment (ERGIC) : in search of its identity and function. Journal of Cell Science 1 1 9 : 2 1 73-2 1 83 .
202
References
Arase K. , York D.A. , Shimizu H . , Shargi l l N. and Bray GA 1 988. Effects of corticotropinreleasing factor on food intake and brown adipose t issue thermogenesis in rats. American Journal of Physiology 255 : E255-E259.
Arjune D. and Bodnar R.J . 1 990. Suppression of nocturnal, palatable and glucoprivic intake in rats by the K-opioid antagonist, nor-binaltorphamine. Brain Research 534: 3 1 3-3 1 6.
Asimov G.J . and Krouze N .K . J 937. The lactogenic preparations from the anterior pituitary and the i ncrease of mi lk yield in cows. Journal of Dairy Science 20: 289-306.
Attaix D. , Aurousseau E., Combaret L., Kee A., Larbaud D., Rall iere C, Souweine 8. , Tail landier D. and Til ignac T . 1 998. Ubiquitin-proteasome-dependent proteolysis in skeletal muscle. Reproduction Nutrition Development 38 : 1 53- 1 65 .
Auchtung T.L. , Rius A.G. , Kendall P .E . , McFadden T.B. and Dahl G.E . 2005 . Effects of photoperiod during the dry period on prolact in, prolactin receptor, and mi lk production of dairy cows. Journal of Dairy Science 88: 1 2 1 - 1 27 .
Baek K .H . 2003 . Conjugation and deconjugation of ubiquitin regulating the destiny of proteins. Experimental and Molecular Medicine 35: 1 -7 .
Bai le CA, McLaughl in CL. , Buonomo F.C, Lauterio T.J . , Marson L. and Dellafera MA 1 987. Opioid peptides and the control of feeding i n sheep. Federation Proceedings 46: 1 73- / 77.
Bairoch A., Apwei ler R. , Wu CH. , Barker W.C, Boeckmann B., Ferro S., Gasteiger E., Huang H .Z. , Lopez R., Magrane M. et at. 2005. The universal protein resource (UniProt) . Nucleic Acids Research 33 : D 1 54-D 1 59.
Baker 1 .R . , Cardinal K., Bober C, Taylor M.M. and Samson W.K. 2003 . Neuropeptide W acts in brain to control prolactin, cort icosterone, and growth hormone release. Endocrinology 1 44: 28 1 6-282 1 .
Baker R.L . , Shannon P. , Garrick DJ. , Blair H .T. and Wickham 8 . W. 1 990. The future impact of new opportunities in reproductive physiology and molecular biology on genetic improvement programmes. Proceedings of the New Zealand SOCiety of Animal Production, Victoria University, Well ington, New Zealand. 1 97-2 1 0.
Balage M. , Sornet C and Grizard 1. 1 992. I nsulin receptor binding and kinase activity i n l iver and skeletal muscles of lactating goats. American Journal of Physiology 262: E56 1 -E568.
Baldwin B.A. , De La Riva C. and Ebenezer I . S . 1 990. Effects of i ntracerebroventricular i njection of dynorphin, leumorphin and a neo-endorphin on operant feeding in pigs. Physiology & Behavior 48: 82 1 -824.
Baldwin R.L. and Kim W. Y. 1 993. Lactation. In: Quantitative aspects of ruminant digestion and metabolism. Ed. 1 .M. Forbes and 1 . France. Wal l ingford, UK: CAB International, pp. 433-45 1
Baracos V.E. , B runbellut 1 . and Marie M. 1 99 1 . Tissue protein synthesis in lactating and dry goats. British Journal of Nutrition 66: 45 1 -465.
Barker DJ.P. 2004. The developmental origins of adult disease. Journal of the American College of Nutrition 23 : 588S-595S .
203
Chapter 8
Barker S .A . , Wang J . , Sierra D.A. and Ross E .M. 200 1 . RGSZ I and Rct RGS: Two of several spl ice variants from the gene RGS20. Genomics 78 : 223-229.
Barnes M.A. , Kazmer G.W., Akcrs M .R. and Pearson R.E. 1 985 . Influence of selection for milk yield on endogenous hormones and metabol ites in holstein heifers and cows. Journal of Dairy Science 60: 27 1 -284.
Barton C, York D.A. and Bray G.A. 1 996. Opioid receptor subtype control of galanin-induced feeding. Peptides 1 7 : 237-240.
Bassett l .M. 1 974. Dietary and gastro-intestinal control of hormones regulating carbohydrate metabolism in ruminants.Proceedings of the IV International Symposium in Ruminant Physiology, Sydney, Austra l ia. 3 83-398.
Bauman D.E. 2000 . Regulation of nutrient partitioning during lactation: homeostasis and homeorhesis revisited. In : Ruminant Physiology: Digestion, Metabolism, Growth and Reproduction. Ed. P .B . Cronje. Wal l ingford: CAB International Publ ishing, pp. 3 1 1 -328
Bauman D.E. and Currie W.B . 1 980. Partitioning of nutrients during pregnancy and lactation: a review of mechanisms involving homeostasis and homeorhesis . Journal of DailY Science 63 : 1 5 1 4- 1 529.
Bauman D.E. and Yernon R.G. 1 993 . Effects of exogenous bovine somatotropin on lactation. Annual Reviews of Nutrition 1 3 : 437-46 1 .
Bauman D.E. , McCutcheon S .N . , Steinhour W.D. , Eppard PJ . and Sechen SJ . 1 985 . Sources of variation and prospects for improvement of productive efficiency in the dairy cow: a review. Journal of Animal Science 60: 583-592 .
Bauman D.E . , Peel Cl., Steinhour W.D., Reynolds PJ . , Tyrrel l H .F. , B rown A.C. and Haaland G.L . 1 988 . Effect of bovine somatotropin on metabol ism of lactating dairy cows: influence on rates of i rreversible loss and oxidation of glucosc and nonesterified fatty acids. Journal of Nutrition 1 1 8 : 1 03 1 - 1 040.
Baumarul M.H . and Rab i i 1 . 1 99 1 . Inhibition of suckl ing-induced pro lactin release by �- and Kopioid antagonists. Brain Research 567: 224-230.
Baumgard L .H . , Webert WJ. , Kazmer G.W. , Zinn S .A. , Hansen L .B . , Chester-Jones H . and Crooker B .A. 2002. Effects of selection for milk yield on growth hormone response to growth hormone releasing factor in growing holstein calves. Journal of Dairy Science 85 : 2529-2540.
Beck N.F . and Tucker H .A. 1 978 . Mammary arterial and venous concentrations of serum insu lin in lactating dairy cows. Proceedings of the Society for Experimental Biology and Medicine 1 59 : 394-396.
Beerda B., Kornalijnslijper J .E. , van der Werf J .T.N. , Noordhuizen-Stasen E.N. and Hopster H . 2004. Effects o f mi lk production capacity and metabol ic status o n H P A function i n early postpartum dairy cows. Journal of DailY Science 8 7 : 2094-2 1 02 .
Beerepoot G .M .M. , Freeman A .E . and Det i l leux 1 .C 1 99 1 . Effect of season, genetic l ine, and sire on growth concentrations of somatotropin in serum of holstein cows in early lactation. Journal of Dairy Science 1 99 1 : 9 .
204
References
Beitz D.C and Nizzi C.P. 1 997. Lipogenesis and l ipolysis in bovine adipose tissue. In: Ruman microbes and digestive physiology in ruminants. Ed. R. Onodera, H . Itabashi, K . Ushida, H . Yano and Y. Sasaki . Tokyo: Japan Scientific Societies Press, pp. 1 3 3- 1 43
Bel l A . W. 1 995. Regulation of organic nutrient metabolism during transition from late pregnancy to early lactation. lournal of Animal Science 73 : 2804-28 1 9.
Bel l A . W. and Bauman D.E . 1 997. Adaptations of glucose metabol ism during pregnancy and lactation. Journal of Mammary Gland Biology and Neoplasia 2: 265-278 .
Bel l A.W., Burhans W.S. and Overton T.R. 2000. Protein nutrition in late pregnancy, maternal protein reserves and lactation performance in dairy cows. Proceedings of the Nutrition Society 59: 1 1 9- J 26.
Bennink M.R . , Mellenberger R.W., Frobish R.A. and Bauman D.E. J 972. G lucose oxidation and entry rate as affected by the initiation of lactation. lournal of Dairy Science 55: 7 1 2 Abstr.
Bequette B . 1 . , Backwell F .R . and Crompton L .A . 1 998 . Current concepts of amino acid and protein metabolism in the mammary gland of the lactating ruminant. lournal of Dairy Science 8 1 : 2540-2559.
Bergman E.N. , Brockman R.P. and Kaufman CF. 1 974. Glucose metabol ism in ruminants: comparison of whole-body turnover with production by gut, J iver, and kidney. Federation Proceedings 33 : 1 849- 1 854.
Bergmann S . , Ihmels 1 . and Barkai N . 2004. Similarities and differences in genome-wide expression data of six organisms. PLoS Bioi 2: E9.
Berman Y., Devi L . and Carr K.D. 1 994. Effects of chronic food restriction on prodynorphinderived peptides in rat brain regions. Brain Research 664 : 49-53 .
Berman Y. , Devi L . , Spangler R . , Kreek M . 1 . and Carr K .D . 1 997. Chronic food restriction and streptozotocin-induced diabetes di fferential ly alter prodynorphin mRNA levels in rat brain regions. Molecular Brain Research 46: 25-30.
Beyenbach K.W. and Wieczorek H. 2006. The V-type H+ ATPase: molecular structure and function, physiological roles and regulation. lournal of Experimental Biology 209: 577-589.
Bickerstaff R. , Annison E .F . and Linzel l J .L . 1 974. Metabolism of glucose, acetate, l ipids and amino acids in lactating dairy cows. lournal of Agricultural Science 82: 7 1 -85 .
Bionaz M . and Loor 1 .1 . 2007a. Identification of reference genes for quantitative real-time PCR in the bovine mammary gland during the lactation cycle. Physiological Genomics 29: 3 1 2-3 1 9.
B ionaz M . and Loor J .J . 2007b. mTOR, AMPK, and insul in receptor signal ing networks in the bovine mammary gland during the lactation cycle. FASEB 1. 2 1 : A l l 09-a-.
Blair HT and Garrick DJ. 2007. Application of new technologies in sheep breeding. New Zealand lournal of Agricultural Research 50: 89- 1 02.
B lair HT, McCutcheon S.N. and Mackenzie D .D.S . 1 990. Physiological predictors of genetic merit. Proceedings of the Australian Association of Animal Breeding and Genetics. 1 33-1 42 .
205
Chapter 8
B lair H.T. , McCutcheon S .N. , B reier B .H . and Gluckman P.D. 2002 . Correlated response in lamb birthweight fol lowing about 5 generations of selection for high or low plasma IGF- I .Seventh World Congress on Genetic Applied to Livestock Production, Montpell ier, France. Communication No. 1 9-04.
B laxter K.L . , Reineke E.P . , Crampton E .W. and Petersen W.E. 1 949. The role of thyroidal materials and of synthetic goitrogens in animal production and an appraisal of thei r practical use. Journal oJ Animal Science 8 .
B lock S .S . , Butler W.R . , Ehrhardt R .A . , Be l l A .W., Van Amburgh M .E . and Boisclair Y .R. 200 I . Decreased concentration of p lasma leptin in periparturient dairy cows is caused by negative energy balance. Journal oJ Endocrinology 1 7 1 : 339-348.
Blum 1 .W. , Reding T., Jans F., Wanner M., Zemp M. and Bachmann K. 1 985 . Variations of 3 -methylhistidine in b lood of dai ry cows. Journal oJ Dairy Science 68: 2580-2587.
Bobe G. , Sonon R.N. , Ametaj B. . , Young 1 .W. and Beitz D.C 2003 . Metabolic responses of lactating dairy cows to single and multiple subcutaneous injections of glucagon. Journal of Dairy Science 86: 2072-208 1 .
Bodnar RJ. 2004. Endogenous opioids and feeding behavior: a 30-year historical perspect ive. Peptides 25 : 697-725.
Boehmer C, Okur F. , Setiawan 1 . , Broer S . and Lang F. 2003. Properties and regulation of glutamine transporter SN I by protein kinases SGK and PKB. Biochemical and Biophysical Research Communications 306: 1 56- 1 62 .
Boehmer C, Rajamanickam 1 . , Schniepp R. , Kohler K. , Wulff P. , Kuhl D. , Palmada M. and Lang F. 2005. Regulation of the excitatory amino acid transporter EAA T5 by the serum and glucocorticoid dependent kinases SGK I and SGK3. Biochemical and Biophysical Research Communications 329: 738-742.
Bohmer C, Phi l ippin M., Rajamanickam J., Mack A., Broer S., Palmada M. and Lang F. 2004. Stimulation of the EAA T4 glutamate transporter by SGK protein kinase isofonns and PKB. Biochemical and Biophysical Research Communications 324: 1 242- 1 248.
Boichard D. , Grohs c., Bourgeois F. , Cerqueira F . , Faugeras R., Neau A., Rupp R., Amigues Y., Boscher M.Y. and Leveziel H. 2003. Detection of genes influencing economic traits in three French dairy cattle breeds. Genetics Selection Evolution 35 : 77- 1 0 I .
Boisgard R., Chanat E. , Lavial le F. , Pauloin A . and Oll ivier-Bousquet M . 200 I . Roads taken by mi lk proteins in mammary epithelial cel ls . Livestock Production Science 70: 49-6 1 .
Bonczek R.R. , Young C W., Wheaton J .E. and Mi l ler K.P . 1 988 . Responses of somatotropin, insulin, prolactin, and thyroxine to selection for mi lk yield in Holsteins. Journal oJ Dairy Science 7 1 : 2470-2479.
Boone DJ. , Steindel S .D . , Herron R., Howanitz P.1 . , Bachner P., Meier F., Schifman R.B . and Zarbo R.B . 1 995 . Tansfusion medicine monitoring practices. Archives of pathology & laboratory medicine 1 1 9 : 999- 1 006.
Borland C, Barber M . , Travers M. and Vemon R. 1 994. Growth honnone inhibition of l ipogenesis in sheep adipose tissue: requirement for gene transcription and polyamines. Journal ofEndocrinology 1 42 : 235-243.
206
References
Breier B . , Bass 1 . , Butler 1. and Gluckman P. 1 986. The somatotrophic axis in young steers: influence of nutritional status on pulsat i le release of growth hormone and circulating concentrations of insulin-like growth factor I . Journal of Endocrinology I l l : 209-2 1 5 .
Breton S. and Brown D . 2007. New insights into the regulation of V-A TPase-dependent proton secretion. American Journal of Physiology-Renal Physiology 292 : F I -F t o.
Brezi l lon S . , Lannoy V., Franssen 1 .-0. , Le Poul E . , Dupriez V. , Lucchetti 1 . , Detheux M. and Parmentier M. 2003 . Identification of natural l igands for the orphan G protein-coupled receptors GPR7 and GPR8. Journal of Biological Chemistry 278: 776-783 .
Broad K.D. , Kendrick K.M. , Sirinathsinghj i D.1 .S . and Keveme E .B . 1 993. Changes in proopiomelanocortin and pre-proenkephal in rnRNA levels in the ovine brain during pregnancy, parturition and lactat ion and in response to estrogen and progesterone. Journal of Neuroendocrinology 5 : 7 1 1 -7 1 9 .
Brockman R.P. 1 986. Pancreatic and adrenal hormonal regulation of metabol ism. In : Control of Digestion and Metabolism in Ruminants. Ed. L.P. Mi l l igan, W.L. Grovum and A. Dobson. Englewood Cl iffs, NJ : Prentice-Hall , pp . 405-4 1 9
Brockman R.P. 1 993. G lucose and short-chain fatty acid metabolism. In : Quantitative Aspects of Ruminant Digestion and Metabolism. Ed. J .M . Forbes and 1 . France. Wal l ingford, OK: CAB International, pp. 249-265
Brockman R .P. and Bergman E.N. 1 975. Effect of glucagon on plasma alanine and glutamine metabol ism and hepatic gluconeogenesis in sheep. American Journal of Physiology 228 : 1 627- 1 633 .
Brockman R.P. and Laarveld B . 1 986. Hormonal regulation of metabolism in ruminants; a review. Livestock Production Science 1 4: 3 1 3-334.
Brockman R.P. , Bergman E. . , Joo P.K. and Manns 1 .G. 1 975. Effects of glucagon and insul in on net hepatic metabol ism of glucose precursor in sheep . American Journal of Physiology 229: 1 344- 1 350.
Brodersen D.E. and Nissen P. 2005 . The social l ife of ribo omal proteins. Febs Journal 272: 2098-2 1 08 .
Brophy B . , Smolenski G. , Wheeler I. , Wel ls D. , L'Hui ll ier P. and Laible G. 2003 . Cloned transgenic cattle produce milk with h igher levels of �-casein and K-casein. Nature Biotechnology 2 1 : 1 57- 1 62 .
Brugman S . , Clegg 0.1 . , Woods S.c. and Seeley R.1. 2002. Combined blockade of both J..l- and K-opioid receptors prevents the acute orexigenic action of agouti-related protein. Endocrinology 1 43 : 4265-4270.
Bryant A .M. and Trigg I.E. 1 98 1 . Progress report on the performance of Jersey cows differing in breeding index. Proceedings of the New Zealand Society of Animal Production. 39-43 .
Bubunenko M. , Baker I . and Court D .L . 2007. Essentiality of ribosomal and transcription anti termination proteins analyzed by systematic gene replacement in Escherichia coli. Journal of Bacteriology 1 89 : 2844-2853 .
207

Chapter 8
Bunting L.D. , Femandez l M. , Thompson D.L.J . and Southern L .L . 1 994. Influence of chromium picol inate on glucose usage and metabol ic criteria i n growing Holstein calves. Journal of Animal Science 72: 1 5 9 1 - 1 599.
Burke lL., Waghom G.c. and Chaves AY 2002. Improving animal performance using foragebased diets. Proceedings of the New Zealand Society of Animal Production, Massey University, Palmerslon North, New Zealand. 267-272.
Butler S . , Marr A., Pelton S., Radcl iff R. , Lucy M. and But ler W. 2003 . Insul in restores G H responsiveness during lactation-induced negative energy balance i n dairy cattle: effects on expression of IGF-I and GH receptor I A. Journal of Endocrinology 1 76: 205-2 1 7 .
Cal l ige M. , Kieffer 1 . and Richard-Foy H. 2005 . CSN5/Jab I is involved in l igand-dependent degradation of estrogen receptor ex by the proteasome. Molecular and Cellular Biology 25 : 4349-4358.
Calogero A.E. , Barreca A. , Burrel lo . , Palermo I . , Giordano G. , D'Agata R. and Vicari E. 2002 . Corticotrophin-releasing hormone inhibits insu l in-like growth factor-I release from primary cultures of rat granulosa cel ls . Journal of Endocrinology 1 74 : 493-498.
Calzon L., Gelay A., Zinovyev A., Radvanyi F . and Bari l lot E . 2008 . A comprehensive modular map of molecular interactions in RB/E2F pathway. Molecular Systems Biology 4 : Article number: 1 73 .
Capuco A .V . and E l l i s S . 2005. Bovine mammary progenitor cells : current concepts and future directions. Journal of Mammmy Gland Biology and Neoplasia 1 0 : 5- 1 5 .
Capuco A.V. , Akers R.M. and Smith J .J . 1 997 . Mammary growth in Holstein cows during the dry period: Quantificati on of nucleic acids and h istology. Journal of DailY Science 80: 477-487.
Capuco AY, Wood D.L. , Baldwin R. , Mcleod K . and Paape M.1 . 200 1 . Mammary cel l number, prol iferation, and apoptosis during a bovine lactation: relation to mi lk production and effect of bST. Journal of Daily Science 84: 2 1 77-2 1 87 .
Carrol l lA., McArthur N .H . and Welsh T.H. 2007. In vitro and In vivo temporal aspects of ACTH secretion: Stimulatory actions of corticotropin-releasing hormone and vasopressin in cattle. Journal of Veterinmy Medicine Series a-Physiology Pathology Clinical Medicine 54: 7- 1 4.
Cases S . , Smith S .1 . , Zheng Y.-W., Myers H .M. , Lear S .R . , Sande E . , Novak S . , Coil ins c., Welch C.B. , Lusis A.1 . et at. 1 998. Identification of a gene encoding an acyl CoA:diacylglycerol acyl transferase, a key enzyme in triacylglycerol synthesis. Proceedings of the National Academy of Sciences 95: 1 30 1 8- 1 3023.
Centner T., Yano l, Kimura E. , McElhinny A.S . , Pel in K. , Witt c.c. , Bang M .L. , Trombitas K. , Granzier H . , Gregorio c .c. et at. 200 I . Identification of muscle specific ring finger proteins as potential regulators of the titin kinase domain. Journal of Molecular Biology 306: 7 1 7-726.
Chamovitz D .A . and Segal D. 200 1 . JAB 1 /CSN5 and the COP9 signalosome - A complex situation. Embo Reports 2: 96- 1 0 I .
208
References
Chefer V. I . , Czyzyk T., Bo lan E.A. , Moron 1 . , Pintar 1 .E . and Shippenberg T.S . 2005. Endogenous K-opioid receptor systems regulate mesoaccumbal dopamine dynamics and vulnerabi l ity to cocaine. Journal of Neuroscience 25 : 5029-5037.
Chen Y . , Zhu 1., Lum P.Y. , Yang X., Pinto S., MacNei l D.1 . , Zhang c., Lamb 1 . , Edwards S . , S ieberts S .K . et at. 2008. Variations in DNA eluc idate molecular networks that cause disease. Nature 452: 429-435 .
Chil l iard Y . 1 999. Metabolic adaptations and nutrient partitioning in the lactating animal. [ n : Biology of Lactation. Ed. 1 . Martinet, L .M . Houdebine and H .H . Head. Paris: INRA, pp. 503-552
Chi l l iard Y . and Robelin 1 . 1 983 . Mobil ization of body proteins by early lactating dairy cows measured by slaughtering and D20 di lution techniques. lVth International Symposium on Protein Metabolism and Nutrition, Clermont-Ferrand, France.
Chil l iard Y . , Robel in 1. and Remond B . 1 984. In vivo estimation of body l ipid mobil ization and reconstitution in dairy cattle. Canadian Journal of Animal Science 64 : 236-237.
Chil l iard Y., Bocquier F. and Doreau M. 1 998a. Digestive and metabolic adaptations of ruminants to undernutrition, and consequences on reproduction. Reproduction Nutrition Development 38 : 1 3 1 - 1 52 .
Chil l iard Y . , Cisse M. , Lefaivre R. and Remond B . 1 99 1 a . Body composition of dairy cows according to lactat ion stage, somatotropin treatment, and concentrate supplementation. Journal of Dairy Science 74: 3 1 03-3 1 1 6.
Chi l l iard Y . , Ferlay A. , Despres L. and Bocquier F. 1 998b. Plasma non-esterified fatty acid response to a �-adrenergic challenge before or after feeding in energy underfed or over fed, dry or lactating cows. Animal Science 67: 2 1 3-223.
Chil l iard Y., Sauvant D., Hervieu 1 . , Dorleans M. and Morandfehr P. 1 977. Lipoprotein l ipase activity and composition of omental adipose tissue as related to l ipid metabolism of goat in late pregnancy and early lactat ion. Annales De Biologie Animale Biochimie Biophysique 1 7 : 1 02 1 - 1 033 .
Chi l l iard Y . , Gagl iostro G. , Flechet 1 . , Lefaivre 1 . and Sebastian I . 1 99 1 b. Duodenal rapeseed o i l i nfusion in early and midlactation cows. 5 . M i lk fatty acids and adipose tissue l ipogenic activities. Journal of Dairy Science 74 : 1 844- 1 854.
Chi l l iard Y., Ferlay A., FaulcOlmier Y., Bonnet M., Rouel 1. and Bocquier F. 2000. Adipose t issue metabol ism and its role in adaptations to w1dernutrition in ruminants. Proceedings of the Nutrition Society 59: 1 27- 1 34.
Chopra U., Solomon D.H. , Chopra U . , Wu S . , Fisher D.A. and Nakamura Y . 1 978 . Pathways of metabol ism of thyriod hormones. Recent Progress in Hormone Research 34: 52 1 -556.
C iechanover A. , Orian A. and Schwartz A.L. 2000. Ubiquitin-mediated proteolysis: biological regulation via destruction. Bioessays 22: 442-45 1 .
Cisse M. , Chi l l iard Y. , Coxam V., Davicco M.1 . and Remond B . 1 99 1 . Slow release somatotropin in dairy heifers and cows fed two levels of energy concentrate. 2. P lasma hormones and metabol i tes. Journal of DailY Science 74: 1 382- 1 394.
209

Chapter 8
Citterio c., lones H .D. , Pacheco-Rodriguez G. , I slam A. , Moss 1. and Vaughan M. 2006. Effect of protein kinase A on accumulation of brefeldin A-inhibited guanine nucleotideexchange protein I (B IG I ) in HepG2 cel l nuclei . Proceedings of the National Academy of Sciences of the United States of America 1 03 : 2683-2688.
Clarenburg R. 1 992. Physiological chemistry of domestic animals. St . Louis: Mosby-Year Book. pp. 428
Claret F .X. , Hibi M. , Dhut S., Toda T. and Karin M. 1 996. A new group of conserved coactivators that increase the specificity of AP- I transcription factors. Nature 383 : 453-457.
Clark C.E.F . , Fulkerson W.J., Nandra K.S . , Barchia I. and Macmil lan K .L. 2005. The use of indicators to assess the degree of mobi l i sation of body reserves in dairy cows in early lactation on a pasture-based diet . Livestock Production Science 94: 1 99-2 1 1 .
Clarke S . , Zimmer A. , Zimmer A .M. , H i l l R.G. and Kitchen r . 2003 . Region selective upregulation of 11-, 8- and K-opioid receptors but not opioid receptor-l ike I receptors in the brains of enkephal in and dynorphin knockout mice. Neuroscience 1 22 : 479-489.
Cohick W.S. and Clemmons D.R. 1 993 . The insulin-l ike growth factors. Annual Revie� of Physiology 55 : 1 3 1 - 1 53 .
Cohick W.S. , Plaut K. , Sechen S . 1 . and Bauman D .E . 1 989. Temporal pattern of insulin-l ike growth factor-I response to exogenous bovine somatotropin in lactating cows. Domestic Animal Endocrinology 6: 263-273 .
Coll ier R .1 . 1 985. Nutritional, metabolic and environmental aspects of lactation. In : Lactation. Ed. B. L. Larson. Ames: The Iowa State University Press, pp. 80- 1 26
Corl B .A . , Butler ST, Butler W.R. and Bauman D .E. 2006. Short communication: Regulation of mi lk fat yield and fatty acid composition by insulin. Journal of Dairy Science 89: 4 1 72-4 1 75.
Cowan C.M. , Dentine M.R. , Ax R.L . and Schuler L .A. 1 990. Structural variation around prolactin gene l inked to quantitative traits in an elite Holstein sire family. Theoretical and Applied Genetics 79: 577-582.
Cronje P .B . 2000. Nutrient-gene interactions: future potential and applications. In : Ruminant Physiology: Digestion, Metabo/ism, Growth and Reproduction. Ed. P .B . Cronj e. Wal l ingford: CABI Publishing, pp. 409-422
Danf<er A., Tetens V. and Agergaard N. 1 995 . Review and an experimental study on the physiological and quantitative aspects of gl uconeogenesis in lactating ruminants. Comparative Biochemistry and Physiology Part B: Biochemistry and Molecular Biology I l l : 20 1 -2 1 0 .
Daughaday W.H . , Mariz l .K . and Blethen S . L. 1 980. Inh ibition of access of bound somatomedin to membrane receptor and immunobinding sites: A comparison of radioreceptor and radioimmunoassay of somatomedin in native and acid-ethanolextracted serum. Journal of Clinical Endocrinology and Metabolism 5 1 : 78 1 -788.
Davey A.W.F. , Grainger c., Mackenzie D.D.S . , F lux D.S . , Wi lson G.F . , B rookes I .M. and Holmes C. W. 1 983. Nutritional and physiological studies of differences between
2 1 0
References
Friesian cows of h igh and low genetic merit.Proceedings of the New Zealand Society of Animal Production. , University of Waikato, Hami lton, New Zealand. 67-70.
Davis G .H . and Kel ly R. W. 1 983 . Segregation of a major gene influencing ovulation rate in progeny of Booroola sheep in commercial and research flocks . Proceedi ngs of the New Zealand Society of Animal Production, University of Waikato, Hamilton, New Zealand. 1 97-200.
Davis M.E . , B ishop M .D. , Park N.H . and Simmen R.e.M. 1 995 . Divergent selection for blood scrum insulin-like growth factor-I concentration in beef cattle . 1 . Nongenetic effects. lournal of Animal Science 73 : 1 927- 1 932.
Davis S .R . 2005. Lactational traits of importance in dairy cows and appl ications of emerging technologies. New Zealand Veterinmy lournal 53: 400-405.
Davis S .R . , Collier R.J . , McNamara 1 .P . , Head H .H . and Sussman W. 1 988 . Effects of thyroxine and growth hormone treatment of dairy cows on milk yield, cardiac output and mammary blood flow. lournal of Animal Science 66: 70-79.
de Boer G. , Robinson P.H. and Kermelly J .J . 1 99 1 . Hormonal responses to bovine somatotropin and dietary protein in early lactation dairy cows. lournal of Dairy Science 74: 2623-2632.
De Bortoli M. , CasteJl ino R.e., Lu X.Y. , Deyo 1 . , Sturla L.M., Adesina A.M., Perlaky L., Pomeroy S.L. , Lau c.c. , Man T.K. et af. 2006. Medulloblastoma outcome is adversely associated with overexpression of EEF I D, RPL30, and RPS20 on the long arm of chromosome 8 . Bmc Cancer 6 : 223 .
De Donato M. , D .S . G.J . , Lehn e. , Gi l l C. and Taylor J .F. 2003. Molecular cytogenetic assignment of genes to bovine chromosome 5. Genetics and Molecular Research 2 : 260-270.
de Vries M.J . and Veerkamp R.F . 2000. Energy balance of dairy cattle in relation to milk production variables and ferti l i ty. lournal of Daffy Science 83 : 62-69.
Debras E., Grizard 1., Aina E., Tesseraud S., Champredon e. and Arnal M. 1 989. Insul in sensit ivity and responsiveness during lactation and dry period in goats. American lournal of Physiology - Endocrinology and Metabolism 256: E295-E302.
Delavaud e., Bocquier F. , Chi l l iard Y. , Keisler D .H . , Gertler A. and Kann G. 2000. Plasma leptin detemlination in ruminants: effect of nutritional status and body fatness on plasma leptin concentration assessed by a specific RIA in sheep. lournal of Endocrinology 1 65 : 5 1 9-526.
Dieter M . , Palmada M., Rajamanickam 1., Aydin A., Busjahn A., Boehmer e., Luft F.e. and Lang F. 2004. Regulation of glucose transporter SGLT I by ubiquitin l igase Nedd4-2 and kinases SGKI , SGK3, and PKB. Obesity Research 1 2 : 862-870.
Dong e. and Wu G. 2007 . Regulation of anterograde transport of adrenergic and angiotensin I l receptors by Rab2 and Rab6 GTPases. Cellular Signalling 1 9 : 2388-2399.
Donkin S .S . and Armentano L.E. 1 995 . Insulin and glucagon regulation of gluconeogenesis in preruminating and ruminating bovine. lournal of Animal Science 73 : 546-55 1 .
2 1 1

Chapter 8
Drackley J .K . , Overton T.R. and Douglas G.N. 200 1 . Adaptations of glucose and long-chain fatty acid metabol ism in l iver of dairy cows during the periparturient period. Journal of Dairy Science 84: E I OO-E I 1 2 .
Drackley 1 .K . , Donkin S .S . and Reynolds c .K. 2006. Major advances in fundamental dai ry cattle nutrition. Journal of Dairy Science 89: 1 324- 1 336.
Druet I., Fritz S . , Boichard D . and Colleau J .J . 2006. Estimation of geneti c parameters for quantitative trait loci for dairy traits in the French holstein population. Journal of Dairy Science 89: 4070-4076.
D'Souza-Schorey C. and Chavrier P . 2006. ARF proteins: roles in membrane traffic and beyond. Nature Reviews Molecular Cell Biology 7: 347-358.
Dunshea F.R. , Bel l A.W. and Trigg I.E. 1 990. Nonesterified fatty-acid and glycerol k inetics and fatty-acid reesterification in goats during early lactation. British Journal of Nutrition 64 : 1 33- 145 .
Elsasser T.H. , Rumsey TS. and Hammond A.C . 1 989. Influence of diet on basal and growth hormone stimu lated p lasma concentrations of IGF-I in beef cattle. Journal of Animal Science 67: 1 28- 1 4 1 .
Embark H .M. , Bohmer c. , Val lon V. , Luft F. and Lang F. 2003 . Regulation of KC NE 1 -dependent K + current by the serum and glucocorticoid-inducible k inase ( SGK) isoforms. Pflugers Archiv-European Journal of Physiology 445 : 60 1 -606.
Etherton TD. and Evock C.M. 1 986. Stimulation of l ipogenesis in bovine adipo e ti sue by insulin and insul in-l ike growth factor. Journal of Animal Science 62: 357-362 .
Etherton TD. and Bauman D.E . 1 998. Biology of somatotropin in growth and lactation of domestic animals. Physiological Reviews 78 : 745-76 1 .
Etschmann B . , Heipertz K.S . , von der Schulenburg A . and Schweigel M . 2006. A vH+-ATPase is present in cultured sheep ruminal epithel ial cel ls . American Journal of PhysiologyGastrointestinal and Liver Physiology 29 1 : G 1 1 7 1 -G 1 1 79 .
Evans .M. , H acker R .R. and Hoover 1. 1 99 1 . Effect of chronobiological alteration of the circadian rhythm of and prolactin and somatotropin release in the dairy cow. 1. Dairy Sci. 74: 1 82 1 - 1 829.
Faichney G .J . 1 993 . Digesta flow. In : Quantitative Aspects of Ruminant Digestion and Metabolism. Ed. 1 .M . Forbes and 1. France. Wal l ingford: CAB International, pp. 53-85
Falconer D.S. and Mackay T F.C. 1 996. Introduction to quantitative genetics, 4th edn. Harlow, Essex, England: Longman. pp. 464
Faulkner A. and Pollock H .T. 1 990a. Metabol ic responses to euglycaemic hyperinsul inemia in lactating and non-lactating sheep in vivo. Journal of Endocrinology 1 24: 59-66.
Faulkner A. and Pol lock H.T. 1 990b. Effects of glucagon and u- and 13-agonists on glycogenolysis and gluconeogenesis in isolated ovine hepatocytes. Biochimica et Biophysica Acta (BBA) - Molecular Cell Research 1 052 : 229-234.
Faulkner A. and Martin P.A. 1 999. I nsulin secretion and intestinal pep t ides during lactation in sheep. Journal of Dairy Research 66: 45-52.
2 1 2
References
Fel l B .F . , Campbell KM. , Mackie W.S . and Weekes T.E. 1 972. Changes associated with pregnancy and lactation in some extra-reproducive organs of the ewe. lournal of Agricultural Science 79: 397-407.
Feller D.D. , Strisower E .H . and Chaikoff I . L. 1 950. Turnover and oxidation of body glucose in normal and al loxan-diabetic rats. lournal of Biological Chemistry 1 87 : 57 1 -588 .
Fischer D. , Patchev V.K. , Hel lbach S . , Hassan A .H .S . and Almeida O.F .X. 1 995. Lactation as a model of natural ly reversible hypercortical ism plasticity in the mechanisms governing hypothalamo-pi tuitary-adrenocort ical activity in rats. lournal of Clinical Investigation 96: 1 208- 1 2 1 5 .
Francis S .M. , Bickerstaffe R . and O'Connell D . 1 990. The insulin status o f sheep with genetic differences in glucose tolerance and carcass composition. Proceedings of the New Zealand Society of Animal Production, Victoria University, Wel l ington, New Zealand. 93-96.
Friggens N.C. , Emmans G.c. , Kyriazakis I . , Oldham 1 .D. and Lewis M . 1 998. Feed intake relative to stage of lactation for dairy cows consuming total mixed diets with a high or low ratio of concentrate to forage. lournal of Dairy Science 8 1 : 2228-2239.
Frohli D . and Blum lW. 1 988. Blood levels, clearance rates and effects of epinephrine and norepinephrine on insul in and metabol ites during a- and �-adrenergic blockade in cattle in vivo, and in vitro degradation of dopamine in bovine blood. Acta Endocrinologica (Copenh) 1 1 8 : 245-253 .
Fukui K . , Matsunaga S . , Uchiyama S . , Maniwa R. and Baba A. 2006 . Functional analysis of chromosome related proteins with special reference to RRS I . Genes & Genetic Systems 8 1 : 432-432 .
Gammie S .c. , Hasen .S . , Awad T .A . , Auger A .P . , Jessen H .M. , Panksepp 1 .B . and Bronikowski A.M. 2005. Gene array profil ing of large hypothalamic C S regions in lactating and randomly cyc l ing virgin mice. Molecular Brain Research 1 39 : 20 1 -2 1 1 .
Gamper N. , F i l lon S . , Huber S .M . , Feng Y. , Kobayashi T., Co hen P. and Lang F. 2002 . IGF- I up-regulates K+ channels via PI3-kinase, PDK I and SGK I . Pflugers Archiv-European Journal of Physiology 443 : 625-634.
Gardner lD. , Rothwel l N .1 . and Luheshi G .N . 1 998. Leptin affects food intake via CRFreceptor-mediated pathways. Nature Neuroscience I : 1 03- 1 03 .
Garrick DJ. and Snell R. 2005. Emerging technologies for identifying supcrior dairy cows in New Zealand. New Zealand Veterinary Journal 53 : 390-399.
Garrick DJ. , Harris B .L . , ShamlOn P . and Sosa-Ferreyra C. 1 993 . A prototype sire evaluat ion for New Zealand dairy cattle. Proceedings of the New Zealand Society of Animal Production, Waikato University, Hami lton, New Zealand. 9 1 -94.
Garz6n 1., Rodriguez-MLlIloz M., L6pez-Fando A., Garcia-Espaiia A. and Sfmchez-Bhizquez P. 2004. RGSZ I and GA IP regulate /1- but not 8-opioid receptors in mouse CNS: Role in tachyphylaxis and acute tolerance. Neuropsychopharmacology 29: 1 09 1 - 1 1 04.
Gehin M., Mark M., Dennefeld c. , Dierich A., Gronemeyer H . and Chambon P. 2002 . The function of TIF2/G RIP I in mouse reproduction is distinct from those of SRC- I and p/c/P . Molecular and Cellular Biology 22: 5923-5937.
2 1 3
Chapter 8
Genini D. and Catapano C .Y. 2006. Control of peroxisome prol iferator-activated receptor fate by the ubiquitin-proteasome system. lournal of Receptors and Signal Transduction 26: 679-692.
Gerlt 1.A. and B abbitt P.e. 2000. Can sequence determine function? Genome Biology I : REVIEWS0005 .
Gi l l R .D. and H art l .e . 1 980. Properties of insulin and glucagon receptors on sheep hepatocytes: a comparison of hormone binding and plasma hormones and metabol ites in lactating and non-lactating ewes. lournal of Endocrinology 84: 237-247.
Gi l l R.D. and Hart l .e . 1 984. The status of insulin and glucagon receptors on hepatocytes isolacted from pregnant and lactating dairy cows. General and Comparative Endocrinology 53 : 476.
Gl ick 1 .L . , Meigs T.E., Miron A. and Casey P.J . 1 998. RGSZ I , a Gz-selective regulator of G protein signal ing whose action is sensitive to the phosphorylation state of Gza. Journal of Biological ChemistlY 273 : 26008-260 1 3 .
Gosnell B .A. , Morley 1 .E . and Levine A.S . 1 986. Opioid-induced feeding - Local ization of sensitive brain sites. Brain Research 369: 1 77- 1 84.
Gotoh K., Fukagawa K., Fukagawa T., Noguchi H., Kakuma T., Sakata T. and Yoshimatsu H . 2005 . G lucagon-l ike peptide- I , corticotropin-releasing hormone, and hypothalamic neuronal histamine interact in the leptin-signaling pathway to regulate feeding behavior. Faseb lourna/ 1 9: 1 1 3 1 -+ .
Gregorini M. , Wang 1. , Xie X.S . , Mi l l igan R.A. and Engel A . 2007. Three-dimensional reconstruction of bovine brain V -A TPase by cryo-e1ectron microscopy and s ingle particle analysis. lournal of Structural Biology 1 58 : 445-454.
Grisart B . , Coppieters W., Famir F., Karim L., Ford e., Berzi P., Cambisano N . , Mni M. , Reid S., Simon P . et at. 2002. Positional candidate cloning of a QTL in dairy cattle : identification of a missense mutation in the bovine DGA T I gene with major effect on milk y ie ld and composition. Genome Research 1 2 : 222-23 1 .
Grochowska R . , S0rensen P. , Zwierzchowski L. , Snochowski M . and L0vendahl P . 200 I . Genetic variation i n stimulated G H release and i n IGF- I of young dairy cattle and their associations with the leucine/valine polymorphism in the GH gene. Journal of Animal Science 79: 470-476.
Gruenberg 1 . and Maxfield F.R. 1 995 . Membrane transport in the endocytic pathway. Current Opinion in Cell Biology 7 : 552-563 .
Grummer R .R . 1 995 . Impact of changes in organic nutrient metabol ism on feeding the transition dairy cow. Journal of Animal Science 73: 2820-2833 .
Guesnet P .M. , Massoud M.J . and Demame Y . 1 99 1 . Regulation of adipose tissue metabolism during pregnancy and lactation in the ewe: the role of insulin. lournal of Animal Science 69: 2057-2065 .
Gulay M.S . , Hayen M .J . , Liboni M. , Bel loso T . 1 . , Wi lcox e.1 . and Head H .H . 2004. Low doses of bovine somatotropin during the transition period and early lactation improves milk yield, efficiency of production, and other physiological responses of holstein cows. Journal of Dairy Science 87: 948-960.
2 1 4

References
Ha lK. and Kennelly 1 .1 . 1 984. Influence of physiological state and of fasting on amino acid uptake by intestinal tissue of cattle. Canadian Journal of Animal Science 64: 3 1 4-3 1 5 .
Haley e.S . , Knott S .A. and Elsen lM. 1 994. Mapping quantitative trait loci in crosses between outbred l ines using least squares. Genetics 1 36 : 1 1 95 - 1 207.
Harris B .L. , Pryce lE., McNaughton L. , Stanley G., Harcourt S . and Spelman R. 2005. Quantifying energy balance in crossbred dairy cows. Proceedings of the Associationfor the Advancement of Animal Breeding and Genetics 1 6 : 267-270.
Hart I .e . , B ines 1 .A. and Morant S. V. 1 980. The secretion and metabolic c learance rates of growth hormone, insul in and prolactin in high- and low-yielding cattle at four stages of lactation. Life Sciences 27: 1 839- 1 847.
Hart I .e . , Morant S . V. and Roy lH.B . 1 98 1 . A note on the variabi l ity of hormone concentrations in twice-weekly blood samples taken from heifer calves during the first 1 1 0 days of l i fe. Animal Production 32: 2 1 5-2 1 7.
Hart I .e . , Bines lA. , Morant S. V. and Ridley lL. 1 978. Endocrine control of energy metabol ism in the cow: comparison of the levels of hormones (prolactin, growth hormone, insulin and thyroxine) and metabol ites in the p lasma of high- and lowyielding cattle at various stages of lactation. Journal of Endocrinology 77: 333-345.
Hegarty R .S . , McFarlane lR, Banks R . and Harden S . 2006. Association of plasma metabolites and hormones with the growth and composition of lambs as affected by nutrition and sire genetics. Australian Journal of Agricultural Research 57 : 683-690.
Henke G., Maier G . , Wal l isch S., Boehmer e. and Lang F. 2004. Regulation of the voltage gated K+ channel Kv l .3 by the ubiquitin l igase Nedd4-2 and the serum and glucocorticoid inducible kinase SGK I . Journal of Cellular Physiology 1 99 : 1 94- 1 99.
Henry B .A. , Tilbrook A.J., Dunshea F .R. , Rao A. , B lache D. , Martin G .B . and Clarke U. 2000. Long-term alterations in adiposity affect the expression of melan in-concentrating hormone and enkephalin but not proopiomelanocortin in the hypothalamus of ovariectomized ewes. Endocrinology 1 4 1 : 1 506- 1 5 1 4.
Herbein J .H . , Aiello R .J . , Eckler L . I . , Pearson RE. and Akers R .M. 1 985. Glucagon, insulin, growth hormone, and glucose concentrations in blood plasma of lactating dairy cows. Journal of Dairy Science 68: 320-325.
Hippen A.R. , She P . , Young lW., Beitz D.C. , Lindberg G.L . , Richardson L .F. and Tucker R.W. 1 999. Metabolic responses of dairy cows and hei fers to various intravenous dosages of glucagon. Journal of Dairy Science 82 : 1 1 28- 1 1 38 .
Hishikawa K . , Marumo T . , Miura S . , Nakanishi A. , Matsuzaki Y . , Sh ibata K. , Ichiyanagi T., Kohike H., Komori T., Takahashi I . et af. 2005. MusculinlMyoR is expressed in kidney side population cells and can regulate their function. Journal of Cell Biology 1 69 : 92 1 -928.
Ho M.N. , Hirata R. , Umemoto N. , Ohya Y. , Takatsuki A. , Stevens T.H . and Anraku Y. 1 993. VMA 13 encodes a 54-kDa vacuolar H+-ATPase subunit required for activity but not assembly of the enzyme complex in Saccharomyces cerevisiae. Journal of Biological Chemistry 268: 1 8286- 1 8292.
Hochol A. , Belloni A.S . , Rucinsk i M., Ziolkowska A., Di Liddo R, Nussdorfer G.G. and Malendowicz L.K. 2006 . Expression of neuropeptides B and W and their receptors in
2 1 5
Chapter 8
endocrine glands of the rat. international Journal of Molecular Medicine 1 8 : 1 1 0 1 -1 1 06.
Hocquette 1.F., Graulet B. and Ol ivecrona T. 1 998. Lipoprotein l ipase activ i ty and mRNA levels in bovine tissues. Comparative Biochemistry Physiology Part B, Biochemistry and Molecular Biology 1 2 1 : 20 1 -2 1 2.
Hodate K. , 10hke T. and Ohashi S. 1 985 . Growth hormone, thyrotropin and prolactin responses to s imultaneous administration of human growth hormone-releasing factor and thyrotropin releasing hormone in the bovine. Endoclinolgica Japonica 32: 375-383.
Hodgson 1. and Brookes I .M . 1 999. Nutrition of grazing animals. In : New Zealand Pasture and Crop Science. Ed. 1. White and 1. Hodgson. Auckland, NZ: Oxford University Press, pp. 1 1 7- 1 32
Hoeschele I . 1 990. Potential gain from insertion of major genes into dairy cattle. Journal of Dairy Science 73 : 260 1 -26 1 8.
H0j S . , L0vendahl P. and Sej rsen K. 1 993 . Possib le associat ion of growth hormone gene polymorphism with growth hormone release in calves from l ines selected for high and low mi lk fat yield. Acta Agriculturae Scandinavica. Section A, Animal Science 43 : 1 29-1 35 .
Hol l inger S. and Hepler 1 .R . 2002. Cel lular regulation of RGS proteins: Modulators and integrators ofG protein signal ing. Pharmacological Reviews 54: 527-559.
Holmes C.W. , Brookes I .M . , Garrick DJ., Mackenzie D.D.S. , Parkinson T.J. and Wi lson G.F . 2002 . Mi lk production from pasture (ed. D. Swain), pp . 602 . Palmerston North: Massey University.
Holtenius K. , Agenas S., Delavaud C. and Chi l l iard Y. 2003. Effects of feeding intensity during the dry period. 2 . Metabol ic and hormonal responses. Journal of DailY Science 86: 883-89 1 .
Holter J .B . , West lW., McGi l l iard M.L. and Pell A .N. 1 996. Predicting ad l ibitum dry matter intake and yields of jersey cows. Journal of Dairy Science 79: 9 1 2-92 1 .
Hough G.M. , McDowell G .H . , Annison E.F. and Wi l l iams AJ. 1 985 . Glucose metabolism in hind l imb muscle of pregnant and l actating ewes. Proceedings of the Nutrition Society of Australia 1 0: 97.
Houseknecht K.L. and Bauman D.E . 1 997. Regulation of l ipolysis by somatotropin: functional alteration of adrenergic and adenosine signaling in bovine adipose t issue. Journal of Endocrinology 1 52 : 465-475.
Houseknecht K.L. , Dwyer D.A., Lanna D.P.D. and Bauman D.E . 1 995 . Effects of somatotropin on adipose t issue metabolism: ontogeny of the enhanced response to adrenergic chal lenge in the lactating cow. Domestic Animal Endocrinology 1 2 : 1 05- 1 1 3 .
Houseknecht K .L . , Baile C.A. , Matteri R.L . and Spurlock M.E . 1 998. The biology of leptin : a review. Journal of Animal Science 76: 1 405- 1 420.
Hua K.M. , Ord R. , Kirk S., Li QJ., Hodgkinson S.c., Spencer G .S . , Molan P.c. and Bass 1.1 . 1 993. Regulation of plasma and t issue levels of insul in-l ike growth factor-f by nutrition and treatment with growth hormone in sheep. Journal of Endocrinology 1 36: 2 1 7-224.
2 1 6
References
Hubinont Cl. , Dufrane S .P . , Garcia-Morales P . , Valverde I . , Sener A . and Malaisse W.J . 1 986. Influence of lactation upon pancreatic islet funct ion. Endocrinology 1 1 8 : 687-694.
Ingvartsen K.L . and Andersen 1 .B . 2000. I ntegration of metabol ism and intake regulation: A review focusing on periparturient animals. lournal of Dairy Science 83 : 1 573- 1 597.
Ingvartsen K .L. and Friggens N.C 2005 . To what extent do variabil it ies in hormones, metabolites and energy intake explain variabil ity in milk yield? Domestic Animal Endocrinology 29: 294-304.
Inoue T., Wang Y.R. , Jefferies K., Qi 1 . , H inton A. and Forgac M. 2005. Structure and regulation of the V-ATPases. lournal ofBioenelgetics and Biomembranes 37 : 393-398.
Iqbal 1 . , Manley T.R., Ciofi P . and Clarke U. 2005 . Reduction in adiposity affects the extent of afferent projections to growth hormone-releasing hormone and somatostatin neurons and the degree of colocalization of neuropeptides in growth hormone-releasing hormone and somatostatin cells of the ovine hypothalamus. Endocrinology 1 46: 4776-4785.
Ishii M. , Fei H. and Friedman 1.M. 2003 . Targeted disruption ofGPR7, the endogenous receptor for neuropeptides B and W, leads to metabolic defects and adult-onset obesity. Proceedings of the National Academy of Sciences of the United States of America 1 00: 1 0540- 1 0545.
Israel Y. , Kandov Y. , Khaimova E. , Kest A., Lewis S .R., Pastemak G .W. , Pan Y.X., Rossi G.C and Bodnar R.J . 2005. NPY-induced feeding: pharmacological characterization using selective opioid antagonists and anti sense probes in rats. Peptides 26: 1 1 67- 1 1 75 .
!toh F . , Obara Y. , Rose M.T. and Fuse H . 1 998. Heat influences on plasma insulin and glucagon in response to secretogogues in non-lactating dairy cows. Domestic Animal Endocrinology 1 5 : 499-5 1 0.
Jackson A. and Cooper SJ. 1 985 . Effects of K-opiate agonists on palatable food consumption in non-deprived rats, with and without food preloads. Brain Research Bulletin 1 5 : 39 1 -
396.
Jaster E.H . and Wegner T.N. 1 98 1 . �-adrenergic receptor involvement in l ipo lysis of dairy cattle subcutaneous adipose tissue during dry and lactating state. lournal of Dairy Science 64: 1 655- 1 663.
lenkins T.C and McGuire M.A. 2006. Major advances in nutrition: Impact on milk composition. Journal of Daily Science 89: 1 302- 1 3 1 0.
Jeong lW., Kwak 1 . , Lee K.Y. , White L.D. , Wang X.P . , Brunicardi F.C, O'Malley B .W. and DeMayo F.J . 2006. The genomic analysis of the impact of steroid receptor coactivators ablation on hepatic metabolism. Molecular Endocrinology 20: 1 1 38- 1 1 52 .
10akimsen 0., Steenberg K. , Lien H . and Theodorsen L . 1 97 1 . Genetic relationships between thyroxine degradation and fat-corrected milk yield in cattle. Acta AgriculturCE Scandinavica 2 1 : 1 2 1 - 1 24.
10hnston DJ. , Herd R .M. , Kadel MJ. , Graser H . -U ., Arthur P .F . and Archer J .A. 2002 . Evidence of JGF- J as a genetic predictor of feed efficiency traits in beef cattle. 7th World Congress of Genetics Applied to Livestock Production, Montpell ier, France. CD-ROm Communication No. 1 0- 1 6.
2 1 7
Chapter 8
Joyce C .J . 2007 . In s i l ico comparative genomic analysis of GABAA receptor transcriptional regulation. Bmc Genomics 8.
Kameda K., Fukao M. , Kobayashi T., Tsutsuura M ., Nagashima M. , Yamada Y., Yamashita T. and Tohse N. 2006. CSN5/Jab I inhibits cardiac L-type Ca2+ channel activity through protein-protein interactions. Journal of Molecular and Cellular Cardiology 40: 562-569.
Kaneko 1.1. 1 997. Carbohydrate metabol ism and its diseases. In: Clinical biochemistry of domestic animals, 5th edn. Ed. 1 . 1 . Kaneko, 1 . W. Harvey and M.L . Bruss. San Diego, Cali fornia: Academic Press, pp. 45-8 1
Kawado M. , H inotsu S . , Matsuyama Y. , Yamaguchi T. , Hashimoto S . and Ohashi Y. 2003. A comparison of error detection rates between the reading aloud method and the double data entry method. Controlled Clinical Trials 24: 560-569.
Kazmer G. W., Barnes M.A . , Akers R .M. and Pearson R .E . 1 986. Effect of genetic selection for mi lk yield and increased mi lking frequency on plasma growth hormone and prolactin concentration in Holstein cows. Journal of Animal Science 63 : 1 220- 1 227 .
Kel ly J .M . , Summers M. , Park H.S . , Mi l l igan L .P . and McBride B.W. 1 99 1 . Cellular energy metabolism and regulation. Journal of Dairy Science 74: 678-694.
Kennedy 1., D i l lon P., Delaby L . , Faverdin P., Stakelum G. and Rath M. 2003. Effect of genetic merit and concentrate supplementation on grass intake and milk production with Holstein Friesian dairy cows. Journal of Dairy Science 86: 6 1 0-62 1 .
Kenyon P .R . , B lair H .T., Breier B .H . and Gluckman P .D . 2007. The influence of maternal IGFI genotype on birthweight and growth rate of lambs. New Zealand Journal of Agricultural Research 50: 29 1 -297.
Keys J .E . , Capuco A.Y. , Akers R .M. and Dj iane J . 1 989 . Comparative study of mammary gland development and differentiation between beef and dairy hcifcrs. Domestic Animal Endocrinology 6: 3 1 1 -3 1 9.
Khatkar M.S . , Thomson P.c. , Inlke T. and Raadsma H.W. 2004. Quantitative trait loci mapping in dairy cattle: review and meta-analysis. Genetics Selection Evolution 36: 1 63- 1 90.
Kim C .H . , Choung J .1 . and Chamberlain D.G. 2000. The effects of intravenous administration of amino acids and glucose on the mi lk production of dairy cows consuming diets based on grass s i lage. Grass and Forage Science 55 : 1 73- 1 80.
Kim E .M . , Welch c.c., Grace M.K . , B i l l ington C.J . and Levine A.S. 1 996. Chronic food restriction and acute food deprivation decrease mRNA levels of opioid peptides in arcuate nucleus. American Journal of Physiology - Regulatory, Integrative and Comparative Physiology 270 : R 1 0 1 9-R 1 024.
Kim E .M. , Kotz C .M. , Welch c.c. , Grace M.K . , B i l l ington C.J. and Levine A.S . 1 997. Lactation decreases rnRNA levels of opioid peptides in the arcuate nucleus of the rat. Brain Research 769: 303-308.
Kimp1e M .E. , Nixon A .B . , Kelly P . , Bailey c.L. , Young K .H . , Fields T.A. and Casey P.J. 2005.
2 1 8
A role for Gz in pancreatic i slet p-cel l biology. Journal of Biological Chemistry 280: 3 1 708-3 1 7 1 3 .
References
Kleinjan D.A. and van Heyningen V. 2005. Long-range control of gene expression: Emerging mechanisms and disruption in disease. American lournal of Human Genetics 76: 8-32 .
Kl indt J . 1 988 . Relationships among growth hormone and prolactin secrctory parameter estimates in Holstein bulls and their predicted differences for lactational traits. Journal of Animal Science 66: 2784-2790.
Knapp lR. , Freetly H .c. , Reis B . L. , Calvert c.c. and Baldwin R.L. 1 992 . Effects of somatotropin and substrates on patterns of l iver metabol ism in lactating dairy catt le. Journal of Dairy Science 75: 1 025- 1 035.
Kneeland J . , Li c . , Basarab 1 . , Snell ing W.M., Benkel B . , Murdoch B. , Hansen C. and Moore S .S . 2004. Identification and fine mapping of quantitative trait loci for growth traits on bovine chromosomes 2, 6, 1 4, 1 9, 2 1 , and 23 within one conunercial l ine of Bos taurus. lournal of Animal Science 82: 3405-34 1 4.
Knight C .H . , France 1. and Beever D. E. 1 994 . Nutrient metabolism and util ization in the mammary gland. Livestock Production Science 39: 1 29 - 1 37 .
Knight C .H . , Alamer MA, Sorensen A. , Nevison I .M. , Fl int D.1 . and Vernon R.G. 2004. Metabolic safety-margins do not differ between cows of h igh and low genetic merit for milk production. lournal of DailY Research 7 1 : 1 4 1 - 1 53 .
Knott S .A . , Elsen 1 .M. and Haley C.S . 1 996. Methods for multiple-marker mapping of quantitative trait loci in half-sib populations. Theoretical and Applied Genetics 93 : 7 1 -80.
Ko 1 .R . , Wu 1.Y., Kirby R. , Li I . F. and Lin A. 2006. Mapping the essential structures of human ribosomal protein L7 for nuclear entry, ribosome assembly and function. Febs Letters 580: 3804-3 8 1 0.
Kobayashi T., Deak M. , Morrice N. and Cohen P. 1 999a. Characterization of the structure and regulation of two novel isoforms of serum- and glucocorticoid-induced protein kinase. Biochemical Journal 344: 1 89- 1 97.
Kobayashi Y. , Boyd C.K., Bracken c.1 . , Lamberson W.R., Keisler D.H. and Lucy M.C. 1 999b. Reduced growth hormone receptor (GHR) messenger ribonucleic acid in l iver of periparturient cattle is caused by a specific down-regulation of GHR I A that is associated with decreased insulin-l ike growth factor 1 . Endocrinology 1 40 : 3947-3954.
Koc E.C. , Burkhart W., B lackburn K., Moyer M.B . , Schlatzer D.M. , Moseley A. and Spremulli L . L. 200 1 . The large subunit of the mammalian mitochondrial ribosome - Analysis of the complement of ribosomal proteins present. Journal of Biological ChemistlY 276: 43958-43969.
Kokkonen T., Tsehai Tesfa A., Tuori M. , Yrj anen S . and Syrjala-Qvist L . 2002. Effect of concentrate crude protein level on grass si lage intake, milk yield and nutrient utilisation by dairy cows in early l actation. Archives of Animal Nutrition 56: 2 1 3-227.
Kokkonen T., Taponen 1 . , Antt i la T., Syrjala-Qvist L . , Delavaud c. , Chi l l iard Y. , Tuori M . and Tesfa A.T. 2005 . Effect of body fatness and glucogenic supplement on l ipid and protein mobil ization and plasma leptin in dairy cows. lournal of DailY Science 88: 1 1 27- 1 1 4 1 .
Kolver E .S . , Roche 1 .R. , de Veth M.1 . and Mackle T.R. 200 I . Lipolytic response of New Zealand and overseas Holstein-Friesian dairy cows challenged with
2 1 9
Chapter 8
epinephrineProceedings of the New Zealand Society of Animal Production, Lincoln University, Canterbury, New Zealand. 48-5 1 .
Kolver E .S . , Roche lR. , Burke C R. and Aspin P.W. 2005 . I nfluence of dairy cow genotype on mi lksol ids, body condition and reproduction response to concentrate supplementation. The Proceedings of the New Zealand Society of Animal Production, Lincoln University, Canterbury, New Zealand. 46-52 .
Komaragiri M .V .S . and Erdman R .A . 1 997. Factors affecting body t issue mobi l ization in early lactation dairy cows. I . E ffect of dietary protein on mobi lization of body fat and protein. Journal of Dairy Science 80: 929-937.
Komatsu T., ltoh F. , Mikawa S . and Hodate K. 2003 . Gene expression of resistin in adipose t issue and mammary gland of l actating and non-lactating cows. Journal of Endocrinology 1 78 : R I -5 .
Komatsu T., Itoh F. , Kushibiki S . and Hodate K. 2005. Changes in gene expression o f glucose transporters in lactating and nonlactating cows. Journal of A nimal Science 83 : 557-564.
Kotz CM., Levine A.S. and B i l l ington Cl. 1 997. Effect of naltrexone on feedi ng, neuropeptide Y and uncoupl ing protein gene expression during lactation. Neuroendocrinology 65 : 259-264.
Kotz CM. , Grace M .K. , B i l l ington Cl and Levine A.S . 1 993. The effect of norbinaltorphimine, l3-funaltrexamine and naltrindole on NPY-induced feeding. Brain Research 63 1 : 325-328.
Krebs M. and Roden M. 2005. Molecular mechamisms of l ipid-induced insul in resistance in muscle, l iver and vasculature. Diabetes, Obesity and Metabolism 7 : 62 1 -632.
Krul ich L. , Koenig 1 . 1 . , Conway S . , McCann S .M. and Mayfield M.A. 1 986. Opioid K-receptors and the secretion of prolactin ( PRL) and growth hormone (GH) in the rat . 1 . Effects of opioid K-receptor agonists bremazocine and U-50,488 on sccret ion of PRL and GH : Comparison with morphine. Neuroendocrinology 42 : 75-8 1 .
Kunz P.L . , B lum 1 . W., Hart I .C, B ickel H . and Landis 1 . 1 985 . Effects of different energy intakes before and after calving on food intake, performance and blood hormones and metabol ites in dairy cows. Animal Production 40: 2 1 9-23 1 .
Kuroda F. , Moss l. and Vaughan M . 2007. Regulation of brefeldin A-inhibited guanine nucleotide-exchange protein 1 (BIG I ) and B IG2 act ivity via PKA and protein phosphatase 1 y. Proceedings of the National Academy of Sciences of the United States of America 1 04: 320 1 -3206.
Laarveld B., Christensen D.A. and Brockrnan R .P. 1 98 1 . The effect of insulin on net metabol ism of glucose and amino acids by the bovine mammary gland. Endocrinology 1 08 : 22 1 7-222 1 .
Laarveld B . , Chapl in R.K. and Brockman R.P. 1 985. Effects of insul in on the metabol ism of acetate, �-hydroxybutyrate and triglycerides by the bovine mammary gland. Comparative Biochemistry and Physiology B-Biochemistry & Molecular Biology 82: 265-267.
220
References
Lacasse P. , B lock E. and Petitclerc D. 1 994. Effect of plane of nutrition before and during gestation on the concentration of homlOnes in dairy hei fers. Journal of Dairy Science 77: 439-44S.
Lacasse P., Petitclerc D. , Pelletier G . , Delorme L. , Morisset 1 . , Gaudreau P. and Brazeau P. 1 99 1 . Effect of long-term administration of human growth hormone-releasing factor and (or) thyrotropin-releasing factor on hormone concentrations in lactating dairy cows. Domestic Animal Endocrinology 8 : 99- 1 08 .
Lafontan M . 1 994. Differential recruitment and differential regulat ion by physiological amines of fat cell /3- 1 , /3-2 and /3-3 adrenergic receptors expressed in native fat cells and in transfected cell l ines. Cellular Signalling 6: 363-392.
Lambert P .D. , Wilding 1 .P .H . , Turton M.D. , Ghatei M .A. and B loom S.R. 1 994. Effect of food deprivation and streptozotocin-induced diabetes on hypothalamic neuropeptide-Y release as measured by a radioimmunoassay-l inked microdialysis procedure. Brain Research 6S6: 1 3S- 1 40.
Land R .B . , Carr W.R., Hart I .e. , Osmond T.J . , Thompson R. and Ti lakaratne N . 1 983 . Physiological attributes as possible selection criteria for mi lk-production 3 . Plasmahomlone concentrations and metabolite and hormonal responses to changes in energy equil ibrium. Animal Production 37: 1 6S- 1 78 .
Lang F . , Bohmer c. , Palmada M. , Seebohm G. , Strutz-Seebohm N. and Vallon V. 2006. ( Patho )physiological significance of the serum- and glucocorticoid-inducible kinase isoforms. Physiological Reviews 86: I I S I - 1 1 78 .
Lapierre H . , Farmer c., Girard C . and Brazeau P. 1 992. Effect of age and intake on growth hormone kinetics in dairy hei fers. Domestic Animal Endocrinology 9: 1 99-207.
Lapierre H . , Peti tclerc D., Pel let ier G., Delorme L . , Dubreui l P., Morisset 1 . , Gaudreau P . , Couture Y. and Brazeau P. 1 990. Dose effect of human growth homlone-releasing factor and thyrotropin-releasing factor on hormone concentrations in lactating dairy cows. Domestic Animal Endocrinology 7: 485-496.
Larbaud D., Debras E., Tai l landier D., Samuels S .E . , Temparis S . , Champredon e., Grizard 1. and Attaix D. 1 996. Euglycemic hyperinslll inemia and hyperaminoacidemia decrease skeletal l11uscle ubiquitin mRNA in goats. American Journal of Physiology Endocrinology and Metabolism 34: ESOS-ES I 2 .
Larson B. L. 1 985. Biosynthesis and cel lular secretion of milk. In : Lactation. Ed. B .L . Larson. Ames: The Iowa State University Press, pp. 1 29- 1 63
Lawrence C .B . , Liu Y .L. , Stock MJ . and Luckrnan S .M . 2004. Anorectic actions of prolactinreleasing peptide are mediated by corticotropin-releasing homl0ne receptors. American Journal of Physiology-Regulatory Integrative and Comparative Physiology 286: R I O 1 -R I 07.
Le Jemtel T.H. , Song Y .H ., Mohler 1 . , Weaver M. , Pigott 1 . and Delafontaine P . 200S. Upregll lation of MuRF2 and down regulation of insulin-l ike growth factor- I and myostatin in skeletal muscles of patients with chronic heart fai lure. Circulation 1 1 2 : U822-U822 .
22 1
Chapter 8
Lee D .K., Nguyen T. , Porter CA., Cheng R. , George S .R. and O'Dowd B .F . 1 999. Two related G protein-coupled receptors: The distribution of GPR 7 in rat brain and the absence of GPR8 in rodents. Molecular Brain Research 7 1 : 96- 1 03 .
Lemosquet S . , Rideau N . , Rulquin H . , Faverdin P . , Simon 1 . and Verite R . 1 997. Effects o f a duodenal glucose infusion on the relationship between plasma concentrations of glucose and i nsulin in dairy cows. Journal of Dairy Science 80: 2854-2865 .
Leon H .V. , Hemandez-Ceron 1 . , Keisler D .H . and Gutierrez CG. 2004. Plasma concentrations of leptin, i nsulin- l ike growth factor-I, and insul in in relation to changes in body condition score in heifers. Journal of Animal Science 82 : 445-45 1 .
Leury B .1 . , Baumgard L .H . , B lock S .S . , Segoale N . , Ehrhardt R.A. , Rhoads R.P . , Bauman D.E. , Bell A.W. and Boisc lair Y.R. 2003 . Effect of insul in and growth hormone on plasma leptin in periparturient dairy cows. American Journal of Physiology - Regulatory, Integrative and Comparative Physiology 285: R 1 1 07-R I I 1 5 .
Levine A.S . , Grace M. , B i l l ington C . 1 . and Portoghese P .S . 1 990. Nor-binaltorphimine decreases deprivation and opioid-induced feeding. Brain Research 534: 60-64.
Levine A.S . , Winsky-Sommerer R. , Huitron-Resendiz S . , Grace M.K. and de Lecea L. 2005. I njection of neuropeptide W into paraventricular nucleus of hypothalamus increases food i ntake. American Journal of Physiology - Regulatory, Integrative and Comparative Physiology 288: R I 727-R I 732 .
Lightman S .L . and Young W.S. 1 987. Vasopressin, oxytocin, dynorphin, enkephalin and corticotropin-releasing factor mRNA stimulation in the rat. Journal of PhysiologyLondon 394: 23-39.
Li ljas A. 2004. Structural aspects of protein synthesis, 1 st edn. S ingapore: World Scientific Publishing Co. pp. 290
Linnane M. , Horan B ., Connolly 1 . , O'Connor P . , Buck ley F . and Di l lon P. 2004. The effect of strain of Holstein-Friesian and feeding system on grazing behaviour, herbage intake and productivity in the first lactation. Animal Science 78: 1 69- 1 78 .
Linzell 1 .L. and Peaker M . 1 97 1 . Mechanism of mi lk secret ion. Physiological Reviews 5 1 : 564.
Liu Z. and Dekkers J.CM. 1 998. Least squares interval mapping of quantitative trait loci under the infinitesimal genetic model in outbred populations. Genetics 1 48 : 495-506.
Liu Z., Long W., Fryburg D.A. and Barrett E.l. 2006. The regulation of body and skeletal muscle protein metabolism by hormones and amino acids. Journal of Nutrition 1 36: 2 1 2S-2 1 7.
Lobley G.E . , M i lano G.D. and van der Wait 1 .G. 2000. The l iver: Integrator of n itrogen metabol ism. In : Ruminant Physiology: Digestion, Metabolism, Growth and Reproduction. Ed. P .B . Cronje. Wall ingford: CAB! Publ ish ing, pp. 1 49- 1 68
Lomax M.A. , Baird G.D. , Mal l inson CB. and Symonds H . W. 1 979. Differences between lactating and non-lactating dairy cows in concentration and secretion rate of insulin. Biochemical 1ournaI 1 80: 28 1 -289.
Loor 1 . 1 . , Dann H .M . , Everts R.E., Ol iveira R., Green C.A., Guretzky N.A.l . , Rodriguez-Zas S .L . , Lewin H .A . and Drackley J .K. 2005 . Temporal gene expression profil ing of l iver
222

References
from periparturient dairy cows reveals complex adaptive mechanisms in hepatic function. Physiological Genomics 23: 2 1 7-226.
Loor 1 .1 . , Dann H.M. , Guretzky N.A.1 . , Everts R.E. , Oliveira R., Green C.A. , Litherland N .B . , Rodriguez-Zas S .L. , Lewin H .A . and Drackley lK. 2006. Plane of nutrition prepartum al ters hepatic gene expression and function in dairy cows as assessed by longitudinal transcript and metabol ic profil ing. Physiological Genomics 27: 29-4 1 .
L0vendahl P . and Sejrsen K. 1 993. Growth hormone release in calves selected for milk fat yield. Animal Production 56: 285-29 1 .
L0vendahl P . , Angus K.D. and Wool l iams l .A. 1 99 1 a. The effect of genetic selection for mi lk yield on the response to growth hormone secretagogues in immature catt le. lournal of Endocrinology 1 28 : 4 1 9-424.
L0vendahl P . , Wooll iams lA. and S innett-Smith P.A. 1 99 1 b. Response of growth hormone to various doses of growth hormone releasing factor and thyrotropin releasing hormone administered separately and in combination to dairy calves. Canadian lournal of Animal Science 7 1 : 1 045- 1 052.
L0vendahl P . , Liboriussen T., Jensen J . , Vestergaard M. and Sejrsen K. 1 994. Physiological predictors in calves of dairy breeds: Part l . Genetic parameters of basal and induced growth hormone secretion. Acta Agriculturae Scandinavica. Section A, Animal Science 44: 1 69- 1 76.
Lu M., Vergara S., Zhang L., Holl iday L.S . , Aris 1. and Gluck S .L . 2002 . The amino-terminal domain of the E subunit of vacuolar H+ -ATPase (V -ATPase) interacts w ith the H subunit and is required for V-ATPase function. lournal of Biological Chemistry 277 : 38409-384 1 5 .
Lu X.Y. , Barsh G .S . , Aki l H. and Watson S .1 . 2003. lnteract ion between a-melanocytestimulating hormone and corticotropin-releasing hormone in the regulation of feeding and hypothalamo-pituitary-adrenal responses. Journal of Neuroscience 23: 7863-7872.
Lucy M.C. , J iang H . and Kobayashi Y. 200 I . Changes in the somatotrophic axis associated with the initiation of lactation. lournal of Dairy Science 84: E 1 1 3-E 1 1 9.
Lue H .Q., Kapumiotu A. , F ingerle-Rowson G. , Roger T., Leng L. , Thiele M. , Calandra T., Bucala R. and Bernhagen l 2006. Rapid and transient activation of the ERK MAPK signall ing pathway by macrophage migration inhibitory factor (MIF) and dependence on JAB I /CS 5 and Src kinase act ivity. Cellular Signalling 1 8 : 688-703 .
Lukes A.J . , Bames M.A. and Pearson R.E. 1 989. Response to selection for milk yield and metabolic challenges in primiparous dairy cows. Domestic Animal Endocrinology 6: 287-298.
Mackenzie D.D.S . , Wilson G.F . , McCutcheon S.N. and Peterson S.W. 1 988. Plasma metabolite and hormone concentrations as predictors of dairy merit in young Friesian bu lls : effect of metabolic challenges and fasting. Animal Production 47: 1 - 1 0 .
Mackinnon M.l. and Georges M.A.J . 1 998. Marker-assisted preselection of young dairy sires prior to progeny-testing. Livestock Production Science 54: 229-250.
223
Chapter 8
Mackle T.R. , Dwyer D.A., I ngvartsen K.L . , Chouinard P .Y. , Lynch l .M. , Barbano D .M. and Bauman D.E . 1 999. Effects of insulin and amino acids on milk protein concentration and yield from dairy cows. Journal of Dairy Science 82 : 1 5 1 2- 1 524.
Majzoub l .A . 2006. Corticotropin-releasing hormone physiology. European Journal of Endocrinology 1 55 : S7 1 -S76.
Mansour A., Khachaturian H., Lewis M.E . , Akil H. and Watson S.J . 1 987. Autoradiographic differentiation of Il-opioid, 8-opioid, and K-opioid receptors in the rat forebrain and midbrain. Journal of Neuroscience 7: 2445-2464.
Mantysaari P . , lngvartsen K.L . and Toivonen V. 1 999. Feeding intensity of pregnant heifers: Effect of feeding intensity during gestation on performance and p lasma parameters of primiparous Ayrshire cows. Livestock Production Science 62 : 29-4 1 .
Mao H. , Zhao Q.S . , Daigle M. , Ghahremani M .H ., Chidiac P . and Albert P .R. 2004. RGS 1 7/RGSZ2, a novel regulator of G(i/o), G(z), and G(q) signal ing. Journal of Biological Chemislly 279: 263 1 4-26322.
Mashek D.G., I ngvartsen K.L. , Andersen 1.B. , Vestergaard M . and Larsen T. 200 1 . Effects ofa four-day hyperinsulinemic-euglycemic c lamp in early and mid-lactation dairy cows on p lasma concentrations of metabolites, hormones, and binding proteins. Domestic Animal Endocrinology 2 1 : 1 69- 1 85 .
Massari M .E . , R ivera R .R . , Voland 1 .R . , Quong M.W. , Breit T .M . , van Dongen 1 . 1 .M . , de Smit O. and Murre e. 1 998. Characterization of ABF- I , a novel basic hel ix-loop-hel ix transcription factor expressed in activated B Iymphocytes. Molecular and Cellular Biology 1 8 : 3 1 30-3 1 39 .
Mastorakos G . and Zapanti E . 2004. The hypothalamic-pituitary-adrenal axis in the neuroendocrine regulation of food intake and obesity: The role of corticotropin releasing hormone. Nutritional Neuroscience 7: 27 1 -280.
Mather I .H . and Keenan T. W. 1 998. I ntroduction - The cel l biology of milk secretion: Historical notes. Journal of Mammary Gland Biology and Neoplasia 3: 227-232.
Maust L.E., McDowell R.E. and Hooven N .W. 1 972. Effect of summer weather on performance of Holstein cows in three stages of lactation. Journal of Daily Science 55 : 1 1 33- / 1 39 .
McCann 1 .P . , Ul lmann M.B. , Temple M.R. , Reimers T.J . and Bergman E.N. 1 986. I nsul in and glucose responses to glucose injection in fed and fasted obese and lean sheep. Journal ofNutriNon 1 1 6: 1 287- 1 297.
McClary D.G., Sartin J .L . , Kemppainen R.J . and Wil l iams 1.e. 1 988 . Insulin and growth hormone responses to glucose infusion in mature and first-lactation dairy cows. American Journal of Veterinary Research 49: 1 702- 1 704.
McCusker R.H. 1 998 . Control l ing insulin-like growth factor activity and the modulation of insulin-l ike growth factor binding protein and receptor binding. Journal of Dairy Science 8 1 : 1 790- / 800.
McCutcheon S .N. and Bauman D.E . 1 986. Effect of chronic growth hormone treatment on responses to epinephrine and thyrotropin-releasing hormone in lactating cows. Journal of Dairy Science 69: 44-5 1 .
224
References
McDowell G .H . , Gooden J .M. , Leenanuruksa D. , Jois M . and Engl ish A.W. 1 987. Effects of exogenous growth hormone on milk production and nutrient uptake by muscle and mammary tissues of dai ry cows in mid-lactation. Australian Journal of Biological Sciences 40: 295-306.
McElhinny A.S . , Perry C.N. , Witt c.c. , Labeit S . and Gregorio c.c. 2004. Muscle-spec ific R ING finger-2 (MURF-2) is important for microtubule, intermediate fi lament and sarcomeric M-l ine maintenance in striated muscle development. Journal of Cell Science 1 1 7 : 3 1 75-3 1 88 .
McKenna N.1 . and O'Mal ley B . W. 2002. Combinatorial control of gene expression by nuclear receptors and coregulators. Cell 1 08 : 465-474 .
McKenzie B .A. , Kemp P .D . , Moot DJ . , Matthew C. and Lucas R.J . 1 999. Environmental effects on p lant growth and development. In: New Zealand Pasture and Crop Science. Ed. J . White and J . Hodgson. Auckland, N Z. : Oxford University Press, pp. 29-44
McNamara J .P . 1 988 . Regulation of bovine adipose tissue metabolism during lactation. 4. Doseresponsiveness to epinephrine as altered by stage of lactation. Journal of Dairy Science 7 1 : 643-649.
McNamara lP. 1 994. Lipid metabol ism in adipose tissue during lactation: a model of a metabolic control system. Journal of Nutrition 1 24: S 1 383-S 1 39 1 .
McNamara lP . 1 995 . Role and regulation of metabol ism in adipose tissue during lactation. The Journal of Nutritional Biochemistry 6: 1 20- 1 29.
McNamara lP . and H i l lers J .K . 1 986a. Adaptations in l ipid metabolism of bovine adipose tissue in lactogenesis and lactation. Journal of Lipid Research 27: 1 50- 1 5 7.
McNamara l . P . and H i l lers 1 .K. 1 986b. Regulation of bovine adipose tissue metabol ism during lactation. 2 . Lipolysis response to milk production and energy intake. Journal of Dairy Science 69: 3042-3050.
McNamara lP. and Hi l lers J . K. 1 986c . Regulation of bovine adipose tissue metabolism during lactation. I . Lipid synthesis in response to increased mi lk production and decreased energy intake. Journal of Dairy Science 69: 3032-304 1 .
McNamara lP. , McFarland D.C. and Bai S. 1 987. Regulation of bovine adipose tissue metabol ism during lactation . 3 . Adaptations of hormone-sensitive and l ipoprotein l ipases. Journal of Dairy Science 70: 1 377- 1 384.
Merchentha1er 1 . 1 993 . Induction of enkephalin in tuberoinfundibu1ar dopaminergic neurons during lactation. Endocrinology 1 33 : 2645-265 1 .
Mercier 1 .C . and Gaye P . 1 982. Early events i n secretion o f main milk proteins - Occurrence of precursors. Journal of Daily Science 65: 299-3 1 6.
Metcalf l .A. , Vernon R.G. , F l int DJ. and Weekes T .E .C . 1 986. Insulin binding to skeletal muscle microsomes during lactation in sheep. Proceedings of the Nutrition Society 46: 47A.
Metcalf l .A. , Vernon R.G. , Fl int DJ. and Weekes T.E .C. 1 99 1 . Insuli n binding to skeletal muscle microsomes in lactating and dry sheep. Hormone and Metabolic Research 23 : 2 7 1 -273 .
225
Chapter 8
Metz S .H .M. and van den Bergh S .G. 1 977. Regulation of fat mobil ization in adipose tissue of dairy cows in the period around parturition. Netherlands Journal of Agricultural Science 25 : 1 98-2 1 1 .
Metz S .H .M. , Mulder 1 . and Van Den Bergh S .G. 1 973 . Regulation of l ipolysis in bovine adipose tissue by the degree of saturation of p lasma albumin with fatty acids. Biochimica et Biophysica Acta (BBA) - Lipids and Lipid Metabolism 306: 42-50.
Meuwissen T.H.E . , Hayes B .1 . and Goddard M.E . 200 1 . Prediction of total genetic value using genome-wide dense marker maps. Genetics 1 57 : 1 8 1 9- 1 829.
Michel A., McCutcheon S.N., Mackenzie D.D.S . , Tait R.M. and Wickham B . W. 1 99 1 . Metabolic responses to exogenous bovine somatotropin in Friesian cows of low or high genetic merit . Domestic Animal Endocrinology 8 : 293-306.
Min S .H . , McCutcheon S .N. , Mackenzie D.D.S . and Wickham B.W. 1 993 . P lasma metabolite and hormone concentrations in Friesian cal ves of low or high genetic merit : effects of sex and age. Animal Production 56: 1 7-27 .
Miyoshi K. , Shirai e . , Horigome e. , Takenami K . , Kawasaki l and M izuta K. 2004. Rrs 1 p, a ribosomal protein L I I -binding protein, is required for nuclear export of the 60S preribosomal subunit in Saccharomyces cerevisiae. Febs Letters 565 : 1 06 - 1 1 0.
Mizoshita K. , Watanabe T., Hayashi H . , Kubota e . , Yamakuchi H. , Todoroki 1 . and Sugimoto Y. 2004. Quantitative trait loci analysis for growth and carcass traits in a half-sib fami ly of purebred Japanese B lack (Wagyu) cattle. Journal of Animal Science 82: 34 1 5-3420.
Mondal M.S . , Yamaguchi H . , Date Y., Shimbara T. , Toshinai K., Shimomura Y . , Mori M. and Nakazato M. 2003 . A role for neuropeptide W in the regulation offeeding behavior. Endocrin% gy 1 44 : 4729-4733.
Mondal M.S. , Yamaguchi H . , Date Y. , Toshinai K . , Kawagoe T., Tsuruta T., Kageyama H. , Kawamura Y . , Shioda S . , Shimomura Y. et al. 2006. Neuropeptide W is present in antral G cel l s of rat, mouse, and human stomach. Journal of Endocrinology 1 88 : 49-57.
Morel N. 2003. Neurotransmitter release: the dark side of the vacuolar-W ATPase. Biology of the Cell 95 : 453-457.
Morinaga N., Tsai S .e. , Moss l and Vaughan M. 1 996. Isolation ofa brefeldin A-inhibited guanine nucleot ide-exchange protein for ADP ribosylation factor (ARF) I and ARF3 that contains a Sec7-l ike domain. Proceedings of the National Academy of Sciences of the United States of America 93 : 1 2856- 1 2860.
Moshel Y., Rhoads R .E . and Barash I. 2006. Role of amino acids in translational mechanisms governing mi lk protein synthesis in murine and ruminant mammary epithelial cel ls . Journal of Cellular BiochemistlY 98: 685-700.
Moussavi A .R .H . , Gi lbert R.O., Overton T.R. , Bauman D.E . and Butler W.R. 2007. Effects of feeding fish meal and n-3 fatty acids on mi lk yield and metabolic responses in early lactating dairy cows. Journal of Dairy Science 90: 1 36- 1 44.
Mukherjee A. , Amato P . , AlIred D.e. , Fernandez-Valdivia R. , Nguyen J . , O'Malley B.W. , DeMayo F.1 . and Lydon lP. 2006. Steroid receptor coactivator 2 is essential for progesterone-dependent uterine function and mammary morphogenesis : lnsights from the mouse - Impl ications for the human. Journal of Steroid Biochemistry and Molecular Biology 1 02 : 22-3 1 .
226

References
Murondoti A . , Jorritsma R., Beynen A.C. , Wensing T. and Geelen M.J .H . 2004. Activit ies of the enzymes of hepatic gluconeogenesis in peri parturient dairy cows with induced fatty l iver. Journal of Dairy Research 7 1 : 1 29- 1 34 .
Nahi F. and Arbogast L.A. 2003 . Prolactin modulates hypothalamic preproenkephalin, but not proopiomelanocortin, gene expression during lactation. Endocrine 20: 1 1 5- 1 22 .
Nariai M . , Tanaka I. , Okada T . , Shirai c., Horigome C . and Mizuta K . 2005 . Synergistic defect i n 60S ribosomal subunit assembly caused by a mutation of Rrs I p, a ribosomal protein L I I -binding protein, and 3 '-extension of 5S rRNA in Saccharomyces cerevisiae. Nucleic Acids Research 33 : 4553-4562.
Nei lson D.R., Whittemore C.T, Lewis M. , Al l iston 1 .c. , Roberts DJ. , Hodgsonjones L.S. , M i l ls 1 . , Parkinson H . and Prescott 1 .H.D. 1 983 . Production characteristics of high-yielding dairy cows. Animal Production 36 : 32 1 -334.
evi l le M.C . , Mc Fad den TB. and Forsyth LA. 2002. Hormonal regulation of mammary differentiation and milk secretion. Journal of Mammary Gland Biology and Neoplasia 7 : 49-66.
ewbold lA. , Chapin L.T., Zinn S .A. and Al ien Tucker H. 1 99 1 . Effects of photoperiod on mammary development and concentration of homlones in serum of pregnant dairy heifers. Journal of Dairy Science 74 : 1 00- 1 08.
Nibler R. 1 995. Approaching zero-defects through optimal operator matching. In: Total Quality Management: Proceedings ofthejirst world congress. Ed. G .K. Kanj i . London: Chapman & Hall , pp. 640
Nishi I. and Forgac M. 2002. The vacuolar ( H+)-atpases - Nature's most versati le proton pumps. Nature Reviews Molecular Cell Biology 3: 94- 1 03 .
i xon D .A . , Akasha M.A. and Anderson R.R. 1 988 . Free and total thyroid hormones in serum of holstein cows. Journal of Daily Science 7 1 : 1 1 52- 1 1 60.
Noda M. , Furutani Y., Takahashi H . , Toyosato M., Hirose I., I nayama S., akanishi S . and N uma S. 1 982. Cloning and sequence analysis of cDNA for bovine adrenal preproenkephal in . Nature 295: 202-206.
Nunn c., Mao H., Chidiac P. and Albert P .R. 2006. RGS 1 7IRGSZ2 and the RZ/A family of regulators of G-protein signaling. Seminars in Cell & Developmental Biology 1 7 : 390-399.
O'Dowd B .F. , Scheideler M.A., guyen T., Cheng R. , Rasmussen lS. , Marchese A. , Zastawny R. , Heng H .H.Q. , Tsui L . -c . , Shi X. et af. 1 995 . The cloning and chromosomal mapping of two novel human opioid-somatostatin-like receptor genes, GPR7 and G PR8, expressed in discrete areas of the brain. Genomics 28 : 84-9 1 .
Oh W., Lee E.W., Sung Y .H . , Yang M.R. , Ghim 1 . , Lee H .W. and Song 1 .W. 2006. Jab l i nduces the cytoplasmic local ization and degradat ion of p53 in coordination with Hdm2. Journal of Biological Chemistry 28 1 : 1 7457- 1 7465.
Okamoto S . , Kimura K. and Saito M. 200 1 . Anorectic effect of leptin is mediated by hypothalamic corticotropin-releasing hormone, but not by urocortin, in rats. Neuroscience Letters 307: 1 79- 1 82.
227
Chapter 8
Okine EK, Cherry R. and Kennel ly J . J . 1 994. G lucose and amino acid transport and metabolism in flat duodenal sheets of dairy cattle at three stages of lactation. Comparative Biochemistry and Physiology Part A: Physiology 1 07 : 7 1 9-726.
Ol l ivier-Bousquet M. 2002. Mi lk l ipid and protein traffic in mammary epithel ial cel ls : joint and independent pathways. Reproduction Nutrition Development 42: 1 49- 1 62.
Ordway R.S . , Ishler V.A. and Varga G.A. 2002. Effects of sucrose supplementation on dry matter intake, mi lk yield, and blood metabolites or periperturient holstein dairy cows. lournal of Dairy Science 85: 879-888.
O'Rei l ly D. and Greaves D.R. 2007. Cel l-type-specific expression of the human CD68 gene is associated with changes in Pol I I phosphorylation and short-range intrachromosomal gene looping. Genomics 90: 407-4 1 5 .
0rskov E.R. , Reid G.W. and McDonald l. 1 98 1 . The effects of protein degradabi l ity and food intake on mi lk yield and composition in cows in early lactation. British Journal of Nutrition 45: 547-555 .
Osmond TJ . , Carr W.R., H inks CJ .M. , Land R .B . and H i l l W.G. 1 98 1 . Physiological attributes as possible selection criteria for milk production. 2. P lasma insulin, tri-iodothyronine and thyroxine in bul ls . Animal Production 32 : 1 59- 1 63 .
Ottinger M.A. , Rosewell K .L . , Wei land N.G. , Margaretten K.T. and Wise P .M. 1 995 . Effect of lactation on hypothalamic preproenkephalin gene expression. lournal of Neuroendocrinology 7 : 34 1 -346.
Overton T.R., Drackley 1 .K . , Douglas G.N., Emmert L .S . and Clark 1 .H . 1 998 . Hepatic gluconeogenesis and whole-body protein metabolism of periparturient dai ry cows as affected by source of energy and intake of the prepartum diet. Journal of DailY Science 8 1 : 295 .
Padi l l a P . I . , Pacheco-Rodriguez G. , Moss 1 . and Vaughan M. 2004. Nuclear local ization and molecular partners of B IG I , a brefeldin A-inhibited guanjne nucleotide-exchange protein for ADP-ribosylation factors. Proceedings of the National Academy of Sciences of the United Slales of America I O \ : 2752-2757.
Palmada M. , Spei l A. , Jeyaraj S . , Bohmer C . and Lang F. 2005. The serine/threonine kinases SGK I , 3 and PKB stimulate the amino acid transporter ASCT2. Biochemical and Biophysical Research Communications 33 1 : 272-277.
Panicke L., F ischer E., Staufenbiel R. and Reklewski Z. 2002. Suitabi l i ty of parameters of glucose tolerance test ( GTT) for the additional evaluation of young bulls . World Congress on Genetics Applied to Livestock Production 7.
Pareek N. , Voigt J . , Bel lmann 0., Schneider F . and Hammon H.M. 2007. Energy and nitrogen metabolism and insulin response to glucose challenge in lactating German Holstein and Charolais heifers. Livestock Science 1 1 2 : 1 1 5- 1 22 .
Pechoux c . , Boisgard R . , Chanat E . and Lavialle F . 2005. Ca2+-independent phospholipase A2 participates in the vesicular transport of milk proteins. Biochimica Et Biophysica ActaMolecular Cell Research 1 743 : 3 1 7-329.
Pere M.C. , Etienne M . and Dourmad J .Y. 2000. Adaptations of glucose metabol ism in multiparous sows: effects of pregnancy and feeding level. lournal of Animal Science 78: 2933-294 1 .
228

References
Perera K.S . , Gwazdauskas F.e. , Akers R .M. and Pearson R.E. 1 985. Seasonal and lactational effects on response to thyrotropin releasing hormone injection in Holstein cows. Domestic Animal Endocrinology 2: 43-S2.
Perriel lo G. , Pampanel l i S., Porcel lati F., Avogaro A., Bosi E., Petrel la G. , Squatrito S . , Furneri S . , Marra G. , Vital i L. et a/. 200S. Insulin aspart improves meal time glycaemic control in patients with Type 2 diabetes: a randomized, stratified, double-bl ind and cross-over trial . Diabetic Medicine 22: 606-6 1 1 .
Peters lP . 1 986. Consequences of accelerated gain and growth hormone administration for l ipid metabol ism in growing beef steers. Journal of Nutrition 1 1 6 : 2490-2S03 .
Peterson J . 1 . and Young D.S . 1 968. Evaluation of the hexokinase/glucose-6-phosphate dehydrogenase mcthod of determination of glucose in urine. Analytical Biochemistry 23 : 3 0 1 -3 1 6.
Pethick D.W. and Lindsay D.B. 1 982 . Acetate metabolism in lactating shecp. British Journal of Nutrition 48: 3 1 9-328.
Pezzi e . , Accorsi P .A. , Vigo D. , Govoni N. and Gaiani R. 2003 . S '-deiodinase activity and circulating thyronines in lactating cows. Journal of Dairy Research 86: I S2- I S8 .
Ph i l l ips G .J . , Citron T.L . , Sage l .S . , Cummins K.A. , Cecava M.l . and McNamara l .P . 2003. Adaptations in body muscle and fat in transition dairy cattle fed differing amounts of protein and methionine hydroxy analog. Journal of Dairy Science 86: 3634-3647.
Picard F. , Gehin M., Annicotte l .S . , Rocchi S., Champy M.F., O'Mal ley B .W. , Chambon P. and Auwerx l. 2002. SRC- I and TIF2 control energy balance between white and brown adipose t issues. Cell I l l : 93 1 -94 1 .
Pizon V. , Lakovcnko A . , van der Yen P .F .M . , Kel ly R. , Fatu c., Furst 0.0. , Karsenti E . and Gautel M. 2002. Transient association of titin and myosin with microtubules in nascent myofibrils directed by the MURF2 RING-fingcr protein. Journal of Cell Science l i S : 4469-4482.
Plaut K. , Bauman DE, Agergaard N. and Akers R.M. 1 987. Effect of exogenous prolactin administration on lactational performance of dairy cows. Domestic Animal Endocrinology 4: 279-290.
Plebani M. and Carraro P . 1 997 . Mistakcs in a stat laboratory: types and frequency. Clinical Chemistly 43: 1 348-1 3S I .
Plouzek e.A. and Trenkle A. 1 99 1 . Growth hormone parameters at four ages in intact and castrated male and female cattle. Domestic Animal Endocrinology 8: 63-72 .
Pol ineni P . , Aragonda P . , Xavier S . , Furuta R. and Adelson D. 2006. The bovine QTL viewer: a web accessible database of bovine Quantitative Trait Loci. BMC Bioinformatics 7: 283 .
Pruitt K .D . and Maglott D .R. 200 I . RefSeq and LocusLink: NCBT gene-centred resources. Nucleic Acids Research 29: 1 37- 1 40.
Pruitt K.D. , Tatusova T. and Maglott D.R. 200S . NCBI Reference Sequence ( RefSeq) : a curated non-redundant sequence database of genomes, transcripts and proteins. Nucleic Acids Research 33 : DSO I -S04.
229
Chapter 8
Pryce 1 .E . , Harris B . L. and Montgomerie W.A. 2007. Limits to selection fro production efficiency in New Zealand dairy cattle. Proceedings of the Seventeenth Conference of the Associationfor the Advancement of Animal Breeding and Genetics, Armidale, NSW, Australia. 453-460.
Radc l iff R.P . , Lookingland K.J . , McMahon C.D. , Chapin L.T. and Tucker H .A . 2003 . Thyrotropin-releasing hormone mediates serotonin-induced secretion of GH in cattle. Domestic Animal Endocrinology 24: 1 37- 1 53 .
Raught 8. , G ingras A.C. and Sonenberg N. 200 I . The target of rapamycin (TOR) proteins. Proceedings of the National Academy of Sciences of the United States of America 98: 7037-7044.
Rausch M. I . , Tripp M.W. , Govoni K.E. , Zang W., Webert W.J . , Crooker B .A . , Hoagland T.A. and Zinn S .A. 2002. The influence of level of feeding on growth and serum insul in-l ike growth factor I and insulin-l ike growth factor-binding proteins in growing beef cattle supplemented with somatotropin. Journal of Animal Science 80: 94- 1 00.
Rebhan M., Chalifa-Caspi V. , Prilusky 1 . and Lancet D. 1 997. GeneCards: encyclopedia for genes, proteins and diseases. Rehovot, Israel : Weizmann Institute of Science, Bioinformatic Unit and Genome Center.
Reid I .M . , Roberts C.l and Baird G.D . 1 980. Effects of underfeeding during pregnancy and lactation on structure and chemistry of bovine l iver and muscle. lournal of Agricultural Science 94: 239-245.
Reimers T.J . , McCann lP. and Cowan R.G . 1 983 . Effects of storagc t imcs and temperatures on T3, T4, LH, prolactin, insulin, cortisol and progesterone concentrations in blood samp les from cows. lournal of Animal Science 57: 683-69 1 .
Ren M.Q. , Wegner l, Bellmann 0., Brockmann G.A. , Schneider F. , Teuscher F. and Ender K. 2002. Comparing mRNA levels of genes encoding leptin, leptin receptor, and l ipoprotein l ipase between dairy and beef cattle. Domestic Animal Endocrinology 23 : 3 7 1 -38 1 .
Rexhepaj R. , Artunc F. , Metzger M. , Skutel la T. and Lang F. 2007. P I3-k inase-dependent electrogenic intestinal transport of glucose and amino acids. Pflugers Archiv-European lournal of Physiology 453 : 863-870.
Reynolds C .K . 1 995 . Quantitative aspects of l iver metabol ism in ruminants. Eighth International Symposium on Ruminant Physiology, Stuttgart, Germany. 35 1 -372 .
Reynolds C.K. , Durst B . , Lupol i 8. , Humphries DJ. and Beever D.E. 2004. Visceral t issue mass and rumen volume in dairy cows during the transition from late gestation to early lactation. lournal of Dairy Science 87: 96 1 -97 1 .
Rhoads R.P . , Kim lW. , Leury B .1 . , Baumgard L .H . , Segoale . , Frank S .1 . , Bauman D.E . and Boisc lair Y .R. 2004. Insulin increases the abundance of the growth hormone receptor in l iver and adipose tissue of periparturient dairy cows. lournal of Nutrition 1 34: 1 020-1 027 .
Richard D . , Lin Q. and Timofeeva E. 2002. The corticotropin-releasing factor family of pep tides and CRF receptors: their roles in the regulation of energy balance. European Journal of Pharmacology 440: 1 89- 1 97 .
230
References
Robb L. , Hartley L. , Wang CC, Harvey R.P. and Begley CG. 1 998. muscul in : a murine basic helix-loop-helix transcription factor gene expressed in embryonic skeletal muscle. Mechanisms of Development 76: 1 97-20 I .
Roberts C .J . and Turfrey B .A. 1 983. Muscle fibre area as an indicator of protein mobil isation in early lactation.JVth International Symposium on Protein Metabolism and Nutrition, Clermont-Ferrand, France. 1 9 1 - 1 94.
Robinson D.L. , Hamrnond K. , Graser H.-U. and McDowell G.H. 1 992. Relationships between breeding values and physio logical responses to fasting and refeeding in dairy bulls . Journal of Animal Breeding and Genetics 1 09 : 26-36.
Roche J .R. , Berry D.P. and Kolver E.S. 2006a. Holstein-Friesian strain and feed effects on milk production, body weight, and body condition score profiles in grazing dairy cows. Journal of Dairy Science 89: 3 532-3543 .
Roche J .R . , Sheahan A.J . , Chagas L .M. and Berry D.P. 2006b. Short Communjcation: Genetic selection for milk production increases plasma ghrelin in dairy cows. lournal of Dairy Science 89: 347 1 -3475 .
Rogatsky / . , Zarember K.A. and Yamamoto K.R. 200 1 . Factor recruitment and TIF2fGRI P I corepressor activity at a col lagenase-3 response element that mediates regulation by phorbol esters and hormones. The EMBO lournal 20: 607 1-6083.
Romo G.A. , Elsasser T.H . , Kahl S . , Erdman R.A. and Casper D.P. 1 997. Dietary fatty acids modulate hormone responses in lactating cows: mechanistic role for 5'-deiodinase activity in tissue. Domestic Animal Endocrinology 1 4 : 409-420.
Ronge H. and Blum J .W. 1 989. I nsulin-l ike growth factor I responses to recombinant bovine growth hormone during feed restriction in heifers. Acta Endocrinologica (Copenh) 1 20: 735-744.
Ronge H . , Blum I .W. , Clement C, Jans F., Leuenberger H. and B inder H. 1 988 . Somatomedin C in dairy cows related to energy and protein supply and to milk production. Animal Production 47: 1 65- 1 83 .
Rose M.T . , Obara Y. , Itoh F . , Hashimoto H . and Takahashi Y. 1 997. Non-insulin and insul inmediated glucose uptake in dairy cows. lournal of Dairy Research 64 : 34 1 -353 .
Rose M.T. , Itoh F., Matsumoto M. , Takahashi Y. and Obara Y . 1 998. Insul in-independent glucose uptake in growth hormone treated dairy cows. lournal of Dairy Research 65 : 423-43 I .
Rose M.T. , Obara Y., Fuse H . , Itoh F . , Ozawa A. , Takahashi Y . , Hodate K. and Ohashi S . 1 996. Effect of growth hormone-releasing factor on the response to insulin of cows during early and late lactation. Journal of Dairy Science 79: 1 734- I 745 .
Rosel D. and Kimmel A.R. 2006. The COP9 signalosome regulates cell prol iferation of Dictyostelium discoideum. European Journal of Cell Biology 85 : 1 023- 1 034.
Roseler D.K. , Fox D.G., Chase L.E. and Stone W.C 1 993 . Feed intake prediction and diagnosis in dairy cows. Proceedings of the Cornell Nutrition Conferencefor Feed Manufacturers, Rochester, NY. 2 1 6.
Rosen E .D. and Spiegelman B.M. 2006. Adipocytes as regulators of energy balance and glucose homeostasis . Nature 444: 847-853 .
23 1

Chapter 8
Rosenfeld M.G. , Lunyak V.V. and Glass CK. 2006. Sensors and signals: a coactivator/corepressor/epigenetic code for integrating signal-dependent programs of transcriptional response. Genes & Development 20: 1 405- 1 428 .
Ruckebusch Y . and Malbert C H. 1 986. Stimulation and inhibition of food intake in sheep by central ly-administered hypothalamic releasing factors. Life Sciences 38 : 929-934.
Sallese M . , Pulvirenti T. and Luini A . 2006. The physiology of membrane transport and endomembrane-based signal l ing. Embo lournal 25 : 2663-2673 .
Sandu C, Rexhepaj R., Graharnmer F. , McCormick 1 .A. , Henke G. , Palmada M. , Namrni S . , Lang U . , Metzger M. , Just L . et al. 2005. Decreased intestinal glucose transport in the sgk3-knockout mouse. Pflugers Archiv-European lournal of Physiology 45 1 : 437-444.
Sano H . , Narahara S . , Kondo T. , Takahashi A. and Terashima Y . 1 993. Insul in responsiveness to glucose and tissue responsiveness to insulin during lactation in dairy cows. Domestic Animal Endocrinology 1 0: 1 9 1 - 1 97 .
Sartin J .L . , Kemppainen R .J . , Cumrnins K.A. and Wil l iams 1 .C 1 988 . Plasma concentrations of metabolic hormones in high and l ow producing dairy cows. Journal of Dairy Science 7 1 : 650-657.
Sasaki 0., Yamamoto N., Togashi K., Minezawa M., Ishii K. and Takeda H. 2003. Use of plasma metabolite concentrations after glucose injection to predict the genetic abi l i ty of milk production in young calves. lapan Agricultural Research Quarterly 37: 1 33- 1 40.
Schams D. , Kohlenberg S . , Amselgruber W.M., Berisha B., Pfaftl M.W. and S inowatz F . 2003 . Expression and local isation of oestrogen and progesterone receptors in the bovine mammary gland during development, function and involution. Journal of Endocrinology 1 77 : 305-3 1 7.
Schei I . , Danf<er A. , Boman LA. and Volden H . 2007. Post-ruminal or intravenous infusions of carbohydrates or amino acids to dairy cows I . Early lactation. Animal I : 50 1 -5 1 4.
Scherl A . , Coute Y. , Deon C . , Calle A. , K indbeiter K., Sanchez 1 .e. , Greco A. , Hochstrasser D . and Diaz J .J . 2002. Functional proteomic analy i s of human nucleolus. Molecular Biology of the Cell 1 3 : 4 1 00-4 1 09 .
Schrooten e., Bovenhuis H . , van Arendonk J .A .M. and Bij ma P. 2005. Genetic progress in multistage dairy cattle breeding schemes using genetic markers. lournal of Dairy Science 88 : 1 569- 1 58 1 .
Schulz S . , Stumm R. and H611t V. 2007. Immunofluorescent identification of neuropeptide Bcontaining nerve fibers and terminals in the rat hypothalamus. Neuroscience Letters 4 1 1 : 67-7 1 .
Sechen S .J . , McCutcheon S . . and Bauman D.E . 1 989. Response to metabol ic challenges in early lactation dai ry cows during treatment with bovine somatotropin. Domestic Animal Endocrinology 6: 1 4 1 - 1 54.
Sechen S . J . , Dunshea F.R. and Bauman D.E . 1 990. Somatotropin in lactating cows: effect on response to epinephrine and insulin . American lournal oJ Physiology 258: E582-E588 .
Sejrsen K . and L0vendahl P . 1 986. Criteria identifying genetic merit for mi lk production. In :
232
Exploiting New Technologies in Animal Breeding: Genetic Developments. Ed . e. Smith, J .W.B. K ing and 1 .e. McKay. New York: Oxford University Press, pp. 202
References
Sejrsen K. , Larsen F. and Andersen B .B . 1 984. Use of plasma hormone and metabol ite levels to predict breeding value of young bulls for butterfat production. Animal Production 39: 335-344.
Shahbazian D . , Roux P .P . , Mieulet V., Co hen M.S . , Raught B . , Taunton 1., Hershey 1 .W.B . , B lenis 1 . , Pende M . and Sonenberg N. 2006. The mTORJP13K and MAPK pathways converge on eIF4B to control its phosphorylation and activity. Embo Journal 25 : 278 1 -279 1 .
She P. , Lindberg G.L . , H ippen A.R. , Beitz D.C and Young 1 .w. 1 999a. Regulation of messenger ribonucleic acid expression for gluconeogenic enzymes during glucagon infusions into lactating cows. Journal of Daily Science 82 : 1 1 53 - 1 1 63 .
She P . , H ippen A.R., Young I .W., Lindberg G . L. , Beitz D .C, Richardson L .F . and Tucker R.W. I 999b. Metabol ic responses of lactating dairy cows to 14-day intravenous infusions of glucagon. Journal of Dairy Science 82: 1 1 1 8- 1 1 27 .
Shen X. , Hong M.S . , Moss 1 . and Vaughan M. 2007. B IG I , a brefeldin A-inhibited guanine nucleotide-exchanae protein, is required for correct glycosylation and function of integrin � I . Proceedings of the National Academy of Sciences of the United States of America 1 04: 1 230- 1 235 .
Shimizu H . , rnoue K. and Mori M. 2007. The leptin-dependent and -independent melanocortin signal ing system: regulation of feeding and energy expenditure. Journal of Endocrinology 1 93 : 1 -9 .
Shimomura Y. , Harada M. , Goto M. , Sugo 1., Matsumoto Y. , Abe M. , Watanabe 1., Asami 1. , Kitada C, Mori M. et al. 2002. ldenti ficat ion of neuropeptide W as the endogenous l igand for orphan G-protein-coupled receptors GPR7 and GPR8. Journal of Biological ChemistlY 277: 35826-35832.
Shingu H. , Hodate K. , Kushibiki S . , Ueda Y . , Watanabe A. , Shinoda M. and Matsumoto M . 200 I . Profiles of growth hormone and insul in secretion, and glucose response to insul in in growing Japanese B lack heifers (beef type) : comparison with Holstein heifers (dairy type). Comparative BiochemisliY and Physiology Part C: Toxicology & Pharmacology 1 30: 259-270.
Shingu H . , Hodate K., Kushibiki S., Ueda Y . , Watanabe A., Shinoda M. and Matsumoto M . 2002. Breed differences in growth hormone and insulin secretion between lactating Japanese B lack cows (beef type) and Holstein cows (dairy type). Comparative Biochemistry and Physiology Part C: Toxicology & Pharmacology 1 32 : 493-504.
Shirley 1 .E . , Emery R .S . , Convey E .M. and Oxender W.D. 1 973 . Enzymic changes in bovine adipose and mammary t issue, serum and mammary tissue hormonal changes with initiation of lactation. Journal of Dairy Science 56: 569-574.
Shojaiefard M . , Christie D.L. and Lang F. 2005 . Stimulation of the creatine transporter SLC6A8 by the protein kinases SGK I and SGK3 . Biochemical and Biophysical Research Communications 334: 742-746.
S idhu K.S . and Emery R.S . 1 973 . Blood fatty acids and glycerol response to diet and norepinephrine. Journal of Dairy Science 56: 258-260.
233
Chapter 8
Silva R.M. , Grossman H.c. , Rossi G.c. , Pasternak G.W. and Bodnar R.1 . 2002a. Pharmacological characterization of l3-endorphin- and dynorphin A 1 - 1 7-induced feeding using G-protein a-subunit antisense probes in rats. Peptides 23 : 1 1 0 1 - 1 1 06 .
S i lva R.M. , Grossman H.C. , H adj imarkou M.M. , Rossi G .c . , Pasternak G.w. and Bodnar R .1 . 2002b. Dynorphin A( 1 - 1 7)-induced feeding: Pharmacological characterization using selective opioid antagon ists and antisense probes in rats. Journal of Pharmacology and Experimental Therapeutics 30 I : 5 1 3-5 1 8 .
Singh G. and Davenport A.P . 2006. Neuropeptide B and W: neurotransmitters in an emerging G-protein-coupled receptor system. British Journal of Pharmacology 1 48 : 1 033- 1 04 1 .
Sinnett-Smith P.A. , S lee 1 . and Wooll iams 1 .A . 1 987. B iochemical and physiological responses to metabolic stimuli in friesian calves of differing genetic meri t for mi lk production. Animal Production 44: 1 1 - 1 9 .
S ipols A.1 . , Bayer J . , Bennett R. and Figlewicz D.P . 2002 . Intraventricular insul in decreases Kopioid-mediated sucrose intake in rats. Pep tides 23 : 2 1 8 1 -2 1 87 .
Sjogren K. , L iu J .L. , B lad K. , Skrtic S . , Vidal 0., Wal lenius V. , LeRoith D. , Tornel l 1 . , Isaksson O.G.P . , Jansson J .O. et at. 1 999. Liver-derived insul in-l ike growth factor I ( IGF-I) is the principal source of IGF-1 in b lood but is not required for postnatal body growth in mice. Proceedings of the National Academy of Sciences of the United States of America 96: 7088-7092.
Smith M.S . 1 993. Lactation alters neuropeptide-Y and proopiomelanocortin gene expression in the arcuate nucleus of the rat. Endocrinology 1 33 : 1 258- 1 265.
Smith R.W., Knight R.A. and Walsh A. 1 98 1 . Effect of lactation on the concentrations of proteins, l ipids and nucleic acids in ovine skeletal muscle. Research in Veterinary Science 30: 253-254.
Smits P., Smeitink J .A .M. , van den Heuvel L .P . , Huynen M.A. and Ettema T.1 .G. 2007. Reconstructing the evolution of the mitochondrial ribosomal proteome. Nucleic A cids Research 35 : 4686-4703 .
Snijders S .E . , Di l lon P .G. , O'Farre l l K .J . , Diskin M. , Wylie A .R. , O'Cal laghan D . , Rath M . and Boland M.P . 200 I . Genetic merit for mi lk production and reproductive success in dairy cows. Animal Reproduction Science 65: 1 7-3 1 .
Sorensen M.T. , Norgaard JV, Thei l P .K. , Vestergaard M . and Sejrsen K. 2006. Cell turnover and activity in mammary tissue during lactation and the dry period in dairy cows. Journal of Dairy Science 89: 4632-4639.
S0rensen P., Grochowska R., Holm L., Henryon M. and L0vendahl P. 2002. Polymorphism in the bovine growth hormone gene affects endocrine release in dairy calves. Journal of Dairy Science 85 : 1 887- 1 893 .
Spelman R.J . and Garrick D.J . 1 997. Uti l i sation of marker assisted selection in a commercial dairy cow population. Livestock Production Science 47: 1 39- 1 47 .
Spelman R.J . , Lopez-Vil lalobos N. and Garrick D.J. 1 998. Experimental designs for quantitative trait loci detection in the New Zealand dairy industry. Proceedings of the New Zealand Society of Animal Production, Massey University, Palmerston North, New Zealand. 6-9.
234
References
Spelman R.J . , Garrick D.J . and van Arendonk JAM. 1 999. Uti l isation of genetic variation by marker assisted selection i n commercial dairy catt le populations. Livestock Production Science 59 : 5 1 -60.
Spelman R.J., Keehan M., Obolonkin V. and Coppietcrs W. 2007. Application of genomic information in a dairy cattle breeding scheme. Proceedings of the Seventeenth Conference of the Association for the Advancement of Animal Breeding and Genetics, Armidale, NSW, Austra l ia . 47 1 -478.
Spelman R.J . , Coppieters W., Karim L., van Arendonk JAM. and Bovenhuis H . 1 996. Quantitat ive trait loci analysis for five milk production traits on chromosome s ix in the Dutch Holstein-Friesian population. Genetics 1 44: 1 799- 1 807.
Spelman R.J . , Mi l ler F.M., Hooper lD. , Thielen M . and Garrick DJ. 200 I . Experimental design for QTL trial involving New Zealand Friesian and Jersey breeds. Proceedings of the Associationfor the Advancement of Animal Breeding and Genetics 1 4: 393-396.
Spelman R.J . , Hooper lD. , Stanley G., Kayis SA and Harcourt S. 2004. Friesian Jersey crossbred trial : Generating phenotypes for the discovery of quantitative trait 10c i .Proceedings of the New Zealand Society of Animal Production, Hami lton, New Zealand. 92-95 .
Spicer L.J . , Tucker W.B. and Adams G.D. 1 990. Insul in-like growth factor-I in dairy cows: relationsh ips among energy balance, body condition, ovarian activity, and estrous behavior. Journal of Daity Science 73: 929-937.
Stam P. 1 986. The use of marker loci in selection for quantitative characters. In: Exploiting New Technologies in Animal Breeding: Genetic Developments. Ed. C . Smith, J .W.B . King and le. McKay. New York: Oxford University Press, pp. 202
Stein lA. , Znamcnsky V., Baumer F., Rossi G.C. , Pasternak G.W. and Bodnar R.J. 2000. Mercaptoacetate induces feeding through central opioid-mediated mechanisms in rats. Brain Research 864: 240-2 5 1 .
Stelwagen K . and Grieve D.G. 1 992 . Effect of p lane o f nutrition between 6 and 1 6 months of age on body composition, p lasma hormone concentrations and first-lactation mi lk production in Holstein heifers. Canadian Journal of Animal Science 72: 337-346.
Suchyta S .P. , Sipkovsky S., Halgren R.G. , Kruska R., Elftman M., Weber-Nielsen M. , Vandehaar M.J . , Xiao L., Tempelman R.J . and Coussens P .M. 2003. Bovine mammary gene expression profil ing using a cDNA microarray enhanced for mammary-specific transcripts. Physiological Genomics 1 6: 8- 1 8 .
Sun-Wada G.H . , Wada Y. and Futai M . 2004. Diverse and essential roles of mammal ian vacuolar-type proton pump ATPase: toward the physiological understanding of inside acidic compartments. Biochimica Et Biophysica Acta-Bioenergetics 1 658 : 1 06 - 1 1 4.
Sun-Wada G .H ., Toyomura T. , Murata Y. , Yamamoto A. , Futai M . and Wada Y. 2006. The a3 i soform of V-A TPase regulates insulin secretion from pancreatic �-cel 1s. Journal of Cell Science 1 1 9 : 453 1 -4540.
Sutter F. and Beever D .E . 2000. Energy and nitrogen metabol ism in Holstein-Friesian cows during early lactation. Animal Science 70: 503-5 1 4.
235

Chapter 8
Swanson E .W. and Mi l ler lK. 1 973 . Restoration of normal lactation in hypothyriod cows. Journal of Dairy Science 56 : 92-97.
Swanson L.V. and Lind R.E . 1 976. Lactational response of dairy cows to oral administration of a synthetic glucocorticoid. Journal of Dairy Science 59: 6 1 4-6 1 9.
Tamminga S . , Luteijn P.A. and Meijer R.G.M. 1 997. Changes in composition and energy content of l iveweight loss in daily cows with time after parturition. Livestock Production Science 52 : 3 1 -38 .
Tanaka H . , Yoshida T., M iyamoto N. , Motoike T. , Kurosu H . , Shibata K. , Yamanaka A. , Wil l iams S .e. , Richardson lA., Tsuj ino N. et af. 2003. Characterization of a family of endogenous neuropeptide l igands for the G protein-coupled receptors GPR7 and GPR8. Proceedings of the National Academy of Sciences of the United States of America 1 00: 625 1 -6256.
Tang F. 1 99 1 . Endocrine control of hypothalamic and pituitary Met-Enkephalin and �Endorphin contents. Neuroendocrinology 53: 68-76.
Taylor M.M. , Yuill E .A. , Baker J .R. , Ferri c.e., Ferguson A.V. and Samson W.K. 2005 . Actions of neuropeptide W in para ventricular hypothalamus: implications for the control of stress hormone secretion. American Journal of Physiology - Regulatory, Integrative and Comparative Physiology 288: R270-275.
Taylor VJ., Beever D.E. , Bryant M.1 . and Wathes D.e. 2006. Pre-pubertal measurements of the somatotrophic axis as predictors of milk production in Holstein-Friesian dairy cows. Domestic Animal Endocrinology 3 1 : 1 - 1 8 .
Tessier M . and Woodgett 1 .R . 2006. Role of the Ph ox homology domain and phosphorylation in activation of serum and glucocorticoid-regulated kinase-3. Journal of Biological ChemistlY 28 1 : 23978-23989.
Thissen 1 . P. , Ketelslegers lM. and Underwood L.E. 1 994. Nutritional regulation of the insulinl ike growth factors. Endocrine Reviews 1 5 : 80- 1 0 1 .
Thomas S .M. and Brugge lS. 1 997. Cellular functions regulated by Src family kinases. Annual Review of Cell and Developmental Biology 1 3 : 5 1 3-609 .
Tilakaratne N. , Al l iston 1 .e. , Carr W.R. , Land R .B . and Osmond T.1. 1 980. Physiological attributes as possible selection criteria for milk production. Animal Production 30: 327-340.
Tisdale EJ. 1 999. A Rab2 mutant with impaired GTPase activity stimulates vesicle formation from pre-golgi i ntermediates. Molecular Biology of the Cell I 0 : 1 837- 1 849.
Tisdale EJ. 2003 . Rab2 interacts directly with atypical protein kinase C (aPKC) tit.. and inhibits aPKC t/t..-dependent glyceraldehyde-3-phosphate dehydrogenase phosphorylation. Journal of Biological Chemistry 278: 52524-52530.
Tisdale E.J . and Artalejo c.R. 2006. Src-dependent aprotein kinase C tit.. ( aPKC tit..) tyrosine phosphorylation is required for aPKC tit.. association with Rab2 and glyceraldehyde-3-phosphate dehydrogenase on pre-Golgi intermediates. Journal of Biological Chemistry 28 1 : 8436-8442 .
236

References
Tisdale E.J . , Kel ly C. and Artalejo C.R. 2004. Glyceraldehyde-3-phosphate dehydrogenase interacts with Rab2 and plays an essential role in endoplasmic reticulum to Golgi transport exclusive of i ts glycolytic activity. Journal of Biological Chemistry 279: 54046-54052.
Tisdale E .J . , Boume lR. , Khosravifar R. , Der C.l and Balch W. E. 1 992. GTP-binding mutants of Rab I and Rab2 are potent inhibitors of vesicular transport from the endoplasmic reticulum to the Golgi complex. Journal of Cell Biology 1 1 9 : 749-76 1 .
Toerien C.A. and Cant lP. 2007. Abundance and phosphorylation state of translation init iation factors in mammary glands of lactating and nonlactating dairy cows. Journal of DailY Science 90: 2726-2734.
Togawa A., Morinaga N . , Ogasawara M., Moss l and Vaughan M. 1 999. Purification and c loning of a brefeldin A-inhibited guanine nucleotide-exchange protein for ADPribosylation factors. Journal of Biological Chemistry 274: 1 2308- 1 23 1 5 .
Tomoda K. , Yoneda-Kato N., Fukumoto A. , Yamanaka S. and Kato Y. 2004. Multiple functions of Jab 1 are requi red for early embryonic development and growth potential in mice. Journal of Biological Chemistry 279: 430 1 3-430 1 8 .
Travers M .T., Vemon R.G. and Barber M .C. 1 997. Repression of the acetyl-CoA carboxylase gene in ovine adipose t issue during lactation: the role of insulin responsiveness. Journal of Molecular Endocrinology 1 9 : 99- 1 07 .
Trayhurn P. and B ing C . 2006. Appetite and energy balance s ignals from adipocytes. Philosophical Transactions - B - Biological Sciences 36 1 : 1 237.
Tsuno A., Miyoshi K. , Tsuj i i R . , Miyakawa T. and M izuta K. 2000. RRS I , a conserved essential gene, encodes a novel regulatory protein required for ribosome biogenesis in Saccharomyces cerevisiae. Molecular and Cellular Biology 20 : 2066-2074.
Tucker H .A . 1 985. Endocrine and neural control of the mammary gland. In: Lactation. Ed. B .L . Larson. Ames: The Iowa State University Press, pp. 39-79
Tucker H .A . 2000. Homlones, mammary growth, and lactation: a 4 1 -year perspective. Journal of Daily Science 83 : 874-884.
Uchiyama S . , Kobayashi S., Takata H . , Ishihara T., Hori N., Higashi T. , Hayashihara K., Sone T., H igo D., Nirasawa T. et al. 2005 . Proteome analysis of human metaphase chromosomes. Journal of Biological Chemistry 280: 1 6994- 1 7004.
Uehara Y. , Shimizu H . , Ohtani K . , Sato N. and Mori M. 1 998. Hypothalamic corticotropinreleasing h0fl110ne is a mediator of the anorexigenic effect of le pt in. Diabetes 47: 890-893 .
Uhl G.R . , Chi lders S . and Pasternak G . 1 994. An opiate-receptor gene fami ly reunion. Trends in Neurosciences 1 7 : 89-93 .
Uhlmann F. 2004. The mechanism of sister chromatid cohesion. Experimental Cell Research 296: 80-85.
Vale W., Spiess 1 . , Rivier C. and Rivier J . 1 98 1 . Characterization of a 4 1 -residue ovine hypothalamic peptide that stimulates secretion of corticotropin and �-endorphin. Science 2 1 3 : 1 394- 1 397.
237

Chapter 8
Van den Broeck l . , Argeseanu Cunningham S . , Eeckels R. and Herbst K. 2005. Data c leaning: Detecting, diagnosing, and editing data abnormal ities. PLoS Medicine 2: e267.
Van den Top A.M. , Van Tol A., Jansen H., H. G .M .1 . and Bcynen A.C 2005. Fatty l iver in dairy cows post partum is associated with decreased concentration of plasma triacylglycerols and decreased activity of l ipoprotein l ipase in adipocytes. Journal of Dairy Research 72: 1 29- 1 3 7 .
Van Tassell CP. , Sostegard T.S . , Liu G . and K. M.L . 2007. Current directions in cattle genomics research. Proceedings of the Seventeenth Conference of the Association for the Advancement of Animal Breeding and Genetics, Armidale, NSW, Australia. 46 1 -470.
Varona L., Ovilo C, Clop A., Noguera l .L. , Perez-Enciso M. , Coli A . , Folch J .M . , Barragan C, Toro M.A . , Babot D. et al. 2002 . QTL mapping for growth and carcass traits in an Iberian by Landrace pig intercross: additive, dominant and epistatic effects. Genetical Research 80: 1 45- 1 54.
Vary T.C and Lynch Cl. 2007. Nutrient signal ing components contro l l ing protein synthesis in striated muscle. Journal of Nutrition 1 37 : 1 835- 1 843 .
Veerkamp R.F . 1 998 . Selection for economic efficiency of dairy cattle using information on l ive weight and feed intake: A review. Journal of Dairy Science 8 1 : 1 1 09- 1 1 1 9 .
Veerkamp R.F. and Koenen E .P .C 1 999. Genetics of food intake, l ive weight, condition score and energy balance. Metabolic stress in dairy cows. 2 1 4 .
Veerkamp R.F . , Beerda B . and van der Lende T. 2003 . Effects of genetic selection for mi lk yield on energy balance, levels of hormones, and metabolites in lactating cattle, and possible l inks to reduced ferti l i ty . Livestock Production Science 83 : 257-275 .
Veerkamp R.F. , Oldenbroek l .K . , Van Der Gaast H .1 . and Van Der Werf J .H . 1 . 2000. Genetic correlation between days unti l start of luteal activity and milk yield, energy balance, and l ive weights. Journal of Dairy Science 83 : 577-583 .
Vega l .R. , Gibson C.A. , Skaar T.C, Hadsel l D .L . and Baumrucker C.R. 1 99 1 . Insul in-l ike growth factor ( IGF)-I and - I T and IGF binding proteins in serum and mammary secretions during the dry period and early lactation in dai ry cows. Journal of Animal Science 69: 2538-2547.
Vegiopoulos A . and Herzig S . 2007. Glucocorticoids, metabol ism and metabolic diseases. Molecular and Cellular Endocrinology 275 : 43-6 1 .
Vernimmen D. , De Gobbi M . , S loane-Stanley J .A . , Wood W.G. and Higgs D.R. 2007. Longrange chromosomal interactions regulate the timing of the transition between poised and active gene expression. Embo Journal 26 : 204 1 -205 1 .
Vernon R.G. 1 982. Effects of growth horn10ne on fatty acid synthesis in sheep adipose t issue. International Journal of Biochemistry 1 4: 225-258 .
Vernon R.G. 1 988 . The partition of nutrients during the lactation cycle. In : Nutrition and lactation in the dairy cow. Ed. P.C Garnsworthy. London: Butterworths, pp. 32-53
Vernon R.G. 1 989. Endocrine control of metabolic adaptation during lactation. Proceedings of the Nutrition Society 48: 23-32.
238
References
Vernon R.G. 1 998. Homeorhesis. In : Yearbook 1 998. Ed. E. Taylor. Ayr, Scotland: Hannah Research Institute, pp. 64-73
Vcrnon R.G. 2005. Lipid mctabolism during lactation: a review of adipose tissue-l iver interactions and the development of fatty l iver. Journal of Dairy Research 72: 460-469.
Vernon R.G. and Finley E. 1 988 . Roles of insul in and growth hormone in the adaptations of fatty acid synthesis in white adipose t issue during the lactation cycle in sheep. Biochemical Journal 256: 873-878.
Vernon R.G. and Taylor E. 1 988 . I nsulin, dexamethasone and their interactions in the control of glucose metabolism in adipose tissue from lactating and nonlactating sheep . Biochemical Journal 256: 509-5 1 4.
Vernon RG. and Sasaki S. 1 99 1 . Control of responsiveness of tissues to hormones. In : Physiological Aspects of Digestion and Metabolism in Ruminants : Proceedings of the Seventh International Symposium on Ruminant Physiology. Ed. T. Tsuda, S. Sasaki and R. Kawashima. San Diego: Academic Press, pp. 1 55- 1 82
Vernon R.G. and Pond C .M. 1 997. Adaptations of maternal adipose tissue to lactation. Journal of MammGlY Gland Biology and Neoplasia 2 : 23 1 -24 1 .
Vernon R.G. , Clegg R A and Fl int 0.1. 1 98 1 . Metabolism of sheep adipose tissue during pregnancy and lactation. Adaptation and regulation. Biochemical Journal 200: 307-3 1 4.
Vernon R.G. , Taylor E. and Faulkner A. 1 984. Regulation of glucose metabol i sm in tissues of the sheep h ind-limb: response to lactat ion. Canadian Journal of Animal Science 64: 302-303.
Vernon R.G. , Barber M.C. and Finley E. 1 99 1 . Modulation of the activity of acetyl-CoA carboxylase and other l ipogenic enzymes by growth hormone, insulin and dexamethasone in sheep adipose tissue and relationship to adaptations to lactation. Biochemical Journal 274: 543-548 .
Vemon R.G. , Denis R .G.P. and Sorensen A. 200 I . Signals of adiposity. Domestic Animal Endocrinology 2 1 : 1 97-2 1 4.
Vernon R.G. , Faulkner A. , Finley E . , Pol lock H. and Taylor E. 1 987. Enzymes of glucose and fatty acid metabol ism of l iver, kidney, skeletal muscle, adipose tissue and mammary gland of lactating and non-lactating sheep. Journal of Animal Science 64 : 1 395- 1 4 1 1 .
Vernon R.G. , Faulkner A. , Hay W.W., Calvert D.T. and Fl int 0.1 . 1 990. In ulin resistance of hind-l imb tissues in vivo in lactating sheep. Biochemical Journal 270: 783-786.
Vestergaard M., Purup S . , Frystyk 1., Uwendahl P. , Sorensen M.T., Riis P .M. , Fl int 0.1 . and Sejrsen K. 2003. Effects of growth hormone and feeding level on endocrine measurements, hormone receptors, muscle growth and performance of prepubertal hei fers. Journal of Animal Science 8 1 : 2 1 89-2 1 98 .
Vicini 1 .L. , Buonomo F.C. , Veenhuizen J .J . , Mi l ler MA, Clemmons D.R. and Col lier R.1. 1 99 1 . Nutrient balance and stage of lactation affect responses of insul in, insulin-l ike growth factors I and I 1 , and insul in-l ike growth factor-binding protein 2 to somatotropin administration in dairy cows. Journal of Nutrition 1 2 1 : 1 656- 1 664.
239
Chapter 8
Wager-Srdar S .A. , Gosnell B .A . , Morley lE. and Levine A.S . 1 985 . The effect of opiates and naloxone on food intake in virgin and lactating rats. Pharmacology Biochemistry and Behavior 23 : 345-348.
Waghom G.C. 2002. Can forages match concentrate diets for dairy production?Proceedings of the New Zealand Society of Animal Production, Massey University, Palmerston North,
ew Zealand. 26 1 -266.
Waghom G.c., Flux D.S . and Ulyatt M.J. 1 987 . Effects of dietary protein and energy intakes on growth hormone, insulin, glucose tolerance and fatty acid synthesis in young wether sheep. Animal Production 44: 1 43 - 1 52.
Waldhoer M. , Bartlett S .E . and Whistler J .L . 2004. Opioid receptors. Annual Review of Biochemistry 73: 953-990.
Walsh D.S . , Vesely J .A . and Mahadevan S. 1 980. Relationships between milk production and circulating hormones in dairy cows. lournal of Dairy Science 63: 290-294.
Wang J., Ducret A., Tu Y., Kozasa T., Aebersold R. and Ross E .M. 1 998 . RGSZ I , a Gz-selective RGS Protein in Brain. Structure, membrane association, regulation by GUz phosphorylation, and relationship to a Gz GTPase-activating protein subfamily. Journal of Biological Chemislly 273 : 260 1 4-26025.
Wang J . , Li c . , Liu Y. , Mei W., Yu S . , Liu c. , Zhang L. , Cao X. , Kimberly R.P . , Grizzle W. et at. 2006 . JAB 1 determines the response of rheumatoid arthritis synovial fibroblasts to tumor necrosis factor-a. The American Journal of Pathology 1 69 : 889-902.
Wang Y., Ho G., Zhang J .J . , Nieuwenhuijsen B., Edris W., Chanda P.K. and Young K.H. 2002. Regulator of G protein signal ing Z 1 (RGSZ J ) interacts with Ga; subunits and regulates Ga;-mediated cel l signaling. Journal of Biological ChemistlY 277: 48325-48332.
Watt P .W., Finley E . , Cork S . , C legg R.A. and Vernon R.G. 1 99 1 . Chronic control of the �- and a2 - adrenergic systems of sheep and adipose tissue by growth hormone and insulin. Biochemical lournal 273 : 39-42 .
Watts A.G. 2005. Glucocorticoid regulation of peptide genes in neuroendocrine CRH neurons: A complexity beyond negat ive feedback. Frontiers in Neuroendocrinology 26: 1 09- 1 30.
Weber W.J . , Wal l ace C.R. , Hansen L.B., Chester-Jones H . and Crooker B.A. 2007. Effects of genetic selection for milk yield on somatotropin, insul in-like growth factor- I , and p lacental lactogen in Holstein cows. lournal of Dairy Science 90: 33 1 4-3325.
Weekes T.E.C. 1 972. Effects of pregnancy and lactation in sheep on the metabol ism of propionate by the ruminal mucosa and on some enzymatic activities in the ruminal mucosa. Journal of Agricultural Science 79: 409-42 1 .
Wei . and Deng X.W. 2003 . The COP9 signalosome. Annual Review of Cell and Developmental Biology 1 9 : 26 1 -286.
White A . 2006. Adrenocorticotropic hormone. In: Endocrinology, 5th edn. Ed. L.l DeGroot and lL. Jameson. Phi ladelphia, PA: Elsevier Saunders, pp. 323-339
White J .D. and McKelvy J .F . 1 986. Enkephalin biosynthesis and processing during lactation. Neuroendocrinology 43: 377-382.
240

References
Wilkens S . , Inoue T. and Forgac M . 2004. Three-dimensional structure of the vacuolar ATPase - Localization of subunit H by difference imaging and chemical cross-linking. Journal of Biological Chemistry 279: 4 1 942-4 1 949.
Wil l MJ . , Vanderheyden W.M. and Kel ley A.E. 2007. Striatal opioid peptide gene expression differentially tracks short-term satiety but does not vary with negative energy balance in a manner opposite to hypothalamic NPY. American Journal of Physiology-RegulatolY Integrative and Comparative Physiology 292: R2 1 7-R226.
WiLmink 1 .B .M. 1 987 . Adjustment of test-day milk, fat and protein yield for age, season and stage of lactation. Livestock Production Science 1 6 : 335-348.
Wi lson C.A., Kreychman J . and Gerstein M . 2000. Assessing annotat ion transfer for genomics: quantifying the relations between protein sequence, structure and function through traditional and probabi l istic scores. Journal of Molecular Biology 297: 233-249.
Wilson D.N. and N ierhaus K .H . 2005. Ribosomal proteins in the spotl ight. Critical Reviews in Biochemistry and Molecular Biology 40: 243-267.
Wi lson G.F . , Mackenzie 0.0. , Brookes I .M . and Lyon G.L . 1 988. Importance of body tissues as sources of nutrients for milk synthesis in the cow, using I
3C as a marker. British Journal
of Nutrition 60: 605-6 1 7.
Wilson L.A. , Mi l l s S .E . , Finley E. , Ki lgour E . , Buttery P .J . and Vemon R.G. 1 996. Effect of lactation on insul in signal transduction in sheep adipose tissue and skeletal muscle. Journal of Endocrinology 1 5 1 : 469-480 .
Wing S .S . 2003 . Deubiquitinating enzymes--the importance of driving in reverse along the ubiquitin-proteasome pathway. The International Journal of Biochemistry & Cell Biology 35 : 590-605 .
Wolf-Goldberg T. , Michaelevski 1 . , Sheu L. , Gaisano H .Y . , Chikvashvi l i D. and Lotan 1. 2006. Target soluble N-ethylmaleimide-sensitive factor attachment protein receptors (tSNAREs) d ifferently regulate activat ion and inactivation gating of K v2.2 and K v2. l : Impl ications on pancreatic islet cell Kv channels. Molecular Pharmacology 70: 8 1 8-828.
Wooll iams J .A. and Smith C. 1 988. The value of indicator traits in the genetic improvement of dairy cattle. Animal Production 46: 333-345.
Wool l iams l .A. and L0vendahl P. 1 99 1 . Physiological attributes of male and juvenile cattle d iffering in genetic merit for mi lk yield: a review. Livestock Production Science 29: 1 -1 6 .
Wooll i ams l .A. , Angus K.D. and Wilson S .B . 1 993 . Endogenous pulsing and stimulated release of growth hormone in dairy calves of high and low genetic merit. Animal Production 56: 1 -8 .
X iao X.Q. , Grove K.L . , Lau S .Y. , McWeeney S . and Smith M.S . 2005. Deoxyribonucleic acid microarray analysis of gene expression pattern in the arcuate nucleus/ventromedial nucleus of hypothalamus during lactation. Endocrinology 1 46: 439 1 -4398.
Xing G.Q. , Mackenzie D.D.S . and McCutcheon S.N. 1 99 1 . Diurnal variation in plasma metabol ite and hormone concentrations and response to metabolic chal lenges in high breeding index and low breeding index Friesian heifers fed at two al lowances. New Zealand Journal of Agricultural Research. 34: 295-304.
24 1
Chapter 8
Xing G.Q. , Mackenzie D .D .S . , McCutcheon S.N. and Wickham B.W. 1 993 . Pancreatic insul in response to exogneous glucose in Friesian heifers of low or high genetic merit for mi lkfat yield. Animal Production 56 : 1 7 1 - 1 78 .
X u C . and Wang Z . 2006. Effect o f propionate, pyruvate and �-hydroxybutyric acid o n pyruvate carboxylase mRNA expression of in vitro culture bovine hepatocytes. Animal Science Journal 77 : 440-446.
Xu 1. and Li Q. 2003 . Review of the in vivo functions of the p 1 60 steroid receptor coactivator family. Molecular Endocrinology 1 7 : 1 68 1 - 1 692.
Xu T., Vasilyeva E. and Forgac M. 1 999. Subunit interactions in the c1athrin-coated vesicle vacuolar ( H+)-ATPase complex. Journal of Biological Chemistry 274: 28909-289 1 5 .
Yan T. , Mayne C .S . , Keady T.W.J. and Agnew R.E. 2006. Effects of dairy cow genotype with two p lanes of nutrition on energy partitioning between mi lk and body tissue. Journal of Daily Science 89: 1 03 1 - 1 042.
Yang 1., Kennelly 1 .1. and Baracos V.E. 2000. The activity of transcription factor Stat5 responds to prolactin, growth hormone, and IGF-I in rat and bovine mammary explant culture. Journal of Animal Science 78 : 3 1 1 4-3 ) 25 .
Yang Y.T. and Baldwin R.L . 1 973 . Lipolysis in isolated cow adipose cel ls. Journal of Dairy Science 56 : 366-374.
Yao M. and Denver R.1. 2007. Regulation of vertebrate corticotropin-releasing factor genes. General and Comparative Endocrinology 1 53 : 200-2 1 6.
Yu L .M. , Mikloucich 1 . , Sangster N . , Perez A. and McCormick PJ . 2003 . MyoR is expressed in nonmyogenic cells and can inhibit their differentiation. Experimental Cell Research 289: 1 62- 1 73 .
Zamir N . , Palkovits M . and Brownstein M . 1 985 . Distribution of immunoreactive MetEnkephalin-Arg6-Gly7-Leu8 and Leu-Enkephalin in discrete regions of the rat brain. Brain Research 326: 1 -8 .
Zemp I . and Kutay U . 2007. Nuclear export and cytoplasmic maturation of ribosomal subunits. Febs Letters 58 1 : 2783-2793 .
Zhang D.x. , L i K. , Liu B . , Zhu Z.M. , XU X.W., Zhao S .H . , Yerle M . and Fan B. 2006. Chromosomal l ocal ization, spatio-temporal distribution and polymorphism of the porcine tripartite motif-containing 55 (TRlM55) gene. Cytogenetic and Genome Research 1 1 4 : 93B-U I I .
Zhao F.-Q., Gl imm D.R. and Kelmel ly J . J . 1 993 . Distribution of mammal ian fac i l itative glucose transporter messenger RNA in bovine tissues. International Journal of Biochemistry 25 : 1 897- 1 903.
Zhao F.-Q. , Okine E.K. and Kennel ly J .J . 1 999. G lucose transporter gene expression in bovine mammary gland. Journal of Animal Science 77: 25 1 7-2522.
Zhao F.-Q. , Moseley W.M. , Tucker H .A . and Kennel ly 1.1 . 1 996. Regulation of glucose transporter gene expression in mammary gland, muscle, and fat of lactating cows by administration of bovine growth hormone and bovine growth hormone-releasing factor. Journal of Animal Science 74: 1 83- 1 89.
242

References
Zhao F.-Q. , Zheng y.-c., Wall E .H . and McFadden T.B. 2005 . Cloning and expression of bovine sodium/glucose cotransporters. Journal of Daily Science 88: 1 82- 1 94.
Zhao F.-Q. , M i l ler P.1 . , Wal l E .H . , Zheng y.-c . , Dong B . , Nevi l le M.C. and McFadden T.B. 2004. Bovine glucose transporter GLUT8 : cloning, expression, and developmental regulation in mammary gland. Biochimica et Biophysica Acta 1 680: 1 03 - 1 1 3 .
Zhao P. and Hoffman E .P . 2006. Musculin isoforms and repression of MyoD in muscle regeneration. Biochemical and Biophysical Research Communications 342: 835-842 .
Zhao P . , Seo J .W. , Wang Z.Y. , Wang Y. , Shneiderman B. and Hoffman E .P . 2003. In vivo fi ltering of in vitro expression data reveals MyoD targets. Comptes Rendus Biologies 326: 1 049- 1 065.
Zhou X.1 . and Gibson G. 2004. Cross-species comparison of genome-wide expression patterns. Genome Biology 5: 232 .
Zoumakis E . , Grammatopoulos D.K. and Chrousos G.P . 2006. Corticotropin-releasing hormone receptor antagonists. European Journal ofEndocrinology 1 55 : S85-S9 1 .
243
Chapter 8
244

CHAPTER 9
Appendices
Chapter 9
Appendix A: Catheterisation Procedures
Consumables
Plugs
I nj ection site cap (Zuel l ig #42380 I ) - these wi l l be attached to the catheter extensions during
the periods from insertion to the start of the glucose challenge, and ovemight after the end of the
glucose/adrenal i ne challenge day. They have a rubber diaphragm for injection which al lows a
solid column of heparinised saline to be placed in the catheter between sampl ing periods, and
reduces the risk of development of blood c lots, fibrin tags, and embol ism should these detach.
Catheter extension (lazy line)
Catheter extension with slider clamp (Zuel l ig #403380) with injection site cap (Zuel l ig
#42380 I ) - a commercial plug and 22cm lazy l ine system which can be attached to the catheter
and acts as an extension/lazy l ine for use during the intensive sampling periods. The injection
site cap al lows samples to be taken without removing it . This equipment reduces the risk of ai r
embol ism and contamination of the catheter whi le faci l itating access when working in close
contact with the animals.
Saline
Standard sal ine solution (0.9% NaCI # 1 324 sterile I L : Zuel l ig) from flexipacks wi l l be used for
flushing catheters after infusion of the various infusates and also after infusion with B ivatop
200.
Heparinised Saline
The lazy l ine and catheter assembl ies wi l l be flushed with heparinised saline. Fresh heparinised
sal i ne was prepared at the beginning of each challenge day. Heparin (25,000 IU/ml, Zue l l ig)
will be added to tlexipacks of saline to give a final concentration of 50IU/ml sal ine. The date
the heparin was added and the actual concentration was written on each flexipack. A
vaccination gun with no needle was attached to each bag of heparinised saline to enable
accurate and efficient dispensing of hcpariniscd salinc into the catheter assembly after each
blood sample was taken.
246
Other requirements
Equipment:
Cl ippers ( including brushes for c leaning, c l ipper o i l etc . )
Tackle boxes to hold a l l the equipment requircd for catheter insertion
Appendices
Tackle box to hold "emergency kit" including: p l iers; scissors; rat tooth forceps; xylazine 2%,
with syringes and needles for its injection; notebook for recording use of xylzine and re insertion
of catheters.
Drugs:
B ioc i l surgical scrub ( iodine based antiseptic) scrub brushes
1 0% povidone iodine in alcohol
Lignocaine ( 2%)
Xylazine (2%)
Bivatop 200
Betadine ointment
Consumables:
Glue ( Loktite Gel) Catheters
Elastoplast 7 .scm Injection site caps
Elastoplast I Ocm Lazy l ines
Syringes 3ml Needles 1 6g x I "
Syringes 1 Oml Needles 1 8g x I "
Syringes 20ml Needles 20g x l "
Vaccinator guns for dispensing saline
247
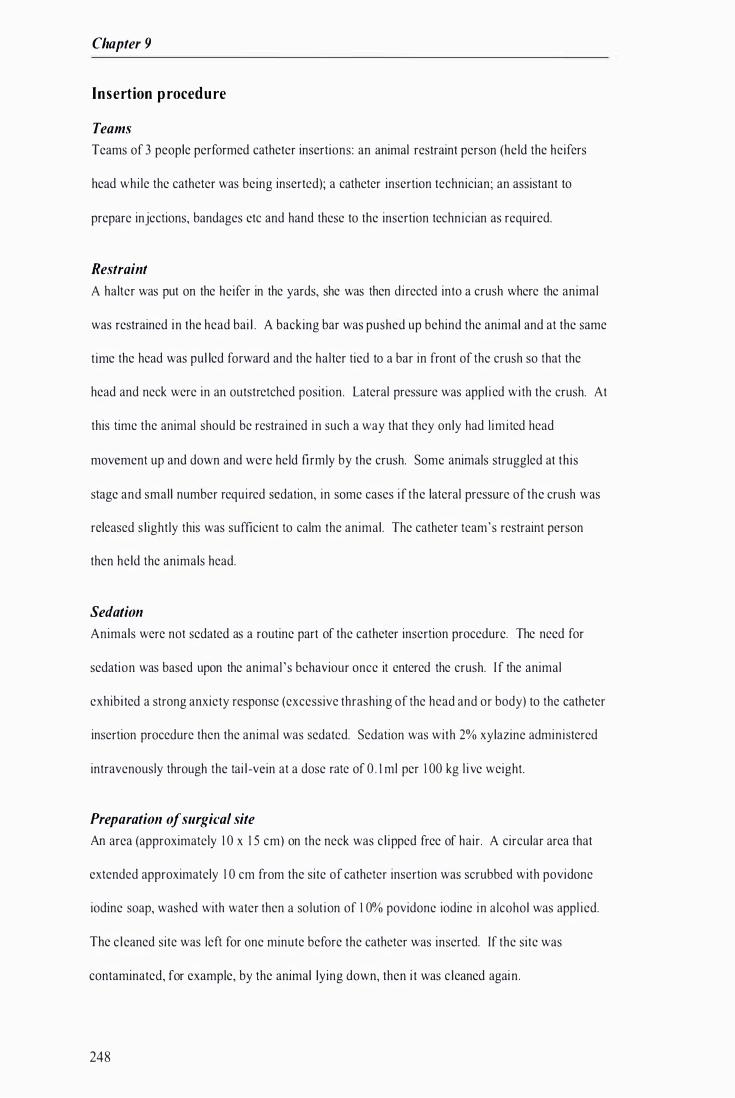
Chapter 9
Insertion procedure
Teams
Teams of 3 people performed catheter insertions: an animal restraint person (held the heifers
head while the catheter was being inserted); a catheter insertion technician; an assistant to
prepare injections, bandages etc and hand these to the insertion technician as required.
Restraint
A halter was put on the heifer in the yards, she was then directed into a crush where the animal
was restrained in the head bai l . A backing bar was pushed up behind the animal and at the same
time the head was pul led forward and the halter tied to a bar in front of the crush so that the
head and neck were in an outstretched position. Lateral pressure was appl ied with the crush. At
this time the animal should be restrained in such a way that they only had l imited head
movement up and down and were held firmly by the crush. Some animals struggled at this
stage and small number required sedation, in some cases if the lateral pressure of the crush was
released s l ightly this was sufficient to calm the animal. The catheter team's restraint person
then held the animals head.
Sedation
Animals were not sedated as a routine part of the catheter insertion procedure. The need for
sedation was based upon the animal ' s behaviour once it entered the crush. I f the animal
exhibited a strong anxiety response (excessive thrashing of the head and or body) to the catheter
insertion procedure then the animal was sedated. Sedation was with 2% xylazine administered
intravenously through the tai l -vein at a dose rate of 0 . 1 ml per 1 00 kg l ive weight.
Preparation of surgical site
An area (approximately 1 0 x 1 5 cm) on the neck was cl ipped free of hair. A circular area that
extended approximately 1 0 cm from the site of catheter insertion was scrubbed with povidone
iodine soap, washed with water then a solut ion of 1 0% povidone iodine in alcohol was appl ied.
The c leaned site was left for one minute before the catheter was inserted. If the site was
contaminated, for example, by the animal lying down, then i t was c leaned again.
248
Appendices
Injection of local anaesthetic
The intended site of injection was identified by raising the jugular vein, by applying pressure to
the vein, in the most ventral part of the prepared surgical site. Approximately 6ml of local
anaesthetic was injected subcutaneously into the intended site so that a bleb developed just
dorsal of the jugular vein.
Bandage preparation
Pieccs of Elastoplast bandage were prepared, one 1 5 cm piece of 1 0 cm wide bandage with a
hole at 1 13 of the way along the 1 5 cm in the middle width ways (doughnut), and a 5 cm piece
of7 .5 cm wide bandage with a 3 cm deep "v" notch cut into each side for a butterfly
attachment. A diagram of these bandages is shown in Figure 9 . 1 .
Syringe preparation
Prepared three syringes; one with the appropriate amount of Bivatop 200 for the weight of each
animal ; one with 20ml of heparinised saline; and one empty syringe to use for checking the
catheter is working.
Lazy line preparation
The catheter extension and catheter plug were removed from their packaging, and the catheter
p lug was attached to the catheter extension. The extension assembly was fil led with heparinised
saline.
Catheter insertion
The person inserting the catheter thoroughly scrubbed thei r hands and arms with povidone
iodine scrub soap. The jugular vein was raised by pressing their thumb on the vein, below
where the anaesthetic bleb was situated, and then inserted the catheter by pushing the catheter
down through the skin and bleb of anaesthetic into the vein. Once the vein had been entered,
the needle assembly was loosened and the needle drawn back s l ightly to remove the sharp point,
then the cannula was sl id into the vein to its ful l length. The needle was removed and the
extension and catheter plug were attached to the catheter. B lood was pul led into the catheter
extension to confirm that the catheter was working and then 5 ml of sal ine was infused.
249
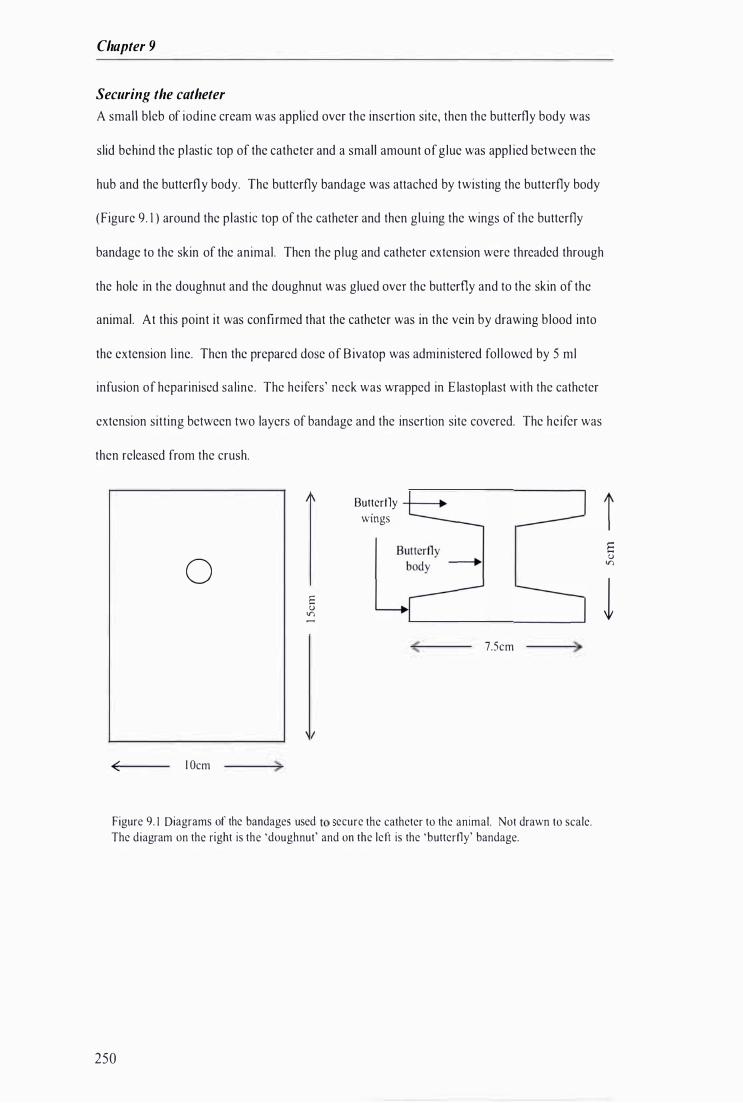
Chapter 9
Securing the catheter
A small bleb of iodine cream was applied over the insertion site, then the butterfly body was
slid behind the plastic top of the catheter and a small amount of glue was appl ied between the
hub and the butterfly body. The butterfly bandage was attached by twisting the butterfly body
(Figure 9. 1 ) around the plastic top of the catheter and then gluing the wings of the butterfly
bandage to the skin of the animal. Then the plug and catheter extension were threaded through
the hole in the doughnut and the doughnut was glued over the butterfly and to the skin of the
animal. At this point it was confirmed that the catheter was in the vein by drawing blood into
the extension l ine. Then the prepared dose of Bivatop was administered fol lowed by 5 ml
infusion of heparinised saline. The heifers' neck was wrapped in E lastoplast with the catheter
extension sitting between two layers of bandage and the insertion site covered. The heifer was
then released from the crush.
o
( I Dcm )
E u V')
Butterfly -+--. wmgs
( 7.5cm )
Figure 9. 1 Diagrams of the bandages used to ecure the catheter to the animal. Not drawn to scale. The diagram on the right is the 'doughnut' and on the left is the 'butterfly' bandage.
250
El u V')
1

Appendices
Appendix B: Infusate preparation
Adrenaline
Weight of Adrenaline calculations
Required concentration: 80llg/ml Dose rate: I AIlg/Kg l ive weight ( LW)
Required Volume of Solution: 300ml
Correction Factor based on molecular weight (MW) difference:
= MW of Adrenaline HCL / MW of Adrenaline pure
= 2 1 9 .7 / 1 83 .2
= 1 . 1 99 (Correction factor)
Actual Concentration = Required Concentration x Correction Factor
= 95.921lg
Actual Concentration (Conversion of Ilg to g) x 300ml
= (95.92Ilg/ 1 000000) x 300ml
= .029g per 300ml
Thus lIse 0.029g of Adrenaline HCI per 300ml of sal ine.
Live Weight calculation
Dose Rate x Live Weight of Animal (LW)
Required Concentration
For example:
LW is 350Kg
Dose Rate is I AIlg/Kg LW
Required Concentration is 80llg/ml
Dose Rate x Live Weight of Animal (LW)
Required Concentration
= l A x 350
80
= 6. 1 25ml
25 1
Chapter 9
Adrenaline preparation
Adrenaline HCI is solubl e in water at 80Ilg!ml but is unstable at neutral or basic pH. Adrenaline
HCI solution is a clear colourless to l ight yel low solution and darkens in colour as it degrades.
Adrenaline HCI solution is l ight and air sensitive, thus was made up the night before or the day
of use to avoid any degradation.
252
1 . Pre-measure out 300ml of saline solution into a glass-measuring cylinder.
2. Using a glass weigh boat, weigh 0.029g :l; 0.000 I g (4dp) Adrenal ine HCI . Record the
actual weight taken on the weighing sheet
3 . Transfer the weighed adrenaline HCI to a 500ml Pyrex beaker rinsing with the pre-
measured sal ine solution. If any of the powder remains on the weigh boat, flush with
saline using a I ml p lastic disposable pipette.
4. Add 0.025g of L-Ascorbic Acid (acts as an antioxidant) to the Adrenaline HCI solution.
5 . Moderately stir the adrenaline solution by swirling for two minutes to ensure total
solubi l ity, as adrenaline dissolves readily in the sal ine.
6. Using the l ive weight of the individual animal calculate the amount of solution required
using the LW calculation below. Withdraw from the beaker the required solution into a
1 0ml syringe (Approximately 6 . 1 rnl based on a l ive weight of 350kg) . Place syringe
guard on the end of the syringe.
7. Wrap the syringe in tinfoi l and apply sticky label. The labels wi l l have the animal
number, mob, group, the volume of the infusate, and name of the challenge. (The
solution is light and air sensitive and wi l l darken as it degrades . )
8. Store prepared syringes in a chil ly bin in an up right position and kept at 4°C.
9. Repeat steps 1 to 8 for al l animals involved in the trial, as well as preparing three extra
syringes as a contingency plan, this wi l l contain the maximum volume of infusate, used
in that group and the volume will be recorded on the syringe.
Appendices
1 0. Withdraw 4mls of Adrenal ine HCI so lution into a Sml vial . Wrap in tinfoi l . Label as
Adrenaline HCI museum sample I , batch number and date. Place into the - 1 8°C
freezer for QA analysis at a later date. Repeat the process for museum sample 2 .
1 1 . Withdraw 4mls of Adrenaline HCI so lution into a Sml vial . Wrap in tinfoi l . Label as
Adrenal ine HCI museum sample 3, batch number and date. Place in the chil libin with
the other syringes. Return vial from field and place into the -1 8°C freezer for quality
assurance (QA) analysis at a later date. Repeat the process for museum sample 4.
Glucose
Glucose was supplied in SOOml flexibags at the required concentration. To get the required
volume of glucose for each animal the excess solution was removed from the 500ml flexibags.
Glucose calculations
Required concentration: 40% (already supplied in flexibags)
Dose rate: O.3g/kg l ive weight Density of glucose: I . I SO
Weight of empty flexibag: 4Sg Volume of glucose in flexibag: 500ml
Volume of glucose left in tube: 1 0.3ml
Weight of glucose left in tube: 1 1 . 8Sg
Volume of glucose required: (Dose rate x Live weight )/concentration
Volume of glucose to be removed from flexibag:
Volume of glucose in bag - volume of glucose required
Weight of glucose to be removed:
(Volume of glucose to be removed x density of glucose) - weight of glucose left in tube
Weight of bag after glucose removed:
(volume of bag x density) - weight of glucose to be removed + weight of empty bag +
weight of glucose left in tube
Example: Volume of glucosc required
(Dose rate x l ive weight )/Concentration
253
Chapter 9
(OJ x 400kg)/OA = 300ml
Volume of glucose to be removed: (SOOml - volume of glucose required)
SOOml - 300ml = 200ml
Weight of glucose to be removed:
(Volume of glucose to be removed x density of glucose) - weight of glucose left in tube
(200ml x L I S ) - 1 1 . 8Sg = 2 1 8 . I Sg
Weight of bag after glucose removed:
(Volume of bag x density) - weight of glucose to be removed + weight of empty bag +
glucose left in tube
( SOO x 1 . I S ) - 230 + 4S + 1 1 . 8S = 40 1 .8S
Glucose preparation
254
I . The weight of glucose to be removed from each bag was calculated using the above
formulae.
2. An empty beaker was placed on a balance and the balance tared
3 . The plug of the glucose flexibag was undone and glucose solution was poured into the
beaker.
4. The glucose flexibag was reweighed to check the correct amount of solution was in the
flexibag. The weight of the glucose flexibag was recorded on a glucose weigh sheet.
S . The glucose solution removed from the flexibag was discarded.
6. A label with the animal number, mob, group, volume of infusate and name of challenge
was stuck on the flexibag.
7. The flexibag was placed in a chi l l i bin and stored at 4°C overnight
8 . The above steps were repeated for a l l animals involved in the trial. Two additional
SOOml flexibags, a 50ml syringe and a sterile needle were supplied for each mob so that
glucose could be withdrawn in the field .
Appendices
9 . For each mob, two museum samples were collected. From one flexibag 4ml of glucose
solution was removed and put into a 5 ml vial and placed into a - I ScC freezer for QA
analysis at a later date, this process was repeated for museum sample 2. These museum
samples were label led with the chal lenge group, museum sample number, batch number
and date.
1 0. From the same flexibag, two more museum samples were obtained. These were also 4
ml samples placed in 5 ml vials. These vials were placed in the chi l l i bin with the
flexibags, once they were returned from the field they were places in a - 1 8 'C freezer
for QA analysis at a later date. These museum samples were label led with the chal lenge
group, museum sample number, batch number and date.
TRH
Weight of TRH calculations
Required concentration: I Sllg/ml
Dose rate: OJIlg/Kg l ive weight ( LW)
Required Volume of Solution: 300ml
( Required Concentration x 300)/Conversion of Ilg to g
= ( I Sllg x 300)/ 1 000000
= O.0045g1300ml
Thus, use O.004Sg of TRH per 300ml of sal i ne.
Live Weight calculation
Dose Rate x Live Weight of Animal ( LW) Required Concentration
For example: LW is 3S0Kg
Dose Rate is OJ Ilg/Kg LW
Required Concentration is I S llglml
255
Chapter 9
0.3 x 35 0 = 7ml
1 5
TRH preparation
TRH is soluble i n water or aqueous buffer at 1 0mg/ml. TRH solution is clear or colourless and
can be stored for up to 30 days refrigerated without loss of activity or potency. Al though there
is no indication of l ight sensitivity, it would be prudent to protect solution from the l ight.
256
I . Pre-measure out 300ml o f sal ine solution into a glass-measuring cylinder.
2 . Using a glass weigh boat, weigh 0.004Sg ± 0.000 I g (4dp) TRH. Record the actual
weight taken . Transfer the weighed TRH to a SOOml Pyrex beaker rinsing with the pre-
measured saline solut ion . If any of the crystals remains on the weigh boat, flush with
sal ine using a I ml p lastic disposable pipette.
3 . Moderate ly stir the TRH solution b y swirl ing for two minutes to ensure total solubi l ity,
as TRH dissolves readily in the sal ine.
4. Using the l ive weight of the individual animal calculate the amount of solution required
using the LW calculation below. Withdraw from the beaker the required solution into a
1 0ml syringe (approximately 7ml based on a l ive weight of 3S0kg). Place syringe
guard on the end of the syringe.
5. Wrap the syringe in t infoi l and apply sticky label. The sticky labels wi l l have the details
of the live weight, animal number, the volume of the infusate in syringe, type of
solution and name of the challenge.
6. Store prepared syringes in a chi l ly bin in an up right position and kept at 4°C.
7. Repeat steps I to 6 for a l l animals involved in the trial, as well as preparing three extra
syringes as a contingency plan, this wi l l contain the maximum volume of infusate, used
in that group and the volume wil l be recorded on the syringe.
8. Withdraw 4mls of TRH solution into a Sml vial . Wrap in tinfoi l . Label as TRH
museum sample I , batch number and date. Place into the - 1 8°C freezer for QA analysis
at a later date. Repeat the process for museum sample 2.

Appendices
9 . Withdraw 4mls of TRH solution into a Sml vial . Wrap in tinfoi l . Label a s TRH
museum sample 3, batch number and date. Place in the chil l ibin with the other
syringes. Return vial from field and place into the - 1 8°C freezer for QA analysis at a
later date. Repeat the process for museum sample 4 .
257
Chapter 9
Appendix C: Iodination procedures
Iodination of bovine G H using Iodogen
IODOGEN is an oxidising agent capable of converting iodide to a more reactive form. The
procedure is simple requiring only mixing of solutions of the protein, sodium iodide(I I 25) and
iodogen. The reaction is terminated by the addition protein buffer.
Iodination components
P04 Stock Solution (O .SM P04)
7 .80g NaH2P04 .2H20 in 1 00 mls disti l led water. N ame 'A'.
3S .S 1 g N a2H P04 anhydrous in SOO ml distil led water. Name 'B'.
Add 82mls of 'A' to the SOOmls of 'B' , adjust to pH 7.4
Store as 40ml al iquots in screw top jars at -20°C.
This becomes the P04 stock solution.
O .OS M P04
Take P04 stock solution and dil ute I : l O in or water.
Make up I OOmls for iodination.
Elution Buffer (200mls)
20mls P04 stock solution
O.4g BSA
0.2g NaN3
or water
Adjust pH to 7.4
Make up to 200mls
258
Appendices
lodogen
lodogen ( 1 , 3 , 4, 6-tetrachloro-3a, 6a diphenyl glycoluri l ; Pierce and Warriner, NZ Ltd;
I OO�I of a \ OO�mol/l solution in dichloromethane) was added to a polypropylene vial
and the solvent evaporated.
Precipitation Buffer
2mls of Stock P04
1 . 86 1 g EDTA (disodium,dihydrate)
I g BSA
O. l g Sodium Azide
Make up to 1 00mls with Mi l l i Q water
TCA
1 0% Tricloroacetic acid
Make up to 200mls in deionised water.
Label ( 1 1 25 )
O.S mil l icuries Obtained through Life Sciences
Iodogen iodination procedures
Iodination takes place in the vial that contains the iodogen
1 . Tap the vial to ensure al l GH is at the bottom.
2 . Add the GH t o the iodogen v ial
3 . Add 20�1 O .SM P04.
4 . Add 0.6mCi (6�1) 1 125 Deglove.
5 . Mix with gentle agitation.
6. Incubate for I S minutes mixing gently at S minute intervals.
7 . After I S mins transfer the contents of the iodogen vial t o a separate vial containing
200�1 of O.OSM P04 buffer.
259
Chapter 9
8. Add 200,..d of Elution Buffer.
9. Gently mix wel l .
1 0. Transfer a 1 0f11 al iquot to a specific activity (SA) tube and add 490f11 elution buffer.
1 1 . Add the remainder of iodinated protein to the column and elute in 1 .0ml fractions per 20
minutes. Run the column overnight col lecting approximately 80 fractions.
1 2 . In the first 2 hours check to see the column is stable and the tubes on the fraction
collector are al igned and moving as they should be.
Iodination of bovine TSH using Chloromine T
Chloromine T is an oxidising agent capable of converting iodide to a more reactive form. The
procedure is simple requiring only mixing of solutions of the protein, sodium iodide ( 1 1 25 ) and
chloromine T. The reaction is terminated by the addition of a reducing agent, sodium
metabisulphite.
Iodination components
P04 Stock Solution (O .SM P04)
7 .80g NaH2P04 .2H20 in 1 00 mls disti l led water. Name 'A'.
35 .S l g Na2HP04 anhydrous in 500 ml dist i l led water. Name 'B'.
Add 82mls of 'A' to the 500mls of '8' , adjust to pH 7.4
Store as 40ml a l iquots in screw top jars at -20°e.
This becomes the P04 stock solution.
0 .05 M P04
Take P04 stock solution and di l ute I : 1 0.
Make up I OOmls for iodination.
Prepare fresh on the day of Iodination. Do not add azide.
260
Elution Buffer (200mls)
20mls P04 stock solution
O .4g BSA
0 .2g NaN3
Adjust pH to 7.4
Make up to 200mls
Chloramine T
1 6mg Chloramine T
I Omls O.05M P04 buffer
Make up immediately prior to use.
Sodium Metabisulphite
1 6mg sodium metabisulphite
1 0mls O.05M P04 buffer
Make up immediately prior to use.
Precipitation Buffer
2mls of Stock P04
1 . 86 1 g EDTA (disodium,dihydrate)
I g BSA
O. l g Sodium Azide
Make up to 1 00mls with Mi l l i Q water
Label ( I 1 25 )
0.5 mil l icuries Obtained through Life Sciences
Appendices
26 1

Chapter 9
Iodination of TSH
I odination takes place in the vial that the TSH is stored.
262
I . Tap the vial to ensure al l TSH i s at the bottom.
2. Add 1 0�1 O .5M P04.
3 . Add 0.5mCi ( 5� 1 ) 1 1 25 . Deglove.
4. Mix with gentle agitation.
5 . Add 5�1 of Chloromine T.
6 . Gently agitate for 60 seconds (Prepare for addi tion of sodium metabisulphate during
this 60 seconds).
7 . Add I O� I of Metabisulphate.
8. Agitate to mix wel l .
9 . Add 500111 of elution buffer. Mix wel l .
10 . Transfer a I O�I al iquot t o a specific activity ( SA ) tube and add 490�1 elution buffer.
1 1 . Add the remainder of iodinated protein to the column and e lute in 1 .0ml fractions per 20
minutes. Run the column overnight col lecting approximately 80 fractions.
1 2 . [n the first 2 hours check to see the column is stable and the tubes on the fraction
col lector are al igned and moving as they should be.
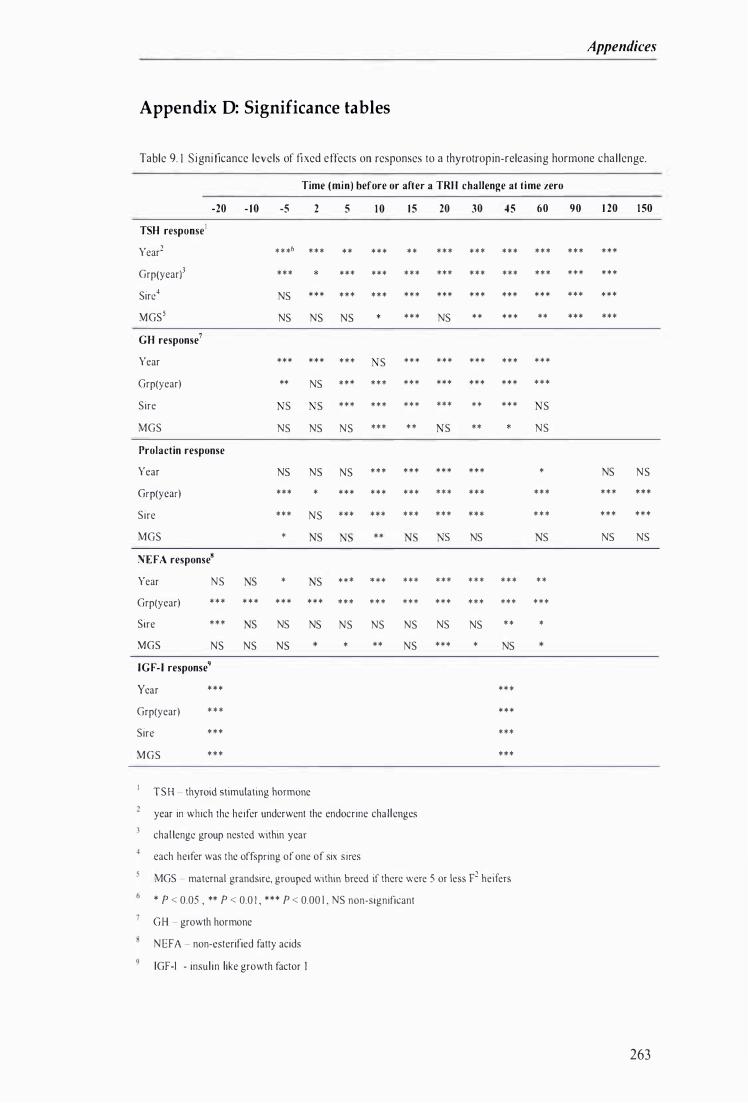
Appendices
Appendix D: Significance tables
Table 9. 1 S i gni ficance levels of fi xed effects on responses to a thyrotropin-releasing hormone cha l lenge.
Time ( min) before or after a TRH challenge at t ime zero
-20 - 1 0 -5 2 5 1 0 1 5 20 30 45 60 90 1 20 1 50 TSH responsei
Year2 * * *6 * * * * * * * * * * * * * * * * * * * * * * * * * * * *
Grp(year)) * * * * * * * * * * * * * * * * * * * * * * * * * * * * * *
Sire4 NS * * * * * * * * * * * * * * * * * * * * * * * * * * * * * *
MGS5 NS NS NS * * * NS * * * * * * * * * * * * *
GH response7
Year * * * * * * * * * S * * * * * * * * * * * * * * *
Grp(year) ** NS * * * * * * * * * * * * * * * * * * * * *
Sire S S * * * * * * * * * * * * * * * * * S
MGS NS NS NS * * * * * S * * NS
Prolactin response
Year NS NS NS * * * * * * * * * * * * * NS NS
Grp(year) * * * * * * * * * * * * * * * * * * * * * * * * * * * *
Sire * * * NS * * * * * * * * * * * * * * * * * * * * * * * *
MGS * S NS S NS NS
NEFA responses
Year NS S * S * * * * * * * * * * * * * * * * * * * *
Grp(year) * * * * * * * * * * * * * * * * * * * * * * * * * * * * * * * * *
Sire * * * S NS NS NS NS NS NS NS * * *
MGS NS NS NS * * * NS * * * * NS
IGF-I response9
Year * * * * * *
Grp(year) * * * * * *
Sire * * * * * *
MGS * * * * * *
TSH - thyroid stimulating hormone
year in which the heifer undcrwent the endocrine chal lcnges
chal lenge group nested within year
each heifer was the offspring of one of six sires
MGS - maternal grandsirc, grouped within breed if there were 5 or less F2 heifers
* P < 0.05 , ** P < 0.0 I , * * * P < 0.00 I , NS non-significant
G H - growth hormone
NEF A - non-esterified fatty acids
IGF-I - insul in like growth factor J
263

Chapter 9
Table 9.2 Significance levels of fixed effects on responses to an adrenaline chal lenge.
Time ( min) before or after an adrenaline challenge at time zero
-20 - 1 0 -5 4 1 0 1 5 20 30 60 90 1 20 NEF A response'
Year2 * * *6 * * * * * * NS NS * * * * * *
Grp(year)l * * * * * * * * * *** *** * * * * * * * * * ***
Sire4 * * * NS *** NS NS NS **
MGS5 * * ** * * * * * NS *
Glycerol response
Year NS NS * * * * * * NS * * * * * * * * * * * *
Grp(year) * * * * * * *** * * * * * * * * * * * * * * * * * * * * *
Sire * * * * * * N S ** * * * * ** * * * * * * * * *
MGS NS NS NS * NS NS ** NS NS NS
Glucose response
Year NS NS NS *** * * N S N S N S NS
Grp(year) * * * *** *** * * * *** * * * * * * * * * * * *
Sire NS NS NS NS NS NS NS NS NS
MGS NS NS NS NS NS NS NS NS NS
NEFA - non-esterified fatty acids
year in which the heifer underwent the endocrine chal lenges
chal lenge group nested within year
each heifer was the offspring of one of six sires
MGS - maternal grandsire, grouped within breed if there were 5 or less F2 heifers
* P < 0.05 , ** P < 0.0 I , * * * P < 0.00 I , NS non-significant
264
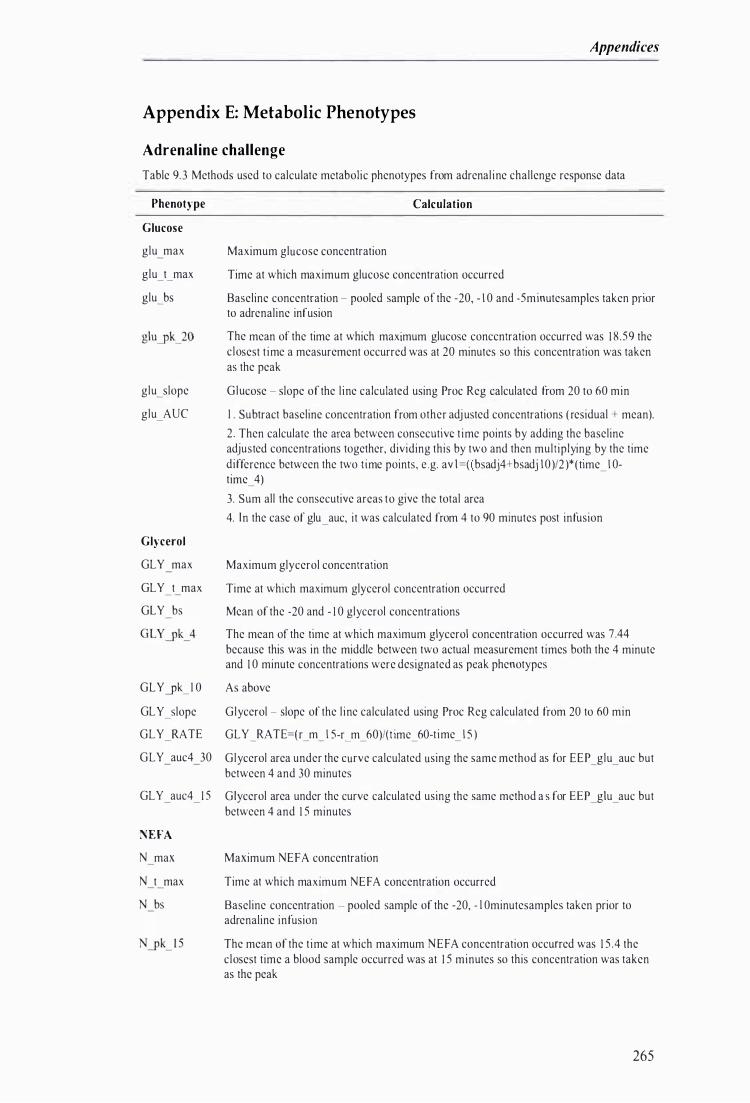
Appendices
Appendix E: Metabolic Phenotypes
Adrenaline challenge
Table 9. 3 Methods used to calculate metabolic phenotypes from adrenal ine challenge response data
Phenotype
Glucose
glu max
glu_t_max
glu_bs
glu_slope
glu_AUC
Glycerol
GLY max
GLY t max
GLY bs
Calculation
Maximum glucose concentration
Time at which maximum glucose concentration occurred
Baseline concentration - pooled sample of the -20, - 1 0 and -5minutesamples taken prior to adrenaline infusion
The mean of the time at which maximum glucose conccntration occurred was 1 8 .59 the closest t ime a measurement occurred was at 20 minutes so this concentration was taken as the peak
Glucose - slope of the l ine calculated using Proc Reg calculated from 20 to 60 min
I . Subtract baseline concentration from other adj usted concentrations ( residual + mean).
2 . Then calculate the area between consecutivc t ime points by adding the baseline adjusted concentrations together, dividing this by two and then multiplying by the time difference between the two time points, e .g. av l =« bsadj4+bsadj lO)/2 )*( time_1 0-
time_ 4)
3. Sum all the consecutive areas to give the total area
4. In the case of glu _ auc, it was calculated from 4 to 90 minutes post infusion
Maximum glycerol concentration
Time at which maximum glycerol concentration occurred
Mean of the -20 and - 1 0 glycerol concentrations
The mean of the time at which maximum glycerol concentration occurred was 7.44 because this was in the middle between two actual measurement t imes both the 4 minute and 1 0 minute concentrations were designated as peak phenotypes
GLY yk_ I O As above
GL Y _slope Glycerol - slope of the l ine calculated using Proc Reg calculated from 20 to 60 min
GLY RATE GLY _RA TE=(r_m_1 5-r_m_60)/(t ime_60-t ime_ 1 5 )
GL Y auc4 30 Glycerol area under the curve calculated using the same method as for EEP _glu _auc but between 4 and 30 minutes
GL Y auc4 1 5 Glycerol area under the curve calculated using the same method a s for EEP _glu_auc but between 4 and 1 5 minutes
NEFA N max
N t max
N bs
Maximum NEFA concentration
Time at which maximum NEFA concentration occurred
Baseline concentration - pooled sample of the -20, - I Ominutesamples taken prior to adrenaline infusion
The mean of the t ime at which maximum NEFA concentration occurred was 1 5 .4 the closest time a blood sample occurred was at 1 5 minutes so this concentration was taken as the peak
265
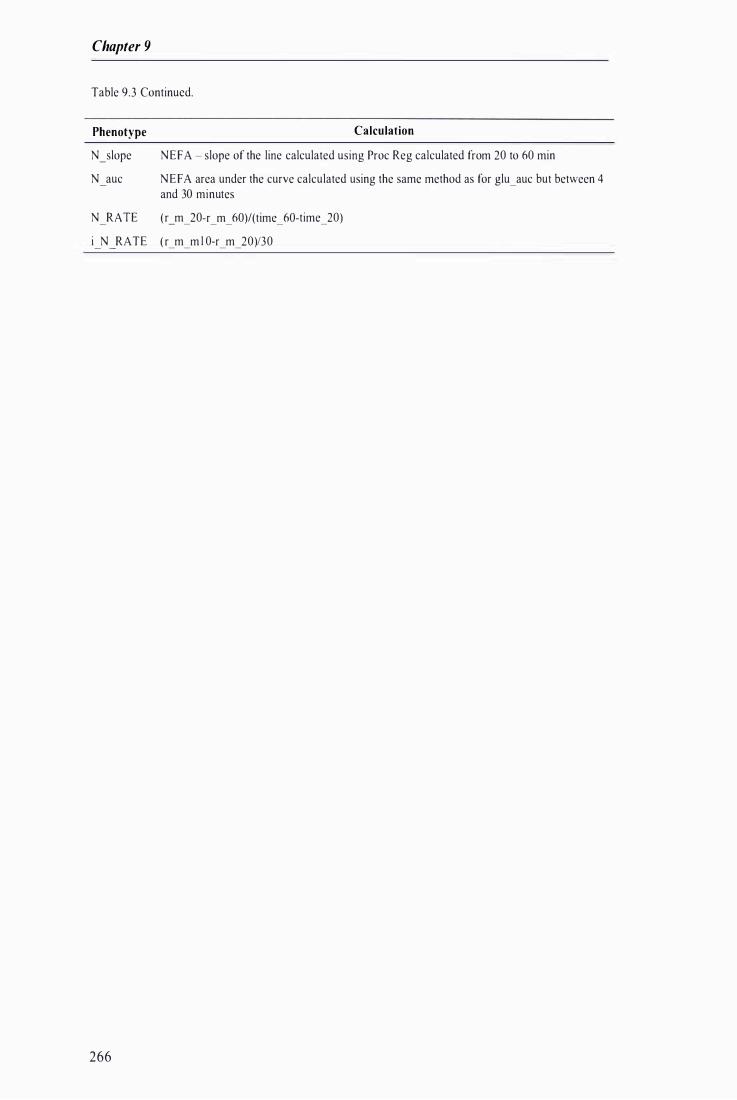
Chapter 9
Table 9.3 Continued.
Phenotype Calculation
N _slope NEF A - slope of the line calculated using Proc Reg calculated from 20 to 60 min
N auc NEF A area under the curve calculated using the same method as for glu _ auc but between 4 and 30 minutes
N RATE (r _m _ 20-r _m _ 60)/(time _ 60-time _ 20)
i N RATE ( r_m_m I 0-r_m_20)/30
266

Appendices
Glucose challenge
Table 9.4 Methods used to calculate metabolic phenotypes from glucose challenge response data
Phenotype Calculation
Glucose
Glucose baseline ( pooled sample of three samples taken at -20, - 1 0 and -S minutes prior to glucose infusion) = adjusted glucose concentration (residual (calculated from the model discussed earlier *) + mean ( mean of all animals in the trial, 4 .3»
g_T_half (min)
g_AUC_60min
Fractional turnover rate of glucose (k) ( Kaneko 1 997)
k - In I - In 2 l OO _ 0/ / . - x - /0 mm
T2 - � where In I = adj usted glucose concentration at S minutes
In 2 = adjusted glucose concentration at 60 minutes
TI = time S minute sample was taken
T2 = time 60 minute sample was taken
Glucose clearance half-time ( Kaneko 1 997): ( 0 .693 1 k ) x 1 00
l . Subtract baseline ( -S ) value from other adj usted values ( residual + mean).
2 . Then calculate the area between consecutive time points by adding the baseline adju ted concentrations together, dividing this by two and then multiplying by the time difference between the two time points, e.g. av I =( (bsadj2+bsadjS )/2)*(time _ S-time _ 2)
3 . Sum a l l the consecutive areas to give the IOtal area
4. I n the case of g_ Totarea _ 60min, it was calculated from 2 to 60 minutes post infusion
G time Glucose - slope of the line using Proc Reg calculated from S to 4S min
I nsulin
i base Insulin baseline (pooled sample of three samples taken at -20, - 1 0 and -S minutes prior to glucose infusion) = adj usted insul in concentration (residual (calculated from the model discussed earlier *) + mean ( mean of a l l animals in the trial, 2 . 8»
i AUC 4Smin Insulin area under the curve calculated using the same method as for g_Totarea_60min but between 2 and 4S minutes
i AUC I S min Insulin area under the curve calculated using the same method as for g_Totarea_60min but between 2 and I S minutes (acute AUC)
i-IJk_I Oand I S Insulin peak concentration calculated as the mean o f the adj usted ( residual + mean) 1 0 and I S minute concentrations
i-IJk _ I Oand I S _ bsadj Insulin peak concentration calculated as the mean of the adj usted (residual + mean) 1 0 and I S minute concentrations
i I Smin I S minute insulin concentration (residual + mean)
i_I Smin _bsadj Baseline adjusted I S minute insulin concentration = ( residual + mean) - baseline
i RATE ( i-IJk _I Oand I S - ((r _ m _ 4S + r _ m_ 60)/2) 1 (mean of time 4S and 60) - (mean of time 10 and I S)
max Maximum insulin concentration
i t max Time maximum insul in concentration occurred
i time Insulin - slope of the l ine using Proc Reg calculated from S to 4S min
267

Chapter 9
Table 9.4 Continued.
Phenotype
11 time
expUime
NEFA
N min
N t min
N time
268
Calculation
Insulin increase from baseline to peak - slope of the l ine calculated using Proc Reg from -5 to 1 0 min
Insulin slope of the l ine from peak to baseline using Proc Reg, mode l : glu = time exptime (exptime = exp(-0.05*time»
Minimum NEF A concentration
Time minimum NEFA concentration occurred
NEFA - slope of the l ine using Proc Reg calculated from 5 to 45 min
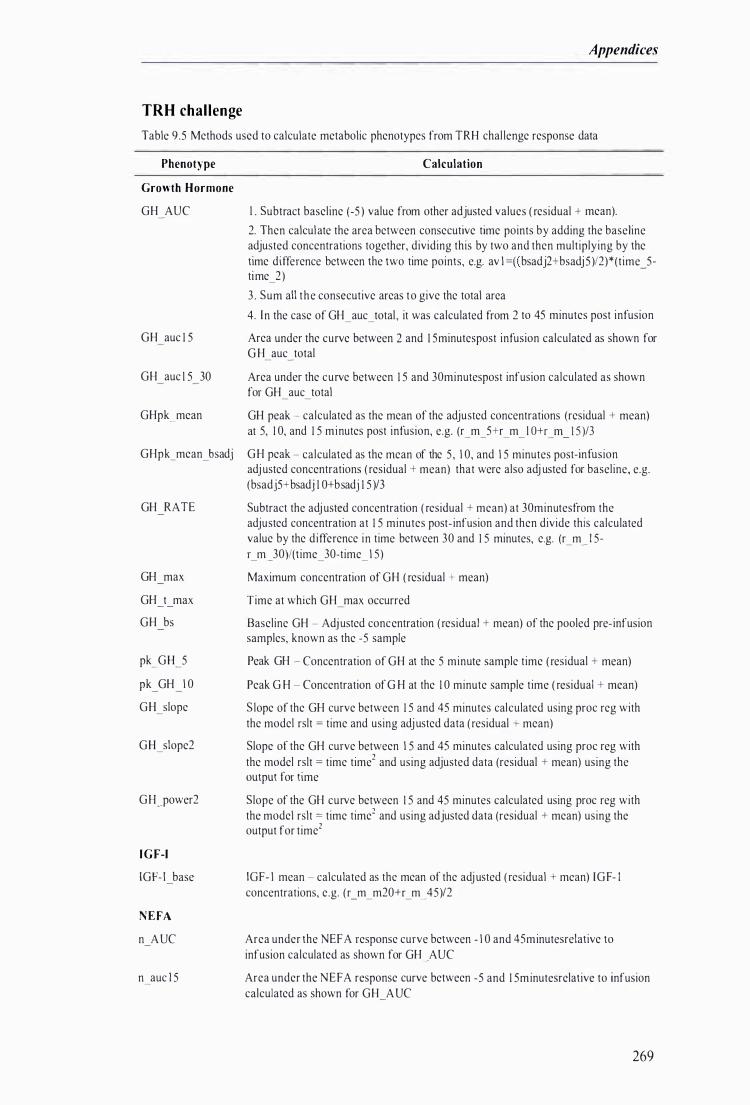
Appendices
TRH challenge
Table 9.5 Methods used to calculate metabolic phenotypes from TRH chal lenge response data
Phenotype
Growth Hormone
GH AUC
Calculation
I . Subtract baseline (-5 ) value from other adjusted values ( residual + mean).
2. Then calculate the area between consecutive time points by adding the baseline adjusted concentrations together, dividing this by two and then multiplying by the time difference between the two time points, e.g. av I =« bsadj2+bsadj5)/2)*(time _5-time_2)
3 . Sum all the consecutive areas to give the total area
4. [n the case of GH _ auc _total , it was calculated from 2 to 45 minutes post infusion
GH auc 1 5 Area under the curve between 2 and 1 5minutespost infusion calculated as shown for G H auc total
G H auc I 5 30 Area under the curve between 1 5 and 30minutespost infusion calculated as shown for GH auc total
GHpk _ mean GH peak - calculated as the mean of the adjusted concentrations (residual + mean) at 5, 1 0, and 1 5 minutes post infusion, e.g. (r _ m_5+r _m_ I O+r _m _ 1 5 )/3
GHpk _ mean_bsadj GH peak - calculated as the mean of the 5 , 1 0, and 1 5 minutes post-infusion adj usted concentrations ( residual + mean) that were also adj usted for baseline, e.g. (bsadj5+bsadj I O+bsadj 1 5 )/3
GH RATE Subtract the adj usted concentration ( residual + mean) at 30minutesfrom the adjusted concentration at 1 5 minutes post- infusion and then divide this calculated value by the difference in time between 30 and 1 5 minutes, e.g. (r _ m_ 1 5-
r _ m _30)/(time _30-time _1 5)
GH max Maximum concentration of GH ( residual + mean)
GH t max Time at which GH max occurred
GH bs Baseline GH - Adjusted concentration ( residual + mean) of the pooled pre-infusion samples, known as the -5 sample
pk_ GH_5 Peak GH - Concentration of GH at the 5 minute sample time ( residual + mean)
pk GH 1 0 Peak G H - Concentration of G H at the 1 0 minute sample time ( residual + mean)
GH_slope S lope of the GH curve between 1 5 and 45 minutes calculated using proc reg with the model rslt = time and using adj usted data ( residual + mean)
GH_slope2 Slope of the GH curve between 1 5 and 4S minutes calculated using proc reg with the model rslt = time time2 and using adjusted data (residual + mean) using the output for time
GH-'power2 Slope of the GH curve between 1 5 and 45 minutes calculated using proc reg with the model rslt = time time2 and using adjusted data (residual + mean) using the output for time2
I GF-I
IGF- I base
N E FA
n AUC
n auc l 5
[GF- I mean - calculated as the mean of the adj usted ( residual + mean) IGF- I concentrations, e.g. (r _m _ m20+r _m _ 45)/2
Area under the NEF A response curve between - 1 0 and 4Sminutesrelative to infusion calculated as shown for GH AUC
Area under the NEFA response curve between -5 and 1 5minutesrelative to infusion calculated as shown for GH AUC
269

Chapter 9
Table 9.5 Continued.
Phenotype
n auc l 5 45 - -
n---'pk_mean
n ---'pk _mean _ bsadj
n RATE
NEFA max
NEFA t max
NEFA bs
n_slope2
Prolactin
Prlc max
Prlc t max
Prlc bs
270
Calculation
Area under the N EFA response curve between 1 5 and 45 minutes post infusion calculated as shown for GH AUC
NEFA peak - calculated as the mean of the adj usted concentrations (residual + mean) at 5 , 1 0, and 1 5 minutes post infusion, e.g. ( r_m_5+r_m_ 1 0+r_m_ 1 5)/3
NEFA peak - calculated as the mean of the adjusted concentrations (residual + mean) at 5 , 1 0, and I S minutes post infusion these values were also adj usted for baseline, e .g. (bsadj5+bsadj I O+bsadj 1 5)/3
Subtract the adj usted concentration (residual + mean) at 45 minutes from the adjusted concentration at 20 minutes post-infusion and then divide this calculated value by the difference in time between 45 and 20 minutes, e.g. ( r_m_20-r_ m _ 45)/(time _ 45-time _ 20)
Maximum concentration of N E FA (residual + mean)
Time at which NEF A max occurred
Baseline NEFA - Concentration of NE FA (residual + mean)at -20 minutes relative to infusion
Peak NEFA - Concentration of NE FA at 1 0minutesample time (rcsidual + mean)
Slope of the decreasing part of the N EFA curve between 1 5 and 45 minutes calculated using proc reg with the model rslt = time time2 and using adjusted data (residual + mean) using the output for time
Slope of the decreasing part of the NEF A curve between 1 5 and 45 minutes calculated using proc reg with the model rslt = time time2 and using adj usted data (residual + mean) using the output for time2
Slope of the increasing part of the NEFA curve between - 1 0 and 5 minutes calculated using proc reg with the model rslt = time and using adj usted data (residual + mean)
Slope of the increasing part of the NEFA curve between - 1 0 and 5 minutes calculated using proc reg with the model rslt = time time2 and using adj usted data (residual + mean) using the output for time
Slope of the increasing part of the NEF A curve between - 1 0 and 5 minutes calculated using proc reg with the model rslt = time time2 and using adjusted data (residual + mean) using the output for time2
Area under the prolactin response curve between 2 and 60 minutes post infusion calculated as shown for GH AUC
Area under the prolactin response curve between 2 and 1 5 minutes post-infusion calculated as shown for GH AUC
Area under the prolactin response curve between I S and 30 minutes post infusion calculated as shown for GH AUC
Subtract the adjusted concentration (residual + mean) at 60 from the adjusted concentration at 20 minutes post-infusion and then divide this calculated value by the difference in t ime between 60 and 20 minutes, e.g. ( r_m_20-r_m_60)/(time_60-time_20)
Maximum concentration of prolactin (residual + mean)
Time at which Prlc max occurred
Baseline prolactin - concentration of Prlc
Peak prolactin - Concentration of Prlc at the 5 minute sample time (residual + mean)
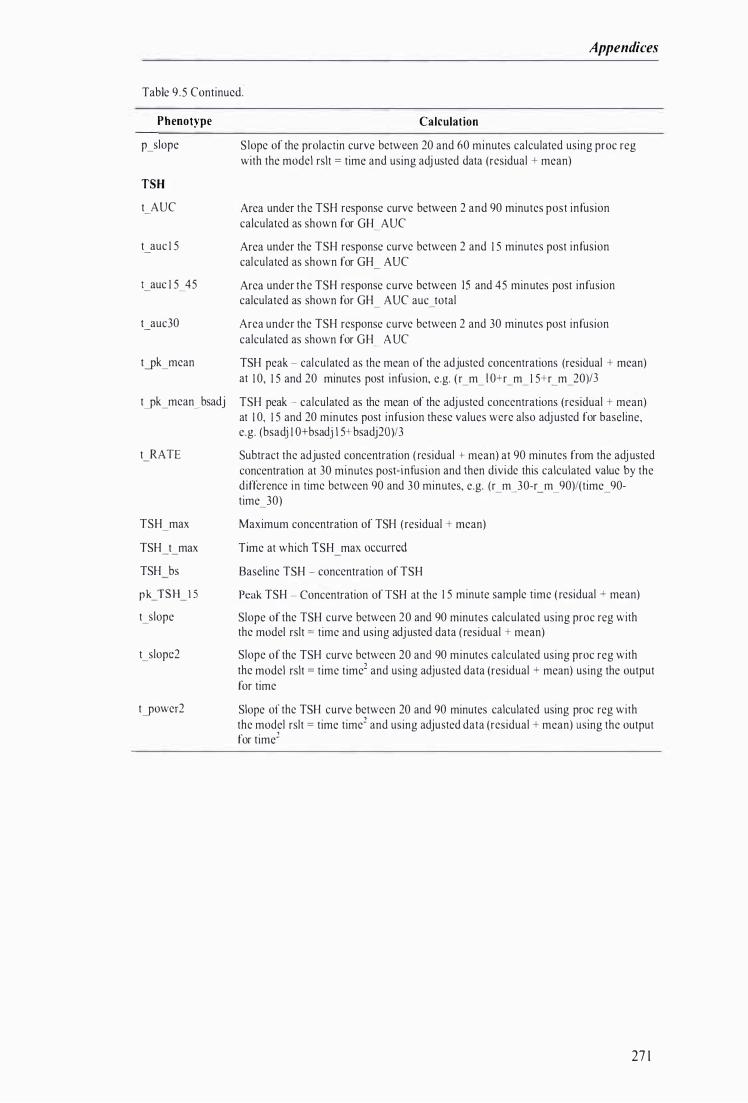
Appendices
Table 9 .5 Continued.
Phenotype Calculation
p_slope S lope of the prolactin curve between 20 and 60 minutes calculated using proc reg with the model rslt = time and using adj usted data (residual + mean)
TSH
t AUC Area under the TSH response curve between 2 and 90 minutes post infusion calculated as shown for GH AUC
t auc 1 5 Area under the TSH response curve between 2 and 1 5 minutes post infusion calculated as shown for GH AUC
t auc 1 5 45 Area under the TSH response curve between IS and 45 minutes post infusion calculated as shown for GH A UC auc total - -
t auc30 Area under the TSH response curve between 2 and 30 minutes post infusion calculated as shown for GH AUC
tyk _mean TSH peak - calculated as the mean of the adjusted concentrations (residual + mean) at 1 0, 1 5 and 20 minutes post infusion, e.g. ( r_m_ I O+r_m_ 1 5+r_m_20)/3
t�k _mean _ bsadj TSH peak - calculated as the mean of the adj usted concentrations (residual + mean) at 1 0, 1 5 and 20 minutes post infusion these values were also adj usted for baseline, e.g. (bsadj I O+bsadj 1 5 bsadj20)/3
t RATE Subtract the adjusted concentration ( residual + mean) at 90 minutes from the adj usted concentration at 30 minutes post-infusion and then divide this calculated value by the difference in time between 90 and 30 minutes, e.g. (r _ m_30-r _m _90)/(time _90-time_30)
TSH max Maximum concentration of TSH (residual + mean)
TSH t max Time at which TSH max occurred TSH bs Baseline TSH - concentration of TSH
pk TSH 1 5 Peak TSH - Concentration of TSH at the 1 5 minute sample time (residual + mean)
t_slope Slope of the TSH curve between 20 and 90 minutes calculated using proc reg with the model rslt = time and using adjusted data ( residual + mean)
t_slope2 Slope of the TSH curve between 20 and 90 minutes calculated using proc reg with the model rslt = time time2 and using adjusted data (residual + mean) using the output for time
t�ower2 Slope of the TSH curve between 20 and 90 minutes calculated using proc reg with the model rslt = time time2 and using adjusted data (residual + mean) using the output for time2
27 1

Chapter 9
Appendix F: QTL locations
Table 9.6 The best predicted location (cM) for the metabolic (9.5 Appendix E) and milk production QTL (Table 9.7) as determined by the analysis models additive (A), additive + dominance (A+D), or hal f-sb (HS) together with the level of significance (Pval) the maximum F-value (Fval) and the 95% confidence interval (95%CI) of the QTL location.
Trait Analysis
TRH HS
TRH HS
Milk HS
TRH A
TRH A
EEP A+D
EEP A+D
EEP HS
EEP HS
TRH HS
TRH HS
TRH HS
TRH HS
TRH A
TRH A
TRH HS
TRH A
TRH A
TRH A
TRH A
TRH A+D
TRH A+D
TRH A+D
TRH A+D
TRH A+D
TRH HS
EEP A+D
TRH A
TRH A+D
TRH A+D
TRH A+D
272
Phenotype
p_auc I 5_30
p _ auc _total
d60yfy
nyk_mean
pk_NEFA_ l O
EEP _ N _slope
EEP RATE
EEP N RATE
EEP _N _slope
t auc 1 5 45 - -
t auc total
t RATE
t_slope
t auc l 5 45 - -
t_slope
p_auc I 5_30
t auc total
t-pk_mean
t auc30
tyk_mean_bsadj
t auc l 5 45 - -
t auc total
t auc30
tyk_mean
tyk _mean _ bsad j
t_slope2
EPI N bs
tyower2
t_slope
tyower2
t_slope2
Chr
2
2
2
2
2
2
2
3
3
3
3
3
3
3
3
3
3
3
3
3
3
3
3
3
3
3
3
3
3
Bst letn Pval Fval 95%CI
98 0.0023 4.38 44 - 1 1 5
98 0.0076 3 .93 35 - 1 23
46 0.0088 3 .67 29 - 1 1 4
1 1 4 0.0026 6 .2 18 - 1 25
1 1 4 0.0063 5 .26 20 - 1 28
1 3 1 0.0003 1 1 . 1 3 1 5 - 1 3 1
1 3 1 0.0029 8 .39 8 - 1 3 1
1 3 1 0.003 1 4. 1 7 3 - 1 3 1
1 3 1 0.0047 3 .99 0 - 1 3 1
68 0.004 1 4 .4 1 0 - I I I
68 o.oon 3.92 1 3 - 1 1 2
7 1 0.0064 3 .86 1 0 - 1 02
n 0.00 1 2 5 .3 1 1 0 - 1 00
73 0.0045 5 . 7 1 49 - 1 24
73 0.0059 5 .65 44 - 1 23
76 0.0059 3 .8 2 - 95
77 0.0037 5 .84 45 - 1 24
77 0.007 1 5 .3 1 38 - 1 2 1
78 0.005 1 5 . 54 39 - 1 24
78 0.0093 5 . 1 3 0 - 1 22
79 0.0004 9 .78 49 - 1 24
80 0.0003 1 0.35 45 - 1 24
80 0.00 1 5 8 .9 1 39 - 1 24
80 0.00 1 9 8 .5 1 38 - 1 2 1
80 0.0026 8.24 0 - 1 22
86 0.0047 4. 1 5 0 - 97
97 0.0059 7 .37 6 1 - 1 24
1 1 3 0.0036 6.07 0 - 1 23
1 1 3 0.0052 7 .84 44 - 1 23
1 1 4 0.000 1 1 2.49 0 - 1 23
1 1 5 0.0006 9.43 0 - 1 20
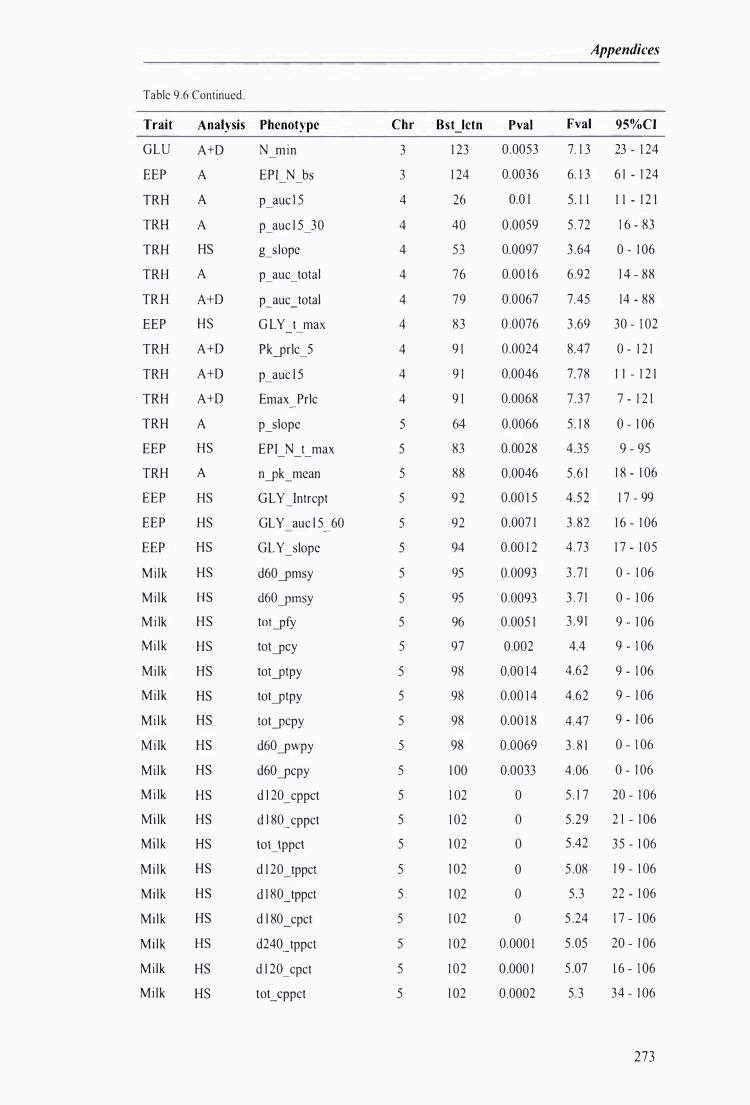
Table 9 .6 Continued
Trait Analysis Phenotype
GLU A+D
EEP A
TRH A
TRH A
TRH HS
TRH A
TRH A+D
EEP HS
TRH A+D
TRH A+D
TRH A+D
TRH A
EEP HS
TRH A
EEP HS
EEP HS
EEP HS
Mi lk HS
Mi lk HS
Mi lk HS
Mi lk HS
Milk HS
Mi lk HS
Mi lk HS
Mi lk HS
Mi lk HS
Mi lk HS
Mi lk HS
Milk HS
Mi lk HS
Milk HS
Mi lk HS
Mi lk HS
Milk HS
Mi lk HS
N min
EPr N bs
p_auc l 5
p_auc l 5_30
g_slope
p _ auc _ total
p _ auc _total
G LY t max
Pk �rlc_5
p_auc l 5
Emax Prlc
p_slope
EPI N t max
n�k_mean
GLY)ntrcpt
GLY auc l 5 60
GLY _slope
d60�msy
d60ymsy
totyfy
totycy
tot�tpy
tot�tpy
tot�cpy
d60�wpy
d60�cpy
d l 20_cppct
d l 80_cppct
tot_tppct
d 1 20_tppct
d 1 80 _tppct
d l 80_cpct
d240 _tppct
d l 20_cpct
tot_cppct
Appendices
Chr Bst Ietn Pval Fval 95%CI
3
3
4
4
4
4
4
4
4
4
4
5
5
5
5
5
5
5
5
5
5
5
5
5
5
5
5
5
5
5
5
5
5
5
5
1 23
1 24
26
40
53
76
79
83
9 1
9 1
9 1
64
83
88
92
92
94
95
95
96
97
98
98
98
98
1 00
1 02
1 02
1 02
1 02
1 02
1 02
1 02
1 02
1 02
0.0053 7. 1 3 23 - 1 24
0.0036 6. 1 3 6 1 - 1 24
0.0 1 5 . 1 1 1 1 - 1 2 1
0 .0059 5 . 72 1 6 - 83
0.0097 3 .64 0 - 1 06
0.00 1 6 6.92 1 4 - 88
0.0067 7.45 14 - 88
0 .0076 3 .69 30 - 1 02
0.0024 8.47 0 - 1 2 1
0.0046 7.78 1 1 - 1 2 1
0.0068 7 .37 7 - 1 2 1
0.0066 5 . 1 8 0 - 1 06
0.0028 4.35 9 - 95
0.0046 5 .6 1 1 8 - 1 06
0.00 1 5 4 .52 1 7 - 99
0.007 1 3 .82 1 6 - 1 06
0.00 1 2
0.0093
0.0093
0.005 1
0.002
0.00 14
0.00 14
0.00 1 8
0 .0069
0.0033
o o o o o o
0.000 1
0 .000 1
0.0002
4.73 1 7 - 1 05
3 . 7 1 0 - 1 06
3 . 7 1 0 - 1 06
3 . 9 1 9 - 1 06
4.4 9 - 1 06
4.62 9 - 1 06
4.62 9 - 1 06
4.47 9 - 1 06
3 . 8 1 0 - 1 06
4 .06 0 - 1 06
5 . 1 7 20 - 1 06
5 .29 2 1 - 1 06
5 .42 35 - 1 06
5 .08 1 9 - 1 06
5 .3 22 - 1 06
5 .24 1 7 - 1 06
5 .05 20 - 1 06
5 .07 1 6 - 1 06
5 .3 34 - 1 06
273
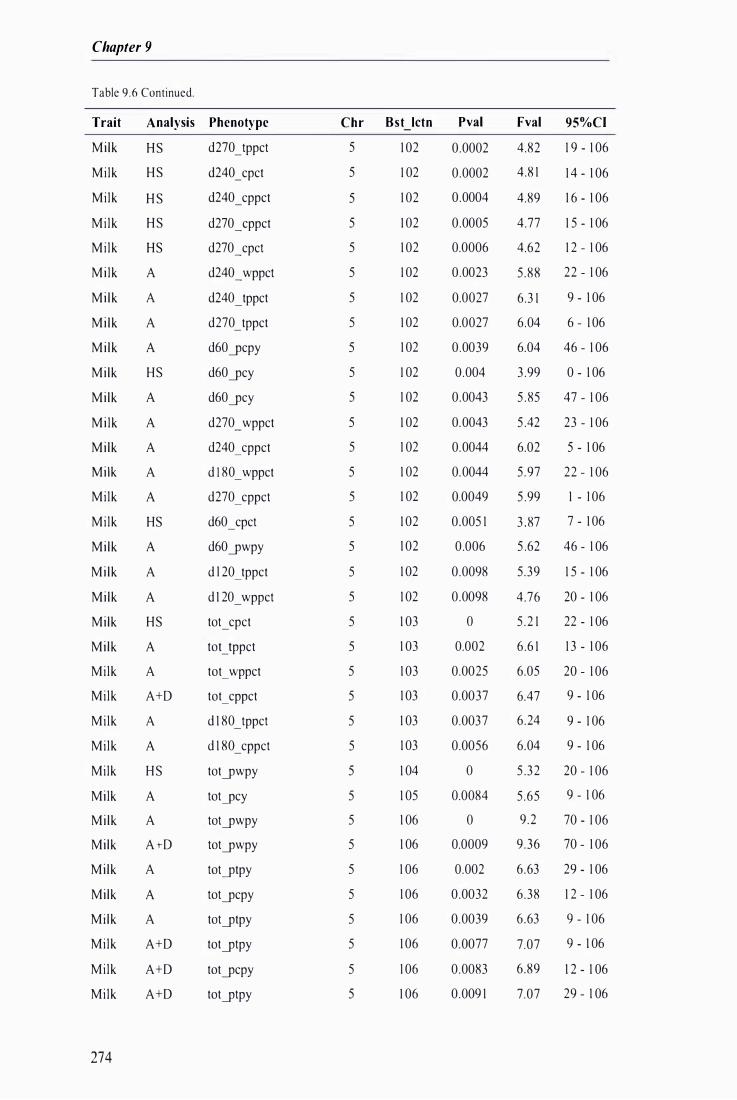
Chapter 9
Table 9.6 Continued.
Trait
Milk Milk Milk Mi lk Mi lk Milk Milk Milk Milk Milk Milk Milk Milk Milk Milk Milk Milk Milk Milk Milk Milk Milk Milk Milk Milk Milk Milk Milk Milk Milk Milk Milk Milk Milk Milk
274
Analysis Phenotype
HS d270_tppct
HS d240 _ cpct
H S d240 _ cppct
HS d270_cppct
HS
A
A
A
A
HS
A
A
A
A
A
HS
A
A
A
HS
A
A
A+D
A
A
HS
A
A
A+D
A
A
A
A+D
A+D
A+D
d270_cpct
d240_wppct
d240_tppct
d270_tppct
d60ycpy
d60ycy
d60ycy
d270_wppct
d240_cppct
d l 80_wppct
d270 _ cppct
d60_cpct
d60ywpy
d l 20_tppct
d 1 20_ wppct
tot_ cpct
toUppct
tot_wppct
tot_cppct
d 1 80 _tppct
d 1 80_ cppct
totywpy
totycy
totywpy
totywpy
totytpy
totycpy
totytpy
totytpy
totycpy
totytpy
Chr Bst Ietn Pval
5 1 02 0.0002
5 1 02 0.0002
5 1 02 0.0004
5 1 02 0.0005
5
5
5
5
5
5
5
5
5
5
5
5
5
5
5
5
5
5
5
5
5
5
5
5
5
5
5
5
5
5
5
1 02
1 02
1 02
1 02
1 02
1 02
1 02
1 02
1 02
1 02
1 02
1 02
1 02
1 02
1 02
1 03
1 03
1 03
1 03
1 03
1 03
1 04
1 05
1 06
1 06
1 06
1 06
1 06
1 06
1 06
1 06
0.0006
0.0023
0.0027
0.0027
0.0039
0.004
0.0043
0.0043
0.0044
0.0044
0.0049
0.005 1
0.006
0.0098
0.0098
o 0.002
0.0025
0.0037
0.0037
0.0056
o 0.0084
o 0.0009
0.002
0.0032
0.0039
0.0077
0.0083
0.009 1
Fval 95%CI
4.82 1 9 - 1 06
4.8 1 1 4 - 1 06
4.89 1 6 - 1 06
4.77 1 5 - 1 06
4.62 1 2 - 1 06
5 .88 22 - 1 06
6.3 1 9 - 1 06
6.04 6 - 1 06
6.04 46 - 1 06
3 .99 0 - 1 06
5 .85 47 - 1 06
5 .42 23 - 1 06
6.02 5 - 1 06
5 .97 22 - 1 06
5 .99 1 - 1 06
3 .87 7 - 1 06
5 .62 46 - 1 06
5 .39 1 5 - 1 06
4 .76 20 - 1 06
5 .2 1 22 - 1 06
6 .6 1 1 3 - 1 06
6.05 20 - 1 06
6.47 9 - 1 06
6.24 9 - 1 06
6.04 9 - 1 06
5 .32 20 - 1 06
5 .65 9 - 1 06
9 .2 70 - 1 06
9 .36 70 - 1 06
6 .63 29 - 1 06
6 .38 1 2 - 1 06
6 .63 9 - 1 06
7.07 9 - 1 06
6.89 1 2 - 1 06
7.07 29 - 1 06
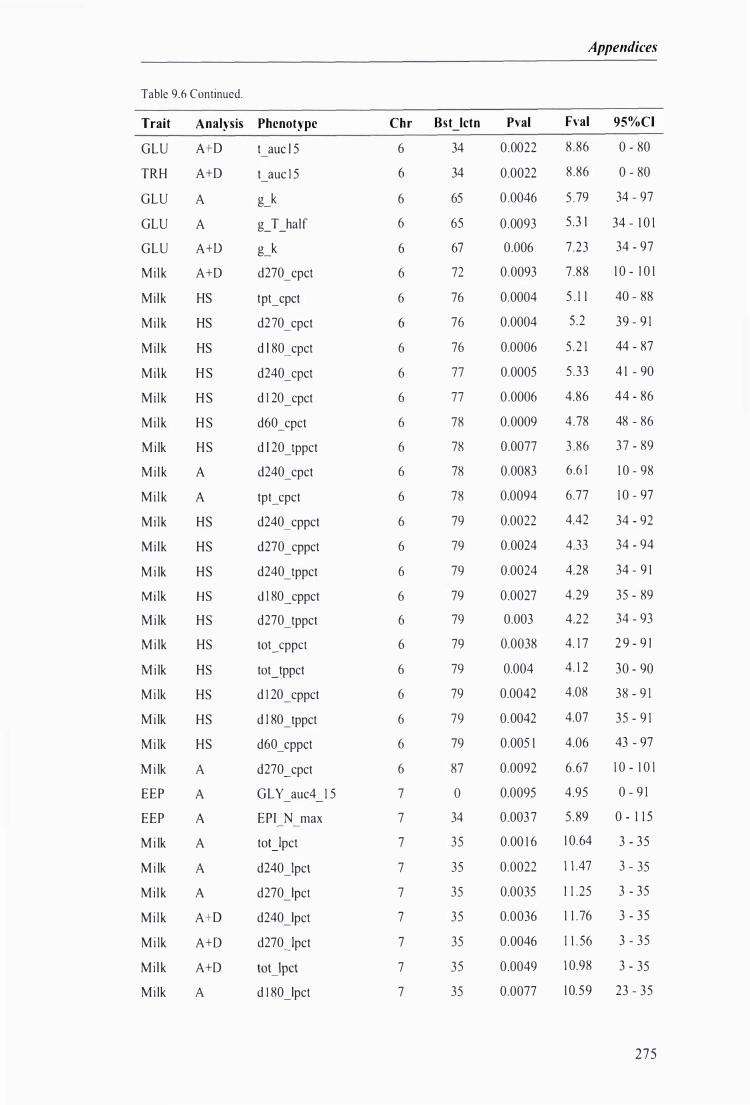
Table 9.6 Continued.
Trait
GLU
TRH
GLU
GLU
GLU
Milk
Milk
Milk
Mi lk
Milk
Milk
Milk
Mi lk
Mi lk
Mi lk
Mi lk
Mi lk
M i lk
Mi lk
Mi lk
Mi lk
Mi lk
Mi lk
Mi lk
Mi lk
M i lk
EEP
EEP
M i lk
M i lk
Mi lk
Mi lk
Mi lk
Mi lk
Mi lk
Analysis Phenotype
A+D t auc l 5
A+D t auc l 5
A g_k
A g_T_half
A+D g_k
A+D
HS
HS
HS
H S
H S
H S
HS
A
A
HS
HS
HS
HS
HS
HS
HS
HS
HS
HS
A
A
A
A
A
A
A+D
A+D
A+D
A
d270 _ cpct
tpt_cpct
d270_cpct
d l 80_cpct
d240_cpct
d l 20_cpct
d60_cpct
d l 20_tppct
d240_cpct
tpt_cpct
d240_cppct
d270_cppct
d240_tppct
d 1 80_cppct
d270_tppcI
lot_ CppCI
tot_tppct
d l 20_cppct
d 1 80_tppct
d60_cppct
d270_cpct
GLY auc4 1 5
EPI N max
toUpct
d240-'pcl
d270-'pcl
d240-'pct
d270-'pct
toUPCI
d l 80-'pct
Chr Bst Ietn Pval
6 34 0.0022
6 34 0.0022
6 65 0 .0046
6 65 0.0093
6 67 0.006
6
6
6
6
6
6
6
6
6
6
6
6
6
6
6
6
6
6
6
6
6
7
7
7
7
7
7
7
7
7
72
76
76
76
77
77
78
78
78
78
79
79
79
79
79
79
79
79
79
79
87
o 34
35
35
35
35
35
35
35
0.0093
0.0004
0.0004
0.0006
0.0005
0 .0006
0 .0009
0.0077
0.0083
0.0094
0.0022
0.0024
0.0024
0.0027
0.003
0.0038
0.004
0.0042
0.0042
0.005 1
0.0092
0.0095
0.0037
0.00 1 6
0.0022
0.0035
0.0036
0.0046
0.0049
0.0077
Appendices
Fval 95%C[
8 .86 0 - 80
8 .86 0 - 80
5 .79 34 - 97
5 .3 1 34 - 1 0 1
7 .23 34 - 97
7 .88 1 0 - 1 0 1
5 . 1 1 40 - 88
5 .2 39 - 9 1
5 .2 1 44 - 87
5 .33 4 1 - 90
4.86 44 - 86
4 .78 48 - 86
3 .86 37 - 89
6.6 1 1 0 - 98
6.77 1 0 - 97
4.42 34 - 92
4.33 34 - 94
4.28 34 - 9 1
4.29 35 - 89
4.22 34 - 93
4. 1 7 2 9 - 9 1
4 . 1 2 30 - 90
4.08 38 - 9 1
4.07 35 - 9 1
4.06 43 - 97
6 .67 1 0 - 1 0 1
4.95 0 - 9 1
5 . 89 0 - 1 1 5
1 0.64 3 - 35
1 1 .47 3 - 35
1 1 .25 3 - 35
1 1 . 76 3 - 35
1 1 . 56 3 - 35
1 0.98 3 - 35
1 0. 59 23 - 35
275
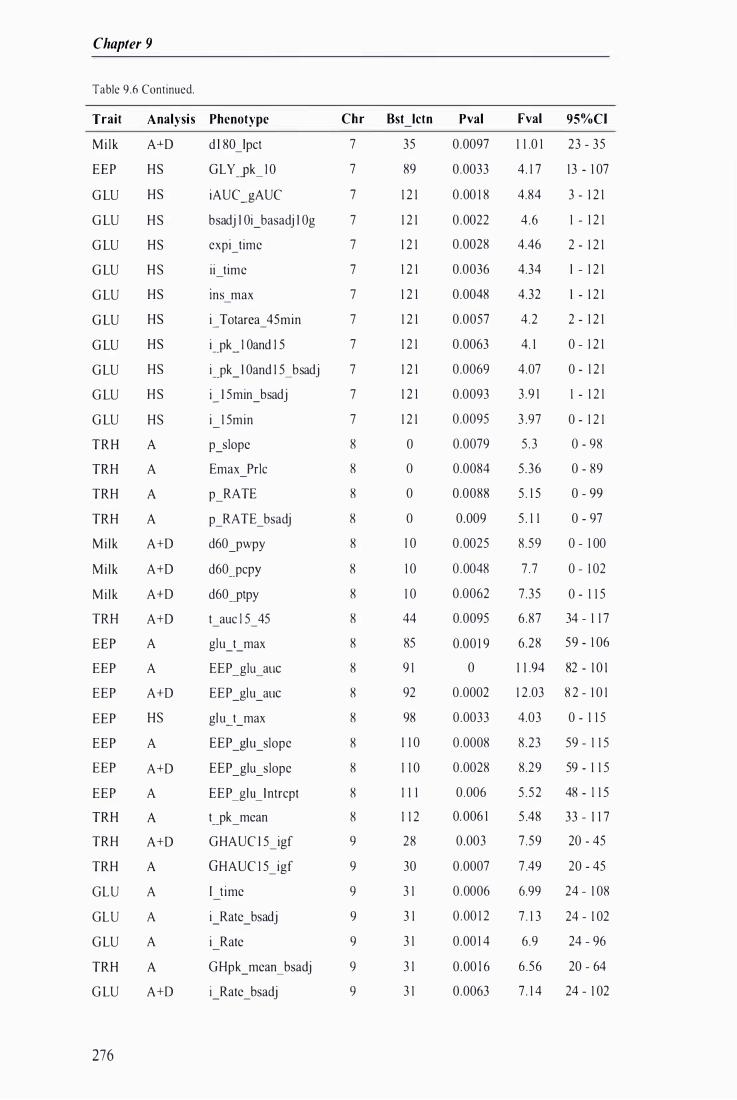
Chapter 9
Table 9.6 Continued.
Trait Analysis Phenotype
Milk A+D
EEP HS
G LU HS
G LU HS
G LU HS
G LU HS
G LU HS
G LU HS
G LU HS
GLU HS
G LU HS
G LU HS
TRH A
TRH A
TRH A
TRH A
Mi lk A+D
Mi lk A+D
Mi lk A+D
TRH A+D
EEP A
EEP A
EEP A+D
EEP HS
EEP A
EEP A+D
EEP A
TRH A
TRH A+D
TRH A
GLU A
GLU A
GLU A
TRH A
G LU A+D
276
d l 80_lpct
GLY -'pk_ I O
iAUC_gAUC
bsadj I Oi_ basadj I Og
expUime
ii time
InS max
i Totarea 45min - -
i-'pk _ I Oand I S
i-'pk _ I Oand 1 5 _ bsadj
U 5min_bsadj
i 1 5min
p_slope
Emax Prlc
p_RATE
p_RA TE_bsadj
d60-'pwpy
d60-'pcPY
d60-.ptpy
t auc l 5 45 - -
glll_t_max
EEP _glu _ allC
EEP _glll_ allC
gl ll_t_max
EEP _gIll_slope
EEP _glu_slope
EEP _gl ll_Intrcpt
t-'pk_mean
GHAUC I 5_igf
GHAUC 1 5 _igf
I t ime
i_Rate_bsadj
i Rate
G Hpk _mean _ bsad j
i_ Rate _ bsad j
Chr Bst Ietn Pval Fval 95%CI
7
7
7
7
7
7
7
7
7
7
7
7
8
8
8
8
8
8
8
8
8
8
8
8
8
8
8
8
9
9
9
9
9
9
9
35
89
1 2 1
1 2 1
1 2 1
1 2 1
1 2 1
1 2 1
1 2 1
1 2 1
1 2 1
1 2 1
o o o o 1 0
1 0
1 0
44
85
9 1
92
98
1 1 0
1 1 0
I 1 1
1 1 2
28
30
3 1
3 1
3 1
3 1
3 1
0.0097 1 1 .0 1 23 - 35
0.0033 4 . 1 7 13 - 1 07
0 .00 1 8 4.84 3 - 1 2 1
0 .0022 4 .6 1 - 1 2 1
0.0028 4.46 2 - 1 2 1
0.0036 4.34 I - 1 2 1
0.0048 4.32 I - 1 2 1
0.0057 4 .2 2 - 1 2 1
0.0063 4. 1 0 - 1 2 1
0.0069 4.07 0 - 1 2 1
0.0093 3 .9 1 1 - 1 2 1
0.0095 3 .97 0 - 1 2 1
0.0079 5 .3 0 - 98
0.0084 5 .36 0 - 89
0.0088 5 . 1 5 0 - 99
0.009 5 . 1 1 0 - 97
0 .0025 8 .59 0 - 1 00
0 .0048 7 .7 0 - 1 02
0.0062 7.35 0 - 1 1 5
0.0095 6.87 34 - 1 1 7
0.00 1 9 6.28 59 - 1 06
o 1 1 .94 82 - 1 0 1
0.0002 1 2 .03 8 2 - 1 0 1
0.0033 4.03 0 - 1 1 5
0.0008 8 .23 59 - 1 1 5
0.0028 8.29 59 - 1 1 5
0.006 5 .52 48 - 1 1 5
0. 006 1 5 .48 33 - 1 1 7
0.003 7 .59 20 - 45
0.0007 7 .49 20 - 45
0 .0006 6.99 24 - 1 08
0 .00 1 2 7 . 1 3 24 - 1 02
0.00 1 4 6.9 24 - 96
0 .00 1 6 6 .56 20 - 64
0.0063 7 . 1 4 24 - 1 02
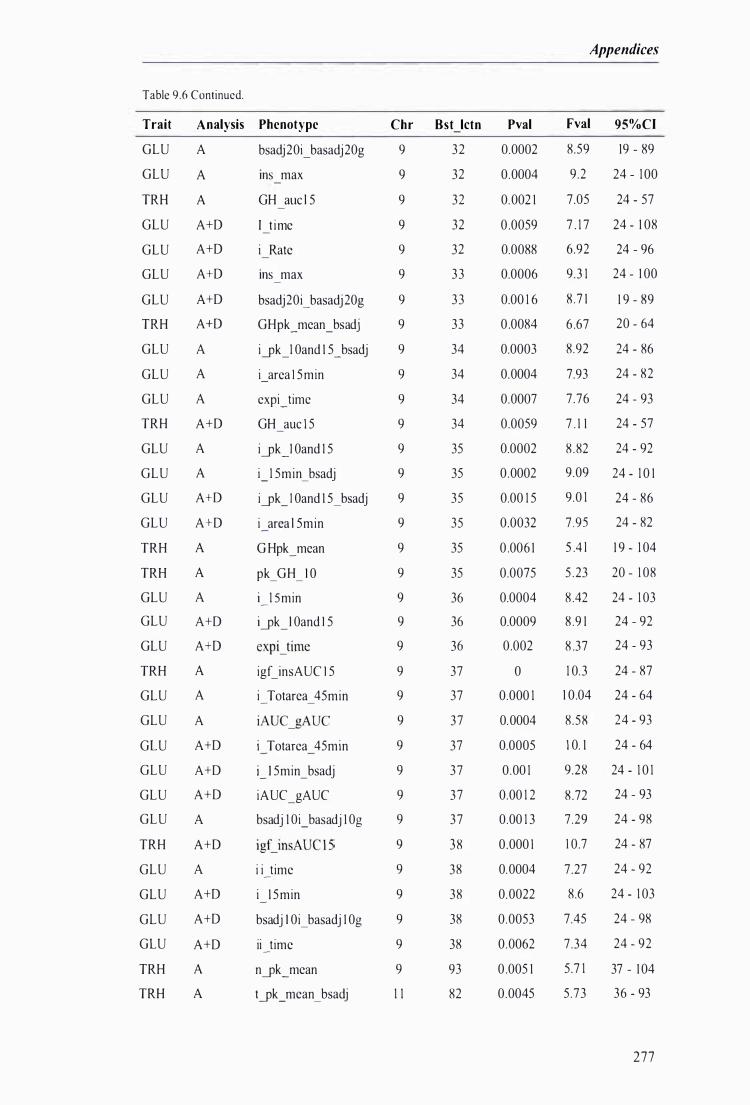
Table 9.6 Continued.
Trait Analysis Phenotype
GLU A
GLU A
TRH A
GLU A+D
GLU A+D
GLU A+D
GLU A+D
TRH A+D
GLU A
GLU A
GLU A
TRH A+D
GLU A
GLU A
GLU A+D
GLU A+D
TRH A
TRH A
GLU A
GLU A+D
GLU A+D
TRH A
GLU A
GLU A
GLU A+D
GLU A+D
GLU A+D
GLU A
TRH A+D
GLU A
GLU A+D
GLU A+D
GLU A+D
TRH A
TRH A
bsadj20i_ basadj20g
IOS max
GH allc l 5
I t ime
i Rate
IOS max
bsadj20i_ basadj20g
GHpk_mean_bsadj
i�k_1 Oand 1 5_ bsadj
i area l 5min
expi_time
GH auc 1 5
i�k_I Oand I 5
i_ 1 5min _ bsadj
i�k _ I Oand 1 5 _ bsadj
i area l 5min
G Hpk_mean
pk_GH_ I O
i 1 5min
i�k_I Oand I 5
expUime
igUnsAUC I 5
i Totarea 45min
iAUC_gAUC
i Totarea 45min
U 5min_bsadj
iAUC_gAUC
bsadj 1 0i_basadj 1 09
igUnsAUC I 5
i i time
i 1 5min
bsadj I Oi _ basadj 1 09
ii time
n�k_mean
t�k_ mean _ bsadj
Chr Bst letn Pval
9
9
9
9
9
9
9
9
9
9
9
9
9
9
9
9
9
9
9
9
9
9
9
9
9
9
9
9
9
9
9
9
9
9
1 1
32
32
32
32
32
33
33
33
34
34
34
34
35
35
35
35
35
35
36
36
36
37
37
37
37
37
37
37
38
38
38
38
38
93
82
0.0002
0.0004
0.002 1
0 .0059
0.0088
0.0006
0.00 1 6
0 .0084
0.0003
0.0004
0.0007
0.0059
0.0002
0.0002
0.00 1 5
0.0032
0 .006 1
0.0075
0.0004
0.0009
0.002
o 0.000 1
0.0004
0.0005
0.00 1
0.00 1 2
0.00 1 3
0.000 1
0.0004
0.0022
0.0053
0.0062
0 .005 1
0.0045
Appendices
Fval 95%CI
8.59 19 - 89
9.2 24 - 1 00
7.05 24 - 57
7 . 1 7 24 - 1 08
6.92 24 - 96
9.3 1 24 - 1 00
8 .7 1 1 9 - 89
6 .67 20 - 64
8.92 24 - 86
7.93 24 - 82
7 .76 24 - 93
7 . 1 1 24 - 57
8 .82 24 - 92
9.09 24 - 1 0 1
9.0 1 24 - 86
7.95 24 - 82
S A l 1 9 - 1 04
5 .23 20 - 1 08
8 .42 24 - 1 03
8 .9 1 24 - 92
8 .37 24 - 93
1 0.3 24 - 87
1 0.04 24 - 64
8 .58 24 - 93
1 0. 1 24 - 64
9.28 24 - 1 0 1
8 .72 24 - 93
7.29 24 - 98
1 0.7 24 - 87
7.27 24 - 92
8.6 24 - 1 03
7.45 24 - 98
7.34 24 - 92
5.7 1 37 - 1 04
5 .73 36 - 93
277
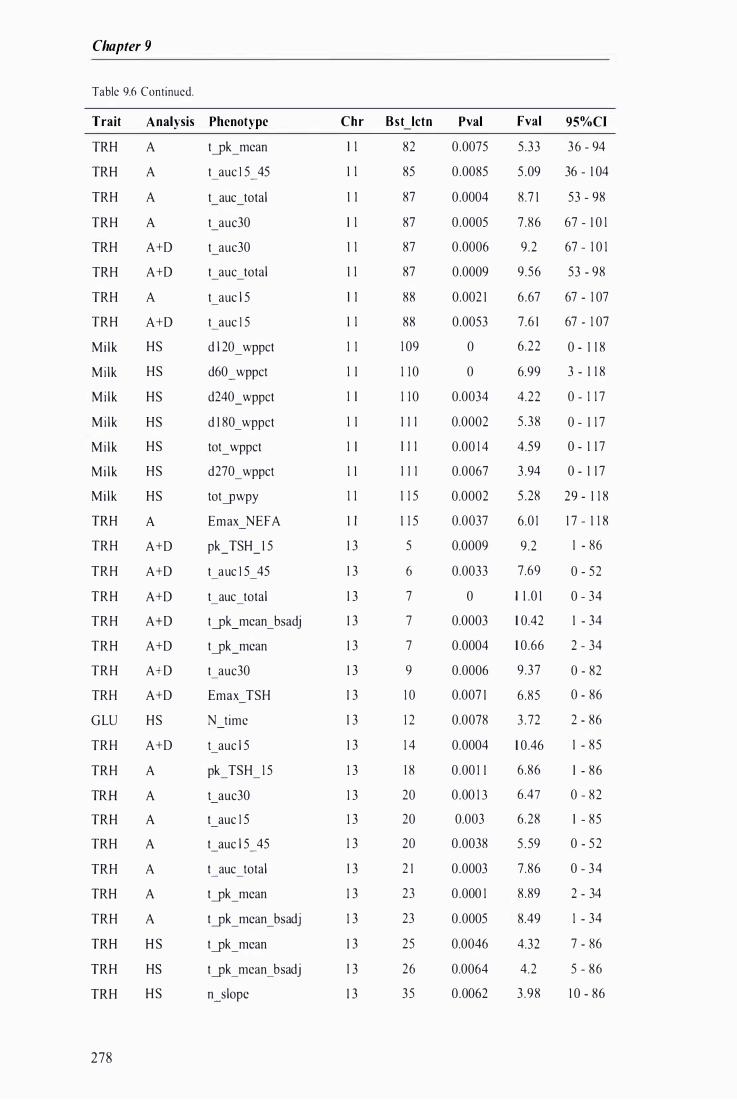
Chapter 9
Table 9.6 Continued.
Trait Analysis Phenotype
TRH A
TRH A
TRH A
TRH A
TRH A+D
TRH A+D
TRH A
TRH A+D
Mi lk HS
Milk HS
Mi lk HS
Mi lk HS
Mi lk HS
Mi lk HS
Mi lk HS
TRH A
TRH A+D
TRH A+D
TRH A+D
TRH A+D
TRH A+D
TRH A+D
TRH A+D
GLU HS
TRH A+D
TRH A
TRH A
TRH A
TRH A
TRH A
TRH A
TRH A
TRH H S
TRH HS
TRH HS
278
tyk_mean
t auc l 5 45 - -
t auc total
t auc30
t auc30
t auc total
t auc l 5
t auc l 5
d l 20_wppct
d60_wppct
d240_wppct
d 1 80_ wppct
tot_wppct
d270_wppct
to t---.pwpy
Emax NEFA
pk_TSH_ 1 5
t auc l 5 45 - -
t auc total
tyk _mean _ bsad j
tyk_mean
t auc30
Emax TSH
N time
t auc l 5
pk_TSH_ 1 5
t auc30
t auc l 5
t auc l 5 45 - -
t auc total
tyk_mean
tyk _mean _ bsadj
tyk_mean
tyk _mean _ bsadj
n_slope
Chr Bst Ietn Pval
I 1
1 1
1 I
I 1
1 1
1 1
I I
1 1
1 1
1 1
1 I
1 1
1 I
1 1
1 1
1 I
1 3
1 3
1 3
1 3
1 3
1 3
1 3
1 3
1 3
1 3
1 3
1 3
1 3
1 3
1 3
1 3
1 3
1 3
1 3
82
85
87
87
87
87
88
88
1 09
1 1 0
1 1 0
I I I
I I I
I I I
1 1 5
1 1 5
5
6
7
7
7
9
1 0
1 2
1 4
1 8
20
20
20
2 1
23
23
25
26
35
0.0075
0.0085
0.0004
0.0005
0.0006
0.0009
0.002 1
0.0053
o o
0.0034
0.0002
0.00 1 4
0.0067
0.0002
0.0037
0.0009
0.0033
o 0.0003
0.0004
0.0006
0.007 1
0.0078
0.0004
0.00 1 1
0.00 1 3
0.003
0.0038
0.0003
0.000 1
0.0005
0.0046
0.0064
0.0062
Fval 95%CI
5.33 36 - 94
5 .09 36 - 1 04
8.7 1 53 - 98
7 .86 67 - 1 0 1
9 .2 67 - 1 0 1
9 .56 53 - 98
6 .67 67 - 1 07
7.6 1 67 - 1 07
6.22 0 - 1 1 8
6.99 3 - 1 1 8
4.22 0 - 1 1 7
5 .38 0 - 1 1 7
4.59 0 - 1 1 7
3 .94 0 - 1 1 7
5 .28 29 - 1 1 8
6.0 1 1 7 - 1 1 8
9 .2 1 - 86
7.69 0 - 52
1 1 .0 1 0 - 34
1 0.42 1 - 34
1 0.66 2 - 34
9 .37 0 - 82
6 .85 0 - 86
3 . 72 2 - 86
1 0.46 1 - 85
6 .86 I - 86
6.47 0 - 82
6.28 I - 85
5 . 59 0 - 52
7.86 0 - 34
8 .89 2 - 34
8.49 1 - 34
4.32 7 - 86
4.2 5 - 86
3 .98 1 0 - 86
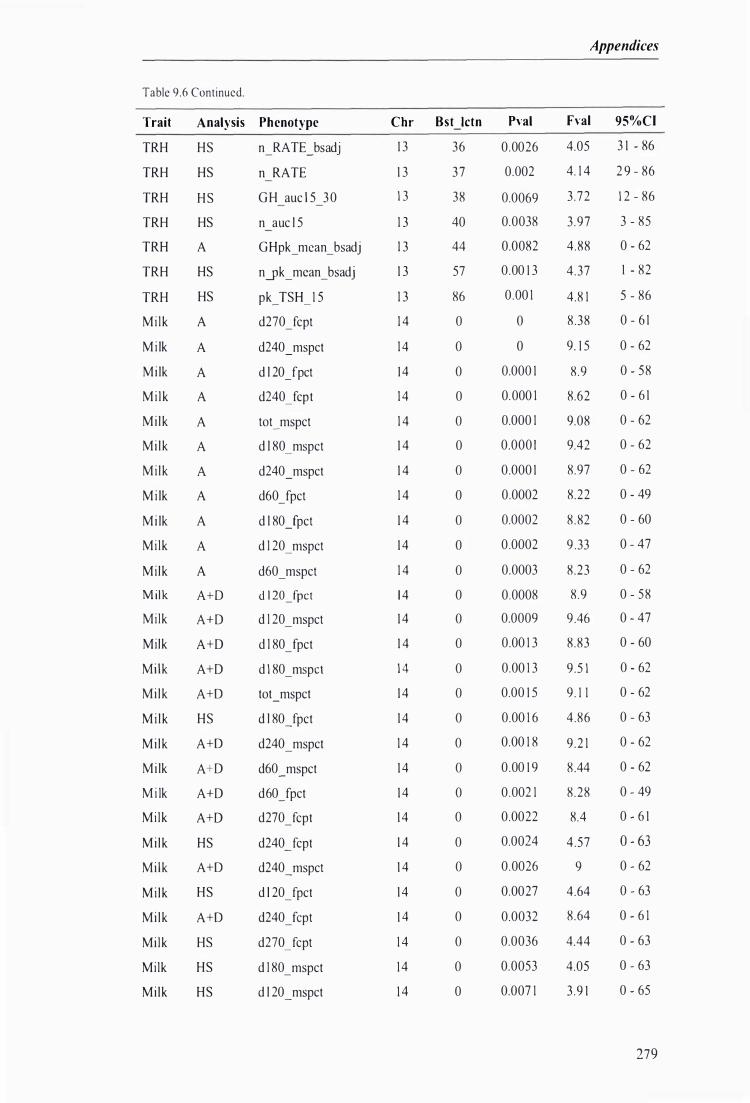
Table 9.6 Continued.
Trait Analysis Phenotype
TRH
TRH
TRH
HS n_RATE_bsadj
HS n RATE
HS GH auc l 5 30
TRH HS
TRH A
TRH HS
TRH HS
Mi lk A
Mi lk A
Mi lk A
Mi lk A
Mi lk A
Mi lk A
Mi lk A
Mi lk A
Mi lk A
Milk A
Mi lk A
M ilk A+D
Milk A+D
Milk A+D
Milk A+D
Mi lk A+O
Mi lk HS
Mi lk A+O
Mi lk A+D
Mi lk A+D
Milk A+D
Mi lk HS
Mi lk A+O
Mi lk HS
Mi lk A+O
Milk HS
Milk HS
Mi lk HS
n auc l 5
GHpk_mean_bsadj
n �k _mean _ bsadj
pk_TSH_1 5
d270_fcpt
d240_mspct
d l 20Jpct
d240_fcpt
tot_mspct
d l 80_mspct
d240_mspct
d60Jpct
d l 80Jpct
d l 20_mspct
d60_mspct
d l 20_fpct
d l 20_mspct
d l 80_fpct
d 1 80_mspct
tot_mspct
d l 80_fpct
d240_mspct
d60_mspct
d60Jpct
d270_fcpt
d240_fcpt
d240_mspct
d l 20_fpct
d240_fcpt
d270_fcpt
d l 80_mspct
d l 20_mspct
Appendices
Chr Bst \ctn Pval Fval 95%CI
1 3 36 0.0026 4.05 3 1 - 86
1 3 37 0.002 4. 1 4 2 9 - 86
1 3 38 0.0069 3 .72 1 2 - 86
1 3
1 3
1 3
1 3
1 4
14
14
14
1 4
1 4
1 4
1 4
1 4
1 4
1 4
1 4
1 4
1 4
1 4
1 4
1 4
1 4
1 4
1 4
1 4
1 4
1 4
1 4
1 4
1 4
14
1 4
40
44
57
86
o o o o o o o o o o o o o o o o o o o o o o o o o o o o
0.0038 3 .97
0.0082 4.88
0.00 1 3 4 .37
0.00 1 4.8 1
o 8.38
o 9. 1 5
0.000 1 8 .9
0.000 1 8.62
0.000 1 9.08
0.000 I 9.42
0.000 1 8.97
0.0002 8.22
0.0002 8 .82
0.0002 9 .33
0.0003 8 .23
0.0008 8 .9
0.0009 9 .46
0.00 1 3 8 .83
0.00 1 3 9 .5 1
0.00 1 5 9 . 1 1
0.00 1 6 4 .86
0.00 1 8 9 .2 1
0.00 1 9 8 .44
0.002 1 8 .28
0.0022 8.4
0.0024 4.57
0.0026 9
0.0027 4.64
0.0032 8 .64
0.0036 4.44
0.0053 4.05
0.007 1 3 .9 1
3 - 85
0 - 62
1 - 82
5 - 86
0 - 6 1
0 - 62
0 - 58
0 - 6 1
0 - 62
0 - 62
0 - 62
0 - 49
0 - 60
0 - 47
0 - 62
0 - 58
0 - 47
0 - 60
0 - 62
0 - 62
0 - 63
0 - 62
0 - 62
0 - 49
0 - 6 1
0 - 63
0 - 62
0 - 63
0 - 6 1
0 - 63
0 - 63
0 - 65
279

Chapter 9
Table 9.6 Continued.
Trait Analysis Phenotype
Milk HS
Milk HS
GLU A
GLU A+D
EEP A+D
EEP A
TRH A
TRH A+D
Mi lk A+D
Mi lk A+D
Mi lk A
Mi lk A
Mi lk A+D
Mi lk A
Mi lk A
Mi lk A
Mi lk A+D
Mi lk A+D
Mi lk A
EEP A
Mi lk A
Mi lk A+D
Mi lk A+D
EEP A+D
Mi lk A
Mi lk A
Mi lk A
EEP A
EEP A+D
EEP HS
EEP A
EEP HS
GLU H S
GLU HS
GLU H S
280
tot_mspct
d240_mspct
i r m m5
i r m m5
EEP _N _ Intrcpt
EEP _ N _ Intrcpt
igCmean
igCmean
d60ymy
d60yly
d60yly
d60ymy
d60ycpy
d60ycpy
d60ytpy
d60ycy
d60ytpy
d60ycy
d60ymsy
G L Y _ Intrcpt
d60ywpy
d60ymsy
d60ywpy
GLY_Intrcpt
totywpy
totycpy
totymy
GLY auc \ 5 60 - -
GLY auc \ 5 60 - -
GLYyk_ I O
gluyk_20
GLY bs
G time
expi_time
Chr Bst letn Pval Fval 95%CI
1 4
1 4
1 4
1 4
1 4
1 4
1 4
1 4
1 4
1 4
1 4
1 4
1 4
1 4
1 4
1 4
1 4
1 4
1 4
1 4
1 4
1 4
1 4
1 4
1 4
1 4
1 4
1 4
1 4
1 5
1 5
1 5
1 5
1 5
1 5
o o
38
38
4 1
45
47
47
48
48
49
49
5 1
5 1
5 1
5 1
5 1
5 1
5 1
5 1
5 1
5 1
5 1
5 1
54
56
56
63
65
2
3
34
36
37
0.0087 3 .84 0 - 63
0.0087 3 . 83 0 - 63
0.00 1 1 7 .47 38 - 9 1
0.0047 7.93 3 8 - 9 1
0.0 1 6.94 0 - 95
0.0093 5 . 1 0 - 95
0.0006 7.72 38 - 65
0.0043 7 .73 38 - 65
o 1 1 .07 1 3 - 56
0.000 1 1 l . l 8 2 1 - 56
o I OJ 7 2 1 - 56
0.000 1 1 0.09 1 3 - 56
o 1 1 .72 37 - 55
o 1 1 .3 1 37 - 55
o 1 1 .26 38 - 54
0.000 1 1 l . l 4 35 - 56
0.000 I 1 1 .59 38 - 54
0.0002 1 1 .57 35 - 56
0.0002 8 . 72 22 - 60
0.00 1 2 7.27 47 - 9 1
0.00 1 2 7.92 20 - 54
0.00 1 6 9 .53 22 - 60
0.003 1 7 .92 20 - 54
0.0067 7J5 47 - 9 1
0.0044 5 .84 7 - 76
0.004 5 .64 12 - 95
0.0 1 4 .95 0 - 95
0.0049 5 .98 45 - 95
0.0064 7 .5 45 - 95
0.0023
0.004 1
0.0065
0.000 1
0.000 1
0.0033
4 . 1 4 0 - 68
5 .35 0 - 38
3 .72 0 - 76
5 .65 22 - 52
5 .07 22 - 5 1
4.34 0 - 64

Table 9.6 Continued.
Trait Analysis Phenotype
GLU
GLU
GLU
GLU
GLU
GLU
GLU
GLU
GLU
GLU
GLU
GLU
GLU
EEP
TRH
GLU
EEP
EEP
EEP
TRH
TRH
TRH
TRH
TRH
Mi lk
M i lk
Mi lk
Milk
Mi lk
M i lk
Mi lk
Milk
Mi lk
M i lk
Milk
HS
HS
HS
HS
HS
HS
HS
HS
HS
HS
HS
HS
HS
HS
HS
HS
A+D
A
HS
A
A+D
A
HS
A
A
A
A+D
A
A
A+D
A
A+D
A
A
A
InS max
ii t ime
g_T_half
I time
i Totarea 45min
iAVC_gAVC
i area l 5min
iyk_ I Oand l 5
i 1 5min
U 5min_bsadj
bsadj 1 0i_ basadj 1 09
i_Rate_bsadj
i Rate
EEP_N_RSQ
igUnsAUC I 5
iyk _ I Oand 1 5_ bsadj
glu_bs
glu_bs
EEP N aue
GH bs
GH bs
GHbs_igf
n_i_slope
g_slape
d60Jpet
d 1 20Jpet
d60Jpet
d l 80Jpet
taUpet
d 1 20Jpet
d240Jpet
d 1 80Jpet
d 1 20_ epet
d240_epet
d 1 80_ epet
Appendices
Chr Bst letn Pval Fval 95%CI
1 5
1 5
1 5
I S
1 5
1 5
1 5
1 5
1 5
1 5
1 5
1 5
1 5
1 5
1 5
1 5
1 6
1 6
1 6 1 6
1 6
1 6
1 6
1 7
1 7
1 7
1 7
1 7
1 7
1 7
1 7
1 7
1 7
1 7
1 7
38
38
38
38
46
47
48
48
48
48
48
49
49
49
49
49
o o 7
2 1
2 1
22
4 1
25
5 1
5 1
5 1
5 1
5 1
5 1
5 1
5 1
53
53
53
0.0005
0.0006
0 .0007
0.00 1 6
0.0048
5.4
4.97
4 .29
4 .7
4 .2 1
0.0065 4 . 1 1
0 .00 1 5 .03
0.00 1 1 4.73
0.0026 4.3
0.0029 4.52
0.005 1 4 .2
0.0005 5 .33
0.0006 5 .2 1
0.0008 4.43
0 .0009 4.7
0.00 1 2 4.93
0.00076 6.99
0.0099 5 . 1 3
0.0023 4 .47
0.002 1 6.76
0.0094 6.94
0.0044 6 .03
0.0084 3 . 77
0.0064 5 .5 1
0.000 I 1 0.22
0.0009 8 .7 1
0.002 1 1 0.24
0.0028 7 .57
0.0049 6.8
0 .0065 8 .78
0.0075 6.69
0.0092 7.78
0.0047 5.93
0 .005 5 .62
0.0055 5 .87
13 - 69
I - 7 1
0 - 56
7 - 69
0 - 73
0 - 73
1 0 - 73
24 - 73
13 - 7 1
2 5 - 72
4 - 75
22 - 73
26 - 73
1 3 - 64
1 3 - 72
27 - 72
0 - 67
0 - 67
0 - 85
2 - 73
2 - 73
4 - 48
2 - 5 1
2 - 58
49 - 63
47 - 52
49 - 63
44 - 60
32 - 60
47 - 52
32 - 60
44 - 60
25 - 60
8 - 60
1 0 - 60
28 1
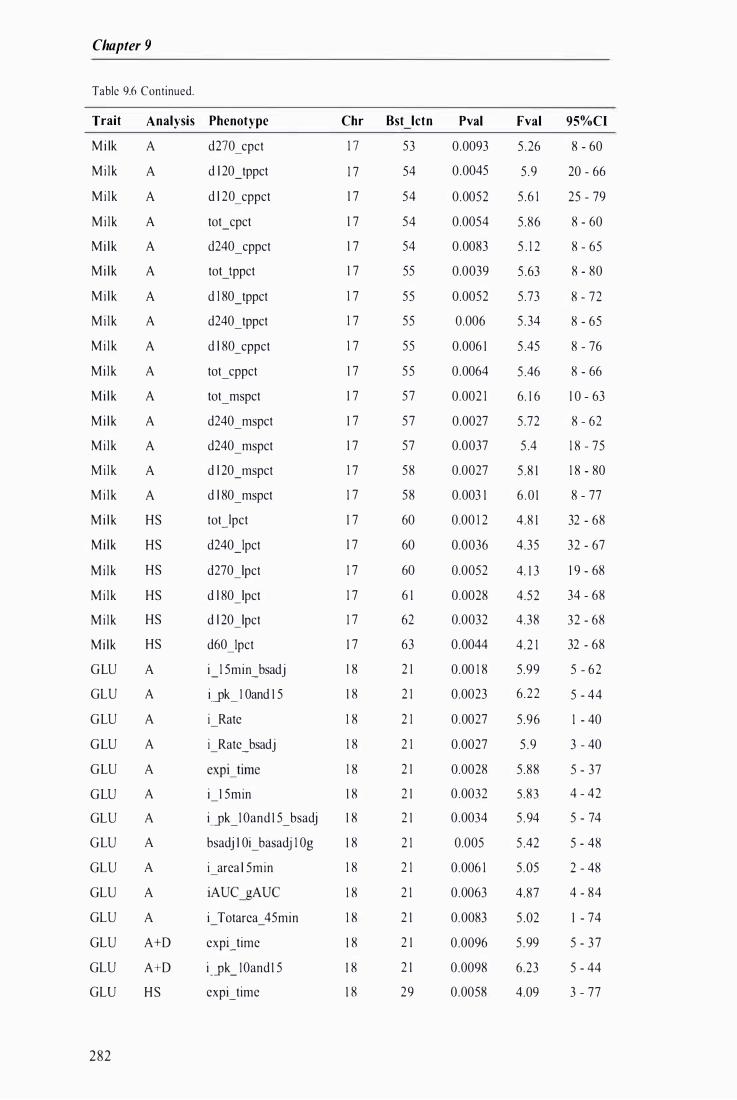
Chapter 9
Table 9.6 Continued.
Trait Analysis Phenotype
Mi lk
Mi lk
Mi lk
A d270_cpct
A d l 20_tppct
A d l 20_cppct
Mi lk A
Mi lk A
Mi lk A
Mi lk A
Mi lk A
Mi lk A
Mi lk A
Mi lk A
Mi lk A
Mi lk A
Mi lk A
Mi lk A
Mi lk HS
Mi lk HS
Mi lk HS
Mi lk HS
Mi lk HS
Mi lk HS
OLU A
OLU A
OLU A
OLU A
OLU A
OLU A
OLU A
OLU A
OLU A
OLU A
OLU A
OLU OLU OLD
282
A+D
A+D
HS
tot_cpct
d240_cppct
touppct
d l 80_tppct
d240_tppct
d l 80 _ cppct
tot_cppct
tot_mspct
d240_mspct
d240_mspct
d l 20_mspct
d l 80_mspct
toUpct
d240_lpct
d270Jpct
d l 80Jpct
d l 20Jpct
d60 _Ipct
i_1 5min_bsadj
i.JJk _ I Oand 1 5
i Rate
i_Rate_bsadj
expUime
i 1 5min
i.JJk _1 Oand 1 5_ bsadj
bsadj I Oi_ basadj 1 09
i area l 5min
i Totarea 45min
expUime
i.JJk _ I Oand 1 5
expUime
Chr Bst letn Pval
1 7 53 0.0093
1 7 54 0.0045
1 7 54 0.0052
1 7
1 7
1 7
1 7
1 7
1 7
1 7
1 7
1 7
1 7
1 7
1 7
1 7
1 7
1 7
1 7
1 7
1 7
1 8
1 8
1 8
1 8
1 8
1 8
1 8
1 8
1 8
1 8
1 8
1 8
1 8
1 8
54
54
55
55
55
55
55
57
57
57
58
58
60
60
60
6 1
62
63
2 1
2 1
2 1
2 1
2 1
2 1
2 1
2 1
2 1
2 1
2 1
2 1
2 1
29
0.0054
0.0083
0.0039
0.0052
0.006
0.006 1
0.0064
0.002 1
0.0027
0.0037
0.0027
0.003 1
0.00 1 2
0.0036
0.0052
0.0028
0.0032
0.0044
0.00 1 8
0.0023
0.0027
0.0027
0.0028
0.0032
0.0034
0.005
0.006 1
0 .0063
0.0083
0 .0096
0.0098
0.0058
Fval
5 .26
5 .9
5 .6 1
95%C[
8 - 60
20 - 66
25 - 79
5 .86 8 - 60
5 . 1 2 8 - 65
5 .63 8 - 80
5 .73 8 - 72
5 .34 8 - 65
5 .45 8 - 76
5 .46 8 - 66
6. 1 6 1 0 - 63
5 .72 8 - 62
5 .4 1 8 - 75
5 .8 1 1 8 - 80
6 . 0 1 8 - 77
4 .8 1 32 - 68
4.35 32 - 67
4. 1 3 1 9 - 68
4.52 34 - 68
4 .38 32 - 68
4 .2 1 32 - 68
5.99 5 - 62
6 .22 5 - 44
5 .96 1 - 40
5 .9 3 - 40
5 .88 5 - 37
5 .83 4 - 42
5 .94 5 - 74
5 .42 5 - 48
5 .05 2 - 48
4.87 4 - 84
5 .02 1 - 74
5 .99
6.23
4.09
5 - 37
5 - 44
3 - 77
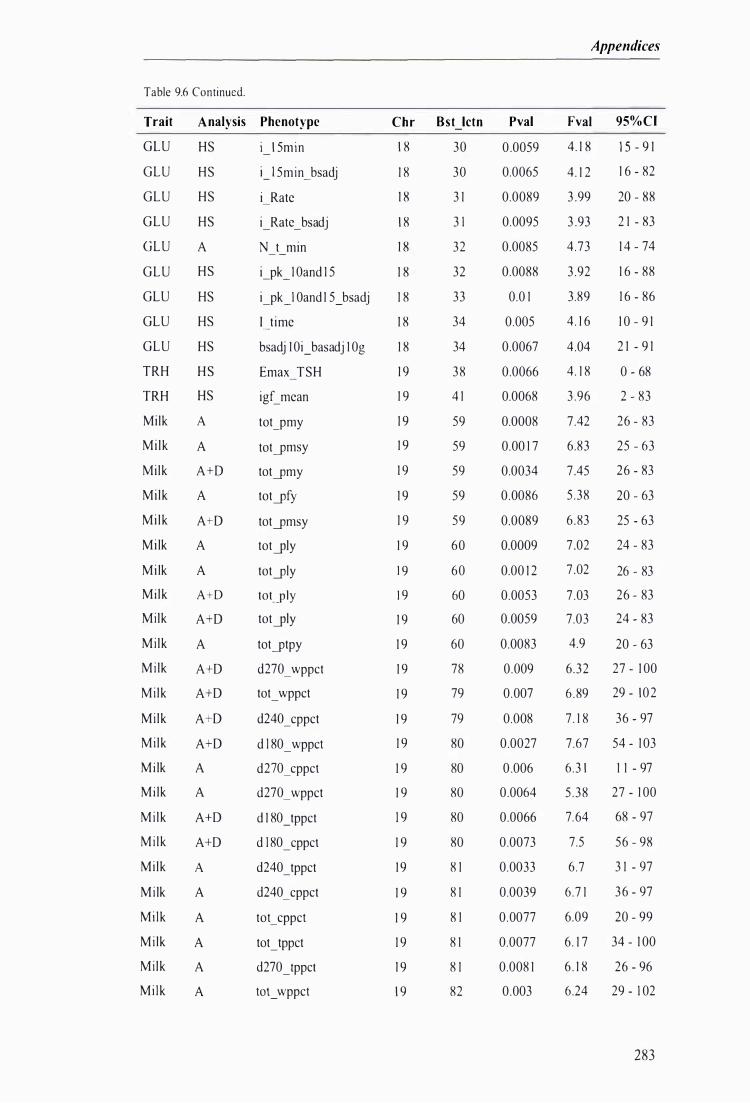
Table 9.6 Continued.
Trait Analysis Phenotype Chr Bst letn Pval
GLU HS i 1 5min 1 8 30 0 .0059
GLU HS U 5min_bsadj 1 8 30 0.0065
GLU HS
GLU HS
GLU A
GLU HS
GLU HS
GLU HS
GLU HS
TRH HS
TRH HS
Milk A
Milk A
Milk A+D
Mi lk A
Mi lk A+D
Mi lk A
Mi lk A
Mi lk A+D
Milk A+D
Mi lk A
Mi lk A+D
Mi lk A+D
Mi lk A+D
Mi lk A+D
Mi lk A
Mi lk A
Mi lk A+D
Mi lk A+D
Mi lk A
Milk A
Mi lk A
Mi lk A
Mi lk A
Mi lk A
i Rate 1 8
i_Rate_bsadj 1 8
N t min 1 8
i--'pk_ I Oand I 5 1 8
i--'pk_1 Oand 1 5_ bsadj 1 8
I t ime 1 8
bsadj 1 0 i_ basadj 1 09 1 8
Emax TSH 1 9
igCmean 1 9
to t--.p my 1 9
tot--'pmsy 1 9
tot--'pmy 1 9
tot--'pfy 1 9
tot--'pmsy 1 9
tot--'ply 1 9
tot--'ply 1 9
tot--'ply 1 9
tot--'ply 1 9
tot--'ptpy 1 9
d270 _ wppct 1 9
tot_ wppct 1 9
d240 _ cppct 1 9
d l 80_wppct 1 9
d270_cppct 1 9
d270 _ wppct 1 9
d 1 80_ tppct 1 9
d l 80_cppct 1 9
d240 _ tppct 1 9
d240 _ cppct 1 9
tot_ cppct 1 9
tot_tppct 1 9
d270_tppct 1 9
tOI_ wppct 1 9
3 1
3 1
32
32
33
34
34
38
4 1
59
59
59
59
59
60
60
60
60
60
78
79
79
80
80
80
80
80
8 1
8 1
8 1
8 1
8 1
82
0.0089
0.0095
0.0085
0.0088
0.0 1
0.005
0.0067
0.0066
0.0068
0.0008
0.00 1 7
0.0034
0.0086
0.0089
0.0009
0.00 1 2
0.0053
0.0059
0.0083
0.009
0.007
0.008
0.0027
0 .006
0.0064
0.0066
0.0073
0.0033
0.0039
0.0077
0.0077
0.008 1
0.003
Appendices
Fval 95%CI
4. 1 8 I S - 9 1
4 . 1 2 1 6 - 82
3 .99 20 - 88
3 .93 2 1 - 83
4 .73 1 4 - 74
3 .92 1 6 - 88
3.89 1 6 - 86
4 . 1 6 1 0 - 9 1
4 .04 2 1 - 9 1
4 . 1 8 0 - 68
3 .96 2 - 83
7 .42 26 - 83
6.83 25 - 63
7 .45 26 - 83
5 .38 20 - 63
6 .83 25 - 63
7 .02 24 - 83
7 .02 26 - 83
7 .03 26 - 83
7.03 24 - 83
4.9 20 - 63
6.32 27 - 1 00
6 .89 29 - 102
7 . 1 8 36 - 97
7.67 54 - 1 03
6 .3 1 1 1 - 97
5 .38 27 - 1 00
7.64 68 - 97
7.5 56 - 98
6.7 3 1 - 97
6 .7 1 36 - 97
6.09 20 - 99
6 . 1 7 34 - 1 00
6 . 1 8 26 - 96
6.24 29 - 1 02
283

Chapter 9
Table 9.6 Continued.
Trait Analysis Phenotype
Milk
Mi lk
A d l 80_tppct
A d 1 80_ cppct
Mi lk A
Mi lk A+D
Mi lk A
Mi lk A
Mi lk A
Mi lk A
Mi lk A+D
TRH A
TRH A
TRH A+D
TRH A+D
EEP A
EEP A+D
Mi lk H S
Mi lk H S
Mi lk HS
Mi lk A
Mi lk H S
Mi lk A+D
Mi lk A
Mi lk A
Mi lk A
Mi lk A
Mi lk A+D
Mi lk A
Mi lk A
Mi lk A
Mi lk H S
Mi lk HS
Mi lk HS
Mi lk HS
TRH A
GLU A
284
d240_wppct
d l 20_tppct
d l 80_wppct
d 1 20_cppct
d l 20_tppct
d l 20_wppct
d 1 20_ wppct
n RATE
n_RA TE_bsadj
n_RATE_bsadj
n RATE
EEP _glu_slope
EEP _glu_slope
d270Jpct
d240Jpct
toUpct
d l 80_cpct
d 1 80Jpct
d240_cpct
d270_cpct
d 1 80_ cppct
d240_cppct
tot_cppct
d270_cppct
d240_tppct
d270 _tppct
d270 _ cppct
d60_mspct
d l 20_mspct
d l 80_mspct
d60_fpct
pk_NEFA_ I O
g_f_m_m5
Chr Bst letn Pval
1 9 82 0.0032
1 9 82 0.0045
1 9
1 9
1 9
1 9
1 9
1 9
1 9
1 9
1 9
1 9
1 9
20
20
20
20
20
20
20
20
20
20
20
20
20
20
20
20
2 1
2 1
2 1
2 1
22
22
82
82
83
83
83
83
83
1 08
1 08
I 1 1
I I I
26
26
4 1
42
43
57
58
59
60
60
6 1
6 1
62
62
63
65
o o o o 1 6
66
0.0053
0.0075
0.0028
0.0048
0.005 1
0.0058
0.0092
0.0005
0.00 1 1
0.0037
0.0062
0.00 1 2
0.0044
0.0047
0.0057
0.0063
0.008
0.008 1
0.0039
0.00 1 8
0.0089
0.0032
0.0093
0.0038
0.0046
0.0038
0.0 1
0.0004
0.00 1 1
0.0047
0.0063
0.0084
0.0027
Fval 95% CI
7.07 68 - 97
7.03 56 - 98
5 .48 38 - 1 0 1
7 .5 68 - 99
6.5 1 54 - 1 03
6.66 57 - 98
6.77 68 - 99
5 .2 1 35 - 1 07
6.44 35 - 1 07
7 .26 68 - 1 1 1
7 .32 70 - I 1 I
7 .6 70 - I I I
7 .5 68 - I I I
7.2 1 6 - 39
7 .25 1 6 - 39
3 .82 0 - 68
3 . 77 0 - 68
3 .73 0 - 68
4 .8 3 - 68
3 .67 0 - 68
5 .49 1 6 - 68
5 .78 39 - 68
4.85 1 3 - 68
5 .69 1 7 - 68
4.57 8 - 68
5 .9 1 48 - 68
5 .34 27 - 68
5 .57 2 1 - 68
6.04 48 - 68
4.6 1 0 - 53
4 .39 0 - 53
3 .86 0 - 53
3 .82 0 - 92
4.69 0 - 63
5 .43 30 - 66
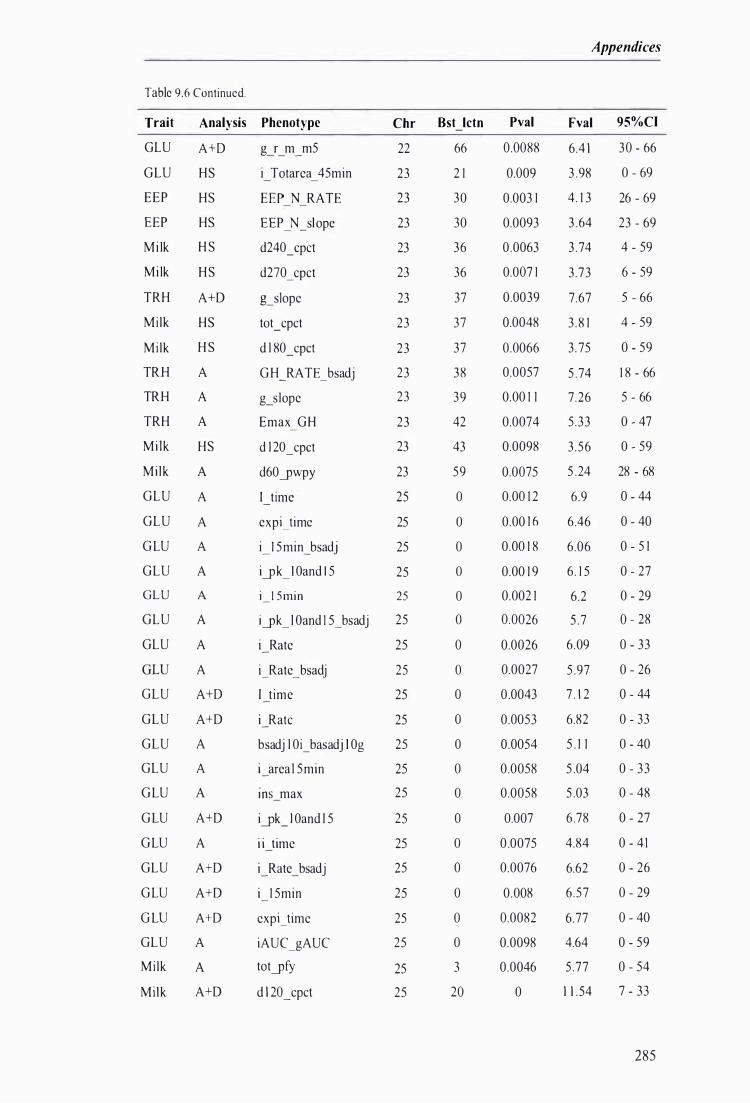
Appendices
Table 9.6 Continued.
Trait Analysis Phenotype Chr Bst letn Pval Fval 95%CI
GLU A+D
GLU HS
EEP HS
EEP HS
Mi lk H S
Mi lk HS
TRH A+D
Mi lk HS
Mi lk H S
TRH A
TRH A
TRH A
Mi lk HS
Mi lk A
GLU A
GLU A
GLU A
GLU A
GLU A GLU A
GLU A
GLU A
GLU A+D
GLU A+D
GLU A
GLU A
GLU A
GLU A+D
GLU A
GLU A+D
GLU A+D
G LU A+D
GLU A
Mi lk A
Milk A+D
g r m m5 22
i Totarea 45min 23
EEP N RATE 23
EEP _N_slope 23
d240_cpct 23
d270_cpct 23
Lslope 23
tot_cpct 23
d l 80_cpct 23
GH_RA TE_bsadj 23
g_slope 23
Emax GH 23
d l 20_cpct 23
d60ywpy 23
I time 25
expUime 25
i_ 1 5min_bsadj 25
iyk_ I Oand l 5 25
i 1 5min 25
iyk_ l Oand I 5_bsadj 25
i Rate 25
i_Rate_bsadj 25
I t ime 25
i Ratc 25
bsadj l Oi_basadj l 0g 25
i area l 5min 25
JI1S max 25
iyk_ l Oand l 5 25
i i time 25
i_Rate_bsadj 25
i 1 5min 25
expUime 25
iAUC_gAUe 25
totyfy 25
d l 20_cpct 25
66
2 1
30
30
36
36
37
37
37
38
39
42
43
59
o
o
o
o
o
o
o
o
o
o
o
o
o
o
o
o
o
o
o
3
20
0.0088 6.4 1
0.009 3 .98
0.003 1 4 . 1 3
0.0093 3 .64
0 .0063 3 .74
0.007 1 3 .73
0.0039 7.67
0.0048 3 .8 1
0.0066 3 . 75
0.0057 5 .74
0.00 1 1 7 .26
0.0074 5 .33
0.0098 3 .56
0.0075 5 .24
0.00 1 2 6.9
0.00 1 6 6 .46
0.00 1 8 6.06
0.00 1 9 6. 1 5
0.002 1 6.2
0.0026 5 .7
0.0026 6 .09
0.0027 5 .97
0 .0043 7 . 1 2
0.0053 6.82
0.0054 5 . 1 1
0 .0058 5 .04
0.0058 5 .03
0.007 6.78
0 .0075 4.84
0.0076 6.62
0.008 6 .57
0.0082 6.77
0.0098 4.64
0.0046 5 .77
o 1 1 . 54
30 - 66
0 - 69
26 - 69
23 - 69
4 - 59
6 - 59
5 - 66
4 - 59
0 - 59
1 8 - 66
5 - 66
0 - 47
0 - 59
28 - 68
0 - 44
0 - 40
0 - 5 1
0 - 27
0 - 29
0 - 28
0 - 33
0 - 26
0 - 44
0 - 33
0 - 40
0 - 33
0 - 48
0 - 27
0 - 4 1
0 - 26
0 - 29
0 - 40
0 - 59
0 - 54
7 - 33
285

Chapter 9
Table 9.6 Continued.
Trait Analysis Phenotype
Milk Mi lk Mi lk Mi lk Milk Milk Milk Milk Mi lk Mi lk Mi lk Mi lk Mi lk Mi lk Mi lk Mi lk Mi lk Mi lk Mi lk Mi lk Mi lk Mi lk Mi lk Mi lk Mi lk Mi lk Milk Milk Milk Mi lk Milk Mi lk Mi lk Mi lk Milk
286
A+D
A+D
A+D
A+D
A+D
A+D
A+D
A+D
A+D
A+D
A+D
A+D
A+D
A+D
A+D
A+D
A
A
A
A
A
A
A
A+D
A
A
A
A
A
A
A
A
A
A
A
d 1 80 _tppct
touppct
d 1 80_ cppct
d l 80_cpct
d 1 20_tppct
tot_cppct
d60_cppct
d 1 20 _cppct
d270_cppct
d240_tppct
tot_cpct
d60_cpct
d240_cppct
d270_tppct
d240_cpct
d60 _tppct
d 1 80 _cppct
d l 20_cppct
d l 80_cpct
d l 80_tppct
d 1 20_ cpct
d240_tppct
d l 20_tppct
d270_cpct
tot_cppct
tot_cpct
d240_cppct
d60_cpct
d240_cpct
touppct
d60_cppct
d270_cppct
d270_cpct
d270_tppct
d60 _tppct
Chr Bst letn Pval
25
25
25
25
25
25
25
25
25
25
25
25
25
25
25
25
25
25
25
25
25
25
25
25
25
25
25
25
25
25
25
25
25
25
25
20
20
20
20
20
2 1
2 1
2 1
2 1
2 1
2 1
2 1
2 1
2 1
2 1
2 1
22
22
22
22
22
22
22
22
23
23
23 23
23
23
23
23
23
23
23
0.000 1
0.0002
0.0003
0.0003
0.0005
o
0.0002
0.0002
0.0003
0.0003
0.0003
0.0004
0.0005
0.0006
0.0008
0.00 1 2
o
0.000 1
0.000 1
0.0002
0.0002
0.0006
0.0007
0.00 1
o
0.000 1
0. 0002 0.0002
0.0002
0.0003
0.0004
0.0005
0.0005
0.0006
0.0008
Fval 95%CI
1 1 . 1 1 6 - 34
1 1 . 1 8 4 - 33
1 2. 1 4 7 - 33
I I A I 6 - 34
1 0.23 3 - 37
1 2 .09 6 - 3 3
I OA3 5 - 36
1 1 .6 1 5 - 35
1 0.5 1 3 - 40
1 0.08 2 - 37
1 1 .04 6 - 37
I OA9 8 - 38
1 1 . 1 5 3 - 36
9.74 2 - 38
1 0.36 4 - 38
9.23 4 - 38
1 0.6 1 7 - 3 3
1 0. 1 1 5 - 35
1 0. 1 8 6 - 34
9.53 6 - 34
1 0. 1 9 7 - 33
8 .76 2 - 37
8 .73 3 - 37
9 .55 2 - 39
1 0. 8 6 - 33
1 0.08 6 - 37
9.78 3 - 36 9.36 8 - 38
9.32 4 - 38
9 .83 4 - 33
9.26 5 - 36
9.25 3 - 40
8 .62 2 - 39
8A 2 - 38
7.99 4 - 38
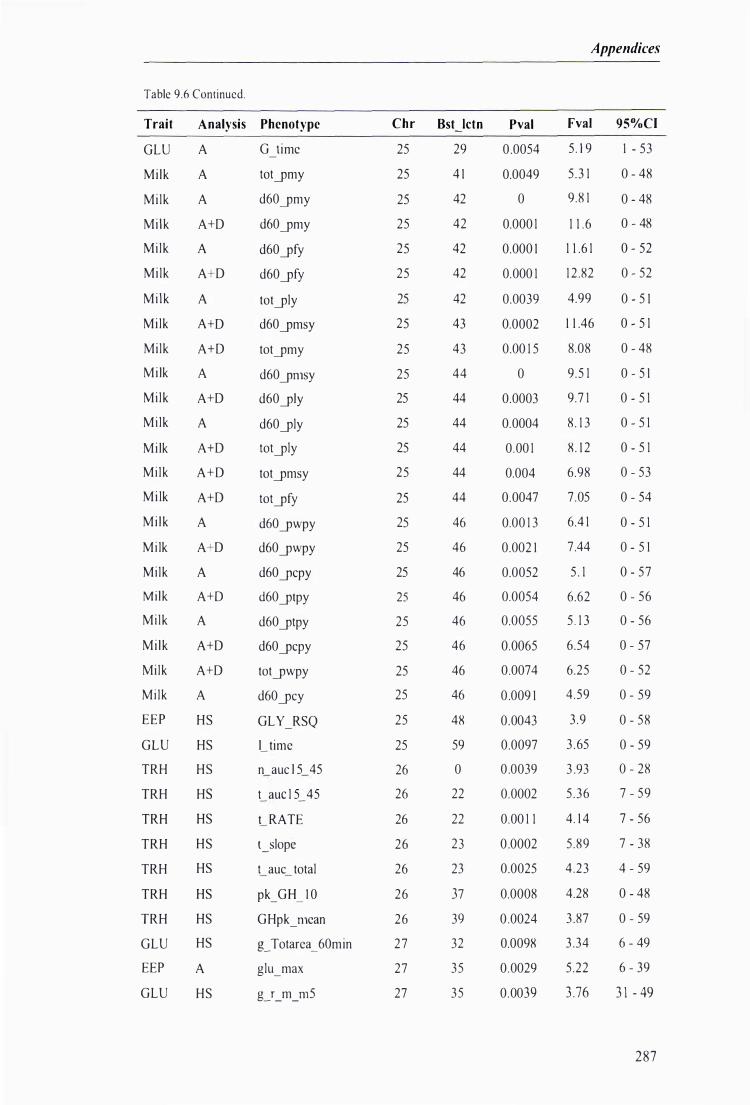
Table 9.6 Continued.
Trait Analysis Phenotype
GLU A G time
Mi lk A totymy
Milk A d60 ymy
Milk A+D d60ymy
Milk A d60yfy
Milk A D d60yfy
Milk A totyly
Mi lk A+D d60ymsy
Milk A+D totymy
Mi lk A d60 Y01sy
Milk A+D d60yly
Mi lk A d60yly
Mi lk A+D totyly
Milk A+D totymsy
Mi lk A+D totyfy
Mi lk A d60ywpy
Mi lk A+D d60ywpy
Milk A d60ycpy
Mi lk A+D d60ytpy
Milk A d60 ytpy
Mi lk A+D d60ycpy
Milk A+D totywpy
Milk A d60ycy
EEP HS GLY _RSQ
GLU HS I time
TRH HS n auc l 5 45
TRH HS t auc l 5 45
TRH HS
TRH HS
TRH HS
TRH HS
TRH HS
GLU HS
EEP A
GLU HS
t RATE
I_slope
t auc total
pk_GH_ I O
GHpk_01ean
L Totarea _ 60m in
glu_max
g_T_m_015
Chr Bst Ietn Pval
25 29 0 .0054
25 4 1 0.0049
25 42 0
25 42 0.000 1
25 42 0.000 1
25 42 0.000 1
25 42 0.0039
25 43 0.0002
25 43 0.00 1 5
25 44 0
25 44 0.0003
25 44 0.0004
25 44 0.00 1
25 44 0.004
25 44 0.0047
25 46 0.00 1 3
25 46 0.002 1
25 46 0.0052
25 46 0.0054
25 46 0.0055
25 46 0.0065
25 46 0.0074
25 46 0 .009 1
25 48 0.0043
25 59 0.0097
26 0 0 .0039
26 22 0.0002
26
26
26
26
26
27
27
27
22
23
23
37
39
32
35
35
0.00 1 1
0 .0002
0.0025
0.0008
0 .0024
0.0098
0.0029
0.0039
Appendices
Fval 95%CI
5 . 1 9 1 - 53
5 .3 1 0 - 48
9 .8 1 0 - 48
1 1 .6 0 - 48
1 1 .6 1 0 - 52
1 2 .82 0 - 52
4.99 0 - 5 1
1 1 .46 0 - 5 1
8.08 0 - 48
9 .5 1 0 - 5 1
9 .7 1 0 - 5 1
8 . 1 3 0 - 5 1
8 . 1 2 0 - 5 1
6.98 0 - 53
7 .05 0 - 54
6.4 1 0 - 5 1
7 .44 0 - 5 1
5 . 1 0 - 57
6.62 0 - 56
5 . 1 3 0 - 56
6.54 0 - 57
6.25 0 - 52
4.59 0 - 59
3 .9 0 - 58
3 .65 0 - 59
3 .93 0 - 28
5 .36 7 - 59
4. 1 4 7 - 56
5 .89 7 - 38
4 .23 4 - 59
4.28 0 - 48
3 .87 0 - 59
3 .34 6 - 49
5.22 6 - 39
3 .76 3 1 - 49
287

Chapter 9
Table 9.6 Continued.
Trait Analysis
Milk HS
Milk HS
Mi lk HS
TRH HS
Mi lk HS
Mi lk HS
Mi lk HS
Mi lk HS
EEP A
TRH HS
TRH HS
Milk A
Mi lk A
TRH HS
EEP HS
TRH A
288
Phenotype
d l 80_fpct
d270_fcpt
d240Jcpt
NEFA bs
d l 20_mspct
d l 20_fpct
d60_mspct
d60Jpct
glu_bs
t RATE
t auc l 5 45 - -
d l 20_fpct
d l 80Jpct
t_slope
EPr N t max
t emax NEFA - -
Chr Bst Ietn Pval Fval 95%CI
27 42 0.0009 4.49 0 - 49
27 42 0.00 1 6 4.27 0 - 49
27 42 0.00 1 7 4.32 0 - 49
27 42 0.0025 3 . 89 1 7 - 49
27 42 0.0078 3 .49 0 - 49
27 43 0.0003 4.84 1 - 49
27 43 0.0044 3 .68 2 - 49
27 44 0.0002 4.88 3 - 49
27 45 0.0044 5 . 1 8 1 7 - 49
27 48 0.0096 3 .54 0 - 49
27 49 0.0068 3 .89 0 - 49
27 49 0.0079 3 .93
27 49 0.0084 3 .87
27 49 0.0092 3 .79 0 - 49
29 I I 0.0069 3 . 63 I - 68
29 1 3 0.0035 5 .84 7 - 28

Appendices
Table 9.8 Continued.
Symbol Ensembl gene NamelDescription
PENK ENSG00000 1 8 J 1 95 proenkephal in
PDE7A ENSGOOOO0205268 phosphodiesterase 7 A
TOX Thymus high mobi l i ty group box protein TOX
NSMAF ENSG0000003568 I eutral sphingomyelinase (N-SMase) activation associated factor
FAM77D ENSGOOOOO 1 85942 Family with sequencc simi larity 77, member 0 MGC34646 ENSGOOOOO I 77 1 82 Hypothetical protein MGC34646; Cellular retinaldehyde-
binding protein- like protein
ENSGOOOOO 1 72825 No description
TMEM68 ENSGOOOOO 1 67904 transmembrane protein 68
E SOOOOOO 1 69 1 22 o description
RDHE2 ENSOOOOOO 1 70786 epidermal retinal dehydrogenase 2
ARMC I ENSOOOOOO 1 04442 armadil lo repeat containing 1
I MPAD l ENSOOOOOO 1 0433 1 myo-inositol mono phosphatase A3, inositol monophosphatase domain containing 1
TGS J ENSOOOOOO 1 37574 trimethylguanosine synthase homo log
MRPL l 5 E SOOOOOO l 37547 mitochondrial ribosomal protein L I S
MOS ENSGOOOOO 1 72680 Proto-oncogene serine/threonine-protein kinase mos (EC 2 .7 . 1 .37) (c- mos) (Oocyte maturation factor mos).
LYPLA I ENSGOOOOO 1 20992 Iysophospholipase r LYN ENSOOOOOO 1 47507 v-yes- I Yamaguchi sarcoma viral related oncogene
homo log; Tyrosine-protein kinase Lyn
GOH ENSGOOOOO 1 37563 gal1lma-glutamyl hydrolase (conjugase, folylpolygal1lmaglutamyl hydrolasc)
E SGOOOOO l 89232 o description
ENSGOOOOO 1 8856 J No description
ENSOOOOOO 1 88285 No description
ENSOOOOOO 1 87863 No description
TCEA I ENSGOOOOO 1 87735 o description
ENSOOOOOO 1 86963 No description
ENSGOOOOO 1 86904 No description
ENSGOOOOO 1 8464 1 No description
ENSGOOOOO 1 83226 No description
ENSGOOOOO 1 83064 o description
ENSGOOOOO 1 82699 No description
PSMC6P ENSGOOOOO 1 8 1 732 No description
ENSGOOOOO 1 77203 No description
29 1
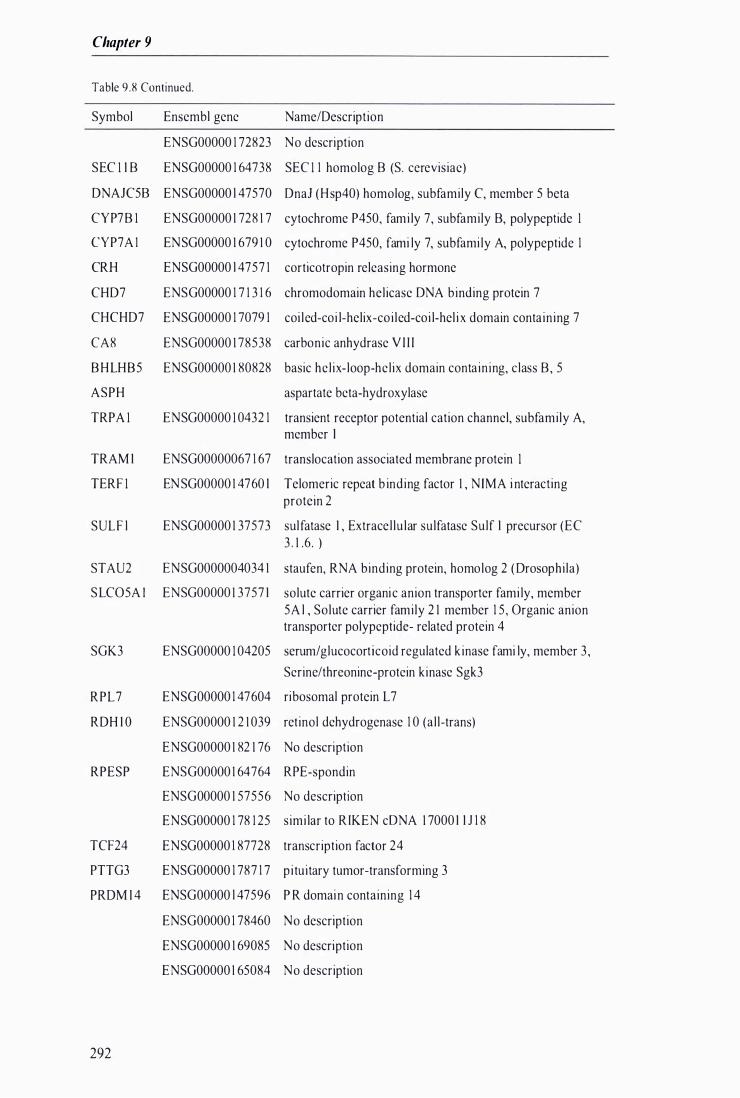
Chapter 9
Table 9 .8 Continued.
Symbol
SEC I I B
DNAJC58
CYP7B I
CYP7A I
CRH
CHD7
CHCHD7
CA8
BHLHB5
ASPH
TRPA I
TRAM I
TERF I
SULF l
STAU2
SLC05A I
Ensembl gene
ENSGOOOOO 1 72823
ENSGOOOOO 1 64738
ENSGOOOOO l 47570
ENSGOOOOO 1 728 1 7
EN SGOOOOO 1 679 1 0
ENSGOOOOO l 4757 1
ENSGOOOOO 1 7 1 3 1 6
ENSGOOOOO 1 7079 1
ENSGOOOOO 1 78538
ENSGOOOOO 1 80828
ENSGOOOOO I 0432 1
ENSGOOOOO067 1 67
EN SGOOOOO 1 4760 I
ENSGOOOOO 1 37573
ENSGOOOOO04034 1
ENSG00000 1 3757 I
Name/Description
No description
SEC I 1 homolog B (S. cerevisiae)
Dna] (Hsp40) homolog, subfamily C, member 5 beta
cytochrome P450, fami ly 7, subfamily B, polypeptide I
cytochrome P450, fami ly 7, subfami ly A, polypeptide 1
corticotropin releasing hormone
chromodomain hel icase DNA binding protein 7
coi led-coi l-helix-coi led-coi l-hel i x domain containing 7
carbonic anhydrase V I I I
basic hel ix-loop-hel ix domain containing, class B , 5
aspartate beta-hydroxylase
transient receptor potential cation channel, subfamily A, member I
translocation associated membrane protein I
Telomeric repeat b inding factor 1 , NlMA i nteracting protein 2
sulfatase I , Extracel lu lar sulfatase Sulf I precursor (EC 3 . 1 .6 . )
staufen, RNA binding protein, homolog 2 (Drosophila)
solute carrier organi c anion transporter fami ly, member 5A l , Solute carrier family 2 1 member 1 5 , Organic anion transporter polypeptide- related protein 4
SGK3 ENSGOOOOO I 04205 serum/glucocorticoid regulated kinase fami ly, member 3 ,
RPL7
RDH I O
RPESP
Serine/threonine-protein kinase Sgk3
ENSGOOOOO 1 47604 ri bosomal protein L 7
ENSGOOOOO 1 2 1 039 retinol dehydrogenase 1 0 (al l-trans)
ENSGOOOOO 1 82 1 76 No description
ENSGOOOOO 1 64764 RPE-spondin
ENSG00000 1 57556 No description
ENSGOOOOO 1 78 1 25 simi lar to R IKEN cON A 1 7000 I I J 1 8
TCF24 ENSGOOOOO 1 87728 transcription factor 24
PTTG3 ENSGOOOOO 1 787 1 7 p i tuitary tumor-transforming 3
PRDM I 4 ENSGOOOOO l 47596 P R domain containing 1 4
ENSGOOOOO 1 78460 No description
ENSGOOOOO 1 69085 No description
ENSGOOOOO 1 65084 No description
292

Appendices
Table 9. 8 Continued.
Symbol Ensembl gene NamelDescription
vcpr P I ENSGOOOOO 1 75073 valosin containing protein (P97)/p47 complex interacting protein I
CSPP l ENSGOOOOO I 042 1 8 centrosome and spindle pole associated protein I
ENSGOOOOO 1 78778 No description
UBE2W ENSGOOOOO I 04343 ubiquitin-conjugating enzyme E2W (putative)
NCOA2 ENSGOOOOO 1 40396 nuclear receptor coactivator 2
MYB L l ENSGOOOOO 1 85697 v-myb myeloblastosis viral oncogene homolog (avian)-like I
MSC ENSGOOOOO 1 78860 musculin ( activated B-cel l factor- I )
LACTB2 ENSGOOOOO 1 47592 lactamase, beta 2
KCNB2 ENSGOOOOO 1 82674 potassium voltage-gated channel, Shab-related subfami ly, member 2
EYA I ENSGOOOOO I 043 1 3 eyes absent homolog I ( Drosophi la)
H2AFZP2 E SGOOOOO 1 87025 H2A histone fami ly, member Z, pseudo gene 2
ENSGOOOOO I 78 1 44 No description
ENSGOOOOO 1 76 1 96 No description
ENSGOOOOO 1 75953 o description
ENSGOOOOO 1 68547 similar to ribosomal protein S 1 5a
DEPDC2 ENSGOOOOOO46889 DEP domain containi ng 2
CPA6 ENSGOOOOO 1 65078 carboxypeptidase A6
COPS5 ENSGOOOOO 1 2 1 022 COP9 constitutive photomorphogenic homolog subunit 5 (Arabidopsis)
BTF3 L2 basic transcription factor 3 , l ike 2
ARFGEF I E SGOOOOO066777 ADP-ribosylation factor guanine nucleotide-exchange factor I (brefeldin A-inhibited)
ADHFE l ENSGOOOOO l 47576 alcohol dehydrogenase, iron containing, I
293
Chapter 9
Appendix H: Information on genes discarded from candidate gene study
LYPLA l - Iysophospholipase I
Function
Hydrolyzes fatty acids from S-acylated cysteine residues in proteins such as trimeric G alpha
proteins or HRAS. Also has low lysophospholipase activity.
Catalytic activity: Palmitoyl-protein + H(2)O = palmitate + protein.
Gene Ontology (GO) terms:
Molecular function: catalytic activity; lysophospho l ipase activity; hydrolase act ivity
Biological process: l ipid metabol ism; fatty acid metabolism
Cellular component: membrane fraction; mitochondrion
Kegg Pathway for LYPLA I : hsa00564 Glycerophospholipid metabol ism
Summary
Lysophospholipases are enzymes that act on biological membranes to regulate the
multi functional lysophosphol ipids. The protein encoded by this gene hydrolyzes
lysophosphatidylcholine in both monomeric and micellar forms. The use of alternate
polyadenylation sites has been found for this gene. There are alternatively spliced transcript
variants described for this gene but the full length nature is not known yet.
Potassium voltage-gated channel, Shab-related subfamily, member 2
(KCNB2)
KCNB2 is a delayed rectifier, voltage-gated potassium (Kv) channel which i s a multi-pass
membrane protein that mediates the voltage-dependent potassium ion permeabi l ity of excitable
membranes. Voltage-gated potassium channels open in response to membrane depolarisation to
al low rapid diffusion of K + ions out of the cell , thus repolarising the cell to restore a negative
resting membrane potential . OR Channels open or c lose in response to the voltage difference
across the membrane, letting potassium ions pass in accordance with their electrochemical
gradient
294
Appendices
Voltage-gated potassium ( Kv) channels diverse functions include regulating neurotransmitter
release, heart rate, insulin secretion, neuronal excitabi l i ty, epithel ial electrolyte transport,
smooth muscle contraction, and cel l volume. Four sequence-related potassium channel genes -
shaker, shaw, shab, and shal - have been identified in Drosophila, and each has been shown to
have human homolog(s) . This gene encodes a member of the potassium channel, voltage-gated,
shab-related subfamily. This member is a delayed rectifier potassium channel . The gene is
expressed in gastrointestinal smooth muscle cells.
Use ofN-terminal anti-body staining of rat pancreatic islet cel ls revealed that K v2 .2 was present
in somatostatin-containing 1) cells and glucagon-containing a cell s ( Wolf-Goldberg et al. 2006).
Thus may play some type of regulatory role within these cells in relation to nutrient partitioning.
y-aminobutyric acid (GABA) is an inhibitory neurotransmitter
Recent data suggest that GABA neurotransmission can be excilatory in basal conditions, not
only in immature but also in adult tissue. GABAergic synapses are indeed endowed with a
unique and fundamental feature - resulting from their CIK permeabi l i ty - that enables them to
shift from an inhibitory mode of operation to one that mainly excites.
ep A6 - carboxypeptidase A6
Function
Subcel lular location: Secreted protein (By simi larity)
Gene Ontology (GO) terms:
Molecular function: carboxypeptidase activity; carboxypeptidase A activity; metallopeptidase
activity; zinc ion binding; metal ion binding
Biological process: proteolysis
Catalysis of the reaction: peptidyl-L-amino acid + H20 = peptide + L-amino acid. Little or no
action with -Asp, -Glu, -Arg, -Lys or -Pro
Summary
Carboxypeptidases have functions ranging from digestion of food to selective biosynthesis of
neuroendocrine peptides. Members of the NB subfamily of carboxypeptidases, such as CPA6,
295
Chapter 9
contain an approximately 90-amino acid pro region that assists in the folding of the active
carboxypeptidase domain. C leavage of the pro region activates the enzyme (Wei et al . , 2002) .
SUL F l - sulfatase 1 Subcel lular location: endoplasmic reticulum, Golgi stacks, plasma membrane
Protein Family, Domain: Arylsulfatase, enzyme, N-acetylglucosamine-6-sulfatase, Sulfuric
ester hydrolase
Regulates: Erk, MET, AKT
Regulated by: SUMF I , I -a lpha, 25-dihydroxy vitamin D3
Role i n cel l : invasion, apoptosis, mitogenecity, contact growth inhibition, moti l i ty
Function
Exhib its arylsulfatase activity and highly specific endoglucosamine-6-sulfatase activity. It can
remove sulfate from the C-6 position of glucosamine within specific subregions of intact
heparin. Diminishes heparan suI fate proteoglycans ( HSPG) sulfation, inhibits signal l ing by
heparin-dependent growth factors, diminishes pro l i feration, and faci l itates apoptosis in response
to exogenous stimulation
Summary
HSPGs act as coreceptors for numerous heparin-binding growth factors and cytokines and are
involved in cell signal l ing. Heparan suI fate 6-0-endosulfatases, such as SULF I , selectively
remove 6-0-sulfate groups from heparin sulfate. Th is activity modulates the effects of hepar an
suI fate by altering binding sites for signal l ing molecules (Dai et a l . , 2005) .
Apoptosis is l ikely to be more i mportant after the first 60 days of lactation.
TGS l - trimethylguanosine synthase homolog (S. cerevisiae)
role in transcriptional regulation
Function
May be a methyl transferase. B inds S-adenosyl-L- methionine and RNA. Plays a role in
transcriptional regulation
296
Appendices
Gene Ontology (GO) terms:
Molecular function: molecular function unknown; methyltransferase activity; S-
adenosylmethionine-dependent methyltransferase activity; transferase activity
Cel lular component: nucleus
Biochem B iophys Res Commun. 2003 Sep l 2 ;309( 1 ) :44-5 1 . Links
Different isoforms of PRIP-interacting protein with methyltransferase
domain/trimethylguanosine synthase local izes to the cytoplasm and nucleus.
EniinlU I, Papai G, Cserpan I, Udvardy A, Jeang KT, Boros l .
A protein family including the recently identified PIMT/Tgs I ( PRIP-interacting protein with
methyl transferase domain/trimethylguanosine synthase) was identified by searching databases
for homologues of a newly identified Drosophi la protein with RNA-binding activity and
methyl transferase domain. Antibodies raised against a short peptide of the mammalian
homologue show a 90-kDa isoform expre ed specifically in rat brain and testis and a 55-kDa
form expressed ubiquitously. [n HeLa cel ls, the larger isoform of the protein is nuclear and
associated with a 600-kDa complex, while the smaller isoform is mainly cytoplasmic and co-
local izes to the tubul in network. Inh ibition of PIMT/Tgs I expression by si RNA in HeLa cel ls
resulted in an increase in the percentage of cells in G2IM phases. In yeast two-hybrid and in
vitro GST pull down experiments, the conserved C-terminal region of PIMT/Tgs l interacted
with the WD domain containing EED/WAIT- I that acts as a polycomb-type repressor in the
nucleus and also binds to integrins in the cytoplasm. Our experiments, together with earl ier data,
indicate that isoforms of the P IMTfTgs I protein with an RNA methyl transferase domain
function both in the nucleus and in the cytoplasm and associate with both elements of the
cytoskeletal network and nuclear factors known to be involved in gene regulat ion.
MYBL l - v-myb myeloblastosis viral oncogene homolog (avian)-like 1 Regulation of transcription, transcription factor
Protein Family, Domain: core domain, functional, SANT domain, transcription activation
domain, transcription regulator
297
Chapter 9
Subcellular Location: nuclear fraction, Nucleus
Regulates: M YC, BCL2, TFEC, EMILIN2, TIMM44, ACTN I , PSD4, HSPA8, CD53, CASP6,
SET, API5, IQGAP I ( includes EG: 8826), SEC3 1 L I , B ET ! L
Regulated by: beta-estradiol , amphetamine, SOD I , EGR I , Tax, raloxifene, RELA, NFKB I ,
TP53 , EGR4, trans-hydroxytamoxifen, NLK
Binds: Nfy, BCL2, SP I , NLK, CREBBP
Role in cel l : apoptosis, growth, expansion, S phase
Disease: hyperplasia, hypoplasia, neoplasia, cancer, gastric cancer, gastric carcinoma
Function
Strong transcriptional activator; DNA-binding protein that specifically recognise the sequence
5'-Y AAC[GT]G-3'. Could have a role in the prol iferation and/or differentiation of neurogenic,
spermatogenic and B-Iymphoid cells.
Genatlas b iochemistry entry for MYBL I : avian myeloblastosis viral (v-myb) oncogene
homo log-l ike I
Gene Ontology (GO) terms:
DNA binding; nucleus; regulation of transcription; transcriptional activator act ivity
Oncogene. 1 994 Sep;9(9) :2469-79. Links
The human A-myb protein is a strong activator of transcription.
Golay J , Loffarel l i L, Luppi M, Castel lano M, [ntrona M.
The A-myb gene belongs to the family of the c-myb proto-oncogene. We report here the cloning
from a B Iymphocyte cDNA l ibrary of the previously missing 3' half of the human A-myb
cDNA, thus closing the previously sti l l incomplete open reading frame. Analysis of the
homologies between the different myb proteins reveals four domains of high conservation. We
show, using a polyclonal rabbit antibody, that the 90 kd human A-myb protein is nuclear and
that it activates transcription from the KHK -CA T reporter 6- 1 0 times more strongly than c-myb
in N TH3T3 cel ls . The transactivating function of A-myb depends on the presence of the myb
298

Appendices
binding site in the reporter, and on both the DNA binding and acidic domains of the A-myb
protein. The bacterially expressed protein protects the myb binding sites of the reporter in
footprint experiments. B inding of the A-myb protein is shown in gel retardation assays to be
specific for the c lassical c-myb recognition sequence PyAACG/TG. In addition, l ike c-myb, A
myb binds more strongly to the M IM-A synthetic ol igonucleotide that carries the TAACGG
sequence than to the MBS- J ol igonucleotide containing T AAGTG. Final ly, DNA binding
activity is demonstrated to require the N-terminal portion of the protein containing the three
tandem repeats of amino acids conserved in al l myb proteins. We have thus shown that the A
myb protein is a strong activator of transcription and that this activity depends on both the
DNA-binding and acidic domains.
299
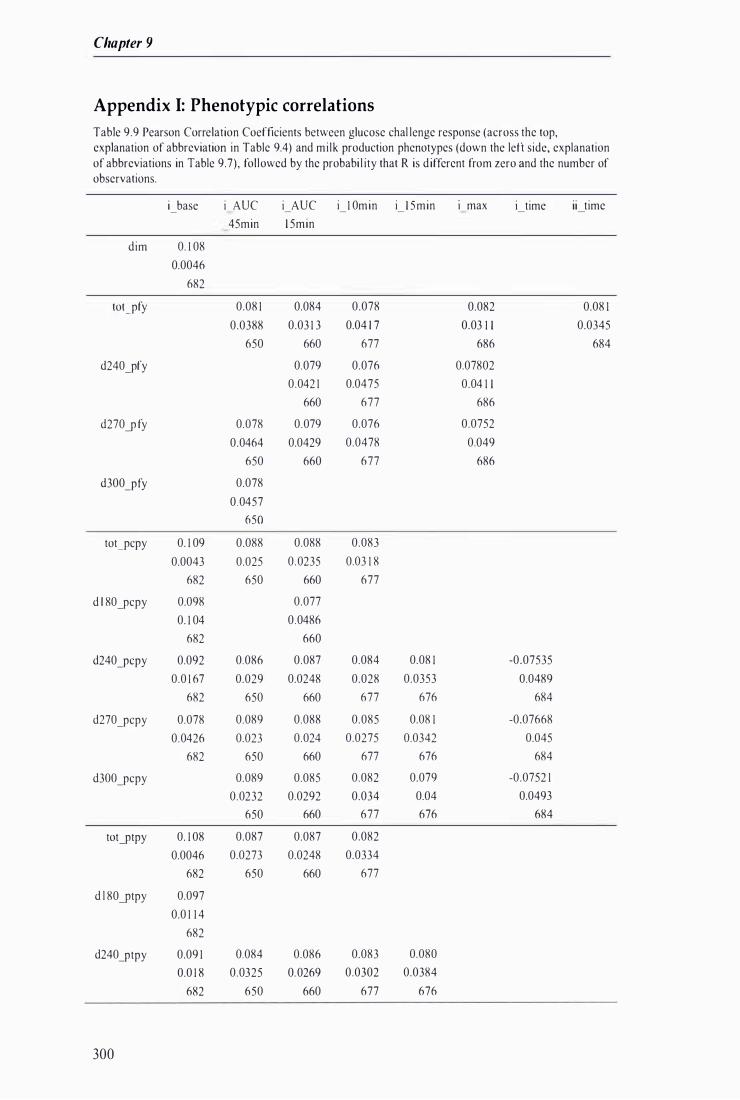
Chapter 9
Appendix I: Phenotypic correlations
Table 9.9 Pearson Correlation Coefficients between glucose chal lenge response (across the top, explanation of abbreviation in Table 9.4) and milk production phenotypes (down the left side, explanation of abbreviations in Table 9.7), fol lowed by the probabi l ity that R is d ifferent from zero and the number of observations.
i base
dim 0. 1 08
0.0046
682
tot-pfy
d240-pfy
d270-p fy
d300-pfy
tot-pcpy 0. 1 09
0.0043
682
d l 80-pcpy 0.098
0. 1 04
682
d240-pcpy 0.092
0.0 1 67
682
d270-pcpy 0.078
0.0426
682
d3OO-pcpy
tot-ptpy 0. 1 08
0.0046
682
d l 80-ptpy 0.097
0.0 1 1 4
682
d24O-ptpy 0.09 1
0.0 1 8
682
300
i AUC
45min
0.08 1
0.0388
650
0.078
0.0464
650
0.078
0.0457
650
0.088
0.025
650
0.086
0.029
650
0.089
0.023
650
0.089
0.0232
650
0.087
0.0273
650
0.084
0.0325
650
i AUC
1 5min
0.084
0.03 1 3
660
0.079
0.042 1
660
0.079
0.0429
660
0.088
0 .0235
660
0.077
0.0486
660
0.087
0.0248
660
0.088
0.024
660
0.085
0.0292
660
0.087
0.0248
660
0.086
0.0269
660
i 1 0min i 1 5min I max i time ii time
0.078 0.082 0.08 1
0.04 1 7 0.03 1 1 0.0345
677 686 684
0.076 0.07802
0.0475 0.04 1 1
677 686
0.076 0.0752
0.0478 0.049
677 686
0.083
0.03 1 8
677
0.084 0.08 1 -0.07535
0.028 0.0353 0.0489
677 676 684
0.085 0.08 1 -0.07668
0.0275 0.0342 0.045
677 676 684
0.082 0.079 -0.0752 1
0.034 0.04 0.0493
677 676 684
0.082
0.0334
677
0.083 0.080
0.0302 0.0384
677 676
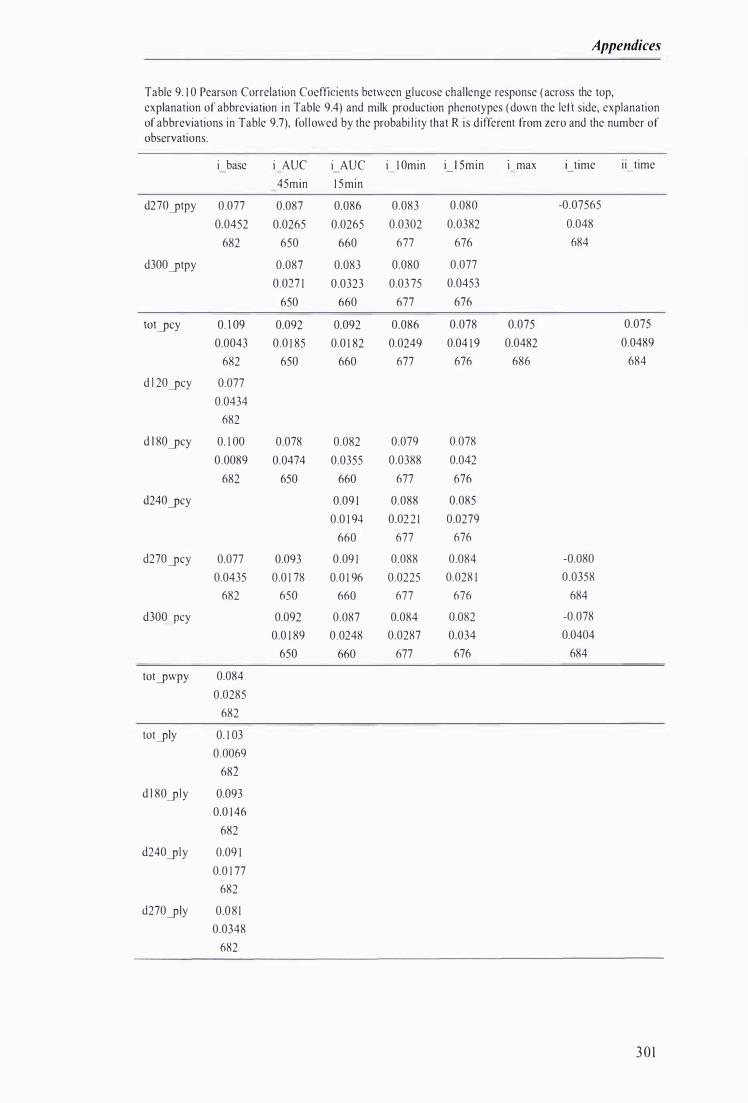
Appendices
Table 9. 1 0 Pearson Correlation Coefficients between glucose challenge response (across the top, explanation of abbreviation in Table 9.4) and milk production phenotypes (down the left side, explanation of abbreviations in Table 9.7), fol lowed by the probabi l ity that R is different from zero and the number of observations.
d270ytpy
d300ytpy
totycy
d l 20ycy
d l 80ycy
d240ycy
d270ycy
d300 ycy
totywpy
totyly
d l 80yly
d240yly
d270yly
i base
0.077
0.0452
682
0. 1 09
0.0043
682
0.077
0.0434
682
0. 1 00
0.0089
682
0.077
0.0435
682
0.084
0.0285
682
0. 1 03
0 .0069
682
0.093
0.0 1 46
682
0.09 1
0.0 1 77
682
0.0 8 1
0.0348
682
i AUC
45min
0.087
0.0265
650
0.087
0.027 1
650
0.092
0.0 1 85
650
0.078
0.0474
650
0.093
0.0 1 78
650
0.092
0.0 1 89
650
i AUC i 1 0min i 1 5min I max i time ii time
1 5min
0.086 0.083 0.080 -0.07565
0.0265 0.0302 0.0382 0.048
660 677 676 684
0.083 0.080 0.077
0.0323 0.03 75 0.0453
660 677 676
0.092 0.086 0.078 0.075 0.075
0.0 1 82 0.0249 0.04 1 9 0.0482 0.0489
660 677 676 686 684
0.082 0.079 0.078
0.0355 0.0388 0.042
660 677 676
0.09 1 0.088 0.085
0.0 1 94 0.02 2 1 0.0279
660 677 676
0.09 1 0.088 0.084 -0.080
0.0 1 96 0.0225 0.028 1 0.0358
660 677 676 684
0.087 0.084 0.082 -0.078
0.0248 0.0287 0.034 0.0404
660 677 676 684
3 0 1
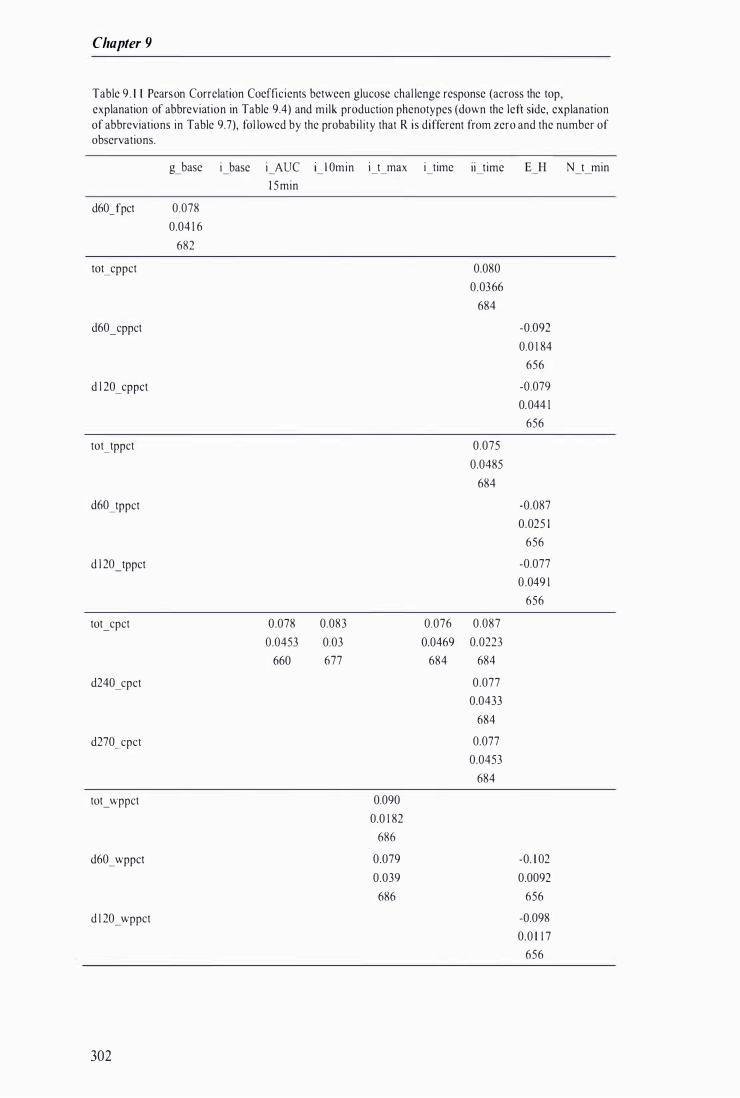
Chapter 9
Table 9. 1 1 Pears on Correlation Coefficients between glucose chal lenge response (across the top, explanation of abbreviation in Table 9.4) and milk production phenotypes (down the left side, explanation of abbreviations in Table 9.7), fol lowed by the probabil ity that R is different from zero and the number of observations.
g_base i base i AUC i 1 0min i t max i time ii time E H N t min
1 5 min
d60Jpct 0.078
0.04 1 6
682
tot_cppct 0.080
0.0366
684
d60_cppct -0.092
0.0 1 84
656
d l 20 _ cppct -0.079
0.044 1
656
tot_ tppct 0.075
0.0485
684
d60 _tppct -0.087
0.025 1
656
d l 20_tppct -0.077
0.049 1
656
tot_ cpct 0.078 0.083 0.076 0.087
0.0453 0.03 0.0469 0.0223
660 677 684 684
d240_cpct 0.077
0.0433
684
d270_cpct 0.077
0.0453
684
tot_ wppct 0.090
0.0 1 82
686
d60_wppct 0.079 -0. 1 02
0.039 0.0092
686 656
d 1 20_ wppct -0.098
0.0 1 1 7
656
302
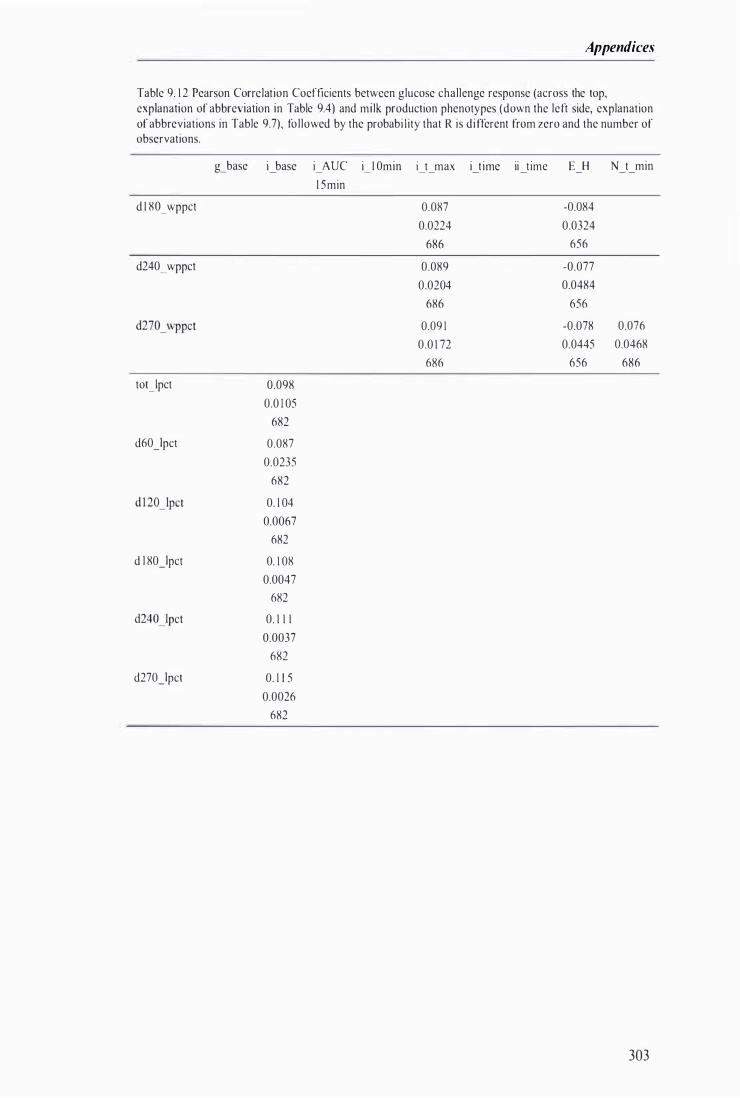
Appendices
Table 9. 1 2 Pearson Correlation Coefficients between glucose challenge response (across the top, explanation of abbreviation in Table 9.4) and milk production phenotypes (down the left side, explanation of abbreviations in Table 9.7), fol lowed by the probabi l ity that R i s di fferent from zero and the number of observations.
g_base
d 1 80_wppct
d240_wppct
toUpct
d60 Jpct
d l 80Jpct
d270Jpct
i base
0.098
0.0 1 05
682
0.087
0.0235
682
0. 1 04
0.0067
682
0. 1 08
0.0047
682
0. 1 1 1
0.0037
682
0. 1 1 5
0.0026
682
i AUC i 1 0min
1 5min
i t max i t ime ii time E H N t min
0.087 -0.084
0.0224 0.0324
686 656
0.089 -0.077
0.0204 0.0484
686 656
0.09 1 -0.078 0.076
0.0 1 72 0.0445 0.0468
686 656 686
303
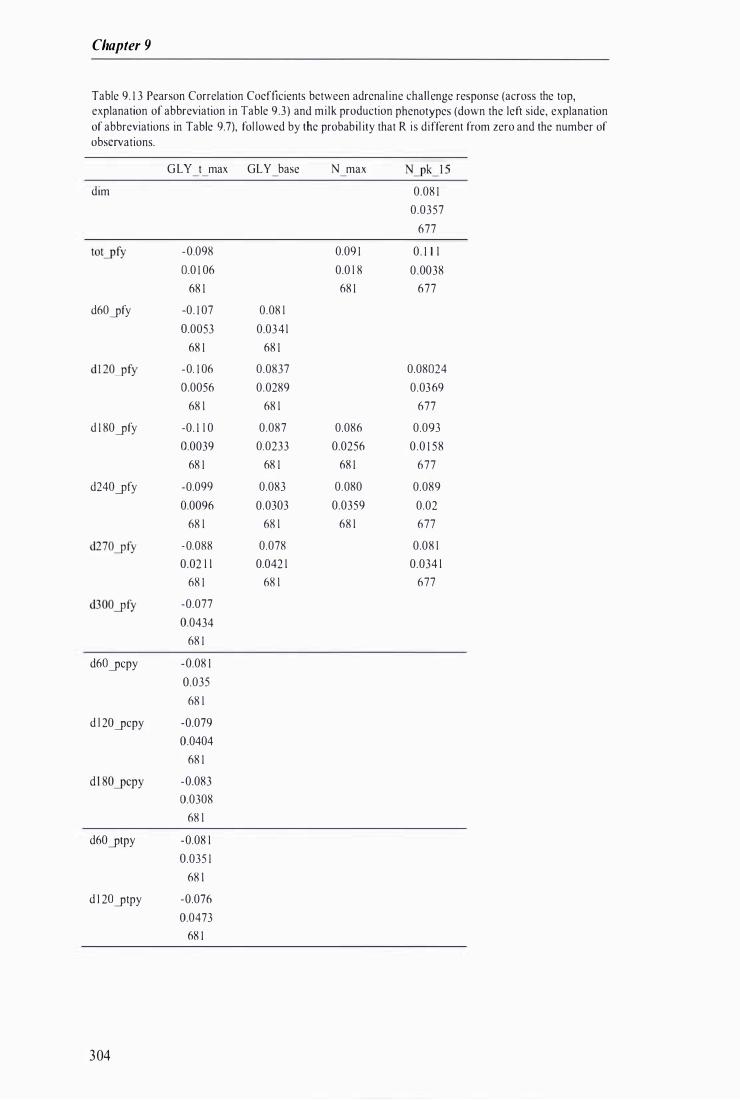
Chapter 9
Table 9. 1 3 Pearson Correlation Coefficients between adrenal ine chal l enge response (across the top, explanation of abbreviation in Table 9.3) and milk production phenotypes (down the left side, explanation of abbreviations in Table 9.7), fol lowed by the probabil ity that R is different from zero and the number of observations.
dim
d60yfy
d 1 8Dyfy
d24Dyfy
d6o.ycpy
d l 2Dycpy
d6Dytpy
d l 2o.ytpy
304
G LY t max GLY base
-0..0.98
0..0. 1 0.6
68 1
-0.. 1 0.7 0..0.8 1
0..0.0.53 0..0.34 1
68 1 68 1
-0.. 1 0.6 0..0.837
0..0.0.56 0..0.289
68 1 68 1
-0.. 1 1 0. 0..0.87
0..0.0.39 0..0.233
68 1 68 1
-0..0.99 0..0.83
0..0.0.96 0..0.30.3
68 1 68 1
-0..0.88 0..0.78
0..0.2 1 1 0..0.42 1
68 1 68 1
-0..0.77
0..0.434
68 1
-0..0.8 1
0..0.35
68 1
-0..0.79
0..0.40.4
68 1
-0..0.83
0..0.30.8
68 1
-0..0.8 1
0..0.35 1
68 1
-0..0.76
0..0.473
68 1
N max
0..0.9 1
0..0.8 1
0..0.357
677
0. . 1 1 1
0..0. 1 8 0. .0.0.38
68 1 677
0..0.80.24
0..0.369
677
0..0.86 0..0.93
0..0.256 0. .0. 1 58
68 1 677
0..0.80. 0..0.89
0..0.359 0..0.2
68 1 677
0..0.8 1
0..0.34 1
677

Appendices
Table 9. 1 4 Pearson Correlation Coefficients between adrenaline challenge response (across the top, explanation of abbreviation in Table 9 .3) and milk production phenotypes (down the left side, explanation of abbreviations in Table 9.7), fol lowed by the probabi l ity that R is different from zero and the number of observation .
GLY t max GLY base N max
d 1 80 -.ptpy -0.080
0.0358
68 1
d60-'pcy -0.079
0.0387
68 1
d l 20-'pcy -0.075
0.0497
68 1
d l 80-'pcy -0.078
0.04 1 8
68 1
tot-'pwPY -0.076
0.0467
68 1
d 1 80-'pwPY -0.079
0.0393
68 1
d60-'ply -0.077
0.0457
68 1
305
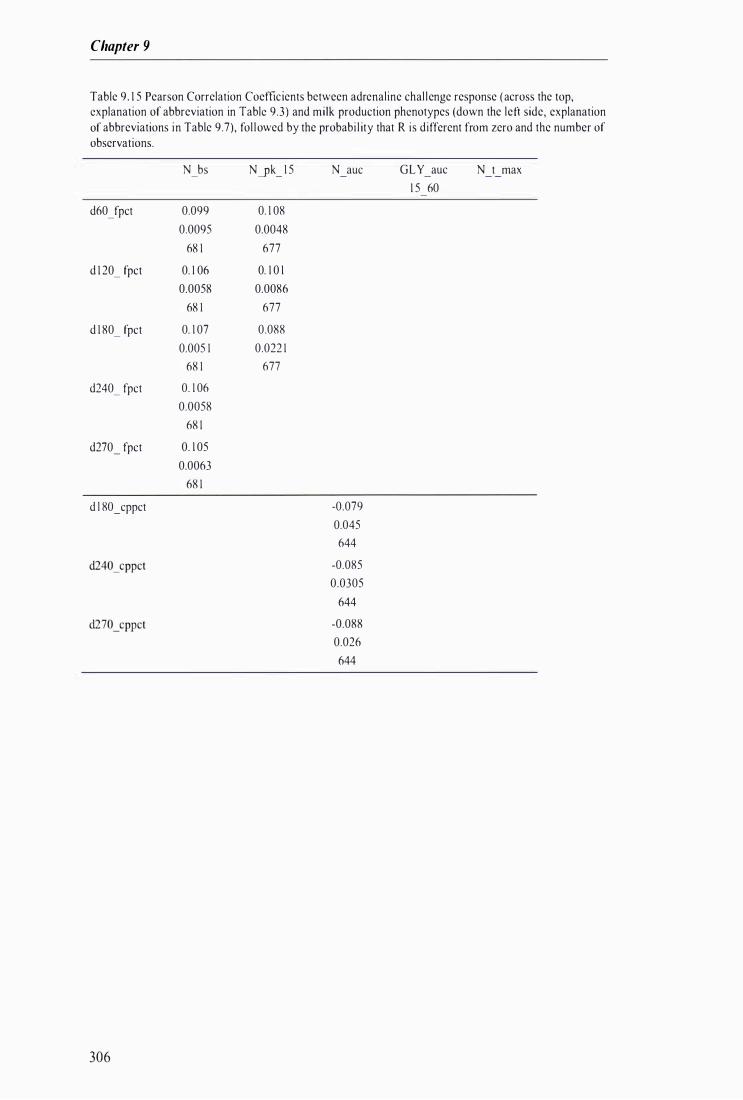
Chapter 9
Table 9. 1 5 Pearson Correlation Coefficients between adrenaline chal lenge response (across the top, explanation of abbreviation in Table 9.3) and milk production phenotypes (down the left side, explanation of abbreviations in Table 9.7), fol lowed by the probabi l ity that R is different from zero and the number of observations.
N bs Nyk_ 1 5 N auc GLY auc N t max
1 5 60
d60_fpct 0.099 0. 1 08
0.0095 0.0048
68 1 677
d 1 20_ fpct 0. 1 06 0. 1 0 1
0.0058 0.0086
68 1 677
d 1 80_ fpct 0. 1 07 0.088
0.005 1 0.022 1
68 1 677
d240_ fpct 0. 1 06
0.0058
68 1
d270_ fpct 0. 1 05
0.0063
68 1
d l 80_cppct -0.079
0.045
644
-0.085
0.0305
644
-0.088
0.026
644
306
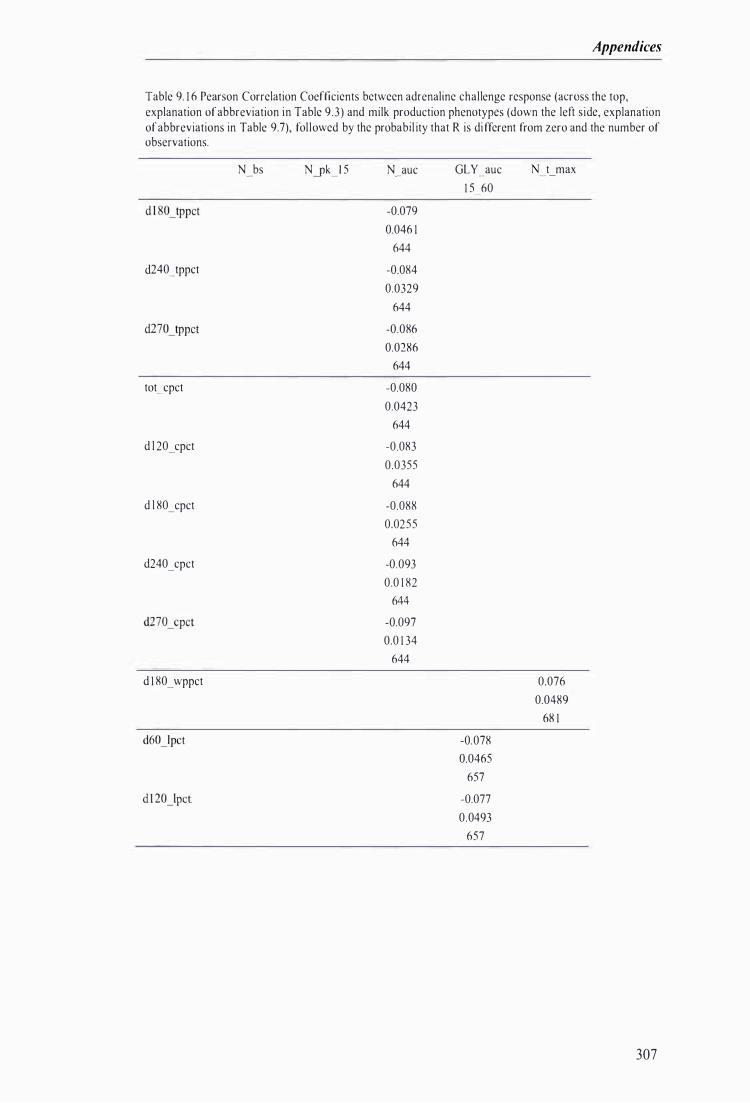
Appendices
Table 9. 1 6 Pearson Correlation Coefficients between adrenaline challenge response (across the top, explanation of abbreviation in Table 9 .3) and milk production phenotypes (down the left side, explanation of abbreviations in Table 9.7), fol lowed by the probabil ity that R is di fferent from zero and the number of observations.
N bs N --'pk _1 5 N auc GLY auc t max
1 5 60
-0.079
0.046 1
644
d240_tppct -0.084
0.0329
644
-0.086
0.0286
644
tot_cpct -0.080
0.0423
644
d l 20_cpct -0.083
0.0355
644
d l 80_cpct -0.088
0.0255
644
d240_cpct -0.093
0.0 1 82
644
-0.097
0.0 1 34
644
d 1 80_ wppct 0.076
0.0489
68 1
d60Jpct -0.078
0.0465
657
-0.077
0.0493
657
307
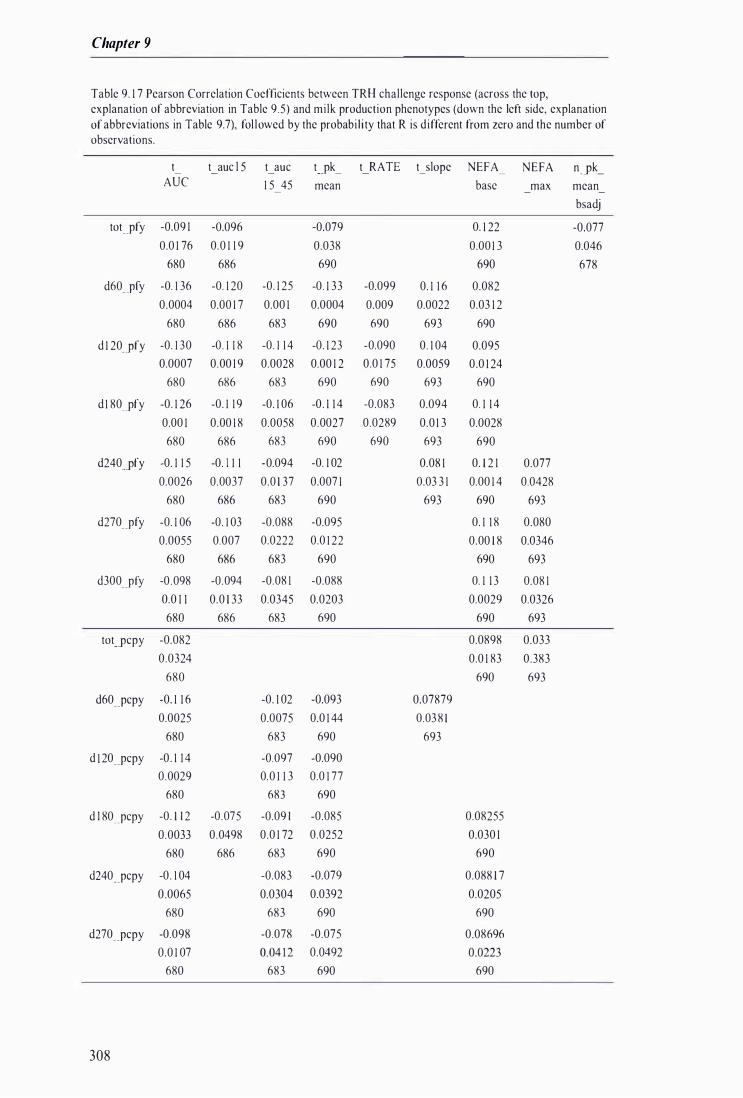
Chapter 9
Table 9. 1 7 Pearson Correlation Coefficients between TRH challenge response (across the top, explanation of abbreviation in Table 9 .5) and milk production phenotypes (down the left side, explanation of abbreviations in Table 9.7), fol lowed by the probabi l i ty that R is different from zero and the number of observations.
t t auc l 5 t auc t--.rk _ t RATE t_slope NEFA NEFA n--.rk_ -
AUC 1 5 45 mean base max mean
bsadj
tot--.rfy -0.09 1 -0.096 -0.079 0. 1 22 -0.077
0.0 1 76 0.0 1 1 9 0.038 0.00 1 3 0.046
680 686 690 690 678
d60 --.rry -0. 1 36 -0. 1 20 -0. 1 25 -0 . 1 33 -0.099 0. 1 1 6 0.082
0.0004 0.00 1 7 0.00 1 0.0004 0.009 0.0022 0.03 1 2
680 686 683 690 690 693 690
d 1 20 --.rfy -0. 1 30 -0. 1 1 8 -0. 1 1 4 -0. 1 23 -0.090 0. 1 04 0.095
0.0007 0.00 1 9 0.0028 0.00 1 2 0.0 1 75 0.0059 0.0 1 24
680 686 683 690 690 693 690
d 1 80 --.rfy -0. 1 26 -0. 1 1 9 -0. 1 06 -0. 1 1 4 -0.083 0.094 0. 1 1 4
0.00 1 0.00 1 8 0.0058 0.0027 0.0289 0.0 1 3 0.0028
680 686 683 690 690 693 690
d240 --.rfy -0. 1 1 5 -0. 1 1 1 -0.094 -0. 1 02 0.08 1 0. 1 2 1 0.077
0.0026 0.0037 0.0 1 37 0.007 1 0.03 3 1 0.00 1 4 0.0428
680 686 683 690 693 690 693
d270 --.rfy -0. 1 06 -0. 1 03 -0.088 -0.095 0. 1 1 8 0.080
0.0055 0.007 0.0222 0.0 1 22 0.00 1 8 0.0346
680 686 683 690 690 693
d300 --.rry -0 .098 -0.094 -0.08 1 -0.088 0. 1 1 3 0.08 1
0.0 1 1 0.0 1 33 0.0345 0.0203 0.0029 0.0326
680 686 683 690 690 693
tot--.rcpy -0.082 0.0898 0.033
0.0324 0.0 1 83 0.383
680 690 693
d60--.rcpy -0. 1 1 6 -0. 1 02 -0.093 0.07879
0.0025 0.0075 0.0 1 44 0.03 8 1
680 683 690 693
d I 20--.rcpy -0. 1 1 4 -0.097 -0.090
0.0029 0.0 1 1 3 0.0 1 77
680 683 690
d I 80--.rcpy -0. 1 1 2 -0.075 -0.09 1 -0.085 0.08255
0.0033 0.0498 0.0 1 72 0.0252 0.030 1
680 686 683 690 690
d240--.rcpy -0. 1 04 -0.083 -0.079 0.088 1 7
0 .0065 0.0304 0.0392 0.0205
680 683 690 690
d270--.rcpy -0.098 -0.078 -0.075 0.08696
0.0 1 07 0.04 1 2 0.0492 0.0223
680 683 690 690
308
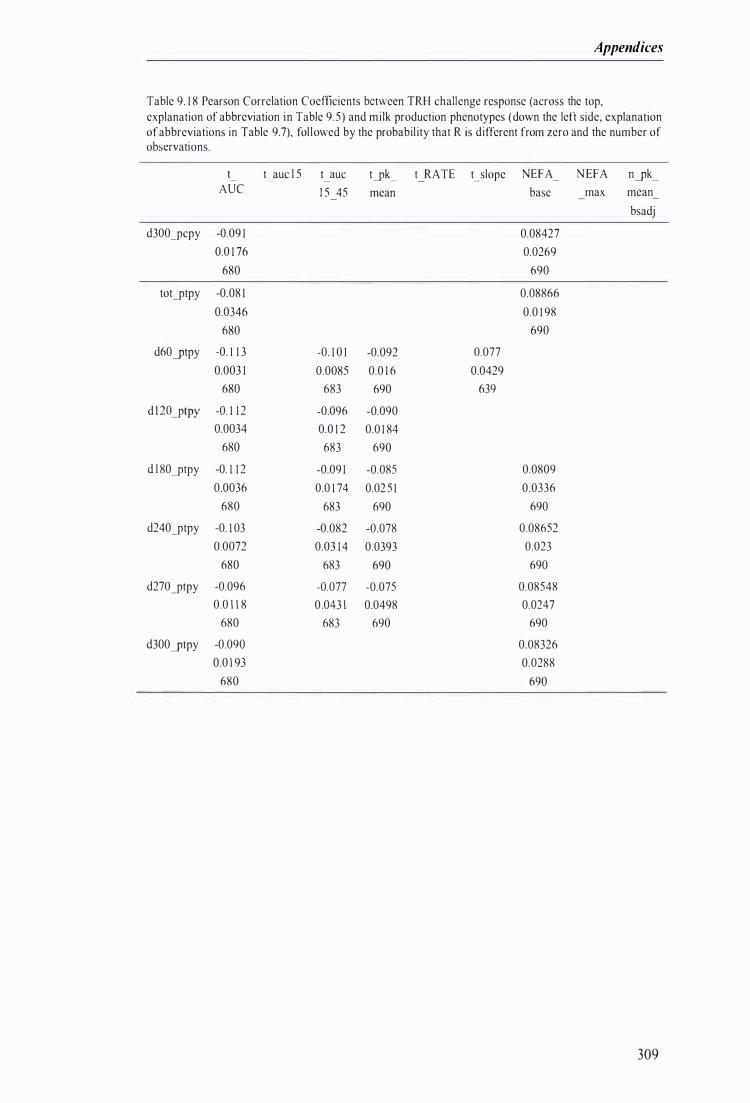
Appendices
Table 9. 1 8 Pearson Correlation Coeflicients between TRH challenge response (across the top, explanation of abbreviation in Table 9 .5 ) and milk production phenotypes (down the left side, explanation of abbreviations in Table 9.7), fol lowed by the probabil ity that R is different from zero and the number of observations.
t t auc l 5 t auc t�k_ t RATE t_slope NEFA N EFA n�k_ -
AUC 1 5 45 mean base max mean
bsadj
d300�cpy -0.09 1 0.08427
0.0 1 76 0.0269
680 690
tot�tpy -0.08 1 0.08866
0.0346 0.0 1 98
680 690
d60�tpy -0. 1 1 3 -0. 1 0 1 -0.092 0.077
0.003 1 0.0085 0.0 1 6 0.0429
680 683 690 639
d l 20�tpy -0. 1 1 2 -0.096 -0.090
0.0034 0.0 1 2 0.0 1 84
680 683 690
d l 80�tpy -0. 1 1 2 -0.09 1 -0.085 0.0809
0.0036 0.0 1 74 0.02 5 1 0.0336
680 683 690 690
d240�tpy -0. 1 03 -0.082 -0.078 0.08652
0.0072 0.03 1 4 0.0393 0.023
680 683 690 690
d27O�tpy -0.096 -0.077 -0.075 0.08548
0.0 1 1 8 0 .043 1 0.0498 0.0247
680 683 690 690
d300�tpy -0.090 0.08326
0.0 1 93 0.0288
680 690
309
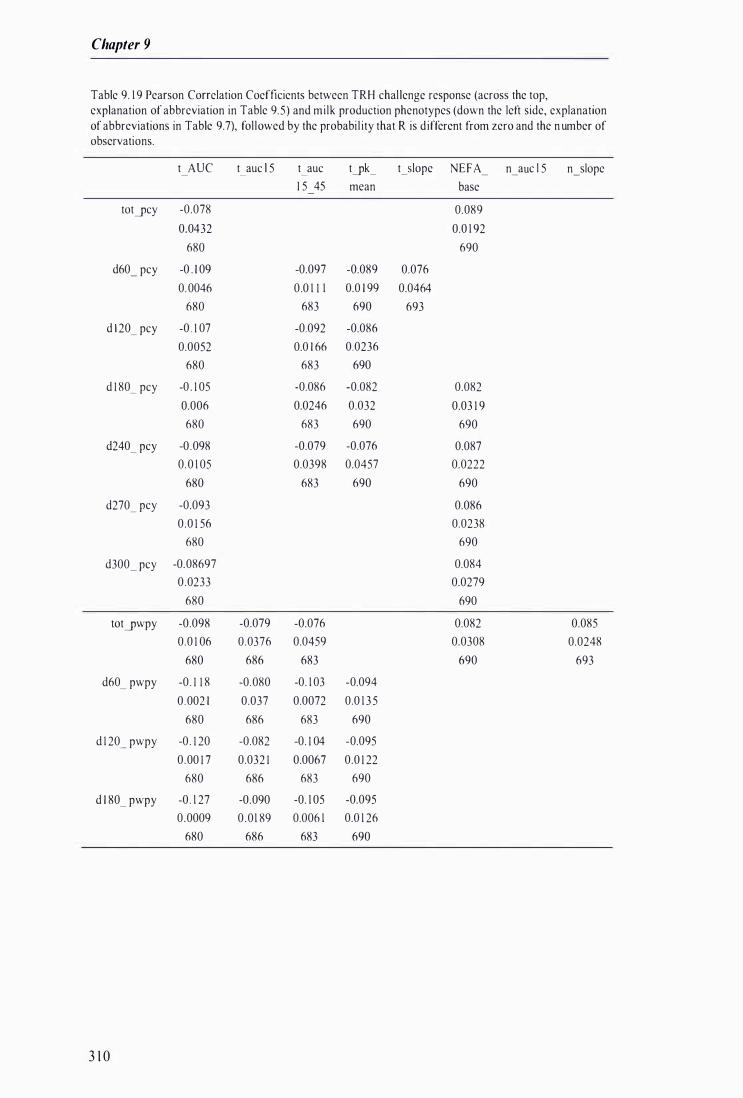
Chapter 9
Table 9. 1 9 Pearson Correlation Coefficients between TRH chal lenge response (across the top, explanation of abbreviation in Table 9. 5 ) and milk production phenotypes (down the left side, explanation of abbreviations in Table 9.7), fol lowed by the probabi l ity that R is different from zero and the n umber of observations.
t AUC t auc l 5 t auc t�k_ t_slope NEFA n auc l 5 n_slope
1 5 45 mean base
tot�cy -0.078 0.089
0.0432 0.0 1 92
680 690
d60_ pcy -0 . 1 09 -0.097 -0.089 0.076
0.0046 0 .0 1 1 1 0.0 1 99 0.0464
680 683 690 693
d 1 20_ pcy -0 . 1 07 -0.092 -0.086
0.0052 0.0 1 66 0.0236
680 683 690
d 1 80_ pcy -0 . 1 05 -0.086 -0.082 0.082
0.006 0.0246 0.032 0.03 1 9
680 683 690 690
d240_ pcy -0 .098 -0.079 -0.076 0.087
0.0 1 05 0.0398 0.0457 0.0222
680 683 690 690
d270_ pcy -0.093 0.086
0.0 1 56 0.0238
680 690
d300_ pcy -0.08697 0.084
0 .0233 0.0279
680 690
tot�wpy -0.098 -0.079 -0.076 0.082 0.085
0.0 1 06 0.0376 0.0459 0.0308 0.0248
680 686 683 690 693
d60_ pwpy -0 . 1 1 8 -0.080 -0. 1 03 -0.094
0 .002 1 0.037 0.0072 0.0 1 3 5
680 686 683 690
d 1 20_ pwpy -0 . 1 20 -0.082 -0. 1 04 -0.095
0 .00 1 7 0.032 1 0.0067 0.0 1 22
680 686 683 690
d 1 80_ pwpy -0 . 1 27 -0.090 -0. 1 05 -0.095
0.0009 0 .0 1 89 0.006 1 0.0 1 26
680 686 683 690
3 1 0
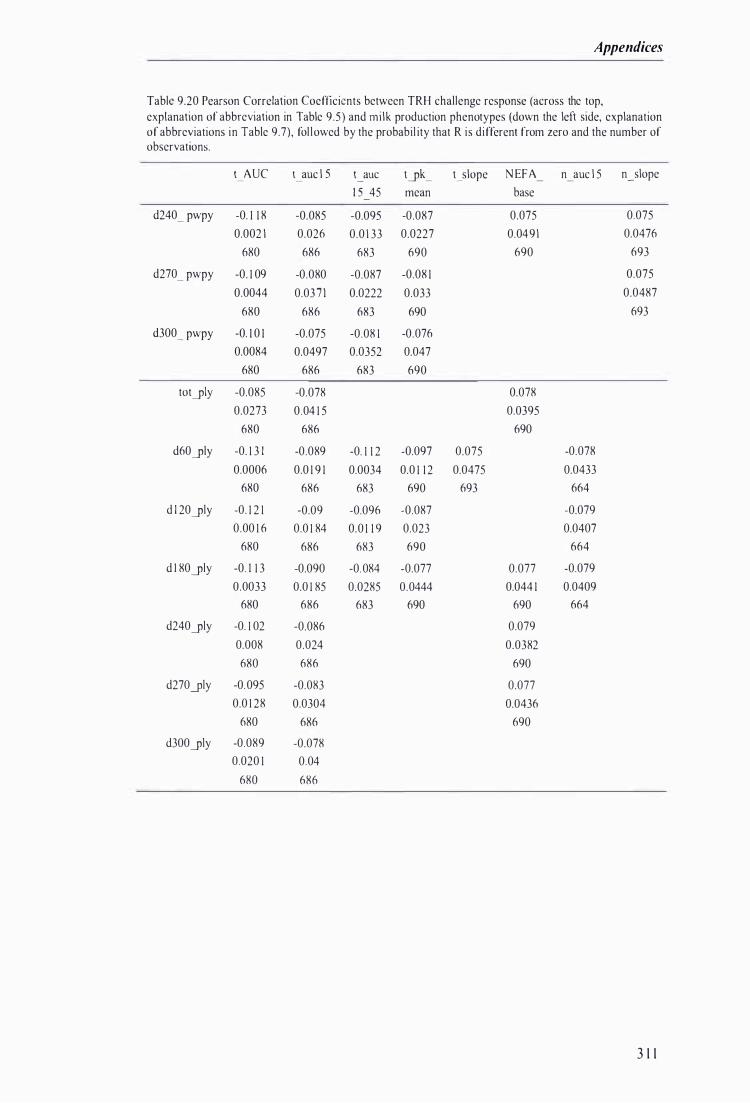
Appendices
Table 9.20 Pearson Correlation Coefficients between TRH challenge response (across the top, explanation of abbreviation in Table 9.5) and milk production phenotypes (down the left side, explanation of abbreviations in Table 9.7), fol lowed by the probabil ity that R is different from zero and the number of observations.
t AUC t auc l 5 t auc Iyk_ I_slope N EFA n auc l 5 n_slope
I S 45 mean base
d240_ pwpy -0. 1 1 8 -0.085 -0.095 -0.087 0.075 0.075
0.002 1 0.026 0.0 1 33 0.0227 0.049 1 0.0476
680 686 683 690 690 693
d270_ pwpy -0. 1 09 -0.080 -0.087 -0.08 1 0.075
0.0044 0.037 1 0.0222 0.033 0.0487
680 686 683 690 693
d300_ pwpy -0. 1 0 1 -0.075 -0.08 1 -0.076
0.0084 0.0497 0.0352 0.047
680 686 683 690
totyly -0.085 -0.078 0.078
0.0273 0.04 1 5 0.0395
680 686 690
d60yly -0. 1 3 1 -0.089 -0. 1 1 2 -0.097 0.075 -0.078
0.0006 0.0 1 9 1 0.0034 0.0 1 1 2 0.0475 0.0433
680 686 683 690 693 664
d l 20yly -0. 1 2 1 -0.09 -0.096 -0.087 -0.079
0.00 1 6 0.0 1 84 0.0 1 1 9 0.023 0.0407
680 686 683 690 664
d J 80yly -0. J 1 3 -0.090 -0.084 -0.077 0.077 -0.079
0.0033 0.0 1 85 0.0285 0.0444 0.044 1 0.0409
680 686 683 690 690 664
d240yly -0. 1 02 -0.086 0.079
0.008 0.024 0.0382
680 686 690
d270yly -0.095 -0.083 0.077
0.0 1 28 0.0304 0.0436
680 686 690
d300yly -0.089 -0.078
0.020 1 0.04
680 686
3 1 1

Chapter 9
Table 9.2 1 Pearson Correlation Coefficients between TRH challenge response (across the top, explanation of abbreviation in Table 9.5) and milk production phenotypes (down the left side, explanation of abbreviations in Table 9.7), fol lowed by the probabi l ity that R is different from zero and the number of observations.
pr1c_t_max pr1c max N EFA max pk_NEFA_ I O GH RATE G H_slope GH auc
1 5 30
d60_fpct 0.078 0.082
0.0403 0.03 1 9
693 689
d l 20_fpct 0.083 0.075 0.090
0.0294 0.0476 0.0 1 8
693 693 689
d l 80Jpct 0.084 0.080 0.096
0.0266 0.036 0.0 1 1 6
693 693 689
d240_fpct 0.090 0.087 0. 1 00
0.0 1 74 0.0226 0.0083
693 693 689
d270_fpct 0.092 0.089 0. 1 02
0.0 1 59 0.0 1 88 0.0077
693 693 689
tot_cppct 0.075 0.076
0.0485 0.0466
693 693
d240_cppct 0.079
0.0368
693
d270_cppct -0.078 0.084
0.04 1 9 0.0267
687 693
d240_tppct 0.079
0.0375
693
d270_tppct -0.078 0.083
0.04 1 1 0.0296
687 693
d240_cpct 0.079
0.03 8 1
693
d270_cpct 0.082 -0.075
0.0304 0.0489
693 683
3 1 2
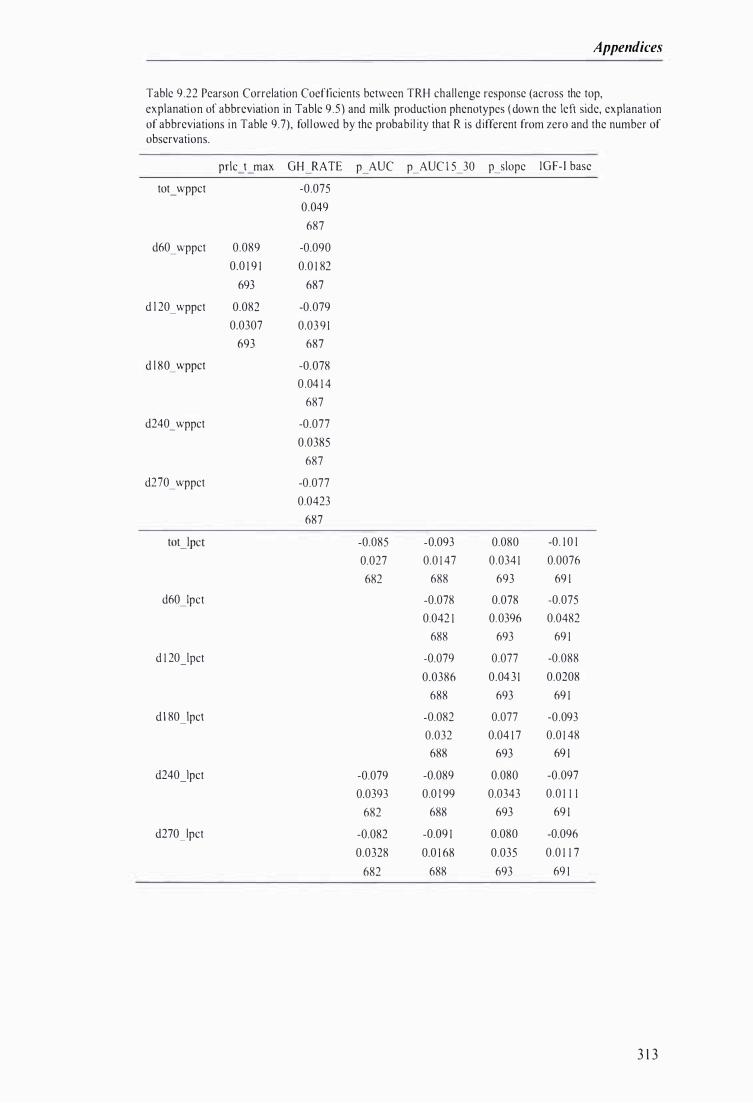
Appendices
Table 9 .22 Pearson Correlation Coefficients between TRH challenge response (across the top, explanation of abbreviation in Table 9 .5) and milk production phenotypes ( down the left side, explanation of abbreviations in Table 9.7), fol lowed by the probabil ity that R is different from zero and the number of observations.
prlc t max GH RATE p AUC p_AUC I 5_30 p_slope IGF- I base
tot_ wppct -0.075
0.049
687
d60_wppct 0.089 -0.090
0.0 1 9 1 0.0 1 82
693 687
d l 20_wppct 0.082 -0.079
0.0307 0.03 9 1
693 687
d l 80_wppct -0.078
0 .04 1 4
687
d240_wppct -0.077
0.0385
687
d270_wppct -0.077
0.0423
687
toUpct -0.085 -0.093 0.080 -0. 1 0 I
0.027 0.0 1 47 0.034 1 0.0076
682 688 693 69 1
d60_lpct -0.078 0.078 -0.075
0.042 1 0.0396 0.0482
688 693 69 1
d 1 20Jpct -0.079 0.077 -0.088
0.0386 0.04 3 1 0.0208
688 693 69 1
d l 80Jpct -0.082 0.077 -0.093
0.032 0.04 1 7 0.0 1 48
688 693 69 1
d240Jpct -0.079 -0.089 0.080 -0.097
0.0393 0.0 1 99 0.0343 0.0 1 1 1
682 688 693 69 1
d270Jpct -0.082 -0.09 1 0.080 -0.096
0.0328 0.0 1 68 0.035 0.0 1 1 7
682 688 693 69 1
3 1 3

Chapter 9
3 1 4