ibb-cnb-pre-owned-car-market-2021.pdf - carandbike
130
MARKET REPORT PRE-OWNED CAR INDIA 2021
-
Upload
khangminh22 -
Category
Documents
-
view
1 -
download
0
Transcript of ibb-cnb-pre-owned-car-market-2021.pdf - carandbike

IBB carandbike Report - 2021 1
MARKET REPORT
PRE-OWNED
CAR
INDIA2021

2021 - IBB carandbike Report 1
The past year witnessed several industries suffering setbacks due to a global economic slowdown,
nation-wide lockdowns, and lack of trade. Amid this backdrop, the pre-owned car sector came to its own for several reasons, some of which were circumstantial and some of which were a result of several years’ worth of work. Online platforms, digital pricing engines, retail networks and a well-established enterprise value chain were crucial to the success that the used-car industry experienced. Add to this an increased need for personal mobility among price-conscious customers, and growth was inevitable.
We would term 2020 as the ‘Rise of the Pre-Owned Car Industry’ in India. It weathered the storm of COVID-19 with great resilience. In fact, practices like social distancing have been a catalyst to this rise. The 2021 edition of the report has been divided into two chapters. The first chapter gives a macroscopic view of the pre-owned car market in India. It covers key metrics like market size, industry landscape and the growth of the industry over the years. This year we have introduced a new section to understand the factors that will be drivers of future growth. This chapter also sheds light on the institutional market in India and how it will continue to be a critical supply source for the used-car industry. The report also has a section on the value chains Fo
rew
ord
IBB carandbike Report - 2021 2
that are currently prevalent in India and around the globe.
Chapter Two: The Voice – Where the Rubber Hits the Road – is an exclusive consumer and pre-owned car dealer study. We have conducted this study with PremonAsia, a consumer insight-based consulting firm based out of Singapore. For this study, we have accounted for all three cogs on the consumer side: the buyer, the seller, and the intender. This extensive consumer-side study gives us a deep understanding of the profiles, preferences, the influence of digital, and the considerations made during the journey of each of these consumers.
The pre-owned car dealer is the cornerstone of the pre-owned car market. The supply-side study gives us insight into the mindset of the dealer, channels of procurement, demand drivers, and future business climate of the pre-owned car market.
COVID-19 has been an unexpected blow to multiple
industries across the globe, with the auto industry facing the brunt. This report covers the impact of COVID-19 at an industry level as well as at a consumer and dealer level. With the Indian auto-industry reeling from the effects of the pandemic, the pre-owned car market will continue to be a key enabler for the growth of the new car industry. With the commencement of a new decade, we believe these are exciting times for the industry, with huge opportunities for growth. We hope that the IndianBlueBook carandbike 2021 report will set the tone for the ongoing decade while being useful to all industry participants to garner insights, and continue to drive the used-car industry forward.
We hope that this edition of IndianBlueBook Pre-Owned Car Market Report, India will be useful to all stakeholders and promote the cause of rapid organisation of the industry and scaling up of participants therein.
2021 - IBB carandbike Report 3
Table o
f Co
nten
tsChapter 1THE INDUSTRY Used Car Industry Landscape
Market Sizing for India ✱ Market Size: F20 ✱ Historical Growth ✱Impact of COVID-19 and FY21 Scenario ✱ Forecast for Market Sizing ✱ Key Drivers of Growth
Value Chain and Business Models ✱ Value Chain of the Used Car Industry ✱ The Supply Conundrum ✱ Different Business Models in the Used-Car Industry
Market Landscape ✱ Geographic Landscape ✱ Channel & Dealer Landscape ✱ Impact of Digital ✱ Impact of Finance
Institutional Used Car Market in India ✱ Composition of Institutional Market ✱ Key Drivers of Growth ✱ Auctions in the Institutional Market

2021 - IBB carandbike Report 4
Table o
f Co
nten
tsChapter 2THE VOICE Where Rubber hits the Road
The Buyer Expanding horizons of options and trust ✱ Customer Profile and Car Profile ✱ Purchase Considerations and Key Influencers ✱ Purchase Process ✱ Impact of COVID-19 ✱ Future Outlook
The SellerConvenience galore in changing landscape ✱ Key Reason to Sell and Car Profile ✱ Selling Journey and Considerations ✱ Channel Preferences ✱ Pricing Assessment ✱ Impact of COVID-19 ✱ Future Outlook
The Intender Shifting mindsets and changing preferences ✱ Customer Profile and Budget ✱ Purchase Considerations and Key Influencers ✱ Channel Preferences ✱ Purchase Process ✱ Impact of COVID-19
The Dealer Backbone of the Industry ✱ Dealership Profile, Sales & Enquiries ✱ Finance for Used Car Customers ✱ Procurement Channels and Challenges ✱ Impact of COVID-19 ✱ Future Outlook
Appendix ✱ Sources
CHAPTER 1
The pre-owned car market in India has continued to grow despite slowing economic activity and externalities which have shaken the auto industry.
4.2 million cars were sold in FY20, with a modest growth of 5% over the previous year.
USED CAR INDUSTRY LANDSCAPE
2021 - IBB carandbike Report 6
The pre-owned car market in India has been a north star of the progress of the automotive industry, despite being bundled with complexity, multiple stakeholders, and a web of value chains. The base of growth stems from the fact that the
industry is has continued to move towards getting organised on the back of significant investments being poured into the sector. The sector will enjoy immense growth potential in the years to come.
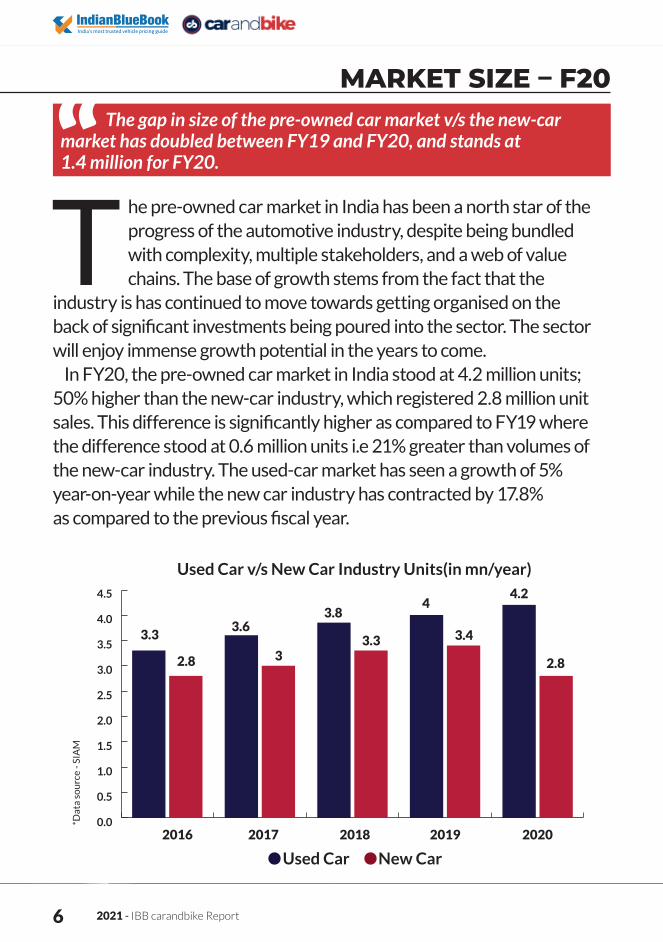
In FY20, the pre-owned car market in India stood at 4.2 million units; 50% higher than the new-car industry, which registered 2.8 million unit sales. This difference is significantly higher as compared to FY19 where the difference stood at 0.6 million units i.e 21% greater than volumes of the new-car industry. The used-car market has seen a growth of 5% year-on-year while the new car industry has contracted by 17.8% as compared to the previous fiscal year.
HISTORICAL GROWTH RATEMARKET SIZE – F20The gap in size of the pre-owned car market v/s the new-car
market has doubled between FY19 and FY20, and stands at 1.4 million for FY20.
*Dat
a so
urc
e - S
IAM
Used Car v/s New Car Industry Units(in mn/year)
2016 2017 2018 2019 2020
Used Car New Car
0.0
0.5
1.0
1.5
2.0
2.5
3.0
3.5
4.0
4.5
3.33.6
3.84
4.2
2.8 33.3 3.4
2.8

IBB carandbike Report - 2021 7
Despite the economic slowdown and other externalities that have impacted the automotive industry, the used-car industry has overall shown a CAGR of 6.21% in the FY16 to FY20 timeframe, while the new-car industry has displayed
a CAGR of -0.09% within the same.Also, if we account for estimates of FY21 to calculate the CAGR
between 2016 and 2021, the CAGR in the used-car industry stands at 3.4% while the new-car industry’s CAGR would stand at -8.33%. The new-car industry is still recovering from the post-pandemic slowdown and macro challenges like global supply chain issues, availability of labour and the transition to BS6.
HISTORICAL GROWTH RATEThe pre-owned car industry has grown consistently in
the last 4 years, while growth of the new-car industry has faltered due to multiple reasons.
CAGR Used Car v/s New Car
Used Car New Car
6.21%
3.40%
-0.09%
2016-2020 2016-2021
-8.33%
-12
-8
-4
0
4
8

2021 - IBB carandbike Report 8
The year FY21 has seen a black swan event in the form of COVID-19 sending shockwaves throughout the globe and various business industries. One of the biggest industries to be impacted due to this has been the auto industry.
While there was a dip in volume of both the new-car and used-car industries, the new-car industry was severely impacted due to the following reasons:
IMPACT OF COVID-19
The wind has blown in favour of the pre-owned car market in India and has nudged the industry towards faster consolidation, organisation and growth.

IBB carandbike Report - 2021 9
MISMATCH BETWEEN SUPPLY AND DEMAND Trade between countries was majorly impacted as the pandemic raged across the world in FY21. This led to serious constraints in the movement of vehicle components that were critical to building new cars (eg: semi-conductors). With the global supply chain impacted, production levels are far lower than in the previous year. Since the used-car industry does not have global interdependencies, it escaped the wrath and, in fact, capitalised on the pent-up demand.
REDUCED OPERATIONSDue to a complete nationwide lockdown in April 2020 and extended lockdowns in several states (especially metro areas), the new-car dealers had a significantly smaller timeframe in FY21 to carry out uninterrupted sales. This effectively gave them only 6-7 months of operation cycle to sell vehicles in the market, leading to a drop in new car sales. In comparison, used-car dealers were able to open shops due to lower dependency on manpower requirements and lesser operational complexities involved. They also had a larger cycle of operations, which facilitated good sales volumes for the pre-owned car market.
2021 - IBB carandbike Report 10
PREFERENCE OF PERSONAL TRANSPORT OVER PUBLIC MODESConsumers have actively avoided the use of public transport this year due to health and safety reasons. The mindset has shifted to owning a car, which acts a safe mode of conveyance to meet their mobility requirements amid the pandemic. Buyers have sought to own used cars as it fulfils their criteria for a safer way to commute.
IMPACT ON BUDGETS FOR PURCHASE With the transition to BS6 at the start of FY21, new cars became more expensive to own. Also, with the pandemic, the disposable income of several consumers was impacted. These customers who were now looking for an affordable means of personal transport gravitated towards used cars and hence potential buyers of new cars have switched to used cars.
An increased comfort with digital platforms, and select sections of society (agriculture related, salaried whose livelihoods weren’t affected extensively by the lockdown) acted as additional factors to propel purchases of pre-owned cars.
The year FY21 can be summarised as a year in transition. While it has impacted the financial health of the used-car and new-car ecosystem in the short term, it has fast-tracked the pre-owned car market on the path to growth. The buyer
is now more open to owning a used car than ever before. Detailed impacts of COVID-19 have been covered in Chapter 2.
2021 - IBB carandbike Report 11
COVID-19 lockdowns impacted multiple industries; however, the auto industry faced the brunt of slowdown and, for the first time in history, there were no new car sales for the entire month of April 2020 due to enforcement of
lockdown. Even post the easing of restrictions, the new-car industry continues to be plagued with supply chain issues and low inventory levels. In these tumultuous times, the pre-owned car market has emerged as a flagbearer of the auto industry.
THE FY21 SCENARIOTHE FY21 SCENARIO
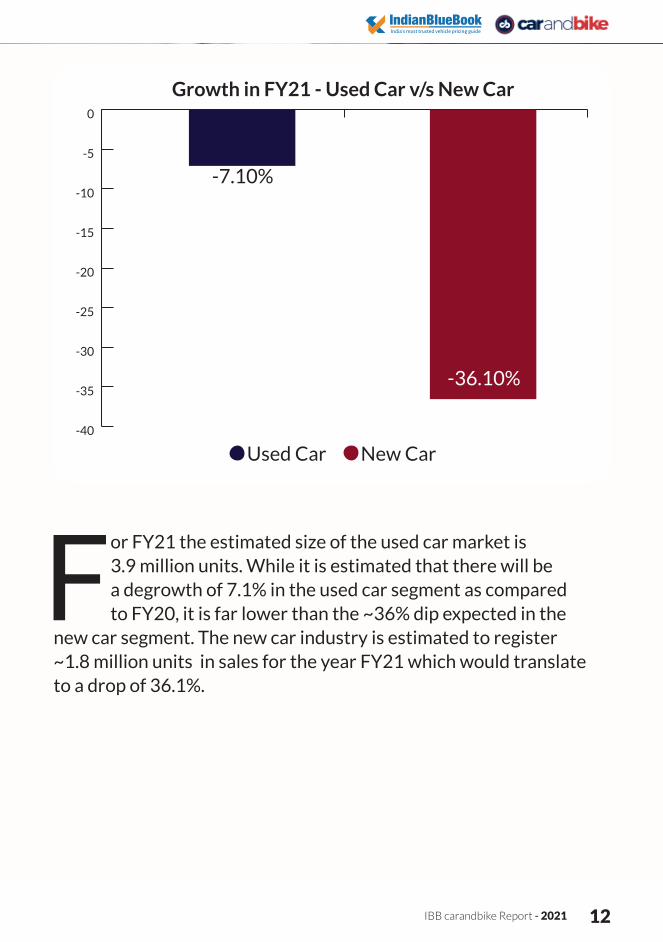
With the lockdown induced due to COVID-19 in the 1st half of the year, the new-car industry is estimated to register ~36% YoY degrowth. In contrast, the pre-owned car industry is estimated to shrink by only 7.1%.
IBB carandbike Report - 2021 12
For FY21 the estimated size of the used car market is 3.9 million units. While it is estimated that there will be a degrowth of 7.1% in the used car segment as compared to FY20, it is far lower than the ~36% dip expected in the
new car segment. The new car industry is estimated to register ~1.8 million units in sales for the year FY21 which would translate to a drop of 36.1%.
THE FY21 SCENARIO
-40
-35
-30
-25
-20
-15
-10
-5
0
Used Car New Car
-7.10%
-36.10%
Growth in FY21 - Used Car v/s New Car
2021 - IBB carandbike Report 13
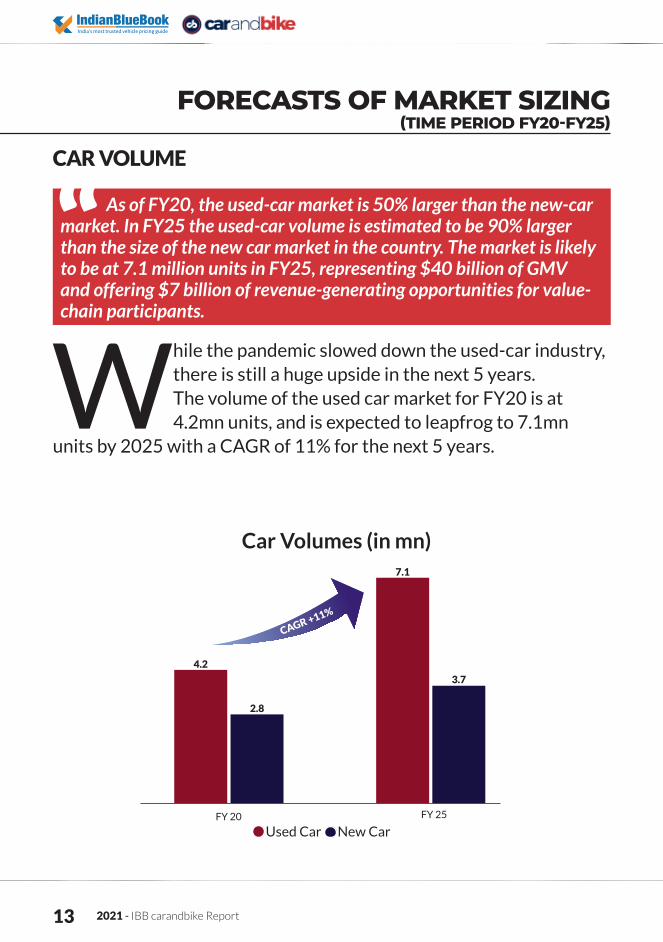
While the pandemic slowed down the used-car industry, there is still a huge upside in the next 5 years. The volume of the used car market for FY20 is at 4.2mn units, and is expected to leapfrog to 7.1mn
units by 2025 with a CAGR of 11% for the next 5 years.
FORECASTS OF MARKET SIZING (TIME PERIOD FY20-FY25)
As of FY20, the used-car market is 50% larger than the new-car market. In FY25 the used-car volume is estimated to be 90% larger than the size of the new car market in the country. The market is likely to be at 7.1 million units in FY25, representing $40 billion of GMV and offering $7 billion of revenue-generating opportunities for value-chain participants.
Car Volumes (in mn)
Used Car New Car FY 20 FY 25
4.2
2.8
7.1
3.7
CAGR +11%
CAR VOLUME

IBB carandbike Report - 2021 14
GMV($Bn)
Used Car New Car
29
19
45
40
FY 20 FY 25
CAGR +17%
In the used car market, while the volume has been significantly higher, the GMV is still lagging by over $10bn as of FY20. However, due to the increase in volume of used cars, the gap is expected to narrow to $5bn by FY25. The GMV estimate
for the used-car market is pegged at $40bn for FY25 from $19bn as of FY20 with a CAGR of 17%.
GROSS MERCHANDISE VALUE
For FY20 GMV of the new-car industry is 52% larger than the used-car industry. For FY25 it is estimated this gap will shrink to 12.5%. This is due to higher-volume growth of the pre-owned car market and increased organisation of the industry, which would lead to multi-service options being baked into the used car products which will enable higher GMV for the pre-owned car market.
2021 - IBB carandbike Report 15
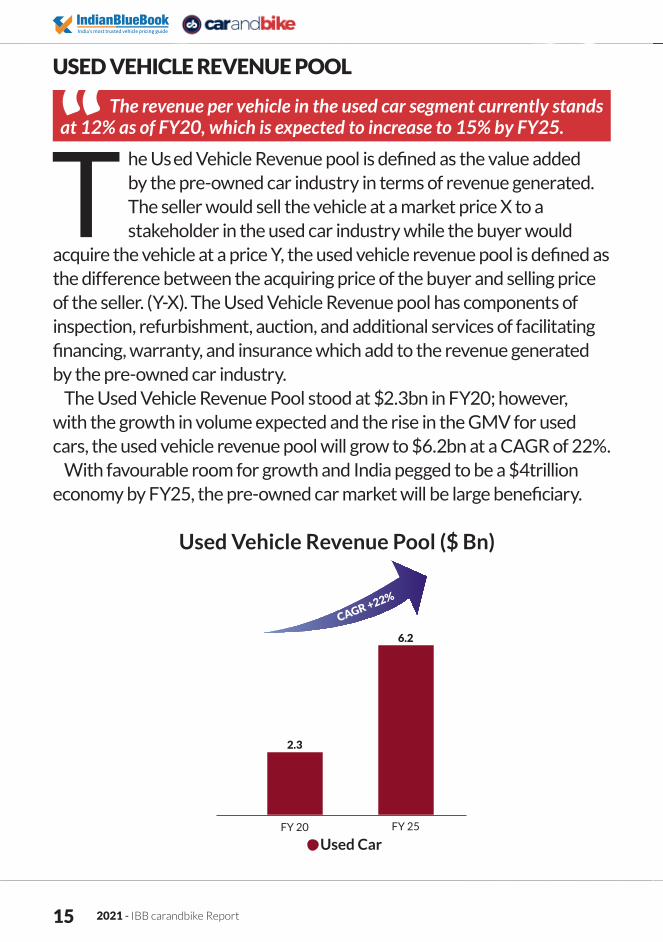
The Used Vehicle Revenue pool is defined as the value added by the pre-owned car industry in terms of revenue generated. The seller would sell the vehicle at a market price X to a stakeholder in the used car industry while the buyer would
acquire the vehicle at a price Y, the used vehicle revenue pool is defined as the difference between the acquiring price of the buyer and selling price of the seller. (Y-X). The Used Vehicle Revenue pool has components of inspection, refurbishment, auction, and additional services of facilitating financing, warranty, and insurance which add to the revenue generated by the pre-owned car industry.
The Used Vehicle Revenue Pool stood at $2.3bn in FY20; however, with the growth in volume expected and the rise in the GMV for used cars, the used vehicle revenue pool will grow to $6.2bn at a CAGR of 22%.
With favourable room for growth and India pegged to be a $4trillion economy by FY25, the pre-owned car market will be large beneficiary.
USED VEHICLE REVENUE POOL
The revenue per vehicle in the used car segment currently stands at 12% as of FY20, which is expected to increase to 15% by FY25.
Used Vehicle Revenue Pool ($ Bn)
Used Car
2.3
6.2
FY 20 FY 25
CAGR +22%
KEY DRIVERS FOR GROWTH
IBB carandbike Report - 2021 16
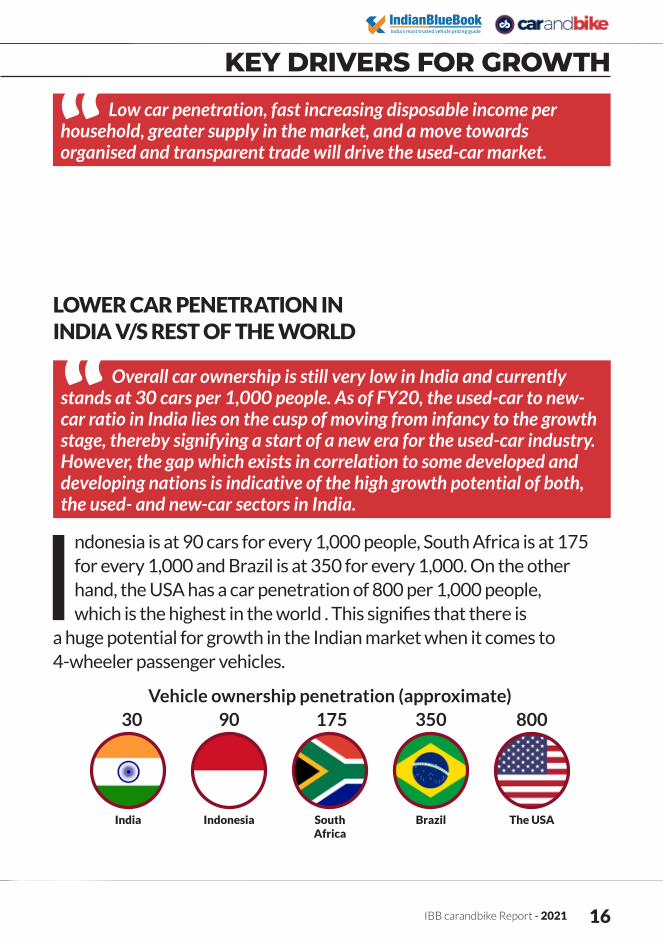
KEY DRIVERS FOR GROWTH Low car penetration, fast increasing disposable income per household, greater supply in the market, and a move towards organised and transparent trade will drive the used-car market.
Indonesia is at 90 cars for every 1,000 people, South Africa is at 175 for every 1,000 and Brazil is at 350 for every 1,000. On the other hand, the USA has a car penetration of 800 per 1,000 people, which is the highest in the world . This signifies that there is
a huge potential for growth in the Indian market when it comes to 4-wheeler passenger vehicles.
LOWER CAR PENETRATION IN INDIA V/S REST OF THE WORLD
Overall car ownership is still very low in India and currently stands at 30 cars per 1,000 people. As of FY20, the used-car to new-car ratio in India lies on the cusp of moving from infancy to the growth stage, thereby signifying a start of a new era for the used-car industry. However, the gap which exists in correlation to some developed and developing nations is indicative of the high growth potential of both, the used- and new-car sectors in India.
Vehicle ownership penetration (approximate)30 90 175 350 800
India Indonesia Brazil The USASouth Africa

2021 - IBB carandbike Report 17
The used-car industry in India is at an early stage of evolution and is at the cusp of transitioning from infancy to the growth and maturity phase. In China, the new-car industry still dominates the yearly sales, with the ratio of a new car to a used car being
0.5 as the sector is largely unorganised and the replacement cycle of a car is still high. In India, it currently stands at 1.55 as of FY20, whereas in developed countries like the USA and UK it stands at 2.3 and 3.4 respectively.
Based on recent estimates for FY21 the ratio for India has leapfrogged to ~2.2x which is a temporary jump due to a large dip in new car sales on account of the short-term impact of Covid-19.
Used / New Car Ratio
0.5
China1.55 1.6 1.7
2.12.3
2.6
3.4
0
1
2
3
4
IndiaSpain
GermanyThe USA
France
U.K
Italy
Infancy Growth Maturity
USED CAR TO NEW CAR RATIO
IBB carandbike Report - 2021 18
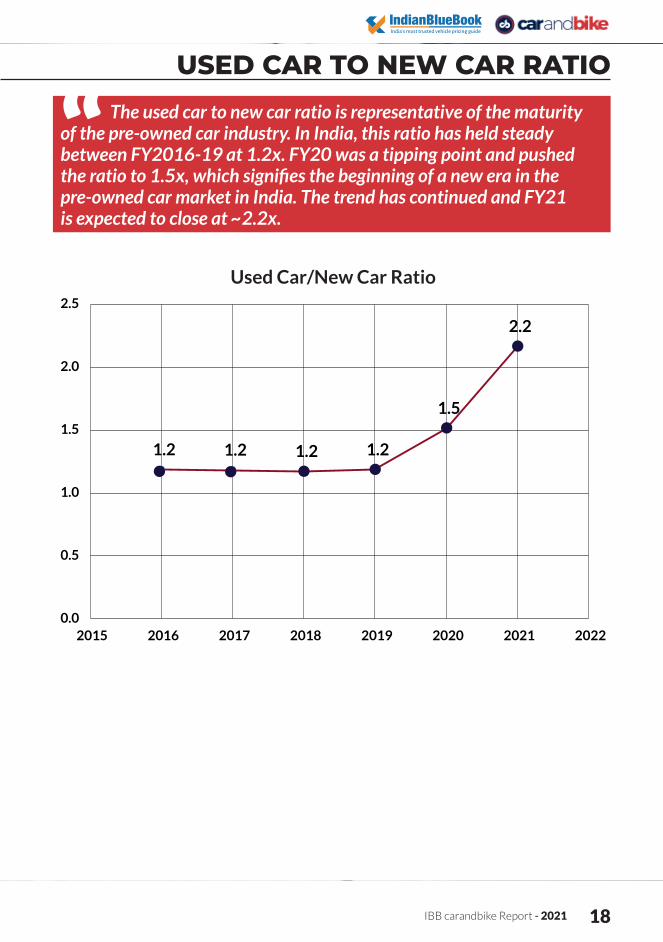
USED CAR TO NEW CAR RATIOThe used car to new car ratio is representative of the maturity
of the pre-owned car industry. In India, this ratio has held steady between FY2016-19 at 1.2x. FY20 was a tipping point and pushed the ratio to 1.5x, which signifies the beginning of a new era in the pre-owned car market in India. The trend has continued and FY21 is expected to close at ~2.2x.
Used Car/New Car Ratio
1.2 1.2 1.2 1.2
1.5
2.2
0.0
0.5
1.0
1.5
2.0
2.5
2015 2016 2017 2018 2019 2020 2021 2022
2021 - IBB carandbike Report 19
HIGHER DISPOSABLE INCOME
The disposable income per household is expected to double by the year FY25 as compared to FY20. With the increase in discretionary spending and rise in aspirations of the Indian populace, vehicle penetration would see an uptrend in the forthcoming years.
The volume of the used car market was 1.2x times that of new car volumes until FY19. While the used-car market has been historically larger in terms of absolute volumes than the new-car market, the jump has amplified in the past couple of years
due to a shift in the consumer sentiment towards used cars. One of the leading factors for this change is the faster shift from unorganised to organised trade and offerings like warranties on used cars by the organised players. Hence, the used car to new car ratio increased to 1.5x for FY20.
Considering the estimates for FY21, this ratio is at an all-time high at ~2.2x. However, it is to be noted that due to the impact of COVID-19, there has been a substantial decrease in the denominator (new car sales) while the numerator, i.e the pre-owned car market, has been relatively stable. Moving ahead, we expect this ratio to normalise. However, COVID-19 has clearly indicated that consumers in India are now amenable to buying used cars and consider it a smarter investment over a new car. The middle-class audience has also shunned the social stigma which was earlier attached to buying a used car, especially in Tier 2 and Tier 3 locations.
2021 - IBB carandbike Report 20
CHANGING BEHAVIOURS AND ATTITUDES
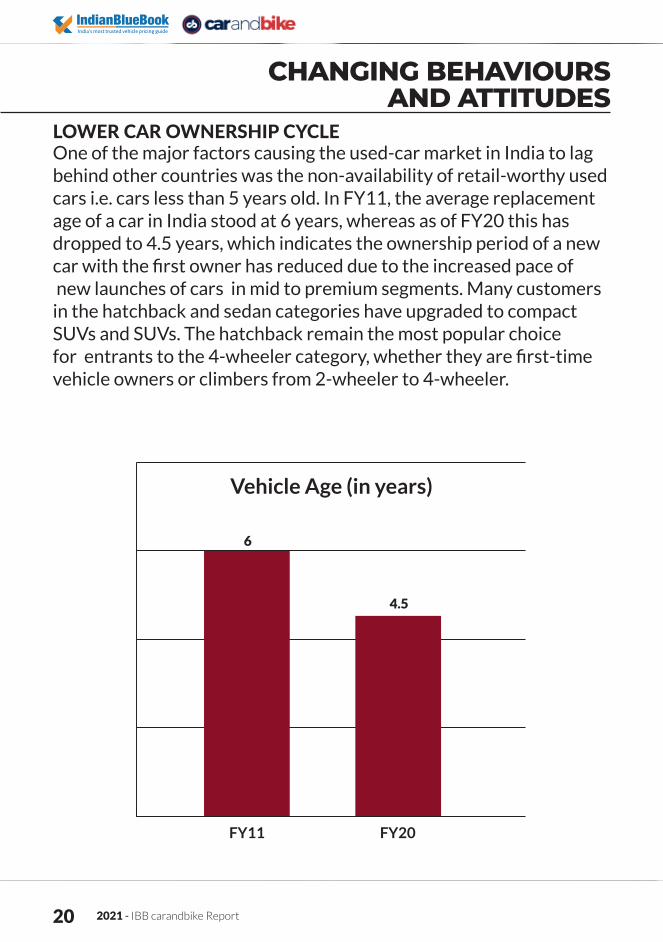
LOWER CAR OWNERSHIP CYCLE One of the major factors causing the used-car market in India to lag behind other countries was the non-availability of retail-worthy used cars i.e. cars less than 5 years old. In FY11, the average replacement age of a car in India stood at 6 years, whereas as of FY20 this has dropped to 4.5 years, which indicates the ownership period of a new car with the first owner has reduced due to the increased pace of new launches of cars in mid to premium segments. Many customers in the hatchback and sedan categories have upgraded to compact SUVs and SUVs. The hatchback remain the most popular choice for entrants to the 4-wheeler category, whether they are first-time vehicle owners or climbers from 2-wheeler to 4-wheeler.
6
FY11
Vehicle Age (in years)
4.5
FY20

IBB carandbike Report - 2021 21
LEASING/ SUBSCRIPTION PATTERN OF USAGE
THE INVESTMENT TRAIN – $1BN IN INVESTMENTS IN THE USED-CAR INDUSTRY IN THE PAST 5 YEARS
BANG SAYS THE BUCK
The subscription and leasing market is poised to see growth in the forthcoming years due to multiple OEM initiatives that are now actively promoting leasing and subscription as an alternative to buying a new car. These vehicles would act as a regular supply for used vehicles in the market, thereby lowering the average ownership cycle of the vehicle. This will help buyers gain access to retail-worthy inventory, as these leased or subscribed vehicles are disposed in the market at the end of the tenure (generally 3 years).
Looking at the immense potential in the pre-owned car market in India, there have been significant investments made to the tune of $1bn in the past 5 years. This has helped organise parts of the used-car industry – especially the supply side, which has led to the shrinking of informal channels. Due to digital payments, and facilitating of registration for used cars along with GST applicable for the buying and selling of used cars, the pre-owned car continues its journey towards organisation.
2021 - IBB carandbike Report 22
The value chain in the used-car market is currently complex, inefficient, and unwieldy. But the good news is, it is evolving faster than ever. Apart from the buyer and seller, there are multiple stakeholders involved in the process, which makes
it fragmented and difficult to organise as significant coordination is required to ensure a used-car transaction flows from seller to buyer.
Technology is now playing a key role in bridging this gap between the multiple stakeholders involved.
In a typical transaction of a used car, the car owner sells the car via online classifieds or other digital portals, or a dealer/ broker. In some cases, the seller sells the vehicles directly to friends and family. Depending on the condition of the car, it is then refurbished and sold in the market by the dealer/ broker, who, in turn, marks up the value and sells it to the final consumer - a used-car buyer.
With multiple stakeholders turning the wheel of the used-car industry, there are three types of value chains that are currently operational: Direct, Dealer-led, and Institution-led, with each playing a critical role in keeping the wheel moving.
VALUE CHAIN OF THE USED-CAR INDUSTRY
SUPPLY IS KING IN THE VALUE CHAIN
IBB carandbike Report - 2021 23
The value chain in the used-car industry is defined by the sources of supply. There are currently four sources through which a used car is available in the ecosystem:
(1) Individual sellers selling directly to individual buyers/ brokers/ dealers
(2) Individual sellers exchanging their pre-owned cars for new cars at new-car dealerships
(3) Institutions like leasing companies or fleet owners(4) Repossession by banks or NBFCs for a default of loan repayment
of the assetThe first source largely drives the C2B (consumer to business) and
the C2C (consumer to consumer) business. The C2B business includes selling to brokers/ dealers or exchanging used cars for new cars at dealerships, which constitutes the dealer value chain. An individual seller can also choose to directly sell to another customer by listing their vehicle on any online classifieds portal or selling it to friends or family. This is the C2C aspect of the business and forms the direct value chain.
The current status of the industry is that individual sellers continue to dominate the supply of used cars, and are a critical piece in driving both the dealer value chain and the direct value chain.
The institutional value chain includes vehicles that are repossessed by banks and NBFCs, or vehicles that are sourced from leasing companies after being used in fleets or leased by corporate employees.The next section explains these value chains in further detail. The various aspects of the institutional used car market has been covered in detail in the latter section of the report.
SUPPLY IS KING IN THE VALUE CHAIN

2021 - IBB carandbike Report 24
DIRECT VALUE CHAIN
The direct value chain has been the cornerstone of the pre-owned car market in India. Prior to any organisation of the pre-owned car industry, the seller would usually look for buyers from within their friends and family or acquaintances
to sell their car. This channel continues to play a key role in the market; however, options to sell the car have expanded with the advent of technology.
In the direct value chain, the car seller can choose to sell to friends or family, or can list their vehicle on any online classified platforms (eg: Quikr, OLX, sections of cardekho, carandbike), which is visible to used-car buyers who are looking to purchase a vehicle. This value chain is simple and direct, but is plagued with challenges like transparency on the condition of the vehicle, and inefficient price benchmarking.
IBB carandbike Report - 2021 25
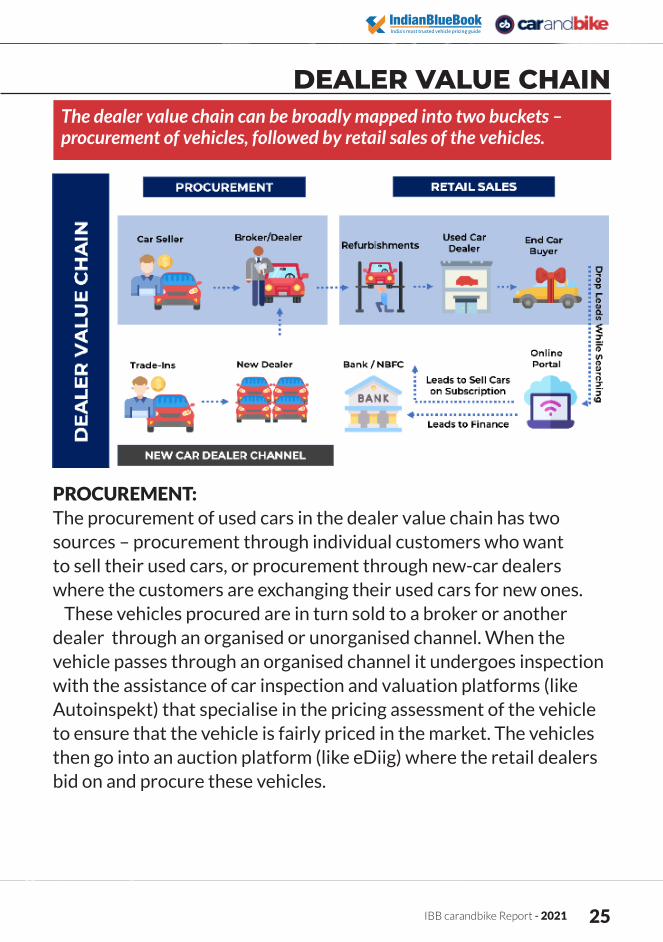
The dealer value chain can be broadly mapped into two buckets – procurement of vehicles, followed by retail sales of the vehicles.
DEALER VALUE CHAIN
PROCUREMENT: The procurement of used cars in the dealer value chain has two sources – procurement through individual customers who want to sell their used cars, or procurement through new-car dealers where the customers are exchanging their used cars for new ones.
These vehicles procured are in turn sold to a broker or another dealer through an organised or unorganised channel. When the vehicle passes through an organised channel it undergoes inspection with the assistance of car inspection and valuation platforms (like Autoinspekt) that specialise in the pricing assessment of the vehicle to ensure that the vehicle is fairly priced in the market. The vehicles then go into an auction platform (like eDiig) where the retail dealers bid on and procure these vehicles.
2021 - IBB carandbike Report 26
RETAIL SALES:Post the procurement of these vehicles, the dealer refurbishes the vehicles to make them retail-ready before having it available for sale at their showrooms or listing them on their website or third-party platforms that they have a tie-up with. The end customer – the car buyer, usually connects with the dealer via walking into the showroom or discovers the dealer listing on one of the listing platforms or via brand website in cases of dealers organised under Mahindra First Choice or Maruti True Value. While the end buyer and dealer interact to discuss pricing and other relevant details pertaining to the vehicle, additional services of insurance and loans for the vehicle are offered by banks/ NBFCs to facilitate the sale of the vehicle to the end user. In most cases, dealers belonging to the organised channel have empanelled vendors for insurance and loans to ensure a complete set of services is offered to the customer to facilitate the sale.
INSTITUTIONAL VALUE CHAIN
IBB carandbike Report - 2021 27
INSTITUTIONAL VALUE CHAIN
With growing default rates on loans taken for the purchase of new and used vehicles along with improving traction in the fleet and leasing space, the institutional value chain has gained prominence
in the entire landscape of supply of vehicles in the pre-owned car market in India. It currently accounts for 10% of the supply in the pre-owned car market in the country. This value chain is critical to the supply chain, because the age of most repossessed vehicles are retail-worthy and, in turn, drives demand for used cars in the market.
PROCUREMENT:All vehicles in the institutional value chain are procured either through repossession i.e. loans that are declared as NPAs for vehicles, or selling of cars that have reached their end of tenure from leasing companies or fleets. Due to the low penetration of leasing companies in India, which currently stands at about 20,000 to 30,000 vehicles per year, the repossession channel becomes a major contributor to the supply of vehicles, which contributes to 85% of the overall supply pie from the institutional market.
In the case of loan defaults, the car is procured by the repossession agent of the NBFC/ bank and is then stored in the yard along with an empanelled dealer/ business that ensures the condition of the car does not deteriorate and the quality of the asset is maintained until it is off-loaded to the retail dealer network or smaller, hyper-local used-car brokers.

2021 - IBB carandbike Report 28
RETAIL SALE:The procured vehicle is inspected by experts (mechanics, businesses) to assess the condition and provide an estimate of the fair price along with the refurbishment required to fetch the maximum price for the vehicle. There are a handful of organised players in the Indian market specialising in the assessment of vehicle condition, providing a credible valuation and finally, conducting auctions at scale where regional dealers or brokers can bid on these vehicles to add them to their inventory and, in turn, sell them to used-car buyers with products of warranty and service baked into the price of the vehicle.
THE SUPPLY SOURCE CONUNDRUM
IBB carandbike Report - 2021 29
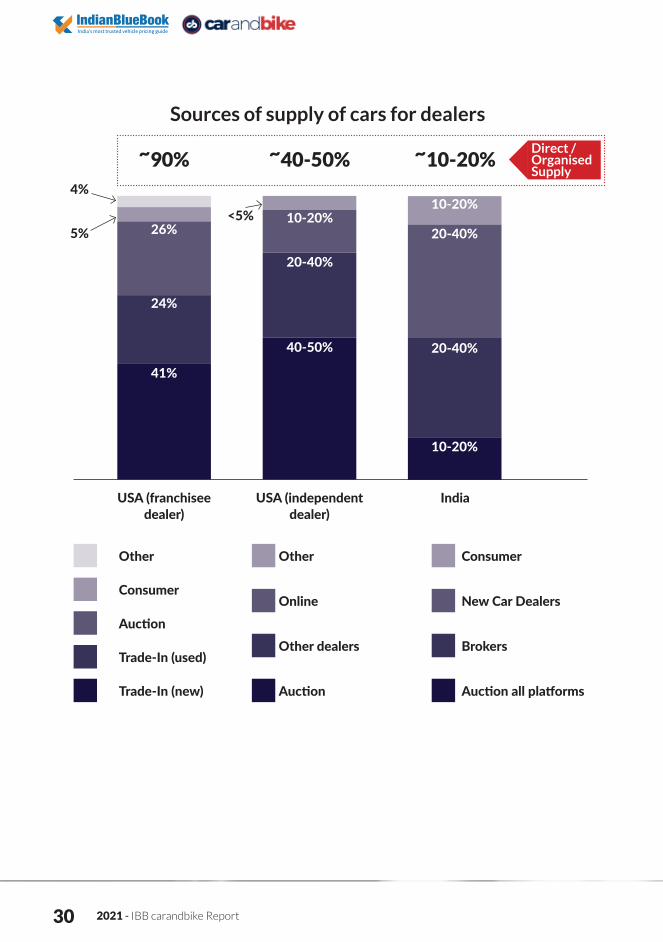
THE SUPPLY SOURCE CONUNDRUM
The new-car industry has a complex relationship with the used-car industry, and is a critical
source of supply via trade-ins from new car dealers.
For franchisee dealers in the USA, about 65% of the supply of used cars happens through the trade-in of new or used cars, and 26% is facilitated by auctions. This amounts to 90% of the entire supply of used cars reaching franchised dealers via an organised supply source. For independent dealers in the USA, about 40-50% of the supply is attributed to auctions, while intra-dealer exchange for inventory accounts for 20-40% of the overall pie.
In India, the supply source is still largely unorganised, with only 10-20% of the entire used-car supply coming through the route of auctions. Brokers comprise 20-40% of the share
to supply used cars to the market while new-car dealers supply 20-40% of the inventory for the used-car market. There is a lot of room to organise the supply route and the share of auctions will continue to increase due to the increased adoption of organised channels by customers looking to sell their vehicles.
STRUCTURAL CHALLENGES IN INDIA✱ Longer replacement cycle for cars at ~4.5 years (US: 3-3.5 yrs) ✱ Very low penetration of leasing & fleet at ~3% of new cars, hence underdeveloped wholesale supply (US: ~42%)✱ Brokers remain a dominant part of the value chain✱ Uncertain inventory quality due to high usage and poor maintenance✱ Inter-state transfer of vehicles difficult; clumsy registration regulations
2021 - IBB carandbike Report 30
Sources of supply of cars for dealers
USA (franchisee dealer)
Trade-In (new) Auction Auction all platforms
Trade-In (used)Other dealers
AuctionBrokers
ConsumerOnline New Car Dealers
Other Other Consumer
USA (independent dealer)
India
~90% ~40-50% ~10-20%
41%
40-50%
10-20%
24%
20-40%
20-40%
26%10-20%<5%
20-40%
10-20%
5%
4%
Direct / Organised Supply
IBB carandbike Report - 2021 31
The complex, fragmented value chain results in a lack of trust & transparency, which impedes the growth of the industry.
The organised players have adopted 4 broad approaches to address the issue of trust and transparency. It must be noted that the industry is still evolving, and the business models are adapting to ongoing changes.
TYPES OF BUSINESS MODELS IN THE USED-CAR INDUSTRY
There are four major types of business models that are currently prevalent in the pre-owned car market around the globe: Classifieds, Services, Procurement and Retail.
CLASSIFIEDS SERVICES PROCUREMENT RETAIL
2021 - IBB carandbike Report 32
CLASSIFIEDS Businesses falling under this category have become critical to bridge the gap between the buyer and seller. They enable direct C2C transactions while also allowing other key users in the industry like dealers to list their inventories on their platforms. This even includes the creation of content, lead generation, and advertising for new cars on their portals. Some of the key players operating under this business model in the international market are CarGurus.com, Cars.com, and Autotrader in the USA & UK. Similar players in the Indian market include OLX, CarDekho, carandbike, Carwale, etc.
SERVICESThe idea of the services business is to ensure the entire process of owning, selling, and buying a used car is made hassle-free by using a suite of tech products and listings to enable the same. The services offered are organised auctions and inspections along with the determination of fair pricing and residual value of the vehicle which the user intends to buy or sell. Players operating under this umbrella also provide digital marketing services for their users in addition to getting the vehicle refurbished and managing the inventory for the user through yard management systems. COX automotive is a major player in the global market that operates under this model, while Mahindra First Choice Wheels and CarTrade are key players in the Indian market.
IBB carandbike Report - 2021 33
PROCUREMENTAnother important cog in the wheel are the companies that focus on solving the procurement issue for dealers to ensure the supply of vehicles in the pre-owned car market. This involves buying used cars from individual customers by ensuring a transparent and convenient point of sale through digital or physical platforms and selling these cars to used-car dealers in the market. They also become a medium of trade financing by bridging the gap between financiers and dealers to help used-car dealers with their working capital requirements. Auto1.com and the Frontier Car Group are some of the major companies which operate under this model. Cars24, OLX Autos, Gaadi and Mahindra First Choice Wheels are some key players in India.
RETAILFor the companies involved in this business model, there is an end-to-end involvement in the entire value chain, which involves procurement of vehicles, carrying out inspection and pricing estimate using analytics, refurbishment of vehicles, and selling the vehicles to the end customer. The core users for this type of model are mainly the end consumers – individual sellers and buyers. Since the end-to-end process is carried out by the company itself, they offer warranty and after-sales service to the customer to ensure higher trust and transparency. Some of the companies under this bracket have a physical-first model like Car Max and AutoNation USA, while the other key players have a digital-first model like Carvana. Spinny operates with this business model in the Indian market.
2021 - IBB carandbike Report 34
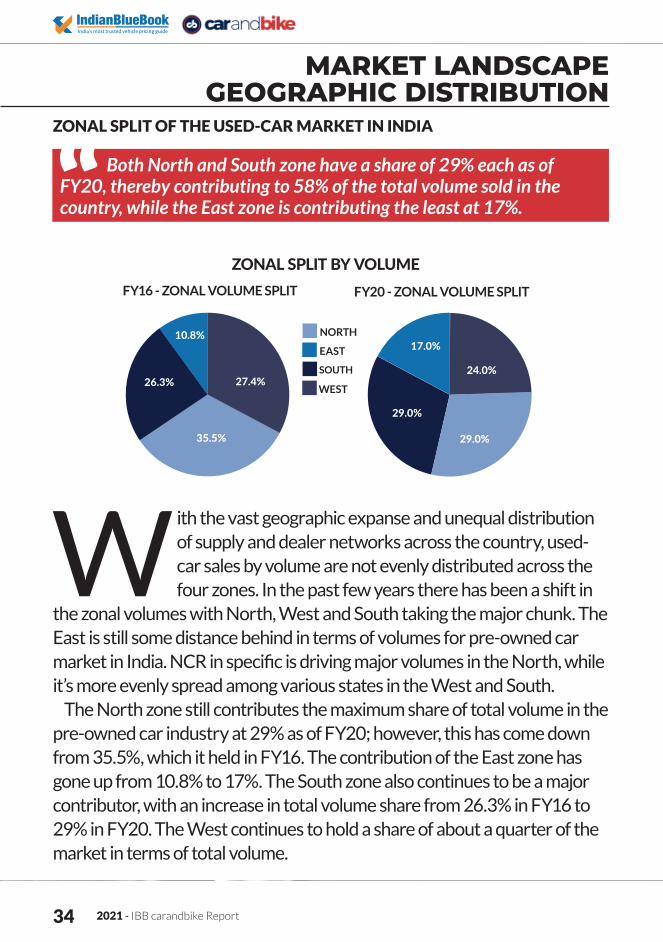
Both North and South zone have a share of 29% each as of FY20, thereby contributing to 58% of the total volume sold in the country, while the East zone is contributing the least at 17%.
MARKET LANDSCAPE GEOGRAPHIC DISTRIBUTION
ZONAL SPLIT OF THE USED-CAR MARKET IN INDIA
With the vast geographic expanse and unequal distribution of supply and dealer networks across the country, used-car sales by volume are not evenly distributed across the four zones. In the past few years there has been a shift in
the zonal volumes with North, West and South taking the major chunk. The East is still some distance behind in terms of volumes for pre-owned car market in India. NCR in specific is driving major volumes in the North, while it’s more evenly spread among various states in the West and South.
The North zone still contributes the maximum share of total volume in the pre-owned car industry at 29% as of FY20; however, this has come down from 35.5%, which it held in FY16. The contribution of the East zone has gone up from 10.8% to 17%. The South zone also continues to be a major contributor, with an increase in total volume share from 26.3% in FY16 to 29% in FY20. The West continues to hold a share of about a quarter of the market in terms of total volume.
ZONAL SPLIT BY VOLUMEFY16 - ZONAL VOLUME SPLIT FY20 - ZONAL VOLUME SPLIT
35.5%
10.8%
26.3% 27.4%
29.0%
17.0%
24.0%
29.0%
NORTH
SOUTH
EAST
WEST

2021 - IBB carandbike Report 35
The top 6 states contribute to 44% of the total volume in the pre-owned car market in the country as of FY20.
STATE-WISE VOLUME CONTRIBUTION IN THE USED-CAR MARKET
Greater than 3 lakhs
Between 2 lakhs and 3 lakhs
Between 2 lakhs and 1 lakh
Lesser than 1 lakh
List of Top 6 states Volume Contribution for FY2020Uttar Pradesh 9%Delhi 8%Maharashtra 8%Tamil Nadu 7%Gujarat 6%Karnataka 6%
METRO V/S NON – METRO SPLIT

IBB carandbike Report - 2021 36
The heartland of the country – Tier 2 and Tier 3 cities – have become critical in driving volumes for the pre-owned car market. The percentage contribution of non-metro areas to the total volumes has increased by 20% between FY17 and FY20.
METRO V/S NON – METRO SPLIT
There has been a major shift in the geographical split of the demand for pre-owned cars. With higher
disposable incomes available and rising aspirations of the coutry’s heartland, non-metros contribute a significantly higher portion to the pie as compared to previous years. Internet adoption and the rise of large online car portals have increased awareness and trust of pre-owned cars among Tier 2 and Tier 3 audience.
In FY17, of the entire pre-owned
car market, 45% of the market volume was concentrated to the metro areas of the city. However, in FY20, their share of contribution has decreased to 25% while the non-metro share has increased from 55% to 75% in the same timeframe. This is due to an increase in the number of used-car dealers in non-metro areas along with easier access to digital platforms to buy a used car. Non-metro cities like Patna, Agra, Guwahati, Ranchi and others have driven demand from the heartland.
FY17 - METRO V/S NON-METRO VOLUMES FY20 - METRO V/S NON-METRO VOLUMES
25%
75%
45%55%
METRO NON-METRO
2021 - IBB carandbike Report 37
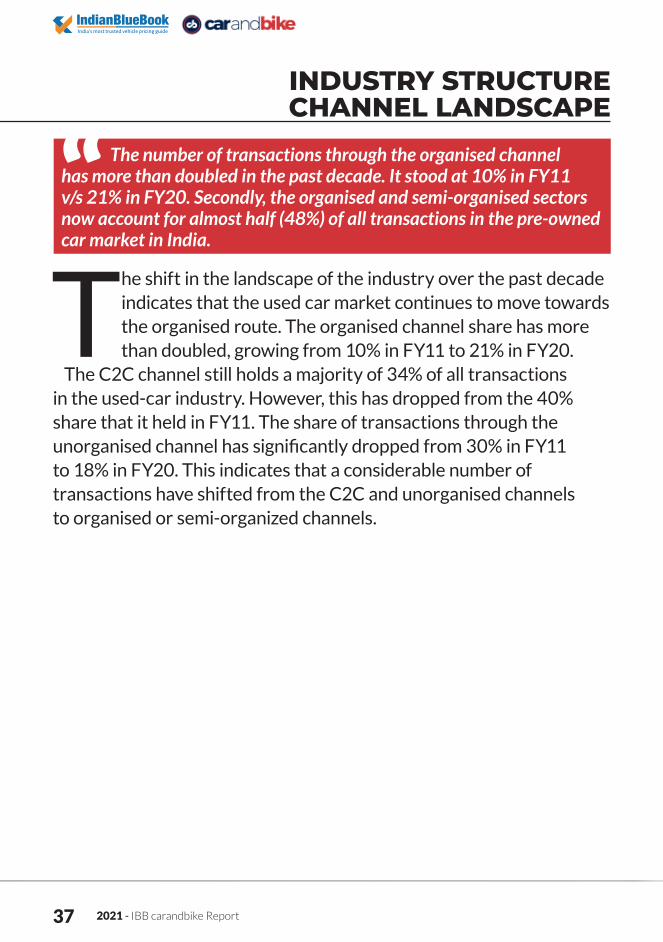
The number of transactions through the organised channel has more than doubled in the past decade. It stood at 10% in FY11 v/s 21% in FY20. Secondly, the organised and semi-organised sectors now account for almost half (48%) of all transactions in the pre-owned car market in India.
INDUSTRY STRUCTURE CHANNEL LANDSCAPE
The shift in the landscape of the industry over the past decade indicates that the used car market continues to move towards the organised route. The organised channel share has more than doubled, growing from 10% in FY11 to 21% in FY20.
The C2C channel still holds a majority of 34% of all transactions in the used-car industry. However, this has dropped from the 40% share that it held in FY11. The share of transactions through the unorganised channel has significantly dropped from 30% in FY11 to 18% in FY20. This indicates that a considerable number of transactions have shifted from the C2C and unorganised channels to organised or semi-organized channels.

IBB carandbike Report - 2021 38
Apart from the increasing share of organised and semi-organised channels in the last decade, they continue to act as critical bridges in enabling transaction closure between C2C platforms and unorganised dealers. With increasing
access to digital listings, and an increasing number of dealerships in the organised and semi-organised channels, the used-car industry is on its way to becoming organised.
CHANNEL SPLIT IN THE USED-CAR INDUSTRY
FY11 - CHANNEL SPLIT FOR TRANSACTIONS FY20 - CHANNEL SPLIT FOR TRANSACTIONS
C2CUNORGANISEDSEMI ORGANISEDORGANISED
10%
40%
30%
20%
21%
18%
27%
34%
2021 - IBB carandbike Report 39
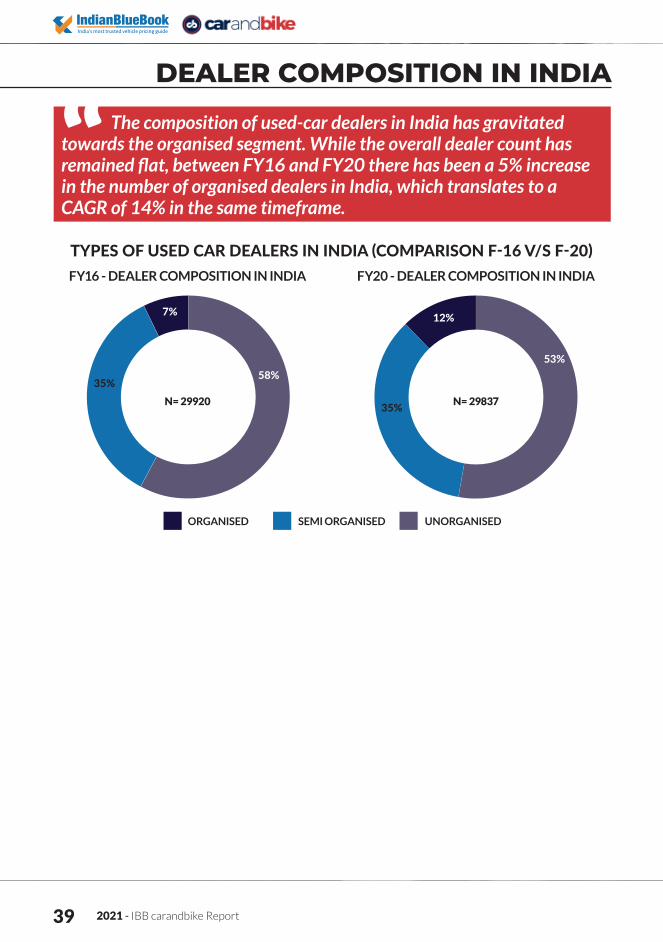
The composition of used-car dealers in India has gravitated towards the organised segment. While the overall dealer count has remained flat, between FY16 and FY20 there has been a 5% increase in the number of organised dealers in India, which translates to a CAGR of 14% in the same timeframe.
DEALER COMPOSITION IN INDIA
FY16 - DEALER COMPOSITION IN INDIA FY20 - DEALER COMPOSITION IN INDIA
TYPES OF USED CAR DEALERS IN INDIA (COMPARISON F-16 V/S F-20)
ORGANISED SEMI ORGANISED UNORGANISED
7%
35%58%
12%
35%
53%
N= 29920 N= 29837
IBB carandbike Report - 2021 40
While the dealer count in India between the years FY16 and FY20
has essentially remained flat, the composition of dealer networks has seen a trend towards the organised dealer channel.
In the year FY16, only 7% of used-car dealers fell under the organised category; in FY20, their share of the pie has increased to 12%. This translates to a CAGR of approximately 14% in the organised dealers count in India over the same timeframe.
A majority of the influx of organised dealers has come from dealers who are upgrading from unorganised or semi-organised channels. Moving ahead, with improving economic conditions and greater demand for used cars in the Indian market, the share of organised dealers in the composition of the dealer network will continue to rise. This shift will be further propelled because of the impact of technology and increased penetration of finance in the used-car industry, giving an extra incentive to dealers to adopt the organised route of operation.
Organised dealers operate out of showrooms akin to those of new car dealers.Semi-organised dealers operate out of a physical place of business such as a garage or mechanic shop.Unorganised dealers are “brokers” or “commission agents” with no physical place of business.
2021 - IBB carandbike Report 41
IMPACT OF DIGITAL
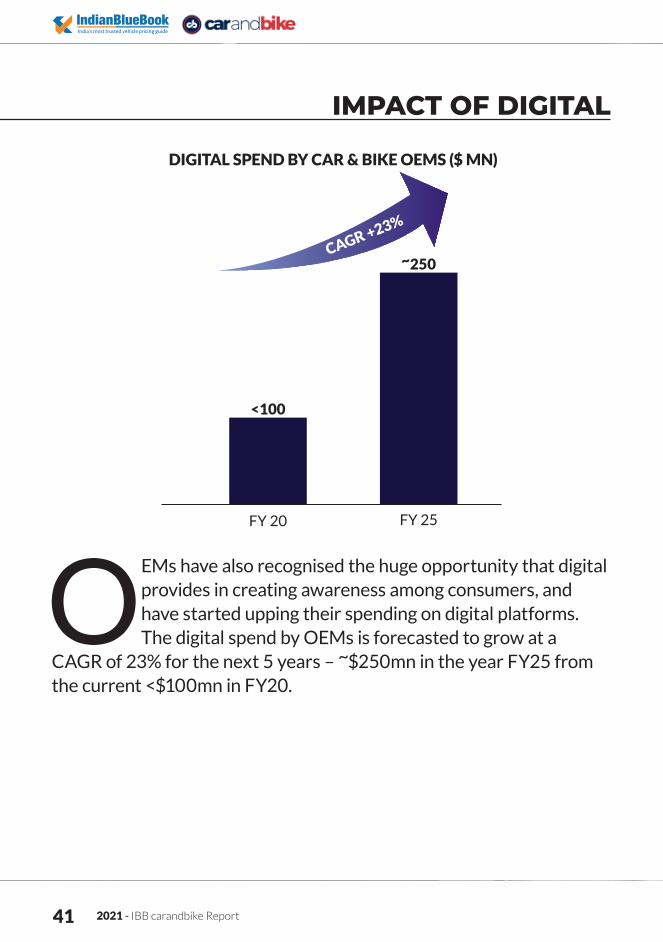
OEMs have also recognised the huge opportunity that digital provides in creating awareness among consumers, and have started upping their spending on digital platforms. The digital spend by OEMs is forecasted to grow at a
CAGR of 23% for the next 5 years – ~$250mn in the year FY25 from the current <$100mn in FY20.
<100
~250
FY 20 FY 25
CAGR +23%
DIGITAL SPEND BY CAR & BIKE OEMS ($ MN)
2021 - IBB carandbike Report 42
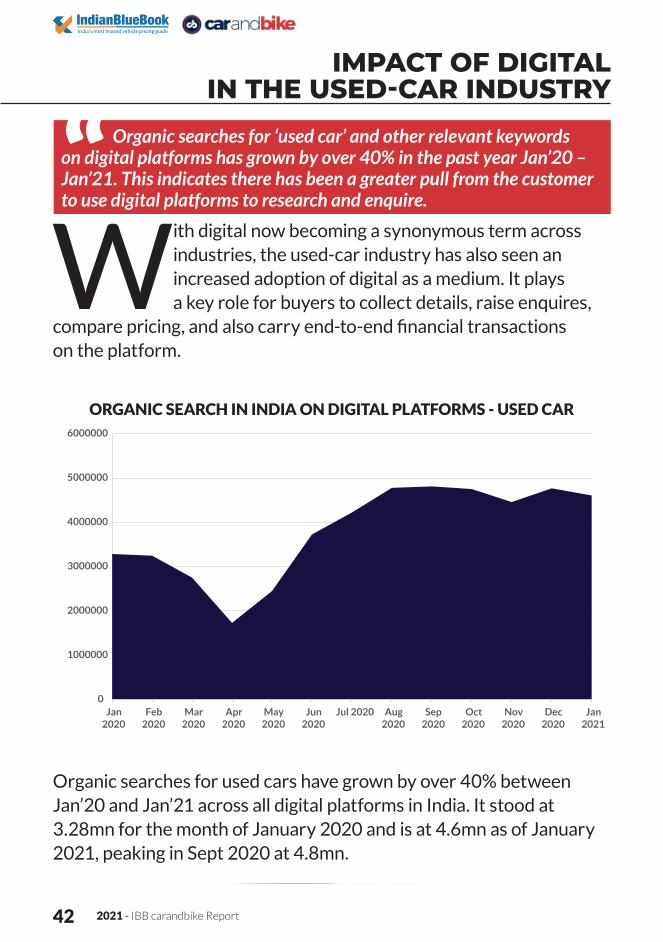
Organic searches for ‘used car’ and other relevant keywords on digital platforms has grown by over 40% in the past year Jan’20 – Jan’21. This indicates there has been a greater pull from the customer to use digital platforms to research and enquire.
IMPACT OF DIGITAL IN THE USED-CAR INDUSTRY
Organic searches for used cars have grown by over 40% between Jan’20 and Jan’21 across all digital platforms in India. It stood at 3.28mn for the month of January 2020 and is at 4.6mn as of January 2021, peaking in Sept 2020 at 4.8mn.
With digital now becoming a synonymous term across industries, the used-car industry has also seen an increased adoption of digital as a medium. It plays a key role for buyers to collect details, raise enquires,
compare pricing, and also carry end-to-end financial transactions on the platform.
0
1000000
2000000
3000000
4000000
5000000
6000000
Jan2020
Feb2020
Mar2020
Apr2020
May2020
Jun2020
Jul 2020 Aug2020
Sep2020
Oct2020
Nov2020
Dec2020
Jan2021
ORGANIC SEARCH IN INDIA ON DIGITAL PLATFORMS - USED CAR
IBB carandbike Report - 2021 43
THE DIGITAL LENS IMPACTTechnology in the used-car industry has benefitted both sides of the coin. From a consumer lens, technology has helped alleviate concerns of trust and transparency associated with buying and selling a used car. On the other side it has also allowed dealers to connect with a higher number of buyers and sellers, thereby increasing inflow and outflow of inventory at a much faster pace with reduced bottlenecks in the process.
THE DEALER PUSHTwo of the biggest challenges that the dealer in the pre-owned car market faces are to identify retail-worthy sources of supply of cars, and to connect with a larger number of buyers to keep the inventory moving.
With the rise in the adoption of a phygital business by dealers, they are able to procure used cars via B2B platforms that conduct bulk auctions of used cars online. This opens them to a wider base of the institutional market from which they can procure required inventory. The B2C digital platforms have increased the number of buyers that the dealer can sell their inventory to via online classifieds and third-party websites, and ensure that there is a quick movement of their inventory and working capital is freed up to acquire more used cars.
An additional benefit of the adoption of technology by dealers is that it will help increase the penetration of retail loans in the industry. With banks/ NBFCs now looking at the digital route of verification like Digital KYC and instant credit check of the customer, processing and disbursements have improved significantly over the last decade. With the dealer having a digital infrastructure in place, bundled services of warranty and insurance along with finance via multiple banks/ NBFCs can be offered to the customer, thereby increasing conversions from enquiry to sale.

2021 - IBB carandbike Report 44
THE CONSUMER PULLFor a consumer, the biggest concern over the years before buying a used car has been issues with trust and transparency in the entire process. Consumers fear being overcharged, being sold a vehicle with pre-existing issues that might not be highlighted at the time of sale by the seller, and also might be unaware if the vehicle is currently involved in legal disputes (theft, unpaid challans and others). Technology has helped address these concerns to a great extent, as it provides higher transparency with respect to the history of the vehicle which involves RC, documentation, and NOC issuance. Also, a multi-point professional inspection of the vehicles by certified engineers ensures it is thoroughly tested and there is a lower probability of breakdown in the future.
The effort of research involved in finding a vehicle is also greatly reduced as digital platforms have become an easier alternative to compare the pricing of different vehicles and explore various options before buying a car. Digital platforms also provide a 360-degree view of the used car along with multiple photos and history of the vehicle which makes it easier for the customer to shortlist vehicles that they intend to buy.
With products of certification of the vehicle and extended warranty now becoming a pre-requisite for dealers in the organised space, this alleviates the biggest issue of lack of trust for the customer during the transaction stage.
Technology will only help the used car market grow and this is not only limited to customers, but has had a major impact in improving the efficiency at the dealer end as well.
We have discussed the impact of financing in the used-car industry in the following section.
IMPACT OF FINANCING IN THE USED-CAR MARKET
IBB carandbike Report - 2021 45
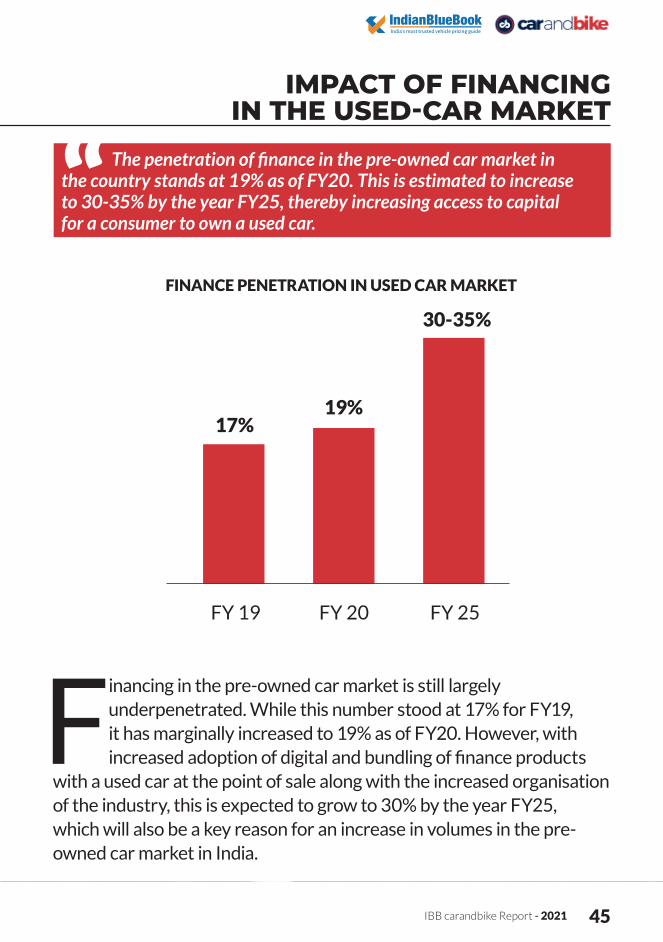
The penetration of finance in the pre-owned car market in the country stands at 19% as of FY20. This is estimated to increase to 30-35% by the year FY25, thereby increasing access to capital for a consumer to own a used car.
IMPACT OF FINANCING IN THE USED-CAR MARKET
Financing in the pre-owned car market is still largely underpenetrated. While this number stood at 17% for FY19, it has marginally increased to 19% as of FY20. However, with increased adoption of digital and bundling of finance products
with a used car at the point of sale along with the increased organisation of the industry, this is expected to grow to 30% by the year FY25, which will also be a key reason for an increase in volumes in the pre-owned car market in India.
FINANCE PENETRATION IN USED CAR MARKET
17%19%
30-35%
FY 20 FY 25FY 19

2021 - IBB carandbike Report 46
EXPERTS VOICE ON FINANCE MARKET
To better understand the used-car market, we have conducted primary research with multiple financiers in the used-car market. Below are some of the key qualitative insights, which capture the current and future trends of used-car
financing in the industry.
OPINION ON MARKET OVERVIEWFinanciers are bullish on the overall outlook of the used-car industry, and almost all of them unanimously feel that the industry has grown steadily over the past few years. This growth can be attributed to the growth of organised and semi-organised sectors. The revision of the GST rate on used cars from 28% to 12 - 18% is also acting as a driver in the market. Additionally, as the Indian auto industry entered BS6 era from April 2020, the value proposition of used cars has grown stronger, as new cars are expected to become more expensive due to additional technology costs. This, coupled with the pollution norms set in cities like Delhi, is likely to have a further positive impact on the used-car market.
IBB carandbike Report - 2021 47
FINANCE PENETRATIONThe current finance penetration in used-car space stands at around 20%; much lower than new-car finance, which is upwards of 75%. But these ratios are expected to change significantly with a lot of car OEMs now shifting focus on used-car trade. Some of the reasons for low finance penetration are:✱ Lack of awareness and option available✱ High interest rates✱ High number of unorganised/ C2C transactions✱ Lengthy and cumbersome paperwork
THE BOTTLENECK - HIGHER FINANCING RATE THAN IN THE NEW-CAR MARKET The financing rate for a used car is almost 300 to 500bps costlier than a new car. This itself acts as a deterrent for many consumers who eventually go for lower-interest options like Personal Loan/ CC Limits et al. Because of a lack of awareness on available options, informal mode of finances also attract higher interest rates, thereby making the deal unviable.

2021 - IBB carandbike Report 48
THE ENABLER - DIGITISATION OF LOAN PRODUCTS FOR USED CARSWhile it is believed that digital is gaining ground for the future business ecosystems most of the financiers do not have an end-to-end digitized product for used cars at this point. Online used-car platforms have given a huge push to the overall growth of the industry, and have facilitated easy buying and selling for a better customer experience. Some of these platforms have also ventured into the finance business. This trend is likely to create new financing model for used-car purchases.
FUTURE OUTLOOK ON FINANCING IN THE USED-CAR MARKET✱ Overall awareness of used-car finance will be enhanced.✱ As the industry matures and more and more organised players operate, finance penetration will also get a push. ✱ More organised financiers will start to provide a pre-approved loan towards purchase of used cars. ✱ Possible creation of a central repository where the financial health data of consumers can be easily sourced. As of now, financers have to rely on bureau data which in most cases tends to be incomplete and takes time to obtain.✱ One positive step appreciated by financiers is Vaahan, via which one can check vehicle details online. This needs to be strengthened further to get all vehicle data; right from age of the car to the number of hands it has changed.
THE INSTITUTIONAL MARKET FOR PRE-OWNED CARS IN INDIA
IBB carandbike Report - 2021 49
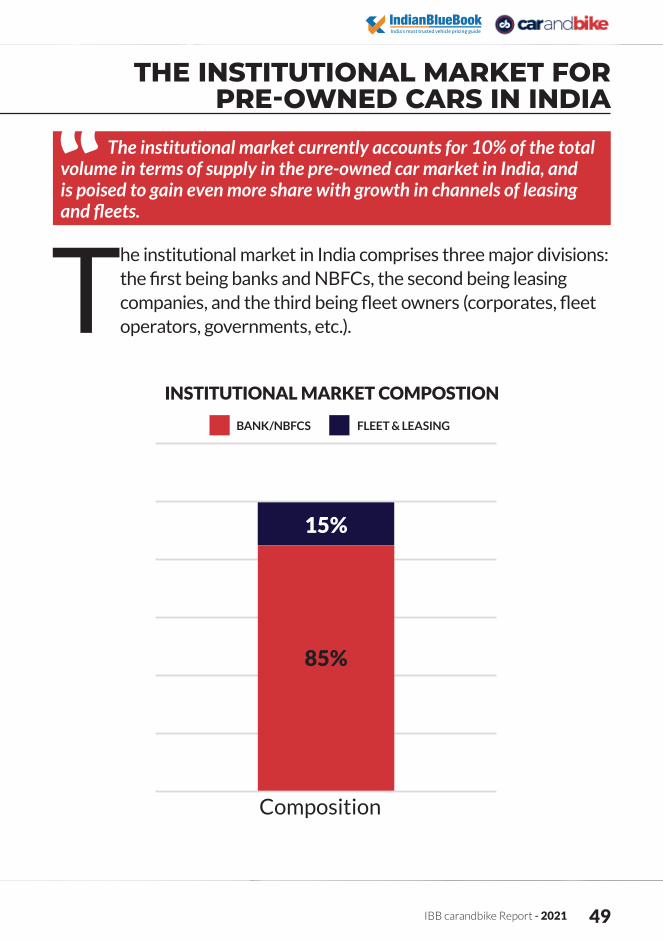
The institutional market currently accounts for 10% of the total volume in terms of supply in the pre-owned car market in India, and is poised to gain even more share with growth in channels of leasing and fleets.
THE INSTITUTIONAL MARKET FOR PRE-OWNED CARS IN INDIA
The institutional market in India comprises three major divisions: the first being banks and NBFCs, the second being leasing companies, and the third being fleet owners (corporates, fleet operators, governments, etc.).
15%
85%
Composition
BANK/NBFCS FLEET & LEASING
INSTITUTIONAL MARKET COMPOSTION

2021 - IBB carandbike Report 50
Much of the institutional market in India is dominated by banks/ NBFCs, which comprise 85% of the market. The remaining 15% of the market is formed by leasing and corporate fleets. The institutional market in India
currently contributes to 10% of the total supply volume of pre-owned cars in India, and the disposal of these vehicles is done through organised and unorganised auctions via the value chain which has been discussed earlier in the report (Section 3). The institutional market is positioned to continue to grow, with an estimated growth rate of 12-14% till FY25. We will be exploring the key drivers in the next section.
KEY DRIVERS OF GROWTH
IBB carandbike Report - 2021 51
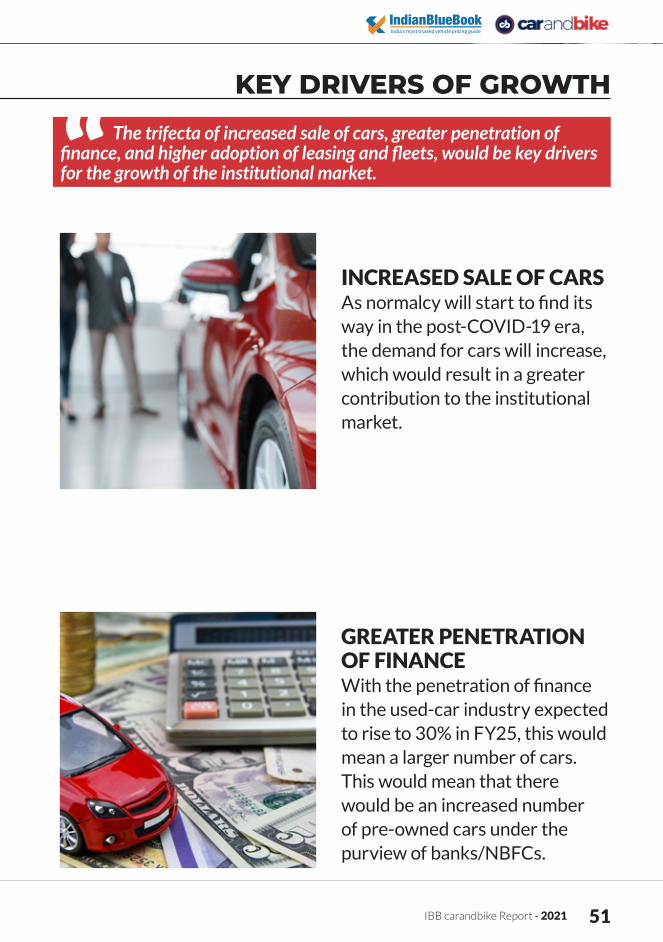
The trifecta of increased sale of cars, greater penetration of finance, and higher adoption of leasing and fleets, would be key drivers for the growth of the institutional market.
KEY DRIVERS OF GROWTH
INCREASED SALE OF CARS As normalcy will start to find its way in the post-COVID-19 era, the demand for cars will increase, which would result in a greater contribution to the institutional market.
GREATER PENETRATION OF FINANCEWith the penetration of finance in the used-car industry expected to rise to 30% in FY25, this would mean a larger number of cars. This would mean that there would be an increased number of pre-owned cars under the purview of banks/NBFCs.
2021 - IBB carandbike Report 52
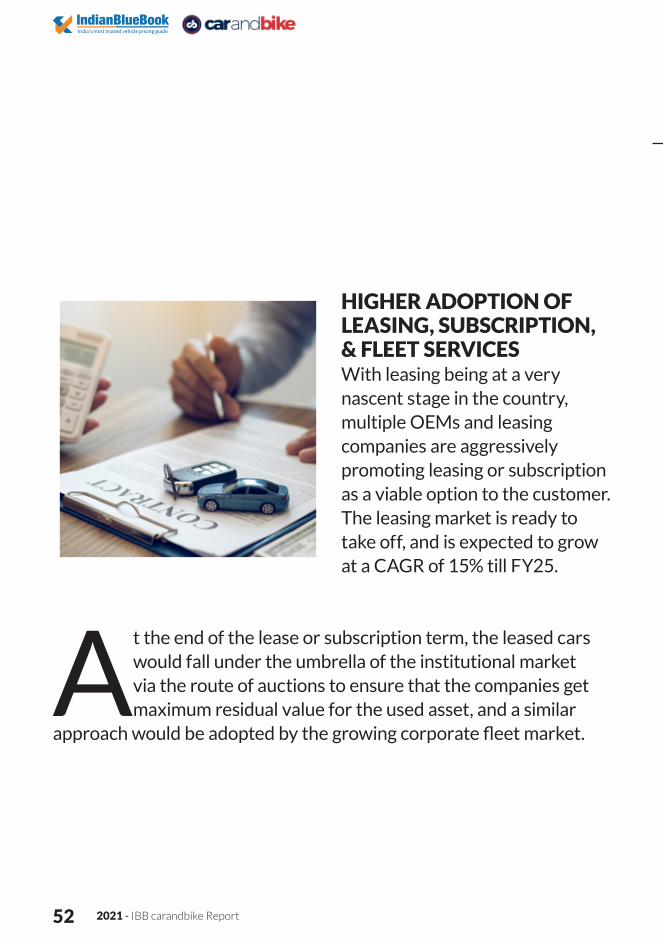
At the end of the lease or subscription term, the leased cars would fall under the umbrella of the institutional market via the route of auctions to ensure that the companies get maximum residual value for the used asset, and a similar
approach would be adopted by the growing corporate fleet market.
HIGHER ADOPTION OF LEASING, SUBSCRIPTION, & FLEET SERVICES With leasing being at a very nascent stage in the country, multiple OEMs and leasing companies are aggressively promoting leasing or subscription as a viable option to the customer. The leasing market is ready to take off, and is expected to grow at a CAGR of 15% till FY25.
SHARE OF ORGANISED V/S UNORGANISED AUCTIONS IN THE INSTITUTIONAL MARKET
IBB carandbike Report - 2021 53
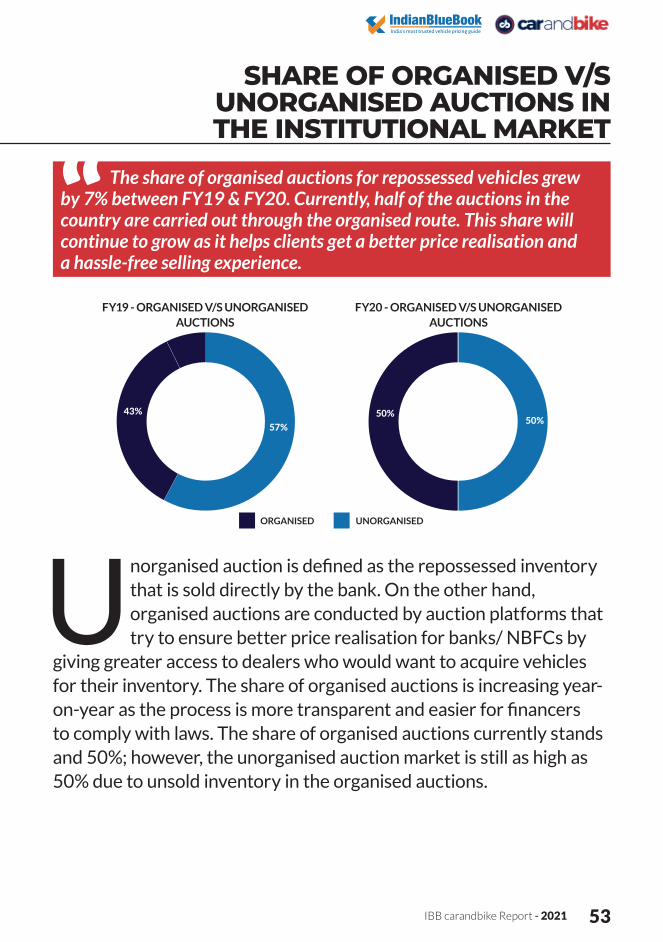
The share of organised auctions for repossessed vehicles grew by 7% between FY19 & FY20. Currently, half of the auctions in the country are carried out through the organised route. This share will continue to grow as it helps clients get a better price realisation and a hassle-free selling experience.
SHARE OF ORGANISED V/S UNORGANISED AUCTIONS IN THE INSTITUTIONAL MARKET
Unorganised auction is defined as the repossessed inventory that is sold directly by the bank. On the other hand, organised auctions are conducted by auction platforms that try to ensure better price realisation for banks/ NBFCs by
giving greater access to dealers who would want to acquire vehicles for their inventory. The share of organised auctions is increasing year-on-year as the process is more transparent and easier for financers to comply with laws. The share of organised auctions currently stands and 50%; however, the unorganised auction market is still as high as 50% due to unsold inventory in the organised auctions.
FY19 - ORGANISED V/S UNORGANISED AUCTIONS
FY20 - ORGANISED V/S UNORGANISED AUCTIONS
ORGANISED UNORGANISED
43%57%
50%50%

2021 - IBB carandbike Report 54
CHAPTER 2
As part of the 2021 IBB carandbike Report, we have conducted first-hand interaction with used-car buyers, sellers, in-market audience and used-car dealers as well, to capture the sentiments of these segments of the industry.
THE VOICE: WHERE THE RUBBER HITS THE ROAD

IBB carandbike Report - 2021 55
THE BUYEREXPANDING HORIZONS OF OPTIONS AND TRUST

2021 - IBB carandbike Report 56
2 out of 3 respondents said that this is the first car in their household, which clearly establishes that a used car acts as a feasible mode of entry for owning a 4-wheeler. These ratios are fairly similar across classes of Tier 1, Tier 2, and Tier 3 cities.
Among consumers who bought hatchbacks, in the case of 76% of respondents it was their first 4-wheeler purchase. This was higher than all other vehicle categories. Buyers who already own a car are in a higher disposable income bracket and have preferred SUVs for their additional car purchase.
THE PRE-OWNED CAR BUYERA large portion of the respondents are first-time car buyers, and
a majority of them have graduated from a two-wheeler. Affordability is the key reason cited for buying a used car. Most people who bought a 4-wheeler for the first time fall in the 7 – 10 lakh income range.
OWNERSHIP & COMMUTING HISTORY
67%
26%
7%
No, Own an additonal car
Owned a car in the past
(n=2200)
Vehicle Ownership History
IBB carandbike Report - 2021 57
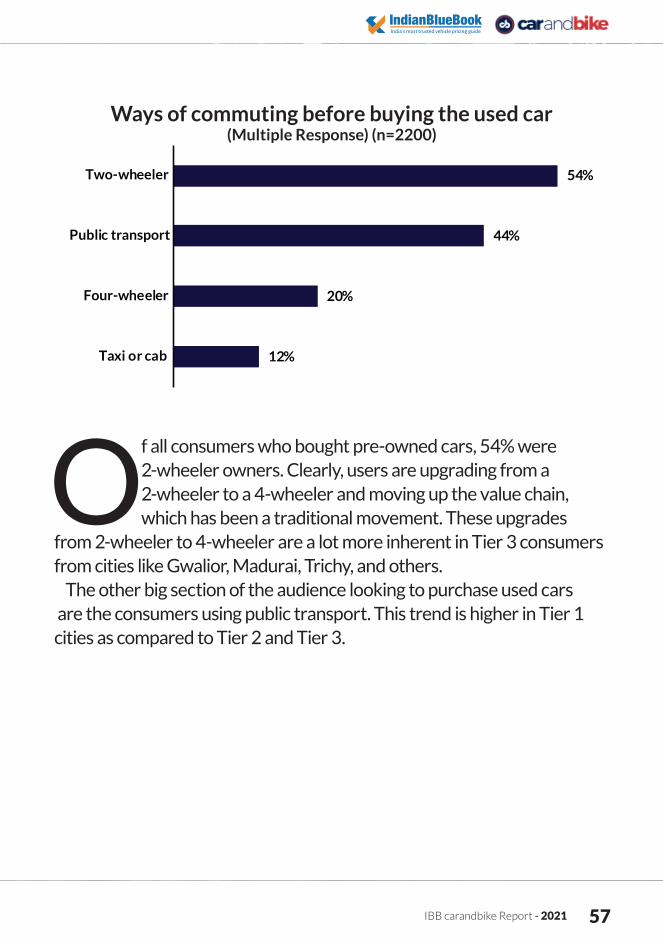
Of all consumers who bought pre-owned cars, 54% were 2-wheeler owners. Clearly, users are upgrading from a 2-wheeler to a 4-wheeler and moving up the value chain, which has been a traditional movement. These upgrades
from 2-wheeler to 4-wheeler are a lot more inherent in Tier 3 consumers from cities like Gwalior, Madurai, Trichy, and others.
The other big section of the audience looking to purchase used cars are the consumers using public transport. This trend is higher in Tier 1 cities as compared to Tier 2 and Tier 3.
Ways of commuting before buying the used car(Multiple Response) (n=2200)
54%
44%
20%
12%
Two-wheeler
Public transport
Four-wheeler
Taxi or cab

2021 - IBB carandbike Report 58
KEY REASONS TO BUY A USED CAR
The key reasons motivators for purchase of a used car are budgetary constraints and the requirement of a 4-wheeler for family commuting needs. Apart from this, 21% of buyers bought a pre-owned vehicle as they aspired to upgrade
from their 2-wheeler. 16% of buyers felt that used cars give them good value for money.
Key Reasons for purchase(Multiple Response) (n=2200)
21%
6%
50%
47%
16%
Upgrade from two-wheeler
Upgrade to better car
Family commuting needs
Budget Constraints
Value for money

IBB carandbike Report - 2021 59
CAR PROFILE
The average age of the vehicle bought currently stands at ~4.5 years. 72% of the cars preferred are less than 5 years of age.
AGE OF THE VEHICLE
Buyers are gravitating towards buying vehicles with lower vehicle age. The number of vehicles bought that are less than 3 years old has increased by 5% between FY19 and FY21 and currently stands at 32%.
Vehicle Age (in years)(n=2200)
27%32%
45%40%
28% 28%
0%
5%
10%
15%
20%
25%
30%
35%
40%
45%
50%
1 to 3 years 4 to 5 years 6 to 8 years
FY19 FY21

2021 - IBB carandbike Report 60
KMS RUN AT THE TIME OF PURCHASE
SEGMENT PROFILE
52% of cars purchased by buyers have run under 40,000 kms at the time of purchase. This number stood at 24% for FY19, signifying that buyers prefer to buy vehicles that haven’t been used extensively
and are in a relatively good condition at the time of purchase. Only 6% of buyers have bought vehicles that had crossed 100,000 kms at the time of purchase.
Over 77% of pre-owned car purchases comprise hatchbacks and sedans. This is
comparable to FY19, where hatchbacks and sedans comprised 75% of the market. SUVs comprise 20% of pre-owned car purchases.
Segment of car purchase
Hatchback Sedan SUV & Others
52%
25%
23%
(n=2200)
Kms run (000s) (n=2200)
FY19 FY21
0%
5%
10%
15%
20%
25%
30%
35%
40%
4%
16%
20%
36%
33%35% 35%
7% 8%6%
<202 0-40 40-707 0-100> 0>10002 07

IBB carandbike Report - 2021 61
Overall, 35% of respondents primarily look at the price of the car, and 32% attach importance to the make/ model of the car, followed by 25% who feel the overall condition of the vehicle is important. About 20% of customers
who bought a vehicle were concerned about accident history and availability of parts for the car model.
Governed by affordability, buyers are steadfast about the budget and make/model, and usually look for options that fall into this set criteria. The key considerations while purchasing a pre-owned car are still the price and the availability of the preferred make and model. This has remained the same across studies in 2009, 2019, and now in 2021, and is likely to remain the same for years to come.
KEY CONSIDERATIONS WHILE PURCHASING A USED CAR
The price of the pre-owned car coupled with the preferred brand still remains the key consideration while purchasing a used car. This is followed by the condition of the car (the exterior/ interior look) and the kilometres driven, which, together, are a function of usage and overall condition of the car at the time of purchase.
Key Considerations for Purchase(Multiple Response) (n=2200)
35%
32%
25%
25%
20%
19%
Price
Brand/model
Overall condition
Odometer reading
Accident history
Availibility of parts
2021 - IBB carandbike Report 62
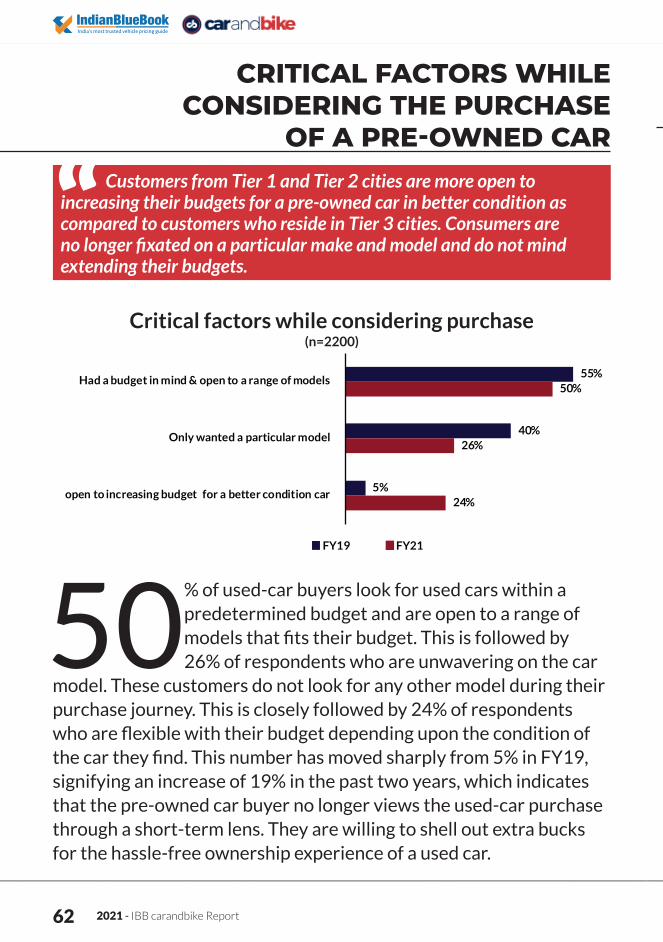
50% of used-car buyers look for used cars within a predetermined budget and are open to a range of models that fits their budget. This is followed by 26% of respondents who are unwavering on the car
model. These customers do not look for any other model during their purchase journey. This is closely followed by 24% of respondents who are flexible with their budget depending upon the condition of the car they find. This number has moved sharply from 5% in FY19, signifying an increase of 19% in the past two years, which indicates that the pre-owned car buyer no longer views the used-car purchase through a short-term lens. They are willing to shell out extra bucks for the hassle-free ownership experience of a used car.
Customers from Tier 1 and Tier 2 cities are more open to increasing their budgets for a pre-owned car in better condition as compared to customers who reside in Tier 3 cities. Consumers are no longer fixated on a particular make and model and do not mind extending their budgets.
CRITICAL FACTORS WHILE CONSIDERING THE PURCHASE
OF A PRE-OWNED CAR
KEY INFLUENCERS TO BUYING DECISION
Critical factors while considering purchase
55%
40%
5%
50%
26%
24%
Had a budget in mind & open to a range of models
Only wanted a particular model
open to increasing budgetf or a better condition car
FY19 FY21
(n=2200)
tf
IBB carandbike Report - 2021 63
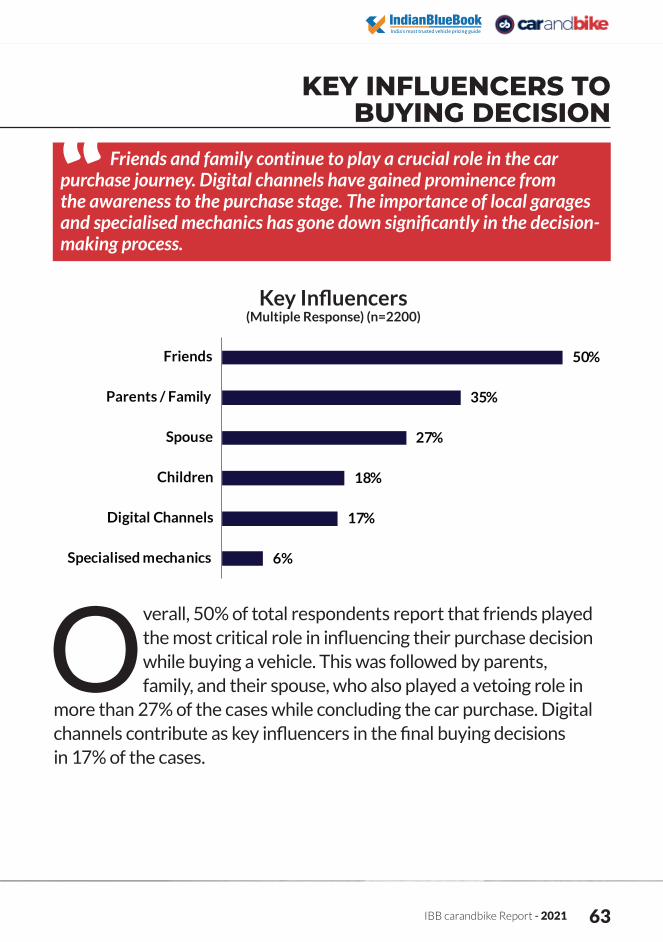
Overall, 50% of total respondents report that friends played the most critical role in influencing their purchase decision while buying a vehicle. This was followed by parents, family, and their spouse, who also played a vetoing role in
more than 27% of the cases while concluding the car purchase. Digital channels contribute as key influencers in the final buying decisions in 17% of the cases.
KEY INFLUENCERS TO BUYING DECISION
Friends and family continue to play a crucial role in the car purchase journey. Digital channels have gained prominence from the awareness to the purchase stage. The importance of local garages and specialised mechanics has gone down significantly in the decision-making process.
Key Influencers(Multiple Response) (n=2200)
50%
35%
27%
18%
17%
6%
Friends
Parents / Family
Spouse
Children
Digital Channels
Specialised mechanics
2021 - IBB carandbike Report 64
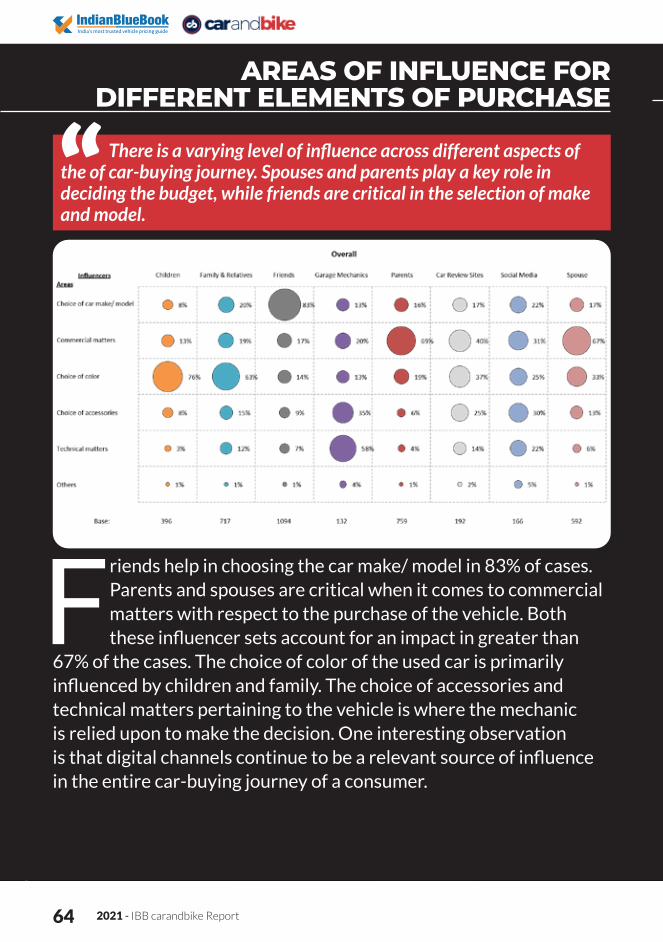
Friends help in choosing the car make/ model in 83% of cases. Parents and spouses are critical when it comes to commercial matters with respect to the purchase of the vehicle. Both these influencer sets account for an impact in greater than
67% of the cases. The choice of color of the used car is primarily influenced by children and family. The choice of accessories and technical matters pertaining to the vehicle is where the mechanic is relied upon to make the decision. One interesting observation is that digital channels continue to be a relevant source of influence in the entire car-buying journey of a consumer.
AREAS OF INFLUENCE FOR DIFFERENT ELEMENTS OF PURCHASE
There is a varying level of influence across different aspects of the of car-buying journey. Spouses and parents play a key role in deciding the budget, while friends are critical in the selection of make and model.
PURCHASE PROCESS ACTIVITIES UNDERTAKEN DURING PURCHASE
IBB carandbike Report - 2021 65
Activities undertaken during purchase process(Multiple Responses)
64%
61%
46%
10%
51%
47%
44%
29%
53%
45%
45%
35%
Had known mechanic examine the vehicle
Had/Friend relative examine the vehicle
Elaborate test drive of the vehicle
Paid an expert to evaluate the vehicle
FY09 FY19 FY21
(n=2200)
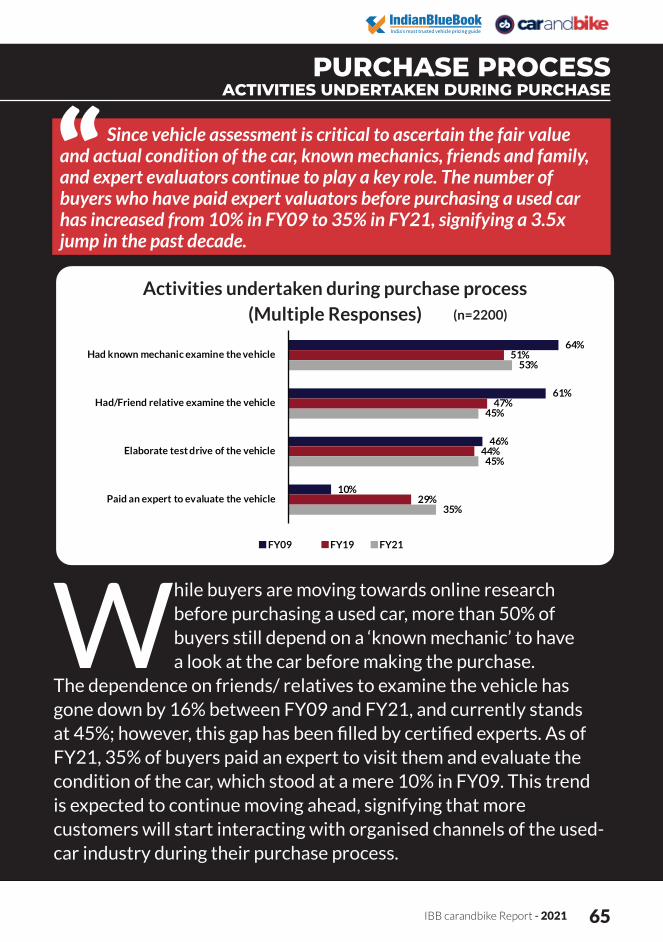
While buyers are moving towards online research before purchasing a used car, more than 50% of buyers still depend on a ‘known mechanic’ to have a look at the car before making the purchase.
The dependence on friends/ relatives to examine the vehicle has gone down by 16% between FY09 and FY21, and currently stands at 45%; however, this gap has been filled by certified experts. As of FY21, 35% of buyers paid an expert to visit them and evaluate the condition of the car, which stood at a mere 10% in FY09. This trend is expected to continue moving ahead, signifying that more customers will start interacting with organised channels of the used-car industry during their purchase process.
PURCHASE PROCESS ACTIVITIES UNDERTAKEN DURING PURCHASE
Since vehicle assessment is critical to ascertain the fair value and actual condition of the car, known mechanics, friends and family, and expert evaluators continue to play a key role. The number of buyers who have paid expert valuators before purchasing a used car has increased from 10% in FY09 to 35% in FY21, signifying a 3.5x jump in the past decade.
2021 - IBB carandbike Report 66
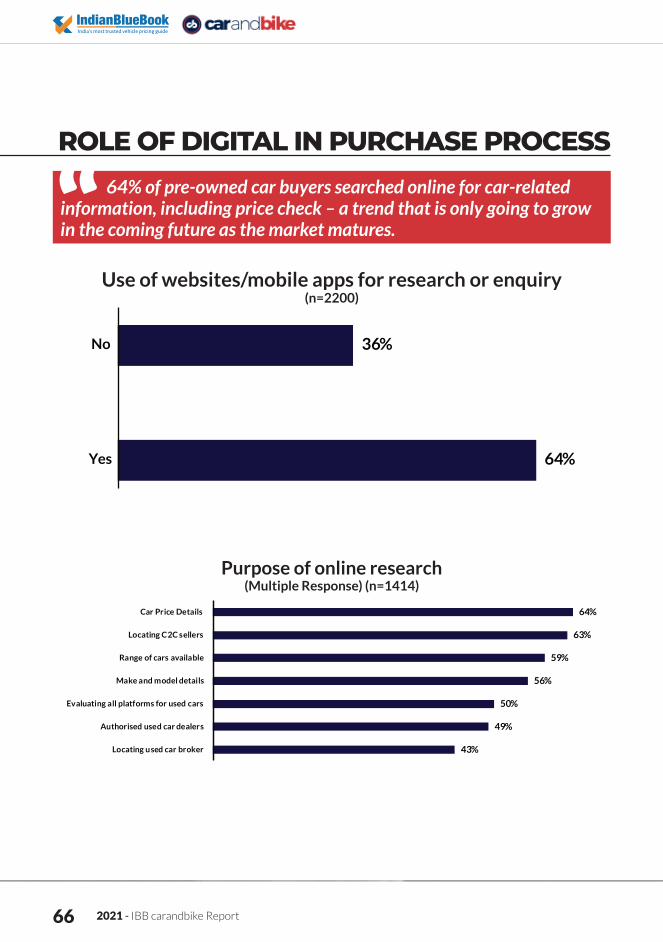
ROLE OF DIGITAL IN PURCHASE PROCESS64% of pre-owned car buyers searched online for car-related
information, including price check – a trend that is only going to grow in the coming future as the market matures.
Use of websites/mobile apps for research or enquiry(n=2200)
Purpose of online research (Multiple Response) (n=1414)
64%
36%
Yes
No
64%
63%
59%
56%
50%
49%
43%
Car Price Details
Locating C2C sellers
Range of cars available
Make and model details
Evaluating all platforms for used cars
Authorised used car dealers
Locating used car broker

IBB carandbike Report - 2021 67
The advent of digital has greatly changed the purchase approach in the pre-owned car industry. While budget and the car’s make/ model continue to be critical parameters for purchase, the customer purchase journey has definitely
changed. 64% of all respondents used digital platforms (websites, apps) for research or inquiry in the entire purchase process.
A majority of buyers from Tier 1 cities used digital platforms for research and enquiry, while this number stood at 28% for buyers from Tier 3 cities.
64% of recent used-car buyers searched online for pre-owned car-related information and to check the price. 63% of buyers used it to locate nearby used-car sellers, thereby indicating how digital has become a bridge to connect buyers and sellers. 59% of buyers also used digital platforms to check different range of cars available for sale. 49% of buyers have used digital platforms to identify authorised used car dealers like Maruti True Value, Mahindra First Choice etc., which indicates that an increased adoption of digital has helped grow the connect between sellers and organised dealers.
2021 - IBB carandbike Report 68
Mode of Payment
53%
22%
13%
12%
Cash
Cheque/Demand draft
Loan/Finance
Partly cash & Partly cheque
(n=2200)
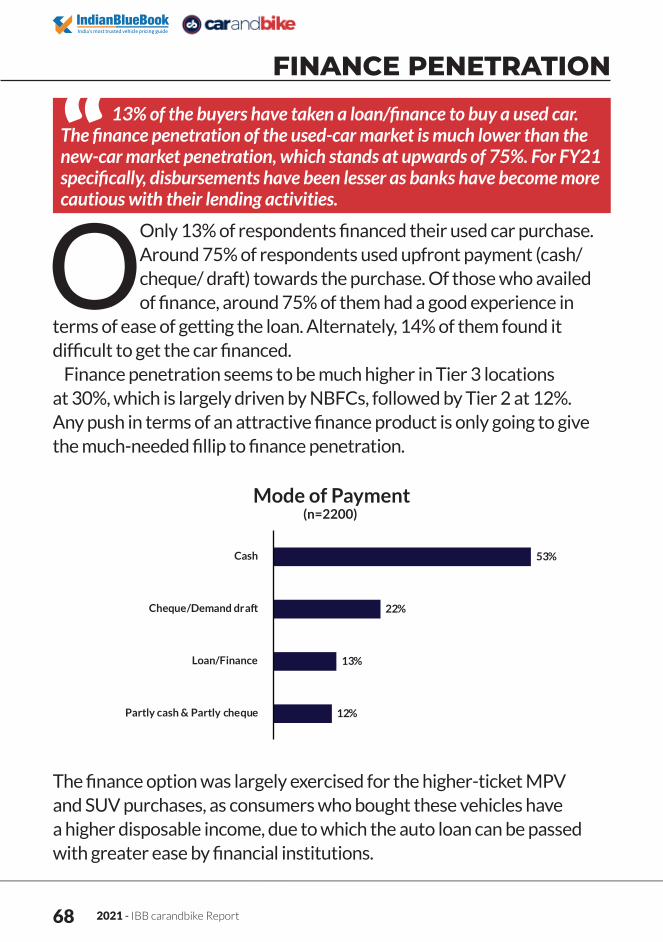
OOnly 13% of respondents financed their used car purchase. Around 75% of respondents used upfront payment (cash/ cheque/ draft) towards the purchase. Of those who availed of finance, around 75% of them had a good experience in
terms of ease of getting the loan. Alternately, 14% of them found it difficult to get the car financed.
Finance penetration seems to be much higher in Tier 3 locations at 30%, which is largely driven by NBFCs, followed by Tier 2 at 12%. Any push in terms of an attractive finance product is only going to give the much-needed fillip to finance penetration.
The finance option was largely exercised for the higher-ticket MPV and SUV purchases, as consumers who bought these vehicles have a higher disposable income, due to which the auto loan can be passed with greater ease by financial institutions.
FINANCE PENETRATION
13% of the buyers have taken a loan/finance to buy a used car. The finance penetration of the used-car market is much lower than the new-car market penetration, which stands at upwards of 75%. For FY21 specifically, disbursements have been lesser as banks have become more cautious with their lending activities.
IBB carandbike Report - 2021 69
Consideration of Car Purchase prior to COVID-19
35%
36%
29%
Yes
Maybe
No
(n=2200)
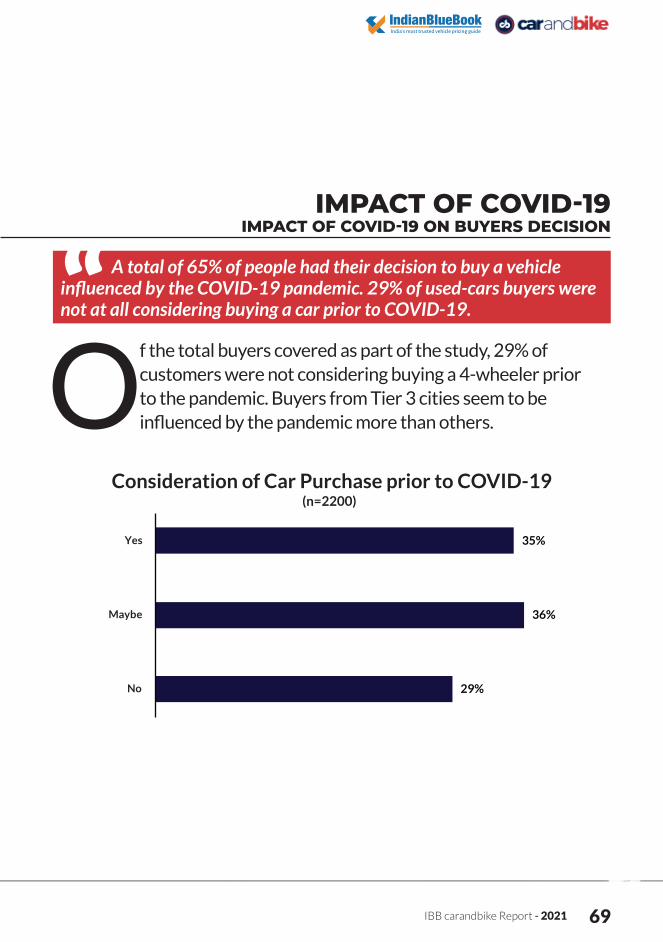
Of the total buyers covered as part of the study, 29% of customers were not considering buying a 4-wheeler prior to the pandemic. Buyers from Tier 3 cities seem to be influenced by the pandemic more than others.
IMPACT OF COVID-19 IMPACT OF COVID-19 ON BUYERS DECISION
A total of 65% of people had their decision to buy a vehicle influenced by the COVID-19 pandemic. 29% of used-cars buyers were not at all considering buying a car prior to COVID-19.
2021 - IBB carandbike Report 70
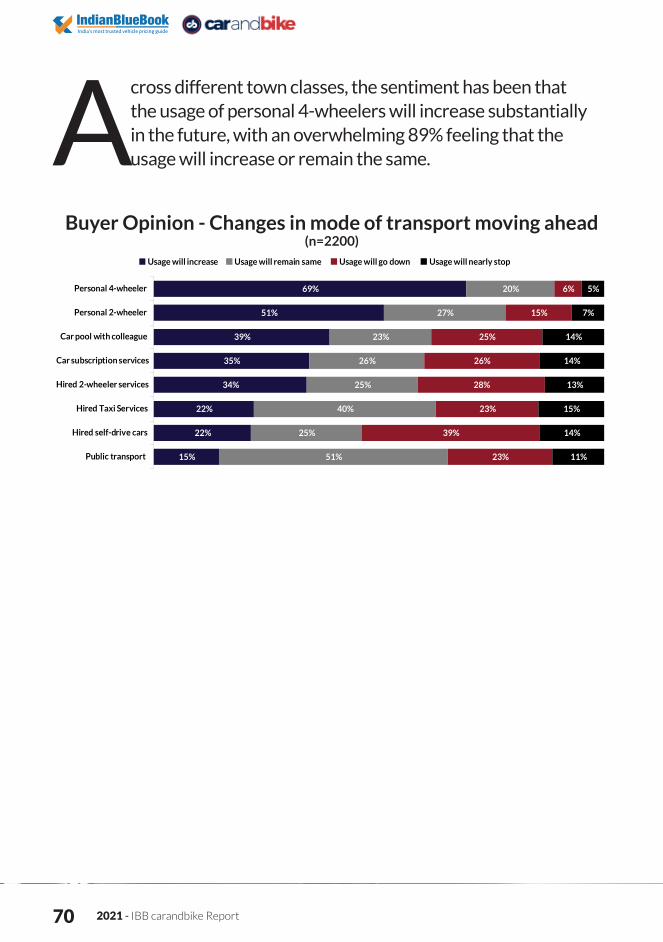
Across different town classes, the sentiment has been that the usage of personal 4-wheelers will increase substantially in the future, with an overwhelming 89% feeling that the usage will increase or remain the same.
Buyer Opinion - Changes in mode of transport moving ahead(n=2200)
69%
51%
39%
35%
34%
22%
22%
15%
20%
27%
23%
26%
25%
40%
25%
51%
6%
15%
25%
26%
28%
23%
39%
23%
5%
7%
14%
14%
13%
15%
14%
11%
Personal 4-wheeler
Personal 2-wheeler
Car pool with colleague
Car subscription services
Hired 2-wheeler services
Hired Taxi Services
Hired self-drive cars
Public transport
Usage will increase Usage will remain same Usage will go down Usage will nearly stop
IBB carandbike Report - 2021 71
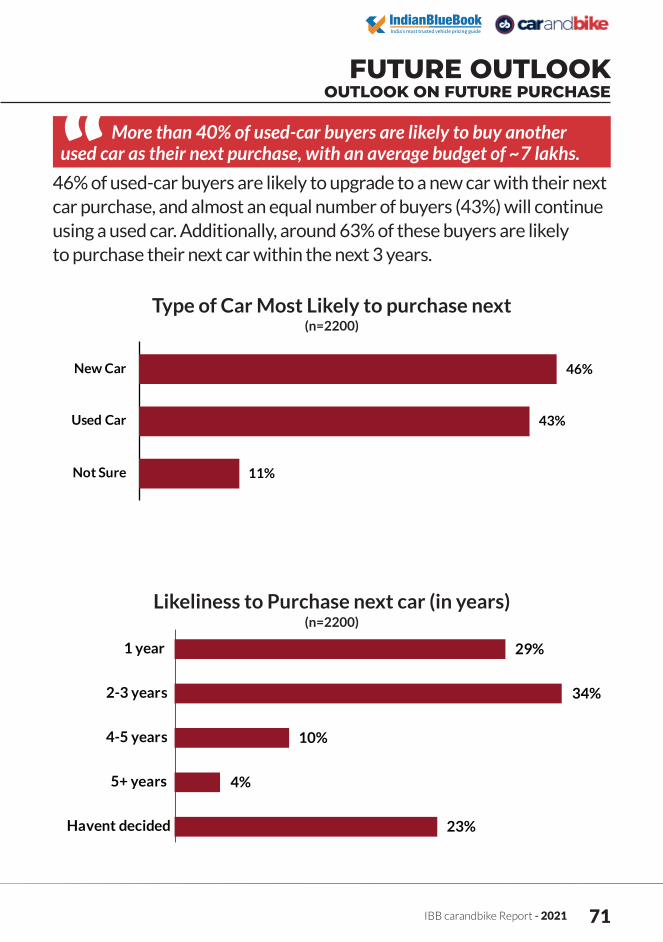
46% of used-car buyers are likely to upgrade to a new car with their next car purchase, and almost an equal number of buyers (43%) will continue using a used car. Additionally, around 63% of these buyers are likely to purchase their next car within the next 3 years.
FUTURE OUTLOOK OUTLOOK ON FUTURE PURCHASE
More than 40% of used-car buyers are likely to buy another used car as their next purchase, with an average budget of ~7 lakhs.
Likeliness to Purchase next car (in years)
Type of Car Most Likely to purchase next
46%New Car
43%Used Car
11%Not Sure
29%1 year
34%2-3 years
10%4-5 years
4%5+ years
23%Havent decided
(n=2200)
(n=2200)
2021 - IBB carandbike Report 72
CONVENIENCE GALORE IN THE CHANGING LANDSCAPETHE SELLER

2021 - IBB carandbike Report 73
CAR PROFILING
Across segments, it was identified that the car aging and problems associated with an old car were the key reasons for selling the vehicle, and stood at 32%. This was followed closely by respondents wanting to upgrade to a new car
at 25% – and this was mostly seen as a priority for sedan owners. Audiences in Tier 1 and Tier 3 cities are generally the ones who make
the most use of their current car, and when they start facing problems with the car due to aging, they sell it. The same pattern is observed among sedan and SUV owners across cities.
However, in Tier 2 towns, the desire to upgrade to a new car has emerged as the most important reason to sell their used car. However, hatchback owners across cities like to upgrade to a new car after a few years of usage.
KEY REASONS TO SELL AND CAR PROFILE
The trigger-points for a car owner to sell are primarily when the car is wearing down and requires ongoing maintenance, or the customer is ready for an upgrade to a new car.
Key reasons for selling the car(n=1909)
32%
25%
11%
10%
9%
7%
6%
Car started giving issues
Upgrade to a new car
Mileage issues
Cost of maintainence
Have an additonal car
Car had depreciated
Change car every few years

IBB carandbike Report - 2021 74
CAR PROFILING
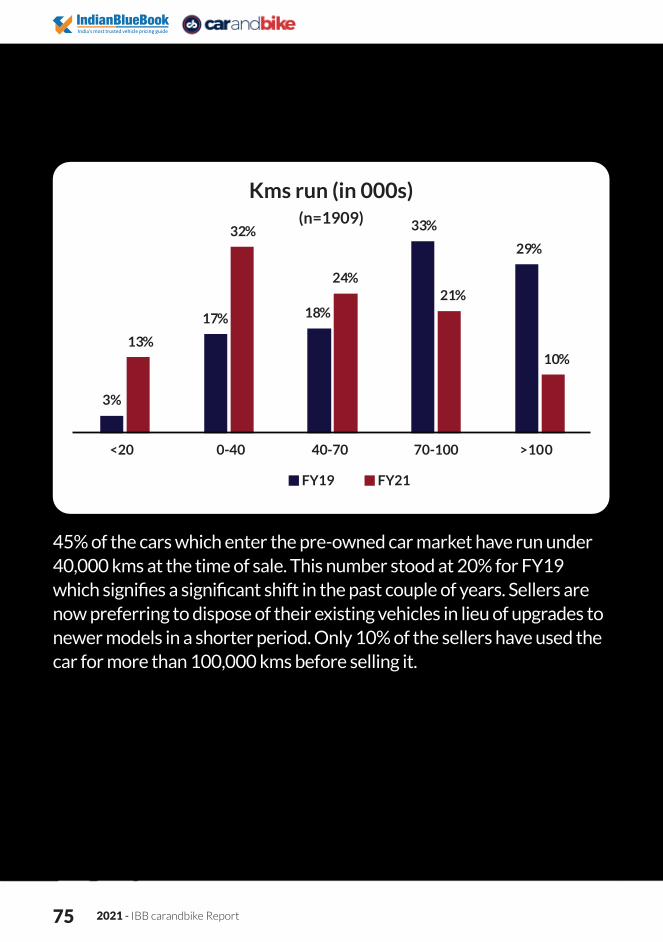
45% of cars that enter the pre-owned car market have run under 40,000 kms at the time of sale. This number stood at 20% for FY19, which signifies a significant shift in the past couple of years. Sellers are now preferring to dispose of their existing vehicles in lieu of upgrades to newer models in a shorter period. Only 10% of sellers have used the car for more than 100,000 kms before selling it.
55% of cars coming into the pre-owned car market are retail worthy (<5 years vehicle age). People are looking to upgrade to newer models at a faster pace due to many new launches and rising aspirations among consumers. This number is expected to grow and would, in turn, drive further demand among buyers.
Vehicle Age (in years)(n=1909)
19%
35%
46%
18%
37%
45%
1 to 3 years 4 to 5 years 6 to 8 years
FY19 FY21
2021 - IBB carandbike Report 75
45% of the cars which enter the pre-owned car market have run under 40,000 kms at the time of sale. This number stood at 20% for FY19 which signifies a significant shift in the past couple of years. Sellers are now preferring to dispose of their existing vehicles in lieu of upgrades to newer models in a shorter period. Only 10% of the sellers have used the car for more than 100,000 kms before selling it.
Kms run (in 000s)(n=1909)
13%
32%
24%21%
10%
3%
17% 18%
33%
29%
<202 0-40 40-707 0-100> 100
FY19 FY21
07 0>
IBB carandbike Report - 2021 76
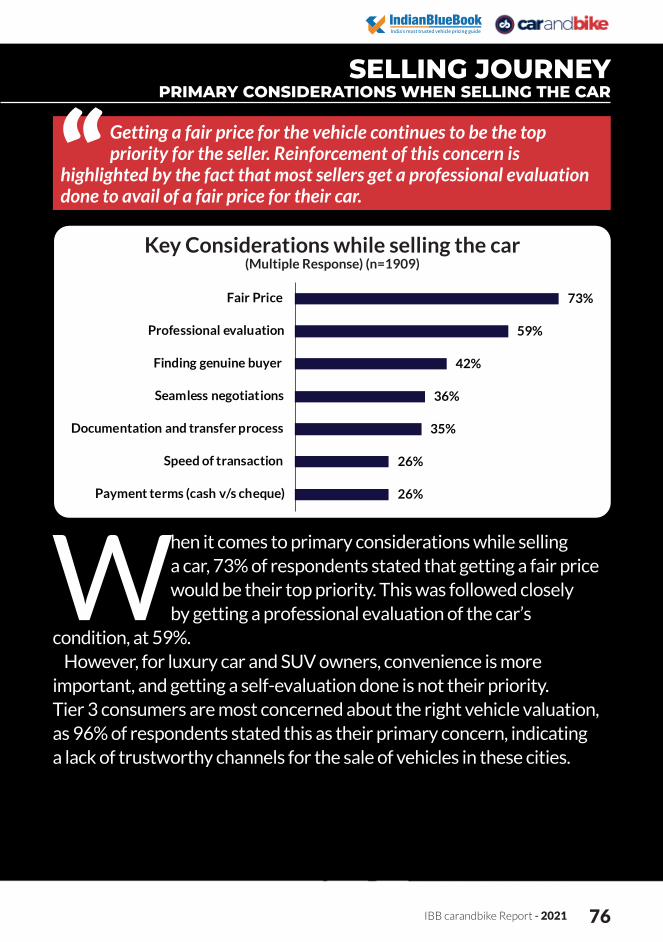
When it comes to primary considerations while selling a car, 73% of respondents stated that getting a fair price would be their top priority. This was followed closely by getting a professional evaluation of the car’s
condition, at 59%.However, for luxury car and SUV owners, convenience is more
important, and getting a self-evaluation done is not their priority. Tier 3 consumers are most concerned about the right vehicle valuation, as 96% of respondents stated this as their primary concern, indicating a lack of trustworthy channels for the sale of vehicles in these cities.
SELLING JOURNEY PRIMARY CONSIDERATIONS WHEN SELLING THE CAR
Getting a fair price for the vehicle continues to be the top priority for the seller. Reinforcement of this concern is
highlighted by the fact that most sellers get a professional evaluation done to avail of a fair price for their car.
Key Considerations while selling the car(Multiple Response) (n=1909)
73%
59%
42%
36%
35%
26%
26%
Fair Price
Professional evaluation
Finding genuine buyer
Seamless negotiations
Documentation and transfer process
Speed of transaction
Payment terms (cash v/s cheque)

2021 - IBB carandbike Report 77
ACTIVITIES CARRIED OUT POST THE DECISION TO SELL THE CAR
Checking with friends and family to buy their car is the first action item undertaken by used car sellers. Digital is still not the go-to platform to sell cars across cities in India.
Activities undertaken upon deciding to sell the car(Multiple Response) (n=1909)
53%
35%
32%
30%
28%
22%
17%
15%
11%
Asked Friends or family
Checked with mechanic/local garage
Visited dealer from where car was purchased
Contacted used car portal
Went to local broker
Visited organised dealer
Price check on internet
IBB carandbike Report - 2021 78
One of the key activities undertaken by the people upon deciding to sell their car involves asking family members and friends if anyone is interested in purchasing it, at 53% of the seller responses, followed by checking with
a mechanic or local garage at 35%. About 15% of respondents went to organised used-car dealers when they decided to sell their car.
When viewed across tier classes, Tier 3 cities would most likely opt to continue asking friends and/ or family if anyone wants to buy their vehicle. This indicates that Tier 3 cities depend highly on unorganised and informal means of vehicular sales. Online listing is dominant in Tier 1 cities, while going back to the same dealer from where the vehicle was originally purchased is the preferred mode in Tier 2 and Tier 3 cities.
Luxury car owners who wanted to sell their cars prefer to contact online used-car portals the most.
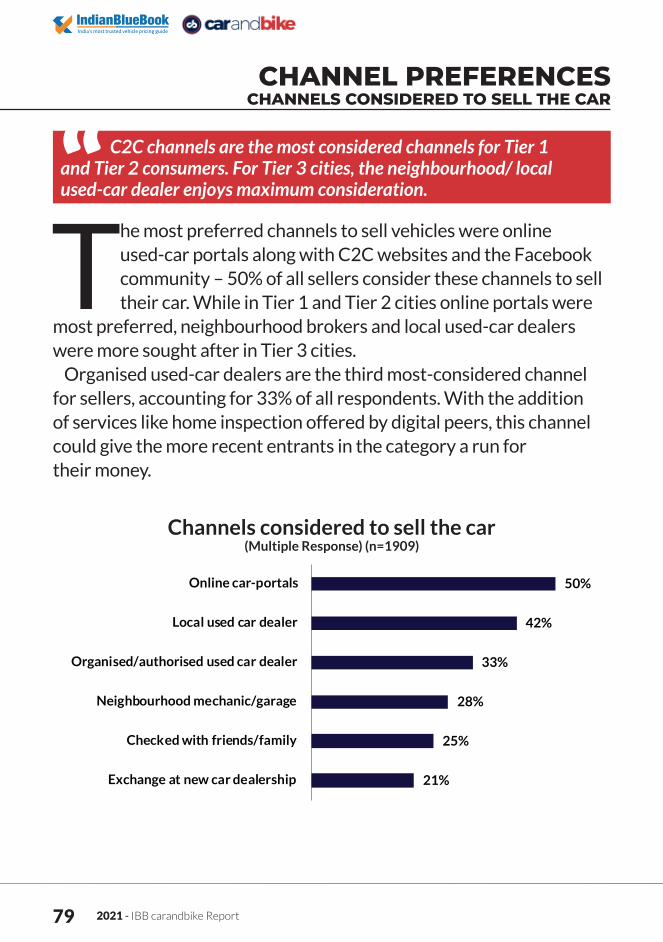
2021 - IBB carandbike Report 79
The most preferred channels to sell vehicles were online used-car portals along with C2C websites and the Facebook community – 50% of all sellers consider these channels to sell their car. While in Tier 1 and Tier 2 cities online portals were
most preferred, neighbourhood brokers and local used-car dealers were more sought after in Tier 3 cities.
Organised used-car dealers are the third most-considered channel for sellers, accounting for 33% of all respondents. With the addition of services like home inspection offered by digital peers, this channel could give the more recent entrants in the category a run for their money.
CHANNEL PREFERENCES CHANNELS CONSIDERED TO SELL THE CAR
C2C channels are the most considered channels for Tier 1 and Tier 2 consumers. For Tier 3 cities, the neighbourhood/ local used-car dealer enjoys maximum consideration.
Channels considered to sell the car(Multiple Response) (n=1909)
50%
42%
33%
28%
25%
21%
Online car-portals
Local used car dealer
Organised/authorised used car dealer
Neighbourhood mechanic/garage
Checked with friends/family
Exchange at new car dealership

IBB carandbike Report - 2021 80
37% of respondents started their used-car selling journey on online portals. The majority of sellers from both Tier 1 and Tier 2 locations used online used-car portals, but in Tier 3 cities, they initiated their car-selling journey mostly with neighborhood or local used-car dealers.
15% of respondents initiated their sale journey via organised used-car channels.
Initial channel used to start sale(n=1909)
37%
24%
15%
10%
10%
5%
Online car-portals
Local used car dealer
Organised used car dealer
Neighbourhood mechanic
Checked with friends/family
Exchange at new car dealership
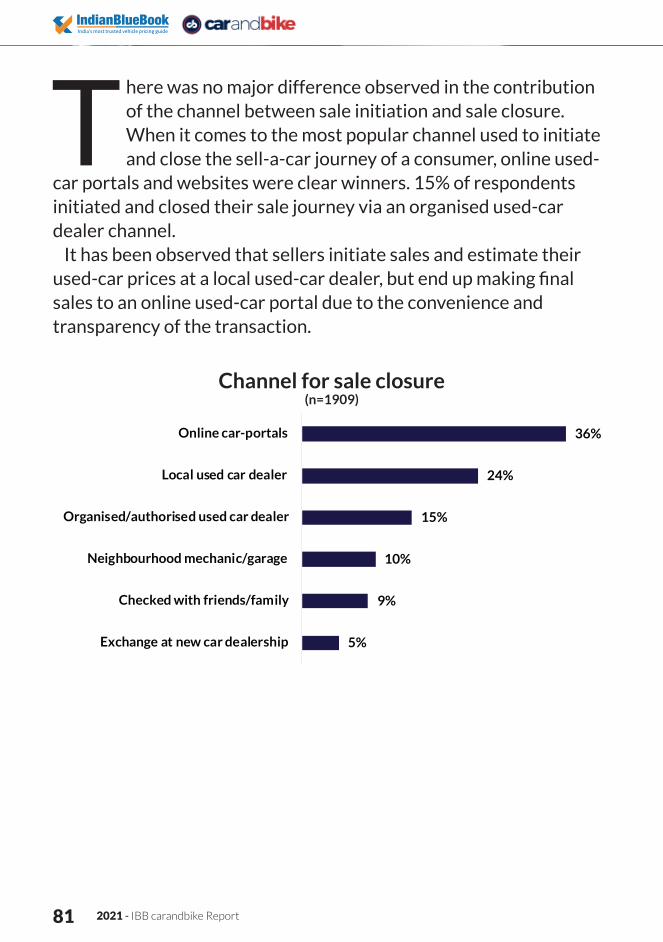
2021 - IBB carandbike Report 81
There was no major difference observed in the contribution of the channel between sale initiation and sale closure.When it comes to the most popular channel used to initiate and close the sell-a-car journey of a consumer, online used-
car portals and websites were clear winners. 15% of respondents initiated and closed their sale journey via an organised used-car dealer channel.
It has been observed that sellers initiate sales and estimate their used-car prices at a local used-car dealer, but end up making final sales to an online used-car portal due to the convenience and transparency of the transaction.
Channel for sale closure(n=1909)
36%
24%
15%
10%
9%
5%
Online car-portals
Local used car dealer
Organised/authorised used car dealer
Neighbourhood mechanic/garage
Checked with friends/family
Exchange at new car dealership
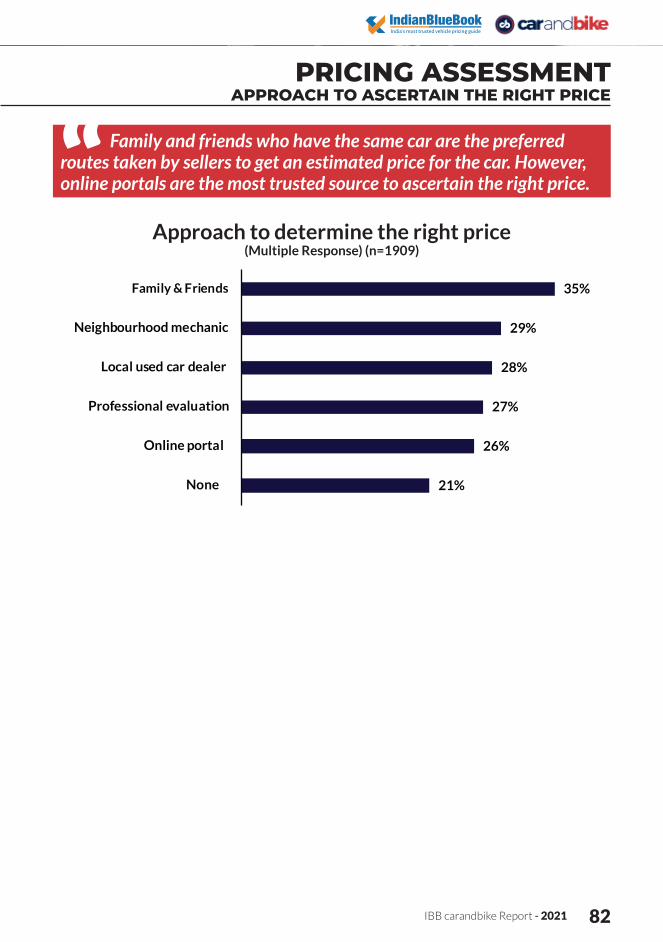
IBB carandbike Report - 2021 82
PRICING ASSESSMENT APPROACH TO ASCERTAIN THE RIGHT PRICE
Family and friends who have the same car are the preferred routes taken by sellers to get an estimated price for the car. However, online portals are the most trusted source to ascertain the right price.
Approach to determine the right price (Multiple Response) (n=1909)
35%
29%
28%
27%
26%
21%
Neighbourhood mechanic
Local used car dealer
Professional evaluation
Online portal
None
Family & Friends

2021 - IBB carandbike Report 83
Multiple channels were utilised by respondents to ascertain the right price for selling their used car. They did not restrict the research to one specific channel. Cross-validation across channels is considered
inherent in this journey, whether it’s approaching family and friends who have the same car, a nearby garage, a local used-car dealer, or getting a professional evaluation of the car.
To ascertain the right price to sell the car, the most popular option was approaching friends or family who own the same car, followed by going to online portals. Luxury car owners preferred online portals the most.
22% of sellers feel that online portals are the most trusted approach to ascertain the right price of the vehicle. 21% sellers believe that none of the current sources can ascertain the right price, which currently represents a gap in the market.
Most trusted approach to determine right price (n=1909)
22%
21%
20%
14%
11%
11%
Online portal
None
Family & Friends
Professional evaluation
Local used car dealer
Neighbourhood mechanic
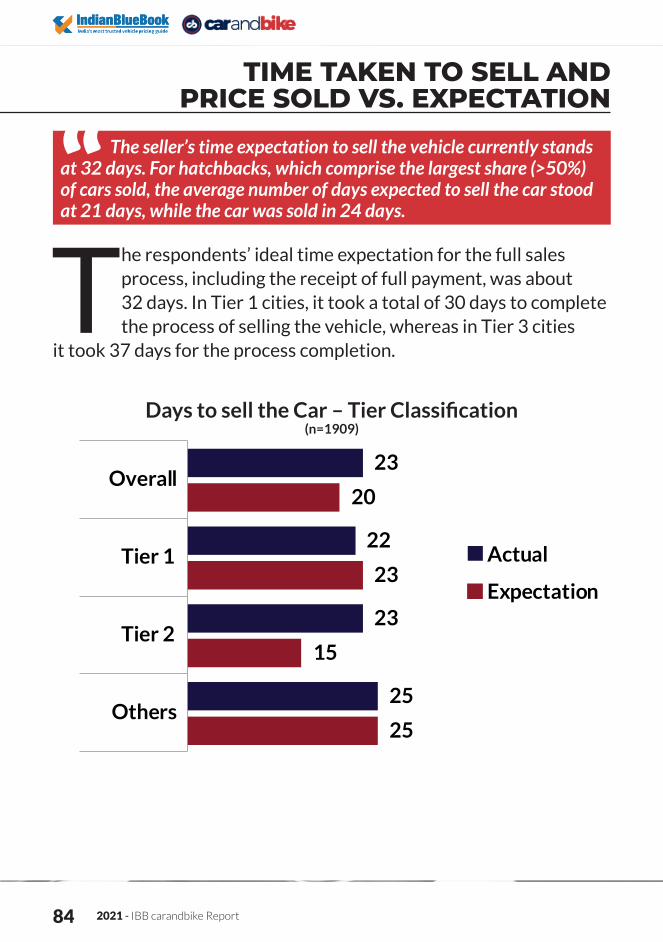
2021 - IBB carandbike Report 84
The seller’s time expectation to sell the vehicle currently stands at 32 days. For hatchbacks, which comprise the largest share (>50%) of cars sold, the average number of days expected to sell the car stood at 21 days, while the car was sold in 24 days.
Days to sell the Car – Tier Classification(n=1909)
23
22
23
25
20
23
15
25
Overall
Tier 1
Tier 2
Others
Actual
Expectation
TIME TAKEN TO SELL AND PRICE SOLD VS. EXPECTATION
The respondents’ ideal time expectation for the full sales process, including the receipt of full payment, was about 32 days. In Tier 1 cities, it took a total of 30 days to complete the process of selling the vehicle, whereas in Tier 3 cities
it took 37 days for the process completion.
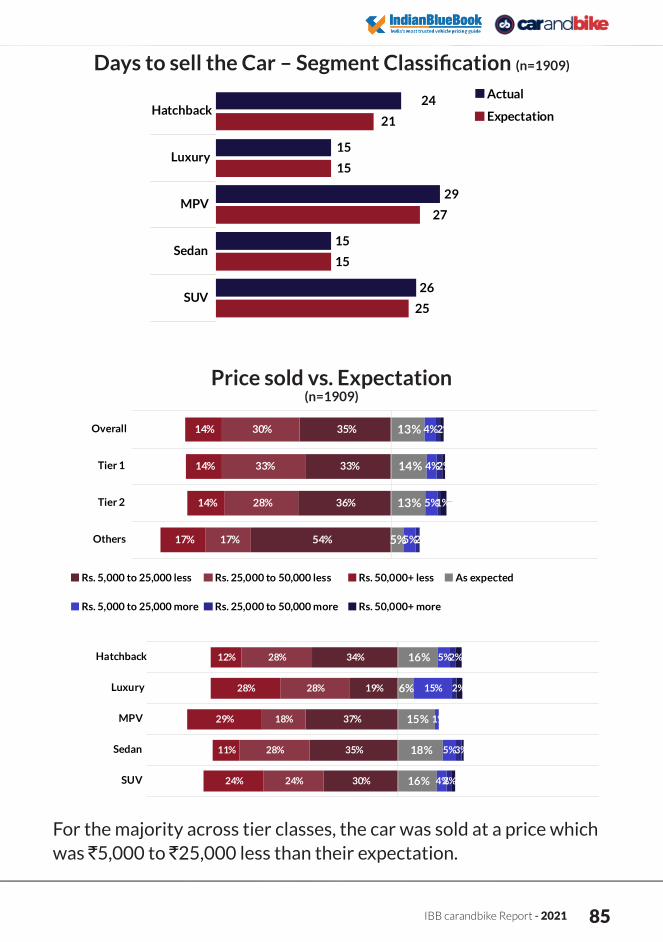
IBB carandbike Report - 2021 85
Days to sell the Car – Segment Classification (n=1909)
24
15
29
15
26
21
15
27
15
25
Hatchback
Luxury
MPV
Sedan
SUV
Actual
Expectation
Price sold vs. Expectation(n=1909)
35%
33%
36%
54%
30%
33%
28%
17%
14%
14%
14%
17%
13%
14%
13%
5%
4%
4%
5%
5%
2%
2%
1%
2%
1%
1%
2%
Overall
Tier 1
Tier 2
Others
Rs. 5,000 to 25,000 less Rs. 25,000 to 50,000 less Rs. 50,000+ less As expected
Rs. 5,000 to 25,000 more Rs. 25,000 to 50,000 more Rs. 50,000+ more
34%
19%
37%
35%
30%
28%
28%
18%
28%
24%
12%
28%
29%
11%
24%
16%
6%
15%
18%
16%
5%
15%
1%
5%
4%
2%
2%
3%
2%
2%
2%
1%
1%
Hatchback
Luxury
MPV
Sedan
SUV
For the majority across tier classes, the car was sold at a price which was `5,000 to `25,000 less than their expectation.
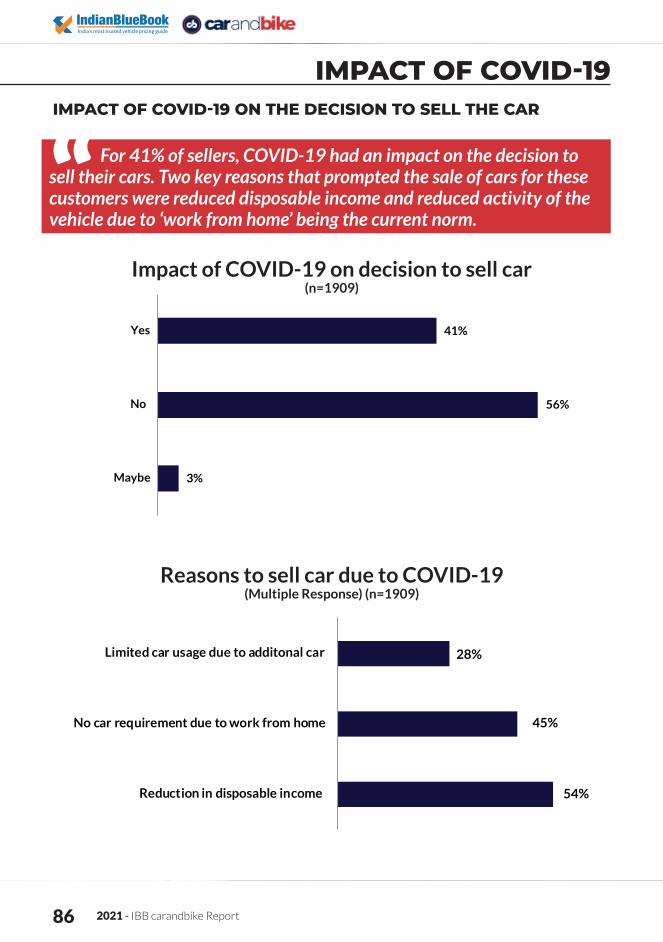
2021 - IBB carandbike Report 86
IMPACT OF COVID-19
For 41% of sellers, COVID-19 had an impact on the decision to sell their cars. Two key reasons that prompted the sale of cars for these customers were reduced disposable income and reduced activity of the vehicle due to ‘work from home’ being the current norm.
Impact of COVID-19 on decision to sell car(n=1909)
41%
56%
3%
Yes
No
Maybe
Reasons to sell car due to COVID-19(Multiple Response) (n=1909)
28%
45%
54%Reduction in disposable income
No car requirement due to work from home
Limited car usage due to additonal car
IMPACT OF COVID-19 ON THE DECISION TO SELL THE CAR

IBB carandbike Report - 2021 87
If we were to assess the impact of COVID-19 on the decision of people to sell their vehicles, it can be seen that the majority did not feel that the pandemic bore a significant impact on their decision, as only 41% of respondents agreed to the question. Upon closer inspection, it was
observed that in Tier 1 locations, the primary reason to sell their car was due to the reduction in disposable incomes. In Tier 2 and “other” towns, the remote working trend took away the need for a vehicle, while some also sold their cars as it was an additional vehicle and its usage was extremely limited.
For sedan owners, work from home had the most significant impact over selling their car as the vehicle was not of use to them any longer. Selling the vehicle due to its inactivity also played a significant role for premium sedan and MPV owners, for whom reduced disposable incomes had an equally strong impact. Of all car segments, the segment which attributed the sales of their car to an additional vehicle the most was MPVs. In pandemic times, sales of vehicles in Tier 2 and Tier 3 cities increased, as people from Tier 1 cities returned to their hometowns with their vehicles and didn’t need an additional vehicle anymore.
IMPACT OF COVID-19 ON THE DECISION TO SELL THE CAR
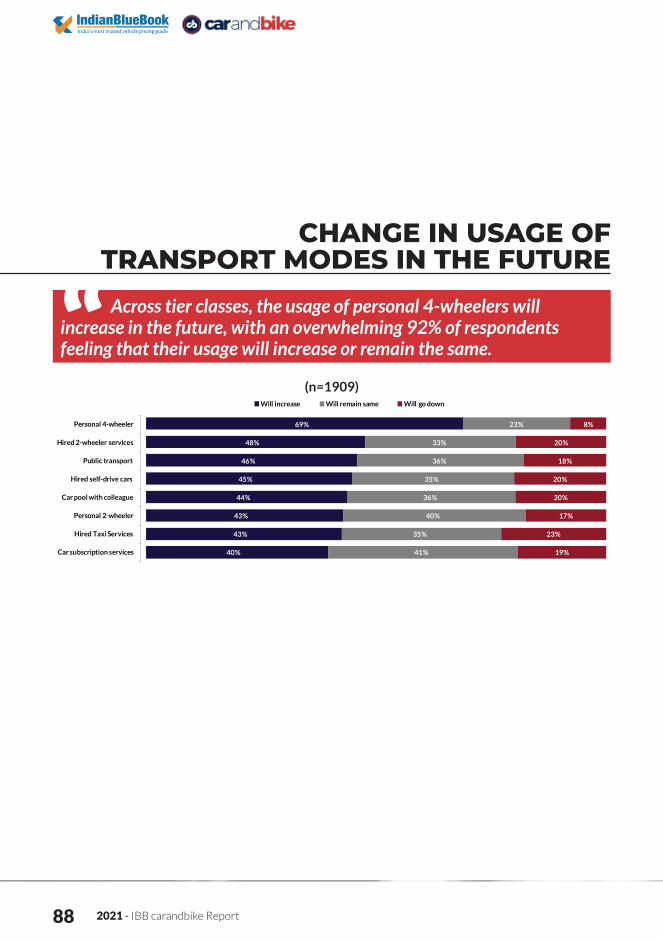
2021 - IBB carandbike Report 88
(n=1909)
69%
48%
46%
45%
44%
43%
43%
40%
23%
33%
36%
35%
36%
40%
35%
41%
8%
20%
18%
20%
20%
17%
23%
19%
Personal 4-wheeler
Hired 2-wheeler services
Public transport
Hired self-drive cars
Car pool with colleague
Personal 2-wheeler
Hired Taxi Services
Car subscription services
Will increase Will remain same W o downaglil
Across tier classes, the usage of personal 4-wheelers will increase in the future, with an overwhelming 92% of respondents feeling that their usage will increase or remain the same.
CHANGE IN USAGE OF TRANSPORT MODES IN THE FUTURE
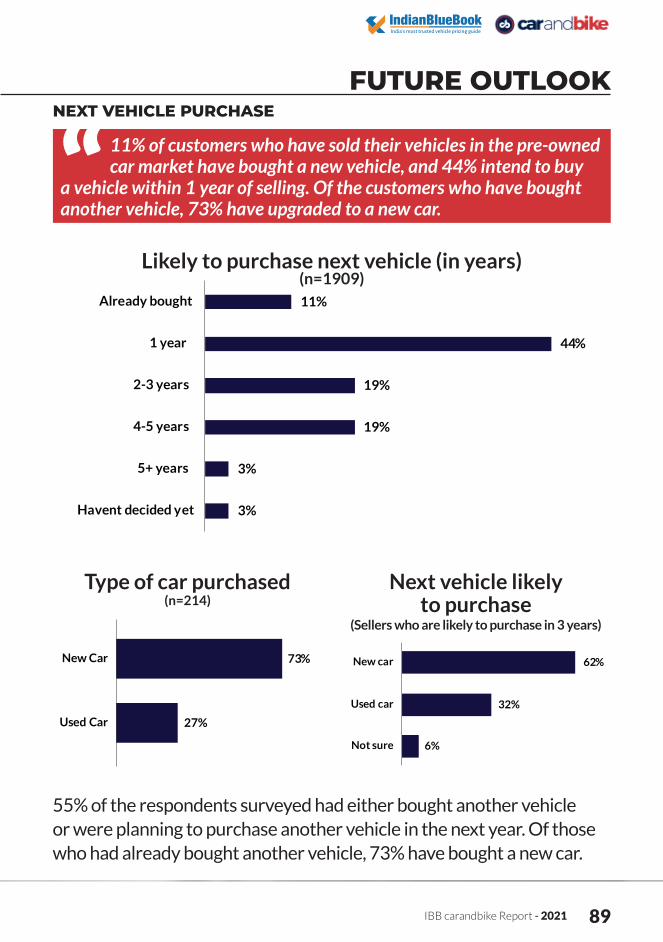
IBB carandbike Report - 2021 89
FUTURE OUTLOOK
11% of customers who have sold their vehicles in the pre-owned car market have bought a new vehicle, and 44% intend to buy
a vehicle within 1 year of selling. Of the customers who have bought another vehicle, 73% have upgraded to a new car.
Likely to purchase next vehicle (in years)(n=1909)
Type of car purchased (n=214)
Next vehicle likely to purchase
(Sellers who are likely to purchase in 3 years)
11%
44%
19%
19%
3%
3%
Already bought
1 year
2-3 years
4-5 years
5+ years
Havent decided yet
62%New car
32%Used car
6%Not sure
73%
27%
New Car
Used Car
NEXT VEHICLE PURCHASE
55% of the respondents surveyed had either bought another vehicle or were planning to purchase another vehicle in the next year. Of those who had already bought another vehicle, 73% have bought a new car.

2021 - IBB carandbike Report 90
For sellers, the intent is to buy a new car, which accounts for a majority of responses at 62%. This is similar across geographies and segments. For Tier 1 cities, the average budget for purchasing the next car is `9.7 lakhs, while for Tier 2 locations
it is `8.05 lakhs, and in Tier 3 cities, it is `6.64 lakhs.
Likely budget for next car(All who have not purchased vehicle yet) (n=1695)
35%
4%
21%
16%
13%
4%
7%
3 lakhs
3 to 5 lakhs
5 to 8 lakhs
8 to 10 lakhs
10 to 15 lakhs
15 to 20 lakhs
20 lakhs & Above
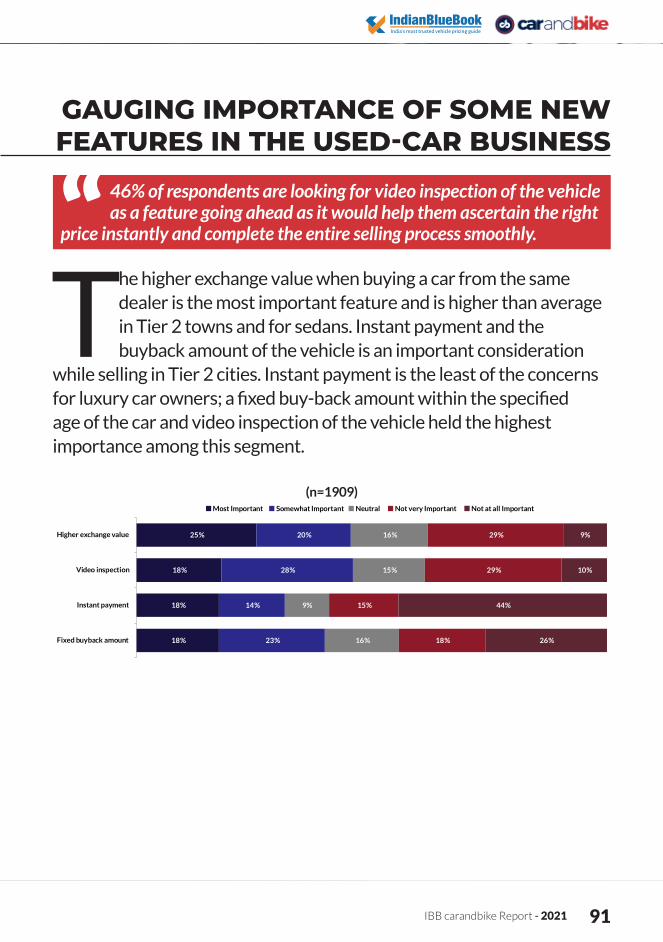
IBB carandbike Report - 2021 91
T he higher exchange value when buying a car from the same dealer is the most important feature and is higher than average in Tier 2 towns and for sedans. Instant payment and the buyback amount of the vehicle is an important consideration
while selling in Tier 2 cities. Instant payment is the least of the concerns for luxury car owners; a fixed buy-back amount within the specified age of the car and video inspection of the vehicle held the highest importance among this segment.
GAUGING IMPORTANCE OF SOME NEW FEATURES IN THE USED-CAR BUSINESS
46% of respondents are looking for video inspection of the vehicle as a feature going ahead as it would help them ascertain the right
price instantly and complete the entire selling process smoothly.
(n=1909)
25%
18%
18%
18%
20%
28%
14%
23%
16%
15%
9%
16%
29%
29%
15%
18%
9%
10%
44%
26%
Higher exchange value
Video inspection
Instant payment
Fixed buyback amount
Most Important Somewhat Important Neutral Not very Important Not at all Important
2021 - IBB carandbike Report 92
PRE-OWNED CAR INTENDERS SHIFTING MINDSETS AND CHANGING PREFERENCES
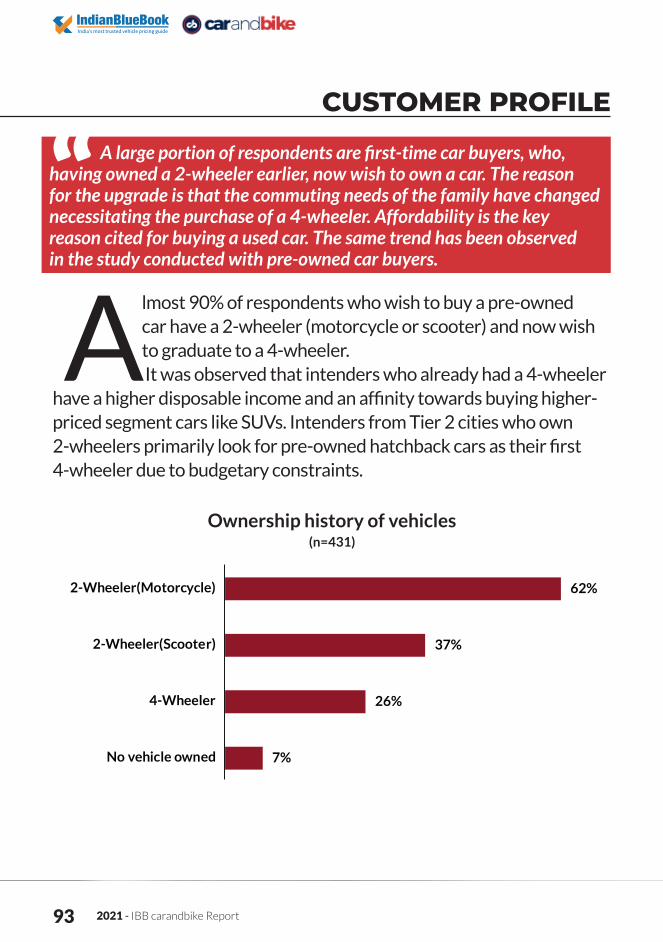
2021 - IBB carandbike Report 93
Almost 90% of respondents who wish to buy a pre-owned car have a 2-wheeler (motorcycle or scooter) and now wish to graduate to a 4-wheeler. It was observed that intenders who already had a 4-wheeler
have a higher disposable income and an affinity towards buying higher-priced segment cars like SUVs. Intenders from Tier 2 cities who own 2-wheelers primarily look for pre-owned hatchback cars as their first 4-wheeler due to budgetary constraints.
CUSTOMER PROFILE
A large portion of respondents are first-time car buyers, who, having owned a 2-wheeler earlier, now wish to own a car. The reason for the upgrade is that the commuting needs of the family have changed necessitating the purchase of a 4-wheeler. Affordability is the key reason cited for buying a used car. The same trend has been observed in the study conducted with pre-owned car buyers.
Ownership history of vehicles
62%2-Wheeler(Motorcycle)
37%2-Wheeler(Scooter)
26%4-Wheeler
7%No vehicle owned
(n=431)
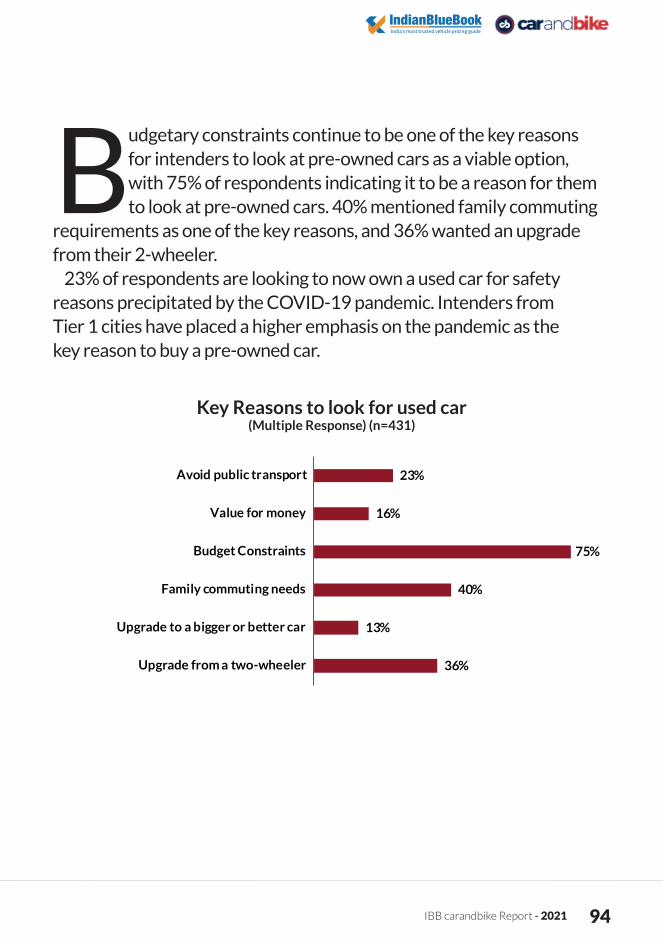
IBB carandbike Report - 2021 94
Budgetary constraints continue to be one of the key reasons for intenders to look at pre-owned cars as a viable option, with 75% of respondents indicating it to be a reason for them to look at pre-owned cars. 40% mentioned family commuting
requirements as one of the key reasons, and 36% wanted an upgrade from their 2-wheeler.
23% of respondents are looking to now own a used car for safety reasons precipitated by the COVID-19 pandemic. Intenders from Tier 1 cities have placed a higher emphasis on the pandemic as the key reason to buy a pre-owned car.
Key Reasons to look for used car(Multiple Response) (n=431)
36%
13%
40%
75%
16%
23%
Upgrade from a two-wheeler
Upgrade to a bigger or better car
Family commuting needs
Budget Constraints
Value for money
Avoid
public transport
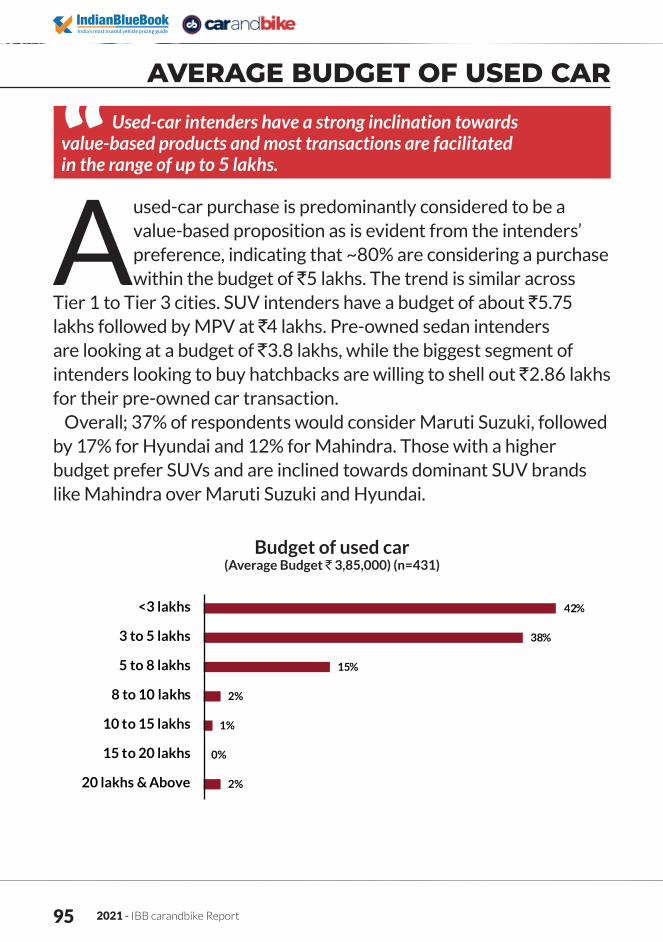
2021 - IBB carandbike Report 95
Budget of used car (Average Budget ` 3,85,000) (n=431)
42%
38%
15%
2%
1%
0%
2%
<3 lakhs
3 to 5 lakhs
5 to 8 lakhs
8 to 10 lakhs
10 to 15 lakhs
15 to 20 lakhs
20 lakhs & Above
Aused-car purchase is predominantly considered to be a value-based proposition as is evident from the intenders’ preference, indicating that ~80% are considering a purchase within the budget of `5 lakhs. The trend is similar across
Tier 1 to Tier 3 cities. SUV intenders have a budget of about `5.75 lakhs followed by MPV at `4 lakhs. Pre-owned sedan intenders are looking at a budget of `3.8 lakhs, while the biggest segment of intenders looking to buy hatchbacks are willing to shell out `2.86 lakhs for their pre-owned car transaction.
Overall; 37% of respondents would consider Maruti Suzuki, followed by 17% for Hyundai and 12% for Mahindra. Those with a higher budget prefer SUVs and are inclined towards dominant SUV brands like Mahindra over Maruti Suzuki and Hyundai.
Used-car intenders have a strong inclination towards value-based products and most transactions are facilitated in the range of up to 5 lakhs.
AVERAGE BUDGET OF USED CAR

IBB carandbike Report - 2021 96
Intenders from Tier 1 cities place a higher preference on the certification of the vehicle, while intenders in Tier 2 cities have more of an affinity towards cars of a particular brand/ model.
Key Reasons while purchase consideration(Multiple Response) (n=431)
44%
40%
34%
21%
21%
20%
19%
Overall condition
Price
Brand / Model
Documentation
Odometer reading
Number of ownership transfers
The three most important considerations for purchasing a pre-owned car remain the same across buyers and intenders: the overall condition of the car, the price, and the brand/ model of the car. This is in sync with the key considerations found in the pre-owned car buyer study.
PURCHASE CONSIDERATIONS
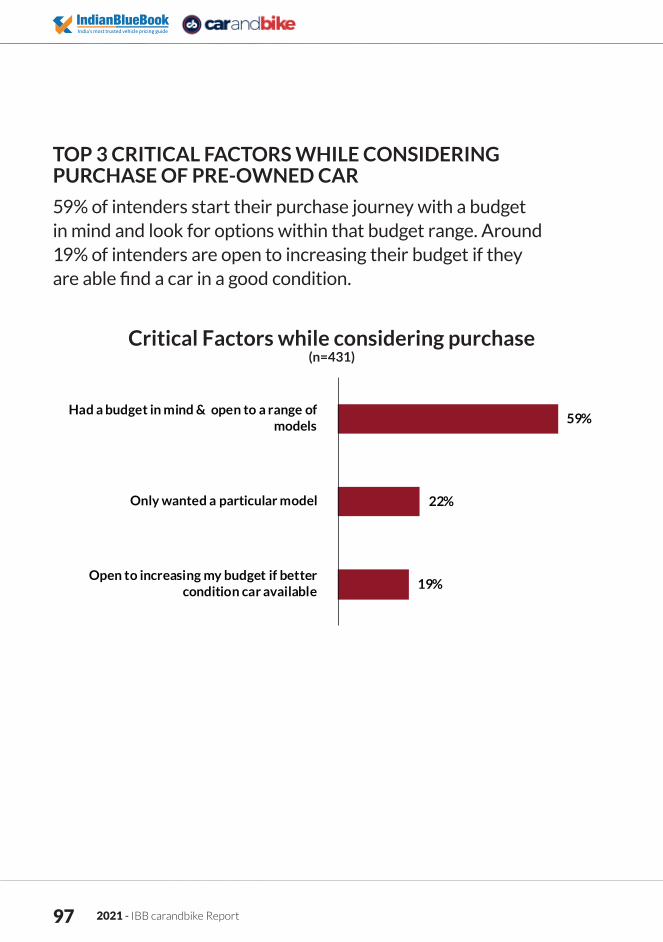
2021 - IBB carandbike Report 97
59% of intenders start their purchase journey with a budget in mind and look for options within that budget range. Around 19% of intenders are open to increasing their budget if they are able find a car in a good condition.
Critical Factors while considering purchase(n=431)
59%
22%
19%
Had a budget in mind & open to a range ofmodels
Only wanted a particular model
Open to increasing my budget if bettercondition car available
TOP 3 CRITICAL FACTORS WHILE CONSIDERING PURCHASE OF PRE-OWNED CAR
CHANNEL PREFERENCE
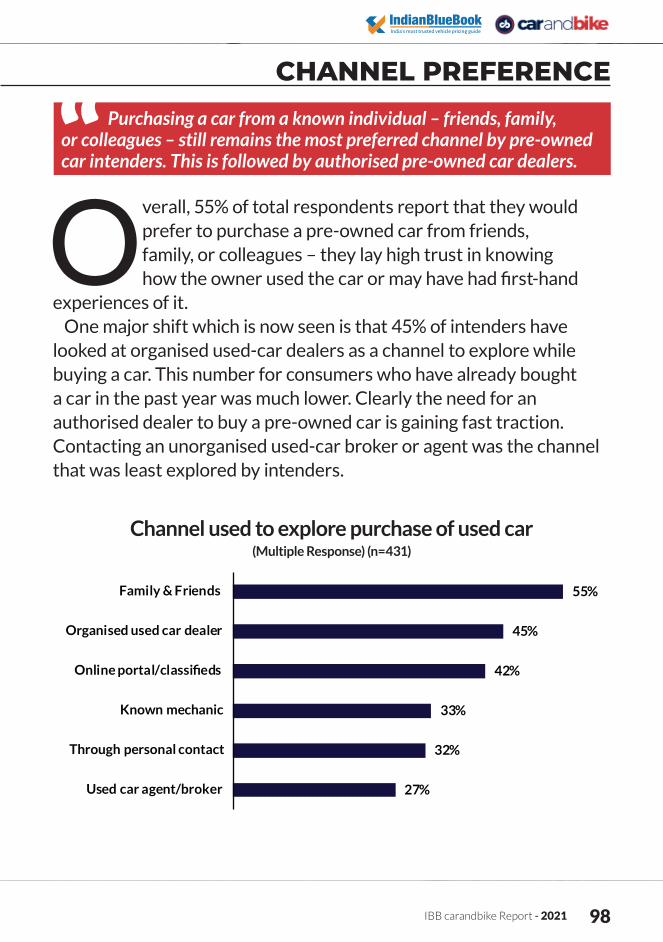
IBB carandbike Report - 2021 98
Purchasing a car from a known individual – friends, family, or colleagues – still remains the most preferred channel by pre-owned car intenders. This is followed by authorised pre-owned car dealers.
CHANNEL PREFERENCE
Overall, 55% of total respondents report that they would prefer to purchase a pre-owned car from friends, family, or colleagues – they lay high trust in knowing how the owner used the car or may have had first-hand
experiences of it. One major shift which is now seen is that 45% of intenders have
looked at organised used-car dealers as a channel to explore while buying a car. This number for consumers who have already bought a car in the past year was much lower. Clearly the need for an authorised dealer to buy a pre-owned car is gaining fast traction. Contacting an unorganised used-car broker or agent was the channel that was least explored by intenders.
Channel used to explore purchase of used car(Multiple Response) (n=431)
55%
45%
42%
33%
32%
27%
Family & Friends
Organised used car dealer
Known mechanic
Through personal contact
Used car agent/broker
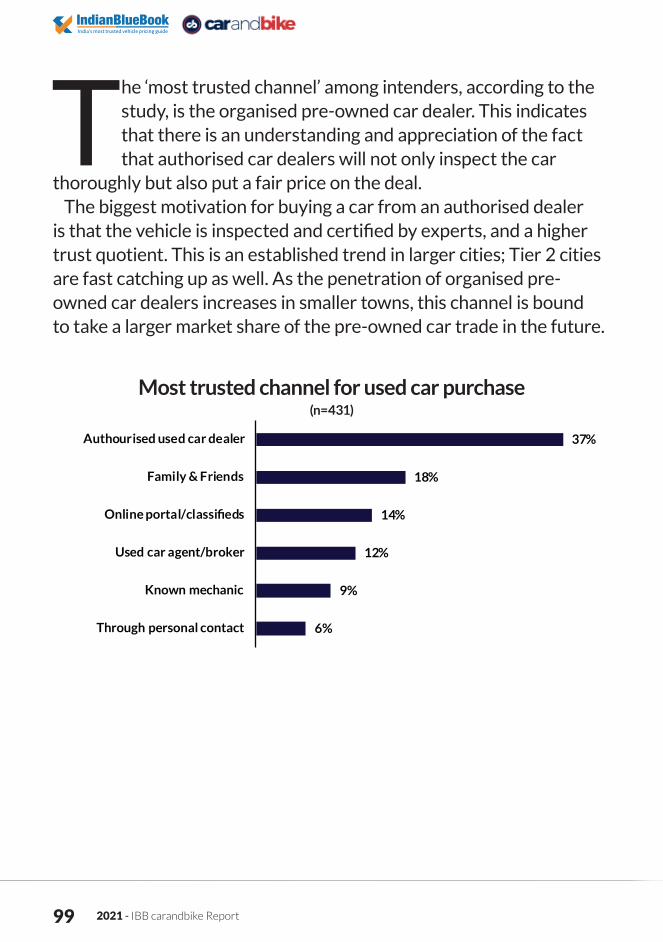
2021 - IBB carandbike Report 99
The ‘most trusted channel’ among intenders, according to the study, is the organised pre-owned car dealer. This indicates that there is an understanding and appreciation of the fact that authorised car dealers will not only inspect the car
thoroughly but also put a fair price on the deal.The biggest motivation for buying a car from an authorised dealer
is that the vehicle is inspected and certified by experts, and a higher trust quotient. This is an established trend in larger cities; Tier 2 cities are fast catching up as well. As the penetration of organised pre-owned car dealers increases in smaller towns, this channel is bound to take a larger market share of the pre-owned car trade in the future.
Most trusted channel for used car purchase(n=431)
37%
18%
14%
12%
9%
6%
Authourised used car dealer
Family & Friends
Used car agent/broker
Known mechanic
Through personal contact
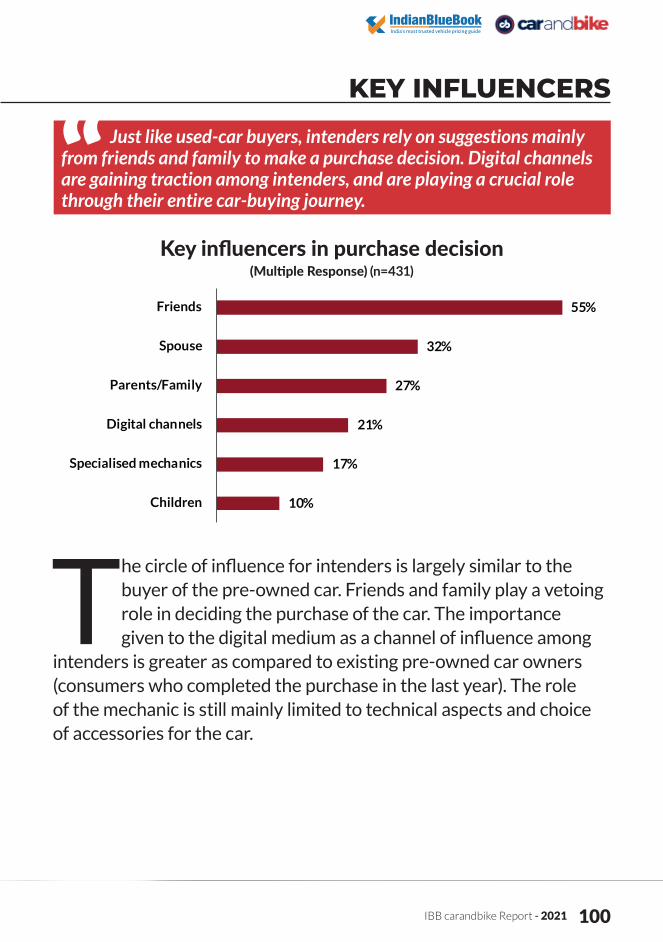
IBB carandbike Report - 2021 100
Just like used-car buyers, intenders rely on suggestions mainly from friends and family to make a purchase decision. Digital channels are gaining traction among intenders, and are playing a crucial role through their entire car-buying journey.
KEY INFLUENCERS
The circle of influence for intenders is largely similar to the buyer of the pre-owned car. Friends and family play a vetoing role in deciding the purchase of the car. The importance given to the digital medium as a channel of influence among
intenders is greater as compared to existing pre-owned car owners (consumers who completed the purchase in the last year). The role of the mechanic is still mainly limited to technical aspects and choice of accessories for the car.
Key influencers in purchase decision(Multiple Response) (n=431)
55%
32%
27%
21%
17%
10%
Friends
Spouse
Parents/Family
Digital channels
Specialised mechanics
Children
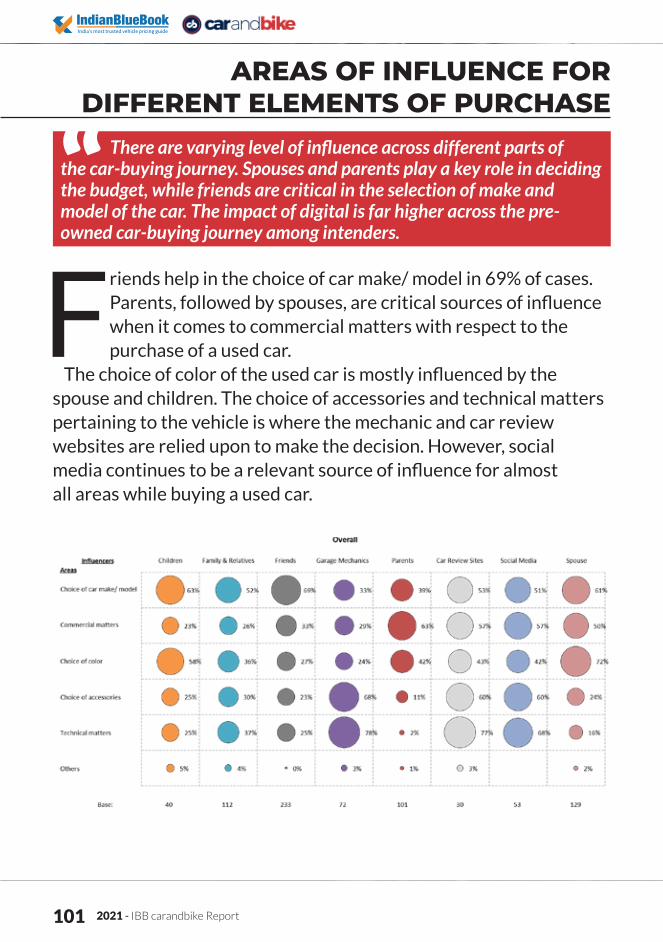
2021 - IBB carandbike Report 101
Friends help in the choice of car make/ model in 69% of cases. Parents, followed by spouses, are critical sources of influence when it comes to commercial matters with respect to the purchase of a used car.
The choice of color of the used car is mostly influenced by the spouse and children. The choice of accessories and technical matters pertaining to the vehicle is where the mechanic and car review websites are relied upon to make the decision. However, social media continues to be a relevant source of influence for almost all areas while buying a used car.
AREAS OF INFLUENCE FOR DIFFERENT ELEMENTS OF PURCHASE
There are varying level of influence across different parts of the car-buying journey. Spouses and parents play a key role in deciding the budget, while friends are critical in the selection of make and model of the car. The impact of digital is far higher across the pre-owned car-buying journey among intenders.
PURCHASE PROCESS ACTIVITIES UNDERTAKEN DURING PURCHASE
AND VEHICLE EVALUATION
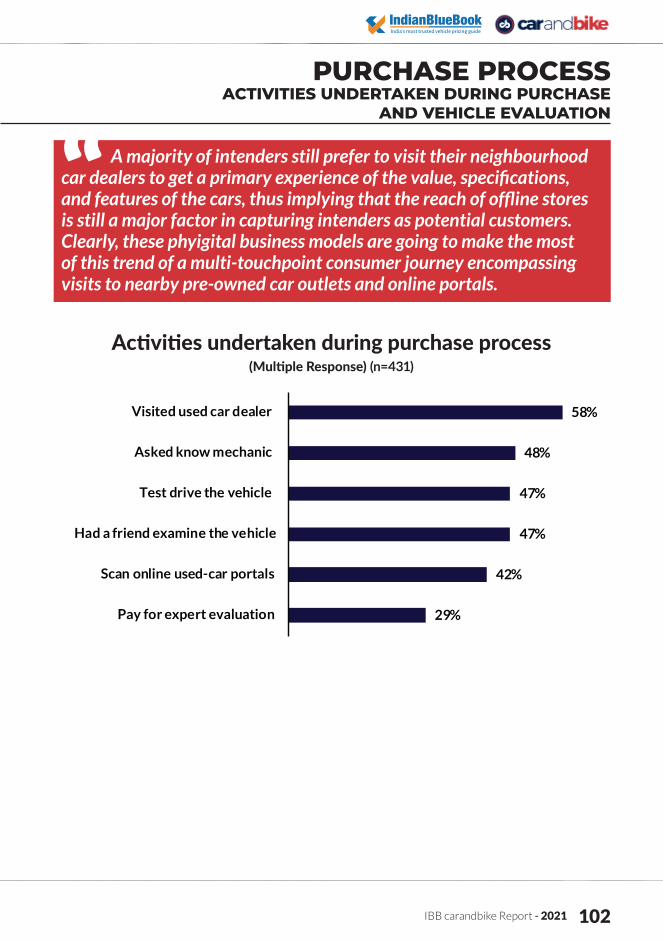
IBB carandbike Report - 2021 102
A majority of intenders still prefer to visit their neighbourhood car dealers to get a primary experience of the value, specifications, and features of the cars, thus implying that the reach of offline stores is still a major factor in capturing intenders as potential customers. Clearly, these phyigital business models are going to make the most of this trend of a multi-touchpoint consumer journey encompassing visits to nearby pre-owned car outlets and online portals.
PURCHASE PROCESS ACTIVITIES UNDERTAKEN DURING PURCHASE
AND VEHICLE EVALUATION
Activities undertaken during purchase process(Multiple Response) (n=431)
58%
48%
47%
47%
42%
29%
Visited used car dealer
Asked know mechanic
Test drive the vehicle
Had a friend examine the vehicle
Scan online used-car portals
Pay for expert evaluation
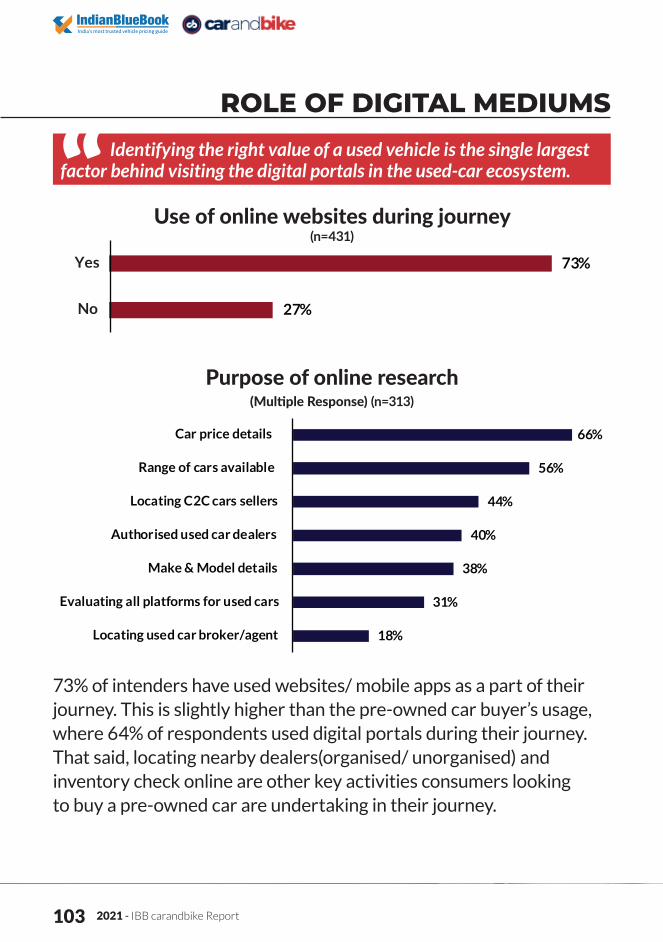
2021 - IBB carandbike Report 103
ROLE OF DIGITAL MEDIUMSIdentifying the right value of a used vehicle is the single largest
factor behind visiting the digital portals in the used-car ecosystem.
73% of intenders have used websites/ mobile apps as a part of their journey. This is slightly higher than the pre-owned car buyer’s usage, where 64% of respondents used digital portals during their journey. That said, locating nearby dealers(organised/ unorganised) and inventory check online are other key activities consumers looking to buy a pre-owned car are undertaking in their journey.
Use of online websites during journey(n=431)
73%
27%
Yes
No
Purpose of online research (Multiple Response) (n=313)
66%
56%
44%
40%
38%
31%
18%
Car price details
Range of cars available
Locating C2C cars sellers
Authorised used car dealers
Make & Model details
Evaluating all platforms for used cars
Locating used car broker/agent
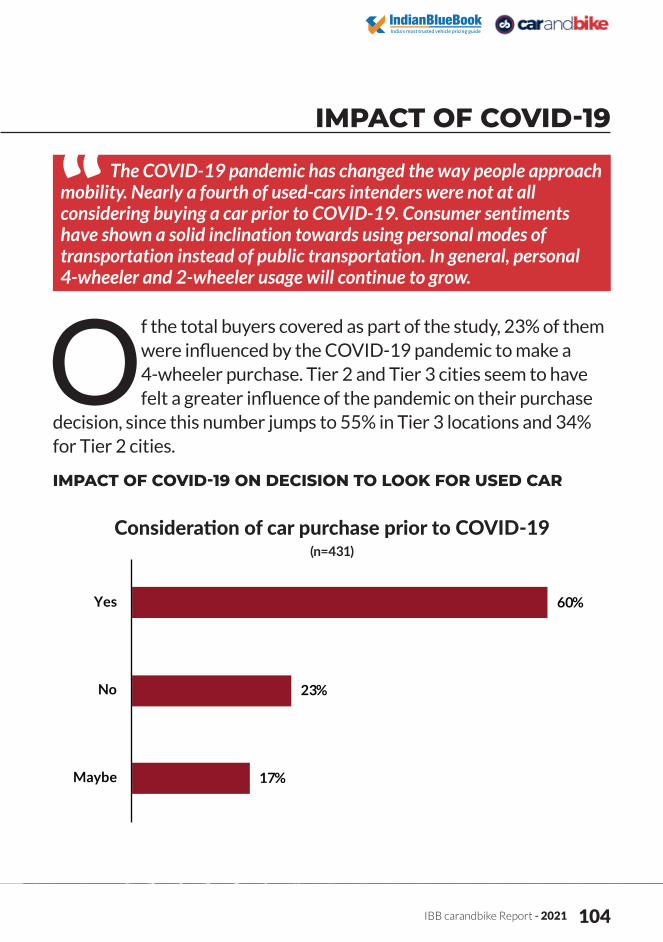
IBB carandbike Report - 2021 104
Of the total buyers covered as part of the study, 23% of them were influenced by the COVID-19 pandemic to make a 4-wheeler purchase. Tier 2 and Tier 3 cities seem to have felt a greater influence of the pandemic on their purchase
decision, since this number jumps to 55% in Tier 3 locations and 34% for Tier 2 cities.
IMPACT OF COVID-19
The COVID-19 pandemic has changed the way people approach mobility. Nearly a fourth of used-cars intenders were not at all considering buying a car prior to COVID-19. Consumer sentiments have shown a solid inclination towards using personal modes of transportation instead of public transportation. In general, personal 4-wheeler and 2-wheeler usage will continue to grow.
Consideration of car purchase prior to COVID-19(n=431)
60%
23%
17%
Yes
No
Maybe
IMPACT OF COVID-19 ON DECISION TO LOOK FOR USED CAR
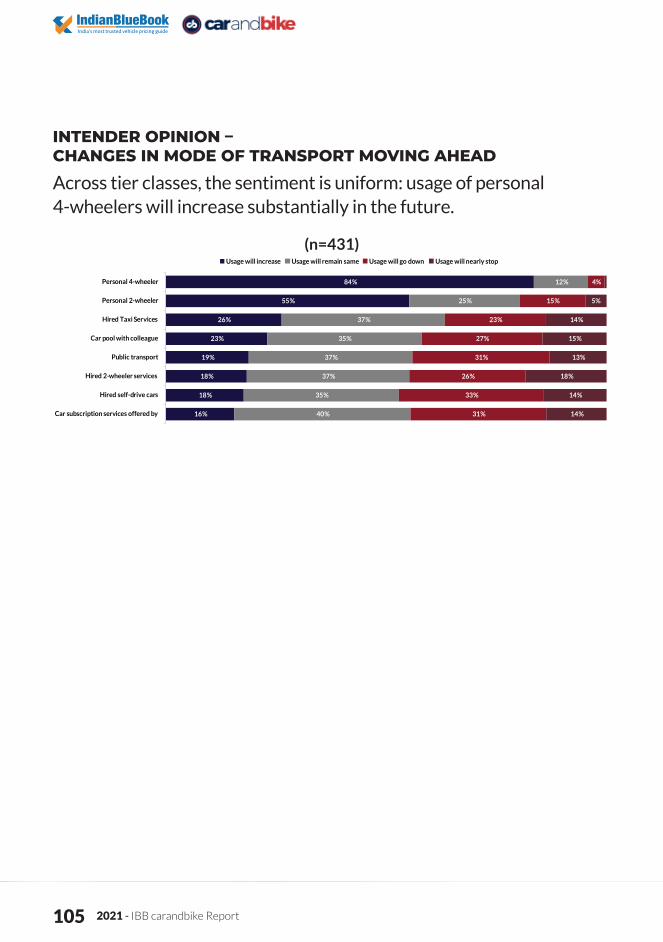
2021 - IBB carandbike Report 105
INTENDER OPINION – CHANGES IN MODE OF TRANSPORT MOVING AHEAD
Across tier classes, the sentiment is uniform: usage of personal 4-wheelers will increase substantially in the future.
(n=431)
84%
55%
26%
23%
19%
18%
18%
16%
12%
25%
37%
35%
37%
37%
35%
40%
4%
15%
23%
27%
31%
26%
33%
31%
5%
14%
15%
13%
18%
14%
14%
Personal 4-wheeler
Personal 2-wheeler
Hired Taxi Services
Car pool with colleague
Public transport
Hired 2-wheeler services
Hired self-drive cars
Car subscription services offered by
Usage will increase Usage will remain same Usage will go down Usage will nearly stop
2021 - IBB carandbike Report 106
THE PRE-OWNED CAR DEALERBACKBONE OF THE INDUSTRY

2021 - IBB carandbike Report 107
A major chunk of dealers in the segment are relatively new as is evident from the data that more than 50% of dealers have been operational for less than 5 years. Despite the industry being in existence for a long time, the share of mature dealers is quite low.
DEALERSHIP PROFILE
40%
17%
15%
7%
5%
17%
1-3
3-5
5-7
7-9
9-10
10+
Age of Dealerships (in years)(n=214)
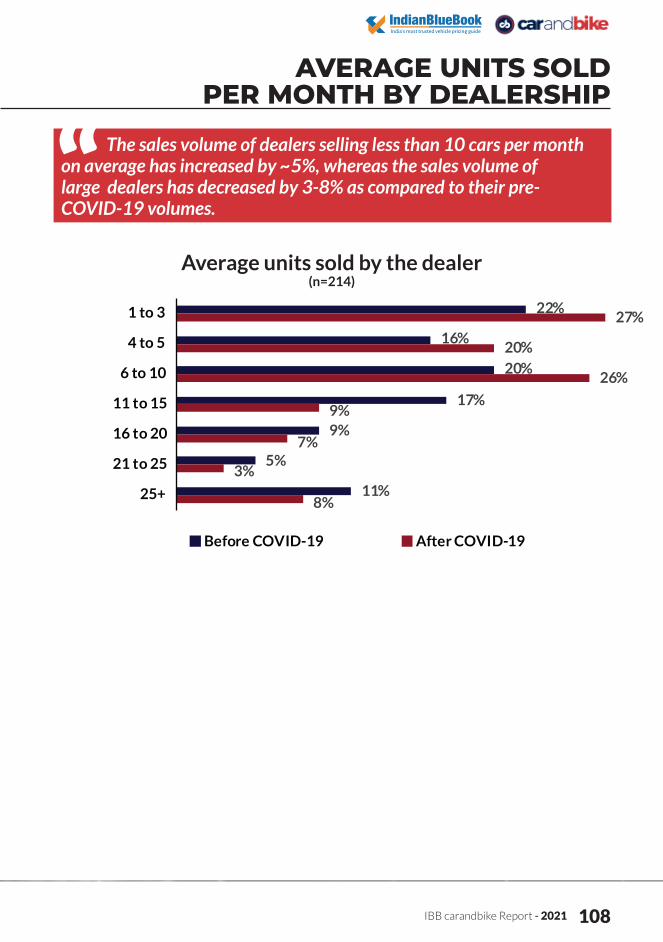
IBB carandbike Report - 2021 108
The sales volume of dealers selling less than 10 cars per month on average has increased by ~5%, whereas the sales volume of large dealers has decreased by 3-8% as compared to their pre-COVID-19 volumes.
AVERAGE UNITS SOLD PER MONTH BY DEALERSHIP
Average units sold by the dealer(n=214)
22%
16%
20%
17%
9%
5%
11%
27%
20%
26%
9%
7%
3%
8%
1 to 3
4 to 5
6 to 10
11 to 15
16 to 20
21 to 25
25+
Before COVID-19 After COVID-19
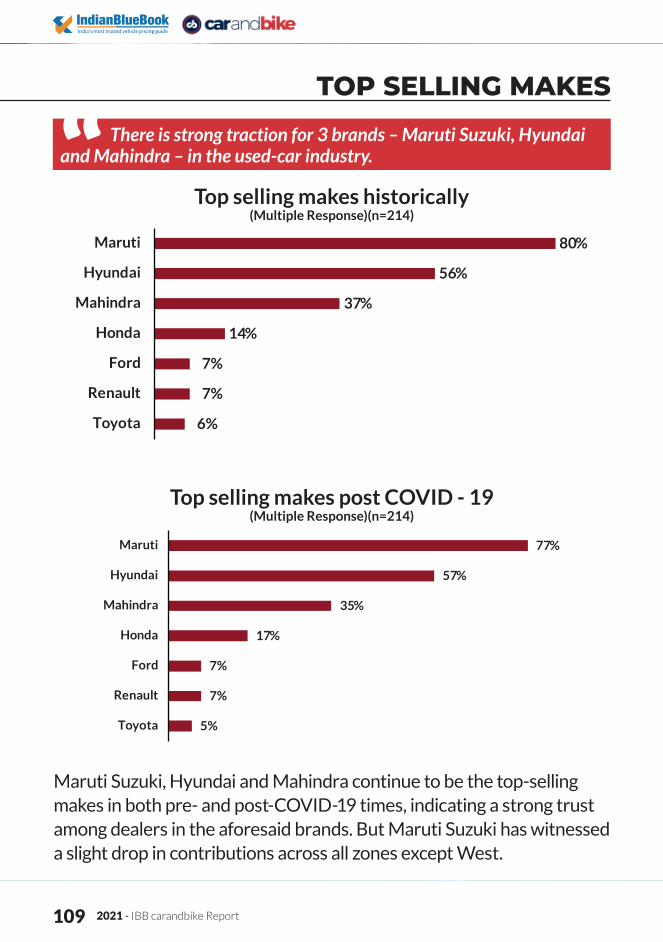
2021 - IBB carandbike Report 109
Maruti Suzuki, Hyundai and Mahindra continue to be the top-selling makes in both pre- and post-COVID-19 times, indicating a strong trust among dealers in the aforesaid brands. But Maruti Suzuki has witnessed a slight drop in contributions across all zones except West.
TOP SELLING MAKES
There is strong traction for 3 brands – Maruti Suzuki, Hyundai and Mahindra – in the used-car industry.
Top selling makes historically (Multiple Response)(n=214)
Top selling makes post COVID - 19 (Multiple Response)(n=214)
80%
56%
37%
14%
7%
7%
6%
Maruti
Hyundai
Mahindra
Honda
Ford
Renault
Toyota
77%
57%
35%
17%
7%
7%
5%
Maruti
Hyundai
Mahindra
Honda
Ford
Renault
Toyota

IBB carandbike Report - 2021 110
Historically, some of the top-selling models are Maruti Suzuki Swift, Maruti Suzuki Alto, Hyundai i20 and Maruti Suzuki WagonR. The Maruti Suzuki Alto is top-selling in the East and South. The Maruti Suzuki Swift is the top-seller in the North, whereas the Maruti Suzuki WagonR sells the most in the West.
TOP SELLING MODELS
Value-based affordable hatchback car variants are the preferred models in the used-car industry.
Top selling models historically(Multiple Response)(n=214)
31%
29%
29%
26%
21%
20%
19%
Maruti Swift
Maruti Alto
Hyundai i20
Maruti WagonR
Maruti Swift Dzire
Mahindra Bolero
Mahindra Scorpio
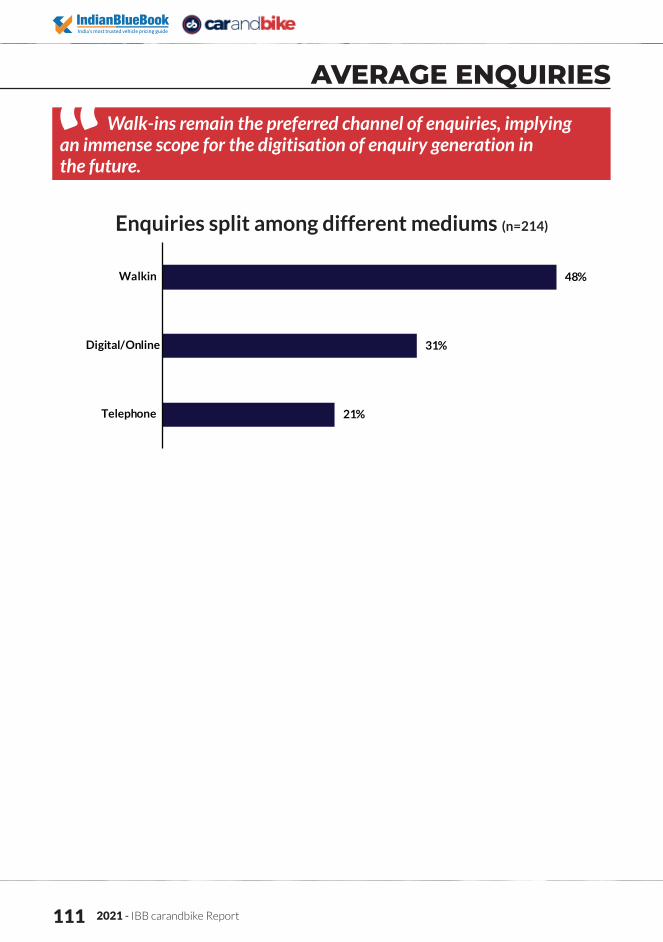
2021 - IBB carandbike Report 111
Enquiries split among different mediums (n=214)
48%
31%
21%
Walkin
Digital/Online
Telephone
AVERAGE ENQUIRIES
Walk-ins remain the preferred channel of enquiries, implying an immense scope for the digitisation of enquiry generation in the future.
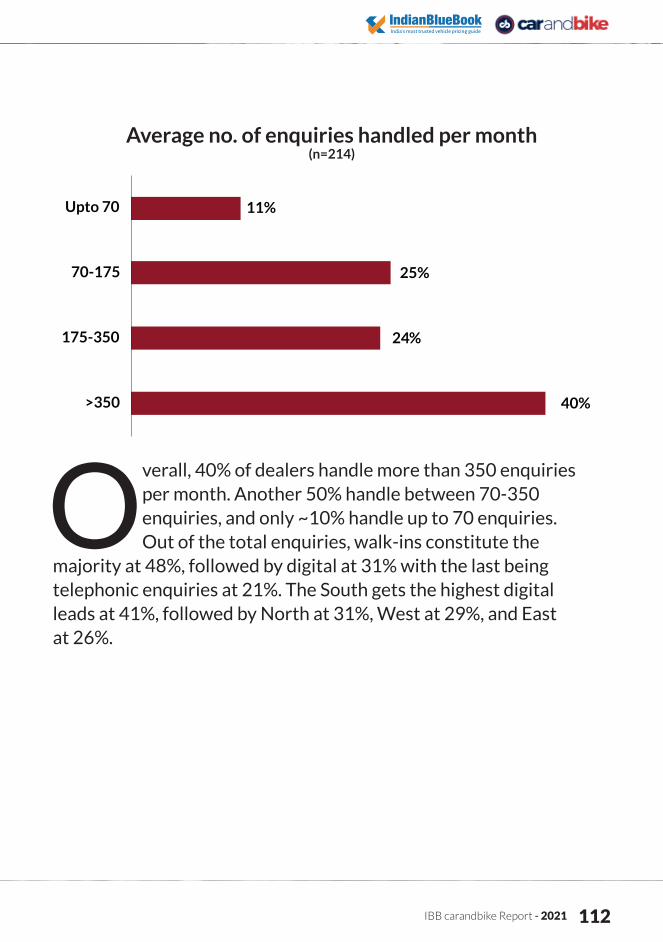
IBB carandbike Report - 2021 112
Average no. of enquiries handled per month(n=214)
11%
25%
24%
40%
Upto 70
70-175
175-350
>350
Overall, 40% of dealers handle more than 350 enquiries per month. Another 50% handle between 70-350 enquiries, and only ~10% handle up to 70 enquiries.Out of the total enquiries, walk-ins constitute the
majority at 48%, followed by digital at 31% with the last being telephonic enquiries at 21%. The South gets the highest digital leads at 41%, followed by North at 31%, West at 29%, and East at 26%.
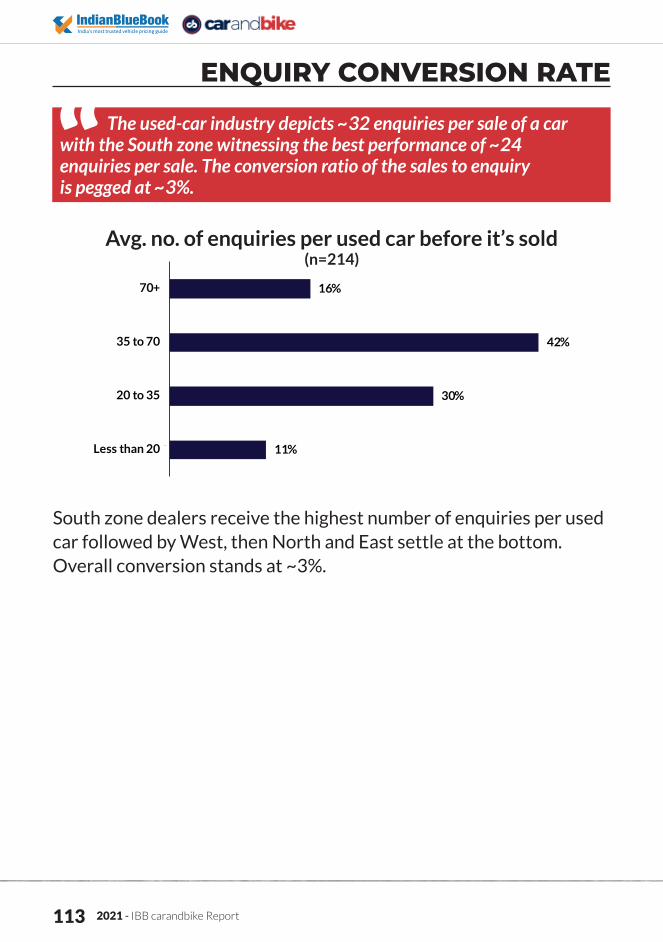
2021 - IBB carandbike Report 113
Avg. no. of enquiries per used car before it’s sold(n=214)
3
16%
42%
30%
11%
70+
35 to 70
20 to 35
Less than 20
ENQUIRY CONVERSION RATE
The used-car industry depicts ~32 enquiries per sale of a car with the South zone witnessing the best performance of ~24 enquiries per sale. The conversion ratio of the sales to enquiry is pegged at ~3%.
South zone dealers receive the highest number of enquiries per used car followed by West, then North and East settle at the bottom. Overall conversion stands at ~3%.
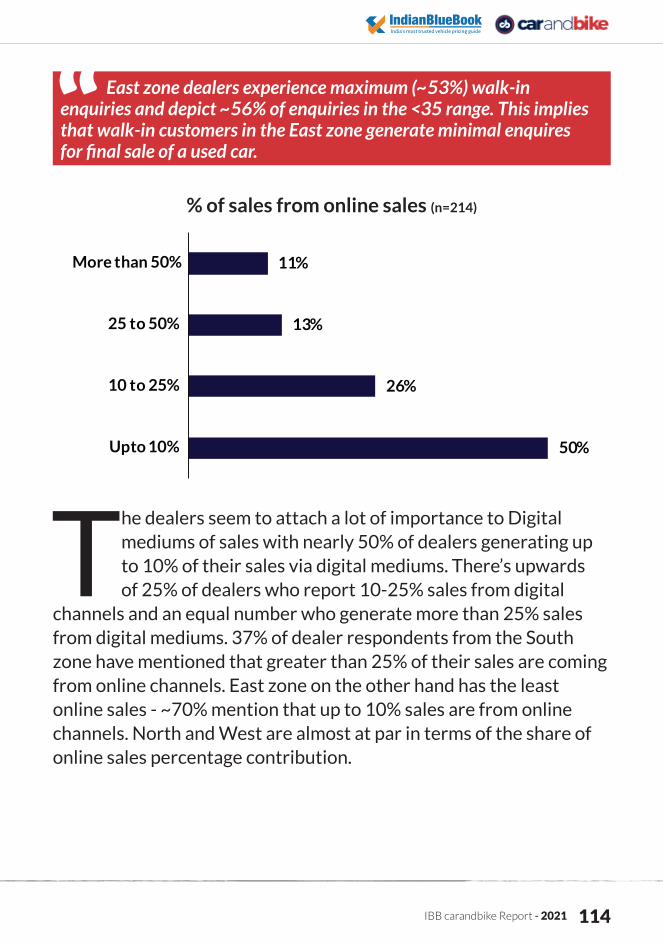
IBB carandbike Report - 2021 114
% of sales from online sales (n=214)
11%
13%
26%
50%
More than 50%
25 to 50%
10 to 25%
Upto 10%
East zone dealers experience maximum (~53%) walk-in enquiries and depict ~56% of enquiries in the <35 range. This implies that walk-in customers in the East zone generate minimal enquires for final sale of a used car.
The dealers seem to attach a lot of importance to Digital mediums of sales with nearly 50% of dealers generating up to 10% of their sales via digital mediums. There’s upwards of 25% of dealers who report 10-25% sales from digital
channels and an equal number who generate more than 25% sales from digital mediums. 37% of dealer respondents from the South zone have mentioned that greater than 25% of their sales are coming from online channels. East zone on the other hand has the least online sales - ~70% mention that up to 10% sales are from online channels. North and West are almost at par in terms of the share of online sales percentage contribution.

2021 - IBB carandbike Report 115
Impact of online channel on sales(n=214)
79%
21%
0%
Increase
Stay same
Decrease
A huge majority (~80%) of dealers believe that digital sales are going to go up by 32% in the near future. This shows that dealers are confident that digital sources will continue to have a positive effect.
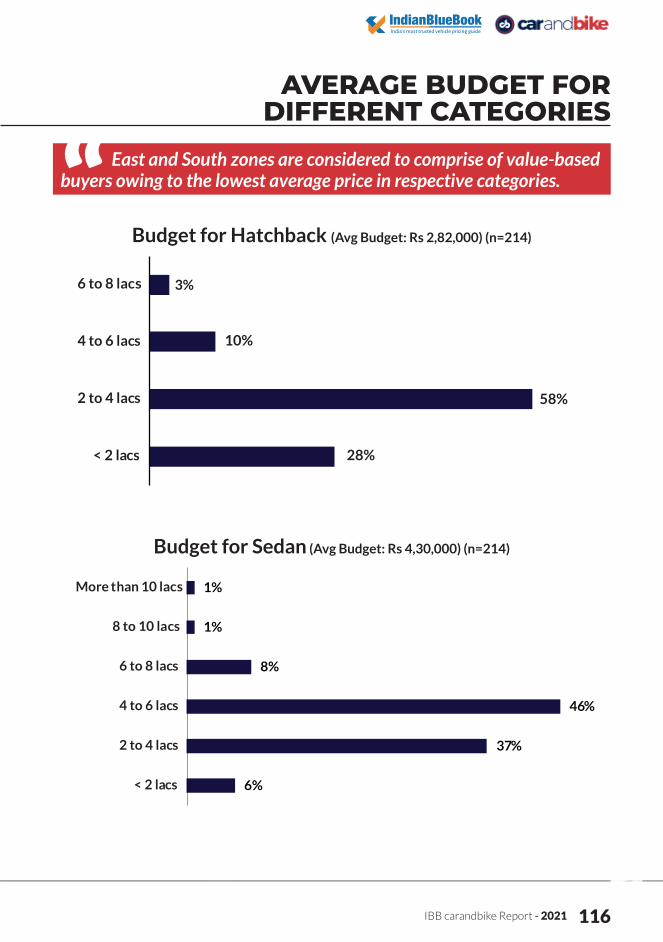
IBB carandbike Report - 2021 116
AVERAGE BUDGET FOR DIFFERENT CATEGORIES
East and South zones are considered to comprise of value-based buyers owing to the lowest average price in respective categories.
Budget for Hatchback (Avg Budget: Rs 2,82,000) (n=214)
Budget for Sedan (Avg Budget: Rs 4,30,000) (n=214)
6 to 8 lac
10%
58%
4 to 6 lacs
2 to 4 lacs
< 2 lacs 28%
s 3%
1%
1%
8%
46%
37%
6%
More than 10 lacs
8 to 10 lacs
6 to 8 lacs
4 to 6 lacs
2 to 4 lacs
< 2 lacs
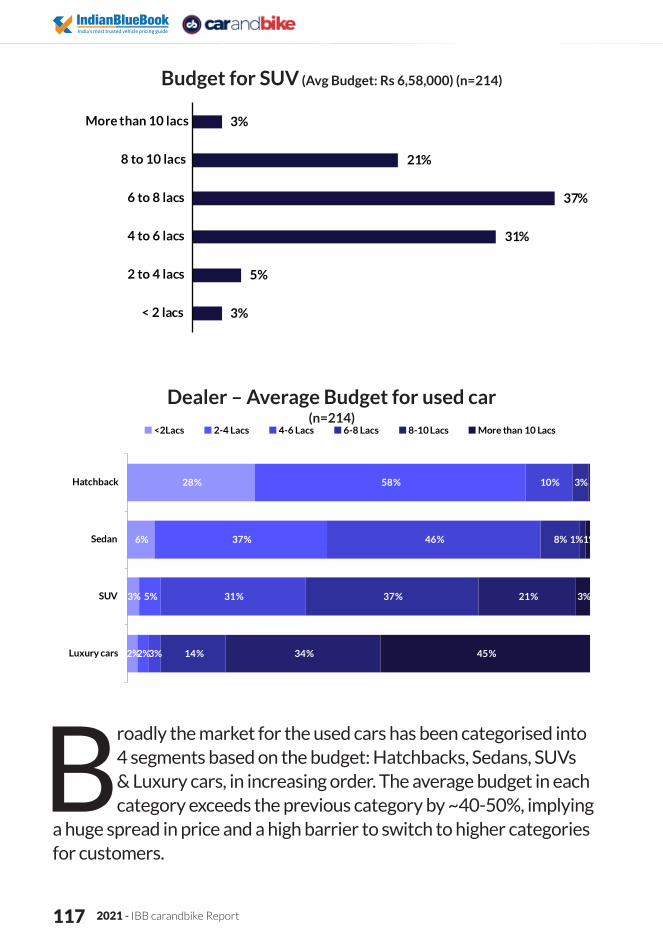
2021 - IBB carandbike Report 117
Broadly the market for the used cars has been categorised into 4 segments based on the budget: Hatchbacks, Sedans, SUVs & Luxury cars, in increasing order. The average budget in each category exceeds the previous category by ~40-50%, implying
a huge spread in price and a high barrier to switch to higher categories for customers.
Budget for SUV (Avg Budget: Rs 6,58,000) (n=214)
3%
21%
37%
31%
5%
3%
More than 10 lacs
8 to 10 lacs
6 to 8 lacs
4 to 6 lacs
2 to 4 lacs
< 2 lacs
Dealer – Average Budget for used car(n=214)
28%
6%
3%
2%
58%
37%
5%
2%
10%
46%
31%
3%
3%
8%
37%
14%
1%
21%
34%
1%
3%
45%
Hatchback
Sedan
SUV
Luxury cars
<2Lacs 2-4 Lacs 4-6 Lacs 6-8 Lacs 8-10 Lacs More than 10 Lacs

IBB carandbike Report - 2021 118
Breakup of Mode of Payment(n=214)
19%
29%
37%
31%
17%
32%
31%
39%
20%
28%
21%
22%
44%
12%
11%
8%
Loan/ Finance
All payment through cheque/ draft
All Payment in cash
Partly cash & partly cheque/ draftpayment
Up to 10% 10-25% 25-50% More than 50%
MODE OF PAYMENT
FINANCE FOR USED CAR CUSTOMERS
Low penetration of financing in the used-car industry is accompanied by a small loan-to-value ratio (i.e. <50%) in a majority of cases. This indicates that financiers/NBFC are reluctant to fund a higher amount for loans on used cars, and buyers prefer to take minimal loan amounts owing to higher interest rates.
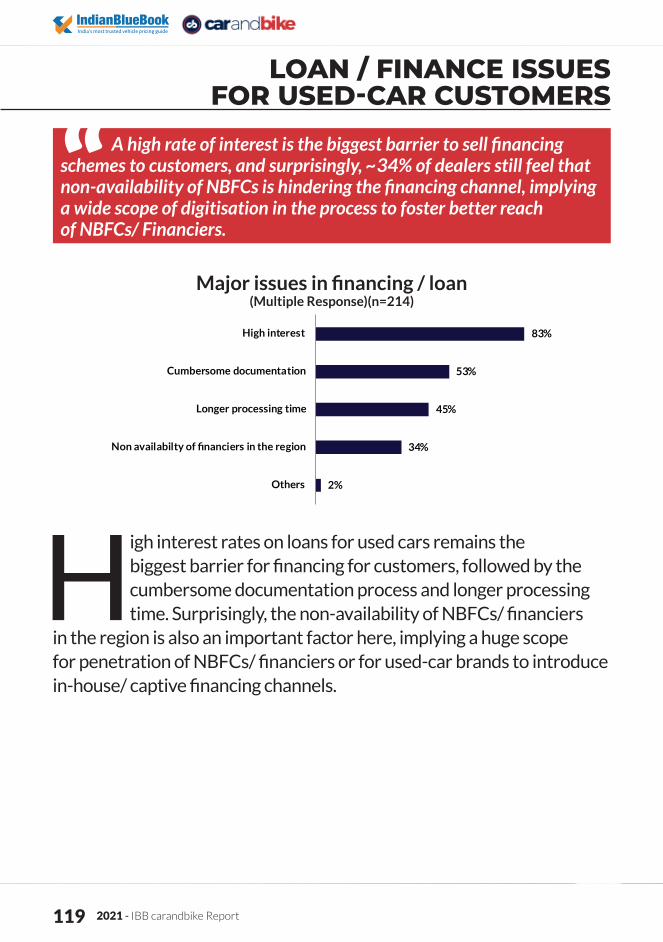
2021 - IBB carandbike Report 119
Major issues in financing / loan(Multiple Response)(n=214)
83%
53%
45%
34%
2%
High interest
Cumbersome documentation
Longer processing time
Others
High interest rates on loans for used cars remains the biggest barrier for financing for customers, followed by the cumbersome documentation process and longer processing time. Surprisingly, the non-availability of NBFCs/ financiers
in the region is also an important factor here, implying a huge scope for penetration of NBFCs/ financiers or for used-car brands to introduce in-house/ captive financing channels.
LOAN / FINANCE ISSUES FOR USED-CAR CUSTOMERS
A high rate of interest is the biggest barrier to sell financing schemes to customers, and surprisingly, ~34% of dealers still feel that non-availability of NBFCs is hindering the financing channel, implying a wide scope of digitisation in the process to foster better reach of NBFCs/ Financiers.
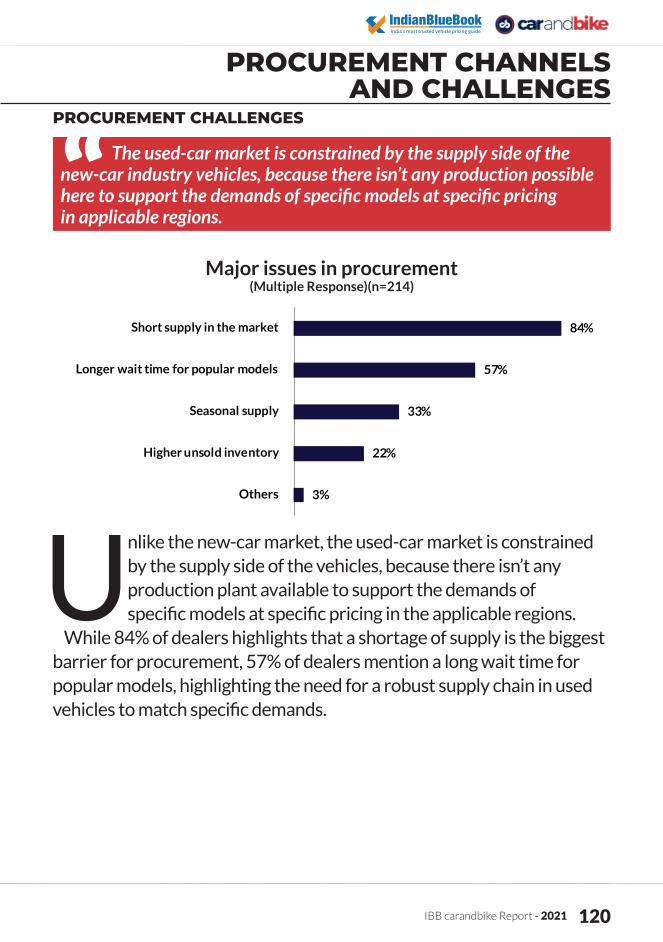
IBB carandbike Report - 2021 120
Major issues in procurement(Multiple Response)(n=214)
PROCUREMENT CHALLENGES
PROCUREMENT CHANNELS AND CHALLENGES
The used-car market is constrained by the supply side of the new-car industry vehicles, because there isn’t any production possible here to support the demands of specific models at specific pricing in applicable regions.
84%
57%
33%
22%
3%
Short supply in the market
Longer wait time for popular models
Seasonal supply
Higher unsold inventory
Others
Unlike the new-car market, the used-car market is constrained by the supply side of the vehicles, because there isn’t any production plant available to support the demands of specific models at specific pricing in the applicable regions.
While 84% of dealers highlights that a shortage of supply is the biggest barrier for procurement, 57% of dealers mention a long wait time for popular models, highlighting the need for a robust supply chain in used vehicles to match specific demands.

2021 - IBB carandbike Report 121
Procurement channel - impact of COVID-19(Multiple Response) (n=214)
CHANNELS OF PROCUREMENT (BEFORE AND AFTER COVID-19)
Major avenues of procurement channels remain unaffected by COVID-19 in terms of volume procured. The broker network dominates the supply chain, closely followed by walk-in customers.
Traditional supply channels like used-car brokers and walk-ins still remain the top 2 sourcing channels for used-car dealers. Online players, a close second, are increasingly seen as key contributors to the ecosystem. Unorganised auctions and
direct customer leads on own websites are the lowest contributors when it comes to supply channels.
COVID-19 hasn’t changed the major channels used for procuring used cars. While the broker network and walk-in customers continue to be the most preferred channel for procurement, websites and C2C channels have shown a marginal increment of ~1-2% in their contribution. The East zone continues to lag in adopting digital channels and websites facilitating C2C transactions, highlighting the huge scope to shift from traditional channels to digital avenues.
Unorganised auctions
Own websites
Organised auctions
C2C customer websites
Third party websites
Walk-ins
Used car brokers 42%42%
40%41%
32%34%
29%32%
21%20%
15%14%
14%13%
Pre-COVID-19 Post COVID-19
IMPACT OF COVID-19

IBB carandbike Report - 2021 122
IMPACT ON DEMAND FOR USED CARS
Demand variations in various segments Impact of COVID-19 on demand of used cars
(n=214)
IMPACT OF COVID-19
The COVID-19 pandemic has had a mixed impact across different segments of cars. The pandemic pushed a lot of non-car owners to shift to a used car by way of entry-level hatchbacks; 3 out of 4 dealers (75%) feel the demand for hatchbacks has gone up. The next spurt in demand is seen by SUVs, followed closely by sedans. Since the pandemic did impact the disposable income of the general populace, those who were planning to purchase a luxury car have either downgraded or deferred their purchase.
75%
40%
38%
14%
21%
39%
42%
37%
3%
21%
20%
49%
Hatchbacks
SUVs
Sedan
Luxury Cars
Demand gone up Remained unchanged Demand gone down

2021 - IBB carandbike Report 123
Impact of COVID-19 on valuation of used cars(n=214)
66%
49%
44%
21%
25%
43%
38%
43%
8%
8%
18%
36%
Hatchbacks
Sedan
SUVs
Luxury Cars
Valuation gone up Remained unchanged Valuation gone down
Demand for luxury cars saw the highest jump in the West zone. Similarly, SUVs and sedans have seen the highest jump in East zone as compared to other regions. This dramatic variation in demand has impacted the
valuations of these cars as well. For example, 2 in 3 dealers feel that hatchbacks have become more valuable. Similarly, sedans and SUVs have also seen an increase in valuation due to the demand pull from the consumer. Inversely, 1 in 3 dealers feel that valuation of luxury cars has gone down post COVID-19.
DEALER OPINION

IBB carandbike Report - 2021 124
CHANGE IN TRANSPORT MODES MOVING AHEAD
Change in transport modes in the future(n=214)
The majority of dealers feel that there would be a strong shift from shared mobility to personal mobility for users. This is evident from the fact that ~50-90% of the dealers said that options of personal 4-wheeler, 2-wheeler and subscription
services would be a strong driver for future growth.
DEALER OPINION
There is a strong feeling among dealers that in the future, customers in the used-car segment would drastically shift towards personal mobility from shared mobility, as is evident in the preferences in personal vehicles and subscription options.
91%
62%
50%
47%
44%
39%
33%
29%
9%
33%
37%
37%
45%
40%
47%
52%
4%
12%
17%
11%
21%
20%
19%
Personal 4-wheeler
Personal 2-wheeler
Car subscription services
Hired self-drive cars
Hired Taxi Services
Car pool with colleague
Hired 2-wheeler services
Public transport
Will increase Will remain same Will downgo
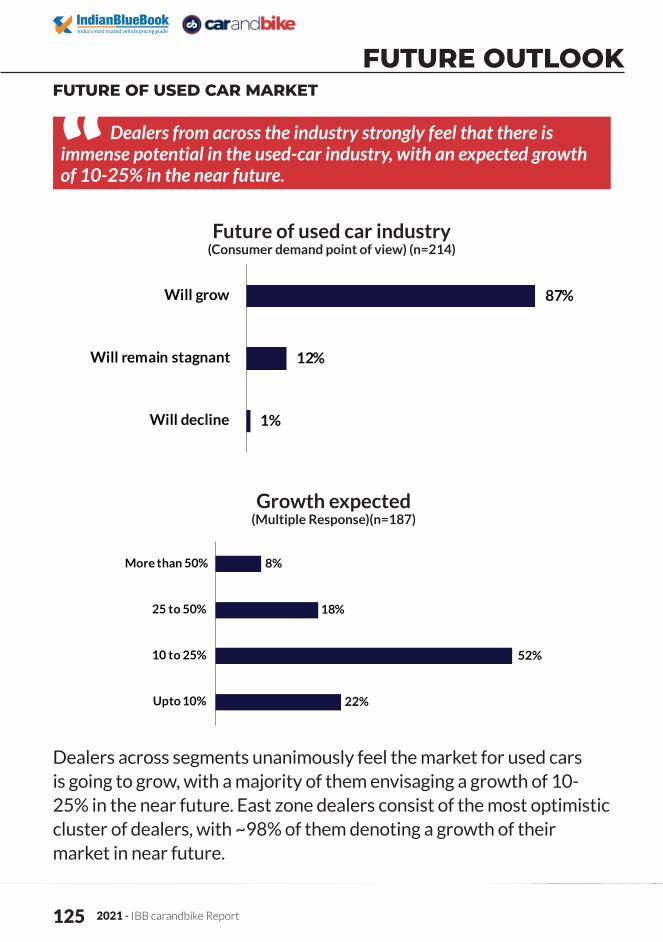
2021 - IBB carandbike Report 125
FUTURE OF AUTOMOTIVE BUSINESSFUTURE OF USED CAR MARKET
Future of used car industry(Consumer demand point of view) (n=214)
Growth expected(Multiple Response)(n=187)
Dealers across segments unanimously feel the market for used cars is going to grow, with a majority of them envisaging a growth of 10-25% in the near future. East zone dealers consist of the most optimistic cluster of dealers, with ~98% of them denoting a growth of their market in near future.
FUTURE OUTLOOK
Dealers from across the industry strongly feel that there is immense potential in the used-car industry, with an expected growth of 10-25% in the near future.
87%
12%
1%
Will grow
Will remain stagnant
Will decline
More than 50%
25 to 50%
10 to 25%
Upto 10%
8%
18%
52%
22%

IBB carandbike Report - 2021 126
OOverall, dealers feel that there will be a lot of consolidation of business in the future, making it difficult for small independent dealers to survive. This could create an immense scope for the formalisation and digitisation of the
entire industry in the future through the presence of umbrella brands.Although South zone dealers have had the highest contribution of
digital enquiries, they still feel that the physical dealership is here to stay, and digital avenues won’t hamper their existing processes.
FUTURE OF AUTOMOTIVE BUSINESS
A majority of dealers feel that the role of technology will be a key lever for the growth of this business. But at the dealer level, a lot of discipline and control need to be introduced with the involvement and empowerment of the dealer principle to drive the profitability of individual dealers.
Dealer opinion on the future of automotive business(n=214)
73%
71%
66%
62%
61%
60%
60%
57%
46%
45%
22%
25%
29%
30%
30%
32%
24%
26%
33%
34%
5%
4%
5%
8%
9%
8%
16%
17%
21%
21%
Agree Neutral Disagree
2021 - IBB carandbike Report 127
APPENDIX
T he consumer and dealer study covered in Chapter 2 was conducted with PremonAsia, a consumer insight-based consulting firm based out of Singapore. This survey was conducted in Feb 2021 with 2000+ buyers, 1900+ sellers
and 400+ intenders, and 200+ pre-owned car dealers at a PAN India level. All three tier classes of cities were covered under this survey, with some of the cities being Mumbai, Delhi, Trichy, Patna, Hyderabad, Jaipur and Ludhiana among others. This report also includes data available on the public domain with the sources cited below for reference.
✱ SIAM ✱ Centre of Monitoring Indian Economy –
Economic Outlook✱ Niti Aayog✱ National Automobile Dealers
Association✱ National Independent Automobile
Dealers Association✱ Tracxn.com✱ OECD ✱ OICA✱ Manheim’s Used Car Market Report
✱ Mahindra First Choice transaction data
✱ Industry experts estimate✱ Google Adwords✱ IBB - Premon Asia Pre-owned
car study India 2021✱ IBB Report 2019✱ IBB Report 2017✱ IBB Report 2016✱ IBB-Premon Asia Customer Profile
Study 2009
SOURCES
ABOUT THE STUDY:
AUTHORS OF THE REPORT✱ Abhishek Agarwal✱ Karan Gulati
SPECIAL THANKS TO✱ Jigar Buddhadeo

IBB carandbike Report - 2021 128
ABOUT INDIANBLUEBOOK
IndianBlueBook (IBB) is the industry-first pricing guide for new and pre-owned vehicle valuation in India. With exclusive access to a large number of car transactions that take place every day through different channels, IBB derives scientific and insightful
inferences that lead to vehicle price discovery. Whether you’re buying or selling a vehicle, IBB helps you discover its real worth. Through various transactions on different customer-facing and B2B channels, IBB’s analytical engine logically deduces a pricing index that is then used to derive the benchmark market price of any vehicle. In essence, IBB is a one-of-a-kind valuation platform based on rigorous research and pure rationality. It is driven by the sheer passion to demystify the data points of a million transactions, thus ensuring that you never overpay or never undersell. IBB offers a wide array of tools, such as Total Cost of Ownership (TCO) and residual value analysis, regularly updated reviews and insights via its blog, and a platform that enables its customers to buy and sell vehicles, thereby serving as a one-stop shop for customers looking to research vehicles.
Any use, including but not limited to the reproduction, display or transmission of the content of this report is strictly prohibited, unless authorised by IndianBlueBook.

2021 - IBB carandbike Report 1