Challenges Hindering Success of Tour Businesses Owned by
237
Challenges Hindering Success of Tour Businesses Owned by Indigenous Entrepreneurs in the Tourism Industry in Kenya Mary Ragui A Thesis Submitted in Partial Fulfilment for the Award of the Degree of Doctor of Philosophy in Business Administration in the Jomo Kenyatta University of Agriculture and Technology 2013
-
Upload
khangminh22 -
Category
Documents
-
view
0 -
download
0
Transcript of Challenges Hindering Success of Tour Businesses Owned by

Challenges Hindering Success of Tour Businesses Owned by
Indigenous Entrepreneurs in the Tourism Industry in Kenya
Mary Ragui
A Thesis Submitted in Partial Fulfilment for the Award of the Degree
of Doctor of Philosophy in Business Administration in the Jomo
Kenyatta University of Agriculture and Technology
2013

i
DECLARATION
This thesis is my original work and has not been presented for a degree in any other
university
Signed……………………..………………… Date……………………………...
Mary Ragui
This thesis has been submitted for examination with our approval as university
supervisors
Signed …………………………… Date: ……………………………………
Prof. Roselyn Gakure
JKUAT, Kenya
Signed ……………………………….. Date……………………………………
Dr. Anthony Waititu
JKUAT, Kenya
Signed ……………………………….. Date……………………………………
Dr. Paul Katuse
USIU, Kenya

ii
DEDICATION
This thesis is dedicated to my late father George Ngugi who ensured that I get the
basic education and always encouraged me to do better than my peers for there is a
reward in hard work. Even as you sleep, I promise that your flag will continually fly
high through your footsteps.

iii
ACKOWLEDGEMENT
I take this opportunity to thank the Almighty God and acknowledge His divinity in
this work.
I also acknowledge my family; my husband Paul for his unlimited support and
encouragement in all ways, Daniel and Joy for their understanding of my absence
when they dearly needed me in the house.
In addition, I acknowledge my supervisors particularly Prof. Gakure who played a
significant role in guidance which was not only valuable for this work but for my
future career.
I cannot forget my classmates for endless support and encouragement during this
tough journey and any other person who assisted me on this study including all who
filled my questionnaire.
May the Almighty God bless you always and answer you whenever you call!

iv
TABLE OF CONTENTS
DECLARATION ...................................................................................................... i
DEDICATION ......................................................................................................... ii
ACKOWLEDGEMENT......................................................................................... iii
TABLE OF CONTENTS ....................................................................................... iv
LIST OF TABLES ................................................................................................... x
LIST OF FIGURES .............................................................................................. xiii
ACRONYMS AND ABBREVIATIONS .............................................................. xiv
DEFINITION OF TERMS .................................................................................... xv
ABSTRACT .......................................................................................................... xvi
CHAPTER ONE ...................................................................................................... 1
INTRODUCTION ................................................................................................... 1
1.1 Background of the Study ...................................................................................... 1
1.1.2 Tourism Industry in Kenya ............................................................................ 4
1.2 Statement of the Problem ..................................................................................... 6
1.3 Study Objectives .................................................................................................. 7
1.3.1 General Objective ......................................................................................... 7
1.3.2 Specific Objectives ....................................................................................... 7
1.4 Research Hypotheses ........................................................................................... 8

v
1.5 Scope of the Study ............................................................................................... 9
1.6 Justification of the Study ...................................................................................... 9
1.7 Limitations of the Study ..................................................................................... 10
CHAPTER TWO ................................................................................................... 11
LITERATURE REVIEW...................................................................................... 11
2.1 Introduction ....................................................................................................... 11
2.2 Theoretical Framework ...................................................................................... 11
2.2.1 Effects of Resources on Success .................................................................. 11
2.2.2 Effects of Policies on Success ..................................................................... 14
2.2.3 Effects of ICT on Success ........................................................................... 15
2.2.4 Effects of Service Quality on Success ......................................................... 17
2.2.5 Effects of Clusters and Networks on Success .............................................. 19
2.3 Conceptual Framework ...................................................................................... 20
2.4 Empirical Review .............................................................................................. 22
2.4.1 Effects of Resources on Success .................................................................. 22
2.4.2 Effect of Policies on Success ....................................................................... 24
2.3.3 Effect of Information, Communication and Technology on Success ............ 28
2.4.4 Effect of Service Quality on Success .......................................................... 31
2.4.5 Effect of Clusters and Networking on Success ........................................... 33

vi
2.4.6 Success of Tourism Businesses ................................................................... 35
2.5 The Tourism Industry ........................................................................................ 38
2.6 Gaps in the Literature Review ............................................................................ 40
CHAPTER THREE ............................................................................................... 43
RESEARCH METHODOLOGY .......................................................................... 43
3.1 Introduction ....................................................................................................... 43
3.2 Research Philosophy .......................................................................................... 43
3.3 Research Design ................................................................................................ 44
3.4 Population ......................................................................................................... 45
3.5 Sampling Process ............................................................................................... 46
3.5.1 Sampling Frame .......................................................................................... 46
3.5.2 Sampling Technique ................................................................................... 47
3.5.3 Sample Size and Sample ............................................................................. 48
3.6 Instruments of Data Collection .......................................................................... 50
3.7 Data Collection Procedure ................................................................................. 51
3.8 Data Processing and Analysis ............................................................................ 52
3.8 Operationalization of Variables ......................................................................... 55
3.9 Ethical Consideration Issues .............................................................................. 57

vii
CHAPTER FOUR ................................................................................................. 58
RESEARCH FINDINGS AND DISCUSSIONS ................................................... 58
4.1 Introduction ....................................................................................................... 58
4.2 Response Rate ................................................................................................... 59
4.3 Sample Characteristics ....................................................................................... 60
4.4 Pilot Study Results ............................................................................................. 64
4.4 Study Variables ................................................................................................. 65
4.4.1 Success of Tour Businesses Owned by Indigenous Entrepreneurs .............. 66
4.4.2 Influence of Resources on Success .............................................................. 73
4.4.2 Influence of Policies on Success .................................................................. 95
4.4.3 Influence of Information, Communication and Technology (ICT) to Success
.......................................................................................................................... 113
4.4.4 Influence of Service Quality on Success .................................................... 131
4.4.5 Influence of Clusters and Networks on Success ......................................... 152
4.4.6 Combined Effect of All Independent Variables on Success ....................... 164
4.4.7 Revised Conceptual Framework ................................................................ 170
CHAPTER FIVE ................................................................................................. 173
SUMMARY, CONCLUSIONS AND RECOMMENDATIONS ........................ 173
5.1 Introduction ..................................................................................................... 173

viii
5.2 Summary of Findings ....................................................................................... 174
5.2.1 Preliminary Findings ................................................................................. 174
5.2.2 Investigate if Resources Affect Success of Tourism Businesses Owned by
Indigenous Entrepreneurs in the Tourism Industry in Kenya .............................. 174
5.2.3 Determine the Effect of Policies on Success of Tourism Businesses Owned by
Indigenous Entrepreneurs in the Tourism Industry in Kenya .............................. 175
5.2.4 Establish the Effect of ICT on Success of Tourism Businesses Owned by
Indigenous Entrepreneurs in the Tourism Industry in Kenya. ............................. 176
5.2.5 Investigate the Effect of Service Quality on Success of Tourism Businesses
Owned by Indigenous Entrepreneurs in the Tourism Industry in Kenya ............. 176
5.2.6 Establish the Effect of Clusters and Networks on Success of Tourism
Businesses Owned by Indigenous Entrepreneurs in the Tourism Industry in Kenya.
.......................................................................................................................... 177
5.2.7 Challenges Hindering Success of Tourism Businesses Owned by Indigenous
Entrepreneurs .................................................................................................... 177
5.3 Conclusions ..................................................................................................... 178
5.3.1 Effects of Resources on Success of Tourism Businesses ............................ 178
5.3.2 Effect of Policies on Success of Tourism Businesses ................................. 179
5.3.3 Effects of ICT on Success of Tourism Businesses ..................................... 180
5.3.4 Effects of Service Quality on Success of Tourism Businesses ................... 180
ix
5.3.5 Effects of Clusters and Networks on Success of Tourism Businesses ........ 181
5.3.6 Challenges Hindering Success of Tourism Businesses Owned by Indigenous
entrepreneurs ..................................................................................................... 181
5.4 Recommendations............................................................................................ 182
5.5 Areas for Further Study.................................................................................... 184
REFERENCES .................................................................................................... 185
APPENDICES ..................................................................................................... 205
APPENDIX 1 - Questionnaire ............................................................................... 205
APPENDIX 2 - KATO Members as at 13/09/2011 ................................................ 216

x
LIST OF TABLES
Table 3.1: Classification of Tour Operators by Ownership ...................................... 50
Table 4.1: Year of Incorporation of the Company ................................................... 62
Table 4.2: Positions of the Respondents .................................................................. 63
Table 4.3: Cronbach’s Reliability Alpha ................................................................. 65
Table 4.4: International Tourists Served Between 2006 and 2010 ............................ 68
Table 4.5: Local Tourists Served Between 2006 and 2010....................................... 70
Table 4.6: Approximate Net Profit from Year 2006 to 2010 .................................... 72
Table 4.7: Number of Permanent Employees........................................................... 76
Table 4.8: Human Resources and Their Skills ......................................................... 79
Table 4.9: Tourist Ferrying Vans Owned ................................................................ 81
Table 4.10: Importance of Other Fixed Assets Owned by the Firm .......................... 84
Table 4.11: Importance of Finance to the Firm ........................................................ 86
Table 4.12: Pearson Correlation Coefficient - Resources ......................................... 87
Table 4.13: Model Summary – Goodness of fit ....................................................... 89
Table 4.14: Analysis of Variance - ANOVA ........................................................... 90
Table 4.15: Regression Coefficients ........................................................................ 91
Table 4.16: Regression Coefficients ........................................................................ 92
Table 4.17: Government Policies .......................................................................... 100
Table 4.18: Firms With Written Guidelines, Rules and Regulations ...................... 102
Table 4.19: Organizational Policies ....................................................................... 105
Table 4.20: Model Summary – Goodness of fit ..................................................... 106
Table 4.21: Pearson Correlation Coefficient - Policies .......................................... 107

xi
Table 4.22: Analysis of Variance - ANOVA ......................................................... 108
Table 4.23: Regression Coefficients ...................................................................... 109
Table 4.24: Regression Coefficients of Policies Combined .................................... 110
Table 4.25: Computerised Firms and With Functional Website ............................. 115
Table 4.26: Website Features ................................................................................ 119
Table 4.27: Website Maintenance Problems .......................................................... 123
Table 4.28: Model Summary – Goodness of fit ..................................................... 125
Table 4.30: Regression Coefficients ...................................................................... 126
Table 4.31: Regression Coefficients on ICT .......................................................... 127
Table 4.32: Analysis of Variance - ANOVA ......................................................... 128
Table 4.33: Service Quality - Reliability ............................................................... 134
Table 4.34: Service Quality - Assurance................................................................ 136
Table 4.35: Service Quality - Tangibles ................................................................ 138
Table 4.36: Service Quality - Empathy .................................................................. 140
Table 4.37: Service Quality - Responsiveness ....................................................... 142
Table 4.38: Model Summary – Goodness of fit ..................................................... 144
Table 4.39: Pearson Correlation Coefficient - Service Quality ............................... 145
Table 4.40: Regression Coefficients ...................................................................... 146
Table 4.41: Coefficients of the Model after Dropping the Insignificant Sub-Variable
.............................................................................................................................. 147
Table 4.42: Regression Coefficients of the Final Model ........................................ 147
Table 4.43: Analysis of Variance - ANOVA ......................................................... 148
Table 4.44: Other Membership in Addition to KATO ........................................... 153
xii
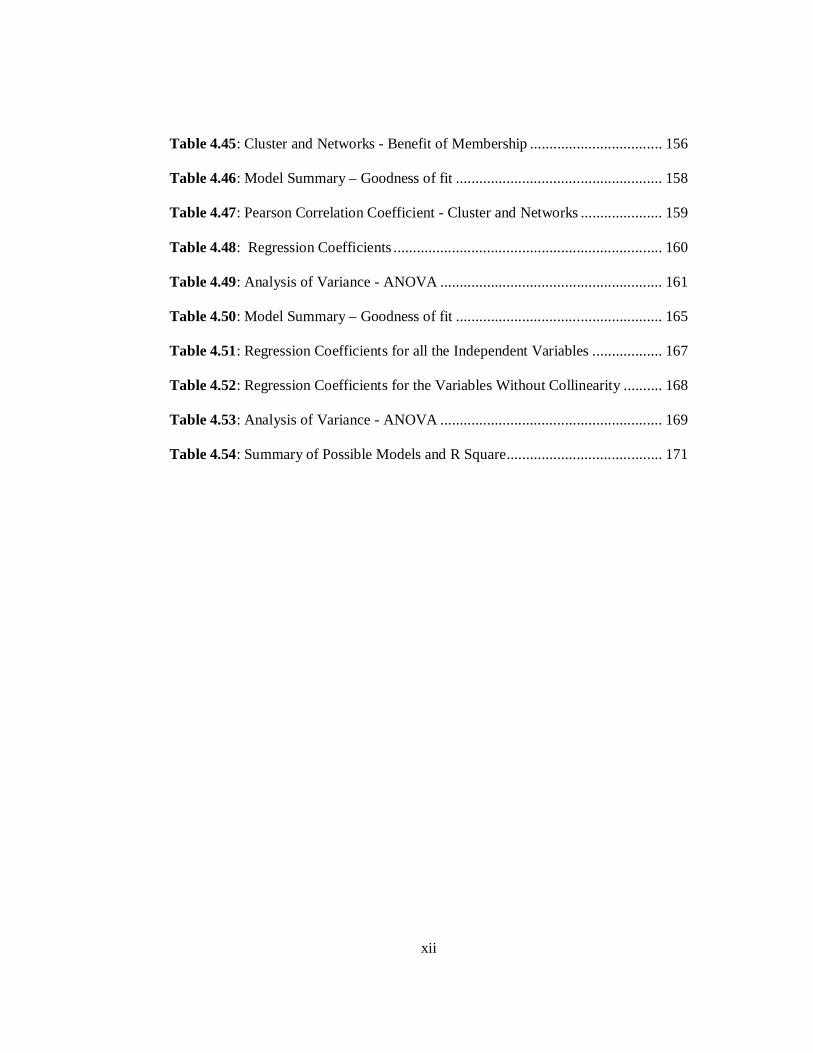
Table 4.45: Cluster and Networks - Benefit of Membership .................................. 156
Table 4.46: Model Summary – Goodness of fit ..................................................... 158
Table 4.47: Pearson Correlation Coefficient - Cluster and Networks ..................... 159
Table 4.48: Regression Coefficients ..................................................................... 160
Table 4.49: Analysis of Variance - ANOVA ......................................................... 161
Table 4.50: Model Summary – Goodness of fit ..................................................... 165
Table 4.51: Regression Coefficients for all the Independent Variables .................. 167
Table 4.52: Regression Coefficients for the Variables Without Collinearity .......... 168
Table 4.53: Analysis of Variance - ANOVA ......................................................... 169
Table 4.54: Summary of Possible Models and R Square ........................................ 171
xiii
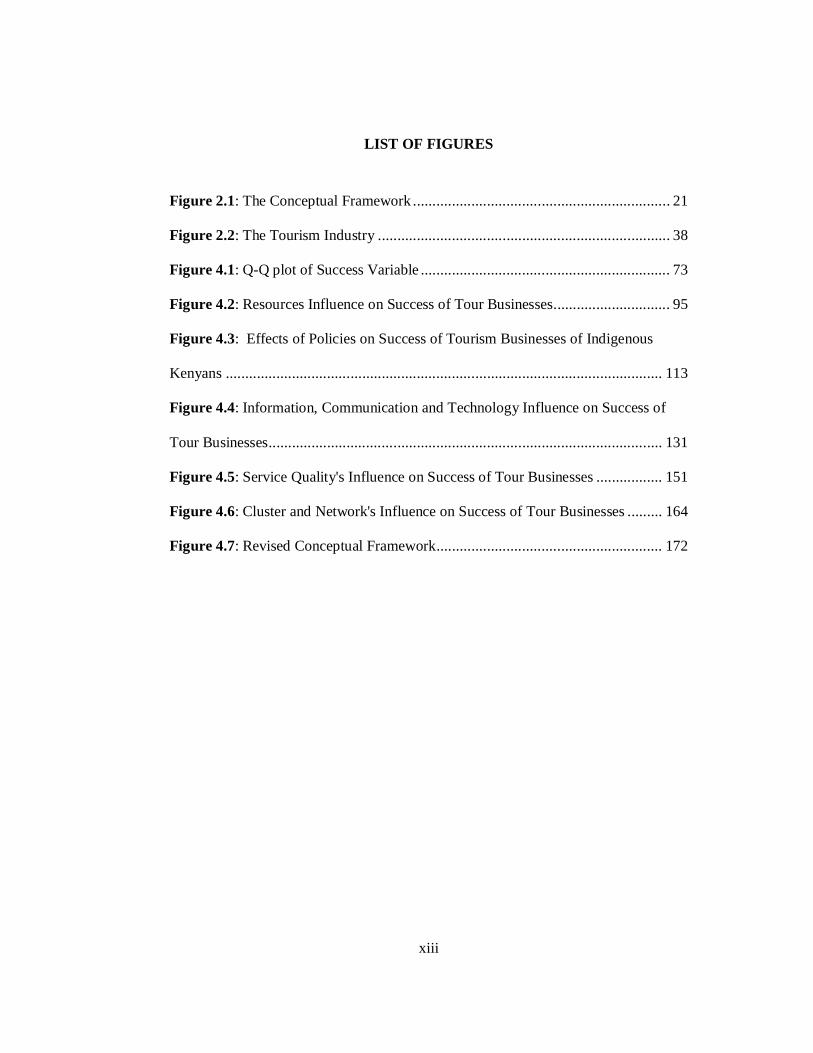
LIST OF FIGURES
Figure 2.1: The Conceptual Framework .................................................................. 21
Figure 2.2: The Tourism Industry ........................................................................... 38
Figure 4.1: Q-Q plot of Success Variable ................................................................ 73
Figure 4.2: Resources Influence on Success of Tour Businesses.............................. 95
Figure 4.3: Effects of Policies on Success of Tourism Businesses of Indigenous
Kenyans ................................................................................................................ 113
Figure 4.4: Information, Communication and Technology Influence on Success of
Tour Businesses ..................................................................................................... 131
Figure 4.5: Service Quality's Influence on Success of Tour Businesses ................. 151
Figure 4.6: Cluster and Network's Influence on Success of Tour Businesses ......... 164
Figure 4.7: Revised Conceptual Framework .......................................................... 172

xiv
ACRONYMS AND ABBREVIATIONS
CRM Customer Relationship Management System
FDI Foreign Direct Investment
GDP Gross Domestic Product
ICT Information, Communication and Technology
KATO Kenya Association of Tour Operators
KWS Kenya Wildlife Service
MDG Millennium Development Goals
RoK Republic of the Government of Kenya
UNCTAD United Nations Conference of Trade and Development
UNWTO United Nations World Tourism Organisation
WB World Bank

xv
DEFINITION OF TERMS
SUCCESS - There is no universally accepted definition of success, and business
success has been deduced in many ways for example survival, profit; return on
investment, sales growth, number of employed, happiness, reputation, and so on (Al-
Mahrouq, 2010). This study will define success as growth in terms of increase in
number of clients served and return on investment.
INDIGENOUS - Buijze (2010) defined indigenous as natives who are descendants of
the original populations residing in a country and still holds to their forefathers
culture. In this study, indigenous will mean Kenyans who have no roots in any other
country.
TOUR OPERATORS - Bennett and Schoeman (2005) defines tour operators as
intermediaries who organizes and puts together holiday packages which include:
arranging travel services (organizing for transfers to and from the destination airport,
car hire excursion), transport (road, rail, air, sea) and accommodation bookings (either
in hotels, guesthouses, self catering villas or apartments).

xvi
ABSTRACT
The main objective of this study was to determine the challenges hindering success of
tourism businesses owned by indigenous entrepreneurs in the tourism industry in
Kenya. Empirical literature showed that though tourism industry is the third largest
contributor to the gross domestic product, tour businesses owned by indigenous
entrepreneurs are yet to get a good share of the market share. It also informs that
foreign operators get high profits than local operators for example in the year 2007,
they earned an aggregate profit of 78 % as compared to 22% earned by the local
operators. In addition, technology has led to small margins and cut throat
competition as a result of independent travellers who access the suppliers directly
avoiding tour operators. Positivist research philosophy and descriptive research design
were adopted for this study. Stratified sampling method was used to ensure
representation from the six strata from the Kenya Association of Tour Operators
(KATO) classification. Sample size was 104 tour operators. The response rate was
79.86%. Statistical Package of Social Sciences version 16 was used as a statistical
tool for analysis. Descriptive analysis, exploratory factor analysis, multicollinerity
test, ANOVA test and linear regression tests were carried out for each variable. The
study found that all the independent variables: resources; policies; ICT; service
quality; and clusters and networks while analysed individually have positive influence
on the dependent variable success of tourism businesses owned by indigenous
entrepreneurs. The combined effect of all the independent variables shows a positive
effect of 84.9% on the dependent variable. However, the optimal model after
addressing multicollinearity was attained by three variables: Service Quality, ICT, and

xvii
Clusters and Networks. The study therefore concluded that success of tourism
businesses owned by indigenous entrepreneurs in the tourism industry can mainly be
achieved through high service quality level, adoption of ICT and engagement in
relevant clusters and networks. The major recommendations from the conclusions
includes: integration of service quality into the firm's strategic plan and values to
make it part of its policy, make an effort to get ISO certification through service
quality improvement via benchmarking and learning from those who have succeeded
in the business. In addition, local operators should also adopt ICT through
computerization, having functional websites with right features and well maintained.
Finally, local operators should create clusters and networks to achieve synergy. This
can be strengthened by joining other networks particularly in the virgin market to
enhance visibility and strategic positioning.

1
CHAPTER ONE
INTRODUCTION
This study sought to establish the challenges hindering the success of tour businesses
owned by indigenous entrepreneurs. This chapter introduces the study by briefly
describing the background of tourism industry global and local perspectives,
statement of the problem, objectives of the study, scope, justification and limitation of
the study.
1.1 Background of the Study
Definitions of tourism may vary depending on various stakeholders classified as
either supply or demand stakeholders by the United Nations World Tourism
Organisation (UNWTO, 1995). From demand stakeholders' perspectives, accepted
definition of tourism is “the activities of persons travelling to and staying in places
outside their usual environment for not more than one year consecutively for leisure,
business and other purposes”. From the supply stakeholders, tourism could not be
defined as different groups of business enterprises in the tourism industry offer
different goods and services thus there was no commonly accepted definition
(UNWTO, 1995). The Kenyan Tourism Bill 2010 concurs with the demand
stakeholders’ definition and defines tourism as “a person travelling to and staying in
a place outside his or her usual abode for more than twenty-four hours, but not more
than one consecutive year, for leisure, business or other purpose, not being a work-

2
related activity remunerated from within the place visited” according to the Republic
of Kenya (RoK) (RoK, 2010).
Tourism is the fastest changing industry in the world because of technological
changes. It also has the highest multiplier effect. Rowe, Smith and Borein (2002)
highlight the multiplier effect from the tourism industry as being caused by the direct
and indirect economic impact, where the direct includes benefit to the tourism
industry players like tour and travel operators, transporters, accommodation, attraction
sites and other tourist attractions. Indirectly, tourism promotes the economy through
goods and services like laundry supplier, food supplier, shops and banks used by
tourists during their visits. This in return creates employment thus eradicating
poverty and hunger in the society.
Tourism is an international industry and the biggest provider of jobs on the planet
earth owed to the heterogeneous stakeholders than in any other industry (Quian,
2010). It highly contributes to: the economic growth contributing to over 10% Gross
Domestic Product (GDP) in some countries, substantial foreign exchange earnings,
contributes to social development making many countries to look into the industry
with a lot of expectation, reduction of poverty in developing countries and its
geographical expansion and labour intensive nature support a spread of employment
without boundaries provided destinations are well maintained to attract tourism..
Bakic, Hrabrovski-Tomic, Muhi and Kovacevic (2010) concluded that the last five
decades have realised remarkable growth of tourist traffic and spending in the

3
international scale. Tourism is one of the top five exports for 83% of countries and
main source of foreign income for more than 38% of countries. As a result, tourism is
predominantly highly regarded by both developed and less-prosperous countries alike.
From the World Tourism Barometer in the year 2010, France led the global tourists
arrivals with 76.8 million tourists followed by United States, China, Spain and Italy
with 59.7, 55.7, 52.7, and 43.6 million respectively (UNWTO, 2011). Global tourism
spending saw Germany as the highest with 77.7 billion dollars. The other ranking for
spending is United States, China, United Kingdom and France with 74.6, 54.9, 48.6,
and 39.4 billion dollars respectively (UNWTO, 2011).
In Africa, in the year 2010, (data for 2011 not yet received for many countries), Egypt
which was rated 18 globally led the tourists arrival with 11.9 million tourists followed
by Morocco, South Africa, Tunisia and Mozambique with 8.3, 7, 6.9, and 2 million
respectively (UNWTO, 2011). In East Africa, Kenya (rated 10 in Africa) was first
with 1.39 million arrivals. The World Tourism Organisation forecasts that Africa will
receive 77.3 million international tourists by 2020 (UNWTO, 2001). It also predicts
long-haul travel to Africa will grow at a slower rate than intraregional travel. This
will result to almost twice as many intraregional arrivals recorded than for long-haul
source markets by 2020. The UNWTO has described African countries to have
extensive, dynamic tourism product development programmes, which are crucial to
their development policies with structured and integrated long term strategies.

4
1.1.2 Tourism Industry in Kenya
Tourism is one of the Kenya’s main contributors to the economic growth at a rate of
10% to the Gross Domestic Product (GDP) and creating 9% formal employment.
Tourism sector is the third largest contributor to the GDP after agriculture and
manufacturing and the third leading foreign exchange earner after tea and horticulture.
However, the sector recorded the highest growth rate of 18.6% in 2009 among the
three leading foreign exchange earners. Consequently, the sector is discussed in key
Government of Kenya (GoK) policy papers including Vision 2030 (2007), the
Tourism Master Plan (1995), Poverty Reduction Strategy Paper (2001-2004), the
Millennium Development Goals (1999-2015), the Economic Recovery Strategy for
Employment and Wealth Creation (2003-2007), and various National Development
Plans (RoK, 1995, 2004, 2005, 2007, 2011). They all emphasize the need for
efficiency and better management of the tourism industry to enable the Government
achieve its strategic objectives of growth, productivity, and improvement in service
delivery to the Kenyan citizens.
Kenya tourism industry has a lot to offer to the tourists as it has all the terrains and
sites including the beach and virgin natural forests with wildlife. Apart from building
of national economy by providing the opportunities for employment being a labour
intensive industry, foreign exchange earnings, income and government revenues, the
tourism industry plays other important roles making its demand increase. For
instance, it helps to pay for and justify infrastructure development that also serves
general community and economic needs.

5
Tourism is an exceedingly diverse and fragmented industry which comprises a wide
variety of tourists' services and activities from several stakeholders including the
government, financial institutions, tour and travel operators, transporters, parks and
game reserves, hospitality industry, cultural heritage shops, other related industries
and the community at large. It provides recreational, culture and commercial facilities
and services for use by both international tourists and communities within the vicinity
that may have not been developed without it. Tourism however, can also generate
various problems such the loss of potential economic benefits and local economic
distortions, environmental degradation, loss of cultural identity and integrity, and
cross-cultural misunderstandings thus reinforcing existing prejudices (RoK, 2011).
This study concentrated on international tourism though it is known that domestic
tourism also contributes to the economy growth. The year 2010 recorded the highest
number of tourists arrivals ever in Kenya at 1,095,945 tourists as at 31st December,
2010. This was 15% increase from year 2009.
The study also concentrated on the tour operators activities in the industry and their
success in the business. The main tasks of tour operators among others include
negotiation of rates with suppliers, booking accommodation and other arrangements,
assisting with itinerary planning, provision of meet and greet services; provision of
ground transportation, provision of local tours, provision of local, step-on guides,
coordination and administration of local arrangements and services, or subcontracting
these services in some instances, and on-site problem solving as indicated by the
Economic Planning Group (EPG) in Canada (EPG, 2005). This makes the tour

6
operators' product different from other products in the sense that it is intangible,
heterogeneous, perishable, and mostly suffer from inseparability by being not able to
sell in bits (Saffery, Morgan, Tulga & Warren, 2007).
In this study, the tour operators were classified according to their owners. The three
main categories were foreign owned (100% or through strategic alliances), locally
owned by the Kenyans who have roots in other countries for example Britain and
India, and locally owned by indigenous entrepreneurs. This study concentrated on
locally owned by indigenous entrepreneurs category which was simply referred as
‘local tour operators’. From the membership list of the Kenya Association of Tour
Operators (KATO) in the year 2011, 142 members are indigenous Kenyan owned tour
operators.
1.2 Statement of the Problem
As Kenya encourages foreign direct investment (FDI), the tourism sector, particularly
the tour operators have received direct investors in the business. Local operators own
about 47% of the business and 82% among them are either at the lowest category ‘E’
which earn less than USD 140,000 per year or at the ‘Associate’ category which is for
new members who are yet to complete one full year in membership, only 3% of the
local tour operators are in category ‘A’ exceeding USD 1.7 million annually as
turnover (KATO, 2011).
UNCTAD (2008) reported that foreign operators got an aggregate profit of 78 % in
the year 2007 as compared to 22% earned by the local operators. World Bank's report

7
on Tourism development in Kenya concluded that most of Kenya's tourism bookings
is handled and organised by foreign tour operators and non-indigenous entrepreneurs
tour operators with branches abroad (WB, 2009).
Failure of tour operators in Kenya will mean loss of employment to locals, less
foreign exchange for the country (as the foreigners retain the profits abroad and only
brings into the country what will be used by the tourists) (Sinclair, 1990). In addition,
supply chain members suffer as a result of foreign instead of local purchases for the
industry. This ultimately leads to low social equity. It might also lead to degradation
and depletion of resources as the foreigners may not have same interest on the same
as the local Kenyans. Sustainability of the industry could also be threatened as well
as attainment of Kenya's Vision 2030. The purpose of this study was therefore to
investigate challenges hindering success of tourism business owned by indigenous
entrepreneurs in the tourism industry in Kenya
1.3 Study Objectives
1.3.1 General Objective
The general objective of this study was to investigate the challenges hindering the
success of tourism businesses owned by indigenous entrepreneurs in the tourism
industry in Kenya.
1.3.2 Specific Objectives
The specific objectives of this study were to:

8
1. Investigate the effect of resources on success of tourism business owned by
indigenous entrepreneurs in the tourism industry in Kenya.
2. Determine the effect of policies on success of tourism businesses owned by
indigenous entrepreneurs in the tourism industry in Kenya.
3. Establish the effect of information and technology on success of tourism
businesses owned by indigenous entrepreneurs in the tourism industry in Kenya.
4. Investigate the effect of service quality on success of tourism businesses owned by
indigenous entrepreneurs in the tourism industry in Kenya.
5. Establish the effect of clusters and networks on success of tourism businesses
owned by indigenous entrepreneurs in the tourism industry in Kenya.
1.4 Research Hypotheses
The research hypotheses that guided this study are outlined below:
1. Ho: Resources do not affect the success of tourism businesses owned by
indigenous entrepreneurs in the tourism industry in Kenya
2. Ho: Policies do not influence the success of tourism businesses owned by
indigenous entrepreneurs in the tourism industry in Kenya
3. Ho: Information and technology does not have an effect on success of tourism
businesses owned by indigenous entrepreneurs in the tourism industry in Kenya
4. Ho: Service quality does not influence the success of tourism businesses owned by
indigenous entrepreneurs in the tourism industry in Kenya

9
5. Ho: Clusters and networks do not affect success of tourism businesses owned by
indigenous entrepreneurs in the tourism industry in Kenya
1.5 Scope of the Study
The scope of the study was limited to the local tour operators registered by the Kenya
Association of Tour Operators (KATO) located in Nairobi. This was guided by
conclusion of Kenya Tourism Board that 90% of those located in other regions are
branches to those in Nairobi (RoK, 2010). This could be because of the international
airport based in Nairobi and the fact that it is central to many tourist attraction sites.
In the “Ease of Doing Business 2010” Nairobi was classified first in ease of starting a
business with 12 procedures, taking 34 days and costing 36-5% of income per capita
which could also have contributed in this (WB, 2010).
1.6 Justification of the Study
As indicated by Ngesa and Cavagnaro (2010) in their study on Sustainable Tour
Operating Practices which was a case study of the inbound tour operators in Kenya,
literature on tour operators is almost non-existent in Africa. They concentrated on the
large tour operators in their study. Okech (2004) studied on The Role of Tour
Operators in Sustainable Ecotourism: Lessons from Kenya and also indicated there is
limited research in the area of tour operators. Other studies carried out in Kenya
concentrates on the tourism industry as a whole and none looked into the performance
of indigenous owned firms in the industry.

10
This study will thus benefit trainers and educators in efforts to develop the right mix
of success factors for tour operators. Policy makers will also benefit as the factors
will be an eye opener on what policies can be changed to ensure success and ultimate
growth of local tour operators. The results of this study can be used by local
operators to improve their businesses and ultimately growth of their firms which will
be proven by increase in number of tourists served and return on investment. This
will result to achievement of Vision 2030 and achievement of the Millennium
Development Goals.
1.7 Limitations of the Study
To save time and cost, the study intended to use email technology to send and receive
the questionnaires. Though many acknowledged receipt of the email, out of the sent
104 emails, only six (6) respondents sent their filled questionnaires back. This forced
reverting to hand delivery where questionnaires were printed, delivered and collected
from the respondents. The response rate increased to 83 from the original six. This
shows that many of the local tour operators are still using paper and pen and have not
moved to the digital arena where pens might mislay their value since even signatures
are now digital.

11
CHAPTER TWO
LITERATURE REVIEW
2.1 Introduction
This study sought to investigate the challenges hindering success of tourism
businesses owned by indigenous entrepreneurs in the tourism industry in Kenya. This
chapter reveals the conceptual framework where the proposed main variables in this
study were exposed. The theories and strategies that can be used by the local tourism
businesses to succeed in their business are highlighted and discussed. In addition,
empirical studies in relation to this study are included.
2.2 Theoretical Framework
This study sought to investigate challenges hindering success of tourism businesses
owned by indigenous entrepreneurs in Kenya. Theoretical framework outlines
genesis of the variables studied by expounding theories them. The theories and
models are analyzed per variable under investigation and they informed the
hypothesis taken to investigate the variables.
2.2.1 Effects of Resources on Success
As one of the independent variable, resources was grounded on different theories and
models. These include the following as discussed below: the Resource Based View
Theory by Penrose (1959), Whole Tourism Systems Model by Leiper (2004), and the
Porter's Diamond model.

12
Resource-based View Theory
Penrose worked on basics of resources-based theory asserting complementary
resources create value (Penrose, 1959). It was furthered by Barney (1991) as the
resource-based view (RBV) concluding that to achieve competitive advantage, firms
should possess resources that are valuable and rare to create competitive advantage
and ultimately superior long-term performance. When a company finds their own
resources not competitive like easy to imitate, little value, not scarce and can be
replaced, they will seek a company outside that has valuable resources to form an
alliance (Barney, 1991). Miller and Freisen (1982) divided resources into property-
based resources and knowledge-based resources according to imitation obstacles of
resources.
Many scholars have used this theory to look into the competitiveness of a firm (Gaur,
Vasudevan & Gaur, 2011; Ivanovic, Katic, & Mikinac, 2010; and Miller & Freisen,
1982). Resources thus cannot be overlooked when undertaking research on success of
a firm as competitiveness leads to success and therefore it was found to be a valuable
variable to investigate on the local tour operators tourism businesses.
In this study resources was subdivided into four parts for deeper analysis based on
the tourism industry. These include: 1)Human resources - number of employees, their
skills and education background, training in tourism industry and language skills in
addition to English; 2)Tourist ferrying vehicles; 3)Other assets owned by the firms;
and 4)Finance - its availability, accessibility and collateral demand for the same.

13
Whole Tourism System (WTS) Model
The WTS model by Leiper looks at tourism as a system which is a set of parts or
elements that are connected to one another by at least one distinguishing principle
(Leiper, 2004). Leiper argues that the only requirements for tourism is “a tourist, a
tourist generating place - where trips begin and end, a tourist destination place, a
transit route, and a tourism industry”. The model reveals the need of resources for
success of tourism. These resources includes: transport modes and accommodation.
This model therefore informed the study variable resources as it outlines the transport
modes as a feature that could hinder success. Tourist ferrying vehicles were therefore
studied as part of the resources with aim of understanding how the local tour operators
embraced the model.
Porter’s Diamond Model
The Porter’s diamond elaborates his thinking into clustering of industry with four
main internal variables. These include:- factor conditions, demand condition, strategy
of the company structure and the related and supporting industries. Two other
external variables - government and chance are also included in the model (Porter,
1990).
The factor conditions include among others the human resource, knowledge
resources, capital, physical resources and infrastructure. The demand conditions
include the structure of domestic demand, size of demand and pattern of growth and

14
the internalization. The strategy of the company structure and rivalry includes the
strategy and structure, goals, personal goals and rivalry among the local companies.
The related and supporting industries include suppliers, customers and related
structure.
This model informed different variables investigated on this study as outlined in
different sections on theoretical review. Resources variable was particularly informed
by the factor conditions which include among others the human resource, knowledge
resources, capital, physical resources and infrastructure. Human resource drives the
industry as the systems and processes cannot drive themselves. This study therefore
investigated their level of education and skills in the tourism industry.
2.2.2 Effects of Policies on Success
Policies as an independent variable was instigated by the Chris Cooper Model of 1992
and the Porter's Diamond model. Chris Cooper Model will be discussed below.
Porter's diamond model was discussed previously and therefore will not be elaborated
though it is important to mention that the Government variable in the model instigated
policies as a variable. Government policies determine ease or otherwise of doing
business which ultimately leads to success of a firm. This was therefore investigated
in this study to see if it is affecting the local operators in success of their tourism
businesses.

15
Chris Cooper Model
Chris Cooper model of 1992 outlines “Whole Tourism System” (WTS) which
describes interaction of the WTS to its environment particularly the political,
economical, social, technological, ecological and legal (PESTEL). It also takes into
consideration other factors like the global warming, safety, and the market forces.
The policies put in place by the government and tourism businesses having closely
monitored the environment will determine success or failure of the businesses (Leiper,
2004).
Though the model ignores the tour operators as an important in the tourism link, this
study borrowed from it the policies variable as the government policies discussed
therein affect the tourism businesses equally. Marketing also as indicated in the
model is only possibly implemented using policies internally put in place by the
organisation. It was therefore critical for this study to investigate what the tour
operators have in terms of organizational policies.
2.2.3 Effects of ICT on Success
As an independent variable, ICT was informed by the Porter's Five Forces Model.
ICT has changed the world and thus instigated changes particularly in the tourism
industry causing ripples particularly to the tour operators businesses owing to
availability of information to the tourists. The Porter's Five Forces Model as
discussed below indicated the need of investigation of ICT as embraced by the local
operators for success of their businesses.
16
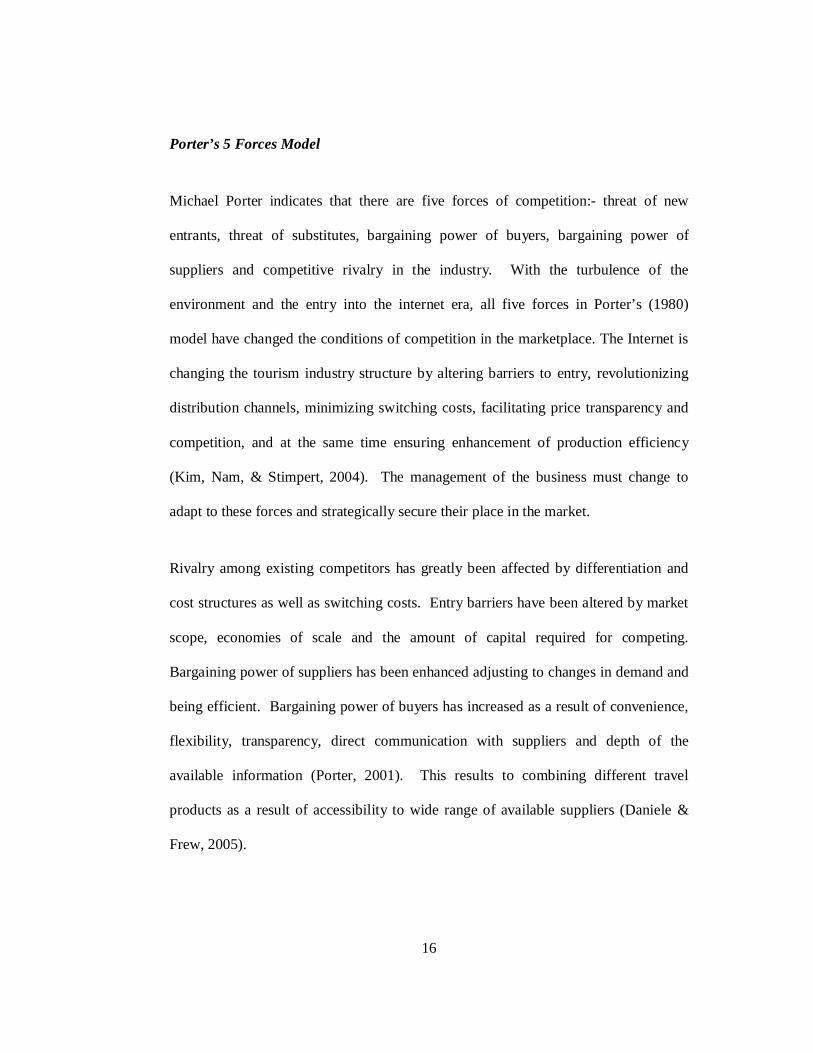
Porter’s 5 Forces Model
Michael Porter indicates that there are five forces of competition:- threat of new
entrants, threat of substitutes, bargaining power of buyers, bargaining power of
suppliers and competitive rivalry in the industry. With the turbulence of the
environment and the entry into the internet era, all five forces in Porter’s (1980)
model have changed the conditions of competition in the marketplace. The Internet is
changing the tourism industry structure by altering barriers to entry, revolutionizing
distribution channels, minimizing switching costs, facilitating price transparency and
competition, and at the same time ensuring enhancement of production efficiency
(Kim, Nam, & Stimpert, 2004). The management of the business must change to
adapt to these forces and strategically secure their place in the market.
Rivalry among existing competitors has greatly been affected by differentiation and
cost structures as well as switching costs. Entry barriers have been altered by market
scope, economies of scale and the amount of capital required for competing.
Bargaining power of suppliers has been enhanced adjusting to changes in demand and
being efficient. Bargaining power of buyers has increased as a result of convenience,
flexibility, transparency, direct communication with suppliers and depth of the
available information (Porter, 2001). This results to combining different travel
products as a result of accessibility to wide range of available suppliers (Daniele &
Frew, 2005).

17
Threat of substitution has now become more difficult as differentiation is not realised
because of internet (Go, Govers & van den Heuvel, 1999). Bargaining power of
suppliers has changed allowing direct contact with consumers and decreasing
distribution costs whilst creating the opportunity for partnerships with countless
affiliates and distributors (Buhalis & Zoge, 2007).
Though literature reveals that competitiveness of a firm is threatened by the five
forces above, Andriotis (2004) added that the forces in the tourism industry could
increase to seven with the extra two being the power of information and the impact of
government regulation. He also added the power of intermeidaries could be added to
the bargaining power of buyers. This was on a study - Revising Porter’s Five Forces
Model for Application in the Travel and Tourism Industry -conducted in Greece. The
current study borrowed from this and investigated ICT and government policies on
tourism industy in Kenya.
2.2.4 Effects of Service Quality on Success
Service quality as an independent variable was supported by the Service Quality
Model by Parasuraman, Zeithaml and Berry (1990). This is discussed below and its
relationship to the variable as investigated in the study.
SERVQUAL Model
SERVQUAL model, also referred to as PZB model, was developed as a framework
for quality measurement in the service industry. It is thus used by management to

18
measure and bridge the gap between customer's expectation and experience
(Parasuraman, Zeithaml, & Berry, 1990). It is anchored on 5 dimensions: Reliability -
dependability, accurate performance; Assurance - competence, courtesy, credibility
and security; Tangibility - appearance of physical elements; Empathy - easy access,
good communications and customer understanding; and Responsiveness - promptness
and helpfulness. Literature (Jooste, 2005) referred to tangibility as an additional P in
the marketing mix as "physical evidence" that should be one of the marketing tools in
tourism industry.
The trio came up with the gaps model in 1990 which proposes five gaps as a result of
perception and the actual service received. Gap 1 represents the difference between
customer’s expected service and the management perception of those expectations.
Gap 2 - difference of management’s perceptions on the expectations and service
quality specification. Gap 3- difference on the service quality specification and the
real service delivery. Gap 4 - difference between the real service delivery and the
external communications to the customers. Gap 5 – difference between the expected
service and the perception of the received service. Gap 5 is thus a function of Gap 1,
2, 3, and 4 (Huang, 2007). Higher expectation of service quality in relation to actual
performance leads to lower level of perceived quality. The gaps model thus serves as
useful diagnostic tool into why the service quality is failing. Though critisized by
Buttle (1996) for failure to draw from existing economic theory as the 5 dimensions
are not universal, it still remains the only valuable model in the service industry.

19
As the current study looks into the local tourism businesses success, the service
quality is crucial as an independent variable. Repeat sales are because of the past
experience and confidence of the customer to the firm. From the first four gaps, the
management reflection on potential service failure as a result of its action is necessary
to understand if there are gaps that could cause the service quality failure.
2.2.5 Effects of Clusters and Networks on Success
As an independent variable, clusters and networks was supported by the Porter's
Diamond Model. This Model was discussed under section 2.2.1 and therefore only
what relates to clusters and networks will be discussed below and its relationship to
the variable as investigated in the study.
Porter’s Diamond Model
The Porter’s diamond elaborates his thinking into clustering of industry with four
main internal variables. These include:- factor conditions, demand condition, strategy
of the company structure and the related and supporting industries. Two other
external variables - government and chance are also included in the model (Porter,
1990).
The related and supporting industries variable relates to the clusters and networks
required for success of any firm by strengthening each other. The strength of any of
the six variable strengthens the whole cluster while weakness of one brings the whole
cluster into rumbles (Ivanovic, Katic, & Mikinac, 2010). In the tourism business, the

20
tour operator can only get more business if they network with others particularly from
the source market. This means close relationships and collaborations to ensure that
the tourists book through them through the agents in the same network. This study
therefore ought to sought out the clusters and networks joined by the tour operators
and the benefits achieved by the same.
2.3 Conceptual Framework
Conceptual framework has been defined or described by authors differently but all are
closely related (Goetz and LeCompte, 1984; Guba & Lincoln, 1989; Miles &
Huberman, 1994; Reichel & Ramey, 1987; and Smith, 2004;). It can be summarised
as a tool providing clear links from the literature to the study goals and questions.
This study was guided by various variables emanating from theoretical review as
illustrated in figure 2.1. Agarwal (2009); Gall, Gall, and Borg (2007); King'oriah
(2004); and Marczyk, DeMatteo, and Festinger (2005); defined a variable as anything
that can take on different values or quantitative expression of a construct usually
measured in terms of scores on an instrument. They also classified variables into
dependent and independent variables. The independent variable is one that is
manipulated or controlled by the scholar and its effects examined. It is independent of
the outcome being measured. In this study, the independent variables were: resources,
policies, ICT, service quality, and clusters and networks. The dependent variable is
measured by the effect of the independent variable (if any). In this study, the
dependent variable is success of tourism businesses owned by indigenous
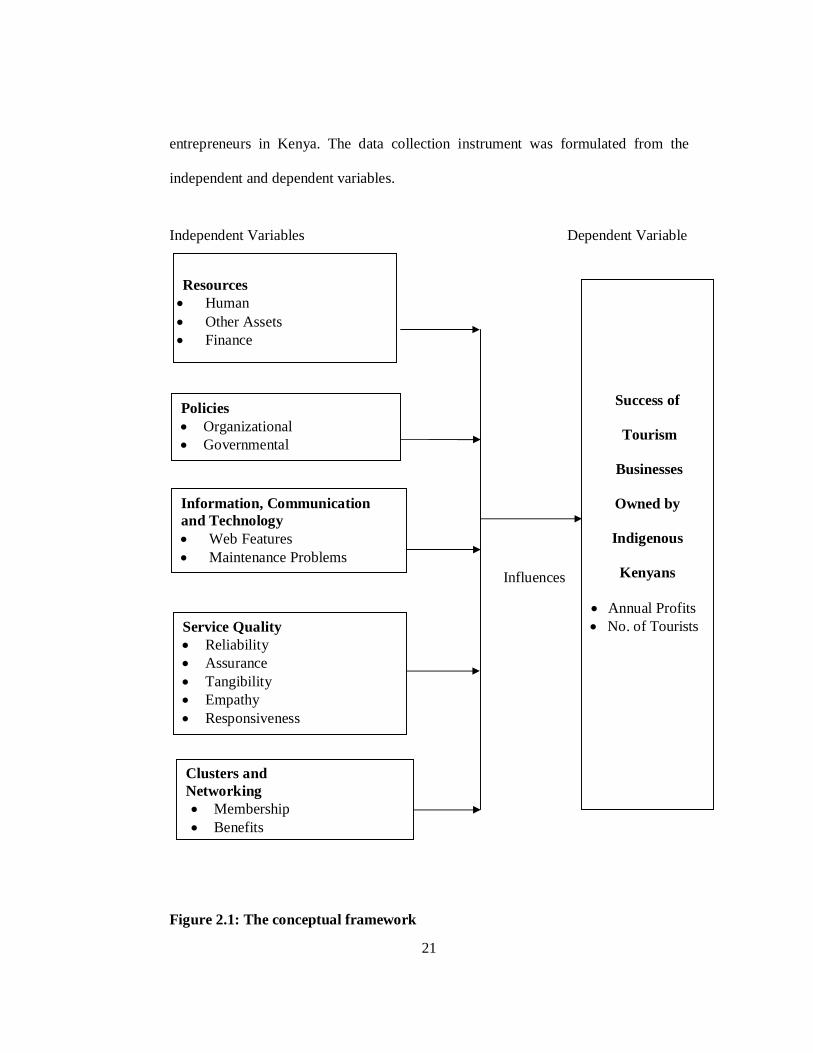
21
entrepreneurs in Kenya. The data collection instrument was formulated from the
independent and dependent variables.
Independent Variables Dependent Variable
Influences
Figure 2.1: The conceptual framework
Clusters and Networking Membership Benefits
Resources Human Other Assets Finance
Policies Organizational Governmental
Information, Communication and Technology Web Features Maintenance Problems
Service Quality Reliability Assurance Tangibility Empathy Responsiveness
Success of
Tourism
Businesses
Owned by
Indigenous
Kenyans
Annual Profits No. of Tourists

22
2.4 Empirical Review
Dayahka (2007), Dudgeon (2008) and Goodwin (2005) described empirical research
as a way of gaining knowledge by analyzing quantitatively or qualitatively previously
conducted researches. This section will cover previous studies undertaken on the
dependent and independent variables as highlighted on the conceptual framework.
2.4.1 Effects of Resources on Success
Kotelnikov (2011) defined resources as the “inputs into a firm's production process,
such as capital, equipment, the skills of individual employees, patents, finance, and
talented managers. ... it is through the synergistic combination and integration of sets
of resources that competitive advantages are formed”. Gaur, Vasudevan and Gaur
(2011) argued that firms that have more resources at their disposal are likely to have
a greater capability to respond to the demands. Miller and Freisen (1982) adds that
firms need resources to invest in systems, product improvements, new product
development, process enhancement, customer satisfaction, organizational challenges
and response competitor challenges.
Bankole and Odularu (2006) in their study, Achieving Millennium Development
Goals: Issues and Options for Nigeria’s Tourism Industry, highlights lack of finance
or its access as one of the hindrances to tourism business. Lack of collaterals required
by the banks and cumbersome loan guarantying process remains a challenge while
seasonality of tourism accelerates the risk of non-performance. Low entrepreneurial
skills and information gap on how and where to obtain funds also contribute to the

23
problem. Finance is an important resource in business success. It will be important to
find out its effects on success in the tourism businesses. This could not be so different
in Kenya as a result of high interest rates changes by the banks. Seasonality of the
business as indicated by Tureac and Anca (2008) could also lead to defaulting of
repayment.
Nordin (2003) in study, Tourism Clustering and Innovation - Paths to Economic
Growth and Development, carried out in Sweden acknowledged that human resource
and qualified staff in particular are crucial to success and vital for innovation in the
tour operating firm. Though innovation in the tourism industry do not last the
competitive advantage because of un-protectability of the innovation, many new ideas
and concepts can only come from knowledgeable staff. She concludes that with
highly knowledgeable staff, it is easy to join clusters that ultimately blocks
competition through greater control of the market via synergism. Her study was used
as a basis by Osterwalder and Pigneur (2009) in their study, Business Model
Generation, conducted in Amsterdam which asserts three reasons for creating
partnerships are: optimization and economy of scale; reduction of risk and uncertainty
and acquisition of particular resources and activities. They however notes that local
operators often regard each other as competitors and not colleagues resulting in little
or no mutual trust among enterprises. This diminishes chances of potential knowledge
transfer and may restrain development of successful cluster.
Trivun, Kenjic, and Mahmutcehajic (2008) in their study, Life -Long Learning
Strategies in Tourism and Hotel Industry, insists that training can be carried out as

24
work-based activities, courses, seminars, conferences, self directed and informal
trainings (for example evening classes initiated by the employee) and also voluntary
work by staff out of office. Other basic competencies could be problem solving skills,
team work, foreign language as well as IT skills. Staff selection in the tour and travel
operators firms should be done with consideration of skills and attributes of the
employee like people skills, flexibility, good personality and high working ethics.
Employee professional development is expected for high quality service delivery. The
findings match with those of Mafunzwaini and Hugo (2005) in their study Unlocking
the Rural Tourism Potential of the Limpopo province of South Africa and those of
Khan (2008) in his study Human Resource Development in Tourism Industry in India.
Human resource was therefore looked at as one of the independent factors and its
effect to success was analyzed.
2.4.2 Effect of Policies on Success
Policies dictate what needs to be done and guides their users. They can be internal or
external policies. In this study, both were discussed as management and government
policies.
Government Policies
National Competitive Council (2004) defines regulatory policy as “the administrative
burden that falls on existing firms as a result of the need to comply with legislation
and regulations (often cumulatively described as ‘red tape’)”. The government
policies are exerted in areas like business and labour market regulation, competition,

25
international trade and investment, taxation and macroeconomic management on
business flexibility, cost competitiveness and innovation. Protecting the nationals and
discouraging foreigners in the industry is also a role of government. Signing of
international agreements like General Agreement on Trade and Services (GATS)
increases the power of the global society protecting foreign operators by reducing or
eliminating barriers in the international trade (Edgell, 1999).
In Kenya, the main body for regulation of the tourism policies is the Ministry of
Tourism. Its mission is to facilitate sustainable tourism for national development and
posterity and its vision is to make Kenya the destination of choice and a global leader
in sustainable tourism. It is responsible for the formulation, coordination and
administration of policy in respect to the tourism sector as mandated by the
Presidential Circular No. 1/2008 of May 2008 and various Acts of Parliament (RoK,
2011). The Ministry is also responsible for overall guidance and policy coordination
for other state corporations and organisations created by the government which
includes: Kenya Tourist Development Corporation (KTDC), Kenya Tourist Board
(KTB), and Tourism Trust Fund (TTF) among others (RoK, 2011).
World Bank (2010) highlights the role of national governments in Africa as central to
tourism development. Not only should the government’s aim to reduce poverty levels
and ensure economic and environmental sustainability but they should look into
policy frameworks, incentives and regulatory framework that enables thriving of the
tourism sector. The strategies that the government can use includes: image position,

26
promotion, destination organisation and information technology support (Quian,
2010).
Rogerson (2007) in study, Reviewing Africa in the Global Tourism, conducted in
South Africa concludes that the main challenge in implementation of the government
policies is the political power struggles and different values that often exist within the
policy process. As a result, the triple-bottom-line priority favours the economic over
the social and environmental concerns. These findings support those of Ikiara and
Okech (2002) in their study Impact of Tourism on Environment in Kenya: Status and
Policy.
Buijze (2010) in his study Governments and Tourism conducted in Netherlands
concludes that for governments to stimulate or discourage tourism in a country, they
are motivated by economic benefits, conservation of culture, ideological reasons, or
ecological preservation. Tourism is dependent on the government with power to
provide political stability, security, infrastructure and a financial and legal framework
which are necessary for the tourism industry. Government policies that affect tourism
either directly or indirectly are taxation, interest rate policy, bilateral air agreements,
environmental policy, customs and immigration policy, communications policy,
minimum wage policy, welfare policy, education policy, cultural policy, foreign
investment policy/regulations, local zoning policy, national, provincial and local
policy concerned with the funding support for major public facilities, legal systems,
infrastructure policy and currency/exchange rate policies. Protecting the nationals
and discouraging foreigners in the industry is also a role of government. Signing of

27
international agreements like General Agreement on Trade and Services (GATS)
increases the power of the global society protecting foreign operators by reducing or
eliminating barriers in the international trade (Edgell, 1999).
The difference on the three studies above could be as a result of the level of
development between the three countries – South Africa, Kenya and the Netherlands.
They however all agree on economic benefit of tourism to a country and the
government’s role being crucial. Government policy will thus be studied on as an
independent variable to find its effect on success of tourism businesses.
Organizational Policies
According to Cole (2004) an organizational policy statement is made to indicate to
those concerned just what the organization will and will not do in pursuance of its
overall purpose and objectives. Scholars such as Mullins (2007) explain that the
process of policy development starts with setting a goal for the organization which is
translated into objectives and policy. This can only come about following proper
management skills which lead to: reconciling the interests of all the stakeholders;
optimizing utilization of resources; managing changing environment; expanding the
size of business; providing innovation; tackling business problems; directing the
organization and providing co-ordination (Gomez-Mejia & Balkin, 2002).
Peters, Frehse and Buhalis (2009) in their conceptual study on the Importance of
Lifestyle Entrepreneurship in the Tourism Industry in Sweden highlights the key
elements of entrepreneurship to be change initiation, creating resourcing, innovation

28
and creativity, knowledge leadership, opportunity alertness and timing of actions.
These are as a result of the policies in place by the management. These views had also
been shared by Buhalis (2000); Buhalis and Main (1998); and Morrison and Thomas
(1999).
Mafunzwaini and Hugo (2005) in study Unlocking the Rural Tourism Potential of the
Limpopo Province of South Africa concludes that with the goals of tourism industry
being economic growth and diversification, employment generation, increased
investment, population retention, infrastructure and facility provision and
conservation; fairly standard policy goals has been put in place. Nevertheless, actual
strategic process by which they can be achieved is not standard. Strategy formulation
and re-defining of the process should be done. This will lead to implementation of the
strategy to bring about success of the tour and travel operators.
2.3.3 Effect of Information, Communication and Technology on Success
As web-based technologies pick up, modes of passing the information; gathering,
processing and communication of information becomes instant (Kiprutto, Kigio &
Riungu, 2011). This has reduced the distance and time barriers resulting to efficiency
and effectiveness. Other benefits include new marketing strategies, mitigation of
perishability and ultimate enhanced profit margin. Challenges in IT includes:
availability of internet connections, speed of the same, high costs of acquiring the
machines and the software, cost of hiring skilled IT personnel, constant updating of
information and competition from larger well established firms. In addition, Sheldon

29
and Yu (2001) in their study, Applications and Benefits of Tourism Information
Technology in Travel Intermediaries, in Taiwan reveals that only large intermediaries
spend a lot on IT investment.
As Alipour, Hajaliakbari, and Javanbakht (2011) concluded in their study, Impact of
Web-Marketing Mix (4s) on Development of Tourism Industry in Iran, in the current
times tourism and internet are inseparable and highly correlated. ICT has turned the
4Ps of marketing (product, price, promotion and place) into 4S's marketing mix
model. The 4S's are: the scope, the site, the synergy and the system. The scope refers
to general acceptance and utilization of e-commerce by the organization. The site is
the web-site, its development and acceptance by the customers. The synergy refers to
integration of the firm both internally and externally. The system refers to the
technical issues like the software and hardware to be used depending on what is
expected of the same. This has by far decreased costs and as a result increased profits.
E-tourism has come up as a result of the internet and it is phasing out the traditional
services by provision of tools that offer supporting services of high quality at low
costs. With the internet services liberalisation just settling down in Kenya, it would
be of importance to find out how the 4S’s model is working out for the local tour
operators.
Website features of a firm also can influence their success as found out by Victor
(2008) in a study in Mauritius and Andaman Island. The website features were
classified into 7C's. The 7C's included (1) Content - with examples of essential
information such as itineraries/tour/product info, maps, security/privacy statement,

30
click-through content, quality assurance and price information (2) Community -
which referred to customer postings and user-to-user interactions (3) Customization -
Multi-language service, personalized service, loading specifications and search
function (4) Communication - frequently asked questions (FAQs), email form, online
registration, newsletters, call center and offline contact details (5) Connection - useful
links and affiliate links (6) Commerce - Online reservation, online payment, online
cancellation and cross-selling (7) Context - Sitemap, main menu, multimedia
contents, cookies placement, search engine optimized, resident software required,
look and feel, transactional utility and alias.
Sciarelli, Corte and Celiento (2005) in their study, Innovations in the Distribution of
Tourist Products, conducted in Italy maintained that tourism industry is
hypercompetitive because of ICT which has brought with it rapid changes in tastes,
growing variety and variability in demand, global and highly information and
knowledge-based competition where the players in the industry try to out-smart one
another. Networks and partnership were looked into as source of synergy in
competition. ICT solutions impacts on the networks and partnership to support
growth corporate strategies. Sustained competitive advantage is based on
entrepreneurial and managerial capabilities, organizational skills and member’s
resources. Choosing the right members for the network is also discussed in their
study. This forms a good background for the current study. However, other
environmental factors like the political, social, ecological and legal are not looked at
like contributors to innovation in the distribution channels.

31
Potgieter, Jager and Van Heerden (2010) in their study Type of Tour Operations
Verses Type of Information Systems in South Africa, revealed information
technology is useful for informed decision making for the tour operators. The
existing management information systems (MIS) do not suit the tourism industry as
they were meant for manufacturing industry. The MIS innovation is thus necessary to
fit the need of the operators. Use of MIS is hindered by the attitude of managers
towards computer, mismatch between MIS and those controlling the systems, rigidity
of the management, high investment cost, and continual advancement of technology
making existing to be redundant after a short while. Their findings supported those of
Hinton (2006) that every business should integrate MIS into their business strategy.
Chib and Cheong (2009) in their study on Investigation of the Applicability of
Business Process Management in Swiss Small and Medium Sized Tourist Enterprises,
(SNTEs), concludes it is not clear to what extent SMTEs can support expensive IT-
enabled innovations. The main aim of the study was to analyse the value chain and
assessment of feasibility of business process management inorder to improve
performance of these firms.
2.4.4 Effect of Service Quality on Success
Tourism businesses offer services that are intangible in nature. As Meirelles (2006)
describes it, service is only accessible while offered with other functions which are
tangible products or processes. It is consumed as it is provided thus production of the
service starts when a service is ordered and finishes when the demand is met. It is

32
thus important to assess the quality of service provided in search of competitive
advantage for the firm (Siadat, 2008).
Parasuraman et al (1985) defined service quality as the difference between what the
customers expected from service providers and their valuation on the actual service
received. This is confirmed by Gefen (2002) as subjective comparison made by
customers between the quality of service customers want to receive and what they
actually get. Difference on service quality depends on attitudes and behavior,
appearance and personality, service mindedness, accessibility and approachability of
customer contact personnel.
Edvardsson, Gustafsson and Roos (2005) expanded service quality into four aspects
that affects customer’s perception:- technical quality, intergrative quality, functional
quality, and outcome quality. While technical quality refers to skills of personnel and
design of service system, intergrative refers to how parts of that system works
together. Functional quality refers to the manner a service is given while outcome
quality is when the actual services meets expected or promised services. Unsatistfied
customers are not likely to come back.
Iliachenko (2006) in the study Electronic Service Quality in Tourism carried out in
Sweden insists on strategic importance for businesses to address their customers in the
electronic markets. It highlights that success of a business in this internet era is
grounded on service quality of the firm's website and integration of the same to its
marketing strategy. Customers are empowered by technology advancement and thus
33
for a tourism business to succeed it is vital to ensure service quality on its electronic
communication devices. Corporate website is viewed as a platform for internet
marketing and thus it is a must to have. Its effectiveness ensures global access to the
market and is a critical success factor on marketing its information to its clients. The
findings of this study are shared by Siadat (2008) on study in Iran on Measuring
Service Quality Using SERVQUAL Model.
2.4.5 Effect of Clusters and Networking on Success
Porter (1998) defined Clusters to be geographic concentration of interconnected
companies and institutions in a particular field, linked by commonalities and
complementariness. Relationship within the cluster brings about high rates of
innovation, training and development, knowledge sharing and high quality of
workers, and synergy resulting in continuous development of high quality products
and services. Other benefits could be development of a common supplier base and
labour pool, smoother production processes, and new business formation that re-
enforces the cluster development (National Competitive Council, 2004b).
Lazzeretti and Petrillo (2006) in their study Tourism Local Systems and Networking
concluded that owing to the highly competitive and turbulence in the tourism industry
and the globalisation; the market does no longer involve single businesses; but it
rather consists of geographical or thematic destinations composed by a network or
cluster of tourism related operations. They suggest that small and medium-sized

34
tourism enterprises (SMTEs) can use clusters/networks as a framework which can
provide opportunities to operate in a competitive tourism environment.
Osterwalder and Pigneur (2009) in their study on Business Model Generation
conducted in Amsterdam indicates three reasons for creating partnerships are:
optimization and economy of scale; reduction of risk and uncertainty and acquisition
of particular resources and activities. Following Nordin (2003) views in study
Tourism Clustering and Innovation - Paths to Economic Growth and Development
conducted in Sweden, there is a correlation between innovation and the business
cluster. The proximity of the cluster partners also fosters a more innovative
environment. Local operators often regard each other as competitors and not
colleagues resulting in little or no mutual trust among enterprises. This diminishes
chances of potential knowledge transfer and may restrain development of successful
cluster.
Scholz (2011) in his study on Development of Tourism Clusters conducted in Chile
highlights there are preconditions to consider when transferring the cluster concept to
tourism. He argues that same location for a cluster is not necessary but most
important is the relationship between actors. Jackson and Murphy (2002) emphasize
the development of a cooperative platform which leads to a pooling of resources,
increasing the value added of a tourism destination as well as attractiveness for
tourists.

35
Rosenfield (2001) however points out the difference between clusters and networks
as: networks can occur among firms situated anywhere, whereas clusters usually refer
to a core of firms in a more limited geographical area. It is thus important to
appreciate that both clusters and networks are important in the tourism sector. Other
distinctions of clusters and networks highlighted includes: networks are based on co-
operation; clusters require both cooperation and competition, networks are based on
contractual agreements; clusters are based on social values that foster trust and
encourage reciprocity, networks make it easier for firms to engage in complex
production; however clusters generate demand for more firms with similar and related
capabilities. While networks have common business goals, clusters have collective
visions.
2.4.6 Success of Tourism Businesses
According to Philip (2010), success in a broad-spectrum, relates to the achievement of
goals and objectives in any sector of human life. In business life, success is a key term
in the field of management, although it is not always explicitly affirmed. There is no
universally accepted definition of success, and business success has been deduced in
many ways (Foley & Green, 1989). Success can thus differ in perceptions like:
survival, profit; return on investment, sales growth, number of employed, happiness,
reputation, and so on. It has been assumed implicitly that high growth correlates
positively with success.

36
Birley and Westhead (1990) on their study, Growth and Performance Contrasts
between “Types” of Small Firms conducted, in Cranfield UK however points out that
one limitation in previous researches is the premise that performance and growth are
not only interlinked but used as a substitute for each other. They add that this kind of
correlation is not supported in the literature. For the sake of this study, success will
be defined as growth in terms of increase in number of employees, capital equipments
such as cars, premises and ICT equipments; sales growth and ultimately return on
investment.
Holland (1998) in study, Planning Against a Business Failure, conducted in the USA
indicates the following can assist in improving the chances of success: developing a
business plan; obtaining accurate financial information about the business in a timely
manner; profiling the target customer, analysing competition; right reasons for going
into business; not borrowing family money. Also he adds that networking with other
business owners in similar industries; realizing that consumer tastes and preference
change; and becoming better informed of the resources that are available also brings
success. He however did not analyse the external forces that could lead to business
failure such as government regulations, security, environmental, social, technological
and other changes. The dependent and independent variables for this study will be
borrowed from some of those revealed by Holland.
Clark (1997) in article, Reasons for Business Failure Come in Three Broad Groups,
condensed the success solutions in 3M’s – money, management and marketing.
Break-even period should not be underestimated to enable growth on other areas of

37
business. Management team should comprise of knowledgeable people and not
family members only. Pull strategy rather than push should be used for marketing.
This is ensuring the customers know the product and are the ones requesting for it and
giving their inputs for improvements. It is however not the best to use push marketing
strategy only by the tour operators. The tour operators has to use the two strategies as
there are some tourists who may not have time to analyse the information given and
thus would like the specialist to do it for them. This is the value addition sort by their
clients and therefore differentiation is critical for the push strategy.
Scholz (2011) in study, Development of Tourism Clusters, conducted in Chile
highlights challenges hindering development of tourism businesses. These include:
problem of language barriers; lack of financial resources/access to loans; seasonality
of tourism; precarious roads; low cooperation between tourism actors; lack of
business skills/experience; lack of promotion of the region on national and
international level; unskilled and inexperienced staff; problems to book in advance
from outside; and lack of information on what tourists prefer. In the study, Chile is
also experiencing the foreigners dominating the industry. It concludes this can be
overcome through cooperation and training to the local actors. It can be noted that
Scholz (2011) concentrated much on resources to be the main hindrance of
development.

38
2.5 The Tourism Industry
Bennett and Schoeman (2005) illustrated various stakeholders of the tourism industry
using a figure with four main divisions: attractions (either natural, manmade or
sociocultural); accomodation (either self-catering or serviced); transportation; and
support services. All these are interconnected by the tour operators and at times travel
agents to the tourist. This is illustrated by figure 2.2.
Figure 2.2: The Tourism Industry
Source: Bennett, J.A. & Schoeman, L. (2005: p39).
RoK (2011) asserts that apart from the building of national economy by providing the
opportunities for employment, foreign exchange earnings, income and government
revenues, the tourism industry plays other important roles making its demand
increase. It helps to pay for and justify infrastructure development that also serves
general community and economic needs. As tourism is decentralized, it is capable of

39
diversifying regional economies making all regions grow at the same rate. Tourism
provides recreational, culture and commercial facilities and services for use by both
tourists and residents that may have not been developed without it. It also provides
opportunity for education of people about other cultures and environments as well as
their own national heritage, often circumventing ideological and political differences
and reducing prejudicial attitudes, hence achieving cross-cultural exchanges. Tourism
however, can also generate various problems such the loss of potential economic
benefits and local economic distortions, environmental degradation, loss of cultural
identity and integrity, and cross-cultural misunderstandings thus reinforcing existing
prejudices (RoK, 2011).
In addition, the industry in Kenya has been marred by high competition as a result of
high number of both registered and non-registered operators both locally and foreign
owned. Michael Porter looked at competition differently and concluded that it can
only be won through strategy. He compared strategy to a wheel that has spokes (key
operating policies) which are expected to radiate and reflect the hub (organizational
goals) (Porter, 1998).
The local tour operators ought to identify the right strategy towards success in their
businesses. Many authors define strategy differently but they all agree on its
importance to grow the business, attract and please the customers, compete
successfully, conduct operations and achieve target levels of organizational
performance (Hambrick & Fredrickson 2001; Mintzberg, Lampel, Quinn, & Ghoshal
2003; and Thompson, Strickland, & Gamble 2010). To work effectively, the strategy

40
must be properly managed. Vallabhaneni (2009) defined the strategic management as
“the set of decisions and actions used to formulate and implement strategies that will
provide a competitively superior fit between the organization and its environment to
achieve organizational goals”. The strategic management coordinates and integrates
the management functions in an organized manner for achievement of the goals.
Gomez-Mejia and Balkin (2002) and Vallabhaneni (2009) stated that the formulation
of strategy includes the planning and decision making that lead to the establishment of
the firm’s goals and the development of a specific strategic plan. Local operators must
have the right strategy which must be well managed to achieve the sought success.
2.6 Gaps in the Literature Review
Although a lot has been studied on the industry and the SMEs, the local tour
operators' success factors have not been studied. This was the main motivator of this
study to ensure the local tour operators get the right key into the business. The studies
in other areas of SME’s cannot be duplicated in the tour operators' field. This is
because this is a service industry and thus the intangibility of their product does not
necessarily face same challenges as tangible product. The theories proposed for
competitiveness are also so much linked into production firms. The one size fits all
strategy is not possible in the service industry.
The studies on effects of resources on success investigated different resources as
single entities towards success for example Bankole and Odularu (2006) investigated
finance and ignored other resource factors while Mbaiwa (2000) investigated vehicles

41
in tourism industry. Mafunzwaini and Hugo (2005); Nordin (2003); Trivun et al.
(2008) concentrated on human resources as the main resources that can bring forth
success. There is no single study that have combined resources together to investigate
their effect on success. This study investigated human resources, finance and other
assets owned by the firm to fill this gap.
On the effect of policies on success, the past studies concentrated on the industry as a
whole and not the tour operators. They also did not combine the governmental and
organizational policy to see their combined effect to success. Many separated the two
policies for example Buijze (2010); Ikiara and Okech (2002); Quian (2010); and
Rogerson (2007) concentrated on government policies while Bryce et al. (2011);
Hambrick and Fredrickson (2001); Peters et al. (2009) and Zyl (2007) concentrated on
organizational policies. This study enjoined the two policies to investigate their effect
on success and fill in this gap.
The studies carried out on ICT again concentrated on the whole industry and not the
tour operators. It was critical to investigate if ICT affects success of the local
operators equally. Again the mixed aspect of the website features and the website
maintenance problems have not been investigated together but separately in the
previous studies for example Eraqi & Abdalla (2008); Hinton (2006); Kiprutto et al.
(2011); Potgieter et al. (2010); and Soraya (2005) concentrated on ICT adoption and
use of internet. Others like Christiansson and Sporrek (2003); Iliachenko (2006);and
Liu & Chen (2011) looked into website appearance. No author had looked into the
problems encountered by the tour operators on website maintenance.

42
On service quality, there was no study carried out in the tourism industry on the five
dimensions of the SERVQUAL model. This left a gap in the Kenyan perspective and
its investigation was necessary. Other investigations carried out internationally were
also on the industry and a whole and not specific to the tour operators. This study
therefore investigated the five dimensions to fill this gap.
The studies carried out on the clusters and networks as a variable in this study are not
local. They have also been carried out based on the data for the whole industry and
not tour operators. This study sought to fill the gap by having Kenyan perspective on
the clusters and networks and particularly on the tour operators. In addition the
previous studies investigated either clusters or networks separately while this study
combines the two together for comprehensiveness of the study.

43
CHAPTER THREE
RESEARCH METHODOLOGY
3.1 Introduction
Kothari (2004) defined research methodology as a science of studying how research is
done scientifically. This involves hierarchical steps on how the research is carried
out. This chapter discusses various steps adopted by this study in investigating the
challenges hindering success of tourism businesses owned by indigenous
entrepreneurs in the tourism industry in Kenya.
3.2 Research Philosophy
This study took a positivism philosophy as it used scientific methods to collect data
using quantitative approach through questionnaires to gather reliable data. Saunders,
Lewis and Thornhill (2006) defined research philosophy as development of
knowledge and nature of that knowledge based on assumptions about ones views of
the world which influences the way research will be conducted. Two main research
philosophies are positivism and phenomenology (Benz and Newman, 1998).
According to positivism philosophy, reality is stable, observable and can be measured.
Knowledge is obtained using the scientific method which is objective and measurable.
To prove that a phenomenon exists, one has to collect data scientifically and what that
cannot be tested empirically cannot be regarded as proven. Positivism has no value
judgments, only statements which can be tested scientifically. To prove the validity of
a statement, data must be collected (for example using experiments, surveys) using

44
methods that are agreed on by the scientific community. Also, the research when
repeated should yield the similar results.
On the other hand, phenomenology philosophy focuses on the processes and
experiences one goes through. Literally, phenomenology is the study of “phenomena”
or the things we experience and the ways we experience such things. Experience is a
complex concept and not directly observable by an external observer. However,
‘intersubjectivity’ is often used as a mechanism for understanding how people give
meaning or interpret their experiences (Benz & Newman, 1998). Generally, the
underlying philosophy of qualitative research is phenomenology while the underlying
philosophy of quantitative research is positivism.
Positivism philosophy was justified by the stability and measurable nature of the
information gathered via questionnaire. Contrary to the phenomenology approach,
this study's sample was also scientifically selected to ensure reliability, non-biasness
and objectiveness of the collected data. It allowed use of statistical analysis like
factor analysis and cluster analysis which is not possible for phenomenology approach
where only descriptive analysis can be carried out.
3.3 Research Design
In this study, descriptive survey design was used. The research design is the plan,
structure of investigation conceived so as to obtain answers to research hypothesis and
to control variance (Kerlinger & Lee, 2000; Kothari, 2004; and Wiersma & Jurs,

45
2009). Sekaran (2003) highlighted that a research design can either be exploratory,
descriptive, experimental or hypothesis testing.
According to Neuman (2000), descriptive survey design involves large numbers of
persons, and describes population characteristics by the selection of unbiased sample.
It involves using questionnaires and sometimes interview tests, and generalizing the
results of the sample to the population from which it is drawn. In this study,
descriptive survey design was also applied because it was found to be flexible enough
to provide opportunity for considering different aspects of a problem under study
(Creswell, 2003).
3.4 Population
In this study the target population comprised of all tour operators owned by
indigenous entrepreneurs in the tourism industry to who the results of this study was
generalized. From literature (Agarwal, 2009; Castillo, 2009; Hyndman, 2008; and
Mugenda & Mugenda, 2003) population is described as a large collection of
individuals or objects that is the main focus of a scientific query and have similar
characteristics. Gall, Gall and Borg (2007) highlights two types of population: target
and accessible population. Target population consists of all members of a real or
hypothetical set of people events or objects from which a researcher wishes to
generalize the results of their research while accessible population consists of all the
individuals who realistically could be included in the sample. The accessible
population in this study was the 142 local tour operators who are registered by the

46
Kenya Association Tour Operators (KATO, 2011). These are the ones who could
realistically be included in the study because their physical, telephone and email
addresses were known from the KATO list.
3.5 Sampling Process
From literature (Black, 2004; Scott & Wild, 1986; and Zikmund, et al., 2010;)
sampling is described as selection of a subset of individuals from within a population
to yield some knowledge about the whole population, especially for the purposes of
making predictions based on statistical inference. Adèr, Mellenbergh, and Hand
(2008) highlights the advantage of sampling as cost, speed, accuracy and quality of
the data. The sampling process comprises of sampling frame, sampling method,
sample size and sample plan. The process in this study is described below.
3.5.1 Sampling Frame
In this study the sampling frame was the list of 142 registered active KATO local tour
operators attached as appendix 2 (KATO, 2011). A sampling frame is a list of
population from which a sample will be drawn from (Leary, 2001; and Särndal,
Swensson & Wretman, 2003). Bailey (2008) argues that the sampling frame
facilitates formation of a sampling unit that refers to one member of a set of entities
being studied which is the material source of the random variable. From the 142
members a sample was randomly sought.

47
3.5.2 Sampling Technique
This study used probabilistic techniques, specifically stratified random sampling.
Sampling technique can either be probabilistic or non-probabilistic (Castillo, 2009;
Gall et al. 2007; Kothari, 2004; and Mugenda & Mugenda, 2003). In probabilistic
sampling every unit in the population has a chance of being selected in the sample,
and this probability can be accurately determined. The method can be: simple random,
systematic, stratified, and multi stage sampling. Non probabilistic sampling is where
some elements of the population have no chance of selection or their probability of
selection can't be accurately determined. The methods available here are
convenience, quota sampling and snowballing.
Creswell (2008); and Gall et al. (2007) highlights that stratified sampling is used
when the population has different characteristics thus to ensure that all get equal
chances, the population is sub-divided into strata before using simple random
sampling to get a sample from each stratum. In this study, the population was divided
into six categories based on their gross annual turnover following KATO’s
classification.
From KATO’s list of registered members the strata are classified according to their
annual gross turnover as follows: Category “A” - All members with a gross annual
turnover exceeding US$ 1.7Million; Category “B” - All members with a gross annual
turnover exceeding US$1.1Million but below US$1.7Million; Category “C” - All
members with a gross annual turnover exceeding US$570,000 but below

48
US$1.1Million; Category “D” - All members with a gross annual turnover exceeding
US$140,000 but below US$570,000; Category “E” - All members with a gross annual
turnover of not exceeding US$ 140,000; and Associate - All new members who are
yet to complete one full year in membership. From the six strata, simple random
sampling was carried out to get the sample. This ensured equal chances of selection to
all. It was thus a true representative of the population.
3.5.3 Sample Size and Sample
For this study, from the population of 142 tour operators to get the sample was
necessary. A sample is a true representative of the entire population to be studied
(King'oriah, 2004 and Leary, 2001). Kothari (2004) advocates that good sample
should be truly representative of the population, result in a small sampling error,
viable, economical, and systematic. A sample was obtained from the sample frame
which is the registered active KATO members who are indigenously owned.
Kothari (2004) described sample size as the number of items to be selected from the
universe to constitute a sample. There are several options to determine the sample size
including census, imitating sample size of similar studies, using published tables, and
applying existing formula. Different authorities give different parameters on the
sample size for example Schewarz and Sudman (1995) recommends a minimum of
100 participants in survey research, Gall et al. (2007) recommends minimum of 15 in
experimental research and 30 in correlation research while Greener (2008)

49
recommends at least 30 but census if population is less than 30. The following
formula of Cochran (1963) was used to calculate sample size:
Where:
Z = Z value
p = percentage picking a choice
e = desired level of precision
Using the above formula with the Z value being 95% thus 1.96, p being 50%, q being
50% and e being 5%, a total of 385 was reached. This was the sample size for
proportions. This size was adjusted to suite the population in question using the
formula below:
Where:
no = sample size for the proportions calculated above (385)
N = Target population
N was calculated based on the assumption that a questionnaire was sent to every firm.
From the above formular, with no being 385 and N being 142, the calculated n was
104. This was the expected number of respondents. The table below shows the
calculation of the number of proportionally accepted sampled firms calculated from

50
each stratum and expected number of respondents. The 104 respondents were arrived
from the formula above and selected as per Table 3.1 which follows:-
Table 3.1: Classification of Tour Operators by Ownership
Population Sampled firms
Category A 6 5
Category B 0 0
Category C 7 6
Category D 16 12
Category E 84 60
Associate 29 21
TOTAL 142 104
3.6 Instruments of Data Collection
In this study, the instruments used for data collection are: literature review for
secondary data and questionnaires for primary data. Literature review from existing
sources is the major instrument for secondary data. For primary data, observation,

51
scientific setting in a closed laboratory, questioning through either questionnaire or
carrying out an interview as used as the major instruments (Anderson & Shaw, 1999).
Questionnaire is a method of data collection in which respondents provide written
answers to written questions (Gillham, 2008; and Leary, 2001). Use of questionnaires
in this study enabled coordination of data collection and guidance on the required
information. The questions therein were either open or closed using 5 likert scale.
This assured collection of all the available data not ignoring any important
information from the respondents while at the same time making it possible to analyse
through restricted likert scale. Many scholars have used the questionnaire on
collection of data on studies in tourism industry like Fache (2000); Peters ( 2005); and
Salwani, et al. (2009);
3.7 Data Collection Procedure
The study took pilot study which is a small-scale research project that collects data
from respondents similar to those used in the full study (Zikmund et al., 2010). It
served as a guide for a larger study by examining specific aspects of the research to
ensure increased response rates, reduced missing data and obtaining more valid
responses (Hair et al. 1998; and Schwab, 2005).
The pilot study involved a randomly selected sample of 10 respondents. This was
10% of the sample size. The same was not included in the final study following ASA
(1997) to avoid survey fatigue. Reliability test was carried out on the tool to ensure it

52
gave reliable results. Cronbach’s Coefficient Alpha test was applied in this study to
validate the measuring instrument to determine its portability, structure and reliability.
Factor analysis was also carried to remove any redundant item from the questionnaire.
Factor analysis as defined by Gall et al. (2007) is a statistical procedure for reducing a
set of measured variables to smaller number by combining those that are moderately
or highly correlated with each other. Confirmatory factor analysis as Zikmund et al.
(2010) and Hair et al. (2010) assert is more reliable when there is a strong theoretical
expectations on the factor structure before carrying out the analysis. All items scoring
less than 0.3 which is the minimum requirement for inclusion of variables into the
final model were dropped from further analysis (Hair et al., 2010; Kothari, 2004).
The data collecting instrument was amended after the pilot study to reflect the
corrections recommended by the respondents and supervisors who had knowledge in
this area. The final version of the questionnaire (appendix 1) was sent to the 104
sampled firms using their email addresses on the KATO register. This failed to give
satisfactory response and the classic method of hand delivery was resulted to which
increased the response rate as explained in the next chapter.
3.8 Data Processing and Analysis
Data analysis is a practice in which raw data is ordered and organized so that useful
information can be extracted from it (Saunders et al. 2009). The primary data
obtained from the questionnaires was checked for omissions, legibility and

53
consistency before being coded for analysis. Majority of the data collected qualified
for coding for further analysis.
Qualitative measures took into account the feelings, attitudes and opinions of
managers on their success. Quantitative measurements involved statistical inference
through application of inductive reasoning (Creswell, 2003). This is usually applied
when one dependent variable is presumed to be a function of more than one
independent variables (Neuman, 2000).The responses by managers were coded to
enable them to be processes by computer. Statistical packages like SPSS was used to
analyze the data to show the relationships between the variables. Neuman (2009)
indicates the main advantage of SPSS as including many ways to manipulate
quantitative data and containing most statistical measures.
Normality test was carried out on the dependent variable (success of local tour
businesses) and the residuals. This tested the normality of the sample to ensure there
is a normal distribution on the same. Pearson’s Coefficient Correlation analysis was
used to examine the type and extent of the relationships of the independent variables:-
resources, policies, ICT, service quality, and clusters and networking – to the
dependent variable – success of local tour operators
The analysis of variance (ANOVA) also referred to as F-test was used to test the
significance of the overall model below. The confidence level to be used is 95%.
Regression analysis was carried out to find out the rate of change of variables in
relation to changes in one another. Kvasova (2012) in the study on Socio-
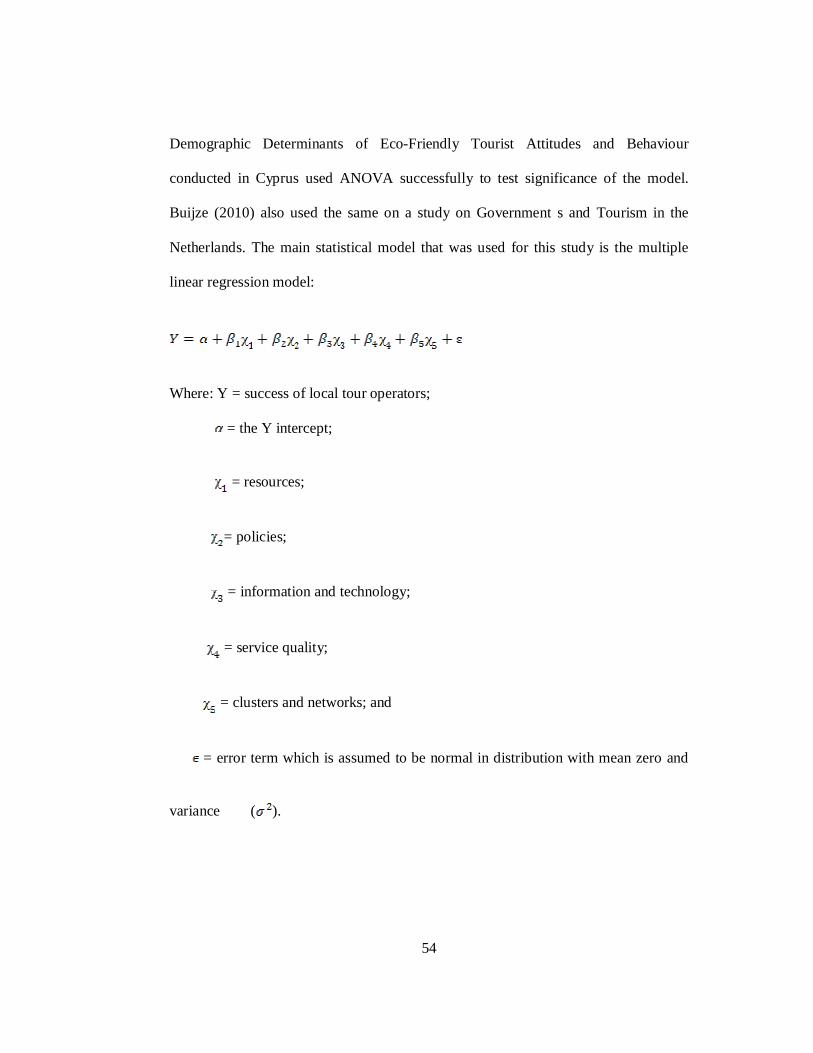
54
Demographic Determinants of Eco-Friendly Tourist Attitudes and Behaviour
conducted in Cyprus used ANOVA successfully to test significance of the model.
Buijze (2010) also used the same on a study on Government s and Tourism in the
Netherlands. The main statistical model that was used for this study is the multiple
linear regression model:
Where: Y = success of local tour operators;
= the Y intercept;
= resources;
= policies;
= information and technology;
= service quality;
= clusters and networks; and
= error term which is assumed to be normal in distribution with mean zero and
variance ( ).

55
3.8 Operationalization of variables
According to the conceptual framework, there are five independent variables and one
dependent variable in this study. The independent variables include: Resources;
Policies; ICT; service quality; and clusters and networks. A sixth model combines all
the five independent variables to give an overall picture as to what extent the five
influence success of tourism businesses owned by indigenous entrepreneurs which is
the dependent variable.
Resources were measured in terms of human resources and their skills, other assets
owned by the firm, and finances. The investigated items include number of permanent
employees classified as: clerical staff, managers, tour consultants, and tour guides; and
their skills in tourism industry including additional language in addition to English.
Other assets investigated were vehicles, parking space, office space, and office
equipment. Finance was investigated on its availability, accessibility, and collateral for
the same.
Policy was measured in terms of the effect of those policies on the success of tourism
businesses owned by indigenous entrepreneurs. The factors investigated were both the
organizational policies and the relevant governmental policies. Organizational
policies were investigated in terms of their existence, availability to employees and
their usage in decision making processes. The governmental policies looked into were
both tarrif and non-tarrif policies that could lead to success in the tourism businesses
owned by indigenous entrepreneurs.

56
ICT was measured in terms of extent of adoption of ICT by the local operators.
Availability of a functional website was also investigated which included the features
of the website and their importance to success of local operators. The features
investigated includes: 1) Appearance of the website, its graphical interface like choice
of layout, fonts, and colours; 2) In-depth descriptions of firms products or services; 3)
Contact information; 4) Booking capability; 5) E-commerce or payment online; 6)
Customer testimonials access; 7) Hyperlinks to other websites; 8) Subscription to
mailing lists to receive offers and news; and 9) Multiple languages.
In addition, problems experienced by the local operators on website maintenance were
also investigated. The study concentrated on problems like: 1) Keeping content
updated; 2) Online security; 3) Reliability of telecommunications service; 4) Quality
of web hosting equipment; 5) Cost of maintenance; 6) Training or skills to implement
certain website features; and 7) Access to expert assistance or advice.
Service quality as an independent variable was investigated on its effect to success of
tour operators. It was measured in terms of the five parameters prescribed by
SERVQUAL model. These includes: Reliability in terms of dependability and
accurate performance; Assurance as competence, courtesy, credibility and security;
Tangibility in terms of appearance of physical elements; Empathy as easy access, good
communications and customer understanding; and Responsiveness as promptness and
helpfulness to customers.

57
Clusters and networks were measured in terms of the memberships that local operators
have subscribed to. This is in addition to KATO membership to which all have
subscribed. The benefits sought from membership which influence subscription were
also investigated.
3.9 Ethical Consideration Issues
Ethical considerations are often in terms of informed consent, confidentiality (the
right to privacy and protecting identify) and consequences (protection from for
example physical and emotional harm) (Fontana and Frey 2000). The three will be
addressed through a cover letter to the questionnaire as follows: (1) informed consent
- by providing the key themes of the research topic and its overall purpose on the
questionnaire where it is clearly indicated that the questionnaire will be filled in on
voluntary grounds; (2) confidentiality - all interviewees will be informed that their
name and their company's name would remain anonymous; and (3) consequences -
questions will be designed to obtain specific information about how the company was
addressing particular issues and not on the specific personal views of the interviewee
this will avoid personal questions thus no consequences will follow the individual.

58
CHAPTER FOUR
RESEARCH FINDINGS AND DISCUSSIONS
4.1 Introduction
This chapter reports the findings of the study aimed to investigate the challenges
hindering success of tourism businesses owned by indigenous entrepreneurs in the
tourism industry in Kenya. The findings are based on the methods discussed in the
previous chapter. The study was organized around the research objectives aimed at
testing the following research hypotheses (1) Ho: Resources do not affect the success
of tourism businesses owned by indigenous entrepreneurs in the tourism industry in
Kenya (2) Ho: Policies do not influence the success of tourism businesses owned by
indigenous entrepreneurs in the tourism industry in Kenya (3)Ho: Information,
Communication and Technology does not have an effect on success of tourism
businesses owned by indigenous entrepreneurs in the tourism industry in Kenya (4)
Ho: Service quality does not influence the success of tourism businesses owned by
indigenous entrepreneurs in the tourism industry in Kenya (5) Ho: Clusters and
networks do not affect success of tourism businesses owned by indigenous
entrepreneurs in the tourism industry in Kenya.
The research hypotheses above formed basis of the independent variables which
include: resources, policies, information, communication and technology, service
quality, and cluster and networks. Each variable was reviewed following the collected
questionnaires. Both descriptive and inferential analysis are presented, interpreted and

59
discussed in this chapter. They are presented in form of tables and graphs. Data was
analyzed both quantitatively and qualitatively.
4.2 Response Rate
One hundred and four questionnaires were hand delivered to the sampled 104 tour
businesses owned by indigenous entrepreneurs. To increase response rate, an email
address was created and the questionnaires were sent to the 104 firms via email
address of their contract person on KATO list. From the 104 emails sent out, many
firms acknowledged receipt of the email but only 6 filled the questionnaire and sent
back via email. This translates to a response rate of 5.76%. This response rate
confirms to that of Ngesa and Cavagnaro (2010) who sent out 318 online
questionnaires to tour operators in Kenya and the response rate was 19.8%. It could
mean that the Kenyan tourism businesses has not fully embraced the technology or
might not be willing to spend time on their online facilities because of various reasons
including time and cost.
From the 104 hand-delivered questionnaires, 83 were successfully collected from the
recipients having been filled out. The total response rate was thus 79.86%. This quite
high as compared to other response rates from the studies carried out in the tourism
industry like those of Schwartz and Font (2009) on their study Sustainable supply
chain management: outbound tour operator practices conducted in the UK whose
response rate was 60.5%; and Kvasova (2012) in his study Socio-Demographic

60
Determinants of Eco-Friendly Tourist Attitudes and Behaviour conducted in Cyprus
whose response rate was 55%.
Mugenda and Mugenda (2003) assert that a 50% response rate is adequate, 60% good
and above 70% rated very good. Neuman (2000) recognizes a response rate of 50%
and above as adequate for a survey study. Based on the recommendations by the two
scholars, it can be conclude that the response rate of 79.86% for this study is very
good.
4.3 Sample Characteristics
The information sought in this section was preliminary to the study objectives with
aim of discerning the characteristics of the sample. The questions aimed to elicit
responses which showed the business parameters of the indigenous tour operators who
responded to the questionnaire. Year of incorporation and the position of the
respondents would show whether indigenous tour operators had established
themselves in the tour industry and the employees of these firms.
Year of Incorporation
The responses as reflected in table 4.1 showed that over half of the indigenous tour
operators (56.6%) had been in business since 2005; 18.1% between 2001 and 2005;
and 25.3% between 1991 and 2000. From the respondents, none existed before 1991.
It can be concluded that the non-indigenous firms then dominated the market.

61
This indicates that there has been a positive growth in the number of indigenous tour
operators which could have coincided with the take-over of the Kenyan government
by the National Rainbow Coalition government in the year 2002 which aimed at
empowering Kenyans for stability of economy growth. With policy document like
Economic Recovery Strategy (ERS) of 2003, confidence on growth of economy was
gained and this could translate to the increased tour businesses for indigenous
entrepreneurs. Unveiling of Kenya's Vision 2030 in year 2007 with prospects of
transforming Kenya into “a newly industrializing, middle income country providing a
high quality of life to all its citizens in a clean and secure environment” could also
have given Kenyans confidence to invest in the industry. This is particularly because
of recognition of the tourism industry under the economic pillar of the nation's
employment creation, poverty eradication, and reduction of inequality.
The growth of the tourism industry suggests that there are many opportunities for new
entrants, such as taxi drivers, hoteliers, tour operators, marketers, trainers, booking
agents, laundry workers, curio and craft sellers, construction workers, vegetable and
fruit producers and farmers (Ceballos-Lascurain, 1996). However, many of the
occupations which the author has cited are low paying, and some (such as construction
work) offer little if any scope for self-employment. Other occupations have seen
growth in entrepreneurship where Kenyans has taken up opportunities for industrial
growth.
The findings suggest that many tour businesses owned by the indigenous
entrepreneurs are in the introduction and growth stage of the production curve. To

62
ensure stability of the industry, it is thus vital to come up with strategies that can lead
to growth of the businesses not forgetting the global competition with many
destinations in the world. Confidence towards Kenya as a destination should be
reinforced to increase traffic of tourists into the country.
Table 4.1: Year of Incorporation of the Company
Year of Incorporation Number of firms %
1991 to 2000 25.30%
2000 to 2005 18.07%
2005 to 2011 56.63%
Positions of the Respondents
The question sought to find out the positions held by the respondents in the study. This
was to shed light on the management structure of indigenous tour operators. Three
main categories filled in the questionnaires. Among them 57.83% were the Managing
Directors; 34.94% were Administration staff; and 7.23% were Operations staff. The
findings are reported on Table 4.2.
As 57.83% of the respondents were managing directors of their tour operators, this
suggests that they are well versed in various aspects of tour operations. However, the
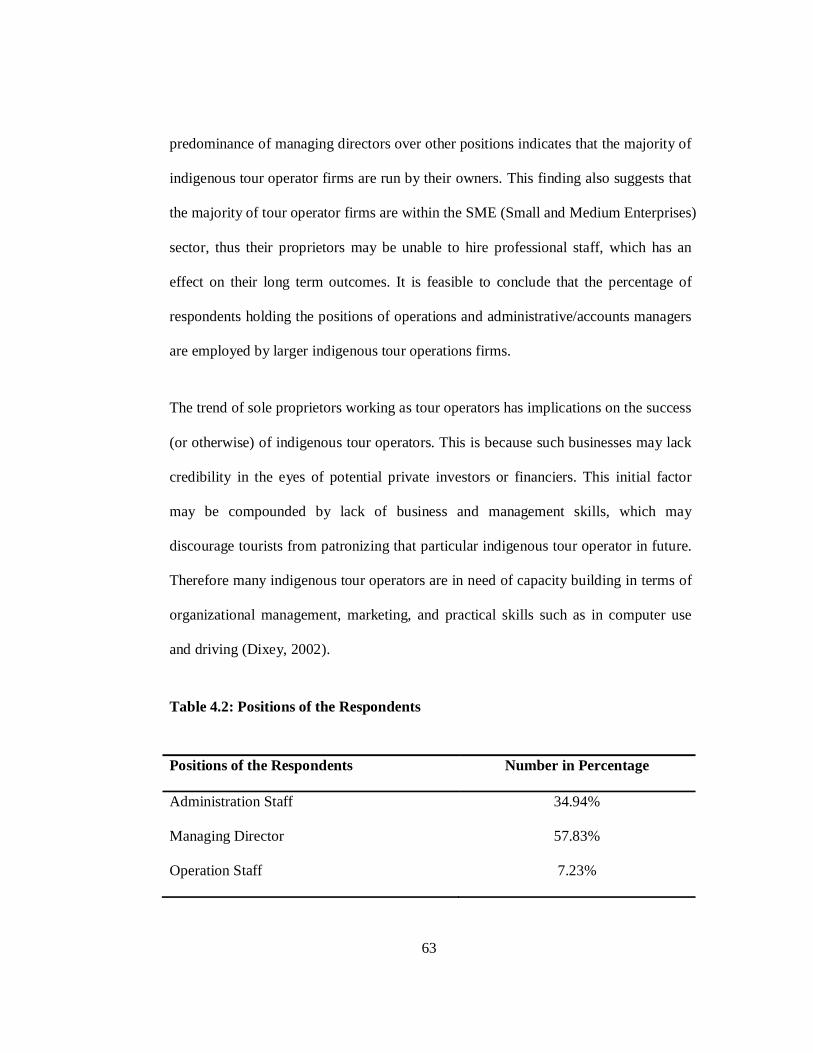
63
predominance of managing directors over other positions indicates that the majority of
indigenous tour operator firms are run by their owners. This finding also suggests that
the majority of tour operator firms are within the SME (Small and Medium Enterprises)
sector, thus their proprietors may be unable to hire professional staff, which has an
effect on their long term outcomes. It is feasible to conclude that the percentage of
respondents holding the positions of operations and administrative/accounts managers
are employed by larger indigenous tour operations firms.
The trend of sole proprietors working as tour operators has implications on the success
(or otherwise) of indigenous tour operators. This is because such businesses may lack
credibility in the eyes of potential private investors or financiers. This initial factor
may be compounded by lack of business and management skills, which may
discourage tourists from patronizing that particular indigenous tour operator in future.
Therefore many indigenous tour operators are in need of capacity building in terms of
organizational management, marketing, and practical skills such as in computer use
and driving (Dixey, 2002).
Table 4.2: Positions of the Respondents
Positions of the Respondents Number in Percentage
Administration Staff 34.94%
Managing Director 57.83%
Operation Staff 7.23%

64
4.4 Pilot Study Results
From the pilot study, reliability test using Cronbach’s Alpha Coefficient was carried out on
the tool to ensure it gave reliable results. From table 4.3, the lowest alpha coefficient was
0.721 while the highest was 0.968.
Reliability test results indicate that the individual components and overall coefficient are
above 0.7. Cooper and Schindler (2008) and Paton (2002) assert that a Cronbach’s alpha
coefficient of 0.7 is adequate for a newly developed tool. Therefore based on the
recommendations by Cooper and Schindler (2008), Paton (2002) and Saunders, Lewis and
Thornhill (2009) the study questionnaire has adequate internal consistency and is reliable
for the study and its results can be used to generalize on population characteristics.
Factor analysis was also carried out on the tool. From the 72 items on the
questionnaire, five items were declared redundant and therefore removed from the
questionnaire. This was to eliminate possible multicollinearity in the model. The
reviewed questionnaire is attached as appendix one.

65
Table 4.3: Cronbach’s Reliability Alpha
Variable Cronbach’s alpha No of items
Resources 0.841 4
Policies 0.745 4
Information Technology 0.876 4
Service Quality 0.968 5
Clusters and networking 0.810 4
Success in tourism businesses 0.721 2
Overall 0.827 23
4.4 Study Variables
The study sought to investigate the challenges hindering success of tour businesses
owned by indigenous entrepreneurs in the tourism industry in Kenya. Five
independent variables were investigated including: resources, policies, information,
communication and technology, service quality, and cluster and network. The
dependent variable success was also investigated. They will be discussed in the section
below highlighting their importance or otherwise towards success of tour businesses
owned by indigenous entrepreneurs in the tourism industry.

66
4.4.1 Success of Tour Businesses Owned by Indigenous Entrepreneurs
The general objective of this study was to investigate the challenges that hinder
success of tour businesses owned by indigenous entrepreneurs in the tourism industry
in Kenya. The dependent variable of the study, success, was investigated to
understand the status of the indigenous tour operators using the number of tourists
served both local and international and the estimate net profit of the firm for the last 5
years starting year 2006 to 2010.
Number of International Tourists Served Between 2006 and 2010
In this section, the number of international tourists served by local tour operators from
the year 2006 and 2010 was analysed. This was to show the trend of success of the
tour businesses owned by indigenous entrepreneurs assuming the more the tourists
served, higher the level of success and vice versa.
Table 4.4 shows that in the year 2006, 44.5% served less than 50 international clients,
19.1% between 50 and 100, 27.1% between 101 to 500, 9.3% between 501 and 1000,
and the mean score for the year was 2.01 where one represents less than 50 and five
represents more than 1001. In the year 2007, 34.3% served less than 50 international
clients, 19.9% between 50 and 100, 38.6% between 101 to 500, 7.2% between 501
and 1000, and the mean score for the year was 2.19. There was a drop in the year
2008 as 57.2% served less than 50 international clients, 38.1% between 50 and 100,
4.7% between 101 to 500, and the mean score for the year was 1.47. In the year 2009,
things started changing for the better as the mean score rose to 2.53 and the number

67
served were as follows: 16.1% served less than 50 international clients, 29.6%
between 50 and 100, 39% between 101 to 500, and 15.3% between 501 and 1000. In
the year 2010, 8.5% served less than 50 international clients, 32.6% between 50 and
100, 31.4% between 101 to 500, 27.5% between 501 and 1000, and the mean score
for the year was 2.78.
The findings of year 2008 decline is echoed by Nyaga (2009) who attributed the drop
by 34.7% to post-election violence that scared away visitors. In 2007, the actual
number of tourists who arrived into the country was 1.8 million as compared to 1.2
million who arrived in 2008 (RoK, 2011). The results of poor international tourists
received in the year 2008 were also experinced in other countries as concluded on the
study of Fakhar (2008) indicating in Pakistan it was regarded as the worst year
attributed to political and social problems. The economic meltdown in 2007 started
flowing to other nations in-terms of low tourists from the west.
Compared to the number of tourists visiting the county for example 1.49 million in
2009, (RoK, 2011), the findings shows that there are many tourists coming into the
country through other operators. Revelation that the local operators are only handling
a small percentage of the international tourists into the country is a reality from this
study as we find that more than a third serve less than fifty clients a year. This shows
that the industry is still very much in the hands of foreigners and thus the local
operators are yet to start driving the market.

68
The year 2008 a decline is noted on the number of the international tourists served by
tour businesses owned by indigenous entrepreneurs. This can be as a result of the
post elections violence experienced in the country after 2007 national elections. The
positive change over the next two years (2009 and 2010) is however encouraging
meaning the local operators are penetrating into the business.
Table 4.4: International Tourists Served Between 2006 and 2010
Year <50 51-100 101-500 501-1000 Mean
2006 44.5% 19.1% 27.1% 9.3% 2.01
2007 34.3% 19.9% 38.6% 7.2% 2.19
2008 57.2% 38.1% 4.7% 0% 1.47
2009 16.1% 29.6% 39% 15.3% 2.53
2010 8.5% 32.6% 31.4% 27.5% 2.78
Average 32.1% 27.9% 28.2% 11.9%
Number of Local Tourists Served Between 2006 and 2010
In this section, the number of local tourists served by local tour operators from the
year 2006 and 2010 were analysed. This was to show the trend of success of the tour
businesses owned by indigenous entrepreneurs assuming the more the tourists served,
the more the increase on success and vice versa.

69
Table 4.5 shows that in the year 2006, 50.4% served less than 50 international clients,
30.9% between 50 and 100, 18.6% between 101 to 500, and the mean score for the
year was 1.68 where one represents less than 50 and five represents more than 1001.
In the year 2007, 46.2% served less than 50 international clients, 28.8% between 50
and 100, 20.3% between 101 to 500, 4.7% between 501 and 1000, and the mean score
for the year was 1.83. There was a drop in the year 2008 as 67.4% served less than 50
international clients, 32.6% between 50 and 100, and the mean score for the year was
1.33. In the year 2009, the mean score rose to 2.06 and the number served were as
follows: 33.5% served less than 50 international clients, 33.1% between 50 and 100,
27.5% between 101 to 500, and 5.9% between 501 and 1000. In the year 2010, 43.2%
served less than 50 international clients, 27.5% between 50 and 100, 23.3% between
101 to 500, 5.9% between 501 and 1000, and the mean score for the year was 1.92.
The findings reflect lack of support from the local tourists to the industry. This could
be because of low economic status of the locals as many are still living in poverty and
thus cannot afford a safari. It could also be that the locals do not value local tour and
safaris. Locals should be encouraged and awareness of local tours disseminated to
ensure they become the backbone of the industry, as without local consumption
success of the industry is not guaranteed. This is in line with Porter's Diamond model
of competitive advantage of nations where demand conditions is said to be a driver of
growth, innovation and quality improvement (Porter, 1990).

70
Table 4.5: Local Tourists Served Between 2006 and 2010
Year <50 51-100 101-500 501-1000 Mean
2006 50.4% 30.9% 18.6% 0% 1.68
2007 46.2% 28.8% 20.3% 4.7% 1.83
2008 67.4% 32.6% 0% 0% 1.33
2009 33.5% 33.1% 27.5% 5.9% 2.06
2010 43.2% 27.5% 23.3% 5.9% 1.92
Average 48.1% 30.6% 17.9% 3.3%
Approximate net Profits Between 2006 and 2010
In this section, the approximate net profits earned by the respondents from the year
2006 and 2010 were analysed. This was to show the trend of success of the tour
businesses owned by indigenous entrepreneurs assuming the more the profit, the
higher the level of success and vice versa.
Table 4.6 shows that in the year 2006, 83.9% earned less than three million Kenya
Shillings, 16.1% between three and ten million, and the mean score for the year was
1.16 where one represents less than three million Kenya Shillings and five represents
more than 51 million Kenya Shillings. In the year 2007, 77.5% earned less than three
million Kenya Shillings, 17.8% between three and ten million, 4.7% between 11
million and 50 million, and the mean score for the year was 1.27 There was a drop in
the year 2008 as 82.4% earned less than three million Kenya Shillings, 14.4%

71
between three and ten million, 3.4% between 11 million and 50 million, and the mean
score for the year was 1.21. In the year 2009, things started changing for the better as
the mean score rose to 1.48 and the number served were as follows: 58.9% earned less
than three million Kenya Shillings, 34.3% between three and ten million, and 6.8%
between 11 million and 50 million. In the year 2010, 54.7% between three and ten
million, 25.8% between three and ten million, 19.5% between 11 million and 50
million and the mean score for the year was 1.65.
Nyaga (2009) found that in the year 2008, there was a sudden drop of revenue from
tourism by 54% from year 2007 that had record revenue of one billion US dollars.
This is in line with earlier findings of international and local tourists drop in the year
2008. The actual revenue collected in 2007 was 65.4 billion Kenya shillings as
compared to 52.7 in the year 2008 (RoK, 2011).
The findings reflect that many firms are still in the lower bracket earning less than
three million shillings per year. The mean shows recovery of the industry from the
year 2008 downfall. Year 2010 reflects that the market is rising with the highest
mean score though still in the lower bracket.

72
Table 4.6: Approximate Net Profit from Year 2006 to 2010
Year <3million 3-
10million
11-50million Mean
2006 83.9% 16.1% 0% 1.16
2007 77.5% 17.8% 4.7% 1.27
2008 82.2% 14.4% 3.4% 1.21
2009 58.9% 34.3% 6.8% 1.48
2010 54.7% 25.8% 19.5% 1.65
Average 71.4% 21.7% 6.9%
Normality Test on Success
Normality test was carried out to ascertain that data is normal and therefore the linear
regression model can be used for testing the effect on the dependent variable. It was
also to ensure best linear unbiased estimators are achieved. The linear regression
model has dependent variable, success, depending on the independent variables -
resources, policies, ICT, service quality and clusters and network is normally
distributed. Quantile-quantile plot (Q-Q plot) was used to test normality of the data.
As shown on Figure 4.1 the points plotted falls approximately on a straight line,
indicating normality with high positive correlation.

73
Figure 4.1: Q-Q plot of Success Variable
4.4.2 Influence of Resources on Success
The study sought to investigate the influence of resources on success of tourism
businesses owned by indigenous entrepreneurs in the tourism industry in Kenya. On
resources the study particularly concentrated on: 1)human resources - number of
employees, their skills and education background, training in tourism industry and
language skills in addition to English; 2)tourist ferrying vehicles; 3)other assets
owned by the firms; and 4)finance - its availability, accessibility and collateral
demand for the same.

74
Human Resource
This section was based on questions on the number of permanent employees and their
skills and their effect on success of tourism businesses owned by indigenous
entrepreneurs in the tourism industry in Kenya. Their skills and education background,
training in tourism industry and language skills in addition to English was also
investigated.
Human Resource - Permanent Employees
Preliminary question was on the number of permanent employees who were
categorised based on their direct contribution to the industry including tour consultants,
tour guides or drivers, and clerical workers. The findings in Table 4.7 point out that
9.64% of the firms had no tour consultants, 53.01% had either one or two, 24.1% had
between 3 and 5, while 13.25% had more than 5 permanent tour consultants. The
findings on number of tour guides or drivers permanently employed in the firms were:
14.46% none, 39.76% with either one or two, 24.10% with between 3 and 5, and
21.69% with more than 5. The clerical workers permanently employed were : none
for 27.71% firms, 51.81% with either one or two, 16.87% with between 3 and 5, and
3.61% with more than 5. The findings showed that majority of tour operators had
between one and two employees, with 53.01% tour consultants, 39.76% tour guides,
and 51.81% clerical workers. It was found that some firms have neither tour
consultants, tour guides nor clerical workers.
The trend of owner-manager tour operators is not unique to Kenya’s tourism industry.
Pivcevic (2009) reports that small hotels in Croatia operate in a similar manner, with

75
the majority employing up to 10 employees, with the prevalence of family owned
hotels and with the managerial function being performed by the owner in more than
60% of small hotels. Hotels may be different from tour operators, but as they are part
of the tourism industry, findings from one area are applicable to another. Due to the
importance of management to success of any enterprise, indigenous tour operators
need to consolidate their management skills. According to King and Stewart (1996),
permanent employees are important and needs to be developed via training, capacity
building, business skills, negotiating skills, marketing skills, and monitoring and
evaluation skills of indigenous tourism projects.
Tourism is labour intensive, with on average two employees per hotel room in
developing countries (Christie & Crompton, 2001). This is confirmed by Page (1999)
who demonstrates that tourism is more labour intensive in low labour cost countries,
with the number of employees per hotel room found to be 3.3 in Africa, 0.5 in Europe,
and 1.7 in Asia. In low labour cost countries the number of casual employees is higher.
Findings by Page (1999) and Christie and Crompton (2001) corroborate with this
study, where on average as indicated on Table 4.7, 48.19% have employed either one
or two employees.
As the question focused on the number of permanent employees, it is apparent that
there is wide use of casual employees in the tourism industry. This is understandable
due to the seasonal nature of tourism as highlighted by Tureac and Anca (2008).
However, in order to maintain service levels, and to compete with larger tour firms, it
is advisable for indigenous tour operators to employ more permanent employees with

76
vast knowledge in the industry. Although casual employees keep costs low, they might
not contribute to quality in the long run as a result of low motivation brought about by
job insecurity. This may thus be detrimental to the success of indigenous tour
operators.
These findings are consistent with the earlier findings on the year of incorporation
that majority of the firms owned by indigenous entrepreneurs were less than 10 years
old. They indicate that the majority of indigenous tour operators are recently formed
and either do not have much business to warrant the employment or the capacity to
pay for extra employees. This indicates that they are being managed by owner-
managers which could lead to incompetent services.
Table 4.7: Number of Permanent Employees
Item None 1-2 3-5 More than 5 Total
Tour consultants 9.64% 53.01% 24.10% 13.25% 100%
Tour guides 14.46% 39.76% 24.10% 21.69% 100%
Clerical workers 27.71% 51.81% 16.87% 3.61% 100%
Average 17.27% 48.19% 21.69% 12.85% 100%

77
Human Resources and Their Skills
The questionnaire had four questions analyzing how the indigenous tour operators rate
their importance to their success. These include importance of human resources
owned by the firm; their education and skills for their jobs; importance of training
with professional body in the industry; and importance of other international
languages acquisition.
From Table 4.8 it was found that majority of the respondents considered the skills of
human resources as important for the success of tour businesses. Education/skills
acquisition of employees was prevalently declared very important by 85.5% and the
remaining 14.5% as moderately important. Training in tourism industry for example in
Utalii College was also regarded highly by 57.8% looking at it as very important,
28.9% rated it as moderately important and 13.3% neutral. Language skills in addition
to English was also deemed important with 66.3% rating it as very important, 22.9%
moderately important, 9.6% neutral and 1.2% of slight importance. The average
findings also reveal that human resources and their skills are important being rated
63.38% very important and 22.60% moderately important. The highest mean score
was that of training in tourism industry for example in Utalii College at 4.88 as
compared to the lowest 4.40 on language skills in addition to English.
The findings above show that indigenous tour operators are well aware of the
importance of human resources to success, with the majority of respondents viewing
these factors as very important. These findings concur with other scholars’ findings:-
Nordin (2003) in Sweden on study on tourism clustering and innovation found that

78
qualified staff in particular is crucial to success and also vital for innovation in the tour
operating firms; Al-Mahrouq (2011) on study on success factors of SMEs in Jordan
also concluded human resources and their skills in an industry were essential on
success of the firm. These views were also shared by Temtime and Pansiri (2002) in a
similar study carried out in Botswana. Findings on training as a vital force in the
industry confirms the findings of Sindiga (1994) and Liu and Chen (2011) in studies
carried out in Kenya and China respectively. Beeton and Graetz (2002) also on their
study on training attitudes and needs of tourism industry concluded that language
other than English was important for tourism industry as it serves the globe and can
not be tied to only English speakers.
Human resources is the driver of all other resources. Their skills are also equally
important in driving the other resources too. Human resources recognition from these
findings is thus founded on believe in their ability to enable success of the tour
businesses owned by indigenous entrepreneurs. Training and skills acquisition
correlates with performance. Training in tourism industry for example in Utalii
College was found to be the most important factor on human resources sector. It is
important to ensure that the staff knows their product better by getting the specialized
knowledge in their area. Better informed human resources will give an edge for the
businesses by maximizing sales using the available resources effectively.

79
Table 4.8: Human Resources and Their Skills
Item Not
important
Of slight
importance
Neutral Moderately
important
Very
important
Mean
Training in
tourism
industry e.g.
Utalii College
0% 0% 13.3% 28.9% 57.8% 4.88
Language
skills in
addition to
English
0% 1.2% 9.6% 22.9% 66.3% 4.40
Education/
skills
acquisition of
employees
0% 0% 0% 14.5% 85.5% 4.58
Average 0.30% 0.90% 7.83% 22.60% 68.38%
Importance of Other Fixed Assets Owned by the Firm
The study sought to find out the importance of other fixed assets owned by the firm
towards its success. These included vehicles, parking yards, office space, and office
equipment. The vehicles being of importance to the tour operators were also
investigated on their ownership.
Tourist Ferrying Vans
The study sought to find out the number of tourist ferrying vans owned by tour firms
of indigenous entrepreneurs. These were classified under Nissan or van; 4x4 land

80
cruiser; and minibus. These were the majority of vehicles seen on Kenyan roads
ferrying tourists. Others that are rare in Kenya but are common to other countries like
the United States and Europe are the cabin camping trucks and choppers.
Table 4.9 indicates that the most popular vehicles among indigenous tour operators for
ferrying tourists are Nissan/vans. It was observed that 38.55% firms did not own a
Nissan or van, 37.35% had 1 or 2, 13.25% had between 3 and 5, while 10.84% had
more than 5. The 4x4 land cruisers were not very common with the firms as 56.63%
owned none, 26.51% owned either 1 or 2, 8.43% had between 3 and 5, while 1.2% had
not more than 5. Minibuses like the land cruisers were limited as 68.67% had none,
18.07% had 1 or 2, 3.61% had between 3 and 5 while 0% had more than 5. Other
vehicles were also not common as 85.54% had none, 7.23% had 1 or 2, 3.61% had
between 3 and 5 while 3.61% had more than 5. In average firms 62.35% firms don't
own tourist ferrying vehicles while only 22.29% among those who own vehicles own
either one or two.
The findings contradicts those of Western (1992) and Mbaiwa (2000) who found that
ownership of vehicles is crucial for the tour business success. They highlighted the
fundamental components of tourism as accommodation, entertainment, attractions at a
destination and transportation. They concluded that without vehicles it would be
difficult to control the quality of service given to the tourists. The findings of this
study thus contradict them as the respondents are lacking the vehicles for their
businesses. It also contradicts study by Schwartz and Font (2009) on sustainable

81
supply chain management on tour operators' practice that concluded vehicles were
important resource for the tourism business success.
With the major tourists' attraction in Kenya being wildlife, tour operators need vans
and 4x4 land cruiser vehicles to facilitate wildlife viewing. Access to the national
parks in Kenya is prohibited without a vehicle therefore one wonders how tour
operators survive without owning vehicles. Hire or lease of vehicles is becoming
increasingly common in Kenya for industries whose core business is not
transportation. This is done through third party logistics where the firms subcontract
others whose core business is related to the services they are looking for and thus
concentrate on their core businesses. This however could be detrimental to the tour
businesses, as they need to ensure quality service given to the tourists and
consequently skilled drivers and tour guides in customer service is vital. Another
disadvantage of this approach is that the reliability of the vehicles may be
questionable leading to poor quality service and unnecessary delays.
Table 4.9: Tourist Ferrying Vans Owned
Item None 1-2 3-5 More than 5
Van/Nissan 38.55% 37.35% 13.25% 10.84%
4x4 Land Cruiser 56.63% 26.51% 8.43% 1.20%
Minibus 68.67% 18.07% 3.61% 0.0%
Others 85.54% 7.23% 3.61% 3.61%
Average 62.35% 22.29% 7.23% 3.91%

82
Other Fixed Assets Owned by the firm
The responses as reflected on Table 4.10 point to poor regard to fixed assets by the
indigenous operators. Owned tourist ferrying vehicle was rated 45.8% very important,
22.9% moderately important, 16.9% neutral and 14.5% of slight importance. Owned
parking yard was not very different with owned tourist ferrying vehicles as 22.9%
rated it very important, 22.9% as moderately important, 18.1% were neutral, 20.5% of
slight importance and 15.7% not important. Owned office space was rated 65.1% very
important, 19.3% moderately important, 6% neutral, 4.8% of slight importance and
4.8% not important. Owned office equipment like fax, telephone, desks and
computers were highly rated as important to the indigenous operators with 73.5%
indicating they were very important, 22.9% moderately important, 1.2% neutral and
2.4% of slight importance. Owned office equipment like fax, telephone, desks and
computers had the highest mean of 4.72 as compared to owned parking yard which
had a mean of 3.26.
The question on owned tourist ferrying vehicles reverberate the previous section on
the number of vehicles owned per category. The findings on the same however differ
as majority of the respondents are convinced that owning a vehicle is important which
now corroborate with the findings of Western (1992) and Mbaiwa (2000) who found
that ownership of vehicles is crucial for the tour business success. Findings on other
fixed assets also proofs that the operators are convinced that the assets contributes to
success of the indigenous Kenyan's owned businesses. These findings are in line with

83
those of Gaur et al. (2011) who found that firms that have more resources at their
disposal are likely to have a greater capability to respond to the demands.
These findings show that while there are some indigenous tour operators who are
willing and able to compete for both local and international tourists, there are some
who seem to be comfortable with their current level of market share, hence their
indifference towards their own lack of resources. The main division between those
who regarded resources as of slight, neutral or not important and those who regard it
as important could also reflect that the operators are less informed of the competitive
advantage it could give them to own assets leading to lowering costs. Lower costs can
enable them improve on their services and ultimately compete for the market share.
The high mean score on owned office equipment indicate the importance of the same
as renting the same can be very expensive for the firm as compared to owning them.
The other resources can be attained via third party logistics or leasing as they are
expensive for small and medium business operators to own.

84
Table 4.10: Importance of Other Fixed Assets Owned by the Firm
Item Not
important
Slightly
important
Neutral Moderately
important
Very
important
Mean
Tourists
ferrying
vehicles
0% 14.5% 16.9% 22.9% 45.8% 4.02
Parking
yard
15.7% 20.5% 18.1% 22.9% 22.9% 3.26
Office
space
4.8% 4.8% 6.0% 19.3% 65.1% 4.41
Office
equipment
0% 2.4% 1.2% 22.9% 73.5% 4.72
Average 5.13% 10.55% 10.55% 22.00% 51.82%
Importance of Finance
The study sought to find out the importance of finance owned by the firm towards its
success. This was done through questions on availability of finance, its accessibility
and collaterals for the same. Table 4.11 shows found that finance was an important
asset with its availability being rated 90.4% very important and 9.6% moderately
important. Accessibility of finances was equally rated high with 85.5% very
important, 13.3% moderately important and some outliers 1.2% not important.
Having collateral to get finances was however rated slightly lower than the rest with

85
63.9% rating it as very important, 25.3% moderately important, 9.6% neutral, and
1.2% of slight importance. In average, the three factors were highly rated with
16.07% as moderately important and 79.97% as very important. The mean of
availability of finance was the highest at 4.93, followed by accessibility of the same at
4.85 and lastly collateral of the same at 4.50.
The findings resonate with those of Bankole and Odularu (2006) in the study carried
out on achieving millennium development goals: issues and options for Nigeria’s
tourism industry, which highlighted lack of finance or its access as one of the
hindrances to tourism business. Tilley and Tonge (2002) also found out that finance
was a key determinant of growth of SMEs thus vital for success of local tour
operators. Miller and Freisen (1982) also highlighted that firms need finance to invest
in systems, product improvements, new product development, process enhancement,
customer satisfaction, organizational challenges and response competitor challenges,
which is in line with findings on availability of finance. As concluded by Wanjohi
(2011), the accessibility remains a challenge because of high cost of credit, interest
rates and processing fees that hinder the operators from accessing the loans.
Finance is a main driver of a business as it enables stability, ownership of assets and
more importantly marketing. Local tour businesses are convinced on the same hence
the high rating on finance. Availability of finance is more important than its
accessibility and the collateral as shown by the mean score. This can be interpreted in
terms of loans from the banks where accessing the loan for local operators requires
some conditions to be fulfilled which might not be possible for example guarantor-

86
ship by another account holder. Collaterals are nowadays not highly regarded though
one must have assets to prove credibility.
Table 4.11: Importance of Finance to the Firm
Item Not
important
Slight
importance
Neutral Moderately
important
Very
important
Mean
Availability of
finance
0% 0% 0% 9.6% 90.4% 4.93
Accessibility of
finance
0% 1.2% 0% 13.3% 85.5% 4.85
Collateral for
finance
0% 1.2% 9.6% 25.3% 63.9% 4.50
Average 0.00% 0.80% 3.20% 16.07% 79.93%
Correlation Coefficient - Resources
Correlation coefficient indicates the measure of linear relationship between two
variables. Resources as a variable had three subsections namely: human resources and
their skills, fixed assets, and finance. Table 4.12 shows the Pearson correlation
coefficients between the three subsections of the independent variable - resources.

87
Human resource and their skills and other assets owned by the firm had a correlation
of 28.1% which was the highest on the matrix.
Table 4.12: Pearson Correlation Coefficient - Resources
Human
Resource
and their
skills
Other Assets
Owned by
Firm
Finance
Human Resource and
their skills
Pearson
Correlation
1
Sig. (2-tailed)
Other Assets Owned
by Firm
Pearson
Correlation
.236 1
Sig. (2-tailed) .000
Finance Pearson
Correlation
.166 .090 1
Sig. (2-tailed) .004 .166
Statistical Model on Effect of Resources on Success
The primary objective of this study was to investigate the challenges hindering
success of tour businesses owned by indigenous entrepreneurs in the tourism industry
in Kenya. Resources as one of the identified independent variable was studied to

88
investigate its effect on success. After establishment of goodness of measure of the
data using factor analysis, the hypothesis on the effect of resources on success of tour
businesses owned by indigenous entrepreneurs was tested.
Model Summary
The hypotheses to be tested were: 1) Null Hypothesis (Ho): Resources do not hinder
success of tour businesses owned by indigenous entrepreneurs in the tourism industry.
2) Alternative Hypothesis (HA): Resources hinder success of tour businesses owned
by indigenous entrepreneurs in the tourism industry. Confidence level of 95% will be
used and thus the significance or alpha level of 5%.
Table 4.13 shows the output for model fitness. The R coefficient of 0.917 indicated
that the resources as the independent factor had a positive correlation of 91.7% with
the dependent variable success of tour businesses owned by indigenous entrepreneurs
in the tourism industry. The R square also referred to coefficient of determination of
0.842 indicates that the model can explain only 84.2% of success of tour businesses
owned by indigenous entrepreneurs in the tourism industry. This shows that
resources as the independent variable of this study is a significant predictor of success
of tour businesses owned by indigenous entrepreneurs in the tourism industry.

89
Table 4.13: Model Summary – Goodness of fit
Indicator Coefficient
R 0.917
R Square 0.842
Std. Error of the Estimate 1.659
Analysis of Variance
Table 4.14 shows the analysis of variance - ANOVA. Success of tour businesses
owned by indigenous entrepreneurs in the tourism industry can be explained by the
model to the extent of 3440.152 out of 4087.106 or 84.2% while other variables not
captured by this model can explain 15.8% (646.953 out of 4087.106) of variation on
success of tour businesses owned by indigenous entrepreneurs in the tourism industry.
A p-value of 0.00 is less than the set level of significance of 0.05 for a normally
distributed data. This means that resources are significant in explaining success of
tour businesses owned by indigenous entrepreneurs in the tourism industry in Kenya.

90
Table 4.14: Analysis of Variance - ANOVA
Model Sum of
Squares
Df Mean Square F Sig.
1 Regression 3440.152 1 3440.152 1.250E .000
Residual 646.953 235 2.753
Total 4087.106b 236
Predictors: Resources
Dependent Variable: SUCCESS
Linear Regression Analysis
On Table 4.15, the beta coefficients used are the unstandardized coefficients. The
results indicate that a unit change on other assets owned by the firm, finance, and
human resource and their skills causes 1.427, 0.945 and -0.609 unit change
respectively in the success of tour businesses owned by indigenous entrepreneurs in
the tourism industry. This indicates that a drop of quality on human resources and their
skills will bring a negative change in success. Increase in other assets owned by the
firm and finance has a positive change towards success of tour businesses owned by
indigenous entrepreneurs in the tourism industry. As shown by the p-value, the three
factors are statistically significant to finance with .000 p-value compared to the set
level of significance of 0.05.

91
Table 4.15: Regression Coefficients
Model Unstandardized
Coefficients
T Sig.
B Std. Error
1 Other Assets Owned by
Firm
1.427 .178 8.028 .000
Finance .945 .157 6.007 .000
Human Resource and
their skills
-.609 .202 -3.015 .003
a. Dependent Variable: SUCCESS
On Table 4.16, the beta coefficients used are the unstandardized coefficients. The
results indicate that a unit change on resources as a combined variable causes 0.176
unit change in the success of tour businesses owned by indigenous entrepreneurs in the
tourism industry. As shown by the p-value is statistically significant with .000 p-value
compared to the set level of significance of 0.05.

92
Table 4.16: Regression Coefficients
Model Unstandardized
Coefficients
Standardized
Coefficients
T Sig.
B Std. Error Beta
1 RESOURCES .176 .005 .917 35.350 .000
a. Dependent Variable: SUCCESS
Regression analysis was carried out to test the two hypotheses stated earlier: 1) Null
Hypothesis (Ho): Resources do not hinder success of tour businesses owned by
indigenous entrepreneurs in the tourism industry. 2) Alternative Hypothesis (HA):
Resources hinder success of tour businesses owned by indigenous entrepreneurs in the
tourism industry. Confidence level of 95% was used and thus the significance or alpha
level of 5%. The model below which links the dependent variable, success, to the
independent variable - resources is used for the testing:-
Y = α + β11X11 + β12X12 + β13X13 + ε
Where:
Y is the dependant variable – Success
α is the intercept
β11, β12, and β13 are the regression coefficients of other assets owned by the firm,
finance, and human resource and their skills respectively

93
X11, X12, and X13 are the sub-variables of independent variable – other assets owned
by the firm, finance, and human resource and their skills.
ε is the Error term
From Table 4.15, β11 is 1.427, β12 is .945, and β13 is -.609. The estimated success is
thus achieved using the equation below using the sub-variables of resources:
Y = α + 1.427X11 + 0.945X12 - 0.609X13 + ε
From Table 4.16, β on the equation is .176. The final equation on success and
resources as a weighted variable is as below:
Y = α + 0.176X1 + ε
The level of significance, α, is 0.05. From Table 4.16, the p-value is 0.000. This
means that the alpha level is greater than the p-value. This led to conclusion that the
null hypothesis above (Resources does not hinder success of tour businesses owned
by indigenous entrepreneurs in the tourism industry in Kenya) should be rejected.
Resources are therefore important to the success of tour businesses owned by
indigenous entrepreneurs in the tourism industry.
From the findings on figure 4.2, resources are one of the challenges hindering success
of the tour businesses owned by indigenous entrepreneurs. The graph shows that the
more the resources in place, the more the success. This corroborates with the findings
of scholars like: Gaur et al. (2011); Khan (2008); and Mafunzwaini and Hugo (2005)
that resources are vital for success of a business. Penrose's resource based view
theory of 1959 is confirmed from the findings as essential for success. Leiper's Whole
Tourism System Model of 2004 which highlighted the need of resources in the tour
businesses particularly transports modes and accommodation was also validated.

94
However, the intensified competition has made the traditional resources dominance
more vulnerable because of fall in entry barriers making it no longer a sufficient
means to control and dominate (Whalley, 2010).
It is thus important for the tour businesses owned by indigenous entrepreneurs to
consider increase of resources. Human resources and their skills should be looked
into keenly because a drop in their quality negatively affects success of the tourism
business. Enhancing their skills is key to success and should be given high priority for
core competencies building. Finances could be accessed using openings in the local
banks for finances where entrepreneurs are encouraged to take loans though
guarantorship is still an issue. Government could also assist the industry by enabling
them access finance by opening its doors of lending to the indigenous entrepreneurs
through the Kenya Tourism Development Corporation (KTDC). Lending policy to the
tour operators should be reviewed to encourage investment in resources that will
ultimately enable success of their businesses. Pooling of vehicles can also be looked
into as an alternative by tour operators to enable them stabilize in terms of resources.
This could be done through partnerships whereby visitors going to the same locations
can be transported in the same vehicle instead of having a whole vehicle for one or
two clients. This could save on resources and at the same time enable clean
environment.
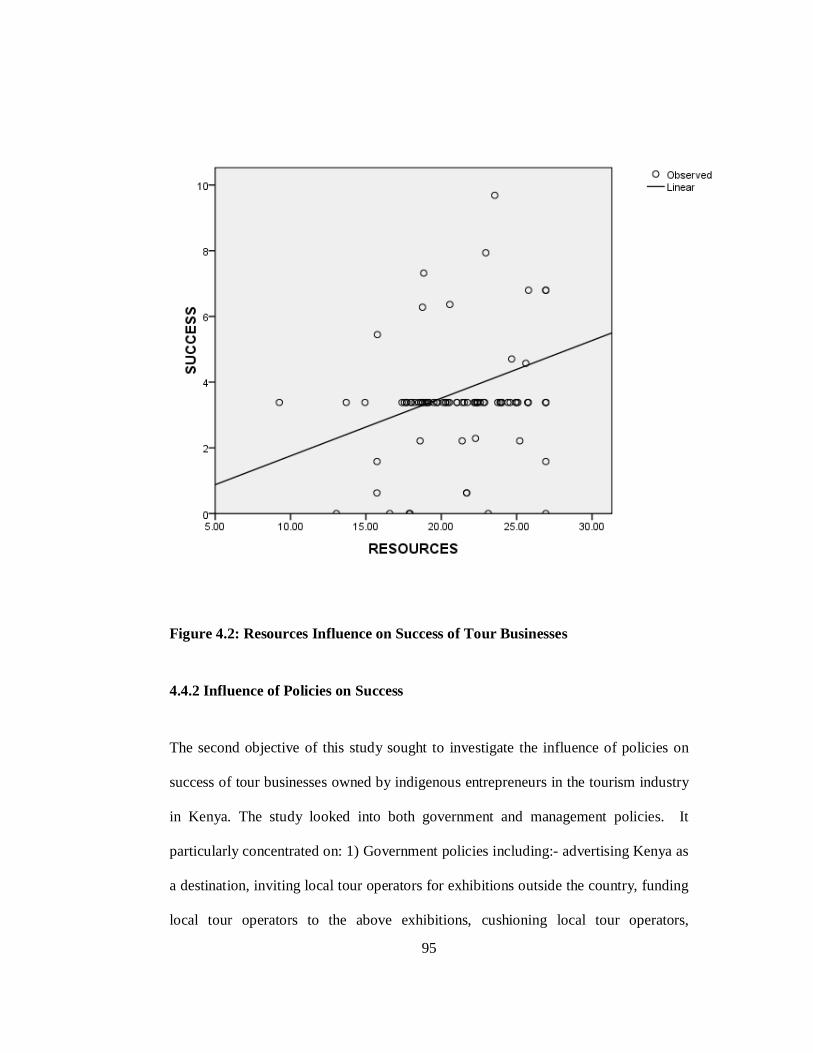
95
Figure 4.2: Resources Influence on Success of Tour Businesses
4.4.2 Influence of Policies on Success
The second objective of this study sought to investigate the influence of policies on
success of tour businesses owned by indigenous entrepreneurs in the tourism industry
in Kenya. The study looked into both government and management policies. It
particularly concentrated on: 1) Government policies including:- advertising Kenya as
a destination, inviting local tour operators for exhibitions outside the country, funding
local tour operators to the above exhibitions, cushioning local tour operators,

96
financing through the Kenya Tourism Development Corporation (KTDC), licenses
requirement, regional tourism enablement (East Africa), and uncontrolled prices
charged by tour operators; 2) Organizational policies which includes:- business plans,
operational plans and objectives, customer orientation and marketing (like customer
attraction and advertisement), human resource management (like recruitment,
remuneration, training and development), finance and accounting (like bookkeeping
and financing), and assets management (like assets recording, depreciation, and
replacement).
Government policies
The study sought to investigate the influence of the direct relevant government
policies on success of tour businesses owned by indigenous entrepreneurs in the
tourism industry in Kenya. These excluded other policies that can equally affect all
tour businesses including foreign owned like the infrastructure and game parks entry
fees. The findings in Table 4.17 point out that 90.1% of respondents believe that the
government should advertise Kenya as a tourist destination, while 81.9% believe that
local tour operators should be invited to participate in tourism exhibitions outside the
country, with 80% holding the opinion that the government should sponsor their
participation in these international exhibitions. Sixty two point seven percent of
operators agreed that the government should cushion indigenous tour operators from
external competition and 63.9% agreed that the government should finance indigenous
tour operators through the Kenya Tourism Development Corporation (KTDC). Eighty
three point one percent% either agreed or strongly agreed with current licensing
requirements. Policies on enablement of regional tourism within East Africa was

97
supported by 75.6% of respondents which would expand destinations and markets,
while 42.5% of respondents agreed with lack of price controls among tour operators,
as opposed to 23.7% who either disagreed or strongly disagreed. Majority of the
operators 33.8% were neutral on this policy. The highest mean was on advertising
Kenya as a destination with 4.39 revealing that many respondents agreed with this
policy as a major contributor to success. The lowest mean was on uncontrolled prices
changed by tour operators at 3.21 which reveals neutrality on this policy.
Other suggestions given by the respondents on policies that would lead to success of
their firms include:1) reduction of number of licenses or fees payable for the same.
Currently the tour operators should have four trading licenses. These are: (i) Class “A”
Enterprises License which cost KES 8,000 for the business license of Tour/Safari
Operators; (ii) Class ‘B’ Enterprises license covering proprietors, owner-drivers and
self employed drivers of passenger vehicles used wholly or partly in a tourist
enterprise at a fee of Kes 6000; (iii) Class “C” Enterprises license covering Citizen
Tour Leaders/Guides, at KES 2000; and (iv) business trade license from the city
council which costs Kes. 10000 for 2 to 5 vehicles, Kes. 30000 for 3 to 30 vehicles
and Kes 80000 for more than 30 vehicles. 2) subsidize rates for participating tour
operators in government's organized trade fairs; 3) review of taxes on the local tour
operators firms' tourists to make them competitive; 4) restriction of foreign investors
and fair treatment to all; 5) control price cut throats; 6) improved road infrastructure;
and 7) better public relations on the country's security.

98
The findings on advertising Kenya as a tourist destination, invitation and sponsoring
of local tour operators to participate in tourism exhibitions outside the county;
cushioning of local operators; financing through KTDC; and licenses requirements;
indicate that the government's role in upholding policies of promoting tourism
industry is paramount to the success of indigenous tour businesses in Kenya. This
corroborates findings from other scholars like Buijze (2010); Ikiara and Okech
(2002); and Rogerson (2007) in the Netherlands, Kenya, and South Africa respectively
who concluded that government support in its policies affect success of tour
businesses. Quian (2010) also concluded that government advertising of a destination
is important to uphold the position of the destination among the many competing
destinations. The findings also concur with the Mill and Morrison Model of 1985 that
indicates, "all tourism is marketed and government policies spearhead the marketing"
(Leiper, 2004).
The policy on uncontrolled prices charged by the tour operators were rated with
inconsistency almost dividing the respondent by half on either agrees or disagrees.
This resonates with Che-Rose, Kumar and Yen (2006) findings on the dynamics of
entrepreneurs’ success factors in influencing venture growth that some government
support programme did not influence venture growth and thus success. However, an
adequate support service to local industry is vital for the success of tour operations
(King and Stewart, 1996).
These findings show that the level of support or otherwise for current government
policy on tourism varies depending on the particular policy. The purpose of a sound

99
domestic policy framework is to reduce anticompetitive practices, to increase
efficiency, to create an enabling environment for investment, to facilitate the
ownership and the access to finance for private investors. Participation in trade-fairs
and exhibition gives an opportunity to increase awareness and to encourage trial via
face-to-face contact with customers. It is vital for the government policies review on
inviting and subsidizing participation to the same to encourage building of networks
and relationships that will translate into business transactions and ultimately success of
indigenous operators.
The local tour businesses operators reveal their neutrality or disagreement with some
policies that were rated with median of three or neutral. This is because of equal
treatment of local and foreign investors in the industry, which makes the policies of no
consequence to the local investors for example requirements for funding through
KTDC that does not differentiate the two. Uncontrolled prices charged by tour
operators is also of no consequence as it depends on the strategy taken by the firm
either to be a cost leader, focus on a certain market or differentiate from other firms.
The foreign direct investment policy encourages foreign investors into the tourism
business. The existing opportunities include investment in film production, recreation
and entertainment facilities in conference tourism, cultural tourism, cruise ship
tourism, aviation/tour and travel tourism and eco-tourism (RoK, 2006). This policy
does not exclude the 100% ownership of foreign investors and the percentage of local
ownership in case of partnership is not defined. This need streamlining to ensure that
the local investors get their share of wealth and thus increase sustainability of the

100
sector. It would also be vital to ensure that the marketing done by the Kenya Tourist
Board benefits the local investors more. This will also help put non-tariff barriers into
the sector and also safeguard the foreign exchange leakages where some tourists pay
from their home countries thus only the amount to be spent here is sent thus the profit
left abroad.
Table 4.17: Government Policies
Item Strongly
disagree
Disagree Neutral Agree Strongly
agree
Mean
Advertising Kenya as
destination
1.2% 6% 2.4% 34.9% 55.4% 4.39
Inviting local tour operators
for exhibitions outside the
country
4.8% 4.8% 8.4% 51.8% 30.1% 3.99
Funding local tour operators
to the above exhibitions
9.6% 6% 16.9% 42.4% 24.1% 3.64
Cushioning local tour
operators
3.6% 13.3% 20.5% 44.6% 18.1% 3.58
KTDC Financing 8.4% 8.4% 19.3% 49.4% 14.5% 3.53
Licenses requirement 1.2% 12% 3.6% 53% 30.1% 4.03
Regional tourism enablement 4.9% 7.3% 12.2% 42.7% 32.9% 3.90
Uncontrolled prices 7.5% 16.2% 33.8% 27.5% 15% 3.21
Average 5.15% 9.25% 14.64% 43.29% 27.53%

101
Organizational Policies
The study examined the firm's views on the existing organizational policies in the
tourism industry. Preliminary questions in this section was if the firm had written
guidelines, rules, and regulations; availability of those policies to employees; and use
of policies in decision-making. From the findings on table 4.18, 20.5% of the
respondents do not have written policies. The same results were for the use of these
policies in decision-making.
This finding confirms those of National Competitive Council (2004) that the main
reason for closedown or failure of young businesses is poor management brought
about by lack of planning and written down policies. Bryce, Dyer, and Hatch (2011)
identified quick decision as a major key to enable responses at the right time and said
this is hindered by lack of documented policies and bureaucracy. Written strategic
marketing policies as indicated by Zyl (2007) are key performance predictor for small
and micro tourism enterprises in South Africa.
These findings concur with the earlier findings that majority of tour businesses owned
by indigenous tour operators are recently formed and are managed by owner-
managers. As a result, policies are not written but instructions are given to workers
following the manager's way of thinking. This can be a reason for closure if the
manager dies as his objectives cannot be implemented leading to dying of the
business.

102
Table 4.18: Firms With Written Guidelines, Rules and Regulations
Frequency Percent Valid Percent Cumulative
Percent
Firms with 66 79.5 79.5 79.5
Firms without 17 20.5 20.5 100.0
Total 83 100.0 100.0
From the same, 63 firms indicated that the written guidelines, rules and regulations
are available to their employees. This translates to 75.9% of all respondents meaning
that those who have written policies make them available to their staff for decision-
making. The findings are in line with literature (Porter, 1998) that maximization of all
stakeholders' wealth will only be reflected by the policies in place. Communication of
the firm's strategy is important as indicated by Hambrick and Fredrickson (2001).
The 24.1% firms not availing their written guidelines, rules, and regulations should be
encouraged to do so.
This finding is consistent with the earlier findings that majority of tour businesses
owned by indigenous tour operators are recently formed and with few permanent
employees. As a result, some managers are not comfortable sharing the written
documents with the casual employees. This could be because of mistrust that should
be overcome if the firms have to grow to the next level. Good strategies are not good
enough until they are well communicated and executed.

103
From the findings in Table 4.19, 86.7% of respondents believed that a business plan
was either efficient or highly efficient policy and 87.9% of them indicated that
operational plans and objectives were either efficient or highly efficient policies. An
enormous majority of 92.8% felt that customer orientation and marketing was a
highly efficient policy for a tour operator to adopt. Human resource management had
81.9% of respondents indicating as either efficient or highly efficient policy. Finance
and accounting was found to be an efficient policy by 91.6% of respondents, and asset
management was rated as an efficient policy by 84.3% of respondents. The mean
score of all was above 4 indicating the policies were efficient. This is also confirmed
by the average of the respondents where 49.8% rated them as efficient.
The findings indicate that efficiency of organizational policies is a key factor to
success of tour businesses owned by indigenous entrepreneurs though only 79.5% of
the respondents as indicated previously have written guidelines, rules and regulations.
Good policies of the firm enables swift strategy devising to enable face the hyper-
competition in the tourism industry where only temporary profits are possible. New
strategies to create temporary advantages in the market calls for new trends in
marketing as a result of the existing policies (Whalley, 2010). The findings on
development of a business plan corroborate with those of Beeton and Graetz (2002);
Holland (1998); and Newbert (2005); on its importance for success. Al-Mahrouq
(2011) in study on success factors of small and medium enterprises (SMEs) in Jordan
also concluded that policies and structure of the firm are the main factors of success.
The findings also corroborates with those of Yusof (2011) in a study carried out in
104
Malaysia on success factors in entrepreneurship that the organizational policies greatly
influence its performance and image to current and prospective stakeholders.
The findings show that indigenous tour operators are predisposed towards a positive
view of organizational policies as efficient. Customer orientation was highly rated
indicating the understanding of the respondents that this is a service industry that is
highly influenced by the services they give to their clients. Findings on some firms
with inefficient or not knowing as their responses confirm the absence of the policies
or the dominance of owner-manager on the firm's activities and decision-making.
Improvement on efficiency of all the policies is encouraged to enable competitiveness
and sustainability as the policies efficiency will ultimately reflect the service quality
of the firm. Hyper-competition calls for change of strategies in the industry where
competitors' behaviors are analyzed to predict scenarios and thus enable identification
of disruptions of the key pivotal points.

105
Table 4.19: Organizational Policies
Item Highly
inefficient
Inefficient Don’t
know
Efficient Highly
efficient
Mean
Business Plan 6% 3.6% 3.6% 55.4% 31.3% 4.05
Operational plans
and objectives
4.8% 4.8% 2.4% 55.4% 32.5% 4.09
Customer orientation
and marketing
2.4% 4.8% 0% 48.2% 44.6% 4.37
Human
resource management
3.6% 3.6% 10.8% 44.6% 37.3% 4.14
Finance and
Accounting
2.4% 1.2% 4.8% 48.2% 43.4% 4.33
Assets management 3.6% 6% 6% 47% 37.3% 4.14
Average 3.80% 4.00% 4.60% 49.80% 37.73%
Statistical Modeling
The primary objective of this study was to investigate the challenges hindering
success of tour businesses owned by indigenous entrepreneurs in the tourism industry
in Kenya. Policies as one of the identified independent variable was studied to
investigate its effect on success. After establishment of goodness of measure of the
data using factor analysis, the hypothesis on the effect of policies on success of tour
businesses owned by indigenous entrepreneurs was tested.

106
Model Summary
The hypotheses to be tested were: 1) Null Hypothesis (Ho): Policies does not hinder
success of tour businesses owned by indigenous entrepreneurs in the tourism industry.
2) Alternative Hypothesis (HA): Policies hinder success of tour businesses owned by
indigenous entrepreneurs in the tourism industry. Confidence level of 95% will be
used and thus the significance or alpha level of 5%.
Table 4.20 shows the output for model fitness. The R coefficient of 0.912 indicated
that the policies as the independent factor had a correlation of 91.2% with the
dependent variable success of tour businesses owned by indigenous entrepreneurs in
the tourism industry. The R square also referred to coefficient of determination of
0.832 indicates that the model can explain only 83.2% of success of tour businesses
owned by indigenous entrepreneurs in the tourism industry while the remaining
16.8% is determined by other factors. This shows that policies as the independent
variable of this study is a significant predictor of success of tour businesses owned by
indigenous entrepreneurs in the tourism industry.
Table 4.20: Model Summary – Goodness of fit
Indicator Coefficient
R 0.912
R Square 0.832
Std. Error of the Estimate 1.715

107
Correlation Coefficients on Policies Variable
Correlation coefficient indicates the measure of linear relationship between two
variables. Table 4.21 shows the Pearson correlation coefficients between the
independent variable - policies based on the two sub-variables government and
organizational policies. The findings show that there is no major correlation between
the two forms of policies though it is positive at 36%. This indicates a positive linear
relationship between them but not so high.
Table 4.21: Pearson Correlation Coefficient - Policies
Organization's
policies
Government
policies
Organization's policies Pearson Correlation 1 .060
Sig. (2-tailed) .360
Government policies Pearson Correlation .060 1
Sig. (2-tailed) .360
Analysis of Variance
Table 4.22 shows the analysis of variance - ANOVA. It shows that the model to the
extent of 3398.603 out of 4087.106 or 83.2% can explain the success of tour
businesses owned by indigenous entrepreneurs in the tourism industry. The remaining
16.8% or 688.503 out of 4087.106 is explained by other variables not captured by this
model. A p-value of 0.00 is less than the set level of significance of 0.05 for a

108
normally distributed data. This means that policies are significant in explaining
success of tour businesses owned by indigenous entrepreneurs in the tourism industry.
Table 4.22: Analysis of Variance - ANOVA
Model Sum of
Squares
Df Mean Square F Sig.
1 Regression 3398.603 2 1699.301 577.538 .000
Residual 688.503 234 2.942
Total 4087.106 236
Predictors: Organization's policies, Government policies
Dependent Variable: SUCCESS
Regression Coefficients
Table 4.23, shows the beta coefficients used that are unstandardized. The results
indicate that a unit change on government policies causes 0.561 changes in the
success of tour businesses owned by indigenous entrepreneurs in the tourism industry
while a unit change on organization's policies causes 1.208 changes. This indicates
that policies as a variable have an influence on success of tour businesses owned by
indigenous entrepreneurs in the tourism industry.

109
Table 4.23: Regression Coefficients
Model Unstandardized
Coefficients
t Sig. Collinearity
Statistics
B Std.
Error
Tolerance VIF
1 Government
policies
.561 .136 4.111 .000 .148 6.765
Organization's
policies
1.208 .132 9.176 .000 .148 6.765
a. Dependent Variable: SUCCESS
Table 4.24 shows the unstandardized regression coefficient of the variable policies
weighted means. This is a combination of the government and the organizational
policies. The results indicate that a unit change on policies causes 0.129 changes in
the success of tour businesses owned by indigenous entrepreneurs in the tourism
industry. A p-value of .000 shows the significance of the model as it is less than the
set significance level of 0.05.

110
Table 4.24: Regression Coefficients of Policies Combined
Model Unstandardized
Coefficients
Standardized
Coefficients
t Sig.
B Std. Error Beta
1 POLICIES .129 .004 .907 32.918 .000
a. Dependent Variable: SUCCESS
Regression Analysis
Regression analysis was carried out to test the two hypotheses stated earlier: 1) Null
Hypothesis (Ho): Policies does not hinder success of tour businesses owned by
indigenous entrepreneurs in the tourism industry in Kenya. 2) Alternative Hypothesis
(HA): Policies hinder success of tour businesses owned by indigenous entrepreneurs in
the tourism industry in Kenya. Confidence level of 95% will be used and thus the
significance or alpha level of 5%. The model below is used for the testing the
dependent variable – success to the independent variable - policies which consists of
the two sub-variables, the government policies and the organizational policies:-
Y = α + β21X21 + β21X22 + ε
Where:
Y is the dependent variable – Success
α is the intercept

111
β21 and β22 is the regression coefficient for the government policies and the
organizational policies respectively
X21 and X22 is the independent variable – Policies subdivided into the government
policies and the organizational policies respectively
ε is the Error term
From Table 4.23, β21 is .561 and β22 is 1.208. The estimated success is achieved using
the equation below:
Y = α + 0.561X21 + 1.208X22 + ε
From Table 4.24, the β on policies is .129. The final equation on success and policies
as a weighted variable is therefore as below:
Y = α + 0.129X2 + ε
As stated above, α is 0.05 and the p-value from the ANOVA table 4.24 is 0.000. This
means that the alpha level is greater than the p-value. This leads to conclusion that the
null hypothesis above (Policies does not hinder success of tour businesses owned by
indigenous entrepreneurs in the tourism industry in Kenya) should be rejected.
Policies are therefore an important factor to the success of tour businesses owned by
indigenous entrepreneurs in the tourism industry.
From the findings on figure 4.3, policies are concluded to be a factor hindering
success of the tour businesses owned by indigenous entrepreneurs. The graph shows
that the more the policies in place, the more the success. This resonates with other
findings like: National Competitive Council (2004) that concluded the main reason for
closedown or failure of young businesses has been said to be poor management
112
brought about by lack of planning and written down policies; Bryce, Dyer, and Hatch
(2011) that concluded identified lack of documented policies and bureaucracy leads to
slow decision making; Zyl (2007) who concluded that written strategic marketing
policies are key performance predictor for small and micro tourism enterprises in
South Africa.
Other scholars like Buijze (2010); Ikiara and Okech (2002) and Rogerson (2007), and
in the Netherlands, Kenya, and South Africa respectively who concluded that
government support in its policies affect success of tour businesses share these
findings. Quian (2010) also concluded that government advertising of a destination is
important to uphold the position of the destination among the many competing
destinations. The findings also concur with the Mill and Morrison Model of 1985 that
indicates, "all tourism is marketed and government policies spearhead the marketing"
(Leiper, 2004). It is thus important for the tour businesses owned by indigenous
entrepreneurs to consider increase use of written policies. The government should
also consider policies that can help the local operators to enable sustainability of the
industry.

113
Figure 4.3: Effects of Policies on Success of Tourism Businesses of Indigenous
Kenyans
4.4.3 Influence of Information, Communication and Technology (ICT) to Success
The third objective of this study sought to investigate the influence of information,
communication and technology (ICT) on success of tour businesses owned by
indigenous entrepreneurs in the tourism industry in Kenya. The study particularly
concentrated on computerization of the firm, website features of the firm, and
problems encountered on website maintenance.

114
Whether Firms are Computerized and has a Functional Website
Two preliminary questions on ICT's determination of success were investigated.
These were if the firm was computerised and if it had a functional website as the
backbone of ICT. Computerisation would mean that the firms have embraced ICT
and left the brick and mortar way of working which meant lots of paperwork, time
spent and many employees required for a task and as a consequence wastage of
valuable resources. ICT adoption would give them competitive advantage by ensuring
fast transmission of information and cost saving leading to efficiency and profitability
of the firm. From the findings on Table 4.25, 63 firms were computerised and an
equal number had a functional website. This translates to 76% firms computerised
and with a functional website. The findings reveal that computerization and creation
of functional website is yet to be implemented by 24%, which is a quarter of the tour
businesses.
This finding corroborates with Kiprutto, Kigio and Riungu (2011) found that only
30% of the tour businesses had adopted ICT or had a website though they all used
internet for email purposes. Eraqi and Abdalla (2008) found the same in Egypt where
many had neither adopted ICT nor had online presence. The findings also show
Kenya is still ahead of some countries like Malaysia where only 30% of small
medium enterprises (SMEs) had a web presence and used ICT extensively in daily
operations (Soraya, 2005).
Failure to adopt ICT and have functional website could be a reason of failure in the
indigenous owned tour businesses. ICT adoption and having a functional website is

115
not an option to any competing firm in the tourism industry. The main innovation that
the tour businesses can come up with could only be because of ICT strategic moves.
Resources also could be restraining the procurement of computers and designing of a
website but investing in the same is worth for the tour businesses.
Table 4.25: Computerised Firms and With Functional Website
Description Frequency Percent
Firms that has adopted ICT and have functional website 63 75.9
Firms that has not adopted ICT and have functional
website
20 24.1
Total 83 100.0
Features of the Website and Their Relations to Success of the Firm
On website information, the study sort information on features of the website and
their relation to success of the firm. The features investigated includes: 1)
Appearance of the website, its graphical interface like choice of layout, fonts, and
colours; 2) In-depth descriptions of firms products or services; 3) Contact
information; 4) Booking capability; 5) E-commerce or payment online; 6) Customer
testimonials access; 7) Hyperlinks to other websites; 8) Subscription to mailing lists to
receive offers and news; and 9) Multiple languages.
From the analysis on Table 4.26, 78.8% of respondents rated appearance of website,
its graphical interface like choice of layout, fonts, and colours as very important to the

116
success of their businesses. Others rated the same as follows: 13.6% moderately
important, 1.7% neutral, 4.7% of slight importance, and 1.3% not important. The
overall mean score was 4.64 out of five, where five would mean very important and
one would mean not important.
In-depth description of the firm's products or services on the website was rated very
important to the success of the tour businesses owned by indigenous entrepreneurs by
78.8% respondents. Others rated it as follows: 18.2% moderately important, 1.7% of
slight importance, and 1.3% not important. The overall mean score was 4.72.
Contact information on the website was rated by 93.6% respondents as very important
to the success of the tour businesses owned by indigenous entrepreneurs. Others rated
it as follows: 6% moderately important and 0.4% of slight importance. The overall
mean score was 4.93.
Booking capability on the website was rated by 52.1% respondents as very important
to the success of the tour businesses owned by indigenous entrepreneurs. Other
respondents rated it as follows: 25% moderately important, 10.6% neutral, 7.2% of
slight importance, and 5.1% not important. The overall mean score was 4.12.
E-commerce or payment online was rated very important to the success of the tour
businesses owned by indigenous entrepreneurs by 30.5% respondents while others
rated it as follows: 29.2% moderately important, 19.5% neutral, 13.6% of slight
importance, and 7.2% as not important. As a consequence of the wide spread of the
rating, the overall mean score was 3.62.

117
Access of customers' testimonials on the website was rated very important to the
success of the tour businesses owned by indigenous entrepreneurs by 45.3%. The
others rated it as follows: 21.2% moderately important, 21.6% neutral, 8.1% of slight
importance and 3.8% not important. The overall mean score was 3.96.
Importance of hyperlink to other websites to success of the tour businesses owned by
indigenous entrepreneurs was valued by 29.2% as very important. Other respondents
valued the same as follows: 22.9% moderately important, 36% neutral, 8.5% of slight
importance, and 3.4% not important. The overall mean score was 3.66.
Subscription to mailing lists to receive offers or news in the website was rated by
35.6% as important towards success of the tour businesses owned by indigenous
entrepreneurs. Others rated it as follows: 39% moderately important, 16.5% neutral,
3.4% of slight importance, and 5.5% not important. The overall mean was 3.96.
Multiple languages on the website was rated by 35.2% as very important towards
success of the tour businesses owned by indigenous entrepreneurs. Other respondents
rated it as follows: 33.9% moderately important, 18.2% neutral, 5.9% of slight
importance, and 6.8% not important. The overall mean score was 3.85.
The studied website features were found to be a factor to success of tour businesses
owned by indigenous entrepreneurs as described by the overall average. Among the
respondents, 53.2% rated the website features as very important, 23.2% moderately
important, 13.8% neutral, 5.9% slightly important, and 3.9% not important.
118
The findings corroborate those of Iliachenko (2006) in a study carried out in Sweden
on Electronic Service Quality in Tourism, though hyperlinks to other websites are
highly rated on this study while mailing list subscription was poorly rated.
Christiansson and Sporrek (2003), Wilson (1996), Liu and Chen (2011), and
Hoffman, Novak and Chatterjee (1995) in their studies carried out in Sweden, United
States of America (USA), China and USA respectively also share the findings on
importance of these factors. They considered appearance of the website with clear
information as a key factor of success towards online booking that can be achieved by
considering the role of customers as one with no time to waste as there are other
alternatives. Pavlou and Gefen (2002) also shared the findings indicating that good
website features bring about institution-based trust while credit card guarantee is also
an important feature on the online payments. Customer testimonials were also found
to influence success as higher rating indicates sellers have higher probability of
delivery (Gefen & Carmel, 2010).
The findings show that indigenous tour operators are aware that the website features
play an important role in success of their businesses. An appealing website attracts
customers and resulting to interest in doing business with the firm. The local
operators do not embrace hyperlinks to other website that suggests unfamiliarity with
web marketing as a good selling point exposing them to the exterior world. Customer
testimonial is also important to website searches, as customers tend to believe more
on what other customers say about it. Giving higher than expected services is an
answer to get a good recommendation that is important for success of the firm.

119
Table 4.26: Website Features
Item Not
Important
Slight
important
Neutral Moderately
important
Very
important
Mean
Appearance of the
website
1.3% 4.7% 1.7% 13.6% 78.8% 4.64
In-depth
descriptions of
products/services
1.3% 1.7% 0.0% 18.2% 78.8% 4.72
Contact
information
0.4% 0.0% 0.0% 6.0% 93.6% 4.93
Booking capability 5.1% 7.2% 10.6% 25.0% 52.1% 4.12
E-commerce
/payment online
7.2% 13.6% 19.5% 29.2% 30.5% 3.62
Customer
testimonials access
3.8% 8.1% 21.6% 21.2% 45.3% 3.96
Hyperlinks to other
websites
3.4% 8.5% 36.0% 22.9% 29.2% 3.66
Subscription to
mailing lists to
receive offers, news
etc.
5.5% 3.4% 16.5% 39.0% 35.6% 3.96
Multiple languages 6.8% 5.9% 18.2% 33.9% 35.2% 3.85
Average 3.9% 5.9% 13.8% 23.2% 53.2%

120
Problems on Website Maintenance and Their Relations to Success of the Firm
This section reports the findings on problems encountered by the local operators on
website maintenance as a factor of ICT that can affect the success of tour businesses
owned by indigenous entrepreneurs. The study concentrated on problems like: 1)
Keeping content updated; 2) Online security; 3) Reliability of telecommunications
service; 4) Quality of web hosting equipment; 5) Cost of maintenance; 6) Training or
skills to implement certain website features; and 7) Access to expert assistance or
advice.
Table 4.27 shows the findings of keeping the website content updated as a major
problem for 28.8% of respondents while others rated it as follows: 20.8% major,
9.3% neutral, 29.2% minor, and 11.9% very minimal. The overall mean score was
2.75 out of five, where five represented very minimal and one represented very major.
Online security problem on the other hand had 31.8% respondents rating it very major
and could hinder success of tour businesses owned by indigenous entrepreneurs.
Others rated it as follows: 20.3% major, 11% neutral, 24.2% minor, and 12.7% very
minimal. The overall mean score was 2.26.
Problem on reliability of telecommunication service could hinder success of tour
businesses owned by indigenous entrepreneurs. It was rated by 35.2% respondents as
very major. Others rated it as follows: 37.3% major, 8.1% neutral, 8.5% minor, and
11% very minimal. The overall mean score was 2.23.

121
Problems encountered on quality of web hosting equipment was also found to be
hinder success of tour businesses owned by indigenous entrepreneurs. It was rated
very major by 25.4%, major by 29.7%, neutral by 16.1%, minor by 17.8%, and very
minimal by 11%. The overall mean score was 2.59.
Cost of maintenance problem could hinder success of tour businesses owned by
indigenous entrepreneurs. It was rated by 25% respondents as very major while the
others rated it as follows: 34.3% major, 16.5% neutral, 14.8% minor, and 9.3% very
minimal. The overall mean score was 2.49.
Problem on training or skills to implement certain website features could hinder
success of tour businesses owned by indigenous entrepreneurs. It was rated by 25.8%
as very major. Others rated it as follows: 28.4% major, 14.4% neutral, 22.9% minor,
and 8.5% very minimal. The mean score was 2.60.
Access to expert assistance problem was rated very major by 26.3% respondents and
could hinder success of tour businesses owned by indigenous entrepreneurs. Others
rated it as follows: 30.1% major, 14.4% neutral, 20.3% minor, and 8.9% very minimal.
The mean score was 2.56.
Website maintenance was found to be an uphill task to many respondents. The
problems could be a major hindrance to success of tour businesses owned by
indigenous entrepreneurs as 57% respondents have rated them as above major. The
overall average rating was as follows: 28.3% very major, 28.7% major, 12.8% neutral,
19.7% minor, and 10.5% very minimal.

122
The study corroborate that of Kiprutto, et al. (2011) who found out that maintenance
of ICT in Kenya was a major problem because of the cost charged thus not affordable
by the small and medium tour operators. Axinte (2009); Christiansson and Sporrek
(2003); and Gefen and Devine (2001) in their studies in USA, Sweden, and Romania
respectively confirms security of the web was a problem to many and its proper
maintenance can lead to customer loyalty. They also raised an alarm on
implementing latest innovation without considering the customers who will actually
use the service as their equipment capacity, internet experience and connectivity could
hinder success of the upgraded website. However, updating of the website content is
mandatory as the internet users are increasingly searching the web (Sullivan, 2005;
Fallows, 2008). Victor (2008) also in a study in Mauritius concluded content of the
website is key and should be backed up by the 7C's of website evaluation that include
content, community, customization, communication, connection, commerce and
context.
The findings reveal that many indigenous tour operators are experiencing problems on
website maintenance that could lead to their downfall in today's competitive and
dynamic world. Reliability of telecommunication service and online security were the
main problems, which indicates that the service levels of the business could be lower
as a result. Prompt reply to queries cannot be guaranteed because of this unreliability
of the service making clients lose confidence on the operators. Lack of online security
might also hinder clients booking with the local operator and prefer making payments
when on the ground meaning the operator has to advance the hotel bookings lowering

123
their liquidity. The inconsistence between the respondents on website maintenance
problems suggests that the operators at different levels have different problems.
Table 4.27: Website Maintenance Problems
Item Very
Major
Major Neutral
Minor
Very
Minimal
Mean
Keeping content updated 28.8% 20.8% 9.3% 29.2% 11.9% 2.75
Online security 31.8% 20.3% 11.0% 24.2% 12.7% 2.66
Reliability of
telecommunications service
35.2% 37.3% 8.1% 8.4% 11.0% 2.23
Quality of web hosting
equipment
25.4% 29.7% 16.1% 17.8% 11.0% 2.59
Cost of maintenance 25.0% 34.3% 16.5% 14.9% 9.3% 2.49
Training or skills to implement
certain website features
25.8% 28.4% 14.4% 22.9% 8.5% 2.60
Access to expert assistance or
advice
26.3% 30.1% 14.4% 20.3% 8.9% 2.56
Average 28.3% 28.7% 12.8% 19.7% 10.5%
Statistical Modeling
The primary objective of this study was to investigate the challenges hindering
success of tour businesses owned by indigenous entrepreneurs in the tourism industry.
ICT as one of the identified independent variable was studied to investigate its effect

124
on success. After establishment of goodness of measure of the data using factor
analysis, the hypothesis on the effect of information and technology on success of tour
businesses owned by indigenous entrepreneurs was tested.
Model Summary
The hypotheses to be tested were: 1) Null Hypothesis (Ho): Information and
Technology does not hinder success of tour businesses owned by indigenous
entrepreneurs in the tourism industry. 2) Alternative Hypothesis (HA): Information
and Technology hinder success of tour businesses owned by indigenous entrepreneurs
in the tourism industry. Confidence level of 95% was used and thus the significance
or alpha level of 5%.
Table 4.28 shows the output for model fitness. The R coefficient of 0.905 indicated
that the ICT as the independent factor had a correlation of 90.5% with the dependent
variable success of tour businesses owned by indigenous entrepreneurs in the tourism
industry. The R square also referred to coefficient of determination of 0.818 indicates
that the model can explain only 81.8% of success of tour businesses owned by
indigenous entrepreneurs in the tourism industry while the remaining 18.2% is
determined by other factors. This shows that ICT as the independent variable of this
study is a significant predictor of success of tour businesses owned by indigenous
entrepreneurs in the tourism industry.

125
Table 4.28: Model Summary – Goodness of fit
Indicator Coefficient
R 0.905
R Square 0.818
Std. Error of the Estimate 1.782
Pearson Correlation Coefficient
Correlation coefficient indicates the measure of linear relationship between two
variables. Table 4.29 shows the Pearson correlation coefficients between the
independent variable - ICT based on the two sub-variables - website features and
website maintenance problems. The findings show that there is no major correlation
between the two forms of policies though it is positive at 4.5%. This indicates a
positive linear relationship between the two sub-variables.
Table 4. 29: Pearson Correlation Coefficient
Website
Features
Website Maintenance
Problems
Website Features Pearson
Correlation
1
Sig. (2-tailed)
Website Maintenance
Problems
Pearson
Correlation
.131* 1
Sig. (2-tailed) .045

126
Regression Coefficients
Table 4.30 shows the unstandardized coefficients. The results indicate that a unit
change on website features causes 1.438 changes in the success of tour businesses
owned by indigenous entrepreneurs in the tourism industry while a unit change in
website maintenance problems causes .617 changes. This means that as the website
features are increased by one unit, success is bound to increase at a rate of 1.438 while
a unit decrease of website maintenance problems would lead to success at the rate of
.617. This indicates that ICT has an influence on success of tour businesses owned by
indigenous entrepreneurs in the tourism industry.
Table 4.30: Regression Coefficients
Model Unstandardized
Coefficients
T Sig.
B Std. Error
1 Website Features 1.438 .098 14.642 .000
Website Maintenance
Problems
.617 .162 3.817 .000
a. Dependent Variable: SUCCESS
Table 4.31 shows the unstandardized coefficients. The results indicate that a unit
change on ICT causes 0.138 changes in the success of tour businesses owned by

127
indigenous entrepreneurs in the tourism industry in Kenya. The p-value of .000 shows
that ICT is significant as the level of significance has been set at 0.05.
Table 4.31: Regression Coefficients on ICT
Model Unstandardized Coefficients Standardized
Coefficients
t Sig.
B Std. Error Beta
1 ICT .138 .004 .903 32.130 .000
a. Dependent Variable: SUCCESS
Analysis of Variance
Table 4.32 shows the findings of the analysis of variance - ANOVA. Success of tour
businesses owned by indigenous entrepreneurs in the tourism industry can be
explained by the model to the extent of 3344.436 out of 4087.106 or 81.8% while
other variables not captured by this model can explain 18.2%, 742.67 out of
4087.106, of variation on success of tour businesses owned by indigenous
entrepreneurs in the tourism industry in Kenya. A p-value of 0.00 is less than the set
level of significance of 0.05 for a normally distributed data. This means that ICT is
significant in explaining success of tour businesses owned by indigenous
entrepreneurs in the tourism industry.
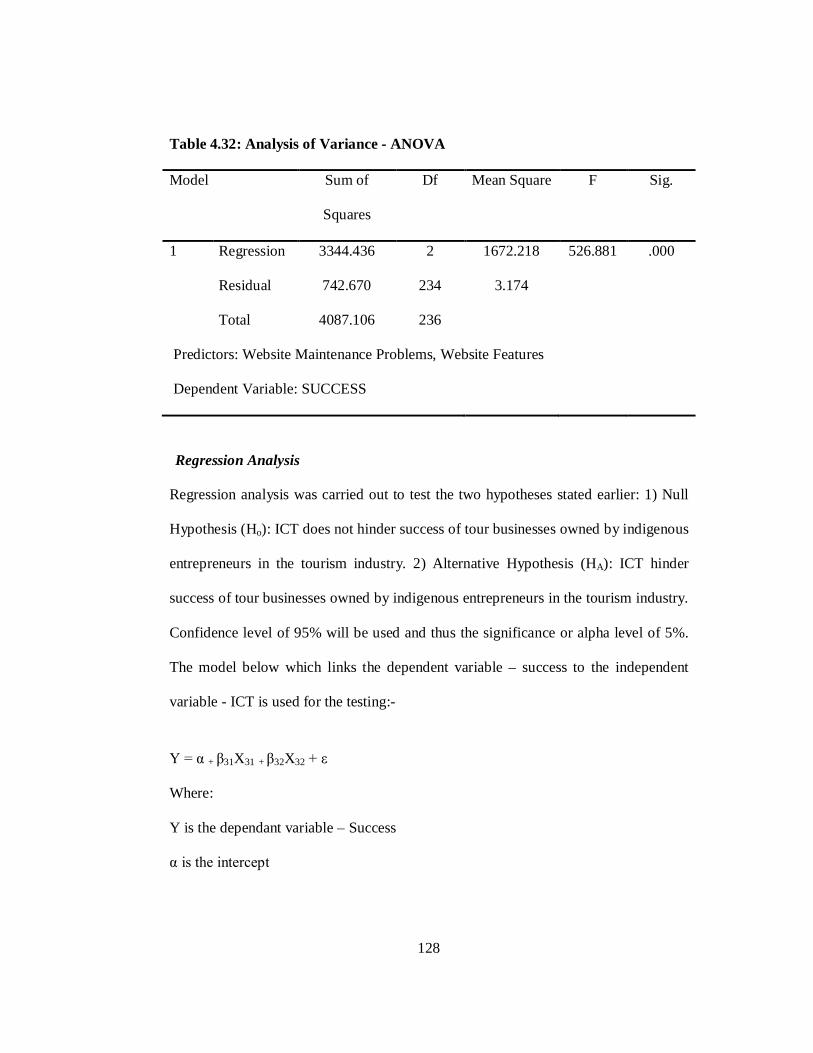
128
Table 4.32: Analysis of Variance - ANOVA
Model Sum of
Squares
Df Mean Square F Sig.
1 Regression 3344.436 2 1672.218 526.881 .000
Residual 742.670 234 3.174
Total 4087.106 236
Predictors: Website Maintenance Problems, Website Features
Dependent Variable: SUCCESS
Regression Analysis
Regression analysis was carried out to test the two hypotheses stated earlier: 1) Null
Hypothesis (Ho): ICT does not hinder success of tour businesses owned by indigenous
entrepreneurs in the tourism industry. 2) Alternative Hypothesis (HA): ICT hinder
success of tour businesses owned by indigenous entrepreneurs in the tourism industry.
Confidence level of 95% will be used and thus the significance or alpha level of 5%.
The model below which links the dependent variable – success to the independent
variable - ICT is used for the testing:-
Y = α + β31X31 + β32X32 + ε
Where:
Y is the dependant variable – Success
α is the intercept

129
β31 and β32 is the regression coefficient of ICT - website features and website
maintenance problems respectively
X31 and X32 is the independent variable – ICT of website features and website
maintenance problems respectively
ε is the Error term
From Table 4.30, β31 is 1.438 while that of β32 is .617. The estimated success is
achieved using the equation below:
Y = α + 1.438X31 +0.617 X32 + ε
From Table 4.31, the β on ICT is .138. The final equation on success and ICT as a
weighted variable is therefore as below:
Y = α + 0.138X3 + ε
As stated above, α is 0.05. From Table 4.32, the p-value is 0.000. This means that
the alpha level is greater than the p-value. This led to conclusion that the null
hypothesis above (ICT does not hinder success of tour businesses owned by
indigenous entrepreneurs in the tourism industry) should be rejected. It can therefore
be concluded that ICT is an important factor to the success of tour businesses owned
by indigenous entrepreneurs in the tourism industry.
From the findings on Figure 4.4, ICT is concluded to be a factor hindering success of
the tour businesses owned by indigenous entrepreneurs. The graph shows that the
more website features are improved and website maintenance problems are reduced,
the more the success. This is because of reduced costs, distance and time to
communication that increases efficiency. This corroborates with the findings of

130
Alipour, Hajaliakbari, and Javanbakht (2011); Fallows (2008); and Sullivan (2005)
who concluded that in the current times tourism and internet are inseparable and
highly correlated. Victor (2008) also resonate the same by concluding that it was not
the cost of being there on the online market place that must be reckoned with, but the
cost of not being there. Baggio and Caporarello (2205) also concluded computerized
decision systems in tourism industry are essential tools to support managers for their
capability to provide timely and accurate information. Without internal installation of
ICT it is impossible for external connection.
Tour businesses owned by indigenous entrepreneurs should therefore consider
application of ICT both in their internal business and in e-tourism to increase success.
Tourism industry is very competitive and thus only the computed will make it on the
race. With the findings on importance of ICT driving success by 81.8%, the
indigenous entrepreneurs cannot afford to downplay it. Competitive advantage in the
tour businesses can be leveraged on ICT because of its advantages on cost and
distance collapsing. Tourism strategies should be ICT oriented for innovation and
speed movement. This is only possible if IT is aligned with the business strategies of
the firm and supported by the management.

131
Figure 4.4: Information, Communication and Technology Influence on Success
of Tour Businesses
4.4.4 Influence of Service Quality on Success
The fourth objective of this study sought to investigate the influence of service quality
on success of tour businesses owned by indigenous entrepreneurs in the tourism
industry. The study concentrated on five dimensions as highlighted by the PZB model
also refered to as SERVQUAL model by Parasuraman, Zeithaml, and Berry (1985).
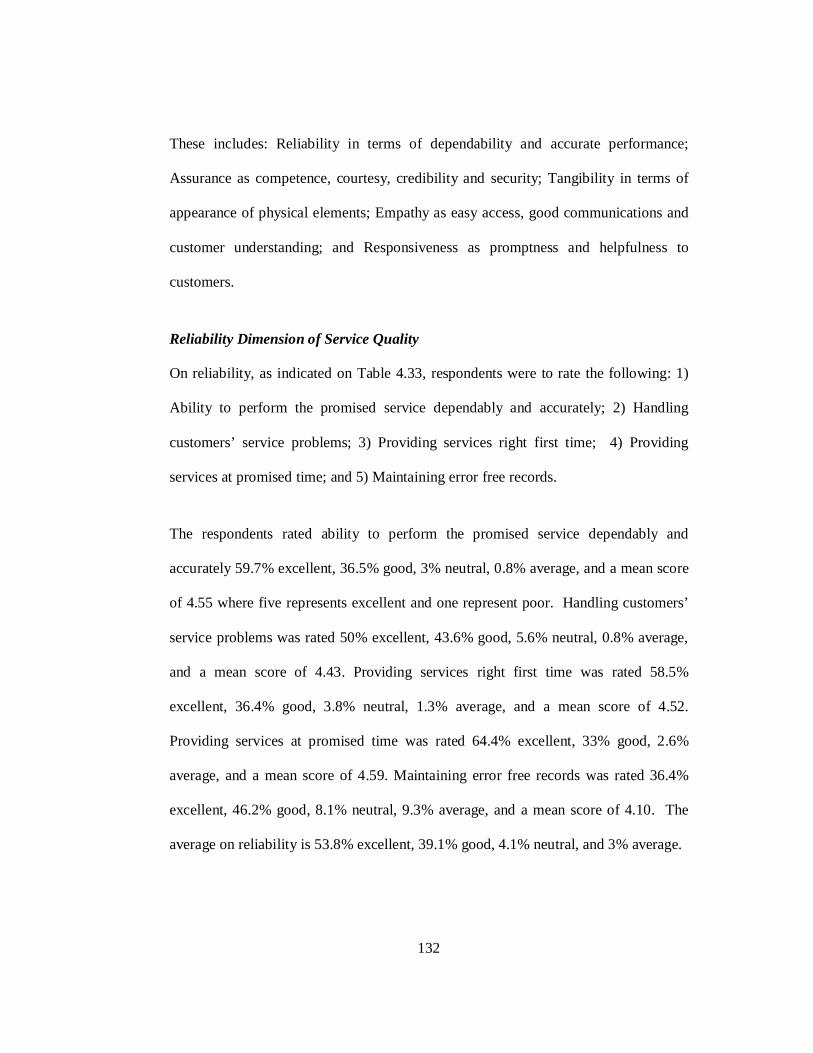
132
These includes: Reliability in terms of dependability and accurate performance;
Assurance as competence, courtesy, credibility and security; Tangibility in terms of
appearance of physical elements; Empathy as easy access, good communications and
customer understanding; and Responsiveness as promptness and helpfulness to
customers.
Reliability Dimension of Service Quality
On reliability, as indicated on Table 4.33, respondents were to rate the following: 1)
Ability to perform the promised service dependably and accurately; 2) Handling
customers’ service problems; 3) Providing services right first time; 4) Providing
services at promised time; and 5) Maintaining error free records.
The respondents rated ability to perform the promised service dependably and
accurately 59.7% excellent, 36.5% good, 3% neutral, 0.8% average, and a mean score
of 4.55 where five represents excellent and one represent poor. Handling customers’
service problems was rated 50% excellent, 43.6% good, 5.6% neutral, 0.8% average,
and a mean score of 4.43. Providing services right first time was rated 58.5%
excellent, 36.4% good, 3.8% neutral, 1.3% average, and a mean score of 4.52.
Providing services at promised time was rated 64.4% excellent, 33% good, 2.6%
average, and a mean score of 4.59. Maintaining error free records was rated 36.4%
excellent, 46.2% good, 8.1% neutral, 9.3% average, and a mean score of 4.10. The
average on reliability is 53.8% excellent, 39.1% good, 4.1% neutral, and 3% average.

133
These findings corroborate those of Millan and Esteban (2004) and Josmani (2007) on
their studies in Spain and Malaysia respectively where they concluded reliability;
which they looked at as providing the service within agreed time, complying with
agreed premises, fast and clear information, and clear and sincere information; was a
main factor of satisfaction on service in travel industry. Christiansson and Sporrek
(2003) and Gefen and Devine (2001) in Sweden and USA respectively also
corroborate with the findings unveiling reliability as a factor giving confidence to
customers by re-assuring dependability and ultimately increasing customer loyalty
and purchases.
The findings reflect self-confidence among the local operators who rated their
services mostly excellent or good. This is a good indicator towards success of the
tourism businesses owned by indigenous entrepreneurs. The mean score also reflects
their understanding on reliability's importance as a factor contributing to success.

134
Table 4.33: Service Quality - Reliability
Item Poor Average Neutral Good Excellent Mean
Ability to perform the
promised service
dependably and accurately
0% 0.8% 3% 36.5% 59.7% 4.55
Handling customers’
service problems
0% 0.8% 5.6% 43.6% 50% 4.43
Providing services right
first time
0% 1.3% 3.8% 36.4% 58.5% 4.52
Providing services at
promised time
0% 2.6% 0% 33% 64.4% 4.59
Maintaining error free
records
0% 9.3% 8.1% 46.2% 36.4% 4.10
Average 0.0% 3.0% 4.1% 39.1% 53.8%
Assurance Dimension of Service Quality
The second dimension of service quality, assurance, was investigated on the
following:- 1) Knowledge and courtesy of employees and their ability to inspire trust
and confidence; 2) Making customers feel safe in their transactions; 3)
Knowledgeable employees in handling customers questions; and 4) Customers’ trust
on website information.

135
As indicated on Table 4.34, assurance as a dimension in service quality was rated as
follows in the firms owned by indigenous entrepreneurs: knowledge and courtesy of
employees and their ability to inspire trust and confidence was rated 49.2% excellent,
47% good, 2.5% neutral, 1.3% average, and a mean score of 4.44 where five
represents excellence and one represents poor. Making customers feel safe in their
transactions was rated 68.2% excellent, 29.7% good, 1.3% neutral, 0.8% average, and
a mean score of 4.65. Knowledgeable employees in handling customers questions was
rated 61.4% excellent, 36.4% good, 2.1% average, and a mean score of 4.57.
Customers’ trust on website information was rated 38.1% excellent, 38.1% good,
10.2% neutral, 9.7% average, 3.8% poor, and a mean score of 3.97. The average
rating on assurance was 54.2% excellent, 37.8% good, 3.5% neutral, 3.5% average,
and 1% poor. The mean of all apart from that of customer trust on website
information was above 4.4.
These findings resonate those of Millan and Esteban (2004) on a study in Spain that
concluded assurance; looked at as employment confidence, service provision
continuously well, follow-up of clients, accuracy of employees, and time dedicated to
each client; was a main factor of satisfaction on service in travel industry.
Christiansson and Sporrek (2003) and Pavlou and Gefen (2002) in Sweden and USA
also unveiled assurance as a factor to lower risk on clients' payments made for the
service and ensure reliability. Axinte (2009); Christiansson and Sporrek (2003),
Gefen and Devine (2001), Liu and Chen (2011), and in Romania, Sweden, USA,
China and respectively considered security very important as far as online booking is

136
concerned and it added that it should not be compromised if the tourists are to give
their personal details online.
The rating on assurance indicates commitment by firms owned by indigenous
entrepreneurs to offer high service quality. This is however negated by the mixed
reaction on customer's trust on website information, which brings about failure, as
clients are not ready to give their money or engage firms they cannot trust. This can
be a consequence of individual marketing and lack of affiliation to the well known
corporate membership clusters and networks in the industry.
Table 4.34: Service Quality - Assurance
Item Poor Average Neutral Good Excellent Mean
Knowledge and courtesy
of employees and their
ability to inspire trust and
confidence
0% 1.3% 2.5% 47% 49.2% 4.44
Making customers feel
safe in their transactions
0% 0.8% 1.3% 29.7% 68.2% 4.65
Knowledgeable employees
in handling customers
questions
0% 2.1% 0% 36.5% 61.4% 4.57
Customers’ trust on
website information
3.8% 9.7% 10.2% 38.1% 38.1% 3.97
Average 1.0% 3.5% 3.5% 37.8% 54.2%

137
Tangibility Dimension of Service Quality
Tangibility as the third dimension of service quality was reviewed on the following:
1) Modern equipments including cars and IT equipment; 2) Very high frequency
(VHF) and high frequency (HF) radio fitted cars; 3) Visually and up-to-date appealing
facilities; 4) Employees with a neat, professional appearance.
As expressed on Table 4.35, modern equipments including cars and information
equipment was rated 23.7% excellent, 50.9% good, 13.1% neutral, 12.3% average,
and a mean score of 3.86 where one is poor and five is excellent. Very high frequency
(VHF) and high frequency (HF) radio fitted cars was rated 29.7% excellent, 38.5%
good, 16.5% neutral, 15.3% average and a mean score of 3.83. Visually and up-to-
date appealing facilities was rated 30.1% excellent, 39.8% good, 21.2% neutral, 8.9%
average and a mean score of 3.91. Employees with a neat, professional appearance
was rated 54.2% excellent, 37.7% good, 4.7% neutral, 3.4% average and a mean score
of 4.43. On average, tangibles was rated 34.4% excellent, 41.7% good, 13.9% neutral
and 10% average. The mean of tangibility was positive between neutral and good with
the least being 3.86 and the highest 4.43.
These findings corroborates Millan and Esteban (2004) on their study in Spain which
concluded tangibility; being employees confidence, service provision continuously
well, follow-up of clients, accuracy of employees, and time dedicated to each client;
as a main factor of satisfaction on service in travel industry. Gefen (2002) on a study
in USA also concluded that customer loyalty highly depend tangibility of service
quality in form of the picture of what they see and is the easiest memory to take.

138
Siadat (2008) in Iran also reiterated that tangibility is important towards success and
can be used as a tool to give competitive advantage to a firm.
Tangibility as service quality dimension looks into appearance of physical elements
thus resonate the resources of the firm. The mixed reactions to the items can be
because many firms owned by indigenous entrepreneurs do not own the resources as
reflected on earlier findings. However, the findings on employees with a neat and
professional appearance of the employees show the positive attitude of the local
operators on the importance of tangibility as a service quality dimension, which will
ultimately secure them success in their businesses.
Table 4.35: Service Quality - Tangibles
Item Poor Average Neutral Good Excellent Mean
Modern equipments
including cars and IT
equipment
0% 12.3% 13.1% 50.9% 23.7% 3.86
VHF and HF radio fitted
cars
0% 15.3% 16.5% 38.5% 29.7% 3.83
Visually and up-to-date
appealing facilities
0% 8.9% 21.2% 39.8% 30.1% 3.91
Employees with a neat,
professional appearance
0% 3.4% 4.7% 37.7% 54.2% 4.43
Average 0.0% 10.0% 13.9% 41.7% 34.4%

139
Empathy Dimension of Service Quality
The fourth dimension of service quality, empathy, was investigated under: 1) Caring,
individualized attention the firm provides its customers; 2) Employees understanding
of their customers’ needs while respecting their privacy; 3) Convenient business
hours; and 4) Communication skills of the employees.
Table 4.36 outlines the findings on caring; individualized attention the firm provides
its customers as 55.5% excellent, 36.9% good, 5.1% neutral, 2.5% average, and a
mean score of 4.45. Employees understanding of their customers’ needs while
respecting their privacy was rated 64.8% excellent, 29.7% good, 3.8% neutral, 1.7%
average, and a mean score of 4.58. Convenient business hours was rated 41.5%
excellent, 49.6% good, 4.2% neutral, 4.7% average, and a mean score of 4.28.
Communication skills of the employees was rated 61% excellent, 35.2% good, 0.4
neutral, 3.4% average and a mean score of 4.54. On average, empathy was rated
55.7% excellent, 37.9% good, 3.4% neutral, 3.1% average and the least mean score
was 4.28.
These findings corroborate with Millan and Esteban (2004) on study in Spain where
they concluded empathy that they looked at areas such as: interest in solving problems
to the clients, individual attention, understanding the specific needs of the client and
sharing information; was a main factor of satisfaction on service in travel industry.
Josmani (2007) on study in Malaysia also concluded service quality provided by
travel operators particularly on experienced tour guide or manager during the tour and
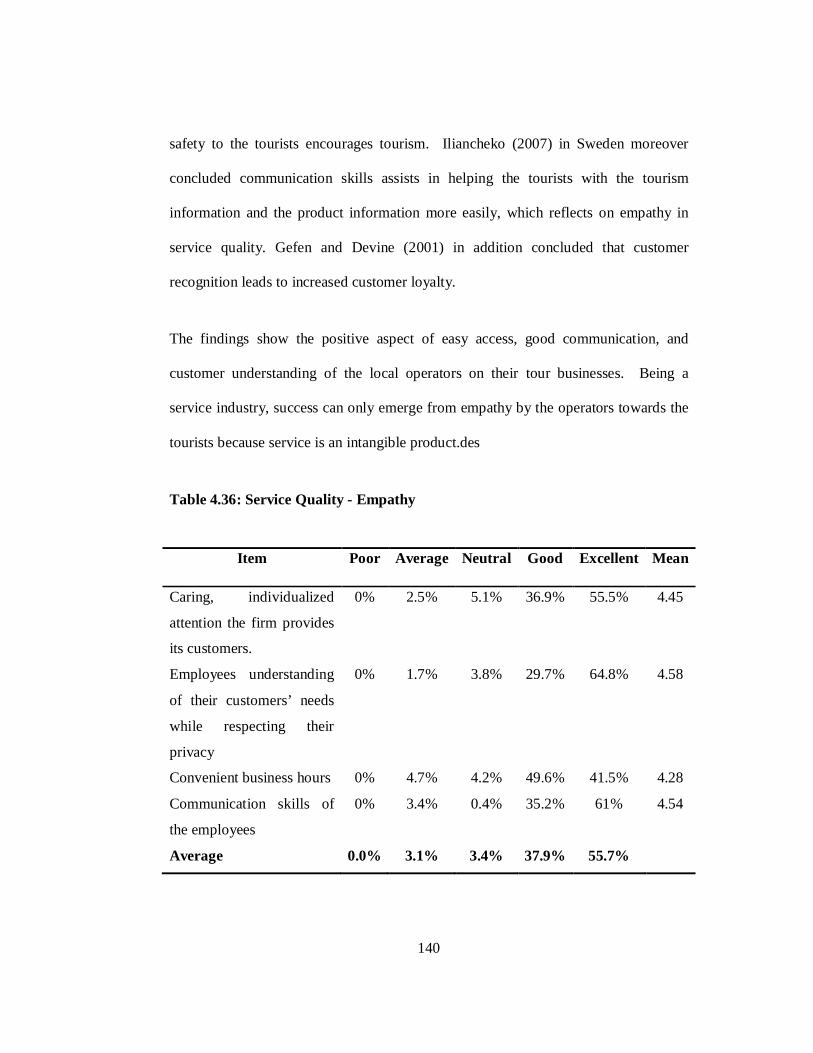
140
safety to the tourists encourages tourism. Iliancheko (2007) in Sweden moreover
concluded communication skills assists in helping the tourists with the tourism
information and the product information more easily, which reflects on empathy in
service quality. Gefen and Devine (2001) in addition concluded that customer
recognition leads to increased customer loyalty.
The findings show the positive aspect of easy access, good communication, and
customer understanding of the local operators on their tour businesses. Being a
service industry, success can only emerge from empathy by the operators towards the
tourists because service is an intangible product.des
Table 4.36: Service Quality - Empathy
Item Poor Average Neutral Good Excellent Mean
Caring, individualized
attention the firm provides
its customers.
0% 2.5% 5.1% 36.9% 55.5% 4.45
Employees understanding
of their customers’ needs
while respecting their
privacy
0% 1.7% 3.8% 29.7% 64.8% 4.58
Convenient business hours 0% 4.7% 4.2% 49.6% 41.5% 4.28
Communication skills of
the employees
0% 3.4% 0.4% 35.2% 61% 4.54
Average 0.0% 3.1% 3.4% 37.9% 55.7%

141
Responsiveness Dimension of Service Quality
Responsiveness as fifth and last dimension of service quality was investigated under
the following: 1) Use of right means of communication; 2) Keeping customers
informed as to when services will be performed; 3) Prompt service to customers; 4)
Information is provided to frequently asked questions and answers; and 5) Email
address for queries or complaints is provided.
Table 4.37 shows the findings as follows: use of right means of communication was
rated 54.2% excellent, 41.1% good, 2.6% neutral, 2.1% average and a mean score of
4.47 where one is poor and five is excellent. Keeping customers informed as to when
services will be performed was rated 57.2% excellent, 39.4% good, 1.3% neutral,
2.1% average and a mean score of 4.52. Prompt service to customers (less than 24
hours) was rated 61.9% excellent, 29.2% good, 3.8% neutral, 5.1% average and a
mean score of 4.48. Provision of information to frequently asked questions and
answers was rated 53.8% excellent, 40.7% good, 1.7% neutral, 3.8% average and a
mean score of 4.44. Provision of email address for queries or complaints was rated
59.3% excellent, 33.1% good, 5.1% neutral, 2.5% average and a mean score of 4.49.
On responsive, on average 56.6% respondents rated it excellent, 36.4% good, 2.9%
neutral, and 4.1% average and the least mean score was 4.44.
The findings corroborate those of Liu and Chen (2011) in China who concluded right
means of communication is key to success as it enables personalization of response.
Iliancheko (2007) and Gefen and Devine (2001) in Sweden and USA respectively
found out that faster response to customers give them confidence towards the firm.

142
Millan and Esteban (2004) in Spain also concluded responsiveness in terms of follow-
up of clients, accuracy of employees, and time dedicated to each client; as a main
factor of satisfaction on service in travel industry.
The findings prove that the local operators realizes that customer is the king and it is
their core business to communicate to them effectively and efficiently to gain a
market share. The average and neutral ratings however show some firms are yet to
understand the impact of service quality on their business that is service based thus
intangible.
Table 4.37: Service Quality - Responsiveness
Item Poor Average Neutral Good Excellent Mean
Use of right means of
communication
0% 2.1% 2.6% 41.1% 54.2% 4.47
Keeping customers
informed as to when
services will be performed
0% 2.1% 1.3% 39.4% 57.2% 4.52
Prompt service to
customers (less than 24
hours)
0% 5.1% 3.8% 29.2% 61.9% 4.48
Information is provided to
frequently asked questions
and answers
0% 3.8% 1.7% 40.7% 53.8% 4.44
Email address for queries
or complaints is provided
0% 2.5% 5.1% 33.1% 59.3% 4.49
Average 0.0% 3.1% 2.9% 36.7% 57.3%

143
Statistical Modeling
The general objective of this study was to investigate the challenges hindering success
of tour businesses owned by indigenous entrepreneurs in the tourism industry.
Service quality as one of the identified independent variable was studied to investigate
its effect on success. After establishment of goodness of measure of the data using
factor analysis, the hypothesis on the effect of service quality on success of tour
businesses owned by indigenous entrepreneurs was tested.
Model Summary
The hypotheses to be tested were: 1) Null Hypothesis (Ho): Service quality does not
hinder success of tour businesses owned by indigenous entrepreneurs in the tourism
industry. 2) Alternative Hypothesis (HA): Service quality hinder success of tour
businesses owned by indigenous entrepreneurs in the tourism industry. Confidence
level of 95% will be used and thus the significance or alpha level of 5%.
Table 4.38 shows the output for model fitness. The R coefficient of 0.912 indicated
that the service quality as the independent factor had a correlation of 91.2% with the
dependent variable success of tour businesses owned by indigenous entrepreneurs in
the tourism industry. The R square also referred to coefficient of determination of
0.832 indicates that the model can explain only 83.2% of success of tour businesses
owned by indigenous entrepreneurs in the tourism industry while the remaining
16.8% is determined by other factors. This shows that service quality as the
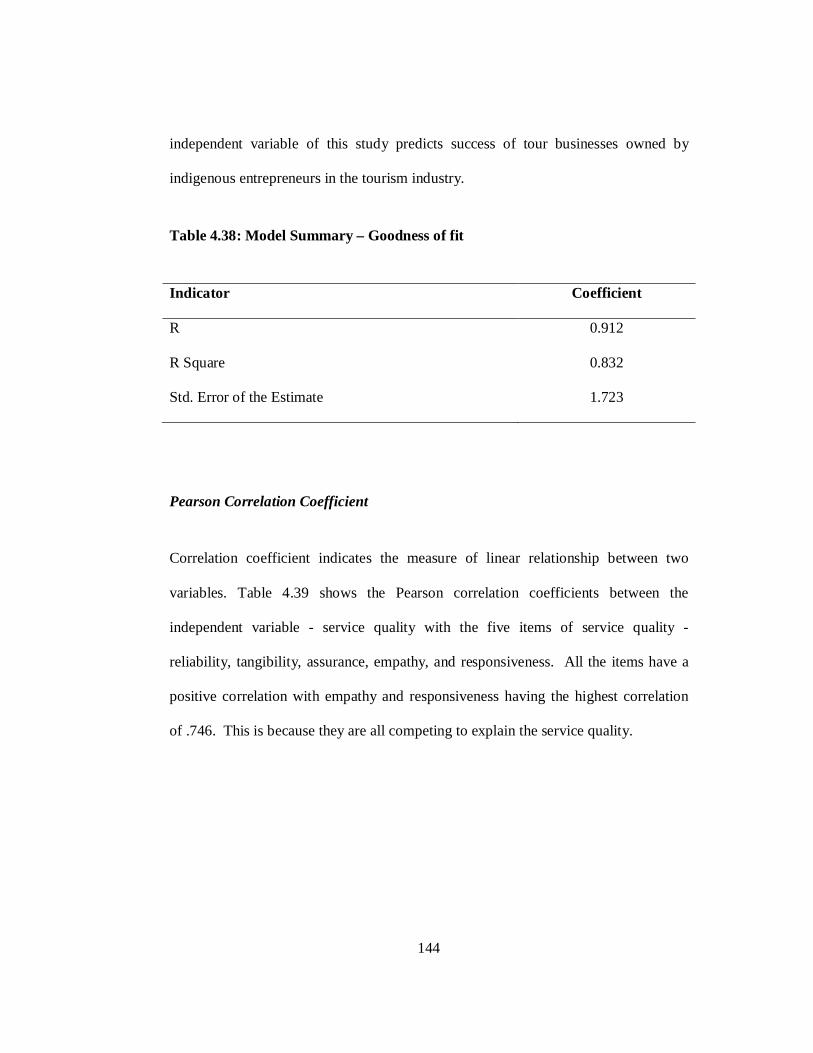
144
independent variable of this study predicts success of tour businesses owned by
indigenous entrepreneurs in the tourism industry.
Table 4.38: Model Summary – Goodness of fit
Indicator Coefficient
R 0.912
R Square 0.832
Std. Error of the Estimate 1.723
Pearson Correlation Coefficient
Correlation coefficient indicates the measure of linear relationship between two
variables. Table 4.39 shows the Pearson correlation coefficients between the
independent variable - service quality with the five items of service quality -
reliability, tangibility, assurance, empathy, and responsiveness. All the items have a
positive correlation with empathy and responsiveness having the highest correlation
of .746. This is because they are all competing to explain the service quality.

145
Table 4.39: Pearson Correlation Coefficient - Service Quality
Reliability Assurance Tangibility Empathy Responsiveness
Reliability Pearson
Correlation
1
Sig. (2-
tailed)
Assurance Pearson
Correlation
.603 1
Sig. (2-
tailed)
.000
Tangibility Pearson
Correlation
.483 .646 1
Sig. (2-
tailed)
.000 .000
Empathy Pearson
Correlation
.597 .695 .690 1
Sig. (2-
tailed)
.000 .000 .000
Responsiveness Pearson
Correlation
.570 .634 .649 .746 1
Sig. (2-
tailed)
.000 .000 .000 .000
Regression Coefficients
Table 4.40 shows the unstandardized coefficients. The results indicate the change
caused by each of the service quality's sub-variables to success tour businesses owned
by indigenous entrepreneurs in the tourism industry in Kenya. From Table 4.39, it
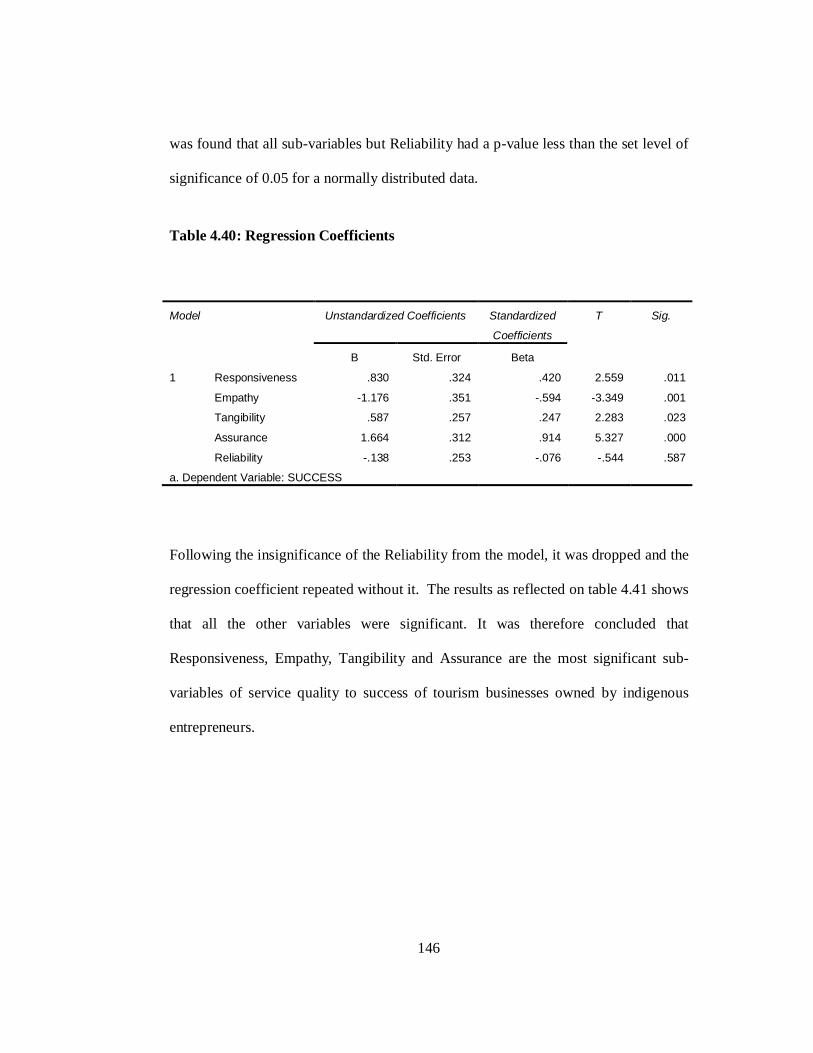
146
was found that all sub-variables but Reliability had a p-value less than the set level of
significance of 0.05 for a normally distributed data.
Table 4.40: Regression Coefficients
Model Unstandardized Coefficients Standardized
Coefficients
T Sig.
B Std. Error Beta
1 Responsiveness .830 .324 .420 2.559 .011
Empathy -1.176 .351 -.594 -3.349 .001
Tangibility .587 .257 .247 2.283 .023
Assurance 1.664 .312 .914 5.327 .000
Reliability -.138 .253 -.076 -.544 .587
a. Dependent Variable: SUCCESS
Following the insignificance of the Reliability from the model, it was dropped and the
regression coefficient repeated without it. The results as reflected on table 4.41 shows
that all the other variables were significant. It was therefore concluded that
Responsiveness, Empathy, Tangibility and Assurance are the most significant sub-
variables of service quality to success of tourism businesses owned by indigenous
entrepreneurs.
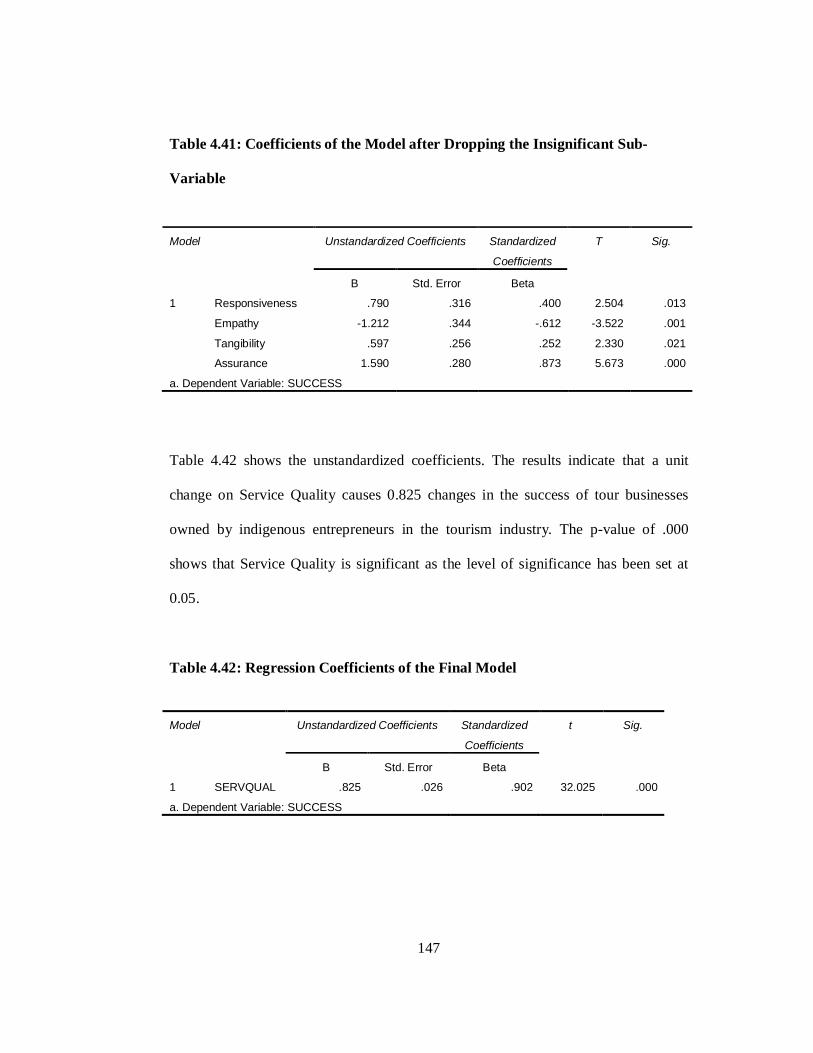
147
Table 4.41: Coefficients of the Model after Dropping the Insignificant Sub-
Variable
Model Unstandardized Coefficients Standardized
Coefficients
T Sig.
B Std. Error Beta
1 Responsiveness .790 .316 .400 2.504 .013
Empathy -1.212 .344 -.612 -3.522 .001
Tangibility .597 .256 .252 2.330 .021
Assurance 1.590 .280 .873 5.673 .000
a. Dependent Variable: SUCCESS
Table 4.42 shows the unstandardized coefficients. The results indicate that a unit
change on Service Quality causes 0.825 changes in the success of tour businesses
owned by indigenous entrepreneurs in the tourism industry. The p-value of .000
shows that Service Quality is significant as the level of significance has been set at
0.05.
Table 4.42: Regression Coefficients of the Final Model
Model Unstandardized Coefficients Standardized
Coefficients
t Sig.
B Std. Error Beta
1 SERVQUAL .825 .026 .902 32.025 .000
a. Dependent Variable: SUCCESS
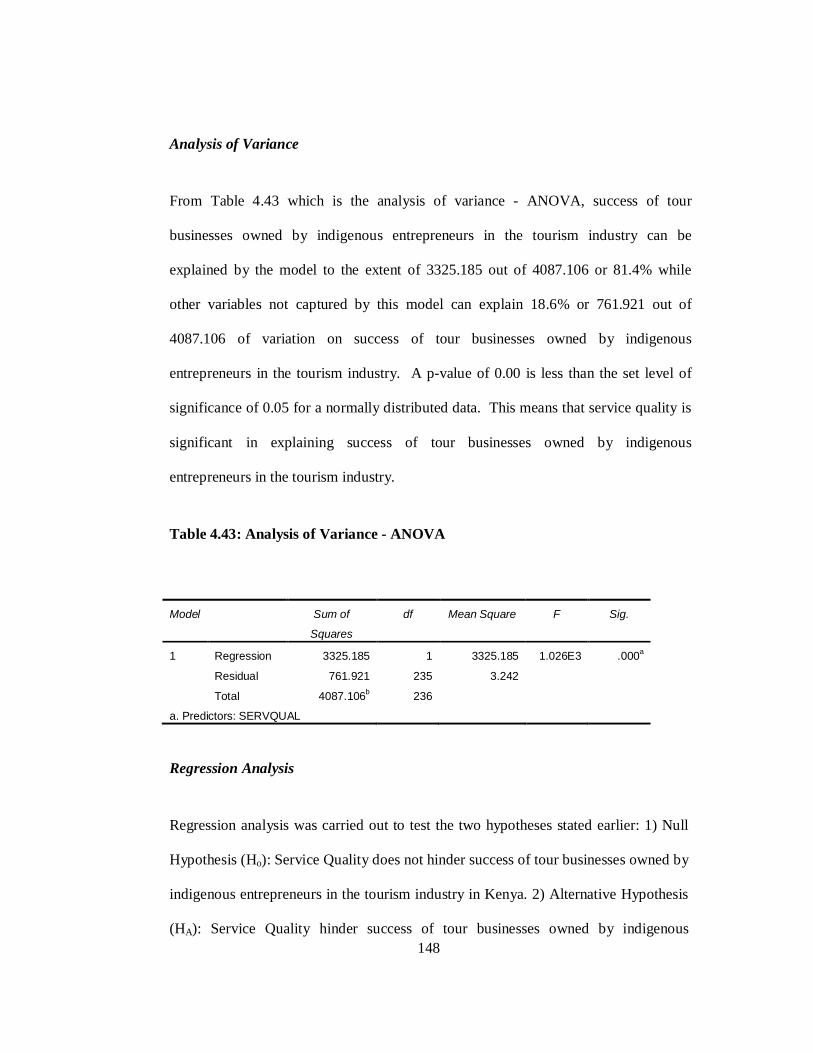
148
Analysis of Variance
From Table 4.43 which is the analysis of variance - ANOVA, success of tour
businesses owned by indigenous entrepreneurs in the tourism industry can be
explained by the model to the extent of 3325.185 out of 4087.106 or 81.4% while
other variables not captured by this model can explain 18.6% or 761.921 out of
4087.106 of variation on success of tour businesses owned by indigenous
entrepreneurs in the tourism industry. A p-value of 0.00 is less than the set level of
significance of 0.05 for a normally distributed data. This means that service quality is
significant in explaining success of tour businesses owned by indigenous
entrepreneurs in the tourism industry.
Table 4.43: Analysis of Variance - ANOVA
Model Sum of
Squares
df Mean Square F Sig.
1 Regression 3325.185 1 3325.185 1.026E3 .000a
Residual 761.921 235 3.242 Total 4087.106b 236
a. Predictors: SERVQUAL
Regression Analysis
Regression analysis was carried out to test the two hypotheses stated earlier: 1) Null
Hypothesis (Ho): Service Quality does not hinder success of tour businesses owned by
indigenous entrepreneurs in the tourism industry in Kenya. 2) Alternative Hypothesis
(HA): Service Quality hinder success of tour businesses owned by indigenous

149
entrepreneurs in the tourism industry in Kenya. Confidence level of 95% will be used
and thus the significance or alpha level of 5%. The model below which links the
dependent variable – success to the independent variable - Service quality is used for
the testing:-
Y = α + β41X41 + β42X42 + β43X43 + β44X44 + ε
Where:
Y is the dependant variable – Success
α is the intercept
β41, β42, β43 and β44 are the regression coefficients of Assurance, Tangibility, Empathy
and Responsiveness respectively
X41, X42, X43 and X44 are the sub-variables: Assurance, Tangibility, Empathy and
Responsiveness respectively
ε is the Error term
From Table 4.41, β41, β42, β43 and β44 are 1.590, .597, -1.212 and .790 respectively.
The estimated success is achieved using the equation below:
Y = α + 1.590X41 + 0.597X42 - 1.212X43 + 0.790X44 + ε
From Table 4.42, the β on Service Quality is .825. The final equation on success and
Service Quality as a weighted variable is therefore as below:
Y = α + 0.825X4 + ε
As stated above, α is 0.05. From Table 4.43, the p-value is 0.000. This means that
the alpha level is greater than the p-value. This led to conclusion that the null

150
hypothesis above (Service quality does not hinder success of tour businesses owned
by indigenous entrepreneurs in the tourism industry in Kenya) should be rejected. It
was concluded that service quality is an important factor to the success of tour
businesses owned by indigenous entrepreneurs in the tourism industry.
From the findings on Figure 4.5, service quality can be concluded to be a factor
hindering success of the tour businesses owned by indigenous entrepreneurs. The
graph shows that the more service quality is increased by the local operators, the more
the success. This is because of increased confidence to the tourists thus increased
relationships and ultimately increased revenues. This corroborate with the findings of
Millan and Esteban (2004) and Josmani (2007) on their study in Spain and Malaysia
respectively where they concluded service quality which they looked at as: providing
the service within agreed time, complying with agreed premises, fast and clear
information, and clear and sincere information; was a main factor of satisfaction on
service in travel industry. Christiansson and Sporrek (2003) and Illiancheko (2007) in
Spain and Sweden respectively also concluded service quality gives confidence to
customers by re-assuring dependability.
Tour businesses owned by indigenous entrepreneurs should therefore consider
enhancement of service quality to increase success. Ability to perform the promised
service dependably and accurately; handling customers’ service problems; providing
services right first time; providing services at promised time; and maintaining error
free records should be enhanced to ensure reliability of the tour businesses. To ensure
tangibility as a dimension of service quality, the firm should invest on modern

151
equipments including cars and ICT equipment; visually and up-to-date appealing
facilities; and employees with a neat, professional appearance.
Service quality should be integrated onto the firm's strategic plan and values to make
it part of its policy. This will ensure that the purpose, principles, processes, people and
performance are quality driven. Training should be done to all employees particularly
while inducting a new employee. Local operators should also endeavor to get ISO
certification to enable them boast of high standards which will ultimately enable them
to compete with international players. This can only be achieved if the service quality
is improved to reach the international levels thus assuring tourists of world class
service.
Figure 4.5: Service Quality's Influence on Success of Tour Businesses

152
4.4.5 Influence of Clusters and Networks on Success
The fifth and last objective of this study sought to investigate the influence of clusters
and networks on success of tour businesses owned by indigenous entrepreneurs in the
tourism industry in Kenya. The study concentrated on the benefits of members from
the clusters and networks in addition to the other memberships undetaken by the
firms.
Memberships Undertaken by the Firms
Preliminary to the benefits, the study sort to find out if Kenya Association of Tour
Operators (KATO) members, where the sample was taken from, are members of other
local or international clusters or networks. From the findings, as on Table 4.43,
50.6% of members were not members of either local or international clusters or
networks, 19.3% were also members of the American Society of Travel Agents
(ASTA), 12% were also members of World Tour Operators Association (WTOA),
3.6% were also members of European Tour Operators Association (ETOA), while
14.5% were members of other bodies. Though the membership list on the
questionnaire allowed the respondents to select all they use, it was noted that only 11
firms had two memberships (in addition to KATO that all respondents are members).
The findings concur with those of Erkus-Ozturk (2008) and Phillip (2010) on studies
carried out in Middle East and India that many businesses only operate under one
cluster or network. In addition, Erkus-Ozturk (2008) concluded there is no direct

153
relationship between the number of associations in which a firm is a member and the
global connections.
Local operators can be said to have confidence in KATO and as a result many has not
subscribed to other associations. United States being a big market for Kenya has
attracted the local operators who join ASTA in expectation of gaining the market
confidence. WTOA also has attracted some members while ETOA has only attracted
a few. It is interesting to note that some local operators are also seeking membership
from bodies in other markets thus diverting from the traditions. Without despising the
role of local networks of firms in clusters for internal dynamics and created
externalities, it is important to engage in global networks to prevent a lock-in situation
and enhance individual firm's competitiveness as well as the cluster.
Table 4.44: Other Membership in Addition to KATO
Other Membership Frequency Percent
None (0) 42 50.6
ASTA 16 19.3
WTOA 10 12.0
ETOA 3 3.6
OTHER 12 14.5
Total 83 100.0

154
Benefits Sort From Membership in a Cluster or Network
This section analysis the findings on members views on benefits sort from
membership in a cluster or network which can lead to success in tour businesses
owned by indigenous entrepreneurs. It concentrated on the following benefits: 1)
Getting information on the tourism industry, 2) Increased market share, 3) Bargaining
power, 4) Sharing resources, and 5) Linkages and connection to international clients.
As shown on table 4.45, the respondents rated benefit of getting information on the
tourism industry as 26.3% strongly agree, 57.3% agree, 7.2% don't know, 8.9%
disagree and a mean score of 4.01 where five is strongly agree and one is strongly
disagree. Increased market share was rated 34.3% strongly agree, 33.1% agree, 11%
don't know, 20.3% disagree, 1.3% strongly disagree, and a mean score of 3.79.
Bargaining power was rated 28.4% strongly agree, 41.1% agree, 15.3% don't know,
12.7% disagree, 2.5% strongly disagree, and a mean score of 3.80. Sharing resources
was rated 24.6% strongly agree, 33.5% agree, 23.3% don't know, 16.1% disagree,
2.5% strongly disagree and a mean score of 3.61. Linkages and connection to
international clients was rated 38.1% strongly agree, 32.2% agree, 15.3% don't know,
14.4% disagree and a mean score of 3.94. Clusters and networks benefits were on
average rated 30.3% strongly agree, 39.5% agree, 14.4% don't know, 14.5% disagree
and 1.3% disagree.
The findings corroborates those of Victor (2008) and Erkus-Ozturk (2008) who
concluded, in their studies in Mauritius and Middle East respectively, that networks
gives synergy to the firms while strengthening the relationships of business partners

155
which enables maximize profits for the members. Hemmati (2000) and Phillip (2010)
in studies carried out in India concluded that cluster and networks could increase
market share by developing a desirable market reputation, enter international markets
through bargaining power, reduce transaction costs through share of resources, and
share information which will enable to cope positively with rapid technological
changes. Franch et al. (2008) in Italy also found out that coming up with Regional
Tourist Boards (RTBs) will help create brands and should be encouraged in tourism to
enhance competitiveness through share of resources.
Although the benefits of membership were rated above average, the fact that there are
some respondents who rated the same as below average indicates lack of awareness
on the benefits. This reiterates the fact that more than half of the members are not
members of any other tour operators' body either locally or internationally as shown
above. Sharing of resources and increased market share that are not highly perceived
as benefits raises a question on understanding of the members. It seems that
information on the sector is the main benefit to the members followed by linkages and
connection to international clients.

156
Table 4.45: Cluster and Networks - Benefit of Membership
Item Strongly
Disagree
Disagree Don't
Know
Agree Strongly
Agree
Mean
Information on the sector 0% 8.9% 7.2% 57.6% 26.3% 4.01
Increased market share 1.3% 20.3% 11% 33.1% 34.3% 3.79
Bargaining power 2.5% 12.7% 15.3% 41.1% 28.4% 3.80
Sharing resources 2.5% 16.1% 23.3% 33.5% 24.6% 3.61
Linkages and connection
to international clients
0% 14.4% 15.3% 32.2% 38.1% 3.94
Average 1.3% 14.5% 14.4% 39.5% 30.3%
Statistical Modeling
The primary objective of this study was to investigate the challenges hindering
success of tour businesses owned by indigenous entrepreneurs in the tourism industry
in Kenya. Clusters and Networks as one of the identified independent variable was
studied to investigate its effect on success. After establishment of goodness of
measure of the data using factor analysis, the hypothesis on the effect of clusters and
networks on success of tour businesses owned by indigenous entrepreneurs was
tested.

157
Model Summary
The hypotheses to be tested were: 1) Null Hypothesis (Ho): Clusters and Networks do
not hinder success of tour businesses owned by indigenous entrepreneurs in the
tourism industry in Kenya. 2) Alternative Hypothesis (HA): Clusters and Networks
hinder success of tour businesses owned by indigenous entrepreneurs in the tourism
industry in Kenya. Confidence level of 95% will be used and thus the significance or
alpha level of 5%.
Table 4.46 shows the output for model fitness. The R coefficient of 0.877 indicated
that the clusters and networks as the independent factor had a correlation of 87.7%
with the dependent variable success of tour businesses owned by indigenous
entrepreneurs in the tourism industry. The R square also referred to coefficient of
determination of 0.769 indicates that the model can explain only 76.9% of success of
tour businesses owned by indigenous entrepreneurs in the tourism industry while the
remaining 13.1%% is determined by other factors. This shows that clusters and
networks as the independent variable of this study predicts success of tour businesses
owned by indigenous entrepreneurs in the tourism industry in Kenya.

158
Table 4.46: Model Summary – Goodness of fit
Indicator Coefficient
R 0.877
R Square 0.769
Std. Error of the Estimate 2.003
Pearson Correlation Coefficient
Correlation coefficient indicates the measure of linear relationship between two
variables. Table 4.47 shows the Pearson correlation coefficients between the
independent variable - clusters and networks. Bargaining power had the highest
correlation to sharing resources with 78.3%% followed by information on the sector
and linkages and connections with 77.5%. Bargaining power and linkages and
connections correlated with 71.5% while increased market share to bargaining power
with 70.6%. Others were as shown on Table 4.46.

159
Table 4.47: Pearson Correlation Coefficient - Cluster and Networks
Information
on the sector
Increased
marketing
share
Bargaining
power
Sharing
resources
Linkages
and
connection
Information on the
sector
1.000
Increased marketing
share
.688 1.000
Bargaining power .646 .706 1.000
Sharing resources .609 .660 .783 1.000
Linkages and
connection
.775 .682 .715 .640 1.000
Regression Coefficients
From Table 4.48 the beta coefficients used are the unstandardized coefficients. The
results indicate that a unit change on cluster and networks causes 0.341% changes in
the success of tour businesses owned by indigenous entrepreneurs in the tourism
industry. This indicates that cluster and networks has an influence on success of tour
businesses owned by indigenous entrepreneurs in the tourism industry.

160
Table 4.48: Regression Coefficients
Model Unstandardized
Coefficients
Standardized
Coefficients
T Sig.
B Std. Error Beta
1 NETWORKS .341 .012 .877 27.993 .000
a. Dependent Variable: SUCCESS
Analysis of Variance
From Table 4.49 which is the analysis of variance - ANOVA, success of tour
businesses owned by indigenous entrepreneurs in the tourism industry can be
explained by the model to the extent of 3144.186 out of 4087.106 or 76.9% while
other variables not captured by this model can explain 13.1% (942.92 out of 4087.106)
of variation on success of tour businesses owned by indigenous entrepreneurs in the
tourism industry. A p-value of 0.00 is less than the set level of significance of 0.05 for
a normally distributed data. This means that cluster and networks is significant in
explaining success of tour businesses owned by indigenous entrepreneurs in the
tourism industry.

161
Table 4.49: Analysis of Variance - ANOVA
Model Sum of
Squares
Df Mean Square F Sig.
1 Regression 3144.186 1 3144.186 783.612 .000
Residual 942.920 235 4.012
Total 4087.106 236
Predictors: NETWORKS
Dependent Variable: SUCCESS
Regression Analysis
Regression analysis was carried out to test the two hypotheses stated earlier: 1) Null
Hypothesis (Ho): Cluster and networks do not hinder success of tour businesses
owned by indigenous entrepreneurs in the tourism industry. 2) Alternative Hypothesis
(HA): Cluster and networks hinder success of tour businesses owned by indigenous
entrepreneurs in the tourism industry. Confidence level of 95% will be used and thus
the significance or alpha level of 5%. The model below which links the dependent
variable – success to the independent variable - Cluster and Network is used for the
testing:-
Y = α + β5X5 + ε
Where:
Y is the dependent variable – Success

162
α is the intercept
β5 is the regression coefficient
X5 is the independent variable – Cluster and networks
ε is the Error term
From Table 4.48, β5 is 0.341. The estimated success is thus achieved using the
equation below:
Y = α + 0.341 X5 + ε
As stated above, α is 0.05. From Table 4.49, the p-value is 0.000. This means that
the alpha level is greater than the p-value. This led to conclusion that the null
hypothesis above (Cluster and networks do not hinder success of tour businesses
owned by indigenous entrepreneurs in the tourism industry) should be rejected. It was
concluded that cluster and networks are an important factor to the success of tour
businesses owned by indigenous entrepreneurs in the tourism industry.
From the findings on figure 4.6, cluster and networks can be concluded to be a factor
hindering success of the tour businesses owned by indigenous entrepreneurs. The
graph shows that the more the local operators join cluster and networks, the more the
success. This is because of synergy achieved from the cluster and networks and
ultimately increased revenues. This corroborates with the findings of Erkus-Ozturk
(2008) who found out that clusters enjoys more global linkages thus affecting success
of the firm positively which unfortunately is only embraced by big creative firms.
Franch et al (2008) also found out that networks and clusters particularly coming up
with Regional Tourist Boards (RTBs) would enhance competitiveness by creating

163
regional brand. Braun (2002) also concluded that small and medium tourism
enterprises (SMTEs) would benefit from increased information flow through regional
networking and cooperative e-marketing campaigns to enhance market visibility,
global positioning, and strategic advantage in the new economy. Literature (Jooste,
2005) referred to networks as an additional P in the marketing mix in terms of
partnerships that he argues to be one of the marketing tools in tourism industry as
connectivity leads to success.
The local operators thus has to engage in forming cluster and networks to boost their
success. Already as members of KATO, the operators indicates their benefits mainly
as sharing of information. This helps in scanning of the environment, which is key
when coming up with strategic planning and thus cannot be undermined. Using the
existing social networks is encouraged and particularly the internet based networks.
Joining other networks particularly in the source markets would also be advisable to
enable reach more tourists and know whatever is happening on the ground thus make
proactive changes of tactics.

164
Figure 4.6: Cluster and Network's Influence on Success of Tour Businesses
4.4.6 Combined Effect of All Independent Variables on Success
The primary objective of this study was to investigate the challenges hindering
success of tour businesses owned by indigenous entrepreneurs in the tourism industry
in Kenya. Previously, all the variables were tested individually to see how they
contribute towards success of the tour businesses owned by indigenous entrepreneurs.
This section combines the variables to see the extent of their influence or otherwise.

165
Model Summary
Table 4.50 shows the output of model fitness. The R coefficient of 0.921 indicated
that the combined independent variables had a correlation of 92.1% with the
dependent variable success of tour businesses owned by indigenous entrepreneurs in
the tourism industry. The R square also referred to coefficient of determination of
0.849 indicates that the model can explain only 84.9% of success of tour businesses
owned by indigenous entrepreneurs in the tourism industry while the remaining
15.1% which is referred to as the coefficient of alienation is determined by other
factors. This shows that the independent variables of this study largely predict
success of tour businesses owned by indigenous entrepreneurs in the tourism industry.
Table 4.50: Model Summary – Goodness of fit
Indicator Coefficient
R 0.921
R Square 0.849
Std. Error of the Estimate 1.635
Regression Coefficients
From Table 4.51, the beta coefficients used are the unstandardized coefficients. The
results indicate the change caused by each of the variables to success tour businesses
owned by indigenous entrepreneurs in the tourism industry in Kenya. It also includes
the collinearity statistics to ensure there is no multicollinearity on the independent

166
variables. The Variance Inflation Factor (VIF) was used to provide an index that
measures how much the variance (the square of the estimate's standard deviation) of
the estimated regression coefficient is increased because of collinearity. Following
Kutner (2004) ten (10) was proposed to be the cut off value and further proposes that
the factors should be eliminated from the model one by one from the one with the
highest VIF value.
From the table, it was found that the only variable that had a p-value less than the set
level of significance of 0.05 for a normally distributed data was resources. It was also
found out that service quality had a negative impact on the model as one unit of its
change gave a negative impact on success. Additionally, multicollinearity was noted
as four variables had a VIF value greater than 10.

167
Table 4.51: Regression Coefficients for all the Independent Variables
Model Unstandardized
Coefficients
Standardized
Coefficients
T Sig. Collinearity
Statistics
B Std. Error Beta Tolerance VIF
1 RESOURCES .095 .028 .495 3.434 .001 .031 31.779
POLICIES .027 .018 .193 1.508 .133 .040 25.069
IT .025 .017 .161 1.480 .140 .055 18.177
SERVQUAL -.002 .011 -.022 -.173 .863 .042 24.031
NETWORKS .041 .030 .106 1.376 .170 .109 9.150
a. Dependent Variable: SUCCESS
Following the preceding table and Kutner (2004), the independent variable resource
was removed from the model. Another test was run with the four remaining variable.
The effect of service quality on success turned positive. Two variables, policies and
ICT, were also found to have a p-value less than the acceptable 0.05 meaning they
were significant. However, VIF value for three variables, policies, ICT and service
quality, remained above 10. The one with the highest VIF was policies and it was
removed and the test repeated with three variables. The three variables - ICT, Service
Quality and Clusters and Networks were found significant and their VIF was lower

168
than 10 as indicated on Table 4.52. They were therefore concluded to be the main
challenges hindering success of the tourism businesses owned by indigenous
entrepreneurs.
Table 4.52: Regression Coefficients for the Variables Without Collinearity
Model Unstandardized
Coefficients
Standardized
Coefficients
Sig. Collinearity Statistics
B Std. Error Beta Tolerance VIF
1 ICT .061 .017 .402 .000 .059 7.035
SERVQUAL .296 .108 .324 .007 .051 9.475
NETWORKS .078 .030 .202 .011 .118 8.475
a. Dependent Variable: SUCCESS
Analysis of Variance
From Table 4.53 which is the analysis of variance - ANOVA, success of tour
businesses owned by indigenous entrepreneurs in the tourism industry can be
explained by the model to the extent of 3399.953 out of 4087.106 or 83.2%, while
other variables not captured by this model can explain 16.8% (687.153 out of
4087.106) of variation on success of tour businesses owned by indigenous
entrepreneurs in the tourism industry. A p-value of 0.00 is less than the set level of
significance of 0.05 for a normally distributed data. This means that the combined
independent variables (ICT, service quality, and cluster and networks) are significant
in explaining success of tour businesses owned by indigenous entrepreneurs in the
tourism industry.

169
Table 4.53: Analysis of Variance - ANOVA
Model Sum of
Squares
Df Mean Square F Sig.
1 Regression 3399.953 3 1133.318 384.286 .000a
Residual 687.153 233 2.949
Total 4087.106b 236
a. Predictors: NETWORKS, SERVQUAL, ICT
b. Dependent Variable: SUCCESS
Regression Analysis
Regression analysis was carried out to test the model below at confidence level of
95% and thus the significance or alpha level of 5%. This model links the independent
variables: ICT, Service Quality and Cluster and Networks and the dependent variable
success. The other independent variables: Resources and Policies were dropped from
the optimal model as either they were not significant or they had high
multicollinearity as indicated on the previous sections.
Y = α + β3X3 + β4X4 +β5X5 + ε
Where:
Y is the dependant variable – Success
α is the intercept
X3 is the independent variable – Information, Communication and technology

170
X4 is the independent variable – Service Quality
X5 is the independent variable – Cluster and networks
ε is the Error term
From Table 4.52, β3 is 0.061, β4 is 0.296 and β5 is 0.078. The estimated success is
thus achieved using the equation below:
Y = α + 0.061X3+ 0.296X4 + 0.078X5 + ε
As stated above, α is 0.05. From Table 4.53, the p-value is 0.000. This means that
the alpha level is greater than the p-value. This led to conclusion that ICT, Service
Quality, and Clusters and Networks are the challenges hindering success of tour
businesses owned by indigenous entrepreneurs in the tourism industry. Though the
combined model had a p-value of 0.000, regression coefficient of each is different
indicating the order of the priority of each variable as drivers of success of tour
businesses owned by indigenous entrepreneurs in the tourism industry. Service
Quality leads followed by Clusters and Networks and lastly the ICT. As stated
earlier, resources and policies had high multicollinearity thus removed from the
optimal model.
4.4.7 Revised Conceptual Framework
Following the hypothesis testing for the optimal model, only three of the five variables
were found to be the main challenges hindering success of tourism businesses owned
by indigenous entrepreneurs in Kenya. These were Service Quality, Clusters and
Networks and ICT (in-order of priority). The other variables were dropped from the
optimal model following multicollinearity amongst them. The two: resources, and

171
policies; will therefore be dropped from the original conceptual framework leaving the
three variables which optimizes the model. Table 4.54 is a summary of models and
their R square also referred to coefficient of determination which indicates by what
percentage the model can explain the dependent variable success of tour businesses
owned by indigenous entrepreneurs in the tourism industry. Though removal of the
variables with multicollinearity lowers the R2, the difference is not significant as it is
only 1.7% and therefore they are not the major determinants of the optimal model.
Table 4.54: Summary of Possible Models and R Square
Variables included in the Model R2 Obtained from the Model
Resources, Policies, ICT, Service Quality,
Cluster and Networks (X1, X2 , X3, X4, X5)
0.849 = 84.9%
Policies, ICT, Service Quality, Cluster
and Networks (X2 , X3, X4, X5)
0.841 = 84.1%
ICT, Service Quality, Cluster and
Networks (X3, X4, X5)
0.832 = 83.2%
ICT, Service Quality, and Cluster and Networks forms the optimal model. They
answer the question what are the challenges hindering success of tour businesses
owned by indigenous entrepreneurs in the tourism industry in Kenya. The new
conceptual framework based on the optimized model is shown on Figure 4.7.

172
Independent Variables Dependent Variable
Influences
Figure 4.7: Revised Conceptual Framework
Clusters and Networks
Membership Benefits gains
ICT
Web features Maintenance Problems
Success of Tour Businesses
Owned by Indigenous
Entrepreneurs No. of tourists Annual profit
Service Quality
Reliability Assurance Tangibility Empathy Responsiveness

173
CHAPTER FIVE
SUMMARY, CONCLUSIONS AND RECOMMENDATIONS
5.1 Introduction
This study sought to investigate challenges hindering success of tour businesses
owned by indigenous entrepreneurs in the tourism industry in Kenya. This chapter
summarises the findings of the study based on the following specific objectives:
1. Investigate if resources affect success of tourism business owned by indigenous
entrepreneurs in the tourism industry in Kenya.
2. Determine the effect of policies on success of tourism businesses owned by
indigenous entrepreneurs in the tourism industry in Kenya.
3. Establish the effect of ICT on success of tourism businesses owned by indigenous
entrepreneurs in the tourism industry in Kenya.
4. Investigate the effect of service quality on success of tourism businesses owned by
indigenous entrepreneurs in the tourism industry in Kenya.
5. Establish the effect of clusters and networks on success of tourism businesses
owned by indigenous entrepreneurs in the tourism industry in Kenya.
The chapter will also report on conclusions and recommendations based on the
findings of the study, and suggested areas for further study.

174
5.2 Summary of Findings
This study sought to investigate challenges hindering success of tour businesses
owned by indigenous entrepreneurs in the tourism industry in Kenya. In this section,
summary of findings for each independent variable investigated is outline. Findings
on the investigated combined model, which is the effect of all the independent
variables together, are also summarized.
5.2.1 Preliminary Findings
Preliminary study of the sample characteristics revealed that over half of indigenous
tour operators (56.6%) had been in business since 2005 and none was operating
before 1991. This suggests that many are at the introduction and growth stage of the
product life cycle curve. The main respondents to the questionnaire were the
managing directors leading to conclusion that they were dominating the business,
which can be as a result of the business stage. The number of permanent employees of
the firms was found to be majorly between one and two (48.19%) and only 12.85%
have employed more than five permanent staff. Sixty two point three five per cent
(62.35%) of the respondent firms did not own tourist ferrying vehicles.
5.2.2 Investigate if Resources Affect Success of Tourism Businesses Owned by
Indigenous Entrepreneurs in the Tourism Industry in Kenya
The study sought to find out if resources affect the success of tourism businesses
owned by indigenous entrepreneurs in the tourism industry in Kenya. The findings of

175
this study suggested that resources affect the success of tourism businesses owned by
indigenous entrepreneurs in the tourism industry. Resources were found to explain
85.4% of success of tourism businesses owned by indigenous entrepreneurs. In
addition, a unit change in resources causes a positive change of 0.176 on the success
of tour businesses owned by indigenous entrepreneurs in the tourism industry. This
means the more the resources, the more the success.
5.2.3 Determine the Effect of Policies on Success of Tourism Businesses Owned
by Indigenous Entrepreneurs in the Tourism Industry in Kenya
The study intended to find out if policies, both organizational and governmental,
influence the success of tourism businesses owned by indigenous entrepreneurs in the
tourism industry in Kenya. The study found that 20.5% of the firms did not have
written organizational policies and ultimately policies were not used in decision-
making. Government policies, though found to influence success, the local operators
looked at them as equal for all including the foreign investors thus not giving the
locals priority to grow.
From the study, policies were found to have a significant influence of 83.2% on
success of tourism businesses owned by indigenous entrepreneurs in the tourism
industry. A unit change in policies could lead to positive changes of 0.129 on success
of tourism businesses owned by indigenous entrepreneurs in the tourism industry.
Relevant policies well implemented both at the organization's level and government
level will lead to success.

176
5.2.4 Establish the effect of ICT on success of tourism businesses owned by
indigenous entrepreneurs in the tourism industry in Kenya.
The study sought to find out if information, communication and technology have an
effect on success of tourism businesses owned by indigenous entrepreneurs in the
tourism industry in Kenya. The findings revealed that 76% firms were computerised
and an equal number had functional websites. The study also found out that
information, communication and technology could explain 81.8% of success of
tourism businesses owned by indigenous entrepreneurs in the tourism industry.
Further, a unit change in ICT could lead to a positive change of 0.138 on success of
tourism businesses.
5.2.5 Investigate the effect of service quality on success of tourism businesses
owned by indigenous entrepreneurs in the tourism industry in Kenya
The study intended to find out if service quality influences the success of tourism
businesses owned by indigenous entrepreneurs in the tourism industry in Kenya.
From the findings of this study, service quality was found to explain 81.4% of success
of tourism businesses owned by indigenous entrepreneurs in the tourism industry. A
unit change on service quality could lead to 0.825 change on success of tourism
businesses owned by indigenous entrepreneurs in the tourism industry.

177
5.2.6 Establish the effect of clusters and networks on success of tourism
businesses owned by indigenous entrepreneurs in the tourism industry in Kenya.
The study wanted to find out if clusters and networks affect success of tourism
businesses owned by indigenous entrepreneurs in the tourism industry in Kenya.
From the findings of the study, clusters and networks have a positive effect on success
of tourism businesses owned by indigenous entrepreneurs in the tourism industry.
Clusters and networks explain 76.9% of success of tourism businesses owned by
indigenous entrepreneurs in the tourism industry. In addition, a unit change in cluster
and networks could lead to a positive change of 0.341 on success.
5.2.7 Challenges Hindering Success of Tourism Businesses Owned by Indigenous
Entrepreneurs
The main objective of the study was to investigate the challenges hindering success of
tourism businesses owned by indigenous entrepreneurs in Kenya. Though the
combination of all the independent variables: resources; policies; information,
communication and technology; service quality; and clusters and networks shows a
positive effect of 84.9% on success of tourism businesses owned by indigenous
entrepreneurs in the tourism industry, the optimal model was sought to ensure absence
of insignificance contribution or multicollinerity of the variables. It was found that
there was either multicollinearity or insignificance on Resources and Policies as
variables. These were dropped from the model for the optimal model to be achieved.
The variables found highly significant and with no collinearity were Service Quality,
Clusters and Networks and ICT. Their effect on success of tourism business was

178
83.2%. A unit change on Service Quality, Clusters and Networks and ICT can cause
a positive change of .296, .078 and .061 respectively on success of tour businesses
owned by indigenous entrepreneurs.
5.3 Conclusions
The study sought to investigate challenges hindering success of tourism businesses
owned by indigenous entrepreneurs in the tourism industry in Kenya. This section
highlights the main conclusions on the five independent variables: resources, policies,
ICT, service quality, and clusters and networks. It also concludes on the combined
effect of the five variables towards success of tourism businesses owned by
indigenous entrepreneurs.
5.3.1 Effects of Resources on Success of Tourism Businesses
The study sought to find out if resources affect the success of tourism businesses
owned by indigenous entrepreneurs in the tourism industry in Kenya. The study
concludes that lack of resources hinders success of tourism businesses owned by
indigenous entrepreneurs in the tourism industry. Employing skilled workers will
ensure delivery of high quality results. Training is not an option but the only option
to ensure high calibre of employees leading to increase of core competences in this
service oriented industry. Additional languages acquisition should be encouraged to
widen the scope of target from English speaking countries to other countries speaking
other languages.

179
Acquisition of vehicles and other assets should not be ignored as a strategy to increase
competitiveness. Own resources helps increase credibility of the firm and ultimately
the tourists' confidence to engage with the firm. It is thus vital for firms to
strategically position themselves by investing on assets, which will consequently lead
to their success.
Finance is a main driver of a business as it enables stability, ownership of assets and
more importantly marketing. Availability, accessibility and collateral of finances are
thus key determinants of success of tourism businesses owned by indigenous
entrepreneurs.
5.3.2 Effect of Policies on Success of Tourism Businesses
The study sought to find out if policies, both organizational and governmental, affect
the success of tourism businesses owned by indigenous entrepreneurs in the tourism
industry in Kenya. It concludes that good organizational policies enables swift
strategy devising to enable face the hyper-competition in the tourism industry where
only temporary profits are possible. Absence of organizational policies or failure to
communicate them to the employees could lead to slow decision making and
inefficiency leading to failure of business.
Government's policies related to the tourism industry particularly advertising of Kenya
as a destination and funding local tour operators to exhibitions outside the country
should be looked into as a strategy to build successful tourism businesses for
indigenous entrepreneurs. This will also help put non-tariff barriers into the sector and

180
safeguard the foreign exchange leakages while increasing sustainability of the
industry.
5.3.3 Effects of ICT on Success of Tourism Businesses
The study intended to find out if information, communication and technology affect
the success of tourism businesses owned by indigenous entrepreneurs in the tourism
industry in Kenya. It concludes that in today’s dynamic world because of ICT, the
tour and travel operators have no choice but to embrace change and bridge the gap
through innovation. Keeping the content of the website updated attracts customers
and consequently creates interest in doing business with the firm as it proves
reliability of the firm. Improvement of online security and investment on website
maintenance is vital to survival and success of the local operators. Use of ICT is of
essence in the tourism industry as it reduces time spent out on marketing and
distances covered. It also enables reach many clients consequently effective and cost
saving.
5.3.4 Effects of Service Quality on Success of Tourism Businesses
The study wanted to find out if service quality affects the success of tourism
businesses owned by indigenous entrepreneurs in the tourism industry in Kenya. It
has found that service quality is expensive but cannot be sacrificed in a competitive
industry like tourism. Service quality particularly in the following subsectors should
be enhanced to ensure success of the tour operators: Assurance in terms of
competence, courtesy, credibility and security; Tangibility in terms of appearance of

181
physical elements; Empathy as easy access, good communications and customer
understanding; and Responsiveness as promptness and helpfulness to customers.
5.3.5 Effects of Clusters and Networks on Success of Tourism Businesses
The study sought to find out if clusters and networks affect the success of tourism
businesses owned by indigenous entrepreneurs in the tourism industry in Kenya. It
was found that creation and management of partnerships is vital to help achieve
economies of scale, synergies of cooperation, and acquisition of required expertise.
Clusters can help enhance competitiveness by creating a regional brand. Networks
help in sharing of information that enables scanning of the environment, which is
essential when coming up with strategic planning and thus cannot be undermined.
Using the existing social networks is encouraged and particularly the internet based
networks.
5.3.6 Challenges Hindering Success of Tourism Businesses Owned by
Indigenous entrepreneurs
The general objective of the study was to establish challenges hindering success of
tourism businesses owned by indigenous entrepreneurs in tourism industry in Kenya.
Based on the findings, it is logical to conclude that though all the independent
variables: resources, policies, ICT, service quality, and clusters and networks; are
individually positively affecting success, the optimal model was achieved with the
only two variables – ICT and clusters and networks. It can therefore be concluded
that success of tourism businesses owned by indigenous entrepreneurs in the tourism

182
industry can mainly be achieved through adoption of ICT and engagement in relevant
clusters and networks.
5.4 Recommendations
This study sought to investigate challenges hindering success of tour businesses
owned by indigenous entrepreneurs in the tourism industry in Kenya. The study
justifies that, a tour business owned by indigenous Kenyan that: has enhanced high
Service Quality, adopted ICT; and joined beneficial clusters and networks is bound to
success. Specifically, the study recommends that:
Service quality should be integrated into the firm's strategic plan and values to make it
part of its policy. This will ensure that the purpose, principles, processes, people and
performance are quality driven.
Local operators should also endeavor to get ISO certification to enable them boast of
high standards that will ultimately enable them to compete with international players.
This can only be achieved if the service quality is improved through benchmarking
and learning from those who have succeeded in the business which is highly
recommended for the local operators.
Tour business should adopt ICT through computerization of their activities and
integrating their back office with the others. This will enable share of information in
the organization leading to knowledgeable organization that can compete with others

183
even on the globe. Fast retrieval of information and making well informed decisions
will also be achieved.
Tour businesses should have a functioning website which has the right features and is
well maintained. Introduction of the Web will offer tour businesses new
opportunities to access new customers both cost effectively and from a wider scope.
Local operators should use the latest ICT technology like the social media marketing
to reach wider clientele at the shortest time possible using cheap means.
The government should come up with a strong policy on security of internet to deal
with the vice of hacking of information. This will enable use of credit cards and thus
boost the trust on local operators by the tourists.
Tour businesses should endeavour to come up with clusters to give them more
bargaining power as a result of the achieved synergy. Wider coverage cluster like
East African region is more recommended than local cluster to give more strategic
advantage to the businesses as a tourist interested in Tanzania or Uganda will be
motivated by the rates under the cluster umbrella to visit Kenya.
Tour businesses should also join other networks particularly in the source markets to
enhance their visibility and strategic positioning that would ultimately enable them
reach more international tourists. As the saying goes, if you want to go faster, do it
alone; if you want to go farther, do it in a group.This will also help the firms to know
whatever is happening on the ground to enable informed decisions on proactive

184
changes of tactics. Linkages to their website are also encouraged as an additional
marketing tool to guarantee wider coverage and visibility.
Finally the study would recommend use of the blue ocean strategies by the indigenous
tourism businesses. This will involve going to untapped market space, creating demand,
and opportunity for highly profitable growth. This will make competition irrelevant and
exceed the existing boundaries where the new tourists will have confidence as they have no
previous experience with any other service provider in Kenya.
5.5 Areas for Further Study
It is important to note that the revised model of this study was only able to answer the
question of success by 83.2%. It would thus be necessary for further study on the topic to
find out other factors causing either success or failure of the tourism businesses owned by
indigenous entrepreneurs.
Another study that can strengthen the findings of this study is one carried out with
respondents being the tourists served by the local operators. This is because this study only
used the lenses of the operator thus one side of the coin. The tourists could have an open
mind and assist in unearthing the problem behind failure of the local operators to compete
effectively in their own home ground.

185
REFERENCES
Adèr, H., Mellenbergh, G. & Hand D. (2008). Advising on research methods: A
consultant's companion. Belgium. Johannes van Kessel Publishing.
Agarwal, B.L. (2009). Basic Statistics, 5th Edition. New Delhi: New Age
International.
Alipour, M., Hajaliakbari, F., & Javanbakht, N. (2011). The Impact of Web-
Marketing Mix (4s) on Development of Tourism Industry in Iran. International
Journal of Business and Social Science , 267-274.
Al-Mahrouq, M. (2010). Success Factors of Small and Medium-Sized Enterprises
(Smes): The Case of Jordan. Ministry of Planning and International Coop.
Amman -Jordan
American Statistical Association (ASA). (1997). How to conduct pre-testing:
section on survey research methods. Alexandria: American Statistical
Association.
Anderson, M., & Shaw, R. (1999). A comparative evaluation of qualitative data
analytic techniques in identifying volunteer motivation in tourism. Journal of
Tourism Management, 20(1), 99-106.
Andriotis, K. (2004). Revising Porter’s Five Forces Model for Application in the
Travel and Tourism Industry. Tourism Today, 131-145.
Axinte, G. (2009). The Development of Knowledge and Information Networks in
Tourism. Annals of the University of Petroşani, Economics , 17-24.

186
Baggio, R. & Caporarello, L. (2005). Decision Support Systems in a Tourism Destination:
Literature Survey and Model Building. Conference of Italian Chapter of Association
for Information Systems, Verona, Italy.
Bailey, R.A. (2008). Design of Two-Phase Experiments. DEMA, Isaac Newton
Institute
Bakic, O., Hrabrovski-Tomic, E., Muhi, B., & Kovacevic, J. (2010). Marketing and
Management Implementation on Megatrends in Modern Tourism. UTMS Journal
of Economics, Vol. 1, No. 2 , 17-25.
Bankole, A.S. & Odularu, G.O. (2006). Achieving Millennium Development Goals:
Issues and Options for Nigeria’s Tourism Industry. PASOS, Vol 4, No. 3, pgs429-
436
Barney, J. B. (1991). The Resource Based View of Strategy: Origins, Implications,
and Prospects. Journal of Management, 17, pp. 97-211.
Beeton, S. & Graetz, B. (2001). Small Business - Small Minded? Training Attitudes
and Needs of the Tourism and Hospitality Industry, The International Journal of
Tourism Research. 3: 105-113.
Bennett, J.A. & Schoeman, L. (2005). The tourism system and major role-players
involved. Managing tourism services (30-62), 3rd edn. Pretoria: Van Schaik
Publishers.
Birley, S. & P. Westhead (1990), Growth and Performance Contrasts between Types
of Small Firms, Strategic Management Journal, Vol. 11, No. 7, John Wiley &
Sons Ltd., pp. 535-557.

187
Black, K. (2004). Business Statistics for Contemporary Decision Making. 4th ed.
Wiley-India.
Braun, P. (2002). Networking Tourism SMEs: E-Commerce and E-Marketing Issues
in Regional Australia. Information Technology & Tourism, Vol. 5 pp. 13–23
Bryce, J. D., Dyer, J. H., & Hatch, N. W. (2011). Competing Against Free. Harvard
Business Review , 104-111.
Buhalis, D. & Main, H. (1998). International Journal of Contemporary Hospitality
Management, Special Theme Issue: Small hotels: The peripheral tourist sector,
10(5): 198-202.
Buhalis, D. (2003). e tourism –Information Technology for strategic tourism
management, Prentice Hall, Harlow, UK.
Buhalis, D. 2000 “Marketing the competitive destination of the future”. Tourism
Management, 21(1): 97-116.
Buhalis, D., & Zoge, M. (2007). The Strategic Impact of the Internet on the Tourism
Industry, in Sigala, M., Mich, L., Murphy, J. (Eds.), Information and
Communication Technologies in Tourism 2007, (pp. 481-492). Springer-Verlag,
Wien.
Buijze, R. (2010). Governments and tourism: How governments with different levels
of democracy influence tourism. Erasmus University Rotterdam. Sweden.
Buttle, F. (1996). "SERVQUAL: review, critique, research agenda," European
Journal of Marketing, Vol.30, Issue 1, pp.8–31

188
Castillo, J.J.(2009). Convenience Sampling. Available online at
http://www.experiment-resources.com/convenience-sampling.html retrieved on 13
September 2011.
Ceballos-Lascurain, L. (1996). Tourism, eco-tourism and protected areas.
Switzerland: Gland.
Che-Rose, R., Kumar, N., & Yen, L. L. (2006). The Dynamics of Entrepreneurs’
Success Factors in Influencing Venture Growth. Journal of Asia Entrepreneurship
and Sustainability , Volume II, Issue 2.
Chib, S. & Cheong, F. (2009). Investigation Of The Applicability Of Business
Process Management In Swiss Small And Medium Sized Tourist Enterprises.
Retrieved 21 Nov. 11 http://aisel.aisnet.org/pacis2009/25
Christensen, L.B., Johnson, R.B. & Turner L.A. (2011). Research Methods, Design,
and Analysis 11th Edition. Boston, USA. Pearson Education, Inc.
Christiansson, H. & Sporrek, K. (2003). The Role of the Internet as an SST - On-Line
Booking Service. Goteborg University ISSN 1403-851X. Elanders Novum.
Christie, I.T., & Crompton, D.E. (2001). Tourism in Africa. Washington; The World
Bank.
Clark, S. (1997). Reasons for business failure come in three broad groups. Sound
Business Journal, Vol 2. Pg 17-23 .
Cole,G. A. (2004). Management Theory Practice. Thompsons learning, London.
Cooper, R.D., & Schindler, S.P., (2008). Business Research Methods, 10th ed.
McGraw Hill, New York, USA

189
Creswell, J. W.(2008). Educational Research. 3rd Edition. Upper Saddle River, New
Jersey. Pearson Education, Inc.
Creswell, J.W. (2003). Research Design: Qualitative, Quantitative, Mixed methods
Approaches. (2nd edn.). London: Sage Publications.
Cochran, W. G. 1963. Sampling Techniques, 2nd Ed., New York: John Wiley and
Sons, Inc.
Daniele, R. & Frew, A. (2005). Using Concept Maps to Examine Business Models
and Drivers of Competitive Advantage for Travel eMediaries, In Frew, A. (ed),
Information and Communication Technologies in Tourism, (pp. 497-507).
Springer, Vienna.
Dayahka H. (2007). Meaning of Empirical Evidence. Available online
http://www.helium.com/items/152345-the-meaning-of-empirical-evidence -
Accessed on 18th August 2011
Dixey, L. (2002) Evaluation of the Institutional Strengthening Programme of the
Heritage Trails Project for Heritage Trails Project Staff and Partners: the
Uganda Community Tourism Association and the Kabaka Foundation, Heritage
Trails, Kampala.
Dudgeon, R.C. (2008). The meaning of Empirical Evidence. Available online
http://www.helium.com/items/769638-the-meaning-of-empirical-evidence
Retrieved on 13 September 2011.
Economic Planning Group (EPG) of Canada. (2005) A Guide to Starting and
Operating a Receptive Tour Operator Business in Nova Scotia. Halifax.

190
Edgell, D. L. (1999). Tourism Policy: The Next Millennium. Champaign: Sagamore
Publishing.
Edvardsson, B., Gustafsson, A., & Roos, I. (2005). Service Portraits in Service
Research: A Critical Review. International Journal of Service Industry
Management, Vol. 16, No. 1, pp. 107-121.
Eraqi, M.I. & Abdalla, G. (2008). Information System and Tourism Marketing: New
Challenges for Tourism Business Sector in Egypt. Information Technology in
Hospitality, Vol.5 pp. 000-000
Erkus-Ozturk, H. (2008). The role of Local and Global Networking for Tourism Firms and
Clusters: The case of Antalya. Middle East Technical University.
Fache, W. (2000). Managing Service Quality. Quality Journal. Volume 10 . Number
6 , pp. 356-366.
Fakhar, A. (2008). Factors Affecting Tourism, Tourism Potential and Strategies for
Development as an Industry in Pakistan. University of Gavle, Pakistan.
Fallows, D. (2008). Search Engine Use. Available at:
www.pewinternet.org/Reports/2008/Search-Engine-Use.aspx (accessed 20 July
2011).
Foley, P. & Green, H. (1989). Small Business Success. London: Chapman.
Franch, M., Martini, U., Buffa, F., & Parisi, G. (2008). Overcoming fragmentation:
Regional brands as a tool to enhance the competitiveness of community
destinations in the Alps. Trento, Italy. URL: www.economia.unitn.it/etourism
Gall, M. D., Gall, J. P., & Borg, W. R. (2007). Educational Research, 8th Edition.
Boston: Pearson Education, Inc.

191
Gaur, S. S., Vasudevan, H. & Gaur, A. S. (2011). Market orientation and
manufacturing performance of Indian SMEs: Moderating role of firm resources
and environmental factors. European Journal of Marketing, Volume 45, Numbers
7-8, 2011 , pp. 1172-1193
Gefen, D. (2002). "Customer Loyalty in E-Commerce," Journal of the Association
for Information Systems: Vol. 3: Iss. 1, Article 2. Retrieved on 7 April 2012 from
http://aisel.aisnet.org/jais/vol3/iss1/2
Gefen, D. & Carmel, E.(2010). "Does Reputation Really Signal Potential Success In
Online Marketplaces, Or Is It Only A Trigger?" (2010). MCIS 2010
Proceedings. Paper 34. http://aisel.aisnet.org/mcis2010/34
Gefen, D. & Devine, P. (2001). "Customer Loyalty to an Online Store: The Meaning
of Online Service Quality" ICIS 2001 Proceedings. Paper 80.
http://aisel.aisnet.org/icis2001/80
Gillham, B. (2008). Developing a Questionnaire. 3rd Edition. Continuum
International Publishing Group Ltd. ISBN 9780826496317
Go, F.M., Govers, P. & van den Heuvel, M. (1999). Towards interactive tourism:
capitalizing on virtual and physical value chains. In Buhalis, D. & Schertler, W.
(eds), Information and Communication Technologies in Tourism 1999. (pp. 12-
24), Springer, Vienna.
Government of Kenya (ROK). (1995). The study on the National Tourism Master
Plan in the Republic of Kenya, Volume 1. Nairobi: Government Printer.
192
Government of Kenya (ROK) (2005). Poverty Reduction Strategy Paper Report no.
05/11. Available online www.imf.org/external.pubs/ft/scr/2005/cr05 Retrieved on
15th September 2011
Government of Kenya (ROK). (2006). National Tourism Policy. Nairobi:
Government Printer.
Government of Kenya (ROK). (2007). Vision 2030. Nairobi: Government Printer.
Government of Kenya (ROK). (2010). The Tourism Bill,2010. Nairobi: Government
Printer.
Government of Kenya (ROK). (2011). Ministry of Tourism in Kenya. Retrieved
August 04, 2011, from Existing Tourism Business:
http://www.tourism.go.ke/ministry.nsf/pages/existing_tourism_business
Government of Kenya (ROK). (2004). Economic Recovery Strategy for Employment
and Wealth Creation (2003-2007) Report no. 28524 Available online at www-
wds.worldbank.org/external/default/WDSContentServer/WDSP/IB/2004/04/16/00
0012009_20040416112850/Rendered/PDF/28524.pdf Retrieved on 15th
September 2011
Gomez-Mejia, L., & Balkin, D. (2002). Management. Irwin: McGraw-Hill.
Goodwin, C. J. (2005). Research in Psychology: Methods and Design. USA: John
Wiley & Sons, Inc.
Greener, S. (2008). Business Research Methods. ISBN 978-87-7681-421-2. Ventus
Publishing ApS.
Guba, E. G., & Lincoln, Y. S. (1989). Fourth Generation Evaluation. Sage
Publications.

193
Hair, J. F., Jr., Black, W. C., Babin, B. J., & Anderson, R. E. (2010). Multivariate
Data Analysis. Upper Saddle River, NJ: Pearson Prentic Hall
Hair, J.F., Anderson, R.E., Tatham, R.L. & Black, W.C. 1998. Multivariate Data
Analysis. 5th Ed. New Jersey: Prentice Hall.
Hambrick, D., & Fredrickson, J. (2001). Are you sure you have a strategy? Academy
of Management Executive , 48-59.
Hemmati, M. (2000). The Financial leakages in tourism. Sustainable Travel &
Tourism, 2000, pp. 25-29.
Hinton, M. (2006). Introducing information management: the business approach.
Amsterdam: Elsevier.
Hoffman, D.L., Novak, T.P., & Chatterjee P. (1995). Commercial Scenarios for the
Web: Opportunities and Challenges. Journal of Computer Mediated
Communication URL:http://www.ascusc.org/jcmc/vol1/issue3/hoffman.html
(accessed 8 August 2011).
Holland, R. (1998). Planning Against A Business Failure. Agriculture Development
Center (ADC) Info #24 .
Huang, R.T. (2007). Improving the Service Quality of Distance Education. Louisiana
State University, Baton Rouge, LA. Retrieved on 7 April 2012 from
www.itdl.org/Journal/May_07/index.htm
Hyndman, R.J. (2008). PBS Forecasting Model Review. Berlin: Springer-Verlag.
Ikiara, M. & Okech, C. (2002). Impact of Tourism on Environment in Kenya: Status
and Policy. Kenya Institute for Public Policy Research and Analysis (KIPPRA),
Nairobi.

194
Iliachenko, E.Y. (2006). Electronic Service Quality (E-SQ) in Tourism: Development
of a Scale for the Assessment of E-SQ of Tourism Websites. Luleå University of
Technology. Luleå, Sweden. ISSN:1402-1544
Ivanovic, S., Katic, A., & Mikinac, K. (2010). Cluster as a Model of Sustainable
Competitiveness of Small and Medium Entrepreneurship in the Tourist Market.
UTMS Journal of Economics , 45-54.
Jackson, J. & Murphy, P. (2002) Tourism destinations as clusters: analytic
experiences from the New World, Tourism and Hospitality Research, 4 (1), pp.36-
52.
Jooste, C.J. (2005). Marketing Management in the Tourism Establishment. 3rded.
Pretoria: Van Schaik Publishers.
Josmani, D.S.B.A. (2007). Selection Criteria for Choosing Domestic Packages Tours in
Malaysia. University of Technology in Malaysia.
Kenya Association of Tours Operators (KATO). (2011). Retrieved 09 13, 2011, from
KATO: http://www.katokenya.org/
Kerlinger, F.N. & Lee, H.B. 2000. Foundations of behavioural research. 4th Ed.
Sydney: Harcourt College Publishers.
Khan,N.A. (2008). Human Resource Development in Tourism Industry in India : A
Case Study of Air India Ltd., New Delhi. Universidad Autónoma del Estado de
México, julio de 2008, núm. 14, pp. 89-117
Kim, E., Nam, D., & Stimpert, J.L. (2004). The Applicability of Porter’s Generic
Strategies in the Digital Age: Assumptions, Conjectures and Suggestions, Journal
of Management, 30(5), 569-589

195
King, D. and Stewart, W.P. 1996. Eco-tourism and commodification: protecting
people and places. Bio-diversity and Conservation, 5 (3): 293.
King'oriah, G. K. (2004). Fundamentals of Applied Statistics. Nairobi: The Jomo
Kenyatta Foundation.
Kiprutto, N., Kigio, F. W., & Riungu, G. K. (2011). Evidence on the Adoption of E-
Tourism Technologies in Nairobi. Global Journal of Business Research , 55-66.
Kotelnikov, V. (2011). Management Strategic Resource Based. Retrieved July 28,
2011, from 1000 Ventures.com:
http://www.1000ventures.com/business_guide/mgmt_stategic_resource-
based.html
Kothari, C.R. (2004). Research Methodology Methods & Techniques 2nd Edition.
New Delhi, India. New Age International (P) Limited.
Kutner, N.N. (2004). Applied Linear Regression Models, 4th edition, McGraw-Hill
Irwin.
Kvasova, O. (2012). Socio-demographic determinants of eco-friendly tourist attitudes and
behaviour. Tourism Today Management. 42(1): 55-77.
Lazzeretti, L. & Petrillo, C. (2006). Tourism Local Systems and Networking. Oxford,
UK, Elsevier, Advances in Tourism Research (series).
Leary, M.R. (2001), Introduction to Behavioral Research Methods (3rd Ed.) Allyn &
Bacon, Boston, USA.
Leiper, N., (2004). Tourism Management (3rd Ed.), Malaysia: Pearson Education
Australia.
196
Liu, H.J. & Chen, L. (2011). The perception of travel agents in Taiwan regarding
travel website and training needs for adopting Ecommerce. African Journal of
Business Management Vol. 5(26), pp. 10811-10820, ISSN 1993-8233.
Mafunzwaini, A. E., & Hugo, L. (2005). Unlocking the rural tourism potential of the
Limpopo province of South Africa: some strategic guidelines. Development
Southern Africa Vol. 22, No. 2 , 251-265.
Marczyk, G., DeMatteo, D., & Festinger, D. (2005). Essentials of Research Design
and Methodology. New Jersey: John Wiley & Sons, Inc.
Mbaiwa, J.E. (2000). The Impacts of Tourism in the Okavango Delta in North-west
Botswana. A Paper Presented at a Workshop on Climate Change, Biodiversity,
Multi-Species Production Systems and Sustainable Livelihoods in the Kalahari
Region, Maun Lodge, Botswana, 1-13 October 2000.
Meirelles, D. S.(2006). The Concept of Service. Revista Economia Política, vol. 26,
n. 1
Miles, M. B., & Huberman, A. M. (1994). Qualitative Data Analysis, 2nd Edition.
Califonia: Sage Publications, Inc.
Millan, A. & Esteban, A. (2004). Development of a multiple-item scale for
measuring customer satisfaction in travel agencies services. “Tourism
management”, n. 25, 2004, pp 533-546.
Miller, D., & Friesen, P. H. (1982). Innovation in conservative and entrepreneurial
firms: Two models of strategic momentum. Strategic Management Journal, 3(1),
1-26.

197
Mintzberg, H., Lampel, J., Quinn, J., & Ghoshal, S. (2003). The Strategy
Process:Concepts, Contexts, Cases, Global 4th Edition. Prentice Hall.
Morrison, A. & Thomas, R. (1999) The future of small firms in the hospitality
industry. International Journal of Contemporary Hospitality Management, 11(4):
148-154.
Mugenda, O. M. & Mugenda, A. G. (2003). Research Methods: Quantitative and
Qualitative Approaches, Acts Press, Nairobi-Kenya
Mullins, L. (2007). Management and Organisational Behaviour. 8th Ed. Harlow.
Financial Times Prentice Hall.
National Competitive Council. (2004). Annual Competitive Report. Dublin: NCC.
National Competitiveness Council. (2004b). Competitiveness through Innovation.
Ireland: Enterprise Strategy Group.
Neuman, W. L. (2009). Understanding Research. Boston. Allyn & Bacon Inc.
Neuman, W.L (2000). Social Research Methods: Qualitative and Quantitative
Approaches. Boston: Allyn and Bacon Publishers.
Newbert, S. (2005). New Firm Formation: A Dynamic Capability Perspective,
Journal of Small Business. Vol.2 pg 45-50
Ngesa, F. & Cavagnaro, E. (2010). Sustainable Tour Operating Practices: Setting up
a Case Study of Inbound Tour Operators in Kenya, Nairobi.
Niu, K., Miles, G., & Lee, C.-S. (2008). Strategic development of network clusters:
A study of high technology regional development and global competitiveness.
Competitiveness Review: An International Business Journal, 18(3), 176-191.

198
Nordin, S. (2003). Tourism Clustering and Innovation - Paths to Economic Growth
and Development. Sweden: ETOUR.
Nyaga, N. 2009). Kenya: Tourism Proves Resilient in times of Trouble. Tourism
Review, Nairobi.
Okech, R.N. (2004). The Role of Tour Operators in Sustainable Ecotourism: Lessons
from Kenya. Tourism Today, 79-89
Osterwalder, A. & Pigneur Y. (2009). Business Model Generation. Amsterdam.
ISBN:978-2-8399-0580-0.
Page, S. (1999). Tourism and Development: the evidence from Mauritius, Zimbabwe
and South Africa. ODI, London.
Parasuraman, A., Zeithaml, V.A. & Berry, L.L. (1985). "A conceptual model of
service quality and its implication", Journal of Marketing , Vol. 49, Fall, pp. 41-
50.
Parasuraman, A.; Berry, L.L. & Zeithaml, V.A. (1990). Delivering Quality Service:
Balancing Customer Perceptions and Expectations. The Free Press: New York.
Paton, M.Q (2002). Qualitative Research and Evaluation Methods (3rd Edition).
London: Sage Publications.
Pavlou, P. & Gefen, D. (2002), "Building Effective Online Marketplaces with
Institution-Based Trust". ICIS 2002 Proceedings. Paper 63.
http://aisel.aisnet.org/icis2002/63
Penrose, E.T., (1959). The Theory of the Growth of the Firm. Basil Blackwell,
Oxford.
199
Peters, M. (2005). Entrepreneurial skills in leadership and human resource
management evaluated by apprentices in small tourism businesses. Emerald
Group Publishing Limited, Vol. 47 No. 8/9 , pp. 575-591.
Peters, M.; Frehse, J.; & Buhalis, D. (2009). The importance of lifestyle
entrepreneurship: A conceptual study of the tourism industry. PASOS, Vol. 7 Nº2
pgs. 393-405.
Philip, M. (2010). Factors Affecting Business Success of Small & Medium
Enterprises (SMES). APJRBM, Volume 1, Issue 2 .
Pivcevic, S. (2009). Strategic Networks Of Small Hotels – Evidence From Croatia.
Tourism and Hospitality Management, Vol. 15, No. 2, pp. 163-175
Porter, M. E. (1980). Competitive Strategy: Techniques for Analyzing Industries and
Competitors. New York: Free Press.
Porter, M.E. (1990). The Competitive Advantage of Nation. New York, Free Press.
Porter, M.E. (1998). Competitive Strategy, Techniques for analyzing Industries and
Competitors. Revised Edition, New York free press.
Porter, M.E. (2001). Strategy and the Internet, Harvard Business Review, 79(3), 63-
78.
Potgieter, M., Jager, J. W. & Van Heerden, C. H. (2010). Type of tour operations
versus type of information systems: South African survey. African Journal of
Business Management Vol. 4(13), pp. 2634-2643
Quian, S. (2010). Research on Behaviors of Government’s Tourism Marketing.
UTMS Journal of Economics , 99-106.

200
Reichel, M., & Ramey, M. A. (1987). Conceptual frameworks for bibliographic
education: Theory to Practice. Littleton Colorado: Libraries Unlimited Inc.
Rogerson, C. M. (2007). Reviewing Africa in the global tourism. Development
Southern Africa , 361-379.
Rosenfield, S.A. (2001) Bringing business clusters into the mainstream of economic
development, European Planning Studies, 5(1), 3-23.
Rowe, A., Smith, J. D., & Borein, F. (2002). Career Award: Travel and Tourism.
Cambridge: Cambridge University Press.
Saffery, A., Morgan, M., Tulga, O., & Warren, T. (2007). The Business of Inbound
Tour Operators. USAID.
Salwani, M. I., Marthandan, G., Norzaidi, M. D., & Chong, S. C. (2009). E-
commerce usage and business performance in the Malaysian tourism sector.
Information Management & Computer Security Vol. 17 No. 2 , pp. 166-185.
Saunders, M., Lewis, P. & Thornhill, A. (2009). Research methods for business
students. 4th ed. London: Prentice Hall.
Schewarz, N. & Sudman, S. (1995). Answering questions; Methodology for
determining cognitive and communicative processes in a survey research. San
Franscisco: Joossey-Bay Publishers
Scholz, W. (2011). Development of Tourism Clusters in Aysén, Patagonia, Chile.
Dortmund Germany.
Schwab, D. P. (2005). Research Methods for Organisational Studies - 2nd Edition.
New Jersey: Lawrence Erbaum Associates, Publishers.

201
Schwartz, K. & Font, X. (2009). Sustainable supply chain management: outbound
tour operator practices. Nottingham University Business School, UK
Sciarelli, P.; Corte K. & Celiento (2005) Innovations in the Distribution of Tourist
Products. Rome, Italy.
Scott, A.J., & Wild, C.J. (1986). Fitting logistic models under case-control or choice-
based sampling. J. Roy. Statist. Soc. B, 48, 170–182.
Sekaran, U. (2003) Research Methods for Business: A skill Building Approach. 4th
Edition Illinois, USA. John Wiley & Sons, Inc.
Sheldon, P. & Yu, S.H. (2001). Applications and Benefits of Tourism Information
Technology in Travel Intermediaries in Taiwan. Taiwan University.
Siadat, S. H. (2008). Measuring Service Quality Using SERVQUAL Model: A Case
Study of E-Retailing in Iran. University of Technology in Malaysia.
Sinclair, M.T. (1990). Tourism development in Kenya. Nairobi: World Bank.
Sindiga, I. (1999). Tourism and African development: Change and challenge of
tourism in Kenya. Hampshire: Ashgate.
Smith, R. (2004). Exploring the usefulness of a conceptual framework as a research
tool: A researcher's reflections. Issues In Educational Research, Vol 14. Available
online at http://www.iier.org.au/iier14/smyth.html Retrieved on 13 September
2011
Soraya, J.N. (2005). ‘SMES Aware of ICT, but Clueless about the Right
Solutions’Bernama The Malaysian National News Agency,7 May 2005.

202
Sullivan, D. (2005), “Search engine sizes”, available at:
www.searchenginewatch.com/reports/article.php/2156481 (accessed 8 August
2011).
Temtime, Z. T. & Pansiri, J. (2002). Small Business Critical Success/Failure Factors
in Developing Economies: Some evidences from Botswana. University of
Botswana, Gaborone.
Thompson, A. J., Strickland, A. I., & Gamble, J. (2010). Crafting and executing
strategy : the quest for competitive advantage : concepts and cases 17th edition.
New York: McGraw-Hill/Irwin.
Tilley, F., & Tonge, J. (2002). Competitive Advantages in SMEs. Tourism and
Hospitality Industry, The International Journal of Tourism Research. 3: 105-113.
Trivun, V., Kenjic, V., & Mahmutcehajic, F. (2008). Life -Long Learning Strategies
in Tourism and Hotel Industry. Tourism and Hospitality Management , 171-184.
Tureac, C.E. & Anca, T. (2008). Types and Forms of Tourism. Danubis: Acta
Universitatis. Economica.
UNCTAD. (2008). FDI and Tourism:The Development Dimension East and
Southern Africa. Geneva: United Nations Conference on Trade and Development.
United Nations World Tourism Organisation (UNWTO). (1995). Technical Manual:
Collection of Tourism Expenditure Statistics. Madrid: World Tourism
Organisation.
United Nations World Tourism Organisation (UNWTO). (2001). Tourism 2020
Vision - Africa [Online]. Available from: http://www.world-tourism.org.

203
United Nations World Tourism Organisation (UNWTO). (2011). International
Recommendations for Tourism Statistics. New York: United Nations.
Vallabhaneni, D. (2009). What’s your MBA IQ: A Manager’s Career Development
Tool. . Hoboken, New Jersey: John Wiley & Sons, Inc.
Victor, A.S. (2008). E-Marketing for Small and Medium Tourism Enterprises in Mauritius
and Andaman Islands. AIMS International, Vol 2, Number 2, pp. 93-114.
Vogt, W.P. (2007). Quantitative Research Methods for Professionals. Boston, USA.
Pearson Education, Inc.
Wanjohi, A. M. (2011). Intelligent life from the web. Retrieved 07 14, 2011, from
Buzzle.com: http://www.buzzle.com/articles/challenges-facing-smes-in-
kenya.html
Western, D. (1992) Planning and Management for Optimal Visitor Capacity.
Tourism Attitudes and Use Impacts in Maasai Mara National Reserve. Edited by
Gakahu C. Nairobi: English Press Ltd
Whalley, A. (2010). Strategic Marketing. Ventus Publishers. ISBN:978-87-7681-643-8
Wiersma, W. & Jurs, S. G. (2009). Research Methods in Education. 9th Edition. New
York. Pearson Education Incl.
Wilson R. (1996). Questions Small Businesses ask About the Internet.
URL:http://www.wilsonweb.com/rfwilson/articles (accessed 8 August 2011).
World Bank. (2009). Tourism Development in Kenya 2010. Washington: World
Bank and International Finance Corporation.
World Bank. (2010). Ease of Doing Business in Kenya 2010. Washington: World
Bank and International Finance Corporation.

204
Yusof, W.M. (2011). Success Factors In Entrepreneurship: The Case of Malaysia .
Penang. Malaysia
Zikmund, G.W., Babin J.B., Carr, J.C & Griffin M. (2010). Business Research
Methods, 8th Edition, Oklahoma: ISBN-10: 1439080674 ISBN-13:
9781439080672
Zyl, C.V. (2007). Key Performance Predictors for Small and Micro Tourism
Enterprises in South Africa: Philosophical and Methodological Underpinnings.
University of Stellenbosch, South Africa.

205
APPENDICES
APPENDIX 1 - Questionnaire
Section 1 – Respondent’s General information
Name of the Company (Optional): ___________________________
Year of incorporation of the company: ________________________
Position of the person filling this questionnaire: __________________
Section 2 – Resources
This section is concerned with investigation of the resources owned by the firm and
their contribution to success:
1. How many permanent employees have your firm employed? _________
(Please fill in their numbers by
categories below)
Managers
Tour Consultants
Tour guides/drivers
Clerical workers
Others (specify)
2. How many tourist ferrying vehicles does your firm own? _____________
(Please fill in their numbers by categories below)
Van/Nissan
4x4 landcruiser
Minibus
Others (specify)

206
3. Using the following scale, please rate the following resources features as they relate
to the success of your firm: (5) Very important; (4) Moderately important; (3) Neutral
(2) Of slight importance (1) Not important
Resources 5 Very
importa
nt
4
Moderatel
y
important
3
Neutral
2 Of slight
importanc
e
1 Not
important
1 Human resource
2 Education/ skills acquisition
of employees
3 Training in tourism industry
e.g. Utalli College
4 Language skills in addition
to English
5 Owned tourists ferrying
vehicles
6 Owned parking yard
7 Owned office space
8 Owned office equipments
(fax, telephone, desks,
computers etc)
9 Availability of finance
10 Accessibility of finance
11 Collateral for finance
4. In your opinion, what other resources are necessary for the success of your
firm? ______________________________________________________________

207
Section 3 – Policies
This section is concerned with investigation of whether policies (written guidelines,
rules and regulations) affect success of tourism businesses’ owned by indigenous
Kenyans.
Please grade your answers from 1 to 5 (1 – strongly disagree, 2 – Disagree, 3 –
Don’t know, 4- Agree, 5 – Strongly Agree)
1. The existing Government policies on the following enable success of your firm:
Government policy (Written
guidelines, rules and regulations)
1
Strongly
disagree
2
Disagree
3
Don’t
know
4
Agree
5
Strongly
Agree
Advertising Kenya as destination
Inviting local tour operators for
exhibitions outside the country
Funding local tour operators to the
above exhibitions
Cushioning local tour operators
Financing through KTDC
Licenses requirement
Regional tourism enablement (East
Africa)
Uncontrolled prices charged by tour
operators

208
2. What other government policy can you suggest for success of your firm?
____________________________________________________________________
3. Does your firm have written down policies (Written guidelines, rules and
regulations)? YES/NO. If yes are they available to all employees? YES/NO.
4. Are the policies always used in decision making by the employees? YES/NO. If no,
what else is used?
___________________________________________________________________
Are the following organizational policies (Written guidelines, rules and
regulations) in place at your firm? YES/NO. If yes how would you rate their
efficiency?
Organizational policy
(Written guidelines, rules
and regulations)
YES/NO 1 Highly
Inefficient
2
Inefficient
3
Don’t
know
4
Efficient
5 Highly
Efficient
Business Plan
Operational plans and
objectives
Customer orientation and
marketing (e.g. customer
attraction and
advertisement)
Human
resource management (e.g.
recruitment, remuneration,
training and development
etc)
Finance and Accounting
(e.g. bookkeeping,

209
financing etc)
Assets management (e.g.
assets recording,
depreciation, replacement
etc.)
Section 4 – Information and Technology
This section is concerned with investigation of whether information and technology
affect success of tourism businesses owned by local operators.
1. Is your firm computerized? YES/NO. If yes, do you have a functional website
YES/NO.
2. Please rate the following website features as they relate to the success of your
firm:
Website feature 5 Very
importa
nt
4 Moderately
important
3
Neutral
2 Of slight
importanc
e
1 Not
important
1 Appearance of the
website, its graphical
interface (choice of
layout, fonts, colours,
etc.)
2 In-depth descriptions of
firms products/services
3 Contact information
4 Booking capability
5 E-commerce/payment
online
6 Customer testimonials

210
access
7 Hyperlinks to other
websites
8 Subscription to mailing
lists to receive offers,
news etc.
9 Multiple languages
3. Does your company experience problems with any of the following aspects of
website maintenance? Please characterize these problems using the following scale:
(1) Very major; (2) Major; (3) Neutral (4) Minor; (5) Very minimal
Website maintenance aspect 1 Very
major
2
Major
3
Neutral
4
Minor
5 Very
minimal
1 Keeping content updated
2 Online security
3 Reliability of telecommunications
service
4 Quality of web hosting
equipment
5 Cost of maintenance
6 Training or skills to implement
certain website features
7 Access to expert assistance or
advice
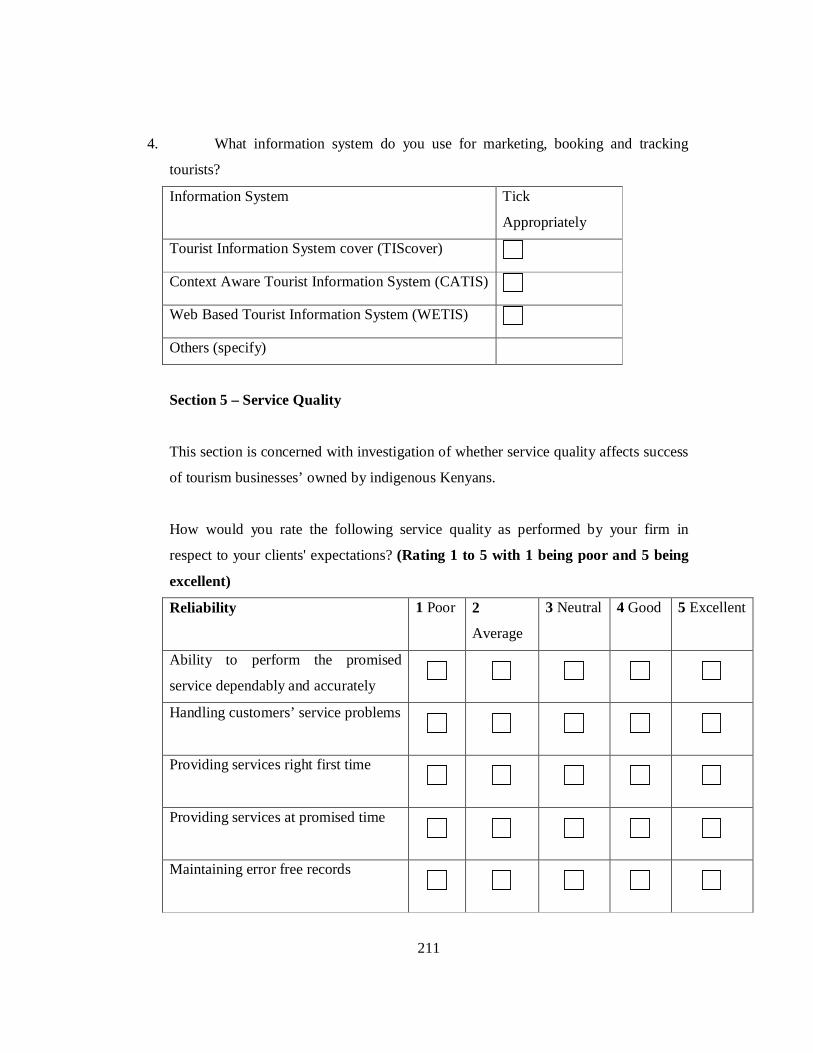
211
4. What information system do you use for marketing, booking and tracking
tourists?
Information System Tick
Appropriately
Tourist Information System cover (TIScover)
Context Aware Tourist Information System (CATIS)
Web Based Tourist Information System (WETIS)
Others (specify)
Section 5 – Service Quality
This section is concerned with investigation of whether service quality affects success
of tourism businesses’ owned by indigenous Kenyans.
How would you rate the following service quality as performed by your firm in
respect to your clients' expectations? (Rating 1 to 5 with 1 being poor and 5 being
excellent)
Reliability
1 Poor 2
Average
3 Neutral 4 Good 5 Excellent
Ability to perform the promised
service dependably and accurately
Handling customers’ service problems
Providing services right first time
Providing services at promised time
Maintaining error free records

212
Assurance
1 Poor
2
Average 3 Neutral 4 Good 5 Excellent
Knowledge and courtesy of
employees and their ability to inspire
trust and confidence.
Making customers feel safe in their
transactions
Knowledgeable employees in
handling customers questions
Customers’ trust on website
information
Tangibles
1 Poor
2
Average 3 Neutral 4 Good 5 Excellent
Modern equipments including cars
and IT equipment
VHF & HF radio fitted cars
Visually and up-to-date appealing
facilities
Employees with a neat, professional
appearance
Empathy 1 Poor
2
Average 3 Neutral 4 Good 5 Excellent
Caring, individualized attention the
firm provides its customers.
Employees understanding of their
customers’ needs while respecting
their privacy
Convenient business hours
Communication skills of the
employees

213
Responsiveness
1 Poor 2
Average
3 Neutral 4 Good 5 Excellent
Use of right means of communication
Keeping customers informed as to
when services will be performed
Prompt service to customers (less than
24 hours)
Information is provided to frequently
asked questions and answers
Email address for queries or
complaints is provided
Section 6 – Clusters and Networks
This section is concerned with investigation of whether clusters and networks affect
success of tourism businesses’ owned by indigenous Kenyans.
1. Apart from KATO, which other memberships does your firm have locally or
internationally?
Tick
Appropriately
American Society of Travel Agents (ASTA)
World Tour Operators Association (WTOA)
European Tour Operators Association (ETOA)
Others (specify)
From the above, which memberships enable you to get more business?
___________________________________________________________________

214
Your company seeks membership for the following benefits:
Benefit from
membership
1 Strongly
disagree
2
Disagree
3 Don’t
know
4
Agree
5 Strongly
Agree
Information on the sector
Increased market share
Bargaining power
Sharing resources
Linkages and connection
to international clients
List any other benefit your firm could be interested in from membership
_____________________________________________________________________
Section 7 – Success
For the previous 5 years, kindly list the following information from your firm’s
records which will concern success of your firm for the last five years:
Information requested
2006 2007 2008 2009 2010
Number of International
Tourists served
Number Local Tourists served
Approximate net profit of the
firm

215
Thank you very much for participating in this study. You are encouraged to give any
other relevant information related to factors hindering success of the tour operators
owned by indigenous Kenyans. Again you are assured of confidentiality of this
information and it will not be shared.
Could you be interested in receiving the findings of this study? If yes, please indicate
the details of your contacts below:-
Name of the Tour Operator: ______________________________________
Contact Person: ________________________________________________
Telephone number: _____________________________________________
Email Address_________________________________________________

216
APPENDIX 2 - KATO Members as at 13/09/2011
Company Name Category in KATO 1 Adventure Alternative Expeditions and Treks Associate 2 Adventure Holidays Company Ltd Associate 3 African Home Adventure Ltd Associate 4 Aipa Safaris Associate 5 Animal World Safaris Ltd Associate 6 Aramati Safaris Associate 7 Benroso Safaris Ltd Associate 8 Born Free Vacations Associate 9 Brogibro Company Ltd Associate 10 BushBlazers Tours Travel & Safaris Ltd Associate 11 Campofrio Safaris Ltd Associate 12 DK Grand Safaris & Tours Ltd Associate 13 Dotcom Safaris Associate 14 Eagle Holidays Ltd Associate 15 East Africa Adventures Tours & Safari Associate 16 Elida Tours & Safaris Associate 17 Expedition Africa Safaris Associate 18 Fidex Car Hire Ltd Associate 19 First Choice Tours & Travel Ltd Associate 20 Flight & Safaris International Ltd Associate 21 Hallmark Travel Planners Associate 22 Kairi Tours & Safaris Associate 23 Mbango Safaris East Africa Ltd Associate 24 Mfekane Tours & Travel Ltd Associate 25 Mighty Tours and Travel Ltd Associate 26 Mitoni Africa Safaris Ltd Associate 27 Moige Tours & Travel Co. Ltd Associate 28 Nightingale Tours & Travel Associate 29 Pacific Blue Travel & Tours Ltd Associate 1 African Quest Safaris Ltd Category A 2 Cheli & Peacock Ltd Category A 3 Global Holidays & Incentives Ltd Category A 4 Guerba (K) Ltd Category A 5 Twiga Car Hire & Tours Ltd Category A 6 Private Safaris(EA) Ltd Category A 1 Dallago Tours & Safaris Category C 2 Eastern and Southern Safaris Category C 3 Jamii Tours & Travel Ltd Category C

217
4 Nature Expeditions Africa Category C 5 Real Africa LTD Category C 6 Sayari Afrika Ltd Category C 7 Silver Africa Tours & Safaris Ltd. Category C 1 Acacia Holidays Ltd Category D 2 Afriqueen Adventure Ltd. Category D 3 Chronicle Tours & Travel Category D 4 Crown Tours & Car Hire Ltd. Category D 5 Diwaka Tours & Travel Ltd Category D 6 IntoAfrica Eco-Travel Ltd Category D 7 Kibo Slopes & Safaris Ltd Category D 8 Ostrich Holidays Adventures Category D 9 Rickshaw Travels (Kenya) Ltd Category D 10 Safaris In Style Category D 11 Star Travel & Tours Ltd Category D 12 Tour Africa Safaris Category D 13 Travel Creations Ltd Category D 14 Travel Scene Services Category D 15 Uniglobe Northline Travel Ltd Category D 16 Woni Safaris Ltd Category D 1 Absolute Adventure Africa Safaris Limited Category E 2 Accacia Safaris( Kenya ) Limited Category E 3 Africa Bound Safaris (K) Ltd Category E 4 Africa Partners In Safari Ltd Category E 5 African Eco-Safaris Category E 6 African Sermon Safaris Category E 7 African Servalcat Safaris & Tours Category E 8 African Spice Safaris Category E 9 All Seasons Safaris and Tours Category E 10 Aloha Tours & Safaris Category E 11 Amazing Tours & Travel Ltd Category E 12 Anste Tours & Travel Limited Category E 13 Asili Adventure Safaris Category E 14 Australken Tours & Travel Ltd Category E 15 Baisy Oryx Tours Travel & Safaris Category E 16 Basecamp Travel Ltd Category E 17 Bellafric Expeditions Ltd. Category E 18 Buena Vista Tours & Safaris Category E 19 Bushbuck Adventures Ltd Category E 20 Bushtroop Tours & Safaris Category E 21 Call of Africa Safaris Category E 22 Cheetah Tours Ltd Category E

218
23 CKC Tours & Travel Category E 24 Custom Safaris Category E 25 Destination Connect Co. Ltd Category E 26 Destination Link Services Category E 27 Earth Tours & Travel Ltd. Category E 28 Eco Adventures Limited Category E 29 El Molo Tours & Travel Category E 30 Elite Travel Services Ltd Category E 31 Exotic Golf Safaris Ltd. Category E 32 Favour Tours & Safaris Category E 33 Finch Travels Ltd. Category E 34 Flawless Links Category E 35 Four By Four Safaris Ltd Category E 36 Furstenberg Safaris Ltd Category E 37 Game Viewers Adventures Limited Category E 38 Genet Tours & Safaris Category E 39 Glory Car Hire Tours & Safaris Ltd. Category E 40 Go Africa Safaris and Travel Category E 41 Go4Fun Safaris Ltd Category E 42 Grand Edition Tours Category E 43 Hamerkop Safaris Category E 44 Holiday Seekers Ltd Category E 45 Hotel Adventure Travel Ltd Category E 46 Ideal Tours & Travel Category E 47 Incentive Travel Ltd Category E 48 Jocky Tours & Safaris Category E 49 Kenor Safaris Ltd Category E 50 Kentan Safaris Ltd. Category E 51 Kisima Tours & Safaris Category E 52 Kuja Safaris Category E 53 Leading Expeditions Safaris Category E 54 Madukha Tours & Safaris Ltd Category E 55 Marble Travel Category E 56 Maridadi Safaris Ltd Category E 57 Menengai Holidays Ltd Category E 58 Nahdy Travel & Tours Category E 59 Napenda Africa Safaris Category E 60 Nappet Tours & Travel Ltd Category E 61 Natural Track Safaris Category E 62 Nature's Edge Category E 63 Palbina Travel & Tours Category E 64 Penfam Tours & Travel Category E

219
65 PioneerTravels Ltd Category E 66 Preps Safaris International Ltd. Category E 67 Prima Vera Tours & Safaris Category E 68 Primetime Safaris Category E 69 Raydoll Tours & Travel Category E 70 Raylenne Tours & Safaris Category E 71 Safari Icon Category E 72 Safari Partners Kenya Ltd. Category E 73 Safe Ride Tours and Safaris Category E 74 Saleva Africa Tours Ltd. Category E 75 Sardius Tours & Safaris Category E 76 Selective Safaris Category E 77 Sights of Africa (E.A.) Tours & Travel Category E 78 Signature Tours & Travel Ltd. Category E 79 Silverbird Adventure Tours & Travel Category E 80 Silverbird Travel Plus Ltd Category E 81 Skyview Of Africa ltd Category E 82 Speedbird Travel & Safaris Category E 83 Sportsmen's Safaris & Tours Category E 84 Spurwing Travel & Tours Ltd Category E