
Copyright by Sonia Kumar 2007 - The University of Texas at ...
114
Copyright by Sonia Kumar 2007
-
Upload
khangminh22 -
Category
Documents
-
view
0 -
download
0
Transcript of Copyright by Sonia Kumar 2007 - The University of Texas at ...

Copyright
by
Sonia Kumar
2007
The Dissertation Committee for Sonia Kumar certifies that this is the approved
version of the following dissertation:
PLASMONIC NANOPARTICLES FOR IMAGING
INTRACELLULAR BIOMARKERS
Committee:
Rebecca Richards-Kortum, Supervisor
Konstantin Sokolov, Supervisor
Krishnendu Roy
Walter Hittelman
Karen Adler Storthz
PLASMONIC NANOPARTICLES FOR IMAGING
INTRACELLULAR BIOMARKERS
by
Sonia Kumar, B.S.
Dissertation
Presented to the Faculty of the Graduate School of
The University of Texas at Austin
in Partial Fulfillment
of the Requirements
for the Degree of
Doctor of Philosophy
The University of Texas at Austin
May, 2007

Dedication
To my family and to Nate, for their love and support.

v
Acknowledgements
Although the following dissertation is an individual work, no graduate student
stands alone. The work presented here stems from the expertise and collective ideas of
dozens of researchers. I would like to take the opportunity to acknowledge a few of these
individuals but this is by far only a small subset. I would like to start the list with my
advisors, Rebecca Richards-Kortum and Konstantin Sokolov. They have provided
excellent mentorship and guidance through the years. I owe them each the deepest
gratitude – Rebecca, for her commitment to developing technologies with global impact
and for showing me that you truly can have it all. Kostia, for his infectious enthusiasm for
research, openness to new ideas, and most importantly for keeping me on track. I also
greatly benefited from the expertise of my other committee members, Dr. Walter
Hittelman, Dr. Krishnendu Roy, and Dr. Karen Adler-Storthz.
There are a number of people who provided me with technical support without
whom I could not have gotten any results. I would like to express my gratitude to Vivian
Mack and Alison Nitsch who are highly skilled cell culture specialists and provided me
with a never-ending supply of cells. I would like to thank John Wright for his incredible
grasp of the scientific process and for his knowledge of seemingly obscure methods. I
also received excellent training and support from John Mendenhall and the fine people at
the ICMB core facility.
I would like to thank the members of the Richards-Kortum group at Rice
University and of the Sokolov group at the University of Texas at Austin. I value our lab
vi
atmosphere that enabled and promoted a free exchange of ideas. I would also like to
acknowledge my fellow graduate students in the UT BME department for their
motivation and more importantly for making my graduate career a fun and memorable
experience.
I would also like to acknowledge the sources from which I received funding.
These include the National Science Foundation Integrative Education and Research
Traineeship and the University of Texas College of Engineering THRUST Fellowship.
Lastly, I would like to thank my family for their endless love and support.

vii
PLASMONIC NANOPARTICLES FOR IMAGING
INTRACELLULAR BIOMARKERS
Publication No._____________
Sonia Kumar, Ph.D.
The University of Texas at Austin, 2007
Co-Supervisors: Rebecca Richards-Kortum and Konstantin Sokolov
Molecular optical imaging enables the ability to non-invasively image biological
function. When used in conjunction with optical contrast agents, molecular imaging can
provide biomarker-specific information with subcellular spatial resolution. Plasmonic
nanoparticles are unique optical contrast agents due to the fact that the intensity and peak
wavelength of scattering is dependant on interparticle spacing. This distance dependance
puts these nanosensors in a position to probe molecular interactions by exploiting contrast
between isolated and closely spaced nanoparticles. This dissertation presents the first
intracellular molecular imaging platform using multifunctional gold nanoparticles which
incorporate both cytosolic delivery and targeting moieties on the same particle. In order
to produce robust nanosensors, a novel conjugation strategy was developed involving a
heterofunctional linker capable of rigidly attaching various components to the
nanoparticle surface. Since most biomarkers of interest are localized intracellularly, the
viii
delivery functionality was a key focus. It was achieved using the TAT-HA2 fusion
peptide which has been previously shown to enhance both endosomal uptake and
subsequent release into the cytosol. The feasibility of these nanoparticles as intracellular
sensors was proposed by attempting to image actin rearrangement in live fibroblasts. The
assembly of nanoparticles at the leading of motile cells was which was potentially due to
actin targeting resulted in a red shift in scattering maxima due to plasmon resonance
coupling between particles as well as a dramatic increase in scattering intensity. Although
several challenges still exist, the potential for these contrast agents as nanosensors for the
presence of proteins implicated in viral carcinogenesis is also introduced.
ix
Table of Contents
List of Figures ....................................................................................................... xii
Chapter 1: Introduction ...........................................................................................1
1.1 MOTIVATION......................................................................................1
1.2 SPECIFIC AIMS ...................................................................................5
1.3 DISSERTATION SUMMARY .............................................................6
Chapter 2: Background ...........................................................................................7
2.1 MOLECULAR OPTICAL IMAGING ..................................................8
2.2 COMPONENTS OF IN VIVO OPTICAL CONTRAST AGENTS .....9
2.2.1 Targeting Moieties ........................................................................9
2.2.2 Delivery Strategies......................................................................10
2.2.2.1 Transient Cell Membrane Permeabilization ................11
2.2.2.2 Cell-Permeable Peptides ..............................................12
2.2.3 Conjugation Strategies ................................................................13
2.3 PROPERTIES OF SPHERICAL GOLD NANOPARTICLES ...........14
2.3.1 Optical Properties........................................................................14
2.3.2 Surface Properties .......................................................................18
2.3.3 Synthesis .....................................................................................19
2.3.4 Gold Nanoparticles as Contrast Agents ......................................20
2.4 OVERVIEW OF OTHER OPTICAL CONTRAST AGENTS...........25
2.4.1 Smart Fluorophores.....................................................................25
2.4.2 Other Plasmonic Nanoparticles...................................................27
2.4.3 Quantum Dots .............................................................................32
Chapter 3: Development of a Multifunctional Contrast Agent.............................35
3.1 MULTIFUNCTIONAL CONTRAST AGENT...................................35
3.2 CONJUGATION PROTOCOL ...........................................................44
3.2.1 Materials .....................................................................................45
3.2.2 Procedure ....................................................................................46

x
3.2.2.1 Gold Nanoparticle Preparation ....................................46
3.2.2.2 Functionalization of Antibodies with Linker Segment47
3.2.2.3 Conjugation to Gold Nanoparticles .............................48
3.3 ANALYSIS OF CONTRAST AGENT...............................................51
3.3.1 Nanoparticle sizing .....................................................................51
3.3.2 Average number of antibodies per nanoparticle .........................52
3.3.3 Modulating the ratio of antibodies on the surface of gold nanoparticles ...............................................................................54
3.3.4 Effect on target functionality ......................................................55
Chapter 4: Plasmonic Nanoparticles with Affinity and Delivery Functionalities for Imaging Actin in Live Cells..........................................................................60
4.1 INTRODUCTION ...............................................................................60
4.2 ACTIN .................................................................................................60
4.3 MATERIALS AND METHODS.........................................................62
4.3.1 Cell Lines ....................................................................................62
4.3.2 Contrast Agent ............................................................................62
4.3.3 Live Cell Labeling/Imaging........................................................62
4.3.4 TEM Imaging..............................................................................63
4.3.5 Immunofluorescence Staining and Imaging ...............................63
4.4 RESULTS ............................................................................................64
4.5 DISCUSSION......................................................................................77
Chapter 5: Labeling of Diffuse Intracellular Proteins – Biomarkers for Human Papillomavirus ...................................80
5.1 HUMAN PAPILLOMAVIRUS AND CERVICAL CANCER...........80
5.2 MATERIALS AND METHODS.........................................................84
5.2.1 Cell Lines ....................................................................................84
5.2.2 Contrast Agent ............................................................................85
5.2.3 Labeling and Imaging Methods ..................................................85
5.3 p16INK4a LABELING RESULTS ........................................................85
5.4 DISCUSSION : LABELING DIFFUSE BIOMARKERS ..................87

xi
Chapter 6: Conclusion...........................................................................................89
6.1 SUMMARY OF RESULTS ................................................................89
6.2 FUTURE DIRECTIONS .....................................................................91
References..............................................................................................................92
Vita 100
xii
List of Figures
Figure 2.1. Aggregates of nanoparticles give a broad red shifted peak due to resonance splitting with a red shifted parallel resonance. The optical densities have been normalized to pronounce the shift..................................................................................... 24 Figure 2.2. Relative red-shift and scattering increase of aggregated particles over isolated ones. Adapted from 43. ...................................................................................................... 24 Figure 2.3. Laser scanning confocal reflectance overlaid on transmittance of EGFR positive cancer cell labeled with anti-EGFR gold nanoparticle conjugates. Scale bar is ca 20µm. Adapted from 43. .................................................................................................... 24 Figure 2.4. Cervical biopsies labeled with anti-EGFR gold nanoparticle conjugates. A) clinically abnormal. B) clinically normal. Adapted from 14. ............................................ 25 Figure 2.5. In vivo near IR fluorescence imaging of HT1080 tumor-bearing mice showing color coded MMP-2 activity overlaid on white-light images with and without MMP inhibitor treatment............................................................................................................. 27 Figure 2.6 (Top) Calculated coefficients for extinction, scattering, and absorption for a nanocage with dimensions given in the inset. (Bottom) OCT image of a gelatin phantom with and without the presence of gold nanocages. ........................................................... 29 Figure 2.7. The optical scattering of nanoshells as a function of the core/shell ratio. Adapted from 60................................................................................................................. 31 Figure 2.8. Calcein AM staining of cells indicating viability. Left: cells without nanoshells exposed to laser light. Middle: cells incubated with nanoshells but not exposed to laser light. Right: cells incubated with nanoshells after laser exposure are effectively ablated. Adapted from 60. .................................................................................................. 31 Figure 2.9. In vivo fluorescence of qdots with three different surface modications in c4-2 human prostate tumor bearing mice. Adapted from 70...................................................... 34 Figure 3.1 The concentration of Triton X-100 to permeabilize the cell membrane without causing cellular damage was optimized using a live/dead cell-mediated cytotoxicity assay. Green fluorescence indicates membrane integrity and red fluorescence indicates delivery. Top Left: 0.025%+1%PEG; Top Center: 0.025%; Top Right: 0.05%+1%PEG Bottom Left: 0.05%; Bottom Center: 0.1%+1%PEG; Bottom Right: 0.5%..................... 42 Figure 3.2 A 3x increase in signal intensity is obtained for E7+ cells (top) over E7- cells (bottom) when labeled with E7 targeted gold nanoparticles in the presence of Triton X-100..................................................................................................................................... 43

xiii
Figure 3.3 Confocal reflectance images of TAT functionalized Anti-Actin 20nm gold conjugate labeled NIH3T3 fibroblasts. ............................................................................. 44 Figure 3.4. A theoretical curve demonstrating the effect of the amount of 38.8mM trisodium citrate on nanoparticle size. .............................................................................. 47 Figure 3.5 Cartoon schematic of the conjugation protocol.............................................. 50 Figure 3.6 TEM image of monodisperse 16nm gold nanoparticles (acquired by Timothy Larson) .............................................................................................................................. 52 Figure 3.7. (Top) Fluorescence vs. antibody concentration standard curve (Bottom) Optical density vs. nanoparticle concentration standard curve......................................... 53 Figure 3.8 Results of two independent experiments demonstrate control of antibody composition on the surface of gold nanoparticles............................................................. 55 Figure 3.9 Standard pyrene-actin polymerization assay shows similar polymerization rates with and without the presence of gold nanoparticle based contrast agents.............. 57 Figure 3.10. Darkfield reflectance images of polymerized actin strands labeled with gold nanoparticle contrast agent targeted to actin..................................................................... 59 Figure 4.1 a) Darkfield reflectance image of a live NIH3T3 cell labeled with gold nanoparticle based contrast agents targeted to actin. The leading edge (arrow) of the cell where actin polymerization is greatest corresponds to a brighter optical signal. Scale bar is 20µm. b) TEM image demonstrating delivery of complete multifunctional contrast agent in live NIH3T3 cells. Scale bar is 2µm. c) A higher magnification TEM image shows the nanoparticle labeling pattern in the region indicated by the arrow in 2b. The inlay shows live cells labeled with contrast agent containing incomplete delivery peptide (TAT only). Labeling is localized to endosomal structures without HA2 functionality. Scale bars are 0.2µm. (TEM images acquired by Nathan Harrison) ................................ 66 Figure 4.2. Stress fiber labeling patterns in a) Confocal fluorescent image of fixed NIH3T3 fibroblasts labeled with Alexa Fluor 488-phalloidin. b) Darkfield reflectance image of live non-motile NIH3T3 fibroblasts labeled with gold nanoparticle based contrast agent. Scale bars are 20µm.................................................................................. 67 Figure 4.3 Efficacy of multiple functionalities in labeling intracellular targets. Darkfield reflectance imaging of live NIH3T3 cells labeled with varying 20nm gold nanoparticle contrast agent formulations. Arrows indicate the presence of visible filapodia. Scale bars are 10µm. a) Unlabeled cells. b) Contrast agent functionalized with anti-actin targeting antibody and only the TAT delivery peptide. c) Contrast agent functionalized with only anti-actin targeting antibody d) Contrast agent functionalized with only TAT-HA2
xiv
delivery peptide. e) Multifunctional contrast agent with both targeting and delivery moieties. ............................................................................................................................ 69 Figure 4.4 Brightfield images of live NIH3T3 cells show a similar spreading pattern when labeled with contrast agent displaying different delivery peptides. Scale bar is 10µm. a) Unlabeled cells b) Contrast agent functionalized with anti-actin targeting antibody and only the TAT delivery peptide. c) Contrast agent functionalized with anti-actin targeting antibody and the TAT-HA2 delivery peptide ........................................... 71 Figure 4.5. High contrast is achieved in confocal images of NIH3T3 cells labeled with a complete multifunctional contrast agent in labeled cells (right) versus unlabeled cells (left). Scale bar is 10µm................................................................................................... 72 Figure 4.6. The leading edge of a NIH3T3 cell is easily distinguished as the cell crawls toward a stimulus, collagen IV (upper right corner). The video spans roughly 1.6 hours............................................................................................................................................ 73 Figure 4.7. Imaging actin dynamics. Cellular functions involving actin demonstrated using darkfield reflectance imaging of live NIH3T3 cells labeled with multifunctional contrast agent. Retraction of filapodia is shown here at various time points. Arrows indicate labeled actin filaments. Scale bar is 20µm......................................................... 74 Figure 4.8 . The arrangement of actin is followed as cells spread on a monolayer of collagen IV. Time points at 4hrs (left) and 8hrs (right) are shown. A star indicates a cell body and arrows indicate actin alignment. Scale bar is 20µm.......................................... 74 Figure 4.9 A darkfield reflectance RGB image of fibroblasts labeled with actin-targeted gold nanoparticle contrast agent. The areas outlined in white indicate areas of strong nanoparticle labeling as identified by thresholding the red channel of the image............ 76 Figure 4.10. Quantification of the effect on cytochalasin D on the gold nanoparticle labeled fibroblasts. ............................................................................................................ 77 Figure 5.1. Histological staining of p16 through the stages of cervical intraepithelial neoplasia using CINTec. Adapted from 116....................................................................... 84 Figure 5.2. Immunofluorescence staining of p16 protein in HPV+ (left) versus HPV- (right) cells. The nuclei are counterstained with DAPI (blue) ............................... 86 Figure 5.3. Live HPV+ (top) and HPV- (bottom) cells were labeled with 20nm gold nanoparticle functionalized with the TAT-HA2 delivery peptide and anti-p16 antibody. Confocal reflectance (left) and reflectance overlaid of transmitted images (right) are provided. ................................................................................................................ 87

1
Chapter 1: Introduction
1.1 MOTIVATION
Cancer imposes a tremendous psychological and economic burden on society. In
2002 alone, direct cancer-related medical costs totaled $60.9 billion and indirect costs
due to loss of productivity totaled $110.7 billion1, 2. A large percentage of cancer
research is focused on improving the outcomes of late stage cancers since most people
become aware of their condition only after the cancer is in advanced stages3. This is
evidenced by the percentage of people with distant metastases at the time of diagnosis –
72%, 57%, and 34% for lung, colorectal, and breast cancer respectively3. Despite the
enormous amount of funding and research devoted to advanced cancer treatment, survival
rates have barely improved over the past 30 years. These modest gains have been
attributed to the difficulty in understanding the instability of invasive cancers and to the
use of indiscriminate aggressive cytotoxic treatments that also exact a toll on healthy
cells. In spite of these minimal improvements, one thing remains certain. Survival rates
are dramatically increased when the disease is detected at an early stage. In the case of
breast cancer, the 5 year survival rate for women diagnosed with distant disease is a
dismal ~20%. When the disease is detected as localized disease however, the 5 year
survival rates jumps to greater than 95%. Early detection is universally acknowledged as
the holy grail in cancer treatment and ultimately in cancer prevention.
The National Cancer Institute has set a goal to eliminate suffering and death due
to cancer by 20152. One of the key strategies in achieving this goal is to stress early
2
detection and prevention using novel molecularly targeted cancer diagnostics and
therapeutics2. As we begin to better understand the cellular and molecular pathways of
carcinogenesis, it is possible to identify and treat pre-cursors to cancer before changes are
detected at anatomic levels. Fortunately, improvements in biochemistry and molecular
biology are beginning to provide the opportunity for the paradigm change from treating
advanced cancer to the detection and treatment of cancer pre-cursors before anatomic
changes can be detected. When a deviant pathway is triggered, a unique set of
biomolecules undergo a change in expression level correlating to the deviance4. Hanahan
et al have classified six essential changes in cellular pathways that govern carcinogenesis
– self-sufficiency in growth signals, insensitivity to inhibitory growth signals, limitless
replicative potential, evasion of apoptosis, sustained angiogenesis, and metastasis4.
Charting associated biomarker expression changes at various stages of the abnormal
pathway gives a detailed map of the disease process and provides potential targets for
diagnosis and therapy. With the exception of growth factor receptors on the cell surface, a
vast majority of these biomarkers are located within the cell. Detection of these target
molecules provides the opportunity to arrest pathologies in their earliest stages and
effectively prevent the subsequent anatomic malfunction and the costly and painful
treatment associated with it. Prevention through early detection remains the best
treatment strategy. Detection of these same markers provides opportunity to not only
diagnose precursors to cancer but also to guide and monitor the response of the body to
therapy.
The history of cervical cancer treatment best illustrates the ability of early
detection and molecular diagnostics to impact quality of life. As late as the 1950’s,
3
cervical cancer was one of the most common reasons for cancer death among American
women. The tides turned when researchers discovered the progression of carcinogenesis
through stages of cervical intraepithelial neoplasias which led to the development of a
screening tool, the Pap smear. The Pap smear is a diagnostic tool that screens for pre-
cancerous changes in the cervix by assessing abnormal cellular morphology. Pap smears
revolutionized the detection of cervical pre-cancers and effectively decreased the
mortality associated with invasive cervical cancer by more than 70% by the 1990’s. In
contrast, in developing countries where the Pap smear is not routinely used due to high
cost or lack of trained personnel, cervical cancer related mortality remains the leading
cause of death in women by cancer. More recently, a second breakthrough in molecular
characterization is having an even more powerful impact. The role of human
papillomavirus (HPV) in causing cervical cancer was discovered just over 30 years ago.
This has led to the development of HPV DNA hybridization assays which drastically
improve the sensitivity and positive predictive value of the Pap smear. Beyond
screening, several prophylactic and therapeutic vaccines have been developed to combat
HPV which have the potential to eradicate the threat of cervical cancer entirely5-7.
Developing imaging techniques in conjunction with targeted contrast agents that
have the ability to detect molecular signatures will not only target biomakers for therapy
but will also prove useful in further unraveling the molecular origins of cancer. They
have the potential to improve our understanding of the disease process and allow the
identification of markers with better predictive values than those currently existing.
Optical imaging, in particular, enables the ability to image non-invasively in real-time
which makes it well suited to early detection. Molecular characterization in combination
4
with optical imaging can potentially provide a sensitive and specific method to detect and
prevent the progression of pre-cancerous lesions.
Molecular imaging of intracellular processes is a key challenge in modern
biology. Recently, plasmonic nanoparticles have been used to develop new assays with
unprecedented sensitivity in analytical biochemistry. This work is providing a foundation
for development of new approaches for molecular specific imaging in live cells. As
many interesting biomolecules are located inside the cell, access to the target must
involve a delivery mechanism. Therefore, novel approaches are required to tailor
nanomaterials for intracellular imaging in live cells. Here I present the first intracellular
molecular imaging platform using gold nanoparticles which incorporate four
functionalities on the same particle - targeting, endosomal uptake, cytosolic release, and
improved biocompatibility. I showed that each functional element of these nanosensors is
essential in providing strong molecular specific optical signal inside living cells. The
utility of this contrast agent was demonstrated in the intracellular imaging of actin. It is
known that gold nanoparticles exhibit inherent "smart" properties which are closely
associated with their non-linear scattering behavior in closely spaced assemblies. While
a solution of isolated 20nm gold nanoparticles scatter light at approximately 520nm,
closely spaced assemblies can shift that resonance on the order of 100nm giving a
significantly brighter red signal8. I demonstrated the feasibility of these properties to be
used for highly sensitive detection of molecular assemblies inside living cells.

5
1.2 SPECIFIC AIMS
The primary goal of this research project was to develop and demonstrate
feasibility for a novel molecular specific optical contrast agent for the imaging of
intracellular biomarkers. The following specific aims were designed to accomplish this
task:
1. Develop and characterize a robust multifunctional optical contrast
agent incorporating targeting and delivery moieties on the same
nanoparticle.
a. Investigate surface chemistries and conjugation strategies relevant to
gold nanoparticles
b. Explore intracellular delivery methods
c. Develop a protocol to reproducibly produce stable, functional contrast
agents.
d. Perform independent characterization assays to determine the
properties of the contrast agent.
2. Demonstrate the potential use of the contrast agent by attempting to
label intracellular biomarkers of interest in live cells.
a. Identify biomarkers that are interesting in the disease process that can
potentially exploit the distance dependant properties of gold
nanoparticles.
i. Actin filaments.
ii. HPV protein, p16.
6
1.3 DISSERTATION SUMMARY
Chapter 2 presents the potential of optical imaging in detecting molecular
biomarkers. The components of optical contrast agent are discussed including both
targeting and delivery functionalities. Then, the optical and surface properties of gold
nanoparticles are presented as well as their current applications in biomarker detection.
The chapter ends with an overview of other existing optical contrast agents under
development. This chapter includes portions of a review paper published in
Nanomedicine in 2006.
Chapter 3 describes the development of a multifunctional gold nanoparticle based
contrast agent. A detailed protocol is presented along with results from the
characterization of the contrast agent.
Chapter 4 reports the validation of the multifunctional contrast agents in labeling
intracellular biomarkers. Details of actin imaging experiments are provided in various
biological systems. Sections of this chapter have been submitted to Nano Letters in 2007.
Chapter 5 describes the labeling of diffuse intracellular biomarkers. Human
papillomavirus protein, p16, was targeted due to its implication in cervical
carcinogenesis.
Chapter 6 summarizes the discussion of multifunctional nanoparticles as optical
contrast agents as well including its limitations. Finally, recommendations for future
work are presented.
7
Chapter 2: Background*
The motivation for this research is largely to create optical nanosensors for the
detection of intracellular biomolecular markers which are involved in the disease process.
This chapter serves to introduce the concept of molecular diagnostics and give an
overview of optical contrast agents. A shift in diagnostic paradigm for cancer detection
using molecular markers is discussed. Optical imaging is then presented as a high
resolution non-invasive detection method for these molecular markers. The targeting and
delivery components of effective molecular optical contrast agents are put forth. The
optical and surface properties of gold nanoparticle are presented as well as applications of
gold nanoparticle based contrast agents. Finally, other classes of optical contrast agents
currently being developed will be reviewed including smart fluorophores, gold
nanoshells, and quantum dots.
• Portions of this chapter were previously published in Kumar, S., Richards-Kortum, R. Optical
molecular imaging agents for cancer diagnostics and therapeutics. Nanomedicine 1, 23-30 (2006)

8
2.1 MOLECULAR OPTICAL IMAGING
Beyond just detection, visualization of the molecular features of carcinogenesis
enables the unparalleled ability to diagnose, stage, and treat cancer. The emergent fields
of biophotonics and nanotechnology are facilitating the optical probing of tissue at the
molecular level. Optical imaging is an emerging imaging technology which entails
probing a sample with non-ionizing radiation and collecting a signal resulting from the
fluorescence, absorption or reflection. When used in conjunction with site-targeted
contrast enhancing agents, imaging of molecular features is possible. Several features of
optical imaging systems make them ideal for the clinical setting. First, optical imaging
systems are relatively easy to use and inexpensive as compared to other imaging
modalities. Since optical imaging enables a noninvasive visualization of markers,
multiple and frequent measurements are possible thereby avoiding the cost and time
requirement of often painful procedures. Currently, tissue regions with questionable
pathology are excised as biopsies to be further evaluated by a pathologist. Noninvasive
optical imaging avoids this perturbation or damage caused to the tissue and thereby
removes potential artifacts during diagnosis. Additionally, the high resolution
information gained from in vivo optical measurements can streamline complicated
traditional immunohistochemistry and in situ hybridization procedures. When multi-
spectral contrast agents are used, multiple biomarkers can be tracked simultaneously
making diagnosis more efficient.
Optical molecular imaging requires two vital components: a molecular-specific
signal and an imaging system to detect this signal. Although new techniques are being
developed in optical imaging systems, the basic tenets have remained unchanged for
9
decades. Several excellent reviews on optical imaging systems have been written and
will not be covered here9-15. We will focus here on the novel probes being developed to
enable imaging of disease-specific targets at the nanometer scale. The properties and
applications of available nanoparticle platforms are described with particular emphasis on
plasmonic nanoparticles. Regardless of the optically active agent, effective contrast
agents should employ methods to penetrate to the location of interest and specifically
bind to the biomarker of interest.
2.2 COMPONENTS OF IN VIVO OPTICAL CONTRAST AGENTS
2.2.1 Targeting Moieties
While native optical image contrast between normal and abnormal tissue is often
present, diagnostic accuracy can be drastically improved by enhancing signal from
disease specific markers16. Regardless of the imaging agent employed, targeting is used
to provide a meaningful signal for pathologic diagnostics. Several factors need to be
evaluated in choosing an appropriate target for detection. These include epitope
availability, specificity to disease and the availability of a suitable probe. The probe itself
should exhibit little to no toxicity and have high affinity and avidity for the target without
affecting target function. Affinity and avidity refer to the binding strength between a
probe and its target. High disease specificity is achieved by choosing markers that are
expressed in unique pathological processes. Fortunately, a suitable probe is often
established in the process of studying the biomarker. The same recognition substrate
used to characterize the molecular feature of pathogenesis can often be conjugated to the
imaging agent to provide targeted detection. Imaging agents themselves can also aid in

10
the discovery of new disease specific markers thus creating a synergy between
biochemistry and molecular imaging. Antibodies for example, which are routinely used
in pathology labs, can be used to provide an in vivo imaging analog of traditional in vitro
molecular biochemistry techniques such as immunohistochemistry17. In addition to full
antibodies, the targeting fragments of antibodies, the Fab fragments, are often used to
reduce the size of the probe without disrupting affinity. In addition, advances in phage
display related technologies are facilitating the use of small peptide derivatives and
aptamers for recognition and targeting18. Phage display uses bacteriophages to produce
and select synthetic proteins and aptamers, short nucleotide sequences that have the target
recognition qualities of natural antibodies. The phages are genetically engineered to
display a protein of interest on the coat of the phage while retaining the encoding DNA
within the phage itself, thereby linking genotype and phenotype. Affinity purification is
used to select a suitable phage from a vast library of random phages18, 19.
2.2.2 Delivery Strategies
Probes to visualize molecular features have two basic requirements – they should
access the target and they should provide a meaningful signal20, 21. As many interesting
biomolecules are located inside the cell, access to the target must involve an intracellular
delivery mechanism. The cell membrane, however, serves as an impermeable barrier to
most hydrophilic biological cargo. The cell membrane consists of a bilayer of
amphipathic lipids interspersed with proteins making up roughly 50% of the membrane
volume. The hydrophobic nature of the lipid bilayer structure of the plasma membrane
effectively restricts access to the cytoplasm with the exception of a few molecules for

11
which transmembrane proteins exist. The most direct method for bypassing the cell
membrane involves microinjecting the cargo into the cell although that is only possible
for small populations of adhesive cells. For large cell populations of adhesive as well as
non-adhesive cells, several techniques have been developed to permeabilize the cell
membrane temporarily and to hoax existing cellular machinery into transporting cargo.
2.2.2.1 Transient Cell Membrane Permeabilization
Several methods have been devised to temporarily disrupt the cell membrane to
allow transport of desired cargo without having long-term effects on the cell. This
strategy results in increased membrane permeability without specificity – any foreign
cargo in the surrounding media has an increased likelihood of being transported into the
cell. A brief overview of these methods is given below. Detergents or surfactants
reversibly solubilize portions of the lipid bilayer via the formation of micelles. Cells are
more receptive to transport since the hydrophobicity of the cell membrane is disrupted.
In the case of digitonin, a commonly used surfactant, pores are formed to allow the
transport of macromolecules in the both directions without the disruption of exocytosis.
Bacterial toxins, such as Streptolysin O, function by binding the cholesterol moieties
embedded in the plasma membrane and thereby forming transmembrane pores that allow
delivery of molecules up to 100kDa in mass22. When sublytic concentrations are used,
cells repair the lesions over time partially by shedding the toxin. Electroporation and
sonoporation use electrical and ultrasonic pressure pulses respectively to transiently
permeabilize membranes23, 24. Both methods suffer from highly cell mortality and low
transport efficiency and are ineffective in adherent cells23, 24.
12
2.2.2.2 Cell-Permeable Peptides
Cell-permeable peptides or protein transduction domains are small peptide
sequences that promote endocytosis independent of specific receptors or transporters.
The attachment of delivery peptides to cargo allows for high delivery specificity. The
TAT peptide was one of the first and is definitely the most widely known cell-permeable
peptide25-27. Other peptides include the third α-helix of Antennapedia, the VP22 herpes
simplex virus protein, and the hydrophilis lysine-rich domain (KKKRKV) derived from
the nuclear localization sequence of the simian virus 40 (SV40) large T-antigen28. The
internalization of the basic TAT protein transduction domain was recently shown to be
initiated by an ionic cell-surface interaction with negatively charged heparin sulfate
proteoglycans. After the initial electrostatic interaction, it is proposed that TAT is taken
up through a receptor-independent form of endocytosis known as lipid raft-mediated
macropinocytosis29. The transduction occurs independent of interleukin-2 receptor/raft-,
caveolar-, and clathrin-mediated endocytosis and phagocytosis. However, the resulting
macropinosomes remain intact thereby trapping cargo. Recently, Dowdy et al reported a
fusogenic TAT-HA2 peptide that overcomes this limitation. The pH sensitive influenza
virus hemagglutinin protein HA2 disrupts the integrity of the endosomal lipid membrane
at low pH releasing the endosomal content into the cytosol29. The HA2 sequence has the
additional benefit of not being cytotoxic as opposed to other commonly used endosomal
membrane destabilizers such as polyethylenimine and chloroquine29. The TAT-HA2
sequence is therefore a fusogenic transduction peptide that can be used to enhance both
the endocytic uptake and the subsequent endosomal release of an imaging contrast agent.
The attachment of TAT-HA2 has been proven effective in the cytosolic delivery of
13
superparamagnetic nanoparticles30. While these magnetic nanoparticles were both
delivered and targeted to an intracellular protein, direct visualization of the particles was
not possible and detection required cell transfection with fluorescent protein-target
constructs.
2.2.3 Conjugation Strategies
Once an appropriate targeting probe (and perhaps also delivery peptide) is
identified, it needs to be conjugated to the surface of an imaging agent. Conjugation can
either be direct or indirect. Regardless of the method used, there are certain criteria that
need to be met for successful conjugation. 1) Attachment should be accomplished
without altering the function of either component. 2) The imaging agent should be stable
under biological conditions, especially in the presence of other proteins. 3) Non-specific
interactions should be minimized or eliminated entirely.
Direct conjugation involves a chemical or electrostatic interaction between the
probe and the imaging agent. Although it has been successful in certain cases, it is often
difficult to use a probe to both stabilize the imaging agent and provide targeting. Indirect
conjugation is achieved by employing a linker to decouple these functions. Typically, one
end of the linker is designed to bind the targeting probe and the other end is reactive to
the surface of the contrast agent. In choosing a linker, length and composition can play
an important role in retaining the function and availability of the targeting molecule. The
position of the linker can also affect functionality. In addition to the targeting molecules
themselves, the imaging agents can be further functionalized with other moieties that can
14
reduce non-specific labeling or improve retention within the body. Polyethylene glycol, a
hydrophilic biocompatible polymer, is one of several molecules used in this capacity.
2.3 PROPERTIES OF SPHERICAL GOLD NANOPARTICLES
2.3.1 Optical Properties
The optical and chemical properties of gold nanoparticles are dramatically
different from those of the bulk noble metal, in particular those of color and surface
reactivity. Colloids of gold display beautiful colors ranging from blue to the deep red.
The Lycurgus chalice dating back from 4th century AD Rome is the oldest known object
containing colloidal gold. The vessel appears opaque green in reflected light and a
translucent red when light is shone through it. This unusual optical effect is due to 70nm
gold and silver nanoparticles. The chalice is not unique however – nanoparticles have
been used throughout the ages for their color in inks, pottery glazes, and stained glass
among others. In 1857, Faraday prepared the first sample of pure colloidal gold and
recognized that the intense colors were correlated with the nanometer size regime of the
nanoparticles.
The optical properties of nanoparticles are governed by Maxwell’s equations for
classical electrodynamics. Mie first presented and Debye extended the exact solution of
these equations for the case of gold nanoparticles in the early 19th century in what is
commonly referred to as Mie theory. Mie theory fully describes the electromagnetic
scattering of a sphere of arbitrary radius and refractive index, embedded in an arbitrary
15
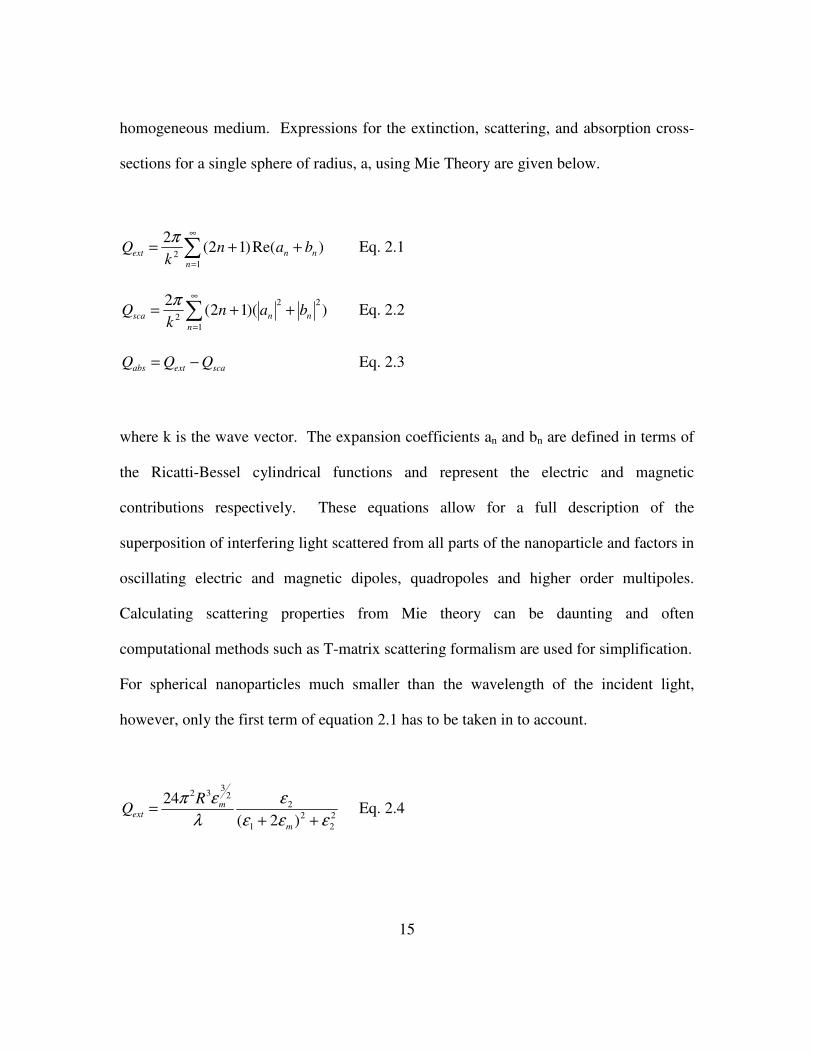
homogeneous medium. Expressions for the extinction, scattering, and absorption cross-
sections for a single sphere of radius, a, using Mie Theory are given below.
)Re()12(2
12 nn
n
ext bank
Q ++= ∑∞
=
π Eq. 2.1
))(12(2 22
12 nn
n
sca bank
Q ++= ∑∞
=
π Eq. 2.2
scaextabs QQQ −= Eq. 2.3
where k is the wave vector. The expansion coefficients an and bn are defined in terms of
the Ricatti-Bessel cylindrical functions and represent the electric and magnetic
contributions respectively. These equations allow for a full description of the
superposition of interfering light scattered from all parts of the nanoparticle and factors in
oscillating electric and magnetic dipoles, quadropoles and higher order multipoles.
Calculating scattering properties from Mie theory can be daunting and often
computational methods such as T-matrix scattering formalism are used for simplification.
For spherical nanoparticles much smaller than the wavelength of the incident light,
however, only the first term of equation 2.1 has to be taken in to account.
2
2
2
1
22
332
)2(
24
εεε
ε
λ
επ
++=
m
mext
RQ Eq. 2.4

16
where 21 εεε i+= is the frequency dependant dielectric function of the nanoparticle and
mε is the dielectric function of the surrounding medium. In this case, Mie theory reduces
to the Rayleigh expression and only the electric dipole is considered. Conceptually, this
occurs when every electron in the nanoparticle experiences the same phase of the incident
electromagnetic wave and thus oscillates and scatters light in phase. While this is true
strictly when the nanoparticle radius, a, is much less than )2/( mnmedO πλ , these
approximations have been calculated to be fairly valid for gold nanoparticles smaller than
40nm in diameter. Under the Rayleigh approximation, the scattered light intensity at any
angle θ is given by
)cos1(1
18 2
2
2
2
42
464
θλ
π+
+
−=
m
m
r
InaI
O
Omed
U Eq. 2.5
Several important optical properties of gold nanoparticles are exposed by Eq. 2.5. The
first is that the scattered light intensity increases with the sixth power of the radius of the
nanoparticle at a given wavelength. The second relationship dictates that for a given
radius, light intensity decreases with the fourth power of the wavelength. The last and
most important property is that the scattered light intensity is defined by the wavelength
dependant refractive index of the nanoparticle, m. The refractive index for gold
nanoparticles is a complex number, wheremed
imrel
n
innm
)( += , indicating that they both
scatter (nrel) and absorb light (nim). It is the light absorption, explained by the imaginary
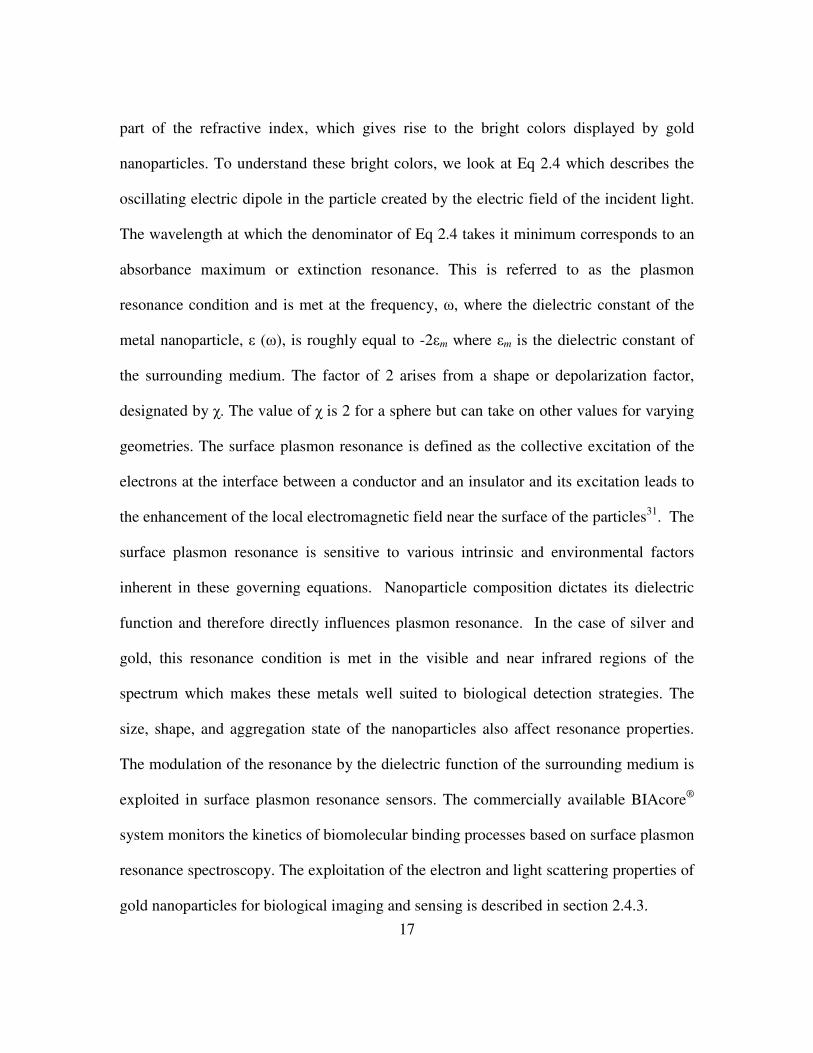
17
part of the refractive index, which gives rise to the bright colors displayed by gold
nanoparticles. To understand these bright colors, we look at Eq 2.4 which describes the
oscillating electric dipole in the particle created by the electric field of the incident light.
The wavelength at which the denominator of Eq 2.4 takes it minimum corresponds to an
absorbance maximum or extinction resonance. This is referred to as the plasmon
resonance condition and is met at the frequency, ω, where the dielectric constant of the
metal nanoparticle, ε (ω), is roughly equal to -2εm where εm is the dielectric constant of
the surrounding medium. The factor of 2 arises from a shape or depolarization factor,
designated by χ. The value of χ is 2 for a sphere but can take on other values for varying
geometries. The surface plasmon resonance is defined as the collective excitation of the
electrons at the interface between a conductor and an insulator and its excitation leads to
the enhancement of the local electromagnetic field near the surface of the particles31. The
surface plasmon resonance is sensitive to various intrinsic and environmental factors
inherent in these governing equations. Nanoparticle composition dictates its dielectric
function and therefore directly influences plasmon resonance. In the case of silver and
gold, this resonance condition is met in the visible and near infrared regions of the
spectrum which makes these metals well suited to biological detection strategies. The
size, shape, and aggregation state of the nanoparticles also affect resonance properties.
The modulation of the resonance by the dielectric function of the surrounding medium is
exploited in surface plasmon resonance sensors. The commercially available BIAcore®
system monitors the kinetics of biomolecular binding processes based on surface plasmon
resonance spectroscopy. The exploitation of the electron and light scattering properties of
gold nanoparticles for biological imaging and sensing is described in section 2.4.3.
18
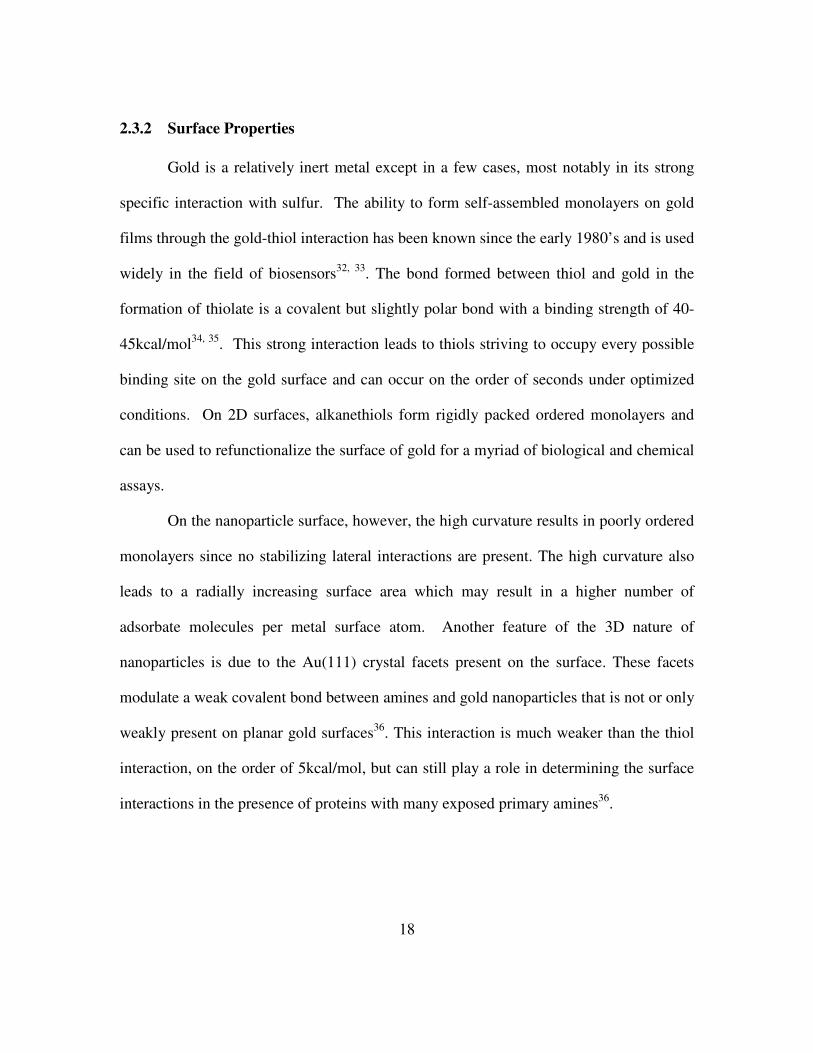
2.3.2 Surface Properties
Gold is a relatively inert metal except in a few cases, most notably in its strong
specific interaction with sulfur. The ability to form self-assembled monolayers on gold
films through the gold-thiol interaction has been known since the early 1980’s and is used
widely in the field of biosensors32, 33. The bond formed between thiol and gold in the
formation of thiolate is a covalent but slightly polar bond with a binding strength of 40-
45kcal/mol34, 35. This strong interaction leads to thiols striving to occupy every possible
binding site on the gold surface and can occur on the order of seconds under optimized
conditions. On 2D surfaces, alkanethiols form rigidly packed ordered monolayers and
can be used to refunctionalize the surface of gold for a myriad of biological and chemical
assays.
On the nanoparticle surface, however, the high curvature results in poorly ordered
monolayers since no stabilizing lateral interactions are present. The high curvature also
leads to a radially increasing surface area which may result in a higher number of
adsorbate molecules per metal surface atom. Another feature of the 3D nature of
nanoparticles is due to the Au(111) crystal facets present on the surface. These facets
modulate a weak covalent bond between amines and gold nanoparticles that is not or only
weakly present on planar gold surfaces36. This interaction is much weaker than the thiol
interaction, on the order of 5kcal/mol, but can still play a role in determining the surface
interactions in the presence of proteins with many exposed primary amines36.

19
2.3.3 Synthesis
There are several methods in which gold nanoparticles can be prepared, three of
which are briefly described below:
(i) Bare metal nanoparticles of varying sizes can be prepared by employing
physical methods such as evaporation. Metal is evaporated in a vacuum by
resistive heating or laser ablation and the resulting nanoparticles are deposited on
a solid substrate. It is possible to narrow the size distribution by controlling the
rate of evaporation, varying the distance between the substrate and the evaporator
as well as by using nucleating inert gases. Complete control over size requires
mass selection using a cluster beam apparatus.
(ii) Particles with diameters ranging from 10-200nm can be prepared by
reduction of diluted aqueous solutions of HAuCl4 using citric acid or trisodium
citrate, a process first developed by Turkevich and later extended by Frens37, 38.
The citrate ions initially serve as reducing agents for the Au ions and then as
stabilizing agents by forming a layer over the nanoparticle surface. The citrate ion
layer protects the nanoparticles from van der Waal induced aggregation via
electrostatic repulsion and renders them soluble in water. When using trisodium
citrate, very narrow size distributions of highly spherical particles can be achieved
with a standard deviation less than 10%. The Turkevich method is the preferred
method for synthesizing gold nanoparticles for biological applications.

20
(iii) The Brust-Schiffrin two-phase synthesis of nanoparticles involves reducing
HAuCl4 in a solution of toluene and a long-chain alkyammonium surfactant39.
Aqueous HAuCl4 is transferred to toluene using tetraoctylammonium bromide as
the phase-transfer reagent and reduced by NaBH4 in the presence of
dodecanethiol. This process can yield particles with sizes between 1-5nm with a
standard deviation of around 5% after size selective processing. The long-chain
alkane-thiols added to the solution cap the particles and make them soluble in the
organic phase and as well as stabilizing them against aggregation. A laborious
ligand exchange and phase separation is necessary to make the particles water-
soluble and therefore usable as biosensors.
2.3.4 Gold Nanoparticles as Contrast Agents
Several properties of gold plasmonic nanoparticles make them advantageous for
imaging in biological systems. Gold nanoparticles have been shown to be non-toxic in
human cells and have been used in various other in vivo biological applications since the
1950s40. The Turkevich reaction also affords size control of the monodisperse colloidal
nanoparticle suspension. The sensitivity of the surface plasmon resonance to size
provides optical tunability over a range of wavelengths from the visible to the near IR.
Since resonant scattering is elastic in nature, the signal benefits from photostability
allowing the particles to be imaged indefinitely. This is a benefit over fluorescent
molecules that suffer from both photobleaching and blinking. In addition to optical
applications, gold nanoparticles have also been extensively used as molecular specific
stains in electron microscopy of cells and tissues41, 42. In this field, the fundamental

21
principle of interactions between the gold particles and biomolecules, especially proteins,
has been thoroughly studied. As a result, well established protocols have been developed
for the labeling of a broad range of biomolecules with colloidal gold, including protein A,
avidin, streptavidin, glucose oxidase, horseradish peroxidase, and IgG.
Among the fascinating properties of metal nanoparticles, the ability to resonantly
scatter light at frequencies coinciding with the particles’ surface plasmon resonance has
yet to be fully exploited for biological applications. The most interesting application
stems from the effect of the aggregation state on the surface plasmon. When particles
aggregate, mutual dipoles are induced due to electrodynamic interactions resulting in a
red shift of plasmon features. It has been observed that as the mean particle-particle
distance decreases, the scattering efficiency per particle increases, along with a
substantial red shift and broadening of the plasmon resonance peak as illustrated in
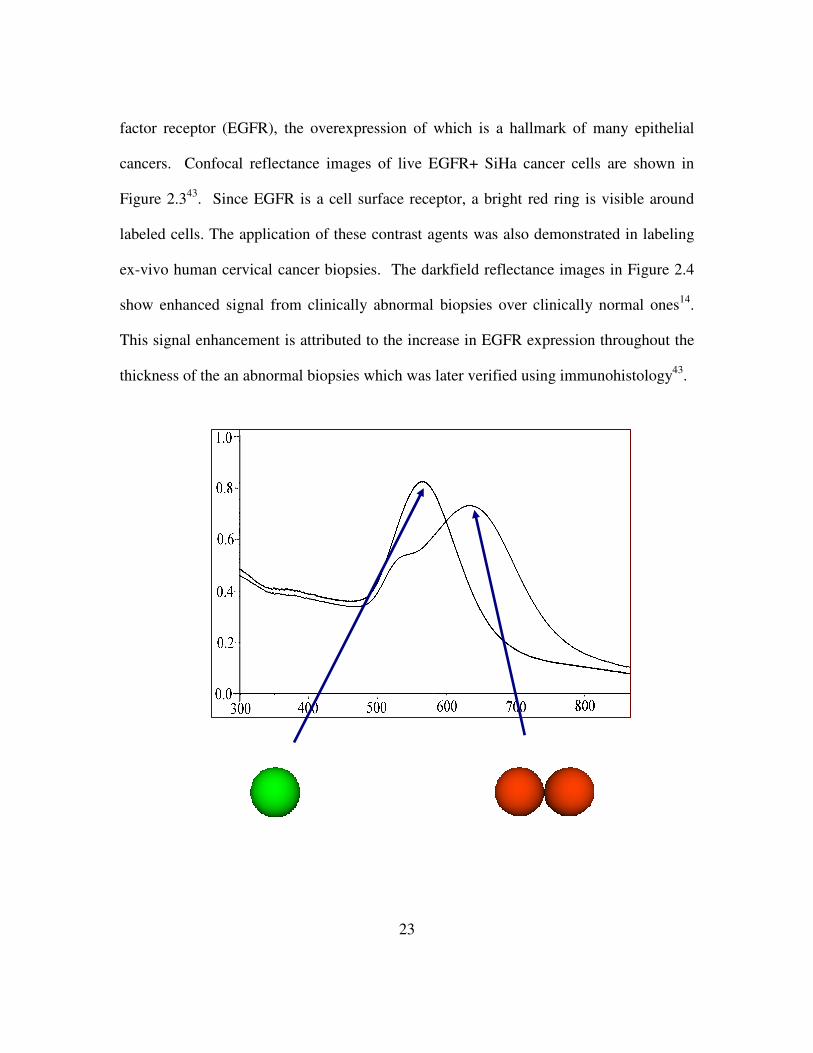
Figure 2.1 and 2.243. Whereas single particles give a single resonance peak that varies
with particle size, aggregates of nanoparticles give a broad red shifted peak as seen in
Figure 2.1. The broadening of the peak is due to peak spitting from resonance shifts in
the perpendicular and parallel orientation. While the perpendicular resonance slightly
blue shifts the resonance peak, the strong overall red shift observed is an effect of the
parallel orientation. Figure 2.2 illustrates the relative dramatic increase in scattering
efficiency per particle. The increase is highly dependant on aggregation size, orientation,
and imaging technique. A description of a squared dependence on scattering on
aggregate is described at Aaron et al and a more thorough treatment is currently under
development8. These properties can be exploited to impart contrast to nanoparticles that
are confined to closely spaced configurations. This effect has led to the development of a
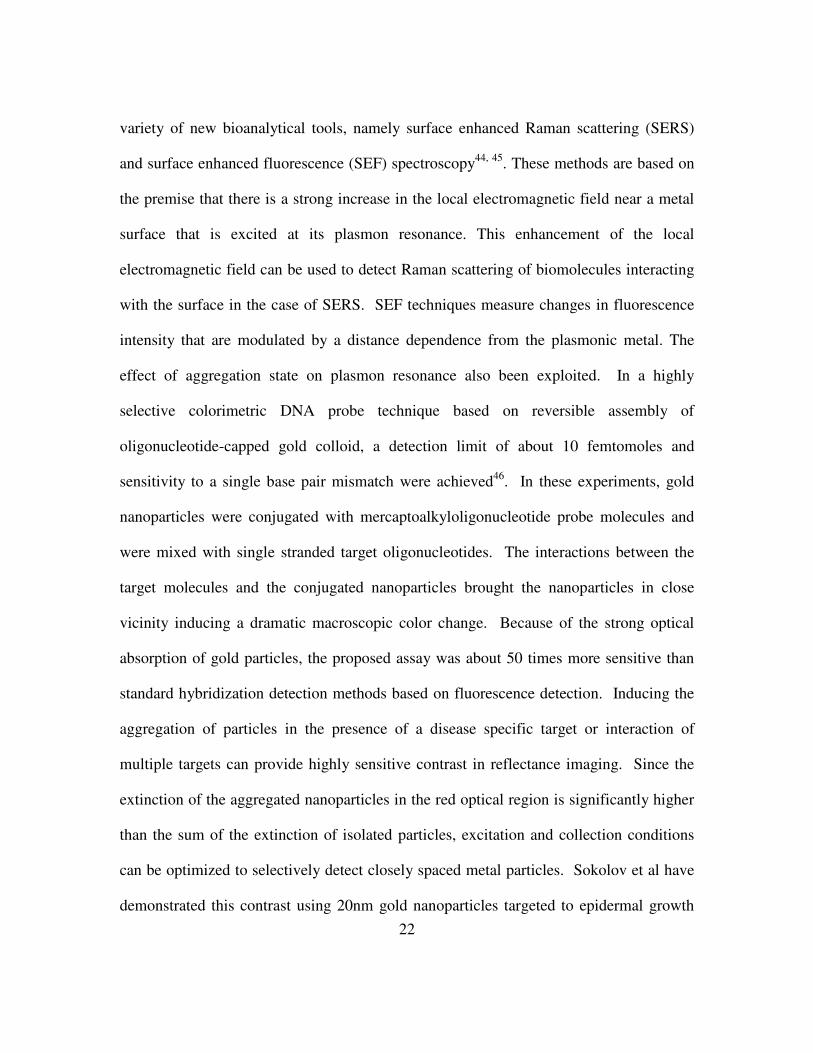
22
variety of new bioanalytical tools, namely surface enhanced Raman scattering (SERS)
and surface enhanced fluorescence (SEF) spectroscopy44, 45. These methods are based on
the premise that there is a strong increase in the local electromagnetic field near a metal
surface that is excited at its plasmon resonance. This enhancement of the local
electromagnetic field can be used to detect Raman scattering of biomolecules interacting
with the surface in the case of SERS. SEF techniques measure changes in fluorescence
intensity that are modulated by a distance dependence from the plasmonic metal. The
effect of aggregation state on plasmon resonance also been exploited. In a highly
selective colorimetric DNA probe technique based on reversible assembly of
oligonucleotide-capped gold colloid, a detection limit of about 10 femtomoles and
sensitivity to a single base pair mismatch were achieved46. In these experiments, gold
nanoparticles were conjugated with mercaptoalkyloligonucleotide probe molecules and
were mixed with single stranded target oligonucleotides. The interactions between the
target molecules and the conjugated nanoparticles brought the nanoparticles in close
vicinity inducing a dramatic macroscopic color change. Because of the strong optical
absorption of gold particles, the proposed assay was about 50 times more sensitive than
standard hybridization detection methods based on fluorescence detection. Inducing the
aggregation of particles in the presence of a disease specific target or interaction of
multiple targets can provide highly sensitive contrast in reflectance imaging. Since the
extinction of the aggregated nanoparticles in the red optical region is significantly higher
than the sum of the extinction of isolated particles, excitation and collection conditions
can be optimized to selectively detect closely spaced metal particles. Sokolov et al have
demonstrated this contrast using 20nm gold nanoparticles targeted to epidermal growth
23
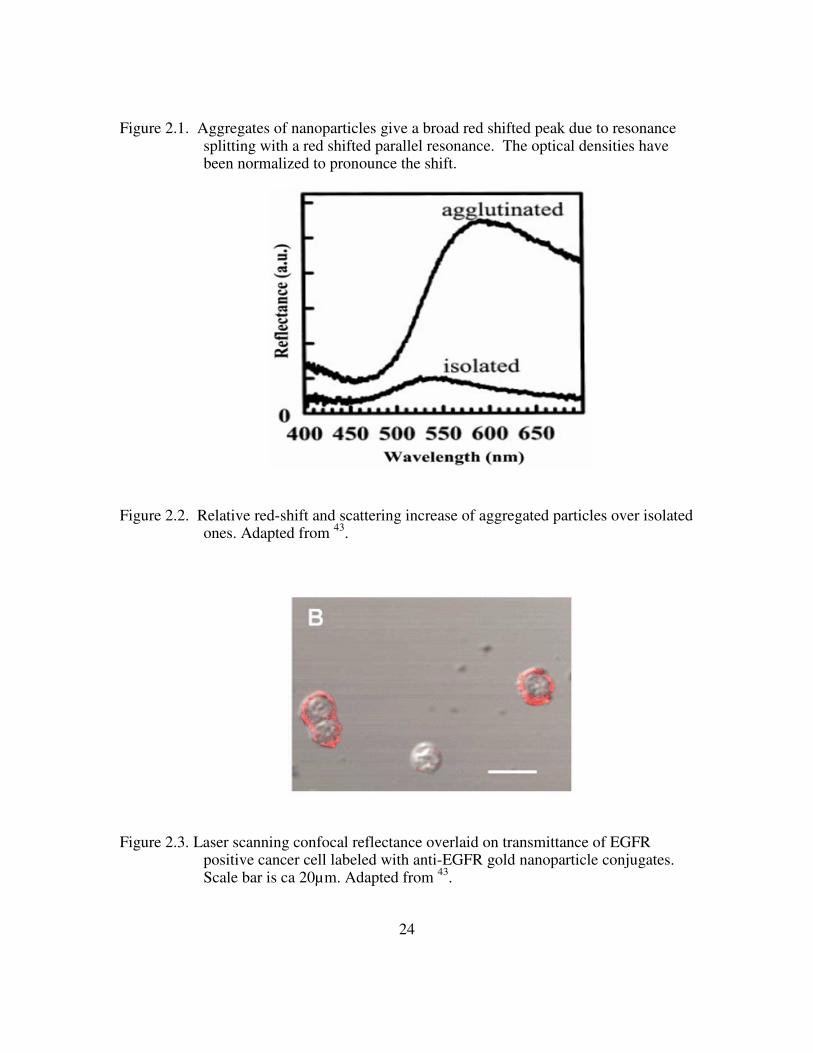
factor receptor (EGFR), the overexpression of which is a hallmark of many epithelial
cancers. Confocal reflectance images of live EGFR+ SiHa cancer cells are shown in
Figure 2.343. Since EGFR is a cell surface receptor, a bright red ring is visible around
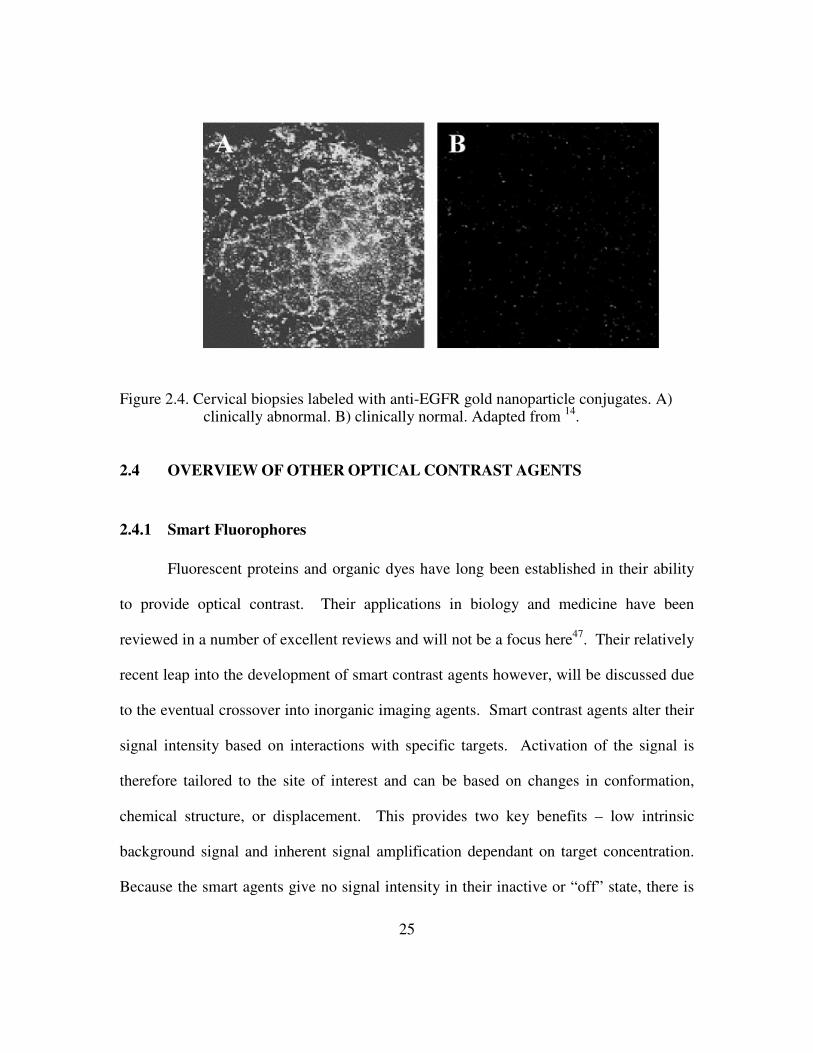
labeled cells. The application of these contrast agents was also demonstrated in labeling
ex-vivo human cervical cancer biopsies. The darkfield reflectance images in Figure 2.4
show enhanced signal from clinically abnormal biopsies over clinically normal ones14.
This signal enhancement is attributed to the increase in EGFR expression throughout the
thickness of the an abnormal biopsies which was later verified using immunohistology43.
24
Figure 2.1. Aggregates of nanoparticles give a broad red shifted peak due to resonance splitting with a red shifted parallel resonance. The optical densities have been normalized to pronounce the shift.
Figure 2.2. Relative red-shift and scattering increase of aggregated particles over isolated ones. Adapted from 43.
Figure 2.3. Laser scanning confocal reflectance overlaid on transmittance of EGFR positive cancer cell labeled with anti-EGFR gold nanoparticle conjugates. Scale bar is ca 20µm. Adapted from 43.
25
Figure 2.4. Cervical biopsies labeled with anti-EGFR gold nanoparticle conjugates. A) clinically abnormal. B) clinically normal. Adapted from 14.
2.4 OVERVIEW OF OTHER OPTICAL CONTRAST AGENTS
2.4.1 Smart Fluorophores
Fluorescent proteins and organic dyes have long been established in their ability
to provide optical contrast. Their applications in biology and medicine have been
reviewed in a number of excellent reviews and will not be a focus here47. Their relatively
recent leap into the development of smart contrast agents however, will be discussed due
to the eventual crossover into inorganic imaging agents. Smart contrast agents alter their
signal intensity based on interactions with specific targets. Activation of the signal is
therefore tailored to the site of interest and can be based on changes in conformation,
chemical structure, or displacement. This provides two key benefits – low intrinsic
background signal and inherent signal amplification dependant on target concentration.
Because the smart agents give no signal intensity in their inactive or “off” state, there is
26
no need to account for signal that has not reached the target. When the site-specific smart
contrast agents are activated or are in the “on” state, the signal intensity will be a function
of target concentration48-50.
The first smart fluorophores, developed by Weissleder et al in 1999, transitioned
from a quenched state to a fluorescent state upon proteolytic activation. They consist of
near infrared (NIR) fluorophores attached to polylysine-polyethylene glycol co-polymers
that could be cleaved by the mouse tumor-associated lysosomal proteinase, cathepsin B50.
A similar cathepsin B targeting peptide linked to Cy 5.5 was used to detect intestinal
adenomas in mouse model of adenomatous polyposis51. Various analogous smart
detection systems have been expanded to other proteinase settings, most notably of
cathepsin D, intracellular proteinases and matrix metalloproteinases (MMPs)52-54. Smart
probes targeting cathepsin D successfully assayed well-differentiated and undifferentiated
mammary tumors in mouse model of human breast cancer54. Intracellular proteinases
such as caspase-3 that are correlated with apoptosis have been detected using caspase-3
cleavable recombinant luciferase fusion proteins53. MMP smart agents were used to
image the reduction of signal in HT1080 fibrosarcoma grafted nude mice after treatment
with MMP inhibitors thus providing a novel approach to monitoring the effectiveness of
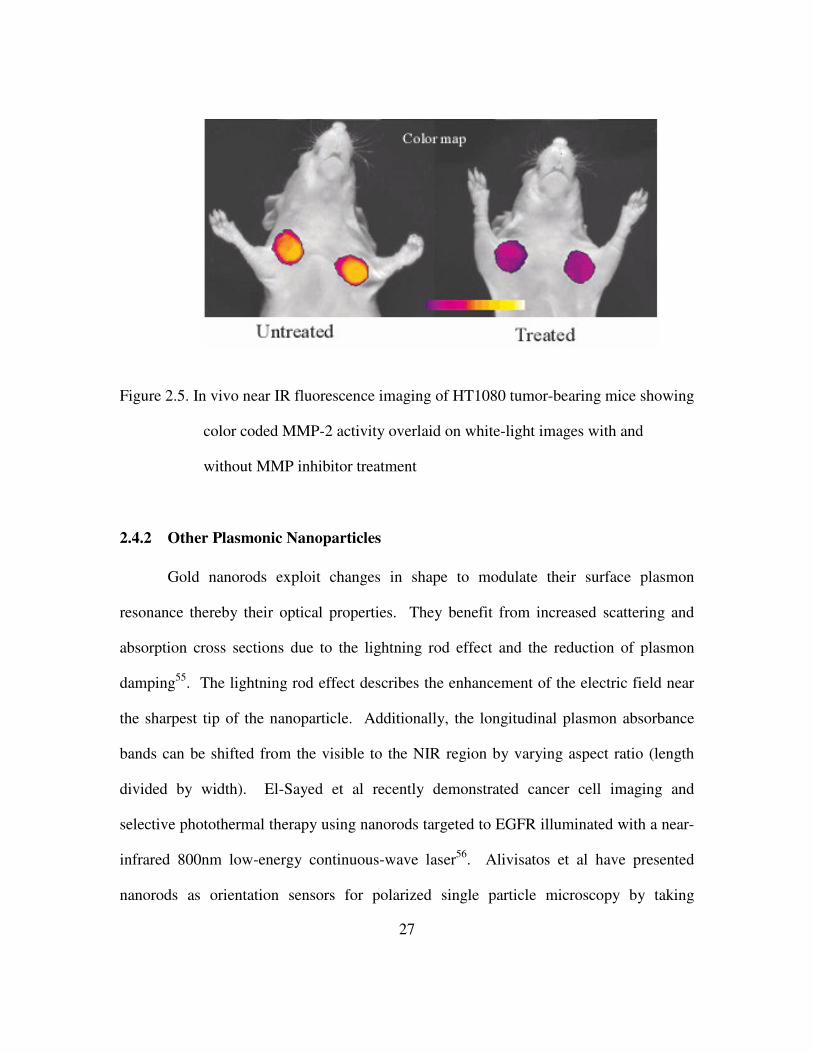
anti-tumor therapies (Fig 2.5)52.
27
Figure 2.5. In vivo near IR fluorescence imaging of HT1080 tumor-bearing mice showing
color coded MMP-2 activity overlaid on white-light images with and
without MMP inhibitor treatment
2.4.2 Other Plasmonic Nanoparticles
Gold nanorods exploit changes in shape to modulate their surface plasmon
resonance thereby their optical properties. They benefit from increased scattering and
absorption cross sections due to the lightning rod effect and the reduction of plasmon
damping55. The lightning rod effect describes the enhancement of the electric field near
the sharpest tip of the nanoparticle. Additionally, the longitudinal plasmon absorbance
bands can be shifted from the visible to the NIR region by varying aspect ratio (length
divided by width). El-Sayed et al recently demonstrated cancer cell imaging and
selective photothermal therapy using nanorods targeted to EGFR illuminated with a near-
infrared 800nm low-energy continuous-wave laser56. Alivisatos et al have presented
nanorods as orientation sensors for polarized single particle microscopy by taking

28
advantage of the fact that scattered light is strongly polarized along the long axis57. Most
recently, Durr et al have demonstrated the use of nanorods in two photon luminescence in
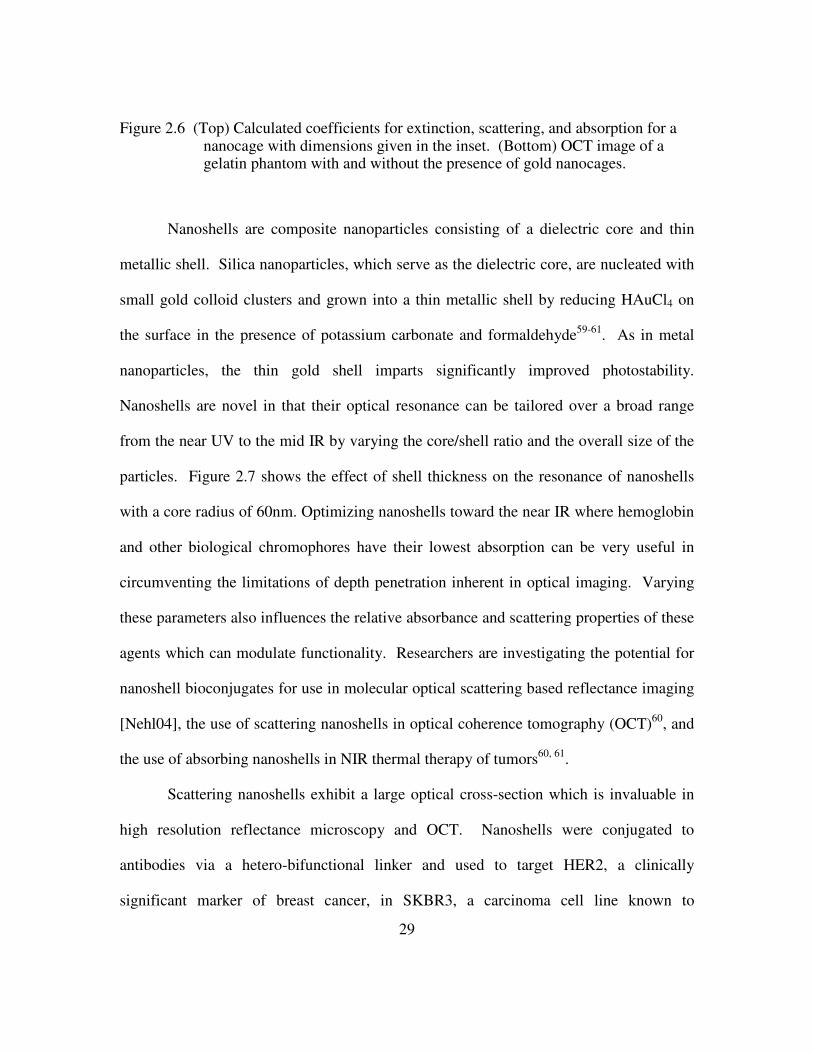
imaging cancer cell phantoms. Metal nanocages (hollow nanostructures with porous
walls) similarly can be tuned to have strong resonance peaks in the NIR by controlling
their dimensions (Fig 2.6) Xia et al have demonstrated their use as contrast agents for
OCT imaging and have successfully targeted breast cancer cells in vitro58.
29
Figure 2.6 (Top) Calculated coefficients for extinction, scattering, and absorption for a nanocage with dimensions given in the inset. (Bottom) OCT image of a gelatin phantom with and without the presence of gold nanocages.
Nanoshells are composite nanoparticles consisting of a dielectric core and thin
metallic shell. Silica nanoparticles, which serve as the dielectric core, are nucleated with
small gold colloid clusters and grown into a thin metallic shell by reducing HAuCl4 on
the surface in the presence of potassium carbonate and formaldehyde59-61. As in metal
nanoparticles, the thin gold shell imparts significantly improved photostability.
Nanoshells are novel in that their optical resonance can be tailored over a broad range
from the near UV to the mid IR by varying the core/shell ratio and the overall size of the
particles. Figure 2.7 shows the effect of shell thickness on the resonance of nanoshells
with a core radius of 60nm. Optimizing nanoshells toward the near IR where hemoglobin
and other biological chromophores have their lowest absorption can be very useful in
circumventing the limitations of depth penetration inherent in optical imaging. Varying
these parameters also influences the relative absorbance and scattering properties of these
agents which can modulate functionality. Researchers are investigating the potential for
nanoshell bioconjugates for use in molecular optical scattering based reflectance imaging
[Nehl04], the use of scattering nanoshells in optical coherence tomography (OCT)60, and
the use of absorbing nanoshells in NIR thermal therapy of tumors60, 61.
Scattering nanoshells exhibit a large optical cross-section which is invaluable in
high resolution reflectance microscopy and OCT. Nanoshells were conjugated to
antibodies via a hetero-bifunctional linker and used to target HER2, a clinically
significant marker of breast cancer, in SKBR3, a carcinoma cell line known to
30
overexpress HER2. Darkfield microscopy showed significantly increased scattering
intensity in targeted labeled HER2 positive cells over non-specific nanoshells as well as
in HER2 negative cell lines. Scattering nanoshells can also be tailored for in vivo
imaging using OCT, an interferometric technique offering cross-sectional images of
optical reflectivity60.
Nanoshells optimized to absorb light can be used to mediate the photothermal
ablations of cancers. The nanoparticle assisted photothermal therapy, or NAPT, has been
demonstrated both in cancer cell lines where HER2-nanoshells effectively ablated human
breast cancer cells (Fig 2.8) and in the live mice inoculated with murine colon carcinoma
tumor cells60, 61. Nanoshells are delivered to the murine tumors via passive extravasation
based on leaky vasculature often found around tumors. Within 10 days of photothermal
treatment in the presence of nanoshells, the tumors were completely resorbed.
Nanoshells are also being designed to simultaneously provide both scattering and
absorption properties at specific frequencies which enables a dual imaging/therapy
approach61, 62.

31
Figure 2.7. The optical scattering of nanoshells as a function of the core/shell ratio.
Adapted from 60.
Figure 2.8. Calcein AM staining of cells indicating viability. Left: cells without
nanoshells exposed to laser light. Middle: cells incubated with nanoshells
but not exposed to laser light. Right: cells incubated with nanoshells after
laser exposure are effectively ablated. Adapted from 60.

32
2.4.3 Quantum Dots
Quantum dots are fluorescent semiconductor nanocrystals that are smaller than
the Bohr exciton radius giving rise to quantum confinement effects. These 2-10nm
nanocrystals fluoresce upon the radiative recombination of an electron-hole pair (exciton)
that is created with the absorption of a photon with energy above the semiconductor band
gap energy. This absorption/recombination process offers favorable optical properties for
quantum dots (qdot). Absorption has an increased probability at higher energies (shorter
wavelengths) and results in a broadband absorption spectrum. Recombination of the
exciton created leads to emission of a photon in a narrow symmetric band defined by the
size and composition of the qdots. The broad absorption spectrum enables the excitation
of multiple sizes of qdots with a single light source while retaining the narrow spectral
emission without overlap63, 64. Often a thin layer of semiconductor material is grown on
top of the core to protect the nanocrystal surface from oxidation and other chemical
reactions. The atomic layer shell also covers surface defects that detract from radiative
recombination and can increase the fluorescent quantum yield to >90% efficiency,
comparable to fluorescent dyes. The protective shell also improves the qdot’s
photostability which is a vast improvement over organic dyes. Other benefits of
semiconductor qdots over traditional fluorophores include long luminescent lifetimes,
resistance to photobleaching and improved brightness due to extinction coefficients that
are on an order of magnitude larger than most dyes. The relatively large extinction
coefficient allows sensitivity limits down to one qdot per target molecule which can be
utilized to perform nanometer resolution confocal microscopy21.
33
Qdots have been imaged in a number of biologically and clinically relevant
studies. Single qdot trajectories have been followed laterally in cell membranes targeting
glycine receptors as well as in internalization into phagokinetic human cancer cells65
[Parak0]. Biotinylated epidermal growth factor (EGF) has been used in conjunction with
commercially available streptavidin qdots to study receptor tyrosine kinase (RTK)
dependant signal transduction in various cancer cell lines66. Streptavidin qdots have also
been used to detect HER2 in SKBR2 breast cancer cells via biotinylated secondary
human antibody and primary anti-HER2 antibody67. Ackerman et al use peptides to
target intravenously injected qdots to specific vascular markers and Ballou et al have
shown that coating qdots with PEG improves circulating lifetimes and reduces
accumulation in the liver and bone marrow68, 69. Gao et al have developed qdots with
triblock polymers to incorporate tumor-targeting ligands and PEG molecules in targeting
human prostate cancers grafted in nude mice70. Using either subcutaneous injection or
systemic injection, these qdots accumulate at the tumors via passive enhanced
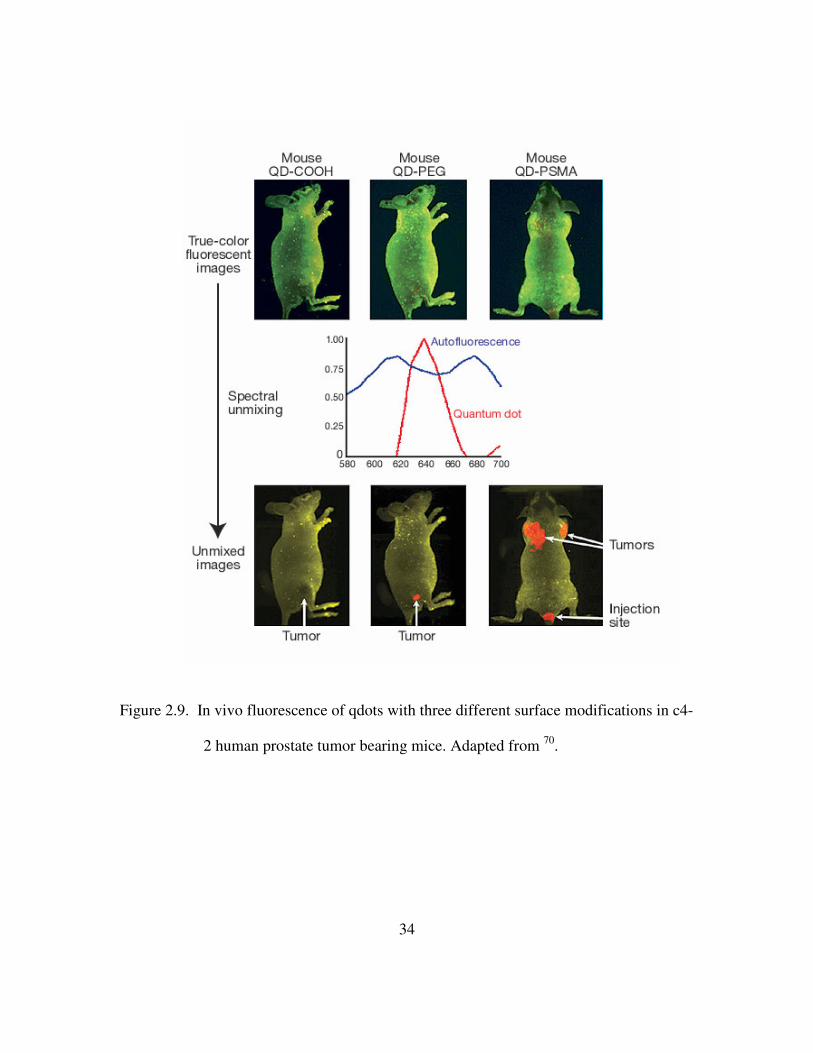
permeability at tumor sites and active targeting to cancer biomarkers70. True color
fluorescent images of mice injected with quantum dots with varying surface coatings are
shown in Figure 2.9. Kim et al have used near IR qdots to guide real-time resection of
sentinel lymph nodes71. The qdots are coated with polydentate phosphine coating to
improve stability and injected intradermally into live mice and pigs which then migrate
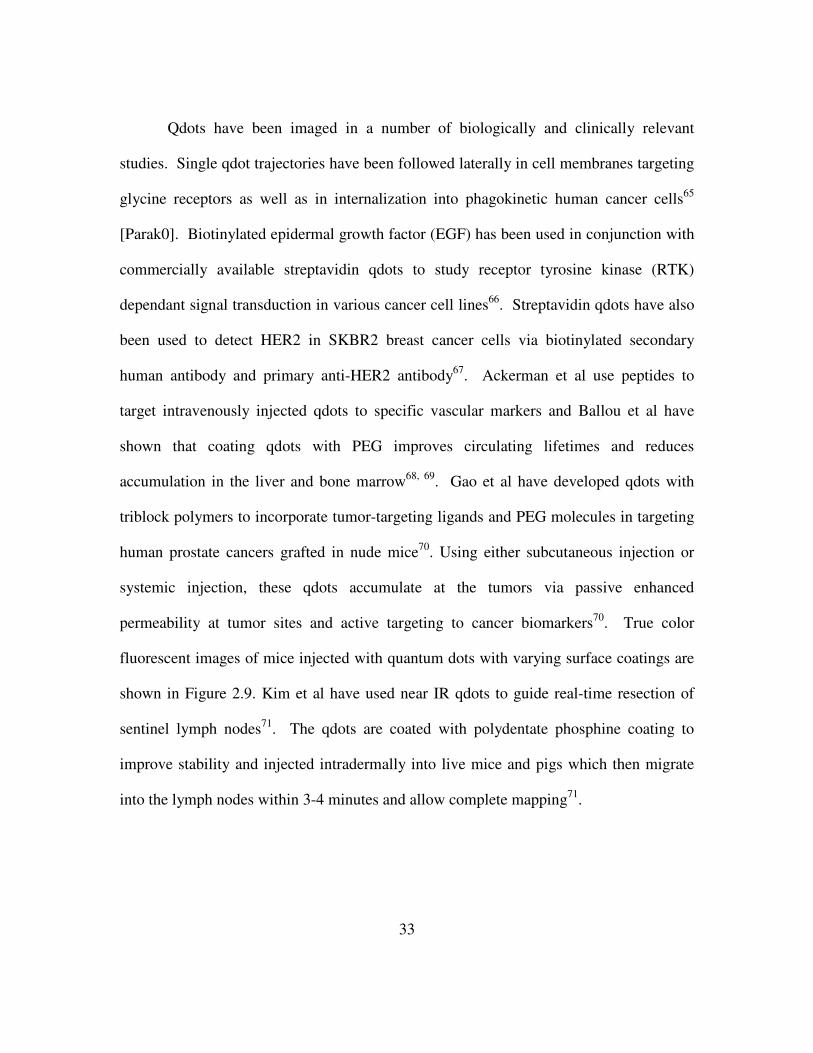
into the lymph nodes within 3-4 minutes and allow complete mapping71.
34
Figure 2.9. In vivo fluorescence of qdots with three different surface modifications in c4-
2 human prostate tumor bearing mice. Adapted from 70.
35
Chapter 3: Development of a Multifunctional Contrast Agent
A novel conjugation technique was developed to directionally attach antibodies to
gold nanoparticles to maximize antibody functionality. Directional attachment serves to
both decrease the amount of antibody needed for conjugation and affords control over the
relative amounts of multiple antibody solutions conjugated to the surface. This was
exploited to prepare multifunctional nanoparticles by incorporating targeting and delivery
moieties on the same nanoparticle which addresses the challenge of imaging intracellular
biomarkers. This chapter briefly describes the evolution of the contrast agent and then
details the final conjugation protocol. The results of various characterization assays are
then presented.
3.1 MULTIFUNCTIONAL CONTRAST AGENT
The following sections detail the considerations taken into account when
designing each component of the contrast agent.
Imaging Agent: Gold nanoparticles were chosen as the contrast agent for several
reasons. Beyond their biocompatibility and relatively easy synthesis, gold nanoparticles
also have well known surface chemistries and exhibit non-linear scattering properties.
The color change associated with the target specific aggregation of gold nanoparticles can
be detected by eye or a simple RGB camera under white light illumination. The non-
linear scattering properties of gold nanoparticles are well suited to the imaging
intracellular targets since unbound particles do not provide significant background and do
not need to be removed to enhance signal to noise. The size of the gold nanoparticle used

36
was a balance between signal intensity, projected ease of penetration into the cell, surface
area available for conjugating functional proteins, and minimizing steric hindrance upon
binding to the target. The intensity has a 6th dependence on particle radius meaning that a
40nm particle scatters 64 times more intensely than a 20nm gold nanoparticle. The
increase in intensity dictates that the largest particle size possible should be used.
Likewise, the increase in surface area available to attach antibodies also promotes the use
of a larger nanoparticle. The increased surface area can potentially increase the space for
additional or multiple types of antibodies, increase the space between antibodies to
minimize steric hindrance, or a combination of the both of these factors. For the
detection of intracellular targets, however, the limiting factor is delivery through the cell
membrane and mobility in the cytoplasm. In order to optimize the size parameter, gold
nanoparticles with diameters between 16-30nm were assessed for their ability to
penetrate the cell membrane and label an intracellular maker. This size range was chosen
based on previous studies of gold nanoparticle delivery into cultured cells72, 73. It should
be noted that the targeting and delivery functionalities on the particle increased the
effective diameter of the gold nanoparticle but was assumed to be the same for each
contrast agent formulation. This assumption was based on the fact that both targeting and
delivery was based on antibodies and that a single layer of antibodies was present on the
nanoparticle surface. The effective diameter of the nanoparticle therefore was assumed
to increase by the same amount for contrast agents with varying particle sizes. Using
conservative estimates for antibody and linker size, this increase was assumed to be on
the order of 10nm. Dynamic light scattering measurements should be used in further
analysis to verify this assumption. Particles with diameters between 18-20nm were found
37
to label intracellular markers while still retaining signal intensity that was more than
sufficient for imaging. This finding, while suitable for demonstrating the feasibility of
gold nanoparticle based contrast agents, is based on purely observation and is currently
being verified quantitatively by the Sokolov lab.
Conjugation Method: Colloidal solutions of gold nanoparticles prepared using
the Turkevich/Frens methods remain suspended in aqueous solution through the
electrostatic repulsion of a thin layer of citrate ions surrounding each nanoparticle37. The
stability of these suspensions can be crudely evaluated by the aggregation of unstabilized
nanoparticles in the presence of 10% NaCl. The sodium and chloride ions disrupt the
charge separation between particles and cause the gold nanoparticle to attract rather than
repel one another, thereby leading to aggregation. This aggregation can be interrogated
with changes in optical density measured with a spectrophotometer41, 42. The optical
density is interrogated at wavelengths that are red-shifted from the expected scattering
resonance of isolated particles. For example, the resonant scattering peaks for isolated
20nm gold nanoparticles occur at ~525nm. The aggregation state for these nanoparticles
can be assayed by measuring the scattering at 575nm. Since an aggregated solution will
red-shift and increase the scattering peak, the optical density at 575nm should increase
with aggregation. The colloidal aggregation caused by instability can also be assayed
visually – aggregation changes a ~20nm gold colloid from a characteristic orange-red to
blue-gray. These colors are associated with the multiple scattering and absorbance found
in colloid suspensions.
The functionalization of the gold nanoparticles is based on substituting the citrate
layer on the nanoparticle for the protein of interest. The protein then serves both to

38
flocculate the nanoparticle to impart stability as well have its intended function. The
direct physisorption of protein on the nanoparticle surface is the most established method
to functionalize gold nanoparticles and was first described by Horisberger and
Geohaegan et al in the early 1970’s41, 42. This method relies on the surface charge based
absorption of protein to the gold colloid at the protein’s isoelectric point (pI). The
interaction is primarily through the primary amines present on the antibody which react
with the exposed gold atoms on the surface of the nanoparticle41. The optimal
concentration of protein necessary to stabilize the gold is determined by exposing the
gold to increasing concentrations of the protein and assaying the resulting conjugate for
aggregation. Although physisorbed conjugates produced by this method are stable in the
presence of a 10%NaCl solution and labeling was achieved for extracellular membrane
targets, there were several drawbacks to this approach. First, a huge excess of protein is
necessary to stabilize the nanoparticles (roughly 100µg of protein per 1ml of gold
nanoparticles (1012 particles/ml)) in order to drive the absorption to completion. Second,
since the antibodies were attached via weak amine-gold interactions, the contrast agent
was not stable in the presence of other proteins. This led to aggregation in the presence
of solutions, such as cell culture media, routinely used in biological assays. The
successful labeling of extracellular targets mentioned earlier was done in the presence of
phosphate buffered saline, PBS.
In order to use these contrast agents for intracellular targeting where interaction
with biological proteins cannot be avoided, a new linker-based conjugation protocol was
implemented to remove any instability for the conjugate. Stronger, near covalent
strategies were employed to more rigidly attach the antibody to the gold nanoparticle.
39
This allowed for any potential “bare” patches on the nanoparticle to be filled with a
protein rejecting, hydrophilic polyethylene glycol, PEG, layer without the threat of
replacing the targeting moiety. The targeting antibody was first tethered to a linker
segment orthopyridyldisulfide-polyethyleneglycol-N-hydroxysuccinimide, OPSS-PEG-
NHS (Shearwater Inc, 2000MW), via succinimidyl ester chemistry to link the NHS
segment to primary amines on the antibody surface. The antibody-linker complex was
then attached to gold nanoparticles via the thiol-gold interaction. Methylated PEG-SH
(Shearwater Inc, 5000MW) was then added to improve the biocompatibility of the
conjugate as well as introduce a hydrophilic, protein rejecting layer to reduce non-
specific interactions. This method afforded several advantages over direct physisorption.
The amount of antibody required to stabilize the gold nanoparticles was reduced by half
thereby reducing the cost of the conjugate and non-specific aggregation in the presence of
other proteins were drastically decreased. The conjugate remained suspended in solution
in the presence of both 10% NaCl and cell culture medium. The instability of the linker in
water prior to conjugation, however, made the process fickle. The NHS portion of the
linker spontaneously hydrolyzed when exposed to moisture from the atmosphere and was
rendered unreactive to primary amines. The final conjugation strategy makes use of a
linker which is stable in aqueous solutions and additionally provides directional
attachment of the targeting antibody. Directional attachment is accomplished by
attaching a heterofunctional linker to the Fc, non-targeting, portion of a glycosylated
antibody thereby freeing the Fab, or antigen binding, portion unhindered. The active Fab
portions are directed outward from the contrast agent and are therefore available for
targeting. The heterofunctional linker consists of an amide-bonded adipic hydrazide and
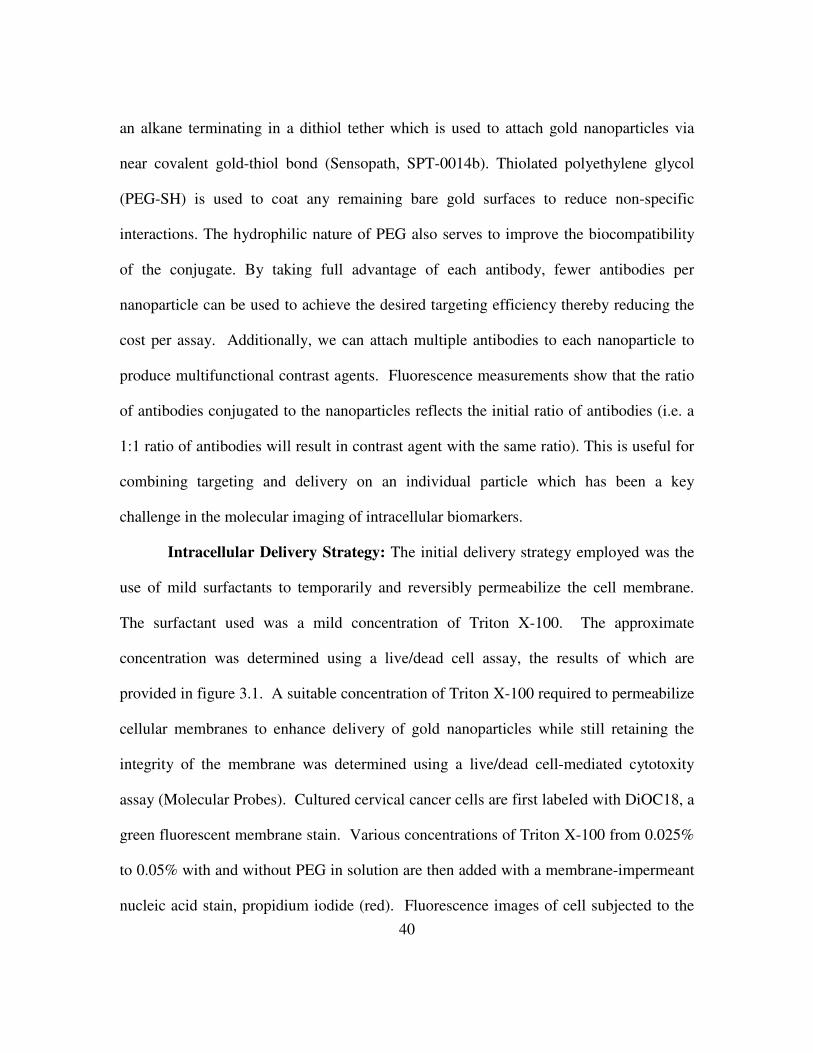
40
an alkane terminating in a dithiol tether which is used to attach gold nanoparticles via
near covalent gold-thiol bond (Sensopath, SPT-0014b). Thiolated polyethylene glycol
(PEG-SH) is used to coat any remaining bare gold surfaces to reduce non-specific
interactions. The hydrophilic nature of PEG also serves to improve the biocompatibility
of the conjugate. By taking full advantage of each antibody, fewer antibodies per
nanoparticle can be used to achieve the desired targeting efficiency thereby reducing the
cost per assay. Additionally, we can attach multiple antibodies to each nanoparticle to
produce multifunctional contrast agents. Fluorescence measurements show that the ratio
of antibodies conjugated to the nanoparticles reflects the initial ratio of antibodies (i.e. a
1:1 ratio of antibodies will result in contrast agent with the same ratio). This is useful for
combining targeting and delivery on an individual particle which has been a key
challenge in the molecular imaging of intracellular biomarkers.
Intracellular Delivery Strategy: The initial delivery strategy employed was the
use of mild surfactants to temporarily and reversibly permeabilize the cell membrane.
The surfactant used was a mild concentration of Triton X-100. The approximate
concentration was determined using a live/dead cell assay, the results of which are
provided in figure 3.1. A suitable concentration of Triton X-100 required to permeabilize
cellular membranes to enhance delivery of gold nanoparticles while still retaining the
integrity of the membrane was determined using a live/dead cell-mediated cytotoxity
assay (Molecular Probes). Cultured cervical cancer cells are first labeled with DiOC18, a
green fluorescent membrane stain. Various concentrations of Triton X-100 from 0.025%
to 0.05% with and without PEG in solution are then added with a membrane-impermeant
nucleic acid stain, propidium iodide (red). Fluorescence images of cell subjected to the
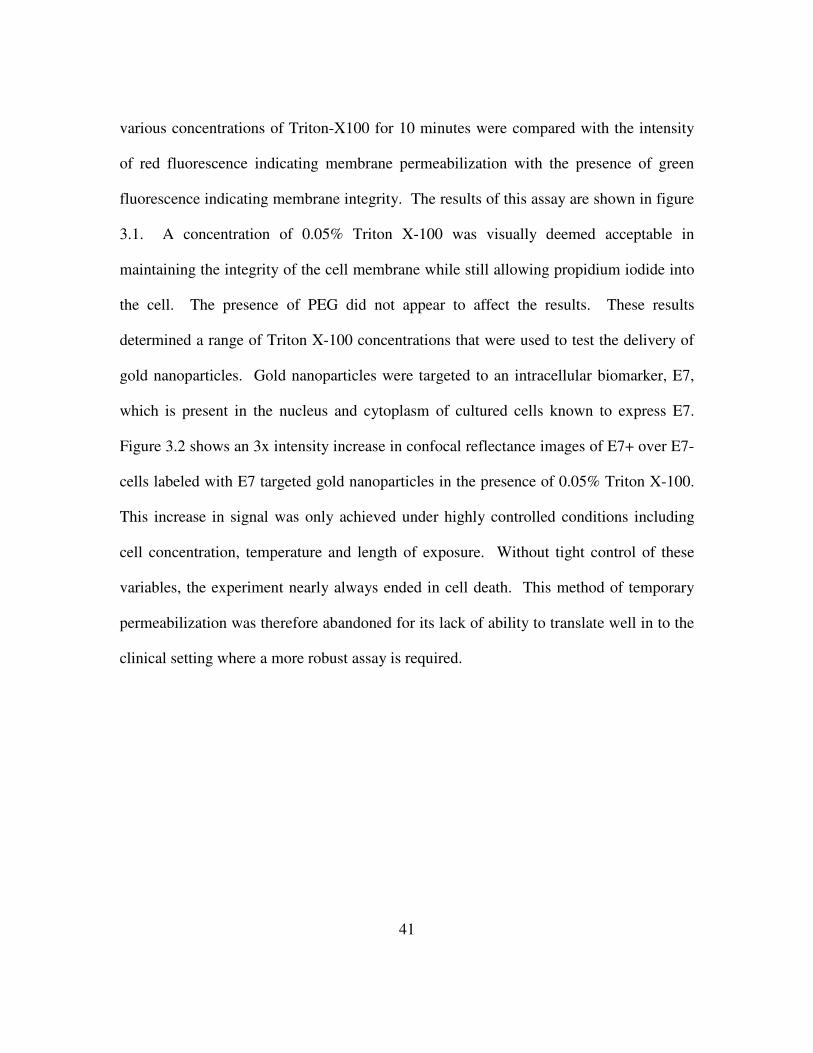
41
various concentrations of Triton-X100 for 10 minutes were compared with the intensity
of red fluorescence indicating membrane permeabilization with the presence of green
fluorescence indicating membrane integrity. The results of this assay are shown in figure
3.1. A concentration of 0.05% Triton X-100 was visually deemed acceptable in
maintaining the integrity of the cell membrane while still allowing propidium iodide into
the cell. The presence of PEG did not appear to affect the results. These results
determined a range of Triton X-100 concentrations that were used to test the delivery of
gold nanoparticles. Gold nanoparticles were targeted to an intracellular biomarker, E7,
which is present in the nucleus and cytoplasm of cultured cells known to express E7.
Figure 3.2 shows an 3x intensity increase in confocal reflectance images of E7+ over E7-
cells labeled with E7 targeted gold nanoparticles in the presence of 0.05% Triton X-100.
This increase in signal was only achieved under highly controlled conditions including
cell concentration, temperature and length of exposure. Without tight control of these
variables, the experiment nearly always ended in cell death. This method of temporary
permeabilization was therefore abandoned for its lack of ability to translate well in to the
clinical setting where a more robust assay is required.
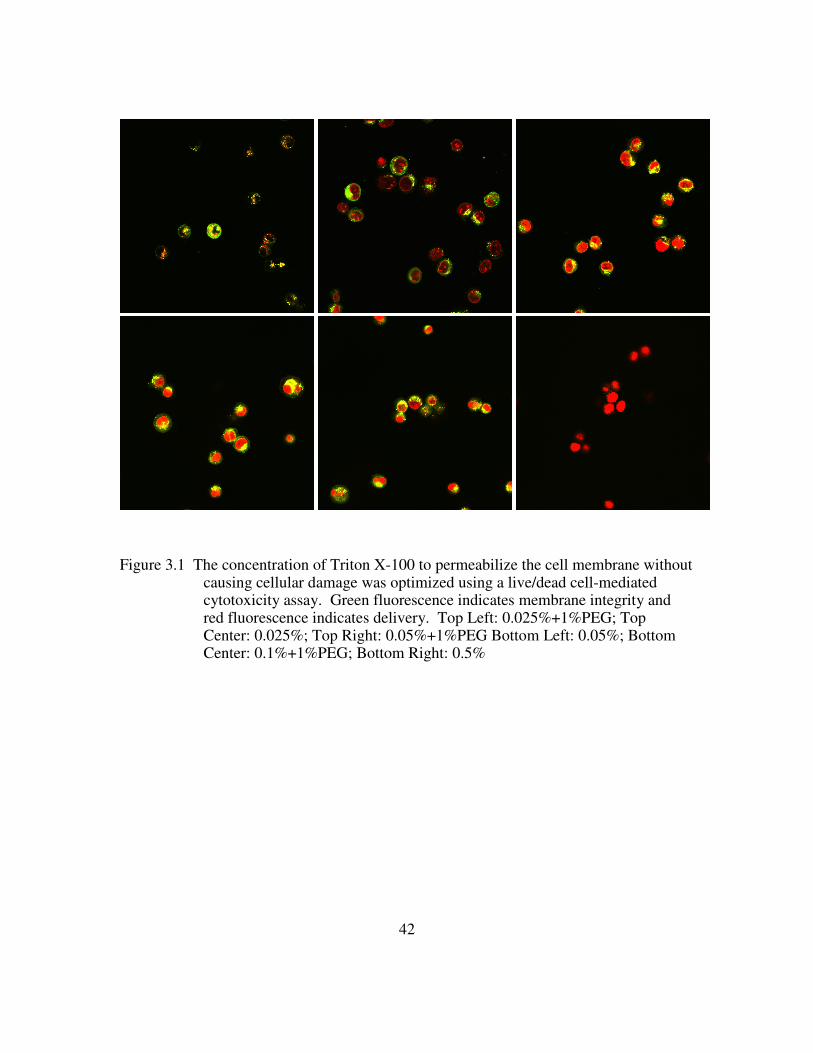
42
Figure 3.1 The concentration of Triton X-100 to permeabilize the cell membrane without causing cellular damage was optimized using a live/dead cell-mediated cytotoxicity assay. Green fluorescence indicates membrane integrity and red fluorescence indicates delivery. Top Left: 0.025%+1%PEG; Top Center: 0.025%; Top Right: 0.05%+1%PEG Bottom Left: 0.05%; Bottom Center: 0.1%+1%PEG; Bottom Right: 0.5%

43
Figure 3.2 A 3x increase in signal intensity is obtained for E7+ cells (top) over E7- cells (bottom) when labeled with E7 targeted gold nanoparticles in the presence of Triton X-100.
The protein transduction domain, TAT, was employed to reduce cytotoxicity and
improve reproducibility. Several papers have been written on the successful use of the
TAT peptide is delivering gold nanoparticles in to both the cytoplasm and the nucleus of
cultured cells72-76. The effectiveness of the TAT peptide in delivering gold conjugates
into the cytoplasm was tested by labeling actin in living cells. Gold nanoparticles, 20nm,
were conjugated in a 1:1 ratio of anti-actin antibodies (Sigma Aldrich) and anti-biotin
antibodies (Jackson ImmunoResearch, Inc). The anti-biotin antibody was used to attach a
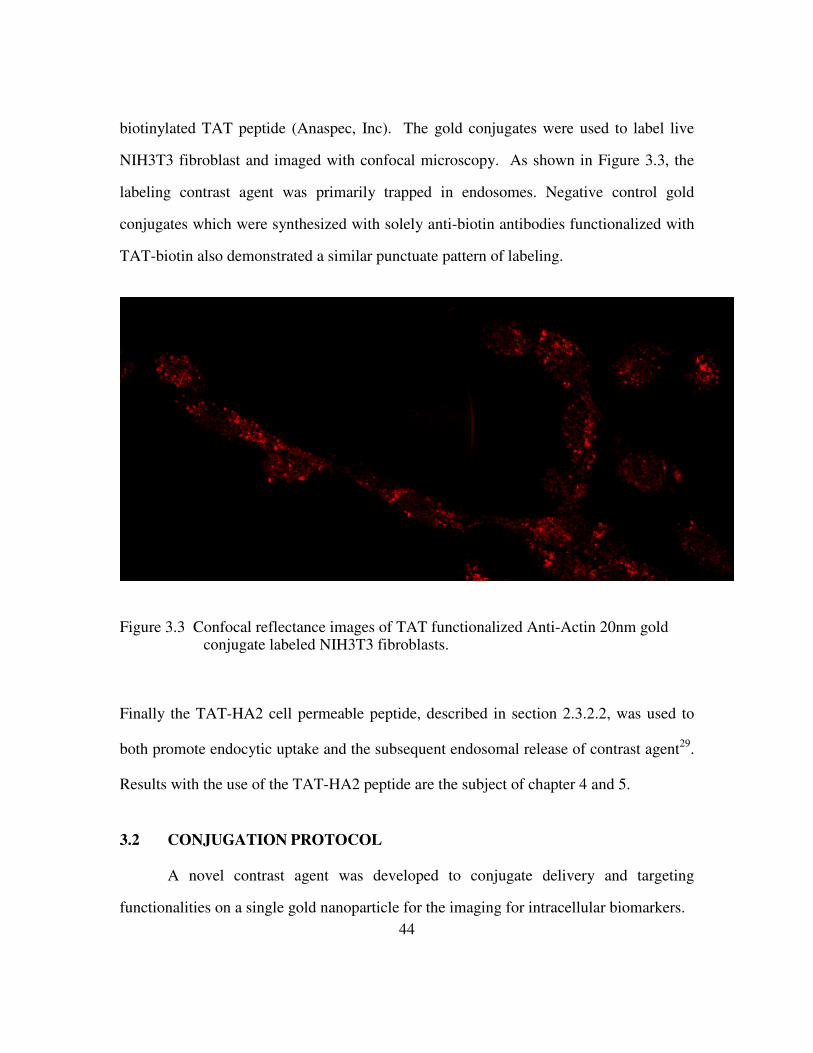
44
biotinylated TAT peptide (Anaspec, Inc). The gold conjugates were used to label live
NIH3T3 fibroblast and imaged with confocal microscopy. As shown in Figure 3.3, the
labeling contrast agent was primarily trapped in endosomes. Negative control gold
conjugates which were synthesized with solely anti-biotin antibodies functionalized with
TAT-biotin also demonstrated a similar punctuate pattern of labeling.
Figure 3.3 Confocal reflectance images of TAT functionalized Anti-Actin 20nm gold conjugate labeled NIH3T3 fibroblasts.
Finally the TAT-HA2 cell permeable peptide, described in section 2.3.2.2, was used to
both promote endocytic uptake and the subsequent endosomal release of contrast agent29.
Results with the use of the TAT-HA2 peptide are the subject of chapter 4 and 5.
3.2 CONJUGATION PROTOCOL
A novel contrast agent was developed to conjugate delivery and targeting
functionalities on a single gold nanoparticle for the imaging for intracellular biomarkers.
45
3.2.1 Materials
Aqua regia - Mix concentrated HCl:HNO3 in a 3:1 ratio in large beaker in the fume hood.
CAUTION: Wear goggles and gloves when working with aqua regia and perform the
experiment in a fume hood. Aqua regia should be prepared fresh and should never be
stored in a closed vessel.
12.7mM chloroauric acid solution – Dissolve 5mg Gold (III) Chloride trihydrate (Sigma,
Cat No. G4022) in 1ml of DIUF H2O
38.8mM trisodium citrate solution – Dissolve 22.8mg Sodium Citrate (Fisher, Cat No.
S279) in 2ml of DIUF H2O
Monoclonal glycosylated targeting antibody
Monoclonal mouse glycosylated anti-biotin antibody (Jackson ImmunoResearch)
100mM Sodium Phosphate, ph~7.5 (Sigma, Cat No. 342483)
Sodium Periodate (Sigma, Cat No. 311448)
Purpald solution – 10mg/ml Purpald (Sigma, Cat No. 162892) dissolved in 1N NaOH
(Fisher, Cat No. S318), prepared fresh
46.5mM linker solution– Dissolve 33mg Dithiolaromatic PEG6-CONHNH2 (SensoPath
Technologies, Cat No. SPT-0014B) in 1ml of deionized, ultra-filtered (DIUF)
H2O. This concentration can be approximated since it is in way excess of the
antibody concentration.
40nM HEPES buffer, pH~8.5 (Fisher, Cat No. BP310)
mPEG-thiol solution – 10-5 M 5000MW (Shearwater Polymers)
2% Polyethylene Glycol (PEG) compound in 1x PBS (Sigma, Cat No. P2263)
7.1µM biotinylated delivery peptide solution – Dissolve 5mg TAT-HA2 (custom made,
46
Anaspec, Inc) in 1ml of DIUF H2O. This concentration can be approximated since
it is in way excess of the anti-biotin antibody concentration.
3.2.2 Procedure
3.2.2.1 Gold Nanoparticle Preparation
1 Add 1ml of 12.7mM chloroauric acid solution to 49ml of DIUF H2O in a clean
100ml two-necked glass flask with stir bar. Attach a reflux column to one neck of
the flask and a rubber stopper on the other neck. Place the entire apparatus on a
hot plate and bring to a boil while stirring.
2 Add X ml of 38.8mM trisodium citrate solution where X depends on the desired
nanoparticle size (See Figure 3.4). The theoretical curve presented in figure 3.4
shows the effect of the volume of trisodium citrate on the nanoparticle size. Upon
addition of trisodium citrate, the color of the solution will change to blue in ~30
seconds and then to red in another ~150 seconds. The color change during
synthesis is attributed to the reduction in size of gold nanoparticles as the citrate
ions reduce gold (III)37. Continue to boil for 5 minutes and the cool to room
temperature while stirring. This procedure produces 50ml of highly spherical
monodisperse gold nanoparticles which can be verified by transmission electron
microscopy.
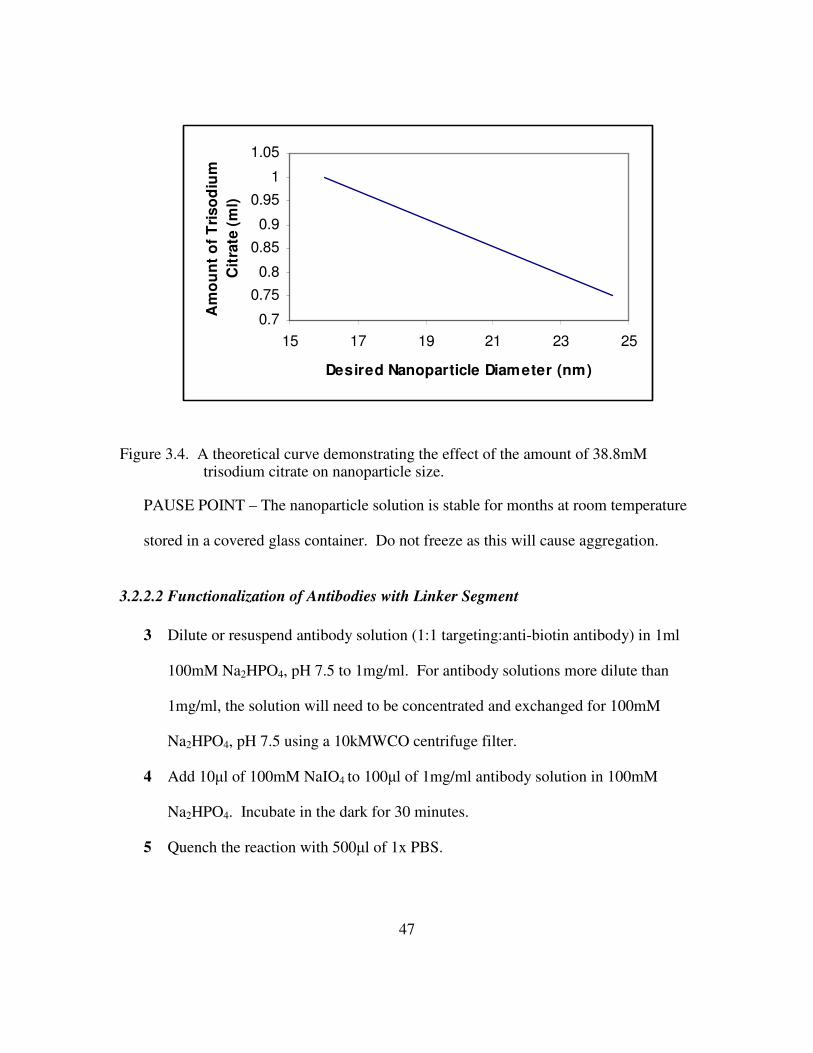
47
0.7
0.75
0.8
0.85
0.9
0.95
1
1.05
15 17 19 21 23 25
Desired Nanoparticle Diameter (nm)
Am
ou
nt
of
Tri
so
diu
m
Cit
rate
(m
l)
Figure 3.4. A theoretical curve demonstrating the effect of the amount of 38.8mM trisodium citrate on nanoparticle size.
PAUSE POINT – The nanoparticle solution is stable for months at room temperature
stored in a covered glass container. Do not freeze as this will cause aggregation.
3.2.2.2 Functionalization of Antibodies with Linker Segment
3 Dilute or resuspend antibody solution (1:1 targeting:anti-biotin antibody) in 1ml
100mM Na2HPO4, pH 7.5 to 1mg/ml. For antibody solutions more dilute than
1mg/ml, the solution will need to be concentrated and exchanged for 100mM
Na2HPO4, pH 7.5 using a 10kMWCO centrifuge filter.
4 Add 10µl of 100mM NaIO4 to 100µl of 1mg/ml antibody solution in 100mM
Na2HPO4. Incubate in the dark for 30 minutes.
5 Quench the reaction with 500µl of 1x PBS.

48
6 To verify the oxidation of the carbohydrate, mix 20µl of the antibody solution to
60µl of freshly prepared Purpald solution. The color of the solution should turn
purple in a few minutes to indicate the presence of aldehydes.
7 Add 2µl of 46.5mM linker solution to the antibody solution and incubate for 30
minutes.
8 Add the entire volume to a 10kMWCO centrifuge filter along with 1 ml of 40mM
HEPES solution and filter until roughly 75% of the solution has passed through
the filter. Resuspend the retained solution in 40mM HEPES solution to a final
volume of 1ml.
PAUSE POINT – The antibody-linker solution can be kept 4ºC for the recommended
storage time for the specific antibody. The linker will not affect the stability of the
antibody.
3.2.2.3 Conjugation to Gold Nanoparticles
9 Combine 100µl of antibody-linker solution (100µg/ml) to 1ml of Au solution.
Incubate for 20 minutes. A rotator can be used to aid in mixing.
10 Add 100µl 10-5M mPEG-SH. Incubate for 20 minutes. A rotator can be used to
aid in mixing.
11 Dilute 2µl of the 7.1µM biotinylated TAT-HA2 solution in 100µl of 2% PEG
solution. Add the entire volume to the contrast agent solution.
12 Centrifuge for 30 minutes at 2500g. Discard supernatant (may remain slightly
pink) and resuspend the fluid pellet to the desired concentration in a 2% PEG
solution in 1x PBS.

49
The final solution will be in orange-red in color and will consist of gold nanoparticles
functionalized with a targeting antibody, PEG to reduce non-specific binding, and an
anti-biotin antibody with a conjugated biotinylated delivery peptide. A cartoon schematic
of the conjugation procedure is presented in Figure 3.5. The optical density of the final
solution should be measured to interrogate the aggregation of the solution. Gross
changes in aggregation will cause a color shift from red to blue-gray when resuspended in
1x PBS , a change that is visible by eye. UV-Vis measurements were performed to verify
the visual assessment.
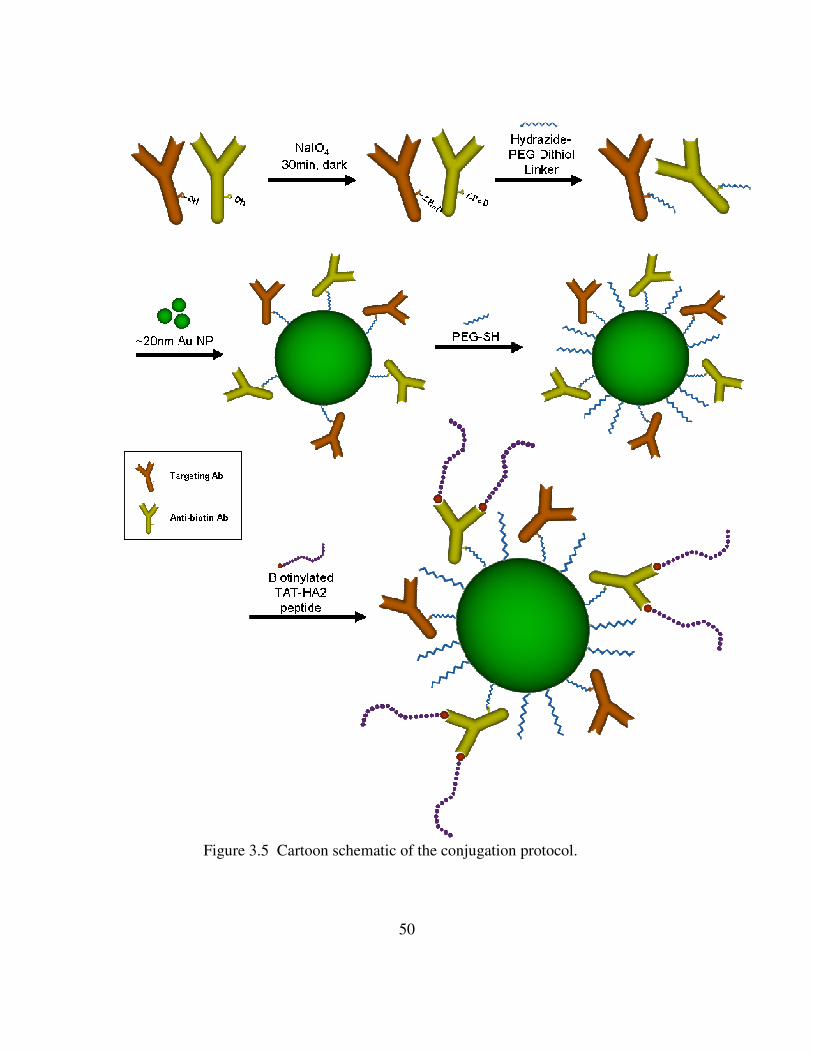
50
Figure 3.5 Cartoon schematic of the conjugation protocol.
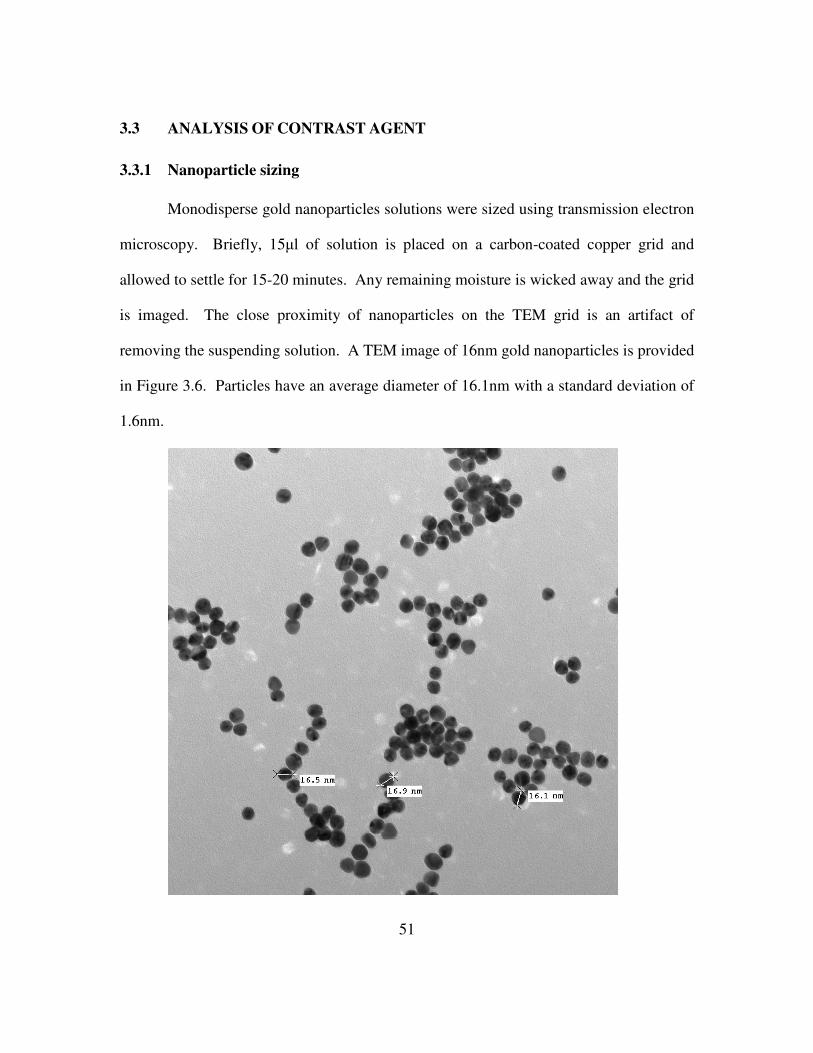
51
3.3 ANALYSIS OF CONTRAST AGENT
3.3.1 Nanoparticle sizing
Monodisperse gold nanoparticles solutions were sized using transmission electron
microscopy. Briefly, 15µl of solution is placed on a carbon-coated copper grid and
allowed to settle for 15-20 minutes. Any remaining moisture is wicked away and the grid
is imaged. The close proximity of nanoparticles on the TEM grid is an artifact of
removing the suspending solution. A TEM image of 16nm gold nanoparticles is provided
in Figure 3.6. Particles have an average diameter of 16.1nm with a standard deviation of
1.6nm.
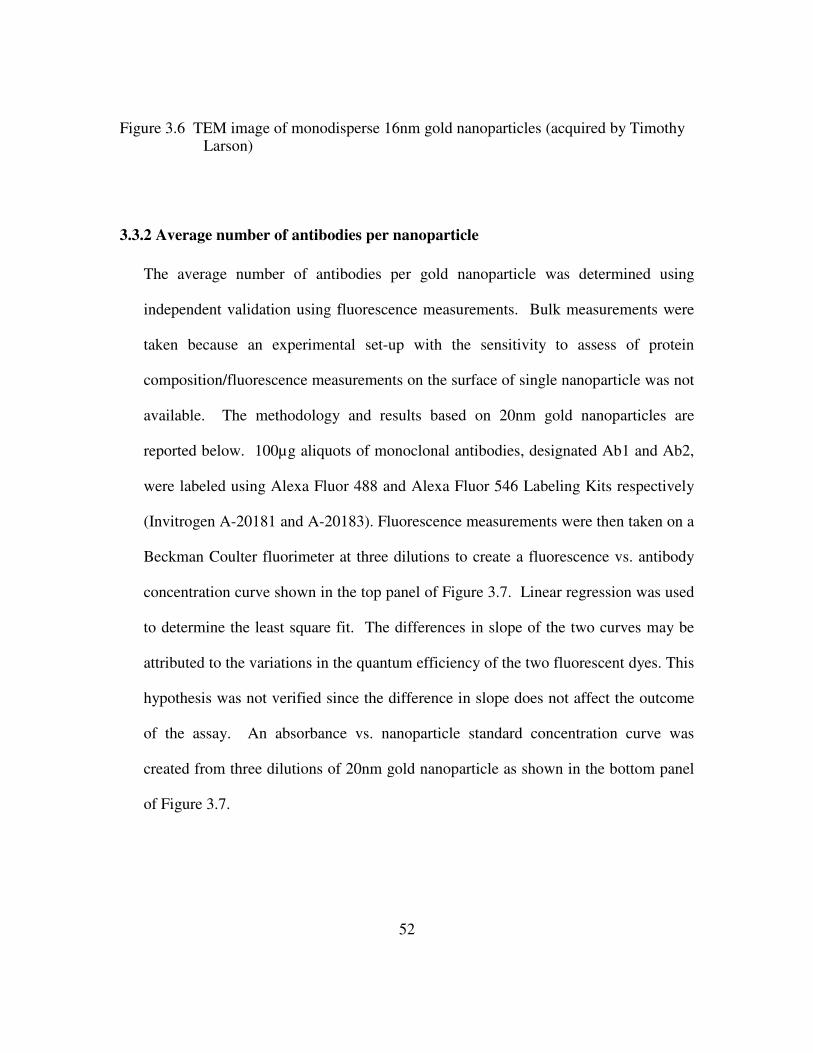
52
Figure 3.6 TEM image of monodisperse 16nm gold nanoparticles (acquired by Timothy Larson)
3.3.2 Average number of antibodies per nanoparticle
The average number of antibodies per gold nanoparticle was determined using
independent validation using fluorescence measurements. Bulk measurements were
taken because an experimental set-up with the sensitivity to assess of protein
composition/fluorescence measurements on the surface of single nanoparticle was not
available. The methodology and results based on 20nm gold nanoparticles are
reported below. 100µg aliquots of monoclonal antibodies, designated Ab1 and Ab2,
were labeled using Alexa Fluor 488 and Alexa Fluor 546 Labeling Kits respectively
(Invitrogen A-20181 and A-20183). Fluorescence measurements were then taken on a
Beckman Coulter fluorimeter at three dilutions to create a fluorescence vs. antibody
concentration curve shown in the top panel of Figure 3.7. Linear regression was used
to determine the least square fit. The differences in slope of the two curves may be
attributed to the variations in the quantum efficiency of the two fluorescent dyes. This
hypothesis was not verified since the difference in slope does not affect the outcome
of the assay. An absorbance vs. nanoparticle standard concentration curve was
created from three dilutions of 20nm gold nanoparticle as shown in the bottom panel
of Figure 3.7.

53
Fluourescence vs. Ab Concentration
0
10000
20000
30000
40000
50000
60000
70000
0 10 20 30 40 50 60
Ab Concentration (ug/ml)
Flu
ore
scen
ce (
au
)
Ab1
Ab2
Au Concentration vs. O.D.
0
0.1
0.2
0.3
0.4
0.5
0.6
0.7
0.00E+00 2.00E+11 4.00E+11 6.00E+11 8.00E+11 1.00E+12 1.20E+12 1.40E+12
Au concentration
O.D
.
Figure 3.7. (Top) Fluorescence vs. antibody concentration standard curve (Bottom) Optical density vs. nanoparticle concentration standard curve.
54
Then, conjugates were prepared as previously described with 1:1 ratio of Ab1 to
Ab2. Fluorescence and extinction measurements of the bulk conjugate were taken and
correlated to the respective standard curves to determine the concentration of each
antibody per nanoparticle. Stoichiometric calculations were used to determine the
number of antibodies and gold nanoparticles. Four independent assays were performed
giving an average of 2.68x10¹² ± 5.53x10¹⁰ Ab1 molecules, 2.45x10¹² ± 3.53x10¹⁰ Ab2
molecules, and 9.02x10¹¹ ± 1.44x10¹⁰ gold nanoparticles per ml of conjugate. The
average total number of antibodies in the conjugate was divided by the average number
of nanoparticle to determine the average number of antibodies per nanoparticle. These
calculations give an average of 2.97 ± 0.06 Ab1 antibodies and 2.71 ± 0.04 Ab2
antibodies per nanoparticle. The total number of antibodies per nanoparticles is
estimated to be 5.68 ± 0.05
3.3.3 Modulating the ratio of antibodies on the surface of gold nanoparticles
When creating multifunctional nanoparticles, the ability to precisely control the
functionality is an important asset. The most direct method of directing functionality is
to control the ratio of different types of antibodies on the surface of a nanoparticle. This
was demonstrated by varying the ratios of two monoclonal antibodies, Ab1 and Ab2,
from 3:1 to 1:3 on the surface of 20nm gold nanoparticles. The method to determine
final antibody on the nanoparticle surface was previously described in section 3.4.2.
Figure 3.8 shows the results obtained from 2 independent assays. Further iterations of
this assay need to be completed to achieve statistical significance. The data shows that
55
the nanoparticle surface was functionalized with nearly the same ratio of antibodies
present in the initial antibody solution.
Control over Conjugate Composition
0
0.5
1
1.5
2
2.5
3 to 1 2 to 1 1 to 1 1 to 2 1 to 3
An
tib
od
y C
on
cen
trati
on
in
Co
nju
gate
(u
g/m
l)
Ab1
Ab2
Figure 3.8 Results of two independent experiments demonstrate control of antibody composition on the surface of gold nanoparticles.
3.3.4 Effect on target functionality
It is widely accepted that a biological imaging tool should have minimal effect on
the cell and especially on the target being detected. This is vital when the functionality of
the target is the unknown quantity. In order to determine the effect of gold nanoparticle
based contrast agents on target functionality, the extent of actin polymerization was
measured in the presence of gold nanoparticle conjugates targeted to actin. This effect
was investigated using the commonly used pyrenyl actin fluorescence assay. The assay is
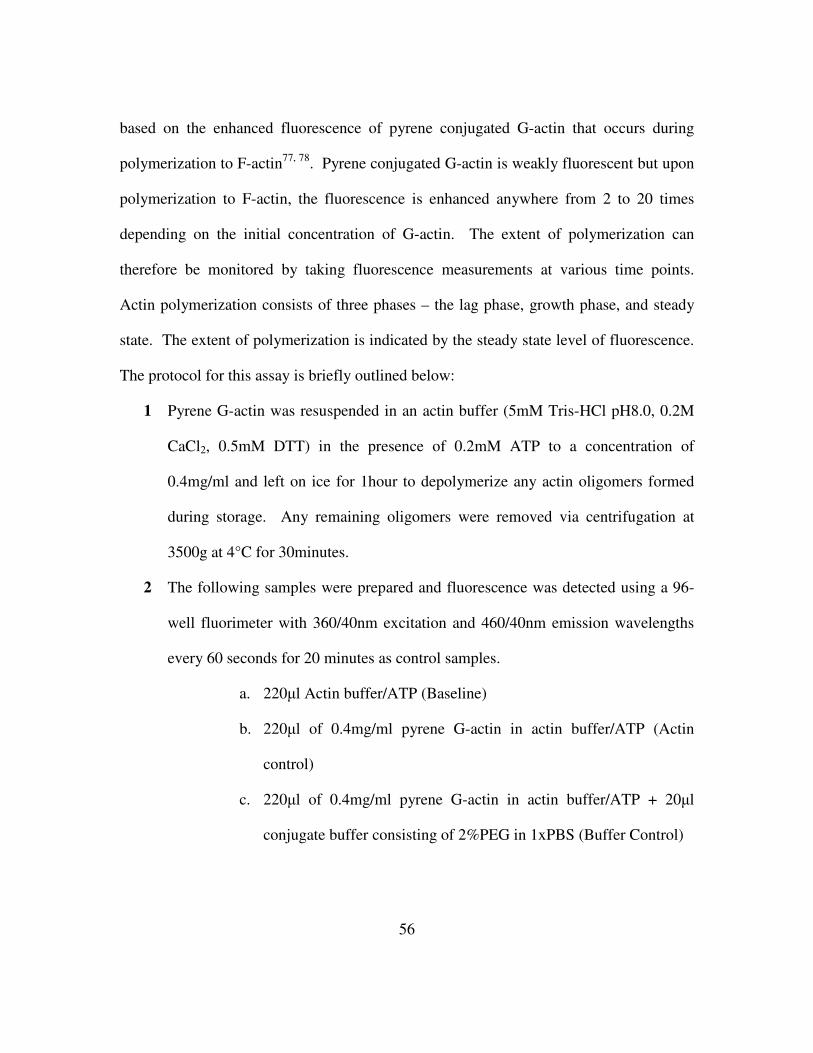
56
based on the enhanced fluorescence of pyrene conjugated G-actin that occurs during
polymerization to F-actin77, 78. Pyrene conjugated G-actin is weakly fluorescent but upon
polymerization to F-actin, the fluorescence is enhanced anywhere from 2 to 20 times
depending on the initial concentration of G-actin. The extent of polymerization can
therefore be monitored by taking fluorescence measurements at various time points.
Actin polymerization consists of three phases – the lag phase, growth phase, and steady
state. The extent of polymerization is indicated by the steady state level of fluorescence.
The protocol for this assay is briefly outlined below:
1 Pyrene G-actin was resuspended in an actin buffer (5mM Tris-HCl pH8.0, 0.2M
CaCl2, 0.5mM DTT) in the presence of 0.2mM ATP to a concentration of
0.4mg/ml and left on ice for 1hour to depolymerize any actin oligomers formed
during storage. Any remaining oligomers were removed via centrifugation at
3500g at 4°C for 30minutes.
2 The following samples were prepared and fluorescence was detected using a 96-
well fluorimeter with 360/40nm excitation and 460/40nm emission wavelengths
every 60 seconds for 20 minutes as control samples.
a. 220µl Actin buffer/ATP (Baseline)
b. 220µl of 0.4mg/ml pyrene G-actin in actin buffer/ATP (Actin
control)
c. 220µl of 0.4mg/ml pyrene G-actin in actin buffer/ATP + 20µl
conjugate buffer consisting of 2%PEG in 1xPBS (Buffer Control)

57
d. 220µl of 0.4mg/ml pyrene G-actin in actin buffer/ATP + 20µl of
gold nanoparticle contrast agent in conjugate buffer (Au contrast
agent assay)
3 20µl of actin polymerization buffer (500mM KCl, 20mM MgCl2, 10mM ATP)
was then added to all samples and fluorescent measurements were read every 60
seconds for 1 hour. This experiment was run in triplicate and the data obtained is
summarized in Figure 3.9.
Actin Polymerization Assay
0
50
100
150
200
250
300
350
400
450
500
0:00:00 0:07:12 0:14:24 0:21:36 0:28:48 0:36:00 0:43:12 0:50:24 0:57:36 1:04:48
Time (min)
Flu
ore
sc
en
ce
(a
u)
Baseline
Actin Control
Buffer Control
Au contrast agent assay
Figure 3.9 Standard pyrene-actin polymerization assay shows similar polymerization rates with and without the presence of gold nanoparticle based contrast agents.
The shape profile of the growth and steady state phases of actin polymerization
over time were not affected by the presence of gold nanoparticle conjugates. The shape
profiles were delineated as the slope of the curve between 2min and 17min for the growth
phase and between 22min and 60min for the steady state phase. The average slopes for

58
the growth phase were 11.60±0.53 for the actin control and 14.87±2.26 for the Au
contrast agent assay. The p-value obtained from a t-Test (2-sample assuming unequal
variances and a significance value of 0.05) is 0.067. Since this p-value is larger than
0.05, the two slopes are not considered statistically different. The average slopes for the
steady state phase were 0.013±0.035 for the actin control and -0.15±0.36 for the Au
contrast agent assay. The p-value obtained from a t-Test (2-sample assuming unequal
variances and a significance value of 0.05) is 0.25. Since this p-value is much larger than
0.05, the two slopes are not statistically different. Although the presence of contrast agent
did not significantly alter the shape profile of the growth and steady state phases of
polymerization, these experiments should be repeated to further validate these results.
The average fluorescence values during the steady state phase were used to compare the
extent of polymerization. The average value over three samples for the Actin control was
343.13±14.21 and the average value for the Au contrast agent assay was 385.13±74.97.
The p-value (2-sample t-Test assuming non-equal variances) was 0.22. The value
indicates that the extent of polymerization between these two cases is not statistically
different. This lack of statistical significance may be partly due to the large standard
deviation in the Au contrast agent assay sample. Further iterations of this assay should be
performed to verify this result. The activity of the anti-actin antibody should also be
interrogated. Previous studies show that the antibody may slightly enhance
polymerization79. This effect should be verified using a control containing the Actin
control ± the anti-actin antibody alone.
Interaction between the pyrene G-actin and the gold nanoparticle conjugate was
verified using darkfield reflectance microscopy. The contrast agent was allowed to react
59
with the pyrene G-actin for 10 minutes at which point the solution was deposited on a
coverslip along with actin polymerization buffer to induce polymerization. Figure 3.10
shows darkfield reflectance images ~20min after the addition of actin polymerization
buffer. Linear strands or bundles of actin are seen as actin polymerizes on the surface of
the glass coverslip. The length of these actin strands/bundles were observed to increase
over time but images were not obtained.
Figure 3.10. Darkfield reflectance images of polymerized actin strands labeled with gold nanoparticle contrast agent targeted to actin.
60
Chapter 4: Plasmonic Nanoparticles with Affinity and Delivery Functionalities for Imaging Actin in Live Cells*
4.1 INTRODUCTION
The potential of multifunctional gold nanoparticles contrast agents as intracellular
sensors was demonstrated by monitoring actin rearrangement in live fibroblasts. Actin
was chosen as a target because of its importance in enhancing cell-biomaterial
interactions as well in its deregulation during disease80, 81. The vast abundance of actin,
often micromolar concentrations, makes it necessary to discriminate filaments involved
in active polymerization from a sea of actin monomers82-84. Gold nanoparticles are ideal
for investigating such filaments in live cells since they provide contrast enhancement in
closely spaced assemblies43, 85. The actin mediated assembly of nanoparticles inside cells
result in a red shift in their scattering maxima due to plasmon resonance coupling
between particles.
4.2 ACTIN
Actin a 43kDa protein present in virtually every eukaryotic cell. The dynamics of
actin drive movement at both the macroscopic and microscopic level. In muscle cells,
actin mediates motility in its interactions with myosin. In non-muscle cells, actin
filaments take on more and varied functions. In addition to cellular motility, actin
filaments maintain cell morphology as well as provide functions such as cellular
adhesion, exocytosis, endocytosis and cell division86. Under normal physiological
conditions, filamentous-actin (F-actin) is polymerized from 5nm globular-actin (G-actin) * Portions of this chapter were previously published in Kumar, S., Harrison, N., Richards-Kortum, R., Sokolov, K. Plasmonic Nanoparticles for Imaging Intracellular Biomarkers. Nano Letters, in press (2007)

61
monomers with the concomitant hydrolysis of ATP. Biologists have been studying the
role of actin for decades because the roles of actin are vital to every virtually facet of
cellular function. Recently, the interest in actin dynamics has sky-rocketed for its
implications in understanding focal adhesions and for its pivotal role in regulating
morphologic and phenotypic events during carcinogenesis81, 87. Quantifying and
enhancing focal adhesions is has become an important area of research in the field of
novel synthetic biomaterials81. Biomaterials needed to be thoroughly tested for cellular
interactions and thus biocompatibility before use. In addition, the cellularization of
synthetic materials for tissue replacement remains the holy grail of regenerative
medicine. The implications of actin dynamics in integrin-mediated adhesions has made
understanding actin even more vital88. As with other physiological events, actin filaments
are disrupted during malignant transformation. The remodeling is a result of either the
activation of oncogenic actin signaling pathways (Ras or Src) or the inactivation of actin-
binding proteins (gelsolin)87. Uncovering these interactions enables the targeting of actin
remodeling for chemopreventative or chemotherapeutic drug development.
Actin dynamics have been imaged previously using varied techniques. Furthmayr
et al used a GFP fusion of a F-actin binding protein to indirectly fluorescently tag actin in
live NIH3T3 cells89. Direct targeting using GFP-actin fusion proteins have also been used
to study polymerization in live fibroblasts90 and carcinoma cells91. The most widely used
methods involve the delivery of fluorescently labeled actin using electroporation or
microinjection. Area of interest are then spot photobleached and imaged after recovery
using various modalities including total internal reflectance and confocal microscopy84, 92.

62
4.3 MATERIALS AND METHODS
4.3.1 Cell Lines
The mouse embryonic fibroblast cell line, NIH3T3, was grown in a humidified
incubator at 37°C and 5% CO2 and maintained in DMEM containing 5% fetal bovine
serum and 5% glutamine/penicillin/streptomycin.
4.3.2 Contrast Agent
Multifunctional contrast agent was made using the protocol described previously
in section 3.5. Monoclonal anti-actin antibodies were specific for the C-terminal end
which is conserved in both G- and F-actin isoforms. Monoclonal anti-biotin antibodies
(Jackson Immunoresearch) were used for the attachment of biotinylated TAT-HA2
peptide.
4.3.3 Live Cell Labeling/Imaging
Cells were deposited on coverslips and allowed to settle for 4 hours prior to
labeling. Coverslips coated with a collagen IV monolayer were prepared by dipping the
coverslips in 1mg/ml collagen IV in 0.2% acetic acid for 30 minutes at 37°C and then
washing in 1xPBS. For chemotaxis experiments, 20µl of 1mg/ml collagen IV in
0.5NHCL was deposited on the center of the coverslip and allowed to dry and then
washed in 1xPBS. A 1ml solution of approximately 1011 nanoparticles/ml in completed
phenol-free DMEM was applied to each coverslip for 30minutes at 37°C to label the
cells. Coverslips were rinsed with fresh media prior to imaging. A modified RC 20
chamber (Warner Instruments) and dual channel stage heater (Fisher) were used for long-
term live imaging. The imaging chamber has two injection ports and one drainage port
for the addition of various solutions during imaging.
63
Darkfield images with white light Xenon illumination were taken using a Leica
DM 6000 upright microscope equipped with a 20x, 0.95 NA darkfield objective and a Q-
Imaging Retiga EXi ultra-sensitive 12-bit CCD camera. Confocal images were taken on a
Leica SP2 AOBS confocal fluorescence/reflectance microscope with a 63X oil (HCX PL
APO 1.4-.60 NA Blau CS) objective and various excitation wavelengths and tunable
emission wavelengths.
4.3.4 TEM Imaging
Cells for TEM were grown on coverslips made from an Aclar substrate and
labeled with the same method used for live cell imaging. Aclar is a widely used substrate
for the processing of the sample the TEM. Samples were fixed in cold 2%
glutaraldehyde in 1x PBS and stained in 2% OsO4 for 10 minutes each. The samples
were then dehydrated in a series of graded ethanols ranging from 25% to 100% and
subsequently in acetone for 10 minutes each. Each Aclar coverslip was embedded in
epoxy (Embed 812, EMS) into 5mm thick disc and sliced transversely to a thickness of
approximately 100nm using Leica Ultracut UCT ultramicrotome. TEM images were
taken on a Philips EM 208 system.
4.3.5 Immunofluorescence Staining and Imaging
Cells are grown on glass coverslips in 6-well plates to 50-75% confluency. (All
subsequent solutions are added at 1ml per well at room temperature). Coverslips were
washed in 1x PBS and fixed with 3.7% HCHO for 10 minutes. After washing 3x in
1xPBS for 5 minutes each, the cells were permeabilized by adding 0.05% Triton X-100
for 10 minutes. Samples were then washed 3x in 1xPBS for 5 minutes each. In order to
reduce non-specific binding, a solution of 2.5% goat serum/2% BSA in 1xPBS was

64
applied for 30 minutes. Primary staining was done with a primary antibody in a buffer
containing 1% BSA in 1xPBS for 45 minutes. The amount was optimized per
antigen/cell type but generally a 2-4µg/ml was used as a starting point. Excess unbound
antibody was washed away with a solution of 0.1% BSA and 0.02% saponin in 1x PBS
for 5 minutes. Secondary labeling was done with a 1-2µg/ml FITC conjugated secondary
antibody in a solution containing 1% BSA in 1xPBS for 30 minutes. Excess unbound
antibody was washed away with a solution of 0.1% BSA and 0.02% saponin in 1x PBS
for 5 minutes. Coverslips were mounted to slide using antifade reagent containing DAPI
dye (Molecular Probes, S-24636). The nucleic acid probe DAPI was used to counterstain
for nuclei.
4.4 RESULTS
The contrast agents were imaged in live NIH3T3 fibroblasts using both darkfield
reflectance (DR) with white light illumination and transmission electron microscopy
(TEM). The DR image in Figure 4.1 shows increased signal intensity at the leading edge
of the cell as it moves towards a chemoattractant, collagen IV93. The yellow-orange color
of the leading edge indicates plasmonic coupling between nanoparticles85. Representative
TEM images (Fig. 4.1b and 4.1c) verify the source of the optical signal with a high
concentration of gold nanoparticles present throughout the extending lamellipodia at the
leading edge of the cell. The separation distance between gold nanoparticles, on the order
of one diameter or less, potentially explains the strong plasmonic coupling observed in
the DR color shift. Since the gold nanoparticle labeling pattern is consistent with
traditional post-fixation labeled TEM images, this may be a valuable tool in streamlining
TEM imaging of intracellular events94. In order to demonstrate the added functionality of
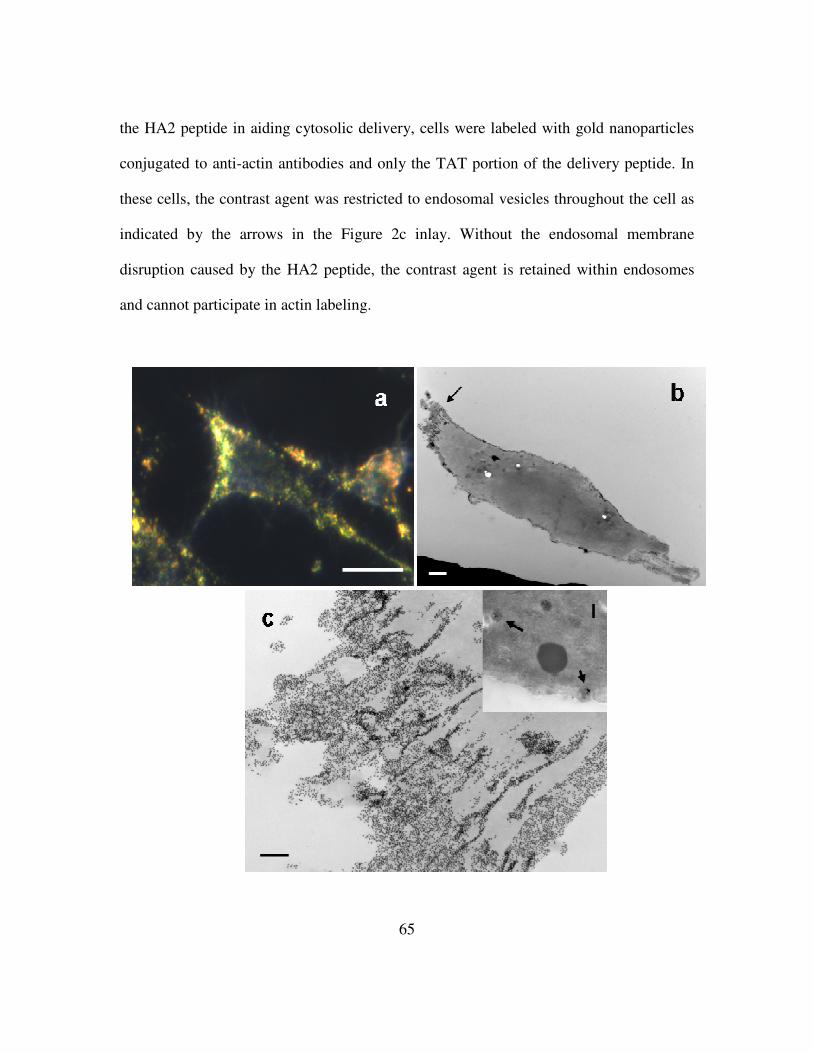
65
the HA2 peptide in aiding cytosolic delivery, cells were labeled with gold nanoparticles
conjugated to anti-actin antibodies and only the TAT portion of the delivery peptide. In
these cells, the contrast agent was restricted to endosomal vesicles throughout the cell as
indicated by the arrows in the Figure 2c inlay. Without the endosomal membrane
disruption caused by the HA2 peptide, the contrast agent is retained within endosomes
and cannot participate in actin labeling.

66
Figure 4.1 a) Darkfield reflectance image of a live NIH3T3 cell labeled with gold nanoparticle based contrast agents targeted to actin. The leading edge (arrow) of the cell where actin polymerization is greatest corresponds to a brighter optical signal. Scale bar is 20µm. b) TEM image demonstrating delivery of complete multifunctional contrast agent in live NIH3T3 cells. Scale bar is 2µm. c) A higher magnification TEM image shows the nanoparticle labeling pattern in the region indicated by the arrow in 2b. The inlay shows live cells labeled with contrast agent containing incomplete delivery peptide (TAT only). Labeling is localized to endosomal structures without HA2 functionality. Scale bars are 0.2µm. (TEM images acquired by Nathan Harrison)
Cells were also labeled in the absence of a collagen IV chemoattractant to
visualize actin filament labeling patterns in non-motile live cells. In order to minimize
motility, cells were deposited on coverslips and labeled/imaged immediately after
attachment. The pattern of labeling was compared to fluorescent phalloidin (Alexa Fluor
488-phalloidin, Molecular Probes) staining which is a common F-actin labeling technique
in formalin-fixed cells. Briefly, cells were fixed in 3.7% HCHO and permeabilized in
0.05% Triton X-100 prior to labeling with fluorescent phalloidin. Confocal fluorescent
images of labeled fixed fibroblasts were taken with a Leica SP2 AOBS confocal
fluorescence microscope using a 488nm argon laser line and 63x objective. Figure 4.2
compares the stress fiber labeling patterns visible using both methods. Confocal
fluorescent images of labeled fixed fibroblasts show a distribution of actin
filaments/bundles throughout the cell. In DR images of live fibroblasts, labeled actin
filaments appear green within and between cells on a background of the endogenous
bluish reflectance of the cell. These actin filaments exhibit a similar pattern to that seen
in phalloidin labeled fixed cells. Although this assessment was made visually, further
quantification is required to rigorously validate this claim. The number and orientation of
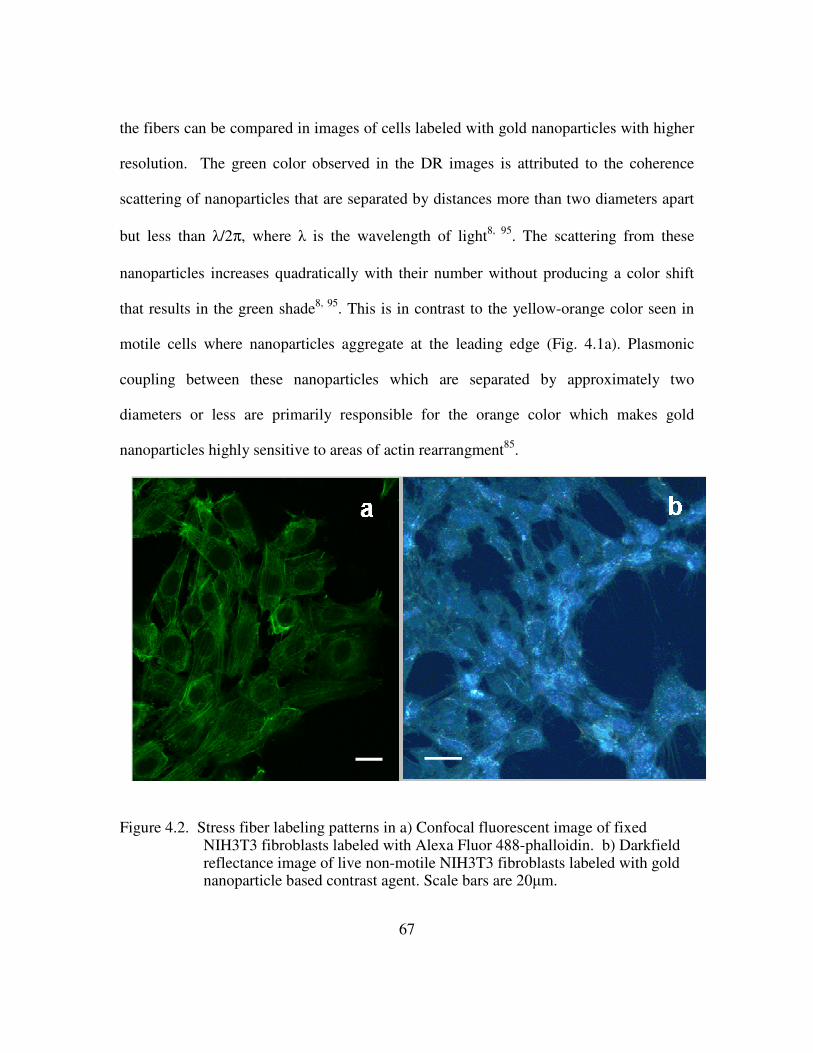
67
the fibers can be compared in images of cells labeled with gold nanoparticles with higher
resolution. The green color observed in the DR images is attributed to the coherence
scattering of nanoparticles that are separated by distances more than two diameters apart
but less than λ/2π, where λ is the wavelength of light8, 95. The scattering from these
nanoparticles increases quadratically with their number without producing a color shift
that results in the green shade8, 95. This is in contrast to the yellow-orange color seen in
motile cells where nanoparticles aggregate at the leading edge (Fig. 4.1a). Plasmonic
coupling between these nanoparticles which are separated by approximately two
diameters or less are primarily responsible for the orange color which makes gold
nanoparticles highly sensitive to areas of actin rearrangment85.
Figure 4.2. Stress fiber labeling patterns in a) Confocal fluorescent image of fixed NIH3T3 fibroblasts labeled with Alexa Fluor 488-phalloidin. b) Darkfield reflectance image of live non-motile NIH3T3 fibroblasts labeled with gold nanoparticle based contrast agent. Scale bars are 20µm.

68
a
c d
b
e

69
Figure 4.3 Efficacy of multiple functionalities in labeling intracellular targets. Darkfield reflectance imaging of live NIH3T3 cells labeled with varying 20nm gold nanoparticle contrast agent formulations. Arrows indicate the presence of visible filapodia. Scale bars are 10µm. a) Unlabeled cells. b) Contrast agent functionalized with anti-actin targeting antibody and only the TAT delivery peptide. c) Contrast agent functionalized with only anti-actin targeting antibody d) Contrast agent functionalized with only TAT-HA2 delivery peptide. e) Multifunctional contrast agent with both targeting and delivery moieties.
In order to demonstrate the necessity of each element of the contrast agent, various
formulations were created by eliminating one component at a time and tested on NIH3T3
cells. Specific labeling was quantified using a colorimetric assay on the RGB images
obtained. Since the plasmonic coupling of gold nanoparticles associated with actin
labeling results in a red shift in the reflectance spectra, a ratio of red channel intensity
over total intensity was calculated to quantify the degree of labeling. All colorimetric
ratio calculations were performed on RGB images acquired with the same exposure and
gain settings. The RGB images are shown in Figure 4.3. Unlabeled cells (Figure 4.3a)
show the characteristic bluish tinge of native cellular reflectance with only 26% of the
signal in the red channel. Cells labeled with contrast agent with anti-actin antibody and
only the TAT portion of the delivery peptide show the contrast agent trapped in
endosomes and are visible as yellow-orange dots (Fig. 4.3b). Since the conjugate is not
distributed over the cell, cells retain their bluish reflectance and only 20% of the signal is
in the red channel. In cells labeled with gold nanoparticles conjugated to solely anti-actin
antibodies (Fig. 4.3c), the image loses the dominance of blue with a 33% red signal
indicating the presence of contrast agent. Filapodic extensions also start to become
visible. This indicates that a small fraction of contrast agent is taken up by the fibroblasts
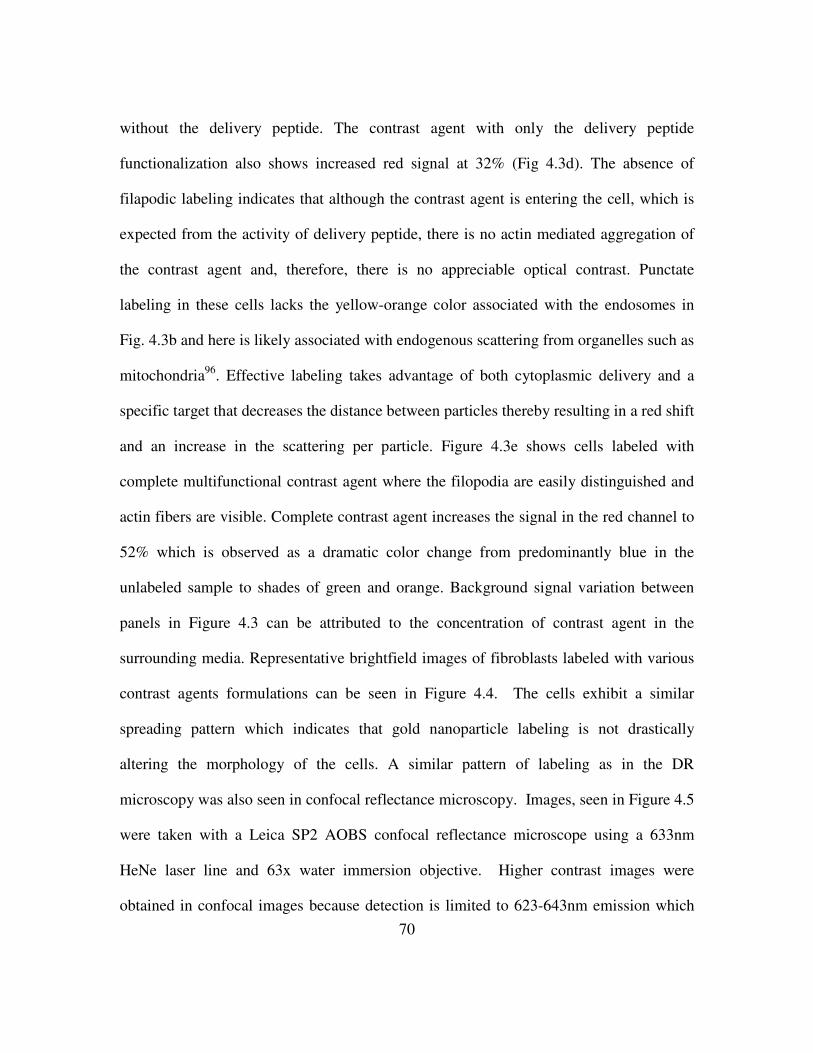
70
without the delivery peptide. The contrast agent with only the delivery peptide
functionalization also shows increased red signal at 32% (Fig 4.3d). The absence of
filapodic labeling indicates that although the contrast agent is entering the cell, which is
expected from the activity of delivery peptide, there is no actin mediated aggregation of
the contrast agent and, therefore, there is no appreciable optical contrast. Punctate
labeling in these cells lacks the yellow-orange color associated with the endosomes in
Fig. 4.3b and here is likely associated with endogenous scattering from organelles such as
mitochondria96. Effective labeling takes advantage of both cytoplasmic delivery and a
specific target that decreases the distance between particles thereby resulting in a red shift
and an increase in the scattering per particle. Figure 4.3e shows cells labeled with
complete multifunctional contrast agent where the filopodia are easily distinguished and
actin fibers are visible. Complete contrast agent increases the signal in the red channel to
52% which is observed as a dramatic color change from predominantly blue in the
unlabeled sample to shades of green and orange. Background signal variation between
panels in Figure 4.3 can be attributed to the concentration of contrast agent in the
surrounding media. Representative brightfield images of fibroblasts labeled with various
contrast agents formulations can be seen in Figure 4.4. The cells exhibit a similar
spreading pattern which indicates that gold nanoparticle labeling is not drastically
altering the morphology of the cells. A similar pattern of labeling as in the DR
microscopy was also seen in confocal reflectance microscopy. Images, seen in Figure 4.5
were taken with a Leica SP2 AOBS confocal reflectance microscope using a 633nm
HeNe laser line and 63x water immersion objective. Higher contrast images were
obtained in confocal images because detection is limited to 623-643nm emission which
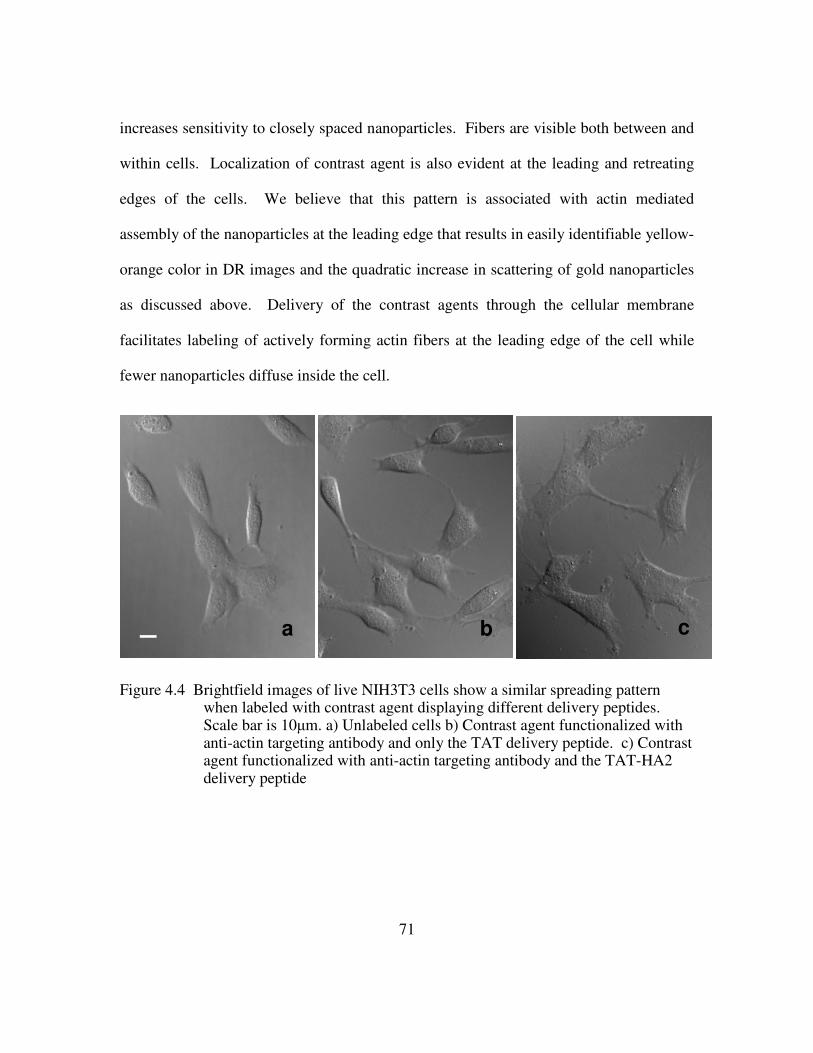
71
increases sensitivity to closely spaced nanoparticles. Fibers are visible both between and
within cells. Localization of contrast agent is also evident at the leading and retreating
edges of the cells. We believe that this pattern is associated with actin mediated
assembly of the nanoparticles at the leading edge that results in easily identifiable yellow-
orange color in DR images and the quadratic increase in scattering of gold nanoparticles
as discussed above. Delivery of the contrast agents through the cellular membrane
facilitates labeling of actively forming actin fibers at the leading edge of the cell while
fewer nanoparticles diffuse inside the cell.
Figure 4.4 Brightfield images of live NIH3T3 cells show a similar spreading pattern when labeled with contrast agent displaying different delivery peptides. Scale bar is 10µm. a) Unlabeled cells b) Contrast agent functionalized with anti-actin targeting antibody and only the TAT delivery peptide. c) Contrast agent functionalized with anti-actin targeting antibody and the TAT-HA2 delivery peptide
a c b
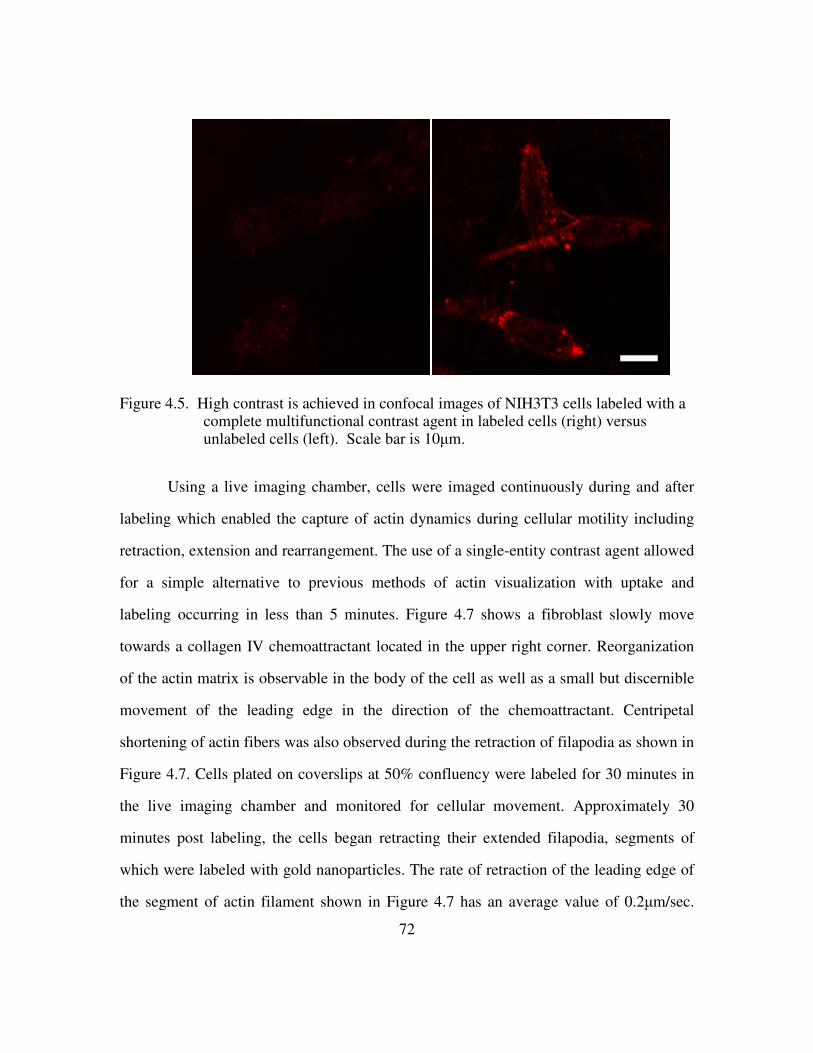
72
Figure 4.5. High contrast is achieved in confocal images of NIH3T3 cells labeled with a complete multifunctional contrast agent in labeled cells (right) versus unlabeled cells (left). Scale bar is 10µm.
Using a live imaging chamber, cells were imaged continuously during and after
labeling which enabled the capture of actin dynamics during cellular motility including
retraction, extension and rearrangement. The use of a single-entity contrast agent allowed
for a simple alternative to previous methods of actin visualization with uptake and
labeling occurring in less than 5 minutes. Figure 4.7 shows a fibroblast slowly move
towards a collagen IV chemoattractant located in the upper right corner. Reorganization
of the actin matrix is observable in the body of the cell as well as a small but discernible
movement of the leading edge in the direction of the chemoattractant. Centripetal
shortening of actin fibers was also observed during the retraction of filapodia as shown in
Figure 4.7. Cells plated on coverslips at 50% confluency were labeled for 30 minutes in
the live imaging chamber and monitored for cellular movement. Approximately 30
minutes post labeling, the cells began retracting their extended filapodia, segments of
which were labeled with gold nanoparticles. The rate of retraction of the leading edge of
the segment of actin filament shown in Figure 4.7 has an average value of 0.2µm/sec.

73
This preliminary result is consistent with previously published values of centripetal
retraction in Swiss 3T3 fibroblasts where an average of 0.26 µm/sec was observed by
attaching and tracking 0.5 µm beads on the dorsal surface of filapodia97. It should be
noted that these observations were made on a small subset of cells in order to
demonstrate the feasibility of labeling intracellular biomarkers with gold nanoparticle
based contrast agents. Analysis on a larger subset of cells should be conducted in order
to validate these findings.
Figure 4.6. The leading edge of a NIH3T3 cell is easily distinguished as the cell crawls toward a stimulus, collagen IV (upper right corner). The video spans roughly 1.6 hours.
t=0s t=196s t=357s t=91s
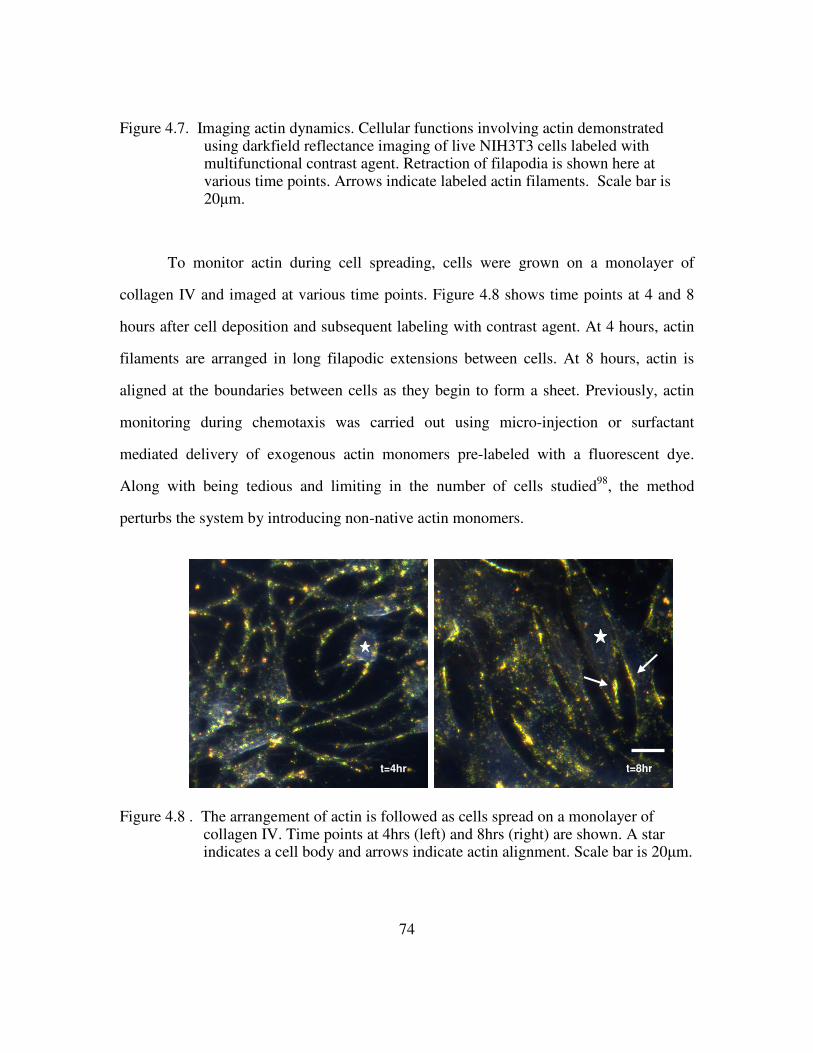
74
Figure 4.7. Imaging actin dynamics. Cellular functions involving actin demonstrated using darkfield reflectance imaging of live NIH3T3 cells labeled with multifunctional contrast agent. Retraction of filapodia is shown here at various time points. Arrows indicate labeled actin filaments. Scale bar is 20µm.
To monitor actin during cell spreading, cells were grown on a monolayer of
collagen IV and imaged at various time points. Figure 4.8 shows time points at 4 and 8
hours after cell deposition and subsequent labeling with contrast agent. At 4 hours, actin
filaments are arranged in long filapodic extensions between cells. At 8 hours, actin is
aligned at the boundaries between cells as they begin to form a sheet. Previously, actin
monitoring during chemotaxis was carried out using micro-injection or surfactant
mediated delivery of exogenous actin monomers pre-labeled with a fluorescent dye.
Along with being tedious and limiting in the number of cells studied98, the method
perturbs the system by introducing non-native actin monomers.
Figure 4.8 . The arrangement of actin is followed as cells spread on a monolayer of collagen IV. Time points at 4hrs (left) and 8hrs (right) are shown. A star indicates a cell body and arrows indicate actin alignment. Scale bar is 20µm.
t=4hr t=8hr
75
The response of fibroblasts labeled with actin-targeted contrast agents to external
modulation was interrogated with cytochalasin. Cytochalasin D is a cell permeable toxin
that disrupts actin filaments and inhibits polymerization99. Cells were grown on glass
coverslips and then labeled with gold nanoparticle contrast agents for 45 minutes in the
incubator at 37ºC in phenol-free DMEM as previously described. The coverslips were
then placed in a long-term imaging chamber and 20x darkfield reflectance images were
acquired every 10 seconds for 10 minutes. Then, 4ml of 10µM cytochalasin D in phenol-
free DMEM was injected into the inlet port of the imaging chamber to replace the media
in the chamber. Images were acquired every 10 seconds for approximately 20min post
cytochalasin injection. The effect of cytochalasin on actin labeling is quantified using the
mean of the red channel. The quantification was performed on ten areas of strong gold
nanoparticle labeling identified by thresholding the red channel of a pre-cytochalasin
RGB image. The RGB image is shown in figure 3.9 along with the ten areas outlined in
white. Results of the quantification are shown in figure 3.10. The mean intensity
decreases from 79.43 ± 19.67 to 62.09 ± 20.78 roughly 20 min after the addition of
cytochalasin. The p-value (2 sample t-Test assuming unequal variances) of 0.035
indicates that these two means are statically different.
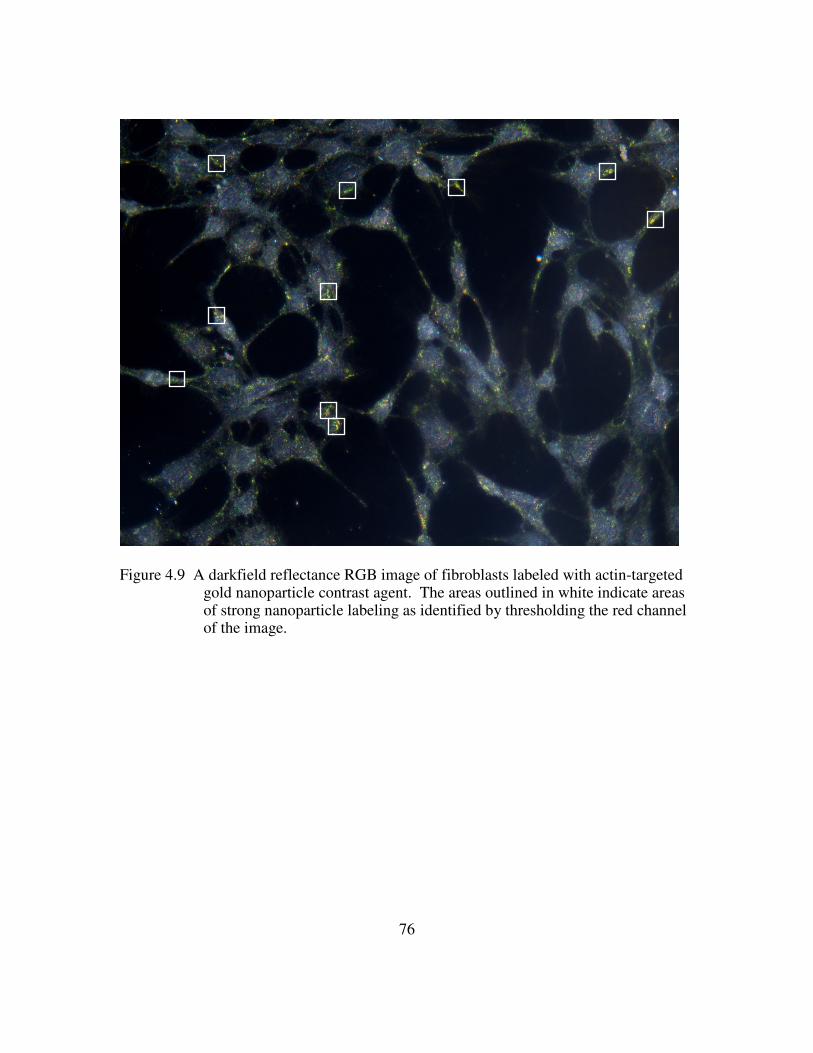
76
Figure 4.9 A darkfield reflectance RGB image of fibroblasts labeled with actin-targeted gold nanoparticle contrast agent. The areas outlined in white indicate areas of strong nanoparticle labeling as identified by thresholding the red channel of the image.

77
Before
cytochalasin
20min post-
cytochalasin
0
20
40
60
80
100
120M
ea
n In
ten
sit
y o
f R
ed
Ch
an
nel
Figure 4.10. Quantification of the effect on cytochalasin D on the gold nanoparticle labeled fibroblasts.
4.5 DISCUSSION
We describe here a novel optical contrast agent complete with affinity to an
intracellular biomolecule and a cytosolic delivery mechanism. Studying actin in cultured
fibroblasts is only one of many biological systems this contrast agent can be adapted for.
The conjugation method can potentially be extended by incorporating the appropriate
antibody to target other intracellular biomarkers of interest such as p16, which is
upregulated in cervical cancers100. Preliminary results for p16 labeling are presented in
chapter 5. Since the delivery peptide, TAT-HA2, uses a receptor-independent
endocytosis pathway, the contrast agent delivery is not theoretically cell specific.
Efficacy in other cell types, however, may differ based on rates of macropinocytosis and
78
the differences in endosomal pH. The amount of TAT-HA2 may be modulated by
controlling the composition of antibodies on the surface of the nanoparticle as described
in section 3.3.3. Other biotinylated delivery peptides can also be easily substituted for
TAT-HA2 using the same conjugation protocol. Gold nanoparticle based sensors can
also be used in combination with TEM to provide super-high resolution “snapshots” that
can be correlated with live optical imaging. Since labeling can be done prior to fixation,
any labeling artifacts that occur as a result of fixation or post-processing are minimized.
The surface conjugation chemistry may also be adapted for additional imaging probes.
Quantum dots passivated with a thiol-reactive layer can potentially be substituted for gold
nanoparticles in this conjugation protocol for applications in which a fluorescent signal
would be more advantageous.
One potential limitation of gold nanoparticles is the amount that can be loaded in
to the cells to achieve a saturation of labeling of targeted biomarkers. The upper
concentration is limited by the size of the particle and the density of the labeling solution.
To analyze the efficiency and saturation of labeling, further experiments should be
performed that vary the size and concentration of the gold nanoparticle contrast agent.
Efficiency can potentially be quantified using a double immunogold labeling technique
on fixed TEM samples. Briefly, live cells are labeled with actin targeted contrast agent
and then fixed and post-processed for TEM. The fixed slices are then labeled with a
second size of immunogold targeted to a different epitope of actin and the labeling
efficiencies are compared. There is also some uncertainty of the effect of nanoparticles
on cellular processes. While there was no indication of any deviant behavior in vitro actin
polymerization experiments, the presence of nanoparticles may interfere with actin

79
polymerization in the cell or with other molecular interactions. However, our experiments
showed that multifunctional gold nanoparticles have great potential as a complementary
contrast agent to quantum dots and other probes for the optical imaging of molecular
intracellular processes. The plasmon resonance coupling between adjacent nanoparticles
provides a unique opportunity to directly image biomolecular interactions like actin
rearrangement. The feasibility of labeling actin rearrangement is demonstrated in this
chapter.
80
Chapter 5: Labeling of Diffuse Intracellular Proteins – Biomarkers for Human Papillomavirus
The potential of multifunctional gold nanoparticle contrast agents as intracellular
sensors was further tested by attempting to label p16 protein in cervical cancer cell lines.
The intention was to develop an optical nanosensor to be used as a point of care ex vivo
assay. The assay could potentially be used in cervical cancer screening to supplement the
Pap test. The chapter introduces p16 as a useful biomarker for cervical cancer
progression. Cell lines with varying p16 expression levels are identified and the levels
and distribution are assayed with standard immunohistochemistry. This is followed by
labeling in live cells with a targeted gold nanoparticle contrast agent. The results for
contrast agent labeling show negligible contrast between the various cell lines. Two
hypotheses are proposed for this lack of contrast - 1) Variability of the TAT-HA2 peptide
in delivery between different cell types 2) Lack of coherent scattering inherent in labeling
a diffuse biomarker. Finally, recommendations for future studies are made to overcome
these drawbacks.
5.1 HUMAN PAPILLOMAVIRUS AND CERVICAL CANCER
Cervical cancer is a preventable disease. When diagnosed early, pre-malignant
changes can easily be treated before cervical cancer develops101. The use of the
cytological Papanicolaou smear to screen the general female population for cervical pre-
cancers has been one of the most successful public health interventions to date. Pap
smear screenings between 1955 and 1992 resulted in a 74% decline in the number of

81
deaths from cervical cancer in the United States1, 102. The precursor lesions to cervical
cancer are known as squamous intraepithelial lesions (SIL) or cervical intraepithelial
neoplasias (CIN). SILs are classified as low-grade SILs (LGSILs) which include human
papillomavirus (HPV) infection and CIN grade 1; and high-grade SILs (HGSILs) which
include CIN grades 2 and 3 and CIS, according to the Bethesda System103. While
cervical cancer is not always curable, SILs are treated by removing the affected cervical
epithelium in a simple outpatient procedure that preserves fertility, the loop
electrosurgical excision procedure (LEEP). Kurman estimated that of the 50 million Pap
smears performed in the United States annually, 2.5 million (5%) show LGSIL and
cervical atypias104. Most low-grade lesions spontaneously regress and only a very few
persist or progress to high-grade lesions; typically, low grade lesions are followed for a
period of two years and treated only if they persist or progress. In the National Breast
and Cervical Cancer Detection Program, the prevalence of HGSILs was 1.1%105. About
10-20% of these high-grade lesions will progress to invasive cervical cancer if not
treated. Because of the higher risk of progression, most high-grade lesions are treated
with excisional therapy. Although effective, the low specificity of pre-cervical cancer
screening leads to many unnecessary costly and painful procedures. In the United States
(U.S.) over $6 billion are spent annually in the evaluation and treatment of low-grade
precursor lesions104. In developing countries, the high costs of detection preclude most
women from being tested and cervical cancer remains the number one reason from cancer
related deaths. Since the persistence and progression of cervical neoplasias are clearly
related to active HPV infection, detection can be vastly improved by optical technologies
that target the molecular characterization of HPV infection.
82
The link between HPV infection and cervical cancer has led to the development
of an FDA approved in vitro assay for high risk HPVs (Digene Corp, Gaithersburg,
MD)106. The assay uses chemiluminescence to indicate the presence of high risk HPV
DNA using a specific HPV RNA probe cocktail. Secondary detection of the resulting
nucleic acid hybrid leads to the signal amplification of a luminescent alkaline
phosphatase detection system. Unfortunately, HPV DNA testing is similar to the Pap
smear in that it cannot reliably predict the persistence or progression of a lesion. In fact,
HPV infections often lay latent in the host indefinitely in an episomal state and most of
these infections are cleared by cell senescence, apoptosis or the host immune system107,
108. Malignant progression of high risks HPVs is dependant on the linearization and
integration of the double stranded circular viral genome into the host DNA. Like most
viruses, HPVs use the host machinery to transcribe its proteins, which consist of 8 early
region proteins (E1-E8) encoding for viral function and 2 late region viral capsid proteins
(L1-L2). Of the early region proteins, it is the production of E6 and E7 that immortalizes
and transforms infected cells. The ability of both oncoproteins to control their cellular
environment and drive the host cell into the S-phase is vital to malignant conversion107-
109.
HPV E6 protein induces unregulated cell cycle progression by stimulating
telomerase activity and degrading the tumor-suppressor protein, p53. In normal cells,
p53 responds to and controls DNA damage by inducing G1 phase growth arrest.
Interactions of the E6 protein with host ubiquitin ligases leads to the rapid degradation of
p53 enabling sustained proliferative activity110. High risk HPV E7 proteins functions by
binding to and degrading the retinoblastoma family of tumor suppressor proteins – pRB,
83
p107, and p130108, 109, 111. In conjunction with the inactivation of cyclin-dependant kinase
inhibitors, E7 expression results in the activation of E2F-mediated gene transcription and
elevated cyclin/CDK2 levels. Unregulated CDK2 activity is thought to lead to
centrosome-mediated mitotic defects, chromosomal instability, aneuploidy and malignant
progression111. The role of E7 protein in carcinogenic transformation is evident in its
correlation to disease severity - an increasing presence of E7 with CIN progression112.
With the protein sequence of E7 being highly conserved, the detection of HPV16 E7
protein is potentially a target for the detection of cervical pre-cancers107, 108, 111.
Unfortunately, the detection of E7 is not reliable due to the unavailability of current
probes to target the protein113. The substantial overexpression and strong correlation of
p16INK4a with E7 activity however makes it an ideal biomarker for the detection of high-
grade lesions100, 114, 115. In normal cells, p16INK4a strictly regulates the activity of cyclin-
dependant kinases which prematurely phosphorylate and thereby inactivate pRb115. Thus,
the inactivation of pRb mediated through E7 results in enhanced expression of p16 levels
in HPV infected cells. The association of p16 levels to active HPV infection, shown in
figure 5.1, has led to the development of commercially available histology and cytology
staining kits for p16116, 117.

84
Figure 5.1. Histological staining of p16 through the stages of cervical intraepithelial neoplasia using CINTec. Adapted from 116.
5.2 MATERIALS AND METHODS
5.2.1 Cell Lines
Caski cervical cancer cells with an integrated HPV16 genome (roughly 600
copies per cell) as well as copies of HPV18 were used as positive controls. The cells
were maintained in RPMI-1640 medium completed with 2 mM L-glutamine adjusted to
contain 1.5 g/L sodium bicarbonate, 4.5 g/L glucose, 10 mM HEPES, and 1.0 mM
sodium pyruvate, 10% fetal bovine serum and 5% penicillin/streptomycin. MDA-MB-
435S mammary adenocarcinoma cells were used as a HPV negative cell line. These cells
were maintained in Leibovitz's L-15 medium with 2 mM L-glutamine supplemented with
0.01 mg/ml insulin, 10% fetal bovine serum, and 5% penicillin /streptomycin.

85
5.2.2 Contrast Agent
Multifunctional contrast agent was made using the protocol described previously
in section 3.5. Monoclonal anti-p16 antibodies, clone 16P07 (Lab Vision Corp) were
used for targeting the aa1-32 epitope of p16INK4a. Monoclonal anti-biotin antibodies
(Jackson Immunoresearch) were used for the attachment of biotinylated TAT-HA2
peptide.
5.2.3 Labeling and Imaging Methods
All methods used in labeling and imaging were previously described in section
4.2.
5.3 P16INK4A
LABELING RESULTS
Immunofluorescence using a primary mouse anti-p16 antibodies and a secondary
FTIC anti-mouse antibody was performed to determine the p16 level and distribution
within cultured cells. The labeling procedure is discussed in section 4.3.5. The results for
Caski (HPV+) and MDA_MB-435S (HPV-) cells are shown in Figure 5.2. There is
approximately a three fold increase in fluorescence signal in Caski cells over MDA-MB-
435S cells. The distribution of p16 appears to be evenly distributed throughout the cells.
Confocal reflectance images shown in Figure 5.3 were taken of live cells labeled
with multifunctional contrast agent targeted p16. Briefly, cells were grown on coverslips
and labeled with contrast agent for 30 minutes. Images were taken at 633nm HeNe
excitation and 623-643nm bandpass emission wavelengths. The ratio of absolute
scattering intensity levels is close to one between HPV+ and HPV- cells. The contrast is
not robust enough for discrimination in a clinical setting. There is also no appreciable
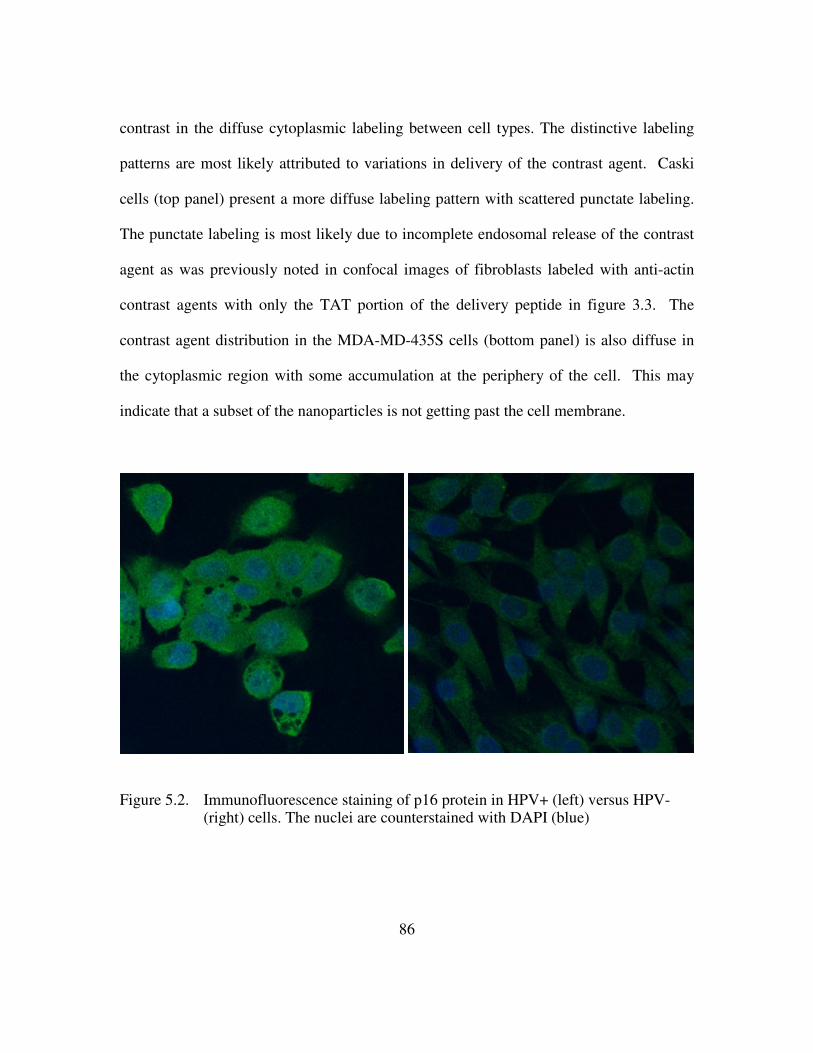
86
contrast in the diffuse cytoplasmic labeling between cell types. The distinctive labeling
patterns are most likely attributed to variations in delivery of the contrast agent. Caski
cells (top panel) present a more diffuse labeling pattern with scattered punctate labeling.
The punctate labeling is most likely due to incomplete endosomal release of the contrast
agent as was previously noted in confocal images of fibroblasts labeled with anti-actin
contrast agents with only the TAT portion of the delivery peptide in figure 3.3. The
contrast agent distribution in the MDA-MD-435S cells (bottom panel) is also diffuse in
the cytoplasmic region with some accumulation at the periphery of the cell. This may
indicate that a subset of the nanoparticles is not getting past the cell membrane.
Figure 5.2. Immunofluorescence staining of p16 protein in HPV+ (left) versus HPV- (right) cells. The nuclei are counterstained with DAPI (blue)

87
Figure 5.3. Live HPV+ (top) and HPV- (bottom) cells were labeled with 20nm gold nanoparticle functionalized with the TAT-HA2 delivery peptide and anti-p16 antibody. Confocal reflectance (left) and reflectance overlaid of transmitted images (right) are provided.
5.4 DISCUSSION : LABELING DIFFUSE BIOMARKERS
There are two potential factors contributing to the lack of high contrast between
HPV+ and HPV- negative cells using p16 protein as an intracellular target. The first is the
variability of TAT-HA2 activity in various cell lines. The rate of macropinocytosis, the
mechanism of endosomal entry used by the TAT-HA2 delivery peptide, may vary
between cell types. The composition of the endosomal membranes can also vary making
the conditions of endosomal escape slightly different in each cell type. The delivery
mechanism should be optimized for each cell type to decouple the effects of delivery

88
from biomarker labeling. This optimization can potentially be accomplished by varying
the ratio of delivery and targeting functionalities on the nanoparticle surface or by using a
different delivery peptide. The same conjugation procedure can be utilized by
biotinylating the new delivery peptide.
The second potential factor contributing to lack of contrast may lie in the
distribution of p16 within the cell. The diffuse localization of p16 does not take
advantage of the coherent scattering properties of gold nanoparticles. Without the
increase in intensity due to coherent scattering, contrast is dramatically reduced. One
method to induce close proximity and therefore plasmonic coupling between
nanoparticles is to label both p16 and its effector molecules, the cyclin-dependant
kinases. Dual targeting for this biomarker complex will not only increase coherent
scattering but will also inherently select for the functional p16 which can be used to
provide additional information.. Dual targeting can also be achieved by using antibodies
targeted to two different epitopes. To reduce to effects of steric hindrance in labeling
complexes, gold nanoparticles can be functionalized asymmetrically. A similar effort to
asymmetrically functionalize gold nanoparticles with oligonucleotides was recently
published by Xu et al118.
Since p16 is also present in the nucleus, higher contrast can potentially be
achieved by delivering contrast agent into the nucleus. This can be accomplished by
using a peptide known to function as nuclear localization sequence.
89
Chapter 6: Conclusion
6.1 SUMMARY OF RESULTS
This dissertation presents results from the development, characterization and
demonstration of feasibility of a multifunctional optical contrast agent for the imaging of
intracellular biomarkers. Various conjugation strategies are investigated before
presenting a novel approach that provides directional attachment at the Fc fragment of the
antibody to a gold nanoparticle. A range of delivery methods are examined from
surfactant aided permeabilization to protein transduction mediated delivery. The findings
of these conjugation and delivery assessments are incorporated in to a gold nanoparticle
based contrast agent with both targeting and delivery functionalities. A detailed protocol
for the production of these multifunctional plasmonic contrast agents is then given. The
ratio of antibodies on the surface of the nanoparticle is shown to be highly controllable.
Results from an in vitro polymerization assay indicate that the presence of the contrast
agent labeling does not appreciably interfere with actin polymerization. Further studies
should be completed in order to fully interrogate the effect on the contrast agent on
retaining target functionality in live cells. These studies can include functional assays
such as cell growth with and without the presence of contrast agent.
The contrast agent is validated as an intracellular sensor by imaging actin
rearrangement in live fibroblasts. The function of each component of the multifunctional
contrast agent is demonstrated using various formulations of contrast agent. The activity
of each formulation is tested using a colorimetric assay which describes the contribution
of the signal attributed to the gold nanoparticles. Nanoparticles conjugated to an
incomplete delivery peptide (only the TAT portion) remain trapped in endosomes
whereas the full TAT-HA2 peptide indicates endosomal release. The presence of a
90
targeting anti-actin antibody mediates the visualization of actin filaments and is greatly
enhanced in conjunction with the TAT-HA2 peptide. The percentage of signal in the red
channel is two times greater in cells labeled with complete conjugate over unlabeled
cells.
Several experiments were then performed to demonstrate the feasibility of gold
nanoparticle contrast agents in imaging the dynamics of actin in live cultured fibroblasts.
These analyses were performed on a small subset of cells and should be extended to a
larger subset. The preliminary results obtained, however, indicate that gold nanoparticles
may be suitable as intracellular nanosensors. Actin filaments imaged in non-motile live
fibroblasts are compared to labeling patterns seen in traditional phalloidin stained fixed
cells. This is in contrast to the yellow-orange color visualized at the leading edge of
motile fibroblasts due to plasmonic coupling of closely spaced gold nanoparticles. The
spacing was verified using transmission electron microscopy. Actin rearrangement was
visualized in motile cells including retraction and extension of filapodia. Centripetal
shortening was captured and the rate of retraction was found to be consistent with
literature values. The distribution of actin filaments were also imaged during as cells
spread over a collagen IV substrate. Labeling is first seen along filapodic extensions
between cells and then at the edges between approaching cells as they attempt to form a
sheet.
Motivation to develop an ex vivo point of care assay for HPV is then described.
Attempts to label p16 protein in HPV positive cells are presented and are compared to
immunofluorescence images used to determine p16 expression. The lack of sufficient
contrast between HPV+ and HPV- is addressed and recommendations are made for future
work.
91
6.2 FUTURE DIRECTIONS
The research presented here provides the description of a multifunctional optical
nanosensor for intracellular biomarkers. This optical contrast agent has the potential to be
used as a tool in both the fields of molecular biology and in vitro diagnostic screening.
The results with actin labeling have clearly demonstrated feasibility in labeling and
imaging molecular features. Future research should focus determining the subset of actin
labeled with these nanoparticles and that association with biological function. The first
step in this process it to use antibodies targeted to specific isoforms of actin that can be
used to investigate individual labeling patterns. Additional biological systems where actin
rearrangement is associated with a disease state should also be considered. For instance,
actin remodeling can be monitored in its association with chemotherapeutic drug
development based on signaling pathways. Since actin dynamics play a role in virtually
every aspect of biological function, its monitoring in live cells has applications far wider
than the scope of these future directions.
Although the results provided in this dissertation did not successfully validate p16
targeted gold nanoparticles in labeling live cultured cervical cancer cells, they indicate a
potential for gold nanoparticles to be used in point of care ex vivo assays. Such an assay
for p16 protein will improve both the specificity and positive predictive value of the Pap
test and further improve screening for cervical cancer. Recommendations were provided
in section 5.4 to increase contrast in targeting p16 – the optimization of delivery per
tested cell line and dual targeting p16 and its associated cyclin-dependant kinases.
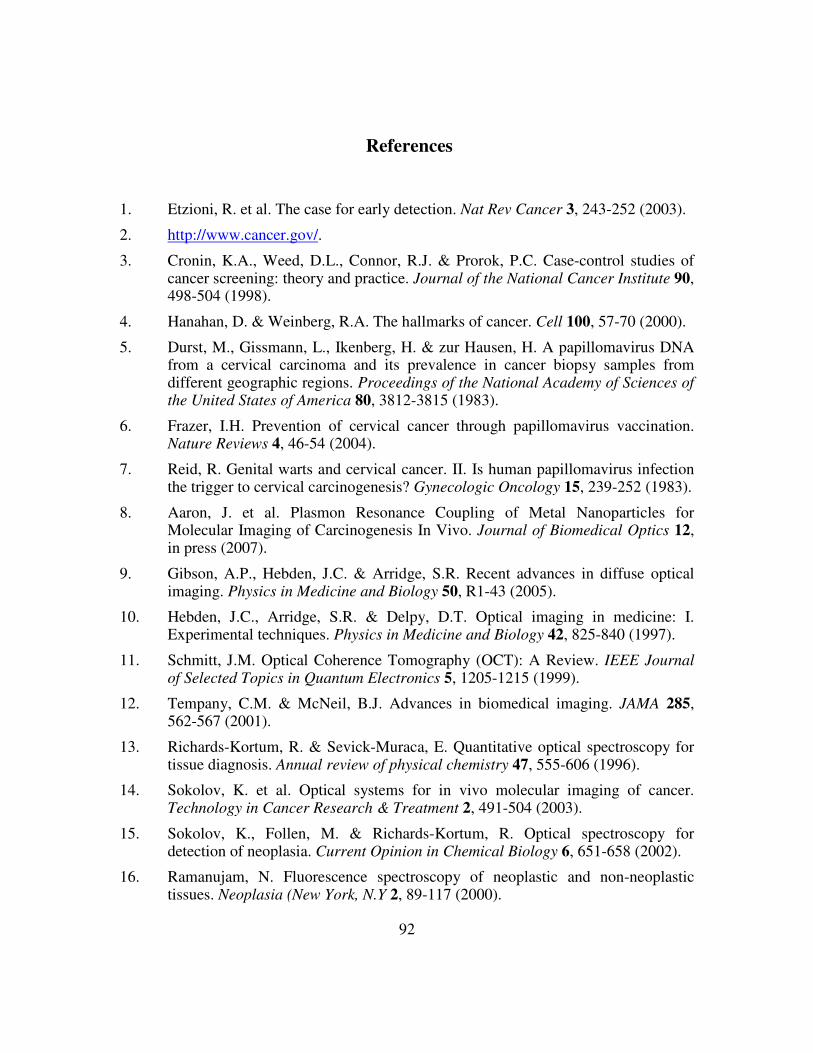
92
References
1. Etzioni, R. et al. The case for early detection. Nat Rev Cancer 3, 243-252 (2003).
2. http://www.cancer.gov/.
3. Cronin, K.A., Weed, D.L., Connor, R.J. & Prorok, P.C. Case-control studies of cancer screening: theory and practice. Journal of the National Cancer Institute 90, 498-504 (1998).
4. Hanahan, D. & Weinberg, R.A. The hallmarks of cancer. Cell 100, 57-70 (2000).
5. Durst, M., Gissmann, L., Ikenberg, H. & zur Hausen, H. A papillomavirus DNA from a cervical carcinoma and its prevalence in cancer biopsy samples from different geographic regions. Proceedings of the National Academy of Sciences of the United States of America 80, 3812-3815 (1983).
6. Frazer, I.H. Prevention of cervical cancer through papillomavirus vaccination. Nature Reviews 4, 46-54 (2004).
7. Reid, R. Genital warts and cervical cancer. II. Is human papillomavirus infection the trigger to cervical carcinogenesis? Gynecologic Oncology 15, 239-252 (1983).
8. Aaron, J. et al. Plasmon Resonance Coupling of Metal Nanoparticles for Molecular Imaging of Carcinogenesis In Vivo. Journal of Biomedical Optics 12, in press (2007).
9. Gibson, A.P., Hebden, J.C. & Arridge, S.R. Recent advances in diffuse optical imaging. Physics in Medicine and Biology 50, R1-43 (2005).
10. Hebden, J.C., Arridge, S.R. & Delpy, D.T. Optical imaging in medicine: I. Experimental techniques. Physics in Medicine and Biology 42, 825-840 (1997).
11. Schmitt, J.M. Optical Coherence Tomography (OCT): A Review. IEEE Journal of Selected Topics in Quantum Electronics 5, 1205-1215 (1999).
12. Tempany, C.M. & McNeil, B.J. Advances in biomedical imaging. JAMA 285, 562-567 (2001).
13. Richards-Kortum, R. & Sevick-Muraca, E. Quantitative optical spectroscopy for tissue diagnosis. Annual review of physical chemistry 47, 555-606 (1996).
14. Sokolov, K. et al. Optical systems for in vivo molecular imaging of cancer. Technology in Cancer Research & Treatment 2, 491-504 (2003).
15. Sokolov, K., Follen, M. & Richards-Kortum, R. Optical spectroscopy for detection of neoplasia. Current Opinion in Chemical Biology 6, 651-658 (2002).
16. Ramanujam, N. Fluorescence spectroscopy of neoplastic and non-neoplastic tissues. Neoplasia (New York, N.Y 2, 89-117 (2000).
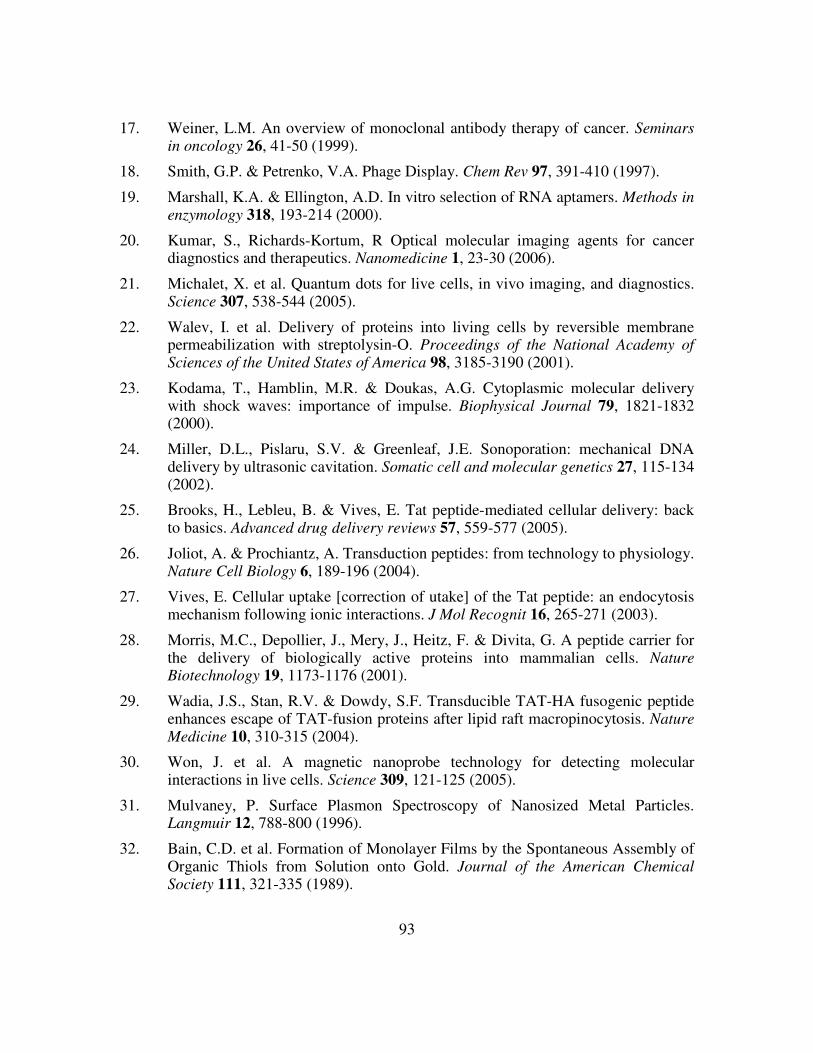
93
17. Weiner, L.M. An overview of monoclonal antibody therapy of cancer. Seminars in oncology 26, 41-50 (1999).
18. Smith, G.P. & Petrenko, V.A. Phage Display. Chem Rev 97, 391-410 (1997).
19. Marshall, K.A. & Ellington, A.D. In vitro selection of RNA aptamers. Methods in enzymology 318, 193-214 (2000).
20. Kumar, S., Richards-Kortum, R Optical molecular imaging agents for cancer diagnostics and therapeutics. Nanomedicine 1, 23-30 (2006).
21. Michalet, X. et al. Quantum dots for live cells, in vivo imaging, and diagnostics. Science 307, 538-544 (2005).
22. Walev, I. et al. Delivery of proteins into living cells by reversible membrane permeabilization with streptolysin-O. Proceedings of the National Academy of Sciences of the United States of America 98, 3185-3190 (2001).
23. Kodama, T., Hamblin, M.R. & Doukas, A.G. Cytoplasmic molecular delivery with shock waves: importance of impulse. Biophysical Journal 79, 1821-1832 (2000).
24. Miller, D.L., Pislaru, S.V. & Greenleaf, J.E. Sonoporation: mechanical DNA delivery by ultrasonic cavitation. Somatic cell and molecular genetics 27, 115-134 (2002).
25. Brooks, H., Lebleu, B. & Vives, E. Tat peptide-mediated cellular delivery: back to basics. Advanced drug delivery reviews 57, 559-577 (2005).
26. Joliot, A. & Prochiantz, A. Transduction peptides: from technology to physiology. Nature Cell Biology 6, 189-196 (2004).
27. Vives, E. Cellular uptake [correction of utake] of the Tat peptide: an endocytosis mechanism following ionic interactions. J Mol Recognit 16, 265-271 (2003).
28. Morris, M.C., Depollier, J., Mery, J., Heitz, F. & Divita, G. A peptide carrier for the delivery of biologically active proteins into mammalian cells. Nature Biotechnology 19, 1173-1176 (2001).
29. Wadia, J.S., Stan, R.V. & Dowdy, S.F. Transducible TAT-HA fusogenic peptide enhances escape of TAT-fusion proteins after lipid raft macropinocytosis. Nature Medicine 10, 310-315 (2004).
30. Won, J. et al. A magnetic nanoprobe technology for detecting molecular interactions in live cells. Science 309, 121-125 (2005).
31. Mulvaney, P. Surface Plasmon Spectroscopy of Nanosized Metal Particles. Langmuir 12, 788-800 (1996).
32. Bain, C.D. et al. Formation of Monolayer Films by the Spontaneous Assembly of Organic Thiols from Solution onto Gold. Journal of the American Chemical Society 111, 321-335 (1989).
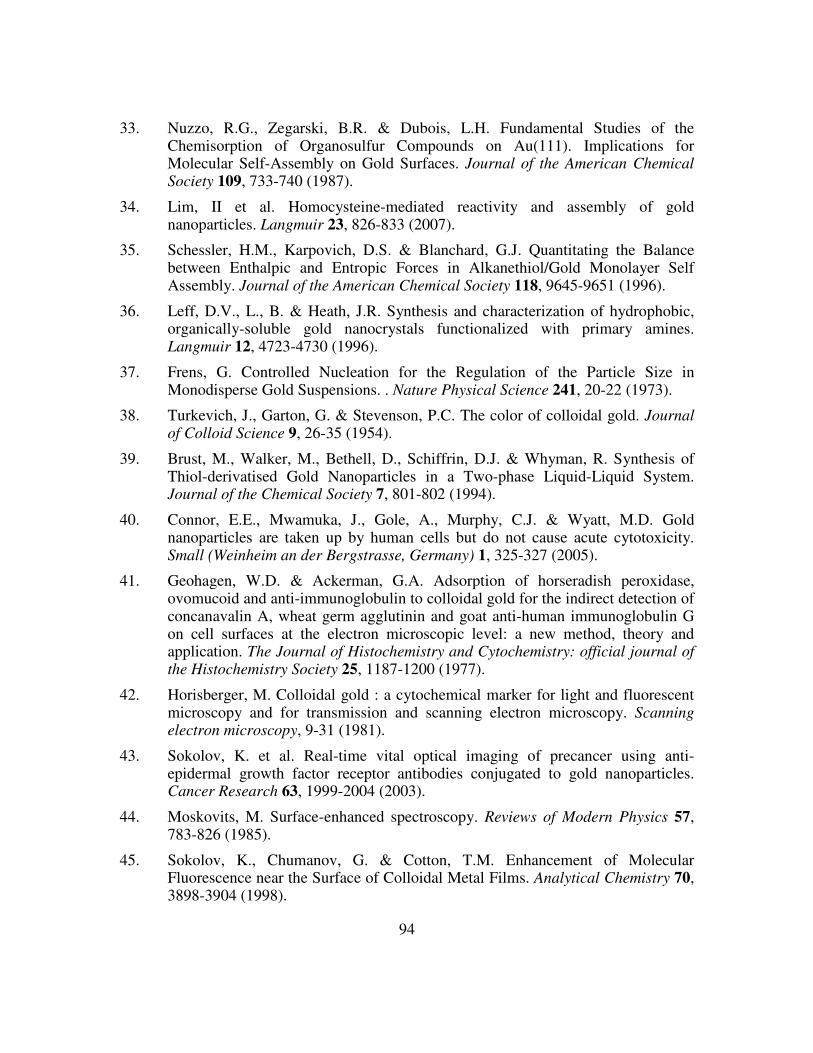
94
33. Nuzzo, R.G., Zegarski, B.R. & Dubois, L.H. Fundamental Studies of the Chemisorption of Organosulfur Compounds on Au(111). Implications for Molecular Self-Assembly on Gold Surfaces. Journal of the American Chemical Society 109, 733-740 (1987).
34. Lim, II et al. Homocysteine-mediated reactivity and assembly of gold nanoparticles. Langmuir 23, 826-833 (2007).
35. Schessler, H.M., Karpovich, D.S. & Blanchard, G.J. Quantitating the Balance between Enthalpic and Entropic Forces in Alkanethiol/Gold Monolayer Self Assembly. Journal of the American Chemical Society 118, 9645-9651 (1996).
36. Leff, D.V., L., B. & Heath, J.R. Synthesis and characterization of hydrophobic, organically-soluble gold nanocrystals functionalized with primary amines. Langmuir 12, 4723-4730 (1996).
37. Frens, G. Controlled Nucleation for the Regulation of the Particle Size in Monodisperse Gold Suspensions. . Nature Physical Science 241, 20-22 (1973).
38. Turkevich, J., Garton, G. & Stevenson, P.C. The color of colloidal gold. Journal of Colloid Science 9, 26-35 (1954).
39. Brust, M., Walker, M., Bethell, D., Schiffrin, D.J. & Whyman, R. Synthesis of Thiol-derivatised Gold Nanoparticles in a Two-phase Liquid-Liquid System. Journal of the Chemical Society 7, 801-802 (1994).
40. Connor, E.E., Mwamuka, J., Gole, A., Murphy, C.J. & Wyatt, M.D. Gold nanoparticles are taken up by human cells but do not cause acute cytotoxicity. Small (Weinheim an der Bergstrasse, Germany) 1, 325-327 (2005).
41. Geohagen, W.D. & Ackerman, G.A. Adsorption of horseradish peroxidase, ovomucoid and anti-immunoglobulin to colloidal gold for the indirect detection of concanavalin A, wheat germ agglutinin and goat anti-human immunoglobulin G on cell surfaces at the electron microscopic level: a new method, theory and application. The Journal of Histochemistry and Cytochemistry: official journal of the Histochemistry Society 25, 1187-1200 (1977).
42. Horisberger, M. Colloidal gold : a cytochemical marker for light and fluorescent microscopy and for transmission and scanning electron microscopy. Scanning electron microscopy, 9-31 (1981).
43. Sokolov, K. et al. Real-time vital optical imaging of precancer using anti-epidermal growth factor receptor antibodies conjugated to gold nanoparticles. Cancer Research 63, 1999-2004 (2003).
44. Moskovits, M. Surface-enhanced spectroscopy. Reviews of Modern Physics 57, 783-826 (1985).
45. Sokolov, K., Chumanov, G. & Cotton, T.M. Enhancement of Molecular Fluorescence near the Surface of Colloidal Metal Films. Analytical Chemistry 70, 3898-3904 (1998).
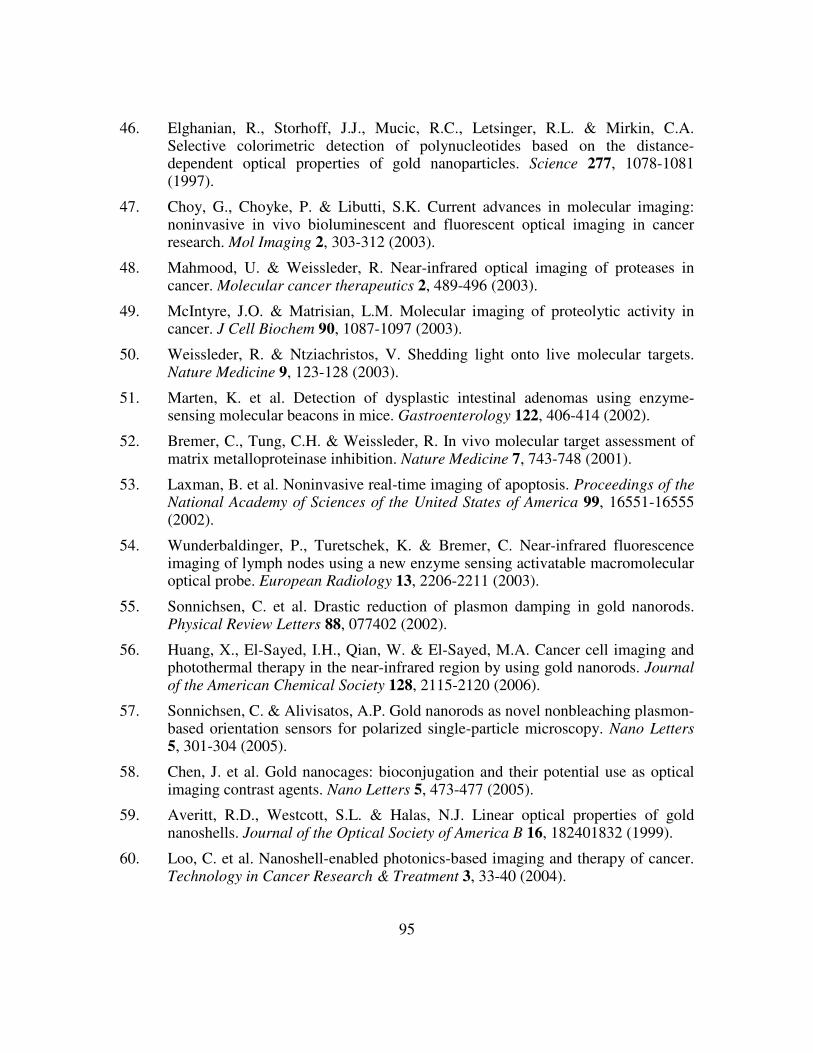
95
46. Elghanian, R., Storhoff, J.J., Mucic, R.C., Letsinger, R.L. & Mirkin, C.A. Selective colorimetric detection of polynucleotides based on the distance-dependent optical properties of gold nanoparticles. Science 277, 1078-1081 (1997).
47. Choy, G., Choyke, P. & Libutti, S.K. Current advances in molecular imaging: noninvasive in vivo bioluminescent and fluorescent optical imaging in cancer research. Mol Imaging 2, 303-312 (2003).
48. Mahmood, U. & Weissleder, R. Near-infrared optical imaging of proteases in cancer. Molecular cancer therapeutics 2, 489-496 (2003).
49. McIntyre, J.O. & Matrisian, L.M. Molecular imaging of proteolytic activity in cancer. J Cell Biochem 90, 1087-1097 (2003).
50. Weissleder, R. & Ntziachristos, V. Shedding light onto live molecular targets. Nature Medicine 9, 123-128 (2003).
51. Marten, K. et al. Detection of dysplastic intestinal adenomas using enzyme-sensing molecular beacons in mice. Gastroenterology 122, 406-414 (2002).
52. Bremer, C., Tung, C.H. & Weissleder, R. In vivo molecular target assessment of matrix metalloproteinase inhibition. Nature Medicine 7, 743-748 (2001).
53. Laxman, B. et al. Noninvasive real-time imaging of apoptosis. Proceedings of the National Academy of Sciences of the United States of America 99, 16551-16555 (2002).
54. Wunderbaldinger, P., Turetschek, K. & Bremer, C. Near-infrared fluorescence imaging of lymph nodes using a new enzyme sensing activatable macromolecular optical probe. European Radiology 13, 2206-2211 (2003).
55. Sonnichsen, C. et al. Drastic reduction of plasmon damping in gold nanorods. Physical Review Letters 88, 077402 (2002).
56. Huang, X., El-Sayed, I.H., Qian, W. & El-Sayed, M.A. Cancer cell imaging and photothermal therapy in the near-infrared region by using gold nanorods. Journal of the American Chemical Society 128, 2115-2120 (2006).
57. Sonnichsen, C. & Alivisatos, A.P. Gold nanorods as novel nonbleaching plasmon-based orientation sensors for polarized single-particle microscopy. Nano Letters 5, 301-304 (2005).
58. Chen, J. et al. Gold nanocages: bioconjugation and their potential use as optical imaging contrast agents. Nano Letters 5, 473-477 (2005).
59. Averitt, R.D., Westcott, S.L. & Halas, N.J. Linear optical properties of gold nanoshells. Journal of the Optical Society of America B 16, 182401832 (1999).
60. Loo, C. et al. Nanoshell-enabled photonics-based imaging and therapy of cancer. Technology in Cancer Research & Treatment 3, 33-40 (2004).

96
61. O'Neal, D.P., Hirsch, L.R., Halas, N.J., Payne, J.D. & West, J.L. Photo-thermal tumor ablation in mice using near infrared-absorbing nanoparticles. Cancer Letters 209, 171-176 (2004).
62. Loo, C. et al. Gold nanoshell bioconjugates for molecular imaging in living cells. Optics Letters 30, 1012-1014 (2005).
63. Alivisatos, P. The use of nanocrystals in biological detection. Nature Biotechnology 22, 47-52 (2004).
64. Chan, W.C. et al. Luminescent quantum dots for multiplexed biological detection and imaging. Current Opinion in Biotechnology 13, 40-46 (2002).
65. Dahan, M. et al. Diffusion dynamics of glycine receptors revealed by single-quantum dot tracking. Science 302, 442-445 (2003).
66. Lidke, D.S. et al. Quantum dot ligands provide new insights into erbB/HER receptor-mediated signal transduction. Nature Biotechnology 22, 198-203 (2004).
67. Wu, X. et al. Immunofluorescent labeling of cancer marker Her2 and other cellular targets with semiconductor quantum dots. Nature Biotechnology 21, 41-46 (2003).
68. Ballou, B., Lagerholm, B.C., Ernst, L.A., Bruchez, M.P. & Waggoner, A.S. Noninvasive imaging of quantum dots in mice. Bioconjugate Chemistry 15, 79-86 (2004).
69. Akerman, M.E., Chan, W.C., Laakkonen, P., Bhatia, S.N. & Ruoslahti, E. Nanocrystal targeting in vivo. Proceedings of the National Academy of Sciences of the United States of America 99, 12617-12621 (2002).
70. Gao, X., Cui, Y., Levenson, R.M., Chung, L.W. & Nie, S. In vivo cancer targeting and imaging with semiconductor quantum dots. Nature Biotechnology 22, 969-976 (2004).
71. Kim, S. et al. Near-infrared fluorescent type II quantum dots for sentinel lymph node mapping. Nature Biotechnology 22, 93-97 (2004).
72. Pante, N. & Kann, M. Nuclear pore complex is able to transport macromolecules with diameters of about 39 nm. Molecular Biology of the Cell 13, 425-434 (2002).
73. Tkachenko, A.G. et al. Cellular trajectories of peptide-modified gold particle complexes: comparison of nuclear localization signals and peptide transduction domains. Bioconjugate Chemistry 15, 482-490 (2004).
74. de la Fuente, J.M. & Berry, C.C. Tat Peptide as an Efficient Molecule To Translocate Gold Nanoparticles into the Cell Nucleus. Bioconjugate Chemistry 16, 1176-1180 (2005).
75. Koch, A.M., Reynolds, F., Merkle, H.P., Weissleder, R. & Josephson, L. Transport of surface-modified nanoparticles through cell monolayers. Chembiochem 6, 337-345 (2005).
97
76. Tkachenko, A.G. et al. Multifunctional gold nanoparticle-peptide complexes for nuclear targeting. Journal of the American Chemical Society 125, 4700-4701 (2003).
77. Cooper, J.A. & Pollard, T.D. Methods to measure actin polymerization. Methods in enzymology 85 Pt B, 182-210 (1982).
78. Kouyama, T. & Mihashi, K. Fluorimetry study of N-(1-pyrenyl)iodoacetamide-labelled F-actin. Local structural change of actin protomer both on polymerization and on binding of heavy meromyosin. European Journal of Biochemistry / FEBS 114, 33-38 (1981).
79. Lessard, J.L. Two monoclonal antibodies to actin: one muscle selective and one generally reactive. Cell Motility and the Cytoskeleton 10, 349-362 (1988).
80. Brunton, V.G., MacPherson, I.R. & Frame, M.C. Cell adhesion receptors, tyrosine kinases and actin modulators: a complex three-way circuitry. Biochimica et Biophysica Acta 1692, 121-144 (2004).
81. Owen, G.R., Meredith, D.O., ap Gwynn, I. & Richards, R.G. Focal adhesion quantification - a new assay of material biocompatibility? Review. European Cells & Materials [electronic resource] 9, 85-96; discussion 85-96 (2005).
82. Kuhn, J.R. & Pollard, T.D. Real-time measurements of actin filament polymerization by total internal reflection fluorescence microscopy. Biophysical Journal 88, 1387-1402 (2005).
83. Nicholson-Dykstra, S., Higgs, H.N. & Harris, E.S. Actin dynamics: growth from dendritic branches. Curr Biol 15, R346-357 (2005).
84. Wang, Y.L. Reorganization of actin filament bundles in living fibroblasts. The Journal of Cell Biology 99, 1478-1485 (1984).
85. Rechberger, W., et al. Optical properties of two interacting gold nanoparticles. Optics Communications 220, 137-141 (2003).
86. Yarar, D., Waterman-Storer, C.M. & Schmid, S.L. A dynamic actin cytoskeleton functions at multiple stages of clathrin-mediated endocytosis. Molecular Biology of the Cell 16, 964-975 (2005).
87. Rao, J. & Li, N. Microfilament actin remodeling as a potential target for cancer drug development. Current Cancer Drug Targets 4, 345-354 (2004).
88. Blystone, S.D. Integrating an integrin: a direct route to actin. Biochimica et Biophysica Acta 1692, 47-54 (2004).
89. Litman, P., Amieva, M.R. & Furthmayr, H. Imaging of dynamic changes of the actin cytoskeleton in microextensions of live NIH3T3 cells with a GFP fusion of the F-actin binding domain of moesin. BMC Cell Biology 1, 1 (2000).
90. Heidemann, S.R., Kaech, S., Buxbaum, R.E. & Matus, A. Direct observations of the mechanical behaviors of the cytoskeleton in living fibroblasts. The Journal of Cell Biology 145, 109-122 (1999).

98
91. Lorenz, M., DesMarais, V., Macaluso, F., Singer, R.H. & Condeelis, J. Measurement of barbed ends, actin polymerization, and motility in live carcinoma cells after growth factor stimulation. Cell Motility and the Cytoskeleton 57, 207-217 (2004).
92. Sund, S.E. & Axelrod, D. Actin dynamics at the living cell submembrane imaged by total internal reflection fluorescence photobleaching. Biophysical Journal 79, 1655-1669 (2000).
93. Hodgson, L., Qiu, W., Dong, C. & Henderson, A.J. Use of green fluorescent protein-conjugated beta-actin as a novel molecular marker for in vitro tumor cell chemotaxis assay. Biotechnology Progress 16, 1106-1114 (2000).
94. Willingham, M.C. et al. Intracellular localization of actin in cultured fibroblasts by electron microscopic immunocytochemistry. J Histochem Cytochem 29, 17-37 (1981).
95. van de Hulst, H.C. Light Scattering By Small Particles. (Dover, Mineola; 1981).
96. Mourant, J.R. et al. Light scattering from cells: the contribution of the nucleus and the effects of proliferative status. Journal of Biomedical Optics 5, 131-137 (2000).
97. Fisher, G.W., Conrad, P.A., DeBiasio, R.L. & Taylor, D.L. Centripetal transport of cytoplasm, actin, and the cell surface in lamellipodia of fibroblasts. Cell Motility and the Cytoskeleton 11, 235-247 (1988).
98. Mallavarapu, A. & Mitchison, T. Regulated actin cytoskeleton assembly at filopodium tips controls their extension and retraction. The Journal of Cell Biology 146, 1097-1106 (1999).
99. Goddette, D.W. & Frieden, C. Actin polymerization. The mechanism of action of cytochalasin D. The Journal of Biological Chemistry 261, 15974-15980 (1986).
100. Klaes, R. et al. Overexpression of p16(INK4A) as a specific marker for dysplastic and neoplastic epithelial cells of the cervix uteri. International Journal of Cancer 92, 276-284 (2001).
101. Park, T.W., Fujiwara, H. & Wright, T.C. Molecular biology of cervical cancer and its precursors. Cancer 76, 1902-1913 (1995).
102. http://www.nccc-online.org.
103. Hudson, E.A., Coleman, D.V. & Brown, C.L. The 1988 Bethesda System for reporting cervical/vaginal cytologic diagnoses. Acta Cytologica 34, 902-903 (1990).
104. Kurman, R.J., Henson, D.E., Herbst, A.L., Noller, K.L. & Schiffman, M.H. Interim guidelines for management of abnormal cervical cytology. The 1992 National Cancer Institute Workshop. JAMA 271, 1866-1869 (1994).
105. Results from the National Breast and Cervical Cancer Early Detection Program, October 31, 1991-September 30, 1993. MMWR 43, 530-534 (1994).

99
106. http://www.digene.com.
107. Duensing, S. & Munger, K. Mechanisms of genomic instability in human cancer: insights from studies with human papillomavirus oncoproteins. International Journal of Cancer 109, 157-162 (2004).
108. Munger, K. & Howley, P.M. Human papillomavirus immortalization and transformation functions. Virus Research 89, 213-228 (2002).
109. Chien, W.M., Parker, J.N., Schmidt-Grimminger, D.C., Broker, T.R. & Chow, L.T. Casein kinase II phosphorylation of the human papillomavirus-18 E7 protein is critical for promoting S-phase entry. Cell Growth Differ 11, 425-435 (2000).
110. Scheffner, M., Werness, B.A., Huibregtse, J.M., Levine, A.J. & Howley, P.M. The E6 oncoprotein encoded by human papillomavirus types 16 and 18 promotes the degradation of p53. Cell 63, 1129-1136 (1990).
111. Munger, K. et al. Biological activities and molecular targets of the human papillomavirus E7 oncoprotein. Oncogene 20, 7888-7898 (2001).
112. Middleton, K. et al. Organization of human papillomavirus productive cycle during neoplastic progression provides a basis for selection of diagnostic markers. Journal of Virology 77, 10186-10201 (2003).
113. Zur Hausen, H. Personal Communication. Heidelberg, Germany; 2005).
114. Mao, C. et al. Evaluation of a new p16(INK4A) ELISA test and a high-risk HPV DNA test for cervical cancer screening: Results from proof-of-concept study. International Journal of Cancer 120, 2435-2438 (2007).
115. Volgareva, G. et al. Protein p16 as a marker of dysplastic and neoplastic alterations in cervical epithelial cells. BMC Cancer 4, 58 (2004).
116. http://www.mtm-laboratories.com.
117. Meyer, J.L., Hanlon, D.W., Andersen, B.T., Rasmussen, O.F. & Bisgaard, K. Evaluation of p16(INK4a) expression in ThinPrep cervical specimens with the CINtec p16(INK4a) assay: correlation with biopsy follow-up results. Cancer (2007).
118. Xu, X., Rosi, N.L., Wang, Y., Huo, F. & Mirkin, C.A. Asymmetric functionalization of gold nanoparticles with oligonucleotides. Journal of the American Chemical Society 128, 9286-9287 (2006).

100
Vita
Sonia Kumar was born in Brampton, Ontario (Canada) on October 3, 1978, the
daughter of Satish and Saroj Kumar. She was raised in the suburbs of Houston, Texas
and attended William P. Clements High School, graduating in 1996. She attended
Northwestern University in Evanston, Illinois, where she earned a Bachelors of Science
degree in Biomedical Engineering in 2000. While at Northwestern, Sonia studied abroad
for a year in Australia at the University of Melbourne and Queensland University.
Following graduation, she worked for 2 years as a clinical research associate at Quintiles,
Inc in San Diego, CA. She then continued her education towards her doctorate as an NSF
Integrative Research and Training fellow at the University of Texas at Austin in the
Department of Biomedical Engineering beginning in the fall of 2002.
Permanent address: 5511 Deerbourne Chase Drive, Sugar Land, TX 78705
This dissertation was typed by the author.