Copper(II) complexes of some N-substituted bis(aminomethyl)phosphinate ligands. An integrated EPR...
12
Copper(II) complexes of some N-substituted bis(aminomethyl)phosphinate ligands. An integrated EPR study of microspeciation and coordination modes by the two-dimensional simulation method No ´ ra Veronika Nagy a , Tere ´zia Szabo ´ -Pla ´nka a, * , Gyula Tircso ´ b , Ro ´bert Kira ´ly b , Zsuzsanna A ´ rkosi c , Antal Rockenbauer c , Ern} o Bru ¨ cher b a Department of Physical Chemistry, University of Szeged, P.O. Box 105, H-6701 Szeged, Hungary b Department of Inorganic and Analytical Chemistry, University of Debrecen, P.O. Box 21, H-4010 Debrecen, Hungary c Chemical Research Center, Institute of Chemistry, Hungarian Academy of Sciences, P.O. Box 17, H-1525 Budapest, Hungary Received 21 April 2004; received in revised form 30 June 2004; accepted 2 July 2004 Available online 28 August 2004 Abstract Copper(II) complexes of bis(aminomethyl)phosphinic acid (L1), bis(N-glycino-N-methyl)phosphinic acid (L2), bis(N-benzylgly- cino-N-methyl)phosphinic acid (L3), bis(L-prolino-N-methyl)phosphinic acid (L4) and bis(iminodicarboxymethyl-N-methyl)phos- phinic acid (L5) were studied in aqueous solution by pH-potentiometric and electron paramagnetic resonance (EPR) spectroscopic methods. The EPR spectrum packages recorded at various ligand-to-metal concentration ratios and pHÕs were ana- lyzed (after matrix rank analysis by the method of residual intensities as a complementary method) by the two-dimensional com- puter simulation method, which simultaneously determines the formation constants and the EPR parameters of the various (micro)species. L1 forms mono and bis complexes in different protonation states; for the other ligands, the mono complexes are always prevalent. For steric reasons, the formation of CuL is shifted to increasingly higher pH regions in the sequence L2, L3 and L4. CuLH was identified for L3, L4 and L5, and also CuLH 2 for L4 and L5. Cu 2 L 2 was found in small amounts for L3 and L4, while it predominates at pH > 4 for L5. For L5, Cu 2 L 2 H 2 was also detected. For the ligands that form dimeric metal com- plexes in equimolar solution or at a ligand excess, Cu 2 L is formed at a metal ion excess. Ligation of the phosphinate O was suggested by indirect proofs in the protonated complexes of L1. For the ligands L2, L3 and L4, the copper(II) coordination in various species in different protonation states is reminiscent of that in the mono and bis complexes of simple amino acids. For the bis(amino- methyl)phosphinates, however, the cis positions of the amino groups in CuL are ensured by the structure of the ligand, and the iso- mers differ from each other in the (equatorial or axial) position of the second carboxylate group. Ó 2004 Elsevier Inc. All rights reserved. Keywords: Electron paramagnetic resonance; Copper(II) complexes; N-Substituted bis(aminomethyl)phosphinic acids; Microspeciation; Coordina- tion modes 1. Introduction Our recently developed two-dimensional (2D) elec- tron paramagnetic resonance (EPR) simulation method [1] offers data on both the speciation and the coordination modes in paramagnetic equilibrium systems from the simultaneous analysis of series of EPR spectra recorded at various metal and ligand concentrations and pHs. In this approach, the EPR intensity is considered to be a function of two independent variables: the magnetic field and the 0162-0134/$ - see front matter Ó 2004 Elsevier Inc. All rights reserved. doi:10.1016/j.jinorgbio.2004.07.001 * Corresponding author. Tel.: +36-62-546-368; fax: +36-62-544-652. E-mail address: [email protected] (T. Szabo ´ -Pla ´nka). www.elsevier.com/locate/jinorgbio Journal of Inorganic Biochemistry 98 (2004) 1655–1666 JOURNAL OF Inorganic Biochemistry
-
Upload
independent -
Category
Documents
-
view
3 -
download
0
Transcript of Copper(II) complexes of some N-substituted bis(aminomethyl)phosphinate ligands. An integrated EPR...
JOURNAL OF
www.elsevier.com/locate/jinorgbio
Journal of Inorganic Biochemistry 98 (2004) 1655–1666
InorganicBiochemistry
Copper(II) complexes of some N-substitutedbis(aminomethyl)phosphinate ligands. An integrated EPR study of
microspeciation and coordination modes by thetwo-dimensional simulation method
Nora Veronika Nagy a, Terezia Szabo-Planka a,*, Gyula Tircso b, Robert Kiraly b,Zsuzsanna Arkosi c, Antal Rockenbauer c, Ern}o Brucher b
a Department of Physical Chemistry, University of Szeged, P.O. Box 105, H-6701 Szeged, Hungaryb Department of Inorganic and Analytical Chemistry, University of Debrecen, P.O. Box 21, H-4010 Debrecen, Hungary
c Chemical Research Center, Institute of Chemistry, Hungarian Academy of Sciences, P.O. Box 17, H-1525 Budapest, Hungary
Received 21 April 2004; received in revised form 30 June 2004; accepted 2 July 2004
Available online 28 August 2004
Abstract
Copper(II) complexes of bis(aminomethyl)phosphinic acid (L1), bis(N-glycino-N-methyl)phosphinic acid (L2), bis(N-benzylgly-
cino-N-methyl)phosphinic acid (L3), bis(LL-prolino-N-methyl)phosphinic acid (L4) and bis(iminodicarboxymethyl-N-methyl)phos-
phinic acid (L5) were studied in aqueous solution by pH-potentiometric and electron paramagnetic resonance (EPR)
spectroscopic methods. The EPR spectrum packages recorded at various ligand-to-metal concentration ratios and pH�s were ana-
lyzed (after matrix rank analysis by the method of residual intensities as a complementary method) by the two-dimensional com-
puter simulation method, which simultaneously determines the formation constants and the EPR parameters of the various
(micro)species. L1 forms mono and bis complexes in different protonation states; for the other ligands, the mono complexes are
always prevalent. For steric reasons, the formation of CuL is shifted to increasingly higher pH regions in the sequence L2, L3
and L4. CuLH was identified for L3, L4 and L5, and also CuLH2 for L4 and L5. Cu2L2 was found in small amounts for L3
and L4, while it predominates at pH > 4 for L5. For L5, Cu2L2H2 was also detected. For the ligands that form dimeric metal com-
plexes in equimolar solution or at a ligand excess, Cu2L is formed at a metal ion excess. Ligation of the phosphinate O was suggested
by indirect proofs in the protonated complexes of L1. For the ligands L2, L3 and L4, the copper(II) coordination in various species
in different protonation states is reminiscent of that in the mono and bis complexes of simple amino acids. For the bis(amino-
methyl)phosphinates, however, the cis positions of the amino groups in CuL are ensured by the structure of the ligand, and the iso-
mers differ from each other in the (equatorial or axial) position of the second carboxylate group.
� 2004 Elsevier Inc. All rights reserved.
Keywords: Electron paramagnetic resonance; Copper(II) complexes; N-Substituted bis(aminomethyl)phosphinic acids; Microspeciation; Coordina-
tion modes
1. Introduction
Our recently developed two-dimensional (2D) elec-tron paramagnetic resonance (EPR) simulation
0162-0134/$ - see front matter � 2004 Elsevier Inc. All rights reserved.
doi:10.1016/j.jinorgbio.2004.07.001
* Corresponding author. Tel.: +36-62-546-368; fax: +36-62-544-652.
E-mail address: [email protected] (T. Szabo-Planka).
method [1] offers data on both the speciation and
the coordination modes in paramagnetic equilibrium
systems from the simultaneous analysis of series ofEPR spectra recorded at various metal and ligand
concentrations and pHs. In this approach, the EPR
intensity is considered to be a function of two
independent variables: the magnetic field and the

L1: R1 = H, R 2 = H
L2: R1 = H, R 2 = CH2COO−
L3: R1 = CH2C6H5, R2 = CH2COO−
L4: R1R2N =
L5: R1 = CH2COO−, R2 = CH2COO−
R1N P P
R1
O−
O
R2 R2
NCO O −
Fig. 1. Structures of the ligands studied.
1656 N.V. Nagy et al. / Journal of Inorganic Biochemistry 98 (2004) 1655–1666
concentration, and in the iteration procedure the for-
mation constants and the individual EPR parameters
for the various species are adjusted simultaneously.
As the EPR parameters rather sensitively reflect the
changes in the first coordination sphere, there is a
good chance of identifying the isomers of variouscomplexes (microspecies) and of detecting oligomeri-
zation.
In consequence of their biological activities, many
aminophosphinate ligands with the phosphinate
groups in terminal positions have been studied. In re-
cent years, a number of c-aminobutyric acidB antago-
nists have been developed, phosphinic acids occupying
a prominent position among them [2–4]. The coordi-nation abilities of the phosphinate and carboxylate
groups have been found to be similar, though the sta-
bility constants of the aminophosphinate complexes
are lower than those of the corresponding aminocarb-
oxylate complexes [5], the phosphinic acid being more
acidic than the carboxylic acid. When a peptide bond
is substituted by the phosphinate moiety, the resulting
molecule furnishes a convenient mimic of a substratein the transition state for some hydrolytic enzymes
[6–9]. Multidentate ligands containing in-chain phos-
phinate groups exhibit biological activity and a strong
coordination ability: they are applied as inhibitors of a
number of bacterial enzymes [6–9], and symmetric
phosphinic acids have been found to be powerful
inhibitors of Human Immunodeficiency Virus protease
[10]; bis(LL-prolino-N-methyl)phosphinic acid andbis(iminodicarboxymethyl-N-methyl)phosphinic acid,
ligands studied in the present paper, have been shown
to have plant growth-regulating properties [11–14].
For ligands of the latter type, essentially amino acid-
like behavior is expected because of the aminocarb-
oxylate donor groups. One interesting question
that arises is the role of the phosphinate group in
the complexation.We report here on an EPR study of the copper(II)
complexes of five N-substituted bis(aminomethyl)phos-
phinic acids, formed in aqueous solution in the pH range
2–10. We set out to characterize all detectable
(micro)species, by identifying their coordinating donor
groups, to seek information on the coordination ability
of the phosphinate moiety, and to clarify the roles of
various coordinating and noncoordinating substituentsin the complexation process. As the 2D spectrum
decomposition demands a knowledge of the formation
constants of the proton complexes, and also good start-
ing values for the parameters of the metal complexes,
the above systems were additionally studied by
pH-potentiometry, and the number of independent
EPR-active species also was checked by a model-free,
purely mathematical analysis of spectrum packages:matrix rank analysis (MRA) by the method of residual
intensities [15].
2. Experimental
2.1. Reagents and solutions
The following ligands (denoted by L in their deprot-
onated forms) were synthesized via Mannich-typereactions: bis(aminomethyl)phosphinic acid (L1),
bis(N-glycino-N-methyl)phosphinic acid (L2), bis
(N-benzylglycino-N-methyl)phosphinic acid (L3), bis(LL-
prolino-N-methyl)phosphinic acid (L4) and bis(iminodi-
carboxymethyl-N-methyl)phosphinic acid (L5). The
solvents and reagents used in the preparative work were
commercially available chemicals (Aldrich, Sigma, Flu-
ka or Spektrum 3D), and were used without furtherpurification. The purity of the ligands was controlled
by 1H, 13C and 31P NMR spectroscopy. The concentra-
tions of the stock solutions of the ligands were deter-
mined pH-potentiometrically. The details of the
syntheses of L4 and L5 were published earlier [16]. L1
was synthesized by the debenzylation of bis[(dibenzyl-
amino)methyl]phosphinic acid in aqueous acetic acid
[14]. The physical data on the product are in good agree-ment with the data published by Maier [13]. L2 and L3
were prepared by a modification of the procedure re-
ported by Dhansay et al. [11]. The structures of the lig-
ands are shown in Fig. 1. (For simplicity, the charges on
the various complexes are neglected throughout the text
and in the tables.)
2.2. pH-potentiometric measurements
The titrations were carried out at 298.0 K, at an ionic
strength I = 1.0 M tetramethylammonium chloride, un-
der an argon atmosphere. The ligand concentrations
were 2 or 4 mM, depending on the ligand-to-metal con-
centration ratio (which was 1:1, 2:1, 3:1 or 1:2). 0.20 M
tetramethylammonium hydroxide solution was used as
titrant. A Radiometer pHM 85 precision pH-meterequipped with a Metrohm 6.0234.100 combined glass
electrode and an ABU 80 autoburet were utilized for
N.V. Nagy et al. / Journal of Inorganic Biochemistry 98 (2004) 1655–1666 1657
the measurements. The protonation constants of the lig-
ands and the stability constants of the complexes were
computed with the program PSEQUAD [17]. The liq-
uid-junction potential of the electrode was taken into
consideration via the method proposed by Irving et al.
[18].
2.3. EPR Measurements
The copper(II) concentration was 5 mM, while the
ligand-to-metal concentration ratios were 1:2, 1:1 and
5:1, except for the case of L4, where the ligand excess
was 10-fold. The initial pH was adjusted with 0.2 M
HCl solution. 0.2 M NaOH solution was then addedfrom a Metrohm 765 Dosimat apparatus to the 10-cm3
sample to adjust the chosen pH, which was measured
to an accuracy of 0.01 pH unit with a Radiometer
PHN 240 potentiometer equipped with a Radiometer
GK2401C combined glass electrode. The electrode was
calibrated with IUPAC Standard Buffers from Radiom-
eter. During the titration, the sample was mixed by bub-
bling gaseous argon through the solution. A MasterflexCL peristaltic pump ensured the circulation (14 cm3
min�1) of the solution through the capillary tube in
the cavity. The EPR spectra were recorded after circula-
tion for 2 min at room temperature (291 K) on an up-
graded JEOL JES-FE3X spectrometer with 100-kHz
field modulation, using manganese(II)-doped MgO
powder for the calibration of g. All the details of the
measurements are given in a previous paper [19].For each of the various systems, 20–32 EPR spectra
were recorded. At a 2-fold metal excess, precipitation
occurred at about pH 6 in each system. At equal metal
and ligand concentrations, the pH of the appearance
of the precipitate was shifted to 6.5, 8.5 and 10.7 for
L1, L2 and L3, respectively. For L4, hydrolysis occurred
at pH > 10. In the case of L5, precipitation was observed
at ligand-to-metal concentration ratios of both 1:1 and5:1 (at pH 8.5 and 10.6, respectively).
2.4. Preparation of spectra for evaluation
The spectral analysis was preceded by elimination of
the background signal, which contained the vanadium
signal of the Pyrex tube and the Mn peaks of the
Mn:MgO external standard. To compensate the minorfrequency shifts in the course of measurements, the field
scale was shifted to secure a perfect fit for the Mn lines
of the external standard.
2.5. Matrix rank analysis
The number of independent EPR-active species was
determined by calculating the residual intensity curveswith the program MRA [15].
2.6. Decomposition of spectra
The series of spectra were evaluated with the program
2D_EPR [1]. Each component curve was described by
the parameters go, the copper and ligand hyperfine cou-
pling constants Ao and aNo, and the relaxation parame-ters a, b and c, which are related to the widths of the
copper lines as rMI ¼ aþ bMI þ cM2I (MI is the mag-
netic quantum number of copper nuclei). Since the cop-
per(II) (as chloride) used to make the stock solution was
a natural mixture of the isotopes, the spectrum of each
species was calculated as the sum of spectra containing63Cu and 65Cu weighted by their abundances in nature.
The copper and ligand coupling constants and the relax-ation parameters with field dimensions are given in units
of gauss (G) throughout the paper; 1 G = 10�4 T.
For each spectrum, the computer program provides
the noise-corrected regression parameter (Rj for the jth
spectrum) derived from the average square deviation
(SQD) between the experimental and the calculated
spectrum. For the series of spectra, the fit is character-
ized by the overall regression coefficient R, calculatedfrom the overall average SQD (the sum of the SQD val-
ues for the various curves in the series). To compare
alternative models, the program also furnishes the criti-
cal value of the difference in overall regression coeffi-
cients (DRcrit), which shows whether the species in
question, included in or omitted from the model, causes
a significant change in the spectral fit or not. The details
of the statistical analysis were published previously [1].
3. Results and discussion
3.1. Equilibrium models in various systems
Matrix rank analysis [15], a model-free mathematical
analysis of the spectrum package, can help to build upthe equilibrium model, as it furnishes the number of
the independent EPR-active species represented in the
spectra. We illustrate the results of MRA in the case
of the copper(II)–L1 system, for which the series of
experimental EPR spectra is depicted in Fig. 2. Fig. 3
shows the gradual reduction of the residual intensities
at various fields, obtained for the above spectrum pack-
age by MRA, as more and more EPR-active species areassumed. The residual intensity reaches the value of
noise at 6 independent complexes. (The disappearance
of the last small peak near 3000 G can be better seen
in the enlarged part (b) of Fig. 3.) MRA resulted in 2,
4, 6 and 5 independent species for L2, L3, L4 and L5,
respectively. This can be a good starting point for the
subsequent 2D-analysis, though MRA cannot distin-
guish those species which are present in constant con-centration ratio in all spectra (e.g., isomers at constant
(a)
(b)
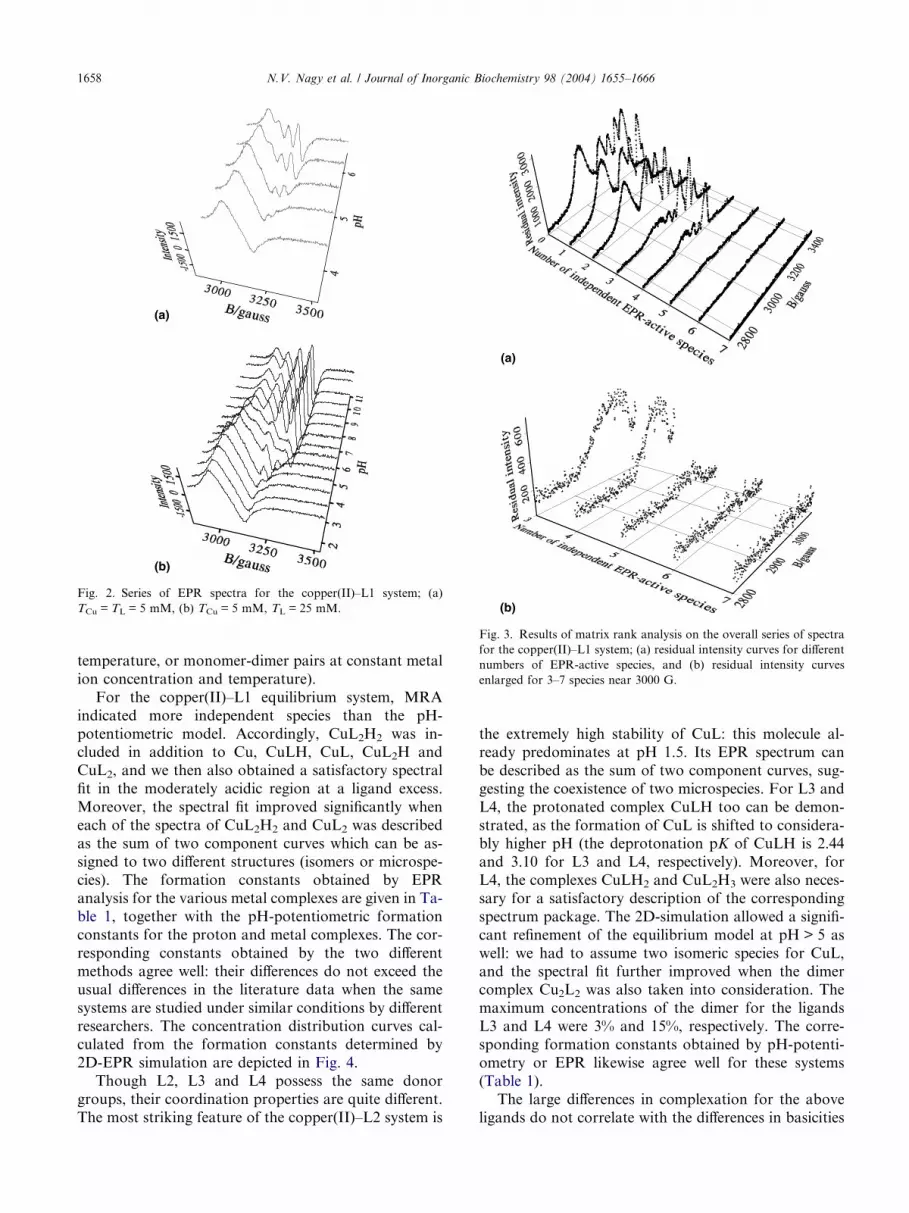
Fig. 2. Series of EPR spectra for the copper(II)–L1 system; (a)
TCu = TL = 5 mM, (b) TCu = 5 mM, TL = 25 mM.
(a)
(b)
Fig. 3. Results of matrix rank analysis on the overall series of spectra
for the copper(II)–L1 system; (a) residual intensity curves for different
numbers of EPR-active species, and (b) residual intensity curves
enlarged for 3–7 species near 3000 G.
1658 N.V. Nagy et al. / Journal of Inorganic Biochemistry 98 (2004) 1655–1666
temperature, or monomer-dimer pairs at constant metal
ion concentration and temperature).
For the copper(II)–L1 equilibrium system, MRA
indicated more independent species than the pH-
potentiometric model. Accordingly, CuL2H2 was in-cluded in addition to Cu, CuLH, CuL, CuL2H and
CuL2, and we then also obtained a satisfactory spectral
fit in the moderately acidic region at a ligand excess.
Moreover, the spectral fit improved significantly when
each of the spectra of CuL2H2 and CuL2 was described
as the sum of two component curves which can be as-
signed to two different structures (isomers or microspe-
cies). The formation constants obtained by EPRanalysis for the various metal complexes are given in Ta-
ble 1, together with the pH-potentiometric formation
constants for the proton and metal complexes. The cor-
responding constants obtained by the two different
methods agree well: their differences do not exceed the
usual differences in the literature data when the same
systems are studied under similar conditions by different
researchers. The concentration distribution curves cal-culated from the formation constants determined by
2D-EPR simulation are depicted in Fig. 4.
Though L2, L3 and L4 possess the same donor
groups, their coordination properties are quite different.
The most striking feature of the copper(II)–L2 system is
the extremely high stability of CuL: this molecule al-
ready predominates at pH 1.5. Its EPR spectrum can
be described as the sum of two component curves, sug-
gesting the coexistence of two microspecies. For L3 and
L4, the protonated complex CuLH too can be demon-
strated, as the formation of CuL is shifted to considera-bly higher pH (the deprotonation pK of CuLH is 2.44
and 3.10 for L3 and L4, respectively). Moreover, for
L4, the complexes CuLH2 and CuL2H3 were also neces-
sary for a satisfactory description of the corresponding
spectrum package. The 2D-simulation allowed a signifi-
cant refinement of the equilibrium model at pH > 5 as
well: we had to assume two isomeric species for CuL,
and the spectral fit further improved when the dimercomplex Cu2L2 was also taken into consideration. The
maximum concentrations of the dimer for the ligands
L3 and L4 were 3% and 15%, respectively. The corre-
sponding formation constants obtained by pH-potenti-
ometry or EPR likewise agree well for these systems
(Table 1).
The large differences in complexation for the above
ligands do not correlate with the differences in basicities

Table 1
Formation constants as log ba for the proton and copper(II) complexes of the various bis(aminomethyl)phosphinate ligands
Complex Ligand
L1 L2 L3 L4 L5
EPRb pH-pot. EPRb pH-pot. EPRb pH-pot. EPRb pH-pot.c EPRb pH-pot.
LH 9.05(2) 9.00(1) 9.22(2) 10.92(2) 10.01(1)
LH2 16.50(2) 15.53(2) 14.78(3) 18.27(3) 16.51(1)
LH3 18.06(2) 16.91(6) 20.27(6) 19.19(2)
LH4 19.72(3) 18.3(2) 21.57(6) 21.36(2)
LH5 22.74(6)
Cu2L 16.13(6) 16.25(9) 18.32(4) 23.03(8) 23.0(1)
CuLH2 20.30(2) 23.13(4)
CuLH 13.65(2) 13.6(1) 15.94(1) 15.92(6) 18.50(1) 18.44(9) 21.38(3) 22.1(2)
Cu2L2H2 45.24(6)
CuL 8.48(1) 8.30(6) 17.30d 17.4(2) 13.50d 13.44(6) 15.40d 15.36(9) 17.5(1) 19.3(2)
Isomer 1 17.28(1) 13.40(1) 15.28(1)
Isomer 2 16.62(2) 12.82(1) 14.78(2)
Cu2L2 27.62(7) 32.19(1) 40.0(1)
CuL2H3 38.95(1)
CuL2H2 26.86d
Isomer 1 26.66(7)
Isomer 2 26.42(8)
CuL2H 21.69(1) 21.53(7)
CuL2 14.88d 14.65(7)
Isomer 1 14.72(1)
Isomer 2 14.37(1)
a The confidence intervals (3r) of the last digit at a significance level of 99.7% are given in parentheses.b For the proton complexes, the pH-potentiometric formation constants were used in the EPR analysis, too.c Data taken from [14] (I = 1.0 M KNO3).d log b = log (bisomer1 + bisomer2).
(a)
(b)
Fig. 4. Concentration distribution in the copper(II)–L1 system,
calculated from the EPR spectroscopic formation constants at (a)
TCu = TL = 5 mM, and (b) TCu = 5 mM, TL = 25 mM.
N.V. Nagy et al. / Journal of Inorganic Biochemistry 98 (2004) 1655–1666 1659
of their donor groups. The pK values of 9.00, 6.53 and
9.22, 5.56 for the N atoms of L2 and L3, respectively
(Table 1), reflect moderate basicities, while for L4, the
donor groups are much more basic (with pK values of10.92 and 7.35, Table 1). At the same time, an extremely
high stability of CuL can be observed for L2, while for
L3, and particularly for L4, this complex is formed at
much higher pH (see above), pointing to significant
steric hindrance caused by the noncoordinating
substituents (L3) or the rigid structure: for the proline
derivative (L4), this effect suppresses even the fairly high
basicities of the donors.The presence of the additional carboxymethyl substit-
uents on the N atoms in L5 considerably enhances the
tendency of the complexes to dimerize: the monomer–di-
mer pairs CuLH and Cu2L2H2 could be identified in the
strongly acidic region, as could CuL and Cu2L2 at
pH > 4; in the latter case, the dimer became prevalent.
Here, larger differences can be observed between the
EPR and pH-potentiometric formation constants (Table1), which may be attributed to the fact that dimer for-
mation was not considered in the latter method. The dis-
tribution of copper(II) amongst the various complexes
at a 5-fold ligand excess is shown in Fig. 5, and that
at a 2-fold metal excess in Fig. 6. It is noteworthy that,
in parallel with the increasing tendency of CuL to form

Table 2
Ratio of DR to DRcritical in the various copper(II)-bis(amino-
methyl)phosphinate systems for different equilibrium models
Neglected species Ligand
L1 L2 L3 L4 L5
[CuLH2]a 46.7 9.2
[Cu2L2H2]a 4.9
[CuL]a 1.5
[CuL]b 10.0 42.9 44.9
[Cu2L2]a 8.9 534.9
[CuL2H3]a 698.5
[CuL2H2]b 3.4
[CuL2H2]a 20.7
[Cu2L]a 122.6 28.3 808.7
a The given species was not taken into consideration at all.b One or other of the isomers of the given species was neglected.
(a)
(b)
(c)
(d)
Fig. 5. Concentration distribution calculated from the EPR spectro-
scopic formation constants at a 5-fold ligand excess in the (a)
copper(II)–L2, (b) copper(II)–L3, (c) copper(II)–L4 and (d) cop-
per(II)–L5 systems.
(a)
(b)
(c)
Fig. 6. Concentration distribution calculated from the EPR spectro-
scopic formation constants at a 2-fold metal ion excess in the (a)
copper(II)–L3, (b) copper(II)–L4 and (c) copper(II)–L5 systems.
1660 N.V. Nagy et al. / Journal of Inorganic Biochemistry 98 (2004) 1655–1666
dimers (Fig. 5), the maximum concentration of the binu-
clear Cu2L increases in the sequence L3, L4, L5 (Fig. 6).
3.2. Verification of the equilibrium models
The best model for each system results in a good
spectral fit: the overall regression coefficient R for each
system lies between 0.99017 and 0.99528. When any,
even minor species involved in the best model is ne-
glected, the decrease in R significantly exceeds the criti-
cal value (Table 2). (The only exception is the complex
CuL of L5, where the decrease in R is only slightly high-
er than the critical value.) Fig. 7 illustrates the deteriora-

(a)
(b)
(c)
(d)
Fig. 7. Experimental and calculated EPR spectra in the copper(II)–L4
system for the best model (upper spectra) and for models when one or
other of the complexes was neglected (lower spectra), near the
maximum concentration of the species in question (a) [CuLH2], pH
1.76; (b) [CuL]�, pH 9.00; (c) [CuL2H3]�, pH 2.89; and (d) [Cu2L]
+, pH
2.96. The metal and ligand concentrations were: (a)–(c) Tcu = 5 mM,
TL = 50 mM; (d) Tcu = TL = 5 mM.
N.V. Nagy et al. / Journal of Inorganic Biochemistry 98 (2004) 1655–1666 1661
tion in the fit for some individual spectra in the cop-
per(II)–L4 system when species featuring in the best
model are neglected.
3.3. Confidence levels of parameters
The EPR parameters for the various complexes are
presented in Table 3, while the component spectra calcu-lated from them are depicted in Fig. 8. The low confi-
dence level intervals (3r at a significance level of
99.7%) reveal the good sensitivity of the fit to the param-
eters go and Ao. The higher 3r values for Cu2L,
Cu2L2H2 and Cu2L2 can be attributed to the broad,
poorly-resolved spectra.
3.4. EPR parameters and coordination modes
When stronger ligand field donors replace the weak O
atoms of water molecules in the equatorial coordination
around the copper(II) ion, the increase in the energy of
the dxy dx2�y2 electronic transition decreases gi, andthereby go (go = (gi + 2g^)/3) (g^ is affected to a much
lower extent) [20]. The go shift is significantly higher
for an equatorial amino N (about 0.030 for the first,
and 0.015–0.020 for the subsequent ones) than for a
carboxylate O (approximately 0.005–0.01) [21]. Axial
coordination of any donor group to copper(II) in the
dx2�y2 ground state has only minor effects on go and
Ao. Accordingly, the go values inform reliably on thenumber of amino N atoms in equatorial positions, and
the equatorial ligation of carboxylate O atoms also
can be detected by the comparison of go for the various
species.
The decrease in go is accompanied by an increase in
Ao for copper(II) complexes with effective D4h symmetry
[22–24]. An opposite trend is indicative of rhombic dis-
tortion [22–26]. There was a trend for the linewidths todecrease together with go, i.e., we obtained better-re-
solved spectra for species with stronger ligand fields (a
lower go reflects a stronger ligand field; see above). This
trend can be explained by the fact that the major relax-
ation parameter a is proportional to the square of the
anisotropy of the g tensor, and the value of go generally
(though not necessarily) varies in parallel with the aniso-
tropic contributions of the Zeeman interaction. Unusu-ally broad lines for complexes with strong ligand fields
suggest an enhanced magnetic dipole interaction be-
tween the paramagnetic centers as a result of oligomeri-
zation [22–26]. Based on the comparison of go, Ao, and
linewidth data, with regard to the above considerations,
we suggest the following coordination modes for the
various species.
3.5. The copper(II)–L1 system
The gradual decrease in go (Table 3) demonstrates
that the stepwise proton loss from the mono and bis
complexes is accompanied by the equatorial binding of
the corresponding amino group, in accordance with
expectations (except isomer 2 of CuL2). The question
arises of whether the phosphinate group takes part inthe coordination or not. Though below pH 3 no phosph-
inate binding could be detected by EPR, it likely occurs
in strongly acidic solutions: Kubicek et al. [27] could
crystallize the complex all-trans-[CuCl2(H2L)2-
(H2O)2]Cl2 in the range pH 2–3, where the amino groups
are protonated, and the crystallographic studies [27]
showed monodentate phosphinate coordination. Proba-
bly, the ligation of this weak donor induces only negligi-ble changes in the ligand field, and consequently in the
magnetic parameters of the aqua complex, and thus
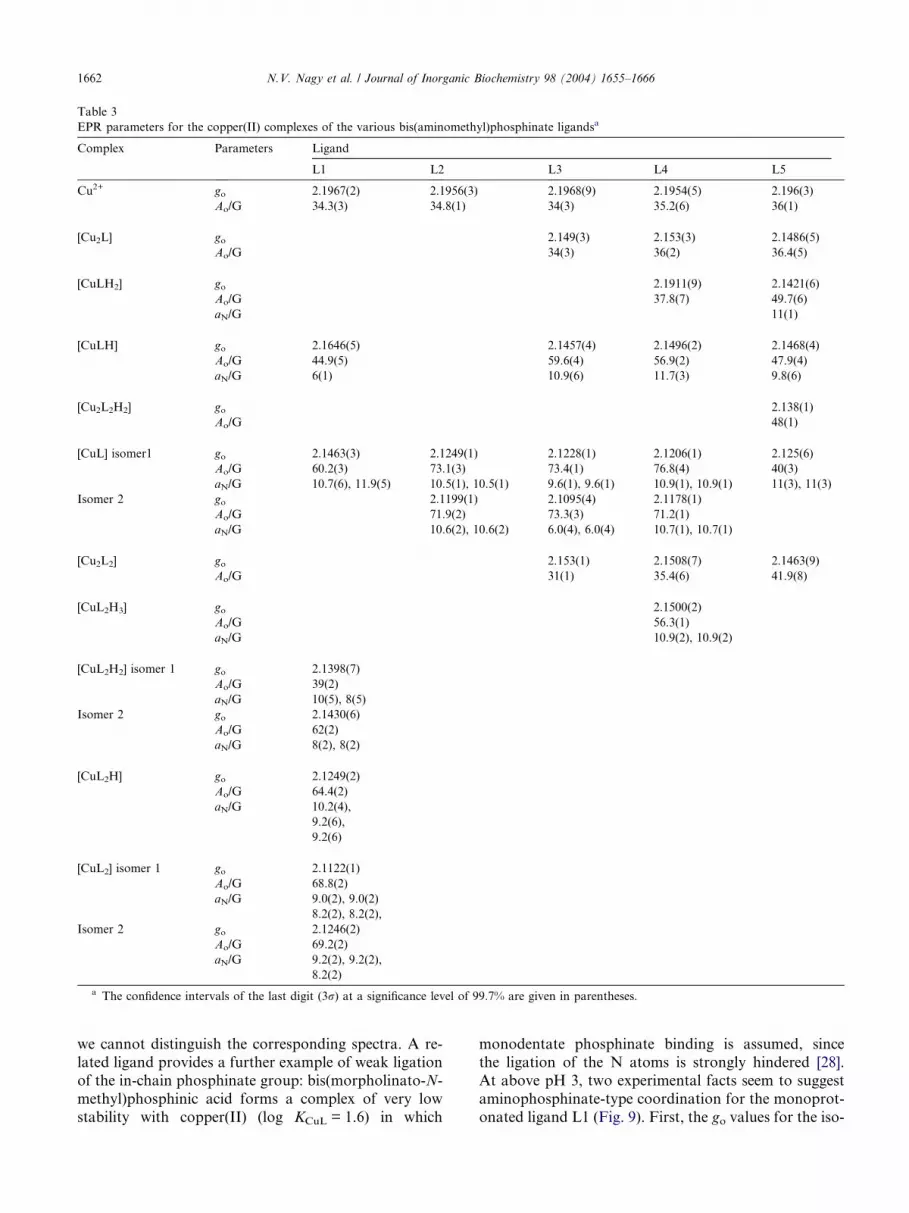
Table 3
EPR parameters for the copper(II) complexes of the various bis(aminomethyl)phosphinate ligandsa
Complex Parameters Ligand
L1 L2 L3 L4 L5
Cu2+ go 2.1967(2) 2.1956(3) 2.1968(9) 2.1954(5) 2.196(3)
Ao/G 34.3(3) 34.8(1) 34(3) 35.2(6) 36(1)
[Cu2L] go 2.149(3) 2.153(3) 2.1486(5)
Ao/G 34(3) 36(2) 36.4(5)
[CuLH2] go 2.1911(9) 2.1421(6)
Ao/G 37.8(7) 49.7(6)
aN/G 11(1)
[CuLH] go 2.1646(5) 2.1457(4) 2.1496(2) 2.1468(4)
Ao/G 44.9(5) 59.6(4) 56.9(2) 47.9(4)
aN/G 6(1) 10.9(6) 11.7(3) 9.8(6)
[Cu2L2H2] go 2.138(1)
Ao/G 48(1)
[CuL] isomer1 go 2.1463(3) 2.1249(1) 2.1228(1) 2.1206(1) 2.125(6)
Ao/G 60.2(3) 73.1(3) 73.4(1) 76.8(4) 40(3)
aN/G 10.7(6), 11.9(5) 10.5(1), 10.5(1) 9.6(1), 9.6(1) 10.9(1), 10.9(1) 11(3), 11(3)
Isomer 2 go 2.1199(1) 2.1095(4) 2.1178(1)
Ao/G 71.9(2) 73.3(3) 71.2(1)
aN/G 10.6(2), 10.6(2) 6.0(4), 6.0(4) 10.7(1), 10.7(1)
[Cu2L2] go 2.153(1) 2.1508(7) 2.1463(9)
Ao/G 31(1) 35.4(6) 41.9(8)
[CuL2H3] go 2.1500(2)
Ao/G 56.3(1)
aN/G 10.9(2), 10.9(2)
[CuL2H2] isomer 1 go 2.1398(7)
Ao/G 39(2)
aN/G 10(5), 8(5)
Isomer 2 go 2.1430(6)
Ao/G 62(2)
aN/G 8(2), 8(2)
[CuL2H] go 2.1249(2)
Ao/G 64.4(2)
aN/G 10.2(4),
9.2(6),
9.2(6)
[CuL2] isomer 1 go 2.1122(1)
Ao/G 68.8(2)
aN/G 9.0(2), 9.0(2)
8.2(2), 8.2(2),
Isomer 2 go 2.1246(2)
Ao/G 69.2(2)
aN/G 9.2(2), 9.2(2),
8.2(2)
a The confidence intervals of the last digit (3r) at a significance level of 99.7% are given in parentheses.
1662 N.V. Nagy et al. / Journal of Inorganic Biochemistry 98 (2004) 1655–1666
we cannot distinguish the corresponding spectra. A re-
lated ligand provides a further example of weak ligation
of the in-chain phosphinate group: bis(morpholinato-N-
methyl)phosphinic acid forms a complex of very low
stability with copper(II) (log KCuL = 1.6) in which
monodentate phosphinate binding is assumed, since
the ligation of the N atoms is strongly hindered [28].
At above pH 3, two experimental facts seem to suggest
aminophosphinate-type coordination for the monoprot-
onated ligand L1 (Fig. 9). First, the go values for the iso-
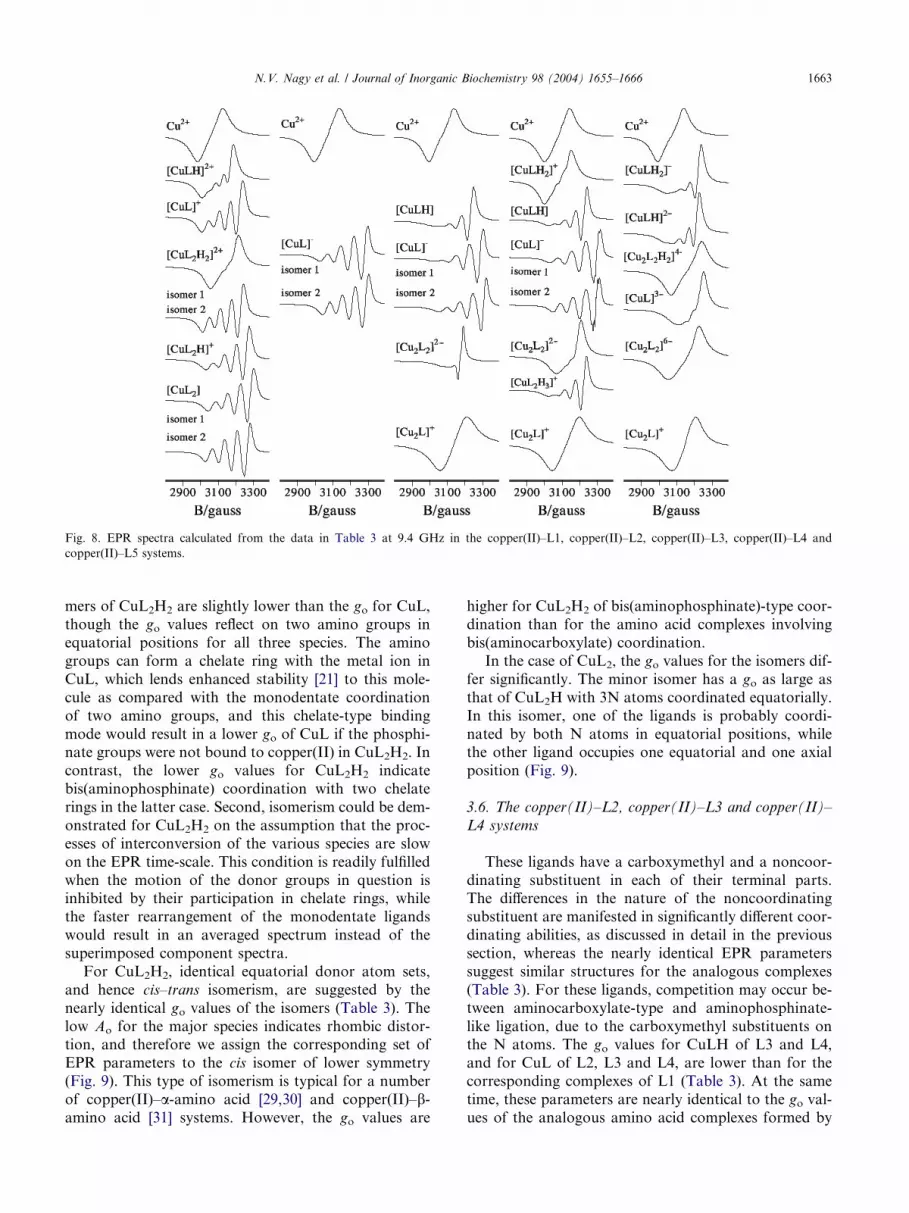
Fig. 8. EPR spectra calculated from the data in Table 3 at 9.4 GHz in the copper(II)–L1, copper(II)–L2, copper(II)–L3, copper(II)–L4 and
copper(II)–L5 systems.
N.V. Nagy et al. / Journal of Inorganic Biochemistry 98 (2004) 1655–1666 1663
mers of CuL2H2 are slightly lower than the go for CuL,
though the go values reflect on two amino groups in
equatorial positions for all three species. The amino
groups can form a chelate ring with the metal ion in
CuL, which lends enhanced stability [21] to this mole-
cule as compared with the monodentate coordination
of two amino groups, and this chelate-type binding
mode would result in a lower go of CuL if the phosphi-nate groups were not bound to copper(II) in CuL2H2. In
contrast, the lower go values for CuL2H2 indicate
bis(aminophosphinate) coordination with two chelate
rings in the latter case. Second, isomerism could be dem-
onstrated for CuL2H2 on the assumption that the proc-
esses of interconversion of the various species are slow
on the EPR time-scale. This condition is readily fulfilled
when the motion of the donor groups in question isinhibited by their participation in chelate rings, while
the faster rearrangement of the monodentate ligands
would result in an averaged spectrum instead of the
superimposed component spectra.
For CuL2H2, identical equatorial donor atom sets,
and hence cis–trans isomerism, are suggested by the
nearly identical go values of the isomers (Table 3). The
low Ao for the major species indicates rhombic distor-tion, and therefore we assign the corresponding set of
EPR parameters to the cis isomer of lower symmetry
(Fig. 9). This type of isomerism is typical for a number
of copper(II)–a-amino acid [29,30] and copper(II)–b-amino acid [31] systems. However, the go values are
higher for CuL2H2 of bis(aminophosphinate)-type coor-
dination than for the amino acid complexes involving
bis(aminocarboxylate) coordination.
In the case of CuL2, the go values for the isomers dif-
fer significantly. The minor isomer has a go as large as
that of CuL2H with 3N atoms coordinated equatorially.
In this isomer, one of the ligands is probably coordi-
nated by both N atoms in equatorial positions, whilethe other ligand occupies one equatorial and one axial
position (Fig. 9).
3.6. The copper(II)–L2, copper(II)–L3 and copper(II)–
L4 systems
These ligands have a carboxymethyl and a noncoor-
dinating substituent in each of their terminal parts.The differences in the nature of the noncoordinating
substituent are manifested in significantly different coor-
dinating abilities, as discussed in detail in the previous
section, whereas the nearly identical EPR parameters
suggest similar structures for the analogous complexes
(Table 3). For these ligands, competition may occur be-
tween aminocarboxylate-type and aminophosphinate-
like ligation, due to the carboxymethyl substituents onthe N atoms. The go values for CuLH of L3 and L4,
and for CuL of L2, L3 and L4, are lower than for the
corresponding complexes of L1 (Table 3). At the same
time, these parameters are nearly identical to the go val-
ues of the analogous amino acid complexes formed by

[CuLH]2+ [CuL]+
[CuL2H2]2+
[CuL2]
NH 2
P
NH 2
Cu2+O −
O
NH 2
P
NH 2
O −
O
NH2
P
NH2
Cu2+O−
O
NH2
P
NH2
O−
O
OH2
NH2
H2O Cu2+
OH2
P
O−
O
NH3+
NH2
OO−
PNH2
H2O Cu2+
OH2
NH2
PO−
O
NH3+
NH3+
O
O−
P
Cu2+
NH2
NH2
Cu2+
P
O-
O
NH3+
NH3+
O
O−
P NH 2
[CuL2H]+
NH2O
O−
P
NH2
NH3+
O
O−
P
Cu2+
NH2
isomer 1 isomer 2
isomer 1 isomer 2
Fig. 9. Coordination modes proposed for the various complexes in the
copper(II)–L1 system.
O
O
O−
NH +O
O−
N
Cu2+
P
O−
OH2
OH 2
C O−
O−
N
H2C
O
P CH2
Cu2+
O−O
C
N
OC
O−
O−
N
H2C
O
P CH2
Cu2+
O−O
C
N
O
NPO−O
N
O
O−
Cu2+
Cu2+
O
O−
O−
O
O−
O
N
OO-
PN
OH2 H2O
[CuLH]
isomer 1 isomer 2[CuL]−
[Cu2L2]6−
Fig. 10. Coordination modes proposed for some complexes in the
copper(II)–L4 system.
1664 N.V. Nagy et al. / Journal of Inorganic Biochemistry 98 (2004) 1655–1666
mono- and bis(aminocarboxylate) coordination [29–31].
These facts indicate that it is the carboxylate groups that
form chelate rings, together with the amino groups in-
stead of the phosphinate moiety in the cases of L2, L3
and L4. As bis(aminocarboxylate) coordination can oc-
cur through the tetradentate binding of the ligand in
CuL, this excludes the cis–trans isomerism characteristic
of bis(amino acid) complexes [29–31]. L4 is probablybound equatorially by four donor atoms in the minor
isomer (with lower go), while in the major isomer (with
higher go) one of the carboxylate groups occupies an ax-
ial position. For L3 and L4, the spectrum of a third
complex in the range of formation of CuL was assigned
to the dimer Cu2L2, its broad bands suggesting dipole
interactions between the metal ions. The relatively high
go (Table 3) corresponds to the equatorial coordinationof one amino group (and one or two carboxylate
groups), while the very low Ao points to a distorted
structure. Overall, therefore, we assume that one half
of the first ligand is bound in equatorial positions to
the first copper(II) via the amino and carboxylate
groups, while it occupies an equatorial and an axial
position around the second metal ion via the carboxy-
late and the amino groups of its second half. The other
ligand is coordinated diequatorially to the second cop-
per(II) ion through the amino and carboxylate groups,
while it is bound in equatorial and axial positions to
the first metal ion by the carboxylate and amino groups
from the other end. The coordination modes proposedfor the complexes L2, L3 and L4 are depicted on the
example of L4 in Fig. 10.
For L4, CuLH2 too was identified. Its high go corre-
sponds to the ligation of an O atom-containing group
(either carboxylate or phosphinate, the data not allow-
ing a distinction). The coordination around the cop-
per(II) ions in Cu2L is most likely of
aminocarboxylate type, as suggested by the agreementof the go values of Cu2L and CuLH (Table 3). In the
copper(II)–L4 system, a further protonated complex,
CuL2H3, could be detected. Here, the aminocarboxy-
late-type binding of the monoprotonated ligand and
the coordination of the diprotonated ligand via an O do-
nor are most probable.
3.7. The copper(II)–L5 system
The close similarity of the EPR parameters of CuLH2
for L5 to those of CuLH of L3 and L4 (Table 3) points
to aminocarboxylate-like equatorial coordination in the

N.V. Nagy et al. / Journal of Inorganic Biochemistry 98 (2004) 1655–1666 1665
former species as well. Its lower go and Ao, however,
indicate a somewhat stronger and more distorted ligand
field. This suggests the equatorial binding of the amino
and both carboxylate groups (Fig. 11). The following
deprotonation step may affect either the protonated
amino or the carboxylic group of the other half of theligand. As compared with CuLH2, the small increase
(0.0047) in go for CuLH (Table 3) reveals similar equa-
torial coordination and an additional strong axial bond
in the latter complex. This bond is most probably
formed by the amino N atom from the other end of
the ligand, because it is a strong donor, and a six-mem-
bered chelate ring can be formed. (A nine-membered
chelate ring with participation of the weak carboxylategroup from the other end of the ligand would be less
favorable.) It can be concluded from go that the latter
carboxylate group, probably for steric reasons, remains
noncoordinated (its equatorial binding would reduce go)
(Fig. 11). For the dimer Cu2L2H2, the somewhat lower
go indicates a slightly stronger ligand field than in CuLH
(Table 3), suggesting that the fourth equatorial position
here is also occupied by a carboxylate group. Both lig-ands are most likely to be bound to both metal ions:
the amino and two carboxylate donors from the first
half of the chain occupy three equatorial positions
around the first metal ion, while the amino N and carb-
oxylate O atoms from the other half of the chain are
[CuLH]2− [Cu2L2H2]4−
[CuL]3− [Cu2L2]6−
[CuLH2]-
O
O−Cu2+
O−
O
NN H+
O
O−
OH
O
P
O−
O
H2O
N
OO−
Cu2+
O−
O
P
O
N
O−
OO−
O
OH
H2O
PO O−
O−O
OO−
N
OO-
Cu2+
O− O
NOO−
O
O−
NP
O−
O
N
O
O−
O−
O−
O
Cu2+
Cu2+O−
O
NO
O-
PN
O−O
O−
O
O
O
HO
O
O−O
NP
O−O
N
O
O−
O
O−
O−
O
Cu2+
Cu2+O−O
N
OO−
PN
O−
O
OH
Fig. 11. Coordination modes proposed for some complexes in the
copper(II)–L5 system.
bound in axial and equatorial positions, respectively,
to the second copper(II) ion, and vice versa (Fig. 11).
For CuL of L5, go is nearly as low as for L2, L3 and
L4, pointing to two N and two O atoms in the equato-
rial positions. At the same time, the value of Ao is much
lower than for the analogous complexes of the other lig-ands (Table 3). This suggests a strong rhombic distor-
tion, which can be attributed to the stress caused in
the structure by the axial ligation of two additional carb-
oxymethyl groups (Fig. 11). The difference in go between
Cu2L2H2 and Cu2L2 (Table 3) indicates that the proton
loss from the last carboxylate groups induces rearrange-
ment of the donor atoms and the formation of addi-
tional strong axial bonds in the latter complex. All theamino and carboxylate groups can undergo coordina-
tion if both ends of the ligands form one axial and
two equatorial bonds: the first half is ligated by the
amino group and one carboxylate group in equatorial
positions, while its other carboxylate group occupies
an axial site around the same copper(II). The second
half is bound to the other metal ion by two carboxylate
groups in equatorial positions and the amino group inan axial position (Fig. 11).
In the systems studied, we did not find any direct
evidence for the binding of the phosphinate group to
the metal ion. For L1 containing one phosphinate
and two amino donors, indirect proofs suggest that
in moderately acidic media the non-protonated amino
group and the phosphinate moiety act as chelating do-
nors. In neutral and alkaline solutions, however, thesecond amino group replaces the phosphinate group.
For the complexes of the ligands with carboxymethyl
substituents, the EPR parameters support that the
aminocarboxylate-type coordination dominates over
the aminophosphinate and diamine-like binding modes.
The most likely explanation for the low coordinating
ability of the phosphinate group in the ligands studied
is its very low basicity. More basic phosphinate groupscan act similarly to carboxylate donors: e.g., it was
found for some dipeptide-analogue ligands with phos-
phinic groups in terminal positions that the phosphi-
nate group stabilized the tridentate coordination of
the ligand, just as carboxylate group does in dipeptides,
and this effect varied parallel with its basicity [32].
4. Conclusions
In the event of nonsubstituted terminal amino groups
(ligand L1), various mono and bis complexes are
formed, where the deprotonated ligand is bound in a
diamin-like way, while aminophosphinate-type coordi-
nation probably occurs for the ligand with one amino
group protonated. When each amino group bears acarboxymethyl substituent, mono complexes and the
aminocarboxylate binding mode are favored (ligands

1666 N.V. Nagy et al. / Journal of Inorganic Biochemistry 98 (2004) 1655–1666
L2, L3 and L4). Simultaneous coordination of all termi-
nal donors appreciably enhances the stability of the
complex CuL, particularly for L2. At the same time,
the steric effect of the noncoordinating substituents on
the N atoms (L3), or the rigidity of the ligand with the
amino group built into a ring (L4), in part counterbal-ance the former effect: at a ligand excess dimerization
occurs, while at a metal excess the binuclear complex
Cu2L is formed in significant amounts. Two carboxy-
methyl substituents on each N atom (L5) make triden-
tate coordination of the terminal parts favored. This
binding mode is observed mainly in the binuclear and di-
mer species, and is accompanied by considerable distor-
tion of the complexes.
Acknowledgement
We gratefully acknowledge the financial support of
the Hungarian Scientific Research Fund OTKA (Grants
T-032929, T-038364 and T-046953). We are indebted
to Dr. David Durham for stylistic correction of themanuscript.
Appendix A. Supplementary material
The full set of EPR parameters for all species, includ-
ing relaxation parameters. This material is available via
the Internet at http://www.staff.u-szeged.hu/~szabot/su-
pinf.html. Supplementary data associated with this arti-
cle can be found, in the online version, at doi:10.1016/
j.jinorgbio.2004.07.001.
References
[1] A. Rockenbauer, T. Szabo-Planka, Zs. Arkosi, L. Korecz, J. Am.
Chem. Soc. 123 (2001) 7646–7654.
[2] J. Kehler, B. Ebert, O. Dahl, P. Krogsogaard-Larsen, Tetrahe-
dron 55 (1999) 771–780.
[3] M. Chebib, G.A.R. Johnston, J. Med. Chem. 43 (2000) 1427–
1447.
[4] G.A.R. Johnston, Curr. Top. Med. Chem. 2 (2002) 903–913.
[5] P. Hermann, I. Lukes, P. Vojtisek, I. Cisarova, J. Chem. Soc.
Dalton Trans. (1995) 2611–2618.
[6] M. Collinsova, I. Jiracek, Curr. Med. Chem. 7 (2000) 629–647.
[7] I.A. Natchev, Liebigs Ann. Chem. (1988) 861–867.
[8] M.A. Hussain, M.S.L. Lim, K.S. Raghavan, N.J. Rogers, R.
Hidalgo, C.A. Kettner, Pharm. Res. 9 (1992) 626–628.
[9] N. Valiaeva, D. Bartley, T. Konno, J.K. Coward, J. Org. Chem.
66 (2001) 5146–5154.
[10] A. Peyman, K. Budt, J. Spanig, B. Stowasser, D. Ruppert,
Tetrahedron Lett. 33 (1992) 4549–4552.
[11] M.A. Dhansay, P.W. Linder, R.G. Torrington, T.A. Modro, J.
Phys. Org. Chem. 3 (1990) 248–254.
[12] M.A. Dhansay, P.W. Linder, J. Coord. Chem. 28 (1993) 133–145.
[13] L. Maier, J. Organomet. Chem. 178 (1979) 157–169.
[14] Gy. Tircso, A. Cs. Benyei, E. Brucher, I. Lazar, R. Kiraly, R. Pal,
in preparation.
[15] G. Peintler, I. Nagypal, A. Jancso, I.R. Epstein, K. Kustin, J.
Phys. Chem. A 101 (1997) 8013–8020.
[16] T. Varga, Synth. Commun. 27 (1997) 2899–2902.
[17] L. Zekany, I. Nagypal, in: D.J. Legett (Ed.), Computational
Methods for Determination of Formation Constants, Plenum,
New York, 1985, p. 291.
[18] H.M. Irving, M.G. Miles, L. Pettit, Anal. Chim. Acta 38 (1967)
475–488.
[19] T. Szabo-Planka, A. Rockenbauer, L. Korecz, Magn. Reson.
Chem. 37 (1999) 484–492.
[20] T. Szabo-Planka, G. Peintler, A. Rockenbauer, M. Gyor, M.
Varga-Fabian, L. Institorisz, L. Balazspiri, J. Chem. Soc. Dalton
Trans. (1989) 1925–1932.
[21] N.V. Nagy, T. Szabo-Planka, A. Rockenbauer, G. Peintler, I.
Nagypal, L. Korecz, J. Am. Chem. Soc. 125 (2003) 5227–5235.
[22] A.H. Maki, B.R. McGarvey, J. Chem. Phys. 29 (1958) 31–34.
[23] D. Kivelson, R. Neiman, J. Chem. Phys. 35 (1961) 149–157.
[24] B.A. Goodman, J.B. Raynor, Adv. Inorg. Chem. Radiochem. 13
(1970) 135–362.
[25] J. Peisach, W.E. Blumberg, Arch. Biochem. Biophys. 165 (1974)
691–708.
[26] A. Rockenbauer, J. Magn. Reson. 35 (1979) 429–438.
[27] V. Kubicek, P. Vojtisek, V. Rudovsky, P. Hermann, I. Lukes, J.
Chem. Soc. Dalton Trans. (2003) 3927–3938.
[28] T.R. Varga, R. Kiraly, E. Brucher, V. Hietapelto, Models Chem.
(1999) 431–439.
[29] B.A. Goodman, D.B. McPhail, J. Chem. Soc. Dalton Trans.
(1985) 1717–1723.
[30] T. Szabo-Planka, A. Rockenbauer, L. Korecz, Polyhedron 18
(1999) 1969–1974.
[31] Zs. Arkosi, T. Szabo-Planka, A. Rockenbauer, N.V. Nagy, L.
Lazar, F. Fulop, Inorg. Chem. 42 (2003) 4842–4848.
[32] M. Lukas, M. Kyvala, P. Hermann, I. Lukes, D. Sanna, G.
Micera, J. Chem. Soc. Dalton Trans. (2001) 2850–2857.


![5-Substituted [1]pyrindine derivatives with antiproliferative activity](https://static.fdokumen.com/doc/165x107/63444c49f474639c9b044f5e/5-substituted-1pyrindine-derivatives-with-antiproliferative-activity.jpg)