CONVR2006 Integration and Visualization Issues in Large-Scale Location Based Facilities Management...
10
CONVR2006 Integration and Visualization Issues in Large-Scale Location- Based Facilities Management Systems Khaled El-Ammari Concordia University - BCEE Montreal, CANADA [email protected] Amin Hammad Concordia University - CIISE Montreal, CANADA [email protected] Elaheh Mozaffari Concordia University ECE Montreal, CANADA [email protected] Bechir Khabir Concordia University - ECE Montreal, CANADA [email protected] Abstract Large-scale Facilities Management Information Systems (FMIS) require integrating a great amount of informa- tion about each building, and the ability to easily locate these buildings and their components, especially when considering the potential of using the FMIS in a mobile Location-Based Computing (LBC) setting. The interop- erability of these systems is of paramount importance because of the need to develop and use them by a large number of groups in a distributed fashion. Available interoperability product models, such as Industrial Founda- tion Classes (IFC), have several limitations with respect to the requirements of these systems. In this paper, we describe innovative methods for integrating and visualizing information of large scale FMIS and discuss the computational issues needed for creating and deploying the 3D models used in these systems. CAD models, maps and images are integrated to create the 3D model of a facility, and then the resulting model is integrated with cost and scheduling information and used to collect inspection data using mobile computers equipped with tracking devices and wireless communications. In order to realize the proposed FMIS, several standards are in- troduced for the purpose of complementing IFC in fulfilling the additional requirements of integration, visualization, and tracking. The proposed approach is demonstrated through a case study about a FMIS for a university campus. Keywords Virtual reality, augmented reality, IFC, modelling, visualization, interaction, navigation, tracking, facilities man- agement 1. INTRODUCTION Research and practice in Facilities Management (FM) have seen a considerable growth in the last 20 years. Managers realized that efficient systems in tracking and storing facility information as well as support systems for planning and management are necessary. Many or- ganizations began implementing new information tech- nologies in their FM departments to help reduce costs and improve the performance of building systems through optimizing the return on their investments in assets (Dennis, 2003; Johnston, 2001). A survey about the usefulness of different information technologies for efficient asset management identified the following “very useful” information technology solutions: E-mail (83%), Computer-Aided Design (CAD) (68%), Com- puter-Aided FM (CAFM) (49%), CAD Standards (46%) and shared databases (46%) (Johnson et al., 1999). In recent years, space management using 3D modeling and communication networks for on-line Fa- cility Management Information Systems (FMIS) is gaining more interest because of the expected benefits of reducing costs and improving the performance of building systems. In particular, integrated FMIS are required so that all users of the system could potentially share all data from one data source, i.e., the 3D model of the facilities. In addition, the resulting FMIS can be used in mobile computers to collect inspection data and automatically link these data to the FM models. How- ever, a large-scale location-based FMIS requires inte- grating a great amount of information about each build-
Transcript of CONVR2006 Integration and Visualization Issues in Large-Scale Location Based Facilities Management...
CONVR2006 Integration and Visualization Issues in Large-Scale Location-
Based Facilities Management Systems
Khaled El-Ammari Concordia University - BCEE
Montreal, CANADA [email protected]
Amin Hammad Concordia University - CIISE
Montreal, CANADA [email protected]
Elaheh Mozaffari Concordia University ECE
Montreal, CANADA [email protected]
Bechir Khabir Concordia University - ECE
Montreal, CANADA [email protected]
Abstract Large-scale Facilities Management Information Systems (FMIS) require integrating a great amount of informa-tion about each building, and the ability to easily locate these buildings and their components, especially when considering the potential of using the FMIS in a mobile Location-Based Computing (LBC) setting. The interop-erability of these systems is of paramount importance because of the need to develop and use them by a large number of groups in a distributed fashion. Available interoperability product models, such as Industrial Founda-tion Classes (IFC), have several limitations with respect to the requirements of these systems. In this paper, we describe innovative methods for integrating and visualizing information of large scale FMIS and discuss the computational issues needed for creating and deploying the 3D models used in these systems. CAD models, maps and images are integrated to create the 3D model of a facility, and then the resulting model is integrated with cost and scheduling information and used to collect inspection data using mobile computers equipped with tracking devices and wireless communications. In order to realize the proposed FMIS, several standards are in-troduced for the purpose of complementing IFC in fulfilling the additional requirements of integration, visualization, and tracking. The proposed approach is demonstrated through a case study about a FMIS for a university campus.
Keywords Virtual reality, augmented reality, IFC, modelling, visualization, interaction, navigation, tracking, facilities man-agement
1. INTRODUCTION Research and practice in Facilities Management (FM) have seen a considerable growth in the last 20 years. Managers realized that efficient systems in tracking and storing facility information as well as support systems for planning and management are necessary. Many or-ganizations began implementing new information tech-nologies in their FM departments to help reduce costs and improve the performance of building systems through optimizing the return on their investments in assets (Dennis, 2003; Johnston, 2001). A survey about the usefulness of different information technologies for efficient asset management identified the following “very useful” information technology solutions: E-mail (83%), Computer-Aided Design (CAD) (68%), Com-
puter-Aided FM (CAFM) (49%), CAD Standards (46%) and shared databases (46%) (Johnson et al., 1999). In recent years, space management using 3D modeling and communication networks for on-line Fa-cility Management Information Systems (FMIS) is gaining more interest because of the expected benefits of reducing costs and improving the performance of building systems. In particular, integrated FMIS are required so that all users of the system could potentially share all data from one data source, i.e., the 3D model of the facilities. In addition, the resulting FMIS can be used in mobile computers to collect inspection data and automatically link these data to the FM models. How-ever, a large-scale location-based FMIS requires inte-grating a great amount of information about each build-
ing, and the ability to easily locate these buildings and their components, especially when considering the po-tential of using the FMIS in a mobile setting. The inter-operability of these systems is of paramount importance because of the need to develop and use them by a large number of groups in a spatially and temporally distrib-uted fashion. Available interoperability product models, such as Industrial Foundation Classes (IFC), have sev-eral limitations with respect to the requirements of these systems, mainly for representing large-scale facilities that may cover several blocks of an urban area and for supporting the mobile Location-Based Computing (LBC) systems. In this paper, innovative methods for integrating and visualizing information for large scale FMIS are de-scribed and the computational issues needed for creat-ing and deploying 3D models used in these systems are discussed. CAD models, maps and images are spatially integrated to create the 3D model of a facility, and then the resulting model is integrated with cost and schedul-ing information and used to collect inspection data us-ing mobile computers equipped with tracking devices and wireless communications. In order to realize the proposed FMIS, Geographic Information System (GIS), LBC and other de-facto standards are introduced for the purpose of complementing IFC in fulfilling the addi-tional requirements of integration, visualization, and tracking. The proposed approach is demonstrated through a case study about a FMIS for the downtown campus of Concordia University in Montreal. 2. VIRTUAL AND MIXED REALITY Virtual Reality (VR) is a technology that creates a vir-tual three-dimensional (3D) model in a computer to visually reproduce the shape, texture and movement of objects (Burdea and Coiffet, 2003). The environment where this model exists is called the Virtual Environ-ment (VE). The VE may be a model of a real-world object, such as a house; it might be an abstract world that does not exist in a real sense but is understood by humans, such as a chemical molecule or a representa-tion of a set of data; or it might be in a completely imaginary science fiction world. A key feature of VEs is that the user believes that he/she is actually in this different world. A second key feature is that if the hu-man moves his head, arms or legs, the shift of visual cues must be those he/she would expect in a real world. Besides immersion, VEs should support navigation and interaction. Different kinds of VE technology support different modes of interaction (Bowman and Bill-inghurst, 2002). Mixed Reality (MR) was introduced by Milgram and Kishino (1994), where different combinations of the virtual and real components are possible along a virtual-ity continuum (Figure 1). The real world and a totally
VE are at the two ends of this continuum with the mid-dle region called MR. Augmented Reality (AR) lies near the real world end of the line with the perception of the real world augmented by computer generated data. This technology combines the viewing of the real-world or video-based environments with superimposed 3D virtual objects that can be manipulated by the viewer. Thus, AR supplements rather than replaces the user’s real world (Virtual Reality Laboratory website, 2006). The most recent advancement in AR is a wear-able system in which users wear a backpack with a portable computer, see-through head-mounted display (HMD), and headphones with motion trackers to place and manipulate virtual objects as they move within their real world (Halden Virtual Reality Center, 2006). Augmented Virtuality (AV) is a term created by Mil-gram and Kishino (1994) to identify systems which are mostly synthetic with some real world imagery added, such as texture mapping video, onto virtual objects.
Figure 1. MR continuum (Isdale, 2003)
3. STANDARDIZATION REQUIREMENTS Standardization is important to make interoperability possible among CAD-based and FM applications at all the phases of a facility lifecycle. The IFC are an open international standard managed by the International Alliance of Interoperability (IAI) (IAI, 2006). In IFC2x2 release, the visual presentation of geometric elements has been added to the IFC model. Any object in IFC that has a geometric representation has two at-tributes: ObjectPlacement representing the location at-tributes, and representation representing the explicit style information for the shapes of products and adding additional annotations to these shapes representations. IFC is developed as an extensible international standard for building data sharing and exchange. Physical ob-jects such as walls, columns, windows are presented in IFC, as well as abstract objects, such as projects, sites, etc. IFC data are based on the EXPRESS language, the same language that has been used to develop ISO STEP project (ISO, 1999), and organized into a hierarchy structure with object-oriented method. In addition, IFC are available to all AEC/FM software developers. Con-sequently, interoperability among AEC/FM software applications is feasible and possible with the involve-ment of IFC. In addition, the 3D IFC model includes information about locations, relationships and the prop-erties of each element (e.g., wall), such as its serial ID
Virtual
EnvironmentReal
Environment
Augmented
Reality (AR)
Augmented
Virtuality (AV)
Mixed Reality
number and material layers description (Graphisoft, 2006). In conventional 2D CAD formats (e.g., DXF), the CAD application deals with entities such as lines, circles or polygons that are not automatically compos-ing an element such as a wall or a column. However, IFC-compatible software deals with 3D elements di-rectly where lines, circles and polygons can define an element such as IfcCoumn, IfcWall, and IfcRoof (IAI, 2006). The interoperability is the most essential feature in IFC. For instance, this international standard allows a user using CAD application (e.g., an architect using Archi-CAD 9.0) to exchange information with another user (e.g., a cost estimator using Timberline Office). Al-though these users have different backgrounds and they are working in different environments, IFC allows both of them to access and exchange the relevant project data for each user using his/her own application. With-out such standards, accessing information (e.g., cost, scheduling, construction, etc.) could be impossible for non-CAD users. To achieve this goal, AEC/FM soft-ware developers should work on developing IFC-compatible applications that extend the use of IFC. Fur-thermore, developing such applications allow members of a large-scale project to share the project lifecycle data with international partners in a consistent, coordi-nated and electronic format. The schema of IFC2x2 also describes the HVAC system by 31 entities and 31 enumerations in IfcHvacDomain model interfaced with 12 schemas to define things like material resources, time resources, production resources, etc. To improve data sharing and exchange, the IAI community has ap-plied XML technology to represent IFC entities in XML formats resulting in IfcXML. Several CAD and FM application vendors are now applying XML in their products to support data sharing formats. For instance, ArchiCAD9.0 supports IfcXML2x2. IFC data model is becoming more and more popular in the AEC/FM industry applications and more software vendors are supporting this model. However, IFC is still under development and many extensions are necessary to fulfill the many requirements of the AEC/FM indus-try. For example, Froese (2003) discussed the present limitation of IFC with respect to representing large ur-ban projects. Furthermore, IFC is basically a standard for data exchange between engineering applications and it is not yet ready to be used as the native format for those applications. One reason is that IFC files are text files which make them huge in size and not suitable for the direct access of data. Therefore, it was found that IFC alone is not adequate for building the virtual FM models proposed in this research. With respect to the specific support for FMIS, the research group at British Colombia University has worked within the IAI on the development of IFC-based data model for integrated FM (Hassanain et al., 2000; 2003).
There are several extensions of IFC that need to be de-veloped to cover the later phases of facilities lifecycle. The proposed approach includes entities such as IfcCondition, IfcInspection, IfcRresource, IfcCostEle-ment, etc. for supporting FM integrated systems. The IfcFacilitiesMgmtDomain schema provides a set of models that can be used to exchange information for managing the movement of people and equipment, cap-turing information concerning the condition of compo-nents and assets, capturing requests for action to be carried out, etc. However, these models do not support the requirements for describing damages relative to the 3D model of the facilities as explained in Section 4. The authors of this paper are investigating the specific methods for integrating IFC with other methods to sat-isfy the requirements of the proposed FMIS. 4. LOCATION-BASED COMPUTING REQUIREMENTS To allow FMIS to support mobility and location-based model interaction, these systems should provide user interfaces that could be used on thin clients, such as PDAs and tablet PCs (Fujitsu, 2006), equipped with wireless connections and tracking devices such as a GPS receiver. For example, in the case of a facility in-spector equipped with a mobile computer that has a tracking device, based on the location and orientation of the inspector and the assigned tasks, the system may display information about the components of interest within the focus of the inspector based on his location and show the historical inspection data visually by tag-ging a symbol on the picked element. The GIS data of the facilities and the surrounding environment, and the tracking devices attached to the inspector, make it pos-sible to locate a 3D component and display it in the VE providing navigation guidance to and around this model. In addition, the collected inspection information can be tagged on the structural elements in the VE. 5. TRACKING ALGORITHM Two tracking technologies are investigated: RTK-GPS for exterior applications using Trimble 5700 RTK-GPS receiver, and video tracking using ARToolKit for interior applications (Kato, 2004). However, in the rest of this paper, only the preliminary results with video tracking will be discussed. Video tracking generally depends on modifying the environment with fiducial markers placed in the environment at well-known locations. The ARToolKit has been developed allowing video tracking of markers using a video camera and computer vision algorithm to calculate the camera position and orientation relative to physical markers in real time. Some of the features of ARToolKit are: single camera
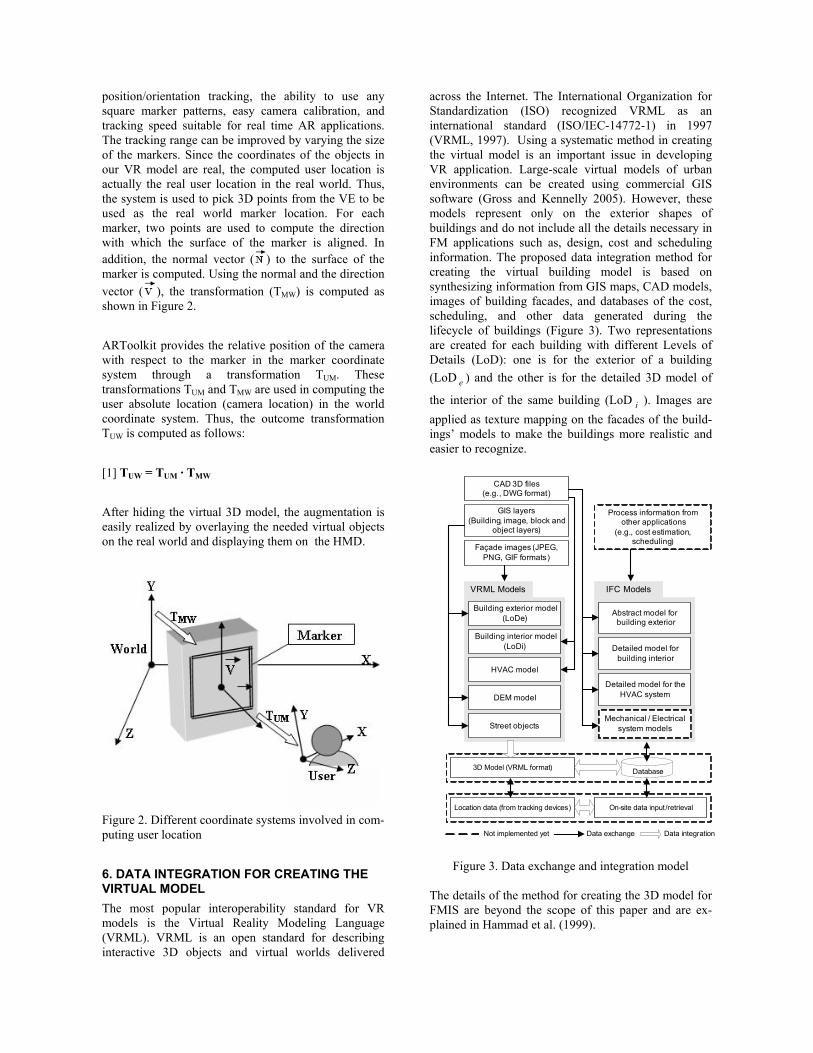
position/orientation tracking, the ability to use any square marker patterns, easy camera calibration, and tracking speed suitable for real time AR applications. The tracking range can be improved by varying the size of the markers. Since the coordinates of the objects in our VR model are real, the computed user location is actually the real user location in the real world. Thus, the system is used to pick 3D points from the VE to be used as the real world marker location. For each marker, two points are used to compute the direction with which the surface of the marker is aligned. In addition, the normal vector ( ) to the surface of the marker is computed. Using the normal and the direction vector ( ), the transformation (TMW) is computed as shown in Figure 2. ARToolkit provides the relative position of the camera with respect to the marker in the marker coordinate system through a transformation TUM. These transformations TUM and TMW are used in computing the user absolute location (camera location) in the world coordinate system. Thus, the outcome transformation TUW is computed as follows: [1] TUW = TUM · TMW After hiding the virtual 3D model, the augmentation is easily realized by overlaying the needed virtual objects on the real world and displaying them on the HMD.
Figure 2. Different coordinate systems involved in com-puting user location 6. DATA INTEGRATION FOR CREATING THE VIRTUAL MODEL The most popular interoperability standard for VR models is the Virtual Reality Modeling Language (VRML). VRML is an open standard for describing interactive 3D objects and virtual worlds delivered
across the Internet. The International Organization for Standardization (ISO) recognized VRML as an international standard (ISO/IEC-14772-1) in 1997 (VRML, 1997). Using a systematic method in creating the virtual model is an important issue in developing VR application. Large-scale virtual models of urban environments can be created using commercial GIS software (Gross and Kennelly 2005). However, these models represent only on the exterior shapes of buildings and do not include all the details necessary in FM applications such as, design, cost and scheduling information. The proposed data integration method for creating the virtual building model is based on synthesizing information from GIS maps, CAD models, images of building facades, and databases of the cost, scheduling, and other data generated during the lifecycle of buildings (Figure 3). Two representations are created for each building with different Levels of Details (LoD): one is for the exterior of a building (LoD e ) and the other is for the detailed 3D model of
the interior of the same building (LoD i ). Images are applied as texture mapping on the facades of the build-ings’ models to make the buildings more realistic and easier to recognize.
IFC Models
CAD 3D files(e.g., DWG format)
GIS layers(Building, image, block and
object layers)
Façade images (JPEG, PNG, GIF formats)
Process information from other applications
(e.g., cost estimation, scheduling)
Abstract model for building exterior
Detailed model for building interior
Detailed model for the HVAC system
Mechanical / Electrical system models
VRML Models
Building exterior model(LoDe)
Building interior model(LoDi)
HVAC model
DEM model
Street objects
3D Model (VRML format)
Location data (from tracking devices) On-site data input/retrieval
Not implemented yet Data exchange Data integration
Database
Figure 3. Data exchange and integration model
The details of the method for creating the 3D model for FMIS are beyond the scope of this paper and are ex-plained in Hammad et al. (1999).
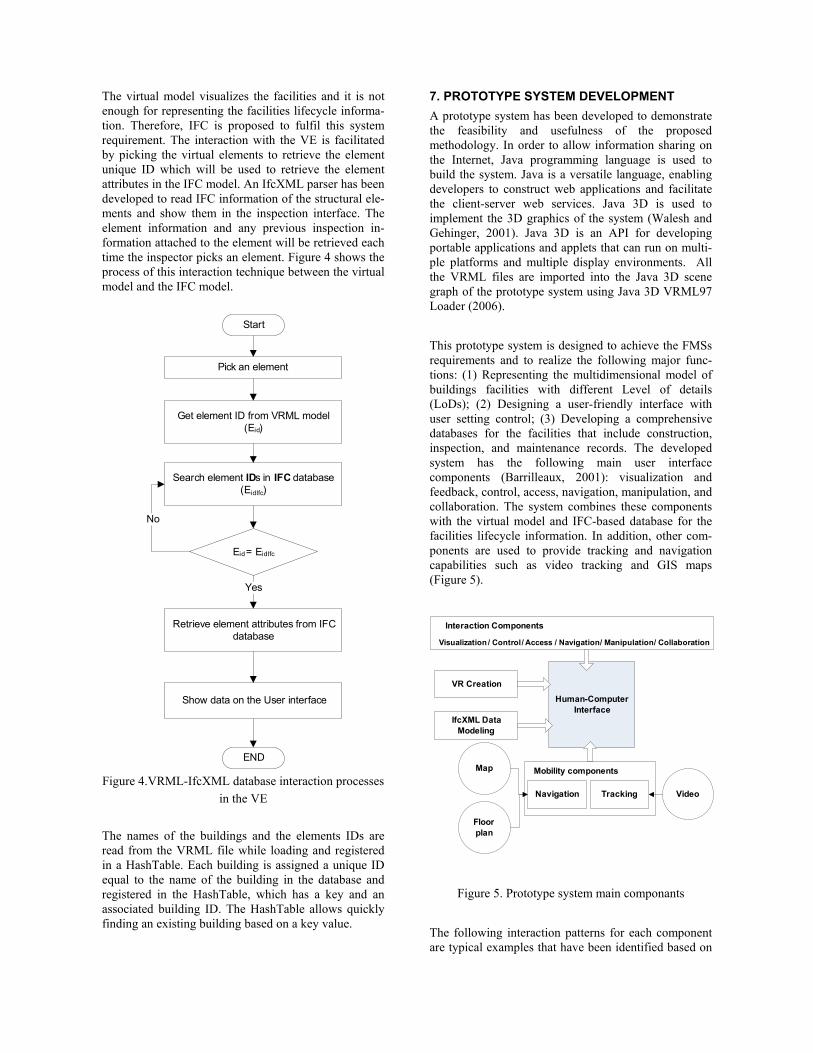
The virtual model visualizes the facilities and it is not enough for representing the facilities lifecycle informa-tion. Therefore, IFC is proposed to fulfil this system requirement. The interaction with the VE is facilitated by picking the virtual elements to retrieve the element unique ID which will be used to retrieve the element attributes in the IFC model. An IfcXML parser has been developed to read IFC information of the structural ele-ments and show them in the inspection interface. The element information and any previous inspection in-formation attached to the element will be retrieved each time the inspector picks an element. Figure 4 shows the process of this interaction technique between the virtual model and the IFC model.
Get element ID from VRML model (Eid)
Eid = EidIfc
Show data on the User interface
END
Retrieve element attributes from IFC database
Yes
No
Search element IDs in IFC database (EidIfc)
Pick an element
Start
Figure 4.VRML-IfcXML database interaction processes
in the VE The names of the buildings and the elements IDs are read from the VRML file while loading and registered in a HashTable. Each building is assigned a unique ID equal to the name of the building in the database and registered in the HashTable, which has a key and an associated building ID. The HashTable allows quickly finding an existing building based on a key value.
7. PROTOTYPE SYSTEM DEVELOPMENT A prototype system has been developed to demonstrate the feasibility and usefulness of the proposed methodology. In order to allow information sharing on the Internet, Java programming language is used to build the system. Java is a versatile language, enabling developers to construct web applications and facilitate the client-server web services. Java 3D is used to implement the 3D graphics of the system (Walesh and Gehinger, 2001). Java 3D is an API for developing portable applications and applets that can run on multi-ple platforms and multiple display environments. All the VRML files are imported into the Java 3D scene graph of the prototype system using Java 3D VRML97 Loader (2006). This prototype system is designed to achieve the FMSs requirements and to realize the following major func-tions: (1) Representing the multidimensional model of buildings facilities with different Level of details (LoDs); (2) Designing a user-friendly interface with user setting control; (3) Developing a comprehensive databases for the facilities that include construction, inspection, and maintenance records. The developed system has the following main user interface components (Barrilleaux, 2001): visualization and feedback, control, access, navigation, manipulation, and collaboration. The system combines these components with the virtual model and IFC-based database for the facilities lifecycle information. In addition, other com-ponents are used to provide tracking and navigation capabilities such as video tracking and GIS maps (Figure 5).
VR Creation
IfcXML Data Modeling
Navigation Tracking
Human-Computer Interface
Mobility components
Video
Map
Floor plan
Interaction Components
Visualization / Control / Access / Navigation / Manipulation / Collaboration
Figure 5. Prototype system main componants
The following interaction patterns for each component are typical examples that have been identified based on

common tasks that FM inspectors usually perform and the type of information they collect. As visualization and feedback, the system can display: (1) graphical details to the facility inspector about structural details retrieved from previous inspection reports. This can happen in a proactive way based on spatial events. For example, once a defected element is within an inspector field-of-view, the system displays the defect on that element discovered during previous inspections. This will help focus the inspector’s attention on specific locations. The user of the system can control the LODs of representing objects depending on his or her needs. (2) non-graphical information and instructions: The user interface can provide links to documents related to the project, such as reports, regulations and specifications. In addition, The system allows for displaying context sensitive instructions on the steps involved in a specific task, such as instructions about the method of checking new cracks and measuring crack size and crack propagation. Accessing data in the system can be achieved through real-time location tracking. The user just needs to walk towards an object of interest then click on it or stand in front of it for a short period of time. The system tracks his/her location and updates the view point accordingly. Then relevant data will be retrieved from the database and displayed. As an extension to conventional navigation systems based on 2D maps, the system can also present navigation information in 3D. Within a specific field task, the system can guide the inspector by providing him/her with navigation information and focusing his or her attention on the next element to be inspected. Once an element is found in the VE, the inspector can add defect information by directly editing its color and tag it with a colored 3D shape (e.g., sphere) to represent location, type and the severity of the defect. The system facilitates wireless communications among a team of facilities inspectors, geographically separated in the project site, by establishing a common spatial reference about the site of the project. In some cases, the facility inspector may collaborate with an expert engineer stationed at the office who monitors the same scene generated by the mobile unit in the field. 8. CASE STUDIES Concordia University downtown campus is chosen to demonstrate the proposed framework. This campus is located in downtown Montreal and the facilities are distributed in a wide area.
Figure 6. Virtual model of the university area
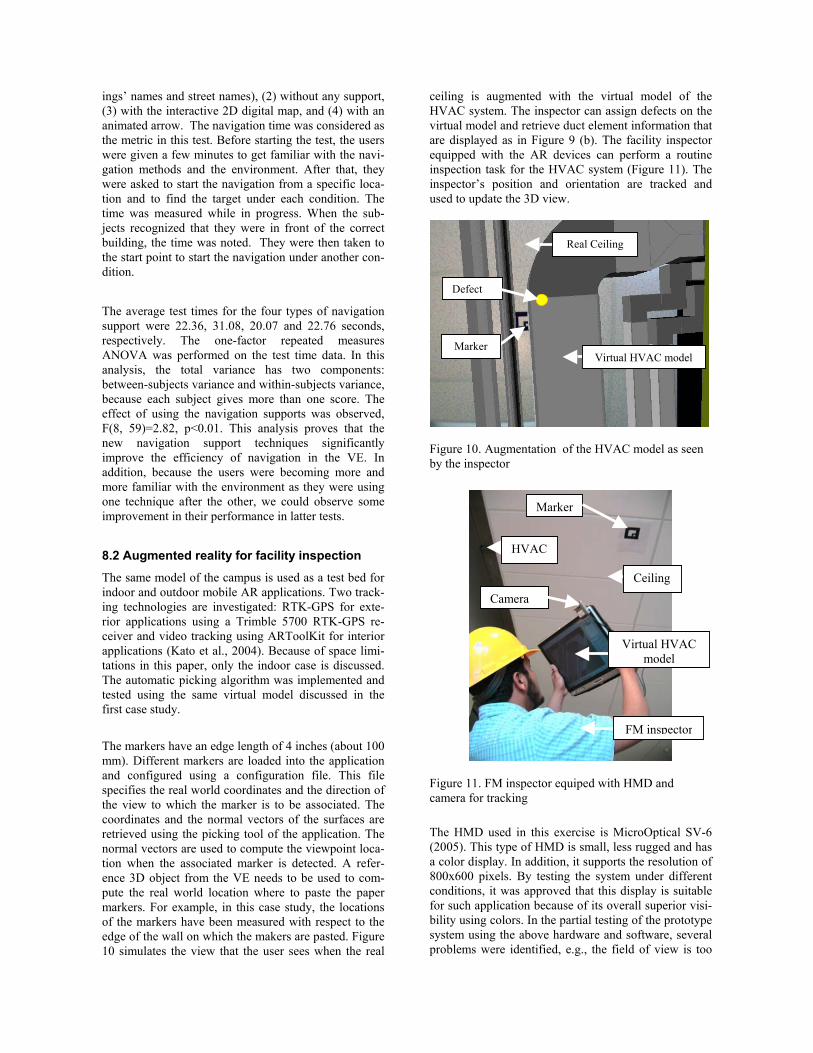
Figure 7. Example of a building with texture mapping representation The Joint Photographic Experts Group (JPEG) format has been used for texture mapping. JPEG uses a complex compression algorithm, which can be applied on a sliding scale. JPEG files are also small and can be compressed by up to 80% or more. However, JPG uses lossy compression that causes some quality reduction (Shannon, 2004). The virtual model of one floor consists of the structural elements such as slabs, columns and walls (Figure 8). In addition, it includes spaces’ partitions and the glassy envelop. The model has been created by VRML and IFC-compatible CAD application (e.g., ArchiCAD9.0). Each element in this model has a unique ID. These IDs are used for interacting with the virtual model. More details can be added to the virtual facility about building subsystems such as mechanical, electrical, plumbing and drainage system. The 3D virtual model of the HVAC system is one example of building subsys-tems that can be represented in the detailed virtual model of a facility.
Facade image
Tree
Street light
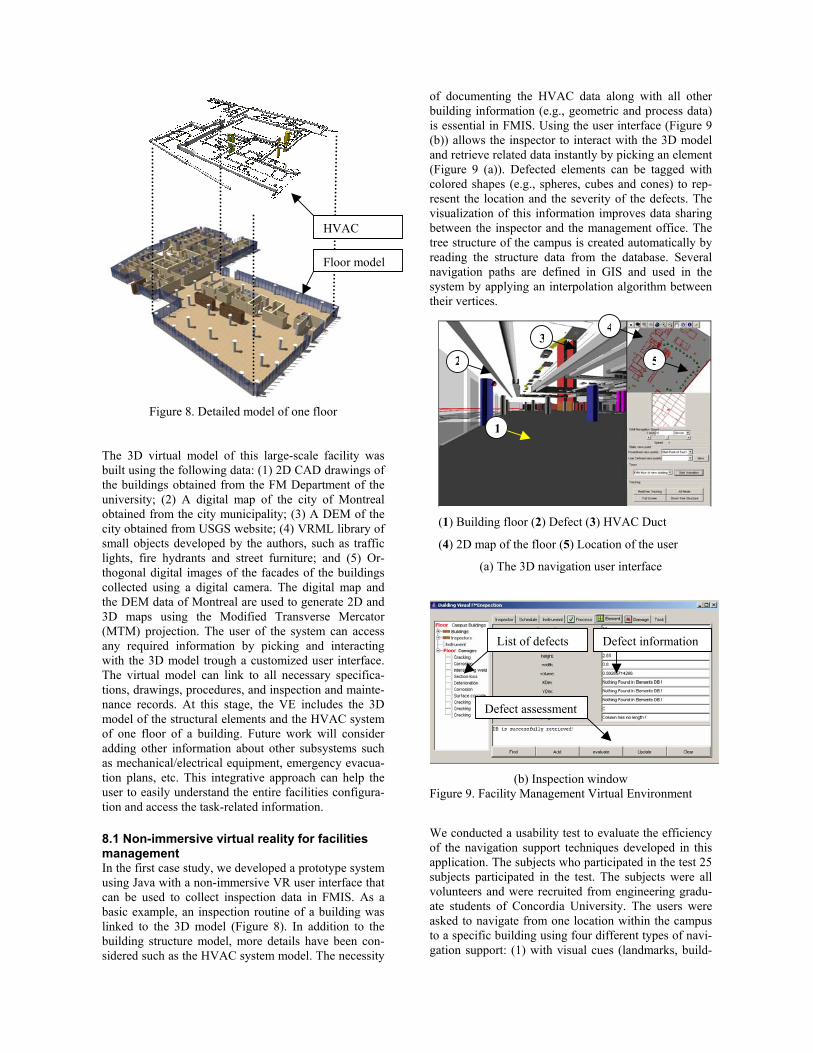
Figure 8. Detailed model of one floor
The 3D virtual model of this large-scale facility was built using the following data: (1) 2D CAD drawings of the buildings obtained from the FM Department of the university; (2) A digital map of the city of Montreal obtained from the city municipality; (3) A DEM of the city obtained from USGS website; (4) VRML library of small objects developed by the authors, such as traffic lights, fire hydrants and street furniture; and (5) Or-thogonal digital images of the facades of the buildings collected using a digital camera. The digital map and the DEM data of Montreal are used to generate 2D and 3D maps using the Modified Transverse Mercator (MTM) projection. The user of the system can access any required information by picking and interacting with the 3D model trough a customized user interface. The virtual model can link to all necessary specifica-tions, drawings, procedures, and inspection and mainte-nance records. At this stage, the VE includes the 3D model of the structural elements and the HVAC system of one floor of a building. Future work will consider adding other information about other subsystems such as mechanical/electrical equipment, emergency evacua-tion plans, etc. This integrative approach can help the user to easily understand the entire facilities configura-tion and access the task-related information. 8.1 Non-immersive virtual reality for facilities management In the first case study, we developed a prototype system using Java with a non-immersive VR user interface that can be used to collect inspection data in FMIS. As a basic example, an inspection routine of a building was linked to the 3D model (Figure 8). In addition to the building structure model, more details have been con-sidered such as the HVAC system model. The necessity
of documenting the HVAC data along with all other building information (e.g., geometric and process data) is essential in FMIS. Using the user interface (Figure 9 (b)) allows the inspector to interact with the 3D model and retrieve related data instantly by picking an element (Figure 9 (a)). Defected elements can be tagged with colored shapes (e.g., spheres, cubes and cones) to rep-resent the location and the severity of the defects. The visualization of this information improves data sharing between the inspector and the management office. The tree structure of the campus is created automatically by reading the structure data from the database. Several navigation paths are defined in GIS and used in the system by applying an interpolation algorithm between their vertices.
(1) Building floor (2) Defect (3) HVAC Duct
(4) 2D map of the floor (5) Location of the user
(a) The 3D navigation user interface
(b) Inspection window
Figure 9. Facility Management Virtual Environment We conducted a usability test to evaluate the efficiency of the navigation support techniques developed in this application. The subjects who participated in the test 25 subjects participated in the test. The subjects were all volunteers and were recruited from engineering gradu-ate students of Concordia University. The users were asked to navigate from one location within the campus to a specific building using four different types of navi-gation support: (1) with visual cues (landmarks, build-
1
2
34
5
List of defects Defect information
Defect assessment
HVAC
Floor model
ings’ names and street names), (2) without any support, (3) with the interactive 2D digital map, and (4) with an animated arrow. The navigation time was considered as the metric in this test. Before starting the test, the users were given a few minutes to get familiar with the navi-gation methods and the environment. After that, they were asked to start the navigation from a specific loca-tion and to find the target under each condition. The time was measured while in progress. When the sub-jects recognized that they were in front of the correct building, the time was noted. They were then taken to the start point to start the navigation under another con-dition. The average test times for the four types of navigation support were 22.36, 31.08, 20.07 and 22.76 seconds, respectively. The one-factor repeated measures ANOVA was performed on the test time data. In this analysis, the total variance has two components: between-subjects variance and within-subjects variance, because each subject gives more than one score. The effect of using the navigation supports was observed, F(8, 59)=2.82, p<0.01. This analysis proves that the new navigation support techniques significantly improve the efficiency of navigation in the VE. In addition, because the users were becoming more and more familiar with the environment as they were using one technique after the other, we could observe some improvement in their performance in latter tests.
8.2 Augmented reality for facility inspection
The same model of the campus is used as a test bed for indoor and outdoor mobile AR applications. Two track-ing technologies are investigated: RTK-GPS for exte-rior applications using a Trimble 5700 RTK-GPS re-ceiver and video tracking using ARToolKit for interior applications (Kato et al., 2004). Because of space limi-tations in this paper, only the indoor case is discussed. The automatic picking algorithm was implemented and tested using the same virtual model discussed in the first case study.
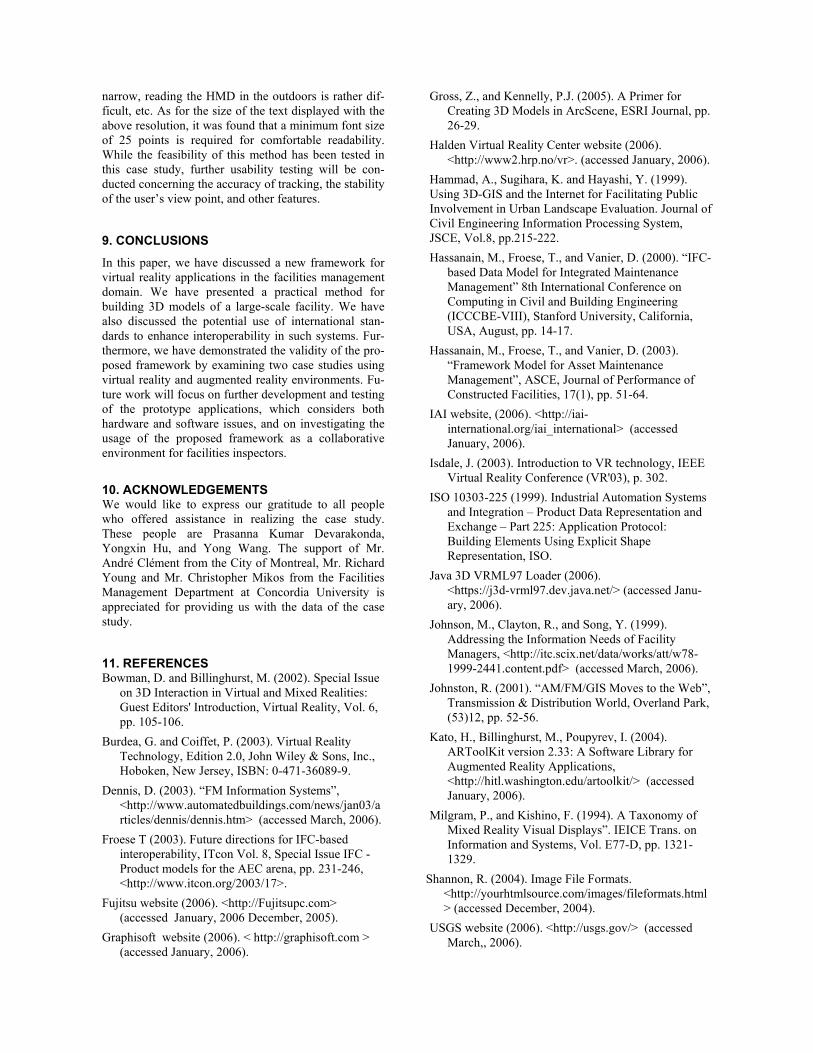
The markers have an edge length of 4 inches (about 100 mm). Different markers are loaded into the application and configured using a configuration file. This file specifies the real world coordinates and the direction of the view to which the marker is to be associated. The coordinates and the normal vectors of the surfaces are retrieved using the picking tool of the application. The normal vectors are used to compute the viewpoint loca-tion when the associated marker is detected. A refer-ence 3D object from the VE needs to be used to com-pute the real world location where to paste the paper markers. For example, in this case study, the locations of the markers have been measured with respect to the edge of the wall on which the makers are pasted. Figure 10 simulates the view that the user sees when the real
ceiling is augmented with the virtual model of the HVAC system. The inspector can assign defects on the virtual model and retrieve duct element information that are displayed as in Figure 9 (b). The facility inspector equipped with the AR devices can perform a routine inspection task for the HVAC system (Figure 11). The inspector’s position and orientation are tracked and used to update the 3D view.
Figure 10. Augmentation of the HVAC model as seen by the inspector
Figure 11. FM inspector equiped with HMD and camera for tracking The HMD used in this exercise is MicroOptical SV-6 (2005). This type of HMD is small, less rugged and has a color display. In addition, it supports the resolution of 800x600 pixels. By testing the system under different conditions, it was approved that this display is suitable for such application because of its overall superior visi-bility using colors. In the partial testing of the prototype system using the above hardware and software, several problems were identified, e.g., the field of view is too
Marker
Real Ceiling
Virtual HVAC model
Defect
Virtual HVAC model
Marker
Camera
FM inspector
Ceiling
HVAC
narrow, reading the HMD in the outdoors is rather dif-ficult, etc. As for the size of the text displayed with the above resolution, it was found that a minimum font size of 25 points is required for comfortable readability. While the feasibility of this method has been tested in this case study, further usability testing will be con-ducted concerning the accuracy of tracking, the stability of the user’s view point, and other features.
9. CONCLUSIONS
In this paper, we have discussed a new framework for virtual reality applications in the facilities management domain. We have presented a practical method for building 3D models of a large-scale facility. We have also discussed the potential use of international stan-dards to enhance interoperability in such systems. Fur-thermore, we have demonstrated the validity of the pro-posed framework by examining two case studies using virtual reality and augmented reality environments. Fu-ture work will focus on further development and testing of the prototype applications, which considers both hardware and software issues, and on investigating the usage of the proposed framework as a collaborative environment for facilities inspectors.
10. ACKNOWLEDGEMENTS We would like to express our gratitude to all people who offered assistance in realizing the case study. These people are Prasanna Kumar Devarakonda, Yongxin Hu, and Yong Wang. The support of Mr. André Clément from the City of Montreal, Mr. Richard Young and Mr. Christopher Mikos from the Facilities Management Department at Concordia University is appreciated for providing us with the data of the case study.
11. REFERENCES Bowman, D. and Billinghurst, M. (2002). Special Issue
on 3D Interaction in Virtual and Mixed Realities: Guest Editors' Introduction, Virtual Reality, Vol. 6, pp. 105-106.
Burdea, G. and Coiffet, P. (2003). Virtual Reality Technology, Edition 2.0, John Wiley & Sons, Inc., Hoboken, New Jersey, ISBN: 0-471-36089-9.
Dennis, D. (2003). “FM Information Systems”, <http://www.automatedbuildings.com/news/jan03/articles/dennis/dennis.htm> (accessed March, 2006).
Froese T (2003). Future directions for IFC-based interoperability, ITcon Vol. 8, Special Issue IFC - Product models for the AEC arena, pp. 231-246, <http://www.itcon.org/2003/17>.
Fujitsu website (2006). <http://Fujitsupc.com> (accessed January, 2006 December, 2005).
Graphisoft website (2006). < http://graphisoft.com > (accessed January, 2006).
Gross, Z., and Kennelly, P.J. (2005). A Primer for Creating 3D Models in ArcScene, ESRI Journal, pp. 26-29.
Halden Virtual Reality Center website (2006). <http://www2.hrp.no/vr>. (accessed January, 2006).
Hammad, A., Sugihara, K. and Hayashi, Y. (1999). Using 3D-GIS and the Internet for Facilitating Public Involvement in Urban Landscape Evaluation. Journal of Civil Engineering Information Processing System, JSCE, Vol.8, pp.215-222. Hassanain, M., Froese, T., and Vanier, D. (2000). “IFC-
based Data Model for Integrated Maintenance Management” 8th International Conference on Computing in Civil and Building Engineering (ICCCBE-VIII), Stanford University, California, USA, August, pp. 14-17.
Hassanain, M., Froese, T., and Vanier, D. (2003). “Framework Model for Asset Maintenance Management”, ASCE, Journal of Performance of Constructed Facilities, 17(1), pp. 51-64.
IAI website, (2006). <http://iai-international.org/iai_international> (accessed January, 2006).
Isdale, J. (2003). Introduction to VR technology, IEEE Virtual Reality Conference (VR'03), p. 302.
ISO 10303-225 (1999). Industrial Automation Systems and Integration – Product Data Representation and Exchange – Part 225: Application Protocol: Building Elements Using Explicit Shape Representation, ISO.
Java 3D VRML97 Loader (2006). <https://j3d-vrml97.dev.java.net/> (accessed Janu-ary, 2006).
Johnson, M., Clayton, R., and Song, Y. (1999). Addressing the Information Needs of Facility Managers, <http://itc.scix.net/data/works/att/w78-1999-2441.content.pdf> (accessed March, 2006).
Johnston, R. (2001). “AM/FM/GIS Moves to the Web”, Transmission & Distribution World, Overland Park, (53)12, pp. 52-56.
Kato, H., Billinghurst, M., Poupyrev, I. (2004). ARToolKit version 2.33: A Software Library for Augmented Reality Applications, <http://hitl.washington.edu/artoolkit/> (accessed January, 2006).
Milgram, P., and Kishino, F. (1994). A Taxonomy of Mixed Reality Visual Displays”. IEICE Trans. on Information and Systems, Vol. E77-D, pp. 1321-1329.
Shannon, R. (2004). Image File Formats. <http://yourhtmlsource.com/images/fileformats.html> (accessed December, 2004).
USGS website (2006). <http://usgs.gov/> (accessed March,, 2006).

Virtual Reality Laboratory website (2006). Virtual Reality: a Short Introduction, Virtual Reality Laboratory, University of Michigan, College of Engineering. <http://www-VRL.umich.edu>.
VRML website (2006). <http://w3.org/MarkUp/VRML/> (accessed March , 2006).
Walesh, A. and Gehringer, D. (2001). Java 3D, API Jump-start, Prentice Hall PTR.