The Kinetics of Reduction of Dense Synthetic Nickel Oxide in H2-N2 and H2-H2O Atmospheres
Upload
khangminh22Category
view
0download
0
Article
Controllable H2 Generation by Formic AcidDecomposition on a Novel Pd/TemplatedCarbon Catalyst
Maria Mihet, Monica Dan, Lucian Barbu-Tudoran , Mihaela D. Lazar * and Gabriela Blanita *
National Institute for Research & Development of Isotopic and Molecular Technologies—INCDTIM,67-103 Donat Str., 400293 Cluj-Napoca, Romania; [email protected] (M.M.); [email protected] (M.D.);[email protected] (L.B.-T.)* Correspondence: [email protected] (M.D.L.); [email protected] (G.B.);
Tel.: +40-264-58-4037 (M.D.L. & G.B.)
Received: 30 September 2020; Accepted: 10 November 2020; Published: 12 November 2020 �����������������
Abstract: A novel Pd/templated carbon catalyst (Pd/TC) was developed, characterized, and tested inthe dehydrogenation of formic acid (FA) under mild conditions, with the possibility to control the H2
generation rate, in the absence or presence of HCOONa (SF), by adjusting the Pd:FA and/or FA:SFratios. The characterization results of the templated carbon obtained by the chemical vapor depositionof acetylene on NaY zeolite revealed different structural and morphological properties compared toother C-based supports. Therefore, it was expected to induce a different catalytic behavior for thePd/TC catalyst. Indeed, the TC-supported Pd catalyst exhibited superior activity in the decompositionof FA, even at room temperature, with turnover frequencies (TOFs) of up to 143.7 and 218.8 h−1 at60 ◦C. The H2 generation rate increased with an increasing temperature, while the H2 yield increasedwith a decreasing FA concentration. Constant generation of gaseous flow (H2 + CO2) was achievedfor 11 days, by the complete dehydrogenation of FA at room temperature using a 2 M FA solution andPd:FA = 1:2100. The presence of SF in the reaction medium significantly enhanced the H2 generationrate (535 h−1 for FA:SF = 3:1 and 60 ◦C).
Keywords: catalytic formic acid dehydrogenation; hydrogen storage; hydrogen liquid carrier;Pd/templated carbon catalyst
1. Introduction
In the quest for environmentally friendly energy sources, hydrogen is regarded as the mostpromising energy carrier, considering that its combustion leads to the formation of the benign watermolecule [1,2]. However, issues such as efficient hydrogen production or effective hydrogen storage andsafe transportation have to be addressed, in order to reach the goal of a hydrogen-based economy [2–5].In this context, there is a tremendous research interest towards the development of appropriatestorage solutions which can allow the controllable and efficient generation of hydrogen under mildconditions (near ambient temperatures and atmospheric pressure) [6,7]. Hydrogen storage may beachieved by either physical or chemical methods [2,8]. Physical storage deals with the compression ofmolecular hydrogen at low temperatures and high pressures [1,2], or with its adsorption on high surfacearea materials, such as carbon-based materials [2,8], zeolites, or metal–organic frameworks [9–11].On the other hand, chemical storage methods rely on the storage of hydrogen in its chemicallybonded form in compounds with a high hydrogen content, such as complex hydrides (boronatesand alanates); covalent hydrides (AlH3, BH3NH3, or SiH3); ionic hydrides (alkali and alkali earthmetal hydrides); and liquid organic hydrogen carriers (LOHCs), such as formic acid (HCOOH),
Hydrogen 2020, 1, 22–37; doi:10.3390/hydrogen1010003 www.mdpi.com/journal/hydrogen

Hydrogen 2020, 1 23
hydrazine, heterocyclic aromatic hydrocarbons, and alcohols [2,8,12,13]. Among these hydrogencarriers, formic acid (FA), which is a major product of biomass processing [14,15], is regarded as apromising H2 storage compound due to its high hydrogen content (4.4 wt.% and 53 g/L), high energydensity (seven times superior to that of commercial lithium ion batteries) [2], low toxicity, and highstability at room temperature [14], compared to other LOHCs [2]. Ideally, FA could release the chemicallystored H2 by catalytic dehydrogenation, for use in fuel cells, while the catalytic hydrogenation of wasteCO2 could regenerate FA as an H2 carrier [4,14]. Therefore, the CO2–HCOOH hydrogen storage cyclebecomes attractive as a sustainable and reversible energy storage cycle [14,16].
Despite the theoretically attractive concept, the most problematic issue of the CO2–HCOOHhydrogen storage cycle is the design of efficient catalysts which favor the release of H2 under mildconditions (near ambient conditions), without the formation of poisonous CO for fuel cell technology.The decomposition of FA occurs via the dehydrogenation pathway (Equation (1)), or the undesireddehydration pathway (Equation (2)) [3,17]:
HCOOH (l) → H2 (g) + CO2 (g), ∆G298 K = − 35.0 kJ/mol, (1)
HCOOH (l) → H2O(l) + CO (g), ∆G298 K = − 14.9 kJ/mol. (2)
The decomposition route followed by FA strongly depends on the employed catalyst, as well asthe reaction conditions (formic acid concentration, temperature, and pH) [3]. Catalytic approachesfor the dehydrogenation of formic acid regard both homogeneous and heterogeneous systems.Although numerous homogeneous catalysts have been developed, with good to excellent activitiesin the CO-free decomposition of FA, the most important disadvantage of these systems is thedifficulty of separating and recovering the employed catalyst [5,18]. In contrast, heterogeneous catalyticsystems allow facile catalyst recovery and reusability [19], but are characterized by a lower H2
selectivity due to the undesired dehydration pathway, elevated temperatures, and the utilizationof added formate salts (e.g., HCOONa, HCOONH3, etc.) [5,19]. Therefore, the development ofactive heterogeneous catalysts for the dehydrogenation of FA under mild conditions has become animportant scientific and technological target. Heterogeneous catalysts are generally supportedmetal ones, for both vapor and liquid phase FA dehydrogenation systems [2]. Noble metalssuch as Pt, Au, and Pd are the most active ones, and are employed either in monometallicsystems (Pd/C [3,5,6,13,20,21], Pd/mpg-C3N4 [4], Pd/CeO2 [15], Pd/rGO [22], Au/C, Au/TiO2 [20],Au/ZrO2 [23,24], Au/Al2O3, Au/La2O3, Au/MgO [23], Au/CeO2 [23,25], Au/ZSM-5 [25], Au/rGO [26],etc.), or multimetallic ones (Ag-Pd core shell [7], AgPd/graphene [17], Pd-Au/C, Pd-Ag/C [27],PdAu/rGO [22], Au-Pd/ED-MIL-101 [28], AgPd/MIL-101 [29], PdAu-MnOx/N-SiO2 [19], NiAuPd/C [18],CoAuPd/C [14], PtRuBiOx/C [30], etc.). The importance of alloying Pd with different metals has alsobeen emphasized for multimetallic systems [31]. Generally, these heterogeneous catalysts are usedfor low concentrations of formic acid solutions, which indicates a low hydrogen storage density [13],or use a very low FA to Pd ratio, which make these systems inadequate for final applications.
The aim of this paper is to report the synthesis of a novel Pd/templated carbon catalyst (Pd/TC)and its activity in CO-free FA decomposition under mild conditions, with the possibility to control thehydrogen generation rate in the absence or presence of added formate salts (HCOONa). To the best ofour knowledge, there is no report on the use of templated carbon as a nanostructured catalytic supportfor the dehydrogenation of formic acid. Templated carbon obtained by the chemical vapor deposition(CVD) of acetylene on NaY zeolite shows different structural and morphological properties whencompared to other C-based supports, which are expected to induce different catalytic behavior of theTC-supported Pd catalyst. Catalytic tests aimed at unfolding the influence of several reaction parameterson the activity of the Pd/TC catalyst, such as the formic acid concentration, reaction temperature,and HCOONa addition to the system, were conducted. The catalyst lifetime and possibility to obtaincomplete formic acid dehydrogenation in a controllable way were also investigated.

Hydrogen 2020, 1 24
2. Experimental Section
2.1. Materials
All starting materials and solvents were obtained from commercial suppliers and used withoutfurther purification. Zeolite Y (Na-form, SiO2:Al2O3 = 5.1:1) was purchased from Alfa Aersar(Karlsruhe, Germany), HF (p.a., 50%) from Fluka (Seelze, Germany), and PdCl2 (59% Pd) from Merck(Darmstadt, Germany). Gasses (C2H2 in N2, H2, and Ar) were purchased from Linde Gaz Romania(Timisoara, Romania).
2.2. Catalyst Preparation
Two preparation sequences were followed, in order to obtain the templated carbon-supportedPd catalyst, with a target metal concentration of 10 wt.%. In the first step, the nanostructuredcarbon was synthesized by dry chemical vapor deposition (CVD), using zeolite as a template [32].Briefly, two successive acetylene (5 vol.% in N2) CVDs were performed over zeolite Y (Na-form,SiO2:Al2O3 = 5.1:1) in a horizontal quartz reactor (i.d. 20 mm): One at 600 ◦C for 4 h and the otherat 700 ◦C for 1 h. The acetylene gas mixture was passed through the reactor at a total flow rate of190 mL (STP)/min. Finally, heat-treatment at 900 ◦C for 1 h was performed. Removal of the zeolitetemplate was conducted by successive HF washing. In the second step, Pd was deposited on thenanostructured templated carbon by the wet impregnation method using an aqueous solution ofan appropriate amount of PdCl2, in order to obtain a 10 wt.% target concentration of metal on thesupport. After impregnation, the catalyst was dried at room temperature overnight, while reductionwas performed by increasing the temperature in Ar flow up to 250 ◦C, followed by actual reduction inH2 flow for 2 h, at this temperature.
2.3. Catalyst Characterization
The effective palladium content of the catalyst was determined by inductively coupled plasmamass spectrometry (ICP-MS) using a Perkin Elmer ELAN DRC spectrometer (Waltham, MA, USA).Before analysis, the sample was treated with 1 mL of aqua regia (3:1 HCl:HNO3, v:v) and diluted to50 mL with ultra-pure de-ionized water.
Specific surface areas of both the nanostructured C support and Pd catalyst were determinedby N2 adsorption–desorption at −196 ◦C, following the standard BET procedure (Sorptomatic 1990,Thermo Electron, Milan, Italy). Prior to N2 adsorption, each sample was degassed under vacuum at200 ◦C, for 5 h.
X–ray powder diffraction (XRD) measurements were performed on a Bruker D8 AdvancedDiffractometer (Billerica, MA, USA) with CuKα1 radiation and a Ge monochromator, working at 40 kVand 40 mA, with a step–scanning mode of ∆2θ = 0.01◦/s in the angle range 2θ = 3–85◦.
Thermogravimetric analysis (TGA) was performed in air flow (100 mL/min) using a temperaturerate of 10 ◦C/min in the range of 25–1000 ◦C (SDT Q600, TA Instruments, New Castle, DE, USA).
Morphological characterization of the catalyst was performed by transmission electron microscopy(TEM) and scanning electron microscopy (SEM) using a HITACHI HD–2700 STEM microscope (Hitachi,Tokyo, Japan) operating at 200 kV. The sizes of Pd particles were measured to determine the particlesize distribution and average particle size (>500 particles). Prior to TEM analysis, the catalyst samplewas homogeneously dispersed by sonication (3 min) in ethanol.
2.4. Catalytic Activity Tests
Catalytic activity tests were carried out under ambient atmosphere of air using a simpleexperimental set-up formed by a round bottom flask, thermostated by a silicon oil bath, and connectedto a gas burette, in order to quantify the volume of evolved gases. Typically, 20 mg of the Pd/TCcatalyst was placed inside the flask, together with a Teflon coated magnetic bar, while the reaction wasconsidered started after the addition of the selected volume of formic acid solution (FA, different molar
Hydrogen 2020, 1 25
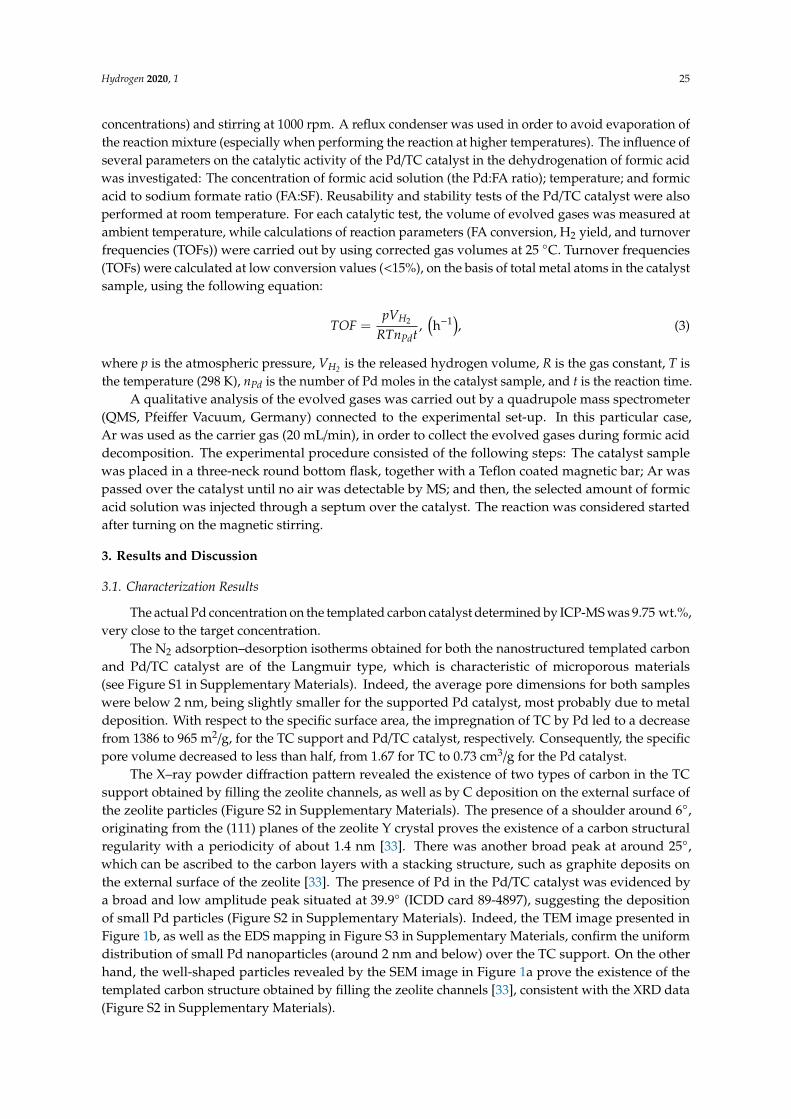
concentrations) and stirring at 1000 rpm. A reflux condenser was used in order to avoid evaporation ofthe reaction mixture (especially when performing the reaction at higher temperatures). The influence ofseveral parameters on the catalytic activity of the Pd/TC catalyst in the dehydrogenation of formic acidwas investigated: The concentration of formic acid solution (the Pd:FA ratio); temperature; and formicacid to sodium formate ratio (FA:SF). Reusability and stability tests of the Pd/TC catalyst were alsoperformed at room temperature. For each catalytic test, the volume of evolved gases was measured atambient temperature, while calculations of reaction parameters (FA conversion, H2 yield, and turnoverfrequencies (TOFs)) were carried out by using corrected gas volumes at 25 ◦C. Turnover frequencies(TOFs) were calculated at low conversion values (<15%), on the basis of total metal atoms in the catalystsample, using the following equation:
TOF =pVH2
RTnPdt,(h−1), (3)
where p is the atmospheric pressure, VH2 is the released hydrogen volume, R is the gas constant, T isthe temperature (298 K), nPd is the number of Pd moles in the catalyst sample, and t is the reaction time.
A qualitative analysis of the evolved gases was carried out by a quadrupole mass spectrometer(QMS, Pfeiffer Vacuum, Germany) connected to the experimental set-up. In this particular case,Ar was used as the carrier gas (20 mL/min), in order to collect the evolved gases during formic aciddecomposition. The experimental procedure consisted of the following steps: The catalyst samplewas placed in a three-neck round bottom flask, together with a Teflon coated magnetic bar; Ar waspassed over the catalyst until no air was detectable by MS; and then, the selected amount of formicacid solution was injected through a septum over the catalyst. The reaction was considered startedafter turning on the magnetic stirring.
3. Results and Discussion
3.1. Characterization Results
The actual Pd concentration on the templated carbon catalyst determined by ICP-MS was 9.75 wt.%,very close to the target concentration.
The N2 adsorption–desorption isotherms obtained for both the nanostructured templated carbonand Pd/TC catalyst are of the Langmuir type, which is characteristic of microporous materials(see Figure S1 in Supplementary Materials). Indeed, the average pore dimensions for both sampleswere below 2 nm, being slightly smaller for the supported Pd catalyst, most probably due to metaldeposition. With respect to the specific surface area, the impregnation of TC by Pd led to a decreasefrom 1386 to 965 m2/g, for the TC support and Pd/TC catalyst, respectively. Consequently, the specificpore volume decreased to less than half, from 1.67 for TC to 0.73 cm3/g for the Pd catalyst.
The X–ray powder diffraction pattern revealed the existence of two types of carbon in the TCsupport obtained by filling the zeolite channels, as well as by C deposition on the external surface ofthe zeolite particles (Figure S2 in Supplementary Materials). The presence of a shoulder around 6◦,originating from the (111) planes of the zeolite Y crystal proves the existence of a carbon structuralregularity with a periodicity of about 1.4 nm [33]. There was another broad peak at around 25◦,which can be ascribed to the carbon layers with a stacking structure, such as graphite deposits onthe external surface of the zeolite [33]. The presence of Pd in the Pd/TC catalyst was evidenced bya broad and low amplitude peak situated at 39.9◦ (ICDD card 89-4897), suggesting the depositionof small Pd particles (Figure S2 in Supplementary Materials). Indeed, the TEM image presented inFigure 1b, as well as the EDS mapping in Figure S3 in Supplementary Materials, confirm the uniformdistribution of small Pd nanoparticles (around 2 nm and below) over the TC support. On the otherhand, the well-shaped particles revealed by the SEM image in Figure 1a prove the existence of thetemplated carbon structure obtained by filling the zeolite channels [33], consistent with the XRD data(Figure S2 in Supplementary Materials).

Hydrogen 2020, 1 26
Hydrogen 2020, 1, FOR PEER REVIEW 5
temperatures between 500 and 600 °C, while in the case of Pd/TC, this combustion temperature decreased significantly up to 290 °C, due to the catalytic contribution of the Pd nanoparticles. On the other hand, the approximate 10% weight difference between the TC support and Pd catalyst confirms the target concentration of the metal on the support, which is also consistent with the average concentration of 9.4 wt.% Pd estimated from the EDX spectra (Figure S4 in Supplementary Materials) and the concentration determined by ICP-MS. Moreover, the derivative curves (DTG) presented in Figure 2b reveal the existence of different forms of C, with different crystallinity degrees, consistent with the XRD data.
Figure 1. (a) Scanning electron microscopy (SEM) and (b) transmission electron microscopy (TEM) images of the Pd/TC catalyst, with the Pd nanoparticle size distribution shown in the inset.
Figure 2. (a) Thermogravimetric analysis (TGA) curve and (b) derivative curve (DTG) of both the TC support and Pd/TC catalyst.
3.2. Catalytic Activity Results
The catalytic performance of Pd/TC was investigated quantitatively by monitoring the total volume of evolved gases under the influence of several parameters, such as the concentration of formic acid solution, Pd:FA ratio, temperature, and formic acid to sodium formate ratio (FA:SF), as well as qualitatively by mass spectrometry.
3.2.1. Influence of the Formic Acid Concentration
In order to examine the influence of the formic acid concentration on the catalytic performance of Pd/TC, FA solutions of 0.5, 1.0, or 2.0 M were used and compared to pure FA (98%). Figure 3 illustrates the volumes of gases evolved during 24 h, using 20 mg of catalyst and 30 mL FA solution, at 25 °C. It can be observed that the use of pure FA (98%) leads to no gas generation, in contrast to
0 200 400 600 800 10000
10
20
30
40
50
60
70
80
90
100(a)
TC Pd/TC
Wei
ght l
oss
(%)
Temperature (°C)
(b)
0 200 400 600 800 10000
5
10
15
20
25 TC Pd/TC
Wei
ght l
oss
deriv
ativ
e (%
/°C
)
Temperature (°C)
(a) (b)
< 1.4 1.4 2.1 2.9 > 30
50
100
150
200
250
300
350
Num
ber o
f par
ticle
s
Size of Pd nanoparticles (nm)
Figure 1. (a) Scanning electron microscopy (SEM) and (b) transmission electron microscopy (TEM)images of the Pd/TC catalyst, with the Pd nanoparticle size distribution shown in the inset.
Thermogravimetric analysis (TGA) demonstrated the strong influence of Pd on the burningbehavior of the nanostructured C support (Figure 2a). The TC support was completely burned attemperatures between 500 and 600 ◦C, while in the case of Pd/TC, this combustion temperature decreasedsignificantly up to 290 ◦C, due to the catalytic contribution of the Pd nanoparticles. On the other hand,the approximate 10% weight difference between the TC support and Pd catalyst confirms the targetconcentration of the metal on the support, which is also consistent with the average concentrationof 9.4 wt.% Pd estimated from the EDX spectra (Figure S4 in Supplementary Materials) and theconcentration determined by ICP-MS. Moreover, the derivative curves (DTG) presented in Figure 2breveal the existence of different forms of C, with different crystallinity degrees, consistent with theXRD data.
Hydrogen 2020, 1, FOR PEER REVIEW 5
temperatures between 500 and 600 °C, while in the case of Pd/TC, this combustion temperature decreased significantly up to 290 °C, due to the catalytic contribution of the Pd nanoparticles. On the other hand, the approximate 10% weight difference between the TC support and Pd catalyst confirms the target concentration of the metal on the support, which is also consistent with the average concentration of 9.4 wt.% Pd estimated from the EDX spectra (Figure S4 in Supplementary Materials) and the concentration determined by ICP-MS. Moreover, the derivative curves (DTG) presented in Figure 2b reveal the existence of different forms of C, with different crystallinity degrees, consistent with the XRD data.
Figure 1. (a) Scanning electron microscopy (SEM) and (b) transmission electron microscopy (TEM) images of the Pd/TC catalyst, with the Pd nanoparticle size distribution shown in the inset.
Figure 2. (a) Thermogravimetric analysis (TGA) curve and (b) derivative curve (DTG) of both the TC support and Pd/TC catalyst.
3.2. Catalytic Activity Results
The catalytic performance of Pd/TC was investigated quantitatively by monitoring the total volume of evolved gases under the influence of several parameters, such as the concentration of formic acid solution, Pd:FA ratio, temperature, and formic acid to sodium formate ratio (FA:SF), as well as qualitatively by mass spectrometry.
3.2.1. Influence of the Formic Acid Concentration
In order to examine the influence of the formic acid concentration on the catalytic performance of Pd/TC, FA solutions of 0.5, 1.0, or 2.0 M were used and compared to pure FA (98%). Figure 3 illustrates the volumes of gases evolved during 24 h, using 20 mg of catalyst and 30 mL FA solution, at 25 °C. It can be observed that the use of pure FA (98%) leads to no gas generation, in contrast to
0 200 400 600 800 10000
10
20
30
40
50
60
70
80
90
100(a)
TC Pd/TC
Wei
ght l
oss
(%)
Temperature (°C)
(b)
0 200 400 600 800 10000
5
10
15
20
25 TC Pd/TC
Wei
ght l
oss
deriv
ativ
e (%
/°C
)
Temperature (°C)
(a) (b)
< 1.4 1.4 2.1 2.9 > 30
50
100
150
200
250
300
350
Num
ber o
f par
ticle
s
Size of Pd nanoparticles (nm)
Figure 2. (a) Thermogravimetric analysis (TGA) curve and (b) derivative curve (DTG) of both the TCsupport and Pd/TC catalyst.
3.2. Catalytic Activity Results
The catalytic performance of Pd/TC was investigated quantitatively by monitoring the totalvolume of evolved gases under the influence of several parameters, such as the concentration of formicacid solution, Pd:FA ratio, temperature, and formic acid to sodium formate ratio (FA:SF), as well asqualitatively by mass spectrometry.

Hydrogen 2020, 1 27
3.2.1. Influence of the Formic Acid Concentration
In order to examine the influence of the formic acid concentration on the catalytic performanceof Pd/TC, FA solutions of 0.5, 1.0, or 2.0 M were used and compared to pure FA (98%). Figure 3illustrates the volumes of gases evolved during 24 h, using 20 mg of catalyst and 30 mL FA solution,at 25 ◦C. It can be observed that the use of pure FA (98%) leads to no gas generation, in contrast tothe use of aqueous FA solutions, when the volume of evolved gases increases with an increasing FAconcentration in the first couple of hours. In this case, it may be observed that the generation of gasesfollows an almost linear trend in the first 6 h, while the final volumes of gases are practically attainedafter 8 h of reaction. Although, in the first hours, the generated gas volume is proportional to theconcentration value, the final gas volumes are lower in the case of the 1.0 M FA solution, compared tothe 0.5 M solution. A qualitative analysis of evolved gases performed by MS revealed that H2 andCO2 are the constituent components of the gas mixture, with no detectable traces of CO (Figure 4).The amplitude of the peak at m/z = 28, which is observable in the insert picture of Figure 4, is given bynitrogen present in the residual air, and not CO, proven by the characteristic fingerprint for air in theMS spectrum (mass numbers 28 and 32). Therefore, it may be concluded that the decomposition offormic acid proceeds via dehydrogenation in the presence of Pd/TC catalyst, which is confirmed by theevolution of the gas composition over time.
Hydrogen 2020, 1, FOR PEER REVIEW 6
the use of aqueous FA solutions, when the volume of evolved gases increases with an increasing FA concentration in the first couple of hours. In this case, it may be observed that the generation of gases follows an almost linear trend in the first 6 h, while the final volumes of gases are practically attained after 8 h of reaction. Although, in the first hours, the generated gas volume is proportional to the concentration value, the final gas volumes are lower in the case of the 1.0 M FA solution, compared to the 0.5 M solution. A qualitative analysis of evolved gases performed by MS revealed that H2 and CO2 are the constituent components of the gas mixture, with no detectable traces of CO (Figure 4). The amplitude of the peak at m/z = 28, which is observable in the insert picture of Figure 4, is given by nitrogen present in the residual air, and not CO, proven by the characteristic fingerprint for air in the MS spectrum (mass numbers 28 and 32). Therefore, it may be concluded that the decomposition of formic acid proceeds via dehydrogenation in the presence of Pd/TC catalyst, which is confirmed by the evolution of the gas composition over time.
Figure 3. The volume of evolved gases versus time for the decomposition of formic acid (FA) catalyzed by Pd/TC at different concentrations of FA (20 mg of catalyst, 30 mL of FA solution, 25 °C).
Figure 4. MS spectrum of the evolved gases during FA decomposition over Pd/TC at 25 °C.
If the catalytic performance of the Pd catalyst is expressed as the conversion of FA, and not the evolved volume of gas over time, the influence of the FA concentration on the catalytic activity becomes more evident. Therefore, considering that H2 and CO2 are the only detected components in the evolved gas mixture, the conversion of formic acid expressed as moles of transformed FA to moles of FA introduced in the system, can be evaluated using the following relationship:
0 2 4 6 8 10 12 14 16 18 20 22 24
0
20
40
60
80
100
120
140
160
Volu
me
of e
volv
ed g
ases
(mL)
Time (h)
0.5 M 1.0 M 2.0 M pure FA (98 %)
0 5 10 15 20 25 30 35 40 45 50
Ar+
H2O
Inte
nsity
(a.u
.)
m/z
H2 Ar++
CO2
0 5 10 15 20 25 30 35 40 45 50O2
H2
H2O
Inte
nsity
(a.u
.)
m/z
N2
air36Ar+ CO2
Figure 3. The volume of evolved gases versus time for the decomposition of formic acid (FA) catalyzedby Pd/TC at different concentrations of FA (20 mg of catalyst, 30 mL of FA solution, 25 ◦C).
Hydrogen 2020, 1, FOR PEER REVIEW 6
the use of aqueous FA solutions, when the volume of evolved gases increases with an increasing FA concentration in the first couple of hours. In this case, it may be observed that the generation of gases follows an almost linear trend in the first 6 h, while the final volumes of gases are practically attained after 8 h of reaction. Although, in the first hours, the generated gas volume is proportional to the concentration value, the final gas volumes are lower in the case of the 1.0 M FA solution, compared to the 0.5 M solution. A qualitative analysis of evolved gases performed by MS revealed that H2 and CO2 are the constituent components of the gas mixture, with no detectable traces of CO (Figure 4). The amplitude of the peak at m/z = 28, which is observable in the insert picture of Figure 4, is given by nitrogen present in the residual air, and not CO, proven by the characteristic fingerprint for air in the MS spectrum (mass numbers 28 and 32). Therefore, it may be concluded that the decomposition of formic acid proceeds via dehydrogenation in the presence of Pd/TC catalyst, which is confirmed by the evolution of the gas composition over time.
Figure 3. The volume of evolved gases versus time for the decomposition of formic acid (FA) catalyzed by Pd/TC at different concentrations of FA (20 mg of catalyst, 30 mL of FA solution, 25 °C).
Figure 4. MS spectrum of the evolved gases during FA decomposition over Pd/TC at 25 °C.
If the catalytic performance of the Pd catalyst is expressed as the conversion of FA, and not the evolved volume of gas over time, the influence of the FA concentration on the catalytic activity becomes more evident. Therefore, considering that H2 and CO2 are the only detected components in the evolved gas mixture, the conversion of formic acid expressed as moles of transformed FA to moles of FA introduced in the system, can be evaluated using the following relationship:
0 2 4 6 8 10 12 14 16 18 20 22 24
0
20
40
60
80
100
120
140
160
Volu
me
of e
volv
ed g
ases
(mL)
Time (h)
0.5 M 1.0 M 2.0 M pure FA (98 %)
0 5 10 15 20 25 30 35 40 45 50
Ar+
H2O
Inte
nsity
(a.u
.)
m/z
H2 Ar++
CO2
0 5 10 15 20 25 30 35 40 45 50O2
H2
H2O
Inte
nsity
(a.u
.)
m/z
N2
air36Ar+ CO2
Figure 4. MS spectrum of the evolved gases during FA decomposition over Pd/TC at 25 ◦C.

Hydrogen 2020, 1 28
If the catalytic performance of the Pd catalyst is expressed as the conversion of FA, and notthe evolved volume of gas over time, the influence of the FA concentration on the catalytic activitybecomes more evident. Therefore, considering that H2 and CO2 are the only detected components inthe evolved gas mixture, the conversion of formic acid expressed as moles of transformed FA to molesof FA introduced in the system, can be evaluated using the following relationship:
XFA =0.5pVevolved
RTninitialFA
× 100, (%) (4)
where Vevolved is the volume of evolved gases and ninitialFA (mole) is the initial amount of FA introduced
in the reaction vessel. Taking into account that 1 mole of FA is decomposed to 1 mole of H2 and1 mole of CO2 (that is a total of 2 moles of gas), the coefficient 0.5 in Equation (4) becomes implicit.Table 1 summarizes the catalytic performance of the Pd catalyst as a function of the FA concentration,with respect to formic acid conversion, as well as TOF values, while Figure 5 illustrates the conversionprofiles over time. It may be clearly observed that the conversion of formic acid increases with adecreasing concentration of FA solution, with the largest conversion value being attained in the caseof 0.5 M FA, under the examined reaction conditions. This behavior is explained by the better Pd:FAratio obtained in the case of more diluted FA solutions, meaning that the number of formic acidmolecules to be assigned to a single Pd atom is lower. On the other hand, the initial TOF valuescalculated after 2 min of reaction at conversion values of around 0.15% are higher for the moreconcentrated solutions, except for the pure FA (Table 1), due to the higher density of FA molecules inthe proximity of the catalytic centers. These apparently contradicting catalytic performance parameters(FA conversion vs. TOF) indicate the importance of the concentration of FA solutions and the usedmetal to formic acid ratio. Therefore, several tests performed by the use of FA solutions of the sameconcentration, but with different Pd:FA ratios (that is different volumes of FA solution to the sameamount of Pd/TC catalyst), demonstrate that the conversion of FA increases with a decreasing numberof FA molecules to each Pd atom (Figure 6). For example, decreasing the 0.5 M FA solution volumeby a factor of 3, so that the Pd:FA ratio changes from 1:800 to 1:270, leads to an enhancement of FAconversion after a 6 h reaction time by a factor of 3 (Figure 6b). Therefore, at room temperature (25 ◦C),FA of a 0.5 M concentration is dehydrogenated in 6 h up to 49.9% using the Pd/TC catalyst, with a Pd:FAratio of 1:270. The initial TOF is 65.3 h−1 (after 2 min of reaction), which is four times higher comparedto the reaction system with 30 mL 0.5 M FA solution (see Table 1). It is noteworthy, however, that exceptfor the initial values, TOFs are practically similar at a given FA conversion value (see Table 1).
Table 1. Catalytic performance of Pd/TC in the dehydrogenation of FA at different concentrations(20 mg of catalyst, 30 mL of FA solution, 25 ◦C).
FA Concentration Pd:FA Ratio X24hFA (%)
TOF (h−1)
Initial(t = 2 min) at XFA=4%
0.5 M 1:800 15.33 15.7 35.61.0 M 1:1600 6.89 39.2 38.52.0 M 1:3200 4.7 143.7 34
FA 98% 1:42,200 0 0 0
Hydrogen 2020, 1 29
Hydrogen 2020, 1, FOR PEER REVIEW 7
( )0.5100, %
evolved
FA initialFA
pVX
RTn= × (4)
where Vevolved is the volume of evolved gases and initialFAn (mole) is the initial amount of FA introduced
in the reaction vessel. Taking into account that 1 mole of FA is decomposed to 1 mole of H2 and 1 mole of CO2 (that is a total of 2 moles of gas), the coefficient 0.5 in Equation (4) becomes implicit. Table 1 summarizes the catalytic performance of the Pd catalyst as a function of the FA concentration, with respect to formic acid conversion, as well as TOF values, while Figure 5 illustrates the conversion profiles over time. It may be clearly observed that the conversion of formic acid increases with a decreasing concentration of FA solution, with the largest conversion value being attained in the case of 0.5 M FA, under the examined reaction conditions. This behavior is explained by the better Pd:FA ratio obtained in the case of more diluted FA solutions, meaning that the number of formic acid molecules to be assigned to a single Pd atom is lower. On the other hand, the initial TOF values calculated after 2 min of reaction at conversion values of around 0.15% are higher for the more concentrated solutions, except for the pure FA (Table 1), due to the higher density of FA molecules in the proximity of the catalytic centers. These apparently contradicting catalytic performance parameters (FA conversion vs. TOF) indicate the importance of the concentration of FA solutions and the used metal to formic acid ratio. Therefore, several tests performed by the use of FA solutions of the same concentration, but with different Pd:FA ratios (that is different volumes of FA solution to the same amount of Pd/TC catalyst), demonstrate that the conversion of FA increases with a decreasing number of FA molecules to each Pd atom (Figure 6). For example, decreasing the 0.5 M FA solution volume by a factor of 3, so that the Pd:FA ratio changes from 1:800 to 1:270, leads to an enhancement of FA conversion after a 6 h reaction time by a factor of 3 (Figure 6b). Therefore, at room temperature (25 °C), FA of a 0.5 M concentration is dehydrogenated in 6 h up to 49.9% using the Pd/TC catalyst, with a Pd:FA ratio of 1:270. The initial TOF is 65.3 h−1 (after 2 min of reaction), which is four times higher compared to the reaction system with 30 mL 0.5 M FA solution (see Table 1). It is noteworthy, however, that except for the initial values, TOFs are practically similar at a given FA conversion value (see Table 1).
Table 1. Catalytic performance of Pd/TC in the dehydrogenation of FA at different concentrations (20 mg of catalyst, 30 mL of FA solution, 25 °C).
FA Concentration Pd:FA Ratio 24FA
hX (%) TOF (h−1)
Initial (t = 2 min)
at 4 %=FAX
0.5 M 1:800 15.33 15.7 35.6 1.0 M 1:1600 6.89 39.2 38.5 2.0 M 1:3200 4.7 143.7 34
FA 98% 1:42,200 0 0 0
0 2 4 6 8 10 12 14 16 18 20 22 24
0
5
10
15
20
Con
vers
ion
of F
A (%
)
Time (h)
0.5 M 1.0 M 2.0 M pure FA (98 %)
increasing FAconcentration
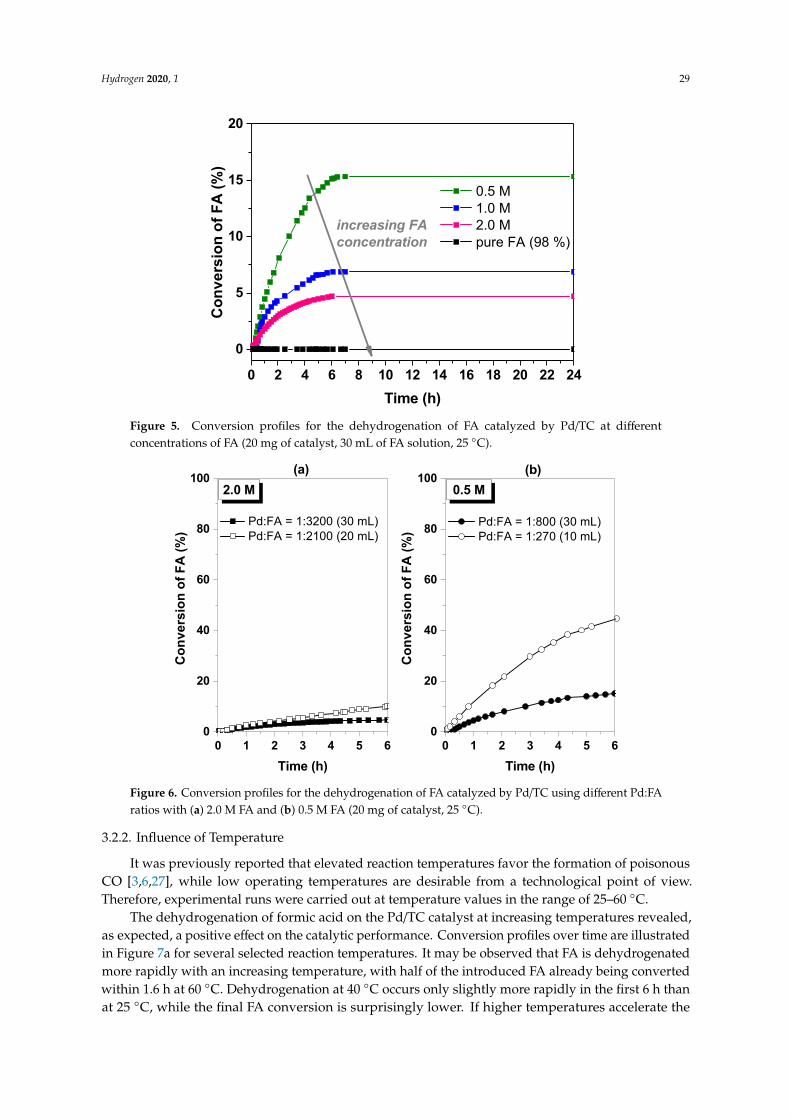
Figure 5. Conversion profiles for the dehydrogenation of FA catalyzed by Pd/TC at differentconcentrations of FA (20 mg of catalyst, 30 mL of FA solution, 25 ◦C).
Hydrogen 2020, 1, FOR PEER REVIEW 8
Figure 5. Conversion profiles for the dehydrogenation of FA catalyzed by Pd/TC at different concentrations of FA (20 mg of catalyst, 30 mL of FA solution, 25 °C).
Figure 6. Conversion profiles for the dehydrogenation of FA catalyzed by Pd/TC using different Pd:FA ratios with (a) 2.0 M FA and (b) 0.5 M FA (20 mg of catalyst, 25 °C).
3.2.2. Influence of Temperature
It was previously reported that elevated reaction temperatures favor the formation of poisonous CO [3,6,27], while low operating temperatures are desirable from a technological point of view. Therefore, experimental runs were carried out at temperature values in the range of 25–60 °C.
The dehydrogenation of formic acid on the Pd/TC catalyst at increasing temperatures revealed, as expected, a positive effect on the catalytic performance. Conversion profiles over time are illustrated in Figure 7a for several selected reaction temperatures. It may be observed that FA is dehydrogenated more rapidly with an increasing temperature, with half of the introduced FA already being converted within 1.6 h at 60 °C. Dehydrogenation at 40 °C occurs only slightly more rapidly in the first 6 h than at 25 °C, while the final FA conversion is surprisingly lower. If higher temperatures accelerate the dehydrogenation reaction in the first hours, as demonstrated by the increasing TOF values presented in Table 2, there is no tremendous effect of the reaction temperature on the final FA conversion values. A similar influence of the reaction temperature on the FA dehydrogenation efficiency in the absence of additives was reported for Ag74Pd26/graphene [17], Pd/C synthesized in situ with citric acid [3], and Pd@MO-urea [34]. In these cases, an increase of the reaction temperature did not lead to higher final gas volumes, but significantly enhanced the gas generation rate. It should be noted, however, that most literature reports present catalytic activity results in terms of generated gas volumes, or, more rarely, in terms of TOF numbers, so a straightforward comparison is difficult. The Arrhenius plot of ln(TOF) versus 1000/T for the Pd/TC catalyst is presented in Figure 7b, from which the apparent activation energy (Ea) was calculated to be 45.0 kJ/mol, which is comparable to or lower than most of the reported values.
Table 2. Catalytic performance of Pd/TC in the dehydrogenation of FA at different reaction temperatures (20 mg of catalyst, 10 mL FA 0.5 M, Pd:FA = 1:270).
Temperature (°C) 50%FAXt =[a] (h) TOF10 min [b] (h−1) 24
FA
hX (%)
25 10.1 32.7 63.3 40 11.1 67.9 54.4 60 1.6 218.8 60.1
[a] Time to reach 50% FA conversion. [b] Corresponding to FA conversion values below 10%.
0 1 2 3 4 5 60
20
40
60
80
100 (a)0.5 M
Pd:FA = 1:3200 (30 mL) Pd:FA = 1:2100 (20 mL)
Con
vers
ion
of F
A (%
)
Time (h)
2.0 M(b)
0 1 2 3 4 5 60
20
40
60
80
100
Pd:FA = 1:800 (30 mL) Pd:FA = 1:270 (10 mL)
Con
vers
ion
of F
A (%
)
Time (h)
Figure 6. Conversion profiles for the dehydrogenation of FA catalyzed by Pd/TC using different Pd:FAratios with (a) 2.0 M FA and (b) 0.5 M FA (20 mg of catalyst, 25 ◦C).
3.2.2. Influence of Temperature
It was previously reported that elevated reaction temperatures favor the formation of poisonousCO [3,6,27], while low operating temperatures are desirable from a technological point of view.Therefore, experimental runs were carried out at temperature values in the range of 25–60 ◦C.
The dehydrogenation of formic acid on the Pd/TC catalyst at increasing temperatures revealed,as expected, a positive effect on the catalytic performance. Conversion profiles over time are illustratedin Figure 7a for several selected reaction temperatures. It may be observed that FA is dehydrogenatedmore rapidly with an increasing temperature, with half of the introduced FA already being convertedwithin 1.6 h at 60 ◦C. Dehydrogenation at 40 ◦C occurs only slightly more rapidly in the first 6 h thanat 25 ◦C, while the final FA conversion is surprisingly lower. If higher temperatures accelerate the

Hydrogen 2020, 1 30
dehydrogenation reaction in the first hours, as demonstrated by the increasing TOF values presentedin Table 2, there is no tremendous effect of the reaction temperature on the final FA conversionvalues. A similar influence of the reaction temperature on the FA dehydrogenation efficiency in theabsence of additives was reported for Ag74Pd26/graphene [17], Pd/C synthesized in situ with citricacid [3], and Pd@MO-urea [34]. In these cases, an increase of the reaction temperature did not leadto higher final gas volumes, but significantly enhanced the gas generation rate. It should be noted,however, that most literature reports present catalytic activity results in terms of generated gas volumes,or, more rarely, in terms of TOF numbers, so a straightforward comparison is difficult. The Arrheniusplot of ln(TOF) versus 1000/T for the Pd/TC catalyst is presented in Figure 7b, from which the apparentactivation energy (Ea) was calculated to be 45.0 kJ/mol, which is comparable to or lower than most ofthe reported values.Hydrogen 2020, 1, FOR PEER REVIEW 9
Figure 7. (a) Influence of temperature on the conversion profiles in the dehydrogenation of FA catalyzed by Pd/TC (20 mg of catalyst, 10 mL FA 0.5 M, Pd:FA = 1:270). (b) Arrhenius plot obtained from the data presented in Table 2.
3.2.3. Catalyst Life Time and Complete FA Dehydrogenation
In order to establish the catalyst life time, the catalyst sample used at 25 °C, with 0.5 M FA and a metal to formic acid ratio of 1:270, was reused 10 times under the same reaction conditions. Between two successive runs, the unreacted formic acid solution was evaporated and the catalyst was dried at 150 °C for 3 h. Except for the first two runs, which are practically identical, the total volume of evolved gases decreases with each run (Figure 8). It must be emphasized that the gap between the second and third run is significantly large, considering a total volume of 155 mL evolved after 24 h of reaction in the second run, compared to 76 mL evolved in the third run. After the third run, the decrease between two successive runs of the total gas volume evolved in 24 h is 20–30%, on average, while the last two runs are practically identical (12.8 and 12.2 mL, respectively).
Figure 8. Reusability potential of Pd/TC in the dehydrogenation reaction of FA at 25 °C (20 mg of catalyst, 10 mL FA 0.5 M, Pd:FA = 1:270).
In the case of several catalytic tests, it was observed that a steady state (final gas volume) was not attained after 24 h of reaction. Therefore, for the experimental test involving 20 mg Pd/TC and 20 mL FA 2.0 M (Pd:FA = 1:2100) at 25 °C, we attempted to determine the timespan required to reach a steady state, or even to achieve complete formic acid conversion. In this particular case, the reaction continued for 11 days (264 h) which resulted in the liberation of 1952 mL gas mixture, corresponding to a 99% formic acid conversion. This demonstrates that the complete conversion of formic acid is possible at room temperature, with no additives, even at higher FA concentrations. More importantly, it indicates the possibility of generating hydrogen from FA for a longer period of time,
0 4 8 12 16 20 240
20
40
60
80
100
t50%=1.6 h
t50%=10.1 h t50%=11.1 h
Con
vers
ion
of F
A (%
)
Time (h)
25°C 40°C 60°C
(a)
3.0 3.1 3.2 3.3 3.4
3.5
4.0
4.5
5.0
5.5
ln(T
OF)
1/1000 (K-1)
y = - 5.417x+21.607Ea = 45.0 kJ/mol
(b)
0 2 4 6 8 10 12 14 16 18 20 22 240
40
80
120
160
200
Volu
me
of e
volv
ed g
ases
(mL)
Time (h)
1st run 2nd run 3rd run 4th run 5th run 6th run 7th run 8th run 9th run 10th run
Figure 7. (a) Influence of temperature on the conversion profiles in the dehydrogenation of FA catalyzedby Pd/TC (20 mg of catalyst, 10 mL FA 0.5 M, Pd:FA = 1:270). (b) Arrhenius plot obtained from the datapresented in Table 2.
Table 2. Catalytic performance of Pd/TC in the dehydrogenation of FA at different reaction temperatures(20 mg of catalyst, 10 mL FA 0.5 M, Pd:FA = 1:270).
Temperature (◦C) tXFA=50%[a] (h) TOF10 min
[b] (h−1) X24hFA (%)
25 10.1 32.7 63.340 11.1 67.9 54.460 1.6 218.8 60.1
[a] Time to reach 50% FA conversion. [b] Corresponding to FA conversion values below 10%.
3.2.3. Catalyst Life Time and Complete FA Dehydrogenation
In order to establish the catalyst life time, the catalyst sample used at 25 ◦C, with 0.5 M FAand a metal to formic acid ratio of 1:270, was reused 10 times under the same reaction conditions.Between two successive runs, the unreacted formic acid solution was evaporated and the catalystwas dried at 150 ◦C for 3 h. Except for the first two runs, which are practically identical, the totalvolume of evolved gases decreases with each run (Figure 8). It must be emphasized that the gapbetween the second and third run is significantly large, considering a total volume of 155 mL evolvedafter 24 h of reaction in the second run, compared to 76 mL evolved in the third run. After the thirdrun, the decrease between two successive runs of the total gas volume evolved in 24 h is 20–30%,on average, while the last two runs are practically identical (12.8 and 12.2 mL, respectively).

Hydrogen 2020, 1 31
Hydrogen 2020, 1, FOR PEER REVIEW 9
Figure 7. (a) Influence of temperature on the conversion profiles in the dehydrogenation of FA catalyzed by Pd/TC (20 mg of catalyst, 10 mL FA 0.5 M, Pd:FA = 1:270). (b) Arrhenius plot obtained from the data presented in Table 2.
3.2.3. Catalyst Life Time and Complete FA Dehydrogenation
In order to establish the catalyst life time, the catalyst sample used at 25 °C, with 0.5 M FA and a metal to formic acid ratio of 1:270, was reused 10 times under the same reaction conditions. Between two successive runs, the unreacted formic acid solution was evaporated and the catalyst was dried at 150 °C for 3 h. Except for the first two runs, which are practically identical, the total volume of evolved gases decreases with each run (Figure 8). It must be emphasized that the gap between the second and third run is significantly large, considering a total volume of 155 mL evolved after 24 h of reaction in the second run, compared to 76 mL evolved in the third run. After the third run, the decrease between two successive runs of the total gas volume evolved in 24 h is 20–30%, on average, while the last two runs are practically identical (12.8 and 12.2 mL, respectively).
Figure 8. Reusability potential of Pd/TC in the dehydrogenation reaction of FA at 25 °C (20 mg of catalyst, 10 mL FA 0.5 M, Pd:FA = 1:270).
In the case of several catalytic tests, it was observed that a steady state (final gas volume) was not attained after 24 h of reaction. Therefore, for the experimental test involving 20 mg Pd/TC and 20 mL FA 2.0 M (Pd:FA = 1:2100) at 25 °C, we attempted to determine the timespan required to reach a steady state, or even to achieve complete formic acid conversion. In this particular case, the reaction continued for 11 days (264 h) which resulted in the liberation of 1952 mL gas mixture, corresponding to a 99% formic acid conversion. This demonstrates that the complete conversion of formic acid is possible at room temperature, with no additives, even at higher FA concentrations. More importantly, it indicates the possibility of generating hydrogen from FA for a longer period of time,
0 4 8 12 16 20 240
20
40
60
80
100
t50%=1.6 h
t50%=10.1 h t50%=11.1 h
Con
vers
ion
of F
A (%
)
Time (h)
25°C 40°C 60°C
(a)
3.0 3.1 3.2 3.3 3.4
3.5
4.0
4.5
5.0
5.5
ln(T
OF)
1/1000 (K-1)
y = - 5.417x+21.607Ea = 45.0 kJ/mol
(b)
0 2 4 6 8 10 12 14 16 18 20 22 240
40
80
120
160
200
Volu
me
of e
volv
ed g
ases
(mL)
Time (h)
1st run 2nd run 3rd run 4th run 5th run 6th run 7th run 8th run 9th run 10th run
Figure 8. Reusability potential of Pd/TC in the dehydrogenation reaction of FA at 25 ◦C (20 mg ofcatalyst, 10 mL FA 0.5 M, Pd:FA = 1:270).
In the case of several catalytic tests, it was observed that a steady state (final gas volume) was notattained after 24 h of reaction. Therefore, for the experimental test involving 20 mg Pd/TC and 20 mLFA 2.0 M (Pd:FA = 1:2100) at 25 ◦C, we attempted to determine the timespan required to reach a steadystate, or even to achieve complete formic acid conversion. In this particular case, the reaction continuedfor 11 days (264 h) which resulted in the liberation of 1952 mL gas mixture, corresponding to a 99%formic acid conversion. This demonstrates that the complete conversion of formic acid is possible atroom temperature, with no additives, even at higher FA concentrations. More importantly, it indicatesthe possibility of generating hydrogen from FA for a longer period of time, at a desired rate, using thePd/TC catalyst, by tuning the reaction conditions accordingly (Pd:FA ratio, FA concentration, etc.).
3.2.4. Influence of Sodium Formate Addition
Is well-known that formates act as active species in HCOOH decomposition [15,22,35,36].Their introduction into the reaction medium certainly has effects on the activation and evolutionof the decomposition of formic acid.
The influence of sodium formate addition on the FA–Pd/TC dehydrogenation system wasinvestigated by following two pathways: (i) The use of FA–SF mixtures with a constant totalconcentration of 0.5 M and constant solution volume of 10 mL, and (ii) the use of increasing addedamounts of sodium formate (solid state) to the same volume of 0.5 M solution of FA (10 mL). All catalytictests involving SF were performed at room temperature.
In the first case, three different ratios between FA and SF were comparatively tested, with thesystems containing only FA or SF solutions of 0.5 M, respectively. The profiles of the evolved gasvolumes are presented in Figure 9. It may be observed that in the first 60 min of the reaction, all threesystems with SF present higher gas generation rates compared to the FA or SF systems alone. Indeed,TOF values calculated at 10 min of reaction are at least double to that of the corresponding value of theFA system, and they increase with an increasing SF concentration in the system. On the other hand,the steady state gas volumes are inferior for each FA:SF system in comparison to the FA system alone.In terms of the hydrogen yield, evaluated as the ratio of formed H2 (mole) to the total mole number ofFA and SF, according to Equation (5),
ΦH2 =n f ormed
H2
nFA + nSF·100, (%) (5)

Hydrogen 2020, 1 32
all FA:SF systems show surprisingly inferior values in comparison to the FA system alone, while the SFsolution alone yields the lowest values after both a 4 and 24 h reaction time (see Table 3).
Hydrogen 2020, 1, FOR PEER REVIEW 10
at a desired rate, using the Pd/TC catalyst, by tuning the reaction conditions accordingly (Pd:FA ratio, FA concentration, etc.).
3.2.4. Influence of Sodium Formate Addition
Is well-known that formates act as active species in HCOOH decomposition [15,22,35,36]. Their introduction into the reaction medium certainly has effects on the activation and evolution of the decomposition of formic acid.
The influence of sodium formate addition on the FA–Pd/TC dehydrogenation system was investigated by following two pathways: (i) The use of FA–SF mixtures with a constant total concentration of 0.5 M and constant solution volume of 10 mL, and (ii) the use of increasing added amounts of sodium formate (solid state) to the same volume of 0.5 M solution of FA (10 mL). All catalytic tests involving SF were performed at room temperature.
In the first case, three different ratios between FA and SF were comparatively tested, with the systems containing only FA or SF solutions of 0.5 M, respectively. The profiles of the evolved gas volumes are presented in Figure 9. It may be observed that in the first 60 min of the reaction, all three systems with SF present higher gas generation rates compared to the FA or SF systems alone. Indeed, TOF values calculated at 10 min of reaction are at least double to that of the corresponding value of the FA system, and they increase with an increasing SF concentration in the system. On the other hand, the steady state gas volumes are inferior for each FA:SF system in comparison to the FA system alone. In terms of the hydrogen yield, evaluated as the ratio of formed H2 (mole) to the total mole number of FA and SF, according to Equation (5),
( )2
2100, %= ⋅
+Φ H
formed
HFA SF
nn n
(5)
all FA:SF systems show surprisingly inferior values in comparison to the FA system alone, while the SF solution alone yields the lowest values after both a 4 and 24 h reaction time (see Table 3).
Figure 9. Influence of the FA:SF ratio on the evolved gas volumes in the dehydrogenation reaction of FA on Pd/TC at room temperature (20 mg of catalyst, total 5 mmol (FA + SF) in 10 mL solution, 25 °C).
Table 3. Generated gas volumes, turnover frequency (TOF) values, and H2 yield (Φ) in the case of different FA–sodium formate (SF) solutions with a total concentration of 0.5 mol/L, at 25 °C.
System [FA] + [SF] = 0.5 mol/L
Vgases (mL) TOF10 min (h−1) Φ4h (%) Φ24h (%)
FA 154.6 32.7 35.4 63.3 FA:SF = 3:1 117.4 64.0 29.4 48.1 FA:SF = 1:1 82.1 68.6 21.5 33.6 FA:SF = 1:3 60.0 77.3 15.2 24.6
SF 38.0 3.2 4.9 15.6
0 2 4 6 8 10 12 14 16 18 20 22 240
50
100
150
200
Volu
me
of e
volv
ed g
ases
(mL)
Time (h)
FA (5.0 mmol FA) FA:SF=3:1 (3.75 mmol FA/1.25 mmol SF) FA:SF=1:1 (2.5 mmol FA/2.5 mmol SF) FA:SF=1:3 (1.25 mmol FA/3.75 mmol SF) SF (5.0 mmol SF)
Figure 9. Influence of the FA:SF ratio on the evolved gas volumes in the dehydrogenation reaction ofFA on Pd/TC at room temperature (20 mg of catalyst, total 5 mmol (FA + SF) in 10 mL solution, 25 ◦C).
Table 3. Generated gas volumes, turnover frequency (TOF) values, and H2 yield (Φ) in the case ofdifferent FA–sodium formate (SF) solutions with a total concentration of 0.5 mol/L, at 25 ◦C.
System[FA] + [SF] = 0.5 mol/L Vgases (mL) TOF10 min (h−1) Φ4h (%) Φ24h (%)
FA 154.6 32.7 35.4 63.3FA:SF = 3:1 117.4 64.0 29.4 48.1FA:SF = 1:1 82.1 68.6 21.5 33.6FA:SF = 1:3 60.0 77.3 15.2 24.6
SF 38.0 3.2 4.9 15.6
Compared to other reported experimental results for active carbon-supported Pd catalysts,our results suggest a different interaction of sodium formate with the catalytic surface, especiallywith the support. The results reported by Wang et al. for the Pd (5 wt.%)/C catalyst at 30 ◦C [6],with different FA:SF ratios, but with a total concentration of 2 M, revealed the beneficial effect ofsodium formate addition on the evolved gas volumes, TOF values, and H2 yield, which all increasedwith an increasing concentration of SF in the system. In our case, on the contrary, except for theTOF values, the total gas volumes and H2 yield decreased with an increasing SF concentration in thesystem. On the other hand, it is important to notice that there is a huge difference in the decompositionefficiency of FA solution and SF solution on our Pd/TC catalyst, while previous reports on C-basedPd-supported catalysts have shown a very small difference between the two, with FA being the leastdecomposed [6]. If ammonium formate is used instead of sodium formate on a Pd/C catalyst, thedecomposition of FA is less efficient than the decomposition of ammonium formate solution [13],in contrast to our results, which show Pd/TC to be highly efficient in the decomposition of FA solutions.It follows that, alongside the deposited Pd nanoparticles known as being efficient in FA decomposition,the type of carbonaceous support also plays an important role in the catalytic performance.
Figure 10 presents the results obtained in the case of using increasing amounts of added SF tothe same volume of 0.5 M FA (10 mL). It may be observed that the evolved gas volumes increasewith an increasing concentration of SF in the system (Figure 10a), with the most rapid increase of gasvolumes over time being observed for the FA:SF = 1:3 system. Indeed, the TOF evaluated after 10 min

Hydrogen 2020, 1 33
of reaction for this system is 8.6 times larger than for FA alone (282.1 compared to 32.7 h−1) (Table 4).For all FA–SF systems, TOF values are significantly increased compared to FA alone. In terms of theH2 yield, the 3:1 and 1:1 FA:SF systems reveal higher values after 4 h of reaction compared to theFA solution alone, while the 1:3 system exhibits an inferior value. If final H2 yields are considered(after 24 h of reaction), it may be observed that these decrease with an increasing added SF amount(see Figure 10b and Table 4).
Hydrogen 2020, 1, FOR PEER REVIEW 11
Compared to other reported experimental results for active carbon-supported Pd catalysts, our results suggest a different interaction of sodium formate with the catalytic surface, especially with the support. The results reported by Wang et al. for the Pd (5 wt.%)/C catalyst at 30 °C [6], with different FA:SF ratios, but with a total concentration of 2 M, revealed the beneficial effect of sodium formate addition on the evolved gas volumes, TOF values, and H2 yield, which all increased with an increasing concentration of SF in the system. In our case, on the contrary, except for the TOF values, the total gas volumes and H2 yield decreased with an increasing SF concentration in the system. On the other hand, it is important to notice that there is a huge difference in the decomposition efficiency of FA solution and SF solution on our Pd/TC catalyst, while previous reports on C-based Pd-supported catalysts have shown a very small difference between the two, with FA being the least decomposed [6]. If ammonium formate is used instead of sodium formate on a Pd/C catalyst, the decomposition of FA is less efficient than the decomposition of ammonium formate solution [13], in contrast to our results, which show Pd/TC to be highly efficient in the decomposition of FA solutions. It follows that, alongside the deposited Pd nanoparticles known as being efficient in FA decomposition, the type of carbonaceous support also plays an important role in the catalytic performance.
Figure 10 presents the results obtained in the case of using increasing amounts of added SF to the same volume of 0.5 M FA (10 mL). It may be observed that the evolved gas volumes increase with an increasing concentration of SF in the system (Figure 10a), with the most rapid increase of gas volumes over time being observed for the FA:SF = 1:3 system. Indeed, the TOF evaluated after 10 min of reaction for this system is 8.6 times larger than for FA alone (282.1 compared to 32.7 h−1) (Table 4). For all FA–SF systems, TOF values are significantly increased compared to FA alone. In terms of the H2 yield, the 3:1 and 1:1 FA:SF systems reveal higher values after 4 h of reaction compared to the FA solution alone, while the 1:3 system exhibits an inferior value. If final H2 yields are considered (after 24 h of reaction), it may be observed that these decrease with an increasing added SF amount (see Figure 10b and Table 4).
Figure 10. Influence of the FA:SF ratio on (a) the evolved gas volumes and (b) H2 yield, in the dehydrogenation reaction of FA on Pd/TC using 10 mL FA 0.5 M solution with added amounts of solid SF (20 mg of catalyst, 25 °C).
Table 4. Generated gas volumes, TOF values, and H2 yield (Φ) in the case of increasing added amounts of SF to 10 mL 0.5 M FA solution, at 25 °C.
System (5 mmol FA + nSF)/10 mL Solution Vgases (mL) TOF10min (h−1) Φ4h (%) Φ24h (%)
FA 154.6 32.7 35.4 63.3 FA:SF = 3:1 166.8 60.1 38.7 51.3 FA:SF = 1:1 232.0 173.1 43.0 47.5 FA:SF = 1:3 369.2 282.1 25.3 37.8
0 4 8 12 16 20 240
50
100
150
200
250
300
350
400(b)
FA FA:SF=3:1 FA:SF=1:1 FA:SF=1:3
Volu
me
of e
volv
ed g
ases
(mL)
Time (h)0 4 8 12 16 20 24
0
10
20
30
40
50
60
70
80
90
100 5 mmol FA + nsolid
SF
FA FA:SF=3:1 FA:SF=1:1 FA:SF=1:3
H2 y
ield
(%)
Time (h)
(a)
Figure 10. Influence of the FA:SF ratio on (a) the evolved gas volumes and (b) H2 yield, in thedehydrogenation reaction of FA on Pd/TC using 10 mL FA 0.5 M solution with added amounts of solidSF (20 mg of catalyst, 25 ◦C).
Table 4. Generated gas volumes, TOF values, and H2 yield (Φ) in the case of increasing added amountsof SF to 10 mL 0.5 M FA solution, at 25 ◦C.
System(5 mmol FA + nSF)/10 mL Solution Vgases (mL) TOF10min (h−1) Φ4h (%) Φ24h (%)
FA 154.6 32.7 35.4 63.3FA:SF = 3:1 166.8 60.1 38.7 51.3FA:SF = 1:1 232.0 173.1 43.0 47.5FA:SF = 1:3 369.2 282.1 25.3 37.8
At a first glance, it seems that the only role of SF addition to FA solutions in the case of a Pd/TCcatalyst would be to enhance the rate of FA decomposition, without any net contribution of formateions to the overall H2 yield. However, if we consider the FA:SF = 1:3 system obtained by adding15 mmol of solid SF to 10 mL of 0.5 M FA solution, it may be observed that the total volume of evolvedgases (369.2 mL in 24 h) is larger than the total gas volume which may be theoretically obtainedfrom the dehydrogenation of the corresponding 5 mmol FA (244 mL). This is only possible by a netcontribution of SF to the FA dehydrogenation mechanism, which means that SF is not an additive tothe system, but acts as an intermediate.
The influence of temperature on the dehydrogenation efficiency in an FA:SF system was alsoinvestigated for 10 mL 0.5 M FA with added solid SF to correspond to a ratio of 3:1. As for the FAsolution alone, an increase of the reaction temperature leads to an enhancement in the gas generationrate, as well as in the total evolved gas volumes (Figure S5 in Supplementary Materials). Consequently,the H2 yield shows increasing values with an increasing reaction temperature. The highest initial TOF

Hydrogen 2020, 1 34
(after 5 min of reaction) was estimated to be 535 h−1, at 60 ◦C. This value is almost three times largerthan the corresponding value for the FA system alone, at the same temperature (196 h−1). The apparentactivation energy (Ea) was calculated and a value of 50.8 kJ/mol was obtained.
An investigation of the catalyst life time in the FA:SF = 3:1 system (10 mL 0.5 M FA withadded solid SF) revealed a decrease of the H2 generation efficiency with an increasing numberof cycles, with a significant difference already being observed between the first and second run(Figure S6 in Supplementary Materials). The following cycles revealed H2 yields comparable to thecase when recyclability tests were performed in the presence of FA solution alone. The main advantagein using added SF to the FA solution is the fact that the gas generation rates may be significantlyincreased. Except for the first two runs, initial TOFs (after 2 min of reaction) are at least 5–6 times largerif SF is present in the reaction system. However, after 10 min of reaction, TOF values are stabilized ataround 50–60 h−1 (Figure 11), but are still at least three times higher than with no added SF.
Hydrogen 2020, 1, FOR PEER REVIEW 12
At a first glance, it seems that the only role of SF addition to FA solutions in the case of a Pd/TC catalyst would be to enhance the rate of FA decomposition, without any net contribution of formate ions to the overall H2 yield. However, if we consider the FA:SF = 1:3 system obtained by adding 15 mmol of solid SF to 10 mL of 0.5 M FA solution, it may be observed that the total volume of evolved gases (369.2 mL in 24 h) is larger than the total gas volume which may be theoretically obtained from the dehydrogenation of the corresponding 5 mmol FA (244 mL). This is only possible by a net contribution of SF to the FA dehydrogenation mechanism, which means that SF is not an additive to the system, but acts as an intermediate.
The influence of temperature on the dehydrogenation efficiency in an FA:SF system was also investigated for 10 mL 0.5 M FA with added solid SF to correspond to a ratio of 3:1. As for the FA solution alone, an increase of the reaction temperature leads to an enhancement in the gas generation rate, as well as in the total evolved gas volumes (Figure S5 in Supplementary Materials). Consequently, the H2 yield shows increasing values with an increasing reaction temperature. The highest initial TOF (after 5 min of reaction) was estimated to be 535 h−1, at 60 °C. This value is almost three times larger than the corresponding value for the FA system alone, at the same temperature (196 h−1). The apparent activation energy (Ea) was calculated and a value of 50.8 kJ/mol was obtained.
An investigation of the catalyst life time in the FA:SF = 3:1 system (10 mL 0.5 M FA with added solid SF) revealed a decrease of the H2 generation efficiency with an increasing number of cycles, with a significant difference already being observed between the first and second run (Figure S6 in Supplementary Materials). The following cycles revealed H2 yields comparable to the case when recyclability tests were performed in the presence of FA solution alone. The main advantage in using added SF to the FA solution is the fact that the gas generation rates may be significantly increased. Except for the first two runs, initial TOFs (after 2 min of reaction) are at least 5–6 times larger if SF is present in the reaction system. However, after 10 min of reaction, TOF values are stabilized at around 50–60 h−1 (Figure 11), but are still at least three times higher than with no added SF.
Figure 11. Initial TOFs and final H2 yields during the recyclability tests for the FA:SF = 3:1 system using 20 mg Pd/TC, 10 mL FA 0.5 M + 1.66 mmol SF, at 25 °C.
A comparison in terms of TOF values with previous literature reports on the performance of carbon-supported Pd catalysts in the dehydrogenation of formic acid (in the absence or presence of sodium formate) is quite difficult, considering the large variety of reaction conditions employed (especially the different metal to formic acid ratios). The range of reported TOFs is very wide, although it is not always clear at what conversion values or at what moment in time these numbers where estimated. However, in comparison to other carbon-supported Pd catalysts, our TOF values at room temperature and with no added formate salts are generally superior, being 143.7 h−1 compared to 6.9 h−1 Pd (5 wt.%)/C [6], 70.9 h−1 reported for the Pd (5 wt.%)/C catalyst [13], and 144 h−1 for a modified C-supported catalyst such as Pd (10 wt.%)/mesoporous graphitic carbon nitride [4]. At reaction temperatures up to 60 °C, we obtained 218.8 h−1, compared to values of between 38 and 87
1 2 3 4 5 6 7 8 9 100
50
100
150
200
250
TOFs
(h-1
)
TOFs (h-1) (after 2 min) TOFs (h-1) (after 10 min)
1 2 3 4 5 6 7 8 9 100
20
40
60
80
100FA:SF = 3:1
H2 Yield (%)
H2 Y
ield
(%)
Number of cycles
Figure 11. Initial TOFs and final H2 yields during the recyclability tests for the FA:SF = 3:1 systemusing 20 mg Pd/TC, 10 mL FA 0.5 M + 1.66 mmol SF, at 25 ◦C.
A comparison in terms of TOF values with previous literature reports on the performance ofcarbon-supported Pd catalysts in the dehydrogenation of formic acid (in the absence or presenceof sodium formate) is quite difficult, considering the large variety of reaction conditions employed(especially the different metal to formic acid ratios). The range of reported TOFs is very wide,although it is not always clear at what conversion values or at what moment in time these numberswhere estimated. However, in comparison to other carbon-supported Pd catalysts, our TOF values atroom temperature and with no added formate salts are generally superior, being 143.7 h−1 comparedto 6.9 h−1 Pd (5 wt.%)/C [6], 70.9 h−1 reported for the Pd (5 wt.%)/C catalyst [13], and 144 h−1
for a modified C-supported catalyst such as Pd (10 wt.%)/mesoporous graphitic carbon nitride [4].At reaction temperatures up to 60 ◦C, we obtained 218.8 h−1, compared to values of between 38 and87 h−1 at 55 ◦C for Pd (5 wt.%)/C prepared by different methods [5]. On the other hand, the 535 h−1
TOF evaluated for the FA:SF = 3:1 reaction mixture at 60 ◦C is significantly superior to other reportedvalues for different FA:SF mixtures, such as 64 h−1 for in-situ synthesized Pd/C with citric acid [3] and228.3 h−1 for Pd (5 wt.%)/C and FA:SF = 1:9 at room temperature [6]. A recent paper on Pd (3.3 wt.%)/Creported a higher TOF value of 2832 h−1 at 30 ◦C, but for very different reaction conditions (2 M FA/SF(0.2/1.8), 30 mg catalyst to 9 mL solution) [21].
The most important feature of the novel Pd/TC catalyst is its performance in terms of both TOFnumbers and the H2 yield, in the dehydrogenation of FA at room temperature, with no added amounts

Hydrogen 2020, 1 35
of SF: 0.5 M FA solution leads to an H2 yield of 63.3% after 24 h of reaction, while complete FAdehydrogenation is achievable by tuning the reaction conditions.
4. Conclusions
A novel Pd/templated carbon catalyst (Pd/TC) with a target metal concentration of 10 wt.% wasprepared and tested in CO-free FA decomposition under mild conditions, in the absence and presenceof HCOONa. The high surface area catalyst, with different C forms and uniformly dispersed Pdnanoparticles on the templated C support, proved to be highly efficient in the dehydrogenation ofFA, even at room temperature. Therefore, an H2 yield of 63.3% could be obtained from the 0.5 M FAsolution after 24 h of reaction. On the other hand, depending on the FA concentration and Pd:FA ratio,adjustment of the H2 generation rate may be achieved, alongside complete FA dehydrogenation atroom temperature. The H2 yield increases with a decreasing FA concentration, while the reactiontemperature significantly enhances the H2 generation rate, but with no important effect upon the finalH2 yield. A TOF number as high as 143.7 h−1 was reached at room temperature and with no addedformate salts. In the presence of sodium formate, the H2 generation rate increased with the amount ofSF present in the reaction system, both when the total FA + SF concentration was kept constant andwhen increasing amounts of SF were added to the same 0.5 M FA solution volume. For the FA:SF = 3:1reaction mixture and at 60 ◦C, the TOF number reached 535 h−1. On the other hand, our results confirmthe findings of other reports that sodium formate acts as an intermediate, and not as an additive. Pd/TCcan be reused in both the dehydrogenation of FA solutions alone and FA + SF systems, several times.
Supplementary Materials: The following are available online at http://www.mdpi.com/2673-4141/1/1/3/s1:Figure S1. (a) N2 adsorption–desorption isotherms, and (b) pore size distribution for the TC support (pink)and Pd/TC catalyst (black); Figure S2. Powder X-ray diffraction patterns of the TC and Pd/TC catalyst;Figure S3. EDS mapping of the Pd/TC catalyst; Figure S4. EDX spectra for the Pd/TC catalyst; Figure S5.Influence of temperature on the volume of evolved gases in the FA:SF = 3:1 system using 20 mg Pd/TC,10 mL FA 0.5 M + 1.66 mmol SF; Figure S6. Reusability potential of Pd/TC in the dehydrogenation of FA:SF = 3:1system using 20 mg catalyst, 10 mL FA 0.5 M + 1.66 mmol SF, at 25 ◦C.
Author Contributions: Conceptualization, M.M., M.D.L., and G.B.; methodology, M.M., M.D.L., and G.B.;validation, M.M., M.D.L., and G.B.; formal analysis, M.M.; investigation, M.M., M.D., and L.B.-T.; resources,M.M. and G.B.; data curation, M.M. and M.D.L.; writing—original draft preparation, M.M.; writing—review andediting, M.M., M.D.L., and G.B.; visualization, M.M.; supervision, M.D.L., and G.B.; project administration, G.B.;funding acquisition, G.B. All authors have read and agreed to the published version of the manuscript.
Funding: This work was supported by a grant of the Romanian CNCS–UEFISCDI, project numberPN-II-RU-TE-2014-4-1326.
Conflicts of Interest: The authors declare no conflict of interest. The funders had no role in the design of thestudy; in the collection, analyses, or interpretation of data; in the writing of the manuscript; or in the decision topublish the results.
References
1. Grasemann, M.; Laurenczy, G. Formic acid as a hydrogen source – recent developments and future trends.Energy Environ. Sci. 2012, 5, 8171–8181. [CrossRef]
2. Singh, A.K.; Singh, S.; Kumar, A. Hydrogen energy future with formic acid: A renewable chemical hydrogenstorage system. Catal. Sci. Technol. 2016, 6, 12–40. [CrossRef]
3. Wang, Z.-L.; Yan, J.-M.; Wang, H.; Ping, Y.; Jiang, Q. Pd/C Synthesized with Citric Acid: An Efficient Catalystfor Hydrogen Generation from Formic Acid/Sodium Formate. Sci. Rep. 2012, 2, 1–6. [CrossRef]
4. Lee, J.H.; Ryu, J.; Kim, J.Y.; Nam, S.-W.; Han, J.H.; Lim, T.-H.; Gautam, S.; Chae, K.H.; Yoon, C.W. Carbondioxide mediated, reversible chemical hydrogen storage using a Pd nanocatalyst supported on mesoporousgraphitic carbon nitride. J. Mater. Chem. A 2014, 2, 9490–9495. [CrossRef]
5. Jeon, H.-J.; Chung, Y.-M. Hydrogen production from formic acid dehydrogenation over Pd/C catalysts: Effectof metal and support properties on the catalytic performance. Appl. Catal. B Environ. 2017, 210, 212–222.[CrossRef]

Hydrogen 2020, 1 36
6. Wang, X.; Qi, G.-W.; Tan, C.-H.; Li, Y.-P.; Guo, J.; Pang, X.-J.; Zhang, S.-Y. Pd/C nanocatalyst with highturnover frequency for hydrogen generation from the formic acid-formate mixtures. Int. J. Hydrogen Energy2014, 39, 837–843. [CrossRef]
7. Tedsree, K.; Li, T.; Jones, S.; Chan, C.W.A.; Yu, K.M.K.; Bagot, P.A.J.; Marquis, E.A.; Smith, G.D.W.;Tsang, S.C.E. Hydrogen production from formic acid decomposition at room temperature using a Ag-Pdcore-shell nanocatalyst. Nat. Nanotechnol. 2011, 6, 302–307. [CrossRef]
8. Jena, P.J. Materials for Hydrogen Storage: Past, Present, and Future. Phys. Chem. Lett. 2011, 2, 206–211.[CrossRef]
9. Rowsell, J.L.C.; Yaghi, O.M. Strategies for Hydrogen Storage in Metal–Organic Frameworks. Angew. Chem.Int. Ed. 2005, 44, 4670–4679. [CrossRef]
10. Blanita, G.; Coldea, I.; Misan, I.; Lupu, D. Hydrogen cryo-adsorption by hexagonal prism monoliths ofMIL-101. Int. J. Hydrogen Energy 2014, 39, 17040–17046. [CrossRef]
11. Ardelean, O.; Blanita, G.; Borodi, G.; Lazar, M.D.; Misan, I.; Coldea, I.; Lupu, D. Volumetric hydrogenadsorption capacity of densified MIL-101 monoliths. Int. J. Hydrogen Energy 2013, 38, 7046–7055. [CrossRef]
12. Jiang, H.-L.; Singh, S.K.; Yan, J.-M.; Zhang, X.-B.; Xu, Q. Liquid-Phase Chemical Hydrogen Storage: CatalyticHydrogen Generation under Ambient Conditions. ChemSusChem 2010, 3, 541–549. [CrossRef]
13. Zhou, J.-P.; Zhang, J.; Dai, X.-H.; Wang, X.; Zhang, S.-Y. Formic acid-ammonium formate mixture: A newsystem with extremely high dehydrogenation activity and capacity. Int. J. Hydrogen Energy 2016, 41,22059–22066. [CrossRef]
14. Wang, Z.-L.; Yan, J.-M.; Ping, Y.; Wang, H.-L.; Zheng, W.-T.; Jiang, Q. An Efficient CoAuPd/C Catalyst forHydrogen Generation from Formic Acid at Room Temperature. Angew. Chem. Int. Ed. 2013, 52, 4406–4409.[CrossRef]
15. Akbayrak, S.; Tonbul, Y.; Ozkar, S. Nanoceria supported palladium(0) nanoparticles: Superb catalyst indehydrogenation of formic acid at room temperature. Appl. Catal. B Environ. 2017, 206, 384–392. [CrossRef]
16. Enthaler, S.; von Langermann, J.; Schmidt, T. Carbon dioxide and formic acid—the couple forenvironmental-friendly hydrogen storage? Energy Environ. Sci. 2010, 3, 1207–1217. [CrossRef]
17. Yang, L.; Hua, X.; Su, J.; Luo, W.; Chen, S.; Cheng, G. Highly efficient hydrogen generation from formicacid-sodium formate over monodisperse AgPd nanoparticles at room temperature. Appl. Catal. B Environ.2015, 168–169, 423–428. [CrossRef]
18. Wang, Z.-L.; Ping, Y.; Yan, J.-M.; Wang, H.; Jiang, Q. Hydrogen generation from formic acid decomposition atroom temperature using a NiAuPd alloy nanocatalyst. Int. J. Hydrogen Energy 2014, 39, 4850–4856. [CrossRef]
19. Karatas, Y.; Bulut, A.; Yurderi, M.; Ertas, I.E.; Alal, O.; Gulcan, M.; Celebi, M.; Kivrak, H.; Kaya, M.;Zahmakiran, M. PdAu-MnOx nanoparticles supported on amine-functionalized SiO2 for the roomtemperature dehydrogenation of formic acid in the absence of additives. Appl. Catal. B Environ. 2016, 180,586–595. [CrossRef]
20. Bulushev, D.A.; Beloshapkin, S.; Ross, J.R.H. Hydrogen from formic acid decomposition over Pd and Aucatalysts. Catal. Today 2010, 154, 7–12. [CrossRef]
21. Kim, Y.; Kim, S.; Chul, H.; Heui, D.J. Mechanistic insights on aqueous formic acid dehydrogenation overPd/C catalyst for efficient hydrogen production. J. Catal. 2020, 389, 506–516. [CrossRef]
22. Grad, O.; Mihet, M.; Coros, M.; Dan, M.; Lazar, M.D.; Blanita, G. Reduced graphene oxide modified withnoble metal nanoparticles for formic acid dehydrogenation. Catal. Today 2020, in press. [CrossRef]
23. Zacharska, M.; Chuvilin, A.L.; Kriventsov, V.V.; Beloshapkin, S.; Estrada, M.; Simakov, A.; Bulushev, D.A.Support effect for nanosized Au catalysts in hydrogen production from formic acid decomposition.Catal. Sci. Technol. 2016, 6, 6853–6860. [CrossRef]
24. Bi, Q.-Y.; Du, X.-L.; Liu, Y.-M.; Cao, Y.; He, H.-Y.; Fan, K.-N. Efficient Subnanometric Gold-CatalyzedHydrogen Generation via Formic Acid Decomposition under Ambient Conditions. J. Am. Chem. Soc. 2012,134, 8926–8933. [CrossRef] [PubMed]
25. Gazsi, A.; Bansagi, T.; Solymosi, F.J. Decomposition and Reforming of Formic Acid on Supported AuCatalysts: Production of CO-Free H2. Phys. Chem. C 2011, 115, 15459–15466. [CrossRef]
26. Grad, O.; Mihet, M.; Dan, M.; Blanita, G.; Berghian-Grosan, C.; Lazar, M.D. Au/reduced graphene oxidecomposites: Eco-friendly preparation method and catalytic applications for formic acid dehydrogenation.J. Mater. Sci. 2019, 54, 6991–7004. [CrossRef]

Hydrogen 2020, 1 37
27. Zhou, X.; Huang, Y.; Xing, W.; Liu, C.; Liao, J.; Lu, T. High-quality hydrogen from the catalyzed decompositionof formic acid by Pd–Au/C and Pd–Ag/C. Chem. Commun. 2008, 30, 3540–3542. [CrossRef]
28. Gu, X.; Lu, Z.-H.; Jiang, H.; Akita, T.; Xu, Q.J. Synergistic catalysis of metal-organic framework-immobilizedAu-Pd nanoparticles in dehydrogenation of formic acid for chemical hydrogen storage. Am. Chem. Soc. 2011,133, 11822–11825. [CrossRef]
29. Dai, H.; Cao, N.; Yang, L.; Su, J.; Luo, W.; Cheng, G.J. AgPd nanoparticles supported on MIL-101 as highperformance catalysts for catalytic dehydrogenation of formic acid. Mater. Chem. A 2014, 2, 11060–11064.[CrossRef]
30. Hu, C.; Ting, S.-W.; Tsui, J.; Chan, K.-Y. Formic acid dehydrogenation over PtRuBiOx/C catalyst for generationof CO-free hydrogen in a continuous-flow reactor. Int. J. Hydrogen Energy 2012, 37, 6372–6380. [CrossRef]
31. Doustkhah, E.; Hasani, M.; Ide, Y.; Assadi, M.H.N. Pd Nanoalloys for H2 Generation from Formic Acid.ACS Appl. Nano Mater. 2020, 3, 22–43. [CrossRef]
32. Hou, P.X.; Yamazaki, T.; Orikasa, H.; Kyotani, T. An easy method for the synthesis of ordered microporouscarbons by the template technique. Carbon 2005, 43, 2624–2627. [CrossRef]
33. Ma, Z.; Kyotani, T.; Tomita, A. Synthesis methods for preparing microporous carbons with a structuralregularity of zeolite Y. Carbon 2002, 40, 2367–2374. [CrossRef]
34. Doustkhah, E.; Mohtasham, H.; Farjzadeh, M.; Rostamnia, S.; Wang, Y.; Arandiyan, H.; Assadi, M.H.N.Organosiloxane tunability in mesoporous organosilica and punctuated Pd nanoparticles growth; theory andexperiment. Microporous Mesoporous Mater. 2020, 293, 109832. [CrossRef]
35. Ojeda, M.; Iglesia, E. Formic Acid Dehydrogenation on Au-Based Catalysts at Near- Ambient Temperatures.Angew. Chem. Int. Ed. 2009, 48, 4800–4803. [CrossRef]
36. Rootsaert, W.M.H.; Sachtler, W.J.M. Interaction of Formic Acid Vapour with Tungsten. Z. Phys. Chem. 1960,26, 16–26. [CrossRef]
Publisher’s Note: MDPI stays neutral with regard to jurisdictional claims in published maps and institutionalaffiliations.
© 2020 by the authors. Licensee MDPI, Basel, Switzerland. This article is an open accessarticle distributed under the terms and conditions of the Creative Commons Attribution(CC BY) license (http://creativecommons.org/licenses/by/4.0/).
Copyright © 2022 FDOKUMEN