Optical impedance matching with scanning near-field optical microscopy
Upload
independentCategory
view
3download
0
Com
JND7BS
MND1S
SB1#S
ND1S
TKNS5S
KSNSBS
CNDB7SE
1
Ihibt
AsEc
Journal of Biomedical Optics 14�5�, 054015 �September/October 2009�
J
ontrol of optical contrast using gold nanoshells forptical coherence tomography imaging ofouse xenograft tumor model in vivo
ames Chen Yong Kahational University of Singaporeivision of BioengineeringEngineering Drive 1lk E3A, #04-15ingapore, 117574
alini Olivoational Cancer Center Singaporeivision of Medical Sciences
1 Hospital Driveingapore 169610
andingapore Bioimaging Consortiumiomedical Sciences Institutes1 Biopolis Way02-02 Heliosingapore, 138667
andational University of Singaporeepartment of Pharmacy8 Science Drive 4ingapore, 117543
zu Hao Chowin San Songanyang Technological University
chool of Electrical and Electronics Engineering0 Nanyang Avenueingapore, 639798
aren Zhen Yu Kohubodh Mhaisalkaranyang Technological University
chool of Materials Science and Engineeringlock N4.1 Nanyang Avenueingapore, 639798
olin James Richard Sheppardational University of Singaporeivision of Bioengineeringlock E3A #04-15Engineering Drive 1
ingapore, 117576
Abstract. The control of image contrast is essential toward optimizinga contrast enhancement procedure in optical coherence tomography�OCT�. In this study, the in vivo control of optical contrast in a mousetumor model with gold nanoshells as a contrast agent is examined.Gold nanoshells are administered into mice, with the injected dosageand particle surface parameters varied and its concentration in thetumor under each condition is determined using a noninvasive theo-retical OCT modeling technique. The results show that too high aconcentration of gold nanoshells in the tumor only enhances the OCTsignal near the tissue surface, while significantly attenuating the signaldeeper into the tissue. With an appropriate dosage, IV deliveryof gold nanoshells allows a moderate concentration of6.2�109 particles/ml in tumor to achieve a good OCT signal en-hancement with minimal signal attenuation with depth. An increasein the IV dosage of gold nanoshells reveals a corresponding nonlinearincrease in their tumor concentration, as well as a nonlinear reductionin the fractional concentration of injected gold nanoshells. Further-more, this fractional concentration is improved with the use of anti-epodermal growth factor receptor �EGFR� surface functionalization,which also reduces the time required for tumor delivery from 6 to 2 h.© 2009 Society of Photo-Optical Instrumentation Engineers. �DOI: 10.1117/1.3233946�
Keywords: gold nanoshells; optical coherence tomography; contrast agent; mousetumor; tumor localization; contrast enhancement.Paper 09043RR received Feb. 10, 2009; revised manuscript received Jul. 21, 2009;accepted for publication Jul. 25, 2009; published online Oct. 26, 2009.
-mail: [email protected]
Introduction
n biomedical imaging of tissues, it is often desirable to en-ance the signal measured from specific structures. For mostmaging modalities, the effectiveness of medical images haseen enhanced with the aid of contrast agents. These agentshat selectively localize at specific organ sites or tissues of
ddress all correspondence to: Colin James Richard Sheppard, Professor, Divi-ion of Bioengineering, National University of Singapore, Block E3A, #04-15, 7ngineering Drive 1, Singapore 117576. Tel: 65 65161910; E-mail:[email protected]
ournal of Biomedical Optics 054015-
Downloaded from SPIE Digital Library on 28 Dec 2009 to 1
interest to produce specific image signatures have been suc-cessfully utilized in almost every medical imaging technique,including ultrasound, computed tomography �CT�, magneticresonance imaging �MRI�, and optical microscopy.
Optical coherence tomography �OCT� is an emerging bio-medical imaging modality that shows promise for a widerange of biomedical applications.1 It is a noninvasive methodfor cross sectional subsurface imaging of tissue up to a depthof 2 mm with a high spatial resolution of 10 to 15 µm, based
1083-3668/2009/14�5�/054015/13/$25.00 © 2009 SPIE
September/October 2009 � Vol. 14�5�1
37.132.123.69. Terms of Use: http://spiedl.org/terms
otrtseomicctsrwn
rfOseswictteats
asahttowsmnunroecstif
iucwab
Kah et al.: Control of optical contrast using gold nanoshells for OCT imaging…
J
n interference detection of optical echoes of light backscat-ered in the near-infrared �NIR� region �0.75 to 1.3 µm�. Thisegion is of biological significance, as it provides a window inhe spectrum where the components of tissue do not haveignificant absorption,2 thus promoting maximum light pen-tration for imaging. The principles of OCT have been previ-usly described.1,3 OCT is already used as a standard imagingodality in ophthalmology to visualize retinal anatomy,4 and
ts potential in gastroenterology,5–8 gynecology,9 andardiology10,11 is under investigation. Since OCT is capable ofellular-resolution imaging, it has proved to be an efficientechnique for in vivo imaging of superficial tissues such askin and mucous membranes,10,12 and may ultimately have aole in the diagnosis of early human malignancies9,13–15 asell as identifying tumor margins in real time without theeed for tissue biopsy.16
The source of contrast in OCT is a change in the index ofefraction. In turbid tissues, there are many microscopic re-ractive index mismatches within a resolution element of theCT system. Thus, the OCT signal received is a general mea-
ure of the backscattering properties of the tissue. Tissue lay-rs can often be distinguished by a difference in their back-cattering properties compared to adjacent layers. In general,hile OCT images have proven to be very useful in identify-
ng normal and pathological tissues such as actinic keratosis,17
olon adenomas and carcinomas,18,19 and developing cardiacissue,20 imaging in OCT is frequently hindered by poor con-rast between adjacent tissues. Although morphological differ-nces between normal and neoplastic tissues can be obvioust later stages of tumor development, it is challenging to de-ect early stage tumors that are morphologically �or optically�imilar to surrounding normal tissues.
Contrast agents are often used to increase the diagnosticnd analytical capabilities of imaging modalities by site-pecific labeling of tissues of interest. By targeting contrastgents to a tissue of interest, their image can be improved toighlight the tissue and provide a clear demarcation betweenhe selected tissue and their surroundings. Therefore, a selec-ive optical agent for contrast enhancement on a specific sitef interest would be useful to better differentiate tissue typesith similar scattering properties, detect subtle changes in tis-
ue morphology, and identify early cancerous changes in hu-an tissues that are morphologically similar to surrounding
ormal tissues. This holds true for OCT imaging, where these of contrast agents offers the promise of enhanced diag-ostic power with the potential to overcome the limitation ofelying on inherent optical properties to discriminate pathol-gy. Since OCT detects scattering changes, image contrastnhancement can be achieved by delivery of highly scatteringontrast agents into the tissue, allowing them to localize topecific regions of interest. Thus, tissues with injected con-rast agents would scatter more light back from regions ofnterest to produce a stronger OCT signal, which is detected toorm a contrast-enhanced OCT image.
The traditional way of improving image contrast in OCTmages employs the use of osmotically active immersion liq-ids such as glycerol, propylene glycol, dextranes, and con-entrated glucose solution.21,22 Other types of contrast agentsith particulate natures, such as air-filled microbubbles23,24
nd engineered microspheres with a protein shell,25 have alsoeen designed to increase the backscattered light intensity and
ournal of Biomedical Optics 054015-
Downloaded from SPIE Digital Library on 28 Dec 2009 to 1
alter the local optical properties of tissue to enhance the utilityof OCT. Despite promising results with �5% improvement inoptical contrast obtained with microbubbles,26 particulate con-trast agents for OCT can be improved to further enhance im-age contrast in vivo by introducing smaller nanometer alter-natives to engineered microspheres ��2 to 15 µm� to improvetheir distribution in microcirculation.
In the present work, we present an approach to OCT im-aging using gold nanoshells as a contrast agent. Being effec-tive for backscattering types of imaging in vitro,27,28 goldnanoshells could can also be a potentially effective contrast-ing agent for OCT. The effectiveness of using gold nanoshellsin enhanced OCT imaging has been demonstrated.26,27,29 Goldnanoshells possess a core-shell structure comprised of a me-tallic gold layer surrounding a dielectric core such as silica,that is capable of exhibiting a strong optical extinction at vis-ible and NIR wavelengths to produce enhanced optical back-scatter. This is due to a localized surface plasmon resonanceof their free electrons on excitation by an electromagneticfield.30 Because OCT detects light backscattered at index ofrefraction mismatches in tissues, it is anticipated that the goldnanoshells with very high scattering efficiency and minimalabsorption at the OCT NIR source wavelength would there-fore produce a strong OCT signal that is detectable in themidst of highly scattering tissue.27,29 This optical resonancecan be custom-tuned anywhere in the spectrum from the vis-ible through the NIR by varying the relative size of the coreand the thickness of the shell31 for compatibility with the spe-cific imaging source wavelength. Gold nanoshells are alsosmall ��300 nm� and biologically inert,32 thus making themsuitable for in vivo use.
O’Neal et al.33 reported on the use of polyethylene glycol-coated gold nanoshells ��130 m in diameter� that localize inthe tumor passively after IV delivery due to the enhancedpermeability and retention �EPR� effect, by which nanoscalematerials are preferentially deposited in tumors �as opposed tonormal tissue�, as they passively extravasate through the leakyand aberrant tumor vasculature.34,35 This passive nanoparticlelocalization in the tumor can be detected by the optical con-trast that the gold nanoshells elicit under OCT. However, goldnanoshells may also be tailored to adhere to specific mol-ecules, cells, or tissue types to provide additional selectivityfor imaging. This is effected through appropriate surface func-tionalization, for example by conjugation with antibody orproteins to facilitate interaction between tumor cell surfacereceptors and receptor ligands attached to gold nanoshells.
Despite the successful demonstration of gold nanoshells asan OCT contrast agent, there are at least three identified issuesthat should be addressed for a more effective imaging in vivo.First, the available in vivo experimental data are insufficientfor developing an appropriate contrasting procedure, since de-tailed parametric studies such as dosage of gold nanoshellsadministered have not been performed to demonstrate controlof optical contrast in vivo. Second, while targeting of macro-molecular anticancer drugs has been studied in detail, less isknown about the dynamics of EPR for metal nanoparticles invivo primarily due to the lack of techniques to monitor themin a tissue noninvasively. For example, the current standardmethod to measure gold nanoshell concentrations in tissue isneutron activation analysis �NAA�,36 which requires tissue ex-cision, dehydration, and irradiation within a nuclear reactor.
September/October 2009 � Vol. 14�5�2
37.132.123.69. Terms of Use: http://spiedl.org/terms

WqdstbiHmtjp
diobttasio
dingnnrisgmcT�mipcsedad
22
GotIn�m�b
Kah et al.: Control of optical contrast using gold nanoshells for OCT imaging…
J
hile extremely sensitive, this method is invasive and re-uires animal sacrifice. Thus, it is not appropriate for longitu-inal monitoring of metal nanoparticle distribution in livingystems. Third, although improvement in optical contrast ofumor cells has been widely demonstrated in vitro using anti-ody conjugated gold nanoparticles of various shapes, includ-ng spherical gold nanoshells,27 gold nanocages,37 targeted toER-2/neu receptors, and gold nanorods targeted to epider-al growth factor receptor �EGFR�,38 there is an entire scien-
ific community struggling with the use of such antibody con-ugated nanoparticles for in vivo targeting, and the amount ofublished data, while available,39–42 is lacking.
In this study, we aim to address the issues described byemonstrating the control of optical contrast of tumors grownn a murine in vivo model through varying the concentrationf injected gold nanoshells and the use of appropriate anti-ody surface functionalization on gold nanoshell delivery toumors. Here, the definition of contrast that we adopt is that ofhe difference in the image signal of the tissue before and afterdministering the contrast agent. We also develop a noninva-ive technique to determine the gold nanoshell concentrationn tumor tissue of live mice based on the theoretical modelingf OCT backscattering signal profile.
Our approach involves examining the optical contrast withifferent modes of nanoshell delivery into tumor tissue, i.e.,ntratumoral and IV, different concentrations of goldanoshells injected via IV, and the use of antibody conjugatedold nanoshells compared to nonfunctionalized goldanoshells, as well as estimating the concentration of goldanoshells in the tumor tissue under these different deliveryegimes. The purpose of introducing the gold nanoshells viantratumoral route is to illustrate the effect of oversaturatedcattering on the OCT image with a high concentration ofold nanoshells in the tumor. A covalent antibody conjugationethod was previously demonstrated43 to produce antibody
onjugated gold nanoshells with excellent colloidal stability.he selective targeting of epidermal growth factor receptor
EGFR� positive cancer cells in vitro using an anti-EGFRonoclonal antibody has also been demonstrated.44,45 EGFR
s a transmembrane glycoprotein that is frequently overex-ressed in a variety of solid tumors46–48 and is used as ourancer marker in this study. The results in this study demon-trate successful control of optical contrast in vivo. The in vivostimation of gold nanoshell concentration in tumors is brieflyiscussed and cross-examined with the optical contrast in im-ging to give a better understanding of the dynamics of tumorelivery under different circumstances.
Materials and Methods.1 Synthesis and Surface Functionalization of Gold
Nanoshellsold nanoshells were synthesized and pegylated according tour previously published protocol.49,50 For antibody conjuga-ion, the monoclonal anti-EGFR �Santa Cruz Biotechnologyncorporated, Santa Cruz, California� was conjugated to goldanoshells using poly�ethylene�glycol SH-PEG-COOH �MW3000 g/mol, Celares GmbH, Berlin� as the linker withethoxy-poly�ethylene glycol�-thiol �mPEG-thiol� �MW2000 Da, �92%, Celares GmbH� functioning as spacers in
etween. The mixture of both PEGs containing nine parts of
ournal of Biomedical Optics 054015-
Downloaded from SPIE Digital Library on 28 Dec 2009 to 1
mPEG-thiol to 1 part SH-PEG-COOH was attached to thegold nanoshells by incubating 1 ml of the described mixture�10 mg/ml� with 1 ml of the gold nanoshells �2.0�1013 particles /ml� under water bath sonication for 5 min atroom temperature as described. After several washes to re-move excess PEGs, the carboxylic end of the linker was thenattached to the amine groups on the anti-EGFR via carbodi-imide chemistry to form an amide bond. This was done withthe aid of 200 µl each of 400-mM 1-ethyl-3-�3-dimethylaminopropyl�-carbo �EDC� �Sigma-Aldrich, SantLouis, Missouri� and 100 mM of N-hydroxysuccinimide�NHS� �Sigma-Aldrich� as activators added to 1 ml of thepegylated gold nanoshells and incubated for about 20 min atroom temperature, before the addition of 20 µl �i.e., 4 µg� ofthe anti-EGFR. The conjugation was completed within 1 h atroom temperature. The pegylated and antibody conjugatedgold nanoshells were then rinsed before being redispersed in2 ml of phosphate buffer solution �1� PBS, pH 7.4� to a finalconcentration of 2.0�1013 particles /ml, as determined bycorrelating its extinction spectroscopy data to the theoreticalextinction cross section data of the gold nanoshells based onthe Mie theory. The synthesized gold nanoshells were storedat 4 °C until further use.
The particle size was characterized by transmission elec-tron microscopy �TEM� �Jeol JEM-1010, Jeol, Tokyo� operat-ing at 100 kV. Gold nanoshells with a 162-nm-diam silicacore surrounded by a gold shell of 23 nm thickness weresynthesized in this process. This size configuration was se-lected based on an optimized backscattering cross section at840 nm as predicted from the Mie theory. Their extinctionspectrum was measured using a UV-VIS spectrophotometer�Shimadzu UV-2401 PC, Shimadzu, Kyoto, Japan� in thewavelength range from 400 to 900 nm, and compared to thetheoretically predicted spectrum determined from a programwritten in Matlab that calculates the theoretical optical spectraof core-shell structures based on the Mie theory for a singlegold nanoshell of the same size configuration.51
2.2 Mouse Xenograft Tumor ModelThe mouse xenograft tumor model used in this study wasdeveloped on male Balb/c nude mice obtained from the Ani-mal Resource Centre �ARC, Western Australia�. The micewere 6 to 8 weeks of age and weighed an average of 24 to25 g. Approximately 5.0�106 human epidermoid carcinomacell line, A-431 �ATCC� suspended in 150 µl of Hanks’ bal-anced salt solution �HBSS� �Gibco, Carlsbad, California�were injected subcutaneously into the lower flanks of the miceto establish the xenograft tumor model. The tumors were al-lowed to grow to 5 to 6 mm in diameter approximately after14 days of inoculation before OCT imaging was carried out.All handling procedures for mice were approved by the Insti-tutional Animal Care and Use Committee �IACUC� at Sing-Health, Singapore, in accordance with international standards.
2.3 Small Animal Optical Coherence TomographyImaging
Prior to imaging, the pegylated gold nanoshells were sus-pended in HBSS to various concentrations and administeredinto the mice via intratumoral or IV injection. For the intra-tumoral injection, the mouse was first anaesthetized before
September/October 2009 � Vol. 14�5�3
37.132.123.69. Terms of Use: http://spiedl.org/terms

1dFf4tliac9aitw
rsdittnemiiicatnAB1acpoac
Fi
Kah et al.: Control of optical contrast using gold nanoshells for OCT imaging…
J
50 µl of the gold nanoshells �9.0�1010 particles /ml� wasirectly injected with care into the tumor to minimize leakage.or the IV delivery, 150 µl of the pegylated gold nanoshells ofour different concentrations: 1.1�1010, 2.3�1010,.5�1010, and 9.0�1010 particles /ml were injected into theail vein and allowed to circulate for 6 h for the nanoshells toocalize in the tumor before the mouse was anaesthetized formaging. As a comparison between antibody functionalizednd nonfunctionalized gold nanoshells, 150 µl of anti-EGFRonjugated gold nanoshells with a concentration of.0�1010 particles /ml were also injected into the tail veinnd allowed to circulate for 2 and 6 h prior to imaging tonvestigate and compare their longitudinal accumulation inissue. For each of the test conditions, the OCT measurementsere performed in triplicates, i.e., n � 3.
The commercial OCT system from Bioptigen, Incorpo-ated �Durham, North Carolina� was used in this study and theystem schematic is shown in Fig. 1. This portable system isescribed in more detail in our previous paper.50 During themaging procedure, the skin covering the tumor was removedo create an open tumor window that allowed the underlyingumor and the tumor-skin interface to be imaged �Fig. 1�. Theormal skin adjacent to the tumor was also imaged as a ref-rence. A coverslip was positioned on top of the exposed tu-or to remove the uneven contour for imaging. The space
n-between was immersed in glycerol to provide index match-ng to reduce specular reflective artifact at the tissue-glass,nterface. The OCT probe was placed directly on top of theoverslip and the tumors were vertically positioned and im-ged with the top surface of the coverslip at 200 µm from theop of the OCT image screen for standardization. The scan-ing was done under B-mode imaging with 1000 axial-scans to give an overall lateral scan range of 6 mm per-scan frame; the imaging depth was about 1.5 mm. All the000 columns of axial A-scans from each B-scan were alsoveraged to obtain an average A-scan profile. As each testondition was performed in triplicate, i.e., n � 3, the A-scanrofile for each mouse measurement was further averaged tobtain the mean A-scan profile of the triplicates for furthernalysis. All parameters including focus position and softwareonstants remained the same throughout the entire study.
ig. 1 The schematic of the spectral domain OCT imaging system umaging various samples such as phantom and small animal models
ournal of Biomedical Optics 054015-
Downloaded from SPIE Digital Library on 28 Dec 2009 to 1
2.4 Tumor Tissue Examination for Gold NanoshellsThe imaged tumor tissues were examined for gold nanoshellsusing hematoxylin and eosin staining and confocal reflectancemicroscopy. Cryosections of 10 µm thickness at the site ofimaging were obtained using a microtome cryostat �Cryo-StarHM 560MV, Germany�, and the tissue sections were mountedonto slides. Sections were then counterstained with eithereosin alone or a combination of Harris’ hematoxylin andeosin, dehydrated in ascending grades of alcohol, mountedonto a coverslip with DePex as the mounting medium, andsealed with nail varnish prior to imaging. Images from theslides were obtained using the Olympus CK40 microscopewith a 20� objective, and were captured in brightfield modeusing the image processing software �Kontron KS400, version3.0, Hallbergmoos, Germany�. For confocal reflectance mi-croscopy, the sectioned tissues were imaged using a laserscanning confocal microscope �Carl Zeiss LSM510 Meta� un-der confocal reflectance mode with an Olympus 20� objec-tive. The confocal reflectance microscopy was performed un-der 633-nm excitation with a helium neon laser.
2.5 Image Data AnalysisThe data from the OCT imaging were output to a computerfor digital processing using the proprietary InVivoVue OCTsoftware suite �Bioptigen Incorporated, Durham, North Caro-lina� to obtain the OCT individual A- and B-scan images. The2-D B-scan images of 784 � 468 pixels were obtained byscanning the single-mode optical beam laterally over thesample, as described earlier. A custom routine was written inMatlab to further process the OCT image file offline to obtainthe average A-scans for subsequent analysis and extraction ofthe �s of the imaged sample.
The multiple scattering theoretical OCT model based onthe extended Huygens-Fresnel �EHF� theory was used to fitthe measured average A-scan profile to extract the �s of thetissue under measurement.52 This model accounts for bothsingle and multiple scatterings in the sample, and is thus ableto fit well into the average A-scan profile for a wide range of�s, including those used in this study. The curve-fitting pro-cess utilized a nonlinear least square fit of the data. For fitting
this study. Image courtesy of Bioptigen Incorporated. The setup forn as an inset in the figure.
sed inis show
September/October 2009 � Vol. 14�5�4
37.132.123.69. Terms of Use: http://spiedl.org/terms

osau�f�8acHasOtw
waas�ttHmm
33Tomwsoola
FUt
Kah et al.: Control of optical contrast using gold nanoshells for OCT imaging…
J
f gold nanoshells in tumor tissue, the anisotropy factor g waset to 0.7 �Ref. 50���rms=0.77� for all cases. This is thenisotropy factor of tumor tissue that is the dominant scatterersed in the study. The anisotropy factor of gold nanoshellsg=0.0004� was not considered in the fitting, as the volumeraction of gold nanoshells used in our study, i.e., 0.0004based on the highest gold nanoshell concentration of.5�1010 particles /ml in 113 mm3 of tumor �5 mm radius�fter intratumoral injection� is too small to cause a substantialhange in the overall scattering angle when added into tissue.owever, to ascertain this would require a separate theoretical
nd experimental treatment, which would be beyond thecope of this study. In any case, the fitting of the theoreticalCT model appears rather insensitive to a range of aniso-
ropy, as the R2 value for the curve fitting does not vary muchhen the anisotropy is varied.
Since the system parameters such as the focal length, beamaist, source wavelength and refractive index of the sample
re known a priori, the fitting process only involved �t. It islso known that the total sample extinction coefficient is theum of the absorption and scattering coefficient, i.e.,
t=�a+�s. For most tissues, the absorption is often assumedo be negligible, i.e., �t��s, since the intrinsic tissue absorp-ion is known to be very small around the source wavelength.ence, the OCT depth-dependent average A-scan has beenodeled as a function of the scattering coefficient �s of theedium instead of �t.
Results.1 Optical Properties of Gold Nanoshellshe TEM image and measured UV-VIS extinction spectrumf the synthesized gold nanoshells are shown in Fig. 2. Theeasured spectrum shows that the 162-nm-diam silica coreith 23-nm gold layer nanostructure produces a peak in its
urface plasmon resonance at 765 nm, which is close to theperating wavelength of our OCT system to generate a largeptical extinction in the gold nanoshells when excited by ouright source. We note that the measured spectrum generallygrees well with the theoretical spectrum, although spectral
ig. 2 �a� Electron micrograph of gold nanoshells with an 81-nm radiuV-VIS extinction spectrum of the synthesized gold nanoshells �solid
he same dimension as derived from the Mie theory is shown for com
ournal of Biomedical Optics 054015-
Downloaded from SPIE Digital Library on 28 Dec 2009 to 1
broadening in the measured spectrum is observed. This maybe attributed to the heterogeneity within a small population ofgold nanoshells due to size variation in the silica core �typi-cally about 4 % in our synthesis process49�, as well as thedifferences in surface roughness and thickness of the shellformed.
3.2 Changes in Optical Contrast with DifferentDelivery Modes
For our in vivo study, we first show the observable changes inthe optical contrast of tumor tissue when gold nanoshells aredelivered via two different delivery modes into the tumor:intratumoral and IV. These two delivery modes deliver differ-ent amounts of gold nanoshells to the tumor, which would beuseful to illustrate the difference in contrast enhancement aris-ing from different gold nanoshell concentrations in tumors.The OCT images in Fig. 3�a� were acquired at the interface
tric silica nanoparticle core and 23-nm-thick gold shell. �b� Measuredhe theoretically calculated extinction spectrum of gold nanoshells ofn �dotted line�.
Fig. 3 �a� OCT images of the interface between normal peripheralskin and tumor tissue of mouse model prior to and after IV and intra-tumoral gold nanoshell delivery. The horizontal reflective surfaceshown on top of the tissue arises from the coverslip used to removethe uneven tissue contour for imaging. �b� Histological tissue sectionsof the tumor after HE staining for tumor without gold nanoshells �left�,and tumor post-IV �middle� and intratumoral �right� gold nanoshelldelivery. The HE stained tissue sections show the presence of goldnanoshells in the tumor tissue. Images were acquired with a 20�objective.
s dielecline�. Tpariso
September/October 2009 � Vol. 14�5�5
37.132.123.69. Terms of Use: http://spiedl.org/terms
bplfcrdsfas
ipaamtt
is
F�tgt
Kah et al.: Control of optical contrast using gold nanoshells for OCT imaging…
J
etween the tumor and surrounding normal skin tissue. Com-ared to tumor tissue in the absence of gold nanoshells, aarge concentration of gold nanoshells in the tumor arisingrom intratumoral injection shows at least two distincthanges in the OCT image. First, the OCT signal attenuatesapidly with depth to result in a loss of image brightnesseeper into the tissue. This is accompanied by a signal inten-ity enhancement at the tissue surface. The overall visual ef-ect is a bright but narrow signal band at the sample surfacetop a dark region, arising from the highly attenuated OCTignal.
However, for a moderate concentration of gold nanoshellsn tumor after IV delivery, the visibility of the tumor is im-roved, as the OCT signal intensity from the tumor is gener-lly increased more uniformly with depth with smaller signalttenuation, with depth into the tissue. In addition to improve-ent in tumor visibility, the OCT images also show that the
umor margin between the tumor and adjacent normal skinissue is also more clearly demarcated.
The histological tissue sections corresponding to the OCTmages acquired from the same scanned site of the tumor arehown in Fig. 3�b�. The tissue sections after HE staining show
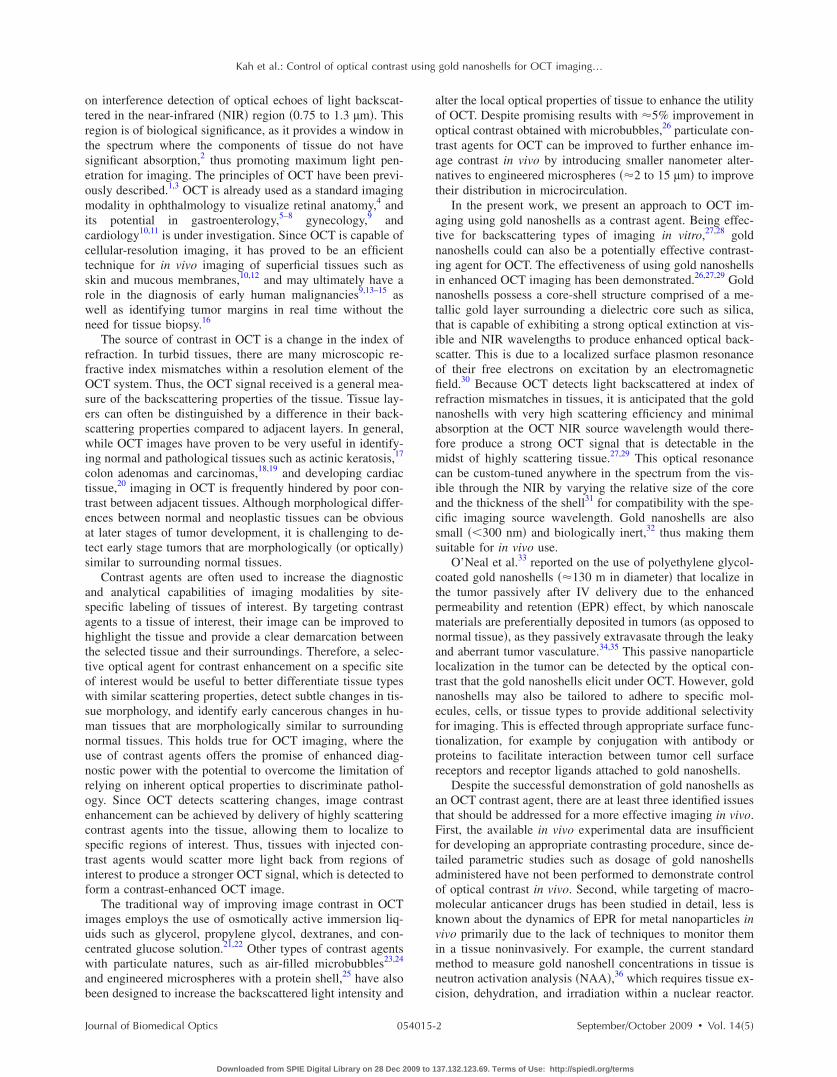
ig. 4 Average A-scan profiles of the tumor tissue of mouse model �a�b� IV and �c� intratumoral delivery of 150-�l pegylated gold nanoshehe dotted line, while the nonlinear least square fit of the data based oniving an extracted �s of the composite gold nanoshells in tumor tissuhe coefficient of determination, r2�0.90.
ournal of Biomedical Optics 054015-
Downloaded from SPIE Digital Library on 28 Dec 2009 to 1
the location of the gold nanoshells in the tumor tissue. Despitetheir nanoscale size, which is beyond the resolution limit of aconventional light microscope, the sudden intratumoral bolusinjection of gold nanoshells causes them to be concentratedand closely spaced in the tumor tissue where they becomeobservable collectively under the light microscope. With aslower delivery of gold nanoshells to the tumor via IV, theamount of gold nanoshells that localizes in the tissue issmaller and their presence in tumor can hardly be discernedvisually from the tissue section.
3.3 Determination of Tissue �s and Gold NanoshellConcentration in Tumor
The changes observed in the OCT image under differentmodes of gold nanoshell delivery described before can becharacterized by changes to the scattering coefficient �s of thetumor tissue, which in turn can be extracted from the averageOCT A-scans of the tissue. The average A-scan profile of thetumors prior to and after IV and intratumoral delivery of goldnanoshells is shown in Fig. 4. Compared to the averageA-scan profile of tumor tissue alone, the presence of gold
gold nanoshell delivery, i.e., tumor without gold nanoshells and after�1010 particles/ml� colloid. The measured OCT signal is shown by
ultiple scattering EHF theory is shown by the solid line superimposed,1.65 mm−1, �b� 2.62 mm−1, and �c� 14.95 mm−1. In all three fittings,
prior tolls �9.0the m
e of �a�
September/October 2009 � Vol. 14�5�6
37.132.123.69. Terms of Use: http://spiedl.org/terms

nOwdamnA
��fibs�=a�1a2pit
tt
wnaacascl
Tkefa8o
3
IjtkdmnT
Kah et al.: Control of optical contrast using gold nanoshells for OCT imaging…
J
anoshells in tumor after IV delivery causes an increase in theCT signal intensity, mainly at the top 300 µm of sample,hile the signal attenuation as given by the slope of theepth-dependent OCT signal becomes more pronounced. Thisttenuation is relatively small compared to that after intratu-oral delivery, where the large concentration of gold
anoshells in the tumor causes the signal in the average-scan to attenuate rapidly with depth.
The average A-scan profiles allow the extraction of overall
s,GNS in tumor of the tumor with embedded gold nanoshellsGNS in tumor� by means of a nonlinear least square curvetting of the theoretical OCT model.52 The �s,GNS contributedy gold nanoshells alone in the tumor can then be derivedimply by subtracting the �s,tumor of tumor tissue from
s,GNS in tumor53 according to the following equation: �s,GNS
�s,GNS in tumor−�s,tumor. The result of curve fitting on theverage A-scan profiles in Fig. 4 shows that the extracted
s,tumor of tumor tissue without gold nanoshells is.65�0.73 mm−1, while the extracted overall �s of tumorfter IV and intratumoral delivery of gold nanoshells, i.e., are.62�0.23 mm−1 and 14.95�0.65 mm−1, respectively. Theostsubtraction �s,GNS contributed by gold nanoshells alonen tumor after IV and intratumoral delivery is then calculatedo be 0.97 and 13.30 mm−1 respectively.
The extracted �s contributed by gold nanoshells alone fur-her allows its concentration in the tumor to be deducedhrough the following theoretical relationship:
�s = cAQsca,
here c is the concentration of our synthesized goldanoshells in particles/ml, A is its geometric cross section,nd Qsca is the scattering efficiency. This linear relationshipssumes an independent scattering approximation. With aonstant gold nanoshell size configuration �81-nm core radiusnd 23-nm shell thickness� of A=3.40�10−14 m2 used in thistudy, and a Qsca of 4.58 at 840 nm based on theoreticalalculations, �s scales linearly with concentration and the re-ationship can be further simplified to:
�s = 1.556c � 10−10 mm−1.
his linear relationship allows for an estimate of any un-nown concentration of gold nanoshells in tissue given itsxtracted �s. Based on the linear relationship described be-ore, the gold nanoshell concentration in the tumor after IVnd intratumoral delivery is approximately 6.2�109 and.5�1010 particles /ml, which is equivalent to 6.9 and 94.4%f the injected gold nanoshell concentration, respectively.
.4 Changes in Optical Contrast with GoldNanoshell Concentration
n most cases of imaging, the contrast agent is usually in-ected intravenously instead of directly into the tissue of in-erest, since the locality of the diseased site is usually un-nown. We thus extend the study on IV delivery to furtheremonstrate that intravenous control of optical contrast in tu-ors is possible by varying the concentration of gold
anoshells �1.1�1010 to 9.0�1010 particles /ml� injected.he OCT images of the tumor together with its corresponding
ournal of Biomedical Optics 054015-
Downloaded from SPIE Digital Library on 28 Dec 2009 to 1
average A-scan profiles after 6 h of vascular circulation withdifferent gold nanoshells concentration are shown in Fig. 5.
The OCT images in Fig. 5�a� show a gradual increase inthe signal intensity, especially at the top 300-µm region, as theconcentration of gold nanoshells injected increases. The sig-nal attenuation with depth also becomes more pronouncedwith increasing concentration. These changes are similarlyobserved in the corresponding average A-scan profiles �Fig.5�b��, where the negative slope of the depth-dependent A-scancurve increases, together with an increase in the OCT signalintensity at the more superficial region. The correspondinghistological tissue sections acquired at the site of imaging andstained with eosin alone �Fig. 5�c�� show an increasingamount of gold nanoshells in the tumor tissue as more goldnanoshells are administered. Here, the gold nanoshells local-ize in the tumor tissue during the period of vascular circula-tion to form small random dark specks that are scattered overthe eosin-stained tissue. These dark specks are possibly due tothe presence of a collective population of the gold nanoshellsin the tissue environment. The confocal reflectance images ofthe tissue sections �Fig. 5�d�� acquired at the same site as thehistology also show the pseudocolored red reflectance arisingfrom the gold nanoshells scattered with the increasing amountin tissue.
The extracted �s of gold nanoshell-laden tumor as deter-mined from the theoretical curve fit of the average A-scanprofile for different gold nanoshells concentrations, i.e.,�s,GNS in tumor, is indicated in Fig. 5�b� and summarized inTable 1. The postsubtraction �s,GNS contributed by goldnanoshells alone in tumor shows that the scattering coefficientattributed to gold nanoshells and its estimated tumor concen-tration exhibit a positive correlation with the injected concen-tration, although the relationship does not scale linearly withthe amount of gold nanoshells injected as shown in Fig. 6.However, when the estimated gold nanoshell concentration inthe tumor is expressed as a fraction of the injected concentra-tion, we observe that this fractional concentration actually de-creases with increasing injected concentration. Likewise, thisnegative correlation does not scale linearly to the injectedconcentration. As the injected concentration increases eight-fold from 1.1�1010 to 9.0�1010 particles /ml, the fractionalconcentration of injected gold nanoshells that localizes in thetumor merely decreases about four-fold from 24.0 to 6.9%.
3.5 Antibody Surface Functionalization of GoldNanoshells
The fractional concentration of injected gold nanoshells deliv-ered to the tumor can be increased with appropriate surfacefunctionalization on the gold nanoshells in the form of anti-body conjugation. This introduces additional interaction be-tween the gold nanoshells and the cells, thereby altering thedynamics of gold nanoshells reaching the tumor and hencefacilitating the control of optical contrast of tumors. The anti-EGFR conjugated gold nanoshells were injected into the cir-culation of mice at a concentration of 9.0�1010 particles /ml and allowed to circulate in the blood be-fore OCT images of tumor were acquired after 2 and 6 h ofcirculation. The pegylated gold nanoshells without antibodyfunctionalization were also injected with the same dosage inseparate mice, and monitored as a control for comparison.
September/October 2009 � Vol. 14�5�7
37.132.123.69. Terms of Use: http://spiedl.org/terms

antg2tnmtgp2oogam
Fiifio
Kah et al.: Control of optical contrast using gold nanoshells for OCT imaging…
J
The OCT images in Fig. 7�a� show that the signal intensityt both 2 and 6 h for tumor loaded with anti-EGFR goldanoshells is generally higher, especially in regions nearer tohe tissue surface compared to tumor loaded with pegylatedold nanoshells, with the difference being more obvious at-h time point. In addition, the change in optical contrast ofumor from 2 to 6 h is observable for both types of goldanoshells, although the longitudinal signal change seemsore apparent for the pegylated gold nanoshells compared to
he anti-EGFR conjugated gold nanoshells. In the case of pe-ylated gold nanoshells, the increase in optical contrast com-ared to tumor without gold nanoshells is hardly observable ath, and would require another 4 h of circulation before the
ptical effect brought about by the gold nanoshells could bebserved clearly. This is unlike the case of anti-EGFR conju-ated gold nanoshells, where the increase in optical contrast islready observable after 2 h and it continues to increase, albeitore slowly, during the next 4 h.
ig. 5 Changes in the �a� OCT image, �b� average A-scan profile, �c�mage of mouse tumor tissue after 6 h of vascular circulation for a rnjected intravenously. In the average A-scan profile in �b�, the measut of the data is shown by the solid line superimposed with the extractbjective. The confocal reflectance microscopy was performed under
ournal of Biomedical Optics 054015-
Downloaded from SPIE Digital Library on 28 Dec 2009 to 1
The average A-scan corresponding to the OCT images inFig. 7�b� shows the nonlinear least square fit of the theoreticalcurve over the tumor data and the extracted �s,GNS in tumor forall four instances in Fig. 7. From the postsubtraction �s,GNS,the gold nanoshell concentration in tumor is derived as shownin Table 2. The results show that the concentration of pegy-lated gold nanoshells is estimated to increase from 2.6�108 particles /ml at 2 h to 6.2�109 particles /ml at 6 h.This represents a 24-fold increase in the fractional concentra-tion from 0.29 to 6.9% of the injected gold nanoshell concen-tration. In comparison, the estimated concentration of anti-EGFR conjugated gold nanoshells in tumor is higher at bothtime points and it increases from 4.9�109 particles /ml at 2h to 7.4�109 particles /ml at 6 h. Despite having a higherconcentration of gold nanoshells in tumor at both time points,the fractional concentration of injected anti-EGFR conjugatedgold nanoshells that localizes in the tumor over the 4 h inter-
gical tissue section with eosin staining, and �d� confocal reflectancef gold nanoshell concentration �1.1�1010 to 9.0�1010 particles/ml�T signal is shown by the dotted line, while the nonlinear least squareoth the histological and confocal images were acquired under a 20�
m excitation.
histoloange ored OCed �s. B633-n
September/October 2009 � Vol. 14�5�8
37.132.123.69. Terms of Use: http://spiedl.org/terms

v6
4Telspsd�cdtA
iTA
Fncpc
Kah et al.: Control of optical contrast using gold nanoshells for OCT imaging…
J
al increases by a smaller amount from 5.5% at 2 h to 8.2% ath of circulation.
Discussionhe optical characterization of OCT has been studied by sev-ral groups, and a few theoretical models have been estab-ished to relate the sample optical parameters to their corre-ponding A-scan profile52,54,55 with the aim to extract out thearameters for diagnostic purposes such as diabetic glucoseensing.56 Previous studies have shown that the negative gra-ient of the average A-scan profile is a function of �t.
57,58 As
t increases, the slope of the average A-scan profile also in-reases. Since biological tissues are known to be scatteringominant with negligible absorption, i.e., �a�0, the ex-racted �t��s of tissue. Therefore, the slope of the average-scan profile determines the �s of the tissue being examined.
In the extraction of �s from the average A-scan profile, themportance of tissue homogeneity should not be understated.his is because the theoretical OCT model used to fit the-scan profile was developed based on an optically homog-
Table 1 Summary of extracted �s,GNS in tumor otheoretical curve fit of average A-scan profile, astumor for different concentration of gold nanoshe�s of 1.65 mm−1 is subtracted from �s,GNS in tumo
Concentration ofgold nanoshells
injected�particles/ml�
Extracted�s,GNS in tumor �mm−1�
Post�s,G
1.1�1010 2.07 ± 0.30
2.3�1010 2.21 ± 0.31
4.5�1010 2.51 ± 0.25
9.5�1010 2.62 ± 0.34
ig. 6 Nonlinear relationship between the concentration of goldanoshells localized in tumor and the injected gold nanoshell con-entration �-�-�. The tumor concentration of gold nanoshells ex-ressed as a fractional concentration of the injected gold nanoshelloncentration �-�-� is also plotted.
ournal of Biomedical Optics 054015-
Downloaded from SPIE Digital Library on 28 Dec 2009 to 1
enous sample whose entire A-scan profile can be fitted by asingle equation. Heterogeneous samples with multiple layersor regions of different �s would require multiple equations tofit different layers individually, thus rendering the single equa-tion inappropriate. For this reason, the average A-scan profileof normal skin with multiple stromal layers of different �s
was not fitted to extract its mean �s. The tumor tissue, on theother hand, is often assumed to possess homogenous opticalproperties.59 Therefore, we were able to extract the �s of tu-mor tissue with a good degree of fit �coefficient of determi-nation, r2=0.94�. In fact, the rest of the average A-scans inour small animal imaging were also well fitted with r2
�0.97 to provide an accurate extraction of �s.The subtraction of �s,GNS in tumor to obtain �s,GNS allows
the concentration of gold nanoshells in tumor tissue to beestimated as described earlier. Here, we would like to com-ment that the mathematically derived �s,GNS assumes that theoptical absorption in gold nanoshells is small, such that the�t,GNS approximates its �s,GNS, as in the case of biologicaltissue. This is true given that the gold nanoshells of this sizeconfiguration are predominantly scattering as determinedfrom the Mie theory �results not shown�. Futhermore, in thesubtraction of �s,GNS in tumor to obtain �s,GNS, the scatteringcoefficient of tumor �s,tumor of 1.65 mm−1 �Fig. 4� is used inall the analysis throughout this study. This value concurs withthose reported in the literature60,61 and is used, albeit with thecaution that small variations in the scattering coefficients oftumor tissue do exist, which may affect the computation of thegold nanoshell concentration.
In calculating the concentration of gold nanoshells in tis-sue, we also assume that the gold nanoshells are monodis-perse in size such that their geometric cross section and scat-tering efficiency is a constant in tissue. In reality, smallvariations in the size of the synthesized gold nanoshells doexist, and a small population of the gold nanoshells may beaggregated to varying degrees in tissue to result in changes totheir optical properties. Such aggregation occurs despite priorsuccessful pegylation in vitro62 and could possibly be attrib-uted to the inherent instability of the pegylation in the tissueinterstitial environment arising from the weak gold-monothiolinteraction between the gold surface and mPEG-thiol tether.
nanoshell laden tumor as determined from thes the estimated gold nanoshell concentration incted intravenously. In all cases, the tumor tissueain the �s,GNS due to gold nanoshells alone.
tion−1�
Estimated goldnanoshell
concentration intumor �particles/ml�
Fractionalconcentration of
injected goldnanoshells that
localize in tumor
2.7�109 24.0%
3.6�109 16.0%
5.5�109 12.3%
6.2�109 6.9%
f goldwell alls inje
r to obt
subtracNS �mm
0.42
0.56
0.86
0.97
September/October 2009 � Vol. 14�5�9
37.132.123.69. Terms of Use: http://spiedl.org/terms

Fnordv�ltcc
tt
FnEihtbst
Kah et al.: Control of optical contrast using gold nanoshells for OCT imaging…
J
urthermore, the linear relationship between �s,GNS and goldanoshell concentration is limited. As previous studies withther particle scatterers such as Intralipid have shown, theelationship turns nonlinear at high particle concentrationsue to interparticle shadowing effects.63 Nonetheless, our pre-ious studies on phantom models have shown that the derived
s,GNS appear to deviate only slightly from the theoreticalinearity at very high concentrations.50 This linear region ishus sufficiently wide to allow an accurate gold nanoshelloncentration to be determined over a wide range, which in-ludes that used in this study.
Keeping in mind the various limitations discussed before,he deduced gold nanoshell concentration from the �s,GNS isherefore only an approximation that is subjected to the vari-
ig. 7 Comparison of the OCT signal in tumor tissue between usingonfunctionalized pegylated gold nanoshells �left column� and anti-GFR conjugated gold nanoshells �right column� showing the changesn �a� OCT images and �b� average A-scan profile after 2 h �top� and 6
�bottom� of gold nanoshells �9.0�1010 particles/ml� IV delivery. Inhe average A-scan profile in �b�, the measured OCT signal is showny the dotted line, while the nonlinear least square fit of the data ishown by the solid line superimposed with the extracted �s shown inhe figure.
ournal of Biomedical Optics 054015-1
Downloaded from SPIE Digital Library on 28 Dec 2009 to 1
ous physical properties of gold nanoshells, e.g., size varia-tions, state of aggregation, and their concentration in tissue asdiscussed. Further evaluation of the accuracy of this noninva-sive approach in determining the gold nanoshell concentrationin tissue would warrant a separate study that would allowcomparison with another independent invasive technique suchas inductively coupled plasma mass spectroscopy �ICPMS�.Nonetheless, such a noninvasive approach in determining thegold nanoshells concentration in tissue holds possible appli-cations in biodistribution studies, and could potentially allowrapid concentration mapping of gold nanoshells in tissue forquantitative molecular imaging of certain crucial biomarkersassociated with cancer, particularly in cases where the vitalityof the animal subject is crucial.
In this study, we observe that different concentrations ofgold nanoshells in tumor tissue would produce different out-comes on the OCT contrast enhancement, as depicted by thetwo delivery modes. Both of the delivery modes, i.e., intratu-moral and IV, are commonly used to deliver therapeutic com-pounds to the target site of interest, which is the tumor in thiscase. In intratumoral delivery, the bolus injection of a 9.0�1010 particles /ml dosage of gold nanoshells directly intothe tumor causes a high concentration ��8.5�1010 particles /ml� to localize there, which works out to94.4% of the injected gold nanoshell concentration.
With a large concentration of gold nanoshells, the incidentlight from OCT that enters the tumor experiences higher lev-els of scattering near the surface due to the presence of goldnanoshell scatterers. The higher concentration of particle scat-terers also causes a larger amount of single backscattered lightthat collectively contributes to the overall backscattered lightfrom tissue. These account for the strong OCT signal en-hancement near the tissue surface as observed in our results.With a large fraction of incident light backscattered out of thetissue, the amount of light that reaches deeper into the tissueis reduced, giving rise to a significant signal attenuation withdepth.
On the other hand, the delivery of the same dose by IVresults in a much lower concentration of gold nanoshells ��6.2�109 particles /ml� in the tumor site via the enhancedpermeation and retention �EPR� effect. This estimated con-centration is only about 6.9% of the injected gold nanoshellconcentration. The reason for a much lower tumor concentra-tion of gold nanoshells with IV delivery is because a signifi-cant amount of injected gold nanoshells is either lost from thebloodstream during circulation due to renal excretion, or re-moved by the reticulo-endothelial system �RES�. Despite theirpegylation, the removal of gold nanoshells by RES is inevi-table, although pegylation does help to minimize the RESuptake.62 The instability of the gold-monothiol interaction be-tween the gold surface and mPEG-thiol tether as mentionedearlier may have also contributed toward the RES uptake afterprolonged circulation in the biological environment.
With a smaller concentration of gold nanoshells, the inci-dent light from the OCT that enters the tumor experiences alonger mean free path, thus allowing a larger fraction of inci-dent light to reach deeper into the tissue and reduce the signalattenuation with depth. Consequently, the amount of singlebackscattered light from regions near the tissue surface is re-duced, thus giving a weaker signal enhancement. Throughout
September/October 2009 � Vol. 14�5�0
37.132.123.69. Terms of Use: http://spiedl.org/terms

taiasctsoi
ptstttapgtaysntt
fupctAiiofma
Kah et al.: Control of optical contrast using gold nanoshells for OCT imaging…
J
he study, it is noteworthy that the injected gold nanoshellslso seem to cause an observable change to the OCT signalntensity of the surrounding normal tissue. This is unavoid-ble, given the poor specificity of passive targeting. However,uch an increase in the OCT signal intensity in normal tissueannot be easily and meaningfully quantified and compared tohe increase in tumor, as it would require a separate detailedtudy on the tumor-to-normal ratio, which is beyond the scopef this study that only aims to characterize the OCT signalncrease in tumor tissue.
The observable changes in OCT image and average A-scanrofile for increasing concentration of gold nanoshells in theumor agree well with the results of our previous phantomtudies.50 The effect of an increasing gold nanoshell concen-ration on the OCT signal holds an important implication tohe dosing of these nanoparticulate contrast agent to controlhe OCT image contrast enhancement in living systems, as anppropriate dosing regime is crucial in achieving a good com-romise between OCT signal enhancement at the surface re-ion and minimal signal attenuation deeper in the tissue. Ashe gold nanoshell dosage increases, the data seem to suggest
limiting concentration of gold nanoshells in the tumor be-ond the 6-h time point. Thus, higher dosing may not neces-arily be more effective in delivering a larger amount of goldanoshells to the tumor site, since a smaller fractional concen-ration of injected gold nanoshells actually localizes in theumor.
Our results have also shown that the use of antibody sur-ace functionalization is one strategy that can improve theptake of gold nanoshells in tumor. In this study, the overex-ression of EGFR on the surface of tumor forming cancerells is used as a cancer marker, and the anti-EGFR is supposeo guide the gold nanoshells to the EGFR tumor marker. The-431 cells that were inoculated to form the xenograft tumor
n mice are widely known to have an expression of EGFR thats several times higher than normal cells. This high expressionf EGFR, together with a relatively porous tumor vasculature,acilitates receptor-ligand interaction that would encourageore gold nanoshells to localize in the tumor. However, it is
lso very likely that the presence of the antibody protein in-
Table 2 Summary of extracted �s,GNS in tumor otheoretical curve fit of average A-scan profile, �tumor tissue, i.e. 1.65 mm−1, and estimated golvascular circulation with nonspecific pegylated a
Type ofgold
nanoshellsinjected
Blood circulationperiod
Extracted�s,GNS in tumor
�mm−1�
Pegylatedgold
nanoshells
2 h 1.69 ± 0.27
6 h 2.62 ± 0.34
Anti-EGFR
conjugatedgold
nanoshells
2 h 2.42 ± 0.23
6 h 2.80 ± 0.25
ournal of Biomedical Optics 054015-1
Downloaded from SPIE Digital Library on 28 Dec 2009 to 1
creases the nonspecific adhesion of the gold nanoshells to thetissue, thus causing an increase in tumor uptake. Therefore, itwould be hard to verify that the mechanism for this increasedtumor uptake is due to antibody-specific targeting basedsolely on the results of this study, where the previously men-tioned nonspecific uptake has not been investigated.
In any case, both the nonfunctionalized pegylated goldnanoshells and the antibody conjugated gold nanoshells relyon vascular porosity to confer a moderate level of tumorspecificity, while the antibody conjugated gold nanoshells of-fer additional cellular interaction to enable greater goldnanoshell uptake in tumor. This by itself would be sufficientto explain the increase in absolute as well as fractional con-centration of injected gold nanoshells that localize in the tu-mor at both time points compared to pegylated goldnanoshells.
Apart from a greater concentration of gold nanoshells intumor, antibody surface functionalization also tends to accel-erate the rate of gold nanoshells reaching the tumor, whichexplains the significant difference in the OCT image bright-ness between that of nonfunctionalized pegylated goldnanoshells and antibody conjugated gold nanoshells at 2 h.This arises because the EPR effect is a slow biological pro-cess of transporting gold nanoshells out of the vasculatureinto the tumor. This slow transport coupled with a weak in-teraction with the tumor tissue, which tend to discourage itsaccumulation there, would therefore require a longer period ofvascular circulation, i.e., 6 h before a sufficient amount ofpegylated gold nanoshells are localized to cause an observablechange in the OCT image. The antibody conjugated goldnanoshells eliminate this problem by having a stronger inter-action with the tumor tissue to allow more gold nanoshells tolocalize and accumulate in tumor within a shorter time of 2 h.
However, given more time for the pegylated goldnanoshells to passively localize in the tumor, the difference inthe OCT image at 6 h is reduced. This occurs as the pegylatedgold nanoshells accumulate continuously in the tumor, whilethe rate of anti-EGFR conjugated gold nanoshell delivery totumor reduces, as more of them accumulate in the tumor after6 h and the diffusion transport gradient is reduced. For the
nanoshell laden tumor as determined from thef gold nanoshells in tumor postsubtracting �s ofshell concentration in tumor after 2 and 6 h ofi-EGFR conjugated gold nanoshells.
btractionS �mm−1�
Estimated goldnanoshell
concentration intumor
�particles/ml�
Fractionalconcentration of
injected goldnanoshells that
localize in tumor
.04 2.6�108 0.29%
.97 6.2�109 6.9%
.77 4.9�109 5.5%
.15 7.4�109 8.2%
f golds,GNS od nanond ant
Postsu�s,GN
0
0
0
1
September/October 2009 � Vol. 14�5�1
37.132.123.69. Terms of Use: http://spiedl.org/terms

sepghcpiti
5Wmteajtrawsobngianusjoetdt
ATa
R
Kah et al.: Control of optical contrast using gold nanoshells for OCT imaging…
J
ame reason, the longitudinal change in OCT image and av-rage A-scan profile between 2 and 6 h is more apparent foregylated gold nanoshells compared to anti-EGFR conjugatedold nanoshells, since the former require a longer period of 6before they localize sufficiently to produce an observable
ontrast, while the latter localize sufficiently fast within 2 h toroduce the same observable contrast. Such delivery dynam-cs hold considerable implications toward developing a con-rasting regime where time is crucial to the subject being stud-ed.
Conclusione demonstrate the in vivo control of optical contrast in aouse xenograft tumor model using gold nanoshells as a con-
rast agent in OCT. This is achieved via three approaches: 1.mploying different modes of gold nanoshells delivery suchs intratumoral or IV, 2. varying the concentration of the in-ected dose, and 3. enabling antibody surface functionaliza-ion on gold nanoshells. With appropriate dosing, IV deliveryesults in a gold nanoshell concentration in tumor thatchieves a good compromise in enhancing the OCT signalithout significantly attenuating the signal deeper into the tis-
ue. The concentration of gold nanoshells in the tumor tissuef live mice can be deduced using a noninvasive techniqueased on the theoretical modeling of OCT backscattering sig-al profile. We use this technique to examine the dynamics ofold nanoshells present in tumor with variations inntravenous-injected dosage and presence of surface function-lization. The results reveal a nonlinear response of goldanoshell concentration in tumor with increasing dosage. These of antibody functionalization on the gold nanoshellserves not just to improve this fractional concentration of in-ected gold nanoshells in tumor, but also hasten the deliveryf nonfunctionalized pegylated gold nanoshells. Such insightsnable us to understand better the dynamics of gold nanoshellumor delivery and thereby hold several implications towardeveloping an optimized contrast protocol to add further valueo the clinical significance of OCT.
cknowledgmentshis work is supported by a grant from the Singapore Bioim-ging Consortium, A*STAR.
eferences1. D. Huang, E. A. Swanson, C. P. Lin, J. S. Schuman, W. G. Stinson,
W. Chang, M. R. Hee, T. Flotte, K. Gregory, C. A. Puliafito et al.,“Optical coherence tomography,” Science 254 �5035�, 1178–1181�1991�.
2. R. Weissleder, “A clearer vision for in vivo imaging,” Nat. Biotech-nol. 19�4�, 316–317 �2001�.
3. J. G. Fujimoto, M. E. Brezinski, G. J. Tearney, S. A. Boppart, B.Bouma, M. R. Hee, J. F. Southern, and E. A. Swanson, “Opticalbiopsy and imaging using optical coherence tomography,” Nat. Med.1 970–972 �1995�.
4. M. R. Hee, J. A. Izatt, E. A. Swanson, D. Huang, J. S. Schuman, C.P. Lin, C. A. Puliafito, and J. G. Fujimoto, “Optical coherence tomog-raphy of the human retina,” Arch. Ophthalmol. (Chicago) 113�3�,325–332 �1995�.
5. I. Cilesiz, P. Fockens, R. Kerindongo, D. Faber, G. Tytgat, F. TenKate, and T. Van Leeuwen, “Comparative optical coherence tomog-raphy imaging of human esophagus: how accurate is localization ofthe muscularis mucosae?” Gastrointest. Endosc. 56�6�, 852–857�2002�.
ournal of Biomedical Optics 054015-1
Downloaded from SPIE Digital Library on 28 Dec 2009 to 1
6. X. D. Li, S. A. Boppart, J. Van Dam, H. Mashimo, M. Mutinga, W.Drexler, M. Klein, C. Pitris, M. L. Krinsky, M. E. Brezinski, and J.G. Fujimoto, “Optical coherence tomography: advanced technologyfor the endoscopic imaging of Barrett’s esophagus,” Endoscopy32�12�, 921–930 �2000�.
7. G. J. Tearney, M. E. Brezinski, J. F. Southern, B. E. Bouma, S. A.Boppart, and J. G. Fujimoto, “Optical biopsy in human gastrointesti-nal tissue using optical coherence tomography,” Am. J. Gastroen-terol. 92�10�, 1800–1804 �1997�.
8. K. Kobayashi, J. A. Izatt, M. D. Kulkarni, J. Willis, and M. V. Sivak,Jr., “High-resolution cross-sectional imaging of the gastrointestinaltract using optical coherence tomography: preliminary results,” Gas-trointest. Endosc. 47�6�, 515–523 �1998�.
9. A. Sergeev, V. Gelikonov, G. Gelikonov, F. Feldchtein, R. Kuranov,N. Gladkova, N. Shakhova, L. Snopova, A. Shakhov, I. Kuznetzova,A. Denisenko, V. Pochinko, Y. Chumakov, and O. Streltzova, “Invivo endoscopic OCT imaging of precancer and cancer states of hu-man mucosa,” Opt. Express 1�13�, 432–440 �1997�.
10. M. E. Brezinski, G. J. Tearney, B. E. Bouma, J. A. Izatt, M. R. Hee,E. A. Swanson, J. F. Southern, and J. G. Fujimoto, “Optical coher-ence tomography for optical biopsy. Properties and demonstration ofvascular pathology,” Circulation 93�6�, 1206–1213 �1996�.
11. F. J. van der Meer, D. J. Faber, J. Perree, G. Pasterkamp, D. BaraznjiSassoon, and T. G. van Leeuwen, “Quantitative optical coherencetomography of arterial wall components,” Lasers Med. Sci. 20�1�,45–51 �2005�.
12. J. G. Fujimoto, C. Pitris, S. A. Boppart, and M. E. Brezinski, “Opticalcoherence tomography: an emerging technology for biomedical im-aging and optical biopsy,” Neoplasia 2�1–2�, 9–25 �2000�.
13. S. A. Boppart, B. E. Bouma, C. Pitris, J. F. Southern, M. E. Brezinski,and J. G. Fujimoto, “In vivo cellular optical coherence tomographyimaging,” Nat. Med. 4�7�, 861–865 �1998�.
14. E. S. Matheny, N. M. Hanna, W. G. Jung, Z. Chen, P. Wilder-Smith,R. Mina-Araghi, and M. Brenner, “Optical coherence tomography ofmalignancy in hamster cheek pouches,” J. Biomed. Opt. 9�5�, 978–981 �2004�.
15. A. V. D’Amico, M. Weinstein, X. Li, J. P. Richie, and J. Fujimoto,“Optical coherence tomography as a method for identifying benignand malignant microscopic structures in the prostate gland,” Urology55�5�, 783–787 �2000�.
16. G. J. Tearney, M. E. Brezinski, B. E. Bouma, S. A. Boppart, C. Pitris,J. F. Southern, and J. G. Fujimoto, “In vivo endoscopic optical biopsywith optical coherence tomography,” Science 276 �5321�, 2037–2039�1997�.
17. J. K. Barton, K. W. Gossage, W. Xu, J. R. Ranger-Moore, K. Saboda,C. A. Brooks, L. D. Duckett, S. J. Salasche, J. A. Warneke, and D. S.Alberts, “Investigating sun-damaged skin and actinic keratosis withoptical coherence tomography: a pilot study,” Technol. Cancer Res.Treat. 2�6�, 525–535 �2003�.
18. A. R. Tumlinson, L. P. Hariri, U. Utzinger, and J. K. Barton, “Min-iature endoscope for simultaneous optical coherence tomography andlaser-induced fluorescence measurement,” Appl. Opt. 43�1�, 113–121�2004�.
19. S. Jackle, N. Gladkova, F. Feldchtein, A. Terentieva, B. Brand, G.Gelikonov, V. Gelikonov, A. Sergeev, A. Fritscher-Ravens, J. Freund,U. Seitz, S. Soehendra, and N. Schrodern, “In vivo endoscopic opticalcoherence tomography of the human gastrointestinal tract—towardoptical biopsy,” Endoscopy 32�10�, 743–749 �2000�.
20. T. M. Yelbuz, M. A. Choma, L. Thrane, M. L. Kirby, and J. A. Izatt,“Optical coherence tomography: a new high-resolution imaging tech-nology to study cardiac development in chick embryos,” Circulation106�22�, 2771–2774 �2002�.
21. A. N. Bashkatov, E. A. Genina, Y. P. Sinichkin, and V. V. Tuchin,“The influence of glycerol on the transport of light in the skin,” Proc.SPIE 4623, 144–152 �2002�..
22. R. K. Wang and J. B. Elder, “Propylene glycol as a contrasting agentfor optical coherence tomography to image gastrointestinal tissues,”Lasers Surg. Med. 30�3�, 201–208 �2002�.
23. C. Christiansen, H. Kryvi, P. C. Sontum, and T. Skotland, “Physicaland biochemical characterization of Albunex, a new ultrasound con-trast agent consisting of air-filled albumin microspheres suspended ina solution of human albumin,” Biotechnol. Appl. Biochem. 19 �Pt 3�307–320 �1994�.
24. J. K. Barton, J. B. Hoying, and C. J. Sullivan, “Use of microbubblesas an optical coherence tomography contrast agent,” Acad. Radiol. 9
September/October 2009 � Vol. 14�5�2
37.132.123.69. Terms of Use: http://spiedl.org/terms

2
2
2
2
2
3
3
3
3
3
3
3
3
3
3
4
4
4
4
4
Kah et al.: Control of optical contrast using gold nanoshells for OCT imaging…
J
�Suppl 1� S52–S55 �2002�.5. T. M. Lee, A. L. Oldenburg, S. Sitafalwalla, D. L. Marks, W. Luo, F.
J. Toublan, K. S. Suslick, and S. A. Boppart, “Engineered micro-sphere contrast agents for optical coherence tomography,” Opt. Lett.28�17�, 1546–1548 �2003�.
6. A. M. Gobin, M. H. Lee, N. J. Halas, W. D. James, R. A. Drezek, andJ. L. West, “Near-infrared resonant nanoshells for combined opticalimaging and photothermal cancer therapy,” Nano Lett. 7�7�, 1929–1934 �2007�.
7. C. Loo, A. Lowery, N. Halas, J. West, and R. Drezek, “Immunotar-geted nanoshells for integrated cancer imaging and therapy,” NanoLett. 5�4�, 709–711 �2005�.
8. C. Loo, L. Hirsch, M. H. Lee, E. Chang, J. West, N. Halas, and R.Drezek, “Gold nanoshell bioconjugates for molecular imaging in liv-ing cells,” Opt. Lett. 30�9�, 1012–1014 �2005�.
9. C. Loo, A. Lin, L. Hirsch, M. H. Lee, J. Barton, N. Halas, J. West,and R. Drezek, “Nanoshell-enabled photonics-based imaging andtherapy of cancer,” Technol. Cancer Res. Treat. 3�1�, 33–40 �2004�.
0. A. L. Oldenburg, M. N. Hansen, D. A. Zweifel, A. Wei, and S. A.Boppart, “Plasmon-resonant gold nanorods as low backscattering al-bedo contrast agents for optical coherence tomography,” Opt. Ex-press 14�15�, 6724–6738 �2006�.
1. S. J. Oldenburg, J. B. Jackson, S. L. Westcott, and N. J. Halas, “In-frared extinction properties of gold nanoshells,” Appl. Phys. Lett.75�19�, 2897–2899 �1999�.
2. K. J. Liu, M. W. Grinstaff, J. Jiang, K. S. Suslick, H. M. Swartz, andW. Wang, “In vivo measurement of oxygen concentration usingsonochemically synthesized microspheres,” Biophys. J. 67�2�, 896–901 �1994�.
3. D. P. O’Neal, L. R. Hirsch, N. J. Halas, J. D. Payne, and J. L. West,“Photo-thermal tumor ablation in mice using near infrared-absorbingnanoparticles,” Cancer Lett. 209�2�, 171–176 �2004�.
4. Y. Matsumura and H. Maeda, “A new concept for macromoleculartherapeutics in cancer chemotherapy: mechanism of tumoritropic ac-cumulation of proteins and the antitumor agent smancs,” Cancer Res.46 �12 Pt 1�, 6387–6392 �1986�..
5. H. Maeda, J. Fang, T. Inutsuka, and Y. Kitamoto, “Vascular perme-ability enhancement in solid tumor: various factors, mechanisms in-volved and its implications,” Int. J. Immunopharmacol 3�3�, 319–328�2003�.
6. W. D. James, L. R. Hirsch, J. L. West, P. D. O’Neal, and J. D. Payne,“Application of INAA to the build-up and clearance of goldnanoshells in clinical studies in mice,” J. Radioanal. Nucl. Chem. 271455–459 �2007�.
7. J. Chen, F. Saeki, B. J. Wiley, H. Cang, M. J. Cobb, Z. Y. Li, L. Au,H. Zhang, M. B. Kimmey, X. Li, and Y. Xia, “Gold nanocages:bioconjugation and their potential use as optical imaging contrastagents,” Nano Lett. 5�3�, 473–477 �2005�.
8. X. Huang, I. H. El-Sayed, W. Qian and M. A. El-Sayed, “Cancer cellimaging and photothermal therapy in the near-infrared region by us-ing gold nanorods,” J. Am. Chem. Soc. 128�6�, 2115–2120 �2006�.
9. R. Goel, N. Shah, R. Visaria, G. F. Paciotti, and J. C. Bischof, “Bio-distribution of TNF-alpha-coated gold nanoparticles in an in vivomodel system,” Nanomedicine 4�4�, 401–410 �2009�.
0. M. P. Melancon, W. Lu, Z. Yang, R. Zhang, Z. Cheng, A. M. Elliot,J. Stafford, T. Olson, J. Z. Zhang, and C. Li, “In vitro and in vivotargeting of hollow gold nanoshells directed at epidermal growth fac-tor receptor for photothermal ablation therapy,” Mol. Cancer Ther.7�6�, 1730–1739 �2008�.
1. G. F. Paciotti, L. Myer, D. Weinreich, D. Goia, N. Pavel, R. E.McLaughlin, and L. Tamarkin, “Colloidal gold: a novel nanoparticlevector for tumor directed drug delivery,” Cancer Drug Deliv 11�3�,169–183 �2004�.
2. G. Zhang, Z. Yang, W. Lu, R. Zhang, Q. Huang, M. Tian, L. Li, D.Liang, and C. Li, “Influence of anchoring ligands and particle size onthe colloidal stability and in vivo biodistribution of polyethyleneglycol-coated gold nanoparticles in tumor-xenografted mice,” Bioma-terials 30�10�, 1928–1936 �2009�.
3. J. C. Kah, R. C. Wan, K. Y. Wong, S. Mhaisalkar, C. J. Sheppard, andM. Olivo, “Combinatorial treatment of photothermal therapy usinggold nanoshells with conventional photodynamic therapy to improvetreatment efficacy: an in vitro study,” Lasers Surg. Med. 40�8�, 584–589 �2008�.
4. J. C. Kah, K. W. Kho, C. G. Lee, C. James, R. Sheppard, Z. X. Shen,K. C. Soo, and M. C. Olivo, “Early diagnosis of oral cancer based on
ournal of Biomedical Optics 054015-1
Downloaded from SPIE Digital Library on 28 Dec 2009 to 1
the surface plasmon resonance of gold nanoparticles,” Int. J. Na-nomed. 2�4�, 785–798 �2007�.
45. J. C. Kah, M. C. Olivo, C. G. Lee, and C. J. Sheppard, “Molecularcontrast of EGFR expression using gold nanoparticles as areflectance-based imaging probe,” Mol. Cell. Probes 22�1�, 14–23�2008�.
46. W. Yasui, H. Sumiyoshi, J. Hata, T. Kameda, A. Ochiai, H. Ito, and E.Tahara, “Expression of epidermal growth factor receptor in humangastric and colonic carcinomas,” Cancer Res. 48�1�, 137–141 �1988�.
47. S. Costa, H. Stamm, A. Almendral, H. Ludwig, R. Wyss, D. Fabbro,A. Ernst, A. Takahashi, and U. Eppenberger, “Predictive value ofEGF receptor in breast cancer,” Lancet 2 �8622�, 1258 �1988�.
48. K. K. Ang, B. A. Berkey, X. Tu, H. Z. Zhang, R. Katz, E. H. Ham-mond, K. K. Fu, and L. Milas, “Impact of epidermal growth factorreceptor expression on survival and pattern of relapse in patients withadvanced head and neck carcinoma,” Cancer Res. 62�24�, 7350–7356�2002�.
49. J. C. Y. Kah, N. Phonthammachai, R. C. Y. Wan, J. Song, T. White, I.Ahmad, C. Sheppard, and M. Olivo, “Synthesis of gold nanoshellsbased on the deposition-precipitation process,” Gold Bull. 41�1�,23–36 �2008�.
50. J. C. Kah, T. H. Chow, B. K. Ng, S. G. Razul, M. Olivo, and C. J.Sheppard, “Concentration dependence of gold nanoshells on the en-hancement of optical coherence tomography images: a quantitativestudy,” Appl. Opt. 48�10�, D96–D108 �2009�.
51. C. F. Bohren and D. R. Huffman, Absorption and Scattering of Lightby Small Particles, Wiley-Interscience, New York �1998�.
52. L. Thrane, H. T. Yura, and P. E. Andersen, “Analysis of optical co-herence tomography systems based on the extended Huygens-Fresnelprinciple,” J. Opt. Soc. Am. A Opt. Image Sci. Vis 17�3�, 484–490�2000�.
53. A. W. Lin, N. A. Lewinski, J. L. West, N. J. Halas, and R. A. Drezek,“Optically tunable nanoparticle contrast agents for early cancer de-tection: model-based analysis of gold nanoshells,” J. Biomed. Opt.10�6�, 064035 �2005�.
54. A. I. Kholodnykh, I. Y. Petrova, K. V. Larin, M. Motamedi, and R. O.Esenaliev, “Precision of measurement of tissue optical propertieswith optical coherence tomography,” Appl. Opt. 42�16�, 3027–3037�2003�.
55. T. G. van Leeuwen, D. J. Faber, and M. C. Aalders, “Measurement ofthe axial point spread function in scattering media using single-modefiber-based optical coherence tomography,” IEEE J. Sel. Top. Quan-tum Electron. 9�2�, 227–233 �2003�.
56. R. O. Esenaliev, K. V. Larin, I. V. Larina, and M. Motamedi, “Non-invasive monitoring of glucose concentration with optical coherencetomography,” Opt. Lett. 26�13�, 992–994 �2001�.
57. J. A. Izatt, M. R. Hee, G. M. Owen, E. A. Swanson, and J. G.Fujimoto, “Optical coherence microscopy in scattering media,” Opt.Lett. 19�8�, 590–592 �1994�.
58. D. Faber, F. van der Meer, M. Aalders, and T. van Leeuwen, “Quan-titative measurement of attenuation coefficients of weakly scatteringmedia using optical coherence tomography,” Opt. Express 12�19�,4353–4365 �2004�.
59. R. T. Zaman, P. Diagaradjane, J. C. Wang, J. Schwartz, N. Rajaram,K. L. Gill-Sharp, S. H. Cho, H. G. Rylander, J. D. Payne, S. Krish-nan, and J. W. Tunnell, “In vivo detection of gold nanoshells in tu-mors using diffuse optical spectroscopy,” IEEE J. Sel. Top. QuantumElectron. 13�6�, 1715–1720 �2007�.
60. A. L. Clark, A. Gillenwater, R. Alizadeh-Naderi, A. K. El-Naggar,and R. Richards-Kortum, “Detection and diagnosis of oral neoplasiawith an optical coherence microscope,” J. Biomed. Opt. 9�6�, 1271–1280 �2004�.
61. A. Garofalakis, G. Zacharakis, G. Filippidis, E. Sanidas, D. D. Tsift-sis, E. Stathopoulos, M. Kafousi, J. Ripoll, and T. G. Papazoglou,“Optical characterization of thin female breast biopsies based on thereduced scattering coefficient,” Phys. Med. Biol. 50�11�, 2583–2596�2005�.
62. J. C. Kah, K. Y. Wong, K. G. Neoh, J. H. Song, J. W. Fu, S. Mhais-alkar, M. Olivo, and C. J. Sheppard, “Critical parameters in the pe-gylation of gold nanoshells for biomedical applications: An in vitromacrophage study,” J. Drug Target. 17�3�, 181–193 �2008�
63. H. J. van Staveren, C. J. M. Moes, J. van Marie, S. A. Prahl and M.J. C. van Gemert, “Light scattering in Intralipid-10% in the wave-length range of 400–1100 nm,” Appl. Opt. 30�31�, 4507–4514 �1991�.
September/October 2009 � Vol. 14�5�3
37.132.123.69. Terms of Use: http://spiedl.org/terms
Copyright © 2022 FDOKUMEN