Optical Medieval Music Recognition
198
Optical Medieval Music Recognition vorgelegt von Christoph Wick Würzburg, 2020 Kumulative Dissertation zur Erlangung des naturwissenschaftlichen Doktorgrades der Bayerischen Julius-Maximilians-Universität Würzburg
-
Upload
khangminh22 -
Category
Documents
-
view
2 -
download
0
Transcript of Optical Medieval Music Recognition

Optical Medieval MusicRecognition
vorgelegt von
Christoph Wick
Würzburg, 2020
Kumulative Dissertation zur Erlangung des naturwissenschaftlichen Doktorgrades derBayerischen Julius-Maximilians-Universität Würzburg

AbstractIn recent years, great progress has been made in the area of Artificial Intelligence (AI) due tothe possibilities of Deep Learning which steadily yielded new state-of-the-art results especiallyin many image recognition tasks. Currently, in some areas, human performance is achieved oralready exceeded. This great development already had an impact on the area of Optical MusicRecognition (OMR) as several novel methods relying on Deep Learning succeeded in specific tasks.Musicologists are interested in large-scale musical analysis and in publishing digital transcriptions
in a collection enabling to develop tools for searching and data retrieving. The application of OMRpromises to simplify and thus speed-up the transcription process by either providing fully-automaticor semi-automatic approaches. This thesis focuses on the automatic transcription of Medievalmusic with a focus on square notation which poses a challenging task due to complex layouts, highlyvarying handwritten notations, and degradation. However, since handwritten music notations arequite complex to read, even for an experienced musicologist, it is to be expected that even with newtechniques of OMR manual corrections are required to obtain the transcriptions.This thesis presents several new approaches and open source software solutions for layout analysis
andAutomatic Text Recognition (ATR) for early documents and forOMRofMedievalmanuscriptsproviding state-of-the-art technology. Fully Convolutional Networks (FCNs) are applied for thesegmentation of historical manuscripts and early printed books, to detect staff lines, and to rec-ognize neume notations. The ATR engine Calamari is presented which allows for ATR of earlyprints and also the recognition of lyrics. Configurable CNN/LSTM-network architectures whichare trained with the segmentation-free CTC-loss are applied to the sequential recognition of textbut also monophonic music. Finally, a syllable-to-neume assignment algorithm is presented whichrepresents the final step to obtain a complete transcription of the music.The evaluations show that the performances of any algorithm is highly depending on the material
at hand and the number of training instances. The presented staff line detection correctly identifiesstaff lines and staves with an F1-score of above 99.5%. The symbol recognition yields a diplomaticSymbol Accuracy Rate (dSAR) of above 90% by counting the number of correct predictions inthe symbols sequence normalized by its length. The ATR of lyrics achieved a Character AccuracyRate (CAR) (equivalently the number of correct predictions normalized by the sentence length)of above 93% trained on 771 lyric lines of Medieval manuscripts and of 99.89% when trainingon around 3.5 million lines of contemporary printed fonts. The assignment of syllables and theircorresponding neumes reached F1-scores of up to 99.2%. A direct comparison to previously pub-lished performances is difficult due to different materials and metrics. However, estimations showthat the reported values of this thesis exceed the state-of-the-art in the area of square notation.A further goal of this thesis is to enable musicologists without technical background to apply the
developed algorithms in a complete workflow by providing a user-friendly and comfortable Graph-ical User Interface (GUI) encapsulating the technical details. For this purpose, this thesis presentsthe web-application Optical Medieval Music Recognition For All (OMMR4all). Its fully-functional
i

workflow includes the proposed state-of-the-art machine-learning algorithms and optionally al-lows for a manual intervention at any stage to correct the output preventing error propagation. Tosimplify the manual (post-) correction, OMMR4all provides an overlay-editor that superimposesthe annotations with a scan of the original manuscripts so that errors can easily be spotted. Theworkflow is designed to be iteratively improvable by training better models as soon as new GroundTruth (GT) is available.
ii

AcknowledgementsMany people supported me in the long time it took to write this dissertation. First of all, I wouldlike to thank my supervisor Frank Puppe for his support and feedback, and for always taking timeeven for extensive discussions. I also appreciate the trust he placed in me in research and teaching.I would also like to thank my second assessor Ichiro Fujinaga for his helpfulness and constructivefeedback.Furthermore, I would like to acknowledge Uwe Springmann who opened me the door to the
exciting research area of early printed books. This resulted in the great collaboration with AndreasHaug and Tim Eipert in the research area of Medieval manuscripts. In this subject I was able tocombine and expand my skills in music and computer science.This work would also not have been possible without the pleasant and supportive working atmo-
sphere which is why I would like to thank all of my colleagues. Special thanks go to Christian Reul,who brought my research work forward significantly through constructive criticism and thoroughreviews of my publications, and who always endured me as a roommate.Finally, I would like to thank my family, especially my parents Reinhold and Karola Wick, for
their support and encouragement during the recent years.
Würzburg, February 2020
iii


Contents
Abstract i
Acknowledgements iii
Contents v
List of Abbreviations vii
1 Introduction 11.1 Steps of a Typical OMR Workflow . . . . . . . . . . . . . . . . . . . . . . . . 11.2 Motivation . . . . . . . . . . . . . . . . . . . . . . . . . . . . . . . . . . . . . 31.3 Challenges of Historical Music Document Processing . . . . . . . . . . . . . . . 31.4 Challenges for the Users . . . . . . . . . . . . . . . . . . . . . . . . . . . . . . 61.5 OMMR4all . . . . . . . . . . . . . . . . . . . . . . . . . . . . . . . . . . . . 71.6 Contributions . . . . . . . . . . . . . . . . . . . . . . . . . . . . . . . . . . . 101.7 Nomenclature . . . . . . . . . . . . . . . . . . . . . . . . . . . . . . . . . . . 11
2 Problematic of the Evaluation of an End-To-End Workflow 13
3 Related Work with Regard to the Contributions 173.1 Layout Analysis . . . . . . . . . . . . . . . . . . . . . . . . . . . . . . . . . . 17
3.1.1 Related Work . . . . . . . . . . . . . . . . . . . . . . . . . . . . . . . 183.1.2 Conclusion . . . . . . . . . . . . . . . . . . . . . . . . . . . . . . . . 20
3.2 Staff Line Detection . . . . . . . . . . . . . . . . . . . . . . . . . . . . . . . . 203.2.1 Related Work . . . . . . . . . . . . . . . . . . . . . . . . . . . . . . . 20
3.2.1.1 Staff Line Identification . . . . . . . . . . . . . . . . . . . . 203.2.1.2 Staff Line Removal . . . . . . . . . . . . . . . . . . . . . . . 23
3.2.2 Conclusion . . . . . . . . . . . . . . . . . . . . . . . . . . . . . . . . 253.3 Music Symbol Detection . . . . . . . . . . . . . . . . . . . . . . . . . . . . . 25
3.3.1 Related Work . . . . . . . . . . . . . . . . . . . . . . . . . . . . . . . 263.3.1.1 OMR on Contemporary Notation . . . . . . . . . . . . . . . 283.3.1.2 OMR on Historical Notations . . . . . . . . . . . . . . . . . 29
3.3.2 Conclusion . . . . . . . . . . . . . . . . . . . . . . . . . . . . . . . . 303.3.3 Future Work . . . . . . . . . . . . . . . . . . . . . . . . . . . . . . . 30
3.4 Text and Lyrics Recognition . . . . . . . . . . . . . . . . . . . . . . . . . . . . 313.4.1 Related Work . . . . . . . . . . . . . . . . . . . . . . . . . . . . . . . 31
3.4.1.1 Open-Source Software for Automatic Text Recognition . . . . 32
v

CONTENTS
3.4.1.2 Text Recognition on Music Documents . . . . . . . . . . . . 323.4.2 Conclusion . . . . . . . . . . . . . . . . . . . . . . . . . . . . . . . . 333.4.3 Future Work . . . . . . . . . . . . . . . . . . . . . . . . . . . . . . . 33
3.5 OMMR4all . . . . . . . . . . . . . . . . . . . . . . . . . . . . . . . . . . . . 343.5.1 Workflows and Projects for OMR on Historical Material . . . . . . . . . 35
3.5.1.1 The Levy II Project . . . . . . . . . . . . . . . . . . . . . . 353.5.1.2 The Gamera Framework . . . . . . . . . . . . . . . . . . . . 353.5.1.3 Aruspix . . . . . . . . . . . . . . . . . . . . . . . . . . . . . 353.5.1.4 Allegro . . . . . . . . . . . . . . . . . . . . . . . . . . . . . 363.5.1.5 MuRET . . . . . . . . . . . . . . . . . . . . . . . . . . . . 363.5.1.6 The NEUMES Project . . . . . . . . . . . . . . . . . . . . . 373.5.1.7 SIMSSA . . . . . . . . . . . . . . . . . . . . . . . . . . . . 37
3.5.2 Comparison to the SIMSSA Workflow . . . . . . . . . . . . . . . . . . 383.5.3 Conclusion . . . . . . . . . . . . . . . . . . . . . . . . . . . . . . . . 403.5.4 Future Work . . . . . . . . . . . . . . . . . . . . . . . . . . . . . . . 41
4 Conclusion 43
A Publications Related to OMMR 45A.1 Fully Convolutional Neural Networks for Page Segmentation of Historical Docu-
ment Image . . . . . . . . . . . . . . . . . . . . . . . . . . . . . . . . . . . . 45A.2 Staff, Symbol and Melody Detection of Medieval Manuscripts Written in Square
Notation Using Deep Fully Convolutional Networks . . . . . . . . . . . . . . . 52A.3 Automatic Square Notation Transcription of Medieval Music Manuscripts using
CNN/LSTM-Networks and the segmentation-free CTC-Algorithm . . . . . . . . 80A.4 Comparison of OCR Accuracy on Early Printed Books using the Open Source
Engines Calamari and OCRopus . . . . . . . . . . . . . . . . . . . . . . . . . 105A.5 Calamari – A High-Performance Tensorflow-based Deep Learning Package for
Optical Character Recognition . . . . . . . . . . . . . . . . . . . . . . . . . . 123A.6 Lyrics Recognition and Syllable Assignment of Medieval Manuscripts . . . . . . 135A.7 OMMR4all – a Semiautomatic Online Editor for Medieval Music Notations . . . 141
B Other Contributions 149B.1 Deep Learning . . . . . . . . . . . . . . . . . . . . . . . . . . . . . . . . . . . 149B.2 Leaf Identification Using a Deep Convolutional Neural Network . . . . . . . . . 155
C Declaration of own Contributions 165
Bibliography 167
vi
List of AbbreviationsAABB Axis-Aligned Bounding Box
AI Artificial Intelligence
ATR Automatic Text Recognition
CC Connected Component
CAR Character Accuracy Rate
CER Character Error Rate
CNN Convolutional Neural Network
CRF Conditional Random Field
CTC Connectionist Temporal Classification
CWMN Common Western Music Notation
DNN Deep Neural Network
FgPA Foreground Pixel Accuracy
FCN Fully Convolutional Network
FN False Negative
FP False Positive
GAN Generative Adversarial Network
GPU Graphical Processing Unit
GRU Gated Recurrent Unit
GT Ground Truth
GUI Graphical User Interface
HMM Hidden Markov Model
HTR Handwritten Text Recognition
vii

List of Abbreviations
ICDAR International Conference on Document Analysis and Recognition
IIIF International Image Interoperability Framework
IU intersection over union
JLCL Journal for Language Technology and Computational Linguistics
LSTM Long-Short-Term-Memory-cell
MEI Music Encoding Initiative
MuRET Music Recognition, Encoding, and Transcription tool
NAR Neume Accuracy Rate
NC Note Component
kNN k-Nearest-Neighbors
OCR Optical Character Recognition
OMMR4all Optical Medieval Music Recognition For All
OMR Optical Music Recognition
PrIMuS Printed Images of Music Staves
dSAR diplomatic Symbol Accuracy Rate
RLE Run Length Encoding
RNN Recurrent Neural Network
SIMSSA Single Interface for Music Score Searching and Analysis
SVG Support Vector Graphics
SVM Support Vector Machine
TP True Positive
TPA Total Pixel Accuracy
URL Universal Request Link
VGSL Variable-size Graph Specification Language
WAR Word Accuracy Rate
viii

1 IntroductionThe digitization and encoding of historical music manuscripts is an ongoing area of research formany scientists. The aim is to preserve the vast amount of cultural heritage but also to pro-vide the musical information in machine-readable form (e.g., **kern [201], MEI [186], or Mu-sicXML [92]). For one thing, this enables musicologists to apply large-scale musical analysissuch as detecting similarities of melodies (see e.g., [94, 95, 120]), creating musical grammars (seee.g., [15, 104, 185]), or comparing different versions of the same piece of music (see e.g., [146,182]). Furthermore, digital transcriptions published in a collection [108] enable to develop toolsfor searching and data retrieving. The current Corpus Monodicum project [112] at the Universityof Würzburg is dedicated to the exploration and edition of music-historically significant, editori-ally untapped stocks of monophonic ecclesiastical and secular music of the European Middle Ageswith Latin text. Two volumes [113, 116] have already been published, however, the majority ofmaterial of interest has not been converted into machine-actionable form, yet. It is highly desirableto develop processes and software to speed up this process considerably.This thesis focuses onMedieval monophonicmusic written in square notation, an ancient notation
which was developed and used from the 11th-12th century onwards [65]. Compared to even earlierforms, this writing of music is already similar to Common Western Music Notation (CWMN) inthe sense that it uses four (or five) staff lines, clefs, accidentals, and neumes depicting discretepitches. However, unlike modern notation, notes are mostly connected to groups, the so-calledneumes which depict small segments of melodic motion. Currently, the digital acquisition heavilyrelies on human effort because the ancient manuscripts suffer particularly from degradation andnon-standardized fonts, glyphs, or layouts. Therefore, to speed up the process, novel techniques inthe area of Artificial Intelligence (AI) targeting Optical Music Recognition (OMR) are required toautomatically capture the encoded data in a computer-readable form. These techniques and theirimplementation are used to solve the different steps and their problems occurring in a productiveOMR workflow.The next sections describe the steps of a generic OMR workflow which is required to provide an
insight into the motivation behind this thesis, and the challenges of historical document processingand for the users. Afterwards, the contributions of the thesis are listed.
1.1 Steps of a Typical OMR WorkflowIn contrast to Rebelo et al. [174] who define a typical OMR workflow without the recognition oflyrics, a generic workflow for vocal music like Medieval chants comprises both music and lyricsrecognition (see Figure 1.1). The essential steps are briefly described in the following:
• The input is a digitized grayscale image of the music score. Usually, double pages are sepa-rated and color images converted to gray beforehand.
1

1 Introduction
Figure 1.1:A generic OMRworkflow to capture both the music and the texts of a music document.Documents serving as input or output are shown in gray, the individual steps of the workflow areshown in blue.
• The preprocessing phase aims to enhance the input images by removing noise or dewarp-ing. Thereto, a binarized version is generated and different algorithms apply morphologicaloperations such as opening or closing. Furthermore, the required reference lengths, whichare typically the staff line thickness and distance, are computed to obtain the scale of thedocument. This number can be used to normalize the dimensions of the input, for exampleby scaling the image to a fixed staff line distance.
• The layout analysis segments the page into regions containing music and text, optionallyincluding a fine-granular semantic distinction into, for example, lyrics or folio numbers.Furthermore, the staff lines must be detected to compute the pitches of music symbols lateron.
• The next step is the music symbol recognition. This includes the detection of individualsymbols, such as notes, rests, accidentals, stems, dynamic notations, or bars, but also, forinstance in CWMN, the reconstruction of high-level symbols such as key signatures. After-wards, the pitches can be computed based on the clefs, the key signatures, accidentals, andthe previously detected staff lines.
• In parallel to the music, the text is recognized. This step includes methods of either Au-tomatic Text Recognition (ATR) in general for printed or Handwritten Text Recognition(HTR).
• If both the lyrics and the music are present, the individual syllables of the text are computedand finally connected to their respective notes.
• Based on this output, the music notation is finally transformed into a machine-readable sym-bolic format, such as MEI. This final representation is then exported to common graphicalor music-publishing files.
As shown in Figure 1.1, the steps are highly dependent on each other which has a great impact onthe performance of an end-to-endworkflow and its evaluation. This problematic is further discussed
2

1.2 Motivation
in Chapter 2. The actual workflow of Optical Medieval Music Recognition For All (OMMR4all)which is a concrete form of this generic workflow is presented in Section 1.5.
1.2 MotivationThe success of Deep Learning in image processing tasks led to a huge popularity and new state-of-the-art algorithms in many areas of interest (see e.g., the surveys [137, 215]). Hereby, it openspossibilities to develop novel approaches to tackle previously unfeasible machine reading of his-torical music manuscripts. However, a crucial problem of any Deep Learning approach is theavailability of large high-quality datasets which are only rarely available in context of historicaldocuments. A lot of human effort is required to manually annotate data to train the models. Itis therefore mandatory to develop high performance algorithms that require only as few GroundTruth (GT) as possible. Naturally, also the GT creation process must be simplified by softwaresupport. The goal is to train book-specific models and finally mixed models which target any kindof material.Already proposed algorithms dealing with the individual steps of an OMR workflow that yield
almost flawless results on high-quality material must be reconsidered when targeting historicalmanuscripts. For example, researchers proposed many different approaches for staff line detec-tion (see e.g., [68]) which work reasonably well on many notations, however, only unsatisfactory onhistorical manuscripts. Furthermore, novel algorithms to read neume notation must be developed.Layout analysis and text recognition in OMR share many similarities with Optical Character
Recognition (OCR), which is why this thesis also presents several new developments regardingdocument analysis of historical prints and ATR. These algorithms form the basis further algorithmsbeing integrated in the pipeline of the OMR workflow.The assignment of syllables and notes is mainly disregarded in the literature, but to obtain a valid
transcript, this information is mandatory. In practice, preexisting lyric transcriptions are sometimesalready available and the identical ecclesial texts are often set to music using different melodies.New algorithms must therefore be developed to include this extra information if available.
1.3 Challenges of Historical Music Document ProcessingIn general, fully automatic OMR is far from being a solved problem for almost any kind of mate-rial or notation. While some subtasks such as OMR on single staffs of monophonic syntheticallyrendered material in CWMN is close to perfect (see e.g., [21] or [36]), OMR on more complex,handwritten, or older notations only provides first steps towards reliable recognition results (seee.g., [171], [208], [40], or [43]). In contrast, OCR is clearly developed further, some researcherseven claim that OCR on contemporary printed material is a solved problem (see e.g., [72]). Com-pared to OMR, this might be related to the easier alphabets of text but also to the greater interestin research of OCR. Especially early printed or handwritten documents still pose researchers achallenge, both in the area of OCR and OMR.Calvo-Zaragoza et al. [44] dividemusic notations into four categories which correspond to overall
complexity in increasing order (the following enumeration is quoted from [44], an example for each
3
1 Introduction
(a)Monophonic
(b) Homophonic
(c) Polyphonic
(d) Pianoform
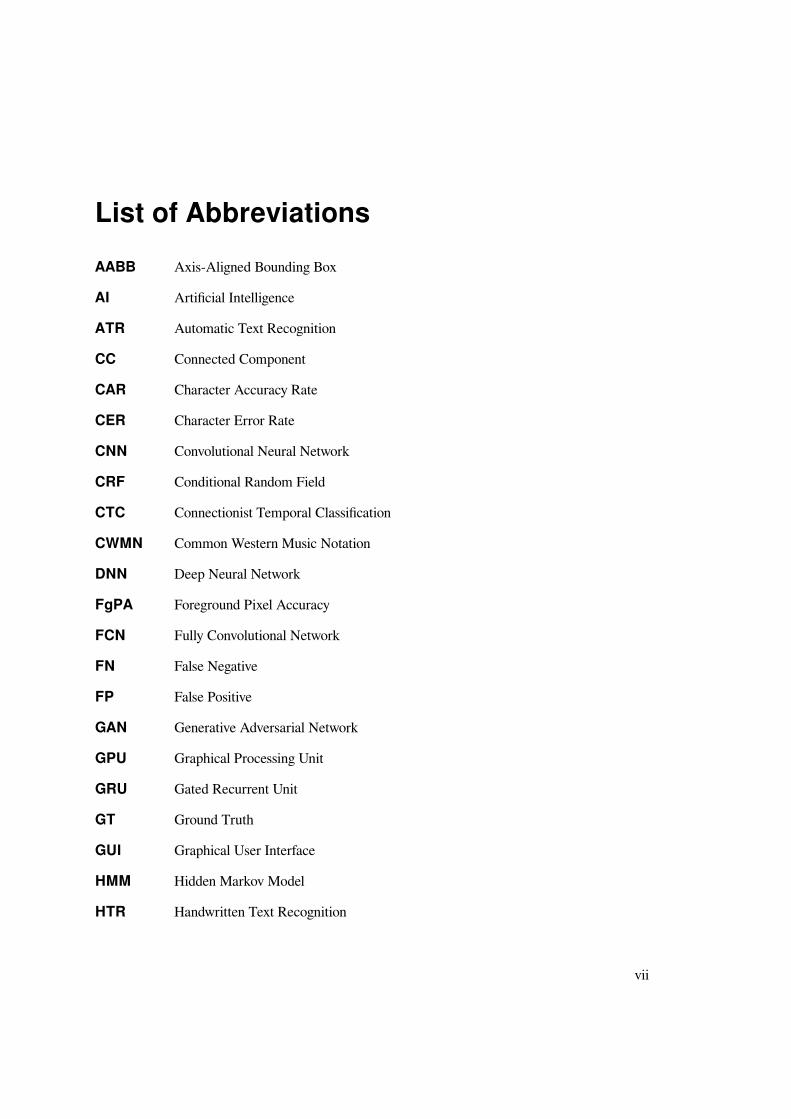
Figure 1.2: Examples of the four complexity categories of OMR (adopted from [44]).
category is shown in Figure 1.2):
(a) Monophonic: only one note (per staff) is played at a time.
(b) Homophonic: multiple notes can occur at the same time to build up a chord, but only as a singlevoice.
(c) Polyphonic: multiple voices can appear in a single staff.
(d) Pianoform: scores with multiple staffs and multiple voices that exhibit significant structuralinteractions. They can be much more complex than polyphonic scores and cannot be dis-assembled into a series of monophonic scores, such as in polyphonic renaissance vocal partbooks. This term was coined by Byrd and Simonsen [33].
While OCR is most similar to the monophonic case because only one character must be detectedat a certain point in time, OMR becomes quite complicated if the complexity increases. EarlyMedieval notations are monophonic since only one tone is sung at the same point in time. However,subsequent notes can be written on top of each other at the same temporal coordinate (see forexample the green box in Figure 1.3) which poses similar problems as homophonic CWMN.
4

1.3 Challenges of Historical Music Document Processing
Gothic (4 staff lines) Gothic (5 staff lines) Square notation (4 staff lines)
Figure 1.3: Example lines of different neume notations.
The main challenges of the processing of historical (music) manuscripts are the age which man-ifests in bad conditions, high variations in handwriting, and also the absence of standards, forexample in terms of layout or notation. Historical documents are often heavily degraded and thusshow signs of faded ink, soiling, or bad contrast. Another severe problem poses the bleeding ofink from the page on the back side. These problems are avoided by OMR systems that act on purerendered material which is why they show the highest performances (see e.g., [21], [36], or Section3.3).Furthermore, historical music is written in numerous different notations. The reason is that the
notation of the Medieval era was continuously under development. The earliest neume notationsdid not yet use staff lines and only used single strokes to depict a small piece of music motionwithout any absolute reference to pitches. The notation of actual pitches in a tonal system wasdeveloped centuries later by introducing discrete locations of the neume relative to one single staffline equipped with a clef. Several decades passed until more staff lines (usually four or five) weredrawn to define absolute intervals and pitches. Later, Mensural notations were developed to alsovisualize the rhythm of the music. From these notations, the CWMN evolved which is basicallyunchanged for many centuries. This thesis focuses solely on neume notations with four or five stafflines. However, even if staff lines are available there are still different “typesets” of music notations.While the square notation draws single Note Components (NCs) of neumes as square-like symbols,Gothic (Hufnagel) notations use more vertically strokes to depict music. Three examples are givenin Figure 1.3.Another challenge is the layout analysis which is required to separate and segment a page into
5
1 Introduction
meaningful regions for further processing. Individual music regions are, for example, fed into amusic symbol detector and classifier while text regions such as lyrics are further processed by anATR engine. Among different books but also pages, the distances or spaces between lines can varyor a different number of columns can occur. Furthermore, a high number of ornaments or droppedcapitals are usually present.A subtask of OMR is to recognize the written texts such as lyrics. When dealing with music
manuscripts, the occurring problems are of course similar to HTR in general: high variety ofwriters with different styles and typesets, noise, or soiling. The training of state-of-the-art systemsrequires a reasonably high amount of GT to obtain a general model which can be used for a reliableprediction afterwards. However, since text makes up only a small part of the content of a musicpage (typically 7-10 lines of lyrics), many pages must be transcribed in order to successfully trainmodels for ATR. Luckily, the writers of Medieval documents usually wrote in a very clean anduniform way – almost print-like, which is why the recognition of text can be settled between ATRon the earliest printed books and HTR. A diplomatic transcription (i.e., according to the document)of the Latin text poses another challenge because many non-standardized abbreviations are usedand sometimes words are written differently compared to modern spelling which is why a dictionaryis of limited use only. Yet, even if the text is successfully captured, individual syllables must bedetected and finally assigned to their corresponding neumes. Even for musicologists this is a highlynon-trivial task especially if notes and text are written very narrowly. Occurring ambiguities areoften part of the critical apparatus if no consistent solution is possible.Due to the high variability in notation related both to music and text, the training of individual
models for a book or a notation style is mandatory to obtain reasonably high recognition accuracies.This enforces the creation of high-quality GT for any algorithm of an OMRworkflowwhich is how-ever a tedious manual task. Consequently, researchers propose human guided or semi-automaticworkflows for OMR [57, 58, 89, 183, 212], but also OCR [63, 179]. These workflows also includethe idea to iteratively train better models during the transcription process if new GT becomes avail-able.
1.4 Challenges for the UsersThe transcription process of Medieval music is currently mainly done manually by musicologistswhereby their primary goal is to obtain a transcription of a book withminimal time expense. There-fore, OMR algorithms will only be accepted if they reduce the amount of effort. However, if mu-sicologists aim to introduce OMR algorithms into their current workflow, they will be confrontedwith a lot of emerging challenges. One crucial point is that the application of technical algorithmsusually requires domain knowledge from a computer science point of view. On the other hand, do-main knowledge of musicology is mandatory to be capable of performing the actual transcriptionsincluding editorial aspects. To simplify this interdisciplinary task, the focus lies on removing thebarrier of (at least) the technical part. First of all, the access to a reliable amount of GT, which isthe most crucial step towards an effective machine learning application, must be ensured. GT pro-duction is a non-trivial task due to the requirement of interdisciplinary knowledge. Music domainknowledge is enforced to read and more importantly understand the content, for example, if am-biguities must be resolved. On the technical point of view, a basic knowledge about the capacities
6

1.5 OMMR4all
about the underlying machine learning systems helps to design guidelines for GT production. Evenif all of the upper aspects are covered, GT production is still a cumbersome and time-consumingtask, especially in the domain of historical music manuscripts due to the required annotations ofthe difficult different layouts, exact positions of every note and all staff lines, texts, and semanticconnections of lyrics and notes. Another challenge is posed by the imperfect AI enforcing man-ual corrections. There might be some cases in large scale analysis for which a musicologist mightaccept some errors, but this is not the general case. Similar to the GT production, correction is alaborious, time-consuming task depending on the quality of the automatically predicted content.This work step must also be facilitated to save valuable time of musicologists.In contrast to music domain knowledge, the technical aspects can be encapsulated and simpli-
fied. This requires a comfortable Graphical User Interface (GUI) that hides details of the technicalimplementations and aspects, and also includes an editor for creating GT from scratch or by cor-recting the erroneous output of existing models. Next, an end-to-end workflow for OMR must beprovided which is easily adaptable to any kind of material, for example, by training new models.Finally, the encoded data must be exportable to common music formats, such as MEI, to allow foran application of already existing analysis tools of music science.Currently, focusing on Medieval music, there is no fully-functional tool available that covers
all of the upper aspects. A current approach embedded in the Single Interface for Music ScoreSearching and Analysis (SIMSSA) project [89] targets Medieval and Renaissance music and iscurrently under development (see [210–213] and Section 3.5.1.7). An available system targetingMensural notations is provided by MuRET [119] (see Section 3.5.1.5).
1.5 OMMR4allIn addition to novel algorithms for OMR, this thesis presents OMMR4all which comprises an auto-matic OMR workflow for Medieval manuscripts with the possibility to manually correct the outputof any stage if necessary. The current focus lies on neume notations with four or more staff lines.Earlier notations without or with only one staff line are considered, but not integrated, yet.OMMR4all implements a concrete form of the previously presented generic OMR workflow
considering both music and text recognition. An overview of the steps and also the integration ofautomatic algorithms and the user is shown in Figure 1.4:
• The input is a digitized color or grayscale image of the music score.
• The preprocessing phase generates deskewed grayscale and binary images. Moreover, thestaff line thickness and distance are computed to obtain the scale of the document. Thisnumber is used to normalize the dimensions of the input by scaling the image to a fixed staffline distance.
• Then, the layout of the page is analyzed. Thereto, it is sensible to first detect and isolatethe staff lines and staves serving as basis for a more accurate segmentation of background,music, and text regions. The exact positions of staff lines are required later to determine thepitches of the individual notes. In contrast to other typical workflows, the staff lines are noterased. Furthermore, the reading order of the music or textual regions must be determined
7

1 Introduction
Figure 1.4: The proposed workflow of OMMR4all. Documents serving as input or output areshown in gray, optional input is connected by dashed arrows. The individual steps of the workfloware shown in blue. Human (inter)actions are drawn in yellow. The orange elements show thestorage for the annotated pages or the trained models. If this thesis provides separately publishedcontributions to parts of the workflow, they are marked with a dark blue outline.
8

1.5 OMMR4all
which is however in most cases straightforward to compute by sorting the regions from topto bottom.
• The next step is the music symbol recognition. Traditional approaches for classificationisolate and then classify symbols. In this thesis, two different CNN-based algorithms areproposed that directly act on the raw grayscale image. Afterwards, if all symbols are recog-nized, the pitches of the notes can be determined based on the previously detected staff linesand the clefs. It might be possible that, for some manuscripts, the written music was alreadytranscribed which is why it is sensible to include this information in the symbol recognitionto speed up the GT production.
• Afterwards, the segmented text of a page is recognized including both lyrics and also anyother text. Lyrics require a hyphenation of its words before individual syllables can be as-signed to their corresponding notes.
• Based on this output, themusic notation is finally transcribed and transformed into amachine-readable symbolic format. The annotated pages are then exported to common graphical ormusic-publishing files (e.g., MEI).
OMMR4all is a client-server application which allows for a worldwide access on any computerwith internet access. Furthermore, the full application is build into a single Docker [143] containerto facilitate the deployment process on a custom server. The semi-automatic workflow fulfills allrequirements to obtain high quality transcriptions which can be exported into common formats thatallow for further research of musicologists. The workflow comprises state-of-the-art tools based onDeep Neural Networks (DNNs) to solve various tasks. A user-friendly GUI allows to control theworkflow and a sophisticated but still comfortable overlay-editor facilitates manual corrections andGT production. The editor allows to intervene at any step of the full pipeline to manually createperfect inputs of an upcoming step which highly reduces consequential errors.The GUI provides functionality to allow an user to easily train new models. This is useful if new
pages of GT are available to iteratively train improved models for a book to reduce the numberof manual corrections. Furthermore, this enables to apply OMMR4all to unseen data or booksafter some pages of GT were manually annotated using the already existing but probably poorlyperforming models. All trained models can be collected in a repository to provide a good startingpoint if a new unknown manuscript is present that shares some similarities with already transcribednotation styles.In order to ensure that OMMR4all is expandable and also adaptable to completely different nota-
tions, existing algorithms can easily be exchanged or expanded by adding new ones. For example,new staff line detection algorithms must be developed and integrated to handle notations with onereal and many virtual staff lines.As soon as many different sources and notations were successfully transcribed, it is sensible to
train and provide a so-called mixed model based on all or a subset of the available data. This modelthen serves as baseline for new data where no perfectly fitting model is available, yet. OMMR4allcurrently allows to define default mixed models for each style, such as Gothic or square notation.OMMR4all provides sophisticated and comfortable software for musicologists and implements a
fully automatic pipeline for OMR with the option of human interaction. Naturally, as stated, the
9

1 Introduction
results must be manually corrected which can however be used to iteratively new improved models.If the benefits of reduction of manual effort in total and especially if the quality of the annotatedoutput outweighs a completely manual workflow, users are willing to put in some effort for thecorrection and also in learning how to interact.
1.6 ContributionsThe main, all-encompassing contribution of this thesis is OMMR4all which incorporates other con-tributions in the field of general document analysis, OCR, and OMR. Most importantly, a sophis-ticated workflow (see Figure 1.4) was developed to tackle all requirements of the peculiaritiesof Medieval music processing and encoding. This thesis proposes several machine learning ap-proaches for the layout analysis, the music symbol and text recognition.
1. The first contribution (see Section A.1, [219]) deals with the application of Fully Convo-lutional Networks (FCNs) for page segmentation of historical books or manuscripts, whichposed a new state-of-the-art on this sort of material. This methodology can be directlyadopted to the layout analysis of Medieval manuscripts.
2. A new staff line detection based on FCNs is presented (see Section A.2, [224]). The algo-rithm shows excellent performance but also generalization on unseen data or notations. Ifnecessary, a few lines of GT suffice to train a new robust model.
3. Two novel symbol detection algorithms which capture the peculiarities of neume notationswere developed: First, a FCN was proposed that identifies the locations of single notes andtheir connection to each other, but also clefs and accidentals (see Section A.2, [224]). Thisallows to reconstruct the neume notations in a bottom-up way. Here again, the advantageis that training and therefore an application to yet unseen notations is easily possible. Thedrawback of this method is that the GT requires positional information about each sym-bol which is why its production is tedious. A further approach is presented in Section A.3[221] that solely requires a segmentation-free transcription similar to ATR. Thereto, Cala-mari (see next point) which originally provides hybrid networks of Convolutional NeuralNetworks (CNNs) and Long-Short-Term-Memory-cells (LSTMs) for ATR was adapted forOMR which is possible since, similar to text, monophonic music is a simple sequence ofsymbols. Both approaches yield comparable results on the same datasets.
4. Calamari, a novel software for ATR is contributed which yields state-of-the-art results bothon historical printings and contemporary fonts (see Sections A.5 and A.4, [223, 226]). Cala-mari includes several cutting-edge techniques to optimize the results even if only a fewlines of GT are available: CNN/LSTM-networks, a loss function based on the Connection-ist Temporal Classification (CTC) algorithm, confidence-voting [178], data augmentation,early stopping, usage of a GPU, or word decoding using a dictionary. Furthermore, Cala-mari supports various kinds of common formats used in OCR to allow for an easy integrationin existing pipelines.
10

1.7 Nomenclature
5. Calamari is applied to detect Latin handwritten lyrics (see Section A.6, [222]). Furthermore,in OMMR4all, if the actual lyrics are already available in textual form, a shortcut allows tosimply paste it. This is meaningful because a preceding text transcription is the currentstandard workflow of musicologists.
6. An algorithm to assign the individual syllables to neumes is presented (see Section A.6,[222]). This algorithm relies on the positional information of the lyrics prediction of Cala-mari. A character-by-character alignment with the known syllables allows to use their aver-age positions to find matching neumes. Possible conflicts, for example, if two syllables arematched to the same neume, are resolved afterwards.
1.7 NomenclatureThroughout this thesis, a consistent terminology is used:
• Staff line: A single horizontal line.
• Staff/Staves: A group of several staff lines (typically four or five) which can also containmusic symbols.
• Music symbol comprising amusic symbol type (occurring symbols or marks, such as notes,stems, clefs, time signatures, slurs, or dynamics) and music symbol height (position ofsymbols relative in a staff).
• Note (absolute note position) consisting of a note type (e.g., quarter or half note, or othervariations of the note head) and note height (position of a note relative to a staff). In termsof neumes, a note is a synonym to a NC.
• Clef comprising a clef type (e.g., treble or bass), and a clef position (position of the clefrelative to the staff).
• Neume consisting of a neume type (e.g., torculus, punctum), and a neume height (positionof the neume or their components relative to a staff). Neumes mainly occur in historicalmusic. A neume is a stereotype combination of NCs and can be resolved into those.
• Note Components (NCs) define a single note of a neume. Each note has a note position(position of the note relative to the staff) and a note type (e.g., oriscus or liquescents).
• Pitch: The pitch of a note is defined with regard to a musical scale (e.g., C, D, E, F, …).Dissolving of note or neume heights into pitches requires a clef.
11


2 Problematic of the Evaluation of anEnd-To-End Workflow
The final goal of any application of AI is a fully-automatic end-to-end workflow. In the contextof this thesis, this is achieved if an OMR workflow receives a scan of a Medieval manuscript(written in square notation) and outputs the music symbols and their pitches (i.e., the melody),the lyrics which are placed to the correct note, and also other text and its semantic label (e.g., folionumbers). In contrast to the closely related task of OCR, these many different outputs that subsumethe outputs of OCR complicate OMR of Medieval manuscripts. Another fundamental problem isthat several steps of a generic OMR workflow are build on one another (see Figure 1.1). This leadsto consecutive errors when applying all steps fully-automatic end-to-end:
• If the layout analysis fails, the subsequent text and symbol recognition will be erroneous.
• If the detection of staff line or clefs fails, the pitches of the notes will be false.
• If the recognition of notes or text fails, the syllables will not be correctly assigned to theirrespective neumes.
In the literature, there are many publications that target one single step of the workflow. Un-fortunately, several differently computed metrics that often depend on the particular algorithmitself are defined, and are thus difficult to compare. Furthermore, publications that target squarenotation and even historical notations in general are rare. Also the used datasets vary among pub-lications and the GT is not publicly available. Therefore, it is very difficult to compare outcomesof this thesis to related work. The following paragraphs attempt to roughly compare the metricsand the obtained performances of the related work to the outcomes of this thesis. More thoroughdescriptions of the related publications are provided in the next chapter.The literature reveals two typical metrics to evaluate the performance of the staff line recognition
(see Section 3.2). The first metrics (called FD1 in this thesis) measures the precision and recall of
how many lines are detected. A line is matched if, for example, the prediction and the GT overlapwith at least 50% of the length or if their average distance is smaller than the line thickness. Thesecond metric (called F LF
1 in this thesis) computes the F1-score of how many pixels that belongto a staff line are identified. The drawback of the first metric is that it does not take the actuallength or thickness of a line into account, whereas the second metric ignores the shape of a line(i.e., whether the pixels are connected). In this thesis, both metrics are used. Depending on thematerial, the best performing algorithms of the literature for staff line detection reach an FD
1 ofabout 99.2% (see Section 3.2) whereby a pair of prediction and GT line is valid if the euclideandistance between two lines is smaller than the staff line height. On Medieval square notation, thealgorithm of this thesis reaches about 99.6%, but instead of the Euclidean distance, at least 50%
13

2 Problematic of the Evaluation of an End-To-End Workflow
of the length must overlap. A direct comparison to the literature is possible thanks to the work ofHartelt [111] who applied three different available staff line detection algorithms using the sameMedieval manuscripts and the same metric as in this thesis (see Section 3.2). Applying a manualhyper-parameter optimization, the algorithm of Dalitz et al. [68] performed best with an FD
1 ofabout 80% which is clearly inferior the result of this thesis with 99.6%.
The performance of the detection of a complete stave consisting of several staff lines is mea-sured by another F1-score counting the number of missing, additional, and correct predictions. Onmanuscripts written in square notation, Ramirez and Ohya [171] achieved an F1-score of about95% whereby only the locations of the staffs using a pattern of straight lines are searched (see Sec-tion 3.2). The proposed algorithm of this thesis reached an F1-score of above 99% on a differentdataset of the same epoch, whereby a staff is found if at least two out of four staff lines were cor-rectly detected. In contrast to Ramirez and Ohya, the staff lines are allowed to be curved and thusfit the actual lines.
In the literature, there are several different metrics to evaluate the performance of the symbolrecognition whereby the choice highly depends on the notation, its digital representation, and thealgorithm. Ramirez and Ohya [171] evaluated the recognition of a neume notation in two met-rics: first, the presence of any neume; second, the accuracy of the type of a neume (e.g., pes orclimacus). This approach does not respect the positions or pitches of the individual NCs. In thisthesis, since neume notations are monophonic, the final representation of the music can be regardedas a sequence of symbols, whereby a neume is always resolved into a list of individual NC eachcomprising a graphical connection and a position. Therefore, the metric is defined by countingthe number of correct symbols within the sequence normalized by the length yielding the diplo-matic Symbol Accuracy Rate (dSAR) which corresponds to the Character Accuracy Rate (CAR)in an OCR task. Similarly, it is possible to define the Neume Accuracy Rate (NAR) counting thenumber of correct neumes (i.e., each NCs of a neume is correct) which can be compared to theWord Accuracy Rate (WAR) in OCR. The dSAR is used in several other publications that tar-get monophonic music (see Section 3.3): [20, 36] for CWMN or [38, 40] for Mensural notation.Unfortunately, to compare the results of this thesis with those of Ramirez and Ohya [171], bothtargeting square notation, only an estimation is possible. Ramirez and Ohya detect 88% of theneumes and correctly label 92% of the neumes which is why in total about 81% of the symbolsare correct. This result can be very roughly compared to the NAR which measures the amount ofneumes with all NCs being correct. This thesis obtained NAR of 83.5% (see Section A.3 or [221])showing the same order of magnitude. Note however, that a mapping of the results of Ramirezand Ohya disadvantages the NAR because it respects False Positives (FPs) and the actual correctlocation (i.e., pitch) of each NC.
Furthermore, a rough comparison to manuscripts in Mensural notation can be drawn: the ageand the degradation of the material are similar, but naturally the layout and the notation itself aredifferent. In contrast to neumes, Mensural notation consists of single notes but also rests with aposition and duration, thus more classes in total. Clefs within a line do typically not occur. Thepublications of Calvo-Zaragoza et al. [38, 40] (see also Section 3.3) do not exceed a dSAR of 59%on Mensural notation. This confirms the difficulty of any historic handwritten material and that thedSAR of 92.2% obtain in this thesis for square notation is competitive.
14

The performance of the ATR of lyrics is evaluated using the Character Error Rate (CER) whichcounts the number of edits required to obtain the GT sequence normalized by the sequence length.On the same Medieval manuscripts, this thesis achieves a CER of below 10% which clearly out-performs the reported CER of de Reuse and Fujinaga [70] who use OCRopus (see Section 3.4).An evaluation if a syllable is correctly assigned to a neume, has not been considered in the lit-
erature, yet. This thesis proposes to use an F1-score to count the correctly matched, missing andadditional connections. On a dataset of Medieval manuscripts in square notation, an F1-score ofabout 99.2% was reached assuming that both the lyrics and the music is present (see Section 3.4).In general, one metric to evaluate the full end-to-end workflow was, in all conscience, not yet
considered, possibly due to the difficulties related to the many different outputs (text, notes, andsyllable connections, semantic region labels) and because publications usually target only one singlestep instead of the complete workflow. A very simple metric could be defined by averaging theperformances of each individual step. Since the focus of this metric is on the transcription, theperformance of the layout analysis or the preprocessing should be ignored. The problem of thismetric is that different errors receive a different weight and might also be more or less severe whichis why a statement of the actual number of errors is not possible. This could be solved by anothermetric that is defined by the minimum number of changes to obtain the GT sequence. An actualapplication is complicated because it can be difficult to find the best match of prediction and GTand also the same corrections can be performed by actions with different efficiency. Nevertheless,an estimation seems feasible as a first step. The application of these metrics is, however, out of thescope of this thesis.
15


3 Related Work with Regard to theContributions
This section briefly summarizes the methods and the results of the accumulated scientific publica-tions (see Table 3.1) which are extended by giving a more comprehensive overview of the relatedwork. The contributions are sorted according to their order in the workflow of OMMR4all: Layoutanalysis including staff line detection, symbol detection, text recognition, and syllable assignment.The last section presents the publications related to OMMR4all and the complete workflow.
Table 3.1: Overview of the accumulated publications of this thesis.Step in the Workflow Section Page PublicationLayout Analysis A.1 45 [219]Staff Line Detection A.2 52 [224]Music Symbol Detection A.2, A.3 52, 80 [221, 224]Text and Lyrics Recognition A.4, A.5, A.6 105, 123, 135 [222, 223, 226]OMMR4all A.7 141 [220, 225]
3.1 Layout AnalysisThe paper “Fully Convolutional Neural Networks for Page Segmentation of Historical DocumentImage” (see Section A.1, [219]), published at the 13th IAPR International Workshop on Docu-ment Analysis Systems (DAS) 2018 in Vienna, targets the page segmentation of historical printedand handwritten documents. Thereto, an FCN was introduced inspired by the U-Net of Ron-neberger et al. [187] to classify each pixel of the input image into several semantic regions: back-ground/periphery, page, running text, marginala, headlines, images, and swash capitals. The eval-uation was performed on three publicly available1 manuscripts (G. Washington [131], Parzival[228], St. Gall [83]) and three early printed books (GW5060, GW5064, GW5066) scanned dur-ing the Narragonien digital2 project. Since there were no strict rules of the GT production for theshape and extends of a region, a metric called Foreground Pixel Accuracy (FgPA) was introducedto more reliably compare the performances of the FCN on the different documents by only ac-counting for foreground pixels. Furthermore, for a comparison with previously published results,the traditional Total Pixel Accuracy (TPA) was included in the evaluation.1http://www.fki.inf.unibe.ch/databases/iam-historical-document-database and http://diuf.
unifr.ch/main/hisdoc/divadia2http://kallimachos.de/kallimachos/index.php/Narragonien
17

3 Related Work with Regard to the Contributions
3.1.1 Related WorkThe semantic segmentation of a page into different regions is still actively researched because themethods of researchers often show satisfactory results for only one specific task and dataset. Thereason is that documents show a high variance across genres and centuries. This interest manifestsin the many competitions of the International Conference on Document Analysis and Recognition(ICDAR) on document analysis since 2009: analysis of historical books [5, 6] or newspapers [7],complex layouts of modern documents [4, 8, 64], document analysis on smartphones [31], tablesegmentation [99], or book structure (e.g., for navigation) [73, 74]. The latest conference in 2019hosted in total 27 challenges related to document analysis which emphasizes the high interest inthis topic and the fact that this area of research is far from being resolved. Four competitions werein the category of handwritten historical document layout recognition: historical book analysis,digitized magazine article segmentation, German-Brazilian newspaper layout analysis, and baselinedetection and page segmentation. Another six competitions were related to document recognition interms of layout analysis and text recognition: table detection and recognition in archival documents,table recognition, scanned receipts OCR and information extraction, form understanding in noisyscanned documents, recognition of documents with complex layouts, competition on recognitionof early Indian printed documents.The goal of document analysis is to split a scan into separate regions of interest and categorize
each. In the literature, this task is often divided into page segmentation which tries to identify textand non-text regions such as figures, tables, or music, and logical structure analysis that attempts toassign a meaningful role to regions such as headline or paragraph (see e.g. [142, 151]). Page seg-mentation can further be split into bottom-up approaches which first detect words and group themhierarchically, and top-down approaches which split a page successively into high-level columns,then paragraphs, and text lines. Depending on the choice of the subsequent character recogni-tion software, lines and words must further be split into single characters (see e.g., [200]). Manybottom-up approaches such as [3, 100, 102, 191] rely on local information such as ConnectedComponents (CCs) to construct higher levels. The major advantage of these approaches is the in-dependence of text spacing or block alignments. Early methods used polar coordinates [156], runlength [80, 189, 204, 227] and run length smoothing [123, 132]. Top-down algorithms try to de-tect for instance black or mainly white stripes that split a document into rows and columns. A veryprominent approach uses recursive X − Y -cuts to decompose a document image into rectangularregions of interest [101, 130, 149, 150]: in general, an iterative algorithm computes horizontaland vertical pixel projections and divide its valleys into zones, which are stored in a tree. Otheralgorithms combine smearing and CCs [163] or analyze white background [14, 118]. One majorproblem of the proposed algorithms is that they only work on so-called Manhatten layouts whichrequires that all columns and paragraphs can be separated by a set of strictly vertical or horizontallines that are drawn through white background.The recent progress towards CNNs and in particular FCNs led to rapid improvements towards
combinations of segmentation and semantic analysis. FCNs are in some sense a combination ofa bottom-up and a top-down approach in one step because the networks have simultaneously ac-cess to high-level and low-level information due to their encoder-decoder structure. Pioneeringwork on FCNs for semantic segmentation was published by Long et al. [138] and Noh et al. [155]who adapted classification networks into FCNs with skip connections to achieve state-of-the-art
18

3.1 Layout Analysis
Table 3.2: Pixel accuracy in percent on three different historical books for page segmentationDataset G. Washington Parzival St. Gall
Local MLP [55] 87 91 95CRF [53] 91 93 97CNN [56] 91 94 98
Weighted Loss [47] − − 98Deep Features [122] 95 97 99
segmentation results on real world photographs. To reduce the expensive human effort for GTproduction, other researchers propose semi and weakly supervised semantic segmentation usingvarious methods such as Generative Adversarial Networks (GANs) (e.g., [196]), a combination ofdeep CNNs and Conditional Random Fields (CRFs) (e.g., [59, 135, 161]), or usage of CNNs withdilation (see e.g., [216]). FCNs to extract semantic structure of contemporary documents, such asscientific articles, were successfully applied by Yang et al. [229].
This thesis focuses on the processing of historical prints and manuscripts that date back to the13th-15th century, which poses different challenges to layout analysis systems for example due todegradation, bleeding ink, or non-standardized layouts. Table 3.2 lists recent segmentation resultson three historical handwritten books. In the field of historical document analysis, Chen and Seuret[56] proposed a three layer neural net with only one convolutional layer. This network learnedto predict the label of superpixels (see e.g., [81]) and outperformed methods that were based onSupport Vector Machines (SVMs) [54, 55] or CRFs [53] and handcrafted features. More recentapproaches use CNNs and a weighted loss [47] or even deeper features [122].
Extracted lyric and music regions are usually processed independently by either an OCR or OMRpipeline. Droettboom [75] proposed an approach that first removes all musical elements such asstaves based on OMR algorithms. The remaining page was processed by an OCR engine to detectand extract lyrics. Chourdhury et al. [62] first removed the prominent staff lines and then usedheuristics of CCs to detect textual content such as lyrics or performance indicators. Burgoyne etal. [30] detected the baseline segments of text on pages with removed staves. These short partswere then merged. Potential FPs arising from notes could be distinguished based on their shapewhich was usually less blurred. The next step estimated the height of the lyrics by reconstructingthe fragments based on the CCs of the baseline segments. Finally, the complete lyrics line couldbe extracted. Campos et al. [45] computed a horizontal projection profile which acted as row-wisefeatures for a vertical layout analysis based on Hidden Markov Models (HMMs). A deterministicfinite-state automaton modeled the restrictions of the layout elements title line, staff lines, emptystaff line, lyrics line, or blank space. The best path was computed by the Viterbi algorithm [121]after the HMMwas trained for each region type. Their approach is similar to a language processingtask, that concatenates predictions of low-level elements, such as characters, to high-level elements,such as words or sentences, by respecting a language model. In general, by design, this algorithmcan only produce straight regions.
19

3 Related Work with Regard to the Contributions
3.1.2 ConclusionUpon publication of the original paper in early 2018 (see Section A.1), its methodology yieldedboth state-of-the-art results and a clearly reduced computation time with a factor of up to 10. Therecent publications of Capobianco et al. [47] and Jobin and Jawahar [122] significantly outperformthe method of this thesis which is not surprising since the segmentation of pages is a currentlyhighly relevant area of research. While the fundamental techniques based on CNNs and DeepLearning remained the same, deeper network architectures, additional features, or variations of theloss function led to significant improvements.Even though the targetmaterial of the paper was text and notmusic, the techniques can directly be
adapted for the layout analysis of musical scores. A first step towards this was presented by Calvo-Zaragoza et al. [43] who apply a simple CNN for this task. In the publication of the next section,FCNs were applied to segment staff lines and to detect music symbols on Medieval manuscripts.
3.2 Staff Line DetectionThe first contribution of the publication “Staff, Symbol and Melody Detection of Medieval Manu-scripts Written in Square Notation Using Deep Fully Convolutional Networks” (see A.2, [224])which was published in the journal Applied Sciences in 2019 dealt with the automatic detectionof staff lines. An FCN which is applied on a full scan identifies pixels that are either part of astaff line or background. Then, a postprocessing pipeline extracts all staff line pixels as CCs andcreates polylines based on each component. Lines on the same height are joined to close smallgaps. Finally, the staff lines are grouped into staves based on their average distances. To evaluatethe method, a dataset comprising 49 pages, 2,040 staff lines, and 510 staves was manually created.F1-scores of over 99% for both detecting lines and complete staves were obtained.
3.2.1 Related WorkAny OMR workflow requires a staff line detection algorithm to gain layout information and tocompute the pitch of notes. Traditional workflows remove these staff lines to obtain an image withonly music symbols that are separated and classified in a second step. More recent attempts aim torecognize music scores without staff line removal. This section first deals with the detection andafterwards with the removal of staff lines. Many papers in the literature deal with both problems,which is why they occur in both sections.
3.2.1.1 Staff Line Identification
The complexity of staff line detection highly depends on the material at hand. Cleanly printed stafflines are perfectly horizontal, while they are usually wavy or distorted in handwritten context. Anoverview of selected publications that comprise a quantitative evaluation of the various proposedalgorithms is given in Table 3.3. The used corpora vary from ideally rendered scores to historicalplainchant manuscripts which are the target material of this thesis. The following section providesinsights of the historical development as well as the current state-of-the-art.
20

3.2 Staff Line Detection
Table3
.3:O
verview
ofdifferentapproachesofthestaff
lineidentification.Theauthor,trainingand
evaluation
corpus,the
used
meth
od,
theevaluation
metrics,and
results
arelisted
groupedintopublicationsusingthesamematerial.Inthefirstsection,the
rendered
scores
aredefo
rmed
fortheevaluation
which
iswhyvaluesfornodeformation,curvaturedeformation,and
typesetemulationaregiven.Hereby,
thew
orstvaluesofthe
algorithmsforeachseverityofdeformation
arelisted.T
healgorithmsofR
ebelo
[ 173]and
Cardoso[49]perform
identical,butdifferinspeed.Thelasttwo
sectionsgive
resultson
plainchantm
anuscripts.
Author
Training
andevaluationcorpus
Method
Evaluationmetrics
Result
Dalitz[68]
32pagesofidealrenderedscores
withartificialdefo
rmationsusing
modern,tabulature,historic(chant,
mensural)notation
s(see[68])
Combinationo
fshortlinesegments
FP,FNofstaffline
Nodeform.:0%
,0%
Curv.:up
to96%,100%
Type:upto59%,37%
Rebelo[173]/
Cardoso[49]
Shortest/StablePath
Nodeform.:0.6%
,0.6%
Curv.:up
to1.2%
,1.2%
Type:upto0.7%
,0.7%
Daliz[68]
40realmusicscores,
manually
annotated
Combinationo
fshortlinesegments
FP,FNofstaffline
5.2%
,5.9%
Rebelo[173]
ShortestPath
1.4%
,2.5%
Cardoso[49]
StablePath
1.3%
,1.4%
Rebelo[172]
76handwrittenmusicscores,
manually
annotated
StablePathsusingb
inaryfeatures
FP,FNofstaffline
1.0%
,1.2%
StableP
athsong
rayscaleusingS
SPs
0.7%
,0.8%
Calvo-Zaragoza
[42]
6,000scores
oftheICDA
R/GR
EC2013
Competition
[214]
CNNtoclassifystafflinepixels
Precision
andRecall
ofcorrectStaff
Line
Pixels
98.2%,73.4%
Calvo-Zaragoza
[43]
10pagesofE
insiedelnmanuscript
CNNtoclassifystafflinepixels
Precision
andRecall
ofcorrectStaff
Line
Pixels
71.3%,86.7%
10pagesofSalzinnesm
anuscript
77.4%,98.8%
Ramirez[171]
136pagesofplainchantmanuscriptsavail-
ableat[82]
Template
matching
ofstaves
Recallofstaves
95%
21

3 Related Work with Regard to the Contributions
The first approaches to detect staff lines only worked well if the staff lines were mostly straightand horizontal. In this case, a simple horizontal projection whose maxima correspond to staff linessufficed [22, 188]. Later algorithms also dealt with more complicated scores for which the initialapproach was extended by a combination of several different projection techniques [13, 153, 230].Other methods used vertical scan lines [50, 124, 175], Run Length Encoding (RLE) [88], linetracing [165, 184], or morphological algorithms [2, 52, 145]. To tackle the detection of curvyor distorted staff lines, various more sophisticated algorithms were developed. Miyao [144] orSzwoch [199] tried to combine short line segments to staff lines which was extended by manysubsequent publications [68, 154, 194, 195]. In [173], Rebelo et al. introduced an iterative staffline detection algorithm which could already handle curved staff lines: The shortest path throughthe foreground pixels of the score from left to right is searched, the result is stored as staff line andthen erased. These steps are repeated until the shortest path does not fulfill a set of different rules.This algorithm was extended in [46, 49] by utilizing stable paths which requires less iterationsbecause in one step multiple staff lines could be detected. Su et al. [197] aimed to model theshapes of staff lines by estimating their orientations on an initial staff line image. The previouslymentioned algorithms require a binarized input image, which is why the binarization algorithm hasa great impact on the performance. The staff line detection algorithm in [172] extended their priorworks [48, 49] to the grayscale domain: the cost of a pixel to belong to a staff line is modeled by aprobability function which is based on different black runs created by variations of the threshold ofthe binarization. Another extension to [49] was published by Bui et al. [28] who used boosted stablepaths which basically speeded up the run-time algorithm by estimating the staff line boundaries onthe page. More recent approaches use machine learning to discriminate between staff or symbolpixels. In [39, 42], Calvo-Zaragoza et al. introduced CNNs for staff line detection of binary orgrayscale images.In the area of historical musical manuscripts, several recent approaches were proposed for the
staff line and stave detection. Timofte et al. [203] or Ramirez et al. [171] roughly detected stavesby an optimization problem to fit predefined staff patterns in the page. While the symbol detectionalgorithm of [171] did not require staff line removal, [203] performed an subsequent accurate staffline detection algorithm. In [41, 43], Calvo-Zaragoza et al. defined the detection of staff line pixelsas part of a complete pixel-wise page segmentation problem which was solved using a CNN. Theirnetwork learned to distinguish background, staff line, text, and symbol in one step, providing aseparate binary layer for each subsequent step.A separate evaluation of the staff line detection on square notation which was assembled by
Hartelt [111] is given in Table 3.4. The algorithms of Miyao [144], Dalitz [68], and Cardoso [49]were taken from the MusicStaves Toolkit [68] of Gamera [77] and the parameters were manuallyoptimized for each material. The results clearly show that the established algorithms work flaw-less for printed material (here 100% of the lines were detected), however only perform poorly onhistorical manuscripts. For example, the results of the Miyao-algorithm on the manuscripts of theNevers dataset mean that only around 40% of all staff lines were correctly hit with at least half ofthe length. If 90% shall be hit, the value drops further to only around 20%. Ramirez and Ohya[171] reached a staff detection of 95% on comparable material as shown in Table 3.3, however,the used template for a staff only allows for straight and equidistant lines which does only roughlymatch with the hand-drawn lines on the manuscripts. Depending on the actual use-case, this is not
22

3.2 Staff Line Detection
Table 3.4: Comparison of different algorithms on historical plainchant manuscript pages of theNevers dataset (see Section A.2) and on the Liber Usualis [51] (printed square notation). Theevaluation metric is the F1-score for identifying a staff line correctly, whereby a line is marked asTP if the overlap between the GT and the predicted line is greater than 50%. These values are thebest values of the literature on the same material as used in this thesis.
Author/Method Nevers Liber UsualisMiyao [144] 0.38 1.0Stable Path [49] 0.59 1.0Dalitz [68] 0.80 1.0
sufficient, for example, if the pitches of the symbols have to be extracted.
3.2.1.2 Staff Line Removal
The performances of the staff line removal algorithms were pushed due to two competitions heldby the ICDAR in 2011 and 2013 [84, 86, 214]. The dataset used throughout the competitions isthe CVC-MUSICMA [85] dataset which comprises 1,000 handwritten scores in pianoform by 50different writers.Table 3.5 lists the primary outcomes and the methodologies of the participants of the compe-
titions. A horizontal line separates the two years in which a different severity of degradation andalso optionally a grayscale version (“-gray”) of the data was used for the evaluation. Most ap-proaches rely on the detection of the staff line thickness and staff line spaces using vertical RLE[48, 68, 88, 197]. These values are used to define different heuristics to either remove foregroundpixels or construct graphs to isolate staff lines which are then erased. A robust approach in bothchallenges is based on the removal of staff lines which were detected using stable paths [49]. Otherapproaches directly try to erase staff lines by combining various mathematical operations, such aspattern matching, dilation, or closing [78, 97].After the training and testing sets of the challenges were made public, several further results were
reported. The staff line removal algorithm of Alirezazadeh and Ahmadzadeh [2] first removes allpixels of their detected staff lines. In a second step, an algorithm tries to recover eliminated partsof the music symbols. Thereto, a 2-D-Fourier transform and a subsequent low-pass filter is appliedto obtain a blurry version of the input image, whereby the thickest objects, mainly overlaps ofstaff lines and symbols, are highlighted. An adaptive binarization algorithm segments these partswhich are the missing parts of the symbols due to the initial staff line removal. The total algorithmincluding the staff line detection was evaluated on the CVC-MUSICMA dataset. To simulate theeffect of various distortions, they applied eleven models such as rotation, curvature, and speckles.The F1-score yielded an error of 1.59% (see Table 3.5).The previous methods for staff line removal show that machine learning approaches, such as
neural networks, were not yet considered in the community of OMR up to about 2013 since theamount of available training data was restricted. In 2017, several machine learning approaches forstaff line removal emerged. Montagner et al. [147] proposed an image operator learning approach
23

3 Related Work with Regard to the Contributions
Table 3.5: Combined results of various staff line removal algorithms. The first section correspondsto the results of the ICDAR 2011 challenge [84] whose metrics is a pixel-based accuracy. Thesecond section shows the averaged outcomes of the ICDAR 2013 challenge [214] which applieddifferent grades of degradation to the evaluation material which posed a greater challenge for thealgorithms. The last two sections show recent developments on the ICDAR 2011 and 2013 datasets,respectively. Separate publications are denoted if available. The results can only be comparedwithin each dataset because, as stated, the evaluation material changed.
Participant F1 [%] MethodISI01-Rob 98.07 Thinned imageISI01-HA 98.11 Thinned image with adapted parametersINP02-SP [49] 97.17 Stable pathsINP02-SPTrim [49] 97.16 Trimmed stable pathsNUS03 97.46 Histogram of vertical run lengthNUG04-Fuji [88] 89.63 Deskewing and identification of long horizontal runsNUF04-LTr [68] 95.71 Removal of short vertical runs, connected subgraphsNUG04-Skel [68] 93.13 Graph with vertical and horizontal linksTAU-bin 83.0 Vertical scans and black RLE, based on [87]NUS-bin [197] 75.2 Vertical RLE histogramNUASi-bin-lin [68] 94.3 Skeleton of SL based on black vertical RLENUASi-bin-skel [68] 93.3 Segments of SLs based on split SL skeletonLRDE-bin [97, 98] 97.1 Mathematical morphological operatorsLRDE-gray [97, 98] 82.85 Mathematical morphological operatorsINESC-bin 91.0 SSL thickness and distance [48], stable paths [49]INEC-gray 42.09 Highlight SL with a sigmoid function, INESC-binBaseline [78] 90.9 Analysis of neighboring components
2D-FT [2] 98.4 2D-Fourier transform, low-pass filter, binarizationLAG-SL-bin [28] 97.4 Extension of stable paths [49]OLA [147] 97.0 Operator learning approachOLA-CNN [1] 98.0 Operator learning approach with CNNNN-bin [37] 92.1 Nearest NeighborsSVM-bin [37] 95.0 Support Vector MachineRaF-bin [37] 94.6 Random forestsStaffNet-bin [42] 97.9 CNNStaffNet-gray [42] 98.9 CNNGANS-bin [129] 99.3 Generative Adversarial NetworksGANS-gray [129] 99.1 Generative Adversarial Networks
24

3.3 Music Symbol Detection
which showed robust results on the ICDAR 2013 dataset. On average, their algorithm achieved anF1-score of 97.0% which ranks already with the best algorithms of the ICDAR 2013 challenge.Aguilar and Hirata [1] coupled image operator learning with CNN-classification which yielded anscore of 98.0% and clearly outperformed any existing method. In [37], several supervised methodsfor classifying pixels were examined: k-Nearest-Neighborss (kNNs), SVMs, and Random Forestsshowed scores of 92.1%, 95.0%, and 94.6% on binary images, respectively. These learning meth-ods resulted in poorer performances compared to the approach of [98] which used morphologicaltransformations. The StaffNet of Calvo-Zaragoza et al. [42] classified the center of small imagepatches into the classes staff or symbol using a CNN and achieved a global average F1 of 97.9%or 98.9% if either a binary or gray input was used. This shows, that in contrast to the earlier hand-crafted features, machine learning approaches are clearly superior when using grayscale material.Konwer et al. [129] proposed GANs (see e.g., [93]) that had shown a remarkable performance inseveral image processing tasks [117, 133, 139]. This approach uses two competing networks: theGenerator network which is based on a U-Net [187] aims to produce images with removed stafflines that shall fool the Discriminator. The Discriminator then again tries do identify if an input im-age is a generated image or part of the GT. This constant interaction results in a Generator networkthat is capable of removing staff lines. The results of this approach were far superior to any othermethods so far. On binary and gray level images, the GAN yielded the current state-of-the-art withan F1-score 99.3% and 99.1%, respectively.The typical errors of any staff line removal approach occur mainly at symbols that share similar-
ities with staff lines, or that lie on or intersect a staff line. Music symbols that contain more or lesshorizontal parts are dynamic signs such as crescendo or decrescendo, slurs, accidentals, or beams.To distinguish between staff lines and symbols, context is highly relevant, especially if beams arewithin a staff. Neuronal networks possess the capability to learn what context is required for anoptimal removal which is why these approaches are superior and now the state-of-the-art.
3.2.2 ConclusionTable 3.4 shows that traditional approaches for staff line detection work well on modern printedmaterial, however fail on Medieval manuscripts. On different material of the same epoch and no-tation, Ramirez and Ohya [171] reached a staff detection of 95%, which however does not includethe detection of accurate individual staff lines. On the identical material, the method of this thesis(see Section A.2) using FCNs achieves an F1-score above 99% clearly outperforming the meth-ods of Miyao [144], Dalitz [68], and Cardoso [49] (see Table 3.4). In the proposed workflow ofOMMR4all, a separate staff line removal is not required because the symbol detection algorithmsdirectly act on the original manuscripts.
3.3 Music Symbol DetectionThis thesis accumulates two publications that deal with the automatic detection of music sym-bols in neume notations. The first publication “Staff, Symbol and Melody Detection of MedievalManuscripts Written in Square Notation Using Deep Fully Convolutional Networks” (see SectionA.2, [224]) was published in the journal Applied Sciences in 2019. A combination of an FCN
25

3 Related Work with Regard to the Contributions
and a CC analysis extracted the written NCs of each individual staff. To evaluate the method, thedataset introduced for the staff line detection comprising 49 pages (see Section 3.2) was extendedby manually annotating over 16,000 symbols. A dSAR of about 87% was obtained.The paper “Automatic Square Notation Transcription of Medieval Music Manuscripts using
CNN/LSTM-networks and the segmentation-free CTC-Algorithm” (submitted to the Journal ofNew Music Research in 2020, see Section A.3, [221]) was the second publication dealing with thedetection of music symbols. Compared to the previous approach using FCNs presented in Sec-tion A.2, hybrid CNN/LSTM-networks were introduced to transcribe square notation. The greatadvantage of this approach is that it works segmentation-free, that is, only the complete sequencemust be annotated but not the actual positions of the symbols. This clearly simplifies the GT pro-duction. Calamari which was originally designed for ATR (see Section A.5) was adopted for thistask.On the same dataset as in the previous paper [224], the new approach achieved a similar dSAR
as the FCN approach (about 89%). Note that during the writing of this paper, the FCN approachwas further developed which resulted in slightly improved results when the experiments were re-produced. Furthermore, a neume dictionary (similar to words) was created and used for decoding.An improvement of about 5% was obtained when measuring the NAR which, similar to the WARin ATR, measures the amount of completely correct neumes.
3.3.1 Related Work
A summary of different current OMR approaches in the literature to recognize printed or handwrit-ten music of various epochs is listed in Table 3.6 with a focus on monophonic scores. The column“Training and evaluation corpus” denotes the used data for training the methods and for evaluat-ing. It is striking, that in contrast to publications targeting historical manuscripts, those dealingwith contemporary music prints used larger corpora for training. The “properties of the corpus”provide more information about its content. Then, the used “methods” are described, whereby thecolumn “input” states the input of the respective algorithm, and “output” defines the produced datawhich was taken for evaluation. For each evaluation, the “metrics” is denoted which varies amongthe different publications which is why Table 3.6 aims to normalize the metrics in a comparableform. The table shows, that the recognition of monophonic music of printed notes of clean scansyielded very good recognition rates up to 99%, whereas the recognition of historical manuscriptswritten in mensural notation (16th-18th century) showed maximum values of around 60%, and ofthose written in square notation (14th century) yielded around 80% (estimated).The focus of this thesis lies on monophonic music, where the music forms a temporal sequence
and hence it is sufficient to only detect one symbol at a point in time. The following sections listpublications related to OMR on monophonic music detection and to music detection on historicaldocuments in general. With the recent overwhelming success of deep learning, CNNs acting onraw input data instead of preprocessed images (e.g., staff line removal) became very popular andyielded state-of-the-art performances. Since OMR is basically a sequence to sequence task, alsorecurrent networks, such as LSTMs, are promising to use.
26

3.3 Music Symbol Detection
Table3
.6:O
verview
ofdifferentreports
onrecognition
ofmusicsymbols.Seethetextforafurtherdescription.
Author
Training
andevaluation
corpus
Epoch
Propertieso
fthe
Corpus
Input
Output
Method
Evaluation
metrics
Result
Printed
vand
erWelet
al.[207]
17,000
MusicX
MLdocuments
oftheM
useScoreSheetM
usic
Archive
[202]
21stCent.
monophonic,user
generated
,renderednotes
Pictureofa
staff
Musicsymbolheight
CNN/LSTM
(Encoder-
Decoder)
≈1−mean
edit-distance
≈F1
79%
Musicsymboltype
92%
Musicsymbol
77%
Baró-M
as[21]
50,000
scoreswithvarying
typography,correspondsto
incip
tsoftheR
ISMdataset[125]
21stCent.
monophonic,
rendered
Pictureofa
staff
Musicsymbolheight
CNN/LSTM
1−mean
edit-distance
≈F1
98.5%
Musicsymboltype
98.5%
Musicsymbol
97.2%
Calvo-Zaragoza
andRizo[36]
87,789
incip
tsofrealmusic
takenfromtheP
rIMusdataset
20thCent.
monophonic
renderedscores
Pictureofa
staff
Musicsymbol
CNN/LSTM
with
CTC-Loss
1−mean
edit-distance
≈F1
99%
Vigliensoniet
al.[208]
20pagesoftheLiberU
sualis
[51]
20thCent.
monophonicprint
ofsquarenotation
Scanofa
page
Pitch
Various
ProbablyRecall
(FPnotdenoted)
95%
Handwritten
Pachaet
al.[158]
140pagesoftheMUS
ICMA+
+dataset[103]
21stCent.
handwritten,
CWMN,
polyphone,no
artifacts
Scanofa
page
Musicsymbol
FCN
Precision
=TP
TP+FP,
Recallnotstated
>80%
Baróetal.[20]
20pagesofthe
CVC-MUS
ICMAdataset
21stCent.
handwritten,
CWMN,
monophonic
Pictureofa
staff
Musicsymbolheight
CNN/LSTM
1−mean
edit-distance
≈F1
53%
Musicsymboltype
61%
Musicsymbol
46%
Calvo-Zaragoza
etal.[38]
Book
containing9
0pagesofthe
Captain
Archives
16th-18th
Cent.
white
mensural
notation
Pictureofa
staff
Note
HMMwith
n-grams
1−mean
edit-distance
≈F1
59%
Calvo-Zaragoza
etal.[40]
576stavesoftheMissaofthe
CathedralofZ
aragoza(Spain)
17thCent.
mensuralnotation
Pictureofa
staff
Noteposition
HMMwith
n-grams
1−mean
edit-distance
≈F1
70%
Notetype
64%
Note
59%
Ramirezet
al.[171]
136scansoftheDigital
Scriptorium[115]
14thCent.
squarenotation
Pictureofa
staff
Neum
eexistence
Pattern-matching
Recall
=TP
TP+FN
88%
Neum
etype
SVN
Recalland
Precision
>92%
Neum
eCombination
Recall
81%?
(not
stated
)
27

3 Related Work with Regard to the Contributions
3.3.1.1 OMR on Contemporary Notation
Baró-Mas et al. [21] used (bidirectional) LSTM networks to predict the pitch and rhythm of notesand other musical symbols, for example rests and clefs, in images, each containing a single staffof monophonic music. The output of the network consists of two sequences: the first one predictsthe pitch of notes or the type of other symbols like clefs (54 classes in total) while the secondone indicates the rhythm of notes or a no note label (26 classes). For training the network, theyimplemented two different loss functions that considered both target sequences. One computedthe weighted Euclidean loss, the other implemented a multi-label soft margin loss. To evaluatetheir algorithm, two different datasets were used which both consisted of monophonic music inmodern notation, however one was printed and one handwritten. Experiments on the first datasetwhich comprised incipts from the RISM dataset [125] yielded a symbol/pitch error rate of 1.5%and a rhythm error rate of 2.0%. The total error for both properties to be correct was 2.8%. Assecond dataset, they used one page of the CVC-MUSICMA dataset [85]. After manually labelingsix staves, they extended the number of different staves by varying the order of bars within a singlestaff. During training, data augmentation was used and all lines from the printed RISM datasetwere added. The error of the symbol/pitch and rhythm detection was 47% and 43%, respectively,yielding a total error rate of 65%.A similar attempt to learn music recognition onmodernmonophonic printedmusic was proposed
by van der Wel and Ullrich [207]. However, compared to Baró-Mas et al. [21], they used prelim-inary CNN layers and an encoder/decoder structure for their neural network. The CNN/LSTM-based encoder mapped a line image into one fixed-size state representation by processing the linesequentially. The decoder consecutively decoded this state and predicted a sequence of pitches,duration, and finally a stop mark. This overall procedure was based on and was very similar tothe sequence to sequence task used for machine translation [198]. In total, there were 108 pitchand 48 duration categories in their dataset which was compiled from MusicXML [92] scores fromthe MuseScore Sheet Music Archive [202]. In contrast to the normalized edit distance, a ratherstrict metric was used that could not handle insertions or deletions. They aligned the prediction andGT sequence label by label and counted the number of correct predictions. Thus, if a label wasdeleted or inserted, all subsequent notes were usually false. Their final model which was trainedwith data augmentation, yielded a pitch and duration accuracy of 81%, and 94%, respectively. Thetotal accuracy of notes was 80%.Another very promising attempt to predict monophonic music was made by Calvo-Zaragoza and
Rizo [36]. They used CNN/LSTM hybrids combined with a CTC-loss-function [96] as modelarchitecture, a technique that already succeeded in handwritten and printed OCR [24, 223], orspeech recognition [193, 232], which are both sequence-to-sequence tasks. The advantage of thisloss function is that it does not require position-accurate labeling in the GT. Solely the targetsequence and input data is obligatory out of which the network automatically learns the alignment.The drawback of this method is that each combination of pitch and rhythm semantically requires adistinct label. Moreover, a key-signature can, for instance, either be a single symbol or be dissolvedin individual accidentals. The first so-called semantic representation required 1,781 classes in total,while the second agnostic representation only used 758 classes. To perform experiments theycreated the so-called Printed Images of Music Staves (PrIMuS) dataset containing 87,678 real-music incipts which were rendered by Verovio [170], a web-based music engraver. The evaluation
28

3.3 Music Symbol Detection
yielded a sequence error rate of 17.9% and 12.5% in the agnostic and semantic representation,respectively, which was explainable by the higher number of classes. However, the individualsymbol error rate was approximately 1% in both representations.A similar approach was applied by Baró et al. [20] who proposed a network architecture based on
CNNs and LSTMs to obtain the rhythms and pitches in two separate output layers. In comparisonto Calvo-Zaragoza and Rizo [36] the GT was accurately segmented by providing the exact startand end of a music symbol. To train the network, an L1-loss function measured if the networkyielded the correct prediction at a certain pixel position. 20 pages of the CVC-MUSCIMA dataset[85] were selected to manually create the required GT. Using various network architectures, dataaugmentation, and transfer learning, the lowest achieved error of the pitch and rhythm detectionwas 38.7% and 47.6%, respectively, and a total error of 54.5%.Compared to the previous described work, handwritten music recognition can also be regarded
as an object detection task. An approach that follows this idea was proposed by Pacha et al. [158].Their pipeline used existing state-of-the-art DNNs for object detection, such as Faster R-CNN[177] or R-FCN [66], with custom preprocessing and training. A cropped image of a single staffwithout staff line removal served as input. They evaluated on the MUSCIMA++ dataset [103]which contains over 90,000 symbol annotations of handwritten music distributed in 71 classes.The object detection achieved a mean average precision of over 80%.
3.3.1.2 OMR on Historical Notations
In the area of historical OMR, Calvo-Zaragoza et al. [38, 40] applied HMMs and an n-gram lan-guage model on line images written in mensural notation of the 17th century. This notation iscomparable to modern notation since it is already ruled by very similar symbols. Their handwrit-ten corpus was comprised of 576 staves with 13,863 individual symbols representing, for instance,notes, rests, or clefs. In total there were 16 different symbol shapes which were located on discretelocations relative to the staff lines. Combination of the position and shape yielded around 200 dif-ferent classes. As metrics they measured the glyph error rate (GER, symbol shape only) and heighterror rate (HER, position relative to the staff lines) separately, but also computed the combinedsymbol error rate (SER, shape and position). Their best model reached a GER of 35.2%, a HERof 28.2%, and a SER of 40.4%.Ramirez and Ohya [171] did notable work on the automatic recognition of square notation on
scans of manuscripts which is also the focus of this thesis. They built a dataset based on 136 pagesfrom the Digital Scriptorium repository (see e.g., [82, 115]) comprising 847 staves and over 5,000neumes. A great challenge were the grayscale images of the 14th century which suffer from physi-cal degradation, variability in notation styles, or non-standardized scan conditions. Their first taskdetected and extracted staves. Thereto, they used a brute-force algorithm that matched the originalimage with a staff template built up from four straight staff lines by varying line and staff dis-tance, and orientation. The found optima indicated locations for staves, which were then extracted.The advantage of this method is that there is no need to detect individual staff lines, however thehandwritten staff lines require to be equally distant and almost straight. In total, 802 of all 847staves were correctly detected (95% recall). In a second task, they performed a symbol detectionand classification algorithm. A pattern matching algorithm fed with several different templates foreach neume first marked possible symbol locations and found approximately 88% of all symbols.
29

3 Related Work with Regard to the Contributions
Then, a SVM classified the symbols into different neume types with an accuracy no lower than 92%across all classes. Compared to the approaches of this thesis, they did not resolve the individualneumes into single NCs nor detect clefs or compute pitches, but likewise, accidentals were ignoredor did not occur.Vigliensoni et al. [208] focused on the pitch detection of square notation documents of the Liber
Usualis [51] printed in 1961. Using the staff line detection of Miyao [144], the staff line removalof Roach and Tatem (see e.g., [68]), and an automatic neume classification algorithm trained on40 pages, they evaluated the pitch detection on 20 pages consisting of 2,219 neumes and 3,114pitches. The pitch of the first component of a neume was correctly detected for 97% of all neumes,while only 95% of all note components including single-tone neumes were found.In [43], Calvo-Zaragoza et al. proposed an approach known from historical document analysis
[219] in the area ofOMR. A deepCNNwas trained to segment scans of twomanuscripts of the 14thand 16th century pixel-wise by assigning each pixel a class selected from background, text, staff line,or symbol. Approximately 80% of the pixels were background, 10% were text, 6% were staff linesand 4% were symbols. The results showed that especially at the margin of changing label types,the classification was incorrect, which however should only have a minor impact on proceedingsteps according to the authors. Furthermore, only a small number of GT instances, ten in thiscase, had to be manually created to obtain the stated results. The evaluation measured the correctlabel of pixels located particularly at the edge of different symbols and yielded an average F1-scoreof around 90%. In general, this algorithm predicting a pixel-wise segmentation only solved onestep in an OMR pipeline. But the segmentation can be used as input for various classifiers whichare for instance trained to extract staff lines, staves, symbols, or text, to finally output the musicalinformation.
3.3.2 ConclusionThe automatic transcription of neume notations is a virtually unexplored area of research. OnMedieval manuscripts written in square notation, Ramirez and Ohya [171] detected 88% of allsymbols and correctly identified the neume type with no lower than 92% of all classes. As alreadystated in Section 2, a direct comparison to the performance of symbol detection of this thesis is notpossible. The presented estimation however implies that the obtained NAR of 83.5% (see SectionA.3 or [221]) is an improvement to Ramirez and Ohya.
3.3.3 Future WorkFirst, the application of novel and popular trends in machine learning should be tested. Recentdevelopments of handwritten music recognition in CWMN suggest a two stage approach whichfirst detects primitive music symbols (e.g., stems, bars, or notes, see [159]) and then decides aboutthe semantic connection of each element,also called music graph construction (see e.g., [160]).Applied to neume notations, first, the primitive elements clefs, accidentals, and note heads in variousshapes are located by a network designed for object detection in general. A second network thendecides on the semantic of the symbols by classifying each pair of elements which allows to extractthe NCs that form neumes. The drawback of this method is that the GT production is extremelycumbersome because the surrounding Axis-Aligned Bounding Boxes (AABBs) for each primitive
30

3.4 Text and Lyrics Recognition
have to be manually annotated. Currently only the center point of an element is required to trainthe neural net for the symbol detection.Furthermore, a combination of both presented approaches is sensible since their errors are not
identical. A voting mechanism including the confidences of the predictions is promising.
3.4 Text and Lyrics Recognition“Calamari – A High-Performance Tensorflow-based Deep Learning Package for Optical Char-acter Recognition” (see Section A.5, [226]) was presented in a paper being published in DigitalHumanities Quarterly, 2020. Calamari is a novel software to tackle ATR by implementing deepCNN/LSTM-networks which processes a full text line in one step. It comprises several techniquesto achieve state-of-the-art results on both contemporary and historical prints. Beside differentDNN architectures, confidence voting of different predictions and finetuning with codec adaptionare supported.The paper “Comparison of OCR Accuracy on Early Printed Books using the Open Source En-
gines Calamari and OCRopus” (see Section A.4, [223]), published in the Special Issue on Auto-matic Text and Layout Recognition in the Journal for Language Technology and ComputationalLinguistics (JLCL), compared Calamari to the former state-of-the-art software OCRopus/OCRopy[23] for ATR on early printed books. The proposed deep CNN/LSTM-networks considerably out-performed OCRopy by up to 55% if both a few (60) and many (1,000) lines of GT were used.Furthermore, the training times were dropped by a factor of at least four and prediction times by afactor of more than six due to the usage of GPUs. The datasets consisted of three historical printedbooks of the years 1476, 1488, and 1505, each comprising more than 3,000 lines of GT in total.A more recent publication of Baierer et al. [10] compares the current versions of the ATR-enginesCalamari, OCRopy, Kraken, and Tesseract 4, however without quantitative results.Lastly, the paper “Lyrics Recognition and Syllable Assignment of Medieval Manuscripts” (see
Section 3.4, [222]) which is submitted to the 17th International Conference on Frontiers of Hand-writing Recognition 2020 applies Calamari on extracted lyrics lines using five different datasets.Depending on the dataset, the number of training lines, and an accurate or approximated line ex-traction, a CER of up to 6.7% was obtained. The paper also introduces a syllable assignmentalgorithm: first, each syllable is assigned to the closest neume based on the positional informationof an ATR. Then, possible conflicts are resolved by shifting syllables to the left or right. An evalu-ation of the syllable assignment yielded an F1-score of above 99% even if it has to rely on a flawedATR output with a CER exceeding 10%.
3.4.1 Related WorkThe major challenge of the character recognition of lyrics compared to common text is that syl-lables can be written separately with space between. Therefore, an ATR system that incorporateslanguagemodeling can not be directly applied since syllables must be combined to words first whichhowever is a non-trivial task due to absent or inconsistent hyphens (“-”). In particular, historicalmusic notations do not use hyphens to mark grouped words, yet. Instead of words, one could relyon syllable dictionaries for a language which are however more prone to error because fewer char-
31

3 Related Work with Regard to the Contributions
acters match. Also the hyphenation and spelling can vary between different, especially historic,documents. A further problem poses the frequent usage of abbreviations that can be inconsistentacross books. Therefore, the hyphenation is handled as a separate step.In the following, first, different open-source software systems for ATR are presented, then pub-
lications targeting the recognition of lyrics is described.
3.4.1.1 Open-Source Software for Automatic Text Recognition
This section provides a brief introduction to software systems for ATR. A thorough comparison ofthe open-source OCR programs OCRopy, Kraken, Tesseract 4, and also Calamari is provided inthe recent publication of Baierer et al. [10]. Actual evaluations and a complete comparison to therelevant OCR engines are provided in Sections A.4 and A.5.Currently, there exist several versions of OCRopy which was originally published by Breuel
(see e.g. [23, 27]). OCRopy was the first software that allowed a user to train custom LSTMbased models incorporating the CTC-Loss function [96]. By default, it uses slow NumPy-basedmodels[206] which can be exchanged by a faster C++-based implementation (clstm) [26], however,neither the GPU nor Deep CNN/LSTM models can be used. For training, OCRopy requires a listof images and their GT, and outputs a model which then can be used to predict the written text ofother text lines.Kraken [127, 128] was originally a fork of OCRopy, but has a different API and uses Py-
Torch as machine learning framework since version 2.0. The network configuration supports deepCNN/LSTM models trainable on the GPU and several settings to configure the network. WhileKraken was successfully trained on different scripts (e.g., Latin, Arabic, Fraktur), a comparativestudy on standard datasets is not available, yet.Tesseract (see e.g., [192]) was initially released as open-source in 2005 and is still under develop-
ment. The newest version of Tesseract (v4) added support for DNNs such as LSTM/CNN-Hybrids,however GPU support is not offered, yet. To prototype network structures, Tesseract proposes acustom Variable-size Graph Specification Language (VGSL) which is similar to the network pro-totype language of Calamari.While OCRopy is still maintained, OCRopy 2 [25] does not seem to be developed anymore,
probably due to the introduction of OCRopy 3 [24] which changed all major OCR components toDNNs using PyTorch [162]. OCRopy 3 supports variable network architectures including CNNsand LSTMs, but also allows training and applying the models on the GPU. The resulting modelsyield state-of-the-art results and can be trained with minimal expenditure of time.
3.4.1.2 Text Recognition on Music Documents
In 2004, Georges stated that “lyric recognition is often considered secondary to OMR”, however, it“cannot be isolated from the music, especially in the final representation stage” [90]. Unfortunately,Georges only “consider[ed] some solutions to the outstanding difficulties in lyrics recognition”. Stilltoday, ATR in OMR has been barely researched. There are a few works, that solely target theextraction of lyrics using traditional methods: Dalitz et al. [69] detected the base line of text usinga vertical projection and then defined all CCs touching that line as lyrics. Burgoyne et al. [30] firstreconstructed staff lines and then removed staffs to obtain the lyrics as remainder. Dinh et al. [71]
32

3.4 Text and Lyrics Recognition
also used reconstructed staves to first obtain possible region candidates for lyric regions and thenextract actual lines based on block division and run-lengths. Calvo-Zaragoza et al. [43] extracted atext layer of an image as part of their CNN-based approach that classifies each pixel into the classesbackground, symbol, staff line, and text.Several further works applied ATR to the extracted text, or transform the task to a text alignment
problem if the transcripts are already available: Hankinson et al. [109] included OCRopy and apretrained model in their workflow to handle the actual recognition of lyrics on the Liber Usualis[51]. Even with a post-ATR correction, the erroneous results were sobering and could thus onlyserve as a proof-of-concept. On Medieval manuscripts, a very recent work of de Reuse and Fu-jinaga [70] aimed to align existing transcripts, which are often available, to the result of an ATRsystem. To train OCRopy, two different datasets, one with 2,302 (Gothic), and one with 1,140words (Carolingian), comprising lyric lines and their transcripts were manually annotated. Theachieved CERs were 12,7% and 12,5% respectively. The predicted text which was expected tocontain errors was then aligned to the correct transcript of the texts using the Needleman-Wunschalgorithm [152]. Text that had no match in the prediction was dropped because it was likely that itbelongs to paratexts. Afterwards, the matching was split into syllables and their bounding box sizewas computed based on the positional information of the ATR output. A syllable was correctlymatched if the bounding box matched with the GT with an intersection over union (IU) of at least50%. The final accuracy ranged from 78.6% to 92.9% depending on the material.
3.4.2 ConclusionThe publications [223, 226] show that Calamari consistently and significantly outperformed Tesser-act, OCRopy, and OCRopy 3 for ATR on various datasets comprising historical and modern fonts.The reasons are the deeper neural networks, but also the additional techniques such as transfer-learning, data augmentation, and (confidence-)voting. The publication [222] shows that the tech-niques generalize on the HTR of lyrics that are clean and uniformly written. Furthermore, thesyllable assignment based on the positional output of the network for ATR yields very satisfactoryresults.
3.4.3 Future WorkAlthoughCalamari supportsmany features such as voting and transfer-learning, plans for extensionsexist. First, a more sophisticated, material-specific data augmentation during training should lead tosignificant drops in the CER especially if only a few lines of GT are present. Additionally, syntheticdata based on existing fonts can also be incorporated for data augmentation.Moreover, training of an even deeper network using many different books sharing similarities
in typeface is expected to result in more generic models that have very low error rates on a largevariety of fonts. Such models must be trained but can be shared to potential users to enable a robustdefault model which can then, if required, be trained on the actual material at hand.Voting showed to be a very efficient way to improve the accuracy of OCR. To further improve
the voting results, distinct voters are required which could be created by variations of the networkarchitecture. The voting mechanism itself could also be learned directly in one network consistingof several paths. Each individual path is trained optionally with a custom CTC-loss, however the
33

3 Related Work with Regard to the Contributions
probability maps are combined in an additional output layer, the voting. This main output layer isfed into a CTC-loss and is used for decoding. To enforce that each path learns differently similarto the implemented cross-fold-training a dropout-like filter enforces that an input line is only pre-sented simultaneously to a subset of paths. All paths could share all convolutional layers for featureextraction but have different weights in its LSTM and subsequent weight layers to enable a fasterand more stable training.Tesseract’s language to define network topologies (VGSL) has a very simple and compact syntax.
The current syntax of Calamari should also support this language to define networks. Furthermore,Calamari should provide additional layer types. Dilation in convolutional layers or its accompanyingdilated blocks increase the visual context while maintaining a small parameter size. The LSTMlayers could be replaced by Gated Recurrent Units (GRUs) which are an alternative recurrent layer.Batch normalization could help to reduce overfitting.A very important component of recurrent networks in the domain of language is attention which
basically multiplies the input vectors across time in the network with a weight matrix to filter andemphasize relevant information. First approaches were already published (e.g., [134] or [231]),inclusion in a framework, such as Calamari, are still pending.Calamari has proven to successfully learn typography (e.g., normal, bold, or italics) by predicting
typographic labels for each glyph instead of the actual character (see [180]). Alignment of this andthe OCR sequence produces a rich text output which is required if typography is used to encodesemantic information (e.g., in a dictionary). Instead of training two independent networks, it issensible and feasible for a faster training to use the same network for both tasks up to the last layerwhich produces two outputs, one for the typography, and one for the character sequence. Naturally,this requires two CTC-loss functions during training which must be added and weighted.Further plans tackle the application to handwritten text which is challenging due to the high
variances in writing style. OMMR4all will directly benefit from even small improvements in thisarea since the handwritings involved are very clean and more similar across books. Exploring thisfield also allows to target other alphabets such as ancient Greek, Hebrew, or Sanskrit.The incorporation of dictionaries or language models such as n-grams provides another elegant
way to improve the character recognition. In a first step, a word could be matched with a dictionary,a pursuing step could use a dictionary and a language model during the decoding of the sequence.The advantage would be that the probability of alternative characters is taken into account. A realimplementation could follow the ideas of a speech-to-text algorithm that uses language models anddictionaries to transcribe a phonetic sequence (the alphabet) into words. First steps in this directionare currently integrated into Calamari.
3.5 OMMR4allThe toolOMMR4all and its comprised workflow for OMR onMedieval manuscripts were presentedat the 2nd InternationalWorkshop onReadingMusic Systems in Delft, 2019, and also at the Germanconference “Digital Humanities im deutschsprachigen Raum” (DHd), 2020 (see Section A.7, [220,225]). In these publications, an evaluation is provided that shows that even at the current earlystage of OMMR4all it is faster to correct the output of the automatic tools of OMMR4all insteadof Monodi+ [79], an editor specifically designed for manually entering neume notations. On two
34
3.5 OMMR4all
books, one written in Gothic and one in square notation, a speedup of 1.3 and 1.2 was measured,respectively. The great benefit of OMMR4all is that its annotations yield positional informationabout the detected music symbols which can be used for quality assessments or, if commented, acritical apparatus.
3.5.1 Workflows and Projects for OMR on Historical MaterialWhile, up to now, several well-working proprietary and free OCR software is available (see e.g.,[9] for a recent comparison), only a few commercial OMR systems are present. Therefore, thereis a justified interest in research to develop end-to-end pipelines solving OMR targeting differentmaterial and applications. The following sections select a few notable attempts targetting OMR onhistorical material over the past 20 years.
3.5.1.1 The Levy II Project
Choudhury et al. [60–62] presented a workflow to capture the Lester S. Levy Collection of SheetMusic [205]. A binary image was first preprocessed by removing staff lines using vertical runs.In a next step, texts such as performance indications and lyrics were erased based on heuristics ofCCs and stored for later processing using OCR. Afterwards, other interfering components suchas stems or barlines were detected and removed using RLE and CCs (algorithm of [87]), and akNN-classifier identified the remaining symbols. The kNN-classifier had to be trained on humancorrected files and could thus be adapted to new styles. The relation of the detected symbols hadto be interpreted, temporally sorted, and grouped into staves. A postcorrection step detected andcorrected errors related to missing or additional beats in a bar. In a second pipeline, OCR wasapplied to the extracted text, which was not assigned to notes. The final output was the musicnotation and the text which could be used for music analysis such as searching.
3.5.1.2 The Gamera Framework
In [76, 77, 140], Droettboom et al. described the open-source and cross-platform framework Gam-era which was designed to build arbitrary document recognition systems. Gamera provides prede-fined algorithms for the various tasks of a workflow, such as preprocessing, layout analysis, symbolsegmentation and classification, and syntactical or structural analysis, which can be extended by aplugin system. A user that aims to process one or more files of the same material, must first tie to-gether different algorithms and adjust their parameters in order to get a satisfactory outcome. Thepattern matching engine which serves to detect known glyphs can be trained by providing new orunknown examples. In [141], MacMillan et al. specifically focused on the application of Gamerafor OMR which they named Gamut but without providing evaluations. Dalitz and Karsten [67]extended the framework to build a lute tabulature recognition system and Vigliensoni et al. [209]created a system for OMR on CWMN.
3.5.1.3 Aruspix
The open-source and cross-platform software Aruspix [166] was created to recognize early mu-sic prints (late 15th and early 16th century) which had been a challenge for traditional OMR ap-
35

3 Related Work with Regard to the Contributions
proaches [164]. It comprised preprocessing including deskewing and border removal, binarization,a layout analysis to identify and classify text, music, and ornate letters, and a music recognition al-gorithm based on HMMs [167, 168]. HMMs allowed to process a music region without staffremoval, and to predict the pitches in one step. In [169], Pugin et al. compared Aruspix to theGamrea framework using four books from the RISM dataset [181]. 40 pages were selected fortraining and 30 for testing. Their main results were: First, OMR yielded an F1-score of 93%for Aruspix and 80% for Gamera, and second, OMR on early music requires adaptive algorithmswhich have to be improved for material that is highly degraded. A reason for the clearly differentresults was that Aruspix was specifically designed for early music prints.
3.5.1.4 Allegro
A different approach for transcribing large masses of handwritten scores is crowd-sourcing. Forthis purpose, Burghardt and Spanner presented their web-based tool Allegro in [29]. Their aimis to transcribe a large corpus of 140,000 handwritten and monophonic German folk songs whichcan currently not be captured fully automatically by an OMR approach. Allegro provides a user-centered interface that allows even non-musicians to use the software for transcribing the providedmaterial. The transcription workflow starts with the segmentation of scores into single bars to allowfor a later alignment with the original score. Next, the user has to select the measure and the key ofthe score. Afterwards, a transcription editor is presented which enables an user to enter the notesfor each bar individually. Furthermore, it is possible to mark notes, or add a text comment for aneditorial review. The melody can be played which simplifies the detection of smaller transcriptionerrors. Finally, Allegro supports an automatic double-keying check before producing the finaloutput. Hereby, after each score was transcribed by two different users, possible differences mustbe resolved.
3.5.1.5 MuRET
Rizo et al. [119, 183] introduced aMusic Recognition, Encoding, and Transcription tool (MuRET)which focuses on the transcription of white mensural notation written in Spain during the 16th to18th century. MuRET provides state-of-the-art machine learning algorithms for OMR whose out-puts can be manually corrected. Several workflows comprising different manual or semi-automaticprocessing pipelines are allowed. First, symbols can be manually traced by depicting them with themouse or a pen. The resulting bounding-boxes are fed into different classifiers to obtain their typesand coordinates. The so-called holistic approach processes the image of a staff in an end-to-endapproach using HMMs [40] or Recurrent Neural Networks (RNNs) [35, 36] by directly producingthe output sequence in one step. This requires a staff segmentation in a preceding step. A thirdapproach uses neural nets that were originally designed for object detection (see e.g., [91, 136])and can processes a complete page [157, 158]. These networks however require a large amount ofGT in order to operate reliably. Rizo et al. proposed to use their proposed user driven approachrequiring only some GT data to produce training data for the more sophisticated approaches. Thisworkflow reduces the amount of human effort for GT-production in general.
36

3.5 OMMR4all
3.5.1.6 The NEUMES Project
Possibly the first project aiming to “design a software infrastructure for digital transcription ofmedieval chant manuscripts” [16], was the Neumed & Ekphonetic Universal Manuscript Encod-ing Standard (NEUMES) project [16, 17] of the University of Oxford starting in 2002. In [18],progress towards a distributed e-library was shown which also included the proposal of an encodingthat only stores the tonal movement instead of the actual glyph form which is similar to the devel-opments in the MEI 4.0 neume standard. Caldwell [34] discusses various classification problemsand the attempts towards a classification of Western chant notations. The most recent publicationof this project [19] described and discussed the problems and approaches of the web-delivery ofthe database. Publications targeting the actual tools for automatic OMR are unfortunately not listedat [17].
3.5.1.7 SIMSSA
The SIMSSA project [89, 106] “targets digitized music scores to design a global infrastructurefor searching and analyzing music scores”. It aims to both create and analyze musical contentwhich also includes early music notations. For the creation of content, novel recognition tech-nologies based on machine learning and computer vision are planned which are embedded into auser-friendly workflow accessible on a web-based interface. Data-mining plays an important roleto analyze music, which enables musicologists for example to search for pitches, rhythms, or lyrics,or to detect structures within and across music scores. The workflow is managed by Rodan [105]which provides a web interface for an adaptive workflow management system by integrating dif-ferent recognition systems and tasks that can be interactive or non-interactive. During the project,librarians and information scientists will review the developed tools for usability and utility from anon-technical view, which is important to provide a comfortable tool for musicians. All developedtools and frameworks will be open-source and accessible to anyone who wants to participate. Itcan be expected that the recent publication of de Reuse [70] will provide the interface for the lyricanalysis.Several projects and their workflows, are located in or related to SIMSSA. Three of them are
presented in the following due to their relevance related to this theses.
Workflow for Medieval and Renaissance Music In [210–213], Vigliensoni et al. pre-sented an OMR workflow embedded in the SIMSSA project which targets Medieval and Renais-sance music. The main stages are the analysis of the document, the reconstruction and encoding ofits music, and finally the generation and correction of the score. Their document analysis relies onpixel-wise labeling which is automatically generated by the CNN presented in [43] and can manu-ally be corrected by Pixel.js [190]. After a succeeding symbol classification based on the resultinglayers, the music can be reconstructed by finding the pitch of neumes and the music is saved asMEI. Finally, a superimposition of the original image and the OMR are shown in the web-basedoverlay editor Neon2 [176], a successor of Neon.js [32], which allows for a manual postcorrec-tion. Verovio [170] is included to directly manipulate, validate, and render the MEI content in thebrowser. Neon2 supports the editing and rendering of various glyphs of the square notations: Cand F clefs, single tone neumes such as punctums, virgas and inclinatums, but also grouped neumes
37

3 Related Work with Regard to the Contributions
such as pes, clivis, torculus. Furthermore, staves can be merged and various MEI elements can behighlighted to facilitate the correction process. Neon2 expects straight staff lines with a fixed linedistance for each staff, which is however rarely the case in actual manuscripts.A focus lies on the integration of the user into the workflow. At any stage, a human annotator
can interfere in order to correct the automatic processing of a page. These correction are used totrain and improve the machine learning algorithms iteratively.
Workflow for the Liber Usualis Hankinson et al. [109] proposed a workflow to recognizethe musical content of the Liber Usualis [51] which is a “liturgical service book produced by theRoman Catholic church and an important source for Gregorian chant. It uses square-note neumenotation derived from the earlier Franconian style but modernized by the monks at Solesmes,France in the late 19th Century” [109]. The proposed semi-supervised workflow started with alayout analysis of the printed page image. Afterwards, the square notation was recognized usingthe algorithm of [208] which adapts Gamera [77]: Staff lines were detected and removed by us-ing provided deterministic algorithms. To train the glyph classifier to detect neumes, GT basedon 40 pages was manually created. To find the pitches of the neumes and its individual NCs, analgorithm based on a horizontal projection and a center of mass computation was developed. Thelyrics were processed by the OCR engine OCRopy [23]. The final output was encoded in MEIand presented in an open-source viewer called Diva.js [107, 110] which provides an interface forindexing, searching, and retrieval of the encoded Liber Usualis pages.
Optical Neume Recognition Project The Optical Neume Recognition Project (see e.g.,[11, 12, 114]) which started in 2012 and ended in 2014 aimed to develop a tool to investigate earlystaff-less neume notations. This notation is a predecessor to the square notation and only uses signsto depict the motion of the melody without any information about an actual discrete pitch. “Theinformation gathered from this project can be used to speed up the time it takes researchers tocompare old and new notations, isolate differences in chant melodies, and compare adiastematic(unheightened) neumes to early staff notation.” [11]. The project planned to use OMR techniquesto identify those neumes based on their unique shapes in scanned images and translate the encodedmelody direction into a machine readable form, however, no results can be found in their listedpublications. Even though, some progress was made towards availability of GT the web-basedneume-recognition was still under development according to [114].
3.5.2 Comparison to the SIMSSA WorkflowThis section compares the proposed OMRworkflow to the SIMSSA workflow presented in Section3.5.1.7. Figure 3.1 shows the SIMSSA workflow for OMR of Medieval and Renaissance musicpresented in [212]. Both OMMR4all and SIMSSA enable a human interaction at almost any stageof the workflow which is required due to the challenging targeted material. The first stage ofboth workflows is basically a document analysis which tries to identify the various regions. WhileOMMR4all applies subsequent algorithms for staff line, stave, and layout analysis, the documentanalysis step of SIMSSA is one output which produces several layers of content corresponding tostaff line, text, lyrics, or music symbol. The splitting is performed by a CNN (see [43]) which
38

3.5 OMMR4all
Figure 3.1: The SIMSSA workflow for OMR of Medieval and Renaissance music (adopted from[212]).
outputs several probability maps corresponding to each layer type. In principal, the classificationoutput is a color image where the color of each pixel corresponds to a type, for example white isbackground, while black, blue, and red represent notes, staff lines, and text, respectively. This colorimage can be manually corrected by Pixel.js [190] in the browser similar to a standard paintingprogram. A second step must then be performed to extract staff lines or symbols based on theisolated components stored in their respective layers.A fundamental advantage of a single algorithm that performs the layout analysis is that only one
network must be trained or adapted if new material is targeted. The drawback is, that specializedalgorithms for each step usually yield better results. Furthermore, a pixel-wise correction whichis mandatory for GT production is very cumbersome. However, the authors of SIMSSA “assumethat perfect performance cannot be achieved because, at pixel-level, even for humans it is hard todiscriminate to what layer a pixel belongs” [210, 211]. OMMR4all has the advantage that pixel-accurate annotations are optional for any algorithm, instead, either the full image or a section ofthe original (grayscale) input is presented to the algorithm. Each algorithm must individually learnwhich pixels are important and which ones can be ignored, leading to optimized algorithms andusually higher performances for a specific task. In particular, the CNN of SIMSSA tries to separatestaff lines and notes which is basically a staff line removal algorithm. Newer research however tendsto algorithms that detect symbols with kept staff lines.The next important step of both workflows is the symbol detection and classification. The advan-
tage of SIMSSA is that the algorithm receives a preprocessed image on which potentially disturbingelements such as staff lines, text, and of course noise are erased. OMMR4all instead uses a croppedbut unprocessed staff for the symbol detector and classifier which is a combination of an FCN anda subsequent CC analysis. SIMSSA chooses a different approach by using a web-based version ofGamera [77] (see Section 3.5.1.2) as interactive classifier. Gamera classifies grouped CCs based ona trainable kNN algorithm. OMMR4all and SIMSSA provide two completely different approachesto obtain a set of musical symbols and their type, a comparison of the performance is unfortunatelynot available. Another difference lies in the accurate interpretation of neumes. While SIMSSAallows to specify the exact types of neumes such as pes or climacus, OMMR4all only stores infor-mation about the graphical connection. This information might be relevant in some cases, however,for the transcription of the sung melody the approach of OMMR4all is sufficient and more efficientsince neume names can be ambiguous and tedious to correct. The “Neumify”-tool of Neon [32]can automatically generate proposals for neume names based on the transcription equivalents.
39

3 Related Work with Regard to the Contributions
While, up to now, the workflow of SIMSSA does not provide a solution for the text recognitionand syllable assignment, OMMR4all currently supports training and recognition of lyric lines usingATR models provided by Calamari, and an automatic syllable assignment algorithm. Furthermore,if the lyrics are already transcribed, they can be pasted into a page.The correction of the musical output in SIMSSA is performed by Neon2 [176] which, similar
to the editor of OMMR4all, provides an overlay of the image of the manuscript and the renderedcontent. Since Neon2 directly relies on MEI as internal data format, it can straightforwardly in-clude Verovio [170] to generate an Support Vector Graphics (SVG) which is rendered. OMMR4allprovides a custom rendering engine which also produces an SVG rendered by the browser. Thisis required due to the different music symbol data structure, and also allows to present additionalinformation to the user, such as the reading order. The major drawback of Neon2 is that it onlyrenders straight staff lines that only very roughly approximate the actual data. Often the handwrit-ten lines are wavy or bent which leads to drawings that can only hardly be interpreted. Especiallyif the rendering has an offset with almost one complete staff line, a quick visual inspection to spoterrors is impossible. The authors of Neon2 are aware of this major drawback and plan to revisethis [176]. However, such a fundamental change requires a lot of effort if not considered initially.Other differences lie in the interaction with the correction tool. Neon2 separates the selection andinsertion of symbols in two sections, OMMR4all unifies this in one tool. This leads to less clickswhen correcting the content of a music line involving insertions, deletions, or shifts due to wrongpositions. While Neon2 allows to scroll through the pages of a book which enables simultaneousediting, while OMMR4all always displays only one page. If most of the content is correct, thismight lead to slightly faster but, compared to the annotation process itself, negligible correctiontimes. Neon2 directly uses MEI as standard data format instead of OMMR4all which generates acustom one that can be exported to MEI. In general, it is always reasonable to use existing formatsthat are expected to be future-proof. However, a custom format is almost essential for an editorthat offers a lot of functionality and therefore requires to store additional information that can bedropped when exporting. Moreover, if the format is perfectly suited for an editor, the actual im-plementation of several correction tools such as type changes is fundamentally easier and thus lesserror-prone.
3.5.3 ConclusionIn conclusion, the overlay editor of OMMR4all is a serious competitor of Neon2 regarding ease ofuse and features. Even though both editors provide an overlay of the transcription and the originalscan to spot errors, glancing is simplified in the overlay editor of OMMR4all due to the accurateoverlay of staff lines and neumes. OMMR4all does not allow to provide information of neume nameswhich are, however, in most cases irrelevant or can be reconstructed. The fundamental workflowsofOMMR4all and SIMSSA are equivalent, however in detail, the workflow ofOMMR4all comprisesmore divided steps especially for the layout analysis. OMMR4all provides steps and algorithms fortext recognition and syllable assignment which also manifests in editor support for correction andinsertion.Furthermore, first quantitative evaluations of OMMR4all showed that working with the semi-
automatic workflow is faster than using the highly specialized software Monodi+. The speedup isexpected to significantly increase if the automatic tools become further developed and thus more
40

3.5 OMMR4all
accurate. Naturally, a transcription with OMMR4all yields additional relevant information such asaccurate symbol positions.
3.5.4 Future WorkDespite the many features of the OMMR4all framework there are many possible improvements orextensions. Some pending tasks will be presented in this section.A primary plan aims to extend OMMR4all to support further monophonic notation styles such
as the later mensural notations or even older neume notations up to notations without staff lines.Hereby, the overlay editor requires several cosmetic changes while new algorithms must be inte-grated or developed.Motivation of users is a crucial step for an efficient work, especially if external assistance is
required. This problem is similar to crowdsourcing approaches which recommend gamification(see e.g., [148]). Since nearly all crowdsourcing system use scores, a first step is to display theprogress of a book which values the users work. Further steps could include competitive aspectssuch as a leaderboard listing the user with the most transcripts, the best transcriptions per day, orthe least time per page. However, it is most important to inhibit sloppiness to secure an error-freetranscription.To improve the quality of the encodedmusic, a transcription using double-keying process may be
implemented. This requires that two independent users process and correct the same book, whichresults in two possible different version of the same manuscript. Highlighting differences to anexpert could either erase errors or directly create editorial notes if the content is indeed ambiguous.Naturally, the process requires more time, however with the great benefits of high-quality data andthe (automatic) generation of a critical apparatus.A pending feature is a communication with Monodi+ which provides a list of known books and
their metadata. This list is presented to the user to enforce a valid link to Monodi+ for exportingencoded music. Moreover, Monodi+ can request the progress in OMMR4all to enable a view forthe full progress of a book or project.Furthermore, a IIIF3 client as already supported by Neon2 would allow OMMR4all to connect to
existing image data bases which simplifies the acquisition of new data. The IIIF specification allowsto request image information and an already formatted image via the URL. Several parameters ofthe request affect the region that is cut out of the original image: size and angle allows to obtaina scaled and rotated image, the quality level allows to receive a grayscale or binary version ofthe image. With this syntax it is possible to easily load low-resolution images if only a limitedbandwidth is available and successively fetch images with a higher quality.Common music editors allow for playing the typed music which facilitates to detect errors in a
melody. This feature should also be part of OMMR4all. By computing a MIDI representation ofthe notation, it is possible to play the music using existing frameworks directly in the web interface.For simplicity, in a first step, the music is played with one beat per note, which can however beextended in a more sophisticated way by playing connected neumes faster to produce a more naturalsound. Naturally, a synthesized sound is created for each pitch that ignores the lyrics. Synthesizedchant is a current area of research, the commercial software Vocaloid [126] is one of the first that3https://iiif.io/
41

3 Related Work with Regard to the Contributions
provides an approach. Furthermore, the createdMIDI sequence can be exported which will supportanother common music representation format.Another viable feature that facilitates the error detection is a preview in CWMN. Because the
music can already be exported to MEI, it is sensible to include Verovio [170] which produces anSVG. This graphic format can be rendered directly by the browser in a separate area. In particular,outliers or wrong clefs that cause abnormal intervals can be easily spotted in a clean drawing.Another project should push the building up of a database that collects all encoded content:
music and lyrics. This allows for an implementation for search engines that detect known melodiesor particularly recurring lyrics to improve the recognition results of OMR or OCR.
42
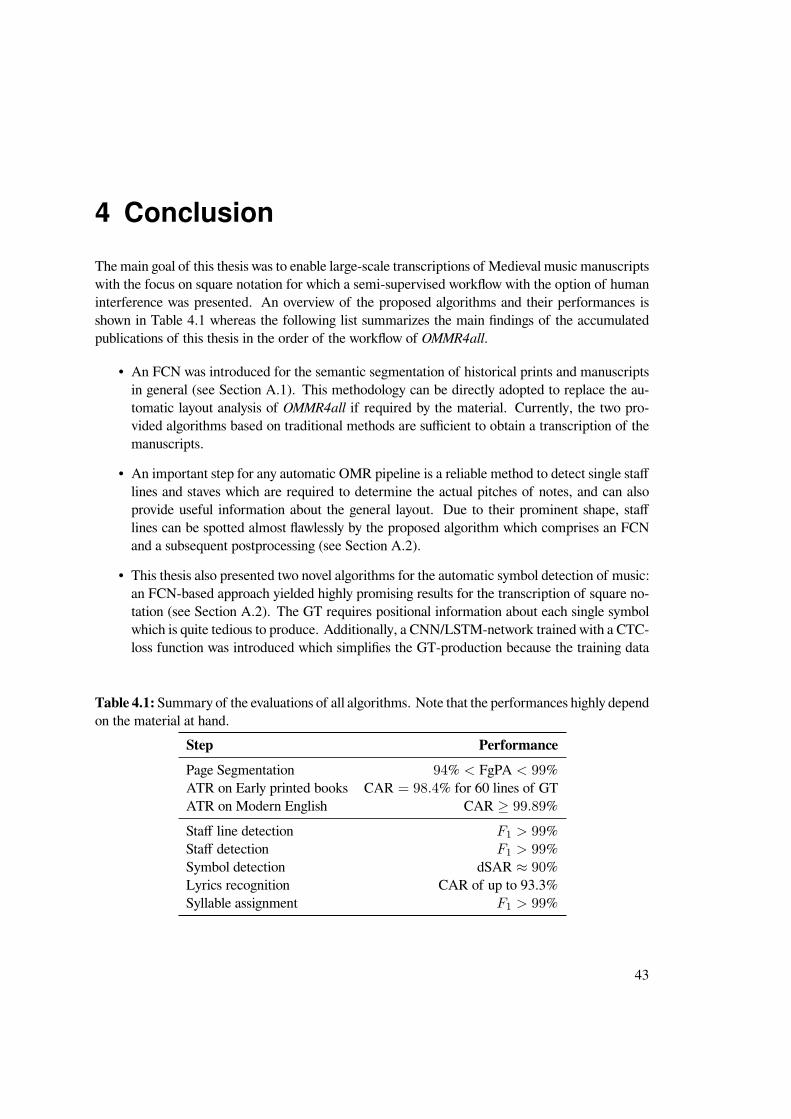
4 ConclusionThe main goal of this thesis was to enable large-scale transcriptions of Medieval music manuscriptswith the focus on square notation for which a semi-supervised workflow with the option of humaninterference was presented. An overview of the proposed algorithms and their performances isshown in Table 4.1 whereas the following list summarizes the main findings of the accumulatedpublications of this thesis in the order of the workflow of OMMR4all.
• An FCN was introduced for the semantic segmentation of historical prints and manuscriptsin general (see Section A.1). This methodology can be directly adopted to replace the au-tomatic layout analysis of OMMR4all if required by the material. Currently, the two pro-vided algorithms based on traditional methods are sufficient to obtain a transcription of themanuscripts.
• An important step for any automatic OMR pipeline is a reliable method to detect single stafflines and staves which are required to determine the actual pitches of notes, and can alsoprovide useful information about the general layout. Due to their prominent shape, stafflines can be spotted almost flawlessly by the proposed algorithm which comprises an FCNand a subsequent postprocessing (see Section A.2).
• This thesis also presented two novel algorithms for the automatic symbol detection of music:an FCN-based approach yielded highly promising results for the transcription of square no-tation (see Section A.2). The GT requires positional information about each single symbolwhich is quite tedious to produce. Additionally, a CNN/LSTM-network trained with a CTC-loss function was introduced which simplifies the GT-production because the training data
Table 4.1: Summary of the evaluations of all algorithms. Note that the performances highly dependon the material at hand.
Step PerformancePage Segmentation 94% < FgPA < 99%ATR on Early printed books CAR = 98.4% for 60 lines of GTATR on Modern English CAR ≥ 99.89%Staff line detection F1 > 99%Staff detection F1 > 99%Symbol detection dSAR ≈ 90%Lyrics recognition CAR of up to 93.3%Syllable assignment F1 > 99%
43

4 Conclusion
is a segmentation-free sequence of symbols (see Section A.3). The main problems of bothalgorithms are caused by the semantic interpretations of detected NCs, that means whether aNC is the start of a neume, or whether it is graphically or logically connected to the previousone. Since this step yields the lowest performance with an dSAR of about 90%, the focus forfuture developments is on developing new methods or extending existing methods tacklingthe symbol detection.
• Calamari (see Section A.4 and A.5) represents a competitive engine for ATR on early printedbooks but also for more modern fonts in general. The clean interfaces and supported formatsallow for an easy integration into existing OCR workflows, for example, it is already utilizedin OCR4all [179], a similar tool to OMMR4all designed to transcribe early printed books.The purpose of Calamari within the workflow of OMMR4all is to automatically transcribethe handwritten lyrics. As they are usually written very cleanly, the degree of difficulty ofthe ATR is comparable to the one of early prints.
• The semantic connection of syllables to neumes was performed by an automatic algorithm(see Section A.6 or [222]) that is based on the positional information of the ATR output ofCalamari which is allowed to be erroneous. In total, above 90% of the syllables were cor-rectly assigned even though the the ATR with a CER of 42% was severely flawed. Traininga model with a CER of about 10% already yielded an F1-score of over 99%.
To enable even non-technical users to apply and even train the provided algorithms, the softwareOMMR4all was presented (see publications in Section A.7). The fully platform-independent web-based front-end provides an easy entry point without the need of installation. To facilitate thetedious process of GT production and to correct the automatic outputs, a sophisticated overlay-editor was introduced. Several features are provided, the most important ones are listed below:
• A view that superimposes the annotations as graphic with the original digital manuscriptwhich allows for an easy spotting of errors.
• Several comfortable tools to correct the automatic annotations of the various algorithms.
• Custom comments can be added to the annotations which can be used for a critical apparatus.
• An automatic anonymous tracking of actions and the transcription times to facilitate theevaluation process of OMMR4all.
In summary, this thesis presented several contributions in the area of OCR and OMR that ex-ceeded the state-of-the-art. By introducing OMMR4all, techniques for page segmentation, staffand symbol detection, lyrics recognition, and syllable assignment were made available in a softwarewhich enables musicologists to independently create transcriptions of their own research materialwith efficient computer support. Future work comprises technical improvements, an incorpora-tion of music background knowledge, a considerably higher amount of GT, and an adaption toother historical music notations, such as Gothic. Nevertheless, this work is a big step towards anautomatic transcription of the enormous number of music manuscripts lined up on the numerousshelves of libraries.
44

A Publications Related to OMMR
45

Fully Convolutional Neural Networks for Page Segmentationof Historical Document Images
Christoph Wick and Frank Puppe
Chair of Informatics VIDepartment of Informatics, University of Wurzburg, Germany
Email: {firstname.lastname}@uni-wuerzburg.de
Abstract—We propose a high-performance fully convolu-tional neural network (FCN) for historical document seg-mentation that is designed to process a single page in onestep. The advantage of this model beside its speed is itsability to directly learn from raw pixels instead of usingpreprocessing steps e. g. feature computation or superpixelgeneration. We show that this network yields better resultsthan existing methods on different public data sets. Forevaluation of this model we introduce a novel metric that isindependent of ambiguous ground truth called ForegroundPixel Accuracy (FgPA). This pixel based measure only countsforeground pixels in the binarized page, any backgroundpixel is omitted. The major advantage of this metric is,that it enables researchers to compare different segmentationmethods on their ability to successfully segment text orpictures and not on their ability to learn and possibly overfitthe peculiarities of an ambiguous hand-made ground truthsegmentation.
Keywords-page segmentation, historical document analysis,fully convolutional network, foreground pixel accuracy
I. INTRODUCTION
In the digitalization pipeline of historical books the
segmentation of a page into different regions such as
pictures and texts is a crucial step for all further pro-
cessing including optical character recognition (OCR).
Errors in the text segmentation, e. g. cropped or forgotten
characters, directly affect the outcome of the OCR that
tries to translate written or printed text into digitized
characters. Especially the segmentation of historical docu-
ments is challenging, because these documents suffer from
degradation, different layouts or writing styles, and often
include ornaments or decoration.
A performant segmentation algorithm whose outcome
shall be used for OCR must be capable of separating
background, text, and possibly images. As improvement it
performs fine grained semantic distinctions to a text block,
such as headline, running text, page number, or marginalia,
which are common text types in historical documents.
The basic approach for a segmentation algorithm is to
assign a label to each pixel of the page. Pixel-by-pixel
semantic classifications based on convolutional nerual nets
(CNNs) have widely been used (see e. g. [1] or [2]). Novel
approaches [3] use fully convolutional networks (FCNs) to
learn and infer the whole image in one step. This method
does not require additional pre- or post-processing steps,
such as superpixels (see e. g. [1], [4], [5], [6]).
Our fully convolutional neural net is an adaptation of the
U-Net proposed by Ronneberger et al. [7]. It consists of
Figure 1. Different segmentations of the same text. The first linesegments almost each single character, the second line is segmented asa rectangle, and the third example is an arbitrary segmentation.
several convolution, pooling and deconvolution operations,
but in contrary to the U-Net it does not use skip connec-
tions. The encoding and decoding structure ensures that
only information that encodes large regions in the page is
forwarded. The main advantage of the proposed network
architecture is the prediction of a full image in one step.
Hence, the network can utilize all available information
(e. g. the position of marginalia) to classify each pixel.
Therefore, the network is not only able to master the
comparatively easy task of distinguishing periphery, page
and text but can also successfully perform a fine-grained
semantic distinction between a large variety of very similar
classes.
For training and evaluating a segmentation algorithm,
human annotated ground truth is required. In those ground
truth masks a region is usually labeled as a whole block,
which contains fore- and background pixels (see middle
of Figure 1 and column 3 of Figure 6). For the purpose of
OCR as step of the digitization pipeline, this segmentation
is ambiguous. All three segmentation examples in Figure
1 are equal in the sense that a further OCR algorithm
gains all the required information for a successful recog-
nition. Obviously, the upper segmentation example loses
information about the connected block, but it is rather
simple for instance by a growing algorithm to join single
lines or characters. A standard Loss-Function as the goal
of training is optimal if the network predicts exactly
the provided ground truth, here the middle of Figure
1. The proposed learning algorithm ignores background
labels and predicts only labels of the foreground. For
this purpose, all background labels are ignored in the
loss function of the FCN. Thus, the network is explicitly
2018 13th IAPR International Workshop on Document Analysis Systems
978-1-5386-3346-5/18 $31.00 © 2018 IEEE
DOI 10.1109/DAS.2018.39
287
2018 13th IAPR International Workshop on Document Analysis Systems
978-1-5386-3346-5/18 $31.00 © 2018 IEEE
DOI 10.1109/DAS.2018.39
287

allowed to predict any label for a background pixel.
Obviously, the established metrics to evaluate such a
model that are mostly variations on pixel accuracy and
region intersection over union (IU) (see e. g. [3] or
[6]), can not be used. If the model predicts the upper
segmentation of Figure 1 but the ground truth is the middle
of Figure 1 the score would be very low, although the
segmentation would be perfect in the described sense of
OCR post-processing. For this purpose, we introduce a
novel pixel based measure, that only tracks foreground
pixels and ignores all background pixels. This metrics
predicts by construction the same value for all of the three
example segmentations of 1. The lower bound is 0 if not a
single pixels is labeled correctly and the maximum value
is 1 if all foreground pixels are assigned with the ground
truth. To compare our FCN with other models we also
evaluate the established pixel accuracy.
II. RELATED WORK
The field of document analysis of contemporary and
historical documents is a challenging problem and has
been addressed by many researchers. Recently, algorithms
based on CNNs that automatically learn features from
the pixels of a page show superior success in this area
compared to handcrafted features [6], [8].
FCNs are a new trend in general semantic segmentation
and were successfully trained by [9], [10], or [3]. The
decoding part of those networks usually consist of several
layers of unpooling [11] and deconvolutional (e. g. [10])
operations.
Yang et al. [8] try to extract semantic structure from
contemporary documents using a multimodal fully convo-
lutional neural networks (MFCN). They combine a simple
FCN with several extensions, including a text embedding
map that tries to input both the visual representation and
the true text. Moreover, they implement an additional un-
supervised consistency task that forces the neural network
to have similar activations in each individual rectangular
region of the ground truth.
An adaptation of a FCN is the so-called U-Net intro-
duced by Ronneberger et al. [7], which is applied to the
field of biomedical image segmentation and outperforms
existing methods for cell tracking by a large margin. This
network consists of several convolution and pooling layers,
but only uses deconvolutions as upsampling operations
instead of unpooling layers. Furthermore, it uses skip
connection from the encoder to the decoder part of the
network to preserve high-level information for the decoder.
In the field of historical document analysis Chen and
Seuret [6] proposed a three layer neural net with only
one convolutional layer. This network learns to predict the
label of superpixels (see e.g. [1]) and outperforms methods
that are based on Support Vector Machines [12], [4] or
Conditional Random Fields [5] and handcrafted features.
III. DATASETS
For all our experiments we use several historical books
(see Table I). GW5060, GW5064 and GW5066 are differ-
ent editions of ”The Ship of Fools”, that were scanned
Table IDETAILS OF THE USED DATA SETS. THE RATIO IS GIVEN AS w/h.
Data set Image size (pixels) Ratio Pages LabelsGW5060 ≈ 1900× 2980 0.64 158 6GW5064 ≈ 2030× 2940 0.69 351 6GW5066 ≈ 1000× 1566 0.64 234 6Parzival 2000× 3008 0.66 37 5St. Gall 1664× 2496 0.67 60 5
G. Washington 2200× 3400 0.65 20 5
during the Narragonien digital1 project. Although these
data sets share the same content, they all have a different
layout, font, images or size. These books are already
deskewed and cropped to a page without periphery. The
three further publicly2 available sets Parzival [13], St.Gall [14], and G. Washington [15] consist only of a few
annotated pages and are split in a fixed training size of
24, 21, and 10, respectively. Those books are skewed
and contain periphery that must be segmented, too. An
exemplary page of G. Washington and GW5060 is shown
in Figure 6.
The provided ground-truth segments a page into var-
ious regions: background, page, running text, marginal,
page number, running head, chapter heading, motto, and
signature mark. Each single book uses only a subset of all
available categories (see Table I).
IV. THE MODEL
A. Pre-processing
The training of the model requires the input image and
the target segmentation that is ground truth. Since not all
pages in a single book have the same dimensions, we fit
each single image in a white page with a fixed ratio of 2/3.
Afterwards the pages are scaled down for the experiments
to a size of 260 × 390 pixels, which reduces both the
computation time and the network size. Note, that the
model is evaluated on the full resolution images by scaling
the predicted mask to the original image size. We apply
ocropy’s3 binarization tool on each input image to provide
a binary image which is used as bit-mask to separate fore-
and background, that is black and white, respectively. The
target mask is chosen to be 0 at true background, that is
white color in the binarized images, and otherwise set to
the desired labels. As stated, the 0 label will be ignored
during the training, which allows the network to predict
any color at these pixel positions.
An example input, binarized and provided ground truth
page is shown in columns 1 to 3 of Figure 6, respectively.
B. FCN Architecture
Our proposed FCN network that is sketched in Figure
2 consists of an encoder and a decoder structure based
on convolution- and deconvolution-layers. Deconvolution
layers can basically be seen as an inverse convolution (see
1http://kallimachos.de/kallimachos/index.php/Narragonien2http://www.fki.inf.unibe.ch/databases/
iam-historical-document-database and http://diuf.unifr.ch/main/hisdoc/divadia
3https://github.com/tmbdev/ocropy
288288

Figure 2. Overview of the used FCN structure. The input image is a full page, the complete segmented image is produced as output in one step.
e. g. [16]). By setting the stride equal to the kernel size it
can be used to increase the image resolution by that factor.
The proposed network consists of pooling layers with a
kernel size and stride of 2, which is why the two middle
deconvolutional layers also have kernel size and stride of
2 to increase the image dimensions in accordance.The encoding consists of more convolutional layers than
the decoder because the encoder has to process more
granular information. Each single convolutional layer has
a kernel size of 5 and uses padding at the margin to
keep the image resolution. The number of filters in the
convolution and deconvolution layers are 40, 60, 120,
160, 240 and 240, 120, 60, and 6, respectively. The last
deconvolution-layer is used to generate the prediction of
up to six different labels.The utilized cross entropy loss ignores all background
labels, which is why the network is allowed to predict any
label where the mask is background.
C. Post-processingSince the output of the neural network is a mask that
can predict arbitrary labels at the ignored background this
outcome must be multiplied with the binary image to get
the final segmentation result for computing the FgPA (see
last column in Figure 6).A further post-processing step to improve the FgPA
computes all connected components in the result which are
mostly single letters, and assigns the mode that is the most
frequent label of all pixels in a component. Therefore, the
final outcome is a segmentation that predicts a consistent
label for each connected component. Obviously, regions
of different types that are connected, e. g. image and
text blocks, will introduce errors because only one label
will be assigned to the complete component by this post-
processing method.
V. EXPERIMENTS
The performed experiments are conducted on all six
available books. To compute average measures each ex-
periment is repeated ten times with randomly initialized
network weights and randomly divided test and train sets.
The hyperparameters of the network structure and the
solver are kept fixed during all experiments and across all
books, which is why we do not optimize the method for
each single book. The books St. Gall, G. Washington, and
Parzival provide a fixed testing and training split, which is
exclusively used to compute the accuracy for comparison
with other existing models.
The FCN is implemented in Caffe [17] and runs on a
Nvidia Titan X GPU. A single image takes about 0.5s to
process, which clearly improves the run time of the simple
CNN approach by a factor of 6 to 10 compared to [?].
The optional post-processing runs on a i7-5820K 3.30GHz
CPU and takes about 1-3s depending on the original image
size.
A. Metrics
The metrics for evaluating the quality of a page segmen-
tation are most commonly pixel-leveled, e. g. precision,
recall or accuracy. Other measures taking into account the
area of a class are, e. g. the mean intersection over union
(IU) or the frequency weighted IU (f.w. IU). But even
those more sophisticated measures yield different results
for the three segmentations in Figure 1. Our novel metric
overcomes this problem by taking only foreground pixels
of the original binarized image into account. Let δx = 1 if
the ground truth label at position x matches the predicted
label, else set δ = 0. Furthermore, define bx = 1 if x is
a foreground pixel else set bx = 0. Note that∑
x 1 is the
total number of pixels and∑
x bx is the total number of
foreground pixels. We then compute the
• Total Pixel Accuracy: TPA =
∑xδx∑
x1
• Foreground Pixel Accuracy: FgPA =
∑xbx·δx∑xbx
• Foreground Pixel Error: FgPE = 1− FgPA
B. Evaluation
All predicted segmentation images are rescaled to the
full resolution of the original image before computing the
pixel valued metrics. The last column Figure 6 shows two
outcomes of the FCN after applying the bit mask (second
column) for the G. Washington and GW5060 data sets as
examples for the worst and best books, respectively.
1) Accuracy of the FCN: The established total pixel
accuracy (TPA) of our FCN on the fixed splits of Parzival,
St. Gall, and G. Washington are reported in Table II. On
Parzival and St. Gall the FCN yields comparable results to
a simple CNN approach [6] that is trained to predict the
label of superpixels. The FCN outperforms teh methods
reported in [4] and [5] on the three examined data sets
and the CNN approach on G. Washington. On GW5060,
GW5064 and GW5066 Table II reports the TPA with its
standard deviation on ten folds using a Monte Carlo cross-
validation approach.
289289

Table IITOTAL PIXEL ACCURACY TPA AND FOREGROUND PIXEL ACCURACY FGPA IN PERCENT ON DIFFERENT METHODS WHERE AVAILABLE. WE USE
A 10-FOLD MONTE CARLO CROSS-VALIDATION TO OBTAIN THE RESULTS.
Data set G. Washington Parzival St. GallTPA FgPA TPA FgPA TPA FgPA
Local MLP [4] 87 - 91 - 95 -CRF [5] 91 - 93 - 97 -CNN [6] 91 - 94 - 98 -
FCN 92.1 93.53± 0.66 93.6 96.75± 0.47 98.4 96.39± 0.35FCN (Post-processed) - 93.7± 1.1 - 97.33± 0.49 - 97.67± 0.39
Data set GW5060 GW5064 GW5066TPA FgPA TPA FgPA TPA FgPA
FCN 95.54± 0.19 98.64± 0.12 95.28± 0.30 96.20± 0.70 95.55± 0.92 94.71± 0.61FCN (Post-processed) - 98.99± 0.13 - 96.48± 0.69 - 95.54± 0.48
2) Foreground Pixel Error: The Foreground Pixel Error
(FgPE) and its standard deviation computed on ten folds is
listed in Table II. Although the total accuracy of the Parzi-
val data set of 93.6% is notably worse than the accuracy on
St. Gall (98.4%), the FgPA is comparable. Therefore, the
measure states that the segmentation result used for OCR
is of similar quality. A reason for this deviation in this
example is found in the layout of the two books and the
ground truth. St Gall is written in justified text and its text
masks are very similar to a simple rectangle. In contrast
Parzival’s text is left aligned with varying line lengths.
Therefore, its masks that follow these indentations have a
longer contour than a simple box. Since most of the errors
are located at the margin of a region, the longer contour is
expected to produce more errors. The FgPA ignores these
margins and instead respects only foreground pixels which
is why these different layouts do not affect this metric.
Similarly, the TPA on GW5060, GW5064, and GW5066
is comparable but the FgPA differs significantly, which is
also explained by the different layouts of the books. The
TPA is mostly affected by the baseline, that is the amount
of background pixels in a page. This baseline is almost the
same for GW5060 and GW5066. GW5064 has a higher
baseline but compared to the other two books its layout
is the most difficult layout. Text at the margin can be
classified as either marginalia, running text or headline,
depending on the context. This neglects the effect of the
higher baseline.
The FgPA is independent of the number of background
pixels, which is why the results of the books are different.
The baseline of this metrics is the most frequent label
of the foreground. GW5066 has by far the lowest FgPA
baseline and therefore reasonably has the worst FgPA
score. Both GW5060 and GW5064 have a similar baseline
but since GW5064 has a difficult layout its score is lower
than the one of GW5060.3) Training set size: The number of pages in the train-
ing set that are required for a reliable segmentation result
is a crucial quantity for the application of an algorithm
because these are the pages that must be manually seg-
mented. We compute the performance of the FCN under
different training set sizes by using a specific amount of
all available pages in the training set and the rest in the test
set. Hereby we simulate a real world application scenario
where a subset of a book is manually segmented and the
Figure 3. The Foreground Pixel Error of the FCN on different absolutetraining set sizes. Note that G. Washington and Parzival only consist of20 and 37 instances, respectively, which is why data points are missing.
resulting ground truth is used to train a model in order to
process the remainder of the pages. In the first experiment
the number of pages N in the training is chosen as absolute
value N ∈ {1, 2, 3, 4, 5, 7, 10, 15, 20, 30, 50}, in a second
run we chose N relatively to the complete data set size Dwith N = r ·D and r ∈ [0.05, 0.80] with step size 0.05.
Figure 3 clearly shows that the accuracy of all data sets
is improved with an increasing amount of training data.
The slopes of GW5060, GW5064 and GW5066 are in
general steeper than those of G. Washington, Parzival, or
St. Gall, what might be related to the different data set
sizes or the different layouts. The G. Washington data set
has the smallest relative error decrease with increasing
training examples. The reason is that the ground truth of
this data set in comparison with the others contains more
errors, as can be seen in the first row of Figure 6: The
upper two horizontal lines in the ground truth are labeled
as text, whereas the bottom line is labeled as page. The
learning algorithm can not learn if a detected line shall be
classified as text or page.
Figure 4 shows similar results as Figure 3, but due to the
huge differences in the number of total images in the data
sets this chart shows the progression to very high amounts
of training examples. Since most of the curves in the log
plot are almost flat starting at 20%, additional pages in
290290

Figure 4. The Foreground Pixel Error of the FCN on different relativetraining set sizes.
Figure 5. The minimum, average and maximum FgPE for ten folds ofthe GW5060 data set on different relative training set sizes.
the training set do not improve the segmentation result.
Solely the GW5060 data set profits of a higher amount
of training examples of up to 40%, which interestingly is
also the data set with the by far lowest FgPE.
4) Manual selection of training images: If a user wants
to train a model for page segmentation he has the freedom
to choose which pages shall be used for training. To
estimate the effect of a useful and a poor selection we
show in Figure 5 the minimum, average and maximum
FgPE on the GW5060 data set for ten folds. For only
a few images in the training set, the difference between
maximum and minimum FgPE is clearly smaller than for a
larger training corpus. The reason is that at the small data
set size any ordinary page is useful for training, whereas
later in a larger data set special pages, e. g. the title page,
should be segmented by hand. Obviously in practice, pages
that have a unique layout or contain unique marks or style
must be segmented by hand. Excluding these pages from
the testing and even training data set will improve the
result clearly towards the maximum curve in Figure 5.
5) Post-processing: Figure 7 shows the effect of the
post-processing approach that chooses the most frequent
label for a single connected component. Obviously, the
post-processing improves the results for different splits.
Although, the post-processing can join components that
have different labels, e. g. an image and a character,
the overall effect is positive There the proposed post
processing is meaningful.
VI. CONCLUSION
We proposed a FCN for historical document segmenta-
tion. This network learns and predicts a complete page in
one step and does not require sophisticated preprocessing
steps such as superpixels. We achieved comparable or
improved results on open source data sets and reduce the
computation time by a factor of up to 10.
Furthermore, we introduced a novel meaningful metric
to compare different models and methods of document
segmentation by using the fact that only foreground infor-
mation (black ink) is relevant for further processing steps
in the pipeline of digitization of documents.
REFERENCES
[1] C. Farabet, C. Couprie, L. Najman, and Y. LeCun, “Learn-ing hierarchical features for scene labeling,” IEEE Transac-tions on Pattern Analysis and Machine Intelligence, vol. 35,no. 8, pp. 1915–1929, 2013.
[2] J. Donahue, Y. Jia, O. Vinyals, J. Hoffman, N. Zhang,E. Tzeng, and T. Darrell, “Decaf: A deep convolutionalactivation feature for generic visual recognition,” in ICML.JMLR, 2014, pp. 647–655.
[3] E. Shelhamer, J. Long, and T. Darrell, “Fully convolutionalnetworks for semantic segmentation,” IEEE Transactionson Pattern Analysis and Machine Intelligence, vol. 39,no. 4, pp. 640–651, 2017.
[4] K. Chen, C. L. Liu, M. Seuret, M. Liwicki, J. Hennebert,and R. Ingold, “Page segmentation for historical documentimages based on superpixel classification with unsupervisedfeature learning,” in 2016 12th IAPR Workshop on Docu-ment Analysis Systems (DAS), 2016, pp. 299–304.
[5] K. Chen, M. Seuret, M. Liwicki, J. Hennebert, C. L.Liu, and R. Ingold, “Page segmentation for historicalhandwritten document images using conditional randomfields,” in 2016 15th Int. Conf. on Frontiers in HandwritingRecognition (ICFHR), 2016, pp. 90–95.
[6] K. Chen and M. Seuret, “Convolutional neural networks forpage segmentation of historical document images,” CoRR,vol. abs/1704.01474, 2017.
[7] O. Ronneberger, P. Fischer, and T. Brox, U-Net: Con-volutional Networks for Biomedical Image Segmentation.Cham: Springer Int. Publishing, 2015, pp. 234–241.
[8] X. Yang, M. E. Yumer, P. Asente, M. Kraley, D. Kifer, andC. L. Giles, “Learning to extract semantic structure fromdocuments using multimodal fully convolutional neuralnetwork,” CoRR, vol. abs/1706.02337, 2017.
[9] J. Long, E. Shelhamer, and T. Darrell, “Fully convolutionalnetworks for semantic segmentation,” in The IEEE Conf. onComputer Vision and Pattern Recognition (CVPR), 2015.
291291

Figure 6. Different images of the model. The columns from left to right show: the original grayscale image, the binarized image, the providedground truth, the segmentation result. The first row is page 290 of the G. Washington data set using black as the ignored background, white as theperiphery, yellow as page, and red as text. The second row shows the results page 55 of GW5060, using black as the ignored background, red as text,yellow as marginalia, blue as headlines, and green as images (best seen in color).
Figure 7. The Foreground Pixel Error of the FCN on different relativetraining set sizes including post-processing. Only the results for GW5060and Parzival are shown.
[10] H. Noh, S. Hong, and B. Han, “Learning deconvolutionnetwork for semantic segmentation,” in 2015 IEEE Int.Conf. on Computer Vision (ICCV), 2015, pp. 1520–1528.
[11] M. D. Zeiler, G. W. Taylor, and R. Fergus, “Adaptivedeconvolutional networks for mid and high level featurelearning,” in 2011 Int. Conf. on Computer Vision, 2011,pp. 2018–2025.
[12] K. Chen, M. Seuret, M. Liwicki, J. Hennebert, and R. In-gold, “Page segmentation of historical document imageswith convolutional autoencoders,” in 2015 13th Int. Conf.on Document Analysis and Recognition (ICDAR), 2015, pp.1011–1015.
[13] M. Wuthrich, M. Liwicki, A. Fischer, E. Indermuhle,H. Bunke, G. Viehhauser, and M. Stolz, “Language modelintegration for the recognition of handwritten medievaldocuments,” in 2009 10th Int. Conf. on Document Analysisand Recognition, 2009, pp. 211–215.
[14] A. Fischer, V. Frinken, A. Fornes, and H. Bunke, “Tran-scription alignment of latin manuscripts using hiddenmarkov models,” in Proc. of the 2011 Workshop on His-torical Document Imaging and Processing, ser. HIP ’11.New York, NY, USA: ACM, 2011, pp. 29–36.
[15] T. M. R. V. Lavrenko and R. Manmatha, “Holistic wordrecognition for handwritten historical documents,” in Proc.of the Int. Workshop on Document Image Analysis forLibraries (DIAL), 2004, pp. 278–287.
[16] M. D. Zeiler, D. Krishnan, G. W. Taylor, and R. Fergus,“Deconvolutional networks,” in 2010 IEEE Computer So-ciety Conference on Computer Vision and Pattern Recog-nition, 2010, pp. 2528–2535.
[17] Y. Jia, E. Shelhamer, J. Donahue, S. Karayev, J. Long,R. Girshick, S. Guadarrama, and T. Darrell, “Caffe: Convo-lutional architecture for fast feature embedding,” in Proc.of the 22Nd ACM Int. Conf. on Multimedia. ACM, 2014,pp. 675–678.
292292

applied sciences
Article
Staff, Symbol and Melody Detection of MedievalManuscripts Written in Square Notation Using DeepFully Convolutional Networks
Christoph Wick * , Alexander Hartelt and Frank PuppeChair for Artificial Intelligence and Applied Computer Science, University of Würzburg,97074 Würzburg, Germany* Correspondence: [email protected]
Received: 16 May 2019; Accepted: 22 June 2019; Published: 29 June 2019�����������������
Abstract: Even today, the automatic digitisation of scanned documents in general, but especiallythe automatic optical music recognition (OMR) of historical manuscripts, still remains an enormouschallenge, since both handwritten musical symbols and text have to be identified. This paper focuseson the Medieval so-called square notation developed in the 11th–12th century, which is alreadycomposed of staff lines, staves, clefs, accidentals, and neumes that are roughly spoken connectedsingle notes. The aim is to develop an algorithm that captures both the neumes, and in particular itsmelody, which can be used to reconstruct the original writing. Our pipeline is similar to the standardOMR approach and comprises a novel staff line and symbol detection algorithm based on deepFully Convolutional Networks (FCN), which perform pixel-based predictions for either staff linesor symbols and their respective types. Then, the staff line detection combines the extracted lines tostaves and yields an F1-score of over 99% for both detecting lines and complete staves. For the musicsymbol detection, we choose a novel approach that skips the step to identify neumes and insteaddirectly predicts note components (NCs) and their respective affiliation to a neume. Furthermore, thealgorithm detects clefs and accidentals. Our algorithm predicts the symbol sequence of a staff with adiplomatic symbol accuracy rate (dSAR) of about 87%, which includes symbol type and location. Ifonly the NCs without their respective connection to a neume, all clefs and accidentals are of interest,the algorithm reaches an harmonic symbol accuracy rate (hSAR) of approximately 90%. In general,the algorithm recognises a symbol in the manuscript with an F1-score of over 96%.
Keywords: optical music recognition; historical document analysis; medieval manuscripts;neume notation; fully convolutional neural networks
1. Introduction
The digitisation and encoding of historical music manuscripts is an ongoing area of research formany scientists. The aim is to preserve the vast amount of cultural heritage but also to provide musicalinformation in a machine-readable form (e.g., **kern (http://www.humdrum.org/rep/kern/), MEI(https://music-encoding.org/), or MusicXML [1]). For one thing, this enables music scientists to applylarge-scale musical analysis such as detecting similarities of melodies, creating musical grammars,or comparing different versions of the same piece of music. Furthermore, the digital transcriptionsare published in a collection [2] that is searchable and provides tools for data retrieving. The currentCorpus Monodicum project at the University of Würzburg is dedicated to the exploration and editionof historically significant music, editorially untapped stocks of unanimous ecclesiastical and secularmusic of the European Middle Ages with Latin text. Two volumes [3,4] have already been published;however, the majority of material of interest has not been converted into machine actionable form yet.Our proposed Optical Music Recognition (OMR) aims to speed up this process considerably.
Appl. Sci. 2019, 9, 2646; doi:10.3390/app9132646 www.mdpi.com/journal/applsci

Appl. Sci. 2019, 9, 2646 2 of 28
If in the process of encoding, the data maintains positional information of symbols or regionsrelative to original manuscript, ambiguities, corrections or other sources of manual interpretation canbe looked up and verified in the original document. In general, this should highly improve the qualityof research and reproducibility.
Currently, the digital acquisition heavily relies on human effort because the ancient manuscriptsparticularly suffer from degradation and non-standardised fonts, glyphs or layouts. Therefore noveltechniques in the area of artificial intelligence are required to capture the encoded data in a computerreadable form. This paper focuses on the digitisation of medieval monophonic music written in squarenotation, an ancient notation which was developed and used from the 11th–12th century onwards [5].Compared to even earlier forms, this writing of music is already similar to Common Western MusicNotation in the sense that it uses four staff lines, clefs, accidentals and more or less discrete notesthat are drawn as squares (compare Figure 1). However, unlike modern notation, notes are mostlyconnected to groups, the so-called neumes witch depict a small segment of melodic motion.
Figure 1. An example transcription equivalent in modern notation (bottom image) based on a neumenotation (upper image). A neume consisting of graphical connected note components (NCs) (a)is visualised by a slur, each new neume starts with an increased space (b), logical connected NCsare notated with small note space (c). The modern notation maintains the relevant information forperforming the historical neume notation. The example image is taken from our corpus introduced inSection 3.
Historically, neumes arise from single solid or broken stroke drawings that visually followed thepitch levels. Figure 1 also shows an actual transcription of the upper line taken from our data set in amodernised form where each note component (NC) is a single note. The graphical connectivity of twoNCs, which is in most cases straightforward to decide, is marked by a slur (a). Example (b) shows twonotes that are two single tone neumes and are therefore notated with a larger space. Logical connectedNCs are visualised by a smaller space between two notes (c). This, however, is in some cases difficultto decide because there is no difference between a neume consisting of multiple single NCs or multipleneumes comprising one NC. In this example, the syllables each belonging to different neumes dissolvethis ambiguity.
The aim of this paper is, on the one hand, to detect the staff lines that form staves and on theother hand, to locate all musical symbols including the discrete note position of the neumes, so thatthe musical relevant information including the positions in the original document is fully recognisedand preserved. Both tasks are conducted separately by usage of two Fully Convolutional Networks(FCNs), which predict pixel based locations of staff lines or music symbols, respectively. Furtherpost-processing steps extract the actual positions and symbol types.
In contrast to the works of other researchers [6,7] that first detect and classify neumes and thenresolve them into single NCs to gain the distinct pitches, our algorithm combines this step by directlyyielding the described transcription equivalent. However, the actual neumes in the original manuscriptcan be reconstructed and thus no information is lost. The advantage of our approach is that we bypassthe ambiguities of neumes that are very similar to each other but yield the same pitches. Furthermore,no subsequent faults can arise. Eventually, we conduct an evaluation that both ignores and includes

Appl. Sci. 2019, 9, 2646 3 of 28
the neume connectivity to measure either only the quality of the detected melody or the capability todigitise the complete square notation.
To summarise, the main contributions of this work regarding an OMR of manuscripts written insquare notation are the following:
• Development of a very robust staff line detection algorithm based on FCNs, which identifiesalmost all staves and their related staff lines.
• Proposal of a symbol detection algorithm which applies an FCN to the detected staves. Thealgorithm locates clefs, accidentals and notes with their respective affiliation to neumes. Thereby,it is possible to fully capture and reconstruct the melodic sequence.
• Evaluations of both new algorithms on 49 pages comprising 510 staves and 16,731 annotatedsymbols. We consider, among other things, the effect of only a few training examples and thegeneralisation to new manuscripts.
The remainder of this paper is structured as follows: First, related work is listed and discussed.Afterwards, the algorithms for staff and symbol detection are described and we evaluate the algorithmsindependently, including the experiments that measure the amount of required training data. Weconclude this paper by giving an outlook on our future work.
2. Related Work
The digitisation on manuscripts is an ongoing area of music research but also for textualdocuments. The special focus of this paper is monophonic music, where the music forms a temporalsequence and hence it is sufficient to only detect one symbol at a point in time. In the following,we list work related to OMR on monophonic music detection and to music detection on historicaldocuments in general. With the recent overwhelming success of deep learning, CNNs acting on rawinput data instead of preprocessed images (e.g., staff line removal) became very popular and yieldedstate-of-the-art performance. Since OMR is basically a sequence to sequence task, recurrent networkssuch as LSTMs are also promising to use.
2.1. OMR on Contemporary Notation
Baró-Mas et al. [8] use (bidirectional) LSTM networks to predict the pitch and rhythm of notesand other musical symbols for example rests and clefs in images, each containing a single line ofmonophonic music. The outputs of the network are two sequences. The first one aims to predict thepitch of notes or the type of other symbols like clefs (54 classes in total), while the second one indicatesthe rhythm of notes or a no note label (26 classes). For training the network, they implement twodifferent loss functions that consider both target sequences. One computes the weighted euclidean loss,the other implements a multi-label soft margin loss. To evaluate their algorithm, two different datasets are used which both consist of monophonic music in modern notation, however one is printedand one handwritten. Experiments on the first dataset which comprises incipts from the RISM dataset [9] yield a symbol/pitch error rate of 1.5% and a rhythm error rate of 2.0%. The total error forboth properties to be correct is 2.8%. As a second data set, they use one page of the CVC-MUSICMAdataset [10]. After manually labelling six staves, they extend the number of different staves by varyingthe order of bars within a single staff. During training, data augmentation is used and all lines fromthe printed data set were added. The error of the symbol/pitch and rhythm detection is 47% and 43%,respectively, yielding a total error rate of 65%.
A similar attempt to learn music recognition on modern monophonic printed music was proposedby van der Wel and Ullrich [11]. However, compared to Reference [8], they use preliminary CNNlayers and an encoder/decoder structure for their neural network. The CNN/LSTM based encodermaps a line image into one fixed size state representation by processing the line sequentially. Thedecoder consecutively decodes this state and predicts a sequence of pitches, duration, and finally astop mark. This overall procedure is based on, and very similar to, the sequence to sequence task used

Appl. Sci. 2019, 9, 2646 4 of 28
for machine translation [12]. In total there are 108 pitch and 48 duration categories in their data set,which is compiled from MusicXML [1] scores from the MuseScore (https://musescore.org/) sheetmusic archive. In contrast to the normalised edit-distance, a rather strict metric is used that cannothandle insertions or deletions. They align the prediction and ground truth (GT) sequence label bylabel and count the number of correct predictions. Thus, if a label is deleted or inserted all subsequentnotes are usually false. Their final model which is trained with data augmentation, yields a pitch andduration accuracy of 81%, and 94%, respectively. The total accuracy of notes is 80%.
A third very promising attempt to predict monophonic music was made by Calvo-Zaragozaand Rizo [13]. They use CNN/LSTM hybrids combined with a CTC-loss-function [14] as modelarchitecture, a technique that already succeeded for handwritten and printed optical characterrecognition (OCR) [15,16], or speech recognition [17,18], which are both sequence to sequence tasks.The advantage of this loss function is that it does not require position accurate labelling in the GT. Onlythe target sequence and input data are obligatory, out of which the network automatically learns thealignment. The drawback of this method is that each combination of pitch and rhythm semanticallyrequires a distinct label. Moreover, a key-signature can, for instance, either be a single symbol or bedissolved in individual accidentals. The first so-called semantic representation requires 1781 classes intotal, while the second agnostic representation only uses 758 classes. To perform experiments theycreated the so-called PrIMuS (available at https://grfia.dlsi.ua.es/primus/) (Printed Images of MusicStaves) data set containing 87,678 real-music incipts which are rendered by Verivio [19], a web-basedmusic engraver. The evaluation yields a sequence error rate of 17.9% and 12.5% in the agnostic andsemantic representation, respectively, which is explainable by the higher number of classes. However,the individual symbol error rate is approximately 1% in both representations.
Compared to the upper work, handwritten music recognition can also be regarded as an objectdetection task. This approach was proposed by Pacha et al. [20]. Their pipeline uses existingstate-of-the-art deep neural networks for object detection such as Faster R-CNN [21] or R-FCN [22]with custom pre-processing and training. A cropped image of a single staff without staff line removalserves as input. They evaluated the MUSCIMA++ dataset [23] which contains over 90,000 symbolannotations of handwritten music distributed in 71 classes. The object detection achieved a meanaverage precision of over 80%.
2.2. OMR on Historical Notations
In the area of historical OMR, Calvo-Zaragoza et al. [24,25] applied Hidden Markov Models(HMM) and an n-gram language model on line images written in mensural notation of the 17th century.This notation is comparable to modern notation, since it is already ruled by very similar symbols.Their handwritten corpus was comprised of 576 staves with 13,863 individual symbols representingfor instance notes, rests, or clefs. In total there were 16 different symbol shapes which are located ondiscrete locations relative to the staff lines. The combination of the position and shape yielded around200 different classes. As metrics they measured the glyph error rate (GER, symbol shape only) andheight error rate (HER, position relative to the staff lines) separately but also computed the combinedsymbol error rate (SER, shape and position). Their best model reached a GER of 35.2%, a HER of 28.2%,and a SER of 40.4%.
Ramirez and Ohya [7] did notable work on the automatic recognition of handwritten squarenotation, which is also the focus of our paper. They built a dataset based on 136 pages from the DigitalScriptorium repository (http://www.digital-scriptorium.org/) comprising 847 staves and over 5000neumes. The greyscale images of the 14th century are a huge challenge, as they suffer from physicaldegradation, variability in notation styles or non-standardised scan conditions. Their first task detectedand extracted staves. They used a brute-force algorithm that matches the original image with a stafftemplate built up from four straight staff lines by varying line and staff distance and orientation. Thefound optima indicated locations for staves, which were then extracted. The advantage of this methodis that individual staff lines need not to be detected; however, the handwritten staff lines must be

Appl. Sci. 2019, 9, 2646 5 of 28
equally distant and almost straight. In total, 802 of all 847 staves were correctly detected (95% recall).In a second task, they performed a symbol detection and classification algorithm. A pattern matchingalgorithm fed with several different templates for each neume first marked possible symbol locationsand found approximately 88% of all symbols. Then, a SVM classified the symbols into different neumetypes with an accuracy no lower than 92% across all classes. Compared to our approach, they didnot resolve the individual neumes into single NCs nor detected clefs. But likewise, accidentals wereignored or did not occur.
Vigliensoni et al. [6] focused on pitch detection in their work; however, on documents of the LiberUsualis (a digital version is available at https://archive.org/details/TheLiberUsualis1961) printedin 1961. Using the staff line detection of Miyao [26], the staff line removal of Roach and Tatem(compare e.g. Reference [27]), and an automatic neume classification algorithm trained on 40 pages,they evaluated pitch detection on 20 pages consisting of 2219 neumes and 3114 pitches. The pitch ofthe first component of a neume was correctly detected for 97% of all neumes, while only 95% of allnote components including single-tone neumes were found.
In Reference [28], Calvo-Zaragoza et al. propose an approach taken from historical documentanalysis [29] in the area of OMR. A deep CNN was trained to segment scans of two manuscripts of the14th and 16th century pixel-wise by assigning each pixel a class selected from background, text, staffline, or symbol. Approximately 80% of the pixels were background, 10% were text, 6% were staff linesand 4% were symbols. The results showed that, especially at the margin of changing label types, theclassification was incorrect, which however should only have a minor impact on the proceeding steps.Furthermore, only a small number of GT instances must be manually created to obtain good results.The evaluation measured the correct label of pixels, particularly those located at the edge of differentsymbols and yields an average F1-score of around 90%. In general, this algorithm which predicts apixel-wise segmentation only solves one step in an OMR pipeline. The segmentation can be used as aninput to feed various classifiers which are, for instance, trained to encode staff lines, staves, symbols ortext, to finally output the musical information.
3. Dataset
As a dataset we used 49 pages of the manuscript “Graduel de Nevers” (accessible at theBibliothèque nationale de France (https://gallica.bnf.fr/ark:/12148/btv1b8432301z)) published in the12th Century. The handwritten music comprises different neume notation styles, only a part is writtenin square notation, which are folios 2-9 and 246-263. These pages were extracted and further split intothree parts that share a similar layout or difficulty based on our human intuition (compare Figure 2).
The first part contained pages with the best available notation quality with fading bleeding. Itsstaff lines are mostly straight, possibly due to usage of a ruler, and all neumes were very clear anddistinct. The second part suffered from bleeding staff lines and was written very narrowly, yieldingthe most difficult notation. The third part comprised to some extent very unclear neumes and verywavy staff lines. In our experiments, we used these parts to estimate how well our trained algorithmsgeneralise onto unseen layouts by not using all parts for training.
The GT was manually annotated under the supervision of music scientists. For each stave, westored four staff lines each as a polyline whose coordinates were relative to the the image. The exactstart and end of a line was ambiguous due to occasional severe degradation. We further defined thesymbols clef, accidental, and neume as part of a staff. A clef consists of a type (C or F), its centre asabsolute position on the image and its location relative to the staff lines, which also marks the denotedstaff line. In the example line in Figure 1 the F-clef is located on the second line. Since all occurringaccidentals are a flat B, it is sufficient to store their absolute centre position and their staff line location.Each neume is comprised of single NCs. For each NC, we took its absolute position, its location on thestaff lines, and whether it is graphically connected to the previous NC. For example the first neumein Figure 1 consists of two NCs. The first one is located on the first staff line while the second oneis graphically connected and is positioned in the second space. The neume (c) in the example line

Appl. Sci. 2019, 9, 2646 6 of 28
comprises three NCs of which none is graphically connected; however, since they belong to the sameneume, their logical connection can be derived. Note that, in general, the symbol location in a staff linecan be computed using the positions of the staff lines and the global position of the symbol, howeverthere exist many ambiguities as to whether a NC is actually located on a line or in a space. For instance,the first NC of the second last neume in Figure 1 might also be an G instead of an F. In this work,we did not distinguish additional note types such as liquecents or oriscus. Furthermore, unlike theapproach in Reference [28], we did not label the images on a pixel-basis, since detecting the actualshape and extent of neumes, clefs, or accidentals is out of the focus of this paper. We were solelyinterested in transcribing historical neume notations in a digitised form that preserved all melodicinformation, which is the desired output in almost all cases.
Figure 2. Each page represents parts 1, 2, and 3, respectively. The bottom images provide a zoomedview on the upper pages. While the first page is very clean, both other pages suffer from bleeding andfainter writing. The staff lines in the first and second part are very straight most certainly due to usageof a ruler, whereas the staff lines of the third part are freehand drawn.
Using the described storage scheme, all required information for training and evaluation is presetor can be computed. Table 1 gives an overview of each part’s properties by listing its number of pages,the number of staves on these pages, each consisting of four staff lines, and the symbol counts. In total,we annotated more than 16,000 symbols located in more than 500 staves. Compared to the numberof symbols, the 65 flat accidentals occur very rarely, which makes the learning of their detection verychallenging. Approximately 4% of the symbols are clefs, yet at least up to 600 clefs can be used astraining examples.
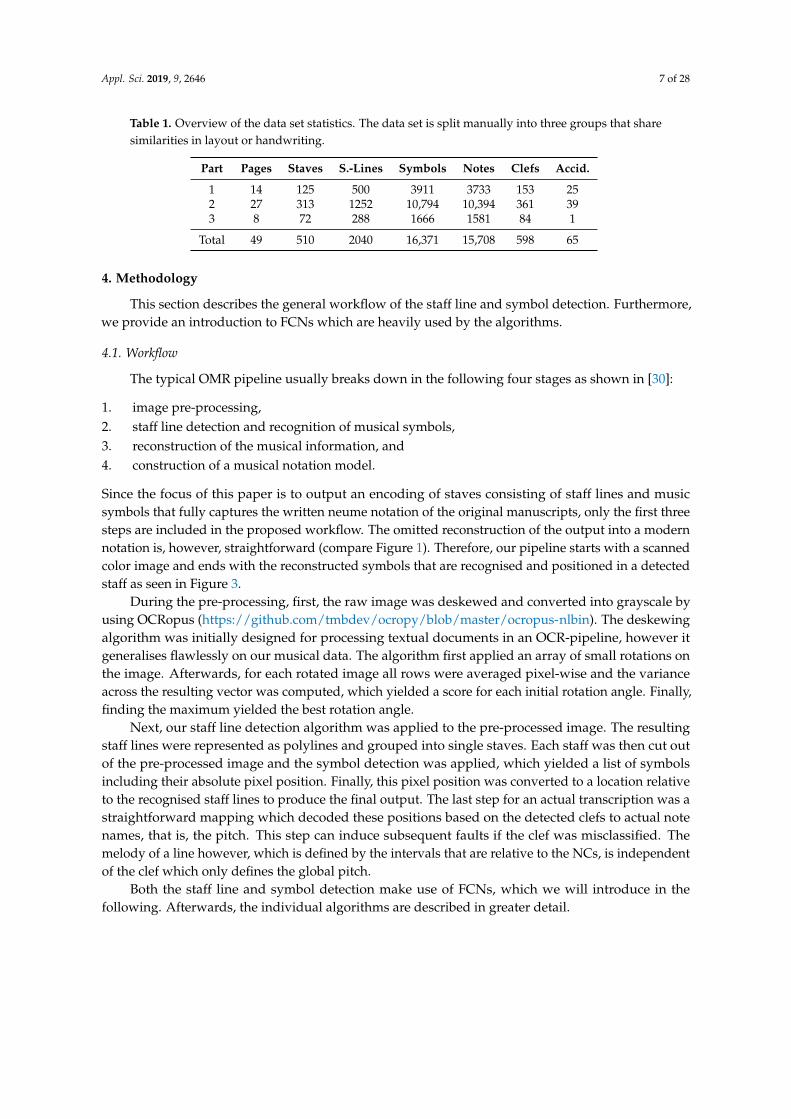
Appl. Sci. 2019, 9, 2646 7 of 28
Table 1. Overview of the data set statistics. The data set is split manually into three groups that sharesimilarities in layout or handwriting.
Part Pages Staves S.-Lines Symbols Notes Clefs Accid.
1 14 125 500 3911 3733 153 252 27 313 1252 10,794 10,394 361 393 8 72 288 1666 1581 84 1
Total 49 510 2040 16,371 15,708 598 65
4. Methodology
This section describes the general workflow of the staff line and symbol detection. Furthermore,we provide an introduction to FCNs which are heavily used by the algorithms.
4.1. Workflow
The typical OMR pipeline usually breaks down in the following four stages as shown in [30]:
1. image pre-processing,2. staff line detection and recognition of musical symbols,3. reconstruction of the musical information, and4. construction of a musical notation model.
Since the focus of this paper is to output an encoding of staves consisting of staff lines and musicsymbols that fully captures the written neume notation of the original manuscripts, only the first threesteps are included in the proposed workflow. The omitted reconstruction of the output into a modernnotation is, however, straightforward (compare Figure 1). Therefore, our pipeline starts with a scannedcolor image and ends with the reconstructed symbols that are recognised and positioned in a detectedstaff as seen in Figure 3.
During the pre-processing, first, the raw image was deskewed and converted into grayscale byusing OCRopus (https://github.com/tmbdev/ocropy/blob/master/ocropus-nlbin). The deskewingalgorithm was initially designed for processing textual documents in an OCR-pipeline, however itgeneralises flawlessly on our musical data. The algorithm first applied an array of small rotations onthe image. Afterwards, for each rotated image all rows were averaged pixel-wise and the varianceacross the resulting vector was computed, which yielded a score for each initial rotation angle. Finally,finding the maximum yielded the best rotation angle.
Next, our staff line detection algorithm was applied to the pre-processed image. The resultingstaff lines were represented as polylines and grouped into single staves. Each staff was then cut outof the pre-processed image and the symbol detection was applied, which yielded a list of symbolsincluding their absolute pixel position. Finally, this pixel position was converted to a location relativeto the recognised staff lines to produce the final output. The last step for an actual transcription was astraightforward mapping which decoded these positions based on the detected clefs to actual notenames, that is, the pitch. This step can induce subsequent faults if the clef was misclassified. Themelody of a line however, which is defined by the intervals that are relative to the NCs, is independentof the clef which only defines the global pitch.
Both the staff line and symbol detection make use of FCNs, which we will introduce in thefollowing. Afterwards, the individual algorithms are described in greater detail.

Appl. Sci. 2019, 9, 2646 8 of 28
Image preprocessing
Reconstruction ofmusical information
Recognition of musical symbols
Preprocessingand dewarping
Scanned colorimage
Staff line detection
FCN
PostprocessingExtract staff lines
and staves
Extracted Staff FCN Connectedcomponents
Extract symbols
Normalization
Reconstructionof staff and page
Figure 3. Schematic view of the workflow of the staff line and symbol detection. The small imagesshow the original image and the input and output of the respective Fully Convolutional Network(FCN).
4.2. FCN Architecture
FCNs are a novel method for classifying an input image with variable size (H ×W) pixel-wise byassigning a target class to each pixel in the input image. Especially the U-Net structure of [31] poses anew state-of-the-art in several areas.
Our network architecture, which is shown in Figure 4, is a bit simpler than the original U-Netsince it has a reduced number of filters in the Convolution Layers and only down scales to a factor of 8.
In general, the U-Net comprises an encoder/decoder structure that down- and up-scales the inputimage and thereby applies convolution and pooling operations. Skip-connections directly link theoutputs of each scale level of the encoder to the outputs of the decoder by concatenation. Thus, thenext higher layer of the decoder knows both the widespread information of the deeper levels andthe more fine-granular features of the higher levels of the encoder. The output of the network is aprobability distribution over all allowed labels for each input pixel.

Appl. Sci. 2019, 9, 2646 9 of 28
H x W x 1 (Input image as grayscale)
H x W x 20, ReLU
H x W x 30
H/2 x W/2 x 30
H/2 x W/2 x 40, ReLU
H/2 x W/2 x 40
H/4 x W/4 x 40
H/4 x W/4 x 60, ReLU
H/4 x W/4 x 60
H/8 x W/8 x 60
H/8 x W/8 x 80, ReLU H/8 x W/8 x 80, ReLU
H/4 x W/4 x 60, ReLU
H/4 x W/4 x 120
H/2 x W/2 x 40, ReLU
H/2 x W/2 x 80
H x W x 30, ReLU
H x W x 60
H x W x 20
H x W x L (Output, label probability for each pixel)
Skip connection
Skip connection
Skip connection
Encoder Decoder
Conv 5x5
Max-Pool 2x2
Deconv 2x2
Concatenate
Conv 1x1
Figure 4. FCN network architecture used for the staff line detection and symbol detection. Both thetype and the dimension of each layer is shown.
The network is trained by using a pair of input (e.g., greyscale) image I and a corresponding targetlabel matrix T as GT (compare Figure 5 for example input pairs). The neural network tries to predictthe desired label with a probability of one, while all other classes shall be zero. The corresponding lossfunction is the negative-log-likelihood L which treats each individual pixel prediction independently:
L = −∑x,y
log P(T|I)x,y, (1)
where the sum runs over all pixel positions x, y and the matrix P(T|I) denotes the probability of theGT labels T given the input I.

Appl. Sci. 2019, 9, 2646 10 of 28
Input Target
Input
Target
Staff line detection
Symbol detection
Figure 5. GT pairs of input and target for training the FCN. The upper box shows an example for thestaff line detection where the FCN acts on the full page. The staff lines in the GT are drawn as blacklines in the target binary image. The symbol detection, instead, expects an image of a single line asinput. The different grey levels of the target represent the symbol classes, for example the darkest levelindicates a F-clef, while the brightest level marks a NC which is the start of a neume.
4.3. Staff Line Detection
Our staff line detection algorithm aims to extract staves and their respective staff lines as a groupof polylines from an input image. Each polyline is a list of points located in the original image.
Our algorithm (compare Figure 3) for the staff line detection acts on the deskewed greyscaleimage of a full page as input and expects as parameters the number of staff lines per staves (four inthe case of this paper) and the average staff line distance dSL which is however approximated by thealgorithm of [32,33]. dSL is used to normalise the original input to an image where dSL is a fixed valueof 10px. The automatic staff line distance approximation algorithm of [33] acts on the binarised versionof the input image which is computed by the OCRopus binarisation tool. The idea of the algorithm isbased on run-length encoding (RLE) for each column of the binary image. RLE encodes an array ofbinaray black and white pixels in sequence length, for example, the sequence {1110011111000111010}is encoded as 3, 2, 5, 3, 3, 1, 1, 1. The most common black runs represent the height of a single staff line,while the most common white runs denote the staff space, 1 and 3 in the upper example, respectively.We adapted this algorithm by constraining the staff space to be at least twice the staff line height togain more robust results with noisy data. The actual dSL is finally approximated by the sum of thestaff line height and space. A preliminary experiment shows that on all available pages this algorithm

Appl. Sci. 2019, 9, 2646 11 of 28
correctly approximates dSL, hence all images can be normalised automatically. This normalisation stepis only required for the staff line detection but not for the later symbol detection.
The pre-processed and normalised image (a) is then fed into the FCN and postprocessing pipeline(compare Figure 6). The FCN, which is trained to discriminate between staff line and backgroundpixels, predicts a probability map (b)—compare also Figure 5. A threshold of 50% corresponding to theclass with the highest probability classifies each pixel (c). To prune artefacts, we then apply a horizontalRLE to drop row-wise pixel groups with a length shorter than 6 px (d). The remaining connectedcomponents (e) are then used to determine preliminary polylines by computing the vertical centre ateach horizontal position for each component (f). Since the staff lines are sometimes interrupted, weapply a postprocessing step that combines polylines which are on a similar height level (g). Finally, wecluster all staff lines into staves by first computing the most common distance of staff lines dSL and thengroup staff lines with a distance of smaller than 1.5 · dSL (h). We only keep staves with four lines, bywhat staves that might be wrongly classified noise (e.g., bleeding), text or the page margin, are dropped.The remaining grouped polylines represent the final result of the staff line detection algorithm.
(a) Input
(b) Output (Probability)
(c) Threshold (50%)
(d) Horizontal runs (Pruning)
(e) Connected Components
(f) Polylines (center of Ccs)
(g) Combine line sections
(h) Group into staves
6px
dSL
Figure 6. Staff line detection steps including the application of the FCN and the postprocessing. Theexample images show the output of the respective step. In step (f–h) the resulting polylines indicatingstaff lines are drawn, while in the other steps (a–e) the output is a matrix. The run-length encoding(RLE) scale of 6 px relative to the output and the dimension of dSL is shown as reference in gray.
The FCN is trained on GT that solely contains the human annotated staff lines drawn with athickness of 3 px. During training, we optionally augment the data by randomly rotating the image upto 2◦, flipping the image vertically or horizontally, and varying the contrast and brightness up to a

Appl. Sci. 2019, 9, 2646 12 of 28
factor of 2[−0.8,0.8] and value of 8%, respectively. Furthermore, the data is scaled with a factor of up to2[−0.1,0.1] on each axis independently.
4.4. Symbol and Note Component Detection
The symbol detection algorithm acts on the image of a single staff (see Figure 3). To extract theseimages, we determine the bounding boxes of each known staff which are extended to the top andbottom by adding dSL, which is computed using the given staff lines. This line image is finally scaledto a fixed height hstaff, which we choose as 80 px (see Section 5.3.2), so that the resolution of the inputdata is normalised. An example line is shown in the first row of Figure 7.
Figure 7. The first line shows the cut off original input image. The next one is the target mask for theFCN in which notes and clefs are marked. The next three lines show the dewarped, padded and anaugmented version of the original image.
Similar to the staff line detection, the symbol detector employs the proposed FCN-architecture toclassify the input image pixel-wise into seven different classes (see Figure 8): clef-c, clef-f, accidental-flat,initial NC (start of a neume), logical connected NC, graphical connected NC and background. TheGT mask for each line is generated by drawing a small box of the respective label at the centre ofeach symbol (compare Figure 5 and the second image in Figure 7). When training the FCN it aims topredict the correct labels pixel wise, which is why actual symbols and their position and types must beextracted in a proceeding step. For this purpose, we first assign the most probable class to each pixelto receive a label map. Afterwards, connected components are detected on a binary image that eitherdenotes background or any symbol. Each component yields a single symbol whereby the centre of thecomponent equates the symbol position and the type defined by majority voting on the label map.

Appl. Sci. 2019, 9, 2646 13 of 28
C-Clef F-Clef ♭-Accid. Initial NC (Neume start)
Logical connected NC
Graphicalconnected NC
Background
Part 1
Part 2
Part 3
Figure 8. Each column shows cropped instances of the seven classes to be recognised by the symboldetection, respectively for each data set part. The central pixel position defines the type.
Finally, the relative note position is computed based on the detected staff lines (see left image ofFigure 9), whereby the relative distance of the y-coordinate of each symbol in the staff determines theclosest space or staff line. It shows that notes are often “on the line” even though it is visually closer toa space which is why spaces and lines are not distributed equidistant, instead the ratio is 2/3 (see theleft zoomed sub figure and for an example the right image of Figure 9).
021
43
6578109
40%30%
30%
Figure 9. The left image shows the relative staff line positions shown on the right. The zoomed windowmarks the area sizes that are assigned as line or space, while the dashed lines indicate ledger lines. Theright image is an example for a NC (green mark) that is visually closer to the space (dashed) howeveractually a NC on a line (solid).
To improve the quality of a line, we implemented and tested several pre-processing steps appliedto the line image before being processed by the FCN (compare third to fifth image of Figure 7). First,we dewarp the line by transforming the image so that the staff lines are straight. Furthermore, we padextra space to the left and right of a staff to ensure that all symbols especially clefs are fully contained.We optionally use data augmentation that varies the contrast and brightness up to a factor of 2[−0.1,0.1]
and a value of 4%, respectively. Also, the data is scaled with a factor of up to 2[−0.1,0.1] independentlyin x- and y-direction.
5. Experiments
In this section, we first introduce the data setup which defines how we chose parts for training andtesting the FCNs. Then, we evaluate and discuss the proposed staff line and symbol detection algorithm.Finally, we measure the computation times required for training the deep models and prediction.
5.1. Data Setup
In general, we report the average value of a five cross-fold as generated by the scheme shown inFigure 10.

Appl. Sci. 2019, 9, 2646 14 of 28
N-train
Test Train
All
Test
Single (Ntrain
)
N-train
Train
Cross (Ntrain
)
Train Test
(Pretraining)
Figure 10. Scheme of the used cross fold training. Each color represents a part that is split into a fivefold (smaller boxes). Depending on the experiment different sections are chosen for training and testing.Optionally, a pretrained model on remaining data is used. For the cross-part scheme Ntrain can be setto zero to only train on other parts.
The different experimental setups are:
1. In the All approach, each part is split into a five fold whereof one fold of each part is chosen fortesting, the remainder for training.
2. Only use a five fold of one single part. One fold is used for testing while Ntrain data of theremainder serves for training. Optionally, a model pretrained on the two remaining parts can beutilised as starting point for the training on the actual part.
3. Cross-Fold: The same as experiment 2, however all pages of the remaining two parts are addedto the training data. Setting Ntrain to zero yields experiments that only incorporates data of theother parts and thus generate the models that are used for pretraining in the previous setup.
For both the staff line and symbol detection, setup 1 serves for a general evaluation of the proposedalgorithm. Then, we use setup 3 with Ntrain = 0 to test how a model generalised on unseen data witha somewhat different layout. Finally, setup 2 with and without pretraining and setup 3 with Ntrain ≥ 1conduce to test how the inclusion of actual data of the new part influences the accuracies.
5.2. Staff Line Detection
The staff line detection algorithm takes a pre-processed page image and outputs a list of staveseach containing four staff lines stored as polyline. To evaluate this algorithm, we first introduce theused metrics and then present the results when training the FCN on different data sets. First, allparts are joined, then the impact of training on two and testing on the remaining one is investigated(compare Figure 10). Finally, we evaluate the effect of increasing the number of training examples.
5.2.1. Metrics
To evaluate the staff line detection algorithm we use two different pixel-based metrics. A truepositive (TP) pixel pair of GT and prediction is allowed to have a distance of maximal 3 px, any otherpixel of a line is treated as false positive (FP) or false negative (FN) (compare Figure 11).
Similar to an object detection task, we first measure the percentage of staff lines that are detected(recall) and if too many lines were found (precision), which then yields the line detection FD
1 -score. Astaff line is marked as TP if the overlap of GT and prediction is greater than 0.5, that is more than 50%of the line must be hit, but the detected line may not be twice as long. This threshold is fairly harsh,since the detection of only a short section of a line causes both an FP and FN error.
The second metrics computes how many pixels of detected staff line are hit in length whichindicates whether the prediction was too long or too short (compare Figure 11). Thereto, we evaluatethe precision, recall and FLF
1 -score of all TP-lines in the upper measure. Finally, multiplication of bothindividual metrics yields the total F1-score.

Appl. Sci. 2019, 9, 2646 15 of 28
Furthermore, we evaluate the detection rate of a complete staff consisting of four staff lines (FS1 ). A
staff is marked as found if at least two staff lines (=50%) are correctly detected. This arbitrary thresholdis common for general object recognition tasks. For all detected staves we also count the relativeamount of how many of the four lines are correctly hit (FHL
1 ).
FN TP FPFP
Predicted line
GT line
Both lines overlap
Metrics
3px
Figure 11. Visualisation of the metric used to evaluate the staff line detection. The blue and red solidlines in the upper image denote the GT and prediction of a single staff line, respectively. The coloredarea is the allowed space of 3 px where lines must overlap to be counted as a match. If at least onevertical pixel is green it is counted as correct. The bottom line shows the intervals which are counted asfalse negative (FN), true positive (TP) and false positive (FP). The deviation in the first part counts bothas FN and FP.
5.2.2. Results on All Data
The results of the staff line detection using a five cross-fold on all available data are shown inTable 2.
Table 2. Staff line detection and length metrics with and without data augmentation. The last columncombines the two individual F1 measures by multiplication.
Line Detection Length FitModel Prec. Rec. FD
1 Prec. Rec. FLF1 Total F1
Default 0.996 0.998 0.997 0.977 0.995 0.985 0.982Data aug. 0.987 0.991 0.989 0.972 0.995 0.983 0.972
Clearly over 99% of all staff lines are found (recall) and over 99% of all predicted staff lines arecorrect (precision). The resulting FD
1 -score is about 99.7%.The length of the correctly detected staff lines has a FLF
1 -score of 98.5%; however, the recall that ishigher than the precision shows that lines mostly are too long.
Typical errors are shown in Figure 12. The green, red and blue colors indicate TP, FP and FNpixels, respectively, though FN are rare. Most errors are either staff lines that are too long, for examplecaused by falsely extending a staff or staff lines that are predicted on background. Both error typesare, among other things, caused by background noise such as bleeding staves or foreground text ordrop capitals. Naturally, other errors occur on damaged pages or very thin lines that must almost beguessed. Furthermore, there are always small inaccuracies at the exact beginning and at the end of astaff line which however are also a problem of the GT itself. The severity of the errors on the symboldetection will be discussed in Section 5.3.5.

Appl. Sci. 2019, 9, 2646 16 of 28
Figure 12. The left image shows typical errors during the staff line detection. Green pixels indicate TPs,red FPs, blue FNs. Either all lines in a staff are too long (third staff) or bled background is recognised(last staff). The right image shows a page with weak bleeding. In this image all staff lines are detectedcorrectly. The zoomed sub images focus on the start and end of a staff.
Table 3 lists the recognition rate of complete staves. It is astonishing that the scores of the staffdetection are (almost) identical to the staff line detection; however, this shows that the staff linedetection only predicts wrong lines across a whole staff, for example all four lines are too long or awhole staff is predicted on a blank page, as seen in Figure 12. This is also shown by a precision andrecall of 100% in the measure of hit lines. This states, that if a staff is detected all lines are correct. Inthe following, we will only report the staff line detection accuracy because it is almost equivalent tothe staff accuracy but also includes the metric concerning the exact length of the lines.
Table 3. Staff detection and the number of recognised lines in a detected staff with and without dataaugmentation. The last column combines the two individual F1 measures by multiplication.
Staff Detection Hit LinesModel Prec. Rec. FS
1 Prec. Rec. FHL1 Total F1
Default 0.996 0.998 0.997 1.000 1.000 1.000 0.997Data aug. 0.988 0.992 0.990 0.999 0.999 0.999 0.989
Applying data augmentation yields no improvements in both metrics, instead the results clearlyworsen. However, especially the precision drops compared to the recall. This is justified by errors thatare mostly confusions if a staff is bleeding or real, which is possibly caused by the strong augmentationsin contrast and brightness levels.
5.2.3. Results of Cross-Part Training
The results of cross-part training with and without data augmentation are shown in Table 4.

Appl. Sci. 2019, 9, 2646 17 of 28
Table 4. Comparing staff line detection using cross data set training: Two parts are chosen for trainingwhile the remainder is chosen as the test data set. The training data is split into five cross folds (fourfolds training, one for validation) of which the average scores are shown. The total score is computedas the product of the individual F1-scores. The lower half of the table shows the results when usingdata augmentation.
Detection Length FitTrain Test Prec. Rec. FD
1 Prec. Rec. FLF1 Total F1
Def.
2, 3 1 1.000 1.000 1.000 0.977 0.990 0.983 0.9831, 3 2 0.986 0.993 0.990 0.982 0.995 0.988 0.9781, 2 3 1.000 0.978 0.988 0.990 0.990 0.990 0.978
Mean 0.993 0.987 0.980
Aug.
2, 3 1 1.000 1.000 1.000 0.976 0.993 0.984 0.9841, 3 2 0.959 0.978 0.968 0.968 0.997 0.982 0.9511, 2 3 0.989 0.967 0.977 0.988 0.995 0.991 0.969
Mean 0.982 0.986 0.968
In general, it can be observed that on any split our algorithm obtains an FD1 -score of 98.8% or
higher in the staff line detection. On part 1 even 100% are reached, thus all staff lines are found with anoverlap of at least 50%. This shows that the staff line detection algorithm is very robust to new layouts.It is significant that part 2 suffers from data augmentation more clearly than part 3, while on part 1 stilla score of 100% is reached. The prediction of the line length is untouched. This can be explained bythe different kind of quality of the parts. While part 3 suffers very weakly from bleeding staves andits lines are drawn very clearly, part 2 consists of pages where bleeding lines are present and somestaff lines are barely visible and thus are more similar to background noise. Data augmentation creates,among other things, pages where the contrast of data is adjusted, which can explain why it is harderto distinguish actual staff lines, background and bleeding in part 2. In general, part 2 also yields thelowest FD
1 -score of 96.8%, which also shows that this part is the most complicated one.The staff line lengths are detected very similar across the parts with a mean FLF
1 -value of 98.6%and 98.7% (with and without data augmentation), which is almost identical to FLF
1 when training andevaluation on all data of 98.5% (compare Table 2). Hence, we conclude that the crucial component ofthe algorithm is to detect where staff lines are located and not to find the correct length of staff lines.
Note that the accuracies of these experiments are averaged over the parts while the results in theprevious Table 3 are the mean of all pages, which is why the values should not be directly comparedsince part 2 consists of more instances than the other parts.
5.2.4. Data Amount
In this section, the effect of increasing the amount of training examples is investigated. The resultsare summarised in Table 5. Each value is computed by first averaging all cross-folds of a single partand then taking the mean of all three respective experiments for all parts.
As expected, if no additional data is available, an increasing number of training examples yieldsa higher F1 score. The model trained on only one page already detects staves with FD
1 = 98.3% andthe length of a detected line matches with FLF
1 = 96.9%. Applying data augmentation on this dataimproves the results significantly, resulting in a FD
1 of over 99% and a FLF1 of 98.0% if one page is used.
Using more pages slightly increases the total F1-score up to 97.9%.Of course using a pretrained model on the remaining data (PT) or including the remaining data
into the data set (Inc.) clearly outperforms the standard training without data augmentation. However,it shows that including the data is in general better than just using a pretrained model if only one ortwo pages are available, which makes this approach more robust for few pages. If more data is usedthe error differences are caused by the training process itself for instance by choosing the randomseed for initialisation of the model. But it is to be expected that if many GT pages are available PT

Appl. Sci. 2019, 9, 2646 18 of 28
is superior since the model can fit directly on the respective data. Data augmentation improves theresults when PT is used, however not if the data is added to the dataset.
In general, it is remarkable that using Ntrain = 0, that is, only using data of the other partsfor training, yields very competitive results compared to any other experiment. Similar results areachieved if only training on one page of a single part but using data augmentation. Therefore, inpractice it can be expected that the staff detection algorithm generalised well on unseen layouts.
Table 5. Evaluation how the number of training instances influence the accuracy of pages with anunknown layout. All results are the averages of a five fold of each data set part. Only Ntrain pages arechosen for actual training. The major row grouping shows if pages of the remaining parts are includedduring training: Either no data is used (Default), a pretrained model on the data is used (PT), a largedata set comprising all other data which is extended by Ntrain is used (Inc.) The first row shows thecross-training (CT.) results of Table 4 without any data of the target layout. The two major columnsections show the results with and without data augmentation on the training data. The best values foreach Ntrain are marked bold.
No Data Augmentation Data AugmentationNtrain FD
1 FLF1 Tot. F1 FD
1 FLF1 Tot. F1
CT. 0 0.993 0.987 0.980 0.982 0.986 0.968
Default
1 0.983 0.969 0.953 0.991 0.980 0.9712 0.986 0.976 0.962 0.990 0.985 0.9754 0.994 0.979 0.973 0.994 0.984 0.978
All 0.989 0.984 0.974 0.994 0.986 0.979
PT
1 0.992 0.980 0.972 0.988 0.985 0.9732 0.992 0.981 0.973 0.993 0.984 0.9774 0.999 0.983 0.982 0.993 0.987 0.980
All 0.995 0.984 0.980 0.998 0.986 0.984
Inc.
1 0.992 0.988 0.980 0.985 0.988 0.9732 0.992 0.987 0.979 0.985 0.984 0.9694 0.994 0.986 0.980 0.986 0.986 0.972
All 0.994 0.988 0.982 0.988 0.986 0.974
5.3. Symbol and Note Component Detection
The symbol detection algorithm acts on extracted images that contain a single staff. To extractthese images as described in Section 4.4, we generally used the GT staff lines to gain scores that areindependent of the staff line accuracy, however in Section 5.3.5, we will also evaluate on predictedstaff lines to investigate the impact of staff lines that are too short or too long. Similar to the staff linedetection, we first present the used metrics. Afterwards, we determine different hyperparameters andsettings for the algorithm. Finally, the outcomes of training on different parts and varying the numberof training examples are shown.
5.3.1. Metrics
We use several metrics for the symbol detection evaluation. First, we measure both the detectionrates of symbols in general (Fall
1 ) and also the subgroups of notes (Fnote1 ) and clefs (Fclef
1 ). Thereto, wecompare all GT and prediction symbols and match a pair as TP if two symbols are closer than 5px, allother symbols in the prediction and GT are treated as FP and FN, respectively. In the subgroups, weonly account for symbols that match a note or clef in the GT or prediction. In the following, accidentalsare not evaluated separately because no accidental is predicated at all.
Moreover, we measure how well types and staff locations of the note or clef subgroups arepredicted. For each subgroup, our measure only takes TPs into account and counts the number ofcorrectly predicted types (Accnote
type and Acccleftype), that is the neume start and graphical connection for
notes and the clef type (C or F) for clefs, or the staff positions (Accnotepos and Accclef
pos).

Appl. Sci. 2019, 9, 2646 19 of 28
Our last measure evaluates either the diplomatic or the harmonic transcription. We compare theproduced sequence with the GT and count the number of insertions, deletions or substitutes in thesequence, which is similar to OCR tasks. As diplomatic transcription, we compare staff position andtypes of notes and clefs and their order; however, the actual horizontal position is ignored. Thus, onlythe resulting transcription is evaluated. The harmonic transcription is similar to the diplomatic one butignores the type of notes, which is why only the harmonic information that is the melody is captured.We represent these two sequence accuracy rates by dSAR and hSAR.
5.3.2. Preliminary Experiments
The first experiments listed in Table 6 test variations of the hyperparameters. Thereto, we usethe setup of Figure 10 where a cross-fold on all available data is taken. We list all scores, however themain focus lies on the general symbol detection, hSAR and dSAR, since these metrics do not act onsubgroups but on the whole prediction.
Table 6. Metrics of various hyperparameter settings for the symbol detection. All experiments wereconducted using a cross-fold of size five using all available data. The best values for each metricare highlighted.
Detection Type Position in Staff SequenceFall
1 Fnote1 Fclef
1 Accnotetype Accclef
type Accnotepos Accclef
pos hSAR dSAR
hstaff = 40 0.926 0.936 0.523 0.929 0.925 0.963 0.992 0.834 0.792hstaff = 60 0.953 0.961 0.655 0.944 0.911 0.968 0.994 0.877 0.844hstaff = 80 0.956 0.964 0.693 0.949 0.897 0.970 0.990 0.885 0.856hstaff = 100 0.956 0.965 0.673 0.950 0.911 0.970 0.995 0.884 0.856
Pad 0.962 0.966 0.829 0.949 0.982 0.967 0.990 0.893 0.866Dewarp 0.952 0.959 0.708 0.946 0.873 0.969 0.987 0.877 0.845Aug. 0.959 0.968 0.671 0.953 0.912 0.970 0.992 0.889 0.862Pad, Aug. 0.964 0.969 0.818 0.952 0.982 0.971 0.992 0.898 0.871
The upper block shows the results when the resolution of the input line is varied. The boldnumbers highlighting the best value for each score indicate that the accuracies seem to stagnate, whichis why in the following we use a line height of 80 px.
Using this hyperparameter, we evaluated the outcome of using padding, dewarping and dataaugmentation. Since padding is designed to add space to the left of a staff particularly where clefsare located, the highest score of clef type detection are achieved. As a result, the overall accuraciesimprove as well. Dewarping yields slightly worse results in any metric, which is why in the following,it was omitted in each experiment. We explain this unexpected behavior with the induced distortionswhich complicates the detection of notes and especially their connection. Data augmentation slightlyimproved the results compared to the default model. Since 80% of all data is used for training it is to beexpected, that data augmentation improves the results more clearly if less data is used for training. Weshow this behavior in Section 5.3.4. The last row shows the best overall result reached when combiningdata augmentation, padding, and choosing a line height of 80 px.
5.3.3. Results of Cross-Part Training
Table 7 show the result of cross-part training, that is testing on one of the three parts and trainingon the two remaining ones. In general, as expected, data augmentation improves the results. Theranking of accuracies follow the quality of the data: in summary, the highest values in Fall
1 , hSAR, anddSAR are achieved on part 1, followed closely by part 3, and finally part 2. The similar accuraciesreached on part 1 and 3 in almost all metrics show the greater similarities of these two parts and ingeneral a clearer notation compared to part 2.
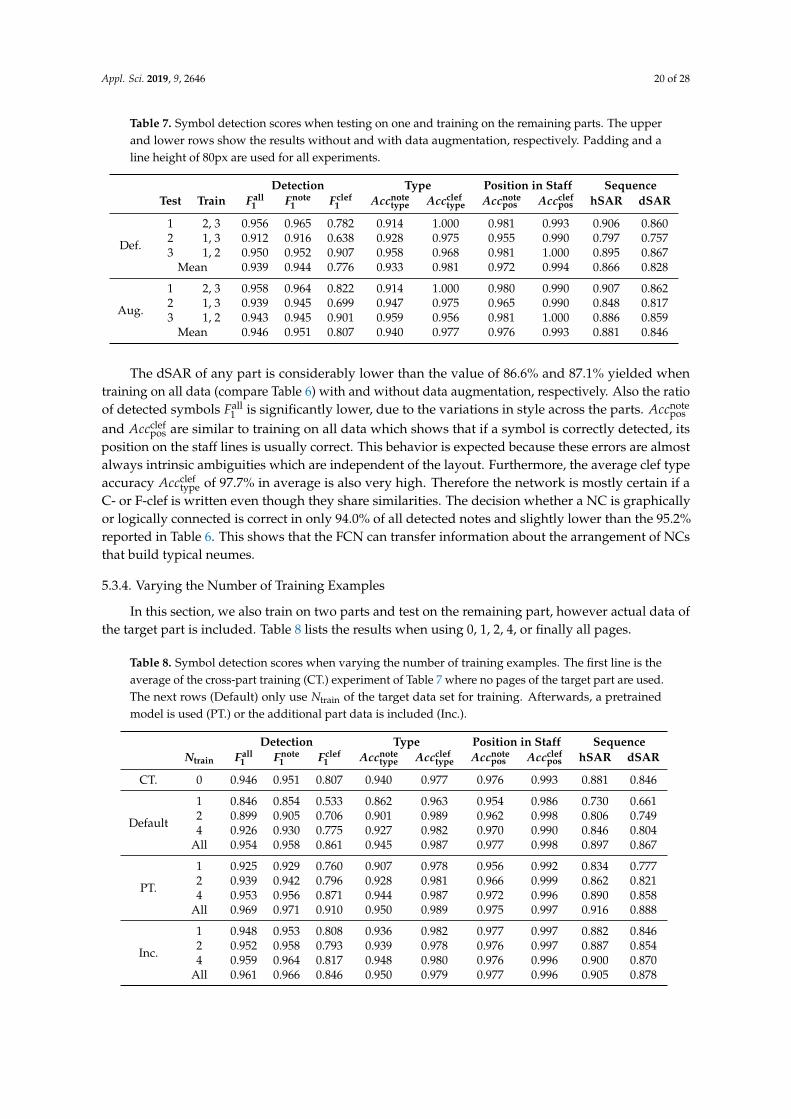
Appl. Sci. 2019, 9, 2646 20 of 28
Table 7. Symbol detection scores when testing on one and training on the remaining parts. The upperand lower rows show the results without and with data augmentation, respectively. Padding and aline height of 80px are used for all experiments.
Detection Type Position in Staff SequenceTest Train Fall
1 Fnote1 Fclef
1 Accnotetype Accclef
type Accnotepos Accclef
pos hSAR dSAR
Def.
1 2, 3 0.956 0.965 0.782 0.914 1.000 0.981 0.993 0.906 0.8602 1, 3 0.912 0.916 0.638 0.928 0.975 0.955 0.990 0.797 0.7573 1, 2 0.950 0.952 0.907 0.958 0.968 0.981 1.000 0.895 0.867
Mean 0.939 0.944 0.776 0.933 0.981 0.972 0.994 0.866 0.828
Aug.
1 2, 3 0.958 0.964 0.822 0.914 1.000 0.980 0.990 0.907 0.8622 1, 3 0.939 0.945 0.699 0.947 0.975 0.965 0.990 0.848 0.8173 1, 2 0.943 0.945 0.901 0.959 0.956 0.981 1.000 0.886 0.859
Mean 0.946 0.951 0.807 0.940 0.977 0.976 0.993 0.881 0.846
The dSAR of any part is considerably lower than the value of 86.6% and 87.1% yielded whentraining on all data (compare Table 6) with and without data augmentation, respectively. Also the ratioof detected symbols Fall
1 is significantly lower, due to the variations in style across the parts. Accnotepos
and Accclefpos are similar to training on all data which shows that if a symbol is correctly detected, its
position on the staff lines is usually correct. This behavior is expected because these errors are almostalways intrinsic ambiguities which are independent of the layout. Furthermore, the average clef typeaccuracy Accclef
type of 97.7% in average is also very high. Therefore the network is mostly certain if aC- or F-clef is written even though they share similarities. The decision whether a NC is graphicallyor logically connected is correct in only 94.0% of all detected notes and slightly lower than the 95.2%reported in Table 6. This shows that the FCN can transfer information about the arrangement of NCsthat build typical neumes.
5.3.4. Varying the Number of Training Examples
In this section, we also train on two parts and test on the remaining part, however actual data ofthe target part is included. Table 8 lists the results when using 0, 1, 2, 4, or finally all pages.
Table 8. Symbol detection scores when varying the number of training examples. The first line is theaverage of the cross-part training (CT.) experiment of Table 7 where no pages of the target part are used.The next rows (Default) only use Ntrain of the target data set for training. Afterwards, a pretrainedmodel is used (PT.) or the additional part data is included (Inc.).
Detection Type Position in Staff SequenceNtrain Fall
1 Fnote1 Fclef
1 Accnotetype Accclef
type Accnotepos Accclef
pos hSAR dSAR
CT. 0 0.946 0.951 0.807 0.940 0.977 0.976 0.993 0.881 0.846
Default
1 0.846 0.854 0.533 0.862 0.963 0.954 0.986 0.730 0.6612 0.899 0.905 0.706 0.901 0.989 0.962 0.998 0.806 0.7494 0.926 0.930 0.775 0.927 0.982 0.970 0.990 0.846 0.804
All 0.954 0.958 0.861 0.945 0.987 0.977 0.998 0.897 0.867
PT.
1 0.925 0.929 0.760 0.907 0.978 0.956 0.992 0.834 0.7772 0.939 0.942 0.796 0.928 0.981 0.966 0.999 0.862 0.8214 0.953 0.956 0.871 0.944 0.987 0.972 0.996 0.890 0.858
All 0.969 0.971 0.910 0.950 0.989 0.975 0.997 0.916 0.888
Inc.
1 0.948 0.953 0.808 0.936 0.982 0.977 0.997 0.882 0.8462 0.952 0.958 0.793 0.939 0.978 0.976 0.997 0.887 0.8544 0.959 0.964 0.817 0.948 0.980 0.976 0.996 0.900 0.870
All 0.961 0.966 0.846 0.950 0.979 0.977 0.996 0.905 0.878

Appl. Sci. 2019, 9, 2646 21 of 28
As expected, an increasing number of training examples leads in general to improve recognitionrates and thus higher scores in any experiment. However, it is remarkable that the model which onlycomprises one page without any other techniques already yields an dSAR of 66.1% and a hSAR of73.0%. Nevertheless, the scores significantly improve if other data are incorporated even if no page ofthe target part is included at all (Ntrain = 0), yielding a dSAR of 84.6% and a hSAR of 88.1%. Only if allavailable pages are used for training (dSAR = 86.7%), the default model is slightly better than trainingon the other parts only (dSAR = 84.6%).
However, there are huge differences when to use pretraining or data inclusion. If only few dataof the target set are available (1, 2, 4) including the data yields better results but if many examplesare used during training, PT is superior. The reason is that the PT model yields a good starting pointwhich is then optimised for one specific part if enough target data is used. Whereas, if all data isincluded, the model is forced to generalise on any part and not on a specific one.
Furthermore, the experiments show that the accuracy of the position in staff increase with a highernumber of training instances in the default model or when using PT but are almost constant if zero orall instances are added to the training set. Obviously, having more data available it is easier to findand remember good rules that state how to resolve incertitudes.
On the whole, the model training if no data of the target part already yields a very robust Fall1 -
and dSAR-score. Even if PT and all data is used the dSAR increases only from 88.1% to 91.5%, whichis a relative improvement of about 4%. However, we highly expect that if the differences betweentraining and testing data are even more clear, the effect will increase.
5.3.5. Symbol Detection on Predicted Staves
Finally, we test the combination of both algorithms. Thus, in this experiment, the impact ofshortened or too long staff lines of the predicted staves can be investigated. Thereto, we only evaluatedon staves that are marked as TPs which is why for an combined result the amount of detected stavesmust be included but which is almost 1. We evaluate the model which is trained on a cross-fold of allpages combined.
The experiment yields a hSAR of 88.9% and a dSAR of 86.2%, which is slightly worse than theresults obtained if predicted on the corrected lines (89.8% and 87.1% respectively). The sole new errorsthat can occur are FPs if the staves are expanded into other content such as drop capitals or text, orFNs if the staves are too short.
In conclusion, the dSAR decreases by only 1% on detected staves due to wrong staff lengths.The score is further reduced by approximately 1% when accounting for FPs and FNs during thestaff prediction.
Figure 13 shows the full output of the symbol detection acting on recognised staves. Hereby,all symbol positions are mapped relative to the page by transforming the prediction of the symboldetection to global space. The various error sources are discussed in Section 5.3.6.

Appl. Sci. 2019, 9, 2646 22 of 28
Figure 13. The page visualises the full prediction of the staff line and symbol detection. Encoded stafflines are drawn as blue lines on top of the red staff lines of the original manuscript, the green dashedlines mark the bounding boxes of single staves. The vertical dashed lines separate neumes whose NCsare drawn as yellow boxes. Graphical connection withing a neume are indicated by a black strokebetween two NCs. The reading order is represented by a thin dotted line that connects all NCs withinga staff. Small crosses inside of the yellow box of a NCs mark the discrete location of the symbol relativeto the staff lines. The cyan symbols mark clefs.

Appl. Sci. 2019, 9, 2646 23 of 28
5.3.6. Error Analysis
Regarding the error analysis, we compare the predicted and GT sequences and count how manydeletions or insertions of a specific type are required to gain the GT. We use the model, when trainingand evaluating a cross fold comprising all data, which yields a dSAR of 87.1% (compare Table 6). Notethat in this section replacements are treated as two errors: one insertion and one deletion. Table 9 listseight groups of errors and their relative impact on the total dSAR whereas Figure 14 shows examplesfor the errors.
Table 9. Error analysis: The relative amount of errors of the output sequence is categorised.
Group Error
False Negatives 51.7%1. Missing Note 21.2%2. Wrong Connection 10.8%3. Wrong Location 14.3%4. Missing Clef 3.5%5. Missing Accidental 1.9%
False Positives 48.3%6. Additional Note 20.6%2. Wrong Connection 10.8%3. Wrong Location 14.3%7. Additional Clef 2.6%8. Additional Accidental 0.0%
Total 100%
Figure 14. The three lines exemplarily show typical errors of the symbol detection algorithm. Refer toTable 9 for the definition of the numbers indicating different groups. The yellow boxes mark single NCs,solid lines between two NCs indicate that the second note is graphically connected to the previous.The dashed vertical lines separate single neumes and therefore represent logical connections. The cyansymbols denote clefs. The connecting thin dotted line represents the reading order of the symbols.
The first result is that the combined amount of FPs and FNs are balanced (48% vs. 52%). Notes aremissed (1) most often if the contrast between notes and background is too low or if neumes are writtenvery dense, which also significantly affects the prediction accuracy of connection types (2). Wrongnote positions (3) occur only at locations where even for a human it is difficult to decide whether theNC is located on a line or in a space. Mainly neumes with stacked NCs, such as a so-called pes (firstneume in Figure 1) or scandicus, suffer from these errors. These neumes also induce errors in reading

Appl. Sci. 2019, 9, 2646 24 of 28
order which is only captured by SAR metrics. Since the NCs are ordered left to right based on theirprediction position, it happens that the upper note, which should be sung later, is predicted a little tofar to the left compared to the lower note. Observations show that the first clef in a staff was almostalways detected, whereas a clef in a line was very often missed (4) and sometimes misrecognisedas two notes. Accidentals are not detected at all (5) possibly due to their underrepresentation in theavailable data set.
Additional notes (6) mostly occur if clefs or accidentals are labeled as two notes or if noise orbleeding is falsely detected as symbols. Wrong connections and locations count also as FP which iswhy their ratio is the same. The amount of FPs that are clefs (7) is very low and since no accidentalsare predicted at all no FPs (8) can occur.
In conclusion, it can be observed that the majority of errors are, as expected, note related; however,missing (21.2%), additional (20.6%), wrong connection (21.6%) and wrong location (28.6%) errors areroughly balanced.
5.4. Timing
Finally, we measured the times required for predicting staff lines or the symbols of a staff lineincluding data loading and pre- and postprocessing steps (see Table 10). The time for loading themodel which is only required once is included. All times were measured on a Nvidia Titan X GPUand an Intel Core i7-5820K processor, while the FCN was implemented in Tensorflow. Moreover, weobtained the results only when using the CPU or a GPU if available.
Table 10. Prediction and training times in seconds. For the staff line detection the numbers denote thetime to process a whole page, while for the symbol detection the reference is a single staff. Predictionincludes pre- and postprocessing; however, training only refers to a single iteration.
Staff Line SymbolsGPU CPU GPU CPU
Predict 3.5 3.7 0.15 0.12Train 0.12 3.6 0.04 0.42
To process a full page the staff line detection requires 3.7 (CPU) and 3.5 (GPU) seconds, thereforeabout 3 min for the full dataset. The pre-processing step, which normalises the input image, takesabout half of the time. The application of the FCN follows with about 40%, however the differencebetween CPU and GPU is minor. This can be explained by the shorter model loading time whenusing the CPU and the faster computation time but a required data transfer when using the GPU. Theremaining time is consumed by the postprocessing which generates the final output.
The symbol detection requires about 0.12 (CPU) and 0.15 (GPU) seconds for the prediction of asingle staff, thus the complete dataset takes one minute to predict. Because no pre-processing besidescutting the image is required and the postprocessing step only consists of a connected componentanalysis, it is clearly faster than the pre- and postprocessing of the staff line detection, yet it is the mosttime consuming step. Compared to the staff detection, the CPU is even a bit faster due to the smallerinput line image. In total about 4 minutes are required to predict both the staves and symbols on all 49pages.
Especially for training, GPU usage is almost indispensable to enable a fast back-propagationwhich computes the weight differences required for training the network. Compared to the CPU, thestaff line training on the GPU that acts on the full page yields a speed-up of 30, which is justified withthe convolution and pooling operations of the FCN that are highly optimised and perfectly suited forthe GPU. Note that training a single instance is faster than prediction because pre- and postprocessingsteps are not required.

Appl. Sci. 2019, 9, 2646 25 of 28
6. Conclusion and Future Work
This paper introduces a new system for automatic staff line and symbol detection on historicalmedieval notations based on deep neural networks. The main results on our data set are (compareTable 11):
Table 11. Overview of the main results of this paper.
Task Score
F1-scores of staff line & staff detection >99%F1-score of detected Symbols >96%Diplomatic sequence accuracy (dSAR) ≈87%
• Staff lines and staves are recognised with an F1-score greater than 99%. The major error sourcesare staves that are detected on a bled background or which are extended into other foregrounds(e.g., text).
• A trained staff line model generalises flawlessly to different layout types and thus needsno retraining.
• Our best model finds symbols with an F1-score of above 96% and yields a dSAR of about 87%.• Pretraining is helpful but not mandatory for the symbol detection, since the dSAR only increases
about 4%.• The full transcription (compare Figure 13) comprises staves consisting of four staff lines stored as
polylines, the position and type of clefs, the position of accidentals, the position and graphicalconnection of NCs which comprise neumes.
To further improve the staff detection, which is close to perfect, more experiments must beconducted to evaluate the effect of data augmentation which is unclear in the proposed manner.Augmentations in brightness and contrast must especially be reconsidered to allow for more robustmodels. Furthermore, staves that are detected on background can be dropped by introducing athreshold of minimum symbols per staff because the symbol detection only occasionally detectssymbols on background. Another problem are staves that extend into text or drop capitals. Howevera symbol detection which is explicitly trained to ignore text could help to determine the boundariesbetween staff and text because no symbols should be detected there.
However, the primary goal of our future work is to further reduce the errors of the symboldetection. First, the error analysis shows that false notes are the main source of symbol errors. Theconnection and location of notes induces many errors, which however are also difficult tasks forhumans. We proposed to evaluate a two stage approach similar to Reference [7] that first predictneumes as combined components and then separates them into individual NCs; however, withincorporation of deep neural networks for object detection. Furthermore, to improve the quality of clefor accidental prediction more data must be gathered or over-sampled in the training data either bydata augmentation or by presenting these lines more often.
A completely different approach, which is based on the state-of-the-art networks in OCR, is todirectly use sequence-to-sequence networks as already proposed in Reference [28] on contemporaryOMR. A CNN/LSTM hybrid network with a combination of a CTC-loss function directly predicts anNC sequence. The main advantage is that GT production is easier since only the sequence has to betranscribed but not the actual position of each single NC. However, it is to be expected that more GT isrequired since it has to learn autonomously both the shape of all music symbols and the staff linesto infer the location of the symbols. It is still an open issue whether this CTC-approach in fact yieldsimproved results. Furthermore, because this approach directly predicts a symbol sequence and noactual note positions relative to the image, it cannot be used if this information is mandatory.

Appl. Sci. 2019, 9, 2646 26 of 28
Author Contributions: C.W. conceived and performed the experiments and created the GT data. C.W. andA.H. contributed the staff line detection algorithm. C.W. designed the symbol detection algorithm. C.W. and F.P.analysed the results. C.W. wrote the paper with substantial contributions of F.P.
Funding: This research received no external funding.
Acknowledgments: We would like to thank Tim Eipert for helping to resolve ambiguities in the data set.
Conflicts of Interest: The authors declare no conflict of interest.
Abbreviations
The following abbreviations are used in this manuscript:
CNN Convolutional Neural NetworkCPU Central Processing UnitCTC Connectionist Temporal ClassificationdSAR Diplomatic Sequence Accuracy RateFCN Fully Convolutional NetworkFN False NegativeFP False PositivehSAR harmonic Sequence Accuracy RateLSTM Long Short-Term MemoryGPU Graphical Processing UnitGT Ground TruthNC Note ComponentOCR Optical Character RecognitionOMR Optical Music RecognitionPT PretrainingRLE Run Length EncodingTP True Positive
References
1. Good, M. MusicXML for notation and analysis. In The Virtual Score: Representation, Retrieval, Restoration;MIT Press: Cambridge, MA, USA, 2001; Volume 12, pp. 113–124.
2. Hankinson, A.; Burgoyne, J.A.; Vigliensoni, G.; Fujinaga, I. Creating a large-scale searchable digital collectionfrom printed music materials. In Proceedings of the 21st International Conference on World Wide Web,Lyon, France, 16–20 April 2012; pp. 903–908.
3. Hild, E.S. Tropen zu den Antiphonen der Messe aus Quellen französischer Herkunft; Corpus Monodicum. Dieeinstimmige Musik des lateinischen Mittelalters, Schwabe Verlag: Basel, Switzerland, 2016.
4. Haug, A.; Kraft, I.; Zühlke, H. Tropen zu den Antiphonen der Messe aus Quellen deutscher Herkunft; CorpusMonodicum. Die einstimmige Musik des lateinischen Mittelalters, Schwabe Verlag: Basel, Switzerland, 2019.
5. Corbin, S.; Institut, B.M. Die Neumen; Palaeographie der Musik. Bd. 1, Fasz. 3; Arno Volk-Verlag: Köln,Germany, 1977.
6. Vigliensoni, G.; Burgoyne, J.A.; Hankinson, A.; Fujinaga, I. Automatic pitch recognition in printedsquare-note notation. In Proceedings of the ISMIR, Miami, FL, USA, 24–28 October 2011.
7. Ramirez, C.; Ohya, J. Automatic recognition of square notation symbols in western plainchant manuscripts.J. New Music Res. 2014, 43, 390–399. [CrossRef]
8. Baró, A.; Riba, P.; Calvo-Zaragoza, J.; Fornés, A. Optical Music Recognition by Long Short-Term MemoryNetworks. In Graphics Recognition. Current Trends and Evolutions; Springer International Publishing: Cham,Switzerland, 2018; pp. 81–95.
9. Keil, K.; Ward, J.A. Applications of RISM data in digital libraries and digital musicology. Int. J. Digit. Libr.2019, 20, 3–12. [CrossRef]
10. Fornés, A.; Dutta, A.; Gordo, A.; Lladós, J. CVC-MUSCIMA: A ground truth of handwritten music scoreimages for writer identification and staff removal. Int. J. Doc. Anal. Recognit. 2012, 15, 243–251. [CrossRef]

Appl. Sci. 2019, 9, 2646 27 of 28
11. Van der Wel, E.; Ullrich, K. Optical Music Recognition with Convolutional Sequence-to-Sequence Models.In Proceedings of the 18th International Society for Music Information Retrieval Conference, ISMIR 2017,Suzhou, China, 23–27 October 2017; Cunningham, S.J., Duan, Z., Hu, X., Turnbull, D., Eds.; 2017; pp. 731–737.
12. Sutskever, I.; Vinyals, O.; Le, Q.V. Sequence to sequence learning with neural networks. In Proceedings ofthe 27th International Conference on Neural Information Processing Systems—Volume 2, Montreal, QC,Canada, 8–13 December 2014; pp. 3104–3112.
13. Calvo-Zaragoza, J.; Rizo, D. End-to-end neural optical music recognition of monophonic scores. Appl. Sci.2018, 8, 606. [CrossRef]
14. Graves, A.; Fernández, S.; Gomez, F.; Schmidhuber, J. Connectionist temporal classification: labellingunsegmented sequence data with recurrent neural networks. In Proceedings of the 23rd InternationalConference on Machine Learning, Pittsburgh, PA, USA, 25–29 June 2006; pp. 369–376.
15. Breuel, T.M. High Performance Text Recognition Using a Hybrid Convolutional-LSTM Implementation. InProceedings of the 14th IAPR International Conference on Document Analysis and Recognition, ICDAR2017, Kyoto, Japan, 9–15 November 2017; pp. 11–16. [CrossRef]
16. Wick, C.; Reul, C.; Puppe, F. Comparison of OCR Accuracy on Early Printed Books using the Open SourceEngines Calamari and OCRopus. JLCL 2018, 33, 79–96.
17. Song, W.; Cai, J. End-to-end Deep Neural Network for Automatic Speech Recognition; Standford CS224D Reports;Stanford University: Stanford, CA, USA, 2015.
18. Zhang, Y.; Chan, W.; Jaitly, N. Very deep convolutional networks for end-to-end speech recognition. InProceedings of the 2017 IEEE International Conference on Acoustics, Speech and Signal Processing (ICASSP),New Orleans, LA, USA, 5–9 March 2017; pp. 4845–4849.
19. Pugin, L.; Zitellini, R.; Roland, P. Verovio: A library for Engraving MEI Music Notation into SVG. InProceedings of the 15th International Society for Music Information Retrieval Conference, ISMIR 2014, Taipei,Taiwan, 27–31 October 2014; Wang, H., Yang, Y., Lee, J.H., Eds., 2014; pp. 107–112.
20. Pacha, A.; Choi, K.Y.; Coüasnon, B.; Ricquebourg, Y.; Zanibbi, R.; Eidenberger, H. Handwritten music objectdetection: Open issues and baseline results. In Proceedings of the 2018 13th IAPR International Workshopon Document Analysis Systems (DAS), Vienna, Austria, 24–27 April 2018; pp. 163–168.
21. Ren, S.; He, K.; Girshick, R.; Sun, J. Faster r-cnn: Towards real-time object detection with region proposalnetworks. In Proceedings of the Advances in Neural Information Processing Systems, Montreal, QC, Canada,7–12 December 2015; pp. 91–99.
22. Dai, J.; Li, Y.; He, K.; Sun, J. R-fcn: Object detection via region-based fully convolutional networks. InProceedings of the Advances in Neural Information Processing Systems, Barcelona, Spain, 5–10 December2016; pp. 379–387.
23. Hajic, J.; Pecina, P. The MUSCIMA++ dataset for handwritten optical music recognition. In Proceedingsof the 2017 14th IAPR International Conference on Document Analysis and Recognition (ICDAR), Kyoto,Japan, 9–15 November 2017; Volume 1, pp. 39–46.
24. Calvo-Zaragoza, J.; Toselli, A.H.; Vidal, E. Early handwritten music recognition with hidden markov models.In Proceedings of the 2016 15th International Conference on Frontiers in Handwriting Recognition (ICFHR),Shenzhen, China, 23–26 October 2016; pp. 319–324.
25. Calvo-Zaragoza, J.; Toselli, A.H.; Vidal, E. Handwritten music recognition for mensural notation: formulation,data and baseline results. In Proceedings of the 2017 14th IAPR International Conference on DocumentAnalysis and Recognition (ICDAR), Kyoto, Japan, 9–15 November 2017; Volume 1, pp. 1081–1086.
26. Miyao, H. Stave extraction for printed music scores using DP matching. J. Adv. Comput. Intell. Intell. Inform.2004, 8, 208–215. [CrossRef]
27. Dalitz, C.; Droettboom, M.; Pranzas, B.; Fujinaga, I. A comparative study of staff removal algorithms.IEEE Trans. Pattern Anal. Mach. Intell. 2008, 30, 753–766. [CrossRef] [PubMed]
28. Calvo-Zaragoza, J.; Castellanos, F.; Vigliensoni, G.; Fujinaga, I. Deep neural networks for documentprocessing of music score images. Appl. Sci. 2018, 8, 654. [CrossRef]
29. Wick, C.; Puppe, F. Fully Convolutional Neural Networks for Page Segmentation of Historical DocumentImages. In Proceedings of the 13th IAPR International Workshop on Document Analysis Systems, DAS 2018,Vienna, Austria, 24–27 April 2018; pp. 287–292. [CrossRef]
30. Rebelo, A.; Fujinaga, I.; Paszkiewicz, F.; Marcal, A.R.S.; Guedes, C.; Cardoso, J.S. Optical music recognition:state-of-the-art and open issues. Int. J. Multimed. Inf. Retr. 2012, 1, 173–190. [CrossRef]

Appl. Sci. 2019, 9, 2646 28 of 28
31. Ronneberger, O.; Fischer, P.; Brox, T. U-Net: Convolutional Networks for Biomedical Image Segmentation.In Proceedings of the MICCAI 2015—18th International Conference on Medical Image Computing andComputer-Assisted Intervention, Munich, Germany, 5–9 October 2015; Navab, N., Hornegger, J., Wells, W.M.,Frangi, A.F., Eds.; Lecture Notes in Computer Science; Springer: Cham, Switzerland, 2015; Volume 9351,pp. 234–241.
32. Fujinaga, I. Staff detection and removal. In Visual Perception of Music Notation: On-Line and Off Line Recognition;IGI Global: Hershey, PA, USA, 2004; pp. 1–39.
33. Cardoso, J.S.; Rebelo, A. Robust Staffline Thickness and Distance Estimation in Binary and Gray-Level MusicScores. In Proceedings of the 20th International Conference on Pattern Recognition, ICPR 2010, Istanbul,Turkey, 23–26 August 2010; pp. 1856–1859. [CrossRef]
c© 2019 by the authors. Licensee MDPI, Basel, Switzerland. This article is an open accessarticle distributed under the terms and conditions of the Creative Commons Attribution(CC BY) license (http://creativecommons.org/licenses/by/4.0/).

Automatic Square Notation Transcription of Medieval Music
Manuscripts using CNN/LSTM-Networks and the segmentation-free
CTC-Algorithm
C. Wick and F. Puppe
Chair for Artificial Intelligence and Knowledge Systems, University of Wurzburg, 97074Wurzburg, Germany;
ARTICLE HISTORY
Compiled May 28, 2020
ABSTRACTThe automatic recognition of scanned Medieval manuscripts still represents a chal-lenge due to degradation, non-standard layouts, or notations. This paper focuseson the Medieval square notation developed around the 11th century which is com-posed of staff lines, clefs, accidentals, and neumes which are basically connectedsingle notes. We present a novel approach to tackle the automatic transcription byapplying CNN/LSTM networks that are trained using the segmentation-free CTC-loss-function which considerably facilitates the Ground Truth (GT)-production. Forevaluation, we use three different manuscripts and achieve a diplomatic Symbol Ac-curacy Rate (dSAR) of 86.0% on the most difficult book and 92.2% on the cleanestone. To further improve the results, we apply a neume dictionary during decodingwhich yields a relative improvement of about 5%.
KEYWORDSOptical Music Recognition; Historical Document Analysis; Medieval manuscripts;neume notation; CNN, LSTM, CTC
1. Introduction
Musicology still relies heavily on manual processes to transcribe manuscripts, espe-cially when examining historic notations like the Medieval square notation. To reducethe time expenditure required to obtain the transcripts, an application of novel auto-matic approaches using state-of-the-art methodology of artificial intelligence is promis-ing. An applicable automatic transcription would allow to produce great amounts ofannotated data which can then be used for large-scale data analysis, such as musicalgrammars (see e.g., Baroni, Maguire, & Drabkin, 1983; Hamanaka, Hirata, & Tojo,2016) or the comparison of melodies (see e.g., Grachten, Arcos, & Lopez de Mantaras,2004; Janssen, Kranenburg, & Volk, 2017). The examined Medieval square notationsare special because they are similar to modern monophonic Common Western MusicNotation (CWMN) in the sense that they already use staff lines (here four) and clefs todefine the pitch of notes. Notes are always part of larger components called “neumes”which historically originate from a stroke which depicts a short movement of music.Furthermore, in contrast to even earlier notations, the square notation uses discretesquare-shaped Note Components (NCs). An example line is shown in Figure 1 which

Figure 1. An original line (first image) and its transcription equivalent (second line) rendered in a modernnotation. Looped NCs are visualised by a slur (a), the start of a new neume is indicated by a wider space (b),
gapped NCs are notated with a small space (c). The last line shows the label sequence of the input line whichis the Ground Truth (GT) for the proposed method. A single token consists of the symbol type (note, clef,
or accidental), its subtype (c- or f-clef for clefs; looped, gapped, or note start for notes; flat or sharp for theaccidentals), and the position on the staff lines (see position labelling). Based on the clef and the positions ofthe notes it is possible to obtain the melody of the transcription equivalent.
also includes a modern transcription equivalent (second line): each NC corresponds toa note, notes within a neume that are graphically connected are drawn with a slur;NCs that belong to the same note, but are not connected are rendered with a smallerspace. The lyrics of the line, whose syllables can help to differentiate between twoneumes or a single neume with two gapped NCs, is also shown.
In this paper, we propose a methodology that is well-established in the field ofAutomatic Text Recognition (ATR): we tackle the transcription of a music staff assequence-to-sequence problem where the image of a staff is the input and the se-quence of music symbols represents the output (bottom of Figure 1). The method ofchoice is a combination of a Convolutional Neural Network (CNN) and a bidirectionalLSTM (Hochreiter & Schmidhuber, 1997) architecture which is trained using the so-called Connectionist Temporal Classification (CTC)-loss (Graves, Fernandez, Gomez,& Schmidhuber, 2006). This setup is well-known from the application in ATR (see e.g.,Breuel, 2017; Wick, Reul, & Puppe, 2018), but also automatic speech recognition (seee.g., Das, Li, Zhao, & Gong, 2018; Salazar, Kirchhoff, & Huang, 2019). In contrast tothe previous approach of (Wick, Hartelt, & Puppe, 2019) using an Fully ConvolutionalNetworks (FCNs) which was trained using a traditional cross-entropy-loss, the advan-tage is that the GT is allowed to be segmentation-free, that is, the sequence of musicsymbols is sufficient while the accurate pixel-positions are not required. This leads to asimplification of the cumbersome process of GT-production because the actual pixelspositions of the notes are irrelevant for further processing steps. Similar to the ATR,it is now sufficient to provide a sequence of labels instead of meticulously markingthe positions of the characters manually. It is even possible to include existing tran-scriptions that only accounted for the music symbols to obtain a modern transcriptionequivalent.
Currently, a fully automatic transcription demanding mixed models that both are
2

highly performant and generalise across different books with a high variety of nota-tions (even within the area of square notations) is not possible, yet. Instead, book-specific models must be trained each requiring its own GT. Furthermore, no auto-matic model is error-free which is why the transcription process must be considered assemi-automatic. To simplify the GT-production and the actual training, the proposedmethodology can be integrated in existing semi-automatic Optical Music Recogni-tion (OMR)-frameworks such as OMMR4all (Wick & Puppe, 2019) which provides anoverlay-editor for error correction and a Graphical User Interface (GUI) to train themodels iteratively.
In this paper, we claim the following contributions:
• We are the first to apply a segmentation free CNN/LSTM-hybrid network trainedusing the CTC-algorithm to transcribe Medieval square notation.• We compare the proposed approach to a previous one based on FCNs (see Wick,
Hartelt, & Puppe, 2019) and obtained equivalent results on the same dataset.• We improve the prediction by about 5% using three different CTC-decoders
which incorporate a dictionary of neumes.• We evaluate the proposed method on three datasets with more than 21,000
symbols in total and achieve a dSAR of 86.0% on the most difficult book and92.2% on the cleanest one.• We examine the performance of training mixed models and the effect of the
number of training instances.• We provide a thorough error analysis.
The remainder of this paper is structured as follows: first, we present publicationsrelated to OMR on historical manuscripts and those that apply similar methods onCWMN. Afterwards, the used datasets are introduced before our proposed method isdescribed. Finally, we present and discuss our results and conclude the paper by givingan overview of future work.
2. Related Work
In this section, we present recent publications related to the application ofCNN/LSTM-hybrids for OMR and those that focus on historical notations. For amore thorough survey of the past developments of OMR refer to the publication ofRebelo et al. (2012).
A combination of CNNs with LSTMs in an encoder/decoder approach known fromthe sequence-to-sequence task of machine translation was proposed by van der Weland Ullrich (2017): the CNN/LSTM-based encoder processes the image of a staffto obtain a vector as digital representation of the score. Then, the decoder whichis only based on LSTMs to predict a sequence of pitches, durations, and finally astop mark. The evaluation dataset consisted of perfectly rendered scores from theMuseScore Sheet Music Archive1 and provided 108 pitch and 48 duration categories.Using data augmentation, a pitch and duration accuracy of 81% and 94% was achieved,respectively. Therefore, the total accuracy of notes was 80%.
Calvo-Zaragoza, Valero-Mas, and Pertusa (2017) proposed a CNN/LSTM-hybrid ar-chitecture combined with the CTC-loss function to tackle the automatic recognition ofprinted monophonic scores in CWMN which is equivalent to our proposed approach for
1https://musescore.com
3

Medieval manuscripts. For evaluation, they published their so-called PrIMuS (PrintedImages of Music Staves) dataset which comprises 87,678 real-music incipts renderedby Verovio (Pugin, Zitellini, & Roland, 2014), a web-based music engraver. Their ap-proach required a distinct label for each combination of pitch and rhythm, which iswhy in total up to 1,781 different classes were required. The evaluation yielded a diplo-matic Symbol Error Rate (dSER), that is, the number of mistakes normalised by thelength of the GT, of approximately 1%. In contrast, even though our fundamentalapproach is equivalent, we propose a considerably different network architecture spe-cialised to square notations which also includes an adapted data representation (seeSection 4.2.1). In general, our task is clearly more difficult because compared to theideally rendered CWMN music, our documents are both handwritten and historicalwhich induce further challenges such as non-uniform writings, degradation, or noise,such as bleeding through. Furthermore, in contrast to monophonic CWMN, notes canbe written on top of each other which is why the network has to learn to predict twosubsequent labels for the same symbol.
To process single lines of handwritten or rendered music, Baro, Riba, Calvo-Zaragoza, and Fornes (2019) also combine‘d CNNs and LSTMs to predict the pitchand rhythm of notes and other musical symbols (e.g., rests or clefs). Their approachwas able to not only recognise monophonic, but homophonic music (see e.g., Calvo-Zaragoza, Hajic jr., & Pacha, 2019), that is, multiple notes can occur at the same timewith the same duration. Thereto, they predicted two probability maps, one for symbolsand one for pitches with 80 and 28 classes, respectively. In contrast to a CTC-basedapproach, training required segmented symbols, not just the plain sequence. Datain such form was available in the rendered PrIMuS and handwritten MUSCIMA++(Hajic jr. & Pecina, 2017) datasets, both written in CWMN. They achieved a totaldSER (both rhythm and pitch must be correct) of 0.3% and 54.5% when evaluatingon PrIMuS and MUSCIMA++, respectively. The differences indicate the huge gapbetween the recognition accuracy of handwritten and engraved music even in the caseof mono- or homophonic music.
In the context of an automatic transcription of historical notations of monophonicmusic only a few recent attempts have been published. Vigliensoni, Burgoyne, Han-kinson, and Fujinaga (2011) focused on the pitch detection of square notation docu-ments of the Liber Usualis (Catholic Church, 1963) printed in 1961. Using the staffline detection of Miyao (2004), the staff line removal of Roach and Tatem (see e.g.,Dalitz, Droettboom, Pranzas, & Fujinaga, 2008), and an automatic neume classifica-tion algorithm based on a pattern matching algorithm which was trained on 40 pages,they evaluated the pitch detection on 20 pages consisting of 2,219 neumes and 3,114pitches. The pitch of the first component of a neume was correctly detected for 97% ofall neumes, while only 95% of all note components including single-tone neumes werefound.
Ramirez and Ohya (2014) proposed a pipeline to automatically transcribe squarenotation on manuscripts of the 14th to 16th century. Their dataset comprised 136pages of the Digital Scriptorium repository2 and contained 847 staves and over 5,000neumes. First, a brute-force algorithm detected staves by matching a staff template offour staff lines with varying positions, scale, and orientation. In total, 802 staves couldbe correctly detected (recall of 95%). Next, a pattern matching algorithm detectedpossible symbol locations with an accuracy of 88%. Finally, a Support Vector Machinewas applied to classify the symbols into different neume types whereby an accuracy
2https://digital-scriptorium.org
4

no lower than 92% was achieved. A further splitting of the neumes into NCs was notperformed.
Calvo-Zaragoza, Toselli, and Vidal (2017) applied a Hidden Markov Model (HMM)with a constructed n-gram language model to transcribe line images of mensural no-tation of the 17th century. They built up a corpus of 576 staves and 13,863 individualsymbols comprising notes, rests, or clefs. There were 16 different symbols shapes whichcould occur on the different discrete vertical locations relative to the staff lines. Com-bining the shape and the positional information resulted in about 200 different classes.Their best model used a 3-gram language model and achieved an dSER of 40.4%.
The recent development of OMR on handwritten notation shows, that machinelearning approaches, such as neural networks, HMMs, or pattern matching are themean of choice which however presupposes the availability of GT. Especially CNNswhich also learn the features on the raw image yielded new state-of-the-art perfor-mances on many different tasks in computer vision. Their drawback is however thatit is more difficult to understand the sources of errors which is why a thorough erroranalysis is mandatory (see Section 5.4).
3. Datasets
To evaluate our proposed method, we use three different manuscripts written in squarenotation which are available (including the GT) at the OMMR4all dataset repository3.An overview of the dataset statistics is given in Table 1, example images are shownin Figure 2. The largest dataset which was introduced in Wick, Hartelt, and Puppe(2019) consists of 49 pages of the manuscript “Graduel de Nevers” from the year 1235(reedited version of the original manuscript from the 11th century in square notation;accessible at the Bibliotheque nationale de France4). The pages were manually splitinto three parts that share a similar layout: Part 1 has the best notation quality thathardly suffers from bleeding through, has straight staff lines, and its neumes are clearand distinct. The notation of the second part is very dense, suffers from bleeding,which is why it is the most difficult notation in the Nevers dataset. The third partcontains some unclear neumes and very wavy staff lines.
The Assisi dataset is comparatively small and comprises only five annotated pagesof the full manuscript. The scans are available at the Italian Digital Library5 and havelarge white margin which we did not crop in our experiments. In general, the notationis equal to the second part of the Nevers dataset, but with a considerably higherquality. The Cambrai dataset available at the Catalogue of illuminated manuscripts6
comprises 15 double pages (29 single pages containing music in total) of the 15th and16th century. The scans are only available in greyscale due to a reproduction using amicrofilm and show a very poor quality. The notation is clean, but pages clearly sufferfrom degradation, artefacts, bleed through, and distortions which is why this materialis the most complicated one compared to our other datasets.
Based on all pages, we created a dictionary of available neumes. While in total thereare 20,288 NCs which are part of 12,852 neumes, only about 518 unique neumes withrespect to the location of the first NC are present. If the initial pitch is ignored andtherefore only the relative motion of the neume is taken into account, only about 231
3https://github.com/OMMR4all/datasets4https://gallica.bnf.fr/ark:/12148/btv1b8432301z5http://www.internetculturale.it6http://initiale.irht.cnrs.fr/codex/9353
5

Figure 2. Example pages and a zoomed line of the used datasets. One page for each of the three parts of theNevers dataset, one of Assisi, and a double page of Cambrai is shown. Note that the white periphery of theAssisi page was manually cropped.
6

Table 1. Overview of the dataset statistics. The bigger Nevers dataset is split manually into three parts thatshare similarities in layout or handwriting. Only five pages are available in the Assisi dataset whereas 15 double
pages are available in Cambrai.
Dataset Pages Staves S.-Lines Symbols Notes Clefs Accid.
Nevers 1 14 125 500 3,911 3,733 153 25
Nevers 2 27 313 1,252 10,794 10,394 361 39
Nevers 3 8 72 288 1,666 1,581 84 1
Nevers Total 49 510 2,040 16,371 15,708 598 65
Assisi 5 50 200 1,333 1,276 53 4
Cambrai 29 176 704 3,500 3,304 185 11
neumes are present whereby the longest neume comprises nine NCs.
4. Methodology
In this section, we first describe a general workflow in which the proposed symboldetection algorithm can be embedded. Then, we introduce the algorithm includingthe network architecture and decoders in detail.
4.1. OMR Workflow
The proposed symbol detection algorithm can be easily integrated into an OMR work-flow for transcribing Medieval notations (see Wick & Puppe, 2019). First, the raw scansare preprocessed which produces a deskewed and normalised version of the image.During the normalisation, the average staff line distance dSL is either automaticallycomputed or manually defined to obtain images with a known scale. The images arethen processed by a staff line and stave detection algorithm based on FCNs. Basedon the bounds of the single staff lines, a complete staff can be extracted to obtainthe input for the symbol detection. The next steps are the application ATR on theextracted lyric lines and to finally assign the transcribed syllables to each neume. Thispaper solely focuses on the symbol detection and thus uses the given staff lines of thedatasets, encoded as polylines, and naturally the original scans of the manuscript.
4.2. Symbol Detection Algorithm
The input of the network is an image of a single staff which we extract based on thealready encoded staff lines. First, the whole page is dewarped by computing an imagein which all staff lines are horizontally straight (see Figure 3). Then, the bounding
7

Figure 3. The image shows the pipeline of the line extraction: First the complete page (left) is dewarped
based on the staff lines (right), then each single line is cut out (bottom). The overlay of green and orange stafflines emphasise the process. Note that only the right page of a double page of the Cambrai data set is shown.The bottom line shows the input of the neural net which is cut out of the original manuscript based on the
staff lines.
boxes of all staves are determined and extended by adding a margin of one dSL. Sinceclefs are often written in the left exterior of the actual lines, we extend the bounds tothe left by an additional 3dSL. Finally, the line image is extracted and centred in aseparate image. Dewarping and centring are important steps for our algorithm becausethe vertical pixel position then roughly corresponds to the vertical position of a note.An example of an extracted line is shown at the bottom of Figure 3.
An image is then processed sequentially by a CNN/LSTM-hybrid network in hor-izontal direction. The output is a probability map which concatenates a distributionof all possible labels at each point in time. The labels are defined by the alphabetwhich are the letters in the case of ATR. In our case, the construction of valid labelsis extended because both the type of a music symbol and its vertical position must beencoded. Therefore, we first define six basic types of music symbols (see Figure 4): C-clef, F-clef, Flat-accidental, and the three different types of NCs being either a neumestart, gapped, or looped. Each of the two clefs can be located on one of the four stafflines, which is why in total 2 · 4 = 8 labels are required to define a clef. Accidentals(theoretically) and NCs can occur at any discrete location in a staff, sometimes evenon the first lower or upper ledger line. Therefore, in total there are eleven possiblevertical positions, and (1 + 3) · 11 + 8 = 52 possible labels in total. For an example
8

Figure 4. Examples of the six classes to be recognised by the symbol detection.
Figure 5. The proposed network architecture. The numbers above each intermediate output denotes thenumber of channels and therefore the number of kernels in the previous convolutional layer.
labelling, see the bottom line of Figure 1.The implementation of the neural network, and its training and decoding is provided
by the open-source ATR-engine Calamari (see Wick, Reul, & Puppe, 2019) which weextended for our task. Only the preprocessing to obtain the deskewed image and thusstraight staves, and the evaluation had to be separately written.
4.2.1. CNN/LSTM Network
Figure 5 shows the chosen network architecture based on several preliminary experi-ments (see Section 5.3.1). First a convolutional layer with 40 kernels with a size of 3×3is applied to the input image, an image of a staff, to extract the most basic features.The following pooling layer aims to reduce the resolution by only selecting the mostprominent features in a 1×2 area. Another two sets of convolution (60 and 80 kernels)and max-pooling layers are appended. The last pooling layer uses a filter size of 2× 2,though. Traditional architectures usually solely perform 2 × 2 pooling halving bothaxes, we, instead, apply two pooling-layers that only halve the height by the pooling,not the width. The reason is that the maximum number of labels that can be predictedis at most the dimension of the temporal axis of the last layer, which is the width inour case. Since the NCs are sometimes written very dense and also on top of eachother, we only inserted one 2 × 2 pooling-layer. After the last pooling layer, a forthconvolutional layer is added with a kernel size of 80, and a bidirectional LSTM-layerwith 100 hidden nodes. Finally, a dense layer with a softmax activation converts the100 output nodes at each position into the 53 (52 + blank) target probabilities at each
9
horizontal position.
4.2.2. CTC-Algorithm and Decoders
The CTC-algorithm allows the network to make “no” prediction at a horizontal po-sition which is enabled by extending the actual alphabet by a so-called blank label(in this paper denoted by a “−”). The network is trained by providing a loss-functionthat aims to maximise the probability of the target GT-sequence. The advantage ofthis algorithm is that the GT-sequence is not segmented, that is, the actual positionof a letter, here a music symbol, is not required to be annotated. Instead, the networklearns the concept of a symbol and automatically learns to internally segment theinput itself. Therefore, the production of GT has a high speed-up because in the caseof ATR only the plain text must be typed. In our case of OMR, GT production is stillmore tedious because the keyboard is not designed to input neume notation. Howeverusing keybindings and a sophisticated editor, for example similar to Monodi+ (Eipert,Herrman, Wick, Puppe, & Haug, 2019), the transcription process can be simplified.
To decode the output of the neural network, we use several algorithms which aredirectly provided by Calamari: The greedy decoder is the simplest one that first takesthe label with the maximum value at each point in time. Then, repeated labels arejoined and finally all blanks are erased. For example, if the most probable labels are−−AA−−AB each character denotes a distinct NC, the resulting decoded sequenceis AAB. This decoder has the disadvantage, that any possible sequence is allowed asoutput. However, as seen in the datasets, the number of different neumes is highlyrestricted which is why it is sensible to force the decoder to only produce “valid”neumes. This is similar to speech decoding, where only words of a predefined dictionaryare permitted.
Therefore, besides the greedy decoder, we apply two different approaches for find-ing the most probable label sequence given a dictionary. The CTC-Token-Passing(CTC-TP)-algorithm is adopted from Graves (2012) and uses the implementation ofScheidl, Fiel, and Sablatnig (2018)7 which we integrated into Calamari. The funda-mental idea of the CTC-TP-algorithm is to decode the Recurrent Neural Net (RNN)output combined with dictionary words (in our context neumes) by searching the mostlikely sequence of dictionary words. Thereto, the characters of each word are modelledas a state machine with intermediate blanks. At each time step (horizontal axis), so-called tokens successively store the probabilities for each state of a word. Equally,transitions to new words are allowed by adding the initial state of word and choos-ing the current most probable word sequence as history. The time complexity of thisalgorithm is O(T ·W 2), where W is the dictionary size and T the sequence length.
The second algorithm is the CTC-Beam-Search (CTC-BS)-algorithm (based onHwang & Sung, 2016) which is most commonly applied for CTC-decoding if a lan-guage model shall be integrated. In Calamari, we implement the algorithm accordingto Scheidl et al. (2018)8 which was extended to allow for word transitions without aspace. The beam search stores a list of paths called beams that are extended at eachtime step by all possible further labels (including the blank) according to the languagemodel. This forms a very deep tree which is pruned by only keeping the nbm mostlikely beams (nbm is also called beam width). The time complexity of this algorithm isO (nbm · C · log (nbm · C)), where C are the number of characters by which the beamsare extended.
7https://github.com/githubharald/CTCDecoder8https://github.com/githubharald/CTCWordBeamSearch
10

Figure 6. The two schemes used for the training on the different parts of the Nevers dataset. Each colourrepresents one part which is again split into five folds (smaller boxes). In the experiments, either a slice of allparts are chosen for evaluation and the remainder for training, one part is taken for evaluation and trainingand both other parts for creating a pretrained model.
5. Experiments
In this section, we first introduce the data setup defining the splitting of trainingand testing data. Then, we evaluate and discuss the proposed symbol detection algo-rithm by using the different datasets, comparing it with an FCN-based approach, andincorporating a dictionary.
5.1. Data Setup
Figure 6 shows the setup when training on the three different parts of the Neversdataset. In any experiment, we apply a cross-fold scheme which splits each part ran-domly into five smaller slices. In the so-called “All” case, we choose one slice of eachpart to build the evaluation set, any other part is chosen for training. In the secondscenario, we pretrain a model on two complete parts and take one slice of the remain-ing part for evaluation. The remaining four parts serve as pool of training material,whereby the number of training examples Ntrain is varied to evaluate its impact onthe accuracy. If setting Ntrain = 0, we evaluate the performance of the pure pretrainedmodel based on different but somewhat similar material. The overall setup is used toevaluate the proposed approach with the one presented in Wick, Hartelt, and Puppe(2019).
The two other books (Assisi and Cambrai) are taken to evaluate how well a pre-trained model (on the Nevers dataset) performs on other books with a considerablydifferent layout, but which are also written in square notation. Thereto, we also varyNtrain to measure the impact of the number of training instances. This setup equatesto the pretraining scenario in Figure 6.
11

5.2. Metrics
To evaluate the performance of the proposed algorithm, we use three sequence-basedmetrics. The dSER computes the edit-distance of the predicted label sequence and theGT and normalises the result by the maximum length of the two sequences. Missing,additional, and replaced (e.g., with a wrong type) symbols therefore count as one error.The dSAR is the corresponding accuracy rate computed by 1− dSER. The harmonicSymbol Accuracy Rate (hSAR) only evaluates the correctness of the harmonic proper-ties, that is the melody, by ignoring the graphical connections (looped or gapped, seeFigure 1) of all NCs. Finally, we introduce the Neume Accuracy Rate (NAR) whichonly takes complete neumes into account and ignores all clefs and accidentals. Themetric is rather strict, because if a single NC is wrong for example due to position orgraphical connection, the complete neume is counted as one error. In context of ATRthis metric can be compared to a Word Accuracy Rate (WAR) which is then used toevaluate the language model, here a dictionary.
5.3. Evaluations
All experiments were conducted on an NVIDIA 1080Ti GPU and an Intel E5-2690processor. We did not apply the early stopping support of Calamari since the num-ber of training instances is rather limited. Instead, training was stopped after 20,000iterations whereby the best performing model on the training data so far was chosenfor evaluation. Following further hyperparameters were set: 0.001 as learning rate, theAdam solver (Kingma & Ba, 2014) for the gradient descent, and a dropout (Srivastava,Hinton, Krizhevsky, Sutskever, & Salakhutdinov, 2014) of 0.5 after the LSTM layer.Furthermore, we used the provided data augmentation of Calamari with a factor of50, that is, each line is multiplied 50 times in addition to the original one.
5.3.1. Preliminary Experiments
This section presents and discusses the results obtained when varying the networkarchitecture. For the experiments, we took all three parts of Nevers as dataset whichwe split into five cross-folds to train networks, each on four folds and evaluated onthe remaining one (“All” schemata in Figure 6). The obtained average values of thehSAR, dSAR, and NAR metrics are listed in Table 2.
We focused on varying the kernel size and thus stride of the pooling layer because, incontrast to the ATR, NCs can be located very densely, even above of each other. It isimportant to maintain an output that is long enough to predict each neume: withouta pooling layer, a symbol can be predicted at each pixel position, a 2 × 2 poolinglayer halves the dimension of the output which is why relative to the input imageonly on every second pixel a symbol can be predicted. Unfortunately, max-poolinglayers whose aim is to reduce the dimensions are a obligatory component of a CNNarchitecture because they keep only the important features of the previous layers andalso introduce a rotation, scale, and translation invariance of the features by a certainamount. Therefore, the different tested network architectures introduce max-poolinglayers with a traditional 2 × 2 shape, but also a 1 × 2 shape which only affects thevertical resolution but not the horizontal which is why it has no effect on the numberof symbols that can theoretically be predicted by the network.
The network with the best results (NA4 in Table 2) showed that using a deepnetwork architecture is superior to a network with only two convolutional layers, using
12

Table 2. Preliminary experiments for the symbol detection using different network architectures: The numberof kernels with a fixed size of 3× 3 of convolutional layers (C), the kernel and filter size for max-pooling layers
(Mp), and the number of hidden notes for a LSTM layer are stated. The results of the harmonic SymbolAccuracy Rate (hSAR), diplomatic Symbol Accuracy Rate (dSAR), and Neume Accuracy Rate (NAR) givenin percent are computed using all tree parts of the Nevers dataset.
ID Network architecture hSAR dSAR NAR
NA1 C(40), Mp(2x2), C(60), Mp(2x2), C(80),LSTM(100)
89.8 86.2 79.9
NA2 C(40), Mp(2x2), C(60), Mp(1x2), C(80),LSTM(100)
90.6 86.8 80.4
NA3 C(40), Mp(1x2), C(60), Mp(1x2), C(80),LSTM(100)
90.9 87.1 80.4
NA4 C(40), Mp(1x2), C(60), Mp(1x2), C(80),Mp(2x2), C(80), LSTM(100)
91.7 88.3 82.3
NA5 C(40), Mp(1x2), C(60), Mp(1x2), C(80),Mp(1x2), C(80), LSTM(200)
91.5 87.9 81.6
1×2 max-pooling layers. Furthermore, we conclude that an increased number of hiddennodes in the LSTM-layer leads to overfitting which is why the accuracy shrinks. Also,the usage of at least one 2 × 2 shape max-pooling layer is sensible. In all furtherexperiments, we applied the network architecture of NA4 since it performs best.
5.3.2. Varying the Number of Training Examples
The number of freely available datasets of the target material to train the proposedneural network for the symbol detection is rather limited. Therefore, it is impossibleto train and share a so-called mixed model that fits a variety of different books whichis why book-specific models must be trained. Since the manual creation of GT isvery tedious, it is mandatory to evaluate how many training instances are required onaverage to train a model of a certain accuracy. Naturally, the actual amount of GThighly depends on the material at hand.
In this section, we trained and evaluated the network using a fixed number oftraining instances (0, 1, 2, 4, and All) of one part and applying a pretrained model onthe remaining ones (second setup in Figure 6). Using 0 pages for the actual trainingequates to only using the model that was pretrained on the remaining parts. Table 3shows the results of the hSAR and dSAR for each part and each Ntrain and also theaverage across all parts. For comparison, we first added the results obtained whenapplying the FCN-based algorithm which was proposed by Wick, Hartelt, and Puppe(2019), then the results of the CNN/LSTM-based approach are listed.
For the CNN/LSTM-based approach, as expected the number of training instancesincreased the accuracies: adding one page increased the average dSAR from 74.6% to78.6%, a second one further improved the results to 84.3%. Finally, using all availabletraining pages yielded a dSAR of 89.1%. The overall accuracies of part 2 were worsethan of both other parts, which was expected since this part is the most difficult one.Similarly, the results of part 1 comprising the pages with the highest quality were abit better than part 3. Interestingly, however, the pretrained CNN/LSTM (Ntrain = 0)performed best on the 2nd part and the worst on part 1.
Compared to the FCN-approach, the novel approach using CNN/LSTMs yielded
13

Table 3. Results (lower half) when training the proposed CNN/LSTM network on the three parts of theNevers dataset using the “pretraining” schemata of Figure 6. For comparison, the FCN results of the upper halfare obtained by using the methodology of Wick, Hartelt, and Puppe (2019). All values are given in percent.
hSAR dSARNtrain 1 2 3 Mean 1 2 3 Mean
FC
N
0 93.6 85.2 90.7 89.8 86.7 80.5 87.5 84.91 89.9 82.3 90.6 87.6 78.3 76.8 84.5 79.92 90.5 84.8 89.3 88.2 83.9 79.8 86.0 83.24 92.8 86.4 90.9 90.0 86.5 81.5 88.5 85.5
All 93.6 91.4 93.4 92.8 88.6 87.9 90.7 89.0
CN
N/L
ST
M
0 74.5 82.0 79.9 78.8 69.0 78.1 76.7 74.61 84.2 84.0 83.6 84.0 75.7 80.4 79.7 78.62 91.4 84.5 90.2 88.8 83.6 80.9 88.4 84.34 92.1 85.5 92.5 90.0 85.3 80.9 90.6 85.6
All 93.4 91.7 92.6 92.6 87.5 88.8 90.9 89.1
equivalent results of the dSAR if at least two pages of GT were available. The effectthat one page of training data reduces the accuracy of the pretrained net possiblydue to overfitting did not emerge in our new approach. We think the reason is thatthe CNN/LSTM-network has to learn a more general representation compared to theFCN: whereas the exact locations of notes are presented to the FCN, the novel networkarchitecture has to learn by itself the concept of a note. This is also the reason why theapproach was significantly worse if only a few lines of GT were available for training.
5.3.3. Incorporating a Neume Dictionary
To further improve the sequential prediction which requires a decoding of the proba-bility matrix produced by the neural net, it is sensible to only allow for valid neumes.Thereto, we created a dictionary of all occurring neumes (see Section 3) and appliedthe presented decoding algorithms (see Section 4.2.2) which restricted the predictionto clefs, accidentals, and known neumes.
Table 4 shows the results of the dSAR and NAR when applying no dictionary, theCTC-TP, CTC-BS with nbw = 25, and nbw = 100, respectively. Hereby, we used theprevious cross-fold-scheme when training with Ntrain images of one part and took thepretrained model of the remaining ones (second setup in Figure 6). Only the averagevalues of all three parts are listed. Note, that the difference between the dSAR andNAR is considerably smaller compared to the analogous WAR in ATR because neumesare on average composed of considerably fewer symbols than words, some neumes evencomprise a single note only. The reason is that it is more probable that a short neumecontaining an error matches with another one in the dictionary and can therefore notbe corrected. Furthermore, the required decoding times for a single staff line are listedfor each decoding approach.
As expected, the accuracies increased if incorporating a neume dictionary, howeveronly by a very small amount (about 5%). When using only the pretrained models(0 lines), the NAR improved from 67.5% to 68.7% if the token passing decoder waschosen. The beam search decoder with nbw = 25 yielded a sightly higher NAR of
14

Table 4. Incorporation of a dictionary for decoding. All values were obtained by training with Ntrain pageson one part and using a pretrained model trained on the remaining ones. All values are the result of a five
cross-fold and given in percent. The last row lists the duration required to decode a single staff.
LM None Token Beam Search 25 Beam Search 100Ntrain dSAR NAR dSAR NAR dSAR NAR dSAR NAR
0 74.6 67.5 75.0 68.7 75.1 69.0 75.3 69.31 78.6 72.1 78.9 73.1 78.8 73.2 79.0 73.22 84.3 77.0 84.5 77.9 84.5 78.0 84.6 78.14 85.6 78.4 85.9 79.3 85.8 79.3 85.8 79.3
All 89.1 82.7 89.2 83.5 89.1 83.5 89.1 83.5
Time 0.23 s 2.83 s 1.66 s 8.59 s
69.0% and using 100 beams results, as expected, in the best value of 69.3%. If four orall training pages were used, all tree decoders with dictionary yielded approximatelythe same value of NAR = 79.3% and NAR = 83.5%, respectively, which was higherthan using no dictionary (78.4% and 82.7%).
A crucial difference of all examined decoding approaches was the duration requiredto process a single line which is listed in the last row of Table 4. Even the beam searchalgorithm with nbw = 25 (1.66 s) was more than six times slower than using the defaultgreedy decoder (0.23 s). The token passing decoder was even slower (2.83 s), and, asexpected, the beam search decoder using 100 lines (9 s) was the slowest one. Theseobservations are in accordance with the time complexity of the different decoders asshown in Section 4.2.2. The overall duration could be clearly reduced using a C++implementation instead of the Python version of the algorithms, however, it is still upfor debate if the cost-benefit ratio of the beam search algorithm with nbw = 100 issensible. Instead, the evaluation leads to the conclusion that using a beam search withonly 25 beams (or even less) is completely sufficient and also acceptable in terms ofduration.
5.3.4. Cross-Dataset Training
In this section, we evaluate how well a model pretrained on the Nevers dataset performson different books. Thereto, we first trained default models for the Assisi and Cambraidatasets without using any information from the Nevers dataset, then we repeated theexperiments using the pretrained model on Nevers. Table 5 shows the obtained results.
If no pretrained model was used (default), the model trained on the Nevers datasetperformed best with an dSAR of 88.3%. Even though only four pages could be used fortraining the Assisi dataset, its performance of dSAR = 83.5% was higher than trainingCambrai with dSAR = 81.5%. This confirms that Assisi is a very clean dataset whileCambrai suffers from high degradation and bleeding through the paper.
Using the pretrained model without training on the actual dataset (Ntrain = 0)shows that the notation style of Assisi is extremely close to the Nevers dataset becauseeven without training a remarkable dSAR of 92.0% was reached which is even betterthan the result on the Nevers dataset itself (88.3%). The Cambrai dataset showed theopposite behaviour since the Nevers dataset only achieved a dSAR of 39.2%. Trainingon actual data for Cambrai was therefore important, however, all training instances
15

Table 5. Evaluation of using the pretrained model on the Nevers dataset for the two other books Assisi andCambrai. Since the Assisi dataset only comprises five pages, training on all pages equates to training on the
four pages in the cross-fold.
Default PretrainedDataset Ntrain hSAR dSAR hSAR dSAR
Nevers Best 91.7 88.3 − −
Assisi 0 − − 94.6 92.01 63.2 54.9 93.5 90.72 83.3 76.7 94.0 91.0
4/All 87.9 83.5 95.0 92.7
Cambrai 0 − − 47.8 39.21 33.0 26.8 60.3 53.82 53.2 43.6 70.2 63.94 69.7 61.8 82.4 77.4
All 87.0 81.5 90.3 86.0
of the cross-fold were required in order to obtain a model with a hSAR greater than90.3%. In contrast, if training with one page of Assisi, the results worsened because thenetwork overfitted on the one page and forgets the primary generalising weights. Thisis also caused by the training setup itself because we did not apply early stopping andchose the best model based on the training data. Four pages (All) were then requiredto actually benefit from the training data. All observations emphasised our initialobservation of the poor quality of the Cambrai dataset. Naturally, the notation itselfcould be the reason for the lower accuracy, but the notation (see Figure 2) appears tobe uniform.
5.3.5. Qualitative Evaluation of the Horizontal Note Position
Figure 7 shows the prediction of a page of the Assisi dataset using the best modelwhich was trained on the four remaining pages with a pretrained model from theNevers dataset. The centres of symbols are drawn at their predicted horizontal position,whereas the vertical position is computed based on the label of a symbol which isrelative to the staff lines (for example the first red note in the first line is located inthe 3rd space). A qualitative evaluation showed that the position of the notes (redboxes) was very accurate, however, with a small offset to the left. This confirms thatthe neural net correctly learned the semantic concept of a NC on its own, but producedthe output as soon as a note starts and not in the centre of a NC. In contrast to thenotes, all clefs that are the first symbol of a line had a large offset to their actualposition even though the network seemed to learn their shape because, in most cases,the prediction whether a C or F clef is present was correctly distinguished (see e.g.,the C-clefs in lines 2 to 5 and the F-clefs in the last two lines). A closer look at thepredicted probability matrix shows that the network predicted the first clef always atthe first possible location which is the start of the staff lines minus the padding. Wethink that the reason is, that the first symbol in a line is always a clef. Therefore, thenetwork first learned to predict the most frequently occurring clef independent of the
16

Table 6. Categorisation of the different errors and their relative amount. See Figure 7 for examples.
Group Error
False Negatives 53.5%1. Missing Note 12.3%2. Wrong Connection 18.6%3. Wrong Location 12.6%4. Missing Clef 8.5%5. Missing Accidental 1.5%
False Positives 46.5%6. Additional Note 8.5%2. Wrong Connection 18.6%3. Wrong Location 12.6%7. Additional Clef 6.8%8. Additional Accidental 0.0%
Total 100%
actual data. Later then, the actual concept of a clef and its type was learned, however,the location which was irrelevant in the loss-function stays the same. This is possiblebecause the bidirectional LSTM allows to memorise the clef from the actual positionthe start of the line.
In general, apart from the initial clefs, the position of the symbols is close enoughto the actual symbols in order to easily spot errors in an overlay view such as shownin Figure 7. Therefore, the algorithm can be integrated in existing semi-automaticOMR-frameworks such as OMMR4all (Wick & Puppe, 2019) which already providesan overlay-editor for error correction.
5.4. Error Analysis
For a quantitative error analysis, we exemplarily took the best performing model (As-sisi) and counted the number of insertions and deletions that were required to obtainthe GT sequence. This approach counts replacements as two errors, one insertion andone deletion, which is why a wrong connection or a wrong vertical location was treatedas one False Negative (FN) and one False Positive (FP). Table 6 lists the errors andtheir relative impact on the dSAR grouped in eight categories. Examples for the er-rors are shown in Figure 7, rare errors concerning accidentals are not present in theexample.
First, as to be expected, there were clearly more missing notes than additionalnotes (12.3% vs 8.5%). The intrinsic reason is that the CTC-loss-function is ratherrestrictive in its prediction which is why blanks, that is no symbol, usually have a veryhigh probability. The most probable errors were the prediction of a wrong connectionwith a relative amount of 37.2% in total (FP and FN). This is reasonable, becausethe decision if a note is, for example, the start of a neume or gapped can often onlybe decided based on context which in some occasions also includes the positions ofsyllables. Similarly, with a total relative error of 25.2%, the decision whether a note
17

Figure 7. The full prediction of a page of the Assisi manuscript including the positional information: cyansymbols mark clefs, vertical dashed lines separate single neumes, NCs are rendered as red box, a loopedgraphical connection is indicated by a black stroke between to NCs. Arrows and the assigned numbers indicatethe error type of the prediction (see Table 6). Note that the periphery of the page was manually cropped.
18

is located in a space or on a staff line also requires context, which is why it is notsurprising that these kinds of errors occurred (see examples for the error type 3 “WrongLocation” in Figure 7). Even though, clefs usually occur only once or twice per line,they accounted for an error of 15.3% (error type 4 and 7), whereby missing clefs weremore probable (8.5%, error type 4). Note, that the wrong offset of a clef at the start ofa line did not count as an error. A qualitative evaluation showed that clefs were almostnever predicted if they occur within a line, instead, they were often misinterpreted asnotes. Accidentals are very rare which is why the network needed a very high confidenceto predict at least some them. This explains why the amount of FPs-accidentals was0.0%, and why missing accidentals were more likely. However, the relative error of 1.5%caused by this type of errors is negligible if the lines are manually corrected anyway.
Next, we broke down the error causes for clefs into four categories (see Table 7): thefirst group which amounts for 27% of all clef-related errors counts all errors that aredue to clefs that are located within the line (none of those were detected at all). Allother three groups always refer to clefs that are the first symbol of a line: clefs whereboth the location and type are wrong amount for 46% of the errors, clefs where onlythe location is wrong amount for 18%, and clefs with a wrong type amount for 9%.Positional errors (in total 46%+18% = 64%) indicate that the network was not able toidentify the clef at all, instead the network guessed using the background informationthat the first symbol is always a clef and that the C-clef location at the top line is themost probable one. This is supported by the fact that no clef was detected within aline at all. The least common error (wrong type only) shows that if the network wasable to detect the correct location, its type is mainly correct. In conclusion, the erroranalysis shows, that the detection of clefs is still a challenging problem, presumablybecause they are underrepresented compared to notes. It is reasonable to incorporatethe background information that the first symbol must be a clef to design a specialisedalgorithm to detect at least the first clef correctly. Potentially, this solves 73% of theclef-related errors, which would result in a relative improvement of the dSAR of about10%.
Furthermore, we examined the FPs and FNs of the note detection to understandwhich sources could cause these kinds or errors (see Table 8). One third of all FPsare due to clefs or accidentals that look similar to notes and that were falsely inter-preted as clefs. One forth of the errors is caused by repeated notes, where the networkpredicted two NCs with a different location directly one after the other. This is anintrinsic problem of the CTC-algorithm, but can be solved in a postprocessing stepthat combines all notes that are very close (smaller than a typical note size) and areon the same location by choosing the most probable one. Another source of errorsthat can hardly be suppressed is noise, which amounts for 25% of the FPs. 17% of theerrors occur at locations where NCs are written very densely, especially if the actualneume is a “stacked” one (e.g., pes or clivis). We expect that a postprocessing stepcan only reduce errors caused by repeated NCs, whereas any other source requiressophistication, such as additional context or more training material. Thus, potentially,about 25% of the FPs could be resolved which results in a relative improvement of thedSAR of about 2%.
The main source of FNs (79%) are NCs that lie close the top or bottom of a line.There, the NCs are very narrow to the lyrics which is an additional challenge for thenetwork because it must also separate text and actual notes. We do not think thatthese kinds of errors can be easily postprocessed without additional training materialthat focuses the separation of text and music. For the other three types of errors,we have no explanation, why the network misses the NCs. It seems that there is an
19

Table 7. Break down of the errors caused by clefs which amount for 15.3% of the total errors.
Error Type Rel. Error Examples
Within lineMissing clefs that are not the first symbol of a staffline.
27%
Beginning, location, and typeDetected clefs at the beginning that have a wrong(vertical) location and type.
46%
Beginning and locationDetected clefs at the beginning that have a wrong(vertical) location, but a correct type
18%
Beginning and typeDetected clefs at the beginning that have a wrongtype, but a correct (vertical) position.
9%
accumulation of errors if the NC is the first one in a line, though. Postprocessingalgorithms to tackle some of the FN errors may be difficult to design.
Next, we examine the origin of NCs with a correct location, but with a wrongconnection which amount for 37.2% of the total dSAR error (see Table 9). The firstcategory (41%) comprises errors that are related to two or more NCs that are stacked orvery close in horizontal direction (e.g., pes or clivis). These situations may sometimesbe difficult to decide for the network because it has to recognise if notes are graphicallyconnected, which can sometimes be very thin. Although, we suspect that the errorsare caused mostly because the network uses only positional information to decideabout the connection which is in most cases valid. This explains why the examples arewrongly classified, however a postprocessing step does not seem to solve these kindsof errors. The second category (59%) comprises errors that occur in gapped neumes(e.g., a climacus). Here, the network must decide whether a note is the start of a newneume or part of the same previous neume. There are some cases where the lyric isrequired to decide about the connection which is why it is reasonable that the networkmakes these kinds of errors. In the first category, the incorporation of backgroundknowledge to solve these kind of errors is difficult because it requires the detectionof the actual connecting line. The incorporation of syllables is feasible, however onlyif the syllables and their positions are known. Therefore, for an actual realisation ofboth postprocessing steps, a second challenging problem must be solved first.
The last error source are positional errors of notes which amount for 25.2% of theerrors (see Table 10). The errors are caused because notes that lie on the same verticalpixel position can be differently interpreted relative to the staff lines depending on thecontext. Therefore, we broke down the errors into the causes: stacked neumes (65%),close to lyrics (12%), and other (e.g., middle of the line, 23%). The error examples
20

Table 8. Break down of FP and FN errors into several causes which amout for 8.5% and 12.3% of the errors,respectively.
Error Type FP Examples FN Examples
Close to Lyrics (Bottom/Top)NCs that are likely to be misinterpretedas part of text.
0% 79%
Stacked NeumesErrors caused related to NCs that arestacked or horizontally close to one an-other (e.g., pes, clivis).
17% 5%
Repeated NCsThe same notes are repeated.
25% 5%
Clef/AccidA clef or an accidental is misinterpretedas notes.
33% 0%
NoiseNoise is falsely detected as NC.
25% 0%
OtherOther error sources that can not be di-rectly explained.
0% 11%
Table 9. Break down of the errors caused by wrong connections (start, looped, or gapped) which amount for37.2% of the total errors.
Error Type Rel. Error Examples
Stacked NeumesErrors caused related to NCs that arestacked or horizontally close to one an-other (e.g., pes, clivis).
41%
Gapped NeumesErrors caused related to neumes withgapped NCs (e.g., climacus).
59%
21

Table 10. Break down of the errors caused by a wrong (vertical) location which amount for 25.2% of thetotal errors.
Error Type Rel. Error Examples
Stacked NeumesErrors caused related to NCs that are stackedor horizontally close to one another (e.g., pes,clivis).
65%
Close to Lyrics (Bottom/Top)NCs that are likely to be misinterpreted as partof text.
12%
OtherError causes without a specific category (e.g.,single tone neumes in the middle of a line).
23%
show, that a NC that touches a staff line is usually “on the line” if it is part of astacked neume (e.g., pes or clivis), but in the space if it is a single tone neume. Wethink that these errors could be resolved by combining this approach either with theFCN approach (if valid GT is available) or with a note detection based on connectedcomponents in the area of interest. If the actual (vertical and horizontal) position ofa NC is known, a set of rules could resolve the errors: in a stacked neumes, a positionclose to a staff line is interpreted as “on the line”, else it is interpreted as “space”.The threshold could be derived based on majority voting of all present notes. Ideally,this could reduce the dSAR by 25.2%, relatively.
Concluding, the error analysis showed that there are two major error categories:errors that require external knowledge (e.g., lyrics) and errors where the local infor-mation presented to the network should be sufficient (e.g., positional errors, or clefs).We expect that errors of the last group could be (mostly) corrected by specialisedpostprocessing steps which could potentially reduce the dSAR by up to 37.2%.
6. Conclusion and Future Work
In this paper, we presented the application of CNN/LSTM-hybrids to tackle the au-tomatic transcription of Medieval square notation. The approach reached a best valuewith a dSAR of 89.1% when training on the three parts of the Nevers dataset and isthus comparable to the previous value of 89.0% achieved by an FCN. For only a fewpages of GT (zero to two), the FCN was clearly better, though. Concluding, if the tar-get material consists of many pages, it is meaningful to apply the CNN/LSTM-basedapproach because it yields competitive results and allows for an easier GT-production.Using a neume dictionary for decoding increased the NAR of the best model from82.7% to 83.5%. It shows that for many pages the fast beam search algorithm usingnbw = 25 was sufficient.
Astonishingly, the pretrained model on the Nevers dataset yielded better results on
22

Assisi with a dSAR of 92.0% than on the actual training data. Finetuning on Assisiincreased the performance to 92.7%. In contrast, the pretrained model but also actualtraining performed worse on the difficult Cambrai dataset with a dSAR up to 86%.We conclude that in principal models can generalise because the model trained onNevers flawlessly extends to Assisi. However, book-specific training is still obligatoryto tackle even difficult books, but the number of training data to obtain a performantmodel highly depends on the material at hand (e.g., for the Cambrai dataset).
While the overall accuracy of the prediction of the horizontal position was com-pletely sufficient, the error analysis showed that the first clef of each line is off becauseit was predicted directly as the first output of the network. We expect that data aug-mentation by prepending a section of another line might prevent this. This approachis only possible if positional information such as in the Nevers dataset is available,though.
The error analysis showed that the main sources of errors were NCs with a wrongconnection or a wrong vertical location. This requires either more context or externalknowledge, for example, about more or less probable melodies, which could be directlyincorporated in the language model for neumes or NCs based on n-grams. However,to obtain reliable transition probabilities, several large datasets are required. Anotherproblem to solve with the current CTC-TP- and CTC-BS-decoders is that they donot provide positional information required for the OMMR4all overlay-editor for post-correction. We plan to add support to both algorithms in order to allow for an actualproductive inclusion of the language model.
We expect that the approach of CNN/LSTM networks for square notation can begeneralised to other neume notations. In a first step, we will focus Gothic or Hufnagelnotations that consist of neumes with a different shape, but also have four or five stafflines. Afterwards, we attempt to transcribe neume notations with only one staff lineand neumes without a distinct shape of NCs. These notations are far more challengingbecause the individual NCs are more difficult to detect, and their pitches must beextrapolated based on virtual staff lines. Furthermore, we expect that if the amountof available GT extracted from a variety of books and notations increases, trainingof several mixed models each targeting a group of similar notation styles becomesfeasible.
References
Baroni, M., Maguire, S., & Drabkin, W. (1983). The concept of musical grammar. MusicAnalysis, 2 (2), 175–208.
Baro, A., Riba, P., Calvo-Zaragoza, J., & Fornes, A. (2019). From Optical MusicRecognition to Handwritten Music Recognition: A baseline. Pattern Recognition Let-ters, 123 , 1–8. Retrieved from http://www.sciencedirect.com/science/article/pii/
S0167865518303386
Breuel, T. (2017). High Performance Text Recognition Using a Hybrid Convolutional-LSTMImplementation. In 14th IAPR International Conference on Document Analysis and Recog-nition (ICDAR) (pp. 11–16). IEEE.
Calvo-Zaragoza, J., Hajic jr., J., & Pacha, A. (2019). Understanding Optical Music Recogni-tion. Computing Research Repository .
Calvo-Zaragoza, J., Toselli, A., & Vidal, E. (2017). Handwritten Music Recognition for Men-sural Notation: Formulation, Data and Baseline Results. In 14th International Conferenceon Document Analysis and Recognition (pp. 1081–1086).
Calvo-Zaragoza, J., Valero-Mas, J. J., & Pertusa, A. (2017). End-to-end Optical Music Recog-
23

nition using Neural Networks. In 18th International Society for Music Information RetrievalConference (pp. 472–477). Retrieved from https://ismir2017.smcnus.org/wp-content/
uploads/2017/10/34 Paper.pdf
Catholic Church. (1963). The Liber Usualis with introduction and rubrics in English. Tournai,Belgium: Desclee.
Dalitz, C., Droettboom, M., Pranzas, B., & Fujinaga, I. (2008). A Comparative Study of StaffRemoval Algorithms. IEEE Transactions on Pattern Analysis and Machine Intelligence,30 (5), 753–766.
Das, A., Li, J., Zhao, R., & Gong, Y. (2018). Advancing Connectionist Temporal Classificationwith Attention Modeling. In 2018 IEEE International Conference on Acoustics, Speech andSignal Processing (ICASSP) (pp. 4769–4773).
Eipert, T., Herrman, F., Wick, C., Puppe, F., & Haug, A. (2019). Editor Support for DigitalEditions of Medieval Monophonic Music. In 2nd International Workshop on Reading MusicSystems (pp. 4–7).
Grachten, M., Arcos, J. L., & Lopez de Mantaras, R. (2004). Melodic similarity: Looking fora good abstraction level. In 5th International Conference on Music Information Retrieval.
Graves, A. (2012). Supervised sequence labelling. In Supervised sequence labelling with recur-rent neural networks (pp. 5–13). Springer.
Graves, A., Fernandez, S., Gomez, F., & Schmidhuber, J. (2006). Connectionist temporalclassification: labelling unsegmented sequence data with recurrent neural networks. In Pro-ceedings of the 23rd international conference on Machine learning (pp. 369–376). ACM.
Hajic jr., J., & Pecina, P. (2017). The MUSCIMA++ Dataset for Handwritten Optical MusicRecognition. In 14th International Conference on Document Analysis and Recognition (pp.39–46).
Hamanaka, M., Hirata, K., & Tojo, S. (2016). Implementing Methods for Analysing MusicBased on Lerdahl and Jackendoff’s Generative Theory of Tonal Music. In D. Meredith (Ed.),Computational Music Analysis (pp. 221–249). Springer International Publishing. Retrieved2020-01-29, from https://doi.org/10.1007/978-3-319-25931-4 9
Hochreiter, S., & Schmidhuber, J. (1997). Long short-term memory. Neural computation,9 (8), 1735–1780.
Hwang, K., & Sung, W. (2016, Mar). Character-level incremental speech recognition withrecurrent neural networks. In IEEE International Conference on Acoustics, Speech andSignal Processing (ICASSP) (p. 5335–5339).
Janssen, B., Kranenburg, P. v., & Volk, A. (2017). Finding Occurrences of Melodic Segmentsin Folk Songs Employing Symbolic Similarity Measures. Journal of New Music Research,46 (2), 118–134. Retrieved 2020-01-29, from https://doi.org/10.1080/09298215.2017
.1316292
Kingma, D. P., & Ba, J. (2014). Adam: A Method for Stochastic Optimization. ComputingResearch Repository , abs/1412.6980 . Retrieved from http://arxiv.org/abs/1412.6980
Miyao, H. (2004). Stave extraction for printed music scores using DP matching. Journal ofAdvanced Computational Intelligence and Intelligent Informatics, 8 (2), 208–215.
Pugin, L., Zitellini, R., & Roland, P. (2014). Verovio: A library for Engraving MEI MusicNotation into SVG. In ISMIR (pp. 107–112).
Ramirez, C., & Ohya, J. (2014). Automatic Recognition of Square Notation Symbols inWestern Plainchant Manuscripts. Journal of New Music Research, 43 (4), 390–399.
Rebelo, A., Fujinaga, I., Paszkiewicz, F., Marcal, A. R., Guedes, C., & Cardoso, J. d. S.(2012). Optical music recognition: state-of-the-art and open issues. International Journalof Multimedia Information Retrieval , 1 (3), 173–190.
Salazar, J., Kirchhoff, K., & Huang, Z. (2019). Self-attention Networks for ConnectionistTemporal Classification in Speech Recognition. In ICASSP 2019 - 2019 IEEE InternationalConference on Acoustics, Speech and Signal Processing (ICASSP) (pp. 7115–7119).
Scheidl, H., Fiel, S., & Sablatnig, R. (2018). Word Beam Search: A Connectionist Tempo-ral Classification Decoding Algorithm. In 16th International Conference on Frontiers inHandwriting Recognition (pp. 253–258). IEEE.
24

Srivastava, N., Hinton, G., Krizhevsky, A., Sutskever, I., & Salakhutdinov, R. (2014). Dropout:A Simple Way to Prevent Neural Networks from Overfitting. Journal of Machine LearningResearch, 15 , 1929–1958. Retrieved from http://jmlr.org/papers/v15/srivastava14a
.html
van der Wel, E., & Ullrich, K. (2017). Optical Music Recognition with Convolutional Sequence-to-Sequence Models. In 18th International Society for Music Information Retrieval Con-ference (pp. 731–737). Retrieved from https://archives.ismir.net/ismir2017/paper/
000069.pdf
Vigliensoni, G., Burgoyne, J. A., Hankinson, A., & Fujinaga, I. (2011). Automatic pitchrecognition in printed square-note notation. In Proc. ISMIR.
Wick, C., Hartelt, A., & Puppe, F. (2019). Staff, Symbol and Melody Detection of MedievalManuscripts Written in Square Notation Using Deep Fully Convolutional Networks. AppliedSciences, 9 (13), 2646.
Wick, C., & Puppe, F. (2019). OMMR4all — a Semiautomatic Online Editor for MedievalMusic Notations. In 2nd International Workshop on Reading Music Systems (pp. 31–34).Retrieved from https://sites.google.com/view/worms2019/proceedings
Wick, C., Reul, C., & Puppe, F. (2018). Comparison of OCR Accuracy on Early Printed Booksusing the Open Source Engines Calamari and OCRopus. JLCL: Special Issue on AutomaticText and Layout Recognition, 33 (1), 79–96. Retrieved from https://jlcl.org/content/
2-allissues/1-heft1-2018/jlcl 2018-1 4.pdf
Wick, C., Reul, C., & Puppe, F. (2019). Calamari - A High-Performance Tensorflow-basedDeep Learning Package for Optical Character Recognition. Digital Humanities Quarterly(forthcoming).
25

Christoph Wick, Christian Reul, Frank Puppe
Comparison of OCR Accuracy on Early Printed Books using theOpen Source Engines Calamari and OCRopus
Abstract
This paper proposes a combination of a convolutional and an LSTM network to improvethe accuracy of OCR on early printed books. While the default approach of line basedOCR is to use a single LSTM layer as provided by the well-established OCR softwareOCRopus (OCRopy), we utilize a CNN- and Pooling-Layer combination in advance ofan LSTM layer as implemented by the novel OCR software Calamari. Since historicalprints often require book specific models trained on manually labeled ground truth(GT) the goal is to maximize the recognition accuracy of a trained model while keepingthe needed manual effort to a minimum.
We show, that the deep model significantly outperforms the shallow LSTM networkwhen using both many and only a few training examples, although the deep network hasa higher amount of trainable parameters. Hereby, the error rate is reduced by a factorof up to 55%, yielding character error rates (CER) of 1% and below for 1,000 linesof training. To further improve the results, we apply a confidence voting mechanismto achieve CERs below 0.5%. A simple data augmentation scheme and the usage ofpretrained models reduces the CER further by up to 62% if only few training data isavailable. Thus, we require only 100 lines of GT to reach an average CER of 1.2%. Theruntime of the deep model for training and prediction of a book behaves very similar toa shallow network when trained on a CPU. However, the usage of a GPU, as supportedby Calamari, reduces the prediction time by a factor of at least four and the trainingtime by more than six.
1 Introduction
The best OCR engines on early printed books like Tesseract (4.0 beta)1 or OCRopus2
currently use Long Short Term Memory (LSTM) based models, which are a special kindof recurrent neural networks. In order to achieve low CERs below e.g. 1% or 2% on earlyprinted books these models must be trained individually for a specific book due to a highvariability among different typefaces used (see Springmann et al. 2016 or Springmannand Lüdeling 2017). Thereto, a certain amount of GT, in the case of OCRopus that isa pair of text line image and transcribed text, must be manually labeled. The primarygoal is to reduce the number of labeled text lines to achieve a certain error rate. A
1https://github.com/tesseract-ocr2https://github.com/tmbdev/ocropy
JLCL 2018 – Band 33 (1) – 79-96
Wick, Reul, Puppe
secondary goal is to continuously retrain the model, if more GT becomes availablebecause e.g. all lines of a book are reviewed and corrected to achieve a final error rate ofnear 0%. The default OCRopus implementation uses a shallow one layer bidirectionalLSTM network combined with the CTC-Loss to predict a text sequence from the lineimage. Since convolutional neural networks (CNN) showed an outstanding performanceon many image processing tasks, see e.g. Mane and Kulkarni (2017), our aim is to traina mixed CNN-LSTM network to increase the overall performance of OCR. Therefore,we compare the default OCRopus implementation with the deep network architecturesprovided by the novel OCR engine Calamari3 which is based on TensorFlow4. It iswell known that voting the outputs of several different models improves the accuracyby a significant margin, which is why we use Calamari’s cross fold training approachproposed by Reul et al. (2018). This approach trains five different models whose outputsare combined by a voting mechanism that considers the confidence values of each output.Moreover, Calamari offers data augmentation and pretrained models to increase theaccuracy especially on small datasets.
The rest of the paper is structured as follows: Section 2 introduces and discussesrelated work regarding OCR on early printed books including deep models and voting.The used data and the applied methods are described in detail in Section 3. In Section4, we evaluate and discuss the results achieved on three early printed books. Aftersumming up the results and insights in Section 5 we conclude the paper with someideas regarding future work.
2 Related Work
This section lists related work concerning the application of CNN-LSTM hybrids inthe areas of speech, vision, and text processing. Furthermore, related work coveringimprovements on OCR using different voting algorithms are itemized.
2.1 Combinations of CNN-LSTM
Currently CNN-LSTM hybrids are used in a high diversity of fields to achieve state-of-the-art results. The combination of those diverse network structures is promisingbecause CNNs are suited for hierarchical but location invariant tasks, whereas LSTMsare perfect at modelling temporal sequences.
For example, in the domain of speech processing Sainath et al. (2015) use a combina-tion of LSTMs, CNNs and Fully Connected Layer for an automatic speech recognitiontask, or else Trigeorgis et al. (2016) train a CNN-LSTM for speech emotion recognition.Another excellently suited area for CNN-LSTM networks is video processing, sinceCNNs are perfect for handling images and the video itself is a sequence of images. Forinstance, in this area Donahue et al. (2015) propose a CNN-LSTM as basic structure
3https://github.com/Calamari-OCR/calamari4https://www.tensorflow.org/
80 JLCL

Comparison of OCR Accuracy on Early Printed Books
to automatically generate video descriptions or Fan et al. (2016) use this structure forrecognizing emotions in videos.
In the field of text recognition, a combination of CNNs and LSTM was most recentlyproposed by Breuel (2017). The deep models yield superior results on the University ofWashington Database III5, which consists of modern English prints with more than95,000 text lines for training. However, the effect of deep networks on historical booksand using only a few dozens of training lines for training book individual models hasnot been considered, yet.
A very similar task to OCR is handwriting recognition, e.g. by Graves and Schmid-huber (2009) or Bluche (2015) or scene text recognition, e.g. by Shi et al. (2017). Theseapplications usually act on contemporary data, which is why it is meaningful to includea language model or a dictionary to achieve a higher accuracy. However, for earlyprinted books, e.g. medieval books, general language models are less effective mostlydue to variability in spelling.
2.2 Voting
Using voting methods to improve the OCR results of different models was investigatedby many different researchers, an overview is given by Handley (1998). Here, we listonly a subset of the most important and the most recent work in the field of OCR andfocus mostly on historical documents.
Rice et al. (1996) showed that voting the outputs of a variety of commercial OCRengines reduces the CER from values between 9.90% and 1.17% to 0.85%. The votingalgorithm first aligns the outputs by using a Longest Common Substring algorithm(Rice et al., 1994) and afterwards applies a majority voting to determine the bestcharacter including a heuristic to break ties.
Al Azawi et al. (2015) trained an LSTM network as voter of the aligned output oftwo different OCR engines. A comparison using printings with German Fraktur and theUniversity of Washington Database III the LSTM approach led to CERs around 0.40%,while the ISRI voting tool achieved CERs around 2%. A major reason for this highimprovement is that the LSTM-based voting algorithm learns some sort of dictionary.Thus, the voter was able to predict a correct result even in cases where each individualvoter failed. However, this behaviour might not be desired since the method not onlycorrects OCR errors but also normalizes historical spellings.
Most recently, in Reul et al. (2018) we showed that a cross-fold training procedurewith subsequent confidence voting reduces the CER on several early printed booksby a high amount of up to and over 50%. This voting procedure not only takes theactual predictions of a single voter into account, but also their confidence about eachindividual character. Therefore, instead of a majority voting for the top-1 output classthe best character is chosen for the top-N outputs. This led to improvements by another5% to 10% compared to the standard ISRI sequence voting approach.
5http://isis-data.science.uva.nl/events/dlia/datasets/uwash3.html
JLCL 2018 – Band 33 (1) 81

Wick, Reul, Puppe
2.3 Data Augmentation and Pretraining
A crucial point for the performance of DNNs is the availability of huge labeled datasets.However, if only a few data points are available or if the GT has to be labeled manuallythe GT can be augmented to generate new examples. The applied operations must belabel preserving, e.g. a line image must still show the same content after augmentation.The augmentations used in Calamari are provided by OCRodeg6 and consist of padding,distortions, blobs, and multiscale noise.
Furthermore, in Reul et al. (2017b), we successfully applied transfer learning on earlyprinted books using OCRopy: Instead of training a network from scratch with randomweights, the weights can be copied from a network that was trained on different GT.Thus, the new network starts its training already with knowledge about the task, i.e.the transferred features are meaningful on the new data as-well. The network only hasto adapt for the new typeface and possibly some new characters in the codec. Therefore,in general, the network requires less lines of GT to reach the CER of a network trainedfrom scratch.
3 Material and Methods
The OCR pipeline of Calamari is based on the OCRopus workflow, whose fundamentalidea is to use a full text line as input and train an LSTM network to predict the GTcharacter sequence of that line. This is achieved by the usage of the CTC-Loss duringtraining and a CTC-Decoder for prediction. For a deeper insight in this pipeline, inthis section, we first introduce the used datasets. Afterwards, we explain our trainingand evaluation procedure. Finally, the differences of OCRopy and Calamari concerningimplementation, hyperparameters, and network architectures are listed.
3.1 Datasets
For our experiments we employ three different early printed books (see Table 1). Onlylines from running text are used, whereas headings, marginalia, page numbers etc. areexcluded, because these elements vary in line length, font size or their characters e.g.numbers are underrepresented. Thus, the actual data is not affected by unwanted sideeffects resulting from these elements. 1505 represents an exception to that rule as wechose the extensive commentary lines instead, as they presented a bigger challenge dueto very small inter character distances and a higher degree of degradation. Figure 1shows one line per book as an example.
1505 is an edition of the Ship of Fools (Narrenschiff by Sebastian Brant) and wasdigitized as part of an effort to support the Narragonien digital project at the Universityof Würzburg7. 1488 was gathered during a case study of highly automated layout
6https://github.com/NVlabs/ocrodeg7http://kallimachos.de/kallimachos/index.php/Narragonien
82 JLCL

Comparison of OCR Accuracy on Early Printed Books
Figure 1: An example line from each of the used books. From top to bottom: 1476, 1488, 1505.
Table 1: Books used for evaluation and their respective number of ground truth lines available fortraining and validation.
Year Language GT Train GT Validation1476 German 2,000 1,0001488 German 3,178 1,0001505 Latin 2,289 1,000
analysis Reul et al. (2017a) and 1476 is part of the Early New High German ReferenceCorpus8. The GT data of all three books was published9 by Springmann et al. (2018).
3.2 Training and Evaluation
To train the essential book specific models the human effort to annotate GT shouldbe minimized. Therefore, we examine the effect of adding only a few dozen lines ofGT on the CER of an individual book. The aim of a real world application is to trainincrementally improved models when more GT becomes available to support the humanannotator with increasingly better models.
As setup, each book in the dataset is first split into an evaluation and a training set.While the evaluation set is fixed, the training set size is chosen as 60, 100, 150, 250, 500,and 1,000 lines, with each set subsuming the smaller sets entirely. Then, each trainingset is divided into a 5-fold, where four parts are used for the actual training and onepart for validation. For example, if 100 lines are chosen randomly from the full set,each fold uses 80 lines for training and the remaining 20 lines for validation. These 20validation lines are distinct from each of the five folds resulting in five diverse models.Based on the validation set the best performing model for each fold is determined.
In summary, for three books and six different numbers of lines in the training set, wetrain five models, respectively. For each run, we compute the CER on the validationset every 1,000 iterations to determine the best model of this fold. This model is thenevaluated on the initial evaluation dataset to obtain the final CER. Since the resultsof each of the five folds vary, we compute the average to compare the outcomes ofthe different network architectures, books, and number of lines. Furthermore the five
8http://www.ruhr-uni-bochum.de/wegera/ref/index.htm9https://zenodo.org/record/1344132/
JLCL 2018 – Band 33 (1) 83

Wick, Reul, Puppe
A
� n(0.6) u(0.1)n(0.2) u(0.3)n(0.4) u(0.5)
�example sentence
Figure 2: An example for the improvement by using the confidence voting mechanism. Here onlythree voters are considered. Although the character "u" is the best character twice the"n" is chosen for the final output because of its higher average confidence.
predictions are used to compute a voted result using the voting mechanism describedin Section 3.3.
At each iteration during training one line is randomly chosen out of the data fold tocompute the gradient update. The number of iterations during training is chosen as10,000, 12,000, 15,000, 20,000, 25,000, and 30,000 for the training set size of 60, 100,150, 250, 500, and 1,000, respectively. These values are fixed for both OCRopus andCalamari.
3.3 Voting
In order to further improve the predictions, we implement the confidence voting schemeas proposed by Reul et al. (2018) to vote on the label sequences that are produced bythe CTC-Greedy-Decoder for each fold considering the confidence of each predictedcharacter. An example for only three voters is shown in Figure 2.
In a first step, all sentences are aligned as far as possible. Afterwards, all differencesare resolved by averaging the confidence of all equal options and keeping the characterwith the highest value. Naturally, this procedure cannot guarantee a flawless output,but it significantly improves the overall result.
An important prerequisite for the models that are used to vote is that they aresimilarly performant, but diverse in their predictions. Errors that occur randomly inone or another sentence can easily be corrected, whereas errors that appear in everyoutput cannot be identified. The above Cross-Fold-Training as proposed by Reul et al.(2018) yields different models that can be used for voting although a high amount oftraining data is shared among each pair of models.
The number of models that are used for voting in our experiments is set to five. Thoseare the individual models produced by the 5-fold Cross-Validation on each trainingset. A higher number of voters is expected to yield better results with the drawback torequire a higher effort in training and prediction. Experiments showed that a fold sizeof five is reasonable trade-off.
3.4 Comparison of Calamari and OCRopy
While both Calamari and OCRopy are written in Python and their interfaces areidentical (both require images of lines and their respective GT) there are many distinct
84 JLCL

Comparison of OCR Accuracy on Early Printed Books
differences regarding the implementation, supported features and default settings.To fasten up the computations of the neural network, OCRopy supports usage of
CLSTM10 which is a C++ implementation of the fixed LSTM network architecturesand only runs on the CPU. Calamari however uses Googles TensorFlow library thatboth allows to design custom network architectures and to utilize a GPU.
Calamari supports the described Cross-Fold-Training mechanism and confidencevoting as well as integrated data augmentation. To choose the best model based on thevalidation data set as provided by the Cross-Folds, Calamari implements early stoppingso that an upper limit for the number of training iterations is optional. Thereto, aftera certain number of iterations the early stopping algorithms tests whether the currentmodel improves the accuracy on the validation data. If the accuracy has not improvedfor a given number of models (default 10), the training is stopped. Data augmentationof the training data is provided by a variable factor naug, i.e. each line is replicated naugtimes. Other features are the support of bidirectional text, and an automatic codecadaption if a pretrained model is loaded that shares only a subset of characters.
Calamari employs by default an Adam solver with an initial learning rate of 0.001,whereas OCRopy utilizes a learning rate of 0.0001 and a Momentum solver with amomentum of 0.9. The batch size of Calamari can be chosen arbitrarily, and is 1 bydefault. OCRopus does not allow to train or predict batchwise. Moreover, Calamariimplements an automatic gradient clipping to tackle the exploding gradient problem ofLSTMs as proposed by Pascanu et al. (2013).
The standard OCRopus network uses a single hidden LSTM layer with 100 nodes.Calamari extends this shallow structure by introducing two pairs of convolutional (40and 60 kernels) and pooling layers before the default LSTM-Layer with 200 nodes.Calamari uses a convolutional kernel of size 3 × 3 with a stride of 1 and equal padding.The network uses max pooling layers with a kernel size and stride of 2 × 2. A stride ora kernel size of 2 in the first dimension, that is the time dimension, halves the widthof the intermediate picture and therefore the number of LSTM operations. On theone hand, this makes the network faster but on the other hand repeated charactersmight not get resolved, because the CTC-Decoder requires an intermediate blank label.Finally, Calamari adds dropout with a factor of 0.5 to the last layer.
Even though the network architecture of Calamari can be adapted, preliminaryexperiments showed that Calamari’s default network yields competitive results in bothaccuracy and speed, hence it will be used as the deep network in the following. Theshallow network architecture is the default OCRopus network.
An overview of the differences and default values is listed in Table 2.
4 Experiments
In the following, we present our findings regarding the improvements of the deeperarchitecture, and the usage of voting. Additionally, we compare the time required for10https://github.com/tmbdev/clstm
JLCL 2018 – Band 33 (1) 85

Wick, Reul, Puppe
Table 2: Comparison and default values of OCRopy and Calamari regarding various aspects.OCRopy Calamari
Language Python 2 Python 3Network Backend Native/CLSTM Tensorflow
GPU Support No YesDefault Network
ArchitectureLSTM 100 CNN 40, Pool, CNN 60, Pool,
LSTM 200CNN Kernel Size − 3 × 3
Pool Size − 2 × 2Dropout No YesSolver Momentum (0.9) Adam
Default Learning Rate 0.0001 0.001Voting No Yes
Pretrained Models Yes (identic codec) YesData Augmentation No Yes
training and prediction of the different architectures, and extend the training corpusto a size of up to 3,000 lines to investigate the behaviour of the deep models on manylines. Finally, we use data augmentation or pretraining to minimize the CER with thefocus on only a few lines of GT. All experiments are conducted by using the defaulthyperparameters and network architectures of Calamari and OCRopy as described inSec. 3.4.
4.1 Results of the Deep Network
Table 3 shows exemplarily the CER for each of the five folds on the three books for 60,100 and 1,000 lines. The average of these five models is used to compute the averageimprovement of the deep network. Note, that in practice the individual results of themodel for each fold must be combined e.g. by voting (see Section 3.3) in order to obtaina usable result. Without voting, only one fold could be used to predict a sequence.
The results of the individual folds show no obvious correlation between CERs onthe same fold, that is the same training data, and its CERs on different networkarchitectures. For example, the worst fold of the shallow network on book 1488 using100 lines is the forth fold with a CER of 4.79%. However, the same fold results in thesecond best model for the deep network. The same can be observed for book 1505 forthe second fold: The best outcome of the deep network with CER of 3.02% is the worstfold for the shallow network.
The relative improvements that are shown in Table 3 are listed for all the differentnumber of lines in Table 4. In the left section the relative improvements of the average
86 JLCL
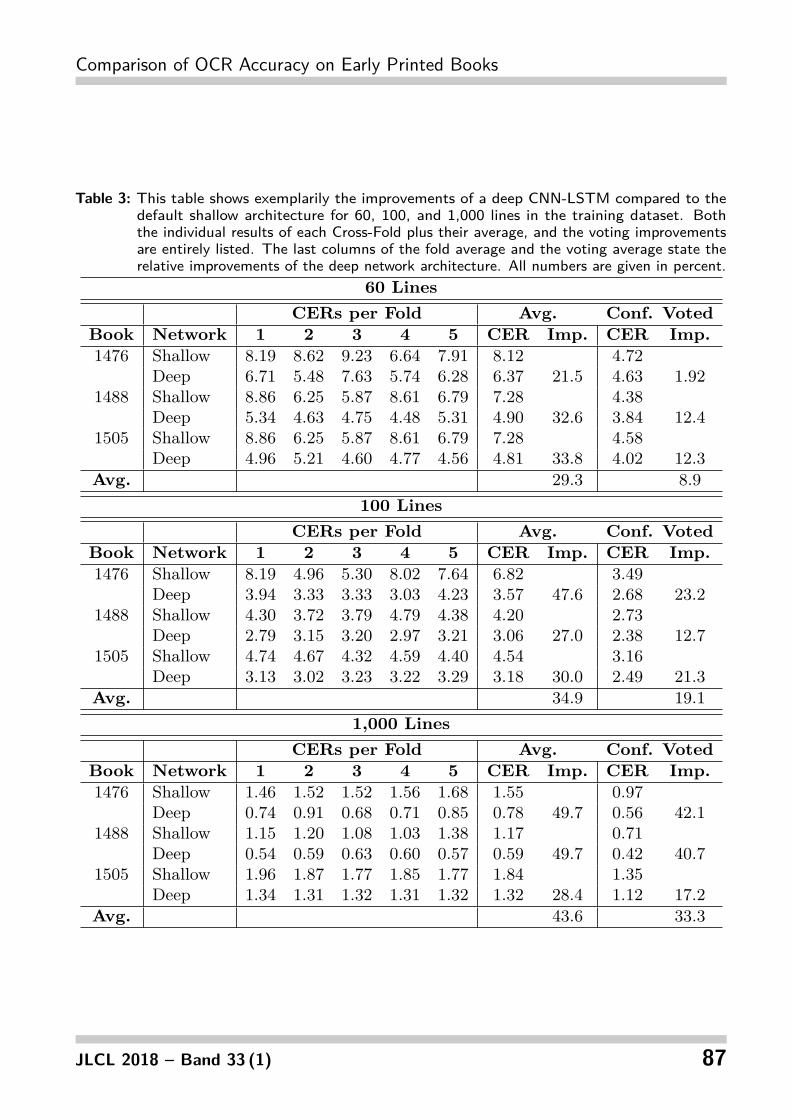
Comparison of OCR Accuracy on Early Printed Books
Table 3: This table shows exemplarily the improvements of a deep CNN-LSTM compared to thedefault shallow architecture for 60, 100, and 1,000 lines in the training dataset. Boththe individual results of each Cross-Fold plus their average, and the voting improvementsare entirely listed. The last columns of the fold average and the voting average state therelative improvements of the deep network architecture. All numbers are given in percent.
60 LinesCERs per Fold Avg. Conf. Voted
Book Network 1 2 3 4 5 CER Imp. CER Imp.1476 Shallow 8.19 8.62 9.23 6.64 7.91 8.12 4.72
Deep 6.71 5.48 7.63 5.74 6.28 6.37 21.5 4.63 1.921488 Shallow 8.86 6.25 5.87 8.61 6.79 7.28 4.38
Deep 5.34 4.63 4.75 4.48 5.31 4.90 32.6 3.84 12.41505 Shallow 8.86 6.25 5.87 8.61 6.79 7.28 4.58
Deep 4.96 5.21 4.60 4.77 4.56 4.81 33.8 4.02 12.3Avg. 29.3 8.9
100 LinesCERs per Fold Avg. Conf. Voted
Book Network 1 2 3 4 5 CER Imp. CER Imp.1476 Shallow 8.19 4.96 5.30 8.02 7.64 6.82 3.49
Deep 3.94 3.33 3.33 3.03 4.23 3.57 47.6 2.68 23.21488 Shallow 4.30 3.72 3.79 4.79 4.38 4.20 2.73
Deep 2.79 3.15 3.20 2.97 3.21 3.06 27.0 2.38 12.71505 Shallow 4.74 4.67 4.32 4.59 4.40 4.54 3.16
Deep 3.13 3.02 3.23 3.22 3.29 3.18 30.0 2.49 21.3Avg. 34.9 19.1
1,000 LinesCERs per Fold Avg. Conf. Voted
Book Network 1 2 3 4 5 CER Imp. CER Imp.1476 Shallow 1.46 1.52 1.52 1.56 1.68 1.55 0.97
Deep 0.74 0.91 0.68 0.71 0.85 0.78 49.7 0.56 42.11488 Shallow 1.15 1.20 1.08 1.03 1.38 1.17 0.71
Deep 0.54 0.59 0.63 0.60 0.57 0.59 49.7 0.42 40.71505 Shallow 1.96 1.87 1.77 1.85 1.77 1.84 1.35
Deep 1.34 1.31 1.32 1.31 1.32 1.32 28.4 1.12 17.2Avg. 43.6 33.3
JLCL 2018 – Band 33 (1) 87
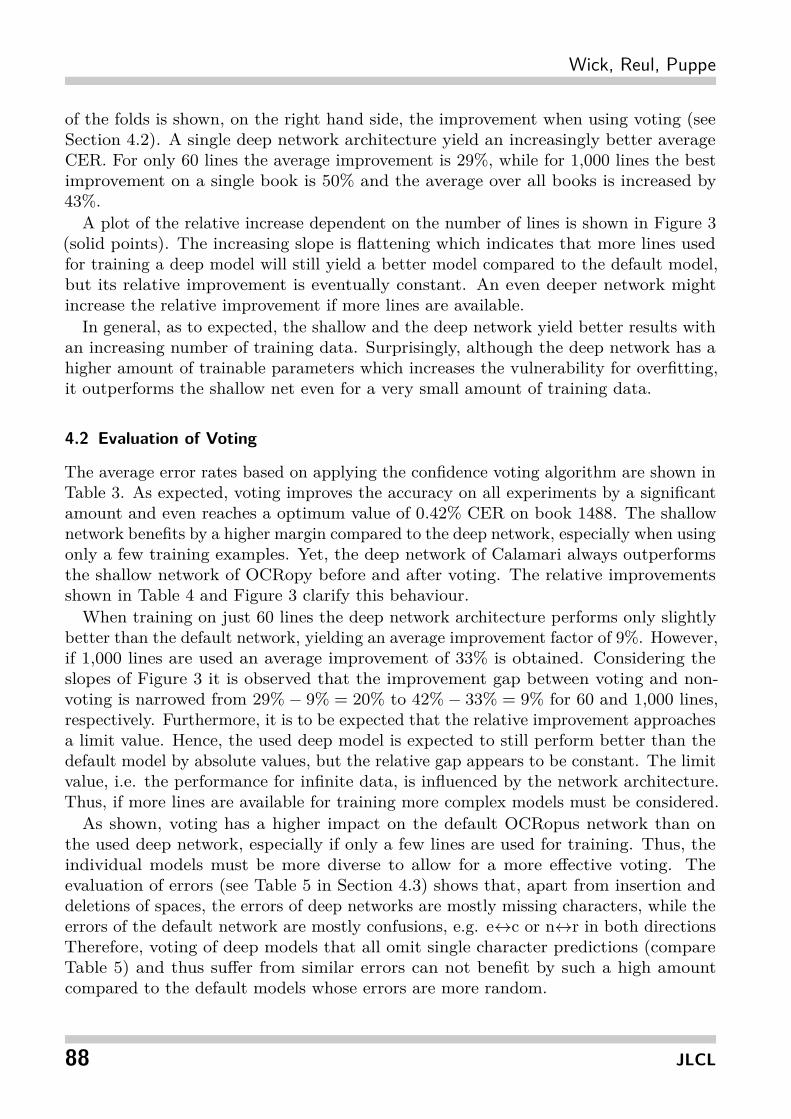
Wick, Reul, Puppe
of the folds is shown, on the right hand side, the improvement when using voting (seeSection 4.2). A single deep network architecture yield an increasingly better averageCER. For only 60 lines the average improvement is 29%, while for 1,000 lines the bestimprovement on a single book is 50% and the average over all books is increased by43%.
A plot of the relative increase dependent on the number of lines is shown in Figure 3(solid points). The increasing slope is flattening which indicates that more lines usedfor training a deep model will still yield a better model compared to the default model,but its relative improvement is eventually constant. An even deeper network mightincrease the relative improvement if more lines are available.
In general, as to expected, the shallow and the deep network yield better results withan increasing number of training data. Surprisingly, although the deep network has ahigher amount of trainable parameters which increases the vulnerability for overfitting,it outperforms the shallow net even for a very small amount of training data.
4.2 Evaluation of Voting
The average error rates based on applying the confidence voting algorithm are shown inTable 3. As expected, voting improves the accuracy on all experiments by a significantamount and even reaches a optimum value of 0.42% CER on book 1488. The shallownetwork benefits by a higher margin compared to the deep network, especially when usingonly a few training examples. Yet, the deep network of Calamari always outperformsthe shallow network of OCRopy before and after voting. The relative improvementsshown in Table 4 and Figure 3 clarify this behaviour.
When training on just 60 lines the deep network architecture performs only slightlybetter than the default network, yielding an average improvement factor of 9%. However,if 1,000 lines are used an average improvement of 33% is obtained. Considering theslopes of Figure 3 it is observed that the improvement gap between voting and non-voting is narrowed from 29% − 9% = 20% to 42% − 33% = 9% for 60 and 1,000 lines,respectively. Furthermore, it is to be expected that the relative improvement approachesa limit value. Hence, the used deep model is expected to still perform better than thedefault model by absolute values, but the relative gap appears to be constant. The limitvalue, i.e. the performance for infinite data, is influenced by the network architecture.Thus, if more lines are available for training more complex models must be considered.
As shown, voting has a higher impact on the default OCRopus network than onthe used deep network, especially if only a few lines are used for training. Thus, theindividual models must be more diverse to allow for a more effective voting. Theevaluation of errors (see Table 5 in Section 4.3) shows that, apart from insertion anddeletions of spaces, the errors of deep networks are mostly missing characters, while theerrors of the default network are mostly confusions, e.g. e↔c or n↔r in both directionsTherefore, voting of deep models that all omit single character predictions (compareTable 5) and thus suffer from similar errors can not benefit by such a high amountcompared to the default models whose errors are more random.
88 JLCL

Comparison of OCR Accuracy on Early Printed Books
Table 4: Relative improvement of the deep CNN compared to default OCRopus listed for all threebooks and the six variations of the amount of training data. The left and right halvesshow the relative improvements without and with voting, respectively. All numbers aregiven in percent.
Improvement over Folds Improvement over VotingBook Book
Lines 1476 1488 1505 Avg. 1476 1488 1505 Avg.60 21.5 32.7 33.8 29.3 1.9 12.4 12.3 8.9
100 47.6 27.0 30.0 34.9 23.2 12.7 21.3 19.8150 38.4 40.1 32.9 37.1 19.7 30.7 19.7 23.4250 49.7 54.6 30.9 45.0 27.0 34.2 23.5 28.2500 50.4 49.6 32.1 44.1 35.2 43.7 21.3 33.3
1,000 49.7 49.7 28.4 42.6 42.1 40.7 17.2 33.3
Figure 3: Relative averaged improvements of the deep network versus the default OCRopus network.The solid points indicate the relative improvements based on the averages of the individualCross-Fold results. The crosses mark the relative improvements when using confidencevoting.
JLCL 2018 – Band 33 (1) 89

Wick, Reul, Puppe
Table 5: The 10 most common errors made by the deep network after voting on the evaluationdataset of book 1476. The left and right halves lists the results for 150 and 1,000training lines, respectively. Both the count (Cnt.) of occurrences and their relative (Rel.)contribution to the total CER are shown. An underscore represents deletions or insertionsof characters.
150 Lines 1000 LinesCnt. Rel. True Predicted Cnt. Rel. True Predicted
56 8.9% SPACE _ 32 18.0% SPACE _54 8.6% _ SPACE 26 14.6% _ SPACE47 7.5% i _ 11 6.2% i _18 2.9% l _ 6 3.8% n _12 1.9% G E 3 1.7% r t12 1.9% n _ 2 1.1% r v10 1.6% r _ 2 1.1% S _9 1.4% r t 2 1.1% r _8 1.3% d _ 2 1.1% ſ f7 1.1% o _ 2 1.1% _ i
4.3 Error Analysis
Table 5 lists the ten most common errors of the deep network after voting whenpredicting the evaluation dataset of 1476. The results are shown for 150 lines and 1,000lines on the left and right columns, respectively. For both networks the most commonerrors consist of insertions or deletions of spaces. Their relative contribution accountfor one fifth for 150 lines, but almost one third for 1,000 lines, which underlines thedifficulty of the task of inserting correct spaces between narrowly printed text if nolanguage model or dictionary is used.
The model trained with 150 lines then mostly misses the prediction of characterswhich shows the expected behaviour for CTC-trained networks that are only trainedwith few data: To minimize the CTC-Loss it is more profitable to predict a blank ratherthan an actual uncertain character. The confusion of G and E vanished because the Goccurred rarely in the dataset with only a few lines, but it was successfully learned ifmore examples were available. The deep network trained with 1,000 lines shows errorsamong the top ten that are expected, e.g. confusions of f and ſ (long s).
4.4 Training and Prediction Times
In this section we compare the time required for training and for the prediction of anentire book of the default OCRopus network and our deep network. All times weremeasured on an Intel Core i7-5820K processor using 1, 2, 4, or 8 threads for eachexperiment. A NVIDIA Titan X is utilized to gauge the GPU times. During trainingthe parallelism is internally used in Numpy for the default OCRopus implementationand in the TensorFlow-Backend for our deep networks. TensorFlow supports cuDNN
90 JLCL

Comparison of OCR Accuracy on Early Printed Books
Table 6: Average times for training and prediction of a single line for all three books. Note thatduring prediction each line has to be processed five times due to the voting of the fivefolds. The timing procedure was conducted for a various number of threads.
Training in seconds Prediction in secondsThreads 1 2 4 8 GPU 1 2 4 8 GPUShallow 0.28 0.27 0.30 0.40 − 0.89 0.48 0.25 0.16 −
Deep 0.57 0.40 0.32 0.33 0.05 0.29 0.21 0.16 0.12 0.03
when using the GPU. For predicting, the default OCRopus implementation copies theindividual model for each thread and uses only one thread in the internal operations ofNumpy. Calamari instead creates only one model and predicts one batch consisting of20 lines in our setup using all desired threads.
Note that each line has to be processed five times during the prediction due to thevoting algorithm. Table 6 reports our findings for the averages across the three usedbooks.
First of all, the results for the training time show that, despite the deeper networkconsists of way more parameters and more operations, the optimized TensorFlowimplementation is only slightly slower than the default implementation based on Numpy,when only one thread is used. However, the shallow default LSTM net cannot benefitfrom a higher number of threads, instead it even suffers from a too high count. Thereason is, that the underlying matrix multiplications are too low dimensional in orderto be relevant for multiprocessing. As expected, the deep network benefits from up to 4threads, as the training time is decreased by an average factor of approximately 40%.The reason is, that the convolution operations that are carried out on each pixel on thefull image profit from a parallel computation. As a result, the deep network is fasterthan the default implementation when allowing several cores during the training. Ourresults show, that a number of 4 is sufficient.
The average time required to predict one line for the three books shows that thedeep network requires less than half the time compared to the default OCRopusimplementation, whereby the time for voting can be neglected. Using a higher numberof threads, the required time for prediction almost shrinks linearly for the defaultimplementation, since each thread computes a single independent model by construction.The TensorFlow implementation of Calamari still benefits from a higher thread count,but by a reduced factor due to the core sharing of batch versus convolutional operation.Yet, for all the tested thread counts the TensorFlow implementation is a bit faster thandefault OCRopus.
Usage of a GPU reduces the training and prediction times further by a factor of atleast six and four, respectively. These times can easily be reduced when processing awhole batch of lines instead of a single line.
JLCL 2018 – Band 33 (1) 91

Wick, Reul, Puppe
Table 7: Decrease of the CER for using more than 1,000 lines for training the deep network. Allvalues are given in percent.
Averaged CER of folds CER using votingBook Book
Lines 1476 1488 1505 Avg. 1476 1488 1505 Avg.1,000 0.78 0.59 1.3 0.90 0.56 0.42 1.1 0.701,500 0.69 0.50 1.3 0.82 0.48 0.35 1.0 0.622,000 0.62 0.49 1.2 0.76 0.45 0.35 1.0 0.603,000 − 0.43 − 0.43 − 0.34 − 0.34
4.5 Increasing the Training Data above 1,000 Lines
The available amount of data for the three books allows us to increase the training setsize up to 2,000, 3,000, and 2,000 lines for the books 1476, 1488, and 1505, respectively(compare Table 1). The averaged CER of the folds and after voting is shown in Table 7by usage of the deep network. As expected, even more lines for training reduces theCER even durther in all experiments with and without voting by a significant amount.Thus, we reached an average CER of 0.6% after voting.
4.6 Data Augmentation
In this section we examine the effect of data augmentation with a factor of naug = 10on the performances of deep network. In a first step, the training data consists of boththe augmentations and the original data. A second step uses the resulting model of thefirst step as starting point and continues the training on solely the original data.
The results using confidence voting of five different voters each with its own augmen-tations are shown in Table 8. As expected, especially for only a few lines in the trainingdata set data augmentation has a huge impact of up to 55%. Increasing the numberof lines decreases the benefit of augmentations to a point where it even worsens theresult (up to -19% on book 1488). This can be explained by the fact that the mixtureof real lines and augmented lines forces the network to focus on both types of datawhich is why it loses its specific training on just the real lines. Thus, when continuingthe training on only the real lines (step 2) the results clearly improve for many lines,but even for a few lines. On average, data augmentations in combination with thedeep network leads to a CER of below 2% and approximately 1% when using only 60and 150 lines for training, respectively. The shallow network as provided by OCRopusrequires more than 1,000 lines to reach this level of accuracy (compare Table 3).
In summary, the experiments show the expected behaviour that the data augmentationas implemented in Calamari yields slightly improved results for a large data set andvery high improvements of up to 55% for only a few lines.
92 JLCL

Comparison of OCR Accuracy on Early Printed Books
Table 8: Relative improvements of data augmentation with naug = 10. The first step trains onboth the real and augmented data, the second step continues the training only on the realdata. The last column shows the absolute CER of the final model (step 2) averaged overall three books.
Improvement after Step 1 Improvement after Step 2Book Book Avg.
Lines 1476 1488 1505 Avg. 1476 1488 1505 Avg. CER.60 56.2 60.4 40.2 52.3 61.4 62.1 41.2 54.9 1.87
100 43.8 46.8 28.0 39.5 46.6 52.0 29.6 42.7 1.43150 43.4 44.6 21.5 36.5 44.8 48.1 26.4 39.7 1.04250 32.0 22.3 19.7 24.6 37.9 31.4 25.4 31.5 0.83500 25.9 6.7 14.2 15.6 34.7 23.6 17.1 25.1 0.64
1,000 21.5 9.7 8.7 13.3 22.0 14.6 16.2 17.6 0.581,500 12.6 -6.5 9.5 5.2 15.2 3.9 13.9 11.0 0.542,000 4.3 -5.8 5.2 1.2 17.0 11.6 11.6 13.4 0.523,000 − -18.5 − -18.5 − 7.3 − 7.3 0.32
Table 9: Improvement of using both pretraining (PT) and data augmentation (AUG). All values arevoted and shown as percentage.
Improvement after PT Improvement after PT and AUGBook Book Avg.
Lines 1476 1488 1505 Avg. 1476 1488 1505 Avg. CER.60 51.1 46.8 30.0 42.7 70.5 68.8 48.0 62.4 1.6
100 37.9 41.9 22.7 34.2 63.6 55.8 39.8 53.1 1.2
4.7 Incorporating Pretrained Models
To evaluate the effect of pretraining, we use three different pretrained Calamari models11
designed for Fraktur (FRK), historical Latin (LH), and Modern English (EN). Twomodels of the five voters are trained with FRK, two more with LH and only one withEN since the trained typefaces of FRK and LH are closer to the target font. Theseoutcomes are voted by the confidence voter to obtain the final CER. Furthermore, wecombine pretraining with a data augmentation of 10. Both setups are only trained for60 and 100 lines of GT, because here on the one hand the effect of pretraining and dataaugmentation is expected to be the largest and on the other hand we want to simulatethe lack of manual annotated GT to train a book specific model.
As shown in Table 9, the CER for both 60 and 100 lines benefits from pretraining(left) and the combination with data augmentation (right). We reach an improvementof over 62% for 60 lines of GT compared to the model without pretraining or data
11https://github.com/Calamari-OCR/calamari_models
JLCL 2018 – Band 33 (1) 93

Wick, Reul, Puppe
Table 10: Improvements of voting, data augmentation, and pretraining (PT) for 60 and 100 linescomparing Calamari to OCRopy. All values are given in percent.
60 LinesBooks Averages
Model 1476 1488 1505 CER Imp.Shallow (OCRopy) 8.1 7.3 7.3 7.6 −Deep (Calamari) 6.4 4.9 4.8 5.4 28.9Deep + Voting 4.6 3.8 4.0 4.2 44.7Deep + Voting + Data aug. 2.0 1.5 2.4 2.0 73.7Deep + Voting + Data aug. + PT 1.4 1.2 2.1 1.6 78.9
100 LinesBooks Averages
Model 1476 1488 1505 CER Imp.Shallow (OCRopy) 6.8 4.2 4.5 5.2 −Deep (Calamari) 4.7 4.4 4.6 4.6 11.5Deep + Voting 2.7 2.4 2.5 2.5 51.9Deep + Voting + Data aug. 1.5 1.3 1.8 1.5 71.2Deep + Voting + Data aug. + PT 1.0 1.1 1.5 1.2 76.9
augmentation, with a final CER of 1.6%. An increase to only 100 lines drops the CERto 1.2%.
Comparing pretraining (Table 9) to the results of only data augmentation (Table 8)shows that data augmentation has a higher impact on the performance (e.g. 55% vs43% using 60 lines). However, data augmentation requires more training time thanusing pretrained models, because the initial random weights must be trained fromscratch.
5 Conclusion and future work
In this paper, we compared the combinations of CNN- and LSTM-Networks as im-plemented by Calamari to the default LSTM network of OCRopy achieving optimumvalues considerably below 1% CER and a relative improvement of above 50% comparedto standard models. The enhancements are increased by a larger amount of availabletraining data and the introduction of voting mechanisms, data augmentation, andpretrained models. Thus, to train a book specific model, only 60 or 100 lines of GT aresufficient to achieve an average CER of below 2% or about 1%, respectively, as shownin Table 10.
Although the proposed deeper network has a higher number of parameters theabsolute training and prediction time is in the same order of magnitude compared tothe standard model. However, the usage of a GPU quickens these times by a factor ofat least four depending on the lines processed in parallel.
94 JLCL

Comparison of OCR Accuracy on Early Printed Books
To further improve the voted results, distinct voters are required. These voters couldbe created by variations of the network architectures and the usage by several differentdatasets for pretraining.
Moreover, training of an even deeper network using many different books sharingsimilarities in typeface, is expected to result in a generic model that has very low errorrates on a high variety of fonts. To reduce its training time, a GPU combined withbatch-wise training should be considered to achieve a high throughput of lines persecond.
Recently, the popular OCR engine Tesseract12 published a new version that imple-ments Deep Neural Networks. We expect similar improvements compared to shallownetworks, however voting, data augmentation, and pretraining in the form of Calamariare not supported, yet. Moreover, GPUs can not be used to speed up the training time.
In summary, it can be stated that the application of Calamari implementing deepCNN-LSTM-networks, Cross-Fold-Voting, data augmentation, and pretraining opensthe door to a very promising approach to establish a new benchmark for OCR bothon early printed books and despite the historical focus of this paper also on any otherprint.
References
Al Azawi, M., Liwicki, M., and Breuel, T. M. (2015). Combination of multiple aligned recognitionoutputs using WFST and LSTM. In Document Analysis and Recognition (ICDAR), 201513th Int. Conf. on, pages 31–35. IEEE.
Bluche, T. (2015). Deep Neural Networks for Large Vocabulary Handwritten Text Recogni-tion. (Réseaux de Neurones Profonds pour la Reconnaissance de Texte Manucrit à LargeVocabulaire). PhD thesis, University of Paris-Sud, Orsay, France.
Breuel, T. M. (2017). High performance text recognition using a hybrid convolutional-lstmimplementation. In 2017 14th IAPR International Conference on Document Analysis andRecognition (ICDAR), pages 11–16. IEEE.
Donahue, J., Anne Hendricks, L., Guadarrama, S., Rohrbach, M., Venugopalan, S., Saenko, K.,and Darrell, T. (2015). Long-term recurrent convolutional networks for visual recognitionand description. In Proceedings of the IEEE conference on computer vision and patternrecognition, pages 2625–2634.
Fan, Y., Lu, X., Li, D., and Liu, Y. (2016). Video-based emotion recognition using cnn-rnnand c3d hybrid networks. In Proceedings of the 18th ACM International Conference onMultimodal Interaction, ICMI 2016, pages 445–450, New York, NY, USA. ACM.
Graves, A. and Schmidhuber, J. (2009). Offline handwriting recognition with multidimensionalrecurrent neural networks. In Advances in neural information processing systems, pages545–552.
Handley, J. C. (1998). Improving OCR accuracy through combination: A survey. In Systems,Man, and Cybernetics, 1998. 1998 IEEE Int. Conf. on, volume 5, pages 4330–4333. IEEE.
12https://github.com/tesseract-ocr/tesseract
JLCL 2018 – Band 33 (1) 95

Wick, Reul, Puppe
Mane, D. T. and Kulkarni, U. V. (2017). A survey on supervised convolutional neural networkand its major applications. IJRSDA, 4(3):71–82.
Pascanu, R., Mikolov, T., and Bengio, Y. (2013). On the difficulty of training recurrent neuralnetworks. In Proceedings of the 30th International Conference on Machine Learning, ICML2013, Atlanta, GA, USA, 16-21 June 2013, volume 28 of JMLR Workshop and ConferenceProceedings, pages 1310–1318. JMLR.org.
Reul, C., Dittrich, M., and Gruner, M. (2017a). Case study of a highly automated layoutanalysis and ocr of an incunabulum: ’der heiligen leben’ (1488). In Proceedings of the 2NdInt. Conf. on Digital Access to Textual Cultural Heritage, DATeCH2017, pages 155–160,New York, NY, USA. ACM.
Reul, C., Springmann, U., Wick, C., and Puppe, F. (2018). Improving OCR accuracy onearly printed books by utilizing cross fold training and voting. In 13th IAPR InternationalWorkshop on Document Analysis Systems, DAS 2018, Vienna, Austria, April 24-27, 2018,pages 423–428. IEEE Computer Society.
Reul, C., Wick, C., Springmann, U., and Puppe, F. (2017b). Transfer learning for OCRopusmodel training on early printed books. 027.7 Zeitschrift für Bibliothekskultur / Journal forLibrary Culture, 5(1):38–51.
Rice, S. V., Jenkins, F. R., and Nartker, T. A. (1996). The fifth annual test of OCR accuracy.Information Science Research Institute.
Rice, S. V., Kanai, J., and Nartker, T. A. (1994). An algorithm for matching OCR-generated textstrings. International Journal of Pattern Recognition and Artificial Intelligence, 8(05):1259–1268.
Sainath, T. N., Vinyals, O., Senior, A., and Sak, H. (2015). Convolutional, long short-termmemory, fully connected deep neural networks. In 2015 IEEE International Conference onAcoustics, Speech and Signal Processing (ICASSP), pages 4580–4584.
Shi, B., Bai, X., and Yao, C. (2017). An end-to-end trainable neural network for image-basedsequence recognition and its application to scene text recognition. IEEE Transactions onPattern Analysis and Machine Intelligence, 39(11):2298–2304.
Springmann, U., Fink, F., and Schulz, K. U. (2016). Automatic quality evaluation and (semi-)automatic improvement of mixed models for ocr on historical documents. CoRR.
Springmann, U. and Lüdeling, A. (2017). OCR of historical printings with an applicationto building diachronic corpora: A case study using the RIDGES herbal corpus. DigitalHumanities Quarterly, 11(2).
Springmann, U., Reul, C., Dipper, S., and Baiter, J. (2018). GT4HistOCR: Ground Truth fortraining OCR engines on historical documents in German Fraktur and Early Modern Latin.
Trigeorgis, G., Ringeval, F., Brueckner, R., Marchi, E., Nicolaou, M. A., Schuller, B., andZafeiriou, S. (2016). Adieu features? end-to-end speech emotion recognition using a deepconvolutional recurrent network. In 2016 IEEE International Conference on Acoustics,Speech and Signal Processing (ICASSP), pages 5200–5204.
96 JLCL

1
Calamari − A High-Performance Tensorflow-based Deep Learning Package for Optical Character Recognition
Christoph Wick, Christian Reul, and Frank Puppe Universität Würzburg, Chair of Computer Science VI
{prename.surname}@uni-wuerzburg.de
Abstract
Optical Character Recognition (OCR) on contemporary and historical data is still in the focus of many
researchers. Especially historical prints require book specific trained OCR models to achieve applica-
ble results (Springmann and Lüdeling, 2017, Reul et al., 2017a). To reduce the human effort for man-
ually annotating ground truth (GT) various techniques such as voting and pretraining have shown
to be very efficient (Reul et al., 2018a, Reul et al., 2018b). Calamari is a new open source OCR line
recognition software that both uses state-of-the art Deep Neural Networks (DNNs) implemented in
Tensorflow and giving native support for techniques such as pretraining and voting. The customiza-
ble network architectures constructed of Convolutional Neural Networks (CNNS) and Long-Short-
Term-Memory (LSTM) layers are trained by the so-called Connectionist Temporal Classification
(CTC) algorithm of Graves et al. (2006). Optional usage of a GPU drastically reduces the computation
times for both training and prediction. We use two different datasets to compare the performance of
Calamari to OCRopy, OCRopus3, and Tesseract 4. Calamari reaches a Character Error Rate (CER) of
0.11% on the UW3 dataset written in modern English and 0.18% on the DTA19 dataset written in
German Fraktur, which considerably outperforms the results of the existing softwares.
1 Introduction Optical Character Recognition (OCR) of contemporary printed fonts is widely considered as a
solved problem for which many commercial and open source software products exist. However,
the task of text recognition on early printed books is still a challenging task due to a high variability
in typeset, additional characters, or low scan quality. To master OCR on early printed books, a
book or font specific model must be trained to achieve CERs below 2% (Reul et al., 2017a,
Springmann and Lüdeling, 2017). For this purpose, highly performant individual models must be
trained in a short period of time using as less manually annotated GT files as possible. Currently,
there exist several Free Open Source Software (FOSS) attempts for such programs: OCRopy,
OCRopus 3, Kraken, or Tesseract 4, each with its own advantages or drawbacks.
Calamari1 is a novel software for training and applying OCR models in order to predict2 text lines
including several up-to-date techniques to highly optimize the computation time and the perfor-
mance of the models. The usage of Tensorflow allows to design arbitrary DNNs including CNN and
LSTM structures that are proven to yield improved results compared to shallow network struc-
tures (Breuel, 2017, Wick et al., 2018). These networks can optionally use CUDA and cuDNN (on
a supported GPU) which results in a highly reduced computation time. Compared to other FOSS
Calamari supports various techniques that minimize the CER including voting and pretraining
(see Reul et al., 2018a, Wick et al., 2018). The software is not designed as a full OCR pipeline which
includes tasks such as layout analysis, or line segmentation, but is the topic of a separate publica-
tion (in preparation), instead it focuses solely on the OCR step that transcribes line images to text.
However, Calamari as Python-Package3 can easily be integrated in existing pipelines to manage
1 https://github.com/Calamari-OCR 2 Throughout this paper, the term “predict” is used whenever machine-readable text is automatically tran-scribed from a line image. 3 https://pypi.org/project/calamari_ocr/

2
the OCR part. Thus, by design without any changes it can directly replace the OCR-Engine of
OCRopy.
2 Related Work In the following, we give a short list of the existing open source OCR programs OCRopy, OCRopus
3, Tesseract 4, and Kraken. All of these systems are designed to support the full pipeline from plain
page to text. Since the intention of Calamari is solely to handle the OCR of line images, only this
functionality of the other programs will be described and compared.
Currently, there exist several versions of OCRopy which was originally published by Breuel (2008)
(see also Breuel et al., 2013), that are still maintained. OCRopy4 is the first software that allowed
a user to train custom LSTM based models incorporating the CTC-Loss function (Graves et al.,
2006). By default, it uses a slow numpy based implementation of the computation, which can be
exchanged by a faster C-based clstm one. However, neither the GPU nor Deep CNN-LSTM models
can be used. For training it requires a list of images and their GT and outputs a model, which then
can be used to automatically transcribe the written text of other text lines.
Kraken5 is a fork of OCRopy, which has a different API, uses clstm as default, and adds support for
bidirectional and top to bottom text. Currently, the usage of PyTorch6 as Deep Learning engine
supporting GPU training is under development.
While OCRopy is still maintained OCRopy 27 seems not to be developed anymore, probably due to
the introduction of OCRopus 38 which changed all major OCR components to Deep Models using
PyTorch. OCRopus 3 supports variable network architectures including CNNs and LSTMs and al-
lows training and applying of the models on the GPU. The resulting models yield state-of-the-art
results and can be trained with minimal effort in time.
Tesseract9 was initially released as open source in 2005 and is still under development. The new-
est version 4 of Tesseract adds support for deep network architectures such as LSTM-CNN-Hy-
brids, however GPU support is not offered. To prototype network structures Tesseract proposes
a Variable-size Graph Specification Language (VGSL) which is similar to the network prototype
language of Calamari.
3 Methods Calamari comprises several techniques to achieve state-of-the art results on both contemporary
prints and historical prints. Beside different DNN architectures (see Appendix Appendix A. ), it
supports confidence voting of different predictions and finetuning with codec adaption. These
methods will be presented in the following.
3.1 Finetuning and Codec Resizing A general approach to improve the accuracy of a model on a specific dataset is not to train from
scratch but instead to start from an existing robust model and to finetune for the specific task (see
e.g. Reul et al., 2017b). Usually, the alphabet of the base model differs from the desired labels
which is why the output layer is usually fully replaced. However, in the task of OCR many letters,
4 https://github.com/tmbdev/ocropy 5 http://kraken.re/ 6 https://pytorch.org/ 7 https://github.com/tmbdev/ocropy2 8 https://github.com/NVlabs/ocropus3 9 https://github.com/tesseract-ocr/tesseract

3
digits, or punctuations are shared across the base model and the target task, and only a few new
letters might be added e.g. German umlauts when starting from an English model, or erased e.g.
the character "@" which does not exist in historical texts. It is rational to keep those weights as is
and add or remove new or unneeded labels instead of training the output layer from scratch.
In the area of historical printed books an individual model for each book must be trained to
achieve reasonable results for OCR. To reduce the human effort required for manually transcrib-
ing GT lines the OCR model should be trained using as few lines as possible. However, if using only
a few lines some characters might not be present yet, e.g. capital letters or digits. Hence, a whitelist
is useful to define characters that should not be erased from the base model. Thus, the resulting
model has still a chance to predict those letters, even if they have never been seen during finetun-
ing.
Another benefit of using a pretrained model is the reduced computation time to train a model.
Since the initial weights are not randomly chosen but set to meaningful features that are expected
to generalize on the new data only small variations are required to optimize on the new data.
3.2 Voting Another technique to obtain more robust results is to vote the outcomes of different models (see
e.g. Reul et al., 2018b). Hereby, several models are individually applied to the same data, each
generating one result called a vote. The final output can be inferred by majority voting. Further
refinement is obtained by weighting each vote: the higher the confidence of the model in general,
or the actual prediction in particular, the higher the weight (“confidence voting”). The benefit of
voting depends highly on the variance of the individual voters. If the voters predict very similar
results, errors are less probable of being removed, as if more diverse models are used.
In case of OCR, confidence voting showed the best results so far. This voting mechanism does not
only include the most likely predicted character but also alternatives with its probabilities into
account. Figure 1 shows a simple example of confidence voting. Three different voters predict the
possible characters with an individual confidence. If a single voter chooses the character with the
highest confidence, the capital letter "I" is winning in a majority vote. However, if one adds up
each individual confidence values the correct letter "l" is chosen as the final output.
To obtain different voters based on a dataset several approaches are meaningful, e.g. using differ-
ent training data, network architectures, base models for finetuning. Recently, we showed that
variable voters can be generated by a simple but robust approach called cross-fold-training (Reul
et al., 2018b).
4 The Calamari OCR-System Calamari supports easy instructions to use any of the listed methods to train various models, and
to apply them on existing lines. The software is implemented in Python3 and uses Tensorflow for
Deep Learning of the neural net. In doing so, Calamari supports usage of the GPU including the
highly optimized cuDNN kernels provided by NVIDIA for a rapid training and an automatic tran-
scription of multiple lines (batches) simultaneously.
Figure 1: An example for the confidence voting algorithm. Each row shows a part of the output of three different voters. When choosing the most frequent top result of each voter (bold) an "I" would be predicted. However, when adding the confidences of each voter, the letter "l" is predicted.

4
4.1 Preprocessing Both the lines and the text are preprocessed by Calamari for all conducted experiments. The line
images are converted to grayscale and are rescaled proportionally to a standard height of 48 pix-
els. Optionally, the lines are dewarped using OCRopy's dewarping algorithm. Crucial problems of
the bidirectional LSTM are the predictions of the first and last few pixels of a line which can be
seen as transient behaviour of the internal LSTM state. Therefore, a padding of 16 white pixels is
added to each side of the line.
The textual preprocessing allows to resolve several visual ambiguities such as converting Roman
unicode digits to Latin letters or joining repeated white space. Furthermore, Calamari adds sup-
port for mixed left-to-right and right-to-left text. This solves a challenging task: mirrored symbols
e.g. opening or closing brackets depend on the reading order which can change within a line.
4.2 Training Calamari can easily be trained on new material if an appropriate model is not available yet. As
input for training, Calamari expects just as OCRopy a list of line images and the corresponding text
files. For efficiency, the full data is loaded and kept in memory for the complete training task in-
stead of repeatedly reading only the current training example. The actual hyperparameters of Cal-
amari are described in Appendix Appendix B. .
4.3 Prediction To apply a trained model on new line images Calamari expects one or more models for automatic
transcription. If several models are used, Calamari votes the results of each individual model to
generate the output sentence.
Sometimes, it might be useful to access additional information of the prediction. Therefore, Cala-
mari allows to generate information about the position and its confidence of each individual char-
acter, as well as the full probability distribution of the input.
5 Experiments To compare the performance of Calamari to OCRopy, OCRopus 3, and Tesseract 4 we use the da-
tasets UW3 and DTA19. All final results of Calamari were achieved by using early stopping. Hereby
we check every 20,000 iterations for a smaller CER on 20% of the training data (hence 80% are
used for actual training), after ten checks without a better model, we interrupt the training. Simi-
larly, we chose the best OCRopy or OCRopus 3 model based on the same 20% of training data.
Tesseract 4 itself chooses its best model on the provided test data set. For Calamari and OCRopus
3 we use a batch size of 5, the OCRopy and Tesseract 4 do not support batching.
5.1 Datasets For evaluating Calamari, we use two datasets with several millions of characters in the training
set and three historical printed books.
The smaller University of Washington Database III10 (UW3) consists of extracted lines images from
different English scientific and technical journal reports which are printed in a modern Antiqua
font. In total, more than 70,000 lines for training and almost 10,000 lines for evaluation are avail-
able. Breuel (2017) uses a different version of this dataset (UW3α) with 95,190 text lines for train-
ing and 1,253 text lines for evaluation. Unfortunately, this split is not publicly available.
10 http://www.tmbdev.net/ocrdata-split/

5
The other large dataset German Text Archive of the 19th Century11 (DTA19) extracted from the
German Text Archive (see Wiegand et al., 2018) consists of 39 German Fraktur novels (mostly)
printed during the 19th century (1797-1898). Eight novels consisting of 50,968 text lines are used
for evaluation the remaining books with 192,974 lines for training. Thus, the evaluation measures
the capability of the models to generalize for unseen fonts.
The three historical printed books12 of the years 1476, 1478, and 1499 are written in broken script
(Fraktur in a wider sense) and only consist of 3,100, 2,695, and 1,578 lines respectively. We use
only 50 lines for training to simulate a human annotator that has to manually transcribe GT data,
yet wants to achieve the best possible results.
An example line for each dataset is shown in Figure 2 and an overview of the datasets and their
statistics are shown in Table 1. The codec size lists the number of characters in the alphabet. The
average line width is computed after preprocessing (see Sec. 4.1) which forces a line height of 48
pixels
5.2 Evaluation Measure To measure the performance of each OCR system we use the CER which is defined as the edit
distance (ed) of two sequences 𝑠1 and 𝑠2 normalized by the maximum length:
CER =ed(𝑠1, 𝑠2)
max(|𝑠1|, |𝑠2|)
This measure is 0 if all characters and 1 if no character match.
11 To be published 12 To be published
Table 1: Overview of the used datasets. The Codec size lists the number of possible characters in the alphabet. The GT lines, the number of total characters, and the average line width in pixels are both shown for the training and the evaluation data sets. The average width of the evaluation set of UW3α is unknown.
Training Evaluation ID Lang. Code GT Lines Chars Width GT Lines Chars Width
UW3 English 87 72,807 3,493,308 973 9,729 469,171 977 UW3α English 87 95,190 4.5 Mio 854 1,253 60 K − DTA19 German 159 192,974 8,711,800 912 50,968 2,304,242 905 1476 German 64 50 1,528 489 3,110 102,137 508 1478 German 69 50 2,054 731 2,695 118,437 755 1499 German 73 50 4,139 1117 1,578 126,445 1031
Figure 2: Example lines of the used UW3, DTA19, 1476, 1478, and 1499 datasets. Note that the last line is cropped.
6
5.3 Accuracy Table 2 lists all results for the different datasets, software and used network architectures. First,
it is notable that OCRopy yields the worst results both on the UW3 and the DTA19 dataset due to
the shallow network structure of only one hidden LSTM-layer.
This network is not capable of learning and generalizing the variations of fonts in the datasets.
Introduction of Convolution- and Pooling-Layers highly increases the accuracy of all software and
on both datasets. Hereby, the same network structure C, Mp(2x2), C, Mp(2x2), LSTM(200) yields
different results on the various frameworks: 0.155% on Calamari, 0.397% on Tesseract 4 and
0.502% on OCRopus3 for the UW3 dataset. This difference must be caused by a different training
setup or varying hyperparameters, e.g. using an Adam-Solver or a Momentum-Solver, differences
in the learning-rate, or usage of dropout. However, the evaluation of hyperparameters is out of
the scope of this paper. Note, that the overall setup is the same: All frameworks use the same da-
taset split for training, choosing the best trained model and evaluation.
The CER on UW3α published by Breuel (2017) that is evaluated on a different evaluation split are
in the same order of magnitude as the computed CER on the UW3 split used in this paper. Our
trained model on OCRopus3 is comparable to the Tesseract 4 model.
On both models the best performance is achieved by Calamari and further improved by the voting
mechanism. On the UW3 dataset it achieves impressive error rates of 0.11% without a language
model such as a dictionary. Calamari with voting yields 0.18% CER on German Fraktur. This task
is far more difficult because this dataset has a larger alphabet with very similar characters (e.g. a,
Figure 3: Three of the worst recognized lines during the evaluation of Calamari using voting on the UW3 dataset. The upper two lines suffer from impurities of segmentation or font. The text of the bottom line is cropped.
Table 2: CER using different software on the UW3 (20th cent. reports) and the DTA19 (19th cent. novels) dataset. The convolutions C each have a kernel size of 3 × 3 with zero padding and a filter count of 64 in the first and 128 in the second layer. Max-Pooling Mp is used either with a kernel size and stride of 2 × 2 or1 × 2. Note that when using 2 × 2 both the height and length of the line is halved while when used 1 × 2 only the height is halved. The last hidden layer is always a LSTM with 200 nodes. Calamari results are the average of five models that are then used to apply confidence voting. The CERs on UW3α were published by Breuel (2017).
Model Voted Software Dataset CER C, Mp(2x2), C, Mp(2x2), LSTM(200) No Calamari UW3 0.155% C, Mp(2x2), C, Mp(2x2), LSTM(200) Yes Calamari UW3 0.114%
LSTM(200) No OCRopy UW3 0.870% C, Mp(2x2), C, Mp(2x2), LSTM(200) No Tesseract 4 UW3 0.397% C, Mp(2x2), C, Mp(2x2), LSTM(200) No OCRopus3 UW3 0.502% C, Mp(1x2), C, Mp(1x2), LSTM(200) No OCRopus3 UW3 0.436% C, Mp(1x2), C, Mp(1x2), LSTM(100) No OCropus3 UW3α 0.25%
C, Mp(1x2), C, Mp(1x2), C, Mp(1x2), LSTM(200) No OCropus3 UW3α 0.25% C, Mp(2x2), C, Mp(2x2), LSTM(200) No Calamari DTA19 0.221% C, Mp(2x2), C, Mp(2x2), LSTM(200) Yes Calamari DTA19 0.184%
LSTM(200) No OCRopy DTA19 1.59% C, Mp(1x2), C, Mp(1x2), LSTM(200) No OCropus3 DTA19 0.907%

7
à, á, â, or ä) or different fonts especially for capital letters. Yet, most errors are due to corrupt lines
or GT inconsistencies (e.g. upper and lower quotation marks).
The evaluation on the UW3 dataset shows that 97% of all lines are recognized without any error,
however the worst 0.1% lines contribute to 20% of the remaining error. Those lines are either
wrongly segmented, rotated or highly degraded. Figure 3 shows three of the worst recognized
examples. The first impurely segmented line contains the upper part of the following line. There-
fore, the postprocessing step failed by bending the middle of the line and the line could not recog-
nized anymore.
The second example has a degraded font, that is also larger than the other lines. For example,
“waters” is misclassified as “wators” because the middle horizontal line in the “e” is missing. This
error could surely be fixed by a dictionary.
The last line is falsely cropped at the beginning, thus it is impossible to recognize “Energy Vol. 9”.
Any other character is correctly recognized.
Table 3 lists the 20 most common errors of Calamari with and without voting on the UW3 dataset.
The GT and PRED columns list the GT expectation and the automatic transcription. The third col-
umn counts the number of errors in the test data set (≈0.47 million characters in total) and the
last column the relative percentage to all errors made by the respective model. The last row adds
the relative percentage of all errors that are not among the 20 most common. Note, that even
though the missing '' occurred four times in the voted model the relative percentage is doubled,
because the double quote is interpreted as two single quotes.
Table 3: Most common errors of Calamari on the UW3 evaluation set. The left side shows the errors of a single voter, the right side after voting. The first two columns show the GT and the predicted character, the third column the number of occurrences, and the forth column the relative percentage compared to the total CER, respectively. The last row sums the relative error remaining mistakes. Note that '' is interpreted as two single quotes, which is why the relative error is doubled if those two characters are missing.
Single model Conf. Voted model GT PRED CNT PCT GT PRED CNT PCT
, . 35 5.12% , . 35 6.68% ␣ 35 5.12% ␣ 33 6.30%
␣ 25 3.66% ‘ 10 1.91%
. , 20 2.93% ␣ 9 1.72% ‘ 11 1.61% . , 9 1.72% , 10 1.46% y v 7 1.34% . 9 1.32% , 7 1.34% i l 8 1.17% i l 7 1.34% y v 7 1.02% . 6 1.15% e c 7 1.02% I l 6 1.15% n 6 0.88% e 4 0.76% i 6 0.88% '' 4 1.53% s 5 0.73% . 4 0.76% i I 4 0.73% r 3 0.57% r 4 0.59% n 3 0.57% . 4 0.59% - 3 0.57% - . 4 0.59% e c 3 0.57% e 4 0.59% e 3 0.57% e 4 0.59% i 3 0.57% l i 4 0.59% s 3 0.57%
Remaining 68.81% Remaining 68.32%

8
As expected the most common errors in both models are confusions of similar characters such as
“.” and “,”, “v” and “y”, or “I” and “l”, but also missing or inserted spaces. Most significantly, the
voting mechanism reduces the error of missing spaces (25 vs 9 occurrences), but also the number
of confusions of "e" and "c" dropped (7 to 3).
A common postprocessing step on OCR is to apply a dictionary on the recognized words. It is to
be expected that errors on letters are highly reduced but punctuation errors are not decreased.
Even in this case the voting mechanism is very useful since is reduces also whitespace and punc-
tuation errors. However, note that in the field of OCR on historical pages a dictionary might not be
present or even not desired if differences in spelling are of interest. In this field of research, the
voting mechanism of Calamari is very useful to reduce the CER.
5.4 Recognition Speed Another crucial measure besides its accuracy for a good OCR system is its speed. The runtimes of
all softwares for training and prediction excluding preprocessing of a single line is listed in Table
4. The processing time of a single line highly depends on the network architecture, the line width,
and the used hardware. All the time experiments were measured on a NVIDIA GTX 1080Ti GPU if
the software supports GPU usage and an Intel Xeon E5-2690 CPU. Preprocessing requires ca. 50
ms per line with a single process and drops to 6 ms when processing eight lines in parallel.
Obviously, both OCRopus 3 and Calamari are faster than Tesseract or OCRopy by a factor of almost
100 since they support batched GPU training and prediction. Incorporation of a GPU therefore
allows to recognize more than 100 lines per second.
The time for voting scales linearly with the number of models used as voters. Thus, the prediction
time per line in the voting experiments is approximately five times higher than the results shown
in Table 4. The time required for the aggregating the voting can be neglected.
5.5 Finetuning Using the models trained on the UW3 or the DTA19 dataset to directly transcribe the books 1476,
1488, and 1499 yields discardable results with up to 50% CER. Thus, it is mandatory to train in-
dividual models requiring manually labelled GT data. In the following, we use 50 lines of the three
historical printed datasets for training different models with and without using the pretrained
models of UW3 and DTA19 from section 5.3. This amount of lines is very low, but shows that even
a small amount of GT can drastically decrease the CER even though the trained model might not
have seen all possible characters of the alphabet yet (e.g. capital letters). The CERs are shown in
Table 5, whereby both the average of the five folds and their voting results are shown.
The 1476 and 1478 datasets behave similar. Both sets yield about 10% error when using an indi-
vidual model and a lower CER when voting five different models. Using the pretrained UW3 and
DTA19 models instead of training from scratch both the individual model CER and the voted CER
Table 4: Average time for training or prediction of a single line of the UW3 dataset. Note that the times measured for OCRopy and Tesseract 4 are on the CPU while Calamari and OCRopus3 run on the GPU. The prediction of OCRopy and Tesseract 4 is evaluated using a single process, using multiple multithreading highly reduces their computation time. The last row was published by Breuel (2017).
Model Software Training Prediction C, Mp(2x2), C, Mp(2x2), LSTM(200) Calamari 8 ms 3 ms
LSTM(200) OCRopy 850 ms 330 ms C, Mp(2x2), C, Mp(2x2), LSTM(200) Tesseract 4 1200 ms 550 ms C, Mp(2x2), C, Mp(2x2), LSTM(200) OCRopus3 10 ms 7 ms C, Mp(1x2), C, Mp(1x2), LSTM(100) OCRopus3 − 10 ms

9
drop significantly. Hereby, using DTA19 as pretrained model results in better models because the
font and the German alphabet of DTA19 is closer to the historical prints than the modern English
fonts of UW3.
Interestingly, pretraining on UW3 yields worse results on the 1499 dataset compared to the mod-
els without pretraining, but the voted results are similar. However, the model using DTA19 as
initial values clearly predicts better values than the default model.
Reul et al. (2018a) showed that using the same pretrained model to train different voters yields
worse voted results than using different pretraining models. Thus, it is to be expected that the
overall results get further improved if one mixes the pretrained models of UW3 and DTA19. Of
course, increasing the number of available lines of GT for training the respective book significantly
improves the accuracies of the models, however this results in a higher amount of human effort
to annotate GT.
6 Conclusion The main focus of this paper was the presentation of Calamari as new line based OCR engine to
replace OCRopy or Tesseract due to its low CER and fast computation times.
The conducted experiments clearly demonstrate the capabilities of Calamari on both contempo-
rary and historical OCR tasks. Not only does Calamari yield outstanding performances compared
to other OpenSource OCR software but also requires a minimum of time for training and predic-
tion due to the usage of Tensorflow as Deep Learning framework including cuDNN. As already
shown by Breuel (2017) and Wick et al. (2018), Deep Hybrid Convolutional-LSTM architectures
increase the accuracies both on contemporary and historical prints. Our results have revealed sig-
nificant differences of Tesseract 4, OCRopus 3 and Calamari due to variations of the network ar-
chitectures and different sets of hyperparameters. It is to be expected that an optimization of these
hyperparameters might further improve the accuracies of the OCR models. However, a very high
amount of the remaining errors on UW3 and DTA19 are GT inconsistencies or impure lines, which
are nearly impossible to predict correctly.
Voting and pretraining are two important mechanisms to increase the performance of newly
trained models, especially if only few data is available. Voting has shown improved results on all
conducted experiments, however on the cost of a higher prediction and training time, since sev-
eral different models are independently used. Pretraining is most useful if the original model is
similar to the new data and reduced both the CER and the training time. Especially, when training
Table 5: Results on the historical printed books using Calamari trained with 50 lines of GT and a batch size of 5. Both the results of using a pretrained model based on either the UW3 (20th cent. reports) or the DTA19 (19th cent. novels) datasets, or training from scratch are indicated by second column. The CER lists the average of the five trained folds and the last column the voted result as CER.
Dataset Pretraining CER Voted 1476 − 9.1% 7.1% 1476 UW3 7.4% 5.5% 1476 DTA19 5.5% 4.0% 1478 − 10.8% 9.3% 1478 UW3 8.8% 7.3% 1478 DTA19 8.6% 6.6% 1499 − 7.5% 6.4% 1499 UW3 8.4% 6.5% 1499 DTA19 6.6% 4.7%

10
new individual models as required for OCR on historical prints pretraining should be used to re-
ceive the best possible results if only a few manually annotated lines are available. In general, the
best OCR results are to be expected if the targeted fonts of a pretrained model are similar to the
material at hand. This of course correlates with the period of publication of the various books lies
in the same epoch.
Although Calamari supports many features such as voting, or pretraining, plans for extensions
exist. A first major work is data augmentation during training which is expected to significantly
drop the CER especially if only a few lines are present. The augmentations basically are different
types of noise, degradation, or generated background. Obviously, synthetic data based on existing
fonts can also be incorporated for data augmentation.
Tesseract's language to define network topologies (VGSL) has a very simple and compact syntax.
The current syntax of Calamari should also support this language to define networks.
Finally, since Calamari is designed very modular, it shall be extended to support other sequence-
to-sequence tasks, such as monophonic Optical Music Recognition (e.g. Gregorian chants) or
Speech-To-Text. All these tasks fundamentally share the tasks of processing two dimensional se-
quential data and output a sequence of classes. Only the data preprocessing e.g. of audio files and
postprocessing is different. Calamari is designed to easily exchange these steps but keeping a ge-
neric structure for training, evaluation, and application.
Literature BREUEL, T. M. (2008) The OCRopus open source OCR system. In: Document Recognition
and Retrieval XV. International Society for Optics and Photonics, Vol. 6815, p. 68150F.
BREUEL, T. M. (2017) High performance text recognition using a hybrid convolutional-lstm implementation. In: Document Analysis and Recognition (ICDAR), 2017 14th IAPR International Conference on. IEEE, Vol. 1, pp. 11-16.
BREUEL, T. M., et al. (2013) High-performance OCR for printed English and Fraktur using LSTM networks. In: Document Analysis and Recognition (ICDAR), 2013 12th International Conference on. IEEE, pp. 683-687.
GRAVES, A., et al. (2006) Connectionist temporal classification: labelling unsegmented sequence data with recurrent neural networks. In: Proceedings of the 23rd international conference on Machine learning. ACM, pp. 369-376.
KINGMA, D. P. and BA, J. (2014) Adam: A method for stochastic optimization. arXiv preprint arXiv:1412.6980.
PASCANU, R., et al. (2013) On the difficulty of training recurrent neural networks. In: International Conference on Machine Learning. pp. 1310-1318.
REUL, C., et al. (2017a) Case Study of a highly automated Layout Analysis and OCR of an incunabulum:'Der Heiligen Leben'(1488). In: Proceedings of the 2nd International Conference on Digital Access to Textual Cultural Heritage. ACM, pp. 155-160.
REUL, C., et al. (2018a) Improving OCR Accuracy on Early Printed Books by combining Pretraining, Voting, and Active Learning. JLCL: Special Issue on Automatic Text and Layout Recognition, 33 (1), 3-24.
REUL, C., et al. (2018b) Improving OCR Accuracy on Early Printed Books by utilizing Cross Fold Training and Voting. In: 2018 13th IAPR International Workshop on Document Analysis Systems (DAS). IEEE, pp. 423-428.
REUL, C., et al. (2017b) Transfer Learning for OCRopus Model Training on Early Printed Books. Journal for Library Culture, 5 (1), 38-51.

11
SPRINGMANN, U. and LÜDELING, A. (2017) OCR of historical printings with an application to building diachronic corpora: A case study using the RIDGES herbal corpus. Digital Humanities Quarterly, 11 (2).
SRIVASTAVA, N., et al. (2014) Dropout: a simple way to prevent neural networks from overfitting. The Journal of Machine Learning Research, 15 (1), 1929-1958.
WICK, C., et al. (2018) Comparison of OCR Accuracy on Early Printed Books using the Open Source Engines Calamari and OCRopus. JLCL: Special Issue on Automatic Text and Layout Recognition, 33 (1), 79-96.
WIEGAND, F., et al. (2018) Recherchieren, Arbeiten und Publizieren im Deutschen Textarchiv: ein Praxisbericht. Zeitschrift für germanistische Linguistik, 46 (1), 147-161.
Appendix A. Network Architecture Building Blocks The task of the DNN and its decoder is to process the image of a segmented text line and to output
simple text. This sequence to sequence task is trained by the CTC algorithm published by Graves
et al. (2006) that allows to predict shorter but arbitrary label sequences out of an input sequence
that is the line image regarded as sequence. Hereby, the network outputs a probability distribu-
tion for each possible character in the alphabet for each horizontal pixel position of the line. Thus,
an image with size ℎ × 𝑤 with a given alphabet size of |𝐿| will result in a matrix of shape 𝑃(𝑥, 𝑙) ∈
ℝ𝑤×|𝐿| with 𝑃(𝑥, 𝑙) being a probability distribution for all 𝑥. Since the network needs to see several
slices in width to be certain about a single character, most of the time it does not yet know what
to predict. Hence, the CTC-algorithm adds a blank label to the alphabet that is ignored by the de-
coder but allows the network to make empty or uncertain predictions with a high probability. In
fact, the used greedy decoder that chooses the character with the highest probability at each po-
sition 𝑥 mostly predicts blank labels, and only with one or two pixel widths the actual character is
recognized. Afterwards, the final decoding result is received by unifying neighbouring predictions
of the same characters and removing all blank labels. For example the sentence 𝐴𝐴 − −𝐵 − −𝐶𝐴 −
−𝐴 − of length 𝑤 is reduced to 𝐴𝐵𝐶𝐴𝐴.
The network is trained by the CTC-Loss-Function that basically computes the probability of the
GT label sequence given the probability output of the network. This probability is computed by
summing up all possible paths through the probability matrix P that yield the GT using an efficient
forward backward algorithm. Fortunately, this computation can be derived to receive the gradient
that is required for the learning algorithm.
The supported network architectures of Calamari are CNN-LSTM-Hybrids that act on a full line in
one step. CNNs are widely used in image processing because they are designed to detect meaning-
ful features (e.g. curves, circles, lines, or corners) that can be located anywhere in an image. These
features are processed afterwards by a (bidirectional) LSTM based recurrent network to compute
the probability matrix 𝑃. Max-Pooling is a common technique in CNNs to reduce the computation
effort and keep only the most important features. In general image processing settings pooling is
applied both in vertical and horizontal direction. This means that the processed lines get short-
ened. Thus, it is important that the final layer of the CNN in the full network has an image width,
that is long enough to produce the full label sequence. For example, if the GT has a length of 40
characters, a minimum of 80 predictions are required to allow for a blank prediction between any
pair of adjacent characters. Thus, if two 2 × 2 pooling layers are used in the CNN the width of the
image lines should be at least 𝑤 = 2 ⋅ 2 ⋅ 80px = 320px.

12
Appendix B. Training hyperparameters The default network consists of two pairs of convolution and pooling layers with a ReLU-Activa-
tion function, a following bidirectional LSTM layer, and an output layer which predicts probabili-
ties for the alphabet. Both convolution layers have a kernel size of 3 × 3 with zero padding of one
pixel. The first layer has 64 filters, the second layer 128 filters. The pooling layers implement Max-
Pooling with a kernel size and stride of 2 × 2. Each LSTM layer (forwards and backwards) has 200
hidden states that are concatenated to serve as input for the final output layer. During training we
apply dropout (Srivastava et al., 2014) with a rate of 0.5 to the concatenated LSTM output to pre-
vent overfitting. The loss is computed by the CTC-Algorithm given the output layer’s predictions
and the GT label sequence.
Calamari uses Adam (Kingma and Ba, 2014) as standard solver with a learning rate of 0.001. To
tackle the exploding gradient problem of the LSTMs we implement gradient clipping on the global
norm of all gradients as recommended by Pascanu et al. (2013).

Lyrics Recognition and Syllable Assignmentof Medieval Manuscripts
Christoph WickChair for AI and Applied Computer Science
University of WürzburgWürzburg, Germany
Frank PuppeChair for AI and Applied Computer Science
University of WürzburgWürzburg, Germany
Abstract—This paper examines the automatic transcriptionof lyrics of Medieval manuscripts by applying recent develop-ments in the area of Automatic Text Recognition (ATR). Weevaluate the performance of a CNN/LSTM-network on fivedifferent manuscripts dating from the 12th to 16th centuryand examine the impact of two different line segmentationapproaches: Using an accurate manual segmentation yieldedan Character Error Rate (CER) of up to 6.7% whereas 8.2%were reached on a fully automatic one. Furthermore, we proposean algorithm for the assignments of syllables to their respectiveneume by finding valid matches based on the positional outputof the ATR. Depending on the ATR accuracy, an F1-score ofover 99% was obtained.
Index Terms—lyrics recognition, Medieval manuscripts, syl-lable assignment.
I. IntroductionIn 2004, George stated that “lyric recognition is of-
ten considered secondary to Optical Music Recognition(OMR)”, however, it “cannot be isolated from the music,especially in the final representation stage” [8]. Unfortu-nately, Georges only “consider[ed] some solutions to theoutstanding difficulties in lyrics recognition”. Still today,ATR in OMR has been barely researched (see SectionII), but the overwhelming success of Deep Learning alsoin the area of printed or Handwritten Text Recognition(HTR) promises highly performant solutions. This paperfocuses on the automatic transcription of lyrics of Medievalmusic manuscripts written in the 13th to 16th century (seeFigure 1 for an exemplary page) which is an importantstep of the complete transcription of the notated music.The music in this epoch is written in neume notationswhich are predecessors of our currently used CommonWestern Music Notation (CWMN). A neume originallyarises from a single stroke that depicts a small piece ofmelodic motion. Figure 2 shows exemplarily the targettranscription of a staff into CWMN including the syllablesof the lyrics.
For the transcription of lyrics, we apply the open-sourceengine Calamari [17], originally developed for ATR of earlyprinted books. Calamari applies a line-based recogniserbased on a CNN/LSTM-network trained with the CTC-Loss-function. While the variance of handwritings is ingeneral large, the handwritings of the manuscripts in
Fig. 1. Example page of the Pa 14819 dataset written in so-calledsquare notation.
Fig. 2. The upper image shows the stave with its correspondinglyrics. The lower image visualises the full transcription of the music.This paper only focuses the lyrics recognition and the assignmentsof syllables and neumes of a line. Syllables of the same word areseparated by a hyphen “-”. Each syllable is centered below the firstnote of its respective neume.

our datasets are very clean and uniform which is whya comparison to early prints is sensible. A fundamentalproblem for any ATR is the accurate segmentation oflines. In music manuscripts, a mayor problem is textthat is written very narrowly to or even overlapping withstaves. This paper evaluates two different segmentationapproaches and their impact on the CER: First, anaccurate segmentation which cleanly cuts out the lyricslines which must be performed manually. Second, anapproximated algorithm which extracts the space betweentwo priorly detected staves. Furthermore, we propose asimple algorithm to match syllables to their respectiveneumes based on the positional information of the ATR.
The remainder of the paper is structured as follows:First, we present related work dealing with lyrics seg-mentation and ATR of lyrics. Next, we introduce thefive different datasets used for evaluation. Then, afterdescribing the ATR and syllable assignment algorithmsin more detail, we evaluate and discuss the results. Weconclude with a discussion of the overall results and bygiving an outlook of future work.
II. Related WorkThere are a few works, that solely target the extraction
of lyrics using traditional methods: Dalitz et al. [5] detectthe baseline of text using a vertical projection and thendefine all Connected Components (CCs) touching that lineas lyrics. Burgoyne et al. [2] first reconstruct staff linesand then remove staffs to obtain the lyrics as remainder.Dinh et al. [7] also use reconstructed staves to firstobtain possible region candidates for lyric regions andthen extract actual lines based on block division and run-lengths. Calvo-Zaragoza et al. [3] extract a text layer of animage as part of their CNN-based approach that classifieseach pixel into the classes background, symbol, staff line,and text.
Several further works apply ATR to the extracted text,or transform the task to a text alignment problem ifthe transcripts are already available: Hankinson et al. [9]include OCRropy [1] and a pretrained model in theirworkflow to handle the actual recognition of lyrics on theLiber Usualis [4]. Even with a post-ATR correction, theerroneous results were sobering and could thus only serveas a proof-of-concept. On Medieval manuscripts, a veryrecent work of de Reuse and Fujinaga [6] aims to alignexisting transcripts, which are often available, with theresult of an ATR system. To train OCRopy, two differentdatasets, one with 2,302 (Salzinnes, Gothic), and one with1,140 words (St. Gallen, Carolingian), which comprise lyriclines and their transcripts were manually annotated. Theachieved an CERs of 12,7% and 12,5% respectively. Thepredicted (erroneous) text is then aligned to the correcttranscript of the texts using the Needleman-Wunsch al-gorithm [11]. Text that has no match in the prediction isdropped because it likely belongs to paratexts. Afterwards,the matching is split into syllables and their bounding box
Fig. 3. Example lines for the five used datasets (see Table I,same order). Blue boxes mark abbreviations that are diplomaticallytranscribed in Salzinnes and St. Gallen. The green box shows anextreme case where a whole “word” is an abbreviation. The orangebox highlights editorial changes such as the replacement of “ſ” to“s”. The two images lines of Pa 15819 show the same line which wassegmented accurately or automatically, respectively, which is the lastline is truncated. Below each line, the GT is given.
size is computed based on the positional information ofthe ATR output. A syllable is correctly matched if thebounding box overlaps with the Ground Truth (GT) withan Intersection over Union (IU) of at least 50%. The finalaccuracy ranges from 78.6% to 92.9% depending on thematerial. This approach highly differs from the aim of ourproposed syllable assignment algorithm, because we arenot interested in the correct position of a syllable relatedto the manuscript, but instead in the correct semanticrelation to a neume by utilising the positional information.
III. DatasetsTo evaluate the lyrics recognition, we collected five
datasets dating from the 12th to the 16th century. TheSalzinnes1 (42 pages) and St. Gallen (five pages of 3882
and two pages of 3903) datasets are available at the Cantusmanuscript database [10]. The prepared GT was kindlyshared by de Reuse and Fujinaga [6]. The Assisi datasetaccessible at the Italian Digital Library4 which dates inthe 13th to 14th century comprises five pages of GT. TheNew York dataset comprises 5 pages from the so-called“Gänsebuch” which is available at the Pierpont MorganLibrary5 and was created in the early 16th century. Thelargest dataset consists of 90 pages of the manuscriptPa 15819 available at the Bibliothèque nationale deFrance6 and originates in the 12th-13th century.
Table I provides an overview of the five datasets, exam-ple text lines are shown in Figure 3. The three datasetsAssisi, New York, and Pa 15819 are fully annotated, thatis, they comprise information about staff lines, layout-segmentation, music symbols, lyrics, and connections of
1https://cantus.simssa.ca/manuscript/1332www.e-codices.unifr.ch/en/csg/03883www.e-codices.unifr.ch/en/csg/03904http://www.internetculturale.it/5http://geesebook.ab-c.nl/6https://gallica.bnf.fr/ark:/12148/btv1b84229841/
TABLE IOverview and properties of the five available datasets. Example lines are shown in Figure 3.
Book Cent. Pages Lines Line Segmentation Transcription Syllables Staff lines & Symbols
Salzinnes 16th 42 706 Accurate Diplomatic No NoSt. Gallen 14th 8 173 Accurate Diplomatic No NoAssisi 13th to 14th 5 50 Rough Editorial Yes YesNew York 16th 5 45 Rough Editorial Yes YesPa 15819 12th to 13th 90 964 Accurate and Rough Editorial Yes Yes
syllables and neumes. Pa 15619 as largest dataset willbe used to evaluate the proposed syllable assignmentalgorithm.
The extraction of text lines of the manuscripts Assisi,New York, and Pa 15819 relies on two different methods:The accurate segmentation includes a manual postprocess-ing to cleanly cut off all non text such as music symbols.The rough segmentation is computed fully automatically. The area between two detected and corrected staff linesgrouped in to staves (see [16]) define the bounds of alyrics line which is then extracted. The height of last lineis computed based on the average of all other ones. Thissegmentation is faster, but sometimes produces croppedlines containing noise. In both cases, the text lines aredewarped based on the surrounding staff lines. The datasetPa 14815 is available with an accurate and a coarsesegmentation (see Figure 3) which is why this book willbe used to measure the impact of the segmentation on theperformance (see Section V-C).
Furthermore, the transcription rules for the GT-production varies among the datasets. Salzinnes andSt. Gallen are transcribed diplomatically, that is, forexample, abbreviations are not resolved, such as “dns”and “dominus” or “Xpo” and “Christo”. In contrast,abbreviations are resolved in the other three datasetswhich we refer to as editorial transcription. An editorialtranscription is expected to have a negative impact on theperformance because, instead of one character for a glyph,two or even more characters must be predicted. However,resolving abbreviations is required to obtain all syllablesfor the subsequent step of the syllable assignment.
IV. MethodsFor the HTR of lyrics, we rely on Calamari7 [17] which
we, as already stated, expect to extend flawlessly toHTR on our kind of material since the handwritings arevery clean and uniform. Calamari provides a configurableCNN/LSTM-network architecture trained with the CTC-Loss-Function. An internal training mechanism allows toautomatically train several (the default is five) models inparallel whose results are then combined by a confidencevoter (see [12]). We used the default parameters, butapplied data augmentation with a factor of 10. To speedup training and to obtain robust voters, we selected five
7https://github.com/Calamari-OCR/calamari
Fig. 4. Steps of the syllable assignment algorithm. The first lineshows the staff containing the text line (green box) which serves asinput for an HTR whose result is rendered below the known lyrics.The next line highlights the differences of prediction and its true text(missing characters in green, additional ones in red, substitutions inblue), and the alignment of syllables and predicted characters basedon the changes. The last line puts the syllables containing the truetext to the positions based on the locations of the aligned predictedcharacters. The orange arrows indicate the centre and the closestneume. Conflicts are resolved afterwards (dashed green arrow).
different pretrained models8 as initial weights for eachof five models: Two trained on historical Antiqua, two onhistorical Fraktur, and one on 19th century Fraktur. Note,that these models were trained on printed books which iswhy their default performances on our material are poor.Experiments showed a CER of 60% and higher.
The steps of the proposed syllable assignment algorithmare shown in Figure 4. The input is the corrected editorialtext including hyphenation9 (step 2) and the ATR outputincluding positional information (step 3). An alignment(step 4) of prediction and GT yields proposals for eachsyllable by using the predicted location of the middle letterof a syllable. Syllables without a match are interpolated.Each syllable is then assigned to the closest neume. Con-flicts are resolved by attempting shifts of the connectionsto the next or previous neume (step 5).
8https://github.com/Calamari-OCR/calamari_models9Hyphenation can be performed automatically using a Latin
spelling and hyphenation dictionary

TABLE IICER of book-specific (same) and cross-book (cross) models. Wecompare our proposed method using Calamari to the results of
de Reuse and Fujinaga [6] who rely on OCRopus.
Book Ntrain proposed de ReuseSame Cross Same
Salzinnes 564 9.6% 27.8% 12.7%St. Gallen 138 9.0% 49.0% 12.5%Assisi 40 29.7% 34.9% −New York 36 18.3% 24.9% −Pa 15819 771 6.7% 27.0% −
V. Evaluation of the Text RecognitionIn this section, we present our evaluation results of the
lyrics recognition and the syllable assignment. 20% of theavailable data were extracted randomly for evaluation, theremaining instances serve as training material.
A. HTR Accuracy on Different DatasetsIn our first experiments, we evaluated the performance
of Calamari on the extracted text lines of the datasets(see Table II) whereby all available training lines andthe exact line segmentation were used, where possible.First of all, we trained and evaluated each model on thesame book. As expected, the number of training instanceshave a high impact on the performance which we willshow in more detail in Section V-C: The two bookswith fewer than 50 lines in total performed worst witha CER of up to 30%. The performance on Assisi wassignificantly worse even though the number of traininglines was higher compared to New York most likely due tothe more denser and uncleaner writing. Compared to theresults of de Reuse and Fujinaga [6], Calamari performedstrictly better on both the Salzinnes and the St. Gallendatasets. This was expected because the improvementsof Calamari over OCRopy had already been shown in[15]. Note, however, that the dataset splitting of de Reuseand Fujinaga is unknown which is why the values areonly partially comparable. As expected, Pa 15819 whichcomprises the highest number of Ntrain yielded the bestresults with a CER of 6.7%.
Since it is very tedious to create book-specific GTit is sensible to evaluate the CER of a model that istrained on all training data, but the target book. Theresults in Table II (cross) clearly show that at the currentearly stage of lyrics recognition on Medieval manuscriptswith only very few lines of GT, it is impossible to trainmixed-models that apply for many different books andhandwritings, in particular since the amount of GT istoo small, yet. Aggravating circumstances were that thelines were cropped using different methods having a strongimpact on the performance.
B. Error AnalysisTable III lists the ten most common errors on the
Pa 14819 dataset when training on all available lines.
TABLE IIIThe ten most common errors on the Pa 14819 dataset. Both the
count (Cnt.) of occurrences and their relative (Rel.) contribution tothe total CER are shown.
True Pred. Cnt. Rel.i 28 5.69%␣ 24 4.88%s ſ 23 4.67%u 17 3.46%
␣ 9 1.83%c t 7 1.42%
i 7 1.42%m 6 1.22%
u 5 1.02%n m 5 1.02%
TABLE IVImpact of a precise or an automatic line segmentation on the CERusing the dataset Pa 15819 and a varying number of training lines
Ntrain.
RegionsNtrain Exact Simple
50 13.5% 14.0%100 10.2% 12.4%200 8.5% 10.3%400 7.1% 8.9%771 6.7% 8.2%
Missing letters, especially “i”, white spaces “␣”, but also“u” or “n” amounted for the the largest part of the mostcommon errors (above 15% in total). A high numberof errors related to spaces are in general expected inlyrics recognition because words can be written very closeand syllables might be written with a space between.Confusions of “s” and the Latin long “s” (“ſ”) indicateinconsistencies or editorial adjustments of the GT. Nat-urally, another source of errors are confusions of similarlooking characters such as “c” and “t” or “n” and “m”.Incorporation of a dictionary should reduce the numberof errors not only due to the correction of insertions,deletions, or confusions of characters, but also becausemissing or additional spaces can be corrected.
C. Impact of the Line SegmentationIn this section, we compare the automatic to the manual
line segmentation. Table IV lists the results obtainedwhen training on a different number of instances Ntrain.As expected, the precisely cut out lines yielded a lowerCER than using the simple automatically extracted lyriclines. To achieve a comparable performance, roughly abouttwice the number of Ntrain were required. The CER onsimple text lines was strictly higher because sometimesletters at the beginning or end of a line are missing andcapital letters are often cropped. In practice, the manualsegmentation of a text line can be extremely cumbersomeespecially if they touch the music region or a swash capital.Therefore, instead, it might be faster to correct the slightlyworse ATR output by saving the complete segmentation

TABLE VF1-score of the syllable assignment using the dataset Pa 15819.Positional information was obtained by models with a different
CER on the evaluation data. The value obtained with Ntrain = 0only uses the pretrained models without further training.
Ntrain Baseline 0 50 100 200 AllCER − 41.5% 13.5% 10.2% 8.5% 6.7%F1 87.5% 90.7% 98.8% 99.0% 99.2% 99.2%
time. Furthermore, if a large collection of ecclesial textsare already present, the performance might be alreadysufficient to search for the corresponding lyrics which thencan be directly adpoted.
VI. Evaluation of the Syllable AssignmentIn this section, we evaluate the proposed syllable assign-
ment algorithm which we compare to a baseline algorithmthat assigns a syllable one after the other to the nextneume in a line. Thus, if the first connection of syllablefails, all subsequent ones are also wrong. Note, that thissimple baseline is valid in many manuscripts that comprisemusic with exactly one neume per syllable. To measure theperformance, we counted the number of correct, missing,or additional connections yielding a precision, recall, andfinally an F1-score. For evaluation, we chose the Pa 15819dataset because it is the largest. Table V lists the resultsof the baseline, using pretrained models (Ntrain = 0) only,and taking the trained ATR models with an increasingperformance. Even without book-specific training, thepositional information of the pretrained models with arather high CER of 41.5% is sufficient to outperform therather high baseline model. The results can be significantlyimproved if the models perform better. A model with aCER of about 10% was already sufficient to obtain an F1-score of 99.0%. An even better accuracy (CER ≤ 8.5%)led to a stagnation of the performance. The recall wasslightly higher than the precision (e.g., 99.2% vs 98.4% for50 lines), because the algorithm enforces that all availablesyllables must be assigned. However, for example, thereare some syllables in the GT that are not linked with aneume at all, such as the word “amen”. The algorithmdoes currently not allow for these special cases which iswhy false positives are generated.
Figure 5 shows the histogram of the offset of allwrongly placed syllables to their correct neume withina line. Note that errors related to syllables that werenot assigned in the GT (e.g., the word “amen”) werenot considered here. The errors of the baseline model arebiased to negative values because by construction syllablescan only be predicted too early. The pretrained models(Ntrain = 0) nicely show a Gaussian scatter with thecentre at zero, which is the expected error distributionof the algorithm. The model with Ntrain = 50 mostly haserrors with a distance of ±1. If using the best model,errors occurred only due to syllables that are shifted to
Fig. 5. Histogram of the offset of syllables to their correct neume.Correctly connected syllables with a distance of zero are omitted.The bar for Ntrain = All and Ntrain = 50 is drawn above the one forNtrain = 0.
the right with a maximum distance of +1. This shows, thatthe network which was trained segmentation-free reliablylearned positional information about the characters alsoif only a few lines of GT were available.
VII. ConclusionDue to the evaluation of the syllable assignment algo-
rithm, it seems sensible to apply the simpler automaticlayout analysis since there is only a minor impact onthe ATR performance, but almost none on the syllableassignment. Thus, it is beneficial to save time duringthe line segmentation. Furthermore, many Medieval musicscores set the same piece of lyrics to music. Therefore, itis sensible to build up a database comprising all ecclesialtexts. A text matching algorithm can then search for thelyrics of the material at hand. Using the automatic layoutshould also be sufficient in this case.
If the text is unknown, the ATR accuracy can beimproved by incorporating a dictionary and possibly alanguage model such as n-grams which can be constructedbased on the database. A possible problem of the line-based approach will occur if one word is hyphenatedinto two lines. To solve this, the decoding applying aCTC-Beam-Search-Decoder (see e.g. [13]) could act onthe continuous prediction of a whole paragraph, wherebythe positional information is then used to determine theactual line of a syllable.
Nevertheless, an automatic HTR of Medieval lyrics isexpected to require manual corrections in the near future.This correction and thus the production of GT mustbe very comfortable to quickly obtain highly performantmodels which can be iteratively improved. Currently theoverlay-editor of our framework OMMR4all [14] which tar-gets the full pipeline of the transcription of Medieval musicprovides a fundamental component for text correction.We plan to improve this by creating a view specificallydesigned for the GT-production which highlights letters

with a low confidence and provides proposals for correc-tions.
References[1] Thomas Breuel. The OCRopus open source OCR
system. In Document Recognition and Retrieval XV,volume 6815, page 68150F. International Society forOptics and Photonics, 2008.
[2] John Ashley Burgoyne, Yue Ouyang, Tristan Himmel-man, Johanna Devaney, Laurent Pugin, and IchiroFujinaga. Lyric Extraction and Recognition onDigital Images of Early Music Sources. In 10thInternational Society for Music Information RetrievalConference, pages 723–727, Kobe, Japan, 2009.
[3] Jorge Calvo-Zaragoza, Francisco J. Castellanos,Gabriel Vigliensoni, and Ichiro Fujinaga. Deep NeuralNetworks for Document Processing of Music ScoreImages. Applied Sciences, 8(5), 2018.
[4] Catholic Church. The Liber Usualis with introductionand rubrics in English. Desclée, Tournai, Belgium,1963.
[5] Christoph Dalitz, Georgios K. Michalakis, and Chris-tine Pranzas. Optical recognition of psaltic Byzantinechant notation. International Journal of DocumentAnalysis and Recognition, 11(3):143–158, 2008.
[6] Timothy de Reuse and Ichiro Fujinaga. Robust Tran-script Alignment on Medieval Chant Manuscripts.In 2nd International Workshop on Reading MusicSystems, pages 21–26, Delft, The Netherlands, 2019.
[7] Cong Minh Dinh, Hyung-Jeong Yang, Guee-SangLee, and Soo-Hyung Kim. Fast lyric area extractionfrom images of printed Korean music scores. IEICETransactions on Information and Systems, E99D(6):1576–1584, 2016.
[8] Susan E. George. Lyric Recognition and ChristianMusic. In Visual Perception of Music Notation: On-Line and Off Line Recognition, pages 198–226. IRMPress, Hershey, PA, 2004.
[9] Andrew Hankinson, John Ashley Burgoyne, GabrielVigliensoni, Alastair Porter, Jessica Thompson,Wendy Liu, Remi Chiu, and Ichiro Fujinaga. Dig-ital Document Image Retrieval Using Optical MusicRecognition. In 13th International Society for MusicInformation Retrieval Conference, pages 577–582,2012.
[10] Debra Lacoste, J Kolácek, and KE Helsen. Cantus:A database for latin ecclesiastical chant, 2011. URLhttp://cantus.uwaterloo.ca/.
[11] Saul B. Needleman and Christian D. Wunsch. A gen-eral method applicable to the search for similaritiesin the amino acid sequence of two proteins. Journalof molecular biology, 48(3):443–453, 1970.
[12] Christian Reul, Uwe Springmann, Christoph Wick,and Frank Puppe. Improving OCR Accuracy on EarlyPrinted Books by utilizing Cross Fold Training andVoting. In 2018 13th IAPR International Workshop
on Document Analysis Systems (DAS), pages 423–428. IEEE, 2018.
[13] H. Scheidl, S. Fiel, and R. Sablatnig. Word BeamSearch: A Connectionist Temporal Classification De-coding Algorithm. In 16th International Conferenceon Frontiers in Handwriting Recognition, pages 253–258. IEEE, 2018.
[14] Christoph Wick and Frank Puppe. OMMR4all —a Semiautomatic Online Editor for Medieval MusicNotations. In Jorge Calvo-Zaragoza and Alexan-der Pacha, editors, 2nd International Workshop onReading Music Systems, pages 31–34, Delft, TheNetherlands, 2019. URL https://sites.google.com/view/worms2019/proceedings.
[15] Christoph Wick, Christian Reul, and Frank Puppe.Comparison of OCR Accuracy on Early PrintedBooks using the Open Source Engines Calamari andOCRopus. JLCL: Special Issue on Automatic Textand Layout Recognition, 33(1):79–96, 2018.
[16] Christoph Wick, Alexander Hartelt, and FrankPuppe. Staff, Symbol and Melody Detection ofMedieval Manuscripts Written in Square NotationUsing Deep Fully Convolutional Networks. AppliedSciences, 9(13):2646, 2019.
[17] Christoph Wick, Christian Reul, and Frank Puppe.Calamari - A High-Performance Tensorflow-basedDeep Learning Package for Optical Character Recog-nition. Digital Humanities Quarterly (forthcoming),2019.

OMMR4all – a Semiautomatic Online Editorfor Medieval Music Notations
Christoph WickChair for AI and Applied Computer Science
University of WurzburgWurzburg, Germany
Frank PuppeChair for AI and Applied Computer Science
University of WurzburgWurzburg, Germany
Abstract—This paper presents OMMR4all, an online opticalmusic recognition (OMR) and correction framework for Medievalneume notations. On the one hand it provides OMR algorithmsto automatically capture staff lines, layout, and music symbolswhich use state-of-the-art Deep Learning models. On the otherhand it provides a web application including an overlay editorto correct errors at any stage during the automatic processing.Since the notation styles between books can show a high variance,the default models provided by OMMR4all might not be well-suited for the actual material at hand. Therefore, new modelscan be trained based on manually corrected material to improvethe automatic recognition of further pages. Experiments show,that only a few pages (about 5-10) are required to obtain arobust model, however an iterative training approach steadilyimproves the models by adding newly annotated scores. The goalof OMMR4all is to provide an easy to use tool targeting musicscientists that aim to build up large-scale collections of encodedhistorical material by minimising the human effort.
Index Terms—optical music recognition, web app, medievalmanuscripts, neume notation, user interface
I. INTRODUCTION
A still present desideratum for music research especiallyregarding historical manuscripts is a library storing machine-readable information, for example MEI, of the vast amount ofavailable material. This digital form of music can then be usedfor large-scale music research such as similarity detection ofmelodies or comparisons of different version of the same pieceof music. However, the encoding of the historical manuscriptsis quite cumbersome because a lot of human effort is required.The current rise of artificial intelligence is a new hope tosolve this task automatically, however, the current algorithmsfor optical music recognition (OMR) are not perfect whichis why human knowledge and work is yet required for thetranscription process. Therefore, the main goal of OMR is tominimise to human effort.
This paper presents our novel software Optical MedievalMusic Recognition For All1 (OMMR4all) which tackles thetranscription of Medieval manuscripts that are written in dif-ferent neume notations such as the square notation. OMMR4allimplements a semi-automatic workflow starting from a singlescanned page and outputs the encoded music for exampleas MEI. To process the music, we embed existing tools for
1https://ommr4all.informatik.uni-wuerzburg.de
Fig. 1. Rendered example transcription which is encoded in MEI. A neumeconsisting of looped note components (NC) is visualised by a slur (a), eachnew neume starts with a large space (b), gapped NCs are notated with a smallspace (c).
OMR combined with an overlay editor to correct errors.Neumes are represented according to the current MEI standard(4.0.1) which stores syllables with their corresponding neumesthat are denoted as single note components (NCs). Each NCstores its connection, gapped or looped, to its predecessor. Anexample transcript of a single line can be seen in Figure 1which is manually rendered in a modern style. The aim of oursoftware is to capture all information about the melody andits corresponding lyrics. Additionally, we store all positionalinformation of each single symbol which can be used for alookup in the original manuscript. This also allows to trainnew models for notation styles that are not known yet. Therequired ground truth can be created by utilising the overlayeditor.
II. RELATED WORK
In [5] Vigliensoni et al. present an OMR workflow em-bedded in the SIMSSA project [2] which targets Medievaland Renaissance music. The main stages are the analysis ofthe document, the reconstruction and encoding of its music,and finally the generation and correction of the score. Theirdocument analysis relies on pixel-wise labelling which isautomatically generated by the convolutional neuronal networkpresented in [1] and can manually be corrected by Pixel.js[4]. After a succeeding symbol classification based on theresulting layers, the music can be reconstructed by findingthe pitch of neumes and the music is saved as MEI. Finally, a
Proceedings of the 2nd International Workshop on Reading Music Systems, Delft, 2019
31

superimposition of the original image and the OMR are shownin the overlay editor Neon2 [3] which allows for a manualpost-correction. Their workflow presents a promising approachof a semi-supervised OMR task on historical manuscripts.It shares many similarities with OMMR4all but also has itslimitations. OMMR4all does not rely on a pixel-wise labellingof the original document which can be quite cumbersomein many cases if it is manually corrected. Also it cannot beguaranteed that a perfect labelling yields substantially betterresults in proceeding steps. In contrast, the output of ourOMR approaches are polygons (e.g. staff lines) or individualsymbols which can be easily corrected in the provided overlayeditor. The idea of Neon.js is an overlay editor that allowshumans to easily inspect differences of the OMR results andthe underlied original image. Our editor picks up this ideabut solves a fundamental shortcoming of the current version2:Neon.js expects straight staff lines with a fixed line distancefor each staff, which is rarely the case in actual manuscripts.The major problem is that in various staves the overlayed stafflines mismatch partially more than one line which introduceshigh problems for an easy readability and comparison. Thestaff line detection algorithm of OMMR4all allows to drawexact staves whereby the staff lines and all of its symbols canbe drawn at its actual positions in the manuscript.
III. OMMR4ALL
A. Workflow
The proposed workflow of OMMR4all is shown in Figure2. The expected input is a high-resolution scan of a singlepage and the prepared lyrics. The lyrics must be written in atext file (e.g. in Word or a simple text editor) and use a “-” toseparate syllables and “—” to denote staff breaks. Line breaks“\n” or multiple white-spaces can be used at will to enable abetter readability of the lyrics in plain text.
The image processing starts with an image deskewing andbinarisation, afterwards staff lines and staves are detected. Thestaves help to define and detect the layout in the next step.Then, the symbol detection to identify neumes or clefs isapplied. Finally, the syllables of the prepared text are assignedto neumes and the encoding can be exported as MEI.
At each step of the workflow a human can interfere toguarantee a correct input for the subsequent steps. But also,after an application of the complete workflow all elements canbe changed. This is enabled by the integrated overlay editorwhich will be briefly introduced in the next sections among aspecification of the individual steps of the workflow.
1) Preprocessing: The expected input of the OMMR4all-workflow is a single sheet of music, a double page mustbe manually split. The preprocessing step applies OCRopus’3
binarisation and deskewing algorithms to obtain an imagewith on average horizontally oriented staff lines and creates agray-scale and binarised version of the deskewed page. Theseimages serve as input for the automatic algorithms.
2https://ddmal.music.mcgill.ca/Neon/ (accessed August 2019)3https://github.com/tmbdev/ocropy
2) Staff line detection: The next step is to identify staff linesand their corresponding staves. Here, we apply our algorithmpresented in [6] which uses a Fully Convolutional Network(FCN) to identify pixels belonging to a staff line The pixelsare then combined to a polyline which represents a single staffline. Based on their relative distances the detected staff linesare combined into staves and pruned by taking only stavesthat match the allowed number of staff lines per staff in thematerial at hand (e.g. four). In [6], we show that the algorithmdetects approximately 99% of all staves on manuscripts writtenin square notation and is robust to new layouts.
3) Layout analysis: A further step is the layout analysisaiming to segment the input image into regions representingdifferent types of text such as lyrics, or denoting the actualboundaries of a staff including all adjacent notes or clefs. Forthe current workflow, that targets solely the transcription ofthe music and its lyrics, an accurate layout analysis is optionalsince no algorithm currently expects exact boundaries of therespective elements. Instead, OMMR4all assumes boundingboxes each containing all staff lines of each respective singlestaff. The area between two staves defines the rough locationfor bounding boxes for lyrics. Despite the fact that an accuratelayout analysis is optional, OMMR4all offers an automaticalgorithm that can detect text (for example lyrics or page-numbers), music, or drop capital regions based on the relativecoordinates of connected components to the detected staves.Depending on the material at hand this simple algorithm yieldsreliable results.
4) Symbol detection: The symbol detection which is basedon another FCN (see [6]) acts on a single staff, and locates andidentifies individual NCs and their connections, accidentals,or clefs. The FCN produces a pixel-wise label map foreach symbol whose connected components represent singlesymbols. Our symbol detection presented in [6] shows thatthe transcription of a line yields an accuracy of about 87%on manuscripts written in square notation with most commonerrors being missing or additional notes. The current algorithmdoes not detect rare symbols (compared to notes or clefs) suchas accidentals or liquescents which hence must be manuallyinserted.
5) Syllable assignment: The last step is to assign theprepared text to individual neumes. The automatic syllableassignment algorithm matches neumes and syllables one afterthe other in reading direction. Therefore, the algorithm is onlysuccessful if there is one neume per syllable. A completelynew algorithm which includes Calamari [7] for an OpticalCharacter Recognition (OCR) of the actual depicted text iscurrently in progress (see section V).
6) Iterative training approach: OMMR4all allows to trainindividual models used in the staff line and symbol detectionto tackle a specific still unknown notation style of a book.Training requires a few pages of ground truth which has to becreated based on similar models.
In general, the staff line models are expected to generalisewell among different notation styles since lines are verysimilar across many notations. The symbol notations show a
Proceedings of the 2nd International Workshop on Reading Music Systems, Delft, 2019
32

Fig. 2. The proposed workflow of OMMR4all. Documents serving as input or output are shown in gray. The steps of our workflow are shown in blue.Human (inter)actions are drawn in green. The orange elements show the storage for the annotated pages or the trained models. Dashed arrows indicate thatthese algorithm do currently not rely on a model from the repository, however they can be extended to use them in the future.
higher variance, for instance when comparing Gothic or squarenotations.
B. Software Architecture
OMMR4all4 is an open source software which implementsa client-server-model based on a REST API including userauthentication. This allows for a low barrier for musicologiststo our software in their research, because no installation isrequired, and the web app is fully platform independent.Furthermore, the heavy computational loads for training ofnew models are outsourced to a server that can host expensiveGPUs for a reduction of processing time. Thus, a simple laptopor desktop PC is sufficient as an access-point to OMMR4all.Finally, the data is stored centralised which allows a word-wide access from any internet-ready working place.
1) Server: The backend server of OMMR4all is imple-mented in Python 3 running Django5. By default the serverprovides algorithms for the staff line, layout, symbol and textanalysis as shown in section III-A. To extend existing or toadd new algorithms the server allows an easy extension toother algorithms for these specific tasks. New algorithms canbe written in Python using an existing algorithm API, but alsoan integration of tools or frameworks implemented in differentlanguages is feasible.
2) Client: The client application is implemented in Type-Script using Angular6. The web-app is split into several viewsallowing to work and process a full book or a single page.The editor of a single page is an overlay editor providingtools to manually correct or create annotations. This tool ispresented separately in the next section. The book view allowsto run all algorithms in a fully automatic way for a completebook which is applicable if appropriate models are alreadyavailable. Naturally, the client provides interfaces to create andupload new books, to download or export the annotations, orto manage user permissions if several users are working withthe same material.
4https://github.com/ommr4all5https://www.djangoproject.com/6https://angular.io/
TABLE IEVALUATION OF THE TRANSCRIPTION TIMES IN MINUTES. WE LIST THE
NUMBER OF SYMBOLS, THE REQUIRED TIMES FOR CORRECTING THESTAFF LINES (SL.), SYMBOLS, SYLLABES, AND THE TOTAL TIME WHEN
USING OMMR4all AND COMPUTE THE SPEED-UP (SU) COMPARED TOMONODI+. ALL VALUES ARE AVERAGES AND RELATIVE TO A PAGE.
Notation #Symb. OMMR4all Monodi SUSL. Symb. Syll. Tot.
Gothic 158 0.3 2.3 1.8 4.5 5.6 1.3Square 267 0.6 3.3 2.9 6.9 8.5 1.2
3) Overlay-Editor: Since the automatic tools provided byOMMR4all are not expected to be perfect, their results mustbe manually corrected in an elegant and user friendly way.The integrated overlay editor tackles this task by providinga view that superimposes the annotations on the page image.The editor uses the exact positions of the staff lines or symbolsto enable an easy-to-read way to detect and correct mistakes.Furthermore, the editor allows to move and edit the pastedsyllables to the correct neumes.
The editor allows to create individual comments regardingfor example disambiguities during the annotation process.These comments can then be integrated in a critical apparatus.
OMMR4all is designed to be easy to use without a steeplearning curve because the ergonomic editor mainly relieson mouse interactions for selection, moving, dragging, orinserting musical symbols. More experienced users can useshort cuts to speed-up the editing process.
IV. EVALUATION
To evaluate the transcription time, we compare OMMR4allto Monodi+7 which is a sophisticated tool specifically designedto input plain chant via the keyboard. We chose five pageswritten in Gothic or square notation (a page is edited in Figure3), respectively, and measured and averaged the times to obtainthe transcript consisting of syllables and neumes. The modelsused for square notation were trained on 49 pages of ground
7Submitted to this workshop: Eipert et al., Editor Support for DigitalEditions of Medieval Monophonic Music
Proceedings of the 2nd International Workshop on Reading Music Systems, Delft, 2019
33

Fig. 3. Screen-shot of the overlay editor. In this example an simple layout is used: Staves (green), lyrics (red). Individual note components are renderedas yellow boxes, graphical connections of neumes are drawn as a solid line connecting two notes, while the dashed vertical lines indicate the start of a newneume. Clefs are drawn in cyan. The syllables of the lyrics are aligned below the corresponding neume within the respective text region. The various buttonsof the tool bar define tools to correct the annotations or to launch the automated tools. Not shown are the reading order and comments.
truth chosen from a different book. To train the Gothic model,we selected another four pages of the same book. Both toolsallowed to paste the prepared lyrics, therefore, only the NCsmust be corrected or written. Table I shows that we achieved aspeed-up of 1.3 and 1.2. The transcription time using Monodi+in these experiments is already at its limit because everyNC must be manually created. However, since the achievedaccuracies of the symbol detection are still less than 90%,it can be expected that if more ground truth of the book athand is available, working with OMMR4all will further reducethe transcription time. Furthermore, an automatic algorithm tominimise the effort to assign syllables (41% time, syll. / Tot.in Table I) is missing. Naturally, if the models can achievehuman accuracy, books can be processed fully automatically.A principal difference of OMMR4all is, that its annotationsyield an inherent explanation component for the origin of eachsymbol, which is very useful for example in a critical apparatusfor borderline cases that need to be commented.
V. FUTURE WORK
Despite the many features of the OMMR4all frameworkthere are many possible improvements or extensions. Somepending tasks will be presented in this section.
First, several tools and algorithms are planned to tackle theacquisition and encoding of text. The main problem is that cur-rently no OCR engine can reliably deal with handwritten textof the targeted material without specific training. Therefore, ina first stage, we still rely on prepared text but we try to improvethe automatic mapping of syllables to neumes by inclusion ofthe erroneous results of Calamari. Preliminary results showedthat even if the OCR result of a lyrics line contains manymismatches of characters, the predicted character positions are
mainly correct. Therefore, by aligning the actual syllables ofthe pasted text line with the OCR result, a rough estimationof the actual syllable position is feasible.
Other plans tackle further monophonic notation styles suchas the later mensural notations or even older neume notationswithout staff lines. Hereby, the overlay editor requires onlysmaller cosmetic changes to store and display the directionalnotation, while new algorithms must be integrated or devel-oped to capture the actual content automatically.
REFERENCES
[1] Jorge Calvo-Zaragoza, Francisco Castellanos, Gabriel Vigliensoni, andIchiro Fujinaga. Deep neural networks for document processing of musicscore images. Applied Sciences, 8(5):654, 2018.
[2] Ichiro Fujinaga, Andrew Hankinson, and Julie E. Cumming. Introductionto SIMSSA (Single Interface for Music Score Searching and Analysis).In Proceedings of the 1st International Workshop on Digital Libraries forMusicology, DLfM ’14, pages 1–3, New York, NY, USA, 2014. ACM.
[3] Juliette Regimbal, Zoe McLennan, Gabriel Vigliensoni, Andrew Tran,and Ichiro Fujinaga. Neon2: A Verovio-based square-notation editor. InMusic Encoding Conference, 2019.
[4] Zeyad Saleh, Ke Zhang, Jorge Calvo-Zaragoza, Gabriel Vigliensoni,and Ichiro Fujinaga. Pixel.js: Web-based pixel classification correctionplatform for ground truth creation. In 2017 14th IAPR InternationalConference on Document Analysis and Recognition (ICDAR), volume 2,pages 39–40. IEEE, 2017.
[5] Gabriel Vigliensoni, Alex Daigle, Eric Lui, Jorge Calvo-Zaragoza, JulietteRegimbal, Minh Anh Nguyen, Noah Baxter, Zoe McLennan, and IchiroFujinaga. Overcoming the challenges of optical music recognition ofearly music with machine learning. DH 2019, 2019.
[6] Christoph Wick, Alexander Hartelt, and Frank Puppe. Staff, symbol andmelody detection of medieval manuscripts written in square notation usingdeep fully convolutional networks. Applied Sciences, 9(13), 2019.
[7] Christoph Wick, Christian Reul, and Frank Puppe. Comparison of OCRaccuracy on early printed books using the open source engines Calamariand OCRopus. JLCL: Special Issue on Automatic Text and LayoutRecognition, 33(1):79–96, 2018.
Proceedings of the 2nd International Workshop on Reading Music Systems, Delft, 2019
34

Digital Humanities im deutschsprachigen Raum 2020
OMMR4all - einsemiautomatischerOnline-Editor fürmittelalterlicheMusiknotationen
Wick, [email protected]ät Würzburg, Deutschland
Hartelt, [email protected]ät Würzburg, Deutschland
Puppe, [email protected]ät Würzburg, Deutschland
Einleitung
Insbesondere für Musikwissenschaftler im Bereich von his-torischen Manuskripten besteht der Wunsch nach digitalenBibliotheken, die die gewaltigen Mengen an Material in ma-schinenlesbare Form (z. B. MEI) speichern. Die Kodierung deralten Werke ist jedoch oft sehr mühselig, da großer mensch-licher Einsatz erforderlich ist. Das Aufkommen von künstli-cher Intelligenz offenbart hier neue Ansätze, um die Arbeits-prozesse größtmöglich zu automatisieren, indem Algorithmenaus dem Bereich der optischen Musikerkennung (OMR) einge-setzt werden.
Die im Folgenden vorgestellte Software OMMR4all (OpticalMedieval Music Recognition For All) realisiert diesen Ansatzfür mittelalterliche Manuskripte, die in verschiedenen Neu-mennotationen, z. B. Quadratnotation, geschrieben sind. Dersemi-automatische Workflow erwartet eine einzelne einge-scannte Seite als Eingabe und erzeugt als Ausgabe die ko-dierte Musik z. B. als MEI oder in einer graphischen Anzeige.Hierbei werden verschiedene existierende OMR-Werkzeugezur Notenlinien-, Notensystem- und Symbolerkennung einge-setzt, die mit einem Overlay-Editor zur Korrektur kombiniertwerden. Neumen werden gemäß dem aktuellen MEI-Standard(4.0.1) repräsentiert. Eine manuell in einem modernen Stil ge-renderte Beispieltranskription zeigt Abbildung 1.
Abbildung 1: Beispieltranskription. Eine oder mehrere Neumen werden zuSilben zugeordnet. Eine Neume besteht wiederum aus einzelnen Notenkom-ponenten, die entweder graphisch (Bindebogen in a) oder logischen (kleinerAbstand in b) zur vorherigen Komponente verbunden sind. Mehrere Neu-men, die zu einer Silbe gehören, werden mit einem größeren Abstand darge-stellt (c).
Vigliensoni et al. (2019) stellten bereits einen vergleichba-ren OMR-Workflow, der im SIMSSA-Projekt (Fujinaga 2014)eingebettet ist, für Musik des Mittelalters und der Renais-sance vor. Hierbei arbeitet die OMR mittels eines Neurona-len Netzes (Calvo-Zaragoza 2018), das jeden Pixel des Ori-ginalmanuskripts in verschiedene Klassen wie z. B. Note,Notenzeile, Hintergrund oder Text einteilt. Die automatischeAusgabe kann durch das Webtool Pixel.js korrigiert werden(Zeyad 2017). Für die Weiterverarbeitung werden die klassi-fizierten Bilden in Ebenen gleichen Typs separiert, sodass einnachfolgender Algorithmus nicht mehr das Originalbild, son-dern ein Binärbild, das z. B. nur noch Notenlinienpixel oderMusiksymbolpixel umfasst. Ein weiterer Algorithmus kann
171

Digital Humanities im deutschsprachigen Raum 2020
so die Musiksymbole separat erkennen, welche anschließendim Overlay-Editor Neon.js (Regimbal 2019) korrigiert wer-den können. Der Workflow teilt mehrere Gemeinsamkeitenmit OMMR4all, dessen Umsetzung zeigt jedoch auch Grenzenauf. So entfällt in OMMR4all die erforderliche, teils mühsamepixelgenaue Korrektur zum Erzeugen der separaten Typebe-nen, da die in OMMR4all verwendeten OMR-Algorithmen di-rekt auf dem Originalmanuskript arbeiten. Auch arbeitet dervon uns vorgestellte neue Overlay-Editor näher am Original,da Notensysteme und Musiksymbole akkurat an die Positio-nen im Manuskript gezeichnet werden, was einen sehr schnel-len Abgleich von Vorlage und Vorhersage ermöglicht.
OMMR4all
Workflow
Abbildung 2: Der Workflow von OMMR4all.
Der Workflow von OMMR4all ist in Abbildung 2 gezeigt. Derhochauflösende Scan einer Seite dient neben dem vorberei-teten Liedtext (z. B. in einer Textdatei) als Eingabe. Das Bildwird zunächst durch eine automatische Vorverarbeitung gera-degestellt und binarisiert. Anschließend werden Notenlinienund Notensysteme mittels eines Fully-Convolutional Neuro-nalen Netzes (FCN) erkannt. Darauf aufbauend werden Mu-sik- oder Textregionen separiert, wobei im Standardfall keineexakten Regionen erforderlich sind und so die Layoutanalysevollständig automatisch abläuft. Basierend auf den Notensys-temen werden nun durch ein weiteres FCN Neumen, Noten-schlüssel und Vorzeichen erkannt. Abschließend werden dieSilben des vorgefertigten Liedtextes an die passenden Neu-men gesetzt. Die Algorithmen zu Notenlinien, Notensystem-und Symbolerkennung wurden hierbei direkt von Wick et al.(2019) übernommen.
Iterativer Trainingsansatz
OMMR4all ermöglicht das Training von individuellen Model-len für die Notenlinien- und Symboldetektion, um die auto-matische Erkennung auf einen spezifischen, aber noch unbe-kannten Stil eines Buches anzupassen. Das Training erfordertwenige Seiten an manuell ausgezeichneten Material. Auch die-ser Schritt kann durch Verwendung existenter ähnlicher Mo-delle semiautomatisch erfolgen.
Im Allgemeinen ist zu erwarten, dass die Notenzeilenerken-nungsmodelle sehr gut auf verschiedene Notationsstile gene-ralisieren, da Linien in allen Notationen sehr ähnlich sind. DieSymbolnotationen weisen hingegen eine größere Varianz auf,wie beispielsweise an Gotischer- oder Quadrat-Notation zu se-hen ist.
Softwarearchitektur
OMMR4all1 ist eine quelloffene Software2, die ein auf ei-ner REST API basierendes Client-Server-Modell implemen-tiert und eine Benutzerverwaltung umfasst. Dies ermöglichteine niedrige Einstiegshürde für den Einsatz der Software inder Forschung von Musikwissenschaftlern, da keine Installa-tion nötig und die Web-Applikation plattformunabhängig ist.Zusätzlich wird die Last des Rechnersystems zum Trainierenneuer Modell auf den Server ausgelagert. Dieser kann hierbeimit high-end GPUs ausgestattet werden, um die Rechenzeitenweiter zu reduzieren. Auch werden die Daten zentralisiert ge-speichert, was einen weltweiten Zugang von jedem internet-fähigen Arbeitsplatz ermöglicht. Demnach ist jeder einfacheLaptop oder Desktop PC als Zugriffspunkt zu OMMR4all voll-kommen ausreichend und sofort einsetzbar.
Overlay-Editor
Da nicht zu erwarten ist, dass die automatischen Tools vonOMMR4all perfekt arbeiten, müssen die Ergebnisse in ele-ganter und benutzerfreundlicher Art korrigiert werden. Diesermöglicht der integrierte Overlay-Editor, der eine Überla-gerung der Annotationen und der Originalseite anzeigt. Un-terschiede von Musiksymbolen können so leicht und mit ei-nem Blick festgestellt und anschließend korrigiert werden.Außerdem können Kommentare hinzufügt werden, um kriti-sche oder unklare Stelle zu markieren, die dann auch in denkritischen Apparat aufgenommen werden können oder die zurKommunikation zwischen dem Editor und einem Reviewer,der die Nachkorrektur durchführt, dienen können.
Abbildung 3: Benutzeroberfläche des Editors. Grüne Regionen definierenNotensysteme, rote Regionen Liedtext. Individuelle Notenkomponentenwerden als gelbe Boxen dargestellt, grafische Verbindungen von Neumenwerden als durchgezogene schwarze Linien, die zwei Noten verbinden ge-zeichnet, wohingegen die gestrichelten vertikalen Linien den Start einerneuen Neume angeben. Notenschlüssel sind türkis markiert. Die Silben desLiedtextes sind unter der zugehörigen Neume in der jeweiligen Textregionausgerichtet. Die verschiedenen Knöpfe der Werkzeugleiste dienen zur Kor-rektur der Annotationen oder um die automatischen Algorithmen zu star-ten. Nicht gezeigt sind Lesereihenfolge oder Kommentare des Korrektors.
Abbildung 3 zeigt die Benutzeroberfläche des Editors. DerEditor ist konzipiert, damit er ohne steile Lernkurve leicht be-dient werden kann: Die Interaktionen zur Selektion, zur Be-wegung, zum Ziehen oder zum Einfügen von Elementen er-folgen mit der Maus. Erfahrene Nutzer können jedoch aufTastaturkürzel zurückgreifen, um den Bearbeitungsprozess zubeschleunigen.
172

Digital Humanities im deutschsprachigen Raum 2020
Evaluation
Zur Evaluation der Transkriptionszeit verglichen wir OMM-R4all mit Monodi+ (Eipert 2019), einem Tool, das unter ande-rem einen hochentwickelten Editor für eine tastaturbasierteEingabe von Cantus Planus (monophone Musik der Westli-chen Kirche) anbietet. Die Bedienung der beiden Softwaresys-teme erfolgte stets durch Experten des jeweiligen Programms.Als Material wählten wir jeweils fünf Seiten in gotischer undQuadratnotation (eine Beispielseite wird in Abbildung 3 be-arbeitet). Wir maßen und verglichen die mittleren Zeiten, diebei Vorlage des Liedtextes nötig waren, um eine korrekte Tran-skription der Manuskripte zu erzielen. Somit wurden nur dieZeiten zur Korrektur oder Eingabe von Notenlinien und Mu-siksymbole gemessen. Die Modelle für die Quadratnotationwaren auf 49 Seiten trainiert, die aus einem weiteren Buchstammen. Die gotischen Modelle basieren auf vier weiterenSeiten aus dem identischen Buch. Tabelle 1 fasst die Ergeb-nisse zusammen.
Tabelle 1: Evaluation der Transkriptionszeiten in Minuten. Wir listen dieAnzahl der Symbole, die erforderlichen Zeiten für die Korrektur der Noten-linien, der Symbole, der Silbenzuordnung, und die Gesamtzeit. Alle Wertesind gemittelt und relativ zu einer Seite angegeben.
Notation #Symbole OMMR4all Monodi+ Speed-up
Notenlinien Symbole Silben Gesamt
Gotisch 158 0,3 2,3 1,8 4,5 5,6 1,3
Quadrat 267 0,6 3,3 2,9 6,9 8,5 1,2
OMMR4all zeigt einen Speed-Up von 1,3 und 1,2. Hierbeiist zu beachten, dass die Bearbeitungszeit mittels Monodi+bereits am Limit ist, da jedes Symbol manuell eingegebenwerden muss, worauf das Interface perfekt zugeschnitten ist.OMMR4all hingegen kann sich stets weiterentwickeln undselbständig genauere Modelle lernen. Insbesondere wenn dieverwendeten Modelle ausgehend von der aktuellen Fehlerratevon 10% genauer arbeiten, ist mit einer deutlichen Reduktionder Bearbeitungszeit für die Symboleingabe zu rechnen. Wei-terhin verspricht die Entwicklung einer automatischen Sil-benerkennung und -zuweisung eine weitere Beschleunigung.Natürlich können, falls die Modelle menschliche Genauigkeiterreichen, alle Seiten vollständig automatisch verarbeitet wer-den. Im Allgemeinen liefert OMMR4all im Vergleich zu ei-ner manuellen Eingabe des Notentextes eine inhärente Erklä-rungskomponente für den Ursprung eines jeden Symbols, wasinsbesondere für einen kritischen Apparat relevant ist.
Geplante Erweiterungen
Trotz der vielen Funktionen von OMMR4all, existieren et-liche weitere mögliche Verbesserungen oder Erweiterungen.Einige anstehenden Aufgaben werden im Folgenden vorge-stellt.
Zunächst planen wir verschiedene Werkzeuge und Algorith-men, um den Liedtext automatisch zu erfassen. Das Hauptpro-blem hierbei ist, dass derzeit keine OCR-Engine verlässlich mithandgeschriebenen Text ohne spezielles Training umgehenkann. Deswegen soll in einem ersten Schritt zunächst die auto-matische Silbenzuordnung gelöst werden, wobei immer nochder vorgefertigte Liedtext vorliegen muss. Hierzu werdendie fehlerhaften Ergebnisse der OCR-Engine Calamari (Wick2018) als Vorschläge für die Position verwendet indem die
bestmögliche Übereinstimmung von erkanntem und korrek-tem Text gefunden wird. Vorläufige Ergebnisse sind vielver-sprechend, selbst wenn ein großer Prozentsatz der erkanntenOCR-Zeichen falsch ist. Die eigentliche automatische Erfas-sung des handgeschriebenen Textes stellt eine große Heraus-forderung dar, da eine Seite meist nur wenige Zeilen umfasst,jedoch viele manuell transkribierte Zeilen für ein Training er-forderlich sind. Alle modernen Ansätze verwenden hierfür einSprachmodell mit n-Grammen oder zumindest einem Wörter-buch sowie tiefe Neuronale Netze, meist bidirektionale LSTMs,die mit CNNs gekoppelt werden. Chammas et al. (2018) ver-wendeten mehrere tausend Seiten mit reinem Text von be-liebiger Handschrift und erhielten eine Wortgenauigkeit vonetwa 80%. Auf sauberer geschriebenen mittelalterlichen Ma-nuskripten erzielten Fischer et al. (2014) eine Wortgenauig-keit von etwa 93% mit etwa 11.000 Wörtern im Trainingsda-tensatz und einem eingeschränkten Vokabular von etwa 5.000Wörtern. In einem Szenario, in dem nur die Wörter des Trai-ningsdatensatzes bekannt waren, wurde eine Wortgenauig-keit von unter 78% erreicht, da etwa 15% der Wörter un-bekannt waren. Eine Umsetzung der Techniken für Liedtextesteht noch aus, denn hier besteht ein zusätzliches Problem,dass viele Worte in Silben aufgeteilt sind, was den Einsatz vonWörterbüchern erschwert.
Andere Pläne umfassen weitere monophone Notationsstilezu unterstützen. Hierunter fallen sowohl ältere Neumennota-tionen, sowohl solche ohne Notenlinien, als auch spätere Men-surnotationen. Hierzu bedarf es nur kleinere kosmetischerÄnderungen am Editor, jedoch ist größerer Aufwand beim Ent-wickeln neuer Algorithmen nötig. Polyphone Notationen, auchsolche bei denen die Stimmen jeweils in separaten Notensys-temen vorliegen, stellen semantische bzw. hierarchische Än-derungen der Musiknotation dar, da z. B. zwei oder mehreregleichzeitig klingende Notenzeilen zu einer Akkolade zusam-mengefasst werden müssen, was Änderungen am Datenfor-mat und somit auch am Editor erfordert.
In der Praxis wird OMMR4all im Corpus Monodicum Pro-jekt3 der Universität Würzburg eingesetzt, um den Prozessder Transkription der Bestände von einstimmiger Musik deslateinischen Mittelalters zu beschleunigen. Der Overlay-Edi-tor, der mit einem Blick erlaubt Fehler zu erkennen, hebt denTranskriptionsprozess bereits auf ein hohes Qualitätsniveau.Trotzdem ist zur Qualitätssicherung ein zweistufiger Prozessnotwendig, indem ein musikwissenschaftlicher Reviewer dasErgebnis des Transkriptionsprozesses überprüft, das in Zu-sammenarbeit von OMMR4all und einem menschlichen Editorerzeugt wurde. Technisch wird dies durch die Möglichkeit un-terstützt, pro Seite eine Freigabe zu dokumentieren oder, wieoben erwähnt, Kommentare zur Nachbearbeitung anzugeben.
Fußnoten
1. Eine Demo-Anwendung, die das testweise Bearbeitenzweier unterschiedlicher Bücher erlaubt ist unter https://ommr4all.informatik.uni-wuerzburg.de/ verfügbar.2. Der Quellcode kann auf https://github.com/OMMR4all/eingesehen werden.3. http://www.musikwissenschaft.uni-wuerzburg.de/for-schung/corpus-monodicum/
173

Digital Humanities im deutschsprachigen Raum 2020
Bibliographie
Calvo-Zaragoza, Jorge / Castellanos, Francisco / Viglien-soni, Gabriel / Fujinaga, Ichiro (2018): "Deep neural net-works for document processing of music score images", in: Ap-plied Sciences 8: 654.
Chammas, Edgard / Mokbel, Chafic / Likforman-Sulem,Laurence (2018): "Handwriting Recognition of Historical Do-cuments with Few Labeled Data", in: 13th IAPR InternationalWorkshop on Document Analysis Systems (DAS), Vienna:. 43-48.
Eipert, Tim / Herrmann, Felix / Wick, Christoph / Puppe,Frank / Haug, Andreas (2019): "Editor Support for DigitalEditions of Medieval Monophonic Music", in: Proceedings ofthe 2 nd International Workshop on Reading Music Systems(submitted to).
Fischer, Andreas / Baechler Michael / Garz, Angelika /Liwicki, Marcus / Ingold, Rolf (2014): “A Combined Systemfor Text Line Extraction and Handwriting Recognition in His-torical Documents", in: 11th IAPR International Workshop onDocument Analysis Systems, Tours, 2014: 71-75.
Fujinaga, Ichiro / Hankinson, Andrew / Cumming, JulieE. (2014): "Introduction to SIMSSA (single interface for musicscore searching and analysis)", in: Proceedings of the 1st Inter-national Workshop on Digital Libraries for Musicology: 1-3.
Saleh, Zeyad / Zhang, Ké / Calvo-Zaragoza, Jorge / Vigli-ensoni, Gabriel / Fujinaga, Ichiro (2017): "Pixel. js: Web-ba-sed pixel classification correction platform for ground truthcreation.", in: 14th IAPR International Conference on DocumentAnalysis and Recognition (ICDAR): 39-40.
Regimbal, Juliette / McLennan, Zoé / Vigliensoni, Ga-briel / Tran, Andrew / Fujinaga, Ichiro (2019): "Neon2:A verovio-based square-notation editor", in: Music EncodingConference 2019.
Saleh, Zeyad / Zhang, Ké / Calvo-Zaragoza, Jorge / Vigli-ensoni, Gabriel / Fujinaga, Ichiro (2017): "Pixel.js: Web-ba-sed pixel classification correction platform for ground truthcreation.", in: 14th IAPR International Conference on DocumentAnalysis and Recognition (ICDAR): 39-40.
Vigliensoni, Gabriel / Daigle, Alex / Lui, Eric / Calvo-Za-ragoza, Jorge / Regimbal, Juliette / Nguyen, Minh Anh /Baxter, Noah / McLennan, Zoe / Fujinaga, Ichiro (2019): "Overcoming the challenges of optical music recognition of earlymusic with machine learning", in: DH2019 .
Wick, Christoph / Hartelt, Alexander / Puppe, Frank(2019): "Staff, Symbol and Melody Detection of Medieval Ma-nuscripts written in Square Notation using Deep Fully Convo-lutional Networks", in: Applied Sciences 9 .
Wick, Christoph / Reul, Christian / Puppe, Frank (2018):"Comparison of OCR Accuracy on Early Printed Books usingthe Open Source Engines Calamari and OCRopus", in: JLCL:Special Issue on Automatic Text and Layout Recognition: 79-96.
174

B Other ContributionsThe following two papers were written during this thesis, but are not peer-reviewed and not directlyrelated to it. The articleDeep Learning [217] published in the journal Informatik Spektrum (2017)as part of the section Aktuelles Schlagwort (en. current buzzword) presents a brief introduction anddifferent applications of Deep Learning.The paper Leaf Identification Using a Deep Convolutional Neural Network [218] applies CNNs
to the classification of leafs including data augmentation and transfer learning. On two publiclyavailable datasets (Flavia, Foliage) with a specified splitting for training and testing, the presentedmethod outperformed several existing methods, such as traditional image operations, and yieldedthe state-of-the-art upon publication.
149

AKTUELLES SCHLAGWORT* / DEEP LEARNING }
Deep LearningChristophWick
Jährlich veröffentlichen Forscher neue Zahlenund Bestwerte ihrer Lernverfahren in verschie-densten Bereichen, mit welchen sie sich denmenschlichen Fähigkeiten nähern oder diese so-gar bereits übertreffen. Hierbei ist Deep Learningals Schlagwort prominent vertreten. Das be-kannteste Beispiel darunter ist sicherlich der vonGoogles DeepMind-Gruppe entwickelte AlphaGo-Computer, der erstmals professionelle menschlicheSpieler im Go-Spiel, das weitaus komplexer alsSchach ist, bezwang (vgl. [8]). Insbesonderedie Mainstreammedien griffen das Thema aufund postulierten eine neue Ära von KünstlicherIntelligenz.
Trotz wachsender Popularität des Deep Learninglöst dieser Ansatz nicht pauschal jedes ungelösteoder nur unzufrieden gelöste Problem des maschi-nellen Lernens. Vielmehr ist es als eines von vielenWerkzeugen zu verstehen, das zum überwachtenoder unüberwachten Lernen von insbesonderesehr großen Datensätzen verwendet werden kann.Deep Learning kann hierbei den geschichteten Auf-bau hierarchischer Features automatisch sehr gutabbilden, weshalb es vor allem in der Bild- undSprachverarbeitung eine wichtige Rolle spielt. Wei-tere Bereiche des maschinellen Lernens wie iML [5]und OCR [9], in denen Deep Learning eingesetztwird, wurden bereits in Artikeln des aktuellenSchlagworts tituliert.
Struktur eines tiefen NeuronalenNetzwerks
Der Grundbaustein eines jeden Deep-Learning-Ansatzes ist das 1958 von Frank Rosenblatt [7]vorgestellte Perzeptron. Dieses ist eine Konstruktion
von mehreren sogenannten künstlichen Neuronen,die mit gewichteten Verknüpfungen und einemSchwellwert miteinander gekoppelt sind. Bei ei-nem einschichtigen Perzeptron sind dabei mehrereEingabeneuronen mit einem oder mehreren Ausga-beknoten voll verknüpft, d. h. jede Eingabe mit jederAusgabe. Die gewichteten Verbindungen sind hier-bei die lernbaren Parameter des Verfahrens, welcheursprünglich mit einer sehr einfachen Regel gelerntwurden.
Der Grundbaustein des Perzeptrons ist leichterweiterbar, indem man mehrere Schichten ein-zelner Perzeptronen mittels einer nichtlinearenAktivierungsfunktion koppelt. Eine solche Strukturwird aufgrund ihrer Vielschichtigkeit Multi-Layer-Perzeptron (MLP) genannt.
Darauf aufbauend gibt es eine Vielzahl weite-rer spezieller Netzstrukturen, z. B. ConvolutionalNeuronale Netze, bei denen teilweise ein Neuroneiner Schicht mit nur wenigen Neuronen der Vor-gängerschicht verbunden ist, um lokale Muster zuerkennen, was u. a. bei der Bildverarbeitung undMustererkennung sehr erfolgreich eingesetzt wird(s. Abschn. ,,Deep Learning in der Praxis“).
DOI 10.1007/s00287-016-1013-2© Springer-Verlag Berlin Heidelberg 2016
Christoph WickJulius-Maximilians-Universität Würzburg,Lehrstuhl für Künstliche Intelligenzund angewandte Informatik,Am Hubland, 97074 WürzburgE-Mail: [email protected]
*Vorschläge an Prof. Dr. Frank Puppe<[email protected]>oder an Dr. Brigitte Bartsch-Spörl<[email protected]>
Alle „Aktuellen Schlagwörter“ seit 1988 finden Sie unter:http://www.is.informatik.uni-wuerzburg.de/as
Informatik_Spektrum_40_1_2017 103

{ DEEP LEARNING
Trainieren eines Neuronalen NetzwerksEin Neuronales Netz mit vielen Schichten wirdstandardmäßig mittels eines Gradientenabstiegs,beispielsweise SGD (Stochastic Gradient Descent)oder dessen Abwandlungen wie AdaGrad oderNesterov, trainiert. Dazu wird eine Loss-FunktionL definiert, die bei fehlerfreiem Lernen des Trai-ningsdatensatzes minimal ist. Die Anwendungdes Gradientenabstiegs auf L durch Änderungder trainierbaren Gewichte W wird durch dieFormel
W ← W – η∇WL
beschrieben, wobei η der Lernrate und ∇W der Ab-leitung nach den Gewichten W entsprechen. Diesesucht und findet ein lokales Minimum von L, welchesjedoch nicht global sein muss, da der Trainings-datensatz nicht zwangsweise auch perfekt gelerntwerden kann. Häufig wird als Loss-Funktion dieüber alle Trainingsbeispiele summierte euklidi-sche Distanz gewählt. Stimmen alle Vorhersagenüberein, sind sowohl die Einzelabstände der Bei-spiele als auch deren Summe gleich Null. Je stärkerjedoch die Abweichung eines Beispiels, desto grö-ßer (hier quadratisch) geht dieser Fehler in dieLoss-Funktion ein.
Als Bild für diese mathematische Formel stelltman sich beispielsweise eine Kugel in einer Ge-birgslandschaft L mit allen Gipfeln, Tälern undGebirgsseen vor. Diese Kugel rollt aufgrund derSchwerkraft in ein Tal als lokales Minimum und zwardem geringsten Widerstand, d. h. dem steilsten Ab-stieg, also dem Gradienten ∇W , folgend. In diesemBild wird bereits eine modifizierte Version des Gra-dientenabstiegs verwendet, in welchem der aktuelleImpuls und die Trägheit berücksichtigt werden. DieKugel kann so aufgrund ihrer Geschwindigkeit auseinem flachen lokalen Minimum entkommen, umein besseres zu finden.
Die Lernrate η hat in diesem Bild die Bedeutungder Schrittweite in einer physikalischen Simulation.Dieser Parameter hat starke Auswirkungen auf dasErgebnis und ist abhängig von der Landschaftsbe-schaffenheit L, denn ein zu kleiner Wert erfordertviele winzige Berechnungsschritte und birgt dieGefahr, in einem sehr flachen lokalen Minimumstecken zu bleiben, wohingegen ein zu großer Wertzu wilden Sprüngen in der Landschaft führen kannund das Verfahren nicht konvergiert. Ein geeigneter
Wert sollte deshalb zunächst groß genug sein, umeine grobe Orientierung zu finden und um klei-nere Minima zu überspringen, jedoch im Laufeder Simulation gesenkt werden, um zu einem lo-kalen Minimum zu konvergieren. In der Anwendungwird deshalb die Lernrate η während des Trainingsgesenkt.
Zwar ist nun ersichtlich, wie das Lernverfah-ren funktioniert, jedoch fehlt zur Implementierungdes Algorithmus die Berechnung des Gradienten∇WL(N). Dazu soll ein einfaches MLP mit dreilernbaren Schichten und deren GewichtsmatrizenWi betrachtet werden. Dies wird in einer verein-fachten mathematischen Schreibweise notiert, dadadurch sowohl das Vanishing-Gradient-Problem,als auch der Backpropagation-Algorithmus leichterklärt werden können. Als Aktivierungsfunktionwird der Platzhalter σ(x) verwendet, beispielsweisetanh(x).
N(x)=W1 ·σ(N2
︷ ︸︸ ︷
W2 ·σ(W3 · x︸ ︷︷ ︸
N3
))
Gut erkennbar ist die Verkettung der einzelnenSchichten, indem die Gewichtsmatrix der i-tenEbene auf die Ausgabe der Aktivierungsfunktion derdarüber liegenden angewandt wird, hier notiert alsN2 bzw.N3.N(x)bezeichnet hier nur die Ausgabe desNetzwerks ohne eine Loss-Funktion, welcheN(x) alsArgument erhält L(N(x)).
Da L deshalb eine Verkettung von mehrerenFunktionen ist, findet die Ableitungsregel df (g(x))
dx =dg(x)dx
df (g)dg mehrmals Anwendung:
dL
dW1= σ(N2) · dL
dNdL
dW2= σ(N3)
dσ(N2)
dN2·W1 · dL
dNdL
dW3= x · dσ(N3)
dN3·W2 · dσ(N2)
dN2·W1 · dL
dN
Man erkennt, dass viele Terme wiederkehren, jetiefer man in das Netz vordringt. Hier beispiels-weise die Ableitung der Loss-Funktion dL
dN unddie der ersten Schicht dσ(N2)
dN2. Der sogenannte
Backpropagation-Algorithmus speichert nun diewiederkehrenden Faktoren zur Berechnung derAbleitungen in tieferen Ebenen und ist somit eineeffiziente Implementierung der Kettenregel nach
104 Informatik_Spektrum_40_1_2017

den einzelnen Lernparametern. So wird beispiels-weise ab der zweiten Schicht jedes Mal der Faktordσ(N2)dN2
·W1 · dLdN benötigt, sodass dieser nach unten
weitergereicht werden kann. Lehrbücher schreibenvereinfacht, dass der Fehler gemäß den Gewichtenaufgeteilt und zurück propagiert wird, woher derAlgorithmus seinen Namen trägt.
Zwar können mit dem SGD, welcher in dieserForm noch heute verwendet wird, effizient Neu-ronale Netze trainiert werden, jedoch zeigen sichProbleme, die das Trainieren von tiefen Struktu-ren aufgrund eines verschwindenden Gradientenerschwert.
Vanishing-Gradient-ProblemDas von Sepp Hochreiter im Jahre 1991 [4] in seinerDiplomarbeit erstmals beschriebene Problem desverschwindenden Gradienten ist eine der Haupt-ursachen, warum es anfänglich unmöglich war,tiefe Netze zu trainieren. Dies lässt sich leicht beinäherer Betrachtung der oben berechneten ver-ketteten Ableitungen verstehen. Je tiefer das Netzwird, desto mehr partielle Ableitungen der Aktivie-rungsfunktion, d. h. Faktoren, müssen miteinandermultipliziert werden (z. B. dσ(N2)
dN2). Sind diese wäh-
rend des Trainings < 1, dann multiplizieren sichmehrere Faktoren zu einer Zahl, die schnell gegenNull strebt, weswegen die Gewichtsänderungen intiefen Schichten deutlich langsamer sind als diein höheren. Da ursprünglich zumeist der tanh(x)als Aktivierungsfunktion verwendet wurde, führtedies unausweichlich zu diesem Problem, dennalle Funktionswerte und auch die Ableitungen anallen Stellen sind stets betragsmäßig < 1. Beson-ders relevant ist das Problem auch bei rekurrentenNetzen, die als zweite Dimension die Zeit besit-zen, weshalb der Gradient ebenso in Zeitrichtungverschwindet.
Bei Verwendung von Aktivierungsfunktionenmit Gradienten > 1 kann stattdessen das Exploding-Gradient-Problem auftreten. Dort werden Zahlen> 1 multipliziert, wodurch der Wert des Gradientenin tiefen Schichten explodiert und das Netz nichtkonvergiert.
Heutzutage gibt es mehrere Ansätze, die Pro-bleme des Vanishing Gradient zu bekämpfen. Dereinfachste ist die Verwendung von purer Rechen-kapazität, insbesondere von Grafikkarten, die dieAnzahl an Flops seit dem Jahr 1991 bis heute (2016)vermillionenfacht haben. So ist es möglich, durch
enormen Rechenaufwand selbst kleine Gradientenzur Optimierung eines Netzes zu verwenden. Wei-terhin wird in modernen Netzarchitekturen meistzusätzlich eine ReLU-Aktivierungsfunktion verwen-det, die als σ(x)=max(0, x) definiert ist. Da dieAbleitung dieser nichtlinearen Funktion für x > 0exakt 1 ist, wird sowohl ein Explodieren als auchein Verschwinden des Gradienten verhindert. Soerkennt man im obigen Formalismus, dass die Ab-leitungen der Aktivierungsfunktionen, falls derenArgument > 0 ist, auf 1 gesetzt wird und nur nochdie Gewichtsmatrizen Einfluss auf die Gewichtsän-derungen haben. Nicht zu vergessen ist hierbei, dassdie Gewichtsänderung 0 ist, sobald ein Argumentder Aktivierungsfunktion < 0 ist, jedoch trifft diesnur auf einen Teil der lernbaren Gewichte in denGewichtsmatrizen zu.
Die übrigen Parameter erhalten nun abereine Gewichtsänderung, die nicht dem Vanishing-Gradient-Problem unterliegen, sondern ausschließ-lich von den Gewichtsmatrizen und Netzausgabender höheren und tieferen Schichten Wi, bzw. σ(Ni)und der Ableitung der Loss-Funktion dL
dN abhängen.Die Größenordnung eines Gradienten liegt deshalbstets in der des zugehörigen Gewichts, multipliziertmit der Ableitung der Loss-Funktion, d. h. die Ge-wichtsänderung ist proportional zum Fehler undaktuellen Gewicht, weshalb ein Nichtverschwindengarantiert ist, solange ein Fehler existiert.
Andere Ansätze, wie der von Geoffrey Hin-ton im Jahr 2006 [2] vorgestellte, trainieren dasNetzwerk zunächst schichtenweise unüberwacht,woraufhin diese in einem Feintuning auf den eigent-lichen Datensatz trainiert werden. Tiefe rekurrenteNetze können beispielsweise durch Verwendungsogenannter LSTM-Zellen, die auf Hochreiter undSchmidhuber [3] zurückgehen, trainiert werden.Diese fügen dem Netzwerk ein lernbares Gedächtnishinzu, weshalb Gradienten so über mehrere Zeit-schritte gespeichert werden können, ohne dass dieseverschwinden.
Durch diese und weitere moderne Technikenist es seit einigen Jahren nun möglich, effizient sehrtiefe Neuronale Netze mit mehreren Millionen Pa-rametern zu trainieren. Eine weitere wichtige Rollespielen hierbei die riesigen Datensätze, die aufgrundvon BigData nun verfügbar sind und einer Über-anpassung der Gewichte entgegenwirken. Auf dasProblem des Overfittings wird in diesem Artikeljedoch nicht weiter eingegangen.
Informatik_Spektrum_40_1_2017 105
{ DEEP LEARNING
Für eine vertiefte Auseinandersetzung mitDeep Learning sei hier auf einen Artikel überDeep Learning von LeCun et al. [6] und auf einneu erschienenes Buch von Goodfellow et al. [1]verwiesen.
Deep Learning in der PraxisAufgrund der Popularität des Deep Learningexistieren bereits mehrere mächtige freie Open-Source-Frameworks zum Trainieren tieferNetzstrukturen. Zu nennen sind hier Caffe1, CNTK2,Tensorflow3 und Torch4 (in alphabetischer Rei-henfolge), wobei bemerkenswert ist, dass dieSoftwaregiganten Google und Microsoft ihre internentwickelten Frameworks Tensorflow und CNTKfrei zur Verfügung stellen. Alle Frameworks bieteneine Schnittstelle zu NVIDIAs Cuda und CUDNNzum effizienten Training auf Grafikkarten. Die vonAMD entwickelte Alternative OpenCL zu NVIDIAsCuda wird beispielsweise von Caffe experimentellunterstützt. Die Einrichtung der Frameworks setztstandardmäßig einen Linux-basierten Computeroder Grafikkartenserver voraus, wobei verschiedeneinoffizielle Portierungen auf Windows existieren.
Die einzelnen Frameworks haben neben dernativen C/C++-Schnittstelle entweder eine Python-oder Lua-Anbindung, die es erlaubt, mit wenigenZeilen Code Netzwerkstrukturen zu erstellen und zutrainieren. Das Training ist aufgrund der verschiede-nen Hyperparameter, darunter die Lernrate η oderdie Netzstruktur N(x), nicht trivial und erforderteinige Erfahrung, die man jedoch beispielsweisedurch Ausprobieren der Beispiele der einzelnenFrameworks erlangen kann.
Anwendung finden die genannten Frameworksin den verschiedensten Bereichen des Deep Lear-nings. Ein Hauptgebiet ist dabei die Bildverarbeitungzur Klassifikation (z. B. Schildererkennung oderGesichtserkennung) oder Segmentierung (z. B.Lokalisieren von Objekten). Insbesondere die spe-ziellen Convolutional Neuronalen Netze (CNN),siehe dazu z. B. [6], spielen hier eine wichtige Rolle,da diese aufgrund ihrer speziellen Struktur spe-zifische lokale Eigenschaften hierarchisch findenkönnen. So können in der ersten Ebene des Netzes
1 http://caffe.berkeleyvision.org/2 https://www.microsoft.com/en-us/research/product/cognitive-toolkit/3 https://www.tensorflow.org/4 http://torch.ch/
Konturen, Linien oder Bögen gefunden werden, diein tieferen Ebenen komplexere Strukturen bilden,um schließlich das gewünschte Zielobjekt zu erken-nen. Moderne Netzstrukturen, wie das bekannteGoogleNet, das zur Klassifikation von Bildern einge-setzt werden kann, besitzen dabei bereits mehr als20 Schichten.
Eine Benchmark auf diesem Bereich ist derMNIST-Datensatz5 von handgeschriebenen Zif-fern, auf welchem CNNs Genauigkeiten von über99,7 % erzielen. Die falsch klassifizierten Ziffernsind hierbei auch für den Menschen nicht ein-deutig zuordenbar, da diese sehr unsauber unddadurch mehrdeutig geschrieben sind. Faszinie-rend ist dennoch, dass Deep Learning, das keinerleiVorwissen über die Aufgabe besitzt, selbstständigdurch das Lernverfahren die Gewichte so opti-miert und dadurch eigene Features ausbildet,die klassische Ansätze des maschinellen Lernensübertreffen.
Ein weiteres wichtiges Gebiet ist die Ver-arbeitung von zeitlichen Sequenzen wie z. B.Spracherkennung oder OCR von geschriebenemText. Letzteres wurde bereits im aktuellen Schlag-wort von Uwe Springmann [9] vorgestellt. Dazuwerden tiefe rekurrente Netze (RNN), beispiels-weise LSTM-Modelle, genutzt, um eine Eingabe-auf eine Ausgabesequenz abzubilden, mithilfe dererbeispielsweise gesprochener Text transkribiert odergeschriebener Text erkannt werden kann. Bei einerÜberlappung von Bild- und Sequenzverarbeitung,z. B. um in Videos Bewegungen oder Abläufe zu er-kennen, können bereits RNNs und CNNs kombiniertund gemeinsam trainiert werden.
Da riesige Netze aus vielen frei lernbaren Para-metern im Millionenbereich bestehen, wächst dieGefahr einer Überanpassung auf den Trainingsda-tensatz. Um dem entgegenzuwirken, werden teilsriesige Datensätze verwendet, die zusätzlich durchGenerierung neuer Beispiele aus den existieren-den augmentiert werden. Dies ist beispielsweisedurch Addieren von Rauschen oder Anwendungvon Transformationen zu erreichen. Das Trainingeines tiefen Netzwerkes dauert trotz Grafikkarten-beschleunigung und effizienten Implementierungenteils mehrere Tage, weshalb verständlich ist, dass vorallem der technische Fortschritt den Boom des DeepLearning in den vergangenen Jahren ermöglicht hat.
5 http://yann.lecun.com/exdb/mnist/
106 Informatik_Spektrum_40_1_2017

Spannend hierbei bleibt, wann die nächstengrößeren Durchbrüche in der Künstlichen In-telligenz durch den Einsatz von Deep Learningeintreten.
Literatur1. Goodfellow I, Bengio Y, Courville A (2016) Deep Learning. The MIT Press2. Hinton GE, Osindero S, Teh Y-W (2006) A fast learning algorithm for deep belief
nets. Neural Comput 18:1527–1554
3. Hochreiter S, Schmidhuber J (1997) Long short-term memory. Neural Comput9(8):1735–1780
4. Hochreiter S (1991) Untersuchungen zu dynamischen neuronalen netzen. Diplom-arbeit, TU München
5. Holzinger A (2016) Interactive machine learning (iml). Informatik-Spektrum39(1):164–168
6. LeCun Y, Bengio Y, Hinton G (2015) Deep learning. Nature 521:436–4447. Rosenblatt F (1957) The Perceptron – A Perceiving and Recognizing Automaton.
Cornell Aeronautical Laboratory, 85-460-18. Silver D, Huang A, Maddison CJ et al. (2016) Mastering the game of go with deep
neural networks and tree search. Nature 529:484–5039. Springmann U (2016) OCR für alte drucke. Informatik-Spektrum 39(6):459–462
Informatik_Spektrum_40_1_2017 107

Leaf Identification Using a Deep Convolutional NeuralNetwork
Christoph Wick and Frank Puppe
University of Wurzburg, Am Hubland, 97074 Wurzburg, Germany,[email protected]
Abstract. Convolutional neural networks (CNNs) have become popular espe-cially in computer vision in the last few years because they achieved outstandingperformance on different tasks, such as image classifications. We propose a nine-layer CNN for leaf identification using the famous Flavia and Foliage datasets.Usually the supervised learning of deep CNNs requires huge datasets for train-ing. However, the used datasets contain only a few examples per plant species.Therefore, we apply data augmentation and transfer learning to prevent our net-work from overfitting. The trained CNNs achieve recognition rates above 99% onthe Flavia and Foliage datasets, and slightly outperform current methods for leafclassification.
1 Introduction
Currently, supervised learning of convolutional neural networks (CNNs) for classifica-tion tasks achieve state-of-the-art performances on a wide range of datasets, e.g. MNIST[13] and ImageNet [5]. Even though these datasets are usually huge in the amount of ex-amples per class optimum values are mostly achieved by using data augmentations. TheFlavia [22] and Foliage [9] datasets used in this paper include approximately 60 imagesper class in Flavia and 120 in Foliage, which is why data augmentation is extremely im-portant to obtain a reliable generalization of the trained networks. Moreover, we applyfurther techniques that help prevent overfitting of the network. Those are dropout [20]and transfer learning which provides an initial guess for the weights of the network,e.g. [6]. As a result, the trained 9-layer CNNs achieve outstanding recognition ratesabove 99% that also outperform slightly the current state-of-the-art published by Sulcand Matas [21], who utilize a texture-based leaf identification based on local featurehistograms.
The following paper is structured as follows. At first, we introduce similar workwhich is also used to compare our results. Next, we present the model we used. Thisincludes preprocessing, the network structure, batch generation, data augmentation, pre-training, and the execution parameters of our experiments. Finally, we demonstrate theinfluence of augmentations, pretraining, and dropout on the accuracy and compare ourresults to other published values.
arX
iv:1
712.
0096
7v1
[cs
.CV
] 4
Dec
201
7

2 Related Work
One of the first important datasets for leaf classification is the Flavia dataset that wasintroduced by Wu et al. [22]. The applied probabilistic neural networks obtained accu-racies around 90% using 12 simple geometric features.
Kadir et al. [9] applied several different features on the task of image classificationon the Flavia dataset, but also on their initially published Foliage dataset. Their bestmethods are based on probabilistic neuronal networks which use features derived froma leaf’s shape, vein, color, and texture. These models achieve accuracies of about 95%on the Flavia and 95.75% on the Foliage dataset [10].
A recent publication of Sulc and Matas [21] use a rotation and scale invariant ver-sion of local binary patterns applied to the leaf interior and to the leaf margin. A Sup-port Vector Machine classification yields impressive state-of-the art recognition valuesof above 99.5% on the Flavia dataset and 99.0% on the Foliage dataset.
Reul et al. [18] use a 1-nearest-neighbor classifier based on contour, curvature,color, Hu, HOCS, and binary pattern features. They achieve accuracies of about 99.37%on the Flavia dataset and 95.83% on the Foliage dataset.
A similar approach to our work that is also based on deep CNNs was publishedby Zhang et al. [23] who use a 7-layer CNN and a comparable data augmentation forleaf classification and achieved results of approximately 95% on the Flavia dataset.Our work differs mainly by usage of arbitrary rotations, of a larger 9-layer CNN andof a pretrained model that initializes the network weights. Moreover we generate newaugmentations during the training which will result in so to say infinite different images,while Zhang et al. augment the dataset by a given factor before training. This procedurewill be explained in Sects. 3.3 and 3.4.
Transfer learning across datasets by learning features on large-scale data and thentransferring them to a different tasks has proven to be successful e.g. in [6] or [14]. Weimplement a “supervised pretraining” approach, i.e. we train a network on the Caltech-256 dataset [7] and use the resulting network weights as initial conditions for all furthertrainings. Therefore each following training task does not start with randomly initializedweights but instead with ones that already represent probably useful features.
Dataset augmentation is one of the key concepts for learning deep convolutionalneural networks due to the power of those deep networks to generalize on large datasets.For example all of the state-of-the-art accuracies [2][3][15] on the famous MNISTdataset [13] make use of random distortions to augment the dataset. We make use oflinear label-preserving transformations that are presented in Sect. 3.4.
3 Models
In the following we will introduce the preprocessing of each dataset, the network struc-ture, the generation of batches, the data augmentation, the pretraining, and finally theparameters during the training.

3.1 Preprocessing
Each of the images in the used datasets is preprocessed in order to generate standardizedinput data for the training process of the network. A segmentation step is not requiredbecause all leaves in the Foliage or Flavia dataset are already photographed on a whitebackground and had their petioles removed.
For preprocessing we first compute the bounding box of a leaf to determine therelevant data, extract the enclosed image, and resize it to 344×344 pixels. By adding awhite margin of 3 pixels on each side we finally end up with a 350× 350 pixels sizedimage.
Before training a single network we split the complete dataset D containing Cclasses and N images into a training set ST R and a testing set ST E according to theratio NT E(C)/NT R(C), where N(C) defines the number of images per class. For exam-ple the notation 10×40 states that 10 images out of N are randomly moved to the testingset and 40 images out of the remaining ones are randomly inserted in the training set.Therefore the total number of instances in the testing set is 10×C and the total num-ber of instances in the training set is 40×C. Note that in this example possibly not allexamples of D are used. The notation 10×ALL means that 10 instances per class aremoved to the training set and the rest is used for testing.
Note that the splitting of the Foliage dataset into ST R and ST E is prescribed, whichwe will denote as FIXED. Therefore, we apply the random distribution only to Flavia.
3.2 Network structure
We use a deep CNN structure shown in Fig. 1 that consists of four convolutional layers(see e.g. [12]), each one is followed by a max-pooling layer, a ReLU (see e.g. [11])fully-connected layers, and a softmax layer indicating the class of the input image.The size of the input layer is 300× 300× 3 pixels, whereby 3 is the number of colorchannels. Note that the size is smaller than the one used in the preprocessing to allowcropping as data augmentation, see Sect. 3.4. The number of nodes in the output layermatches the count of classes C of the used dataset.
3.3 Batch generation
Training is performed by utilizing batches of size 32 that are renewed before each iter-ation consisting of a forward and backward pass. A single element of a batch is createdby choosing a random class c ∈C and afterwards a corresponding image i ∈ N(c) outof the images in the training dataset. Even if N(c) is different for distinct c, e.g. in a10×ALL splitting, we thereby achieve a uniform class distribution in our training set.
3.4 Dataset augmentation
Each randomly generated batch is altered by label-preserving transformations (e.g.[19]) to reduce overfitting. A single transformation T is performed by applying thefollowing elementary operations on a single image in the batch:

Fig. 1. The used CNN structure. The two numbers at the small block indicate the kernel sizes inconvolutional or max-pooling layers. The digit below a convolutional layer specifies the numberof kernels. The stride of convolutional and max-pooling layers it is 1 and 2, respectively. The firstfully connected layer consists of 500 output nodes.
– Rotation: Rotating the image by an arbitrary angle.– Scaling: Scaling the image by a factor in the range of 2[−0.1,0.1].– Cropping: Selection of a window with a size of 300×300 pixels out of the (trans-
formed) image.– Contrast: Multiplication of the color values by a factor of 2[−1,1].– Brightness: Adding a value in the range of [−20,20] to the image colors.– Flip: Mirroring the image window.
Note that changing the contrast and brightness also changes the white backgroundof the images.
During training we use uniformly random distributed transformations TR. For testingwe use TR, the original image (no transformation) T0 and a transformation TF that simplygenerates rotations of an original image by a fixed angle offset.
3.5 Pretraining
We use a “supervised pretraining” method also known as “transfer learning” similar tothe one applied in [6]. The main idea is to use a large-scale dataset that differs substan-tially from the actual smaller dataset for a supervised pretraining phase. The trainedweights of all layers except the softmax-layer are then used as initial conditions fortraining the actual dataset. Thus the filters of the convolutional layers are not initializedrandomly but instead set to pretrained values that already learned useful generalizingfeatures.
For that purpose we use the Caltech-256 dataset [7] which consists of classes ofimages that are entirely different from leaf classifications, e.g. various animals, tools,objects, vehicles or even fictional characters. This training is performed by using thesame preprocessing as described in Sect. 3.1 and the same dataset augmentation asintroduced in Sect. 3.4.
The increase of performance of the trained network on the Flavia and Foliage datasetshall be studied deeper in Sect. 4.1. In our experiment we only trained once on theCaltech dataset and used these results as initial network weights.

3.6 Experiments
The CNNs implementation is based on the caffe framework [8] running on a singleNVIDIA Titan X GPU. The calculation of new training batches is performed simultan-iously on a i7-5820K CPU using OpenCV [1] and OpenMP [4].
Each network is trained with a batch size of 32 using a Nesterov solver [16] and amomentum of 0.95. The training lasts for exactly 50000 iterations. During the processwe multiply the initial learning rate of 0.001 by 0.1 each 20000 iterations. Moreover,we use a L2 regularization with a weight decay of 0.0005. Training the network on theCaltech dataset to generate the pretrained weights takes approximately 8.5 hours, butusing 100000 iterations. Training of a single network afterwards took approximately4.2 hours.
For each model we train 10 networks that use different random seeds for splittingthe dataset into testing and training, generating the random batches and performing thedata transformation. Since the testing and training parts are prescribed in the Foliagedataset, a single run only changes the seed for generating a random batch and datatransformations.
All stated accuracies and their errors are obtained by averaging the results of the 10networks and computing the standard deviation.
4 Results
First, we will study the effect of the presented methods on the accuracy of the models.Afterwards, we show the final evaluation of the best models and discuss the occurringerrors. During the classification, the predicted leaf class is chosen to be the one with thehighest probability in the output softmax layer.
4.1 Data augmentation
In the following we study the effect of a single method shown in Sect. 3 on the accuracyor error. Therefore, we compare the result of a model that uses all augmentation methodsto one that leaves out a single one. The seeds in all of these modes are identical, i.e. theimages in the testing and training sets are the same. We use the Flavia dataset and a10× 40 splitting for evaluation. A data point in the following plots is computed every500 iterations by predicting 3200 augmented examples that are chosen randomly, usingTR on the test dataset. For smoothing the graph we average over 5 data points. Note thatthe jump at iteration 20000 occurs due to a change of the learning rate at this point.
The effect of pretraining and data augmentation is shown in Fig. 2. The solid lineindicates a typical learning process including all of the presented methods. It is clearlyvisible that the usage of pretraining leads to a lower classification error, because a modellearned without a pretraining (dotted line) shows a constant higher error. The absenceof data augmentation (dashed curve) leads to a initial fast learning followed by a con-stant plateau. This behavior can be explained by the absence of data augmentationsas rotation or color changes that drastically increase the number of different examplesthat have to be learned. Moreover, in the dashed curve the effect of overfitting becomes

Fig. 2. The error on test examples is computed by a model with or without the use of pretraining.
visible. The accuracy reaches a maximum at approximately 10000 iterations and thendecreases due to overfitting the training data. Usage of a model without a pretrainedmodel or any data augmentation lead to a even worse result (dash dotted line). In addi-tion removing dropout that helps prevent overfitting deteriorates (dashed line with bigdots).
The dash dotted line with big dots shows the results when training a model that isvery similar to the settings of Zhang et. al [23]. For that we applied clipping with amaximum offset of 0.1 of the allowed range, a scaling factor between 0.9 and 1.1, rota-tions by an angle up to 10 degrees, and a contrast factor between 0.8 and 1.2. Changesin contrast are neglected. It is clearly visible that the accuracy is coincidentally verysimilar to the model without any data augmentation. The value of approximately 97%is slightly higher than the reported one of 94%. This difference can be explained bythe larger overall structure of the network, as well as by the usage of a training set thatrepeatedly generates new random batches instead of using a fixed extended dataset asused by [23]. Furthermore, our result of about 89% by usage of a conventional structure(dashed line with big dots) is very similar to 87% reported by Zhang et al. [23].

Table 1. Evaluation of the trained networks using the single image and augmentation of eachimage based on TR and TF . All numbers are given as a percentage. The best values are markedbold.
Flavia Flavia Flavia Foliage10×ALL 10×40 1/2×1/2 FIXED
Single image T0 99.38±0.55 99.41±0.43 99.39±0.40 98.77±0.39Av. TR 99.72±0.31 99.75±0.29 99.67±0.20 99.28±0.11Av. TF 99.81±0.26 99.69±0.33 99.66±0.19 99.40±0.09Sulc and Matas [21] − 99.7±0.3 99.4±0.2 99.0Reul et al. [18] − 99.37±0.08 − 95.83Kadir et al. [10] − 95.0 − 95.75Zhang et al. [23] 94.69 − − −
4.2 Final results
For evaluating the networks we use the testing set ST E . Since every step during thelearning process is probabilistic, reliable results require averaging of different mod-els. For this purpose, we take the mode (most occurring prediction) of an augmentedversion of each single image in the testing set, which is also called “oversampling”.For this purpose we generate 64 augmentations based on random operations TR and onfixed rotations TF with an offset of 64/360 degrees. As comparative value we denotethe prediction of all testing images without any augmentation by T0 . To overcome ran-domness of the seeds for splitting the dataset or generating random numbers for dataaugmentation we average 10 runs.
Table 1 shows the classification results of our CNNs on the Flavia and Foliagedataset averaged over 10 runs compared to the results of similar publications.
As expected the number of examples in the training set have an impact on the result-ing accuracies. Usage of the largest training set 10×ALL is more accurate than usageof the smallest set 1/2×1/2. In the 10×ALL dataset the amount of examples per classin the training set vary between 40 and 67 which is why a splitting of 10× 40 is onlyslightly worse, even though the errors of each results are too large to allow a significantstatement.
Since our optimums and the ones of Sulc and Matas [21] coincide within their errorswe can not state that our results are significantly better on the Flavia dataset, but weappreciably outperform the state-of-the-art value on the Foliage dataset. However, wedefinitely achieve significantly improved classification accuracies of CNNs on thesedatasets compared to the proposed settings by Zhang et al. [23].
4.3 Error discussion
To examine the errors of the model we show the misclassifications on the Flavia datasetin Fig. 3. Therefor we sum up all wrong predictions of all models (T0, TR, TF ) of a singlesplitting in a matrix whose rows indicate the correct labels and whose columns show themisclassifications. Each single plot is normalized to its maximum that is drawn black.
At first, the distribution of the black boxes attract attention. They are not randomlydistributed but instead ordered in rows or columns, i.e. if there exists a box at a certain
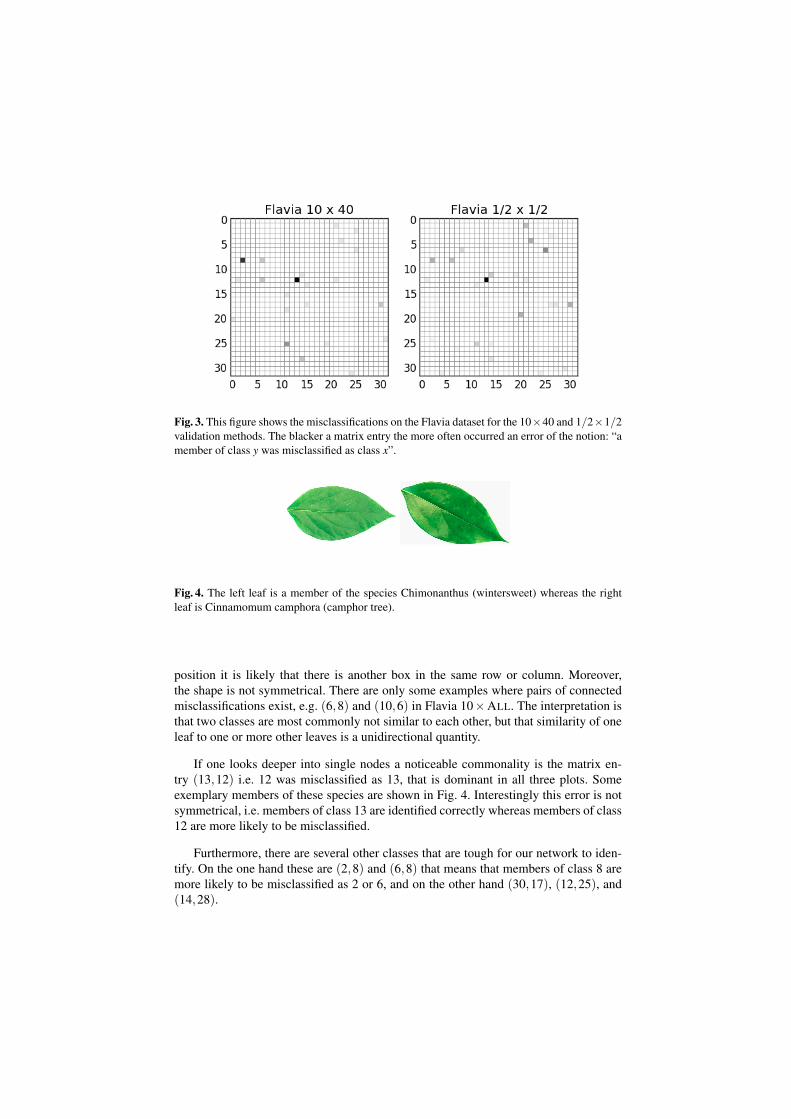
Fig. 3. This figure shows the misclassifications on the Flavia dataset for the 10×40 and 1/2×1/2validation methods. The blacker a matrix entry the more often occurred an error of the notion: “amember of class y was misclassified as class x”.
Fig. 4. The left leaf is a member of the species Chimonanthus (wintersweet) whereas the rightleaf is Cinnamomum camphora (camphor tree).
position it is likely that there is another box in the same row or column. Moreover,the shape is not symmetrical. There are only some examples where pairs of connectedmisclassifications exist, e.g. (6,8) and (10,6) in Flavia 10×ALL. The interpretation isthat two classes are most commonly not similar to each other, but that similarity of oneleaf to one or more other leaves is a unidirectional quantity.
If one looks deeper into single nodes a noticeable commonality is the matrix en-try (13,12) i.e. 12 was misclassified as 13, that is dominant in all three plots. Someexemplary members of these species are shown in Fig. 4. Interestingly this error is notsymmetrical, i.e. members of class 13 are identified correctly whereas members of class12 are more likely to be misclassified.
Furthermore, there are several other classes that are tough for our network to iden-tify. On the one hand these are (2,8) and (6,8) that means that members of class 8 aremore likely to be misclassified as 2 or 6, and on the other hand (30,17), (12,25), and(14,28).

5 Conclusions
Our proposed CNN was trained by applying the presented variety of improvements toovercome the small amount of training examples in the Flavia and Foliage dataset. Ityields results with state-of-the-art performance of above 99% for leaf identification onthe Flavia and Foliage dataset. The presented method is in our best knowledge cur-rently the best CNN approach on this task, mainly by using transfer learning and dataaugmentation. Thereby we combine data augmentation and training into one step tocreate a model that can be adopted easily to other applications. Even compared to meth-ods based on handcrafted features we showed that supervised training of CNNs yieldslightly better results.
As a next step we will apply the presented methods on the larger MEW dataset [17]that contains 153 species and at least 50 per class. We expect competitive accuraciesthat are definitively worse than the results on the Flavia dataset, because the number ofinstances per class is approximately the same but the total number of classes is almostfive times as big.
However, our main goal is to apply the described methods to cross dataset val-idation. Comparable to [18] we want to study how a trained CNN applies to a realworld scenario, i.e. classifying leaves that were collected completely independent ofthe test set and therefore differ quite a lot due influences of the temperature, rainfall,solar irradiation or seasons. Similar to [18] we expect that the applications of convolu-tional neural networks that are highly optimized on the trained dataset will fail on crossdataset validations especially due to the usage of colors, which is why experiments uti-lizing gray-scale images are required to achieve improved results. Another approachwould be to generate augmentations allowing color changes in a defined way so that thenetwork learns possible different colors of leaves.
References
1. Bradski, G.: The OpenCV Library. Dr. Dobb’s Journal of Software Tools (2000)2. Ciresan, D.C., Meier, U., Gambardella, L.M., Schmidhuber, J.: Deep, big, simple neural nets
for handwritten digit recognition. Neural Computation 22(12), 3207–3220 (2010)3. Ciresan, D.C., Meier, U., Gambardella, L.M., Schmidhuber, J.: Convolutional neural network
committees for handwritten character classification. In: ICDAR. pp. 1250–1254 (2011)4. Dagum, L., Menon, R.: Openmp: an industry standard api for shared-memory programming.
Computational Science & Engineering, IEEE 5(1), 46–55 (1998)5. Deng, J., Dong, W., Socher, R., Li, L.J., Li, K., Fei-Fei, L.: ImageNet: A Large-Scale Hier-
archical Image Database. In: CVPR09 (2009)6. Donahue, J., Jia, Y., Vinyals, O., Hoffman, J., Zhang, N., Tzeng, E., Darrell, T.: Decaf: A
deep convolutional activation feature for generic visual recognition. CoRR abs/1310.1531(2013)
7. Griffin, G., Holub, A., Perona, P.: Caltech-256 Object Category Dataset. Tech. Rep. CNS-TR-2007-001, California Institute of Technology (2007)
8. Jia, Y., Shelhamer, E., Donahue, J., Karayev, S., Long, J., Girshick, R., Guadarrama, S.,Darrell, T.: Caffe: Convolutional architecture for fast feature embedding. arXiv preprintarXiv:1408.5093 (2014)

9. Kadir, A., Nugroho, L.E., Susanto, A., Santosa, P.I.: Foliage plant retrieval using polar fouriertransform, color moments and vein features. Signal & Image Processing: An InternationalJournal (SIPIJ Journal) 2(3) (September 2011)
10. Kadir, A., Nugroho, L.E., Susanto, A., Santosa, P.I.: Performance improvement of leaf iden-tification system using principal component analysis. International Journal of Advanced Sci-ence and Technology 44 (July 2012)
11. Krizhevsky, A., Sutskever, I., Hinton, G.E.: Imagenet classification with deep convolutionalneural networks. In: Pereira, F., Burges, C.J.C., Bottou, L., Weinberger, K.Q. (eds.) Ad-vances in Neural Information Processing Systems 25, pp. 1097–1105. Curran Associates,Inc. (2012)
12. Lecun, Y., Bottou, L., Bengio, Y., Haffner, P.: Gradient-based learning applied to documentrecognition. In: Proceedings of the IEEE. pp. 2278–2324 (1998)
13. Lecun, Y., Cortes, C.: The MNIST database of handwritten digits14. jia Li, L., Su, H., Fei-fei, L., Xing, E.P.: Object bank: A high-level image representation for
scene classification & semantic feature sparsification. In: Advances in Neural Informa-tion Processing Systems 23, pp. 1378–1386. Curran Associates, Inc. (2010)
15. Meier, U., Ciresan, D.C., Gambardella, L.M., Schmidhuber, J.: Better digit recognition witha committee of simple neural nets. In: ICDAR. pp. 1135–1139 (2011)
16. Nesterov, Y.: A method of solving a convex programming problem with convergence rateO(1/
√k). Soviet Mathematics Doklady (1983)
17. Petr Novotny and Tomas Suk: Leaf recognition of woody species in central europe. Biosys-tems Engineering 115(4), 444 – 452 (2013)
18. Reul, C., Toepfer, M., Puppe, F.: Cross dataset evaluation of feature extraction techniques forleaf classification. Internatial Journal of Artificial Intelligence & Applications (IJAIA) 7(2)(March 2016)
19. Simard, P.Y., Steinkraus, D., Platt, J.C.: Best practices for convolutional neural networksapplied to visual document analysis. In: Proceedings of the Seventh International Conferenceon Document Analysis and Recognition - Volume 2. IEEE Computer Society (August 2003)
20. Srivastava, N., Hinton, G., Krizhevsky, A., Sutskever, I., Salakhutdinov, R.: Dropout: A sim-ple way to prevent neural networks from overfitting. J. Mach. Learn. Res. 15(1), 1929–1958(Jan 2014)
21. Sulc, M., Matas, J.: Computer Vision - ECCV 2014 Workshops: Zurich, Switzerland,September 6-7 and 12, 2014, Proceedings, Part IV, chap. Texture-Based Leaf Identification,pp. 185–200. Springer International Publishing, Cham (2015)
22. Wu, S.G., Bao, F.S., Xu, E.Y., Wang, Y.X., Chang, Y.F., Xiang, Q.L.: A leaf recognition algo-rithm for plant classification using probabilistic neural network. In: 2007 IEEE InternationalSymposium on Signal Processing and Information Technology. pp. 11–16 (Dec 2007)
23. Zhang, C., Zhou, P., Li, C., Liu, L.: A convolutional neural network for leaves recognitionusing data augmentation. In: Computer and Information Technology; Ubiquitous Comput-ing and Communications; Dependable, Autonomic and Secure Computing; Pervasive Intelli-gence and Computing (CIT/IUCC/DASC/PICOM), 2015 IEEE International Conference on.pp. 2143–2150 (Oct 2015)

C Declaration of own Contributions1. Christoph Wick. Deep Learning. Informatik-Spektrum, 40(1):103-107, 2017
Own contribution.
2. Christoph Wick and Frank Puppe. Leaf Identification Using a Deep Convolutional NeuralNetwork. arXiv preprint arXiv:1712.00967, 2017
C.W. conceived the methodology and the experiments, and carried them out. C.W. ana-lyzed and discussed the results. C.W. wrote the publication with contributions of F.P.
3. Christoph Wick, Christian Reul, and Frank Puppe. Comparison of OCR Accuracy on EarlyPrinted Books using the Open Source Engines Calamari and OCRopus. JLCL: Special Issueon Automatic Text and Layout Recognition, 33(1):79-96, 2018
C.W. conceived the methodology and the experiments, and carried them out. C.W. de-veloped the presented software “Calamari”. C.W., C.R. and F.P. analyzed the results. C.W.wrote the publication with contributions of C.R. and F.P.
4. Christoph Wick and Frank Puppe. Fully Convolutional Neural Networks for Page Segmen-tation of Historical Document Images. In 13th IAPR International Workshop on DocumentAnalysis Systems (DAS), pages 287–292, Vienna, 2018.
C.W. conceived and carried out the experiments. C.W. designed and implemented the al-gorithm. C.W. and F.P. analyzed the results. C.W. wrote the publication with contributionsof F.P.
5. ChristophWick, Christian Reul, and Frank Puppe. Calamari – AHigh-Performance Tensor-flow-based Deep Learning Package for Optical Character Recognition. Digital HumanitiesQuarterly (forthcoming), 2019
C.W. conceived the methodology and the experiments, and carried them out. C.W. de-veloped the presented software “Calamari”. C.W., C.R. and F.P. analyzed the results. C.W.wrote the publication with contributions of C.R. and F.P.
6. Christoph Wick and Frank Puppe. OMMR4all — a Semiautomatic Online Editor for Me-dieval Music Notations. In 2nd International Workshop on Reading Music Systems, pages31-34, Delft, The Netherlands, 2019
165

C Declaration of own Contributions
C.W. conceived and developed the tool. C.W. wrote the publication with contributions ofF.P.
7. Christoph Wick, Alexander Hartelt, and Frank Puppe. Staff, Symbol and Melody Detectionof Medieval Manuscripts Written in Square Notation Using Deep Fully Convolutional Net-works. Applied Sciences, 9(13):2646, 2019
C.W. conceived and performed the experiments and created theGT data. C.W. andA.H. con-tributed the staff line detection algorithm. C.W. designed the symbol detection algorithm.C.W. and F.P. analyzed the results. C.W. wrote the paper with substantial contributions ofF.P.
8. Christoph Wick, Alexander Hartelt, and Frank Puppe. OMMR4all – ein semiautomatischerOnline-Editor fürmittelalterlicheMusiknotationen. InDigital Humanities im deutschsprachi-gen Raum, 2020
C.W. conceived and developed the tool including contributions of A.H. C.W. wrote thepublication with contributions of F.P. and A.H.
9. Christoph Wick and Frank Puppe. Automatic Neume Transcription of Medieval MusicManuscripts using CNN/LSTM-Networks and the segmentation-free CTC-Algorithm. Ap-plied Sciences, 2020. submitted to.
C.W. conceived the methodology and the experiments, and carried them out. C.W. ana-lyzed and discussed the results. C.W. wrote the publication with contributions of F.P.
10. Christoph Wick and Frank Puppe. Lyrics Recognition and Syllable Assignment of Me-dieval Manuscripts. In 20th International Conference on Frontiers in Handwriting Recogni-tion, Dortmund, 2020. submitted to.
C.W. conceived the methodology and the experiments, and carried them out. C.W. ana-lyzed and discussed the results. C.W. wrote the publication with contributions of F.P.
166

Bibliography[1] Frank Dennis Julca Aguilar and Nina ST Hirata. Image operator learning coupled with
CNN classification and its application to staff line removal. In 2017 14th IAPR InternationalConference on Document Analysis and Recognition (ICDAR), volume 1, pages 53–58. IEEE,2017.
[2] Fatemeh Alirezazadeh and Mohammad Reza Ahmadzadeh. Effective staff line detection,restoration and removal approach for different quality of scanned handwritten music sheets.Journal of Advanced Computer Science & Technology, 3(2):136–142, 2014. doi: 10.14419/jacst.v3i2.3196.
[3] Adnan Amin and Ricky Shiu. Page segmentation and classification utilizing bottom-upapproach. International Journal of Image and Graphics, 1(02):345–361, 2001.
[4] Apostolos Antonacopoulos, Stefan Pletschacher, David Bridson, and Christos Papadopou-los. ICDAR 2009 page segmentation competition. In 2009 10th International Conferenceon Document Analysis and Recognition, pages 1370–1374. IEEE, 2009.
[5] Apostolos Antonacopoulos, Christian Clausner, Christos Papadopoulos, and StefanPletschacher. Historical document layout analysis competition. In 2011 International Con-ference on Document Analysis and Recognition, pages 1516–1520. IEEE, 2011.
[6] Apostolos Antonacopoulos, Christian Clausner, Christos Papadopoulos, and StefanPletschacher. ICDAR 2013 competition on historical book recognition (HBR 2013). In2013 12th International Conference on Document Analysis and Recognition, pages 1459–1463. IEEE, 2013.
[7] Apostolos Antonacopoulos, Christian Clausner, Christos Papadopoulos, and StefanPletschacher. ICDAR 2013 competition on historical newspaper layout analysis (HLNA2013). In 2013 12th International Conference on Document Analysis and Recognition, pages1454–1458. IEEE, 2013.
[8] Apostolos Antonacopoulos, Christian Clausner, Christos Papadopoulos, and StefanPletschacher. ICDAR2015 competition on recognition of documents with complex layouts-RDCL2015. In 2015 13th International Conference on Document Analysis and Recognition(ICDAR), pages 1151–1155. IEEE, 2015.
[9] Mehdi Assefi. OCR as a Service: An Experimental Evaluation of Google Docs OCR,Tesseract, ABBYY FineReader, and Transym. ISCV, December 2016.
167

BIBLIOGRAPHY
[10] Konstantin Baierer, Rui Dong, and Clemens Neudecker. okralact - a multi-engine OpenSource OCR training system. In Proceedings of the 5th International Workshop on Histor-ical Document Imaging and Processing, HIP ’19, pages 25–30, Sydney, NSW, Australia,September 2019. Association for Computing Machinery. ISBN 978-1-4503-7668-6. doi:10.1145/3352631.3352638. URL https://doi.org/10.1145/3352631.3352638.
[11] Jennifer Bain, Inga Behrendt, Kate Helsen, Alan P. Sexton, and Ichiro Fujinaga. The Op-tical Neume Recognition Project, 2012. URL https://opticalneumerecognition.wordpress.com.
[12] Jennifer Bain, Inga Behrendt, and Kate Helsen. Linienlose Neumen, Neumentrennung undRepräsentation von Neumen mit MEI Schema – Herausforderungen in der Arbeit im Op-tical Neume Recognition Project (ONRP). In Digitale Rekonstruktionen mittelalterlicherBibliotheken, pages 119–132, Wiesbaden, 2014.
[13] David Bainbridge. Extensible optical music recognition. PhD Thesis, University of Canter-bury, 1997. URL http://hdl.handle.net/10092/9420.
[14] Henry S. Baird, Susan E. Jones, and Steven J. Fortune. Image segmentation by shape-directed covers. In [1990] Proceedings. 10th International Conference on Pattern Recogni-tion, volume 1, pages 820–825. IEEE, 1990.
[15] Mario Baroni, Simon Maguire, and William Drabkin. The concept of musical grammar.Music Analysis, 2(2):175–208, 1983.
[16] Louis W. G. Barton. The NEUMES Project: digital transcription of medieval chantmanuscripts. In 2nd International Conference on Web Delivering of Music, pages 211–218,2002. doi: 10.1109/WDM.2002.1176213.
[17] Louis W. G. Barton. The NEUMES Project, 2007. URL http://www.scribeserver.com/NEUMES/index.html?lang=en&level=2&opened=yes&page=.
[18] Louis W. G. Barton, John A. Caldwell, and Peter G. Jeavons. E-library of Medieval ChantManuscript Transcriptions. In 5th ACM/IEEE-CS Joint Conference on Digital Libraries, pages320–329, Denver, CO, USA, 2005. ACM. ISBN 1-58113-876-8. doi: 10.1145/1065385.1065458.
[19] Louis WG Barton, Peter G. Jeavons, John A. Caldwell, and Koon Shan Barry Ng. Firstclass objects and indexes for chant manuscripts. In Proceedings of the 7th ACM/IEEE-CSjoint conference on Digital libraries, pages 415–416. ACM, 2007.
[20] Arnau Baró, Pau Riba, Jorge Calvo-Zaragoza, and Alicia Fornés. From Optical MusicRecognition to Handwritten Music Recognition: A baseline. Pattern Recognition Letters,123:1–8, May 2019. ISSN 0167-8655. doi: 10.1016/j.patrec.2019.02.029. URL http://www.sciencedirect.com/science/article/pii/S0167865518303386.
168

BIBLIOGRAPHY
[21] Arnau Baró-Mas. Optical Music Recognition by Long Short-Term Memory RecurrentNeural Networks. Master’s thesis, Universitat Autònoma de Barcelona, 2017. URLhttp://www.cvc.uab.es/people/afornes/students/Master_ABaro2017.pdf.
[22] Dorothea Blostein and Henry S. Baird. A Critical Survey of Music Image Analysis. InStructured Document Image Analysis, pages 405–434. Springer Berlin Heidelberg, 1992.ISBN 978-3-642-77281-8. doi: 10.1007/978-3-642-77281-8_19.
[23] Thomas Breuel. The OCRopus open source OCR system. In Document Recognition andRetrieval XV, volume 6815, page 68150F. International Society for Optics and Photonics,2008.
[24] Thomas Breuel. High Performance Text Recognition Using a Hybrid Convolutional-LSTMImplementation. In 14th IAPR International Conference on Document Analysis and Recog-nition (ICDAR), pages 11–16. IEEE, 2017.
[25] Thomas Breuel. OCRopy 2, 2018. URL https://github.com/tmbdev/ocropy2/.
[26] Thomas Breuel. CLSTM - A small C++ implementation of LSTM networks, focused onOCR, 2019. URL https://github.com/tmbdev/clstm.
[27] Thomas Breuel, Adnan Ul-Hasan, Mayce Ibrahim Ali Al Azawi, and Faisal Shafait. High-Performance OCR for Printed English and Fraktur Using LSTM Networks. In 12th Inter-national Conference on Document Analysis and Recognition, ICDAR 2013, Washington, DC,USA, August 25-28, 2013, pages 683–687, 2013. doi: 10.1109/ICDAR.2013.140. URLhttps://doi.org/10.1109/ICDAR.2013.140.
[28] Hoang-Nam Bui, Iin-Seop Na, and Soo-Hyung Kim. Staff Line Removal Using LineAdjacency Graph and Staff Line Skeleton for Camera-Based Printed Music Scores. In22nd International Conference on Pattern Recognition, pages 2787–2789, 2014. doi:10.1109/ICPR.2014.480.
[29] Manuel Burghardt and Sebastian Spanner. Allegro: User-centered Design of a Tool for theCrowdsourced Transcription of Handwritten Music Scores. In Proceedings of the 2Nd In-ternational Conference on Digital Access to Textual Cultural Heritage, DATeCH2017, pages15–20, New York, NY, USA, 2017. ACM. ISBN 978-1-4503-5265-9. doi: 10.1145/3078081.3078101. URL http://doi.acm.org/10.1145/3078081.3078101. Göttin-gen, Germany.
[30] John Ashley Burgoyne, Yue Ouyang, Tristan Himmelman, Johanna Devaney, Laurent Pu-gin, and Ichiro Fujinaga. Lyric Extraction and Recognition on Digital Images of Early Mu-sic Sources. In 10th International Society for Music Information Retrieval Conference, pages723–727, Kobe, Japan, 2009. URL http://ismir2009.ismir.net/proceedings/OS8-3.pdf.
[31] Jean-Christophe Burie, Joseph Chazalon, Mickaël Coustaty, Sébastien Eskenazi, Muham-mad Muzzamil Luqman, Maroua Mehri, Nibal Nayef, Jean-Marc Ogier, Sophea Prum,
169

BIBLIOGRAPHY
and Marçal Rusiñol. ICDAR2015 competition on smartphone document capture and OCR(SmartDoc). In 2015 13th International Conference on Document Analysis and Recognition(ICDAR), pages 1161–1165. IEEE, 2015.
[32] Gregory Burlet, Alastair Porter, Andrew Hankinson, and Ichiro Fujinaga. Neon.js: NeumeEditor Online. In 13th International Society for Music Information Retrieval Conference,pages 121–126, Porto, Portugal, 2012. URL http://ismir2012.ismir.net/event/papers/121_ISMIR_2012.pdf.
[33] Donald Byrd and Jakob Grue Simonsen. Towards a Standard Testbed for Optical MusicRecognition: Definitions, Metrics, and Page Images. Journal of New Music Research, 44(3):169–195, 2015. ISSN 0929-8215. doi: 10.1080/09298215.2015.1045424.
[34] John A. Caldwell. Towards a Classification of Western Chant Notations. InNEUMES 2006 Oxford Conference on Computerised Transcription of MedievalChant Manuscripts, pages 27–28, St Anne’s College, Oxford, June 2006. URLhttp://www.scribeserver.com/NEUMES/conference2006/proceedings/Caldwell_Classification-of-Notations.pdf.
[35] Jorge Calvo-Zaragoza and David Rizo. Camera-PrIMuS: Neural End-to-End Optical MusicRecognition on Realistic Monophonic Scores. In 19th International Society for Music Infor-mation Retrieval Conference, pages 248–255, Paris, France, 2018. ISBN 978-2-9540351-2-3. URL http://ismir2018.ircam.fr/doc/pdfs/33_Paper.pdf.
[36] Jorge Calvo-Zaragoza and David Rizo. End-to-End Neural Optical Music Recognitionof Monophonic Scores. Applied Sciences, 8(4), 2018. ISSN 2076-3417. doi: 10.3390/app8040606. URL http://www.mdpi.com/2076-3417/8/4/606.
[37] Jorge Calvo-Zaragoza, Luisa Micó, and Jose Oncina. Music staff removal with supervisedpixel classification. International Journal on Document Analysis and Recognition, 19(3):211–219, 2016. doi: 10.1007/s10032-016-0266-2.
[38] Jorge Calvo-Zaragoza, Alejandro Héctor Toselli, and Enrique Vidal. Early HandwrittenMusic Recognition with Hidden Markov Models. In 15th International Conference on Fron-tiers in Handwriting Recognition, ICFHR 2016, Shenzhen, China, October 23-26, 2016, pages319–324, 2016. doi: 10.1109/ICFHR.2016.0067. URL https://doi.org/10.1109/ICFHR.2016.0067.
[39] Jorge Calvo-Zaragoza, Antonio Pertusa, and Jose Oncina. Staff-line detection and removalusing a convolutional neural network. Machine Vision and Applications, 28(5-6):665–674,2017.
[40] Jorge Calvo-Zaragoza, Alejandro Toselli, and Enrique Vidal. Handwritten Music Recogni-tion for Mensural Notation: Formulation, Data and Baseline Results. In 14th InternationalConference on Document Analysis and Recognition, pages 1081–1086, Kyoto, Japan, 2017.doi: 10.1109/ICDAR.2017.179.
170

BIBLIOGRAPHY
[41] Jorge Calvo-Zaragoza, Gabriel Vigliensoni, and Ichiro Fujinaga. A machine learning frame-work for the categorization of elements in images of musical documents. In 3rd Interna-tional Conference on Technologies for Music Notation and Representation, A Coruña, Spain,2017. University of A Coruña. URL http://www.udc.es/grupos/ln/tenor2017/sections/node/5-unified_categorization.pdf.
[42] Jorge Calvo-Zaragoza, Gabriel Vigliensoni, and Ichiro Fujinaga. Staff-Line Detection onGrayscale Images with Pixel Classification. In Luís A. Alexandre, José Salvador Sánchez,and João M. F. Rodrigues, editors, Pattern Recognition and Image Analysis, pages 279–286, Cham, 2017. Springer International Publishing. ISBN 978-3-319-58838-4. URLhttps://link.springer.com/chapter/10.1007%2F978-3-319-58838-4_31.
[43] Jorge Calvo-Zaragoza, Francisco J. Castellanos, Gabriel Vigliensoni, and Ichiro Fujinaga.Deep Neural Networks for Document Processing of Music Score Images. Applied Sciences,8(5), 2018. ISSN 2076-3417. doi: 10.3390/app8050654. URL http://www.mdpi.com/2076-3417/8/5/654.
[44] Jorge Calvo-Zaragoza, Jan Hajič jr., and Alexander Pacha. Understanding Optical MusicRecognition. Computing Research Repository, 2019. URL https://arxiv.org/abs/1908.03608.
[45] Vicente Bosch Campos, Jorge Calvo-Zaragoza, Alejandro H. Toselli, and Enrique VidalRuiz. Sheet Music Statistical Layout Analysis. In 2016 15th International Conference onFrontiers in Handwriting Recognition (ICFHR), pages 313–318, October 2016. doi: 10.1109/ICFHR.2016.0066. ISSN: 2167-6445.
[46] Artur Capela, Ana Rebelo, Jamie dos Santos Cardoso, and Carlos Guedes. Staff LineDetection and Removal with Stable Paths. In International Conference on Signal Process-ing and Multimedia Applications, 2008. URL http://www.inescporto.pt/arebelo/publications/2008ACapelaSIGMAP.pdf.
[47] Samuele Capobianco, Leonardo Scommegna, and Simone Marinai. Historical Handwrit-ten Document Segmentation by Using a Weighted Loss. In Luca Pancioni, FriedhelmSchwenker, and Edmondo Trentin, editors, Artificial Neural Networks in Pattern Recogni-tion, Lecture Notes in Computer Science, pages 395–406. Springer International Publishing,2018. ISBN 978-3-319-99978-4.
[48] Jaime S. Cardoso and Ana Rebelo. Robust staffline thickness and distance estimationin binary and gray-level music scores. In 2010 20th International Conference on PatternRecognition, pages 1856–1859. IEEE, 2010. URL https://ieeexplore.ieee.org/document/5597199.
[49] Jamie dos Santos Cardoso, Artur Capela, Ana Rebelo, Carlos Guedes, and Joaquim Pinto daCosta. StaffDetectionwith Stable Paths. IEEETransactions on Pattern Analysis andMachineIntelligence, 31(6):1134–1139, 2009. ISSN 0162-8828. doi: 10.1109/TPAMI.2009.34.
171

BIBLIOGRAPHY
[50] Nicholas Paul Carter and Richard A. Bacon. Automatic Recognition of Printed Music. InStructured Document Image Analysis, pages 456–465. Springer Berlin Heidelberg, Berlin,Heidelberg, 1992. ISBN 978-3-642-77281-8. doi: 10.1007/978-3-642-77281-8_21. URLhttps://doi.org/10.1007/978-3-642-77281-8_21.
[51] Catholic Church. The Liber Usualis with introduction and rubrics in English. Desclée, Tour-nai, Belgium, 1963.
[52] G. Chen, L. Zhang, W. Zhang, and Q. Wang. Detecting the Staff-Lines of Musical Scorewith Hough Transform andMathematical Morphology. In 2010 International Conference onMultimedia Technology, pages 1–4, October 2010. doi: 10.1109/ICMULT.2010.5631269.
[53] K. Chen, M. Seuret, M. Liwicki, J. Hennebert, C. L. Liu, and R. Ingold. Page Segmentationfor Historical Handwritten Document Images Using Conditional Random Fields. In 201615th Int. Conf. on Frontiers in Handwriting Recognition (ICFHR), pages 90–95, 2016. doi:10.1109/ICFHR.2016.0029.
[54] Kai Chen, Mathias Seuret, Marcus Liwicki, Jean Hennebert, and Rolf Ingold. Page seg-mentation of historical document images with convolutional autoencoders. In 2015 13th In-ternational Conference on Document Analysis and Recognition (ICDAR), pages 1011–1015.IEEE, 2015.
[55] Kai Chen, Cheng-Lin Liu, Mathias Seuret, Marcus Liwicki, Jean Hennebert, and Rolf In-gold. Page segmentation for historical document images based on superpixel classificationwith unsupervised feature learning. In 2016 12th IAPR Workshop on Document AnalysisSystems (DAS), pages 299–304. IEEE, 2016.
[56] Kai Chen, Mathias Seuret, Jean Hennebert, and Rolf Ingold. Convolutional neural networksfor page segmentation of historical document images. In 2017 14th IAPR International Con-ference on Document Analysis and Recognition (ICDAR), volume 1, pages 965–970. IEEE,2017.
[57] Liang Chen and Christopher Raphael. Human-Directed Optical Music Recognition. Elec-tronic Imaging, 2016(17):1–9, 2016. doi: 10.2352/ISSN.2470-1173.2016.17.DRR-053.
[58] Liang Chen, Rong Jin, and Christopher Raphael. Human-Guided Recognition of MusicScore Images. In 4th International Workshop on Digital Libraries for Musicology. ACMPress, 2017. doi: 10.1145/3144749.3144752.
[59] Liang-Chieh Chen, George Papandreou, Kevin Murphy, and Alan L. Yuille. Weakly-andsemi-supervised learning of a deep convolutional network for semantic image segmentation.In ICCV, volume 1, page 2. Citeseer, 2015.
[60] G. Sayeed Choudhury, M. Droetboom, Tim DiLauro, Ichiro Fujinaga, and Brian Har-rington. Optical Music Recognition System within a Large-Scale Digitization Project. In1st International Symposium on Music Information Retrieval, 2000. URL http://jhir.library.jhu.edu/handle/1774.2/32794.
172

BIBLIOGRAPHY
[61] G. Sayeed Choudhury, Cynthia Requardt, Ichiro Fujinaga, Tim DiLauro, Elisabeth W.Brown, James W. Warner, and Brian Harrington. Digital workflow management: TheLester S. Levy digitized collection of sheet music. First Monday, 5(6), 2000. doi:10.5210/fm.v5i6.756.
[62] G. Sayeed Choudhury, Tim DiLauro, Michael Droettboom, Ichiro Fujinaga, and KarlMacMillan. Strike Up the Score: Deriving searchable and playable digital formatsfrom sheet music. D-Lib Magazine, 7(2), 2001. ISSN 1082-9873. doi: 10.1045/february2001-choudhury. URL http://www.dlib.org/dlib/february01/choudhury/02choudhury.html.
[63] Matthew Christy, Anshul Gupta, Elizabeth Grumbach, Laura Mandell, Richard Fu-ruta, and Ricardo Gutierrez-Osuna. Mass digitization of early modern texts with op-tical character recognition. Journal on Computing and Cultural Heritage (JOCCH), 11(1):6, 2018. URL https://psi.engr.tamu.edu/wp-content/uploads/2018/01/christy2017jcch.pdf.
[64] Christian Clausner, Apostolos Antonacopoulos, and Stefan Pletschacher. Icdar2017 com-petition on recognition of documents with complex layouts-rdcl2017. In 2017 14th IAPRInternational Conference on Document Analysis and Recognition (ICDAR), volume 1, pages1404–1410. IEEE, 2017.
[65] Solange Corbin and Basel Musikwissenschaftliches Institut. Die Neumen. Palaeographie derMusik. Bd. 1, Fasz. 3. Volk, Köln, 1977.
[66] Jifeng Dai, Yi Li, Kaiming He, and Jian Sun. R-FCN: Object detection via region-basedfully convolutional networks. In Advances in Neural Information Processing Systems, pages379–387, 2016.
[67] Christoph Dalitz and Thomas Karsten. Using the Gamera framework for building a lutetablature recognition system. In 6th International Conference on Music Information Re-trieval, pages 478–481, London, UK, 2005. URL http://ismir2005.ismir.net/proceedings/2012.pdf.
[68] Christoph Dalitz, Michael Droettboom, Bastian Pranzas, and Ichiro Fujinaga. A Compara-tive Study of Staff Removal Algorithms. IEEE Transactions on Pattern Analysis andMachineIntelligence, 30(5):753–766, 2008. ISSN 0162-8828. doi: 10.1109/tpami.2007.70749.
[69] Christoph Dalitz, Georgios K. Michalakis, and Christine Pranzas. Optical recognition ofpsaltic Byzantine chant notation. International Journal of Document Analysis and Recog-nition, 11(3):143–158, 2008. ISSN 1433-2825. doi: 10.1007/s10032-008-0074-4. URLhttps://doi.org/10.1007/s10032-008-0074-4.
[70] Timothy de Reuse and Ichiro Fujinaga. Robust Transcript Alignment on Medieval ChantManuscripts. In Jorge Calvo-Zaragoza and Alexander Pacha, editors, 2nd InternationalWorkshop on Reading Music Systems, pages 21–26, Delft, The Netherlands, 2019. URLhttps://sites.google.com/view/worms2019/proceedings.
173

BIBLIOGRAPHY
[71] Cong Minh Dinh, Hyung-Jeong Yang, Guee-Sang Lee, and Soo-Hyung Kim. Fast lyricarea extraction from images of printed Korean music scores. IEICE Transactions on Infor-mation and Systems, E99D(6):1576–1584, 2016. ISSN 0916-8532. doi: 10.1587/transinf.2015EDP7296.
[72] David Doermann and Karl Tombre, editors. Handbook of Document Image Processing andRecognition. Springer Reference. Springer, London, 2014. ISBN 978-0-85729-858-4. doi:10.1007/978-0-85729-859-1.
[73] Antoine Doucet, Gabriella Kazai, and Jean-Luc Meunier. ICDAR 2011 book structure ex-traction competition. In 2011 International Conference on Document Analysis and Recog-nition, pages 1501–1505. IEEE, 2011.
[74] Antoine Doucet, Gabriella Kazai, Sebastian Colutto, and Günter Mühlberger. ICDAR 2013Competition on Book Structure Extraction. In 2013 12th International Conference on Doc-ument Analysis and Recognition, pages 1438–1443. IEEE, 2013.
[75] Michael Droettboom. Beyond transcription: Case studies in special document analysis re-quirements. In The International Workshop on Document Image Analysis for Libraries. Cite-seer, 2004.
[76] Michael Droettboom, Ichiro Fujinaga, KarlMacMillan, G. Sayeed Chouhury, TimDiLauro,Mark Patton, and Teal Anderson. Using the Gamera framework for the recognition ofcultural heritage materials. In Joint Conference on Digital Libraries, pages 12–17, London,UK, 2002. URL http://droettboom.com/papers/p74-droettboom.pdf.
[77] Michael Droettboom, Karl MacMillan, and Ichiro Fujinaga. The Gamera framework forbuilding custom recognition systems. In Symposium on Document Image UnderstandingTechnologies, Greenbelt, MD, 2003.
[78] Anjan Dutta, Umapada Pal, Alicia Fornés, and Josep Llados. An Efficient Staff RemovalApproach from Printed Musical Documents. In 20th International Conference on PatternRecognition, pages 1965–1968, 2010. doi: 10.1109/ICPR.2010.484.
[79] Tim Eipert, Felix Herrman, Christoph Wick, Frank Puppe, and Andreas Haug. EditorSupport for Digital Editions of Medieval Monophonic Music. In Jorge Calvo-Zaragoza andAlexander Pacha, editors, 2nd InternationalWorkshop on ReadingMusic Systems, pages 4–7,Delft, The Netherlands, 2019. URL https://sites.google.com/view/worms2019/proceedings.
[80] Kuo-Chin Fan, Chi-Hwa Liu, and Yuan-Kai Wang. Segmentation and classification ofmixed text/graphics/image documents. Pattern Recognition Letters, 15(12):1201–1209,1994.
[81] C. Farabet, C. Couprie, L. Najman, and Y. LeCun. Learning Hierarchical Features forScene Labeling. IEEE Transactions on Pattern Analysis and Machine Intelligence, 35(8):1915–1929, 2013. ISSN 0162-8828. doi: 10.1109/TPAMI.2012.231.
174

BIBLIOGRAPHY
[82] Charles B. Faulhaber. The Digital Scriptorium: A New Way to Study Medieval IberianManuscripts. Research Series-Institute of International Studies University of CaliforniaBerkeley, pages 9–21, 1999.
[83] Andreas Fischer, Volkmar Frinken, Alicia Fornés, and Horst Bunke. Transcription Align-ment of LatinManuscripts Using HiddenMarkovModels. In Proceedings of the 2011Work-shop on Historical Document Imaging and Processing, HIP ’11, pages 29–36, NewYork, NY,USA, 2011. ACM. ISBN 978-1-4503-0916-5. doi: 10.1145/2037342.203734. Beijing,China.
[84] Alicia Fornés, Anjan Dutta, Albert Gordo, and Josep Llados. The ICDAR 2011 MusicScores Competition: Staff Removal and Writer Identification. In International Conferenceon Document Analysis and Recognition, pages 1511–1515, 2011. doi: 10.1109/ICDAR.2011.300.
[85] Alicia Fornés, Anjan Dutta, Albert Gordo, and Josep Lladós. CVC-MUSCIMA: a groundtruth of handwritten music score images for writer identification and staff removal. Interna-tional Journal on Document Analysis and Recognition (IJDAR), 15(3):243–251, September2012. ISSN 1433-2825. doi: 10.1007/s10032-011-0168-2. URL https://doi.org/10.1007/s10032-011-0168-2.
[86] Alicia Fornés, Anjan Dutta, Albert Gordo, and Josep Lladós. The 2012 Music ScoresCompetitions: Staff Removal and Writer Identification. In Young-Bin Kwon and Jean-Marc Ogier, editors, Graphics Recognition. New Trends and Challenges, pages 173–186,Berlin, Heidelberg, 2013. Springer Berlin Heidelberg. ISBN 978-3-642-36824-0. doi:10.1007/978-3-642-36824-0_17.
[87] Ichiro Fujinaga. Adaptive optical music recognition. PhD Thesis, McGill University, 1996.URL http://www.music.mcgill.ca/ich/research/diss/FujinagaDiss.pdf.
[88] Ichiro Fujinaga. Staff detection and removal. In Visual Perception of Music Nota-tion: On-Line and Off Line Recognition, pages 1–39. IGI Global, 2004. doi: 10.4018/978-1-59140-298-5.ch001.
[89] Ichiro Fujinaga and Andrew Hankinson. SIMSSA: Single Interface for Music Score Search-ing and Analysis. Journal of the Japanese Society for Sonic Arts, 6(3):25–30, 2014. URLhttp://data.jssa.info/paper/2014v06n03/7.Fujinaga.pdf.
[90] Susan E. George. Lyric Recognition and Christian Music. In S. George, editor, VisualPerception ofMusic Notation: On-Line and OffLine Recognition, pages 198–226. IRMPress,Hershey, PA, 2004. doi: 10.4018/978-1-59140-298-5.ch007.
[91] Ross Girshick, Jeff Donahue, Trevor Darrell, and Jitendra Malik. Rich feature hierarchiesfor accurate object detection and semantic segmentation. In Proceedings of the IEEE con-ference on computer vision and pattern recognition, pages 580–587, 2014.
[92] Michael Good. MusicXML for notation and analysis. The virtual score: representation,retrieval, restoration, 12:113–124, 2001.
175

BIBLIOGRAPHY
[93] Ian Goodfellow, Jean Pouget-Abadie, Mehdi Mirza, Bing Xu, David Warde-Farley, SherjilOzair, Aaron Courville, and Yoshua Bengio. Generative adversarial nets. In Advances inneural information processing systems, pages 2672–2680, 2014.
[94] Maarten Grachten, Josep Lluıs Arcos, and Ramon López deMántaras. A comparison of dif-ferent approaches to melodic similarity. In Proceedigns of the 2nd International Conferenceon Music and Artificial Intelligence, pages 43–56, 2002.
[95] Maarten Grachten, Josep Ll Arcos, and Ramon Lopez de Mantaras. Melodic similarity:Looking for a good abstraction level. In 5th International Conference on Music InformationRetrieval, Barcelona, Spain, 2004.
[96] Alex Graves, Santiago Fernández, Faustino Gomez, and Jürgen Schmidhuber. Connec-tionist temporal classification: labelling unsegmented sequence data with recurrent neuralnetworks. In Proceedings of the 23rd international conference on Machine learning, pages369–376. ACM, 2006.
[97] Thierry Géraud. Olena/Icdar2013Score, 2013. URL https://www.lrde.epita.fr/wiki/Olena/Icdar2013Score.
[98] Thierry Géraud. A morphological method for music score staff removal. In InternationalConference on Image Processing, pages 2599–2603. Institute of Electrical and ElectronicsEngineers Inc., 2014. ISBN 978-1-4799-5751-4. doi: 10.1109/ICIP.2014.7025526.
[99] Max Göbel, Tamir Hassan, Ermelinda Oro, and Giorgio Orsi. ICDAR 2013 table compe-tition. In 2013 12th International Conference on Document Analysis and Recognition, pages1449–1453. IEEE, 2013.
[100] Jaekyu Ha, Robert M. Haralick, and Ihsin T. Phillips. Document page decomposition by thebounding-box project. In Proceedings of 3rd International Conference on Document Analysisand Recognition, volume 2, pages 1119–1122. IEEE, 1995.
[101] Jaekyu Ha, Robert M. Haralick, and Ihsin T. Phillips. Recursive XY cut using boundingboxes of connected components. In Proceedings of 3rd International Conference on Docu-ment Analysis and Recognition, volume 2, pages 952–955. IEEE, 1995.
[102] Jaekyu Ha, Ihsin T. Phillips, and Robert M. Haralick. Document page decomposition usingbounding boxes of connected components of black pixels. In Document Recognition II,volume 2422, pages 140–151. International Society for Optics and Photonics, 1995.
[103] Jan Hajič jr. and Pavel Pecina. The MUSCIMA++ Dataset for Handwritten Optical MusicRecognition. In 14th International Conference on Document Analysis and Recognition, pages39–46, Kyoto, Japan, 2017. doi: 10.1109/ICDAR.2017.16.
[104] Masatoshi Hamanaka, Keiji Hirata, and Satoshi Tojo. Implementing Methods for AnalysingMusic Based on Lerdahl and Jackendoff’s Generative Theory of Tonal Music. In DavidMeredith, editor, Computational Music Analysis, pages 221–249. Springer International
176

BIBLIOGRAPHY
Publishing, Cham, 2016. ISBN 978-3-319-25931-4. doi: 10.1007/978-3-319-25931-4_9.URL https://doi.org/10.1007/978-3-319-25931-4_9.
[105] Andrew Hankinson. Optical music recognition infrastructure for large-scale music docu-ment analysis. PhD Thesis, McGill University, 2014. URL http://digitool.library.mcgill.ca/webclient/DeliveryManager?pid=130291.
[106] Andrew Hankinson and Ichiro Fujinaga. SIMSSA: Single Interface for Music ScoreSearching and Analysis. In Conference of the International Association of Music Libraries,Montréal, QC, 2012. URL https://www.iaml.info/sites/default/files/pdf/20120711a_montreal_programme.pdf.
[107] Andrew Hankinson, Wendy Liu, Laurent Pugin, and Ichiro Fujinaga. Diva. js: A continuousdocument viewing interface. Code4Lib Journal, (14), 2011.
[108] Andrew Hankinson, John Ashley Burgoyne, Gabriel Vigliensoni, and Ichiro Fujinaga. Cre-ating a Large-scale Searchable Digital Collection from Printed Music Materials. In 21stInternational Conference on World Wide Web, pages 903–908, Lyon, France, 2012. ACM.ISBN 978-1-4503-1230-1. doi: 10.1145/2187980.2188221.
[109] Andrew Hankinson, John Ashley Burgoyne, Gabriel Vigliensoni, Alastair Porter, JessicaThompson, Wendy Liu, Remi Chiu, and Ichiro Fujinaga. Digital Document Image Re-trieval Using Optical Music Recognition. In Fabien Gouyon, Perfecto Herrera, Luis Gus-tavo Martins, and Meinard Müller, editors, 13th International Society for Music Informa-tion Retrieval Conference, pages 577–582, 2012. URL http://ismir2012.ismir.net/event/papers/577-ismir-2012.pdf.
[110] Andrew Hankinson, Wendy Liu, Laurent Pugin, and Ichiro Fujinaga. Diva: a web-basedhigh-resolution digital document viewer. In International Conference on Theory and Practiceof Digital Libraries, pages 455–460. Springer, 2012.
[111] Alexander Hartelt. Segmentierung von Notenlinien auf historischen Dokumenten. Master’sthesis, University of Würzburg, Würzburg, April 2019.
[112] Andreas Haug and Frank Puppe. Corpus monodicum, December 2019. URL http://www.musikwissenschaft.uni-wuerzburg.de/forschung/corpus-monodicum/.
[113] Andreas Haug, Isabel Kraft, and Hanna Zühlke. Tropen zu den Antiphonen der Messe ausQuellen deutscher Herkunft. Corpus Monodicum. Die einstimmige Musik des lateinischenMittelalters. Schwabe Verlag, Basel, 2019.
[114] Kate Helsen, Jennifer Bain, Ichiro Fujinaga, Andrew Hankinson, and Debra Lacoste. Op-tical music recognition and manuscript chant sources. Early Music, 42(4):555–558, 2014.doi: 10.1093/em/cau092.
[115] Steven L. Hensen. Primary sources, research, and the Internet: The digital scriptorium atDuke. First Monday, 2(9), 1997.
177

BIBLIOGRAPHY
[116] Elaine Stratton Hild. Tropen zu den Antiphonen der Messe aus Quellen französischerHerkunft. Corpus Monodicum. Die einstimmige Musik des lateinischen Mittelalters.Schwabe Verlag, Basel, 2016.
[117] Phillip Isola, Jun-Yan Zhu, Tinghui Zhou, and Alexei A. Efros. Image-to-image translationwith conditional adversarial networks. In Proceedings of the IEEE Conference on ComputerVision and Pattern Recognition, pages 1125–1134, 2017.
[118] David J. Ittner and Henry S. Baird. Language-free layout analysis. In Proceedings of 2ndInternational Conference on Document Analysis and Recognition (ICDAR’93), pages 336–340. IEEE, 1993.
[119] José M. Iñesta, David Rizo, and Jorge Calvo-Zaragoza. MuRET as a software for the tran-scription of historical archives. In Jorge Calvo-Zaragoza and Alexander Pacha, editors, 2ndInternational Workshop on Reading Music Systems, pages 12–15, Delft, The Netherlands,2019. URL https://sites.google.com/view/worms2019/proceedings.
[120] Berit Janssen, Peter van Kranenburg, and Anja Volk. Finding Occurrences of MelodicSegments in Folk Songs Employing Symbolic Similarity Measures. Journal of New MusicResearch, 46(2):118–134, April 2017. ISSN 0929-8215. doi: 10.1080/09298215.2017.1316292. URL https://doi.org/10.1080/09298215.2017.1316292.
[121] Frederick Jelinek. Statistical methods for speech recognition. MIT press, 1997.
[122] K. V. Jobin and C. V. Jawahar. Document Image Segmentation Using Deep Features. InRenu Rameshan, Chetan Arora, and Sumantra Dutta Roy, editors, Computer Vision, PatternRecognition, Image Processing, and Graphics, pages 372–382, Singapore, 2018. SpringerSingapore. ISBN 978-981-13-0020-2.
[123] Emily G. Johnston. Printed Text Discrimination. Computer Graphics and Image Processing,3(1):83–89, March 1974. ISSN 0146-664X. doi: 10.1016/0146-664X(74)90012-4. URLhttp://www.sciencedirect.com/science/article/pii/0146664X74900124.
[124] Hirokazu Kato and Seiji Inokuchi. A Recognition System for Printed Piano MusicUsing Musical Knowledge and Constraints. In Structured Document Image Analysis,pages 435–455. Springer Berlin Heidelberg, Berlin, Heidelberg, 1992. ISBN 978-3-642-77281-8. doi: 10.1007/978-3-642-77281-8_20. URL https://doi.org/10.1007/978-3-642-77281-8_20.
[125] Klaus Keil and Jennifer A. Ward. Applications of RISM data in digital libraries and digitalmusicology. International Journal on Digital Libraries, 20(1):3–12, 2019.
[126] Hideki Kenmochi and Hayato Ohshita. Vocaloid-commercial singing synthesizer based onsample concatenation. In Eighth Annual Conference of the International Speech Communi-cation Association, 2007.
[127] Benjamin Kiessling. Kraken - an Universal Text Recognizer for the Humanities. DH 2019Digital Humanities, 2019.
178

BIBLIOGRAPHY
[128] Benjamin Kiessling, Matthew Thomas Miller, G. Maxim, Sarah Bowen Savant, and others.Important New Developments in Arabographic Optical Character Recognition (OCR). Al-ʿUṣūr al-Wusṭā, 25:1–13, 2017.
[129] Aishik Konwer, Ayan Kumar Bhunia, Abir Bhowmick, Ankan Kumar Bhunia, PrithajBanerjee, Partha Pratim Roy, and Umapada Pal. Staff line removal using generative ad-versarial networks. In 2018 24th International Conference on Pattern Recognition (ICPR),pages 1103–1108. IEEE, 2018.
[130] Mukkai Krishnamoorthy, George Nagy, Sharad Seth, and Mahesh Viswanathan. Syntacticsegmentation and labeling of digitized pages from technical journals. IEEE Transactions onPattern Analysis and Machine Intelligence, 15(7):737–747, 1993.
[131] Victor Lavrenko, Toni M. Rath, and Raghavan Manmatha. Holistic Word Recognition forHandwritten Historical Documents. In Proceedings of the International Workshop on Doc-ument Image Analysis for Libraries (DIAL), pages 278–287, 2004.
[132] Frank Lebourgeois, Z. Bublinski, and H. Emptoz. A fast and efficient method for extract-ing text paragraphs and graphics from unconstrained documents. In Proceedings of the 11thIAPR International Conference on Pattern Recognition. Vol. II. Conference B: Pattern Recog-nition Methodology and Systems, pages 272–276. IEEE, 1992.
[133] Christian Ledig, Lucas Theis, Ferenc Huszár, Jose Caballero, Andrew Cunningham, Ale-jandro Acosta, Andrew Aitken, Alykhan Tejani, Johannes Totz, and Zehan Wang. Photo-realistic single image super-resolution using a generative adversarial network. In Proceed-ings of the IEEE Conference on Computer Vision and Pattern Recognition, pages 4681–4690,2017.
[134] Chen-Yu Lee and Simon Osindero. Recursive Recurrent Nets With Atten-tion Modeling for OCR in the Wild. In Proceedings of the IEEE Conferenceon Computer Vision and Pattern Recognition, pages 2231–2239, 2016. URLhttp://openaccess.thecvf.com/content_cvpr_2016/html/Lee_Recursive_Recurrent_Nets_CVPR_2016_paper.html.
[135] Qizhu Li, Anurag Arnab, and Philip HS Torr. Weakly-and semi-supervised panoptic seg-mentation. In Proceedings of the European Conference on Computer Vision (ECCV), pages102–118, 2018.
[136] Wei Liu, Dragomir Anguelov, Dumitru Erhan, Christian Szegedy, Scott Reed, Cheng-YangFu, and Alexander C. Berg. SSD: Single shot multibox detector. In European Conferenceon Computer Vision, pages 21–37. Springer, 2016.
[137] Weibo Liu, Zidong Wang, Xiaohui Liu, Nianyin Zeng, Yurong Liu, and Fuad E. Alsaadi.A survey of deep neural network architectures and their applications. Neurocomputing, 234:11–26, April 2017. ISSN 0925-2312. doi: 10.1016/j.neucom.2016.12.038. URL http://www.sciencedirect.com/science/article/pii/S0925231216315533.
179

BIBLIOGRAPHY
[138] Jonathan Long, Evan Shelhamer, and Trevor Darrell. Fully Convolutional Networksfor Semantic Segmentation. In Proceedings of the IEEE Conference on Computer Vi-sion and Pattern Recognition (CVPR), 2015. URL https://www.cv-foundation.org/openaccess/content_cvpr_2015/html/Long_Fully_Convolutional_Networks_2015_CVPR_paper.html.
[139] Pauline Luc, Camille Couprie, Soumith Chintala, and Jakob Verbeek. Semantic segmenta-tion using adversarial networks. arXiv preprint arXiv:1611.08408, 2016.
[140] Karl MacMillan, Michael Droettboom, and Ichiro Fujinaga. Gamera: A structured doc-ument recognition application development environment. In 2nd International Sympo-sium on Music Information Retrieval, pages 15–16, Bloomington, IN, 2001. URL https://jscholarship.library.jhu.edu/handle/1774.2/44376.
[141] Karl MacMillan, Michael Droettboom, and Ichiro Fujinaga. Gamera: Optical music recog-nition in a new shell. In International Computer Music Conference, pages 482–485, 2002.URL http://www.music.mcgill.ca/ich/research/icmc02/icmc2002.gamera.pdf.
[142] Song Mao, Azriel Rosenfeld, and Tapas Kanungo. Document structure analysis algorithms:a literature survey. In Document Recognition and Retrieval X, volume 5010, pages 197–207.International Society for Optics and Photonics, 2003.
[143] Dirk Merkel. Docker: lightweight linux containers for consistent development and deploy-ment. Linux Journal, 2014(239):2, 2014.
[144] Hidetoshi Miyao. Stave extraction for printed music scores using DP matching. Journal ofAdvanced Computational Intelligence and Intelligent Informatics, 8(2):208–215, 2004.
[145] Bharath R. Modayur, Visvanathan Ramesh, Robert M. Haralick, and Linda G. Shapiro.MUSER: A prototype musical score recognition system using mathematical morphology.Machine Vision and Applications, 6(2):140–150, 1993. ISSN 1432-1769. doi: 10.1007/BF01211937.
[146] Marcel Mongeau and David Sankoff. Comparison of musical sequences. Computers and theHumanities, 24(3):161–175, 1990.
[147] Igor dos Santos Montagner, Nina S.T. Hirata, and Roberto Jr. Hirata. Staff removal usingimage operator learning. Pattern Recognition, 63:310–320, 2017. ISSN 0031-3203. doi:10.1016/j.patcog.2016.10.002.
[148] Benedikt Morschheuser, Juho Hamari, and Jonna Koivisto. Gamification in Crowdsourcing:A Review. In 2016 49th Hawaii International Conference on System Sciences (HICSS), pages4375–4384, January 2016. doi: 10.1109/HICSS.2016.543. ISSN: 1530-1605.
[149] George Nagy and Sharad C. Seth. Hierarchical representation of optically scanned docu-ments. In Proceedings of the IEEE 7th ICPR, Montreal, Canada, 1984.
180

BIBLIOGRAPHY
[150] George Nagy, Sharad Seth, andMahesh Viswanathan. A prototype document image analysissystem for technical journals. Computer, 25(7):10–22, 1992.
[151] Anoop M. Namboodiri and Anil K. Jain. Document structure and layout analysis. In DigitalDocument Processing, pages 29–48. Springer, 2007.
[152] Saul B. Needleman and Christian D. Wunsch. A general method applicable to the searchfor similarities in the amino acid sequence of two proteins. Journal of Molecular Biology,48(3):443–453, 1970.
[153] Diego Nehab. Staff Line Detection by Skewed Projection. Techni-cal report, 2003. URL https://pdfs.semanticscholar.org/142c/dc7231a7a8093fd2da6f293a36862e592733.pdf.
[154] VoQuangNhat andGueeSang Lee. Adaptive Line Fitting for StaffDetection in HandwrittenMusic Score Images. In 8th International Conference onUbiquitous InformationManagementand Communication, pages 991–996, Siem Reap, Cambodia, 2014. ACM. ISBN 978-1-4503-2644-5. doi: 10.1145/2557977.2558057.
[155] H. Noh, S. Hong, and B. Han. Learning DeconvolutionNetwork for Semantic Segmentation.In 2015 IEEE Int. Conf. on Computer Vision (ICCV), pages 1520–1528, 2015. doi: 10.1109/ICCV.2015.178.
[156] Lawrence O’Gorman. The document spectrum for page layout analysis. IEEE Transactionson Pattern Analysis and Machine Intelligence, 15(11):1162–1173, 1993.
[157] Alexander Pacha and Jorge Calvo-Zaragoza. Optical Music Recognition in Mensural No-tation with Region-Based Convolutional Neural Networks. In 19th International Societyfor Music Information Retrieval Conference, pages 240–247, Paris, France, 2018. ISBN978-2-9540351-2-3. URL http://ismir2018.ircam.fr/doc/pdfs/32_Paper.pdf.
[158] Alexander Pacha, Kwon-Young Choi, Bertrand Coüasnon, Yann Ricquebourg, RichardZanibbi, and Horst Eidenberger. Handwritten Music Object Detection: Open Issues andBaseline Results. In 13th International Workshop on Document Analysis Systems, pages163–168, 2018. doi: 10.1109/DAS.2018.51.
[159] Alexander Pacha, Jan Hajič jr., and Jorge Calvo-Zaragoza. A Baseline for General MusicObject Detection with Deep Learning. Applied Sciences, 8(9):1488–1508, 2018. ISSN2076-3417. doi: 10.3390/app8091488. URL http://www.mdpi.com/2076-3417/8/9/1488.
[160] Alexander Pacha, Jorge Calvo-Zaragoza, and Jan Hajič jr. Learning Notation Graph Con-struction for Full-Pipeline Optical Music Recognition. In 20th International Society forMusic Information Retrieval Conference (in press), 2019.
[161] George Papandreou, Liang-Chieh Chen, Kevin P. Murphy, and Alan L. Yuille. Weakly- andsemi-supervised learning of a deep convolutional network for semantic image segmentation.
181

BIBLIOGRAPHY
In Proceedings of the IEEE International Conference on Computer Vision, pages 1742–1750,2015.
[162] Adam Paszke, Sam Gross, Soumith Chintala, Gregory Chanan, Edward Yang, Zachary De-Vito, Zeming Lin, Alban Desmaison, Luca Antiga, and Adam Lerer. Automatic differ-entiation in PyTorch. In 31st Conference on Neural Information Processing Systems, LongBeach, CA, USA, 2017. URL https://openreview.net/pdf?id=BJJsrmfCZ.
[163] Theo Pavlidis and Jiangying Zhou. Page segmentation and classification. CVGIP: GraphicalModels and Image Processing, 54(6):484–496, 1992.
[164] João Caldas Pinto, Pedro Vieira, M. Ramalho, M.Mengucci, P. Pina, and F. Muge. AncientMusic Recovery for Digital Libraries. In José Borbinha and Thomas Baker, editors, Researchand Advanced Technology for Digital Libraries, pages 24–34, Berlin, Heidelberg, 2000.Springer Berlin Heidelberg. ISBN 978-3-540-45268-3. doi: 10.1007/3-540-45268-0_3.
[165] David S. Prerau. Computer pattern recognition of standard engraved music notation. PhDThesis, Massachusetts Institute of Technology, 1970.
[166] Laurent Pugin. Aruspix: an Automatic Source-Comparison System. Computing in Mu-sicology, 14:49–59, 2006. ISSN 1057-9478. URL https://dialnet.unirioja.es/servlet/articulo?codigo=3476563.
[167] Laurent Pugin. Optical Music Recognitoin of Early Typographic Prints using Hid-den Markov Models. In 7th International Conference on Music Information Retrieval,pages 53–56, Victoria, Canada, 2006. URL http://ismir2006.ismir.net/PAPERS/ISMIR06152_Paper.pdf.
[168] Laurent Pugin, John Ashley Burgoyne, and Ichiro Fujinaga. Goal-directed Evaluation forthe Improvement of Optical Music Recognition on Early Music Prints. In 7th ACM/IEEE-CS Joint Conference on Digital Libraries, pages 303–304, Vancouver, Canada, 2007. ACM.ISBN 978-1-59593-644-8. doi: 10.1145/1255175.1255233.
[169] Laurent Pugin, Jason Hockman, John Ashley Burgoyne, and Ichiro Fujinaga. Gamera versusAruspix – Two Optical Music Recognition Approaches. In 9th International Conferenceon Music Information Retrieval, 2008. URL http://ismir2008.ismir.net/papers/ISMIR2008_247.pdf.
[170] Laurent Pugin, Rodolfo Zitellini, and Perry Roland. Verovio: A library for Engraving MEIMusic Notation into SVG. In Proceedings of the 15th International Society for Music Infor-mation Retrieval Conference, pages 107–112, 2014.
[171] Carolina Ramirez and Jun Ohya. Automatic Recognition of Square Notation Symbols inWestern Plainchant Manuscripts. Journal of New Music Research, 43(4):390–399, 2014.ISSN 0929-8215. doi: 10.1080/09298215.2014.931438.
182

BIBLIOGRAPHY
[172] Ana Rebelo and Jamie dos Santos Cardoso. Staff Line Detection and Removal in theGrayscale Domain. In 12th International Conference on Document Analysis and Recog-nition, pages 57–61, 2013. doi: 10.1109/ICDAR.2013.20.
[173] Ana Rebelo, Artur Capela, Joaquim F. Pinto da Costa, Carlos Guedes, Eurico Carrapatoso,and Jamie dos Santos Cardoso. A Shortest Path Approach for Staff Line Detection. In 3rdInternational Conference on Automated Production of CrossMedia Content forMulti-ChannelDistribution, pages 79–85, 2007. doi: 10.1109/AXMEDIS.2007.16.
[174] Ana Rebelo, Ichiro Fujinaga, Filipe Paszkiewicz, Andre R. S. Marcal, Carlos Guedes, andJamie dos Santos Cardoso. Optical music recognition: state-of-the-art and open issues.International Journal of Multimedia Information Retrieval, 1(3):173–190, 2012. doi: 10.1007/s13735-012-0004-6.
[175] K. Todd Reed and J. R. Parker. Automatic Computer Recognition of Printed Music. In13th International Conference on Pattern Recognition, pages 803–807, 1996. ISBN 0-8186-7282-X. doi: 10.1109/ICPR.1996.547279.
[176] Juliette Regimbal, Zoé McLennan, Gabriel Vigliensoni, Andrew Tran, and Ichiro Fujinaga.Neon2: A Verovio-based square-notation editor. In Music Encoding Conference, 2019.
[177] Shaoqing Ren, Kaiming He, Ross Girshick, and Jian Sun. Faster r-cnn: Towards real-time object detection with region proposal networks. In Advances in Neural InformationProcessing Systems, pages 91–99, 2015.
[178] Christian Reul, Uwe Springmann, Christoph Wick, and Frank Puppe. Improving OCRAccuracy on Early Printed Books by utilizing Cross Fold Training and Voting. In 2018 13thIAPR International Workshop on Document Analysis Systems (DAS), pages 423–428. IEEE,2018.
[179] Christian Reul, Dennis Christ, Alexander Hartelt, Nico Balbach, Maximilian Wehner, UweSpringmann, Christoph Wick, Christine Grundig, Andreas Büttner, and Frank Puppe.OCR4all—An Open-Source Tool Providing a (Semi-)Automatic OCR Workflow for His-torical Printings. Applied Sciences, 9(22):4853, January 2019. doi: 10.3390/app9224853.URL https://www.mdpi.com/2076-3417/9/22/4853.
[180] Christian Reul, Sebastian Göttel, Uwe Springmann, Christoph Wick, Kay-MichaelWürzner, and Frank Puppe. Automatic Semantic Text Tagging on Historical Lexica byCombining OCR and Typography Classification. Proceedings of the 3rd International Con-ference on Digital Access to Textual Cultural Heritage, 2019.
[181] RISM. Répertoire international des sources musicales (RISM). Single Prints Before 1800.Series A/I. Bärenreiter, Kassel, 1971.
[182] David Rizo. Symbolic music comparison with tree data structures. PhD Thesis, Universidadde Alicante, 2010. URL http://rua.ua.es/dspace/bitstream/10045/18331/1/Tesis_Rizo.pdf.
183

BIBLIOGRAPHY
[183] David Rizo, Jorge Calvo-Zaragoza, and José M. Iñesta. MuRET: A Music Recognition,Encoding, and Transcription Tool. In 5th International Conference on Digital Libraries forMusicology, pages 52–56, Paris, France, 2018. ACM. ISBN 978-1-4503-6522-2. doi: 10.1145/3273024.3273029. URL http://doi.acm.org/10.1145/3273024.3273029.
[184] John W. Roach and Joseph E. Tatem. Using domain knowledge in low-level visual pro-cessing to interpret handwritten music: an experiment. Pattern Recognition, 21(1):33–44, 1988. ISSN 0031-3203. doi: 10.1016/0031-3203(88)90069-6. URL http://www.sciencedirect.com/science/article/pii/0031320388900696.
[185] Curtis Roads and Paul Wieneke. Grammars as representations for music. Computer MusicJournal, 3(1):48–55, 1979.
[186] Perry Roland. The music encoding initiative (MEI). In 1st International Confer-ence on Musical Applications Using XML, pages 55–59, 2002. URL https://pdfs.semanticscholar.org/7fc4/16754b0508837dde8b505b3fd4dc517c7292.pdf.
[187] Olaf Ronneberger, Philipp Fischer, and Thomas Brox. U-Net: Convolutional Networks forBiomedical Image Segmentation. In Nassir Navab, Joachim Hornegger, William M. Wells,and Alejandro F. Frangi, editors, Medical Image Computing and Computer-Assisted Inter-vention – MICCAI 2015: 18th Int. Conf., Munich, Germany, October 5-9, 2015, Proceedings,Part III, pages 234–241. Springer Int. Publishing, Cham, 2015. ISBN 978-3-319-24574-4.doi: 10.1007/978-3-319-24574-4_28.
[188] Martin Roth. An approach to recognition of printed music. Technical report, Swiss FederalInstitute of Technology, 1994.
[189] Takashi Saitoh, Toshifumi Yamaai, and Michiyoshi Tachikawa. Document image segmen-tation and layout analysis. IEICE transactions on information and systems, 77(7):778–784,1994.
[190] Zeyad Saleh, Ke Zhang, Jorge Calvo-Zaragoza, Gabriel Vigliensoni, and Ichiro Fujinaga.Pixel.js: Web-Based Pixel Classification Correction Platform for Ground Truth Creation. In14th International Conference on Document Analysis and Recognition, pages 39–40, Kyoto,Japan, 2017. doi: 10.1109/ICDAR.2017.267.
[191] Anikó Simon, J.-C. Pret, and A. Peter Johnson. A fast algorithm for bottom-up documentlayout analysis. IEEE Transactions on Pattern Analysis and Machine Intelligence, 19(3):273–277, 1997.
[192] Ray Smith. An overview of the Tesseract OCR engine. In Ninth International Conference onDocument Analysis and Recognition (ICDAR 2007), volume 2, pages 629–633. IEEE, 2007.
[193] William Song and Jim Cai. End-to-end deep neural network for automatic speech recogni-tion. Standford CS224D Reports, 2015.
184

BIBLIOGRAPHY
[194] K. I. M. Soo-Hyung, S. O. N. Hwa-Jeong, O. H. Sung-Ryul, L. E. E. Chil-Woo, and O. H.Il-Seok. Staff-Line Detection and Removal Algorithm for a Camera-Based Recognitionof Music Score Images. IEICE technical report, 107(281):141–147, October 2007. ISSN09135685. URL https://ci.nii.ac.jp/naid/110006453453/.
[195] M. Sotoodeh and F. Tajeripour. Staff detection and removal using derivation and con-nected component analysis. In The 16th CSI International Symposium on Artificial Intelli-gence and Signal Processing (AISP 2012), pages 054–057, May 2012. doi: 10.1109/AISP.2012.6313717.
[196] Nasim Souly, Concetto Spampinato, and Mubarak Shah. Semi and weakly super-vised semantic segmentation using generative adversarial network. arXiv preprintarXiv:1703.09695, 2017.
[197] Bolan Su, Shijian Lu, Umapada Pal, and Chew Lim Tan. An effective staff detection andremoval technique for musical documents. In 10th International Workshop on DocumentAnalysis Systems, pages 160–164. IEEE, 2012. ISBN 978-0-7695-4661-2. doi: 10.1109/DAS.2012.16.
[198] Ilya Sutskever, Oriol Vinyals, and Quoc V. Le. Sequence to sequence learning with neuralnetworks. In Advances in Neural Information Processing Systems, pages 3104–3112, 2014.
[199] Mariusz Szwoch. A Robust Detector for Distorted Music Staves. In André Gagalowicz andWilfried Philips, editors, Computer Analysis of Images and Patterns, pages 701–708, Berlin,Heidelberg, 2005. Springer Berlin Heidelberg. ISBN 978-3-540-32011-1. doi: 10.1007/11556121_86.
[200] Yuan Yan Tang, Chang De Yan, and Ching Y. Suen. Document processing for automaticknowledge acquisition. IEEE Transactions on Knowledge & Data Engineering, (1):3–21,1994.
[201] The Humdrum Toolkit. **kern. URL https://www.humdrum.org/rep/kern/.
[202] TheMuseScore developer community. MuseScore sheet music archive, 2019. URL https://musescore.org/en.
[203] Radu Timofte and Luc Van Gool. Automatic Stave Discovery for Musical Facsimiles. InKyoung Mu Lee, Yasuyuki Matsushita, James M. Rehg, and Zhanyi Hu, editors, ComputerVision – ACCV 2012, pages 510–523, Berlin, Heidelberg, 2013. Springer Berlin Heidelberg.ISBN 978-3-642-37447-0. doi: 10.1007/978-3-642-37447-0_39.
[204] Shuichi Tsujimoto and Haruo Asada. Major components of a complete text reading system.Proceedings of the IEEE, 80(7):1133–1149, 1992.
[205] John Hopkins University. The Lester S. Levy Music Collection, 2018. URL http://levysheetmusic.mse.jhu.edu/.
185

BIBLIOGRAPHY
[206] Stefan Van Der Walt, S. Chris Colbert, and Gael Varoquaux. The NumPy array: a structurefor efficient numerical computation. Computing in Science & Engineering, 13(2):22, 2011.
[207] Eelco van der Wel and Karen Ullrich. Optical Music Recognition with ConvolutionalSequence-to-Sequence Models. In 18th International Society for Music Information Re-trieval Conference, pages 731–737, Suzhou, China, 2017. ISBN 978-981-11-5179-8. URLhttps://archives.ismir.net/ismir2017/paper/000069.pdf.
[208] Gabriel Vigliensoni, John Ashley Burgoyne, Andrew Hankinson, and Ichiro Fujinaga. Au-tomatic pitch recognition in printed square-note notation. In Proceedings of the 12th Inter-national Society for Music Information Retrieval Conference, 2011.
[209] Gabriel Vigliensoni, Gregory Burlet, and Ichiro Fujinaga. Optical measure recognition incommon music notation. In 14th International Society for Music Information Retrieval Con-ference, Curitiba, Brazil, 2013. URL http://ismir2013.ismir.net/wp-content/uploads/2013/09/207_Paper.pdf.
[210] Gabriel Vigliensoni, Jorge Calvo-Zaragoza, and Ichiro Fujinaga. Developing an environmentfor teaching computers to read music. In Jorge Calvo-Zaragoza, Jan Hajič jr., and AlexanderPacha, editors, 1st International Workshop on Reading Music Systems, pages 27–28, Paris,France, 2018. URL https://sites.google.com/view/worms2018/proceedings.
[211] Gabriel Vigliensoni, Jorge Calvo-Zaragoza, and Ichiro Fujinaga. An Environment for Ma-chine Pedagogy: Learning How to Teach Computers to Read Music. In IUI Workshops,2018.
[212] Gabriel Vigliensoni, Alex Daigle, Eric Liu, Jorge Calvo-Zaragoza, Juliette Regimbal,Minh Anh Nguyen, Noah Baxter, Zoé McLennan, and Ichiro Fujinaga. From image toencoding: Full optical music recognition of Medieval and Renaissance music. InMusic En-coding Conference, 2019. URL https://music-encoding.org/conference/2019/abstracts_mec2019/vigliensoni19from%20camera%20ready.pdf.
[213] Gabriel Vigliensoni, Alex Daigle, Eric Lui, Jorge Calvo-Zaragoza, Juliette Regimbal,Minh Anh Nguyen, Noah Baxter, Zoe McLennan, and Ichiro Fujinaga. Overcomingthe Challenges of Optical Music Recognition of Early Music with Machine Learning. InDH2019, 2019.
[214] Muriel Visaniy, V. C. Kieu, Alicia Fornés, and Nicholas Journet. The ICDAR 2013 MusicScores Competition: Staff Removal. In 12th International Conference on Document Analysisand Recognition, pages 1407–1411, 2013. doi: 10.1109/ICDAR.2013.284.
[215] Athanasios Voulodimos, Nikolaos Doulamis, Anastasios Doulamis, and Eftychios Protopa-padakis. Deep Learning for Computer Vision: A Brief Review, 2018. URL https://www.hindawi.com/journals/cin/2018/7068349/.
[216] Yunchao Wei, Huaxin Xiao, Honghui Shi, Zequn Jie, Jiashi Feng, and Thomas S.Huang. Revisiting Dilated Convolution: A Simple Approach for Weakly- and
186

BIBLIOGRAPHY
Semi-Supervised Semantic Segmentation. In Proceedings of the IEEE Confer-ence on Computer Vision and Pattern Recognition, pages 7268–7277, 2018. URLhttp://openaccess.thecvf.com/content_cvpr_2018/html/Wei_Revisiting_Dilated_Convolution_CVPR_2018_paper.html.
[217] Christoph Wick. Deep learning. Informatik-Spektrum, 40(1):103–107, 2017.
[218] Christoph Wick and Frank Puppe. Leaf Identification Using a Deep Convolutional Neu-ral Network. arXiv preprint arXiv:1712.00967, 2017. URL https://arxiv.org/abs/1712.00967.
[219] Christoph Wick and Frank Puppe. Fully Convolutional Neural Networks for Page Segmen-tation of Historical Document Images. In 2018 13th IAPR International Workshop on Doc-ument Analysis Systems (DAS), pages 287–292, Vienna, 2018. doi: 10.1109/DAS.2018.39.URL https://ieeexplore.ieee.org/document/8395210.
[220] Christoph Wick and Frank Puppe. OMMR4all — a Semiautomatic Online Editor forMedieval Music Notations. In Jorge Calvo-Zaragoza and Alexander Pacha, editors, Pro-ceedings of the 2nd International Workshop on Reading Music Systems, pages 31–34,Delft, The Netherlands, 2019. URL https://sites.google.com/view/worms2019/proceedings.
[221] Christoph Wick and Frank Puppe. Automatic Neume Transcription of Medieval Mu-sic Manuscripts using CNN/LSTM-Networks and the segmentation-free CTC-Algorithm.Journal of New Music Research, 2020. submitted to.
[222] ChristophWick and Frank Puppe. Lyrics Recognition and Syllable Assignment ofMedievalManuscripts. In 20th International Conference on Frontiers in Handwriting Recognition,Dortmund, 2020. submitted to.
[223] ChristophWick, Christian Reul, and Frank Puppe. Comparison of OCR Accuracy on EarlyPrinted Books using the Open Source Engines Calamari and OCRopus. JLCL: Special Issueon Automatic Text and Layout Recognition, 33(1):79–96, 2018. URL https://jlcl.org/content/2-allissues/1-heft1-2018/jlcl_2018-1_4.pdf.
[224] Christoph Wick, Alexander Hartelt, and Frank Puppe. Staff, Symbol and Melody Detec-tion of Medieval Manuscripts Written in Square Notation Using Deep Fully ConvolutionalNetworks. Applied Sciences, 9(13):2646, 2019.
[225] Christoph Wick, Alexander Hartelt, and Frank Puppe. OMMR4all - ein semiau-tomatischer Online-Editor für mittelalterliche Musiknotationen. In Digital Humanitiesim deutschsprachigen Raum, 2020. URL https://zenodo.org/record/3666690#.XlAmeWhKhPY.
[226] Christoph Wick, Christian Reul, and Frank Puppe. Calamari - A High-PerformanceTensorflow-based Deep Learning Package for Optical Character Recognition. Digital Hu-manities Quarterly, 14(1), 2020.
187

BIBLIOGRAPHY
[227] Kwan Y.Wong, Richard G. Casey, and Friedrich M.Wahl. Document analysis system. IBMJournal of Research and Development, 26(6):647–656, 1982.
[228] M. Wüthrich, M. Liwicki, A. Fischer, E. Indermühle, H. Bunke, G. Viehhauser, andM. Stolz. Language Model Integration for the Recognition of Handwritten Medieval Docu-ments. In 2009 10th International Conference on Document Analysis and Recognition, pages211–215, 2009. doi: 10.1109/ICDAR.2009.17.
[229] Xiao Yang, Ersin Yumer, Paul Asente, Mike Kraley, Daniel Kifer, and C. Lee Giles. Learn-ing to Extract Semantic Structure from Documents Using Multimodal Fully ConvolutionalNeural Network. In Proceedings of the IEEE Conference on Computer Vision and PatternRecognition, pages 5315–5324, 2017.
[230] Yin-xian Yang and Ding-li Yang. Staff line detection and revision algorithm based onsubsection projection and correlation algorithm. In Fifth International Conference on Ma-chine Vision (ICMV 2012): Algorithms, Pattern Recognition, and Basic Technologies, vol-ume 8784, page 87842P. International Society for Optics and Photonics, March 2013. doi:10.1117/12.2021234.
[231] Hui Zhang, Hongxi Wei, Feilong Bao, and Guanglai Gao. Segmentation-Free Printed Tra-ditional Mongolian OCR Using Sequence to Sequence with Attention Model. In 2017 14thIAPR International Conference on Document Analysis and Recognition (ICDAR), volume 01,pages 585–590, November 2017. doi: 10.1109/ICDAR.2017.101. ISSN: 2379-2140.
[232] Yu Zhang, William Chan, and Navdeep Jaitly. Very deep convolutional networks for end-to-end speech recognition. In 2017 IEEE International Conference on Acoustics, Speech andSignal Processing (ICASSP), pages 4845–4849. IEEE, 2017.
188