Contributor Turnover in Libre Software Projects - CiteSeerX
14
Contributor Turnover in Libre Software Projects Gregorio Robles and Jesus M. Gonzalez-Barahona GSyC/LibreSoft, Universidad Rey Juan Carlos, Spain {grex,jgbJQgsyc. escet . ur j c. es Abstract. A common problem that management faces in software companies is the high instability of their staff. In libre (free, open source) software projects, the permanence of developers is also an open issue, with the potential of causing problems amplified by the self-organizing nature that most of them exhibit. Hence, human resources in libre soft- ware projects are even more difficult to manage: developers are in most cases not bound by a contract and, in addition, there is not a real management structure concerned about this problem. This raises some interesting questions with respect to the composition of development teams in libre software projects, and how they evolve over time. There are projects lead by their original founders (some sort of "code gods"), while others are driven by several different developer groups over time (i.e. the project "regenerates" itself). In this paper, we propose a quan- titative methodology, based on the analysis of the activity in the source code management repositories, to study how these processes (developers leaving, developers joining) affect libre software projects. The basis of it is the analysis of the composition of the core group, the group of de- velopers most active in a project, for several time lapses. We will apply this methodology to several large, well-known libre software projects, and show how it can be used to characterize them. In addition, we will discuss the lessons that can be learned, and the validity of our proposal. Keywords: open source, human resources, turnover, mining software repositories 1 Introduction Employee turnover (the ratio of the number of workers replaced in a given period to the average number of workers), is known to be high in the (proprietary) software industry [1]. In the libre software world^ the study of turnover has not been a research target (at least to the knowledge of the authors) profusely. Most of the attention has been focused on the organizational structure of the In this paper we will use the term "libre software" to refer to any software licensed under terms compliant with the FSF definition of "free software", and the OSI definition of "open source software", thus avoiding the controversy between those two terms. Please use the following format when citing this chapter: Robles, G., and Gonzalez-Barahona, J.M., 2006, in IFIP International Federation for Information Processing, Volume 203, Open Source Systems, eds. Damiani, E., Fitzgerald, B., Scacchi, W., Scotto, M., Succi, G., (Boston: Springer), pp. 273-286
-
Upload
khangminh22 -
Category
Documents
-
view
7 -
download
0
Transcript of Contributor Turnover in Libre Software Projects - CiteSeerX

Contributor Turnover in Libre Software Projects
Gregorio Robles and Jesus M. Gonzalez-Barahona
GSyC/LibreSoft, Universidad Rey Juan Carlos, Spain {grex,jgbJQgsyc.escet.urj c.es
Abstract. A common problem that management faces in software companies is the high instability of their staff. In libre (free, open source) software projects, the permanence of developers is also an open issue, with the potential of causing problems amplified by the self-organizing nature that most of them exhibit. Hence, human resources in libre software projects are even more difficult to manage: developers are in most cases not bound by a contract and, in addition, there is not a real management structure concerned about this problem. This raises some interesting questions with respect to the composition of development teams in libre software projects, and how they evolve over time. There are projects lead by their original founders (some sort of "code gods"), while others are driven by several different developer groups over time (i.e. the project "regenerates" itself). In this paper, we propose a quantitative methodology, based on the analysis of the activity in the source code management repositories, to study how these processes (developers leaving, developers joining) affect libre software projects. The basis of it is the analysis of the composition of the core group, the group of developers most active in a project, for several time lapses. We will apply this methodology to several large, well-known libre software projects, and show how it can be used to characterize them. In addition, we will discuss the lessons that can be learned, and the validity of our proposal. Keywords: open source, human resources, turnover, mining software repositories
1 Introduction
Employee turnover (the ratio of the number of workers replaced in a given period to the average number of workers), is known to be high in the (proprietary) software industry [1]. In the libre software world^ the study of turnover has not been a research target (at least to the knowledge of the authors) profusely. Most of the attention has been focused on the organizational structure of the
In this paper we will use the term "libre software" to refer to any software licensed under terms compliant with the FSF definition of "free software", and the OSI definition of "open source software", thus avoiding the controversy between those two terms.
Please use the following format when citing this chapter: Robles, G., and Gonzalez-Barahona, J.M., 2006, in IFIP International Federation for Information Processing, Volume 203, Open Source Systems, eds. Damiani, E., Fitzgerald, B., Scacchi, W., Scotto, M., Succi, G., (Boston: Springer), pp. 273-286

274 Gregorio Robles and Jesus M. Gonzalez-Barahona
projects, and how developers move to a central position in that structure, but not on how they are replaced when leave it.
In this line, probably the best known model about the organizational structure of Hbre software projects is the onion model [2, 3, 4], a visual analogy that represents how developers and users are positioned in communities. In this model, it is possible to differentiate among core developers (those who have a high involvement in the project), co-developers (with punctual, but frequent contributions), active users (that contribute only occasionally) and passive users [8, 7].
But the onion model provides only a static picture of a project, lacking the time dimension that is required for studying joining and leaving processes. Advancing to fill in this shortcoming, it has been complemented by Ye et al. with a more theoretical identification and description of the roles, including also some dynamism [11]. According to this refinement, a core developer is supposed to go through all the outlying roles, starting as a user, until she eventually reaches the core group. An alternative approach is proposed by Jensen and Scacchi [6], who have studied and modelled the processes of role migration for some libre software communities, focusing on end-users who become developers. They have found different paths for this process, concluding that the organizational structure of the studied projects is highly dynamic in comparison to traditional software development organizations.
With respect to abandonment, it is worth mentioning a study [9] which analyzes how many Debian developers leave the project, and how this affects it (i.e. what happens to those software packages that become unmaintained). The authors propose a half-Hfe parameter, defined as the time required for a certain group of contributors to fall to half of its initial population, which is of 7.5 years for the Debian project.
Given these precedents, the research goal for the study presented in this paper is to gain further understanding of the evolution of libre software developers, and especially of the "core group", those most active. Therefore, we will study the evolution over time of this core in some libre software projects. We consider at least two possible scenarios: one in which the first core group is highly stable and does not change over time, and one in which the core group "regenerates". This first case (which will be codenamed the code gods scenario) assumes that projects rely heavily on their initiators and that their absence would suppose a great loss for, if not the death of, the project. The second scenario assumes that as time passes, the core group changes its composition with some of the initial members leaving the project, but others joining and filling the gap. One of the main goals of this study is to find which of these two approaches is the most common in fibre software projects.
This paper is organized as follows. First, the methodology that has been used to extract information from source code management systems is described. The next section contains the results of applying the methodology to 21 large libre software projects. Finally, conclusions are drawn and some hints about further research are given.

Contributor Turnover in Libre Software Projects 275
2 Methodology
Our methodology is based on mining source code management system repositories, in our case the well-known and widely-used CVS systems. We analyze the log history of the versioning systems using CVSAnalY [10], a tool that retrieves the information related to every commit to the repository, and inserts it to a database where it can be conveniently analyzed.
To identify the "generations" of the core developers, we split the project life-time into ten equally large intervals, which means that intervals will be of different lengths depending on the project, but will have the same relative importance in the context of its history. Selected projects for this study are all at least three years old, and therefore the minimum length of the time interval is more than three months (which is considered to be significative enough, although further research should clarify if this is a correct assumption or not).
For each interval we consider the activity measured in terms of commits to the repository. The most active 20% of all commiters (rounded by excess) for that interval is what we consider the "core group". Therefore, for each project we identify ten different core groups, one per interval. Of course, the composition of the core group in each interval depends on the total number of commiters in that interval. If only 10 commiters participated in the first interval, the core group would be composed of two persons. If in the last interval the number of participants is 19 commiters, the core group would have 4 members. This means that the core group has always the same relative importance, despite the growth in number of developers in the project.
Some other possibilities for selecting the fraction of commiters that form a core groups, or the duration of the intervals could be considered. Using these other approaches would lead to different definitions of "core group" and "generation" . However, after experiencing with some of them (we tried with thresholds of 5% and 10%, and with 5 and 20 intervals), we have found that they do not give more insight.
The technique we use is based on visualizing the contribution of the core groups over time. We identify the core group in the first interval, and then plot its contribution not only for the first time interval, but also for all the others. After that, we go on with the core group that corresponds to the second interval, plotting the aggregate^d contribution of all of its members for all the intervals, and so on, until we have done that for the core groups in all the intervals. In the end, we obtain ten curves (one per core;group) which show the evolution of the contributions for all of them since the beginning to the end of the project.
To better understand the visual information that the plots provide, it is important to notice that core groups may have members in common. This is the case if a commiter is part of the most active 20% in several time intervals. This is not easy to identify at first sight, since we plot only the aggregated contribution of all the members of the core group. Though, in some cases, subsequent core groups will be composed by the same persons. In that case, this will be easy to identify visually, as the corresponding curves will have exactly the same shape.

276 Gregorio Robles and Jesus M. Gonzalez-Barahona
For each project, we will plot the resulting data in three different graphs, which differ in how the contribution of the various core groups (the vertical axis) is represented:
- Absolute graph. Displays the absolute number of commits by each core group (vertical axis) for each interval over time (horizontal axis).
- Aggregated graph. Displays the aggregated number of commits by each core group since the beginning of the project (vertical axis) vs. time (horizontal axis). This graph is the integral of the absolute graph.
- Fractional graph. Displays the fraction of the total commits performed by each core group for each interval (vertical axis) vs. time (horizontal axis). This graph provides the same information than the absolute graph, but normalized by the number of commits performed in each period.
From our experience the fractional plot is usually the better one to perform the generations analysis. Nonetheless, it should be compared to both the absolute and the aggregated graphs since, for instance, periods of little or a lot of activity cannot be identified in the fractional graph.
From the observation of the resulting graphs, it can be inferred whether the same core group rides the project from its beginning to current days or not.
3 Observations on some libre software projects
The 21 case studies shown in the next subsections will help us considering the convenience of this methodology. Among them, we have selected three examples to illustrate the study more in detail. Two of them can be considered as canonical patterns: no generations (The GIMP), and several generations over time (Mozilla). The third one (Evolution) shows results which cannot be assigned to the previous patterns. The rest of case examples, up to 18, will provide us with some evidence about the most frequent pattern found in large libre software projects.
3.1 Observations on The GIMP
The GIMP can be considered as a canonical example of a project with "code gods". Table 1 provides a small summary of the most important facts related to our analysis. The size of the code developed is over half a million lines of code, with an activity of more than 100,000 commits (which means that The GIMP is a very active project).
Although The GIMP started before December 1997 (which is why the date appears in brackets in table 1), it was only then when it was uploaded to the GNOME CVS repository, so we have only data from that moment onwards. The version 1.0 of The GIMP was released in June 1998, so we can consider it a stable project by that time. The length of the intervals in which we have divided the project is shghtly over half a year (7.5 months).

Contributor Turnover in Libre Software Projects 277
Project Size
Commits Start
Ver 1.0 Interval
Generations
The GIMP 557 K
125,590 (Dec 97)
Jun98 7.5 months
Code god
Table 1. Summary of the most important facts for The GIMP project
'^' \ /
Fig. 1. Right: Absolute graph for The GIMP project. Left: Aggregated graph for The GIMP project.
Figure 1 shows on the left the absolute graph of commits for each core group and for each interval. We can see that there are at least two groups (generations), as it seems that the core group in the beginnings is different from the ones found in the rest of the intervals. In any case, the members of these core groups do not all leave the project as their contribution in subsequent intervals is in the thousands.
A detailed study of the developers forming the core groups yields that one of the most active is present in all of them. The second and third most active developers enter during the third interval (which starts around mid-99) and stay in the project until today.
The plot on the right in figure 1 strengthens this perception. Here the commits performed by each core group are displayed as aggregated. Parallel curves are indicative of core groups for which the most contributing developers are the same. We can easily identify the first two core groups as their curve is below the rest of the curves for later intervals. On the other hand, the shape of the curves from the core group in the third interval onwards shows that they only differ in the number of members of the core group, which as we have seen is variable depending on the total number of contributors for a given interval.
The fractional graph, depicted in figure 2, gives further information. Now the vertical axis has been normaHzed to 100% of the total commits done in a given interval. By definition the maximum in each interval will correspond

278 Gregorio Robles and Jesus M. Gonzalez-Barahona
KwHt ti o«
.1 / \
\ /
Fig. 2. Fractional graph for The GIMP project.
to the core group that has been identified in it. In the case of a "code gods" project, the other core groups should be near that maximum (or at the same level) as the composition has not changed much over time. In the case of The GIMP this is true, except for the first two intervals, as we have seen in the previous plots. There is a fall of the contribution of the two first core groups, especially in the sixth interval, where it lies under 20%.
Interestingly enough, all core groups show a development share of more than 80% in their corresponding intervals, and even over 90% for those core groups after the third interval. This shows again evidence about the inequality that exist in the contributions of libre software projects. We knew by now that a 20%-80% Pareto distribution is a common work distribution pattern in libre software projects [5]; these graphs shows that, at least for The GIMP (but we will see that this happens in almost all other projects considered in this paper) this is general even for (large enough) time intervals in the project.
3.2 Observations on Mozilla
We have selected the Mozilla Internet suite as the example of libre software project in which several generations can be identified. Mozilla is a well-known libre software project, the follow-up of the Netscape Internet suite. Mozilla is a multi-million project, with more than three million source lines of code. The CVS activity around the project is over 650,000 commits, more than five times larger than that of The GIMP (which is by itself already a large libre software project); Table 2 summarizes the relevant information for our analysis.
The Mozilla project started in 1998. Although its beginnings were not very promising, the project surpassed its early problems, and its version 1.0 was released in June 2002. Following our methodology, we have ten intervals of 6.5 months each, slightly below the 7.5 months used for The GIMP.

Contributor Turnover in Libre Software Projects 279
Project Size Commits Start Ver 1.0 Interval Generations
Mozilla 3,414 K 663,454 (Oct 1998) Jun 2002 6.5 months Multiple
Table 2. Summary of the interesting information on Mozilla.
L4 I
. te^^/
/ , ' ' A ^, ,/ ,
'/* ~ r . * f \ , -' ^
Fig. 3. Right: Absolute graph for the Mozilla project. Left: Aggregated graph for the Mozilla project.
Figure 3 groups the absolute (left) and aggregated (right) plots of the ten core groups for each interval. At first sight, we can already see that there exist many differences between these plots and the corresponding ones of The GIMP. The absolute graph shows interesting information about the overall activity in the repository. It can be seen how in the first two intervals, and for the fifth one, the peak of the core groups is not that high, a fact that is indicative of less activity. Attending to the aggregated graph, we can see how the number of curves which follow their own way (i.e. are not parallel one to each other) is larger. In other words, the composition of core groups varies more frequently than in The GIMP.
Once more, the figure which provides more information is the fractional one (see 4). It shows clearly several generations over time. For all of them, there are peak values of over 75% in their intervals (over 80% in later ones).
Interestingly enough, the core group in the last interval contributed already in the early stages a small amount of commits (around 5%). Its contribution grows then almost continuously (the sequence in the ten intervals is the following: 5%, 11%, 18%, 21%, 21%, 34%, 27%, 55% and finally 78% where it is the leading core group). The core group that achieves its peak contribution in the first interval has an opposite trend with a substantial decline as time passes. In between we find several core groups that have both behaviors found in the first and last core group: an increasing shape until they arrive to the peak and a

280 Gregorio Robles and Jesus M. Gonzalez-Barahona
* . . ^ ( , 4 <,1%K «
A -^
( v r " ' \
•!)jrc* »-i«r< - ifei i'-«l«i.-
Fig. 4. Fractional graph for the Mozilla project.
declining part afterwards. If we compare this figure with the corresponding one for The GIMP, it can be observed that the more chaotic a fractional graph is (or the less background color we can see in it), the more generations there are. "Code god" projects have a tendency to show parallel curves, while projects with many generations show a lot of curves crossing each other.
3.3 Observations on Evolution
Finally, we have selected a project which shows a mixed behavior between code gods and generations. This is the case of Ximian Evolution (currently renamed to Novell Evolution), a groupware solution for the GNOME project. Table 3 shows the most important information about this software, a medium-sized appHcation with around 200 KSLOG. The amount of commits is in the order of magnitude of The GIMP.
The history of Evolution gives further insight about the results which will be shown below. Evolution started as a community-driven project in December 1998. By the end of the 1999 it was chosen by a small start-up company called Ximian as a strategic application. This meant that hired developers started to work on it, changing its governance to one more typical of a company-driven project. Version 1.0 was delivered in late 2001. The duration of each interval is around 6.4 months, similar to the one for Mozilla and The GIMP.
The absolute graph on the right of figure 5 gives a clear idea of the lower activity that prevailed in Evolution before Ximian developers took over the project in the third interval. Then, an increase in activity can be observed during several years (reaching up to 16,000 commits in each interval), declining in the last year to values close to 9,000 commits per interval. The aggregated graph on the right supports our findings: we can see how the first two core groups (which are identical in their composition) do not contribute after the
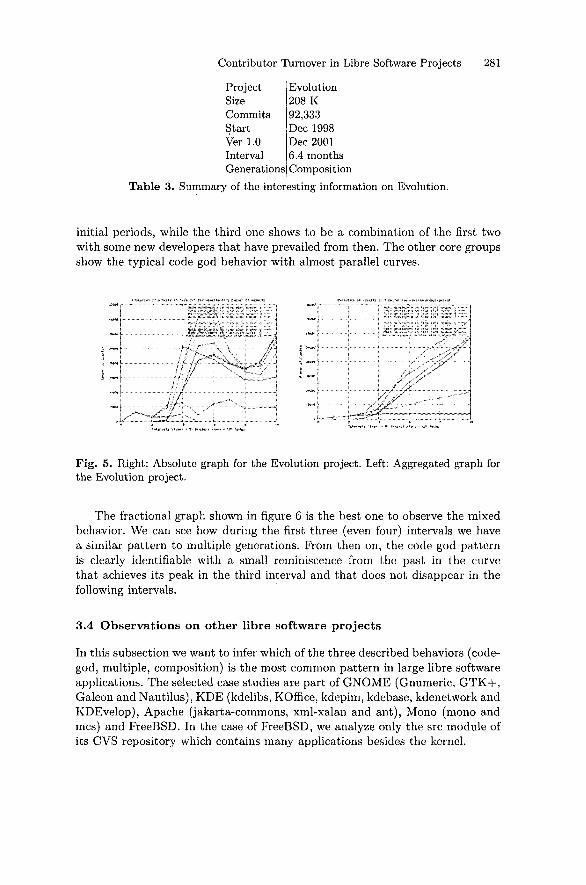
Contributor Turnover in Libre Software Projects 281
Project Size Commits Start Ver 1.0 Interval Generations
Evolution 208 K 92,333 Dec 1998 Dec 2001 6.4 months Composition
Table 3. Summary of the interesting information on Evolution.
initial periods, while the third one shows to be a combination of the first two with some new developers that have prevailed from then. The other core groups show the typical code god behavior with almost parallel curves.
.«»c»i.
.«.**[
i I[ « [
..4
;;:,; i:i:^ ::. ^ j .
^ ;i(|j ;,L:4::S ;;
/ > ^ %
/ ; /
j ^ / - - , • • • " • •
A ««
...
..«
«
"';>.<.. «.-,.t',J',, :,. <w. x;MVvh»."
4;u s; , ;;-;;-;;«;:;; . :;s;: ,^.- . : . : . .
^.....~v-.?..T.v.-:~rr^^'..... i ,
Fig. 5. Right: Absolute graph for the Evolution project. Left: Aggregated graph for the Evolution project.
The fractional graph shown in figure 6 is the best one to observe the mixed behavior. We can see how during the first three (even four) intervals we have a similar pattern to niultiple generations. From then on, the code god pattern is clearly identifiable with a small reminiscence from the past in the curve that achieves its peak in the third interval and that does not disappear in the following intervals.
3.4 Observations on other libre software projects
In this subsection we want to infer which of the three described behaviors (code-god, multiple, composition) is the most common pattern in large libre software applications. The selected case studies are part of GNOME (Gnumeric, GTK+, Galeon and Nautilus), KDE (kdelibs, KOffice, kdepim, kdebase, kdenetwork and KDEvelop), Apache (Jakarta-commons, xml-xalan and ant). Mono (mono and mcs) and FreeBSD. In the case of FreeBSD, we analyze only the src module of its CVS repository which contains many applications besides the kernel.

282 Gregorio Robles and Jesus M. Gonzalez-Barahona
Tuol-^Hi": I.? on'vxHr •:op o»»'Tii irr»l>u (>«"-!v»t)i* <»
^s A "tv -r-v^t
t' * y-x -'••••'" ^"--"•-'
Fig. 6. Fractional graph for the Evolution project
Table 4 shows a summary of the projects, which will be relevant for our analysis. The starting years of the projects range from December 1993 (earher commits of the FreeBSD project) to June 2001 for the Mono project. With the exception of Jakarta-commons, all of them have delivered a 1.0 version, so we can assume they are stable software. The length of each interval depends on the starting date of the repository. Hence, we have intervals ranging from 1 year to three months (for Mono and mcs, the two younger applications). The project size, the number of commits and commiters have been added to give additional insight on the applications and to show that they can be considered large in size and in number of contributors.
Fractional graphs for the selected projects are shown in the two 2x4 matrix tables (tables 5 and 6). They have been ordered, putting those that have several generations (multiple) first, then those that have a composite behavior and finally the projects that have a code god behavior. After a quick inspection of the fractional graphs, it is easy to classify eight of the projects as having multiple generations, six as showing a composite model, and finally only two projects behaving as having code gods.
4 Conclusions and further research
In this paper we have shown a methodology to answer the question of how the transition (developers joining and leaving) in a libre software project is. We have used the methodology to classify projects in three categories: those based on "code gods", those with generations of core developers, and those which show a mixed model. Most of the projects we have analyzed enter clearly into one of the presented categories.

Contributor Turnover in Libre Software Projects 283
Project Start Ver 1.0 Size Interval Commits Commiters Type PreeBSD (src)
kdelibs j akart a-commons
mcs kdenetwork
kdevelop koffice
kdepim g tk+
galeon xml-xalan kdebase
ant nautilus gnumeric
mono
Mar 93 May 97
1 Mar 01 Jun 01 Jun 97 Dec 98 Apr 98 Jun 97 Dec 97 Jun 00 Nov 99 Apr 97 Feb 00 ( Feb 98 Jul 98
Jun 01
Dec 93 Jul 98
-Jun 04 Jul 98
Dec 99 Jan 01 Jul 98
Apr 98 Dec 01 Oct 00 Feb 99
[Aug 03) May 01 '• Jun 02 Jun 04
1500K 615K 429K
1081K 293K 386K 780K 512K 388K
90K 337K 362K 120K 200K 229K 222K
12.1 8.3 3.3 2.7 8.1 6.2 7.1 8.1 7.7 4.5 4.9 8.3 4.7 7.3 6.9 2.7
554,764 217,961
39,370 32,566 98,282 69,890
172,564 93,632 68,279 31,153 54,267
330,009 43,955 63,760 81,019 11,936
352 441
72 114 332 152 247 284 265 110 32
450 33
236 166 91
M M M M M M M M C C C C C C G G
Table 4. Summary of the findings for a generations analysis applied to the projects listed in the first column. Start is the starting date of the CVS, Ver 1.0 the date of version 1.0 if available, size gives the size of the software in SLOG, interval gives a tenth of the life-time (in months), commits the total number of commits, commiter the total number of commiters and generations their type (G = code gods, M = multiple, C = composition).
T h e methodology we present is quant i ta t ive , based on the d a t a publicly available in t he CVS reposi tory of t he projects . It uses information ab o u t t he his tory of source code managemen t sys tems (mainly who performed commi ts and when he did i t ) , and could be therefore influenced by diff'erent policies t h a t projects may have regarding the use of versioning sys tems. However, we have checked t h a t using other pa ramete r s , such as number of lines changed ( instead of number of commits) yield similar results .
Fur the r research should s tudy how much the selection of t h e interval length aff'ects t h e (visual) results . Our experience so far proves t h a t selecting t ime slots larger t h a n five to six mon ths are sufficient to identify t he existence of several generat ions, b u t it does not allow to recognize t he to ta l number of t h e m .
On the o ther hand , our sample is composed of large libre software projects . An interest ing future research act ivi ty could be to invest igate t he results obta ined from applying th is methodology to projects wi th a smaller number of cont r ibutors .
T h e research we make public here is backed by a reasonably large number of projects analyzed, bu t can of course be improved in the future by analyzing more cases, and by compar ing the results to o ther s tudies , such as t he growth of t he code size, or of t he change over t ime of the project s t ruc tu re . Our results show t h a t a major i ty of projects have mult iple core groups over t ime, so t h a t a na tu ra l regenerat ion process can be inferred. Pro jec t s t h a t are still led by

284 Gregorio Robles and Jesus M. Gonzalez-Barahona
founding core groups have been the less frequent, with only 3 cases over 21 applications under consideration.
In any case, the study of the behaviour of human resources in libre software projects, and the relationship between its join/leave patterns and the evolution of the project, is a field to explore. Our study tries to be a first step in this direction, focused on studying its dynamics, and on finding how projects cope with the changes caused by those patterns.
References
1. Barry W. Boehm, editor. Software risk management IEEE Press, Piscataway, NJ, USA, 1989.
2. K. Crowston, B. Scozzi, and S. Buonocore. An explorative study of open source software development structure. In Proceedings of the ECIS, Naples, Italy, 2003.
3. Kevin Crowston and James Howison. The social structure of oss development teams. In Proc Intl Conf on Information Systems, Seattle, USA, 2003.
4. Kevin Crowston and James Howison. The social structure of free and open source software development. First Monday, 10(2), February 2005.
5. Rishab A. Ghosh and Vipul Ved Prakash. The orbiten free software survey. First Monday, 5(7), May 2000.
6. Chris Jensen and Walter Scacchi. Modeling recruitment and role migration processes in OSSD projects. In Proceedings of 6th International Workshop on Software Process Simulation and Modeling, St. Louis, May 2005.
7. Stefan Koch and Georg Schneider. Effort, cooperation and coordination in an open source software project: GNOME. Information Systems J, 12(l):27-42, 2002.
8. Audris Mockus, Roy T. Fielding, and James D. Herbsleb. Two case studies of Open Source software development: Apache and Mozilla. ACM Transactions on Software Engineering and Methodology, ll(3):309-346, 2002.
9. Gregorio Robles, Jesus M. Gonzlez-Barahona, and Martin Michlmayr. Evolution of volunteer participation in libre software projects: evidence from Debian. In Proc 1st Intl Conf Open Source Systems, pages 100-107, Genoa, Italy, July 2005.
10. Gregorio Robles, Stefan Koch, and Jesus M. Gonzalez-Barahona. Remote analysis and measurement of libre software systems by means of the CVS Anal Y tool. In Proc 2nd Workshop on Remote Analysis and Measurement of Software Systems, pages 51-56, Edinburg, UK, 2004.
11. Yuwan Ye, Kumiyo Nakakoji, Yasuhiro Yamamoto, and Kouichi Kishida. The co-evolution of systems and communities in Free and Open Source software development. In Stefan Koch, editor, Free/Open Source Software Development, pages 59-82. Idea Group Publishing, Hershey, Pennsylvania, USA, 2004.

Contributor Turnover in Libre Software Projects 285
> ' : /
i .'
! - .'V.V/
At -
'L „
/ / \ N
rA^\
v»-mt ^> .«
r'
7 f /
f
> ^-x^U-v
\
y
' \
V.
If « . -
x ' .
/
\i
< %
,>r'
4^. ' - ' f '5
' "" >4 KI
\
/'
i...
^y>U*1,*,.„K.'-
*v.» ><;,i..
< ^^t .^^v:
^Y*:::,j?: f '
/ . / • '^ / / i
i '
i .
» ^ t W v « . . -
, » V* ^ i v i
-/ *!,%
'S.'-^ " '
\
\
v t -x»^ u>v^.f
v,»»x. >
^is^c: ^ - ^ ^
s
,^ «!;rr.,-;^-tr.%/,Nr^'.^v:;;^a r "
•' ... h \
/
• / / . . , .^
N )
«« »» >-
1 \
. 1
^ - > / ' - / . - , " / •
:L_
1 I
/
\
'
A ^ \
—r-
t
1
>'
\ i
.J
~5f7 't* xiVx »
z :: .4 .
^ y' ^*
\
"-••
' ^-^ 4.
•"7777"
x ^ ^
/ '
/ - -
7m7T . . t
'2hi
/ /
/
"-
4.
^ H
^
V^j
Table 5. 2x4 matrix with fractional generation plots for 8 libre software systems. Projects with heavy generational turn-over have been situated at the top. More information can be found in table 4.

286 Gregorio Robles and Jesus M. Gonzalez-Barahona
^ . . i U \ ; X f' -V%v , -1
A 1r
/ \ I
" > / V
1 ^^
i f
•
.- .\ /
,L-u»»«
'
^
'
I
*
/**•
)S*
/'
*) OU .V .« ' „,i . , ™ ^
• • . \ • - , : ' • ~ -
\ \
i , 1
; - / . / •^., •^ 7
/
1 W /
/ / ^ /
:_.^--i
/ /
Table 6. 2x4 matrix with fractional generation plots for 8 libre software systems. Projects with heavy generational turn-over have been situated at the top. More information can be found in table 4.


![Glossator 5: On the Love of Commentary [co-editor/contributor]](https://static.fdokumen.com/doc/165x107/632a52e40566aeccab0f45b2/glossator-5-on-the-love-of-commentary-co-editorcontributor.jpg)