Contributions to Applied International Business Management ...
81
I Discussion Papers in Business and Economics Prof. Dr. Claudia Kreipl, Prof. Dr. Dagmar Preißing, Prof. Dr. Michael Huth/Prof. Dr. Dirk Lohre, Dominik Och MA, Prof. Dr. Josef Neuert Contributions to Applied International Business Management Research Discussion Paper No. 06 April 2013 Herausgeber/Editor: Hochschule Fulda/Fulda University of Applied Sciences Fachbereich Wirtschaft/Faculty of Business Marquardstraße 35 36039 Fulda Deutschland/Germany www.hs-fulda.de/wirtschaft ISSN: 2194-7309
-
Upload
khangminh22 -
Category
Documents
-
view
0 -
download
0
Transcript of Contributions to Applied International Business Management ...
I
Discussion Papers in Business and Economics
Prof. Dr. Claudia Kreipl, Prof. Dr. Dagmar Preißing,
Prof. Dr. Michael Huth/Prof. Dr. Dirk Lohre, Dominik Och MA, Prof. Dr. Josef Neuert
Contributions to Applied
International Business Management Research
Discussion Paper No. 06
April 2013
Herausgeber/Editor:
Hochschule Fulda/Fulda University of Applied Sciences
Fachbereich Wirtschaft/Faculty of Business
Marquardstraße 35
36039 Fulda
Deutschland/Germany
www.hs-fulda.de/wirtschaft
ISSN: 2194-7309
II
Table of Contents
Table of Contents .................................................................................................................................... II
List of Figures and Tables ...................................................................................................................... III
Preface of Editor ...................................................................................................................................... 1
Prof. Dr. Claudia Kreipl
The Health Care Sector – Growing market or ticking time bomb? ......................................................... 3
Prof. Dr. Dagmar Preißing
The consequences of flexible employment on the expertise development of employees in times of
severe demographic change ................................................................................................................... 17
Prof. Dr. Michael Huth / Prof. Dr. Dirk Lohre
Risk Management in Logistics Enterprises: Results of an Empirical Study ......................................... 26
Dominik Och, MA
The risk awareness and the degree of implementation of systematic Enterprise Risk Management in
the economic region Fulda .................................................................................................................... 37
Prof. Dr. Josef Neuert
The impact of intuitive and discursive behavioral patterns on decision making outcomes: Some
conjectures and experimental findings .................................................................................................. 48
Overview previous Discussion Papers ................................................................................................... IV
III
List of Figures and Tables
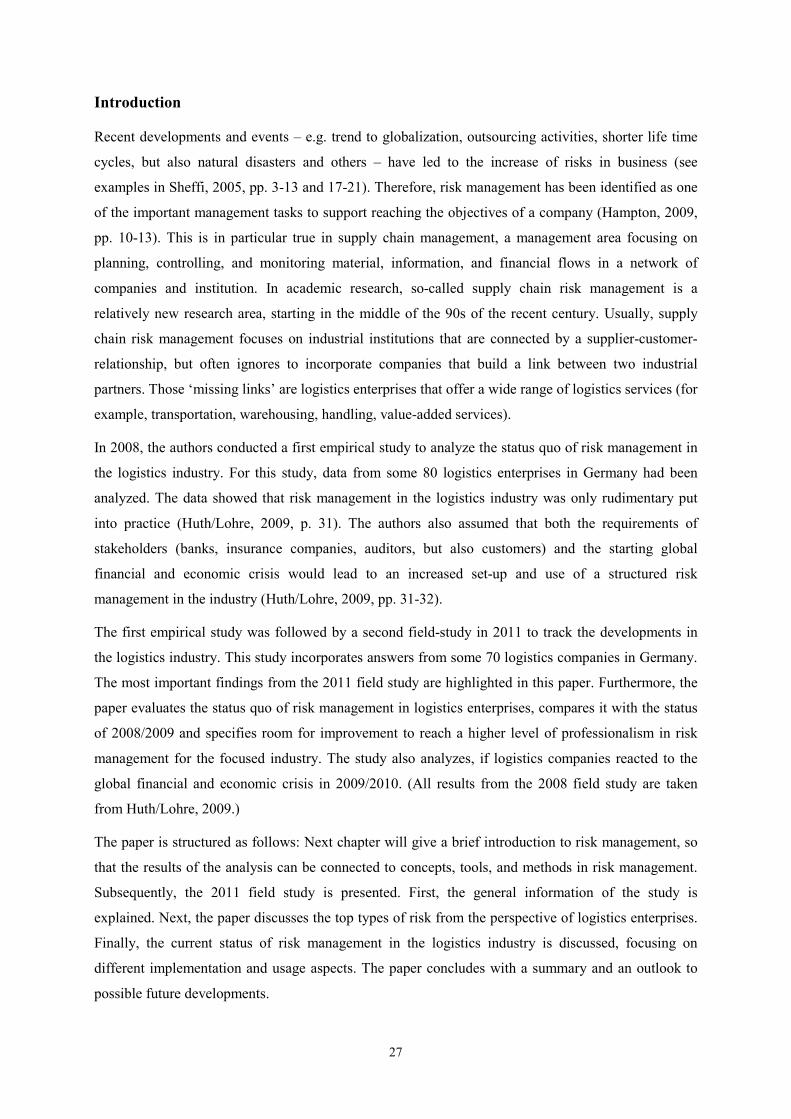
Figure 1: Risk management cycle (Huth/Lohre, 2009, p. 5) .................................................................. 28
Figure 2: Types of risk management actions (Huth/Lohre, 2009, p. 6) ................................................. 29
Table 1: Top future risks (in brackets: development compared to status in the 2008 field-study) ....... 30
Figure 3: Implementation status of risk management in logistics companies ...................................... 31
Figure 4: Functional focus of risk management .................................................................................... 32
Figure 5: Use of software tools for risk management ........................................................................... 33
Figure 6: Use of risk management methods .......................................................................................... 34
Figure 1. Legal forms of respondents .................................................................................................... 39
Figure 2. Number of employees ............................................................................................................. 39
Figure 3. Reasons for ERM ..................................................................................................................... 40
Figure 4. Methods of risk identification ................................................................................................. 40
Table 1. Relevant risk types ................................................................................................................... 41
Figure 5. Implementation of early-warning-systems ............................................................................ 43
Figure 6. Implementation of monitoring-system ................................................................................... 43
Figure 7. Implementation of risk controlling ......................................................................................... 44
Figure 8. ERM implementation in the region Fulda ............................................................................... 45
1
Preface of Editor
The research papers published in this reader were presented to an audience of academicians and
practitioners at the 2011 Global Business Management Research Conference at Fulda University.
The conference was conducted under the topic “Recent Developments in Business Management
Research in an International and Regional Context”.
Altogether, in the course of the conference, about 60 presentations within six focus sessions took
place, addressing actual and contemporary research issues and practical problems of Business
Management. In particular, the areas of Finance and Risk Management, Supply Chain Management
and Logistics, Leadership in Organizations, Marketing Management, Sustainable Organizational
Development, and Employment Management were in the center of the presenters´ efforts.
In addition, keynote addresses were given to the conference audience, emphasizing aspects of regional
development and quality of life issues in the Fulda area (Diplom-Volkswirt Stefan Schunck,
Hauptgeschäftsführer der Industrie- und Handelskammer Fulda), and perspectives of modern
temporary work and personnel services companies in an international context (Diplom-Betriebswirt
Stefan Polak, Vorstand Job AG Fulda).
All of the submitted articles and presentations abstracts were subject to a review by the Editorial
Board of the conference, comprised of the following persons: Prof. Dr. Baiba Savrina, Prof. Dr. Erika
Sumilo (both University of Latvia, Riga, Faculty of Economics and Management), and Prof. em. Dr.
Johannes Lachhammer (Augsburg University, Germany).
The Editorial Board also reviewed and approved the submitted full papers for publication in this
reader:
• Prof. Dr. Claudia Kreipl addresses the requirements of social responsibility under
economic pressure in the health care sector.
• Prof. Dr. Dagmar Preißing discusses and explains the consequences of flexible
employment on employees´ expertise development under significant demographic changes.
• Prof. Dr. Michael Huth and Prof. Dr. Dirk Lohre present the results of an empirical study
dealing with risk management issues in logistics enterprises.
• Dominik Och, MA, outlines the risk awareness and the degree of implementation of
systematic risk management tools in companies of the Fulda region.

2
• Prof. Dr. Josef Neuert reports on his research project, dealing with the impact of diverse
behavioral patterns on decision making efficiency, based on the findings from
experimental studies.
This reader intends to sustainably stimulate the discussion concerning recent developments in
Business Management Research among scholars and practitioners. Each and every feedback, also and
particularly from students, is most welcome.
Prof. Dr. Josef Neuert Fulda, April 2013
Chairman, Editorial Board
3
Prof. Dr. Claudia Kreipl
The Health Care Sector – Growing market or ticking time bomb?
Prof. Dr. Claudia Kreipl
Germany, Fulda University of Applied Science
Email: [email protected], Phone: +49 (0) 661 9640 272
Abstract
Health is regarded as our most precious good. Since decades, the Western societies are confronted
with growing health care expenditures. An absolute cost increase can be observed, as well as an
increase on the ratio on the gross national product. Combined with a growing demand on health care
products and services, this problem is aggravating. Maintaining a high quality health care supply is
therefore a challenging task of our time.
Reasons for the development concerning cost escalation and demand increase can be found in our
over-aging society, a growing range of offers due to medical progress and innovation and furthermore
an increase in the number of chronic diseases. Usual market mechanisms to regulate demand and offer
via the price do not work in the health care sector. This results from health being a merit good.
Therefore, and furthermore to secure access to follow the requirements of social responsibility even
under economic pressure, government is forced to interfere in this sector.
Sustaining a health care system where the demand of people can be met on one hand with a secured
funding on the other hand is one of the major challenges of our time. Without reducing the quality
standard and with only scarce options for reducing costs, only a limited range of actions to meet the
challenges remains. The increase of efficiency is carved out being a suitable method of resolution.
Three approaches will be focused. Starting with health economics, methods to evaluate the efficiency
in the health care sector will be illustrated. Concepts identified in other markets with identical
challenges show further approaches for meeting the challenges in the health care sector. Therefore, the
concept of Efficient Consumer Response is presented. Discussing ideas for research on factors of
success to secure an effective and efficient introduction of new methods supplement the contribution
of scientists to meet the requirements of social responsibility and economic pressure in the health care
sector. Thoughts result in the interaction of the three approaches to come to a conclusion.
4
Introduction
Health is regarded as our most precious good. Since decades, the Western societies are confronted
with growing health care expenditures. An absolute cost increase can be observed, as well as an
increase on the ratio on the gross national product. Combined with a growing demand on health care
products and services, this problem is aggravating. Maintaining a high quality health care supply is
therefore a challenging task of our time.
The paper in hand addresses reasons for the development concerning cost escalation and demand
increase. This is accompanied by an explanation for the government’s sanction to interfere in the
health care market. It is an important public task not only to secure a functioning system in the
situation of economic pressure, but moreover to assume social responsibility. Opportunities to fulfil
these requirements will be discussed.
The increase of efficiency is carved out being a suitable method of resolution. Three approaches will
be focused. Starting with health economics, tasks and methods will be illustrated. The following
approach identifies options on the basis of other markets with identical challenges. Discussing ideas
for research on factors of success to secure an effective and efficient introduction of new methods
supplement the contribution of scientists to meet the requirements of social responsibility and
economic pressure in the health care sector. Discussing the interaction of the three approaches
complements the thoughts to come to a conclusion.
Specifics of the Health Care Sector
The health care sector is determined by some specifics differing from common competitive markets.
Generally, products and services for consumers called patients are traded in this market. But e.g. due
to the social responsibility resulting in the demand for access to health care for all people, the market
mechanisms do not come into action in their traditional way.
Dealing with the subject of health care is a matter of public interest, because public spending finances
this sector. As the health care expenditure increase is not followed by an equivalent development of
the income growth in this sector, even a sinking income can be expected, the situation will be
aggravating. This growing gap is accompanied by the ticking of a time bomb, unless this development
will be stopped. Analysing the developments and challenges in the health care sector is the first step to
identify possible levers to influence trends and reacting on challenges. Understanding the
characteristics of health supply marks a starting point. The description of developments on the demand
side and the cost side of the health care sector will complement the understanding of the situation.
5
Health as a private, public and merit good
Due to the constitution of the World Health Organisation (WHO), health is a state of complete
physical, mental and social well-being and not merely the absence of disease or infirmity. It is
considered the most precious good of humans.
Well-being of individuals is of both, private and public interest. The importance of health for human
beings is evident. An appropriate state of health comes along with the ability of people to cope with
their everyday life. Moreover, it is the basis of enjoying life. Generally it is of everybody’s private
interest to keep a good state of health and to be able to participate in life without limitations.
On the other side, health as a public good comes into focus due to two reasons. In the last century
under difficult hygienic conditions it was of public interest to avoid epidemic plagues for keeping a
social community alive and avoiding hunger and sorrow. Therefore, sanitation and later the
introduction of obligatory vaccinations became a public task.
The second reason for public interest in health is the role of individuals as production factor in
business life. Healthy people can go to work, pay taxes and contribute to the existence of the social
community. The lack of health may lead to the loss of job and the dependence on social welfare –
temporarily of daily sick benefit or even of long-term nursing. Former tax-payers convert into
demanders of social services.
Furthermore, health is regarded as a merit good. Due to the term introduced by Richard Musgrave
(1957), merit goods are characterised by an insufficient demand from public perspective. The main
reasons for the low demand can be found in
Irrational decisions: Consumers do not consider the advantages and disadvantages of decisions or do
not understand the complex situation. Not using a security belt in a car was considered irrational and
led to the introduction of the obligation for installation and use of belts in cars in the 1970 years.
Another example is the obligation not to drive a car after heavy alcohol consumption.
Incomplete information: People are considered not to have access to all information for an optimal
budget allocation, e.g. house owners do not know about the savings caused by thermal insulation.
Government therefore subsidised testing at times. In health care, consumers cannot assess the doctors’
skills. Therefore, quality of medical care is secured by education standards on one hand and the
obligation for obtaining approvals on the other hand.
Wrong time preferences: They refer to the fact, that future events are ascribed less importance than
present events. Therefore e.g. the compulsory nursing insurance was introduced, so young people
already contribute to an insurance they will make no use of in their present life, but with growing
probability in the future.
External effects: The advantage of the individual deciding about the demand differs from the public
interest in the demand. E.g. a vaccination can cause the individual a light fever or a light inflammation
6
at the injection site. On the other hand, vaccinations avoid the spreading of epidemics and are
therefore of public interest.
Whereas in most markets pricing mechanism and competition rule the market developments, the
health care market requires interferences. The classification of health as a private, but moreover a
public and merit good explains government action to obtain a sufficient demand on one hand and
access for the entire population on the other hand. Being a public and merit good legitimates the
government’s interference in the health care market and the necessity to develop market regulation
mechanisms.
Demand for Health Care Products and Services
The health care market is considered a growing market. These markets are characterised by a growing
demand for the relevant goods. Market growth in an existing market can be generated in different
ways. First of all, the number of users can be increased. Secondly, the intensity and the duration of use
in an existing market with regular customers can be enhanced. A third way can be found in creating
need for new, differentiated goods.
Goods offered in the health care market can be classified in services and products. Services are
delivered at hospitals and resident doctors, but moreover at physiotherapists, ambulant nursing units
etc. Products include physical goods like drugs or medical devices delivered by pharmaceutical and
medical companies directly or via pharmaceutical wholesalers or pharmacies. Services and products
are combined to offer therapies to treat specific diseases, diagnosing them, avoiding them by
prophylactic activities or to ease the patients’ situation by palliative activities.
A special interest in the health care market can be set, because it is a market with growing demand due
to
An over-aging society:
Life expectation is steadily growing while the number of newborns is still slightly sinking. Combined
with a slow reduction of the German population from 82.26 Mio in 2000 to 81.802 Mio in 2009
(Bundesministerium fuer Gesundheit (2011), 1.1) this leads to a growing ratio of elderly people. As
especially elderly people demand health care, the number and the ratio of demanders grow and
moreover, the duration of their demand grows.
A growing range of offers caused by medical progress and innovations:
This creates new demand. Having e.g. a large number of diagnostic devices creates the possibility to
make use of a range of them to come to a diagnosis. As soon as new therapeutic or diagnostic tools are
invented, one makes use of them. This is desired, because it offers the possibility to detect diseases
earlier or to treat diseases that had been incurable so far.
7
An increase of chronic diseases:
Especially the big diseases resulting from an unhealthy lifestyle like hypertension and diabetes
mellitus show an earlier incidence, i.e. younger patients with an earlier outbreak of the disease.
Combined with a higher expectation of life due to excellent treatment options this leads to the
prolongation of the time under therapy.
Costs of Health Care Products and Services
From an economic perspective, a market with an expected increase in demand may be called a
paradise for managers. A secure and growing demand secures jobs and gives investments the
opportunity to pay out. Investments in the number of hospitals and beds in hospitals, in production
plants of pharmaceutical companies, in product development should be expected. None of that
happens in the health care market. Instead, the number of hospitals and of beds is sinking. A decrease
of 8% of the hospitals respectively 12% of the beds from 1998 to 2009 can be observed
(Bundesministerium fuer Gesundheit (2011), 11.4).
But with a glimpse on the financing of the health care sector, the challenges in this market become
obvious. The growing demand for health care products and services leads to growing expenses. Unlike
other markets, the costs for products and services are not only covered by consumer. This can be
explained by claiming access to the market for all citizens independently from their purchasing power.
Health care costs are distributed to three groups of payers. The first group to be mentioned is the
health insurance. In Germany, all people are obliged to contract with a health insurance, either a public
or a private one – dependent from their income respectively their job. With 87%, the majority of
people are member of a statutory health insurance. The earnings and the spending of these insurance
companies are both growing constantly. An increase of spending of 14.3% from 2000 to 2007 can be
observed (Bundesministerium fuer Gesundheit (2011), 9.5A).
Government shares furthermore the costs for the health care system e.g. for operating and investing in
hospitals. Third group of payers are patients themselves. They contribute via prescription and practice
fee, co-payments for specific services and taking over the entire costs for the so-called OTC-drugs that
are prescription free. An increase in spending can be observed here as well.
Overall, the ratio of health care expenses on the gross national product raise from 10.3% in 1999 to
11.6% in 2009. In the same period, the health care expenses per capita grow from 2 530 € to 3 400 €,
which is an increase of 34% (Bundesministerium fuer Gesundheit (2011), 9.3).
8
1. Facing the Challenges
Sustaining a health care system where the demand of the people can be met on one hand with a
guaranteed sustainable funding on the other hand is one of the major challenges for Germany as well
as for most European countries. This health care system has to meet the following requirements:
• The requirement for health services on a high quality standard is the first to be named.
• From a social perspective, access to this high standard for the entire population has to be maintained.
• And last not least, bearable costs for all parties involved have to be secured.
Moreover, the health care market has to be considered from the macro-economic perspective. The
market offers an enormous and growing number of jobs. An increase of jobs from 1999 to 2009 of
15.4% can be observed. 11.8% of all employed work in 2009 in the health care sector
(Bundesministerium fuer Gesundheit (2011), 11.4). This sector not only allows a wide number of
employed the opportunity to make a living, they moreover contribute to health insurances. By paying
taxes, the employed contribute to the national income and to financing the health care system.
Observing the aggravating problem of financing the health care services, the income side offers
solutions by increasing the contribution rate, the co-payments made by patients or raising the taxes
used to finance health care services. Other possibilities can be found in reducing expenses by an
elimination of services. These options are not in accordance with the requirements stated above and
are neither favoured by governmental units nor by patients.
Reacting on the challenges has to consider complex market relations. An increase of the contribution
rate of the health insurance leads to higher non-wage labour costs and makes investment in jobs more
unattractive. On the other hand, a decrease of the contribution rate came along with a shift of costs
either to the tax payers or the patients directly – both alternatives that do not really relieve the system
as a whole and therefore do not deliver an acceptable solution.
Patent expiries of drugs lead to the introduction of low-priced generic drugs and to a price decline in
the product market. Despite high product development costs for pharmaceutical companies, only a
short period of time with exact schedules for gaining revenue remains. So the price reduction by
generic drugs reduces the costs of the health insurances respectively of patients in case of OTC-drugs.
But on the other hand, it destroys jobs in the pharmaceutical companies and, moreover, it brings a
negative impulse for further product development and research on pharmaceutical products.
Without reducing the quality standard of the health care system or removing services and furthermore
with only scarce options for reducing costs, only a limited range of actions to meet the challenges
remains. Concentration on increasing the efficiency of the system can be regarded as the silver bullet
to meet the requirements.
9
2. Contribution of Management Research
Activities to secure a high quality health care system therefore have to focus approaches increasing the
efficiency of actions. Concepts fulfilling this requirement have to be identified and implemented in all
parts of the health care sector. This may first of all include methods to determine the grade of
efficiency of health care processes, services or products to identify the best choice. Health and
pharmaco-economics deal with that subject.
Dealing with rare goods is the core competence of economics. Scarcity of (monetary) resources is
common in most economical situations. For that reason, a view in other sectors to learn from their
experiences is an effective approach. If suitable concepts to solve problems in the health care sector
are identified and their implementation is prepared, one has to pay respect to a successful i.e. effective
and efficient introduction. Identifying factors of success is one major task in meeting this requirement.
These three approaches will be addressed in the following sections.
2.1 Health Economics
As a specific branch of economics, health economics deals with the evaluation of the effectiveness and
efficiency of health care products and services (Hajen et al. (2006), p.11ff.). Pharmaco economics in
particular compare the benefits of specific therapies to identify those with the best input-output
relation (Mueller-Bohn & Ulrich (2000), p.11ff.).
Generally, health economics address the problem of allocation. It intends to give answers to the
questions, whether public and private resources are distributed in accordance with peoples’ needs.
Health care has to be delivered for minimized costs by a given quality without wasting narrow means.
It addresses the question, whether the ratio of health expenses on the overall public expenses is on a
desirable level. It deals with the optimal ratio of e.g. health promotion to therapy costs.
Health economics deals furthermore with the problem of efficiency (Hajen et al. (2006), p. 13). This
implies the uncovering of potential for cost reduction while keeping quantity and quality of the
outcome on a constant level. Specific methods to assess this ratio are developed.
A third field of health economics can be found in assessing the quantity of offers based on the needs
known. As the market mechanism in the health care sector does not work, regulating methods have to
be identified, e.g. for assessing the desired number of doctors or hospitals. This is accompanied by
regulating prices of health care services and the distribution of costs on the cost units in the health care
sector. An optimal financing procedure has to be found. Another subject health economics deals with
is the question of the health care sector’s contribution to the growth of a country’s national economy.
For investigating the raised questions, health economics uses specific economic evaluation methods.
These methods are characterised by assessing the relationship between input and output. They are
based on the assumption that in the health care sector decisions about an alternative use of given
10
resources are taken. As a person’s health respectively his life is not traded on a market, we do not have
market prices for assessment. Furthermore, the market regulations inhibit the forming of market
prices. These specifics form the necessity of evaluation techniques individual for health care.
This evaluation concentrates on the impact of a health technology such as prevention programs,
medical treatments, drugs, a comparison between ambulant and inpatient treatments or new steering
instruments like Disease Management Programs or treatment guidelines etc. Their impact can be
observed as an improvement of the life expectation of patients or an improvement of people’s health
status. After assessing this, it can be compared with its costs. Further consequences like their legal,
society or ethical aspects are matter of the so-called health technology assessment (Hajen et al. (2006),
p.222).
Evaluating these objects requires the operationalization of the benefit of medical technologies. This
can be the prevention of death, healing or easing diseases and therefore reducing pain and malaise, the
recovery of physical and mental functional efficiency. They cover a wide range of embodiments.
They are opposed to the related costs. Costs can be classified in direct, indirect and intangible costs.
Direct costs cover personnel and material expenses for health technologies, i.e. drugs, medical
products or operating costs. Indirect costs include e.g. productive loss due to illness and time costs.
Intangible costs are psychosocial costs like pain, fear or social isolation (Hajen et al. (2006), p.225).
Costs are expressed in monetary terms. Benefit can be expressed in monetary terms as well, but
furthermore in efficacy or enhanced quality of life. Several types of health economical evaluations
exist. The cost minimization analysis, cost benefit analysis, cost effectiveness analysis, and cost utility
analysis are among the most common ones (Schoeffski (2008), p. 79ff.).
Cost minimization analysis combines two separate cost analyses to gain information about the cost of
two or more alternative technologies. The analysis aims at finding the cheapest way of treatment.
Whereas the focus is on cost, the outcome and especially differences in the benefit should not be
neglected. This can be obtained by means of a cost benefit analysis. Cost benefit analyses consider the
overall cost and the entire benefit of medical technologies are expressed and evaluated in monetary
terms. Cost effectiveness analysis focuses the efficiency of medical interventions. This can be
expressed in e.g. days without pain or the absence of symptoms as well as the gain of life years.
Whereas costs are expressed in monetary values, benefit may be demonstrated in non-monetary
objectives and opposed to the costs. It allows the comparison of two or more ways of treatments. Cost
utility analysis can be regarded as a sub-class of the cost effectiveness analysis. Here the evaluation of
the benefit is performed based on the patients’ assessment, i.e. the perceived effects on peoples’
quality of life are set into focus. This allows far reaching comparisons within the entire health care
system.
All these evaluation technologies require knowledge of both, medical and economical aspects. A
collaboration of experts from both professions is strictly required. Furthermore, gaining realisable
11
information from the evaluations has to solve the problem of the quantification of the benefit. And
furthermore, access to valid and reliable data in a sufficient quantity has to be secured.
2.2 Learning from other markets
The transferral of existing approaches and experiences from other sectors into the health care sector is
a suitable way of introducing new processes and concepts to organize processes in the health care
sector more efficiently without inventing the wheel anew. One option presented in this paper can be
found in the ECR-concept.
Efficient Consumer Response (ECR) is a co-operative concept where retail companies and producing
respectively service companies work together to make the market as a whole more responsive to
consumer demands and promote the removal of unnecessary costs from the supply chain. The concept
was developed in the grocery sector in the mid-nineties (cf. Mueller-Hagedorn et al. (1999), p. 61ff;
Zentes & Swoboda (1999)). It aims on serving the customers’ needs better, faster and at less cost. In
the grocery sector this includes a broad assortment with an adequate choice, service convenience, the
quality of goods and their freshness. An efficient way of reaching the customer to make profits in a
world of small margins is most critical for success. This implies the delivery of the right product in the
right amount for the right price and focuses therefore the optimisation of the supply chain as well as
improvements on the demand side i.e. with the concept of category management to meet the
customers’ needs.
The innovative approach was created in a market that is determined by strong competition between the
trade companies, but also between retail and producing companies. Concentration and displacement
processes on both, production and trading side as well as growing system costs (e.g. for CRM-
systems) combined with growing expectations on the customer side are predominant in the fast
moving consumer goods sector. These developments led not only to an aggravation of the horizontal,
but moreover the vertical competition. Beside this competitive element, the relation between industry
and retail is determined by mutual dependencies. The retail needs the manufacturers’ products to fill
their shelves. Manufacturers need access to the customers. A cooperative arrangement of the business
relationship can deliver a contribution to ease the companies’ situation. In this situation the concept of
Efficient Consumer Response was born.
This situation is in accordance with the health care sector’s. Equating patients with customers in the
FMCG-sector and furthermore the retail’s gatekeeper function towards the customer make parallels
between the competitive pressure in the grocery market with the situation in the hospital sector
obvious. Therefore, the idea suggests itself to investigate a possible solution to solve the problems in
the hospital sector. This requires the description of the ECR elements as well as their transferral into
the hospital situation (Kreipl (2004)).
12
ECR aims at improving the processing goods including all related transactions. Costs that do not
create value to the customer are to be eliminated in all steps of the distribution system. Needs and
expectations of the customers are set into focus to gain a win-win-win situation for producer, retail and
customer. This has to be obtained by the combination of supply chain management and category
management as a value chain management.
In detail four strategies create the concept. Efficient replenishment is the first strategy to be mentioned.
It realises co-operative supply chain management. The remaining three marketing oriented strategies
focus with the category management the value chain.
Efficient replenishment structures the processing of goods, information and payments to realise cost
reductions in logistics and its administration along the entire supply chain. These activities result in a
stock reduction, improvements of processes in warehouses, use of capacity of transport resources
combined with a reduction of inventory cost and capital bonding costs. Avoiding an out of stock
situation is basic requirement to be followed. The conventional delivery system is replaced by an
inverted system, where an employee at the production site controls the quantity and rhythm delivered
via the point of sale data directly from retail.
Efficient Assortment describes the arrangement of the assortment by retail and producer together to
optimise retail capacity in the shelves as well as optimising the customers need. This aims at
optimising the revenue in the sale area via optimising the space productivity. Optimising the
placement of products, having an optimal assortment, eliminating redundant articles and creating
clearly arranged assortments is intended. Efficient Product Introduction intends to develop and
introduce new products in close co-operation between retail and producer. This aims at the provision
of a larger number of demand-oriented products with a reduced time-to-market and a reduced flop
rate. This shall improve the image, increase the turnaround of products and create revenue. This can be
realised via combined market research, integration of the retail in the product development process and
the creation of complementary product marketing systems. Efficient Promotion aims at the increase in
sales with optimised costs for promotion activities. A joint optimising of the communication politics
intends to distinguish the assortment of all enterprises involved.
Taking into account the demand for an all-embracing concept, all ECR basic strategies have to be
realised. The supply side in hospitals does not differ from other sectors, so the introduction of Efficient
Replenishment can be transferred easily. First techniques are already taken into action. Transferring
the strategies of the demand side requires a translation of termini into the hospital situation. The
hospital is the trading place where patients consume the health services. Assortment includes therefore
the diagnosing, therapies and nursing performances as well as administrative services. Their
optimising, e.g. a reduction of stay by a reduction of complications and frictionless processes can
improve the cost situation, but furthermore the patients’ satisfaction and the image. Efficient
Assortment in hospitals cannot exclude services from the catalogue, but it can focus the efficiency of
13
the process of services. Besides general administrative or nursing processes, this has to focus
therapeutic and diagnostic services. This can be realised by common research in detecting most
efficient treatment pathways together with other parties in the health care system. This goes in
accordance with an Efficient Product Introduction in hospitals, where innovative therapy concepts may
lead to the introduction of new standards. This may consider specific indications or new nursing offers
and can be performed together with e.g. medical suppliers. Its advantages can be found in a decreased
use of resources combined with a quicker healing process and therefore reduced hospital stays.
Efficient Promotion commonly organised by hospital and medical suppliers are possible in the field of
public relations, e.g. in health promotion activities. It can create a positive image. These thoughts
demonstrate starting points for introducing a concept from the grocery market into the hospital sector.
2.3 Research on the factors of success
Introducing new management concepts or new approaches to organize processes in the health care
sector requires the investment of different resources. It is therefore a time and cost consuming
undertaking which should be successful without spoiling resources.
Research on the factors of success aims at identifying the source of success for enterprises. Despite the
numerous dimensions and multiple causes, success respectively missing success can be led back to a
few basic factors. Knowing the reasons for success offers the possibility to concentrate on relevant
aspects to be successful. Besides detecting ways for securing success, research on success and its
influencing factors allows the use of the knowledge to detect crisis in an early stage and deliver
therefore starting points for avoiding failures and therefore the loss of invested resources.
Basic requirement for maintaining an ECR co-operation and indicator for its success is doubtlessly the
gaining of the intended increase in efficiency. These are indicators for success. Moreover, factors
concerning the shaping of the partnership can be regarded as of prominent importance in a vertical co-
operation (Kreipl (2004)). Ruekert and Churchill (1984) postulate, that the construct of satisfaction is
of fundamental importance in understanding channel relationships. They assume that channel member
satisfaction will lead to higher moral, greater co-operation and fewer terminations of relationships.
A relationship management with the partner is therefore a key factor for success. Trust between
partners has to grow. Successful alliance partners can balance the interests of their partners with their
own, maximise the potential of their network of partners, are capable of understanding and managing
cultural differences, and know how to walk the fine line between competition and collaboration
(Douma et al. (2000) p. 594).
Maintaining a co-operation depends on the ability to find consensus, solving conflicts between
partners and distributing the realised advantages among partners. A stable partnership can only be
obtained, when a short term, project oriented collaboration is developed being a long term
14
relationship. Then investments e.g. in new information and communication technologies and the
adoption of structures and processes of the partner enterprises can pay off. Consequently, the long-
term continuances depend on the selection of the right partner.
Supplementing factors of a successful implementation and operation of the ECR-concept can be found
in the demand for consequent activities. This has to be based on the commitment of the general
management. A change management to create a positive attitude to the new concept is required. This
has to be embedded in an organisational form oriented on the changed processes.
The research focus in this concept is therefore on the satisfaction of partners in a relationship.
Although research on relationship satisfaction did not develop a general accepted theory yet, the
theoretical basis to explain this phenomenon is led back to the confirmation-disconfirmation paradigm,
the most used approach in this field. This approach is based on the thought of a comparison of a target
with an observed aim. This comparison results in either confirmation of the meeting the expectations
or the expectations are not held, which leads to a disconfirmation. Only (over-)confirmation leads to
satisfaction (Chaston (2000)). The more the co-operation partners’ expectations in the collaboration
are met, the higher is their satisfaction and the less likely is an interruption of the relationship.
Scientists have to find out the most relevant of relationship factors satisfaction and their development
over time. From a method point of view, quantitative multidimensional constructs are to be
recommended as the state of the art in management research. Quantitative large scale studies deliver a
broad data basis, where universally valid statements can be generated relying on hypotheses based on
management and behavioural theories.
This requires on one hand the development of scales that show the success of the ECR-
implementation. Kreipl (2004) developed these key performance indicators based on the ECR Global
Scorecard. To obtain a multidimensional construct, the measurement of relationship satisfaction has to
be integrated. The model developed by Jap/Ganesan (2000) based on Ruekert/Churchill (1984) is
suitable for this research task. They develop a three-dimensional construct of relationship satisfaction
in business relation, consisting of the financial satisfaction, product satisfaction, and staff satisfaction.
By means of a structural equation model (Backhaus et al. (2000)), the interaction of the relationship
satisfaction with its single subfactors and the key performance indicators of the ECR-concept was be
tested then (cf. Kreipl (2004)). The satisfaction showed a strong effect on the willingness to cooperate
with a specific partner, the most important factor of satisfaction was staff satisfaction, especially staff
behaviour followed by staff competence.
This example shows the applicability of management research to integrate monetary, quantitative
variables and furthermore behavioural variables into one statistical model based on statistical
hypotheses that are led back on management and behavioural theories. This leads to the ability to
deliver theory-based and hypotheses-based testing results with relevance for practical implications.

15
3. Conclusion
The paper in hand addresses the specific situation in the health care sector. Health as our most
precious good is of major importance for every person, but as well for the public. Its characteristics as
private, public and, moreover, merit good explain government’s task to interfere in the market and
regulate to secure social justice and social peace are described. The growing demand for health care
products and services arises from an over-aging society, an increase of prevalence and incidence of
many diseases and a wide and growing range of innovative health care offers. On the other side,
financing the system is a growing challenge. With government, health insurances and the patients
themselves, three parties bear the health care costs. Their capacity is limited. An increase of their cost
burden can be accompanied by side effects, as e.g. an increase of non-wage labour costs making the
country less attractive for investing in employment.
So on one hand we face the growing social responsibility to secure access to a high standard health
care system for the entire population. On the other hand, we have to secure jobs in a big and even
growing market offering income for members of the German population and taxes for the public
authorities. A sustainable funding of the system is sacrosanct for its further integrity.
This challenge has to be faced by practitioners and scientists as well. This paper concentrates on the
scientists’ feasible contribution. A solid basis of knowledge is needed to come to decisions and allow
sustainable, effective and efficient reforms. We discussed three approaches. Firstly, health economics
respectively pharmaco-economics offer the possibility to compare cost and efficiency of therapies and
therefore to identify the therapy of choice. In this field, the co-operation of scientists with medical,
pharmaceutical and economic background is required. Secondly, the experience of other markets
facing cost pressure can be used to adopt their efficiency increasing concepts to the health care sector.
Thirdly, research on factors of success can accompany an efficient introduction of new concepts to
accelerate the operational capability.
All three approaches together make a contribution to secure the existence of our high standard health
care provision for the entire German population. Many tesserae create an all-embracing picture of life.
16
References
1. Backhaus K.; Erichson B.; Plinke W.; Weiber R. (2000): Multivariate Analysemethoden: eine
anwendungsorientierte Einführung. Berlin: Springer
2. Bundesministerium für Gesundheit (2012): Daten des Gesundheitswesens 2011. Rostock: Veröffentlichungen
der Bundesregierung
3. Chaston, I.: Relationship marketing and the orientation customers require of suppliers. In: The services
industries journal. Vol. 20
4. Douma M.U.; Bilderbek J.; Idenburg P.J.; Looise J.K. (2000): Strategic Alliances, Managing the Dynamics
of Fit. In: Longe Range Planning Vol. 33
5. Hajen L.; Paetow H.; Schumacher H. (2006): Gesundheitsoekonomie; Strukturen – Methoden –
Praxisbeispiele. Stuttgart: Kohlhammer
6. Jap S.D.; Ganesan S. (2000): Control mechanisms and the relationship life cycle: Implications for
safeguarding specific investments and developing commitment. In: Journals of management research Vol. 37
7. Kreipl C. (2004): Efficient Consumer Response und die Bereitschaft zur Kooperation. Wiesbaden: Gabler-
Verlag
8. Mueller-Bohn T.; Ulrich V. (2000): Pharmakooekonomie: Einfuehrung in die oekonomische Analyse der
Arzneimittelanwendung. Stuttgart: Wiss.Verl.-Ges.
9. Mueller-Hagedorn L.; Dach C.; Spork S.; Toporowski (1999): Vertikales Marketing: Trends in der Praxis
und Schwerpunkte in der theoretischen Diskussion. In: Marketing • ZFP Vol. 11
10. Musgrave, R. A. (1957): A Multiple Theory of Budget Determination. In: Finanzarchiv 17
11. Ruekert R.W.; Churchill G.A. (1984): Reliability and validity of alternative measures of channel member
satisfaction. In: Journal of Marketing Research, Vol. 21
12. Schoeffski, O. (2008): Grundformen gesundheitsoekonomischer Evaluationen. In: Schoeffski, O.; Graf v.d.
Schulenburg, J.-M.: Gesundheitsoekonomische Evaluationen; Berlin: Springer.
13. WHO (2005): Constitution of the World Health Organization.
14. Zentes J.; Swoboda B. (1999): Kundenbindung im vertikalen Marketing. In: Bruhn M.; Homburg C.;
Handbuch Kundenbindungsmanagement: Grundlagen – Konzepte – Erfahrungen; Wiesbaden: Gabler.
17
Prof. Dr. Dagmar Preißing
The consequences of flexible employment on the expertise
development of employees in times of severe
demographic change
Prof. Dr. Dagmar Preißing
Germany, Fulda University of Applied Sciences
Email: [email protected], Phone: +49 661 9640 269
Abstract
Purpose: The purpose of this paper is to examine the effects of flexible employment on the receipt of knowledge
and skills of flexible employed persons. The intention is to show that flexible employment is no appropriate
working form for the future, especially when the expertise-retention of employees is a key factor for the success
promising arrangement of the demographic change in an aging society.
Design/methodology/approach: This is a conceptual paper based on theoretical constructs relating to flexible
employment.
Findings: The key finding from this study is that flexible employment is no adequate form of employment for the
successful overcoming of the demographic change.
Practical implications: This paper provides evidence of the negative consequences and effects of flexible
employment. Companies may realize that the replacement of the so far classical normal employment, understood
as a perpetual full-time employment, by flexible forms of employment is no long-term solution in a
demographically changing environment.
Keywords: Human resource management; flexible employment, precarity.
Introduction
The demographic change in Germany is essentially coined by an aging workforce, an absolute
declining number of employed persons and a dramatic scarcity of junior employees. Resulting out of
this, one of the key demands for the creation of employment therefore is that the receipt of knowledge
and skills for the whole still available labor force is assured over its entire working career.
But now the basic forms of employment change rapidly. The so far classical normal employment,
understood as a perpetual full-time employment, is being increasingly replaced by flexible forms of
employment. One of the reasons for this lies in the global competition, which causes an ever shorter
becoming predictability of developments. In return, the demands on the adjustment-speed of the
production processes and the employment systems increase, in order to survive as a business in the
competitive environment. This essential flexibilization demand of work takes place in form of flexible
18
employment. But are these adequate forms of employment for the successful overcoming of the
demographic change?
This question will be answered with a "No". Because flexible employment causes a segmentation of
the labor market: The one part of the labor force is permanently in stable and well-regulated, and the
flexibly employed part of the labor force is in unstable and irregular, respectively precarious
employment. This precarization of the flexible employed includes the aspects of low wages,
successive withdrawal of tariff-based protection regulations and short retention periods of employees
in companies. Along with this comes a lack of expertise-retention of flexible employees by the
company, as well as by the concerned themselves. Downgrading and an interconnected deficient
employability are the result.
Thus, flexible employment is no appropriate working form for the future. Especially the expertise-
retention of employees is a key factor for the success promising arrangement of the demographic
change in an aging society.
The Demographic Development in Germany
The eleventh population forecast of the German Federal Statistics Office (StatBA: 2010) basically
shows two main developments: The number of young people is declining; the number of older people
is rising. The reasons for this are well known. Declining birth rates, longer life expectancy and lower
positive balance of immigration are reasons for this demographic situation. The available manpower is
decreasing.
In 2000 there were 51,000,000 people available on the job market. In 2050 there will be only about
40,000,000 people. At the same time this development is closely connected to an aging workforce. In
2007 the 35 – 50 years old age group was the largest one represented in the work force. As early as
2020 this largest group will be the 50 – 60 years old. (StatBA: 2010) The number of people in the
young age groups is steadily decreasing while, at the same time, number of people in the older age
groups is growing. As the number of older employees in companies rises significantly, enterprises will
need forms of employment which guarantee the long-term expertise-retention of employees.
Basics of flexible employment
Definition of flexible employment
A flexible employment relationship differs in one or more areas from the normal labor condition,
respectively that it does not meet at least one criterion of normal working conditions.
In a positive definition of content a flexible working relationship features at least one of the following
criteria:

19
Forms of flexible employment
There are several forms of flexible employment, which are often classified according to their degree of
flexibility and the workforce planning dimensions. However, in the following only those forms of
flexible employment will be looked at more closely, which are quantitatively gaining importance.
These flexible employment relationships include:
• Temporary employment (+238% growth rate)
• Minor employment (+112% growth rate)
• part-time employment (+46% growth rate)
• Limited employment (+46% growth rate) (Source: Federal Statistical Office (a), micro-census,
2008)
The importance of flexible employment therefore has increased over the last few years: the share of
flexible employees has increased from 17.5% in 1997 to 25.5% in 2007. (Federal Statistical Office (b),
2008: 7).
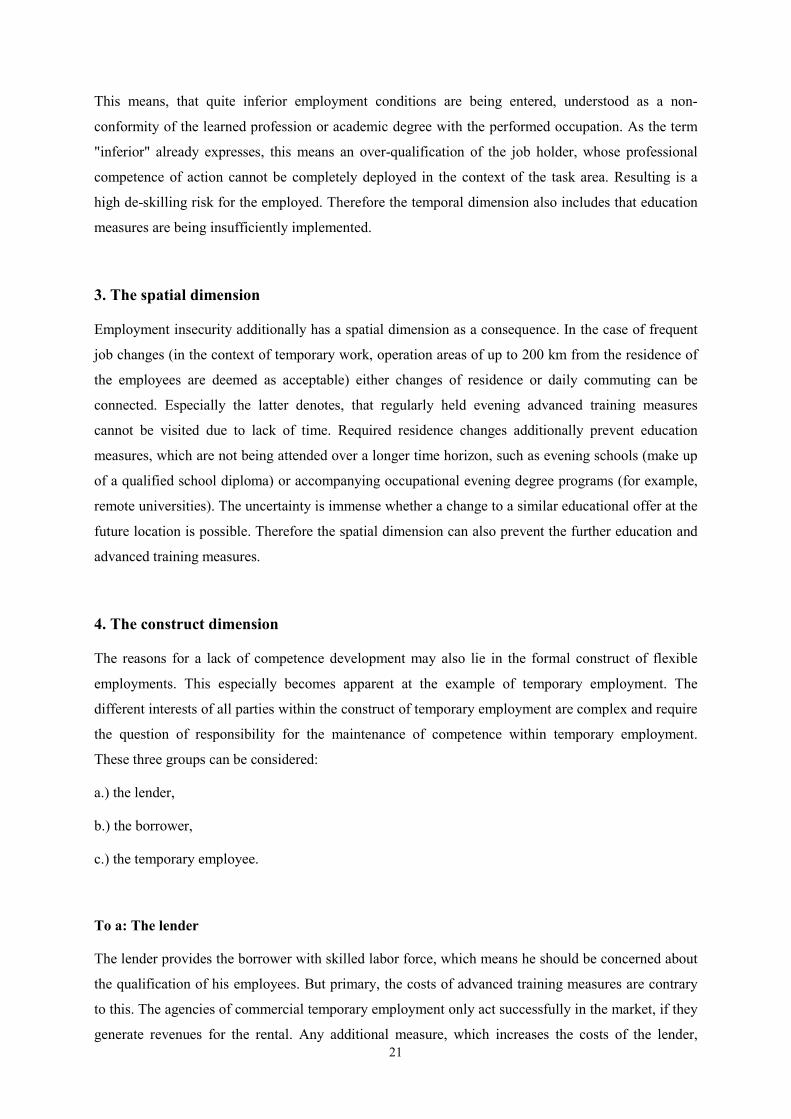
Effects of flexible employment on the expertise development
Principally it could be assumed, that the employer bears the responsibility for the maintenance of
competence of their employees. The reality is different however. According to the statements of the
Expert Commission Financing Lifelong Learning several types of flexible employment suffer from the
fact, that hardly any qualification adaptation to changed requirements for the target group of flexible
employees takes place, in the context of occupational advanced training. (see Commission of Experts,
2004)
Fig. 1: Characteristics of flexible employment; source: own illustration in dependance
on Haunschild, 2004: 199 et seqq.
No instruction
adhesion by the
employee to the
employer
Irregular or non
existence securing
compensation
No full-time
employment
Temporally
limited
employment
Limited effect of legal
and social protection
laws – no (full)
integration into the
social security systems
No clearly delineated
and unpredictably
fluctuating working
hours
No or inessential
parts of operational
workplaces
No employment
contract, but service-,
labor- or labor leasing
contract
Features of a flexible
employment
20
Thus, the following analyzes whether flexible employed have chances available, to educate themselves
in order to maintain or to advance their professional skills. At this juncture four key dimensions were
identified, which have a negative impact on the qualification in the context of flexible employment.
1. The income dimension
Flexible employment includes precarious potential. "Employment can be described as precarious, if
the employed fall, due to their occupation, distinctly under an income-, protection- and social
integration standard, which is defined and majoritarianly accepted in the present society. But even if
labor is associated with loss of meaning, recognition deficits and uncertainty of planning to the extent,
that social standards are being corrected in favor of the employees, they can be described as
precarious. "(Dörre, 2005: 252).
Precarious potential refers primarily to the income dimension, for example, the exclusion of flexible
employees from collective and company agreements should be mentioned here. (see Brinkmann et al.,
2006: 19). The temporary workers are being excluded from the principle of "equal payment" by the
establishment of own associations and correspondingly low ratified collective agreements. This
means that the income of temporary workers compared to those working in regular employment is
lower and holds precarious potential.
The other flexible employees also show a precarious income potential: It is self-explanatory that no
advanced training or further education can be financed on part of the employees, with the income of a
minor job (monthly income up to 800 €). This income is barely sufficient for the preservation of life,
the same applies to part-time employees. Low respectively precarious income therefore prevents the
person concerned to take over advanced training in personal responsibility. The private financing of
the training measure is not possible.
2. The temporal dimension
The temporal dimension - in terms of long-term employment stability and therefore job security –
hinders a longer-term planning of personal investment in education. If the employment security is cut,
the income security is also cut. On the one hand, the finance ability of advanced training measures is
being questioned again. On the other hand, the lack of employment stability means a more frequent
change of workplaces. Thus the question arises for the future field of activity following the currently
carried out function. As a chief example the temporary work employments should be mentioned. The
average retention time in a labor leasing company is three to six months. A goal-oriented educational
planning becomes impossible, since a follow-up employment is often not always taken up under the
aspect of qualification maintenance or even qualification build-up, but rather under the aspect of
preventing unemployment.
21
This means, that quite inferior employment conditions are being entered, understood as a non-
conformity of the learned profession or academic degree with the performed occupation. As the term
"inferior" already expresses, this means an over-qualification of the job holder, whose professional
competence of action cannot be completely deployed in the context of the task area. Resulting is a
high de-skilling risk for the employed. Therefore the temporal dimension also includes that education
measures are being insufficiently implemented.
3. The spatial dimension
Employment insecurity additionally has a spatial dimension as a consequence. In the case of frequent
job changes (in the context of temporary work, operation areas of up to 200 km from the residence of
the employees are deemed as acceptable) either changes of residence or daily commuting can be
connected. Especially the latter denotes, that regularly held evening advanced training measures
cannot be visited due to lack of time. Required residence changes additionally prevent education
measures, which are not being attended over a longer time horizon, such as evening schools (make up
of a qualified school diploma) or accompanying occupational evening degree programs (for example,
remote universities). The uncertainty is immense whether a change to a similar educational offer at the
future location is possible. Therefore the spatial dimension can also prevent the further education and
advanced training measures.
4. The construct dimension
The reasons for a lack of competence development may also lie in the formal construct of flexible
employments. This especially becomes apparent at the example of temporary employment. The
different interests of all parties within the construct of temporary employment are complex and require
the question of responsibility for the maintenance of competence within temporary employment.
These three groups can be considered:
a.) the lender,
b.) the borrower,
c.) the temporary employee.
To a: The lender
The lender provides the borrower with skilled labor force, which means he should be concerned about
the qualification of his employees. But primary, the costs of advanced training measures are contrary
to this. The agencies of commercial temporary employment only act successfully in the market, if they
generate revenues for the rental. Any additional measure, which increases the costs of the lender,
22
would have to be passed to the client, the borrower. This would give the lender competitive
disadvantages, compared to the agencies which relinquish costly qualification measures. Therefore,
the lenders will prefer to only take in already qualified employees at the beginning of an employment
relationship. Should a de-skilling and an associated lack of subletting of a temporary worker take
place, he/she can be released and replaced by a suitably qualified successor, or hence the required
requalification occurs.
Another negative aspect for the lender is that with a qualification of the temporary worker his
employability and thus his labor market value is increased. Thus the lender at once increases his risk to
lose the temporary worker to the borrower through the takeover into normal employment.
A third reason for the lender to abstain from qualification measures for his employees, are
organizational aspects. The lender seeks a temporarily consistent subletting phase of his employees,
because only then revenues are generated. If further education measures would be implemented within
a possible borrowing phase, costs would occur for the borrower in two ways: First, the revenues for
the rental would be omitted, secondly costs for the qualification would occur. Thus essentially only the
rental-free periods remain for the implementation of advanced training measures. But organizational
issues come into play here. Rental-free periods are very rarely able to be planned, the right
qualification measure therefore would have to be arbitrarily available. This situation is rather unlikely,
because individually accomplishable qualification offers would have to stand by (see Weinkopf, 2007:
51). The exception to this may represent e-learning. Summing up it can therefore be stated, that the
lender has little incentive to develop his employees.
To b: The borrower
It is unlikely that the borrower feels responsible for the maintenance or extension of competence of the
temporary worker. Because he has requested those workers from the labor leasing company, who
already have the adequate profile of requirements in order to perform the task that should be fulfilled.
Furthermore recent studies show, that the labor leasing company does not see itself in the
responsibility for the competency development of temporary workers. This is the summary of the
study by Axel Bolder, that development of competence in temporary work only occurs to a small
extent (see Bolder, 2007: 105). The obtained data in the survey of borrowers and labor leasing
companies show, that the temporary workers have to acquire their professional competence by
themselves. The results of a re-presentative study on skills development in temporary work by Seidel
and Münchhausen show, "..., that the skills development is perceived and taken into account very little
by the companies…" (Seidel, Münchhausen, 2007: 160).
23
To c: The temporary employee
If the temporary employment shows precarious dimensions, especially with respect to the income,
temporal and spatial, a conducted further education on one’s own responsibility will not take place.
The temporary worker is dependent on the support of third parties. However, since neither the
borrower nor the lender have little positive incentives to invest in the skills development of the
temporary worker, it will not take place.
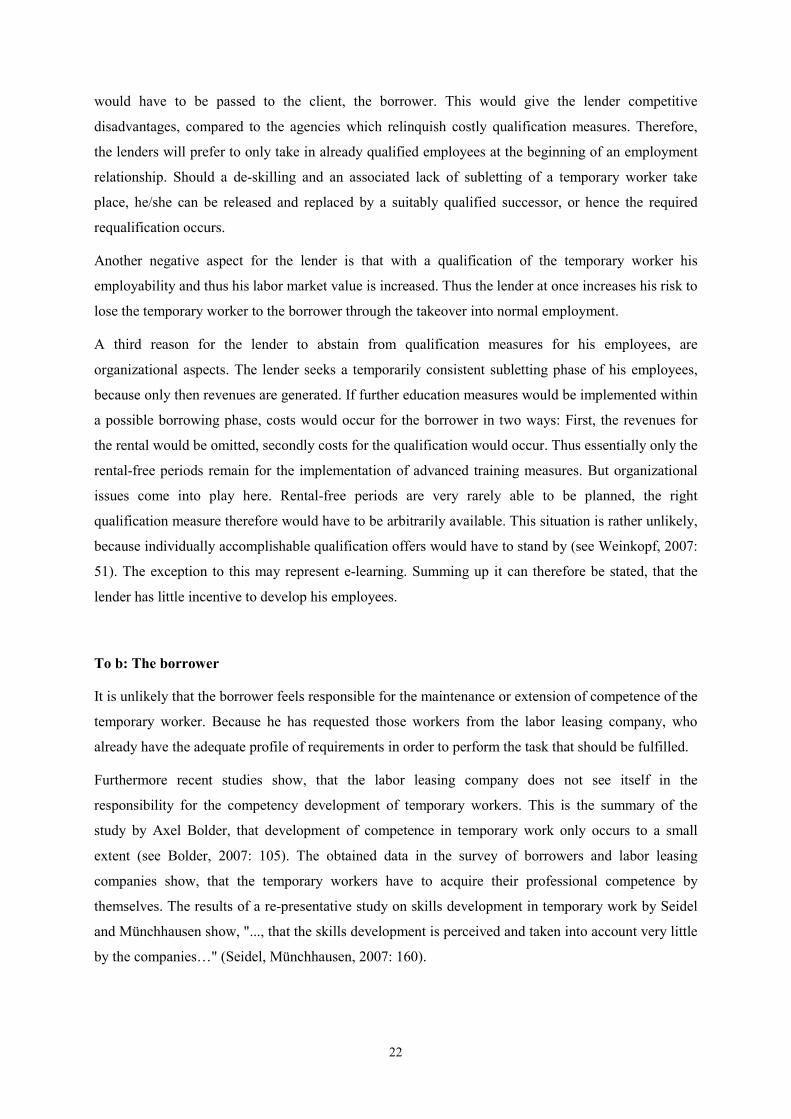
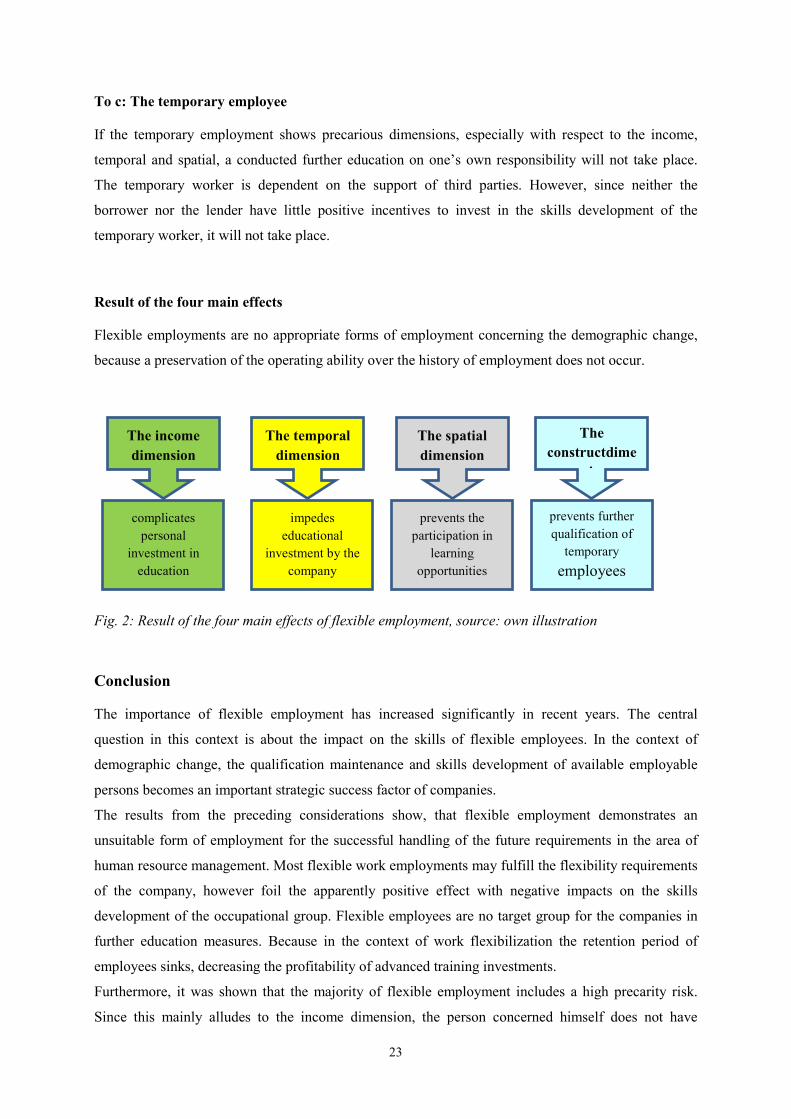
Result of the four main effects
Flexible employments are no appropriate forms of employment concerning the demographic change,
because a preservation of the operating ability over the history of employment does not occur.
Fig. 2: Result of the four main effects of flexible employment, source: own illustration
Conclusion
The importance of flexible employment has increased significantly in recent years. The central
question in this context is about the impact on the skills of flexible employees. In the context of
demographic change, the qualification maintenance and skills development of available employable
persons becomes an important strategic success factor of companies.
The results from the preceding considerations show, that flexible employment demonstrates an
unsuitable form of employment for the successful handling of the future requirements in the area of
human resource management. Most flexible work employments may fulfill the flexibility requirements
of the company, however foil the apparently positive effect with negative impacts on the skills
development of the occupational group. Flexible employees are no target group for the companies in
further education measures. Because in the context of work flexibilization the retention period of
employees sinks, decreasing the profitability of advanced training investments.
Furthermore, it was shown that the majority of flexible employment includes a high precarity risk.
Since this mainly alludes to the income dimension, the person concerned himself does not have
The income
dimension
The temporal
dimension
The spatial
dimension
The
constructdime
nsion
complicates
personal
investment in
education
impedes
educational
investment by the
company
prevents the
participation in
learning
opportunities
prevents further
qualification of
temporary employees

24
sufficient financial resources in order to invest in his personal employability. The resulting
consequences can be de-skilling and thus lacking long-term employability. The demand that staff has
the responsibility for their employability is ad absurdum.
A knowledge-based society should imperatively ensure that the growing proportion of employees,
who are in precarious and flexible employment relationships, become adequately qualified with regard
to the demographic development. Otherwise the demographic development will clarify the fatal
consequences of flexibilized employment, even if it only will be in a few years.
25
Literature
1. Bolder, A.: Kompetenzentwicklung in der Zeitarbeit: Die Aktivitäten von Zeitarbeit- und
Entleihunternehmen, in: Münchhausen, G. (Hrsg.): Kompetenzentwicklung in der Zeitarbeit – Potenziale und
Grenzen, Schriftenreihe des Bundesinstituts für Berufsbildung, Bonn, 2007, p. 97-106
2. Brinkmann, U., Dörre, K., Röbenack, S., Kraemer, K., Speidel, F.: Prekäre Arbeit. Ursachen, Ausmaß,
soziale Folgen und subjektive Verarbeitungsformen unsicherer Beschäftigungsverhältnisse, in: Wirtschafts-
und sozialpolitisches Forschungs- und Beratungszentrum der Friedrich-Ebert-Stiftung (Hrsg.), Abteilung
Arbeit und Sozialpolitik, Bonn, 2006
3. Däubler, W.: Perspektiven des Normalarbeitsverhältnisses, in: WSI-Mitteilungen 8/1988, p. 449-457
4. Dörre, K. (a): Entsicherte Arbeitsgesellschaft. Politik der Entprekarisierung, in: Widerspruch, Beiträge zu
sozialistischer Politik. Prekäre Arbeitsgesellschaften, Ausgabe 49, Basel, Zürich, 2005, p. 5-18
5. Dörre, K. (b): Prekariat – Eine arbeitspolitische Herausforderung, in: WSI-Mitteilungen 05/2005, p. 250-258
6. Galais, N., Moser, K., Münchhausen, G.: Arbeiten, Lernen und Weiterbildung in der Zeitarbeit – Eine
Befragung von Zeitarbeitnehmer/-innen in Deutschland, in: Münchhausen, G. (Hrsg.):
Kompetenzentwicklung in der Zeitarbeit – Potenziale und Grenzen, Schriftenreihe des Bundesinstituts für
Berufsbildung, Bonn, 2007, p. 161-178
7. Haunschild, A.: Flexible Beschäftigungsverhältnisse: Effizienz, institutionelle Voraussetzungen und
organisationale Konsequenzen, Habilitationsschrift für das Fach Betriebswirtschaftslehre, 2004, www1.uni-
hamburg.de/perso/Haunschild_Habil_2004.pdf, Abrufdatum 11.09.2007
8. Keller, B., Seifert, H.: Atypische Beschäftigungsverhältnisse: Flexibilität, soziale Sicherheit und Prekarität,
in: WSI Mitteilungen, 5/2006, p. 235-240
9. Kowalski, N.: Leiharbeit als neue Beschäftigungsform. Flexibilität als Markenzeichen, Berlin, 2006
Münchhausen, G. (Hrsg.): Kompetenzentwicklung in der Zeitarbeit – Potenziale und Grenzen, Schriftenreihe
des Bundesinstituts für Berufsbildung, Bonn, 2007
10.Preißing, D. (Hrsg.): Auswirkungen prekärer und atypischer Beschäftigungsverhältnisse auf die
Kompetenzentwicklung im demografischen Wandel, in: Erfolgreiches Personalmanagement im
demografischen Wandel, München, 2010, p. 195-225
11.Seidel, S., Münchhausen, G.: Kompetenzentwicklung in der Zeitarbeit – Repräsentativerhebung bei
Zeitarbeitsunternehmen, in: Münchhausen, G. (Hrsg.): Kompetenzentwicklung in der Zeitarbeit – Potenziale
und Grenzen, Schriftenreihe des Bundesinstituts für Berufsbildung, Bonn, 2007, p. 137-160
12. Statistisches Bundesamt, Mikrozensus, 2010
13. Statistisches Bundesamt (a), Mikrozensus, 2008
14. Statistisches Bundesamt (b) (Hrsg.): Atypische Beschäftigung auf dem deutschen Arbeitsmarkt, Wiesbaden,
2008
15. Weinkopf, C.: Qualifizierung in der vermittlungsorientierten Arbeitnehmerüberlassung, in: Münchhausen, G.
(Hrsg.), Kompetenzentwicklung in der Zeitarbeit – Potenziale und Grenzen, Schriftenreihe des
Bundesinstituts für Berufsbildung, Bonn, 2007, p. 45-54

26
Prof. Dr. Michael Huth / Prof. Dr. Dirk Lohre
Risk Management in Logistics Enterprises: Results of an Empirical Study
Prof. Dr. Michael Huth
Germany, Fulda University of Applied Sciences
Email: [email protected], Phone: +49 (0)661 9640-250
Prof. Dr. Dirk Lohre
Germany, Heilbronn University
Email: [email protected], Phone: +49 (0)7131 504-252
Abstract
Recent developments and events – e.g. trend to globalization, outsourcing activities, shorter life time
cycles, but also natural disasters and others – have led to the increase of risks in business. Therefore,
risk management has been identified as one of the important management tasks to support reaching the
objectives of a company. This is in particular true in supply chain management, a management area
focusing on planning, controlling, and monitoring material, information, and financial flows in a
network of companies and institutions. In academic research, so-called supply chain risk management
is a relatively new research area, starting in the middle of the 90s of the recent century. Usually,
supply chain risk management focuses on industrial institutions that are connected by a supplier-
customer-relationship, but often ignores to incorporate companies that build a link between two
industrial partners. Those ‘missing links’ are logistics enterprises that offer a wide range of logistics
services (for example, transportation, warehousing, handling, value-added services).
The authors’ objective is to document and analyze the current status of risk management in logistics
enterprises. They had conducted a first empirical study in 2008/2009, analyzing data from some 80
logistics enterprises in Germany. The data enabled them to document the ‘state of the art’ of risk
management in the logistics industry. In 2011, a follow-up study had been conducted to track the
developments in this industry. This study incorporates answers from some 70 logistics companies in
Germany. Beside the documentation of the status quo and of possible developments in the logistics
industry, this study shows how logistics companies reacted to the global financial and economic crisis
in 2009/2010.
The paper intends to highlight the most important findings from the 2011 field study and to evaluate
the status quo of risk management in logistics enterprises. It also specifies room for improvement to
reach a higher level of professionalism in risk management for the focused industry.
27
Introduction
Recent developments and events – e.g. trend to globalization, outsourcing activities, shorter life time
cycles, but also natural disasters and others – have led to the increase of risks in business (see
examples in Sheffi, 2005, pp. 3-13 and 17-21). Therefore, risk management has been identified as one
of the important management tasks to support reaching the objectives of a company (Hampton, 2009,
pp. 10-13). This is in particular true in supply chain management, a management area focusing on
planning, controlling, and monitoring material, information, and financial flows in a network of
companies and institution. In academic research, so-called supply chain risk management is a
relatively new research area, starting in the middle of the 90s of the recent century. Usually, supply
chain risk management focuses on industrial institutions that are connected by a supplier-customer-
relationship, but often ignores to incorporate companies that build a link between two industrial
partners. Those ‘missing links’ are logistics enterprises that offer a wide range of logistics services (for
example, transportation, warehousing, handling, value-added services).
In 2008, the authors conducted a first empirical study to analyze the status quo of risk management in
the logistics industry. For this study, data from some 80 logistics enterprises in Germany had been
analyzed. The data showed that risk management in the logistics industry was only rudimentary put
into practice (Huth/Lohre, 2009, p. 31). The authors also assumed that both the requirements of
stakeholders (banks, insurance companies, auditors, but also customers) and the starting global
financial and economic crisis would lead to an increased set-up and use of a structured risk
management in the industry (Huth/Lohre, 2009, pp. 31-32).
The first empirical study was followed by a second field-study in 2011 to track the developments in
the logistics industry. This study incorporates answers from some 70 logistics companies in Germany.
The most important findings from the 2011 field study are highlighted in this paper. Furthermore, the
paper evaluates the status quo of risk management in logistics enterprises, compares it with the status
of 2008/2009 and specifies room for improvement to reach a higher level of professionalism in risk
management for the focused industry. The study also analyzes, if logistics companies reacted to the
global financial and economic crisis in 2009/2010. (All results from the 2008 field study are taken
from Huth/Lohre, 2009.)
The paper is structured as follows: Next chapter will give a brief introduction to risk management, so
that the results of the analysis can be connected to concepts, tools, and methods in risk management.
Subsequently, the 2011 field study is presented. First, the general information of the study is
explained. Next, the paper discusses the top types of risk from the perspective of logistics enterprises.
Finally, the current status of risk management in the logistics industry is discussed, focusing on
different implementation and usage aspects. The paper concludes with a summary and an outlook to
possible future developments.
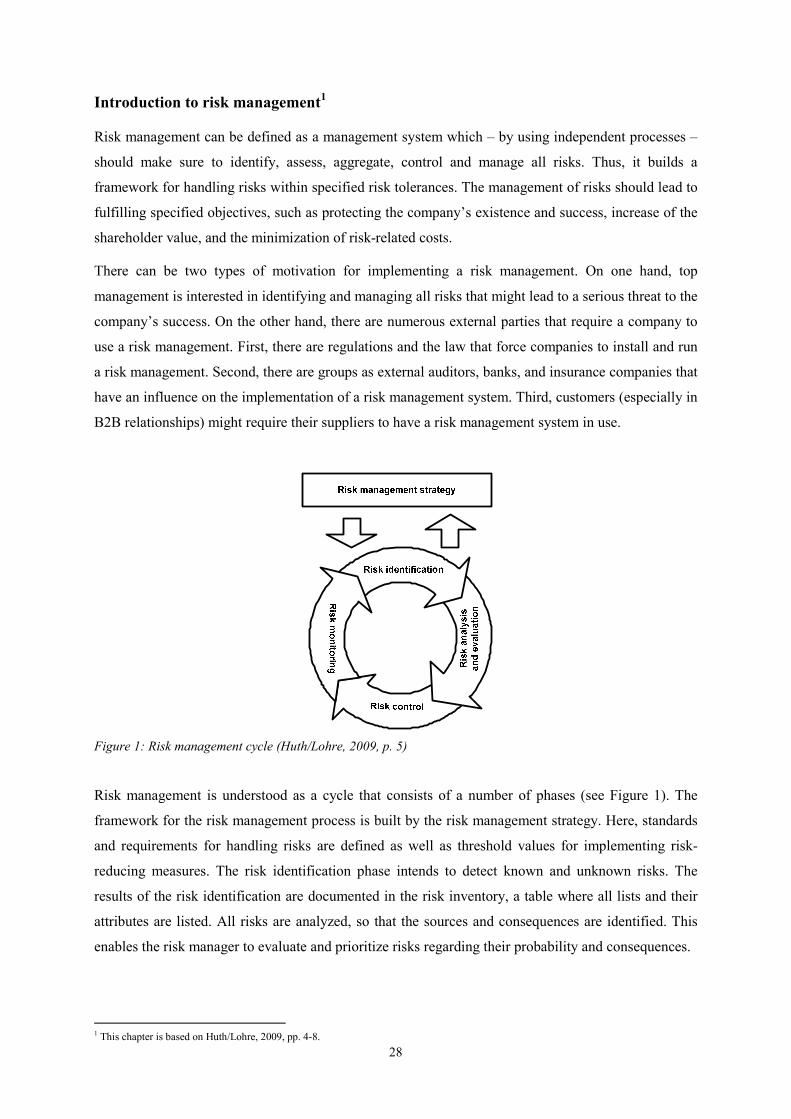
28
Introduction to risk management1
Risk management can be defined as a management system which – by using independent processes –
should make sure to identify, assess, aggregate, control and manage all risks. Thus, it builds a
framework for handling risks within specified risk tolerances. The management of risks should lead to
fulfilling specified objectives, such as protecting the company’s existence and success, increase of the
shareholder value, and the minimization of risk-related costs.
There can be two types of motivation for implementing a risk management. On one hand, top
management is interested in identifying and managing all risks that might lead to a serious threat to the
company’s success. On the other hand, there are numerous external parties that require a company to
use a risk management. First, there are regulations and the law that force companies to install and run
a risk management. Second, there are groups as external auditors, banks, and insurance companies that
have an influence on the implementation of a risk management system. Third, customers (especially in
B2B relationships) might require their suppliers to have a risk management system in use.
Figure 1: Risk management cycle (Huth/Lohre, 2009, p. 5)
Risk management is understood as a cycle that consists of a number of phases (see Figure 1). The
framework for the risk management process is built by the risk management strategy. Here, standards
and requirements for handling risks are defined as well as threshold values for implementing risk-
reducing measures. The risk identification phase intends to detect known and unknown risks. The
results of the risk identification are documented in the risk inventory, a table where all lists and their
attributes are listed. All risks are analyzed, so that the sources and consequences are identified. This
enables the risk manager to evaluate and prioritize risks regarding their probability and consequences.
1 This chapter is based on Huth/Lohre, 2009, pp. 4-8.
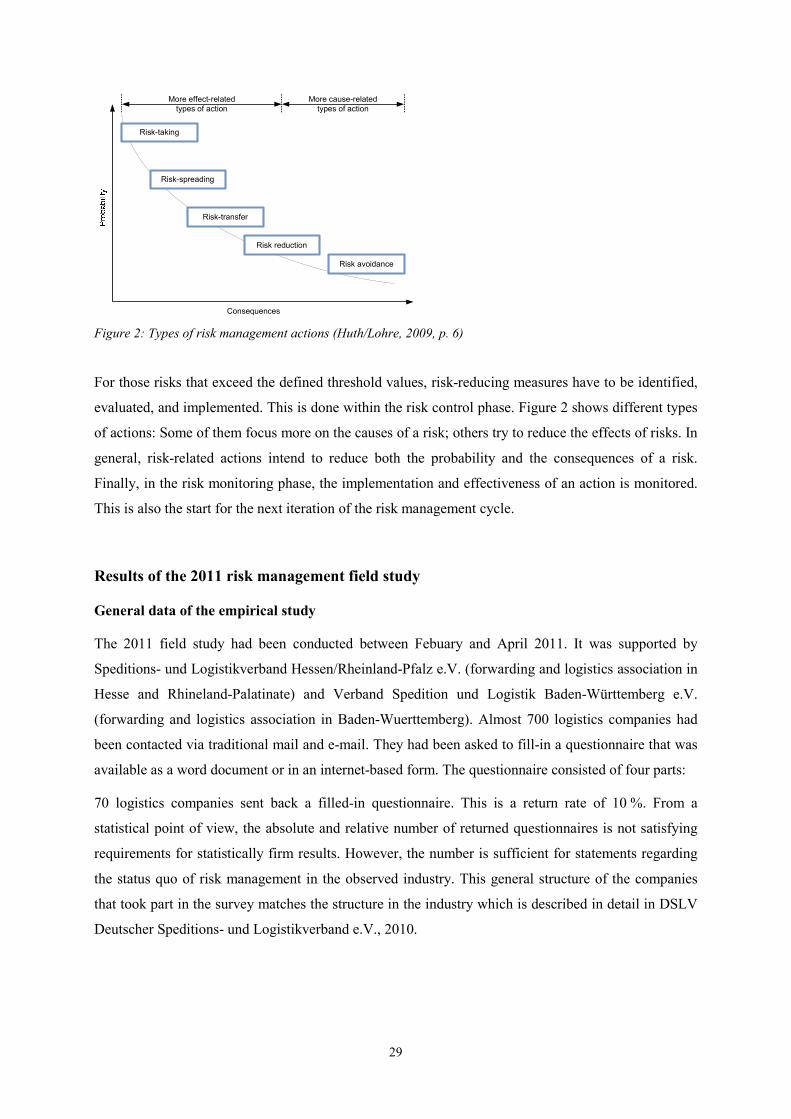
29
Figure 2: Types of risk management actions (Huth/Lohre, 2009, p. 6)
For those risks that exceed the defined threshold values, risk-reducing measures have to be identified,
evaluated, and implemented. This is done within the risk control phase. Figure 2 shows different types
of actions: Some of them focus more on the causes of a risk; others try to reduce the effects of risks. In
general, risk-related actions intend to reduce both the probability and the consequences of a risk.
Finally, in the risk monitoring phase, the implementation and effectiveness of an action is monitored.
This is also the start for the next iteration of the risk management cycle.
Results of the 2011 risk management field study
General data of the empirical study
The 2011 field study had been conducted between Febuary and April 2011. It was supported by
Speditions- und Logistikverband Hessen/Rheinland-Pfalz e.V. (forwarding and logistics association in
Hesse and Rhineland-Palatinate) and Verband Spedition und Logistik Baden-Württemberg e.V.
(forwarding and logistics association in Baden-Wuerttemberg). Almost 700 logistics companies had
been contacted via traditional mail and e-mail. They had been asked to fill-in a questionnaire that was
available as a word document or in an internet-based form. The questionnaire consisted of four parts:
70 logistics companies sent back a filled-in questionnaire. This is a return rate of 10 %. From a
statistical point of view, the absolute and relative number of returned questionnaires is not satisfying
requirements for statistically firm results. However, the number is sufficient for statements regarding
the status quo of risk management in the observed industry. This general structure of the companies
that took part in the survey matches the structure in the industry which is described in detail in DSLV
Deutscher Speditions- und Logistikverband e.V., 2010.
Risk-transfer
Consequences
Risk avoidance
Risk-taking
Risk reduction
Risk-spreading
More effect-related
types of action
More cause-related
types of action
30
Important types of risk for logistics enterprises
There are many different approaches to classify types of risk. For example, Wolke differentiates
between financial and performance-oriented risks and breaks them further down into more details risk
categories (Wolke 2008, p. 7). For this study (and the first empirical study in 2008), the authors
developed a list with 14 different types of risk. The participants were asked for the top risks for the
logistics industry for today and for the future (within 5 to 10 years). Although an overview over
today’s risks might be of interest, the more interesting is an overview over tomorrow’s risks, as shown
in table 1.
Table 1: Top future risks (in brackets: development compared to status in the 2008 field-study)
2008 field-study 2011 field study
Human resources
Politics
Energy costs
Customer-related risks
Operational risks, competition
Human resources (�)
Energy costs (�)
Operational risks (�)
Politics (�)
Competition (�)
The top future risk, seen both in the 2008 field-study and in the current study, is human resource
related risk. There might be two reasons for this type of risk: On one hand, the lack for truck drivers in
Germany has been and will be increasing already in the near future, because the demand for drivers is
still rising, and at the same time the number of job candidates is decreasing (Bundesamt für
Güterverkehr, 2012, pp. 24-25). On the other hand, many companies realize that often their business is
becoming more complex, e.g. due to increased contractual logistics projects. To be able to handle this
complexity companies need graduates or junior managers with a profound background of knowledge.
They might identify the gap between their demand for graduates and the ‘supply’ as a major risk for
the future.
Beside human resource related risks, risks related to the (increase of) energy costs are ranked as the
second most important future type of risk. For logistics companies, energy costs are a major driver of
total cost. Often, this type of cost adds up to between 25 %and 33 % of the company’s total cost
(Bundesamt für Güterverkehr, 2012, p. 24). Therefore, they can strongly influence a company’s
profitability. This fact, plus the relatively low margins in many logistics area (except contractual
logistics) and the volatility in energy prices, leads to energy costs seen as one of the top risks in
logistics.
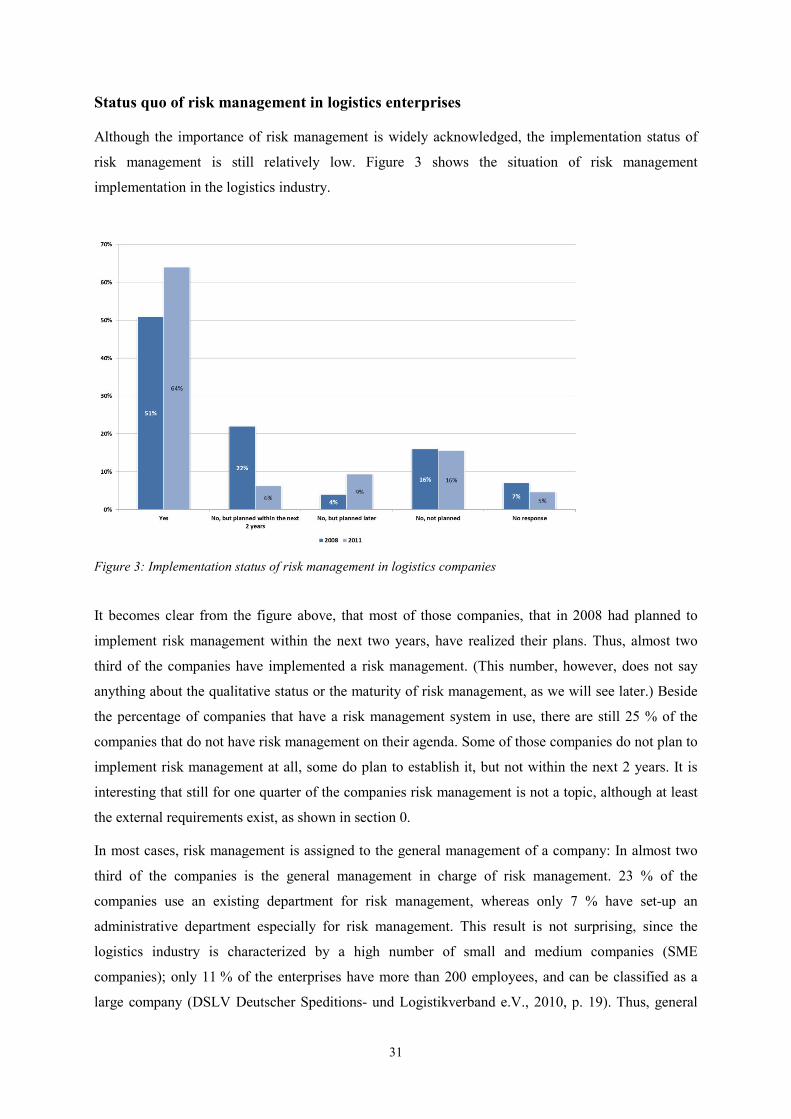
Status quo of risk management in logistics enterprises
Although the importance of risk management is widely acknowledged, the implementation status of
risk management is still relatively low.
implementation in the logistics industry.
Figure 3: Implementation status of risk
It becomes clear from the figure above, that most of those companies, that in 2008 had planned to
implement risk management within the next two years, have realized their plans. Thus, almost two
third of the companies have implemented a risk management. (This number, however, does not say
anything about the qualitative status or the maturity of risk management, as we will see later.) Beside
the percentage of companies that have a risk management system in use, there are st
companies that do not have risk management on their agenda. Some of those companies do not plan to
implement risk management at all, some do plan to establish it, but not within the next 2 years. It is
interesting that still for one quarter
the external requirements exist, as shown in section
In most cases, risk management is assigned to the general management of a company: In almost two
third of the companies is the general management in charge of risk management. 23 % of the
companies use an existing department for risk management, whereas only 7 % have set
administrative department especially for risk management. This result is not surprising, since the
logistics industry is characterized by a high number of small and medium companies (SME
companies); only 11 % of the enterprises have more than 200 employees,
large company (DSLV Deutscher Speditions
31
Status quo of risk management in logistics enterprises
Although the importance of risk management is widely acknowledged, the implementation status of
risk management is still relatively low. Figure 3 shows the situation of risk management
implementation in the logistics industry.
: Implementation status of risk management in logistics companies
It becomes clear from the figure above, that most of those companies, that in 2008 had planned to
implement risk management within the next two years, have realized their plans. Thus, almost two
e implemented a risk management. (This number, however, does not say
anything about the qualitative status or the maturity of risk management, as we will see later.) Beside
the percentage of companies that have a risk management system in use, there are st
companies that do not have risk management on their agenda. Some of those companies do not plan to
implement risk management at all, some do plan to establish it, but not within the next 2 years. It is
interesting that still for one quarter of the companies risk management is not a topic, although at least
the external requirements exist, as shown in section 0.
gement is assigned to the general management of a company: In almost two
third of the companies is the general management in charge of risk management. 23 % of the
companies use an existing department for risk management, whereas only 7 % have set
ministrative department especially for risk management. This result is not surprising, since the
logistics industry is characterized by a high number of small and medium companies (SME
% of the enterprises have more than 200 employees, and can be classified as a
large company (DSLV Deutscher Speditions- und Logistikverband e.V., 2010, p. 19). Thus, general
Although the importance of risk management is widely acknowledged, the implementation status of
shows the situation of risk management
It becomes clear from the figure above, that most of those companies, that in 2008 had planned to
implement risk management within the next two years, have realized their plans. Thus, almost two
e implemented a risk management. (This number, however, does not say
anything about the qualitative status or the maturity of risk management, as we will see later.) Beside
the percentage of companies that have a risk management system in use, there are still 25 % of the
companies that do not have risk management on their agenda. Some of those companies do not plan to
implement risk management at all, some do plan to establish it, but not within the next 2 years. It is
of the companies risk management is not a topic, although at least
gement is assigned to the general management of a company: In almost two
third of the companies is the general management in charge of risk management. 23 % of the
companies use an existing department for risk management, whereas only 7 % have set-up an
ministrative department especially for risk management. This result is not surprising, since the
logistics industry is characterized by a high number of small and medium companies (SME
and can be classified as a
und Logistikverband e.V., 2010, p. 19). Thus, general
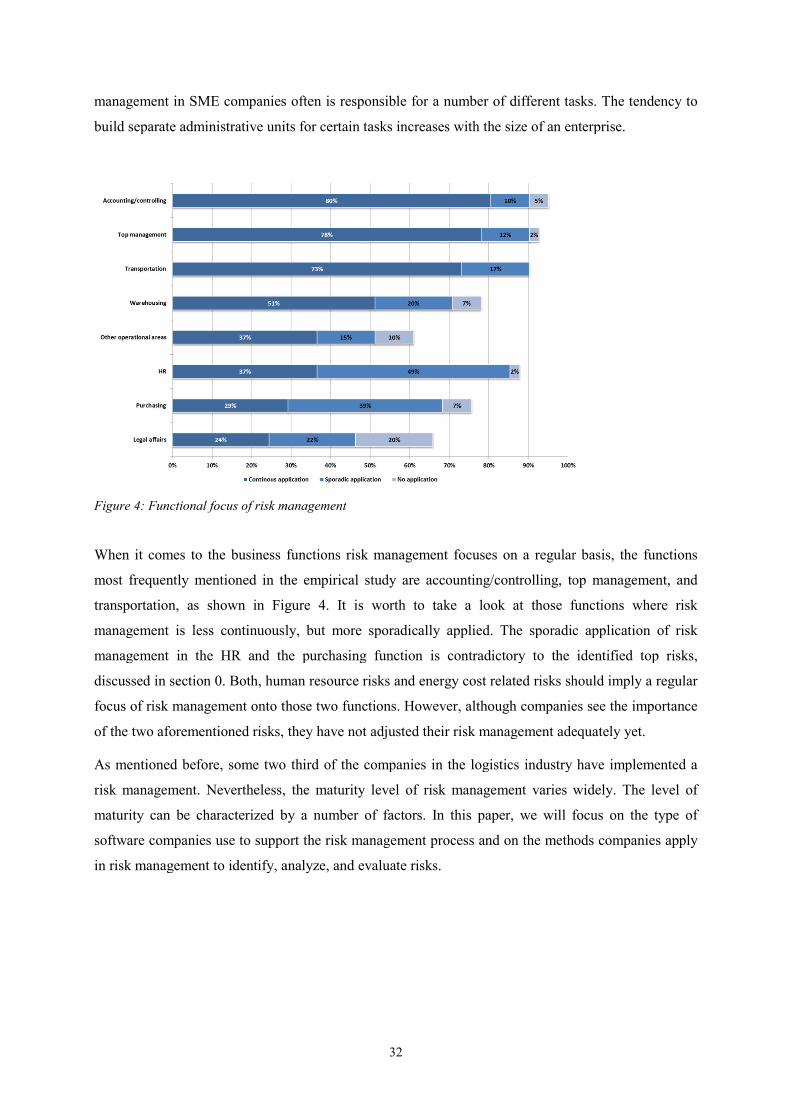
management in SME companies often is responsible for a number of different tasks. The tendency to
build separate administrative units
Figure 4: Functional focus of risk management
When it comes to the business functions risk management focuses on a regular basis, the functions
most frequently mentioned in the empirical study are accounting/controlling, top management, and
transportation, as shown in Figure
management is less continuously, but more sporadically applied. The sporadic application of risk
management in the HR and the purchasing function is contradictory to the identified top risks,
discussed in section 0. Both, human resource risks and energy cost related risks should imply a regular
focus of risk management onto those two function
of the two aforementioned risks, they have not adjusted their risk management adequately yet.
As mentioned before, some two third of the companies in the logistics industry have implemented a
risk management. Nevertheless, the maturity level of risk management varies widely. The level of
maturity can be characterized by a number of factors. In this paper, we will focus on the type of
software companies use to support the risk management process and on the me
in risk management to identify, analyze, and evaluate risks.
32
management in SME companies often is responsible for a number of different tasks. The tendency to
build separate administrative units for certain tasks increases with the size of an enterprise.
: Functional focus of risk management
When it comes to the business functions risk management focuses on a regular basis, the functions
ned in the empirical study are accounting/controlling, top management, and
Figure 4. It is worth to take a look at those functions where risk
management is less continuously, but more sporadically applied. The sporadic application of risk
management in the HR and the purchasing function is contradictory to the identified top risks,
. Both, human resource risks and energy cost related risks should imply a regular
focus of risk management onto those two functions. However, although companies see the importance
of the two aforementioned risks, they have not adjusted their risk management adequately yet.
As mentioned before, some two third of the companies in the logistics industry have implemented a
t. Nevertheless, the maturity level of risk management varies widely. The level of
maturity can be characterized by a number of factors. In this paper, we will focus on the type of
software companies use to support the risk management process and on the methods companies apply
in risk management to identify, analyze, and evaluate risks.
management in SME companies often is responsible for a number of different tasks. The tendency to
for certain tasks increases with the size of an enterprise.
When it comes to the business functions risk management focuses on a regular basis, the functions
ned in the empirical study are accounting/controlling, top management, and
. It is worth to take a look at those functions where risk
management is less continuously, but more sporadically applied. The sporadic application of risk
management in the HR and the purchasing function is contradictory to the identified top risks,
. Both, human resource risks and energy cost related risks should imply a regular
s. However, although companies see the importance
of the two aforementioned risks, they have not adjusted their risk management adequately yet.
As mentioned before, some two third of the companies in the logistics industry have implemented a
t. Nevertheless, the maturity level of risk management varies widely. The level of
maturity can be characterized by a number of factors. In this paper, we will focus on the type of
thods companies apply
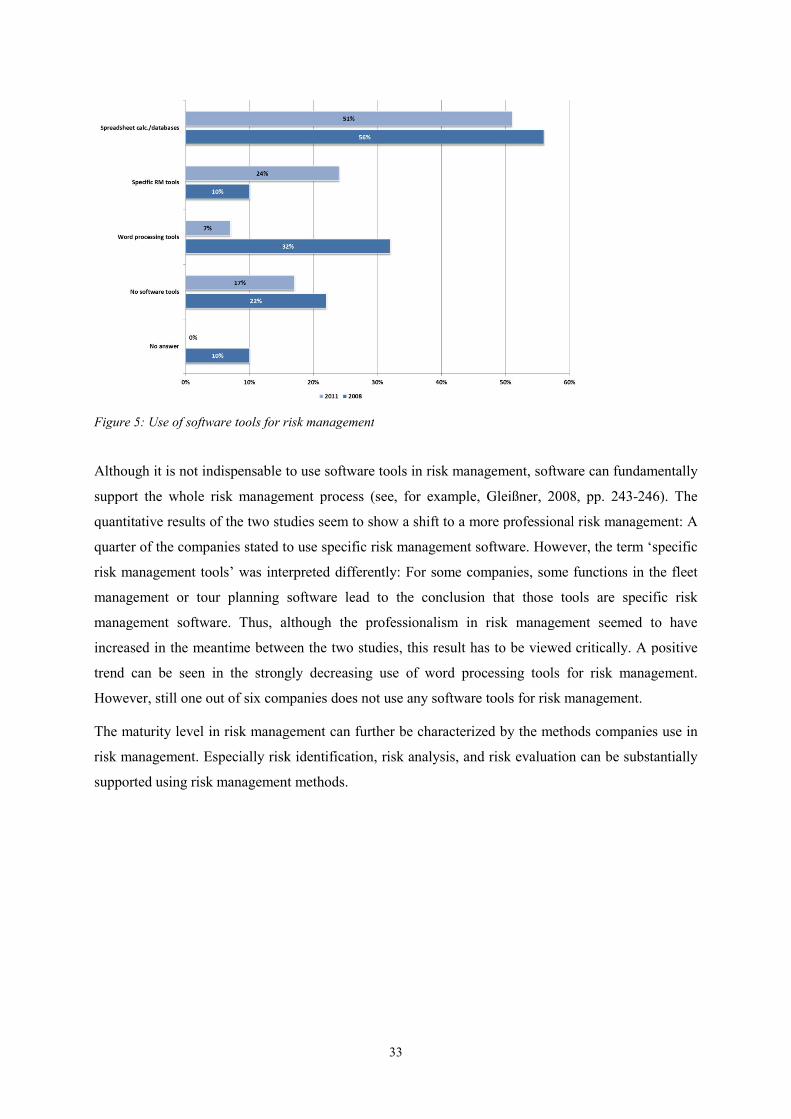
Figure 5: Use of software tools for risk management
Although it is not indispensable to use software tools in risk management, software can
support the whole risk management process (see, for example, Gleißner, 2008, pp. 243
quantitative results of the two studies seem to show a shift to a more professional risk management: A
quarter of the companies stated to use speci
risk management tools’ was interpreted differently: For some companies, some functions in the fleet
management or tour planning software lead to the conclusion that those tools are specific risk
management software. Thus, although the professionalism in risk management seemed to have
increased in the meantime between the two studies, this result has to be viewed critically. A positive
trend can be seen in the strongly decreasing use of word processin
However, still one out of six companies does not use any software tools for risk management.
The maturity level in risk management can further be characterized by the methods companies use in
risk management. Especially risk id
supported using risk management methods.
33
: Use of software tools for risk management
Although it is not indispensable to use software tools in risk management, software can
support the whole risk management process (see, for example, Gleißner, 2008, pp. 243
quantitative results of the two studies seem to show a shift to a more professional risk management: A
quarter of the companies stated to use specific risk management software. However, the term ‘specific
risk management tools’ was interpreted differently: For some companies, some functions in the fleet
management or tour planning software lead to the conclusion that those tools are specific risk
agement software. Thus, although the professionalism in risk management seemed to have
increased in the meantime between the two studies, this result has to be viewed critically. A positive
trend can be seen in the strongly decreasing use of word processing tools for risk management.
However, still one out of six companies does not use any software tools for risk management.
The maturity level in risk management can further be characterized by the methods companies use in
risk management. Especially risk identification, risk analysis, and risk evaluation can be substantially
supported using risk management methods.
Although it is not indispensable to use software tools in risk management, software can fundamentally
support the whole risk management process (see, for example, Gleißner, 2008, pp. 243-246). The
quantitative results of the two studies seem to show a shift to a more professional risk management: A
fic risk management software. However, the term ‘specific
risk management tools’ was interpreted differently: For some companies, some functions in the fleet
management or tour planning software lead to the conclusion that those tools are specific risk
agement software. Thus, although the professionalism in risk management seemed to have
increased in the meantime between the two studies, this result has to be viewed critically. A positive
g tools for risk management.
However, still one out of six companies does not use any software tools for risk management.
The maturity level in risk management can further be characterized by the methods companies use in
entification, risk analysis, and risk evaluation can be substantially
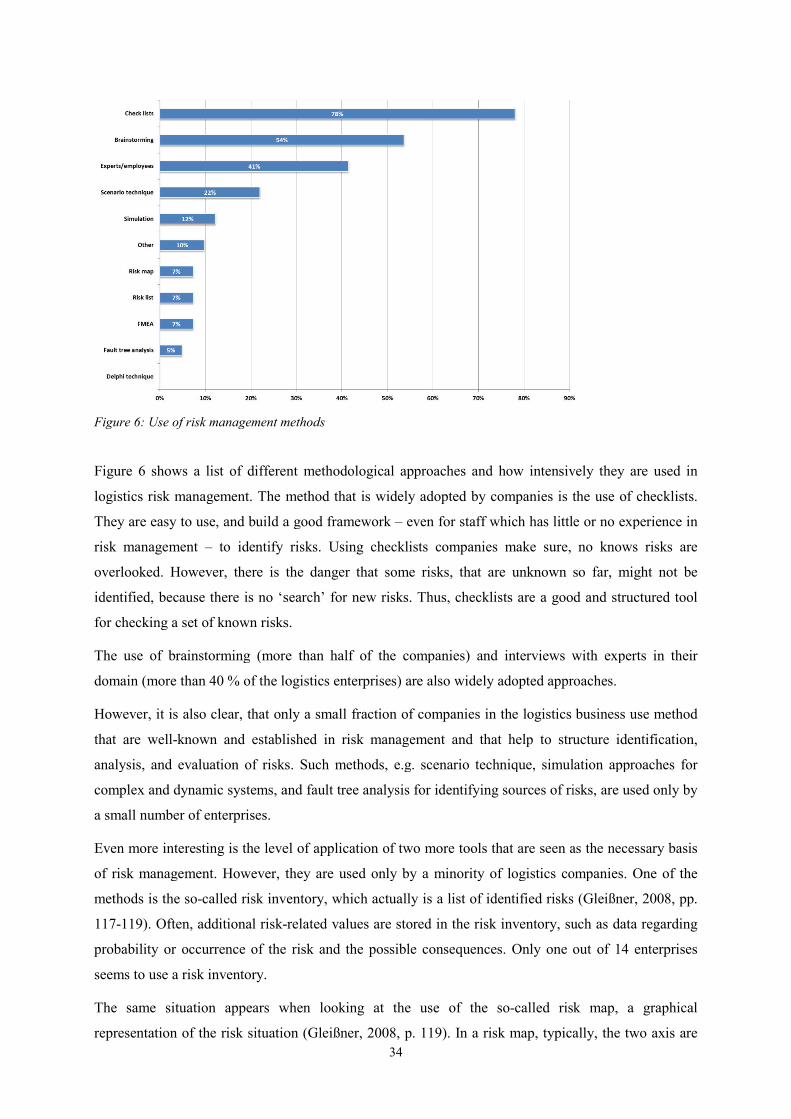
Figure 6: Use of risk management methods
Figure 6 shows a list of different methodological approaches and how intensively they are used in
logistics risk management. The method that is widely adopted by companies is the use of checklists.
They are easy to use, and build a good framework
risk management – to identify risks. Using checklists companies make sure, no knows risks are
overlooked. However, there is the danger that some risks, that are unknown so far, mi
identified, because there is no ‘search’ for new risks. Thus, checklists are a good and structured tool
for checking a set of known risks.
The use of brainstorming (more than half of the companies) and interviews with experts in their
domain (more than 40 % of the logistics enterprises) are also widely adopted approaches.
However, it is also clear, that only a small fraction of companies in the logistics business use method
that are well-known and established in risk management and that help to s
analysis, and evaluation of risks. Such methods, e.g. scenario technique, simulation approaches for
complex and dynamic systems, and fault tree analysis for identifying sources of risks, are used only by
a small number of enterprises.
Even more interesting is the level of application of two more tools that are seen as the necessary basis
of risk management. However, they are used only by a minority of logistics companies. One of the
methods is the so-called risk inventory, which
117-119). Often, additional risk-
probability or occurrence of the risk and the possible consequences. Only one out of 14 ent
seems to use a risk inventory.
The same situation appears when looking at the use of the so
representation of the risk situation (Gleißner, 2008, p. 119). In a risk map, typically, the two axis are
34
: Use of risk management methods
shows a list of different methodological approaches and how intensively they are used in
logistics risk management. The method that is widely adopted by companies is the use of checklists.
build a good framework – even for staff which has little or no experience in
to identify risks. Using checklists companies make sure, no knows risks are
overlooked. However, there is the danger that some risks, that are unknown so far, mi
identified, because there is no ‘search’ for new risks. Thus, checklists are a good and structured tool
for checking a set of known risks.
The use of brainstorming (more than half of the companies) and interviews with experts in their
re than 40 % of the logistics enterprises) are also widely adopted approaches.
However, it is also clear, that only a small fraction of companies in the logistics business use method
known and established in risk management and that help to structure identification,
analysis, and evaluation of risks. Such methods, e.g. scenario technique, simulation approaches for
complex and dynamic systems, and fault tree analysis for identifying sources of risks, are used only by
Even more interesting is the level of application of two more tools that are seen as the necessary basis
of risk management. However, they are used only by a minority of logistics companies. One of the
called risk inventory, which actually is a list of identified risks (Gleißner, 2008, pp.
-related values are stored in the risk inventory, such as data regarding
probability or occurrence of the risk and the possible consequences. Only one out of 14 ent
The same situation appears when looking at the use of the so-called risk map, a graphical
representation of the risk situation (Gleißner, 2008, p. 119). In a risk map, typically, the two axis are
shows a list of different methodological approaches and how intensively they are used in
logistics risk management. The method that is widely adopted by companies is the use of checklists.
even for staff which has little or no experience in
to identify risks. Using checklists companies make sure, no knows risks are
overlooked. However, there is the danger that some risks, that are unknown so far, might not be
identified, because there is no ‘search’ for new risks. Thus, checklists are a good and structured tool
The use of brainstorming (more than half of the companies) and interviews with experts in their
re than 40 % of the logistics enterprises) are also widely adopted approaches.
However, it is also clear, that only a small fraction of companies in the logistics business use method
tructure identification,
analysis, and evaluation of risks. Such methods, e.g. scenario technique, simulation approaches for
complex and dynamic systems, and fault tree analysis for identifying sources of risks, are used only by
Even more interesting is the level of application of two more tools that are seen as the necessary basis
of risk management. However, they are used only by a minority of logistics companies. One of the
actually is a list of identified risks (Gleißner, 2008, pp.
related values are stored in the risk inventory, such as data regarding
probability or occurrence of the risk and the possible consequences. Only one out of 14 enterprises
called risk map, a graphical
representation of the risk situation (Gleißner, 2008, p. 119). In a risk map, typically, the two axis are
35
used for the probability or frequency of a risk and for the average (or maximum) consequences.
Although a risk map is an easy to use tool, again only 7 % of the companies with a risk management
system use this approach.
Another interesting finding is the relatively low usage of the failure mode and effect analysis (FMEA).
This method allows for documenting most activities of the ri sk management process in a single
document. It is widely used in the automotive industry. Although 44 % of the logistics enterprises
realize services in and for the automotive industry, only 7 % of all companies use FMEA.
Thus, while the use of checklists, brainstorming and expert interviews can be expected, since they are
easy to apply methods, the low degree of application of other typical and well-established risk
management tools leads to the conclusion, that risk management in the logistics business is still on a
low maturity level.
Summary and outlook
When comparing the results of the 2011 study with those from the 2008 study, it becomes clear that
the implementation of risk management in the logistics sector made progress. More logistics
companies use a risk management system. However, still a fraction of some 25 % of the enterprises
does not have plans to realize a risk management within the next two years. Those companies might
not be sufficiently prepared for either the realization of risks (or an economic crisis as in 2009/2010)
or for requirements by their customers to prove using a risk management system.
Beside the increasing percentage of companies with a risk management system, risk management is
still on a relatively low maturity level. This had been shown focusing on two aspects. On one hand,
risk management is only partially supported by IT systems. Although, it might not be appropriate –
especially for small and medium enterprises – to use a high-end risk management tool, the use of risk
management software can structure the risk management process and can help to make the risk
situation transparent. The second aspect is the use of state-of-the-art methods to identify, analyze, and
evaluate risks. Here, only a small number of companies use established approaches such as risk
inventory, risk maps, or FMEA. Thus, for logistics companies, there is still room for increasing the
maturity level of their risk management system that helps them to stay competitive in the market.
36
References
1. Bundesamt für Güterverkehr (2012): Marktbeobachtung Güterverkehr – Jahresbericht 2011, Cologne,
http://www.bag.bund.de/SharedDocs/Downloads/DE/Marktbeobachtung/Herbst_und_Jahresberichte/Markt_
2011_Jahresber.pdf?__blob=publicationFile.
2. DSLV Deutscher Speditions- und Logistikverband e.V. (2010): Zahlen, Daten, Fakten aus Spedition und
Logistik 2010, Bonn.
3. Gleißner, W. (2008): Grundlagen des Risikomanagements im Unternehmen, Munich.
4. Hampton, J. J. (2009): Fundamentals of Enterprise Risk Management – How Top Companies Assess Risk,
Manage Exposure, and Seize Opportunity, New York.
5. Huth, M. (2010): Entwicklung eines logistisch orientierten Risikomanagements, in: Praxishandbuch Logistik,
edited by U. Pradel et al., Cologne, chapter 3.3.18, pp. 1-18.
6. Huth, M./Lohre, D. (2009): Risikomanagement in der Speditions- und Logistikbranche – Bestandsaufnahme
zu Verbreitung und Reifegrad, edited by Speditions- und Logistikverband Hessen/Rheinland e.V.,
Frankfurt/Main.
7. Sheffi, Y. (2005): The Resilient Enterprise – Overcoming Vulnerability for Competitive Advantage,
Cambridge.
8. Wolke, T. (2008): Risikomanagement, 2nd edition, Munich.
37
Dominik Och, MA
The risk awareness and the degree of implementation of systematic
Enterprise Risk Management in the economic region Fulda
Dominik Och, MA
Marketing Manager
Germany, Walter-Fach-Kraft GmbH & Co. KG
Email: [email protected]
Abstract
Due to current economic crisis, increasing complexity of the world economy as well as legal
regulations, the topic risk management gains more and more importance. Risk management is a
management instrument to identify, evaluate, and control threats as well as chances that arise for
companies. Capital market-oriented companies in Germany are legally bounded by the Control and
Transparency in Enterprises Act (KonTraG) to practice Enterprise Risk Management. Goal of the
legislator is to increase the transparency in order to avoid serious company crisis in Germany. In
addition, many companies have recognized that risk management is a necessary instrument for
ensuring competitiveness. Even small and medium sized companies which are not bounded to the
KonTraG started to practice risk management to meet the market’s new challenges. The economic
region Fulda is characterized by successful operating small and medium sized companies, which
makes it an interesting area for the study of how those companies evaluate the topic risk management,
how they deal with emerging risks on the operational level, and in which way they implement possible
risks in their strategic planning. This paper shows the results of a survey which was conducted in the
context of a master thesis at the University of Applied Sciences Fulda. It summarizes the present status
of implementation of risk management instruments, and gives recommendations for the improvement
of the Enterprise Risk Management in the region.
38
1 Introduction
Enterprise Risk Management (ERM) is the identification, measuring, and treatment of risks. Risks are
possible positive or negative variances from an expected result, leading to possible chances and threats
(Gleißner and Romeike, 2005, p. 27). For a systematic ERM, a risk culture and strategy, constituting
the risk management framework, are indispensable. In that framework, a risk early warning system, a
monitoring system, and a risk controlling have to be implemented as subsystems. These subsystems
form a holistic Enterprise Risk Management system in which the risk management process proceeds.
The risk management process is dynamic and consists of the risk identification, risk evaluation and
analysis, risk treatment, and risk monitoring (ISO 31000).
Capital market-oriented companies in Germany are legally bounded by the Control and Transparency
in Enterprises Act (KonTraG) to practice ERM in an appropriate way. Since ERM is an efficient
instrument to secure the future of the company it is also important for companies which are not
bounded by the KonTraG to practice ERM. Furthermore, the corporate environment has a high degree
of complexity and becomes more and more dynamic. As a result of this changing environment, there
are more and new chances but also threats for companies, which is why even small and medium sized
companies are compelled to practice ERM systematically in order to secure their future. Hence, it is
deeply interesting to investigating the actual degree of implementation of systematic ERM of small
and medium sized companies.
After giving a short introduction to the research base, this paper presents the results of a survey on the
risk awareness and the degree of implementation of systematic ERM in the economic region Fulda
which is characterized by medium sized companies acting successfully on both the national as well as
international level. At the end, a conclusion and a short recommendation will be given.
2 Research base
The survey was conducted in the context of a master thesis at the University of Applied Sciences
Fulda. The questionnaire for the survey consists of meaningful indicators which are able to measure
the risk awareness as well as the degree of implementation of systematic ERM in the economic region
Fulda. All the respondents were companies that belong to the Chamber of Industry and Commerce
Fulda (IHK Fulda). In 2010, the IHK Fulda comprised 13,358 companies in total. Since the ERM of
banks and insurance companies is quite different due to special laws, banks and insurance companies
were not consulted. The respondents were sampled by a simple random sampling. In total, the survey
had 28 respondents, a response rate of 10.37%.
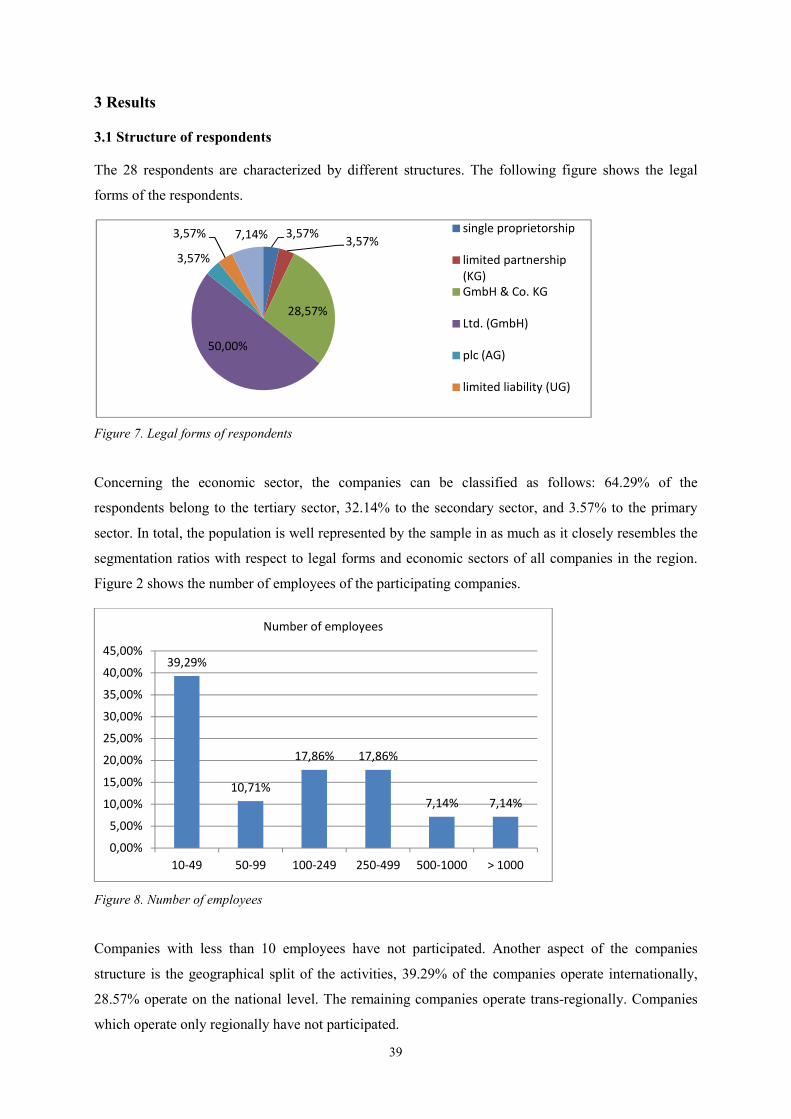
39
3 Results
3.1 Structure of respondents
The 28 respondents are characterized by different structures. The following figure shows the legal
forms of the respondents.
Figure 7. Legal forms of respondents
Concerning the economic sector, the companies can be classified as follows: 64.29% of the
respondents belong to the tertiary sector, 32.14% to the secondary sector, and 3.57% to the primary
sector. In total, the population is well represented by the sample in as much as it closely resembles the
segmentation ratios with respect to legal forms and economic sectors of all companies in the region.
Figure 2 shows the number of employees of the participating companies.
Figure 8. Number of employees
Companies with less than 10 employees have not participated. Another aspect of the companies
structure is the geographical split of the activities, 39.29% of the companies operate internationally,
28.57% operate on the national level. The remaining companies operate trans-regionally. Companies
which operate only regionally have not participated.
3,57%3,57%
28,57%
50,00%
3,57%
3,57% 7,14%single proprietorship
limited partnership
(KG)
GmbH & Co. KG
Ltd. (GmbH)
plc (AG)
limited liability (UG)
39,29%
10,71%
17,86% 17,86%
7,14% 7,14%
0,00%
5,00%
10,00%
15,00%
20,00%
25,00%
30,00%
35,00%
40,00%
45,00%
10-49 50-99 100-249 250-499 500-1000 > 1000
Number of employees
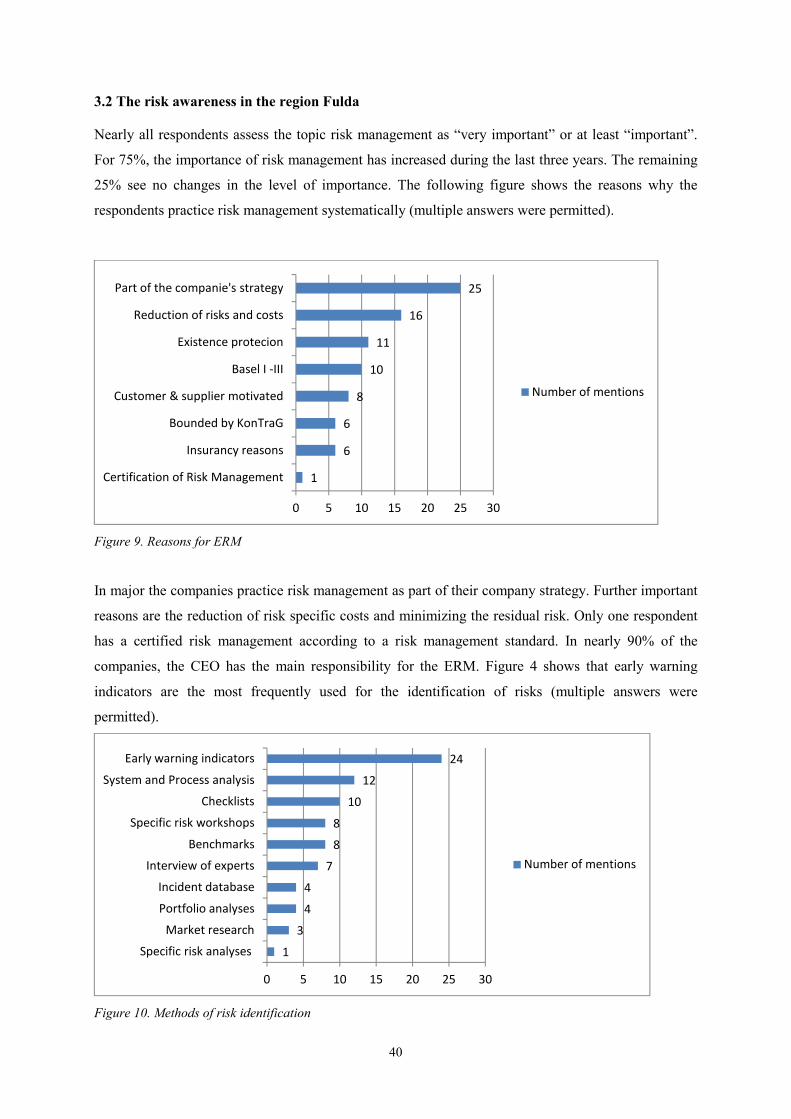
40
3.2 The risk awareness in the region Fulda
Nearly all respondents assess the topic risk management as “very important” or at least “important”.
For 75%, the importance of risk management has increased during the last three years. The remaining
25% see no changes in the level of importance. The following figure shows the reasons why the
respondents practice risk management systematically (multiple answers were permitted).
Figure 9. Reasons for ERM
In major the companies practice risk management as part of their company strategy. Further important
reasons are the reduction of risk specific costs and minimizing the residual risk. Only one respondent
has a certified risk management according to a risk management standard. In nearly 90% of the
companies, the CEO has the main responsibility for the ERM. Figure 4 shows that early warning
indicators are the most frequently used for the identification of risks (multiple answers were
permitted).
Figure 10. Methods of risk identification
1
6
6
8
10
11
16
25
0 5 10 15 20 25 30
Certification of Risk Management
Insurancy reasons
Bounded by KonTraG
Customer & supplier motivated
Basel I -III
Existence protecion
Reduction of risks and costs
Part of the companie's strategy
Number of mentions
1
3
4
4
7
8
8
10
12
24
0 5 10 15 20 25 30
Specific risk analyses
Market research
Portfolio analyses
Incident database
Interview of experts
Benchmarks
Specific risk workshops
Checklists
System and Process analysis
Early warning indicators
Number of mentions
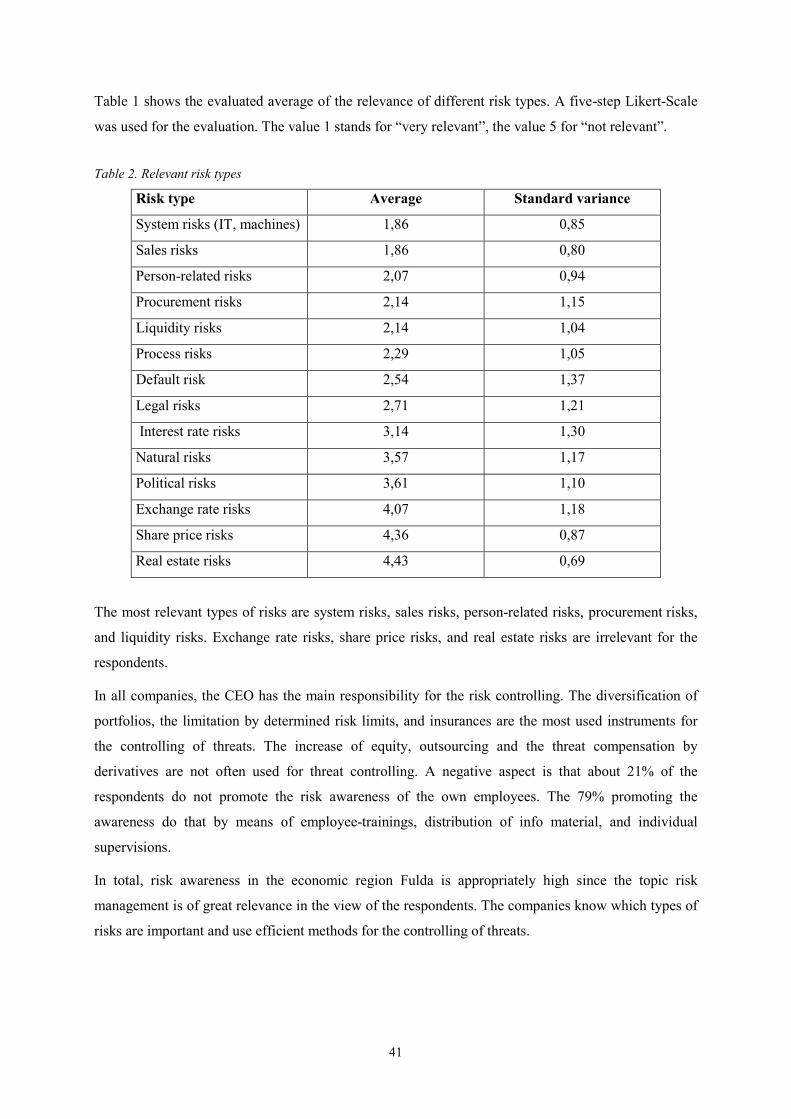
41
Table 1 shows the evaluated average of the relevance of different risk types. A five-step Likert-Scale
was used for the evaluation. The value 1 stands for “very relevant”, the value 5 for “not relevant”.
Table 2. Relevant risk types
Risk type Average Standard variance
System risks (IT, machines) 1,86 0,85
Sales risks 1,86 0,80
Person-related risks 2,07 0,94
Procurement risks 2,14 1,15
Liquidity risks 2,14 1,04
Process risks 2,29 1,05
Default risk 2,54 1,37
Legal risks 2,71 1,21
Interest rate risks 3,14 1,30
Natural risks 3,57 1,17
Political risks 3,61 1,10
Exchange rate risks 4,07 1,18
Share price risks 4,36 0,87
Real estate risks 4,43 0,69
The most relevant types of risks are system risks, sales risks, person-related risks, procurement risks,
and liquidity risks. Exchange rate risks, share price risks, and real estate risks are irrelevant for the
respondents.
In all companies, the CEO has the main responsibility for the risk controlling. The diversification of
portfolios, the limitation by determined risk limits, and insurances are the most used instruments for
the controlling of threats. The increase of equity, outsourcing and the threat compensation by
derivatives are not often used for threat controlling. A negative aspect is that about 21% of the
respondents do not promote the risk awareness of the own employees. The 79% promoting the
awareness do that by means of employee-trainings, distribution of info material, and individual
supervisions.
In total, risk awareness in the economic region Fulda is appropriately high since the topic risk
management is of great relevance in the view of the respondents. The companies know which types of
risks are important and use efficient methods for the controlling of threats.
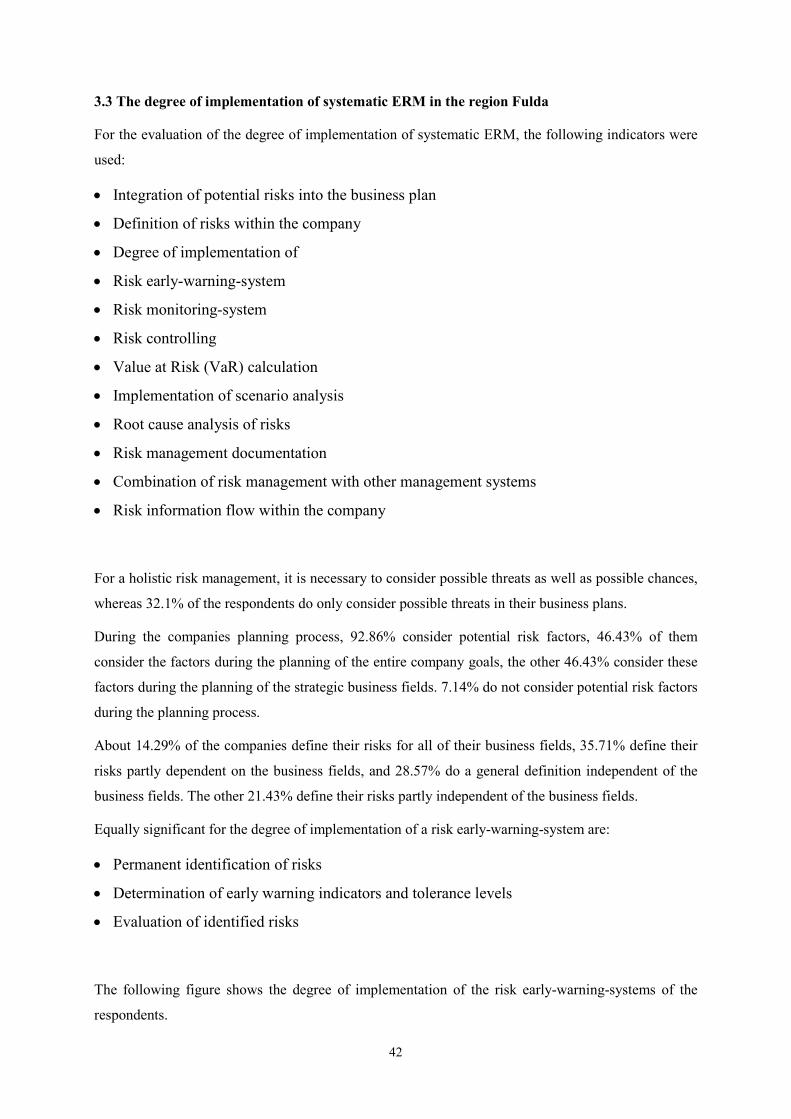
42
3.3 The degree of implementation of systematic ERM in the region Fulda
For the evaluation of the degree of implementation of systematic ERM, the following indicators were
used:
• Integration of potential risks into the business plan
• Definition of risks within the company
• Degree of implementation of
• Risk early-warning-system
• Risk monitoring-system
• Risk controlling
• Value at Risk (VaR) calculation
• Implementation of scenario analysis
• Root cause analysis of risks
• Risk management documentation
• Combination of risk management with other management systems
• Risk information flow within the company
For a holistic risk management, it is necessary to consider possible threats as well as possible chances,
whereas 32.1% of the respondents do only consider possible threats in their business plans.
During the companies planning process, 92.86% consider potential risk factors, 46.43% of them
consider the factors during the planning of the entire company goals, the other 46.43% consider these
factors during the planning of the strategic business fields. 7.14% do not consider potential risk factors
during the planning process.
About 14.29% of the companies define their risks for all of their business fields, 35.71% define their
risks partly dependent on the business fields, and 28.57% do a general definition independent of the
business fields. The other 21.43% define their risks partly independent of the business fields.
Equally significant for the degree of implementation of a risk early-warning-system are:
• Permanent identification of risks
• Determination of early warning indicators and tolerance levels
• Evaluation of identified risks
The following figure shows the degree of implementation of the risk early-warning-systems of the
respondents.
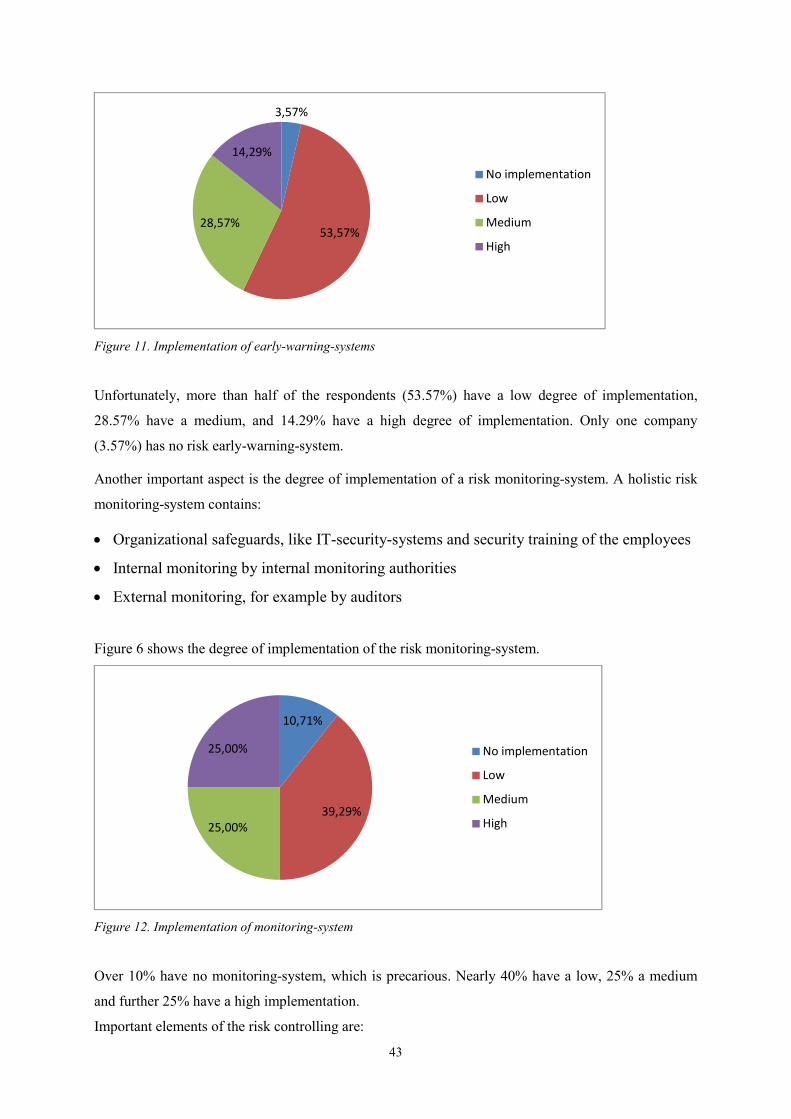
43
Figure 11. Implementation of early-warning-systems
Unfortunately, more than half of the respondents (53.57%) have a low degree of implementation,
28.57% have a medium, and 14.29% have a high degree of implementation. Only one company
(3.57%) has no risk early-warning-system.
Another important aspect is the degree of implementation of a risk monitoring-system. A holistic risk
monitoring-system contains:
• Organizational safeguards, like IT-security-systems and security training of the employees
• Internal monitoring by internal monitoring authorities
• External monitoring, for example by auditors
Figure 6 shows the degree of implementation of the risk monitoring-system.
Figure 12. Implementation of monitoring-system
Over 10% have no monitoring-system, which is precarious. Nearly 40% have a low, 25% a medium
and further 25% have a high implementation.
Important elements of the risk controlling are:
3,57%
53,57%28,57%
14,29%
No implementation
Low
Medium
High
10,71%
39,29%
25,00%
25,00% No implementation
Low
Medium
High
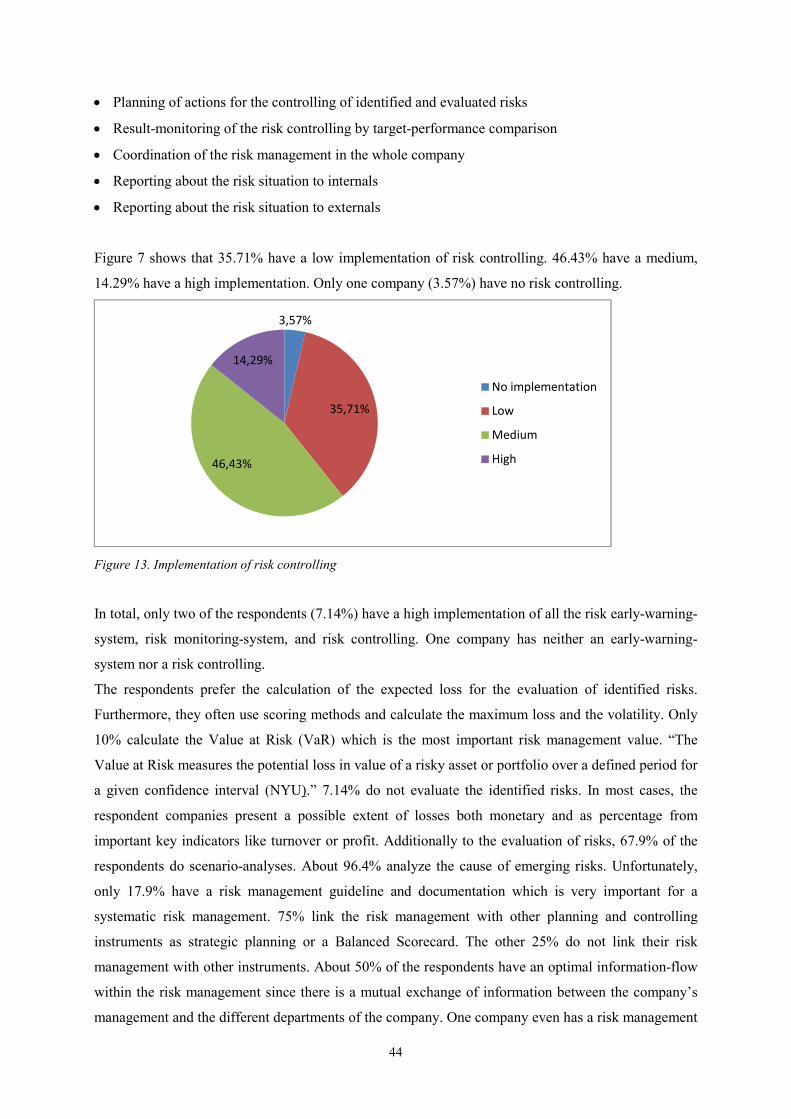
44
• Planning of actions for the controlling of identified and evaluated risks
• Result-monitoring of the risk controlling by target-performance comparison
• Coordination of the risk management in the whole company
• Reporting about the risk situation to internals
• Reporting about the risk situation to externals
Figure 7 shows that 35.71% have a low implementation of risk controlling. 46.43% have a medium,
14.29% have a high implementation. Only one company (3.57%) have no risk controlling.
Figure 13. Implementation of risk controlling
In total, only two of the respondents (7.14%) have a high implementation of all the risk early-warning-
system, risk monitoring-system, and risk controlling. One company has neither an early-warning-
system nor a risk controlling.
The respondents prefer the calculation of the expected loss for the evaluation of identified risks.
Furthermore, they often use scoring methods and calculate the maximum loss and the volatility. Only
10% calculate the Value at Risk (VaR) which is the most important risk management value. “The
Value at Risk measures the potential loss in value of a risky asset or portfolio over a defined period for
a given confidence interval (NYU).” 7.14% do not evaluate the identified risks. In most cases, the
respondent companies present a possible extent of losses both monetary and as percentage from
important key indicators like turnover or profit. Additionally to the evaluation of risks, 67.9% of the
respondents do scenario-analyses. About 96.4% analyze the cause of emerging risks. Unfortunately,
only 17.9% have a risk management guideline and documentation which is very important for a
systematic risk management. 75% link the risk management with other planning and controlling
instruments as strategic planning or a Balanced Scorecard. The other 25% do not link their risk
management with other instruments. About 50% of the respondents have an optimal information-flow
within the risk management since there is a mutual exchange of information between the company’s
management and the different departments of the company. One company even has a risk management
3,57%
35,71%
46,43%
14,29%
No implementation
Low
Medium
High
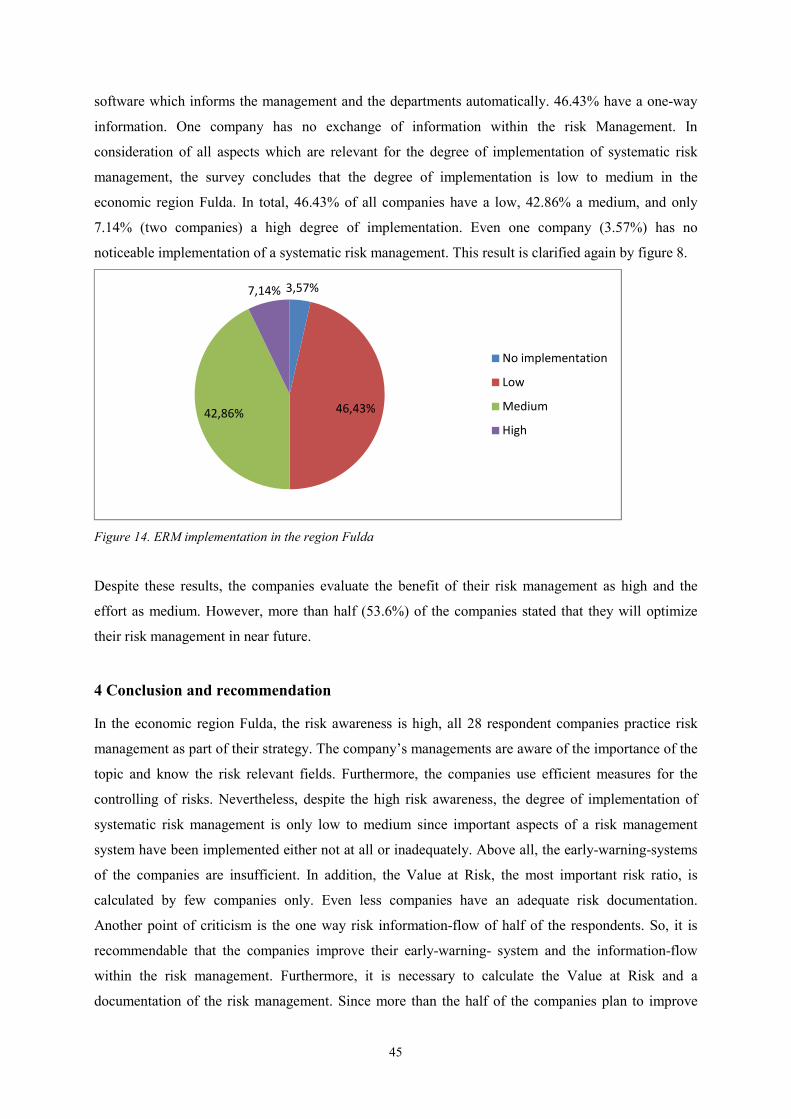
45
software which informs the management and the departments automatically. 46.43% have a one-way
information. One company has no exchange of information within the risk Management. In
consideration of all aspects which are relevant for the degree of implementation of systematic risk
management, the survey concludes that the degree of implementation is low to medium in the
economic region Fulda. In total, 46.43% of all companies have a low, 42.86% a medium, and only
7.14% (two companies) a high degree of implementation. Even one company (3.57%) has no
noticeable implementation of a systematic risk management. This result is clarified again by figure 8.
Figure 14. ERM implementation in the region Fulda
Despite these results, the companies evaluate the benefit of their risk management as high and the
effort as medium. However, more than half (53.6%) of the companies stated that they will optimize
their risk management in near future.
4 Conclusion and recommendation
In the economic region Fulda, the risk awareness is high, all 28 respondent companies practice risk
management as part of their strategy. The company’s managements are aware of the importance of the
topic and know the risk relevant fields. Furthermore, the companies use efficient measures for the
controlling of risks. Nevertheless, despite the high risk awareness, the degree of implementation of
systematic risk management is only low to medium since important aspects of a risk management
system have been implemented either not at all or inadequately. Above all, the early-warning-systems
of the companies are insufficient. In addition, the Value at Risk, the most important risk ratio, is
calculated by few companies only. Even less companies have an adequate risk documentation.
Another point of criticism is the one way risk information-flow of half of the respondents. So, it is
recommendable that the companies improve their early-warning- system and the information-flow
within the risk management. Furthermore, it is necessary to calculate the Value at Risk and a
documentation of the risk management. Since more than the half of the companies plan to improve
3,57%
46,43%42,86%
7,14%
No implementation
Low
Medium
High

46
their ERM soon, follow-up studies in this region measuring the progress of improvement would be
interesting.

47
Calling References
1. ISO 31000 (2010): Risk management – Principles and guidelines on implementation. iso.org
2. IHK Fulda (2011): Statistical numbers 2010 – IHK Fulda. ihk-fulda.de
3. Gleißner and Romeike (2005): Risikomanagement: Umsetzung, Werkzeuge, Risikobewertung; Controlling,
Qualitätsmanagement und Balanced Scorecard als Plattform für den Aufbau. Freiburg:Haufe Verlag
4. NYU: Value at Risk – VaR. http://people.stern.nyu.edu/adamodar/pdfiles/papers/VAR.pdf
5. Och, D. (2011): Master Thesis: Das systematische Risikomanagement und dessen Implementierungsgrad in
der Wirtschaftsregion Fulda. Fulda: University of Applied Sciences Fulda
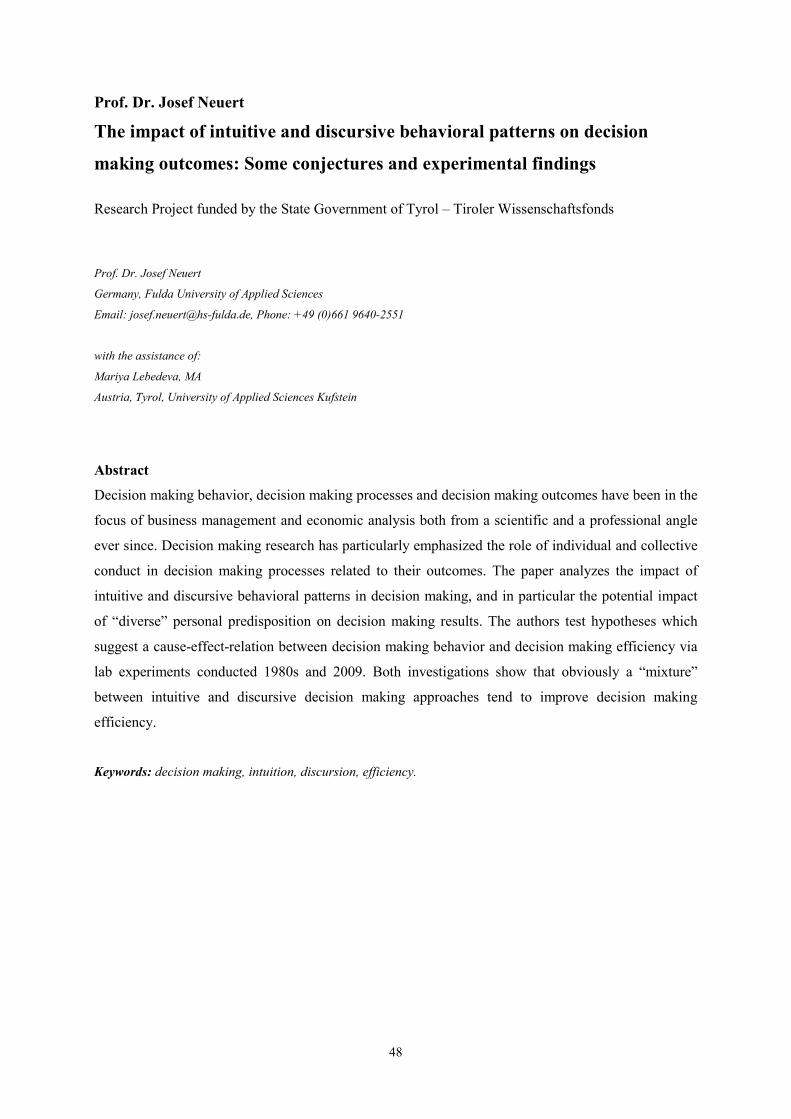
48
Prof. Dr. Josef Neuert
The impact of intuitive and discursive behavioral patterns on decision
making outcomes: Some conjectures and experimental findings
Research Project funded by the State Government of Tyrol – Tiroler Wissenschaftsfonds
Prof. Dr. Josef Neuert
Germany, Fulda University of Applied Sciences
Email: [email protected], Phone: +49 (0)661 9640-2551
with the assistance of:
Mariya Lebedeva, MA
Austria, Tyrol, University of Applied Sciences Kufstein
Abstract
Decision making behavior, decision making processes and decision making outcomes have been in the
focus of business management and economic analysis both from a scientific and a professional angle
ever since. Decision making research has particularly emphasized the role of individual and collective
conduct in decision making processes related to their outcomes. The paper analyzes the impact of
intuitive and discursive behavioral patterns in decision making, and in particular the potential impact
of “diverse” personal predisposition on decision making results. The authors test hypotheses which
suggest a cause-effect-relation between decision making behavior and decision making efficiency via
lab experiments conducted 1980s and 2009. Both investigations show that obviously a “mixture”
between intuitive and discursive decision making approaches tend to improve decision making
efficiency.
Keywords: decision making, intuition, discursion, efficiency.
49
Introduction:
Research into business decisions and decision making behavior – summarizing synopsis
A myriad of academic and professional publications has dealt with the phenomenon of “human
decision making”, particularly emphasizing individual and/or collective behavior in decision making
processes for decades. Already Immanuel Kant refers to the way human decisions should be
conducted, by pointing out behavioral instructions in his categorical imperative, demanding to “act
along the guideline, based on which (one) wish(es) that it should become a general law” [31].
Whereas the categorical imperative stresses the underlying norms, human behavior should be based
on, decision making and decision making processes as a research topic have been looked at in a multi-
fold manner, especially focusing on analytical, theoretical, explanatory, exploratory and empirical
aspects, intensively and extensively [11] [9] [7] [15] [25] [4]. The list of relevant publications could be
continued nearly endlessly, however, the major areas of decision research are comprised of the
following: People, situations and contexts, goals, quantitative and qualitative aspects, heuristics,
efficiency and outcomes, timing and processes [35].
Either implicitly or explicitly, the issue of rational vs. irrational conduct can always be observed in the
forefront of decision making research. Fehr and Ockenfels, for example, have recently demonstrated
that in reality human beings are neither as efficient nor as rational as classical and neo-classical
economists suggest in their various models [16] [8]. Thaler and Sunstein deal with the problem how to
improve decisions in various areas of the society and the economy, and come to the conclusion that
“nudges” indeed increase the efficiency of decisions, also in a socially preferred manner [51].
Kagel and Roth examined degrees of rationality and empirical anomalies in individual decision
making, particularly focusing on judgment issues and choices, and uncertainty. They, too, demonstrate
that the “classical” notion of the “rational man” (homo oeconomicus) in decision making processes
can no longer be maintained [30].
Generally, decision making research can be divided into three major areas: Normative or prescriptive
decision theory, descriptive or explanatory decision theory, and empirical decision theory as the field,
where prescriptive and descriptive theory either clash or comply [37] [27].
Prescriptive and normative decision theory have developed rules, tools, models and heuristics for
decision making behavior (i.e. rules for decision optimization, decision support models, decision tree,
decision matrices, etc.).
Descriptive decision theory has discovered behavioral patterns in problem solving processes, like
fairness and reciprocity, special effects like endowment, asymmetric information, loss aversion and
specific biases [28].
Empirical decision theory, especially experimental economics, have dealt with various hypotheses of
rational conduct in decision making processes and have disclosed numbers of ambiguous behavioral
50
patterns in decision making processes (which is especially pointed out in Kahneman’s and Tversky’s
prospect theory, 1979).
In sum, decision making theory is still one of the most preeminent fields of business and economic
research, both in a theoretical and empirical context. In particular, the issue of rationality is still being
investigated from various angles, with a strong focus on the potential dependence between decision
making rationality and decision making efficiency. Pars pro toto, Neuert (1987) has come to the
empirically proven conclusion that in the context of business decision making tasks, the utilization of
decision heuristics tends to improve the outcomes of semi-structured problem solving processes on the
one hand. But also on the other hand, it was found out that human behavior in decision making
processes never shows a pattern of “full” rationality, but moreover a limited frame of rationality [43],
in particular combining “intuitive” and “discursive” elements of decision making behavior, can also
lead to sufficient decision making results.
Intuition vs. “discursion” in decision making processes – Theoretical background and
basic theorem of conduct
In a basic research study into managerial planning and decision making behavior and its impact on
decision making efficiency, Neuert investigates potential cause-effect relations between human
conduct in decision making processes, measured by degrees of rationality, and respective decision
making outcomes [35]. In addition, a specific research question was formulated, trying to find out
whether “intuition” and “discursion” as pre-dispositions of individual personality and behavior do
have an impact on the degree of rationality in decision making processes and thus also on decision
making efficiency. This research question is, with a time gap of 20 years, again in the focus of the
paper.
Classical and neo-classical models of human behavior in business transactions are characterized by the
image of individuals as the “homo oeconomicus”, the rational man [46] [50]. The rational man
possesses “a complete and consistent system of preferences which allows him to choose
(advantageously) among alternatives available; he always knows completely what the alternatives are;
there are no limits for the complexity of his rationale in order to find out which alternative is the
optimal one; probability calculations are neither scary nor puzzling to his mind” [44, pp. 24 et sqq.].
In the meantime, additional research has convincingly proven that such an illusion of human behavior
does not exist at all. In a number of publications it has been demonstrated that limited rationality and
even sometimes obvious irrational behavior can be observed in decision making processes and
business transactions. Effects like fairness, reciprocity, endowment, biases like loss dominating
aversion, emotions etc. do play a preeminent role in decision making and business transactions [4]
[23] [3]. On the other hand, there have been tendencies in social science trying to reduce human
51
reasoning and behavior solely to being based on affective impulses [5] [6].
More recently, questions have been raised whether human beings are at all capable to act goal-
oriented, rationally reasoning and pro-active, or whether our entire behavioral patterns are based on
“depth psychology”, which triggers human reaction by environmental stimuli. It is claimed that, in this
sense, unconsciousness and sub-consciousness determine all our decisions and actions [49, p. W4]. In
particular, latest research efforts in the area of “neuroeconomics” intensively deal with the issue, to
which extent neurological pre-disposition is responsible for decision making behavior and our actions
and transactions [40, pp. 33 et sqq.]. It seems that the entire scientific discussion about the dominating
forces for human decision making can be placed into a continuum with the two extremes, the “homo
oeconomicus” on the one hand, and the “homo irrationalis” on the other hand. Reducing human
decision making solely to the one or the other end has been called an “act of schizophrenia of social
science” by Herbert Simon [44, p. 29].
The state of the art of decision making research represents the notion that neither the entirely rationally
acting homo oeconomicus nor the homo irrationalis, solely “inspired” by unconscious stimuli and
emotions, do exist in “pure” form. However, it seems to appear plausible to work under the
assumption that there are different “layers” of decision making behavior, varying in between the
extremes of a 100% degree of rationality and a 100% degree of subconsciously driven conduct [35, pp.
67 et sqq.]. This presumption means that human behavior (in decision making processes) will never
occur in form of a constantly complete rational design in the sense of “optimal conduct”, nor totally
irrational in a sense of affect-driven actions.
To specify this notion, we have to determine more precisely the intension and the extension of the
meaning of rationality. Simon says that the degree of rationality of an action depends “on the process
which leads to it” [42, pp. 2 et sqq.].
In addition, following Max Weber, we understand “rational behavior” as an action based on
consciousness, future orientation, critical reasoning, structuring of the problem and consistency of
underlying norms of action [53].
In this context, still the question remains which role “intuition” and, on the other extreme, “discursion”
actually play in decision making processes. “Discursion”-based behavior can be characterized as
“passing from one topic to another” and - interestingly (!) – “proceeding to a conclusion through
reason rather than intuition” [57].
Whereas the term “discursion” comes close to what we understand from “rational conduct”, the term
“intuition” appears much more vague and undetermined. Indeed, intuition has been dealt within social
sciences under a myriad of different and often contradictory perspectives, leading to Fiedler’s
conclusion that “there are nearly as many definitions and (implicit) meanings of intuition as there are
researchers involved” [17]. Moreover, Fiedler points out that intuition is supposed to imply meanings
like unconscious, emotional and affective, spontaneous, without any external stimulus, and instinctive
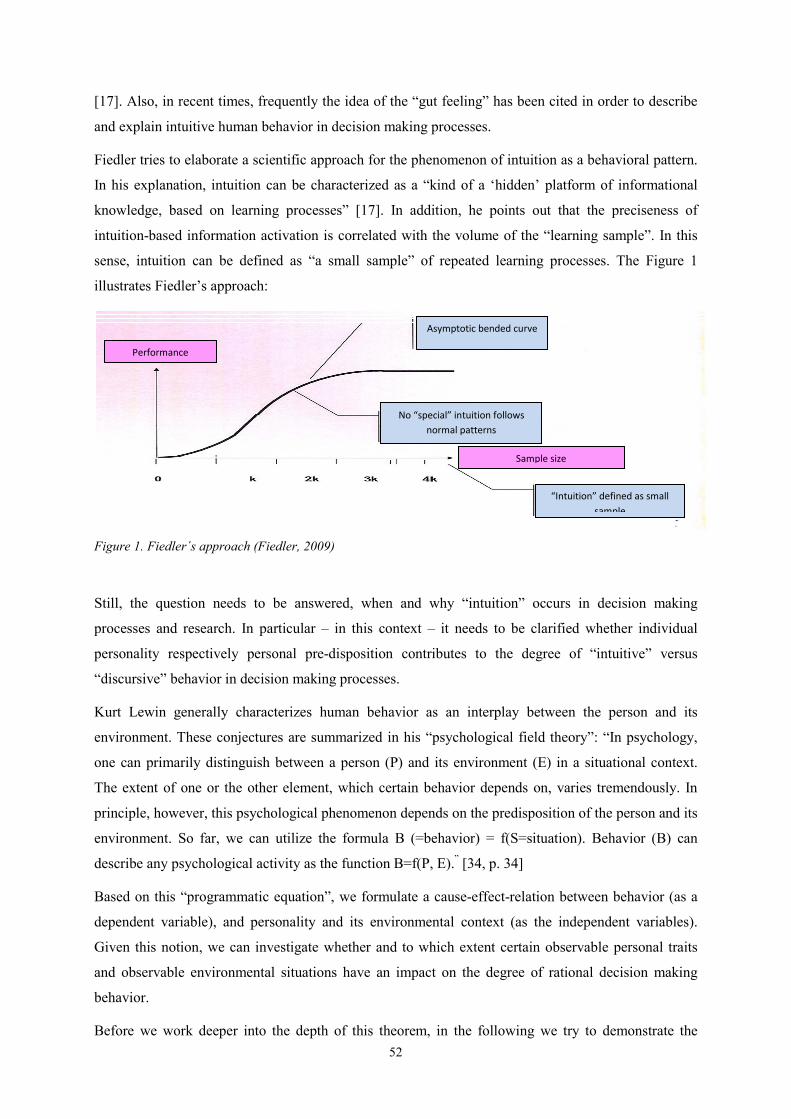
52
[17]. Also, in recent times, frequently the idea of the “gut feeling” has been cited in order to describe
and explain intuitive human behavior in decision making processes.
Fiedler tries to elaborate a scientific approach for the phenomenon of intuition as a behavioral pattern.
In his explanation, intuition can be characterized as a “kind of a ‘hidden’ platform of informational
knowledge, based on learning processes” [17]. In addition, he points out that the preciseness of
intuition-based information activation is correlated with the volume of the “learning sample”. In this
sense, intuition can be defined as “a small sample” of repeated learning processes. The Figure 1
illustrates Fiedler’s approach:
Figure 1. Fiedler´s approach (Fiedler, 2009)
Still, the question needs to be answered, when and why “intuition” occurs in decision making
processes and research. In particular – in this context – it needs to be clarified whether individual
personality respectively personal pre-disposition contributes to the degree of “intuitive” versus
“discursive” behavior in decision making processes.
Kurt Lewin generally characterizes human behavior as an interplay between the person and its
environment. These conjectures are summarized in his “psychological field theory”: “In psychology,
one can primarily distinguish between a person (P) and its environment (E) in a situational context.
The extent of one or the other element, which certain behavior depends on, varies tremendously. In
principle, however, this psychological phenomenon depends on the predisposition of the person and its
environment. So far, we can utilize the formula B (=behavior) = f(S=situation). Behavior (B) can
describe any psychological activity as the function B=f(P, E).” [34, p. 34]
Based on this “programmatic equation”, we formulate a cause-effect-relation between behavior (as a
dependent variable), and personality and its environmental context (as the independent variables).
Given this notion, we can investigate whether and to which extent certain observable personal traits
and observable environmental situations have an impact on the degree of rational decision making
behavior.
Before we work deeper into the depth of this theorem, in the following we try to demonstrate the
Performance
Asymptotic bended curve
No “special” intuition follows
normal patterns
Sample size
“Intuition” defined as small
sample
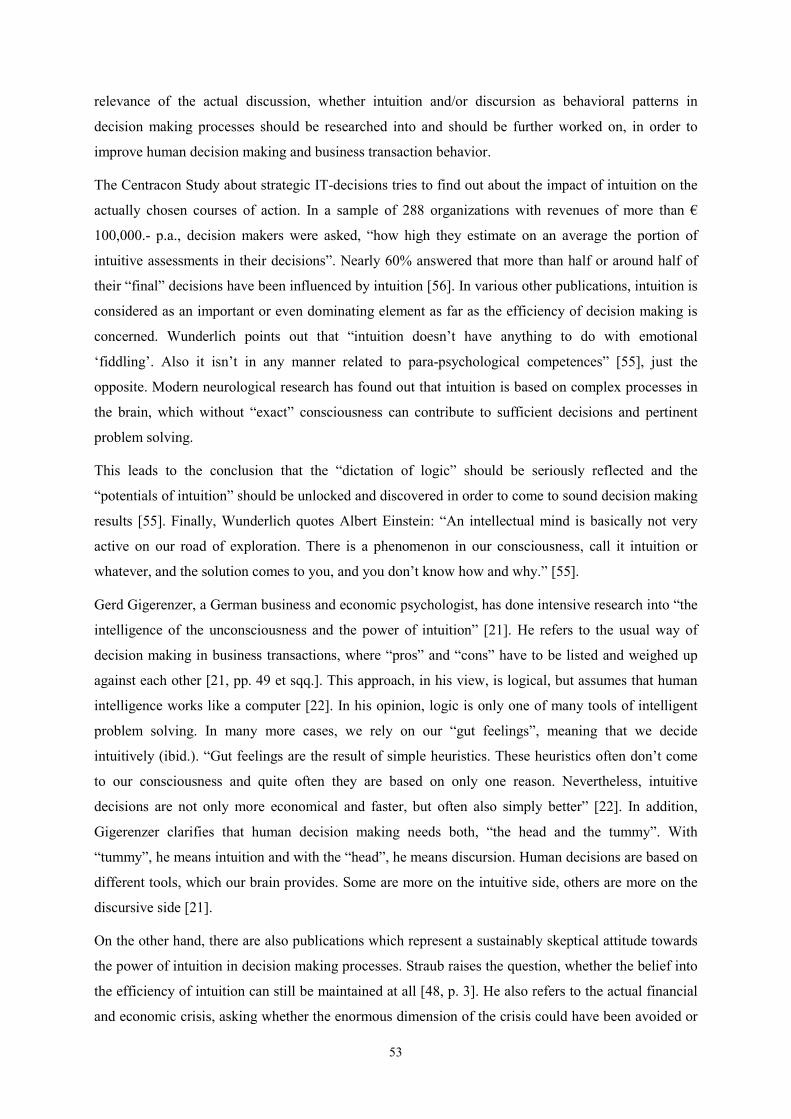
53
relevance of the actual discussion, whether intuition and/or discursion as behavioral patterns in
decision making processes should be researched into and should be further worked on, in order to
improve human decision making and business transaction behavior.
The Centracon Study about strategic IT-decisions tries to find out about the impact of intuition on the
actually chosen courses of action. In a sample of 288 organizations with revenues of more than €
100,000.- p.a., decision makers were asked, “how high they estimate on an average the portion of
intuitive assessments in their decisions”. Nearly 60% answered that more than half or around half of
their “final” decisions have been influenced by intuition [56]. In various other publications, intuition is
considered as an important or even dominating element as far as the efficiency of decision making is
concerned. Wunderlich points out that “intuition doesn’t have anything to do with emotional
‘fiddling’. Also it isn’t in any manner related to para-psychological competences” [55], just the
opposite. Modern neurological research has found out that intuition is based on complex processes in
the brain, which without “exact” consciousness can contribute to sufficient decisions and pertinent
problem solving.
This leads to the conclusion that the “dictation of logic” should be seriously reflected and the
“potentials of intuition” should be unlocked and discovered in order to come to sound decision making
results [55]. Finally, Wunderlich quotes Albert Einstein: “An intellectual mind is basically not very
active on our road of exploration. There is a phenomenon in our consciousness, call it intuition or
whatever, and the solution comes to you, and you don’t know how and why.” [55].
Gerd Gigerenzer, a German business and economic psychologist, has done intensive research into “the
intelligence of the unconsciousness and the power of intuition” [21]. He refers to the usual way of
decision making in business transactions, where “pros” and “cons” have to be listed and weighed up
against each other [21, pp. 49 et sqq.]. This approach, in his view, is logical, but assumes that human
intelligence works like a computer [22]. In his opinion, logic is only one of many tools of intelligent
problem solving. In many more cases, we rely on our “gut feelings”, meaning that we decide
intuitively (ibid.). “Gut feelings are the result of simple heuristics. These heuristics often don’t come
to our consciousness and quite often they are based on only one reason. Nevertheless, intuitive
decisions are not only more economical and faster, but often also simply better” [22]. In addition,
Gigerenzer clarifies that human decision making needs both, “the head and the tummy”. With
“tummy”, he means intuition and with the “head”, he means discursion. Human decisions are based on
different tools, which our brain provides. Some are more on the intuitive side, others are more on the
discursive side [21].
On the other hand, there are also publications which represent a sustainably skeptical attitude towards
the power of intuition in decision making processes. Straub raises the question, whether the belief into
the efficiency of intuition can still be maintained at all [48, p. 3]. He also refers to the actual financial
and economic crisis, asking whether the enormous dimension of the crisis could have been avoided or
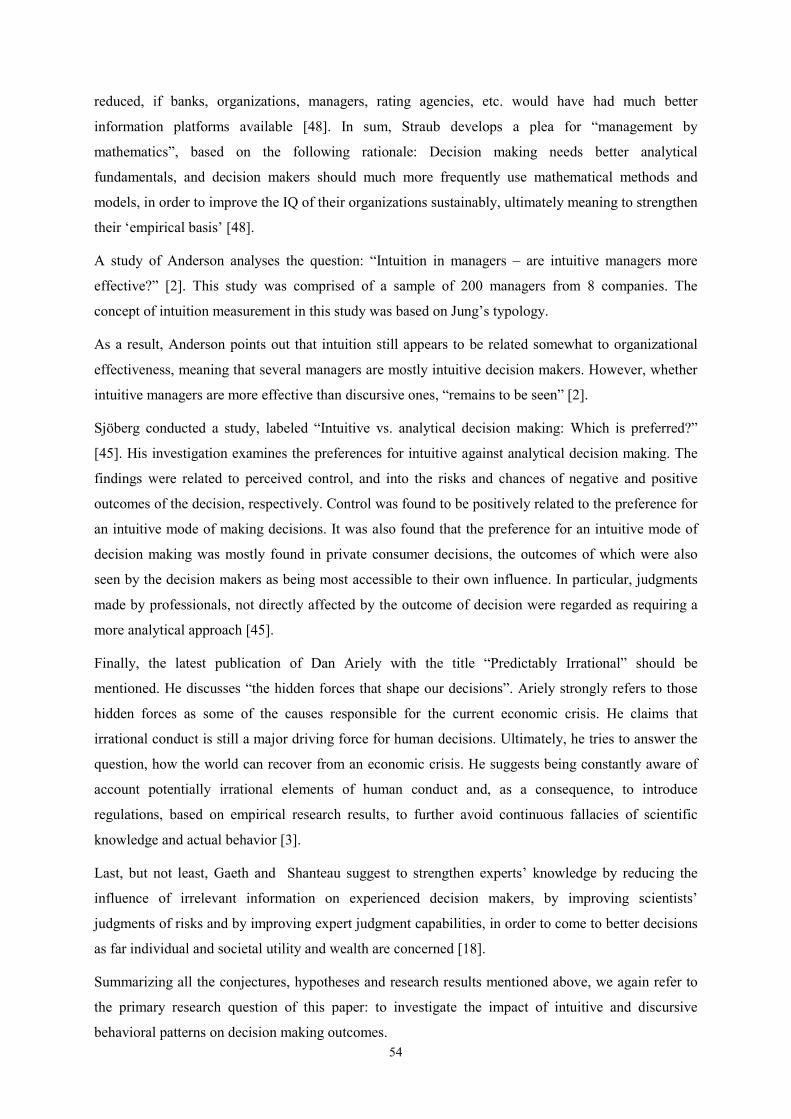
54
reduced, if banks, organizations, managers, rating agencies, etc. would have had much better
information platforms available [48]. In sum, Straub develops a plea for “management by
mathematics”, based on the following rationale: Decision making needs better analytical
fundamentals, and decision makers should much more frequently use mathematical methods and
models, in order to improve the IQ of their organizations sustainably, ultimately meaning to strengthen
their ‘empirical basis’ [48].
A study of Anderson analyses the question: “Intuition in managers – are intuitive managers more
effective?” [2]. This study was comprised of a sample of 200 managers from 8 companies. The
concept of intuition measurement in this study was based on Jung’s typology.
As a result, Anderson points out that intuition still appears to be related somewhat to organizational
effectiveness, meaning that several managers are mostly intuitive decision makers. However, whether
intuitive managers are more effective than discursive ones, “remains to be seen” [2].
Sjöberg conducted a study, labeled “Intuitive vs. analytical decision making: Which is preferred?”
[45]. His investigation examines the preferences for intuitive against analytical decision making. The
findings were related to perceived control, and into the risks and chances of negative and positive
outcomes of the decision, respectively. Control was found to be positively related to the preference for
an intuitive mode of making decisions. It was also found that the preference for an intuitive mode of
decision making was mostly found in private consumer decisions, the outcomes of which were also
seen by the decision makers as being most accessible to their own influence. In particular, judgments
made by professionals, not directly affected by the outcome of decision were regarded as requiring a
more analytical approach [45].
Finally, the latest publication of Dan Ariely with the title “Predictably Irrational” should be
mentioned. He discusses “the hidden forces that shape our decisions”. Ariely strongly refers to those
hidden forces as some of the causes responsible for the current economic crisis. He claims that
irrational conduct is still a major driving force for human decisions. Ultimately, he tries to answer the
question, how the world can recover from an economic crisis. He suggests being constantly aware of
account potentially irrational elements of human conduct and, as a consequence, to introduce
regulations, based on empirical research results, to further avoid continuous fallacies of scientific
knowledge and actual behavior [3].
Last, but not least, Gaeth and Shanteau suggest to strengthen experts’ knowledge by reducing the
influence of irrelevant information on experienced decision makers, by improving scientists’
judgments of risks and by improving expert judgment capabilities, in order to come to better decisions
as far individual and societal utility and wealth are concerned [18].
Summarizing all the conjectures, hypotheses and research results mentioned above, we again refer to
the primary research question of this paper: to investigate the impact of intuitive and discursive
behavioral patterns on decision making outcomes.
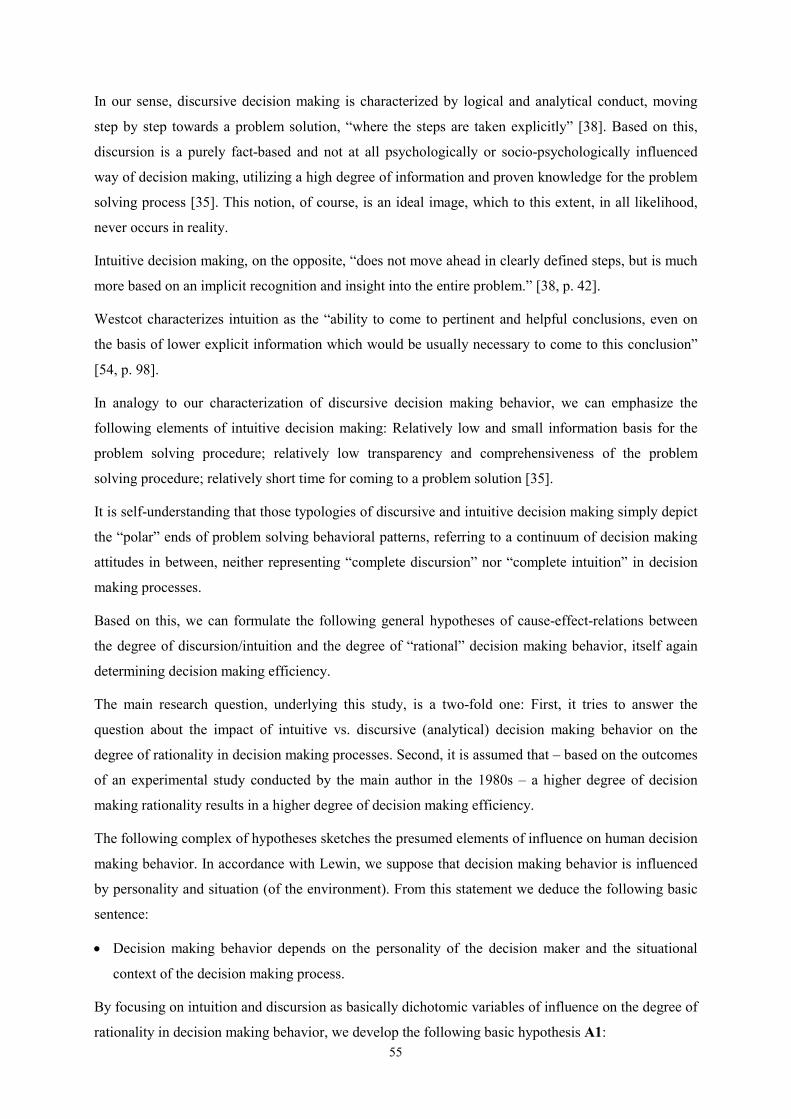
55
In our sense, discursive decision making is characterized by logical and analytical conduct, moving
step by step towards a problem solution, “where the steps are taken explicitly” [38]. Based on this,
discursion is a purely fact-based and not at all psychologically or socio-psychologically influenced
way of decision making, utilizing a high degree of information and proven knowledge for the problem
solving process [35]. This notion, of course, is an ideal image, which to this extent, in all likelihood,
never occurs in reality.
Intuitive decision making, on the opposite, “does not move ahead in clearly defined steps, but is much
more based on an implicit recognition and insight into the entire problem.” [38, p. 42].
Westcot characterizes intuition as the “ability to come to pertinent and helpful conclusions, even on
the basis of lower explicit information which would be usually necessary to come to this conclusion”
[54, p. 98].
In analogy to our characterization of discursive decision making behavior, we can emphasize the
following elements of intuitive decision making: Relatively low and small information basis for the
problem solving procedure; relatively low transparency and comprehensiveness of the problem
solving procedure; relatively short time for coming to a problem solution [35].
It is self-understanding that those typologies of discursive and intuitive decision making simply depict
the “polar” ends of problem solving behavioral patterns, referring to a continuum of decision making
attitudes in between, neither representing “complete discursion” nor “complete intuition” in decision
making processes.
Based on this, we can formulate the following general hypotheses of cause-effect-relations between
the degree of discursion/intuition and the degree of “rational” decision making behavior, itself again
determining decision making efficiency.
The main research question, underlying this study, is a two-fold one: First, it tries to answer the
question about the impact of intuitive vs. discursive (analytical) decision making behavior on the
degree of rationality in decision making processes. Second, it is assumed that – based on the outcomes
of an experimental study conducted by the main author in the 1980s – a higher degree of decision
making rationality results in a higher degree of decision making efficiency.
The following complex of hypotheses sketches the presumed elements of influence on human decision
making behavior. In accordance with Lewin, we suppose that decision making behavior is influenced
by personality and situation (of the environment). From this statement we deduce the following basic
sentence:
• Decision making behavior depends on the personality of the decision maker and the situational
context of the decision making process.
By focusing on intuition and discursion as basically dichotomic variables of influence on the degree of
rationality in decision making behavior, we develop the following basic hypothesis A1:
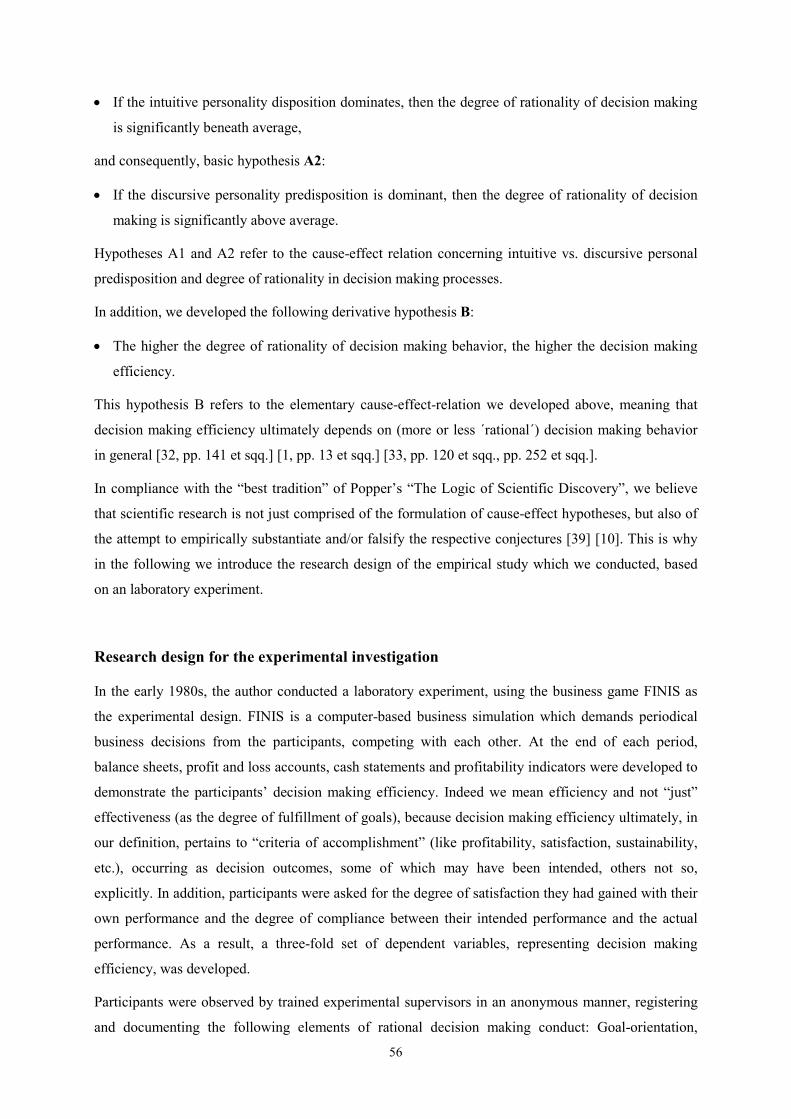
56
• If the intuitive personality disposition dominates, then the degree of rationality of decision making
is significantly beneath average,
and consequently, basic hypothesis A2:
• If the discursive personality predisposition is dominant, then the degree of rationality of decision
making is significantly above average.
Hypotheses A1 and A2 refer to the cause-effect relation concerning intuitive vs. discursive personal
predisposition and degree of rationality in decision making processes.
In addition, we developed the following derivative hypothesis B:
• The higher the degree of rationality of decision making behavior, the higher the decision making
efficiency.
This hypothesis B refers to the elementary cause-effect-relation we developed above, meaning that
decision making efficiency ultimately depends on (more or less ´rational´) decision making behavior
in general [32, pp. 141 et sqq.] [1, pp. 13 et sqq.] [33, pp. 120 et sqq., pp. 252 et sqq.].
In compliance with the “best tradition” of Popper’s “The Logic of Scientific Discovery”, we believe
that scientific research is not just comprised of the formulation of cause-effect hypotheses, but also of
the attempt to empirically substantiate and/or falsify the respective conjectures [39] [10]. This is why
in the following we introduce the research design of the empirical study which we conducted, based
on an laboratory experiment.
Research design for the experimental investigation
In the early 1980s, the author conducted a laboratory experiment, using the business game FINIS as
the experimental design. FINIS is a computer-based business simulation which demands periodical
business decisions from the participants, competing with each other. At the end of each period,
balance sheets, profit and loss accounts, cash statements and profitability indicators were developed to
demonstrate the participants’ decision making efficiency. Indeed we mean efficiency and not “just”
effectiveness (as the degree of fulfillment of goals), because decision making efficiency ultimately, in
our definition, pertains to “criteria of accomplishment” (like profitability, satisfaction, sustainability,
etc.), occurring as decision outcomes, some of which may have been intended, others not so,
explicitly. In addition, participants were asked for the degree of satisfaction they had gained with their
own performance and the degree of compliance between their intended performance and the actual
performance. As a result, a three-fold set of dependent variables, representing decision making
efficiency, was developed.
Participants were observed by trained experimental supervisors in an anonymous manner, registering
and documenting the following elements of rational decision making conduct: Goal-orientation,
57
utilization of available information, organization of the decision making process, utilization of
decision making heuristics, and continuous reflection and controlling of the respective decision
making performance.
As a result, the following “efficiency function”, was formulated:
DE = f (DDR); DE = Decision Making Efficiency (1)
DDR = Degree of Decision Making Rationality.
More precisely, in mathematical terms it reads [35, p. 309]:
b1y1 + b2y2 + b3y3 = a1x1 + a2x2 + a3x3 + a4x4 + a5x5 (2)
[y1 = formal efficiency, y2 = material efficiency, y3 = personal efficiency; x1 = goal orientation, x2 =
organization of the decision making process, x3 = utilization of available information, x4 = utilization
of decision making heuristics, x5 = reflection and controlling].
Formal efficiency represents the degree of actual performance in comparison with the intended
performance, the material efficiency represents indicators like profitability, solvency, rankings in
comparison with competitors, and personal efficiency represents individual satisfaction of the
participants with their performance.
The structural equation depicted above represents a canonical correlation, which was conducted as a
statistical analysis of the collected data sets.
All together, 83 participants contributed to the laboratory experiment sample.
65 participants were advanced students of business and management, 18 participants were experienced
practitioners.
The participants formed the competing “enterprises”, for which they had to make periodical decisions
competing on a virtual market against three other “enterprises”. In sum, eight periods were conducted,
finally leading to the entire data set which was subject to statistical analyses.
The statistical analyses delivered the following results, showing the relation between decision making
efficiency as the dependent variable and the “rationality elements” of decision making behavior as the
independent variables, achieved via a multiple regression analysis [35, p. 300]:
• Multiple correlation coefficient: 0,82041;
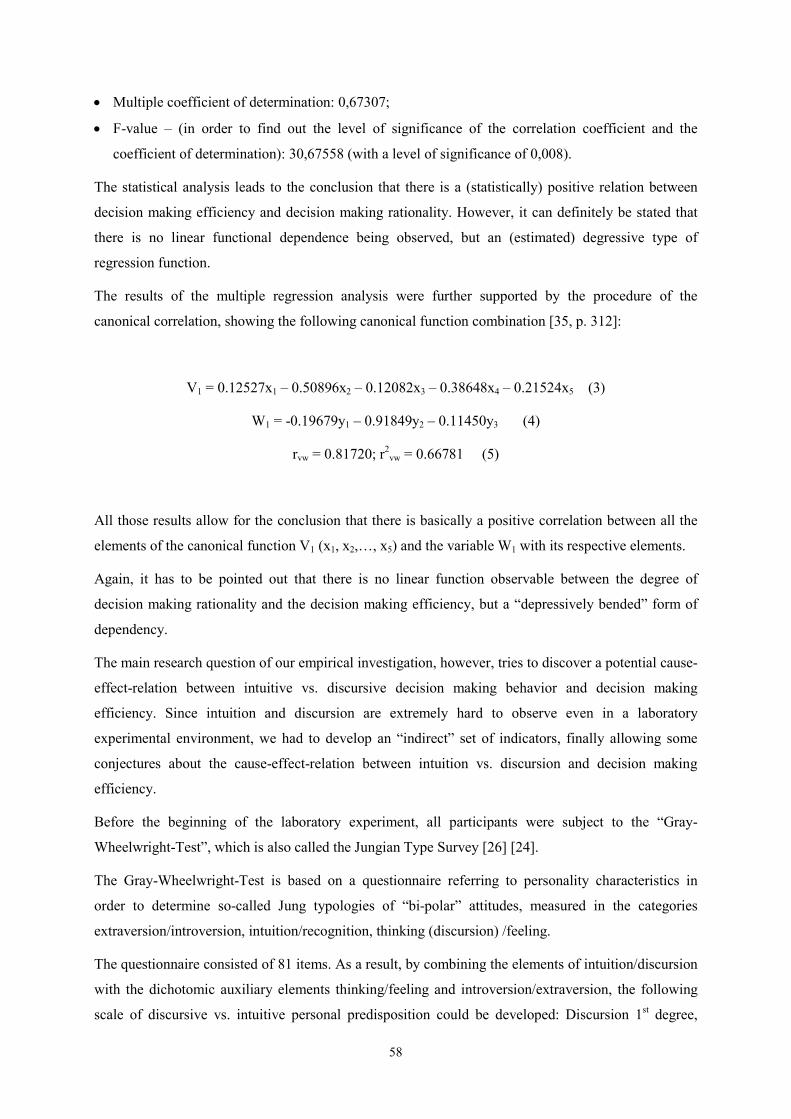
58
• Multiple coefficient of determination: 0,67307;
• F-value – (in order to find out the level of significance of the correlation coefficient and the
coefficient of determination): 30,67558 (with a level of significance of 0,008).
The statistical analysis leads to the conclusion that there is a (statistically) positive relation between
decision making efficiency and decision making rationality. However, it can definitely be stated that
there is no linear functional dependence being observed, but an (estimated) degressive type of
regression function.
The results of the multiple regression analysis were further supported by the procedure of the
canonical correlation, showing the following canonical function combination [35, p. 312]:
V1 = 0.12527x1 – 0.50896x2 – 0.12082x3 – 0.38648x4 – 0.21524x5 (3)
W1 = -0.19679y1 – 0.91849y2 – 0.11450y3 (4)
rvw = 0.81720; r2vw = 0.66781 (5)
All those results allow for the conclusion that there is basically a positive correlation between all the
elements of the canonical function V1 (x1, x2,…, x5) and the variable W1 with its respective elements.
Again, it has to be pointed out that there is no linear function observable between the degree of
decision making rationality and the decision making efficiency, but a “depressively bended” form of
dependency.
The main research question of our empirical investigation, however, tries to discover a potential cause-
effect-relation between intuitive vs. discursive decision making behavior and decision making
efficiency. Since intuition and discursion are extremely hard to observe even in a laboratory
experimental environment, we had to develop an “indirect” set of indicators, finally allowing some
conjectures about the cause-effect-relation between intuition vs. discursion and decision making
efficiency.
Before the beginning of the laboratory experiment, all participants were subject to the “Gray-
Wheelwright-Test”, which is also called the Jungian Type Survey [26] [24].
The Gray-Wheelwright-Test is based on a questionnaire referring to personality characteristics in
order to determine so-called Jung typologies of “bi-polar” attitudes, measured in the categories
extraversion/introversion, intuition/recognition, thinking (discursion) /feeling.
The questionnaire consisted of 81 items. As a result, by combining the elements of intuition/discursion
with the dichotomic auxiliary elements thinking/feeling and introversion/extraversion, the following
scale of discursive vs. intuitive personal predisposition could be developed: Discursion 1st degree,
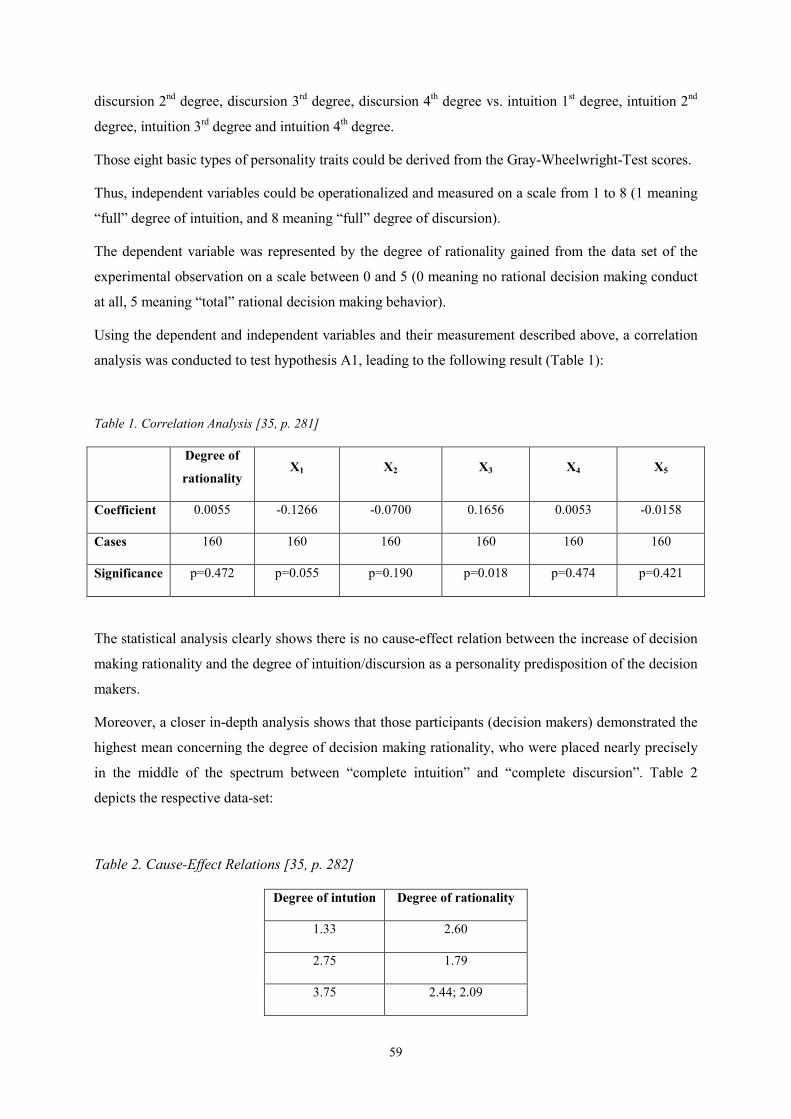
59
discursion 2nd degree, discursion 3
rd degree, discursion 4
th degree vs. intuition 1
st degree, intuition 2
nd
degree, intuition 3rd degree and intuition 4
th degree.
Those eight basic types of personality traits could be derived from the Gray-Wheelwright-Test scores.
Thus, independent variables could be operationalized and measured on a scale from 1 to 8 (1 meaning
“full” degree of intuition, and 8 meaning “full” degree of discursion).
The dependent variable was represented by the degree of rationality gained from the data set of the
experimental observation on a scale between 0 and 5 (0 meaning no rational decision making conduct
at all, 5 meaning “total” rational decision making behavior).
Using the dependent and independent variables and their measurement described above, a correlation
analysis was conducted to test hypothesis A1, leading to the following result (Table 1):
Table 1. Correlation Analysis [35, p. 281]
Degree of
rationality X1 X2 X3 X4 X5
Coefficient 0.0055 -0.1266 -0.0700 0.1656 0.0053 -0.0158
Cases 160 160 160 160 160 160
Significance p=0.472 p=0.055 p=0.190 p=0.018 p=0.474 p=0.421
The statistical analysis clearly shows there is no cause-effect relation between the increase of decision
making rationality and the degree of intuition/discursion as a personality predisposition of the decision
makers.
Moreover, a closer in-depth analysis shows that those participants (decision makers) demonstrated the
highest mean concerning the degree of decision making rationality, who were placed nearly precisely
in the middle of the spectrum between “complete intuition” and “complete discursion”. Table 2
depicts the respective data-set:
Table 2. Cause-Effect Relations [35, p. 282]
Degree of intution Degree of rationality
1.33 2.60
2.75 1.79
3.75 2.44; 2.09
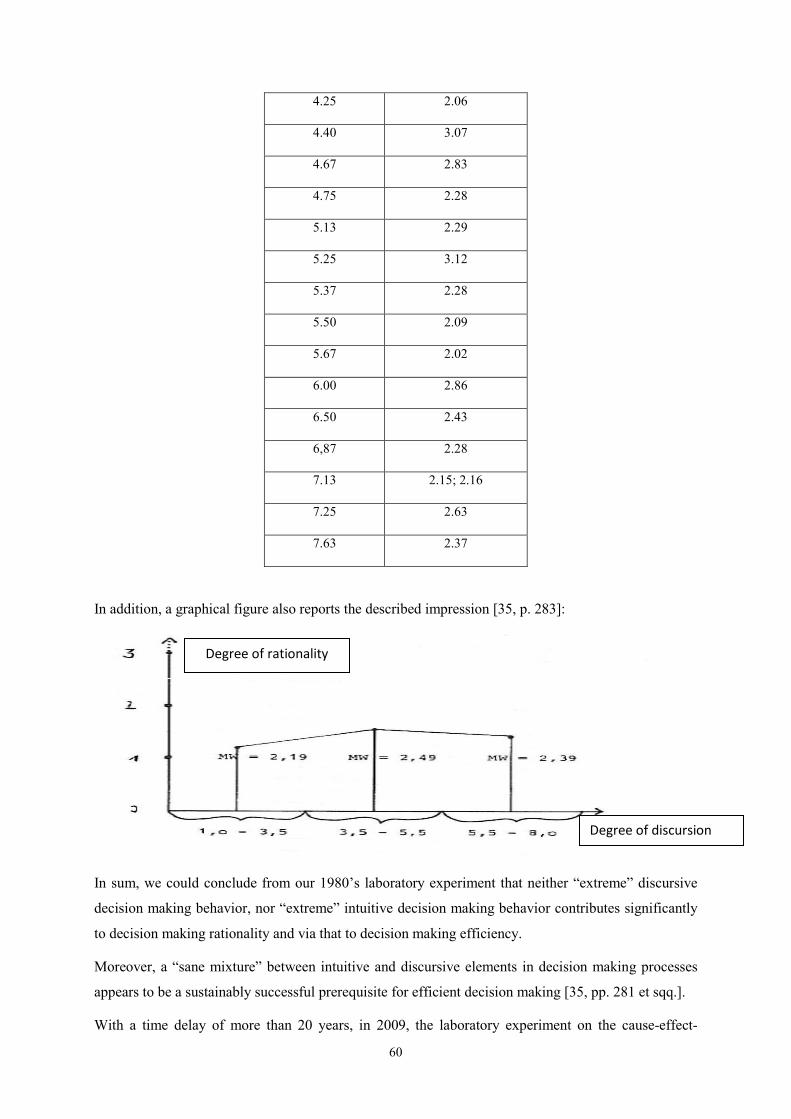
60
4.25 2.06
4.40 3.07
4.67 2.83
4.75 2.28
5.13 2.29
5.25 3.12
5.37 2.28
5.50 2.09
5.67 2.02
6.00 2.86
6.50 2.43
6,87 2.28
7.13 2.15; 2.16
7.25 2.63
7.63 2.37
In addition, a graphical figure also reports the described impression [35, p. 283]:
In sum, we could conclude from our 1980’s laboratory experiment that neither “extreme” discursive
decision making behavior, nor “extreme” intuitive decision making behavior contributes significantly
to decision making rationality and via that to decision making efficiency.
Moreover, a “sane mixture” between intuitive and discursive elements in decision making processes
appears to be a sustainably successful prerequisite for efficient decision making [35, pp. 281 et sqq.].
With a time delay of more than 20 years, in 2009, the laboratory experiment on the cause-effect-
Degree of rationality
Degree of discursion
61
relations between intuition vs. discursion in decision making processes and the respective decision
making efficiency was repeated (based on a somewhat different lab experiment – design see below),
trying to either replicate the empirical findings of 1980´s study or to falsify them.
The empirical design of the 2009 experimental investigation was comprised of the following elements:
• Main research question: Is there an impact of intuitive vs. discursive decision making behavior on
the decision making outcomes?
• Laboratory experimental sample: 115 graduate students in Master’s programs of Business
Administration, International Management, Sports-, Cultur- and Eventmanagement, Facility
Management at a German University of Applied Sciences and an Austrian University of Applied
Sciences.
• As the experimental design, the NASA game was utilized. The NASA game represents a decision
making situation in an imaginative urgency (see attachment). The participants had to present their
solution for this task, which was in the end “contrasted” with NASA´s optimal solution.
• The participants had to act individually, independently and without any support and/or discussions
with other participants. They were not given a time limit, but the actual time they needed to come
to a complete solution was recorded.
• After the conclusion of the problem solving process, each participant was asked to fill in a
questionnaire, either based on the Gray-Wheelwright-Winer 4-letter Type Indicator Test (based on
Jung’s typology theory) or the Myers-Briggs-Type-Indicator Test, which similarly deals with
personality patterns like the Gray-Wheelwright-Winer-Test, as there are extraversion/introversion,
sensing/intuition, thinking/feeling and judging/perceiving.
The Gray-Wheelwright-Winer 4-letter Type Indicator Test is a modified version of the Gray-
Wheelwright-Test, which was used in the 1980s experiment, described above.
Recently, both test apparatuses were subject to reliability and validity investigations [12] [41].
Those studies came to the following main conclusions:
1. The study of Schaubhut/Herk (2009): The correlation coefficients as the test/re-test reliability
indicator of the MBTI Test were higher than those of the Gray-Wheelwright-Winer Test,
ranging from 0.61 to 0.89 with an 8-week time period [41, p. 6].
2. Davis/Mattoon’s study: The Gray-Wheelwright-Winer Test is one of the few tests especially
designed to measure Jung’s concepts of extraversion/intraversion, sensing/intuition,
thinking/feeling and judgment/perceiving. It can be regarded as one of the best test instruments
available. But the T/H scale has limited reliability and validity [12, p. 238].
• Eventually, a correlation analysis was conducted to find out about a potential dependency between
the decision making performances in the NASA game and the operationalized indicator results of
the intuition/discursion personality tests. The analysis’ results and their accordance or divergence
from the 1980’s empirical findings are reported in the following chapter.
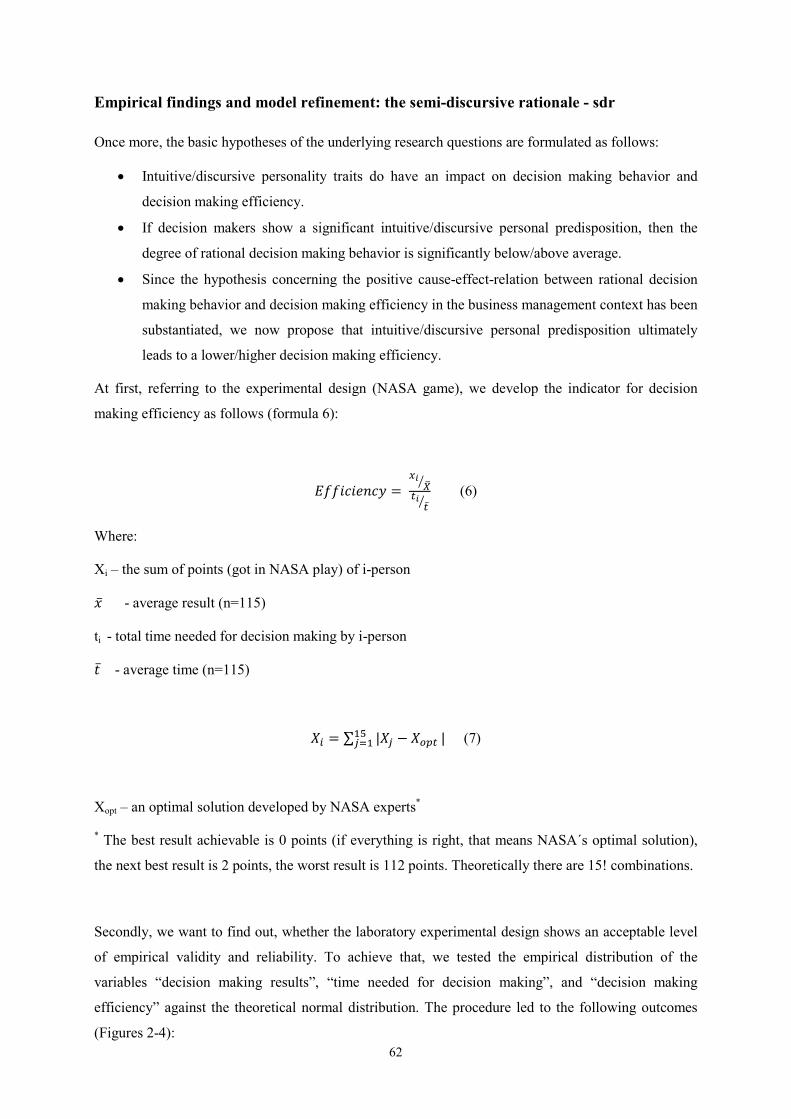
62
Empirical findings and model refinement: the semi-discursive rationale - sdr
Once more, the basic hypotheses of the underlying research questions are formulated as follows:
• Intuitive/discursive personality traits do have an impact on decision making behavior and
decision making efficiency.
• If decision makers show a significant intuitive/discursive personal predisposition, then the
degree of rational decision making behavior is significantly below/above average.
• Since the hypothesis concerning the positive cause-effect-relation between rational decision
making behavior and decision making efficiency in the business management context has been
substantiated, we now propose that intuitive/discursive personal predisposition ultimately
leads to a lower/higher decision making efficiency.
At first, referring to the experimental design (NASA game), we develop the indicator for decision
making efficiency as follows (formula 6):
���������� = �
� ����̅� (6)
Where:
Xi – the sum of points (got in NASA play) of i-person
�̅ - average result (n=115)
ti - total time needed for decision making by i-person
�̅ - average time (n=115)
�� = ∑ |�� − ��������� | (7)
Xopt – an optimal solution developed by NASA experts*
* The best result achievable is 0 points (if everything is right, that means NASA´s optimal solution),
the next best result is 2 points, the worst result is 112 points. Theoretically there are 15! combinations.
Secondly, we want to find out, whether the laboratory experimental design shows an acceptable level
of empirical validity and reliability. To achieve that, we tested the empirical distribution of the
variables “decision making results”, “time needed for decision making”, and “decision making
efficiency” against the theoretical normal distribution. The procedure led to the following outcomes
(Figures 2-4):

63
Figure 2. Distribution of variable “Result” (Xi)
Figure 3. Distribution of variable “Time” (ti)
Figure 4. Distribution of “Efficiency”
(German “Haeufigkeit” = engl. Frequency)
The empirical normal distribution against the theoretical normal distribution for the variables
“decision making results” and “time needed for decision making” was tested for both questionnaire
batteries, the Gray-Wheelwright-Winer-Test and the MBTI-Test (via Kolmogorov-Smirnov Test). As
a result, it can be stated that the variables “decision making results” (p=0,921) and “decision making
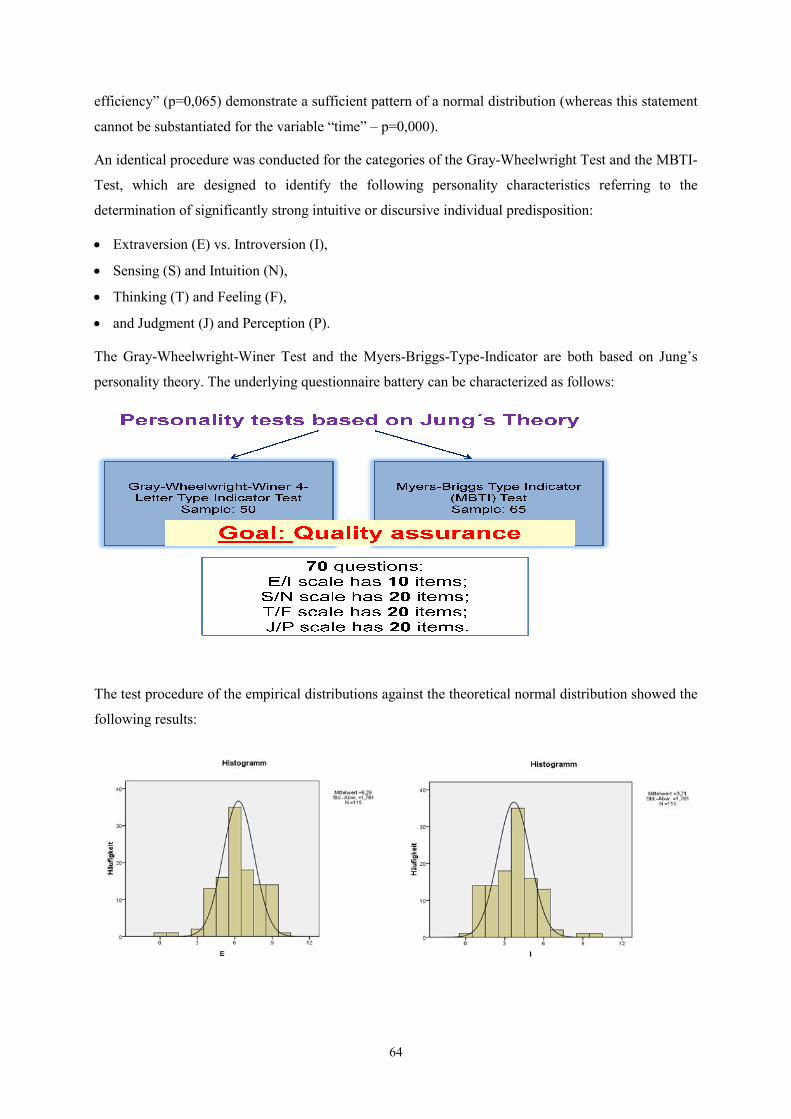
efficiency” (p=0,065) demonstra
cannot be substantiated for the variable “time”
An identical procedure was conducted for the categories of the Gray
Test, which are designed to identify the following personality characteristics referring to the
determination of significantly strong intuitive or discursive individual predisposition:
• Extraversion (E) vs. Introversion (I),
• Sensing (S) and Intuition (N),
• Thinking (T) and Feeling (F),
• and Judgment (J) and Perception (P).
The Gray-Wheelwright-Winer Test and the Myers
personality theory. The underlying questionnaire battery can be characterized as follows:
The test procedure of the empirical distributions against the theoretical normal distribution showed the
following results:
64
efficiency” (p=0,065) demonstrate a sufficient pattern of a normal distribution (whereas this statement
cannot be substantiated for the variable “time” – p=0,000).
An identical procedure was conducted for the categories of the Gray-Wheelwright Test and the MBTI
to identify the following personality characteristics referring to the
determination of significantly strong intuitive or discursive individual predisposition:
Extraversion (E) vs. Introversion (I),
Sensing (S) and Intuition (N),
(F),
and Judgment (J) and Perception (P).
Winer Test and the Myers-Briggs-Type-Indicator are both based on Jung’s
The underlying questionnaire battery can be characterized as follows:
empirical distributions against the theoretical normal distribution showed the
te a sufficient pattern of a normal distribution (whereas this statement
Wheelwright Test and the MBTI-
to identify the following personality characteristics referring to the
determination of significantly strong intuitive or discursive individual predisposition:
Indicator are both based on Jung’s
The underlying questionnaire battery can be characterized as follows:
empirical distributions against the theoretical normal distribution showed the
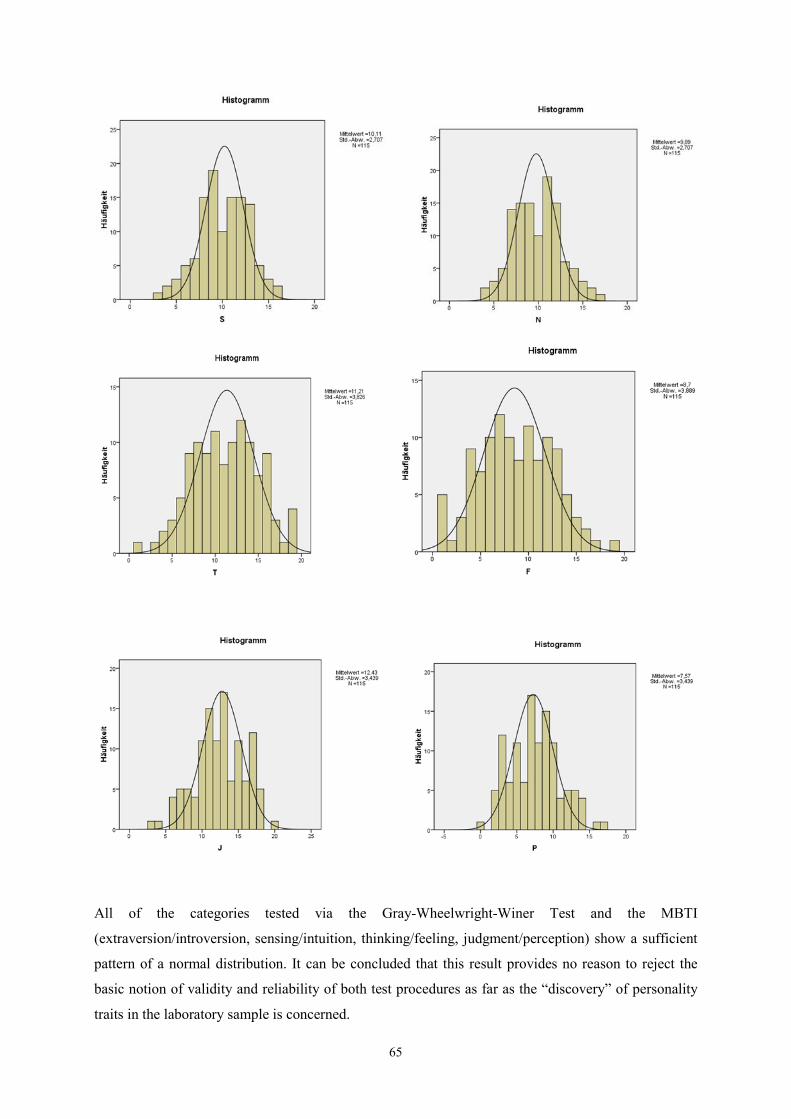
65
All of the categories tested via the Gray-Wheelwright-Winer Test and the MBTI
(extraversion/introversion, sensing/intuition, thinking/feeling, judgment/perception) show a sufficient
pattern of a normal distribution. It can be concluded that this result provides no reason to reject the
basic notion of validity and reliability of both test procedures as far as the “discovery” of personality
traits in the laboratory sample is concerned.
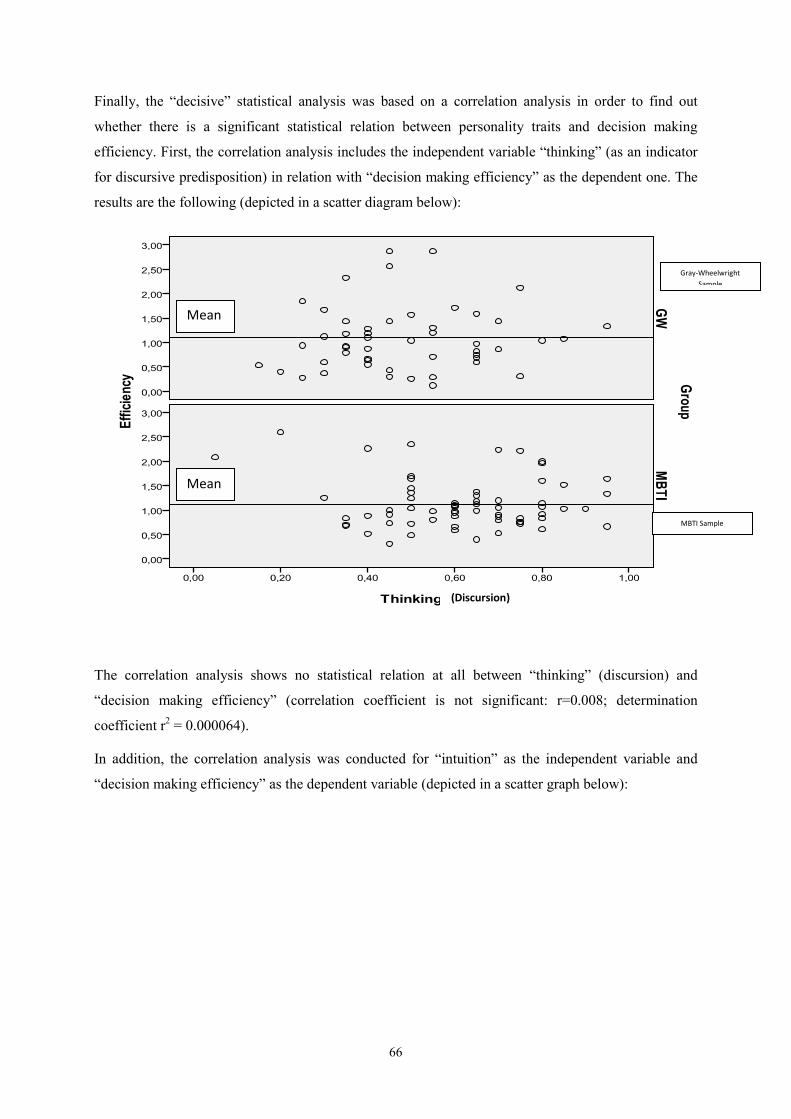
66
Finally, the “decisive” statistical analysis was based on a correlation analysis in order to find out
whether there is a significant statistical relation between personality traits and decision making
efficiency. First, the correlation analysis includes the independent variable “thinking” (as an indicator
for discursive predisposition) in relation with “decision making efficiency” as the dependent one. The
results are the following (depicted in a scatter diagram below):
The correlation analysis shows no statistical relation at all between “thinking” (discursion) and
“decision making efficiency” (correlation coefficient is not significant: r=0.008; determination
coefficient r2 = 0.000064).
In addition, the correlation analysis was conducted for “intuition” as the independent variable and
“decision making efficiency” as the dependent variable (depicted in a scatter graph below):
Mean
Mean
Gray-Wheelwright
Sample
MBTI Sample
(Discursion)
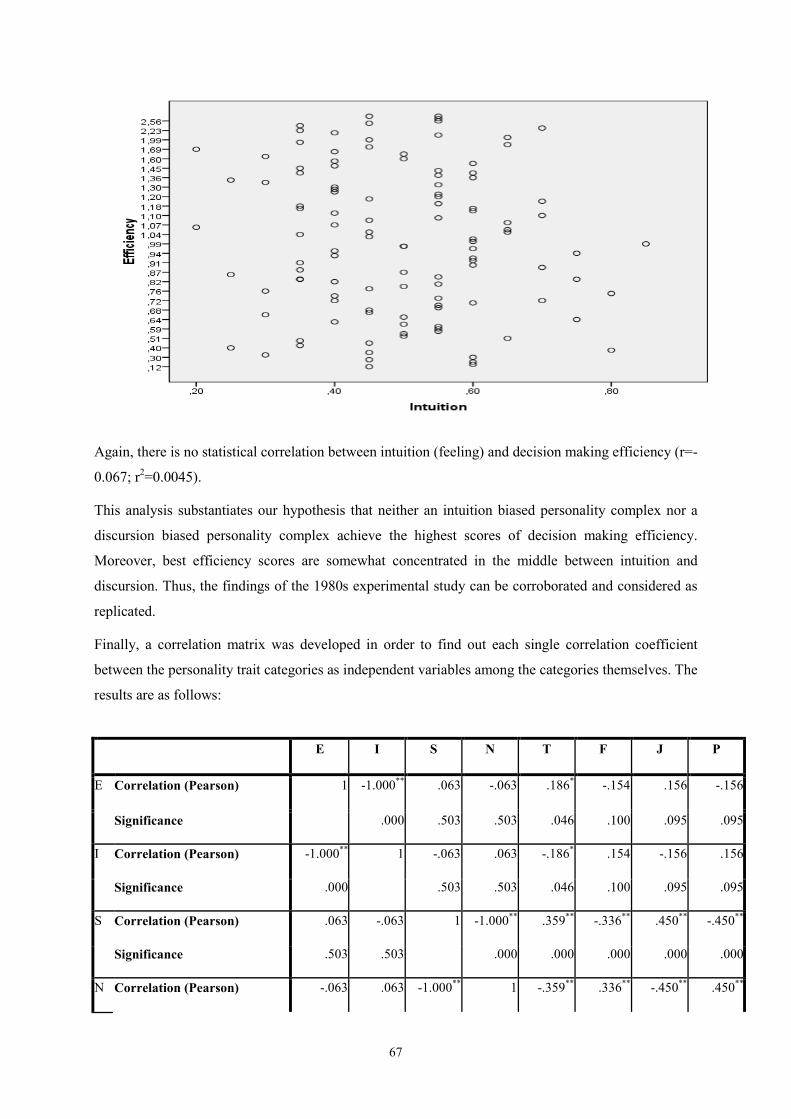
67
Again, there is no statistical correlation between intuition (feeling) and decision making efficiency (r=-
0.067; r2=0.0045).
This analysis substantiates our hypothesis that neither an intuition biased personality complex nor a
discursion biased personality complex achieve the highest scores of decision making efficiency.
Moreover, best efficiency scores are somewhat concentrated in the middle between intuition and
discursion. Thus, the findings of the 1980s experimental study can be corroborated and considered as
replicated.
Finally, a correlation matrix was developed in order to find out each single correlation coefficient
between the personality trait categories as independent variables among the categories themselves. The
results are as follows:
E I S N T F J P
E Correlation (Pearson) 1 -1.000** .063 -.063 .186
* -.154 .156 -.156
Significance
.000 .503 .503 .046 .100 .095 .095
I Correlation (Pearson) -1.000** 1 -.063 .063 -.186
* .154 -.156 .156
Significance .000
.503 .503 .046 .100 .095 .095
S Correlation (Pearson) .063 -.063 1 -1.000** .359
** -.336
** .450
** -.450
**
Significance .503 .503
.000 .000 .000 .000 .000
N Correlation (Pearson) -.063 .063 -1.000** 1 -.359
** .336
** -.450
** .450
**
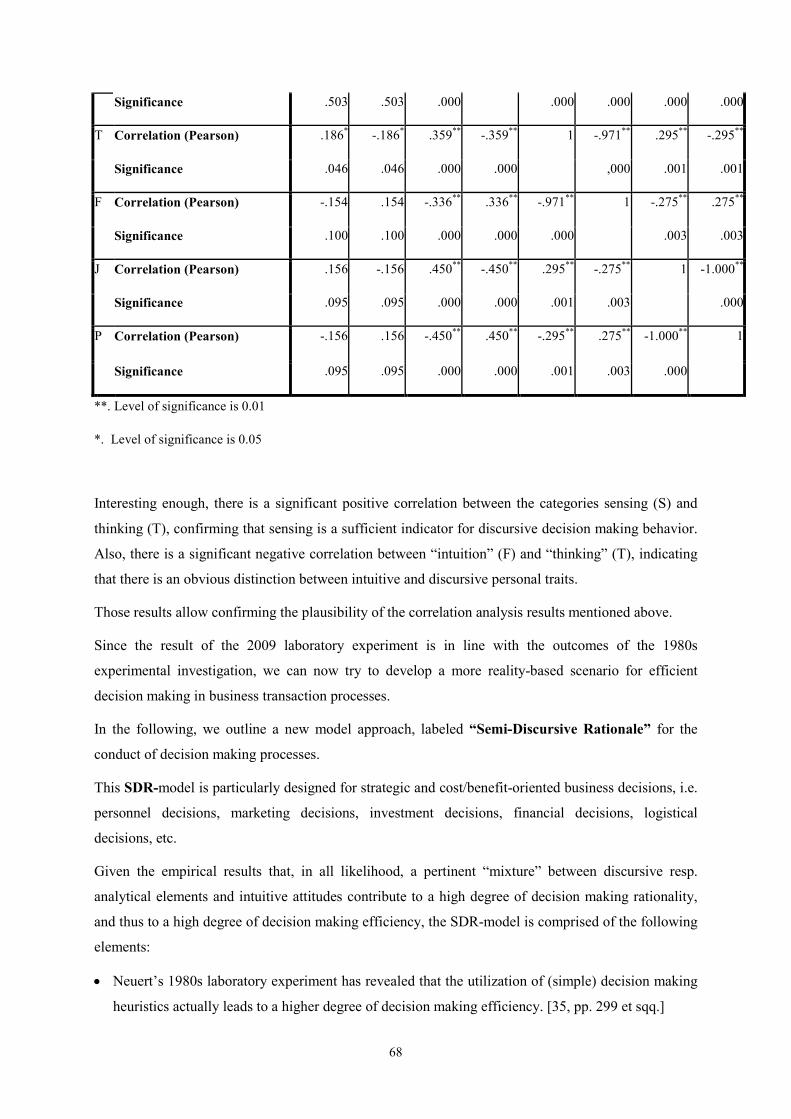
68
Significance .503 .503 .000
.000 .000 .000 .000
T Correlation (Pearson) .186* -.186
* .359
** -.359
** 1 -.971
** .295
** -.295
**
Significance .046 .046 .000 .000
,000 .001 .001
F Correlation (Pearson) -.154 .154 -.336** .336
** -.971
** 1 -.275
** .275
**
Significance .100 .100 .000 .000 .000
.003 .003
J Correlation (Pearson) .156 -.156 .450** -.450
** .295
** -.275
** 1 -1.000
**
Significance .095 .095 .000 .000 .001 .003
.000
P Correlation (Pearson) -.156 .156 -.450** .450
** -.295
** .275
** -1.000
** 1
Significance .095 .095 .000 .000 .001 .003 .000
**. Level of significance is 0.01
*. Level of significance is 0.05
Interesting enough, there is a significant positive correlation between the categories sensing (S) and
thinking (T), confirming that sensing is a sufficient indicator for discursive decision making behavior.
Also, there is a significant negative correlation between “intuition” (F) and “thinking” (T), indicating
that there is an obvious distinction between intuitive and discursive personal traits.
Those results allow confirming the plausibility of the correlation analysis results mentioned above.
Since the result of the 2009 laboratory experiment is in line with the outcomes of the 1980s
experimental investigation, we can now try to develop a more reality-based scenario for efficient
decision making in business transaction processes.
In the following, we outline a new model approach, labeled “Semi-Discursive Rationale” for the
conduct of decision making processes.
This SDR-model is particularly designed for strategic and cost/benefit-oriented business decisions, i.e.
personnel decisions, marketing decisions, investment decisions, financial decisions, logistical
decisions, etc.
Given the empirical results that, in all likelihood, a pertinent “mixture” between discursive resp.
analytical elements and intuitive attitudes contribute to a high degree of decision making rationality,
and thus to a high degree of decision making efficiency, the SDR-model is comprised of the following
elements:
• Neuert’s 1980s laboratory experiment has revealed that the utilization of (simple) decision making
heuristics actually leads to a higher degree of decision making efficiency. [35, pp. 299 et sqq.]
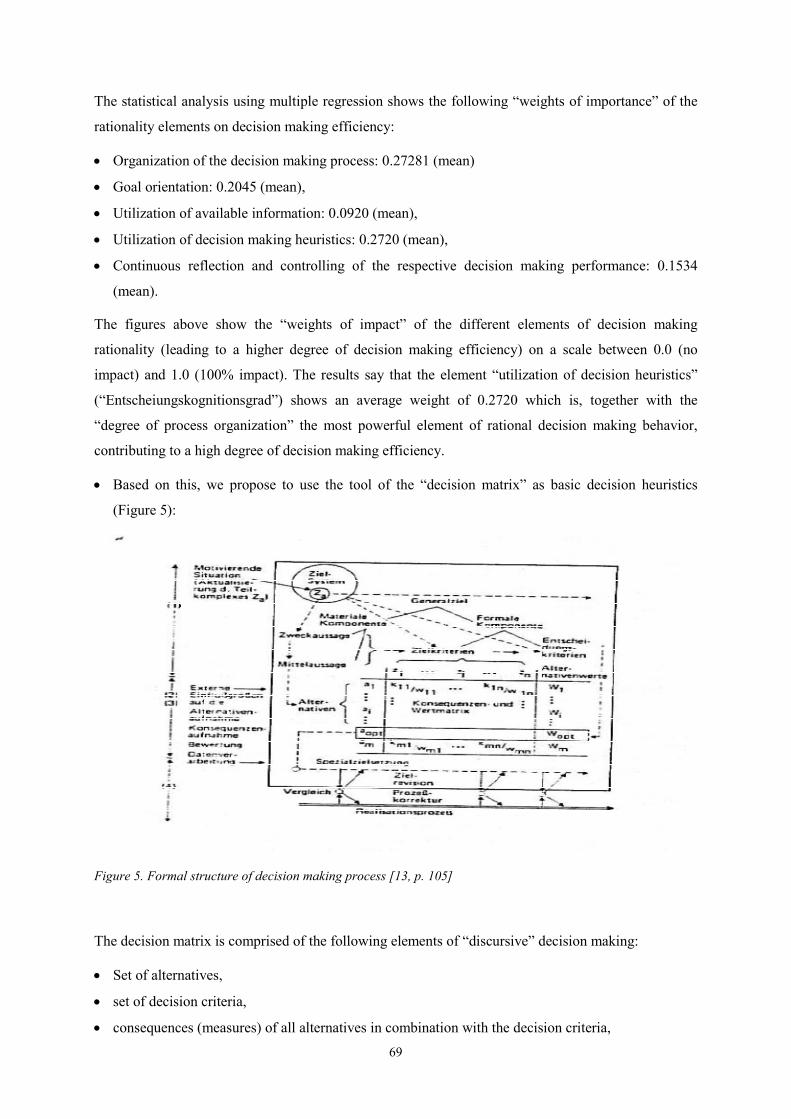
69
The statistical analysis using multiple regression shows the following “weights of importance” of the
rationality elements on decision making efficiency:
• Organization of the decision making process: 0.27281 (mean)
• Goal orientation: 0.2045 (mean),
• Utilization of available information: 0.0920 (mean),
• Utilization of decision making heuristics: 0.2720 (mean),
• Continuous reflection and controlling of the respective decision making performance: 0.1534
(mean).
The figures above show the “weights of impact” of the different elements of decision making
rationality (leading to a higher degree of decision making efficiency) on a scale between 0.0 (no
impact) and 1.0 (100% impact). The results say that the element “utilization of decision heuristics”
(“Entscheiungskognitionsgrad”) shows an average weight of 0.2720 which is, together with the
“degree of process organization” the most powerful element of rational decision making behavior,
contributing to a high degree of decision making efficiency.
• Based on this, we propose to use the tool of the “decision matrix” as basic decision heuristics
(Figure 5):
Figure 5. Formal structure of decision making process [13, p. 105]
The decision matrix is comprised of the following elements of “discursive” decision making:
• Set of alternatives,
• set of decision criteria,
• consequences (measures) of all alternatives in combination with the decision criteria,
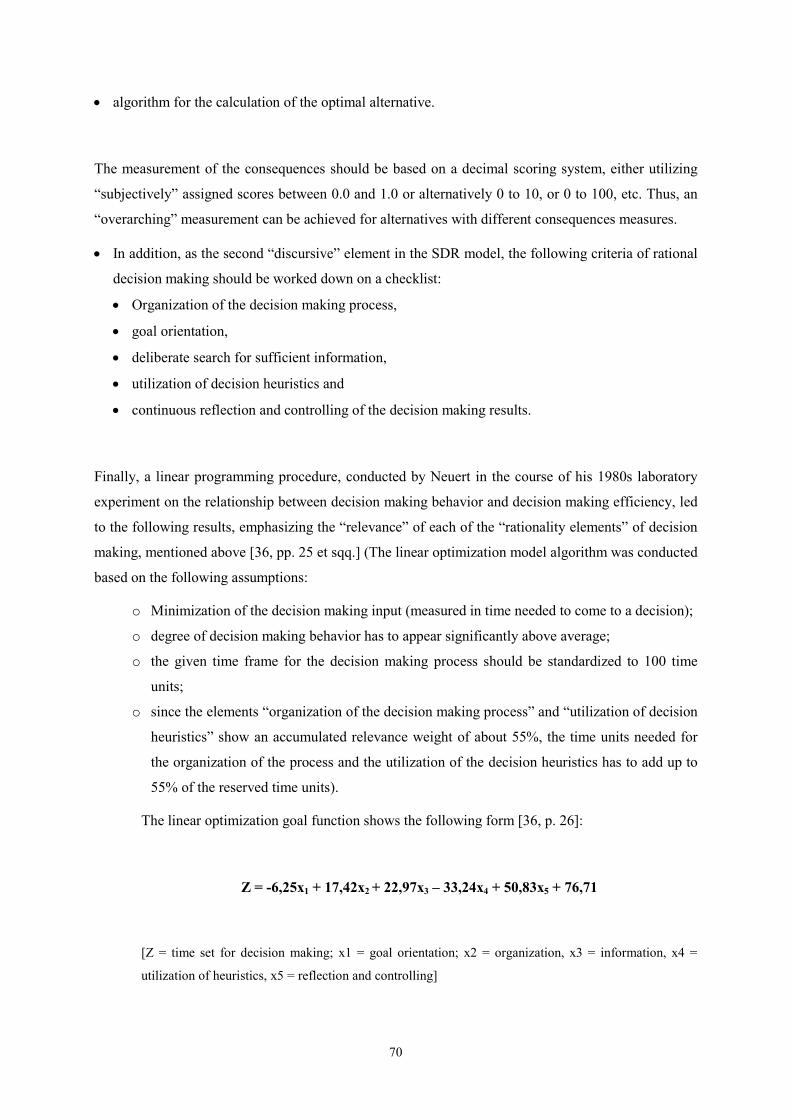
70
• algorithm for the calculation of the optimal alternative.
The measurement of the consequences should be based on a decimal scoring system, either utilizing
“subjectively” assigned scores between 0.0 and 1.0 or alternatively 0 to 10, or 0 to 100, etc. Thus, an
“overarching” measurement can be achieved for alternatives with different consequences measures.
• In addition, as the second “discursive” element in the SDR model, the following criteria of rational
decision making should be worked down on a checklist:
• Organization of the decision making process,
• goal orientation,
• deliberate search for sufficient information,
• utilization of decision heuristics and
• continuous reflection and controlling of the decision making results.
Finally, a linear programming procedure, conducted by Neuert in the course of his 1980s laboratory
experiment on the relationship between decision making behavior and decision making efficiency, led
to the following results, emphasizing the “relevance” of each of the “rationality elements” of decision
making, mentioned above [36, pp. 25 et sqq.] (The linear optimization model algorithm was conducted
based on the following assumptions:
o Minimization of the decision making input (measured in time needed to come to a decision);
o degree of decision making behavior has to appear significantly above average;
o the given time frame for the decision making process should be standardized to 100 time
units;
o since the elements “organization of the decision making process” and “utilization of decision
heuristics” show an accumulated relevance weight of about 55%, the time units needed for
the organization of the process and the utilization of the decision heuristics has to add up to
55% of the reserved time units).
The linear optimization goal function shows the following form [36, p. 26]:
Z = -6,25x1 + 17,42x2 + 22,97x3 – 33,24x4 + 50,83x5 + 76,71
[Z = time set for decision making; x1 = goal orientation; x2 = organization, x3 = information, x4 =
utilization of heuristics, x5 = reflection and controlling]

71
• The simplex procedure shows the following standardized results for the relevance of the various
elements:
o goal orientation 0.3536
o organization of the decision making procedure 0.3768
o information basis 0.8127
o utilization of decision heuristics 0.6414
o reflection and controlling 0.2280
Applied to the assigned decision time frame of 100 time units, this simplex algorithm results would
suggest the following “time portions” being reserved to conduct the following procedures:
o Development and determination of a system of goal criteria: 15 time units
o Organization of the decision making process: 15 time units
o Creation of the information basis for the decision making process: 34 time units
o Utilization of decision heuristics: 27 time units
o Reflection and controlling: 9 time units
The computation of time portions represents the relative “weights” of each element.
The procedure described above represents the “discursive approach” in our SDR-model. The next
question we will have to answer concerns the utilization of the “intuitive approach”, in order to come
to an “optimal” solution (based on the experimental findings). Wunderlich points out that the
“potentials” of intuition in decision making processes have be unlocked and utilized [55]. In other
words, how can intuition or intuitive behavioral elements significantly contribute to the improvement
of decision making efficiency?
In this context, we again refer to Fiedler’s scientific approach of intuitive decisions [17]. As a
consequence of his conjecture that “rational” intuition is based on learning processes including small
samples of learning procedures, he points out that “intuition is not contradictory to analytical decision
making…, but intuition can be regarded as a useful benefit coming out of the empirical environment”
[17].
Based on Fiedler’s works, we suggest the “utilization of intuition” via the following simple
framework:
• Each element of the “discursive procedures” described above has to be concluded with the question
to oneself based on a semantic differential:
How certain are you having done the procedure in a satisfactory manner?
very uncertain absolutely certain
1 2 3 4 5
72
• After having achieved a “first” optimal alternative, conducting the decision making process
described above, the final question to oneself should be added:
How certain are you that you have come to the right decision?
very uncertain absolutely certain
1 2 3 4 5
As long as the answer to this semantic differential question does not reach either 4 or 5, the procedure
should be repeated within a given time frame. The time frame should have been set at the beginning of
the decision making procedure, again based on the intuitive question to oneself:
• How long will I need to come to a satisfactory decision and
• how long am I supposed to need to come to a satisfactory decision.
This Semi-Discursive Rationale-Model for decision making may not fulfill satisfactorily the
scientific measures one wishes to make a decision subject to. Indeed, the SDR-model is just the first
draft of an applied decision making concept, using empirically proven scientific approaches to
improve decision making efficiency. Undoubtedly, much more research will have to be conducted in
order to elaborately outline the substance of the SDR.
However, as Gigerenzer points out in his monograph “Reckoning with risk – learning to live with
uncertainty” [19], “learning to live with uncertainty” may be a first step to at least somewhat enhance
the readiness to accept our limited ability to produce “optimal” decisions and actions, individually and
collectively.
Tentative conclusions
As a summary, we can draw the following tentative conclusions from our analytical and empirical
findings:
1. Decision making processes and decision making behavior are still one of the most preeminent
research topics in business management, economics and social sciences.
2. The neo-classical notion of the rational man – the homo oeconomicus – as the generally infallible
decision maker does not comply with reality.
3. The degree of decision making rationality is limited and subject to individual and/or collective
constraints, like insufficient cognitive competences, psychological predispositions, feelings and
emotions, etc.
4. However, the degree of decision making rationality, in the context of business decisions, does have
an impact on decision making efficiency. A “total” extent of decision making rationality, however,

73
can never be achieved in reality.
5. The degree of decision making rationality, and, indirectly, of decision making efficiency, also
depends on individual personality traits like introversion/extraversion, thinking/feeling,
sensing/intuition and judgment/perception.
6. Intuition/discursion (as a synonym for analytical decision making) can be measured as individual
personality traits. However, intuition/discursion does not determine solely a lower/higher degree of
decision making efficiency.
Moreover, a “sane mixture” between intuitive and discursive behavioral patterns tends to
“produce” higher decision making efficiency.
7. Based on the experimental findings, the Semi-Discursive Rationale-Model has been developed as
a set of heuristics in order to improve business decision making outcomes.
8. Further research needs to be conducted, following the so far unanswered question: “Why do
economic transactions take place at all and what determines the terms of those transactions?” [47,
p. 3].

74
APPENDIX 1
The main idea of NASA Play (crash on the
mood)15 Pieces of equipment must be positioned (1-the
most important, 15 – the less important):�Matches
�Food concentrate
�50 foot nylon rope
�Parachute silk
�Portable heating device
�2 pistols caliber 45
�Powdered milk
�2-pound-tanks with oxygen
�Mood atlas
�Float for lifesaving
�Magnetic compass
�5 gallons water
�Signal lamp
�First-aid case with injection needles
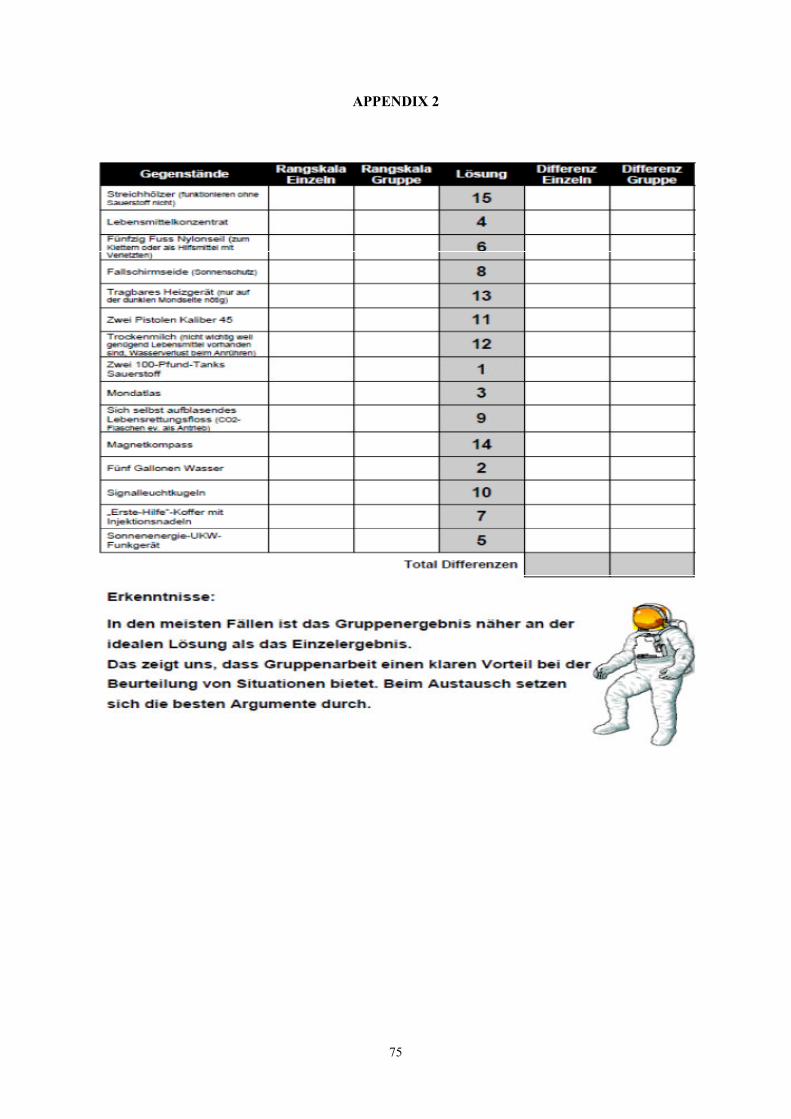
75
APPENDIX 2
76
References
1. Albert, J. Besser entscheiden - Gebrauchsanweisung für Unentschlossene. Frankfurt am Main, Germany:
Eichborn AG, 2006
2. Anderson, J.A. Intuition in managers. Are intuitive managers more effective? Journal of Managerial
Psychology, 2000, Vol. 15 No. 1, pp. 46-67,
3. Ariely, D. Predictably irrational. The Hidden Forces that shape our decisions. New York, USA:
HarperCollins Publishers, 2008
4. Arkes, H.R. / Hammond, K.R. Judgment and decision making: An interdisciplinary reader. Cambridge,
Great Britain: Cambridge University Press, 1992
5. Asch, S.E. Studies of Independence and Conformity. Psychological Monographs, 70. Jg., Pittsburgh, 1956,
pp. 1-70
6. Bales, R.F. Interaction Process Analysis: A Method for the Study of Small Groups. Massachusetts, USA:
1950
7. Bamberg, G. / Coenenberg, F. / Krapp, M. Betriebswirtschaftliche Entscheidungstheorie. München,
Germany: Vahlen, 2008
8. Bolton, G.E. / Ockenfels, A. ERC: A Theory of Equity, Reciprocity, and Competition. The American
Economic Review, March 2000, pp. 166-193
9. Camerer, F. / Loewenstein, J. / Rabin, P. Behavioural Economics. New York, USA: Princeton University
Press, 2004
10. Chmielewicz, K. Forschungskonzeptionen der Wirtschaftswissenschaft. Stuttgart, Germany: Poeschel Verlag,
1979
11. Cyert, R. / March, J. A Behavioural Theory of the Firm. Engelwood Cliffs, USA: Prentice Hall, 1963
12. Davis M.F. / Mattoon M.A. Reliability and Validity of the Gray-Wheelwrights Jungian Type Survey.
European Journal of Psychological Assessment. Vol. 22(4)., 2006, pp. 233-239
13. Dorow, W. Unternehmenskonflikte als Gegenstand unternehmungspolitischer Forschung. Berlin, Germany:
Duncker & Humblot GmbH, 1978
14. Dürmeier, T. / Egan-Krieger / Peukert, H. (ed.) Die Scheuklappen der Wirtschaftswissenschaft.
Postautistische Ökonomik für eine pluralistische Wirtschaftslehre. Marburg, Germany: Metropolis-Verlag,
2006
15. Eisenführ, H. / Weber, F. Rationales Entscheiden. Berlin, Germany: Springe, 2003
16. Fehr, E. / Schmidt, K.M. A Theory of Fairness, Competition and Cooperation. Working Paper No. 4. The
Quartely Journal of Economics, August 1999, pp. 817-868
17. Fiedler, K. Warum sind intuitive Entscheidungen so oft richtig? Eine wissenschaftliche Erklärung braucht
mehr als Intuition. Lecture of the Carl von Linde Foundation. Heidelberg, 2009
18. Gaeth, G.J. / Shanteau, J. Reducing the influence of irrelevant information on experienced decision makers.
Organizational Behaviour and Human Performance, 33, 1984, pp. 263-282
19. Gigerenzer, G. Reckoning with risk – learning to live with uncertainty. New York, USA: Penguin Group,
2002
20. Gigerenzer, G. Der Bauch wird unterschätzt. Frankfurter Allgemeine Zeitung, October 18/19, 2008
21. Gigerenzer, G. Bauchentscheidungen. Die Intelligenz des Unbewussten und die Macht der Intuition.
München, Germany: Wilhelm Goldmann Verlag, 2008
22. Gigerenzer, G. Das Einmaleins der Skepsis: über den richtigen Umgang mit Zahlen und Risiken. Berlin,
Germany: BvT Berliner Taschenbuch Verlags GmbH, 2009
23. Glimcher, P.W. / Camerer, C.F. / Fehr, E. / Poldrack, R.A. Neuroeconomics: Decision Making and the Brain.
London, United Kingdom: Elsevier Academic Press, 2009
24. Gray, H. / Wheelwright, J.W. Jung´s Psychological Types, including the four functions. Stanford, USA: 1945
25. Heinen, E. Entscheidungsorientierte Betriebswirtschaftslehre. Wiesbaden, Germany: Mohr, 1972
26. Jung, C. Psychological types. New York, USA: 1923
27. Jungermann, H. The two camps on rationality. in: Scholz, R.W. (ed.) Decision Making under Uncertainty.
Amsterdam: Elsevier Academic Press, 1983, pp. 63-86
28. Kahneman D. / Tversky, A. Prospect theory: An analysis of decision under risk. Econometrica, Vol. 47, No.
2, 1979, pp. 263-291.
29. Kahneman, D. / Tversky, A. On the reality of cognitive illusions. New York, USA: Econometrica, 1996
30. Kagel, J.H. / Roth, A.E. The handbook of experimental economics. New Jersey, USA: Princeton University
77
Press, 1995
31. Kant, I. Kritik der praktischen Vernunft, 1788
32. Kast, B. Wie der Bauch dem Kopf beim Denken hilft. Die Kraft der Intuition. Frankfurt am Main, Germany:
S.Fischer Verlag GmbH, 2009
33. Lehrer, J. Wie wir entscheiden: das erfolgreiche Zusammenspiel von Kopf und Bauch. München, Germany:
Piper Verlag GmbH, 2009
34. Lewin, K. Feldtheorie in den Sozialwissenschaften. Ausgewählte theoretische Schriften. Bern/Stuttgart,
Switzerland/Germany: 1969
35. Neuert, J.O. Planungsgrade: Eine experimentelle Untersuchung zum Zusammenhang zwischen
Planungsverhalten und Planungserfolg. Spardorf, Germany: Verlag René F. Wilfer, 1987
36. Neuert, J.O. Zu den praxeologischen und pädagogischen Implikationen einer empirischen Untersuchung zum
Zusammenhang zwischen Planungsverhalten und Planungseffizienz auf der Basis von Management Lern-
Labors. Band 2, EUROTOP GmbH, 1994
37. Neuert, J.O. The logic of managerial decisions making processes – rational conduct in the context of multiple
behavioural patterns: conjectures and refutations tested via an experimental investigation.
http://www.lab.uni-koeln.de/gew2005/public/pdf.php/program.pdf, 2005
38. Pfohl, H. Problemorientierte Entscheidungsfindung in Organisationen. Berlin/New York, Germany/USA:
1977
39. Popper, Karl Logik der Forschung. Berlin, Germany: Akademie Verlag, 2007
40. Rustichini, A. Neuroeconomics: Formal Models of Decision Making and Cognitive Neuroscience. in:
Glimcher, P.W./ Camerer, C.F./ Fehr, E./ Poldrack, R.A. (2009): Neuroeconomics: Decision Making and the
Brain. New York, USA: Elsevier Academic Press, 2009, p. 33-46
41. Schaubhut N.A./ Herk N.A. Reliability of the MBTI Form Q Assessment. CPP, Inc. In: Annual Convention of
the American Psychological Association, Toronto, Canada, August 6-9, 2009
42. Simon, H. On the Concept of Organizational Goal. Administrative Science Quarterly 9. New York, 1964, pp.
1-22
43. Simon, H. The New Science of Management Decision. New York, USA: Evatson, 1977
44. Simon, H. Entscheidungsverhalten in Organisationen. Eine Untersuchung von Entscheidungsprozessen in
Management und Verwaltung. Landsberg am Lech, Germany: 1981
45. Sjöberg, L. Intuitive vs. analytical decision making: which is preferred? Scandinavian Journal of
Management 19, 2003, pp. 17-29
46. Smith, A. Wealth of Nations. London, United Kingdom: 1776
47. Sowell, T. Economic Facts and Fallacies. New York, USA: Basic Books, 2008
48. Straub, W. (2009): Management by Mathe. FAS Consulting September 19, 2009, p.3
49. Stüvel, H. Die heimliche Macht des Unbewussten. DIE WELT, March 21, 2009
50. Szyperski, N. / Winand, U. Entscheidungstheorie. Eine Einführung unter besonderer Berücksichtigung
spieltheoretischer Aspekte. Stuttgart, Germany: 1974
51. Thaler, R.H. / Sunstein, C.R. Nudge – Improving Decisions About Health, Wealth and Happiness. New
Haven/London, United Kingdom: Yale University Press, 2008
52. Tversky, A. / Kahneman, D. Advances in prospect theory: cumulative representation of uncertainty. in:
Kahneman, D. / Tversky, A. (ed.) Choices, values and frames, Cambridge, United Kingdom: Cambridge
University Press, 1992, pp. 44-66.
53. Weber, M. Wirtschaft und Gesellschaft. Stuttgart, Germany: 1964
54. Westcott, M. Toward a Contemporary Psychology of Intuition. A Historical, Theoretical and Empirical
Inquiry. New York , USA: 1968
55. Wunderlich, J. Bauchgefühl: mit Intuition wirksamere Entscheidungen treffen. http://www.business-
wissen.de, [April 09, 2009]
56. Centracon Study: Strategische IT-Entscheidungen beruhen zur Hälfte auf Intuition.
http://www.openpr.de/news/160570/Centracon-Studie-Strategische-IT-Entscheidungen [July 29,2009]
57. http://www.thefreedictionary.com/discursive [September 17, 2009]
IV
Overview previous Discussion Papers
• No 5: Boelsche, Dorit: Performance measurement in humanitarian logistics, 2013.
• No 4: Conrad, Peter; Hummel, Thomas R. Transitions: Individuelle Handhabung und
Verarbeitungsformen institutionellen Wandels, 2012.
• No 3: Hummel, Thomas R.; Turovskaya, Maria S.: Project Studies in Specific Business,
Legal and Economic Topics: video conference presentations, 2011.
• No 2: Hans, Lothar: Zur Konzeption eines Verwaltungscontrollings, 2011.
• No 1: not published
The discussion papers can be downloaded from the homepage of the Faculty of Business:
www.hs-fulda.de/wirtschaft.