contoh kasus six sigma dipublikasi oleh alumni esa unggul
28
A R I P I N 2002 - 21 – 140 TEKNIK INDUSTRI UNIVERSITAS INDONUSA ESA UNGGUL 2004 MENURUNKAN CACAT NO POWER PADA PRODUKSI TV DENGAN METODA SIX SIGMA DI PT LG ELECTRONICS INDONESIA MENURUNKAN CACAT NO POWER PADA PRODUKSI TV DENGAN METODA SIX SIGMA DI PT LG ELECTRONICS INDONESIA MENURUNKAN CACAT NO POWER PADA PRODUKSI TV DENGAN METODA SIX SIGMA DI PT LG ELECTRONICS INDONESIA
-
Upload
siakesaunggul -
Category
Documents
-
view
4 -
download
0
Transcript of contoh kasus six sigma dipublikasi oleh alumni esa unggul

A R I P I N2002 - 21 – 140
TEKNIK INDUSTRI
UNIVERSITAS INDONUSA ESA UNGGUL2004
MENURUNKAN CACAT NO POWER PADA PRODUKSI TV
DENGAN METODA SIX SIGMA DI PT LG ELECTRONICS INDONESIA
MENURUNKAN CACAT NO POWER PADA PRODUKSI TV
DENGAN METODA SIX SIGMA DI PT LG ELECTRONICS INDONESIA
MENURUNKAN CACAT NO POWER PADA PRODUKSI TV
DENGAN METODA SIX SIGMA DI PT LG ELECTRONICS INDONESIA

Makin bertambah nilai sigma, makin berkurang biaya kualitas dan waktu siklus
Sigma adalah ukuran satuan statistik yang menggambarkan kemampuan suatu proses dan ukuran nilai sigma dinyatakan dalam DPU (Defect Per Unit) atau PPM
Dapat dikatakan bahwa proses dengan nilai sigma lebih tinggi dalam proses akan mempunyai cacat yang lebih sedikit
Konsep Six Sigma
Six Sigma : Suatu sistem yang flexibel untuk memperbaiki kinerja yang mendukung sukses secara terus-menerus. Six Sigma dibangun berdasarkan banyak ide manajemen yang penting dan praktek terbaik dari metoda sebelumnya
Menggunakan Z sebagai satuan ukuran kemampuan proses
Bila keragaman / variasi turun, maka kemungkinan cacat juga turun, maka kemampuan (capability)
meningkat
Kemampuan 6s
1σ
• Z = 3
2σ 3σ
Kemampuan 3s
USLLSL
USLLSL
• Z = 6
1σ 2σ 3σ 4σ 5σ 6σ
= s =( Xi - X )2
i = 1
n
n - 1
Sample’s standard deviation :
= X =Xi
i = 1
n
n
Sample’s average :
Z =
x - Nilai Z (sigma level)
Konsep Six Sigma

DEFINE
MEASURE
ANALYZEIMPROVE
CONTROL
•Identify Customer’s CTQ•Develop a team charter•Define and build a process
map
•Validate problem / process
•Measure key problem
•Current condition
•Screening potential factor
•Identify vital few root causes
•Validate hypothesis
•Develop ideas to cut off root causes
•Optimation solution•Measure solution
•Standardize solution
•Establish standard measure to maintain performance
Konsep Six Sigma

μ
USLUSL
T
Tepat namun tidak akurat
Geser menuju Target
TurunkanVariasi
μ
USLUSL
T
Shifting/bergeser ke Target & Mereduksi Variasi
Objectdari 6 adalah
Shift(geser) ke target
MenurunkanVariasi
Konsep Six Sigma
USLUSL
T
μ
Akurat namun tidak tepat

Aplikasi detail Six Sigma
Perbaikan dengan Metoda Six Sigma ( DMAIC )
PT LG ELECTRONICS INDONESIA

REDUCE SMPS TRANSFORMER SHORT ( NO POWER )
REDUCE SMPS TRANSFORMER SHORT ( NO POWER )
2004 06 14
Incoming Quality Control
REDUCE SMPS TRANSFORMER SHORT ( NO POWER )

Project Registration Sheet
840 PPM
ThemeName
ProjectPeriod
Measurement
QuantityTarget
Current Target Improvement Ratio (%)
0 PPM
Customer’sNeeds
Definition
Theme
Outline
Status&
Problem
AmountOf target (US$/Year)
AnticipationEffect
100 %
Analysis
Improvement
Control
6
Member
Role Telp.DeptName
February 3 ~ 6, 2004
February 9 ~ 21, 2004
February 24 ~ 28, 2004
March ~ May, 2004
REDUCE SMPS TRANSFORMER SHORT ( NO POWER )
Short Test as check point at line production of Samwha and IQC LGEIN.
Good reliability part
WIRE HOLE
WIRING CROSS
CHECKING PROSSES
Aripin QA 212
• Material Checking method
• Quality System set up
$29000
$0
100%
Before After
Great Company Great People
Fun Innovation By New Culture
2 - 22

Problem Situation
Management policy said we have reduce field claim.
Data field claim show No Power is cause biggest than other.
No power is TV Set have no supply voltage. It show by not light of Indicator power and no display on tube.
No power can caused by parts, like power cord, SMPS Transformer, IC, FBT, Transistor and others.
SMPS Transformer have function as divider power voltage to several sub circuit or part like FBT, IC, and others.
If SMPS not function, it can’t supply voltage to parts or sub circuit.
840 PPM
0PPM
100%
Before After
Target
SMPS
IC
Transistor
Diode
Crystal
Fuse
FBT
Resistor
29%
27%
15%
13%
5.2%
3.4%
2.0%
2.0%
3.6%Others
Defect Analysis by No Power
5 WORST SYMPTOM IN 2003
No Power42%
Screen 16%
No Sound15%
Picture NG15%
Knowledge12%
Data field claim 2003
29%
14%
10%
8.4%
8%
No Power
No Sound
CPT NG
Sound NG
A/V NG
Defect Analysis by Model
6170VMCBO1L
6170VMCBO1K
Others
26.3%
70.2%
3.5%
3 - 22
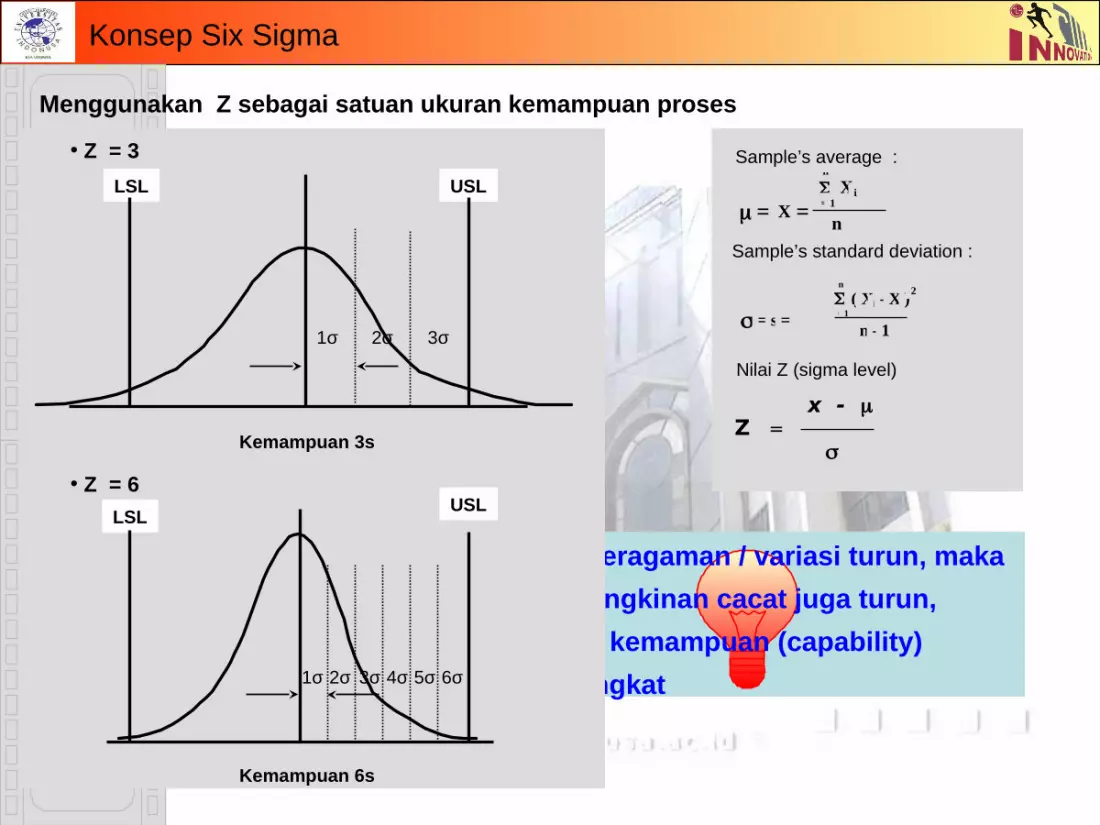
Improve TV Quality Attribute 30% SCR Reducing
Knowledge
Little y1
Part
Process
Big Y Little y2
Bad System ConnectorAGC Circuit
Front Cabinet DentedPWB Short
Bad Wiring ConnectionLoosen PartPWB Crack
Speaker ConnectionAdjustment
Soldering
Little y3
AntennaHow to Use
Product SpecElectricity
Environment
CapacitorFuse
SMPS TransSpeakerTunerFBTCPT
TransistorIC
Resistor
TYPETYPE PIC
1P1P1P1P1P1P1P1P
IIC1P1PIIC1P1P1P1P
1P1P1P1P1P1P1P1P
1P1P1P1P1P1P1P1PIIC1P1P
IIC1P1P
Crack, BallOpt. Skill, AbilityWire Connection
HandlingHandling
Opt. Skill, AbilityWrong Connection
HandlingAGC Circuit
Opt. Skill, Ability
No connectionHow to UseHow to used
Plug Connection Environment
ChassisReliability
Screen Focus, DYC,PRTABL Short
AGC, No RusterNo Sound Problem
No Power Un Connect
ReliabilityReliability
LQC LQCIQCProduction
ProductionProductionIQC/ProdIQCProduction
OQC
OQCIQCIQCIQCIQCIQC
IQCIQC
Status
FinishedOn ProgressOn ProgressOn Progress
FinishedOn ProgressFinishedOn ProgressOn Progress
On progressOn ProgressOn ProgressOn Progress
On ProgressOn ProgressFinishedFinishedFinishedOn Progress
FinishedOn Progress
OQCOQCOQC
1P1P IQC Finished
Theme Selection
4 - 22

Process Mapping
LGEIN LQCLGEIN LQC
• PatrolPatrol
• PerformancePerformance
Final Final InspectInspect
SAMWHASAMWHAProcessProcess
•R&DR&D
• PurchasePurchase
•IQCIQC
•ProductionProduction
• LQCLQC
• OQCOQC
LGEIN OQCLGEIN OQC
• ELTELT
• LTLTLTLT
• Reliability Reliability ProductProduct
LGEIN IQCLGEIN IQC
• AppearanceAppearance
• DimensionDimension
• StructureStructure
• PerformancePerformance
• AssemblingAssembling
• Reliable PartReliable Part
High defect SMPS no power
At LGEIN production
Selecting Best Condition
for reliable Part
Find Out what isthe Main Cause of
Problem
• OS&D
5 - 22
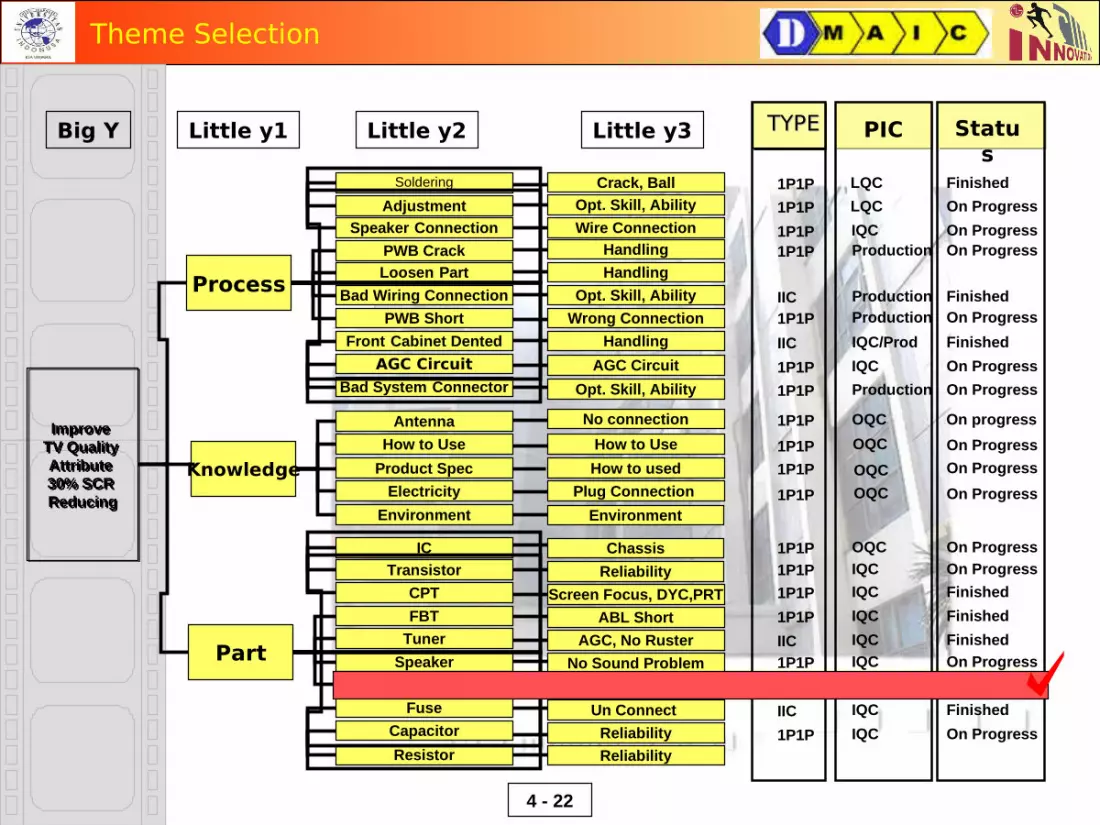
SMPS Component :• Core• Bobbin• Wire• Insulation• Tape• Shield
SMPS
What is SMPS Transformer ?
7
5
1
2
9
8
10
14
12
13
Output of SMPS (Voltage) • Pin 9 - 8 : 24 ~ 25• Pin 10 - 11 : 10 ~ 12• Pin 14 - 13 : 110 ~ 115• Pin 13 - 12 : 13 ~ 14• Pin 1 – 2 : 7 ~ 10
Potential ShortArea
Short can be happen if one of wire on potential areaget direct connect.
6 - 22
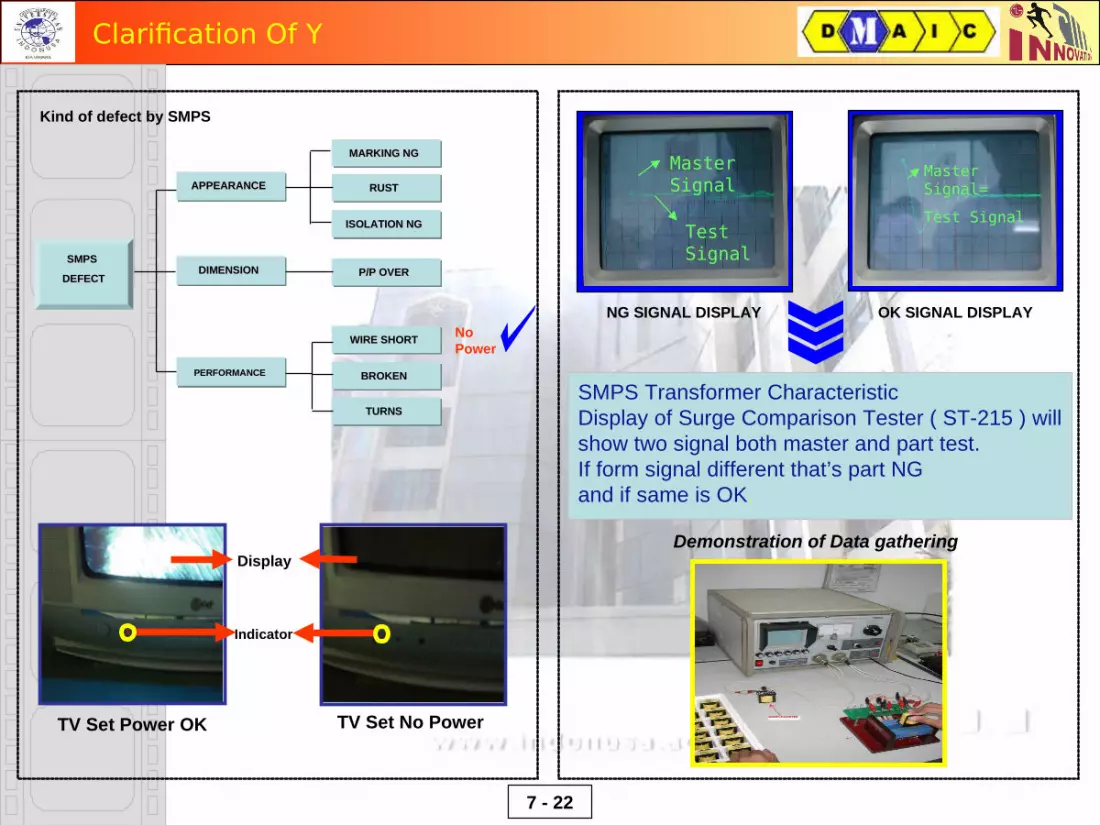
Clarification Of Y
Indicator
Display
TV Set Power OK TV Set No Power
No Power
SMPS SMPS
DEFECTDEFECT
APPEARANCEAPPEARANCE
DIMENSIONDIMENSION
PERFORMANCEPERFORMANCE
MARKING NGMARKING NG
RUSTRUST
ISOLATION NGISOLATION NG
P/P OVERP/P OVER
WIRE SHORTWIRE SHORT
BROKENBROKEN
TURNSTURNS
Kind of defect by SMPS
Master Signal
Test Signal
Master Signal=
Test Signal
NG SIGNAL DISPLAY OK SIGNAL DISPLAY
SMPS Transformer Characteristic Display of Surge Comparison Tester ( ST-215 ) will show two signal both master and part test. If form signal different that’s part NG and if same is OK.
Demonstration of Data gathering
7 - 22
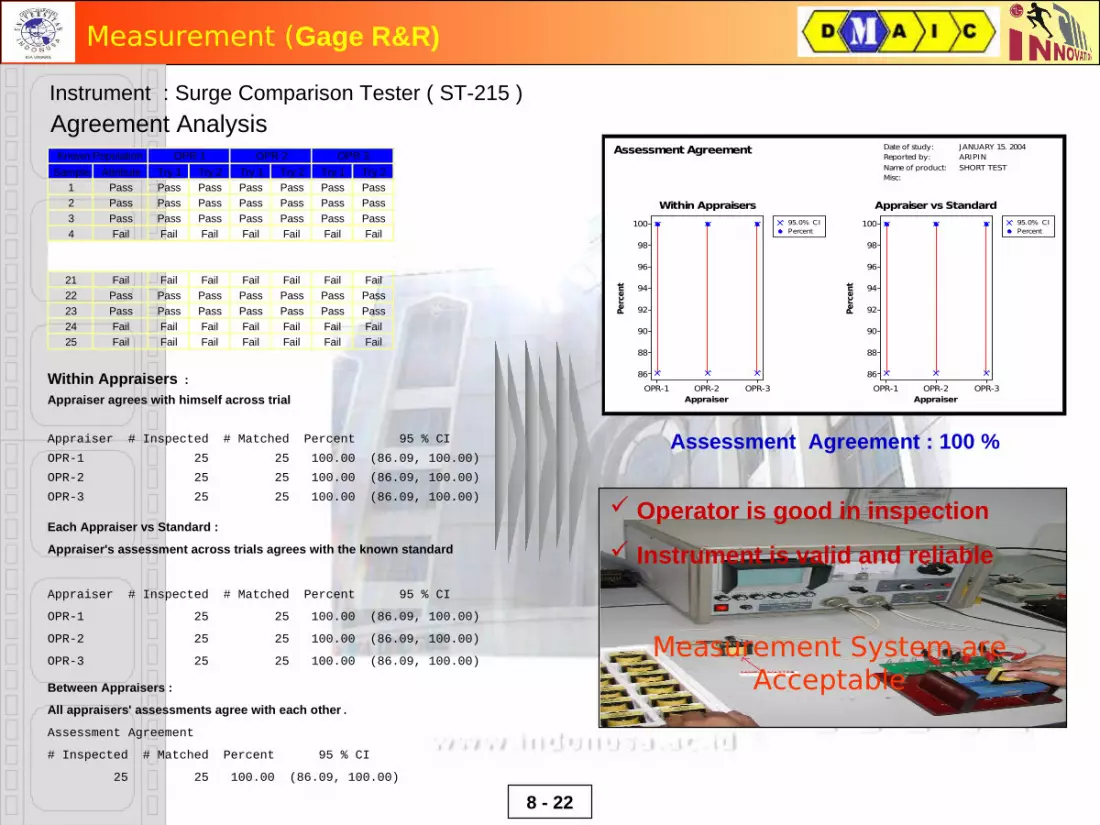
Measurement (Gage R&R)
Appraiser
Perc
ent
OPR-3OPR-2OPR-1
100
98
96
94
92
90
88
86
95.0% CIPercent
Appraiser
Perc
ent
OPR-3OPR-2OPR-1
100
98
96
94
92
90
88
86
95.0% CIPercent
Date of study: JANUARY 15. 2004Reported by: ARIPINName of product: SHORT TESTMisc:
Assessment Agreement
Within Appraisers Appraiser vs Standard
Assessment Agreement : 100 %
Operator is good in inspection Instrument is valid and reliable
Measurement System are Acceptable
Instrument : Surge Comparison Tester ( ST-215 )Agreement Analysis
Within Appraisers : Appraiser agrees with himself across trial
Appraiser # Inspected # Matched Percent 95 % CIOPR-1 25 25 100.00 (86.09, 100.00)OPR-2 25 25 100.00 (86.09, 100.00)OPR-3 25 25 100.00 (86.09, 100.00)
Each Appraiser vs Standard :
Appraiser's assessment across trials agrees with the known standard
Appraiser # Inspected # Matched Percent 95 % CI
OPR-1 25 25 100.00 (86.09, 100.00)
OPR-2 25 25 100.00 (86.09, 100.00)
OPR-3 25 25 100.00 (86.09, 100.00)
Between Appraisers :
All appraisers' assessments agree with each other.
Assessment Agreement
# Inspected # Matched Percent 95 % CI
25 25 100.00 (86.09, 100.00)
Sample Attribute Try 1 Try 2 Try 1 Try 2 Try 1 Try 21 Pass Pass Pass Pass Pass Pass Pass2 Pass Pass Pass Pass Pass Pass Pass3 Pass Pass Pass Pass Pass Pass Pass4 Fail Fail Fail Fail Fail Fail Fail
21 Fail Fail Fail Fail Fail Fail Fail22 Pass Pass Pass Pass Pass Pass Pass23 Pass Pass Pass Pass Pass Pass Pass24 Fail Fail Fail Fail Fail Fail Fail25 Fail Fail Fail Fail Fail Fail Fail
Known Population OPR 1 OPR 2 OPR 3
8 - 22

Capability Process (Current)
Based on data October ~ December ‘03, defect SMPS 124 ea from 147595 ea.• Defect Op. = 1 ( Wire Short )
• DPU = 124 : 147595
• DPO = 124 : ( 147595 x 1 ) = 8.4E-04
• DPMO = DPO x 1.000.000 = 840 PPM
From Z Normal table, we get :
DPO = 8.4E-04
Z Value = 3.1 + 0.04
= 3.14
Our Condition now :Sigma level = 3.14+ 1.5
= 4.64
8.45E-043.1
0.04
9 - 22

Estimate Cause Analysis
By Analyzing all potential problem that could have significant effect for SMPS Performance,thru Brainstorming and screening, we succeed to collect some root cause for the problem
Material
Method
wire
Hole
Space
Finishing
Core
Turn wiring
Home pin
Varnish
Dielectric Breakdown
Press
Short (No
Power)
Potential Factor
10 - 22
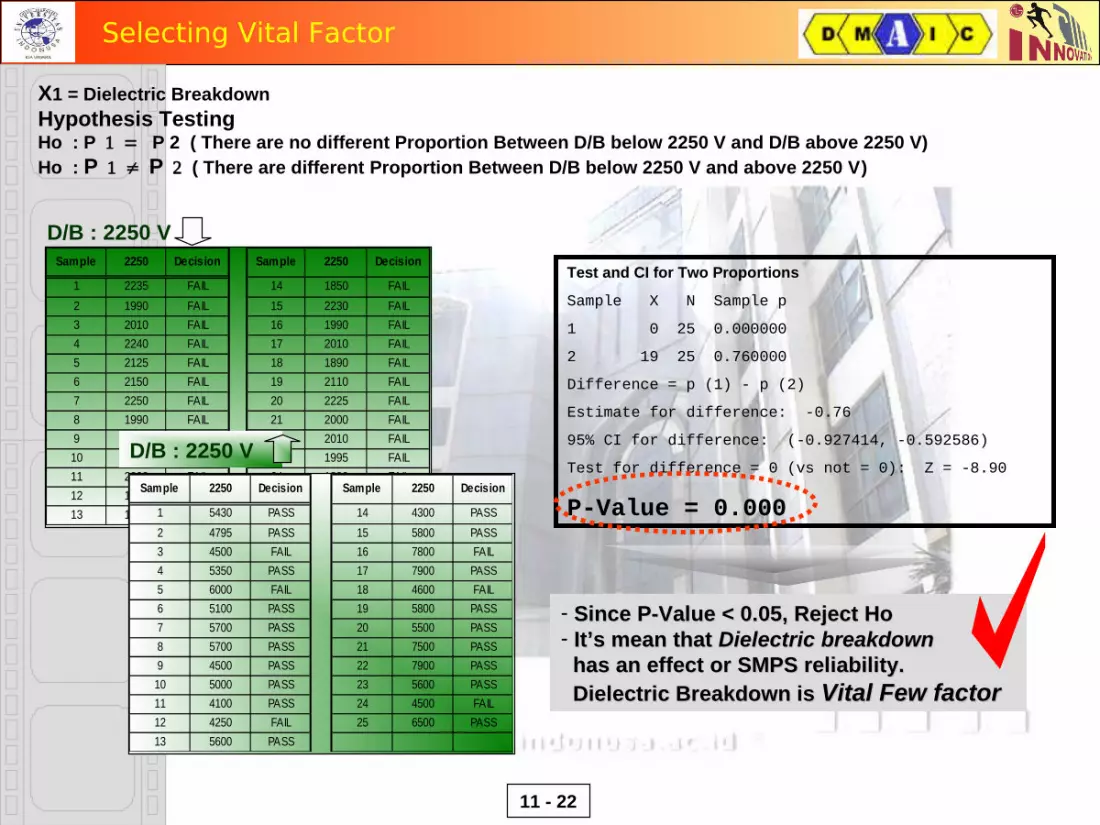
Selecting Vital Factor
Test and CI for Two Proportions
Sample X N Sample p
1 0 25 0.000000
2 19 25 0.760000
Difference = p (1) - p (2)
Estimate for difference: -0.76
95% CI for difference: (-0.927414, -0.592586)
Test for difference = 0 (vs not = 0): Z = -8.90
P-Value = 0.000
- Since P-Value < 0.05, Reject HoSince P-Value < 0.05, Reject Ho- It’s mean that It’s mean that Dielectric breakdownDielectric breakdown has an effect or SMPS reliability.has an effect or SMPS reliability. Dielectric Breakdown is Dielectric Breakdown is Vital Few factorVital Few factor
X1 = Dielectric BreakdownHypothesis TestingHo : P P 2 ( There are no different Proportion Between D/B below 2250 V and D/B above 2250 V)Ho : P≠P ( There are different Proportion Between D/B below 2250 V and above 2250 V)
Sample 2250 Decision Sample 2250 Decision
1 2235 FAIL 14 1850 FAIL
2 1990 FAIL 15 2230 FAIL3 2010 FAIL 16 1990 FAIL4 2240 FAIL 17 2010 FAIL5 2125 FAIL 18 1890 FAIL6 2150 FAIL 19 2110 FAIL7 2250 FAIL 20 2225 FAIL8 1990 FAIL 21 2000 FAIL9 2000 FAIL 22 2010 FAIL10 2230 FAIL 23 1995 FAIL11 2000 FAIL 24 1890 FAIL12 1985 FAIL 25 1885 FAIL13 1960 FAIL
D/B : 2250 V
Sample 2250 Decision Sample 2250 Decision
1 5430 PASS 14 4300 PASS
2 4795 PASS 15 5800 PASS3 4500 FAIL 16 7800 FAIL4 5350 PASS 17 7900 PASS5 6000 FAIL 18 4600 FAIL6 5100 PASS 19 5800 PASS7 5700 PASS 20 5500 PASS8 5700 PASS 21 7500 PASS9 4500 PASS 22 7900 PASS
10 5000 PASS 23 5600 PASS11 4100 PASS 24 4500 FAIL12 4250 FAIL 25 6500 PASS13 5600 PASS
D/B : 2250 V
11 - 22

Selecting Vital Factor
Test and CI for Two Proportions
Sample X N Sample p
1 25 25 1.000000
2 14 25 0.560000
Difference = p (1) - p (2)
Estimate for difference: 0.44
95% CI for difference: (0.245420, 0.634580)
Test for difference = 0 (vs not = 0):
Z = 3.76 P-Value = 0.000
- Since P-Value < 0.05, Reject HoSince P-Value < 0.05, Reject Ho- It’s mean that It’s mean that Pin Hole WirePin Hole Wire has an effect or SMPS reliability.has an effect or SMPS reliability.Pin Hole Wire is Pin Hole Wire is Vital Few factorVital Few factor
X2 = Pin Hole WireHypothesis TestingHo : P P 2 ( There are no different Proportion Between Pin Hole Below 5 and Above 5)Ho : P≠P ( There are different Proportion Between Pin Hole Below 5 and Above 5)
Sample 5 Decision Sample 5 Decision1 0 PASS 14 1 PASS
2 0 PASS 15 1 PASS3 1 PASS 16 0 PASS4 0 PASS 17 0 PASS5 0 PASS 18 0 PASS6 2 PASS 19 1 PASS7 1 PASS 20 1 PASS8 3 PASS 21 1 PASS9 1 PASS 22 0 PASS10 1 PASS 23 0 PASS11 0 PASS 24 0 PASS12 3 PASS 25 1 PASS13 0 PASS
Sample 5 Decision Sample 5 Decision1 7 PASS 14 6 PASS
2 7 PASS 15 7 PASS3 8 FAIL 16 7 FAIL4 7 FAIL 17 6 PASS5 6 PASS 18 7 PASS6 6 FAIL 19 8 FAIL7 8 PASS 20 8 FAIL8 8 FAIL 21 6 PASS9 6 PASS 22 7 PASS
10 9 PASS 23 9 FAIL11 10 FAIL 24 7 PASS12 11 FAIL 25 8 PASS13 10 FAIL
P/H : 5
P/H : 5
12 - 22
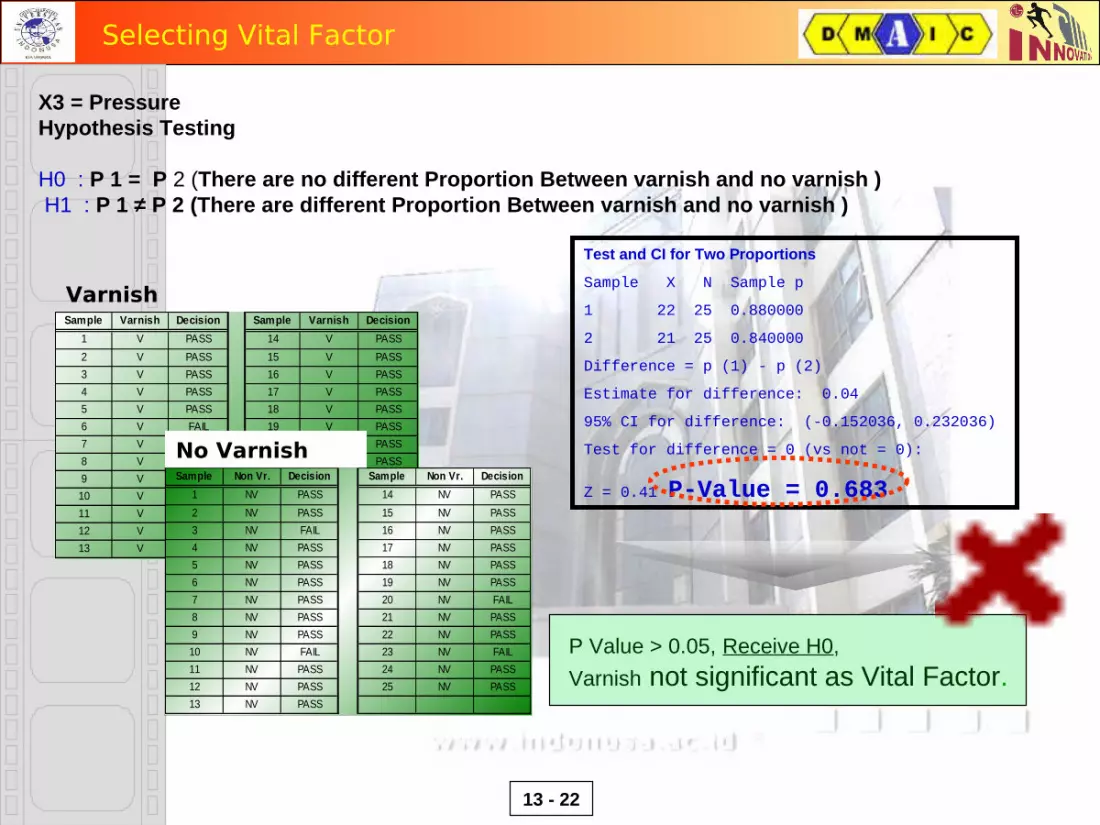
Sample Varnish Decision Sample Varnish Decision1 V PASS 14 V PASS
2 V PASS 15 V PASS3 V PASS 16 V PASS4 V PASS 17 V PASS5 V PASS 18 V PASS6 V FAIL 19 V PASS7 V PASS 20 V PASS8 V PASS 21 V PASS9 V PASS 22 V FAIL10 V PASS 23 V PASS11 V FAIL 24 V PASS12 V PASS 25 V PASS13 V PASS
Sample Non Vr. Decision Sample Non Vr. Decision1 NV PASS 14 NV PASS
2 NV PASS 15 NV PASS3 NV FAIL 16 NV PASS4 NV PASS 17 NV PASS5 NV PASS 18 NV PASS6 NV PASS 19 NV PASS7 NV PASS 20 NV FAIL8 NV PASS 21 NV PASS9 NV PASS 22 NV PASS10 NV FAIL 23 NV FAIL11 NV PASS 24 NV PASS12 NV PASS 25 NV PASS13 NV PASS
X3 = PressureHypothesis Testing
H0 : P 1 = P 2 (There are no different Proportion Between varnish and no varnish ) H1 : P 1 ≠ P 2 (There are different Proportion Between varnish and no varnish )
Varnish
No Varnish
Test and CI for Two Proportions
Sample X N Sample p
1 22 25 0.880000
2 21 25 0.840000
Difference = p (1) - p (2)
Estimate for difference: 0.04
95% CI for difference: (-0.152036, 0.232036)
Test for difference = 0 (vs not = 0):
Z = 0.41 P-Value = 0.683
P Value > 0.05, Receive H0, Varnish not significant as Vital Factor.
13 - 22
Selecting Vital Factor

Sample Space Decision Sample Space Decision1 S PASS 14 S PASS
2 S PASS 15 S PASS3 S PASS 16 S PASS4 S PASS 17 S PASS5 S PASS 18 S PASS6 S PASS 19 S PASS7 S PASS 20 S PASS8 S PASS 21 S PASS9 S PASS 22 S PASS10 S PASS 23 S PASS11 S PASS 24 S PASS12 S PASS 25 S PASS13 S PASS
Sample No Space Decision Sample No Space Decision1 NS PASS 14 NS PASS
2 NS PASS 15 NS PASS3 NS PASS 16 NS PASS4 NS PASS 17 NS PASS5 NS PASS 18 NS PASS6 NS PASS 19 NS PASS7 NS PASS 20 NS PASS8 NS PASS 21 NS PASS9 NS PASS 22 NS PASS10 NS PASS 23 NS PASS11 NS PASS 24 NS PASS12 NS PASS 25 NS PASS13 NS PASS
X4 = SpaceHypothesis Testing
H0 : P 1 = P 2 (There are no different Proportion Between space and no space ) H1 : P 1 ≠ P 2 (There are different Proportion Between space and no space )
No Space Space
No Space
Space
P Value > 0.05, Receive H0, Space not significant as Vital Factor.
Test and CI for Two Proportions
Sample X N Sample p
1 22 25 0.880000
2 24 25 0.960000
Difference = p (1) - p (2)
Estimate for difference: - 0.08
95% CI for difference: (-0.152036, 0.232036)
Test for difference = 0 (vs not = 0):
Z = 0.41 P-Value = 0.297
14 - 22
Selecting Vital Factor
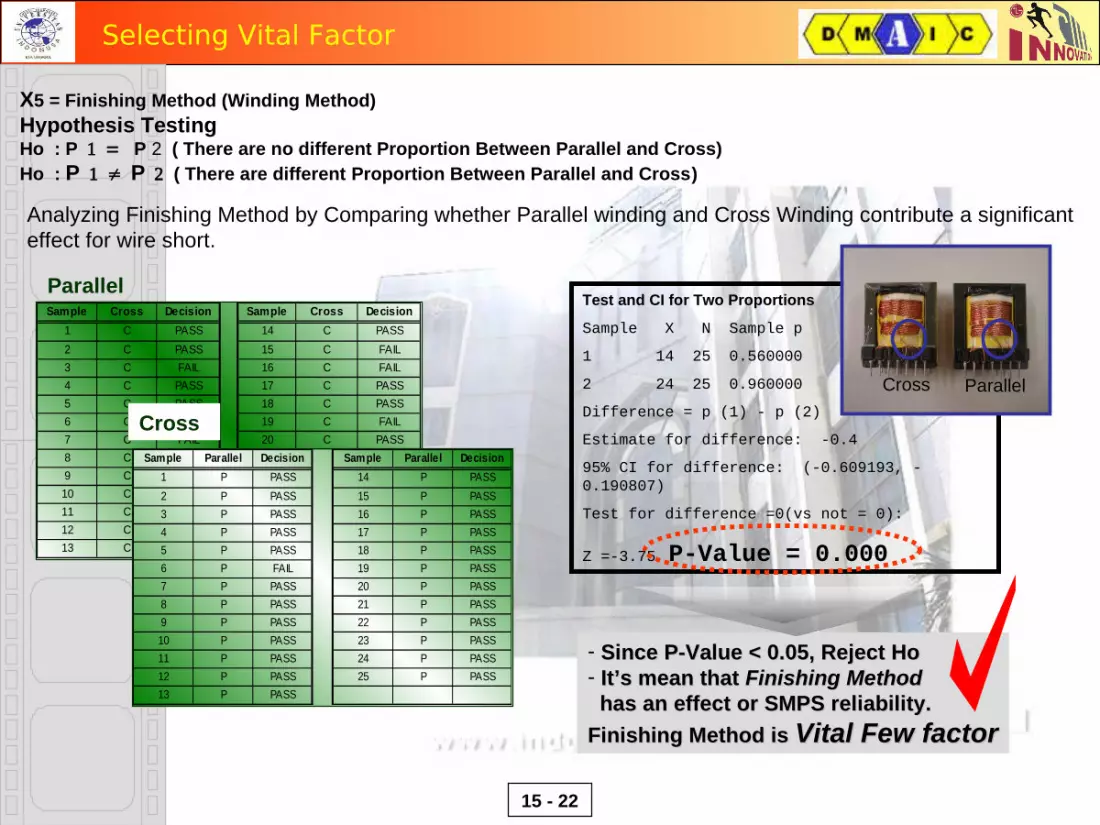
Sample Cross Decision Sample Cross Decision1 C PASS 14 C PASS
2 C PASS 15 C FAIL3 C FAIL 16 C FAIL4 C PASS 17 C PASS5 C PASS 18 C PASS6 C FAIL 19 C FAIL7 C FAIL 20 C PASS8 C PASS 21 C FAIL9 C PASS 22 C FAIL10 C FAIL 23 C FAIL11 C PASS 24 C PASS12 C FAIL 25 C PASS13 C PASS
Analyzing Finishing Method by Comparing whether Parallel winding and Cross Winding contribute a significant effect for wire short.
Parallel
Cross
Test and CI for Two Proportions
Sample X N Sample p
1 14 25 0.560000
2 24 25 0.960000
Difference = p (1) - p (2)
Estimate for difference: -0.4
95% CI for difference: (-0.609193, -0.190807)
Test for difference =0(vs not = 0):
Z =-3.75 P-Value = 0.000
- Since P-Value < 0.05, Reject HoSince P-Value < 0.05, Reject Ho- It’s mean that It’s mean that Finishing MethodFinishing Method has an effect or SMPS reliability.has an effect or SMPS reliability.Finishing Method is Finishing Method is Vital Few factorVital Few factor
X5 = Finishing Method (Winding Method)Hypothesis TestingHo : P P 2 ( There are no different Proportion Between Parallel and Cross)Ho : P≠P ( There are different Proportion Between Parallel and Cross)
Cross Parallel
Sample Parallel Decision Sample Parallel Decision1 P PASS 14 P PASS
2 P PASS 15 P PASS3 P PASS 16 P PASS4 P PASS 17 P PASS5 P PASS 18 P PASS6 P FAIL 19 P PASS7 P PASS 20 P PASS8 P PASS 21 P PASS9 P PASS 22 P PASS10 P PASS 23 P PASS11 P PASS 24 P PASS12 P PASS 25 P PASS13 P PASS
15 - 22
Selecting Vital Factor
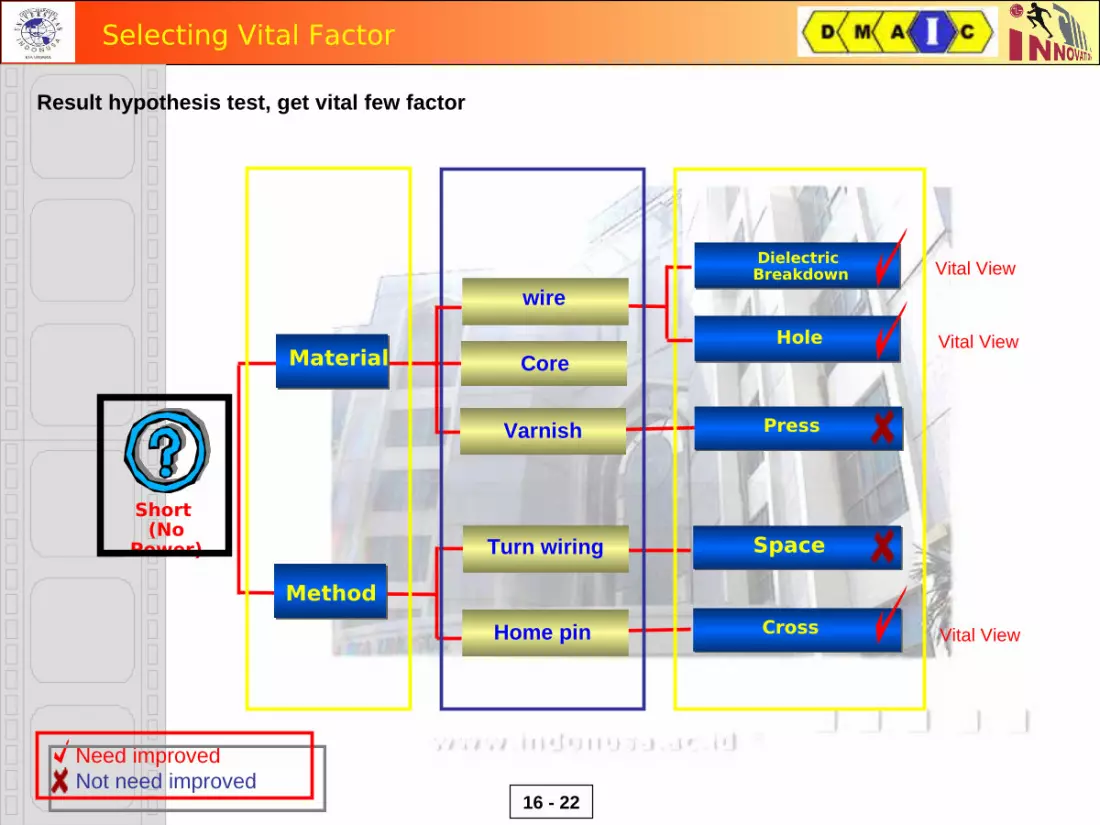
16 - 22
Vital View
Material
Method
wire
Hole
Space
Cross
Core
Turn wiring
Home pin
Varnish
Dielectric Breakdown
Press
Short (No
Power)
Vital View
Vital View
Selecting Vital Factor
Need improvedNot need improved
Result hypothesis test, get vital few factor

Selecting Optimum Condition
• Dielectric Breakdown ( ↑ 2250 V and ↓ 2250V)
• Wire Hole (↑ 5 and ↓5 / on 5 Meters)• Method Finishing Home Pin ( Cross and parallel)
Optimum condition : Dielectric Breakdown : ↑ 2250 V Pin Hole : ↓ 5 hole / 5 m Method Finishing : Parallel
P
C
H +
H -DB +DB -
MTD
H
DB
50
1000
0
40
700
0
Cube Plot (data means) for PASS ( % )
Opt. Condition
DB PH MTD Pass %DB - PH + P 0DB - PH + C 0DB + PH + P 50DB + PH + C 40DB + PH - C 70DB + PH - P 100DB - PH - P 0DB - PH - C 0
In this Step, we try to find the optimum combination of all factors which have a significant effect on SMPS Transformer Reliability.
17 - 22
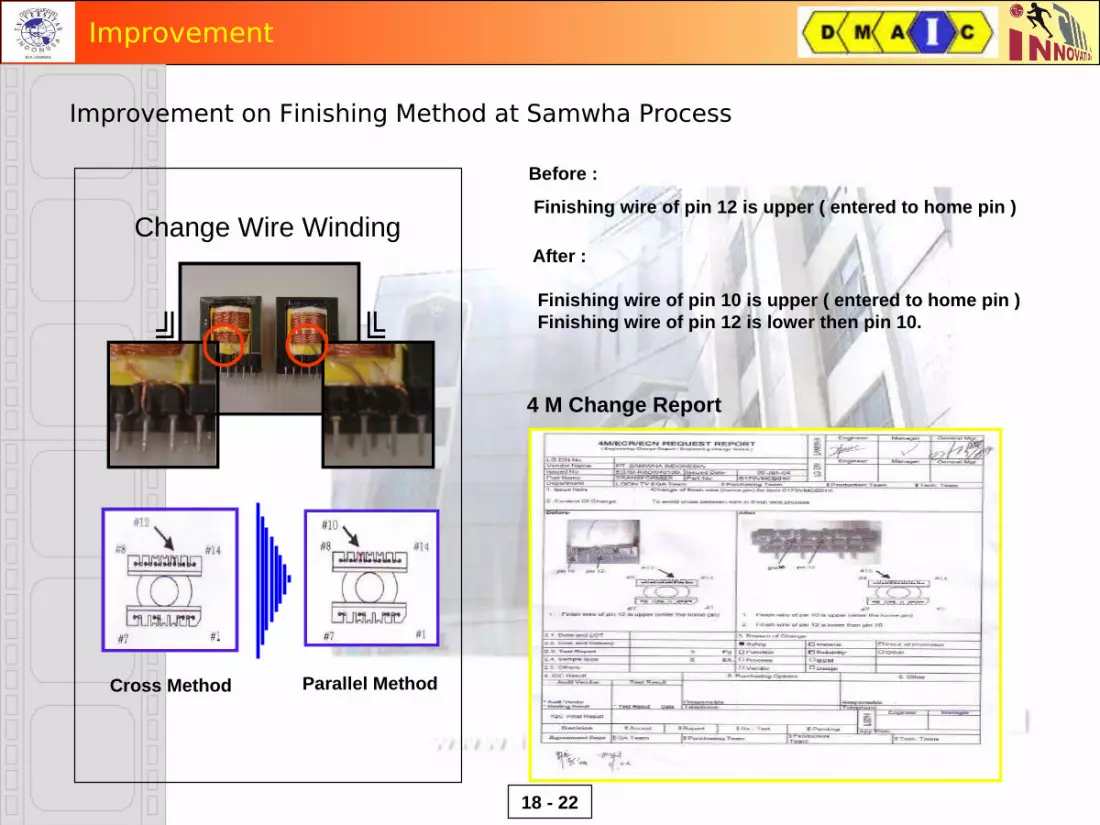
Improvement
Improvement on Finishing Method at Samwha Process
Before :
Finishing wire of pin 12 is upper ( entered to home pin )
After :
Finishing wire of pin 10 is upper ( entered to home pin ) Finishing wire of pin 12 is lower then pin 10.
4 M Change Report8
╚╝
Cross Method Parallel Method
Change Wire Winding
18 - 22

Improvement
Improvement on Inspection Checking Method
BeforeBefore AfterAfter
Delivery
Sampling
Inspection(Conventional)
Storage Area
Incoming
OK
NG
IQC
• Appearance• Size
Supplier
Inspection
Check hole & D
Breakdown
Storage Area
Incoming
OK
NG
IQC• Appearance Size• 5 m each roll wire ( test hole & D Breakdown )
Supplier
Sampling
Delivery
IQC Samwha
• Involving new item inspection as an
new inspection check point :
• Check hole wire by Phenolphthalein
( > 5 hole/5m, NG )
• Dielectric Breakdown test
ContentContent
19 - 22

To keep good condition, we do : Dielectric breakdown and hole wire control at wire vendor ( monthly ) Wire hole test before to production Item CTQ Control QC and Process Irregular Audit at Supplier Total Inspection Part (100% Short Test)
D/B Control
Observation
Indi
vidu
al V
alue
2018161412108642
7
6
5
4
3
_X=5.316
UCL=7.135
LCL=3.497
I Chart of D/ B
Observation
Indi
vidu
al V
alue
2018161412108642
550
540
530
520
510
_X=529.2
UCL=549.08
LCL=509.32
I Chart of INDUCTANCE
Inductance Control
Resistance Control
Observation
Indi
vidu
al V
alue
2018161412108642
157.5
155.0
152.5
150.0
147.5
145.0
_X=152.4
UCL=158.14
LCL=146.66
I Chart of RESISTANCE
CTQ
Maintain CTQ
20 - 22

Part production on March ~ May ‘04 are 245915 EA, SMPS Transformer defect: 1 ea
DPU = 1 : 184259 = 5.427E-6 ▶ DPMO = 4 PPM , Sigma Level = 5.97
Condition part Oct ~ Dec’03
No Power by SMPS
Part No
Def
ect P
PM
BOIL BOIK OTHERS
1128
(70.2% )
423
(26.3%)
56
4.64 840 PPM
Condition part Mar ~ May ’04
No Power by SMPS
Part No
Def
ect P
PM
BOIL BOIK OTHERS
5.97 4 PPMImprov
e
21 - 22
Saving Cost
HISTORY :
October ~ December ‘03 : Analysis cost : $ 1000
Hold, rework & sorter cost : $ 1950
Material cost : $ 4000
Loss time prod : $ 300
Total : $ 7250 ( 3 Month )
SAVING COST : $ 29,000 / YEARAfterBefore
$ 0
SAVING COST
$29000

22 - 22
THANK YOUTHANK YOUTHANK YOU