Continuous Risk-Aware Multi-Modal Authentication Across ...
167
Submitted by Daniel Hintze Submitted at Institute of Networks and Security Supervisor and First Examiner René Mayrhofer Second Examiner Alastair Beresford Co-Supervisor Josef Scharinger Eckhard Koch October 2019 JOHANNES KEPLER UNIVERSITY LINZ Altenbergerstraße 69 4040 Linz, Österreich www.jku.at DVR 0093696 Continuous Risk-Aware Multi-Modal Authentication Across Mobile Devices Doctoral Thesis to obtain the academic degree of Doktor der technischen Wissenschaften in the Doctoral Program Technische Wissenschaften
-
Upload
khangminh22 -
Category
Documents
-
view
3 -
download
0
Transcript of Continuous Risk-Aware Multi-Modal Authentication Across ...
Submitted byDaniel Hintze
Submitted atInstitute of Networksand Security
Supervisor andFirst ExaminerRené Mayrhofer
Second ExaminerAlastair Beresford
Co-SupervisorJosef ScharingerEckhard Koch
October 2019
JOHANNES KEPLERUNIVERSITY LINZAltenbergerstraße 694040 Linz, Österreichwww.jku.atDVR 0093696
Continuous Risk-AwareMulti-Modal AuthenticationAcross Mobile Devices
Doctoral Thesis
to obtain the academic degree of
Doktor der technischen Wissenschaften
in the Doctoral Program
Technische Wissenschaften

Continuous Risk-Aware Multi-Modal Authentication Across Mobile Devices© 2019 Daniel Hintze

Nothing worth having comes easy
— Theodore Roosevelt


Dedicated to Marianne Lina Jentsch-Hintze


A B S T R A C T
Personal mobile devices have long become an indispensable part of everyday life,allowing easy access to sensitive assets, information, and services. Being small andmobile, they are often lost or stolen. Knowledge-based authentication is commonlyapplied to protect against unauthorized access in this case. However, one out ofthree mobile devices is not protected by authentication with inconvenience beingthe paramount reason.
To increase the usability of authentication by reducing the cognitive load for theuser, transparent biometrics and risk-aware authentication can be used. In thisdissertation, we demonstrate how both concepts can be combined and extended toa group of trusted devices, thereby scaling with the increasing number of devicespeople own and operate simultaneously. Using a novel simulation-based eval-uation approach, we show that the proposed dynamic authentication system isable to significantly increase both security and usability, compared to conventionalknowledge-based authentication and single-device biometric systems. Simulatingabout 2,000 total years of mobile device usage, we found that the system we pro-pose is able to achieve a reduction in password entries by up to 98% with equal orbetter security compared ceteris paribus with password-based authentication.
As a prerequisite to our authentication approach, we conducted a large-scale, long-term analysis of mobile device usage characteristics such as session length, interac-tion frequency, and daily usage with respect to authentication state, context, andform factor. Covering more than 4,300 total years of mobile device usage, it is byfar the most comprehensive study of its kind in terms of sample size as of today.We found that smartphones are used on average 60 times per day but are unlockedin only 46% of the interactions. Additionally, we discovered that context has a sta-tistically significant effect on both the length and frequency of device interactions.
In addition to this main focus, we also introduce a novel approach for repeatableand efficient sharing of large scientific datasets which we developed in the process.Featuring inter- and intra-file selectivity, the system we developed facilitates accessto datasets otherwise to large to process for researchers with limited computationalresources, making the ability to conduct excellent research less of a privilege ofeconomic wealth.
vii

Z U S A M M E N FA S S U N G
Persönliche mobile Geräte sind längst zu einem unverzichtbaren Bestandteil desAlltags geworden und ermöglichen den einfachen Zugriff auf sensible Informatio-nen und Dienste. Da die Geräte klein und mobil sind, können sie leicht verlorengehen oder gestohlen werden. Um den Zugriff Unbefugter in diesen Situationenzu verhindern, werden üblicherweise wissensbasierte Authentifizierungsverfahreneingesetzt. Da die wiederholte Eingabe von Passwörtern von vielen Benutzer alslästig empfunden wird, ist heute jedoch bei jedem dritten Smartphone kein ent-sprechender Sperrbildschirm aktiviert.
Um die Benutzerfreundlichkeit von Sperrmechanismen durch die Verringerungder kognitiven Belastung für den Benutzer zu verbessern, können biometrischeErkennungsverfahren und risiko-adaptive Systeme verwendet werden. In dieserDissertation zeigen wir, wie beide Ansätze kombiniert und auf eine Gruppe vonGeräten angewendet werden können. Dies ermöglicht es, der zunehmenden An-zahl persönlicher mobiler Geräte, die parallel genutzt werden, Rechnung zu tragen.Unter Verwendung eines neuartigen simulations-basierten Evaluierungsverfahrenszeigen wir, dass das entwickelte System im Vergleich zur herkömmlichen, wissens-basierten Authentifizierung sowohl die Sicherheit, als auch die Benutzerfreundlich-keit erheblich steigern kann. Bei der Simulation von circa 2.000 Nutzungsjahrenmobiler Geräte konnten wir zeigen, dass das in dieser Arbeit entwickelte Systemeine Reduktion der Kennworteingaben um bis zu 98% bei gleicher oder bessererSicherheit als passwort-basierte Authentifizierung ermöglicht.
Als Vorstudie führen wir eine umfassende Langzeitanalyse der Nutzungsmerkma-le mobiler Geräte durch. Dabei betrachten wir Merkmale wie Nutzungsdauer, In-teraktionshäufigkeit und Summe der täglichen Nutzung, unter Berücksichtigungvon Aspekten wie Status des Sperrbildschirms, Kontext und Formfaktor. Die Stu-die betrachtet mehr als 4.300 Jahre Gerätenutzung, was sie zu der heute mit Ab-stand umfassendsten Studie ihrer Art macht. Dabei stellten wir unter anderem fest,dass Smartphones durchschnittlich 60 mal pro Tag verwendet werden, aber nur in46% der Interaktionen der Bildschirm entsperrt wird. Weiterhin stellen wir fest,dass Kontext einen statistisch signifikanten Effekt im Bezug auf Häufigkeit undLänge der Interaktionen hat.
Wir präsentieren außerdem ein neuartiges System für die reproduzierbare und ef-fiziente Distribution großer wissenschaftlicher Datensammlungen, welches wir imRahmen dieser Dissertation entwickelt haben. Das System erlaubt den selektivenZugriff auf die jeweils relevanten Teile großer Datenmengen. Dadurch ermöglichtes auch Anwendern mit begrenzten Computerkapazitäten den Zugriff auf Daten-mengen, die ansonsten zu umfangreich für die lokale Verarbeitung wären. Dies er-laubt auch weniger gut ausgestatteten Wissenschaftlern Zugriff auf entsprechendeDaten, was einen Beitrag dazu leistet, akademischen Erfolg unabhängiger von derfinanziellen Ausstattung einzelner Wissenschaftler und Institutionen zu machen.
viii
S TAT U T O RY D E C L A R AT I O N
I hereby declare that the thesis submitted is my own unaided work, that I havenot used other than the sources indicated, and that all direct and indirect sourcesare acknowledged as references. This printed thesis is identical with the electronicversion submitted.
Porta Westfalica, 1st October 2019
Daniel Hintze


A C K N O W L E D G M E N T S
First of all I want to thank my supervisor René Mayrhofer for giving me the op-portunity to pursue my educational dreams. Despite the spatial distance, I couldalways rely on René’s guidance, encouragement, and advice. He is a role model ofa scholar, truly committed to making the world a better place with exemplifyingintegrity. I also want to thank Josef Scharinger, whose support was vital for mydissertation and from whom I have learned much about cryptography.
I owe my heartfelt gratitude to Willi Nüßer and Eckhard Koch, who supervisedme during my bachelor’s and master’s degrees. They planted the seed in my headto aspire a doctorate and went to great lengths to actually make it possible againstall odds, for instance by acquiring the funding for my research. Willi and Eckhardwere great teachers and mentors to me, on whom I could always rely.
I would like to express the deepest appreciation to Alastair Beresford and AndyRice. Their effort to share their tremendous amount of mobile device usage logswith the research community sparked my first PhD project. Andy hosted me forseveral weeks at the University of Cambridge‘s Digital Technology Group, whichconstitutes one of the very highlights of my educational journey, and I am honoredthat Alastair is acting as second examiner for this dissertation.
I would like to express my particular gratitude to Rainhard Findling, who went outof his way to integrated me remotely into the research group in Linz, and my othercolleagues Sebastian Scholz, Matthias Füller, Muhammad Muaaz, Michael Hölzl,and Peter Riedl for their support and collaborative work. I also want to thank thestaff of the FHDW Paderborn and the Institute of Networks and Security at theJohannes Kepler University Linz for providing the fruitful environment in which Iconducted my studies and research.
I also owe my deepest gratitude to my colleagues at Ecclesia. Among many greatpeople I worked with, Tilman Kay, Dirk Borsetzky, and Dominik Mähl have beenextraordinarily supportive and great managers, mentors, some even friends.
I grateful acknowledge that my research has been funded by the German FederalMinistry of Education and Research under grant number 03FH030IX5.
Finally, I would like to thank my family for their encouragement and imper-turbable support. My wife Julia and our sons Leeroy and Nils for endured times oflate night work or absence. My brother Philipp, who conducted his PhD researchsimultaneously, and who was an invaluable source of encouragement. Klaus-Dieter Labahn, on whom I could always rely for the most thorough proofreading.And last but not least, my parents Marianne and Jochen have my eternal gratitudeas their education and their inexhaustible energy and love till this day is whatenabled me to accomplish my dreams.
xi


P U B L I C AT I O N S
Parts of this thesis have been published previously in the following publications:1
Journal Article
Daniel Hintze, Matthias Füller, Sebastian Scholz, Rainhard D. Findling, et al.“CORMORANT: Ubiquitous Risk-Aware Multi-Modal Biometric Authenticationacross Mobile Devices.” In: Proceedings of the ACM on Interactive, Mobile, Wearableand Ubiquitous Technologies (IMWUT) 3.85 (3 2019)
Daniel Hintze, Philipp Hintze, Rainhard D. Findling, and René Mayrhofer. “ALarge-Scale, Long-Term Analysis of Mobile Device Usage Characteristics.” In:Proceedings of the ACM on Interactive, Mobile, Wearable and Ubiquitous Technologies(IMWUT) 1.13 (2 2017)
Conference Paper
Daniel Hintze, Matthias Füller, Sebastian Scholz, Rainhard D. Findling, et al.“CORMORANT: On Implementing Risk-Aware Multi-Modal Biometric Cross-DeviceAuthentication For Android.” In: Proceedings of the 17th International Conference onAdvances in Mobile Computing and Multimedia (MoMM’19). Accepted for publication
Daniel Hintze and Andrew Rice. “Picky: Efficient and Reproducible Sharing ofLarge Datasets Using Merkle-Trees.” In: 2016 IEEE 24th International Symposium onModeling, Analysis and Simulation of Computer and Telecommunication Systems (MAS-COTS’16) (2016)
Daniel Hintze, Muhammad Muaaz, Rainhard D. Findling, Sebastian Scholz, etal. “Confidence and Risk Estimation Plugins for Multi-Modal Authentication onMobile Devices using CORMORANT.” in: Proceedings of the 13th International Con-ference on Advances in Mobile Computing and Multimedia (MoMM’15). 2015
Daniel Hintze, Rainhard D. Findling, Sebastian Scholz, and René Mayrhofer. “Mo-bile Device Usage Characteristics: The Effect of Context and Form Factor onLocked and Unlocked Usage.” In: Proceedings of the 12th International Conferenceon Advances in Mobile Computing and Multimedia (MoMM’14). 2014
Workshop Paper
Daniel Hintze, Rainhard D. Findling, Muhammad Muaaz, Sebastian Scholz, et al.“Diversity in Locked and Unlocked Mobile Device Usage.” In: Adjunct Proceedingsof the 2014 ACM International Joint Conference on Pervasive and Ubiquitous Computing(UbiComp’14 Adjunct). 2014, � Winning entry out of 22 papers submitted to theUbiComp/ISWC 2014 Programming Competition.
1 Poster papers and technical reports not included
xiii

C O N T E N T S
I research summary 11 introduction 3
1.1 Motivation . . . . . . . . . . . . . . . . . . . . . . . . . . . . . . . . . . 31.2 Outline . . . . . . . . . . . . . . . . . . . . . . . . . . . . . . . . . . . . 51.3 Research Questions . . . . . . . . . . . . . . . . . . . . . . . . . . . . . 61.4 Main Contributions . . . . . . . . . . . . . . . . . . . . . . . . . . . . . 6
1.4.1 Risk-Aware Multi-Modal Cross-Device Authentication . . . . 61.4.2 Mobile Device Usage Characteristics . . . . . . . . . . . . . . 71.4.3 Efficient and Reproducible Sharing of Large Datasets . . . . . 8
1.5 Other Contributions . . . . . . . . . . . . . . . . . . . . . . . . . . . . 91.5.1 Scientific Publications . . . . . . . . . . . . . . . . . . . . . . . 91.5.2 Technical Reports . . . . . . . . . . . . . . . . . . . . . . . . . . 91.5.3 Open Source Projects . . . . . . . . . . . . . . . . . . . . . . . . 10
2 background 112.1 Mobile Device User Authentication . . . . . . . . . . . . . . . . . . . . 11
2.1.1 Risk-Aware Authentication . . . . . . . . . . . . . . . . . . . . 122.1.2 Biometric Authentication . . . . . . . . . . . . . . . . . . . . . 122.1.3 Multi-Device Authentication . . . . . . . . . . . . . . . . . . . 13
2.2 Mobile Device Usage Datasets . . . . . . . . . . . . . . . . . . . . . . 132.2.1 AlgoSnap Crowdsignals Dataset . . . . . . . . . . . . . . . . . 142.2.2 Device Analyzer Dataset . . . . . . . . . . . . . . . . . . . . . 14
2.3 Dissemination of Scientific Datasets . . . . . . . . . . . . . . . . . . . 152.3.1 Properties of Data Distribution . . . . . . . . . . . . . . . . . . 152.3.2 Sharing Strategies . . . . . . . . . . . . . . . . . . . . . . . . . 17
3 methodological and technical fundamentals 213.1 Merkle Tree . . . . . . . . . . . . . . . . . . . . . . . . . . . . . . . . . 213.2 Repeated Measures Analysis of Variance . . . . . . . . . . . . . . . . 223.3 Signal Protocol . . . . . . . . . . . . . . . . . . . . . . . . . . . . . . . 22
4 sharing large scientific datasets 254.1 Motivation . . . . . . . . . . . . . . . . . . . . . . . . . . . . . . . . . . 254.2 Concept . . . . . . . . . . . . . . . . . . . . . . . . . . . . . . . . . . . . 26
4.2.1 Logical Data Model . . . . . . . . . . . . . . . . . . . . . . . . 274.2.2 Physical Data Model . . . . . . . . . . . . . . . . . . . . . . . . 27
4.3 Properties . . . . . . . . . . . . . . . . . . . . . . . . . . . . . . . . . . 294.4 Evaluation . . . . . . . . . . . . . . . . . . . . . . . . . . . . . . . . . . 304.5 Summary . . . . . . . . . . . . . . . . . . . . . . . . . . . . . . . . . . . 31
5 mobile device usage characteristics 335.1 Motivation . . . . . . . . . . . . . . . . . . . . . . . . . . . . . . . . . . 335.2 Methodology . . . . . . . . . . . . . . . . . . . . . . . . . . . . . . . . 34
5.2.1 Dataset . . . . . . . . . . . . . . . . . . . . . . . . . . . . . . . . 345.2.2 Usage Session Extraction . . . . . . . . . . . . . . . . . . . . . 34
xv

xvi contents
5.2.3 User Context Classification . . . . . . . . . . . . . . . . . . . . 355.3 Results and Discussion . . . . . . . . . . . . . . . . . . . . . . . . . . . 385.4 Summary . . . . . . . . . . . . . . . . . . . . . . . . . . . . . . . . . . . 39
6 risk-aware multi-modal cross-device authentication 416.1 Motivation . . . . . . . . . . . . . . . . . . . . . . . . . . . . . . . . . . 416.2 Concept . . . . . . . . . . . . . . . . . . . . . . . . . . . . . . . . . . . . 436.3 Score Level Fusion . . . . . . . . . . . . . . . . . . . . . . . . . . . . . 446.4 Implementation . . . . . . . . . . . . . . . . . . . . . . . . . . . . . . . 46
6.4.1 Android Client . . . . . . . . . . . . . . . . . . . . . . . . . . . 466.4.2 Plugin API . . . . . . . . . . . . . . . . . . . . . . . . . . . . . . 476.4.3 Backend . . . . . . . . . . . . . . . . . . . . . . . . . . . . . . . 47
6.5 Evaluation and Optimization . . . . . . . . . . . . . . . . . . . . . . . 476.6 Results . . . . . . . . . . . . . . . . . . . . . . . . . . . . . . . . . . . . 496.7 Summary . . . . . . . . . . . . . . . . . . . . . . . . . . . . . . . . . . . 50
7 conclusion and outlook 537.1 Summary . . . . . . . . . . . . . . . . . . . . . . . . . . . . . . . . . . . 537.2 Contributions . . . . . . . . . . . . . . . . . . . . . . . . . . . . . . . . 53
7.2.1 Sharing Large Scientific Datasets . . . . . . . . . . . . . . . . . 537.2.2 Mobile Device Usage Characteristics . . . . . . . . . . . . . . 547.2.3 Risk-Aware Multi-Modal Cross-Device Authentication . . . . 54
7.3 Conclusion . . . . . . . . . . . . . . . . . . . . . . . . . . . . . . . . . . 557.4 Limitations and Outlook for Future Work . . . . . . . . . . . . . . . . 56
bibliography 57
II constituent publications 718 efficient and reproducible sharing of large datasets 739 long-term analysis of mobile device usage characteristics 8510 cross-device biometric authentication - concept 10911 cross-device biometric authentication - implementation 135
III appendix 147
curriculum vitae 149

L I S T O F F I G U R E S
Figure 1.1 Dissertation overview . . . . . . . . . . . . . . . . . . . . . . . 5Figure 3.1 Example of a binary Merkle tree . . . . . . . . . . . . . . . . 21Figure 4.1 Overview – Sharing large scientific datasets . . . . . . . . . . 25Figure 4.2 Logical data model of Picky . . . . . . . . . . . . . . . . . . . 27Figure 4.3 Physical data model of Picky . . . . . . . . . . . . . . . . . . 28Figure 5.1 Overview – Mobile device usage characteristics . . . . . . . 33Figure 5.2 State machine for session detection . . . . . . . . . . . . . . . 35Figure 6.1 Overview – Risk-aware multi-modal cross-device authenti-
cation . . . . . . . . . . . . . . . . . . . . . . . . . . . . . . . . 41
L I S T O F TA B L E S
Table 6.1 Grand mean of explicit authentication procedures for smart-phones per day, percentages relative to the baseline . . . . . 50
Table 6.2 Grand mean of smartphone compromisations per day, rela-tive to the baseline . . . . . . . . . . . . . . . . . . . . . . . . 50
xvii

A C R O N Y M S
AGPL GNU Affero General Public License
ANOVA Analysis of variance
AOSP Android Open Source Project
AWS Amazon Web Services
CAIDA Center for Applied Internet Data Analysis
CAS Content Addressable Storage
CPU Central Processing Unit
DNA Deoxyribonucleic Acid
DH Diffie–Hellman
FTP File Transfer Protocol
GPS Global Positioning System
GSM Global System for Mobile communications
HTTP Hypertext Transfer Protocol
ISP Internet Service Provider
MAC Media Access Control
mTAN Mobile Transaction Authentication Number
NYPD New York City Police Department
PC Personal Computer
PIN Personal Identification Number
SMS Short Message Service
SVM Support-Vector Machine
UDP User Datagram Protocol
URL Uniform Resource Locator
UWB Ultra-wideband
X3DH Extended Triple Diffie-Hellman
xviii

Part I
R E S E A R C H S U M M A RY


1I N T R O D U C T I O N
“The most profound technologies are those that disappear. They weave themselvesinto the fabric of everyday life until they are indistinguishable from it.”
Mark D. Weiser (1952–1999)
1.1 motivation
In 1991, Mark Weiser, chief scientist at Xerox PARC, envisioned a world of ubi-quitous computing in which computers are omnipresent, but recede into the back-ground of everyday life. He pictured a future in which people use multiple com-putational devices simultaneously without necessarily being aware of them. Com-puters would constantly be aware of their environment and situation or contextand keep their users perpetually informed of what is happening around them,what is going to happen, and what had just happened. Information would appearin the center of attention when needed and effortlessly disappear into the back-ground otherwise [140]. Today, almost three decades later, much of what Weiserpredicted has become reality: Mobile devices like smartphones, tablets, fitnesstrackers, smartwatches, and other wearables have become an indispensable part ofour daily routine, facilitating convenient access to our digital lives. Already, thereare more mobile devices than people on Earth. By 2021, there will be 1.5 mobiledevices per capita globally, a total of 11.6 billion mobile-connected devices, witha compound annual growth rate of eight percent [17]. Being small and mobile,those devices have a high propensity to become lost or stolen. When lost, thefinder attempts to access personal or corporate information four out of five times[142]. To protect sensitive information and services accessible via mobile devicesagainst unauthorized access, conventional knowledge-based user authenticationmethods well known from stationary devices (e.g. PCs) like PIN, pattern, and pass-word are commonly applied. Besides well-studied shortcomings like people beingbad at choosing and remembering adequate secrets [143] or their vulnerability toshoulder surfing [80] and smudge attacks [8], these authentication techniques areinherently unsuited for mobile application since they require a significant amountof scarce user attention in proportion to the usually short usage sessions [65]. Thiseffect is further amplified by the inability of current approaches to scale with theever growing number of devices people own and use simultaneously, as users needto authenticate separately and repeatedly on every device. At least one out of threesmartphone users thus chooses to not enable authentication, most often to avoidthe corresponding effort [4, 13, 28, 50, 51].
Weiser’s vision of effortlessly ubiquitous computing will not become reality as longas devices require cognitive effort to authenticate before each interaction. The main
3

4 introduction
motivation for this dissertation is consequently to enhance the usability of userauthentication on mobile devices by drastically reducing the time and effort spenton authentication whilst providing equal or better protection against unauthorizedaccess. Therefore, we combine transparent biometrics like gait, face, and voicerecognition with dynamic risk estimation based on factors like contextual location,national crime rate, and time of day in a dynamic authentication framework. Bysharing authentication and risk information between all devices owned by thesame user, we are able to utilize the state of trusted devices within close proximityto unobtrusively authenticate the user across device boundaries. This allows us toimprove usability and convenience of authentication significantly by reducing thefrequency of password entries required on smartphones by 98% at a consistent oreven improved level of security.
To improve the usability of user authentication, one first needs a profound under-standing of how users interact with their devices and how parameters like formfactor, time of day, or location influence usage patterns. We therefore conductedthe – as of today – largest handset-based study of mobile device usage patterns.Based on detailed logs from almost 30,000 mobile devices representing close to6,000 years of usage time, we derived 52.2 million usage sessions. From theiranalysis we found that context has a significant effect on both frequency and ex-tent of mobile device usage. For instance, mobile phones are used twice as muchat home compared to in the office. Interestingly, devices are unlocked for only46% of the interactions. We found that with an average of 60 interactions per day,smartphones are used almost three times as often as tablet devices (23). However,usage sessions on tablets are also about three times longer, hence smartphones andtablets are used for almost an equal amount of time throughout the day.
In order to conduct this study, it was necessary to process an 18 TB dataset ofdevice usage logs with only commodity computational hardware at our disposal,which proved quite challenging in many regards. It soon became clear that despiteof sharing research data being crucial for validating approaches and repeatingresults in order to improve reproducibility [24, 43, 82], researchers lacking an ad-equate institutional infrastructure or the relevant technical skills frequently find ithard to share and access large datasets [119]. We therefore developed a novel ap-proach for repeatable and efficient sharing of large evolving scientific datasets. Thesystem we propose enables dataset providers to publish updates, e. g. by amend-ing new data, without having clients to re-download contents already present. Italso features versioning, allowing clients to precisely specify and access a partic-ular snapshot of the dataset and thus facilitates reproducibility of results whenworking with changing datasets. Finally, the proposed system enables users todownload and process only a subset of the original dataset by enabling both fileand intra-file selectivity, allowing them for instance to only download packagessend to a certain port from a dataset of network traces. Through an evaluationbased on real-world datasets and studies we could show that our approach is ableto save researchers between 26% and 93% of network traffic and storage capac-ity. It thus facilitates access to scientific data for less well-equipped or -fundedresearchers, making the ability to conduct excellent research less of a privilege ofeconomic wealth.

1.2 outline 5
1.2 outline
This dissertation consists of three parts. Part I summarizes the research presentedin this work: Chapter 1 gives an introduction, outlining the motivation behind thepresented research, the main research questions as well as the scientific contribu-tions. Chapter 2 establishes the relevant background of mobile device authenti-cation, mobile device usage data, and dataset sharing approaches. In chapter 3we then outline methods and technical concepts of particular importance for thisdissertation.
Our core research is then introduced in three chapters that build on each other:Chapter 4 discusses the challenges in sharing large scientific datasets in a man-ner that is efficient, reproducible, and facilitates access with limited resources. Inchapter 5 we use the technology developed in chapter 4 to process one such largedataset in order to analyze how users interact with their mobile devices, particu-larly with regards to unlocking them. In chapter 6 we utilize this information todesign, optimize, and evaluate a system for multi-modal, risk-based, cross-deviceauthentication on mobile devices. Figure 1.1 outlines the relationships between thethree core research chapters and illustrates the structure of this dissertation.
Chapter 7 summarizes the main contribution of our research and presents an out-look for future work. Part II contains full copies of selected journal articles andconference papers in which results from this dissertation have previously been pub-lished or that have been accepted but are still pending publication. The author’scurriculum vitae follows in part III.
DeviceAnalyzerDataset
Chapter 4Sharing Large Scientific Datasets
Implementation
Evaluation
Concept
Chapter 5Mobile Device Usage Characteristics
Usage SessionExtraction
Analysis
DeviceUsage
Sessions
Chapter 6Risk-Aware Multi-Modal
Cross-Device Authentication
Concept
Optimization
Evaluation
Implementation
SimulationModel
Figure 1.1: Dissertation overview

6 introduction
1.3 research questions
The work within the context of this dissertation is organized based on the followingthree main research questions:
I How can usability and security of mobile device user authentication be im-proved by utilizing risk estimation and transparent biometrics gathered acrossa group of trusted devices?
II How do context, form factor, and lock status affect mobile device usage ses-sion characteristics?
III How can researchers share and access large evolving datasets in a repeatable,verifiable, and efficient manner using only commodity hardware?
1.4 main contributions
In accordance with the three main research questions, the scientific contributions ofthis dissertation apply to three interconnected fields of research. This section givesan overview about the corresponding publications constituting this dissertationand outlines their main contributions.
1.4.1 Risk-Aware Multi-Modal Cross-Device Authentication
The core motivation for this dissertation is to explore novel ways to improve theusability of mobile device user authentication. We utilize risk estimation and trans-parent biometrics from nearby trusted devices to reduce the number of explicitauthentication processes necessary whilst still providing an equal or better level ofsecurity compared to traditional means of authentication.
To this end, we designed and implemented CORMORANT, the – to our knowledge– first security framework on Android that leverages a dynamic set of explicitand implicit authentication mechanism combined with continuous risk estima-tion, shared securely across a group of trusted devices. CORMORANT improvesthe usability of authentication by reducing explicit authentication overhead and in-creasing security at the same time. We implemented authentication plugins basedon gait, voice, face, and keystroke dynamics along with risk assessment pluginsbased on location, time of day, and intrusion detection. We devised an API for finegrained access control on application and transaction level based on the currentconfidence in the user’s identity and the estimated risk of unauthorized access in-stead of today’s all-or-nothing access model. We also proposed a novel applicationof Kalman filters to fuse authentication scores in a dynamic set of a priori un-known biometrics across different devices, taking uncertainty and device distanceinto account. We show that CORMORANT can improve usability and convenience ofauthentication significantly by achieving an equivalent or better level of securitywith only 2% the number of explicit authentication processes compared to conven-tional knowledge-based authentication. The CORMORANT framework and backend
1.4 main contributions 7
are published under open source license (see section 1.5.3). Design, implementa-tion, and results have been published or accepted for publication in the followingjournal article and conference proceedings.
Daniel Hintze, Matthias Füller, Sebastian Scholz, Rainhard D. Findling, Muham-mad Muaaz, Philipp Kapfer, Eckhard Koch, and René Mayrhofer. “CORMORANT:Ubiquitous Risk-Aware Multi-Modal Biometric Authentication across Mobile De-vices.” In: Proceedings of the ACM on Interactive, Mobile, Wearable and UbiquitousTechnologies (IMWUT) 3.85 (3 2019). doi: 10.1145/3351243
Daniel Hintze, Matthias Füller, Sebastian Scholz, Rainhard D. Findling, Muham-mad Muaaz, Philipp Kapfer, Wilhelm Nüßer, and René Mayrhofer. “CORMORANT:On Implementing Risk-Aware Multi-Modal Biometric Cross-Device Authentica-tion For Android.” In: Proceedings of the 17th International Conference on Advances inMobile Computing and Multimedia (MoMM’19). Accepted for publication, pp. 1–10
Daniel Hintze, Sebastian Scholz, Eckhard Koch, and René Mayrhofer. “Location-based Risk Assessment for Mobile Authentication.” In: Adjunct Proceedings of the2016 ACM International Joint Conference on Pervasive and Ubiquitous Computing (Ubi-Comp’16 Adjunct). 2016, pp. 85–88. doi: 10.1145/2968219.2971448
Daniel Hintze, Muhammad Muaaz, Rainhard D. Findling, Sebastian Scholz, Eck-hard Koch, and René Mayrhofer. “Confidence and Risk Estimation Plugins forMulti-Modal Authentication on Mobile Devices using CORMORANT.” in: Proceed-ings of the 13th International Conference on Advances in Mobile Computing and Multi-media (MoMM’15). 2015, pp. 384–388. doi: 10.1145/2837126.2843845
Daniel Hintze, Rainhard D. Findling, Muhammad Muaaz, Eckhard Koch, andRené Mayrhofer. “CORMORANT: Towards Continuous Risk-Aware Multi-ModalCross-Device Authentication.” In: Adjunct Proceedings of the 2015 ACM InternationalJoint Conference on Pervasive and Ubiquitous Computing (UbiComp’15 Adjunct) (2015),pp. 169–172. doi: 10.1145/2800835.2800906
Daniel Hintze. “Towards Transparent Multi-Device-Authentication.” In: AdjunctProceedings of the 2015 ACM International Joint Conference on Pervasive and Ubiqui-tous Computing (UbiComp’15 Adjunct). 2015, pp. 435–440. doi: 10.1145/2800835.
2801644
1.4.2 Mobile Device Usage Characteristics
To devise novel approaches to device authentication in order to improve usabilityand user experience, deep understanding of how mobile devices are used and un-locked is crucial. As no such results had been previously published, we conductedthe – to our best knowledge – so far largest handset-based mobile device usagestudy using detailed logs from 29,279 mobile phones and tablets representing atotal of 5,811 years of usage time. We identified and analyzed 52.2 million usagesessions with some participants providing data for more than four years. Our re-sults show that context has a highly significant effect on both frequency and extentof mobile device usage, with mobile phones being used twice as much at homecompared to in the office. Surprisingly, we found that devices are unlocked for

8 introduction
only 46% of the interactions. We found that with an average of 60 interactions perday, smartphones are used almost thrice as often as tablet devices (23), while usagesessions on tablets are three times longer, meaning tablets are used for an almostequal amount of time throughout the day. Results from this study influenced thedesign of CORMORANT in a number of ways and were fundamental for optimizingand evaluating the overall system. The code used to parse and analyze the 18 TB ofdata from the Device Analyzer project has been made available under open sourcelicense (see section 1.5.3). Details and results of our study have been publishedin the following journal article and conference proceedings, one of which wonthe UbiComp/ISWC 2014 Programming Competition out of 22 submitted papers[114]:
Daniel Hintze, Philipp Hintze, Rainhard D. Findling, and René Mayrhofer. “ALarge-Scale, Long-Term Analysis of Mobile Device Usage Characteristics.” In:Proceedings of the ACM on Interactive, Mobile, Wearable and Ubiquitous Technologies(IMWUT) 1.13 (2 2017). doi: 10.1145/3090078
Daniel Hintze, Rainhard D. Findling, Muhammad Muaaz, Sebastian Scholz, andRené Mayrhofer. “Diversity in Locked and Unlocked Mobile Device Usage.” In:Adjunct Proceedings of the 2014 ACM International Joint Conference on Pervasive andUbiquitous Computing (UbiComp’14 Adjunct). 2014, pp. 379–384. doi: 10.1145/
2638728.2641697, � Winning entry in the UbiComp/ISWC 2014 ProgrammingCompetition
Daniel Hintze, Rainhard D. Findling, Sebastian Scholz, and René Mayrhofer. “Mo-bile Device Usage Characteristics: The Effect of Context and Form Factor onLocked and Unlocked Usage.” In: Proceedings of the 12th International Conferenceon Advances in Mobile Computing and Multimedia (MoMM’14). 2014, pp. 105–114.doi: 10.1145/2684103.2684156
1.4.3 Efficient and Reproducible Sharing of Large Datasets
When we first started to analyze mobile device usage characteristics, it soon be-came clear that sharing and accessing datasets the size of several terabytes requiressignificant computational resources and is challenging from a practical point ofview [62]. To enable us to conduct our usage study using only the commodityhardware at hand, we developed PICKY, a simple yet powerful new approach forrepeatable, verifiable, and efficient sharing of large datasets, featuring incrementalupdates and selective downloads. We were able to show that our approach is bene-ficial by applying it to three large datasets from different domains and calculatingthe benefits for a selection of studies found in literature. We found that PICKY
would have saved researchers between 26% and 93% of network and storage costs.PICKY is available under open source license (see section 1.5.3) and actively used,for instance by the University of Cambridge to disseminate a dataset of several ter-abytes in size. The design, implementation details, and evaluation of PICKY havebeen published in the following paper:
Daniel Hintze and Andrew Rice. “Picky: Efficient and Reproducible Sharing ofLarge Datasets Using Merkle-Trees.” In: 2016 IEEE 24th International Symposium on

1.5 other contributions 9
Modeling, Analysis and Simulation of Computer and Telecommunication Systems (MAS-COTS’16) (2016), pp. 30–38. doi: 10.1109/MASCOTS.2016.25
1.5 other contributions
1.5.1 Scientific Publications
Besides the main contributions of this dissertation, the author contributed substan-tially to the development of ShakeUnlock, a novel authentication method in whichauthentication state is transferred from one device to another by conjointly shak-ing them. Despite its close relation the main topic, ShakeUnlock is not part of thisdissertation. Results of this work have been published in the following journalarticle and conference proceeding, one of which was awarded Best Full Paper at the12th International Conference on Advances in Mobile Computing and Multimedia(MoMM 2014):
Rainhard D. Findling, Muhammad Muaaz, Daniel Hintze, and René Mayrhofer.“ShakeUnlock: Securely Transfer Authentication States Between Mobile Devices.”In: IEEE Transactions on Mobile Computing 16.4 (2017), pp. 1163–1175. doi: 10.1109/TMC.2016.2582489
Rainhard D. Findling, Muhammad Muaaz, Daniel Hintze, and René Mayrhofer.“ShakeUnlock: Securely Unlock Mobile Devices by Shaking them Together.” In:Proceedings of the 12th International Conference on Advances in Mobile Computing andMultimedia (MoMM’12) (2014), pages 165–174, � Best Full Paper Award
1.5.2 Technical Reports
The author contributed to the following technical reports within the scope of thisdissertation:
René Mayrhofer, Edgar Weippl, Damjan Buhov, Rainhard D. Findling, DanielHintze, Michael Hölzl, Georg Merzdovnik, Muhammad Muaaz, and Michael Ro-land. User-friendly Secure Mobile Environments (Final Report for JRC u’smile). Tech-nical Report. University of Applied Sciences Upper Austria, JR-Center u’smile,2017
Rainhard D. Findling, Daniel Hintze, Muhammad Muaaz, and René Mayrhofer.Prototypical Implementation and Demonstration of Multiple Multi-Channel Device Au-thentication Protocols Using Embedded Sensors on Various Off-the-shelf Mobile Phones.Technical Report. University of Applied Sciences Upper Austria, JR-Center u’smile,2014
10 introduction
1.5.3 Open Source Projects
This dissertation resulted in the initiation of the following open source projects:
• Cormorant client for risk-aware, multi-modal, cross-device authentication.https://github.com/mobilesec/cormorant
• Cormorant backend for secure communication using Signal Messaging.https://github.com/mobilesec/cormorant-signal-server
• Code to process and analyze mobile device usage data.https://github.com/hintzed/mobile-device-usage-processing
• Picky for efficient, reproducible and selective sharing of large datasets.https://github.com/ucam-cl-dtg/picky
2B A C K G R O U N D
In this chapter, we outline the background for the work presented in this disser-tation. In section 2.1 we discuss user authentication on mobile devices and sum-marize important approaches to improve its usability found in literature, whichconstitutes the background for chapter 6. In section 2.2 we summarize the under-lying data and gathering process for two mobile device usage datasets that are thebase of our analysis of mobile device usage presented in chapter 5. In section 2.3we then give an overview of different properties that are desirable when dissemi-nating a scientific dataset of significant size and discuss the different sharing strate-gies available today, which provides the relevant background for our approach ondata sharing introduced in chapter 4.
2.1 mobile device user authentication
Since mobile devices provide convenient access to sensitive data and services, userauthentication is crucial to prevent unauthorized access. There are three differentapproaches to user authentication:
knowledge : Something the user knows (e. g. PIN, password, pattern)
possession : Something the user has (e. g. security token, smart card, cell phone)
biometric : Something the user is or does (e. g. fingerprint or gait recognition)
The most common form of authentication in use today is proof of knowledge.Knowledge-based authentication systems are easy to implement and do not re-quire additional hardware. Most personal mobile devices offer multiple knowledge-based authentication mechanisms like password, PIN, or pattern. Possession-basedauthentication is not commonly used to secure smart mobile devices at present.However, the device itself is frequently used to prove possession in an authentica-tion process, e. g. by entering a mTAN received via SMS to authorize a bank trans-action. Most smartphones and similar devices also offer biometric authenticationmechanisms. To do so, some devices feature additional sensors, e. g. to recognizefingerprints. Devices that feature a front camera are able to utilize face detection,although mostly with insufficient accuracy if no additional sensing hardware (suchas depth cameras) is available.
When a device falls into wrong hands, authentication is the only way to preventunauthorized access. However, multiple surveys have shown that one out of threemobile device users does not use authentication mechanisms to secure their de-vices against unauthorized access at all with inconvenience being the primary rea-
11

12 background
son [4, 13, 28, 50, 51]. To increase adoption of authentication on mobile devices byimproving usability, different approaches have been explored.
2.1.1 Risk-Aware Authentication
Security measures are generally applied to mitigate a risk, which can be seen asthe probability of an adverse event occurring multiplied by the resulting cost. Bothfactors, however, vary based on context. For instance, mobile phone theft is morelikely in public places than at home while the exposure of private pictures might bemore costly than compromising one’s music playlist. Risk-awareness can thereforefacilitate adequately tailored security mechanisms. It is for example common forsecurity conscious applications like Facebook to require extended authenticationmeasure if the user suddenly attempts to access the application from a differentcountry or device. With regards to mobile device authentication, risk-awarenesscan for instance be employed to dynamically select the required strength of au-thentication based on contextual information like time and location [53].
2.1.2 Biometric Authentication
Authentication based on biological or behavioral characteristics has been exten-sively studied as a less obtrusive form of user authentication on mobile devices.Common examples of biometric authentication that can be found on consumer de-vices are fingerprint and face recognition. Behavioral characteristics are still ratheruncommon on off-the-shelf devices, but are of particular interest with regards tounobtrusive authentication as they can often be captured transparently in the back-ground without any explicit user interaction. Examples are gait recognition [98]and keystroke dynamics [76]. However, biometric authentication in general andunobtrusive methods in particular can also pose a security risk as an adversarymight be able to obtain the biometric feature undetected, e. g. by taking a pictureof a person’s face, or obtaining a fingerprint left on a surface or even from a highresolution picture [78]. For this reason, biometrics alone are usually not used as aprimary means of authentication.
Biometric information from multiple sources can be combined in form of multi-modal biometric systems to overcome some drawbacks of unimodal biometrics orto defend against spoofing attacks [116]. It was demonstrated that e. g. by combin-ing keystroke dynamics and speaker verification, the need for explicit authentica-tion can be significantly reduced in the context of mobile devices [22].
In a multi-modal system, biometric information must be fused in order to come toa decision like whether to unlock the device. Information fusion can be appliedon different levels of the biometric processing chain, either before or after classifi-cation or matching algorithms are applied [117]. Pre-classification fusion operateson either sensor or feature level. Post-classification fusion commonly operates oneither rank, matching score, or decision level. An overview of different fusionmethods can be found in [73].

2.2 mobile device usage datasets 13
In the research presented in this dissertation, we develop and employ three novelscore level fusion algorithms. Existing approaches can be divided into simple an-alytic, machine learning, and probabilistic approaches. Analytic fusion methods,e. g. sum rule [55, 77] or dynamic weighted average fusion [32] use static or chang-ing weights for each source of information to sum up to a single score value. Theyare easy to understand and scale well, but are hard to adjust at runtime. Machinelearning approaches like support-vector machines (SVMs) [9, 35, 137] or neuralnetworks [139] perform well for fusing scores from different sources, but need tobe individually trained for each configuration. Probabilistic or estimation-basedmethods like likelihood ratio statistics [23, 103], Bayesian belief networks [88], orGaussian mixture models [110] use different probabilistic approaches to model un-certainty (quality) in the fusion process. Depending on the chosen method, theysupport a dynamic number of sources and can include different kinds of uncer-tainties in their calculations. A discussion of different score level fusion methodscan be found in [44].
2.1.3 Multi-Device Authentication
With the number of mobile devices operated simultaneously ever increasing, theeffort for conventional, device centered authentication increases as the user has toauthenticate to each device individually – ideally using a different secrets on eachof them. A natural development is the emergence of multi-device authenticationsystems that center around a user rather than a single device. This development issimilar to how Single Sign-on protocols on individual machines prevent the need toauthenticate to each individual application. Today, first steps towards multi-deviceauthentication can be found in consumer devices, for instance by allowing desktopor notebook devices to be automatically unlocked once a trusted device like asmartphone or watch is in close proximity [45]. More sophisticated approachesare explored in research. For instance, we demonstrated how authentication statecan be transferred between mobile devices by conjointly shaking them together,using acceleration data to verify that both devices are co-located [39].
2.2 mobile device usage datasets
Mobile device usage data from genuine users is of vital importance for analyzingand understanding behavioral patterns in situ. A number of mobile device usagedatasets are publicly available today. Examples are the Crowdsignals dataset with31 subjects [141], the MIT Reality Mining dataset [27] with 100 subjects, and theDevice Analyzer dataset with 31,000 subjects [136]. In this section, we outlinetwo of these datasets that we used extensively in the research presented in thisdissertation.
14 background
2.2.1 AlgoSnap Crowdsignals Dataset
The AlgoSnap Crowdsignals pilot dataset1 is the result of a crowdfunded, handset-based data collection conducted between August and November 2016 with 31 par-ticipants, 20 males and 11 females, of varying age, education and ethnicity. Of the31 participants, 23 reported to be employed while eight stated to be not employed,not able to work, or retired. The dataset captures a variety of different features,including Wi-Fi scan results and cell connections. Despite the rather small numberof subjects, the dataset stands out because, unlike most handset-based data collec-tions, it contains manually labeled ground truth for contextual information likeactivities and locations. With regards to authentication, participants were askeddifferent labeling questions at random when unlocking their phone, one of whichwas asking for their current location. Allowed answers included, among others,Home, Work, Bank, Hotel, Church, and Restaurant, with the most recent selectionbeing preselected. Participants could always choose to dismiss the question or dis-able them permanently but where paid $0.05 per response [141]. The presence ofground truth labels allows it to be used to evaluate for instance the performanceof context detection algorithms that are then applied to larger datasets withoutground truth labels. To that end we use the Crowdsignals dataset for our researchpresented in chapter 5.
2.2.2 Device Analyzer Dataset
Most research presented in this dissertation extensively uses the Device Analyzerdataset, the largest and most detailed dataset on Android device usage publiclyavailable today. It consists of more than 225 billion records of Android mobiledevice usage logs, collected from more than 31,000 devices2 around the world bythe Device Analyzer project [135, 136] by the University of Cambridge ComputerLaboratory between 2011 and 2019.3 It captures 263 different features,4 rangingfrom raw sensor data to application usage, recorded either periodically or eventbased by a stand-alone application available via Google Play Store. The datasetconsists of more than 18 TB of data which are disseminated using PICKY, a novelopen source5 system for sharing large scientific datasets which was developed aspart of this dissertation and is discussed in chapter 4.
Many devices within the dataset contribute data for an extended period of time,with more than 7,000 devices participating for more than one month, more than500 devices providing data for more than one year and some even more than 4.5years usage data. The dataset includes at least 1,277 different device types from 468manufacturers and users from 175 different countries.6 Since the Device Analyzer
1 https://crowdsignals.io
2 Data collection for the dataset was ongoing whilst we conducted our research. We used earlierversions of the dataset as they became available with fewer devices.
3 The University of Cambridge Computer Laboratory and Data Funder do not bear any responsibilityfor our analysis or interpretation of the Device Analyzer dataset or data thereof.
4 https://deviceanalyzer.cl.cam.ac.uk/keyValuePairs.htm
5 https://github.com/ucam-cl-dtg/picky
6 Numbers as of 16 May 2016.

2.3 dissemination of scientific datasets 15
project emphasizes user privacy, no biographical or demographical features areavailable in the dataset.
2.3 dissemination of scientific datasets
There is growing demand for researchers to make scientific datasets available toallow others to reproduce results as well as to facilitate a broad use of – typicallypublicly funded – data. When considering how to make a dataset available, anumber of properties can be desirable, depending on the nature of the dataset. Forinstance, publishing data from a still ongoing, long term experiment might resultin different versions of a dataset over time, whereas other datasets might only bepublished in a single version. In section 2.3.1 we discuss some of these propertiesthat are of particular relevance for our work. Depending on the size of the datasets,different strategies for disseminating datasets are available, which are discussed insection 2.3.2.
2.3.1 Properties of Data Distribution
Upgradability While some datasets are compiled and published in form of astatic snapshot, others are the result of ongoing research or data collection andneed to be updated as new data becomes available. A genetic database like the1000 Genomes Project, for instance, might grow as the number of sequenced indi-viduals’ DNA increases [18]. As new versions of the database are being published,users working with an earlier release should be able to efficiently obtain the latestversion.
Verifiability A number of common sources for errors with the potential to cor-rupt the dataset exist when sharing a dataset of significant size. Examples arenetwork transmission errors, software bugs, or disc failures. Depending on theformat of the dataset and the nature of the error, consequences range from ren-dering the dataset unusable to altering the underlying data unnoticeable and thusfalsifying results of subsequent research. As the likelihood of errors increases withthe size of the dataset, a mechanism to verify the integrity of a dataset is necessaryin order to ensure the correctness of received data.
Patching While upgradability refers to appending new data to an existing dataset,situations that require modification of already published data exists. If, for in-stance, an error is detected in an already published dataset, the owner might wantto apply corrections in form of a patch. Another example is the enrichment ofexisting data with new information as they become available.
Versioning Reproducibility of results is considered a scientific standard. How-ever, there is an ongoing debate about how to improve reproducibility in manyfields including bioinformatics, psychology, and computer science [21, 24, 43, 82].
16 background
Reproducibility in these fields frequently requires the exact code and data usedin an experiment to be available to other researchers. If the underlying dataset issubject to changes introduced by patches and upgrades, some form of versioningis necessary to obtain an exact copy of the data used in the original research evenyears later in order to facilitate reproducibility.
Selectivity Available datasets often contain a wider range of data than what isrelevant to a scientist’s particular research question. For example, public tracesof Internet traffic such as the CAIDA Anonymized Internet Traces dataset [130]have been widely used in networking research. The actual research conductedusing network traces might, however, only involve certain protocols, for instanceDNS traffic send to port 53 [58]. Another example is the Device Analyzer project(see section 2.2.2). On occasion of the UbiComp/ISWC 2014 Programming Com-petition 41 researchers from around the world were given access to the collecteddata. While it was possible to submit a MapReduce script to the hosting insti-tution to process the data on premise, most researchers chose to download thedataset, which at the time consisted of approximately 10 TB of logfiles with a com-pressed size of 1.1 TB. Access was given through a custom download tool, allowingto select which devices’ logfiles to download based on number of recorded days,time period, present features, or random sample [114]. Half of the participantsused this option to reduced the amount of data downloaded to an overall total of17.5 TB while changing their selection of devices on average 3.3 times after startingto download data. Since it was effectively not possible to only download certainfeatures of the dataset (e. g. only network-related data), researchers still had todownload, store, decompress, and process complete log files, although some re-ported only using 5% of the dataset [61]. As a consequence, researchers lacking aninstitutional infrastructure providing sufficiently storage and network bandwidthstruggled to conduct research on the dataset [114], further emphasizing the de-mand for selectivity in distributing scientific datasets of significant size.
Confidentiality Open access and sharing of scientific data is essential to enablereproducibility of results [24] and facilitate further research. It therefore is to beencouraged and should be considered as a standard part of the publishing processrather than an optional addition whenever possible. Nevertheless, confidentialityand access control might be necessary when dealing with certain datasets, e. g. forethical or legal reasons. This is frequently the case when handling data containingsensitive personal or private information, even in anonymized form. Examples aremedical data [14], network traces [3, 91], and mobile device usage logs [136]. Priorto granting access to such datasets, the owner of the dataset might, for instance,require interested researchers to sign a legal license agreement binding them torefrain from trying to deanonymize the data, signed by an authorized signatory oftheir home institution, as reported in [114].
2.3 dissemination of scientific datasets 17
2.3.2 Sharing Strategies
Established approaches to sharing scientific datasets can be grouped into four cat-egories based on how the data are made available to other researchers, which arediscussed in the following.
Offline Sharing Being basically the only option for distributing larger quantitiesof data prior to the advent of broadband Internet connectivity, sharing datasetsoffline by physical transferring them on storage media such as flash memory cards,USB flash drives, DVDs, Blu-rays, or external hard drives is still in common usagetoday, informally referred to as sneakernet. Depending on the size of the datasetin relation to the achievable end-to-end network bandwidth and associated trafficcosts, posting storage media via traditional mail rather than using the Internet fordistribution might be faster and/or cheaper, despite the obviously high latency, oras Tanenbaum classically put it:
Never underestimate the bandwidth of a station wagon full of tapeshurtling down the highway. [129]
However, offline distribution requires both effort and time, e. g. exchanging postaladdresses, purchasing storage media, copying data, packaging, posting, and re-turning media if required and thus does not scale very well. Depending on originand destination, clearing the storage media through customs or border controlcould potentially pose additional difficulties.
An example for offline sharing as well as the associated costs is the ClueWeb09dataset, consisting of about 1 billion web pages in ten languages, which is madeavailable to researchers by mailing two 3-terabyte hard disks for a fee of $380.7
Others share their datasets free of charge, but require researchers to provide aphysical drive along with pre-paid return shipment [91].
Centralized Download Widespread access to broadband Internet greatly facili-tates collaboration among researchers and sharing datasets directly through HTTPor FTP downloads is likely the most widely used form of distribution today. Es-sentially two forms of direct download sharing exist in terms of hosting: Datasetsare either hosted on the dataset owner’s servers, e. g. an institutional or privatewebsite, or made available via a data repository. A vast number of public datarepositories exist, maintained by universities, publishers, research communities,or institutions. Their particular scope ranges from hosting datasets that are theresult of work published in a certain journal to datasets related to a certain field togeneral repositories open to all kind of scientific data. Well established examplesare the Dataverse Project8, Dryad9 and figshare10. Public repositories enhance vis-ibility of the uploaded datasets by indexing metadata associated with the datasetand thus facilitate the goal of making scientific data available to others, especially
7 https://lemurproject.org/clueweb09/
8 https://dataverse.org
9 https://datadryad.org/
10 https://figshare.com
18 background
if repositories are well established and commonly used in the respective academiccommunity or discipline. Some journals even require related data to be submittedto a certain repository before accepting submitted work [109]. Repositories alsospare researchers and institutions the cost and effort associated with providingand maintaining the infrastructure required to store and provide the data.
Centralized downloads are in general a fast and convenient way to provide andaccess datasets, allowing researchers to apply the same tools commonly usedto access many modern publications, i. e. utilizing search engines and databasesthrough a web browser. With today’s download rates common for institutionalInternet access, this approach appears feasible for datasets up to the size of afew gigabytes, e. g. the haveibeenpwned dataset of breached passwords (10 GB) [71].For larger datasets, browsers and manual downloads are increasingly unsuitablefor reliably retrieving data, as network errors, connection interruptions, softwarecrashes and the like on either side of the transmission might cancel the downloador result in corrupt local copies. A common practice to mitigate the impact ofthese issues is to split a large dataset into smaller parts that can be downloadedindependently from each other. An example is the CAIDA Anonymized InternetTraces dataset [130], containing eight hours of Internet traffic traces from high-speed monitors, split into 631 files capturing a one-minute period each, totaling531 GB of compressed data. The downside of this fragmentation approach is thatdownloading a large number of files manually soon becomes cumbersome anderror prone. While scholars with a technical background like computer scientistsusually have the required tools, skills, and infrastructure to automate this processat their disposal, e. g. by writing a small script, it nevertheless introduces addi-tional and redundant effort to access a dataset. Researchers from less technicaldomains, however, might lack the necessary toolbox and thus find it difficult toobtain a large dataset by the way of direct download [57].
Peer-to-Peer Distribution An alternative to sharing datasets via direct down-loads is to apply a peer-to-peer approach wherein users of the dataset form aswarm of equally privileged peers while downloading the dataset. Data are ini-tially seeded from the dataset provider and subsequently transferred in small chunksdirectly between peers, thus considerably reducing the consumption bandwidth onthe side of the dataset provider.
A popular protocol for peer-to-peer data distribution is BitTorrent, which has beenproposed as a suitable method of sharing scientific datasets by several authors [19,79]. As data are received from untrusted sources, the correctness of the down-loaded data has to be verified using cryptographic hash functions in order toprevent unintended or malicious manipulation. BitTorrent-based data distribu-tion therefore satisfies the property of verifiability. The benefit of using a peer-to-peer approach for the sake of saving resources on the side of the dataset provider,mainly bandwidth, highly depends on the size of the swarm, e. g. the numberof peers making parts of the dataset available to others. Since scientific datasetsare usually only of interest to a rather small and focussed group of peers, theusefulness of applying peer-to-peer based techniques as means of sharing scien-tific data could be questioned. One could argue, however, that using a BitTorrent
2.3 dissemination of scientific datasets 19
client tackles the usability problems of direct downloads discussed earlier while inworst case (only a single user downloading a dataset at some point in time) stillperforming equal to a centralized download approach. For popular datasets, onthe other hand, one could expect a notable gain in distribution speed along witha significantly reduced load on the infrastructure of the hosting institution. Forinstance, the Device Analyzer dataset (see section 2.2.2) was simultaneously down-loaded by 41 different research groups in preparation for the UbiComp/ISWC 2014Programming Competition [114] and thus would have profited from a peer-to-peerapproach. Troy Hunt, the maintainer of the popular haveibeenpwned dataset, evenurges clients to access the dataset via a torrent if at all possible to share the asso-ciated bandwidth costs and only to resort to direct download if torrent access isinfeasible, e. g. because it is being blocked by a corporate firewall [71].
The downside of peer-to-peer data sharing is the loss of control in comparison todirect download. Limiting access, maintaining confidentiality, or enforcing a cer-tain license agreement, as it might be required for legal or ethical reasons, becomesfar more challenging in a BitTorrent scenario compared to sharing data through di-rect downloads from a single controlled source. Another potential drawback isthat peer-to-peer protocols, being popular for sharing pirated copies of softwareand multimedia files, are potentially subject to restrictive firewall rules as well asthroughput throttling by Internet service providers (ISPs) [100].
Cloud Processing Sharing data predominantly means transferring it either on-line or offline from the provider of the dataset or a hosting repository to otherresearchers for computational processing. However, reversing this process is alsopossible, i. e. transferring the processing code to the data instead of the other wayaround. Since this usually involves big data and cloud techniques like Hadoopand MapReduce, we refer to this approach as cloud processing. A cloud in thisscenario can be either run internally by an organization, by a consortium of insti-tutions in form of a community cloud, or by commercial cloud service providerslike Amazon and Google [47, 57].
One of the appealing aspect of cloud processing is that the size of individual pro-cessing code usually is negligible compared to the size of the dataset, thus elimi-nating all issues related to transferring and storing very large datasets. In addition,a cloud processing infrastructure usually provides an environment for processingmassive datasets in parallel, allowing to take advantage of vast on demand compu-tational power offered by cloud service providers and domain-specific tool-chains.An example is the 1000 Genomes Project dataset containing 200 TB of genomicdata, including DNA sequences for over 1,700 individuals, which is hosted andmade publicly available as well as processable using MapReduce tasks on Ama-zon Web Services (AWS) [18].
Another interesting characteristic of cloud processing is that it potentially allowsresearchers to conduct research on data they for legal or ethical reasons cannotbe granted direct unrestricted access to. Again, the Device Analyzer dataset pro-vides an example as sensitive data like MAC addresses and cell IDs are hashedin the dataset shared with other researchers to protect the privacy of participants.

20 background
However, researchers requiring access to the original data in order to answer theirparticular research questions are encouraged to submit MapReduce scripts for on-site computation of aggregated results, thereby allowing research on sensitive datawithout compromising individuals’ privacy. An example can be found in [85].The haveibeenpwned dataset provider goes even one step further and provides aconvenient web-based user interface access to the dataset as well as additional ser-vices like automated notifications when new entries matching pre-defined searchcriteria are added to the dataset [71].
The main disadvantages of cloud processing are cost and complexity. Hosting adataset of significant size on a commercial cloud platform is usually subject tomonthly charges by the service provider. Storing 1 TB of data on Amazon Web Ser-vices (AWS), for instance, costs $282 per year at the time of writing. Processing thedataset on the same infrastructure usually requires researchers to pay for the usedcomputational resources. In terms of complexity, users of the dataset are requiredto be familiar with the underlying technologies, e. g. Hadoop and MapReduce. Inaddition, debugging code that runs on a remote system without access to the un-derlying data it is operating on is usually more demanding than processing a flatfile on a local machine with a toolchain of choice.

3M E T H O D O L O G I C A L A N D T E C H N I C A L F U N D A M E N TA L S
In this chapter we briefly introduce statistical methods and technical concepts thatare of particular importance for understanding the research presented in this dis-sertation. Section 3.1 outlines the concept of a Merkle tree, which is central to ourwork on data sharing presented in chapter 4. Section 3.2 gives an overview over re-peated measures analysis of variance (ANOVA), which we use to test the statisticalsignificance of different factors on mobile device usage discussed in chapter 5. Insection 3.3 we describe the Signal messaging protocol which we rely on for crossdevice authentication as presented in chapter 6.
3.1 merkle tree
A hash tree or, named after its inventor [92], a Merkle tree, is a tree data struc-ture where each non-leaf node contains a hash of its child nodes and leaves aredata blocks. Merkle trees facilitate efficient and secure verification of large datastructures that are stored on or transferred between computers. Their applicationranges from file systems [11] over software deployment [66] to crypto currencies[102]. Figure 3.1 illustrates the concept of a Merkle tree with an example of fourdata blocks labeled D1 though D4 forming the leaves of the tree. Each block ishashed using a hash function in the corresponding parent node. Pairs of hashnodes are then recursively hashed until the root node is reached. Through therecursive hashing, a single bit change in one of the data blocks will result in a dif-ferent root hash. While the tree in this example implements a binary tree, Merkletrees can generally be created as n-nary trees, with n children per node.
Root Hashhash(Hash 0, Hash 1)
Hash 1hash(Hash 1-0, Hash 1-1)
Hash 1-1hash(D4)
D4Data Block
Hash 1-0hash(D3)
D3Data Block
Hash 0hash(Hash 0-0, Hash 0-1)
Hash 0-1hash(D2)
D2Data Block
Hash 0-0hash(D1)
D1Data Block
Figure 3.1: Example of a binary Merkle tree
21
22 methodological and technical fundamentals
3.2 repeated measures analysis of variance
Analysis of variance is a common statistical approach to analyze the differencesin means between three or more groups of data [42]. It allows to statistically testthe causal relationships between categorical independent variables (factors) anda numerical dependent variable. When the same subjects are measured repeat-edly under different conditions of the same categorical independent variables, arepeated measures ANOVA can be used when certain assumptions are met:
• Normality: For each level of the factors, the dependent variable must have anormal distribution.
• Randomness: Within each sample, the observations are sampled randomlyand independently of each other.
• Sphericity: When there are more than two levels of a factor, difference scorescomputed between two levels of a factor must have the same variance for thecomparison of any two levels. If the sphericity assumption is violated, thevariance calculations may be distorted. To evaluate whether sphericity hasbeen violated, Mauchly’s sphericity test [87] can be used. A lack of sphericitycan be adjusted by applying a Greenhouse–Geisser correction [46].
When the main F-test ANOVA shows statistically significant differences betweenthe means of the groups exist, post hoc range tests and pairwise multiple com-parisons can be used to determine precisely which means differ. In our work, weused Tukey’s range test [133], which compares the means of every group to themeans of every other group and identifies any difference between two means thatis greater than the expected standard error.
3.3 signal protocol
The Signal Protocol [127] (formally TextSecure Protocol) is a non-federated end-to-end encryption security protocol for instant messaging conversation as well asvoice and video calls. It has been recently adopted by popular instant messagingservices such as WhatsApp [95], Facebook Messenger [93], Skype [96], and GoogleAllo [94]. Signal offers a number of desirable security properties, including for-ward and future secrecy. The protocol has recently been formally analyzed withno major flaws found in its design [20].
Signal uses the Extended Triple Diffie-Hellman (X3DH) key agreement protocolto establish a shared secret key between two parties who mutually authenticateeach other based on public keys. X3DH stands out from other key agreementprotocols in that it was designed for asynchronous communication in which oneof the partners might not be online to agree on a shared key, which is particularlyimportant for mobile communication. To that end, Signal relies on a server thatbuffers encrypted messages and stores pre-send batches of ephemeral public keys.
The protocol relies on a number of cryptographic Diffie–Hellman (DH) key pairs:a long-term identity key, a medium-term signed key, and multiple short-term one-

3.3 signal protocol 23
time prekeys. The corresponding public keys are uploaded to the server for distri-bution. To communicate, the parties establish a long-lived session using the iden-tity key, the medium-term key, as well as a one-time key from the server, optionallyverifying the identity key out-of-band. Using X3DH, two symmetric keys, a rootkey and a sending chain key, are established. As messages are send and received,these keys are frequently updated using a combination of ratcheting mechanisms.[20]
Among authenticity and privacy, Signal offers additional properties such as for-ward secrecy and post-compromise security. Forward secrecy implies that if aparty is compromised, messages sent and received prior remain hidden to an at-tacker. Post-compromise security indicates that the communication can recoverfrom a state compromise if the attacker remains passive, i. e. does not alter orinject messages. [5]

4S H A R I N G L A R G E S C I E N T I F I C D ATA S E T S
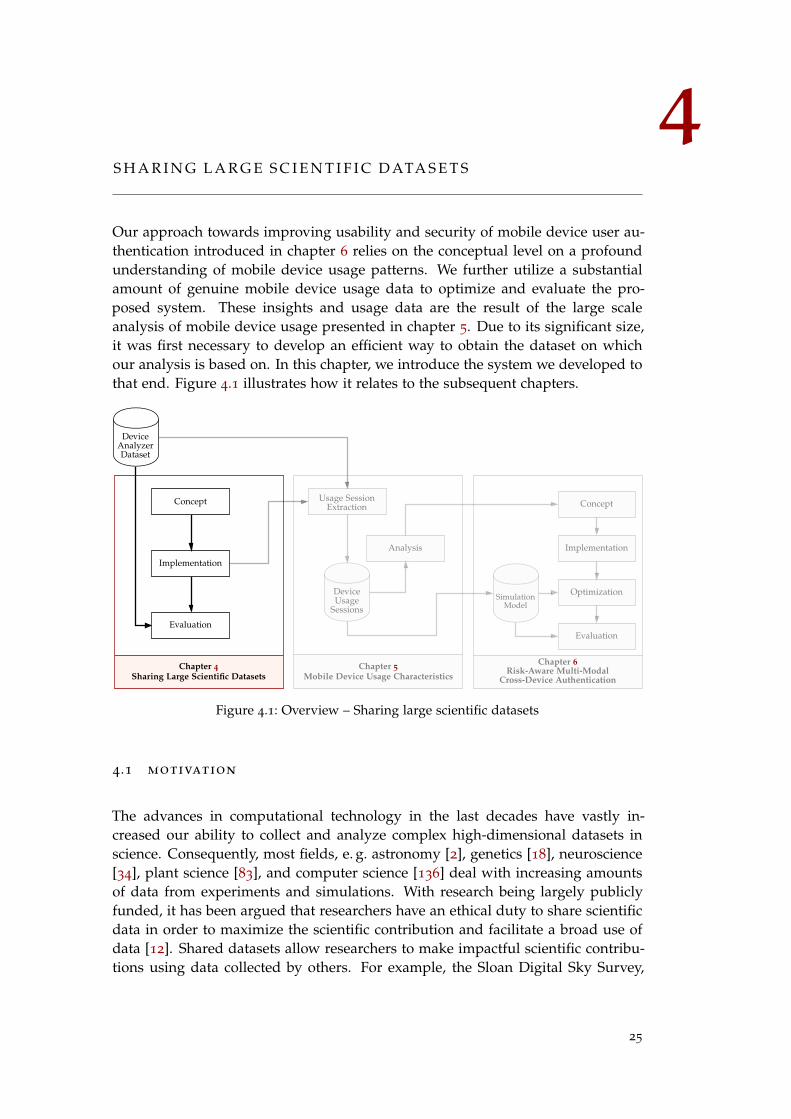
Our approach towards improving usability and security of mobile device user au-thentication introduced in chapter 6 relies on the conceptual level on a profoundunderstanding of mobile device usage patterns. We further utilize a substantialamount of genuine mobile device usage data to optimize and evaluate the pro-posed system. These insights and usage data are the result of the large scaleanalysis of mobile device usage presented in chapter 5. Due to its significant size,it was first necessary to develop an efficient way to obtain the dataset on whichour analysis is based on. In this chapter, we introduce the system we developed tothat end. Figure 4.1 illustrates how it relates to the subsequent chapters.
DeviceAnalyzerDataset
Chapter 4Sharing Large Scientific Datasets
Implementation
Evaluation
Concept
Chapter 5Mobile Device Usage Characteristics
Usage SessionExtraction
Analysis
DeviceUsage
Sessions
Chapter 6Risk-Aware Multi-Modal
Cross-Device Authentication
Concept
Optimization
Evaluation
Implementation
SimulationModel
Figure 4.1: Overview – Sharing large scientific datasets
4.1 motivation
The advances in computational technology in the last decades have vastly in-creased our ability to collect and analyze complex high-dimensional datasets inscience. Consequently, most fields, e. g. astronomy [2], genetics [18], neuroscience[34], plant science [83], and computer science [136] deal with increasing amountsof data from experiments and simulations. With research being largely publiclyfunded, it has been argued that researchers have an ethical duty to share scientificdata in order to maximize the scientific contribution and facilitate a broad use ofdata [12]. Shared datasets allow researchers to make impactful scientific contribu-tions using data collected by others. For example, the Sloan Digital Sky Survey,
25
26 sharing large scientific datasets
a dataset containing more than three million astronomical objects [2], was rankedthe most cited observatory [84], enabling astronomers to make discoveries withouttelescopes [107]. This dissertation serves as another example, with most of thecomprising publications making extensive use of publicly available datasets likethe Device Analyzer dataset (see section 2.2.2).
Making scientific datasets publicly available not only reduces the costs of science[111] and facilitates further research, it is also crucial for validating approaches andrepeating results in order to facilitate reproducibility [24, 43, 49, 82] – the ultimatestandard by which scientific claims are judged [107]. Consequently, funding bodieslike the US National Institutes of Health [56] and scientific publication outletslike Science [49] increasingly require the sharing of data to be an integral part ofresearch projects and publications.
Sharing and accessing datasets the size of several terabytes up to petabytes, how-ever, requires significant computational resources and is thus challenging from apractical point of view, even if researchers are only interested in a small fractionof the data. Researchers lacking adequate institutional infrastructure or relevanttechnical skills frequently find it hard to access such datasets [29, 114, 119]. Ef-ficient sharing techniques therefore facilitate access to scientific data for less-wellequipped or funded researchers. The author has experienced first-hand how a lackof access to adequate computational resources can impede research when trying toprocess a dataset of several terabytes [61] having only a commodity notebook avail-able – which motivated the work on efficiently sharing large datasets presented inthis section. Ultimately, efficient sharing techniques contribute to making the abil-ity to conduct excellent research less of a privilege of economic wealth.
4.2 concept
The discussion of available dataset sharing strategies in section 2.3.2 shows thatthere is no practical generic strategy for sharing large evolving datasets that en-ables upgradability as well as verifiability and that supports patching, other thancloud processing. However, even cloud processing alone does not offer strongversioning, thus impedes repeatability, in addition to the other aforementioneddrawbacks. This leads to our research question III: How can researchers shareand access large evolving datasets in a repeatable, verifiable, and efficient mannerusing only commodity hardware? In order to answer this question, we devel-oped PICKY, a novel open source1 system for sharing large scientific datasets up toseveral terabyte that features upgradability, verifiability, patches, versioning andintra-file selectivity. In this section, we discuss the logical and physical data modeland how they enable those properties. We then outline the potential bandwidthand storage savings PICKY is able to achieve in practice.
1 https://github.com/ucam-cl-dtg/picky

4.2 concept 27
4.2.1 Logical Data Model
Selectivity is one of the core features we designed PICKY for, as it enables re-searchers only interested in particular aspects of a larger dataset to downloadonly certain subsets. This saves resources and enables access to datasets otherwisetoo large to process using commodity hardware. To enable selectivity, contex-tual knowledge about the content and structure of the dataset is required. Realworld scientific datasets mostly come in form of some file structure. Since filesand directories are a very fundamental concept in computer system, they providea universal interface across virtually all operating systems and programming lan-guages. While files contain the actual content of a dataset, directory structuresand file names are commonly used to encode metadata describing the content, al-lowing for selectivity on file level. Files usually either constitute atomic binarydata, for instance images, or can be considered collections of self-contained entries.Examples are network trace files containing sequences of independent networkpackets [130] and event logs consisting of events capturing e. g. mobile device us-age [136]. Selectivity at the entry level is desirable if only a subset of entries isrelevant for a particular research question, for instance only network traffic to asingle UDP port [58] or certain usage events [62].
In order to enable selecting subsets of a dataset not only on file level but also onentry level in a generic way, a model for associating metadata with files and entriesis necessary. PICKY expects these metadata to come in form of key-value attributes,defined and provided by the dataset publisher based on which dataset consumersare then able to select which subset, i. e. which files containing which entries, theywish to download. Figure 4.2 illustrates this logical data model.
Figure 4.2: Logical data model of Picky
4.2.2 Physical Data Model
To prepare a dataset for publication, a repository and an index file are created basedon the original dataset. Each file is associated with a number of dataset-specificattributes in key-value form that allow users of the dataset to assess the content ofthe file. In addition, the file’s relative path, filename, and timestamp are recordedin order to restore these attributes on client side. Each file is then split into oneor multiple atomic entries, depending on the file’s content. Entries can be of equal

28 sharing large scientific datasets
size, separated by a line break, or defined by a binary format (e. g. network pack-ets). Since the definition of entries depends on the individual dataset, the file con-tent is streamed through a function implemented by the dataset owner to provideassociated attributes each time an entry passes through the data stream. Entriesare grouped by their set of attributes into collection of entries called chunks. Inaddition to the entry data itself, each entry also contains the length of the datastored and a sequence ID identifying the relative positioning of the entry withinthe source file. The content of a chunk is compressed and written to disk wheneither the entire file is fully processed or the size of the compressed entries exceedsa certain threshold, in which case an additional chunk for subsequent entries withthe same attribute set is created. The reason for splitting entries into multiplechunks is that a chunk constitutes an atomic blob that can be addressed and re-trieved. Changes in data cause the corresponding chunk to change, which meansthat those new chunks need to be downloaded by clients to update their copy ofthe dataset. More chunks thus means less data has to be downloaded in the eventof patches, but there is some additional overhead per chunk. The chunk thresh-old thus should best be chosen with some assumptions about future changes tothe dataset in mind. Chunks are persisted using concepts introduced by the opensource software deployment system Kipeto,2 which in turn was inspired by the gitversion control system [66]. The file format used to persist chunks starts with aprotocol version to allow future changes, followed by a string designating the ap-plied compression algorithm and the length of the uncompressed content. Finally,the compressed entries are written to the file, as depicted in Figure 4.3.
Figure 4.3: Physical data model of Picky
2 The author is one of the maintainers of the project (https://github.com/ecclesia/kipeto).
4.3 properties 29
Chunks are stored in a repository, which is a form of content addressable storage(CAS). A repository is basically a file structure, in which blobs, such as chunks,are stored using a content hash as ID. This approach ensures deduplication to savestorage and bandwidth while also enables the verification of the integrity of therepository.
All chunks featuring the same set of attributes constitute a block. A block containsthe associated attributes followed by a list of chunk hashes. If a client requests aparticular attribute, then the blocks containing that attribute are used to identifythe chunks to be sent to the client. For each file within the dataset, a file referencecontaining metadata like name, relative path, timestamp, dataset specific attributes,binary file header, and the blocks constituting the file is added to the index. Allfile references together form a dataset index, which also contains optional metadatadescribing the dataset, for instances a short description, an URL pointing to furtherreading, and an icon image. The dataset index is compressed and stored as a singlefile in the repository, again using the hashed content as an identifier. The physicaldata model hence implements a Merkle tree as described in section 3.1.
To retrieve a dataset index file from the repository, its ID, e. g. its hash, is required.To translate from human readable labels to repository IDs, references are created.References are stored alongside the repository and point to a dataset index file,being basically a substitution for symlinks, which are not available on every op-erating system. Figure 4.3 outlines the general picture of reference, dataset index,and chunks.
4.3 properties
In this section, we briefly illustrate how the desirable properties introduced insection 2.3.1 manifest in PICKY. A more comprehensive example can be found inchapter 8.
Upgradability Upgrading a dataset by appending new data is achieved by addingnew file entries and/or additional chunks, depending on the nature of the upgrade.Users who have already obtained an earlier version of the dataset only need todownload the new index as well as missing chunks, which is highly efficient.
Verifiability The properties of a Merkle tree enable the client to cryptographicallyverify the integrity of the local copy of a dataset based on the index and dataset IDby re-hashing the stored chunks and comparing it against the chunk ID, which isthe hash of the file content. Chunks that have been corrupted, e. g. by network ordisk failures, can be identified and re-downloaded.
Patching Changing data inside a published dataset causes the chunks containingthese data to change. Due to the Merkle tree structure, these changes propagateup to the dataset ID. The client is thus able to identify precisely which chunks
30 sharing large scientific datasets
have changed between any two versions and only needs to download changed (i. e.new) chunks to patch the local copy of the dataset.
Versioning Each change to the dataset, either by patching or upgrading, resultsin a new dataset ID. By using a certain dataset ID as a reference, clients are able toprecisely re-produce a certain version of the dataset, irrespective of any subsequentchanges.
Selectivity The dataset index allows the client to identify which files and blocksare associated with certain attributes. It can thus identify and download onlythose chunks that actually contain data of interest and locally reconstruct a sparseversion of the original dataset.
Confidentiality PICKY can be used with different file transfer protocols as trans-port layer, including HTTP and FTP. This allows dataset owners to rely on com-mon authentication and authorization solutions as well as transport encryption torestrict access to the dataset and maintain confidentiality and integrity if necessary.
4.4 evaluation
We evaluated the utility of PICKY by applying it to large real-world datasets fromdifferent domains and measuring the potential resource savings of exemplary stud-ies found in literature:
The CAIDA 2014 dataset contains 1091 GB of anonymized passive network traffictraces from Internet backbone links [130]. Each of the 20 billion network packetswas considered an entry and assigning attributes denoting the respective networkand transport layer protocol as well as destination port number. Surprisingly, theresulting repository required about 10% less space compared to the compressedoriginal dataset, despite a 20% increase in raw data due to storing entry levelmetadata. The reduction comes from gzip compression performing better on fileswith higher redundancy as is caused by grouping entries (i. e. packets) by attributes(e. g. network protocol). We found that e. g. researchers interested in only UDPtraffic [81, 147] would have saved about 90% in bandwidth and storage had thedataset been disseminated with PICKY.
We also evaluated PICKY on the Device Analyzer dataset (see section 2.2.2) thatthen contained 11.5 TB usage data from 30,000 Android devices, constituting thelargest publicly available dataset of its kind. We observed an overhead of 14% dueto metadata added during index creation. Using recorded selection metrics fromthe UbiComp/ISWC 2014 Programming Competition, we found that selectivityresulted in an average resource saving of 76% on client side with about one in fourresearchers limiting their request to less than 1% of the original dataset.

4.5 summary 31
4.5 summary
Picky is a novel approach for repeatable and efficient sharing of large scientificdatasets. It features inter- and intra-file selectivity, upgradability, verifiability,strong versioning, as well as patches. It facilitates the use of common access con-trol schemes by working over arbitrary file exchange protocols. PICKY handlesboth text based files and arbitrary binary protocols equally well and can reducethe dataset size due to compression-friendly file reorganisation. We evaluated theconcept and implementation using real world datasets of up to 11.5 TB size and150 billion entries. We showed that reductions of up to 99% both in terms of trafficand storage costs are possible in realistic applications by only accessing a subset ofthe data relevant for a particular research interest. In our research efforts outlinedin chapters 5 and 6, Picky enables us to access datasets we would otherwise lackthe computational resources for. PICKY is released3 under open source license andused by the University of Cambridge to disseminate the Device Analyzer dataset(see section 2.2.2).
3 https://github.com/ucam-cl-dtg/picky

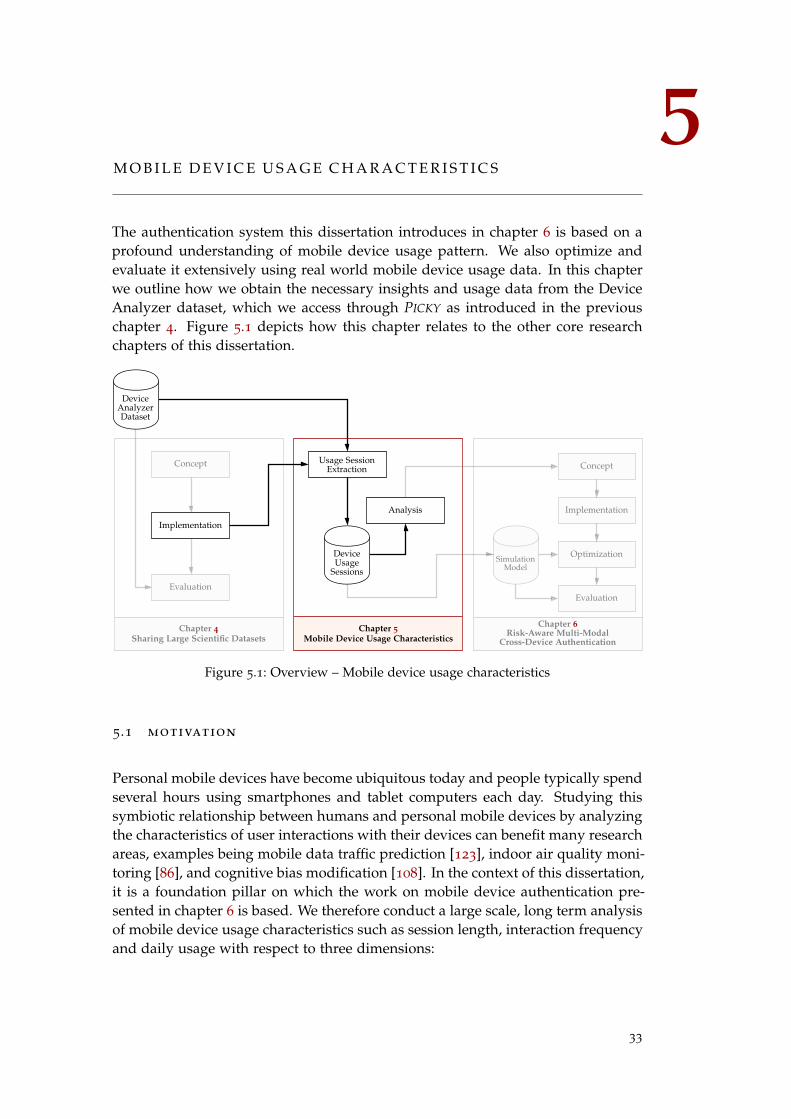
5M O B I L E D E V I C E U S A G E C H A R A C T E R I S T I C S
The authentication system this dissertation introduces in chapter 6 is based on aprofound understanding of mobile device usage pattern. We also optimize andevaluate it extensively using real world mobile device usage data. In this chapterwe outline how we obtain the necessary insights and usage data from the DeviceAnalyzer dataset, which we access through PICKY as introduced in the previouschapter 4. Figure 5.1 depicts how this chapter relates to the other core researchchapters of this dissertation.
DeviceAnalyzerDataset
Chapter 4Sharing Large Scientific Datasets
Implementation
Evaluation
Concept
Chapter 5Mobile Device Usage Characteristics
Usage SessionExtraction
Analysis
DeviceUsage
Sessions
Chapter 6Risk-Aware Multi-Modal
Cross-Device Authentication
Concept
Optimization
Evaluation
Implementation
SimulationModel
Figure 5.1: Overview – Mobile device usage characteristics
5.1 motivation
Personal mobile devices have become ubiquitous today and people typically spendseveral hours using smartphones and tablet computers each day. Studying thissymbiotic relationship between humans and personal mobile devices by analyzingthe characteristics of user interactions with their devices can benefit many researchareas, examples being mobile data traffic prediction [123], indoor air quality moni-toring [86], and cognitive bias modification [108]. In the context of this dissertation,it is a foundation pillar on which the work on mobile device authentication pre-sented in chapter 6 is based. We therefore conduct a large scale, long term analysisof mobile device usage characteristics such as session length, interaction frequencyand daily usage with respect to three dimensions:
33
34 mobile device usage characteristics
1. As the majority of interactions with mobile devices do not include unlockingthe device, we distinguish between locked and unlocked usage.
2. Since location context (e. g. being at home or at work) is suspected to have anoticeable effect on mobile device usage [125], we consider contexts classifiedas home, office, other meaningful place, and elsewhere.
3. With little previous knowledge about the impact of form factor on deviceusage, this work is to our best knowledge the first to analyze and compareusage characteristics of both smartphones and tablets.
Our objectives are two-fold: On one hand we aim to give a high level overview ofmobile device usage characteristics. On the other hand we want to provide exten-sive multi-layered statistical information on device usage based on the dimensionsstated above. Considering these dimensions, we seek to answer research ques-tion II: How do context, form factor, and lock status affect mobile device usagesession characteristics?
5.2 methodology
5.2.1 Dataset
Our analysis is based on the Device Analyzer dataset described in section 2.2.2, ac-cessed through PICKY as introduced in chapter 4. To achieve the best data qualitypossible, we revised the dataset rigorously. Records created from older versions ofthe log capturing application which did not include all features required were dis-regarded. Devices not using any keyguard were omitted, since they do not allowdistinguishing between locked and unlocked state. For day-based statistics, onlydays captured entirely are used. Days recorded only partially, e. g. due to crashes,restarts, or pausing of the data collection, were discarded. We also removed de-vices configured to keep the display turned on while charging since this woulddistort the display state-based usage analysis. Finally, we only analyzed devicesproviding valid data for at least seven days.
5.2.2 Usage Session Extraction
We consider mobile device usage sessions to be consecutive periods of time dur-ing which a user interacts directly with the device. Since mobile devices provideconvenient access to their owners digital lives, they are typically protected againstunauthorized access by some form of keyguard: for instance PIN, password, graph-ical pattern, face unlock, fingerprint, or swipe-to-unlock. While most interactionsrequires unlocking the device first, there are a number of restricted interactionspossible without unlocking the device. The most common locked interactions arechecking time, battery health, network connectivity, notifications, incoming calls,controlling media playback, or taking pictures. Unlike previous mobile deviceusage studies, we therefore distinguish between locked usage sessions and unlockedusage sessions. To derive usage sessions from device logs, we use a screen power

5.2 methodology 35
based model which is commonly used in similar studies [31, 105, 106, 132]. Al-though screen power based usage session extraction comes fairly close to actualdevice interaction, some pitfalls exist which – in our experience – can distort the re-sults noticeably if not considered carefully. For instance, missed calls can be falselyclassified as usage sessions due to the screen activity by a naïve screen power basedapproach. To avoid such misclassification, we used a more sophisticated state ma-chine based usage session extraction approach illustrated in figure 5.2.
locked, display off locked, ringing
locked, display on locked, active call
first event last event
screen|power (on)screen|power (off)
phone|offhook/ start locked session
screen|power (on)screen|power (off)
phone|idle
phone|idle
phone|ringing
screen|power (off)shutdown/ end locked session
screen|power (on)/ start locked session
phone|keyguardremoved/ start unlocked session
unlocked
unlocked, call
phone|idlephone|ringingphone|calling
screen|power (on)screen|power (off)
screen|power (off)shutdown/ end unlocked session
Figure 5.2: State machine for session detection
5.2.3 User Context Classification
People use their mobile devices in different ways, depending on their current situ-ation. For instance, in an office situation people might be more likely to use theirsmartphones to make phone calls or check for upcoming meetings, while at homedevices might be used more to browse the Internet or watch movies. Researchby Soikkeli [125] reflects these different usage patterns by observing that usagesessions are 37% longer in home context over office context, but happen 56% moreoften in office context over home context.
Deriving context from low level device logs is often difficult. Nevertheless, infor-mation on time and location can be combined in order to derive contextual placeinformation. Based on previous research by Jiménez [75] and Soikkeli [125] wedistinguish four different place-related user contexts: home, office, other meaningful,and elsewhere.
While home and office are self-explanatory, other meaningful refers to places that donot have the characteristics of home and office, but still a significant amount of timeis spent there. A frequently visited gym, for instance, would be considered an othermeaningful place. Any place that is not classified as one of these three contexts isassigned the elsewhere context. This includes, but is not limited to, less frequentvisited places like restaurants as well as transitions between other contexts.
Context classification is a two-step process. Meaningful places first have to be iden-tified and then classified into the contexts outlined above. To detect meaningfulplaces – i. e. places the user frequently spends significant time at – using locationdata like GPS would be a natural choice. Since the dataset doesn’t contain GPS data

36 mobile device usage characteristics
for most of the device, we rely on proxy location data, namely Wi-Fi scan resultsand GSM cell ID data. To derive places, we used different approaches for both datasources as detailed in the following:
Deriving Places from Cell Data A mobile phone is almost always connected toa cell tower with a unique cell ID. However, adjacent cells usually overlap eachother to enhance connectivity robustness and devices may dynamically switch be-tween cells. It is not unlikely for even a stationary mobile phone to be connectedto several different cells over the course of time. In order to obtain places fromcell data, adjacent cells therefore need to be clustered. We apply a clustering algo-rithm based on minimum circular subsequences proposed by Yang et al. [144]. Givena sequence of cell IDs a device has been connected to, a circular subsequence is asubsequence starting and ending with the same cell ID and containing at leasttwo different cell IDs with the cardinality being the number of different cell IDs itcontains. A minimum circular subsequence is a circular subsequence that does notcontain other circular subsequences. Cells that appear in a minimum circular sub-sequence of low cardinality are assumed to be co-located and therefore assignedto the same cluster. To avoid the problem of “over-clustering” large areas in situa-tions like stop-and-go traffic on a freeway, cells are clustered around qualified cellsthat appeared at least Q times for at least one day. For our work, we choose Q = 10and a minimum circular subsequence cardinality threshold S = 2, as suggested in[144].
Deriving Places from Wi-Fi Scan Results Wi-Fi-enabled mobile devices periodi-cally scan for Wi-Fi access points within range. The result contains a list of accesspoints, each uniquely identified by its MAC address. Since Wi-Fi access points aretypically stationary, Wi-Fi scan results are frequently used for location-based ser-vices such as indoor positioning and navigation systems [125]. Taking the availablehistory of scan results for a single device as input, we apply the steps outlined inalg. 1 to derive contextual places, each identified by a cluster of adjacent accesspoints.
ALGORITHM 1: Wi-Fi Access Point Cluster AlgorithmA← sequence of all known access pointssort(A)← sort descending by the number of occurrences.while A is not empty do
R← pop(A)
C ← cluster(R) The first access point from A constitutes the root R of a newcluster C
for each access_point in scans_containing_R, doC ← C + access_pointA← A− C Remove from A each access point contained in C
endend
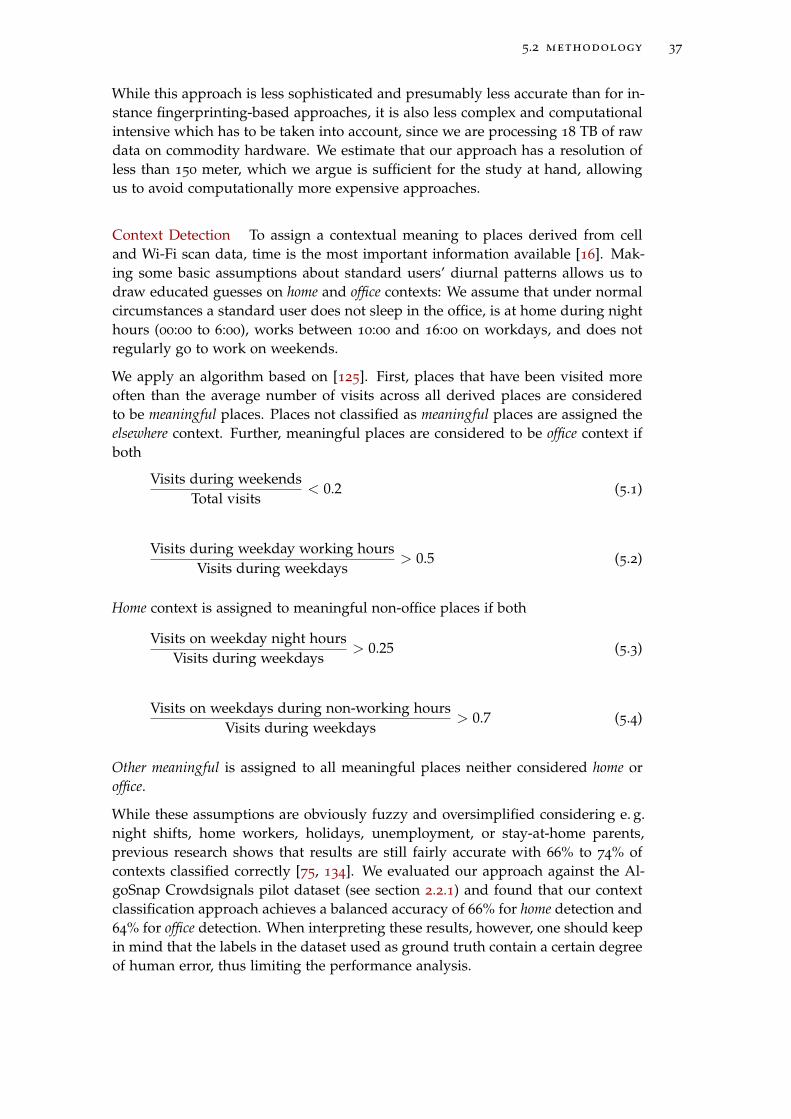
5.2 methodology 37
While this approach is less sophisticated and presumably less accurate than for in-stance fingerprinting-based approaches, it is also less complex and computationalintensive which has to be taken into account, since we are processing 18 TB of rawdata on commodity hardware. We estimate that our approach has a resolution ofless than 150 meter, which we argue is sufficient for the study at hand, allowingus to avoid computationally more expensive approaches.
Context Detection To assign a contextual meaning to places derived from celland Wi-Fi scan data, time is the most important information available [16]. Mak-ing some basic assumptions about standard users’ diurnal patterns allows us todraw educated guesses on home and office contexts: We assume that under normalcircumstances a standard user does not sleep in the office, is at home during nighthours (00:00 to 6:00), works between 10:00 and 16:00 on workdays, and does notregularly go to work on weekends.
We apply an algorithm based on [125]. First, places that have been visited moreoften than the average number of visits across all derived places are consideredto be meaningful places. Places not classified as meaningful places are assigned theelsewhere context. Further, meaningful places are considered to be office context ifboth
Visits during weekendsTotal visits
< 0.2 (5.1)
Visits during weekday working hoursVisits during weekdays
> 0.5 (5.2)
Home context is assigned to meaningful non-office places if both
Visits on weekday night hoursVisits during weekdays
> 0.25 (5.3)
Visits on weekdays during non-working hoursVisits during weekdays
> 0.7 (5.4)
Other meaningful is assigned to all meaningful places neither considered home oroffice.
While these assumptions are obviously fuzzy and oversimplified considering e. g.night shifts, home workers, holidays, unemployment, or stay-at-home parents,previous research shows that results are still fairly accurate with 66% to 74% ofcontexts classified correctly [75, 134]. We evaluated our approach against the Al-goSnap Crowdsignals pilot dataset (see section 2.2.1) and found that our contextclassification approach achieves a balanced accuracy of 66% for home detection and64% for office detection. When interpreting these results, however, one should keepin mind that the labels in the dataset used as ground truth contain a certain degreeof human error, thus limiting the performance analysis.

38 mobile device usage characteristics
Both Cell-based and Wi-Fi-based context detection is applied to classify the contextof a usage session, depending on which information is available. If for one placecontexts derived cell-based and Wi-Fi-based differ, we choose the most specificcontext in the following order: home, office, other meaningful, elsewhere.
5.3 results and discussion
We studied locked and unlocked usage sessions for characteristics like: averagedevice usage time per day, average usage session duration, and average numberof usage sessions per day. For each locked, unlocked, and overall usage sessionswe compute mean and median number of daily interactions as well as mean andmedian daily usage time in regard to context and form factor. For each device,this is done by calculating the mean and median for each feature over all observeddays. The mean and median locked, unlocked, and overall session durations arecalculated across the entire observation period for each device, again in relation tocontext and form factor. We then calculate the grand mean (mean of the means ofall devices) and the grand median (median of the medians of all devices).
Number of Daily Interactions The majority of interactions does not include un-locking the device. Overall, people used their phones on average 60 times perday but only unlocked them for half (46 %) of the interactions. Tablet devices areused less than half as often, namely 23 times per day on average with a similarunlocked usage share of 38 %. Since locked usage only allows for a limited set ofactions, mainly checking information, the high proportion of locked sessions canbe explained by checking habits as described by Oulasvirta et al. [106].
Using a repeated measurement ANOVA (see section 3.2) with context and lockstate as factors, we observed a highly significant effect of context on the numberof daily interactions. Tuckey post hoc tests revealed significant differences forinstance in the average number of sessions at home compared to in the office. Theaverage number of daily device interactions varPhoneInteractionsOfficePercentesconsiderably across users.
Session Duration In general, usage sessions on tablet devices last more thantwice as long as phone usage sessions. Locked sessions on average last 107 sec-onds on phones (median 57 seconds) while spanning 271 seconds on tablet devices(median 84 seconds). Locked sessions being longer for tablet devices compared tosmartphones are presumably caused by the fact that tablets are configured with anaverage display timeout of 6.6 minutes while smartphones feature a mean displaytimeout of only 2.8 minutes. As locked usage sessions are usually short, they aremore prone to distortion caused by display timeouts counted towards usage timein cases in which the user does not manually switch off the device’s screen, whichtechnically marks the end of the usage session.
Average unlocked sessions span 307 seconds on phones (median 73 seconds) whilelasting for 963 seconds on tablets (median 297 seconds). Interestingly, context has
5.4 summary 39
a significant effect on session duration: In home context, sessions on both tablet andphone devices are considerably longer than in other contexts while sessions in officecontext are usually the shortest. On tablet devices, for instance, unlocked sessionsin home context have an average duration of 11.4 minutes while in office context,unlocked sessions would only last 6.7 minutes. Tuckey post hoc tests confirm thatthe effect is statistically significant.
Daily Usage Duration The average locked device usage per day for phones andtablets is fairly close (36 minutes vs. 25 minutes), as the tablets’ longer sessionscompensate for the higher number of sessions on phones. Unlocked usage oftablet devices sums up to 81 minutes per day (median 44 minutes), while phonesare used on average 93 minutes per day (median 66 minutes). Overall, phoneusage amounts to 126 minutes per day (median 96 minutes) while tablets featurean overall usage of 95 minutes (median 47 minutes). As with individual sessionlength, home context accounts for the largest share of usage while office has thesmallest share per context of daily usage.
The average device usage per day is again dominated by a small number of de-vices accumulating an excessive amount of daily usage. Some phones featured anaverage usage per day of almost 15 hours while the maximum average usage oftablet devices is 7 hours. The median of the overall mean daily usage is, however,109 minutes for phones and 67 minutes for tablet devices.
Diurnal Pattern The long-term nature of the underlying dataset – some usersparticipate for more than 4.5 years – enables us to analyze diurnal patterns inmobile device usage. For this purpose we measured how much time each userwould spend at which days of the week and which hour. We found diurnal usagepatterns to be quite different with regard to context, time and day of the week.Mobile devices are most intensely used during weekdays between 09:00 and 17:00in the office context, e. g. at work or in class. For home and other meaningful, onecan observe different patterns for weekdays and weekends. At home, usage duringearly morning hours seems to be less intense at weekends than during the weekwhile the reverse seems to be true for other meaningful places.
5.4 summary
We studied locked and unlocked mobile device usage with respect to device formfactor and user context. For our study we extracted a total of 56.3 million usagesessions from 225 billion mobile device usage records using a sophisticated screenpower state machine-based approach. By combining anonymized GSM cell IDs,Wi-Fi scan results, and timestamps of records we derived location information forusage sessions. Through making reasonable assumptions about standard users’diurnal patterns, we were able to draw educated guesses about users’ locationalcontext, identifying home context for 88 % and office context for 80 % of the smart-phone devices.
40 mobile device usage characteristics
Consistent with previous studies we found high diversity in device usage charac-teristics, both across sessions and users. We observed that on average, smartphonesare used almost thrice as much per day as tablet devices. However, devices are un-locked in only 46 % of the interactions. Given the limited forms of interactionavailable in locked state, the high share of locked usage indicates that the majorityof usage constitutes some form of short information checking [106]. Our resultsshow that 19 % of smartphone usage occurs in office context and 27 % in home con-text, and that the difference is statistically significant. Contrary to the numberof interactions, we found that the duration of usage sessions is in general morethan twice as long for tablets compared to smartphones. The total daily usage ofboth smartphones and tablets is thus similar. Again, home context accounts forthe largest share of usage while office has the smallest share per context of dailyusage.
Our work shows that despite offering similar technical capabilities, smartphonesand tablets are used quite differently. While substantial research has been con-ducted in regard of smartphone usage, little work has been done to analyze tabletusage. With the increasing ubiquity of mobile devices, people tend to simultane-ously own and use several devices of different form factors like phones, tablets,and smartwatches. Further research is needed, e. g. on when and why users tran-sition between different device types.
In the context of mobile device authentication, our work highlights once morewhy traditional knowledge based authentication methods that exhibit reasonableusability in the PC domain are often perceived as an inconvenient burden on mo-bile devices. With on average 27 usage sessions that require authentication per day,secrets like passwords have to be entered much more frequently, typically with aless convenient keyboard, than on a stationary PC, on which authentication is re-quired on average only 4.5 times per day [54] because individual usage sessionstend to be much longer.
The data we gathered in this study are crucial for our subsequent work on deviceauthentication presented in chapter 6. They enable us to accurately model thespatio-temporal behavior of mobile device users with regards to device usage andauthentication on a large scale. This allows us not only to extensively optimize theproposed system but also for the first time to conduct a ceteris paribus comparisonof different authentication strategies under realistic conditions.

6R I S K - AWA R E M U LT I - M O D A L C R O S S - D E V I C EA U T H E N T I C AT I O N
In this section, we present our approach to increase the security and usability ofmobile device authentication by utilizing risk estimation and transparent biomet-rics gathered across a group of trusted devices. We build upon the insights anddata obtained by the device usage study presented in the previous chapter 5, whichin turn utilized the dataset sharing system introduced in chapter 4. Figure 6.1 il-lustrates how this chapter is embedded into the overall dissertation.
DeviceAnalyzerDataset
Chapter 4Sharing Large Scientific Datasets
Implementation
Evaluation
Concept
Chapter 5Mobile Device Usage Characteristics
Usage SessionExtraction
Analysis
DeviceUsage
Sessions
Chapter 6Risk-Aware Multi-Modal
Cross-Device Authentication
Concept
Optimization
Evaluation
Implementation
SimulationModel
Figure 6.1: Overview – Risk-aware multi-modal cross-device authentication
6.1 motivation
Mobile devices such as smartphones, tablets, and notebooks have dramaticallychanged how we interact with computer systems. They provide ubiquitous andconvenient access to sensitive information and services, ranging from private com-munication and data to confidential business documents and critical business pro-cesses. Due to their small size and mobile nature, those devices are exposed toa much higher risk of being lost or stolen than stationary computer systems. Astudy found that in 2013, 3.1 million Americans became victims of smartphonetheft while 1.4 million lost their device [112]. When a smartphone is lost, the per-son who finds it tries to access sensitive personal or business data in over 80% ofthe cases [142]. Strong user authentication is thus crucial to protect against therisk of unauthorized access. To that end, knowledge-based mechanisms like PIN,
41
42 risk-aware multi-modal cross-device authentication
pattern, and password are commonly applied today (see 2.1. Besides well-studiedshortcomings like people being bad at choosing and remembering adequate secrets[7, 10, 143] or their vulnerability to shoulder surfing [145], thermal attacks [1], andsmudge attacks [8], these authentication techniques require a significant amountof scarce user attention in proportion to the usually short usage sessions [65]. Aneffect that is even further amplified by the inability of current approaches to scalewith the ever growing number of devices used simultaneously, as users need toauthenticate separately on every device. Consequently, knowledge-based authen-tication is perceived as inconvenient by many users, the primary reason why au-thentication is disabled on every third smartphone [4, 28, 50, 51].
As a promising approach to overcome the aforementioned drawbacks, continuousunobtrusive user identity verification using different biometrics has been proposed[74, 120, 121] as outlined in section 2.1.2. Commonly used traits include gait [104],mouth motions [128], heartbeat [138], breathing acoustics [15], voice [113], mousemovement [48], and keystroke dynamics [76].
User authentication on mobile devices is generally applied to defend against therisk of unauthorized access to data and services through an adversary with physi-cal access to the device [89]. This risk, however, is dynamic and highly depends onspatial and temporal context. Considering risk in order to apply as much securityas needed but as little as possible potentially enables less obtrusive, adequatelytailored and thus user-friendly security mechanisms [53, 72].
Approaches towards multi-modal biometric authentication systems proposed sofar usually operate on a single device [118] only. With the increasing number ofdifferent interconnected devices owned and used by a single individual, it seemsdesirable to expand the scope in order to leverage contextual and biometric infor-mation gathered within a group of trusted devices to increase both security andusability [70, 126]. This leads to our research question I: How can usability andsecurity of mobile device user authentication be improved by utilizing risk estima-tion and transparent biometrics gathered across a group of trusted devices?
As an answer to this question, we present the concept and open source implemen-tation of CORMORANT, a novel approach towards risk-aware, multi-modal biomet-ric, continuous user authentication across multiple trusted mobile devices. Ourcontributions are as follows:
• We present an approach towards combining explicit and implicit authentica-tion mechanisms with continuous risk estimation, shared securely across agroup of trusted devices to reduce the cognitive effort of authentication.
• We introduce three novel algorithms to fuse authentication scores in a setof dynamic biometrics across different devices, taking risk, uncertainty, anddevice distance into account.
• We propose a novel evaluation technique for dynamic authentication ap-proaches that measures security and usability precisely and facilitates thecomparison with conventional authentication measures using a large-scalesimulation based on more than 720,000 days of real-world device usage tracesand 6.7 million robberies and thefts sourced from policy reports.
6.2 concept 43
6.2 concept
Our research goal is to devise a system capable of significantly reducing the user’seffort of authentication without sacrificing security. To that end, we developedCORMORANT, a mobile authentication framework that utilizes transparent biomet-rics and risk estimation across trusted devices in close proximity.
Transparent biometrics like gait recognition can be employed to unobtrusively andcontinuously evaluate the user’s identity. However, transparent biometric authen-tication only yields sporadic results, e. g. when the user is actually walking in thecase of gait recognition. Furthermore, not every device comes equipped with thenecessary sensors. We therefore use a dynamic set of multiple biometric authentica-tion plugins, as well as knowledge or possession-based authentication mechanisms,e. g. as fallback mechanism should biometric authentication be unavailable. Eachplugin reports its level of confidence in the genuine user’s presence in the interval[0, 1]. We implement a number of authentication plugins utilizing gait recognition,face recognition, speaker recognition, and keystroke dynamics [39, 76, 98, 99]. Weemphasize, however, that those are merely examples and that the system we pro-pose can conceptually integrate all forms of explicit and implicit authentication.
The fundamental purpose of user authentication in the context of mobile devices isto prevent unauthorized access to data and services accessible through the device.Authentication mechanisms like lock screens featuring PIN, password, or patterncommonly used on mobile devices to protect against unauthorized access are usu-ally rather static. Once configured, the level of protection provided, e. g. as a func-tion of the password complexity, remains fixed until the user changes the securitysettings. The actual risk of unauthorized access a device is exposed to, however, isfar from static but depends on the current situation: Devices are frequently lost inpublic transport, but rarely at home. More robberies per capita are committed e. g.in Latin American countries than in Asian countries [26]. Crime rates are higher atnight than during daytime [33]. Users are generally faced with three choices: Theycan configure their devices according to the highest conceivable risk and bear theadded burden of e. g. entering a more complex password even in situations per-ceived less risky. Alternatively, users can choose a less secure configuration, e. g. nolock screen or a short passphrase, that might not be sufficient to protect the deviceunder adverse conditions like shoulder surfing. Ultimately, users could manuallyadjust the settings when their perceived risk changes to balance usability and se-curity, which is even suggested as a viable strategy by some authors [124]. Toautomate the adaptation, CORMORANT relies on risk plugins to continuously assesthe risk of unauthorized access in the interval [0, 1] and adjust the authenticationrequirements accordingly. We suggest three exemplary approaches to quantify riskusing signals like location, time of day, and device usage as examples.
Since people increasingly carry and use multiple devices simultaneously, the thirdpillar of CORMORANT is to leverage authentication and risk information establishedon a single device on other devices belonging to the same user. To that end,a secure, end-to-end encrypted communication between trusted devices is estab-lished. The confidence and risk measurements of individual plugins are periodi-
44 risk-aware multi-modal cross-device authentication
cally broadcast within the group, along with location information. This allows, forinstance, for a device to be accessible if it is in close proximity to a device that hassuccessfully established the user’s identity recently.
For estimating the distance between devices, different techniques and signals canbe used, for instance GPS, Wi-Fi, GSM, ultra-wideband (UWB), and Bluetooth [6,52, 131]. In our implementation we use a combination of GPS, GSM, and Wi-Fifor a coarse distance estimation to determine the device’s current location with anaccuracy of 3 to 10 meters. For devices within close proximity, we utilize BluetoothLow Energy beacons to establish the distance between devices with an accuracy ofless than a meter.
We note that generally such radio based distance estimation techniques are suscep-tible to spoofing or distance enlargement attacks if a powerful attacker is equippedwith the necessary hardware. The only notable exception is UWB, for which a newmodulation technique that allows to detect distance enlargement attacks was re-cently proposed by Singh et al. [122]. If an attacker possessing the capability tospoof the distance estimation (e. g. a governmental agency) is assumed in the user’spersonal threat model, it is advisable to refrain from using the multi-device authen-tication functionality of CORMORANT but restrain its scope to individual devices.
A major choice with any authentication systems is the threat model. For mobile au-thentication, this includes in particular whom to consider an attacker with regardsto insiders, e. g. people familiar with the victim [101]. Depending on personal cir-cumstances, a user might for instance be voluntarily sharing access to a personaldevice with their spouse but determined to prevent their children from accessingthe device without supervision. For now, we assume devices will only be used bya single user and not shared, though CORMORANT could be extended in the futureto accommodate more diverse usage models.
6.3 score level fusion
None of the established score level fusion techniques outlined in section 2.1.2 isdirectly applicable for CORMORANT, since novel properties like distance betweendevices and risk information need to be considered during fusion as well. We thusdesigned three novel fusion algorithms for CORMORANT. The most sophisticatedalgorithm we propose uses a Kalman filter to estimate the overall confidence inthe genuine user’s presence based on the confidence information provided by theauthentication plugins. Since the Kalman filter is computationally expensive, wealso developed two lightweight alternatives, which are outlined in the followingwhereas for details on the Kalman filter based fusion we refer to chapter 10.
The max weighted threshold fusion algorithm as well as the mean weighted threshold fu-sion algorithm are similar variants of analytic fusion methods, which makes themsimple to implement and computationally efficient. Each individual plugin is as-signed a static weight (W). On every tick, all co-located trusted devices, includingthe device running the algorithm, are iterated and all active confidence and riskplugins are queried.

6.3 score level fusion 45
The previous confidence is degenerated by a constant component as well as a riskdependent component. The constant factor can be configured independently fordifferent device types (e. g. smartphone vs. notebook) as well as whether the de-vice is actively used or idle (Dact vs. Didle). It causes confidence to erode over timeif not reinforced. The risk-dependent component ensures the level of confidence re-quired corresponds to the current risk assessment. This is achieved by subtractingthe current risk multiplied by a constant αrisk from the previous confidence.
Current confidence, degenerated previous confidence, and risk scores are fused,depending on the algorithm, using either a max or mean function. The result iscompared against a constant threshold and access to the device is granted if theconfidence is equal or greater than that threshold, as illustrated in algorithms 2and 3.
ALGORITHM 2: Max Weighted Threshold Fusion
InputT ← set of all trusted devicess← device running the algorithm, s ∈ Tcon ft−1 ← previous confidence
Methodcon ft = 0.0for all d ∈ T do
if not colocated(d, s) then continue;P← set of confidence plugins active on dfor all p ∈ P do
if not hasConfidence(p) then continue;if d = s then
con fp = con f idence(p) ∗Wp
elsecon fp = con f idence(p) ∗Wp ∗ remote_ f actor
endcon ft = max(con fp, con ft)
endend
riskt = 0.0R← set of risk plugins active on dfor all r ∈ R do
if not hasRisk(r) then continue;riskr = risk(r) ∗Wr
riskt = max(riskr, riskt)end
if d is active thencon ft−1 = con ft−1 − Dact_s − riskt ∗ αrisk
elsecon ft−1 = con ft−1 − Didle_s − riskt ∗ αrisk
end
return max(con ft−1, con ft) ≥ threshold
ALGORITHM 3: Mean Weighted Threshold Fusion
InputT ← set of all trusted devicess← device running the algorithm, s ∈ Tcon ft−1 ← previous confidence
Methodcon f _vals = []
for all d ∈ T doif not colocated(d, s) then continue;P← set of confidence plugins active on dfor all p ∈ P do
if not hasConfidence(p) then continue;if d = s then
con fp = con f idence(p) ∗Wp
elsecon fp = con f idence(p) ∗Wp ∗ remote_ f actor
endcon f _vals[dp] = con fp
endend
risk_vals = []
R← set of risk plugins active on dfor all r ∈ R do
if not hasRisk(r) then continue;risk_vals[r] = risk(r) ∗Wr
endriskt = mean(risk_vals)
if d is active thencon f _vals[con ft−1] = con ft−1 − Dact_s − riskt ∗ αrisk
elsecon f _vals[con ft−1] = con ft−1 − Didle_s − riskt ∗ αrisk
end
return mean(con f _vals) ≥ threshold

46 risk-aware multi-modal cross-device authentication
6.4 implementation
The implementation of CORMORANT consists of a client on each device, an API toconnected authentication and risk plugins to the framework, as well as a backendto facilitate cross device communication, which are outlined in the following.
6.4.1 Android Client
We implemented CORMORANT as an Android application, though with additionaleffort, other platforms could be supported as well. The framework applicationoperates on the results reported by authentication and risk plugin applications in-stalled independently by the user as well as results reported from other trusteddevices. It can lock or unlock the device or challenge the user with explicit authen-tication if the implicit confidence in the user’s identity gained through transparentbiometrics is not sufficient to grant access under the current risk level. The frame-work application allows the user to configure CORMORANT, including managingthe group of trusted devices, learn about the location and state of other devices,and adjust various configuration parameters.
Apart from protecting general access to the device, the framework offers an inter-face for applications to query the current confidence in the user’s identity based onavailable means of authentication as well as the estimated risk of unauthorized ac-cess. Moreover, applications can request to raise the confidence level in which casethe framework might prompt the user with some form of explicit authenticationsuch as pan face recognition [36]. This functionality is somewhat similar to the Bio-metricPrompt1 API introduced in Android 9, which allows application developersto integrate biometric authentication into their applications by requesting biomet-ric authentication from the operating system, for instance by prompting the userto scan their finger. The key difference is that in our concept, the application doesnot request authentication but a certain level of confidence in the user’s identity. Ifthe confidence is already high enough, e. g. from recent authentication on nearbytrusted devices, no explicit user interaction might be needed. This allows for fineraccess control than today’s authentication models where access is largely grantedon an all-or-nothing principle where a user either gets access to every applicationand service if successfully authenticated or to none otherwise. However, a calcu-lator application arguably needs less protection than a mobile banking app. Byusing the CORMORANT API, an application could ensure that it only operates whencertain, app-dependent confidence and risk levels are met. But one could easilygo further and apply this model of access control to certain functionalities withinapplications or even transactions. For example, transferring $1 using a mobilebanking app might require a lower level of confidence while authorizing a transac-tion worth $10,000 might require multiple authentication mechanisms to positivelyidentify the genuine user (virtually a dynamic form of multi factor authentication).We note that certain applications might require more fine-grained control over theauthentication process that this simple API facilitates, for instance to comply with
1 https://source.android.com/security/biometric
6.5 evaluation and optimization 47
industry regulations like the upcoming requirement of using two-factor customerauthentication for banking applications in the EU [30]. However, by choosing aless complex API we hope to facilitate easier adoption for the majority of applica-tions. It is also worth noting that the BiometricPrompt API in Android follows asimilar design principle in that it allows to request strong biometric authentication,but not a specific modality.
6.4.2 Plugin API
CORMORANT is designed as a modular system that can be extended dynamicallyat runtime through a plugin mechanism. Plugins come in the form of risk plug-ins, which assess the probability of unauthorized physical access to a device, andauthentication plugins which implicitly or explicitly authenticate the user of a de-vice. While we provide a number of biometric and knowledge-based authenti-cation plugins as well as some risk plugins, the primary motivation behind theplugin mechanism is to allow third party developers and researchers to utilize andextend CORMORANT with novel means of risk assessment or authentication. Conse-quently, the API is published as an Android library in source2 and in the JCenterMaven repository3.
6.4.3 Backend
In order to utilize authentication information gathered on other devices, trusteddevices need to be able to efficiently and securely communicate. To maintainsecurity and privacy, communication needs to be authenticated and encrypted.Groups of trusted devices also need to be dynamic, as users might add additionaldevices or remove devices sold, lost, or stolen at any time. Finally, the mobile anddistributed application of CORMORANT requires the underlying communication tocope with devices being potentially offline at any time.
To account for these requirements, CORMORANT relies on the Signal messagingprotocol as outlined in section 3.3. As basis for the CORMORANT backend we forkedand modified the Signal server4 which serves as backend infrastructure for theSignal messaging application. The code is available under AGPLv3 open sourcelicense,5 allowing curious or particularly privacy conscious users to deploy andhost their own instance of the backend if desired.
6.5 evaluation and optimization
Established techniques like cross-validation are available to measure the perfor-mance of individual biometrics. Evaluating an entire system like CORMORANT
2 https://github.com/mobilesec/cormorant
3 https://dl.bintray.com/mobilesec/maven/at/usmile/cormorant/cormorant-api
4 https://github.com/WhisperSystems/Signal-Server
5 https://github.com/mobilesec/cormorant-signal-server
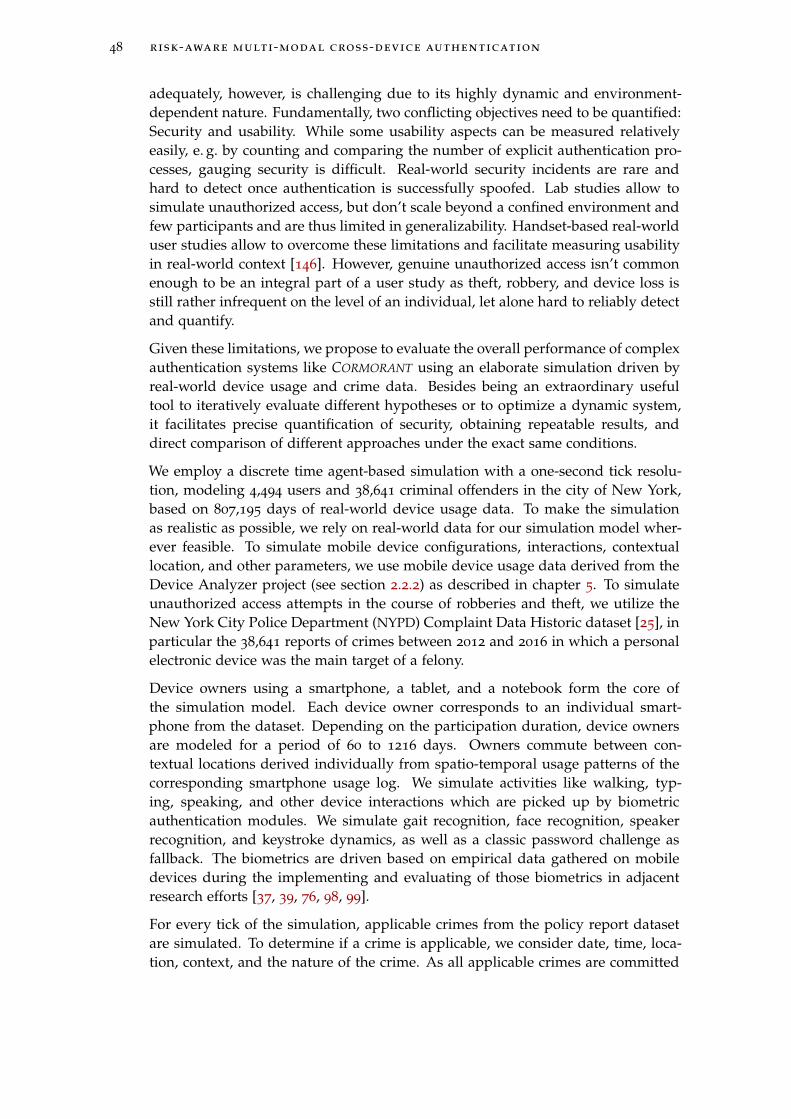
48 risk-aware multi-modal cross-device authentication
adequately, however, is challenging due to its highly dynamic and environment-dependent nature. Fundamentally, two conflicting objectives need to be quantified:Security and usability. While some usability aspects can be measured relativelyeasily, e. g. by counting and comparing the number of explicit authentication pro-cesses, gauging security is difficult. Real-world security incidents are rare andhard to detect once authentication is successfully spoofed. Lab studies allow tosimulate unauthorized access, but don’t scale beyond a confined environment andfew participants and are thus limited in generalizability. Handset-based real-worlduser studies allow to overcome these limitations and facilitate measuring usabilityin real-world context [146]. However, genuine unauthorized access isn’t commonenough to be an integral part of a user study as theft, robbery, and device loss isstill rather infrequent on the level of an individual, let alone hard to reliably detectand quantify.
Given these limitations, we propose to evaluate the overall performance of complexauthentication systems like CORMORANT using an elaborate simulation driven byreal-world device usage and crime data. Besides being an extraordinary usefultool to iteratively evaluate different hypotheses or to optimize a dynamic system,it facilitates precise quantification of security, obtaining repeatable results, anddirect comparison of different approaches under the exact same conditions.
We employ a discrete time agent-based simulation with a one-second tick resolu-tion, modeling 4,494 users and 38,641 criminal offenders in the city of New York,based on 807,195 days of real-world device usage data. To make the simulationas realistic as possible, we rely on real-world data for our simulation model wher-ever feasible. To simulate mobile device configurations, interactions, contextuallocation, and other parameters, we use mobile device usage data derived from theDevice Analyzer project (see section 2.2.2) as described in chapter 5. To simulateunauthorized access attempts in the course of robberies and theft, we utilize theNew York City Police Department (NYPD) Complaint Data Historic dataset [25], inparticular the 38,641 reports of crimes between 2012 and 2016 in which a personalelectronic device was the main target of a felony.
Device owners using a smartphone, a tablet, and a notebook form the core ofthe simulation model. Each device owner corresponds to an individual smart-phone from the dataset. Depending on the participation duration, device ownersare modeled for a period of 60 to 1216 days. Owners commute between con-textual locations derived individually from spatio-temporal usage patterns of thecorresponding smartphone usage log. We simulate activities like walking, typ-ing, speaking, and other device interactions which are picked up by biometricauthentication modules. We simulate gait recognition, face recognition, speakerrecognition, and keystroke dynamics, as well as a classic password challenge asfallback. The biometrics are driven based on empirical data gathered on mobiledevices during the implementing and evaluating of those biometrics in adjacentresearch efforts [37, 39, 76, 98, 99].
For every tick of the simulation, applicable crimes from the policy report datasetare simulated. To determine if a crime is applicable, we consider date, time, loca-tion, context, and the nature of the crime. As all applicable crimes are committed

6.6 results 49
on every simulation tick, owners become the victim of a crime on average everyfour minutes. When a crime is committed, the simulation forks, i. e. the currentstate of the simulated world is copied. The initial simulation continues as if thecrime did not happen whereas in the fork, the crime and its consequences are simu-lated. The crime simulation now features an attacker, who is modeled conceptuallysimilar to the device owner with regards to behavior like walking, speaking, or typ-ing. An attacker tries to access devices under his control, either by guessing thepassword or overcoming the biometric authentication system, e. g. through a falsepositive. In our model, we assume a zero-effort attacker who opportunisticallytries to access the device but does not try to spoof the biometric feature or mimicthe genuine owner’s features [97]. To quantify the security of different authentica-tion systems and configurations, we track how often devices are compromised.
We evaluate the performance of CORMORANT relative to the currently most com-mon form of authentication, i. e. knowledge-based authentication. We establish abaseline by running the simulation with an independent password system on ev-ery simulated device. By running the exact same simulation ceteris paribus, downto the second in which a crime occurs, but with CORMORANT in action, we can com-pare the relative number and extent of unauthorized access against the baseline tomeasure the relative difference in security.
The simulation-based evaluation approach also facilitates the optimization of theoverall system configuration using heuristic search techniques from artificial intel-ligence. We employ different techniques including random restart hill climbing,simulated annealing, and gradient descent iteratively with increasing simulationsize to find optimal solutions for different goals. The goals are to maximize usabil-ity without compromising security, to maximize security without compromisingusability, and to maximize both security and usability equally. The cost functionswe use ensure that neither security nor usability regresses compared to the base-line. Due to the extent of the simulation and our computational resources beinglimited to about 20,000 CPU hours, we could only use up to 10% of the deviceusage data (449 devices with 80,432 days of usage) for optimization purposes andretained 90% of the dataset for the evaluation.
6.6 results
We evaluated CORMORANT using an evaluation datasets (4,045 devices with 726,763days of usage) against a baseline using traditional authentication methods. Theevaluation dimensions are usability and security, measured by the number of ex-plicit authentication procedures necessary per day and the number of device com-promisations per day. We used three different configurations optimized for secu-rity, usability, and both.
Comparing the three different score level fusion algorithms, the Kalman filterbased approach shows the best relative performance in many though not all di-mensions. The weighted score fusion algorithms also performed much better thananticipated, with none of the three algorithms proving to be strictly superior overthe others.
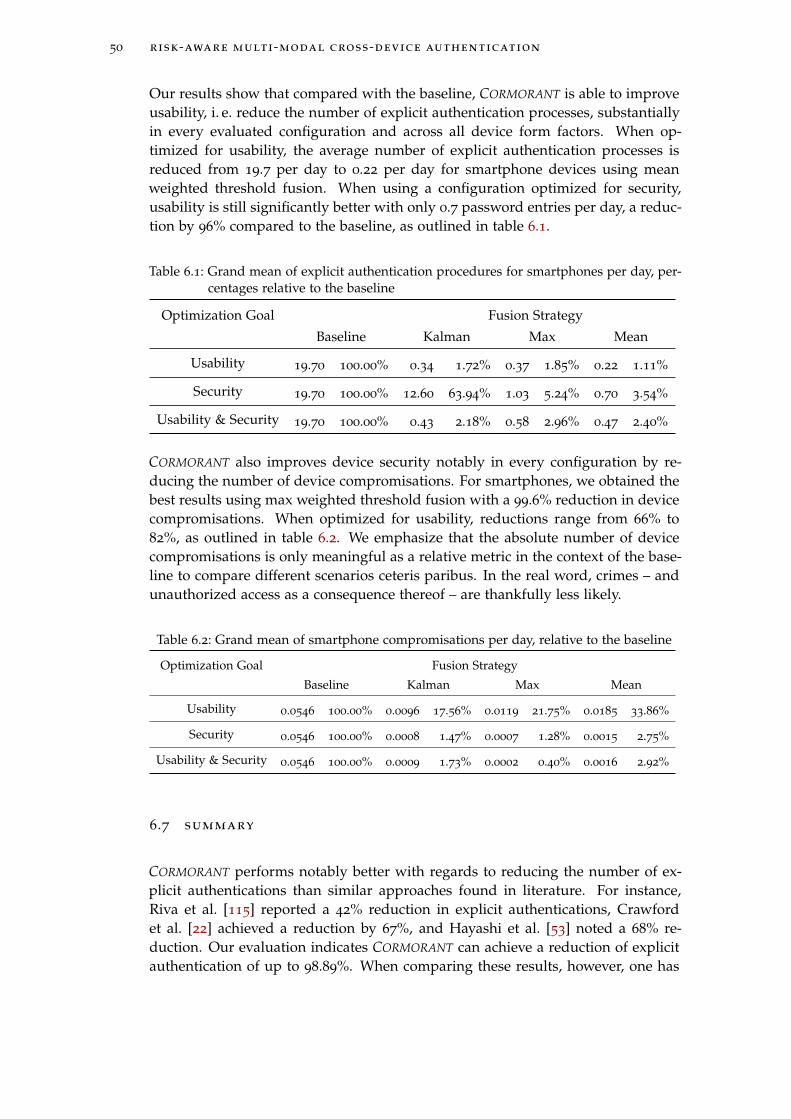
50 risk-aware multi-modal cross-device authentication
Our results show that compared with the baseline, CORMORANT is able to improveusability, i. e. reduce the number of explicit authentication processes, substantiallyin every evaluated configuration and across all device form factors. When op-timized for usability, the average number of explicit authentication processes isreduced from 19.7 per day to 0.22 per day for smartphone devices using meanweighted threshold fusion. When using a configuration optimized for security,usability is still significantly better with only 0.7 password entries per day, a reduc-tion by 96% compared to the baseline, as outlined in table 6.1.
Table 6.1: Grand mean of explicit authentication procedures for smartphones per day, per-centages relative to the baseline
Optimization Goal Fusion Strategy
Baseline Kalman Max Mean
Usability 19.70 100.00% 0.34 1.72% 0.37 1.85% 0.22 1.11%
Security 19.70 100.00% 12.60 63.94% 1.03 5.24% 0.70 3.54%
Usability & Security 19.70 100.00% 0.43 2.18% 0.58 2.96% 0.47 2.40%
CORMORANT also improves device security notably in every configuration by re-ducing the number of device compromisations. For smartphones, we obtained thebest results using max weighted threshold fusion with a 99.6% reduction in devicecompromisations. When optimized for usability, reductions range from 66% to82%, as outlined in table 6.2. We emphasize that the absolute number of devicecompromisations is only meaningful as a relative metric in the context of the base-line to compare different scenarios ceteris paribus. In the real word, crimes – andunauthorized access as a consequence thereof – are thankfully less likely.
Table 6.2: Grand mean of smartphone compromisations per day, relative to the baseline
Optimization Goal Fusion Strategy
Baseline Kalman Max Mean
Usability 0.0546 100.00% 0.0096 17.56% 0.0119 21.75% 0.0185 33.86%
Security 0.0546 100.00% 0.0008 1.47% 0.0007 1.28% 0.0015 2.75%
Usability & Security 0.0546 100.00% 0.0009 1.73% 0.0002 0.40% 0.0016 2.92%
6.7 summary
CORMORANT performs notably better with regards to reducing the number of ex-plicit authentications than similar approaches found in literature. For instance,Riva et al. [115] reported a 42% reduction in explicit authentications, Crawfordet al. [22] achieved a reduction by 67%, and Hayashi et al. [53] noted a 68% re-duction. Our evaluation indicates CORMORANT can achieve a reduction of explicitauthentication of up to 98.89%. When comparing these results, however, one has
6.7 summary 51
to consider the different evaluation methods used. While the cited works useduser studies, though of rather small size, we used a novel simulation approachon a large dataset, thus comparability may be limited. We also note that theperformance of CORMORANT significantly improved as a result of the parameteroptimization, compared to manual configurations we used initially. It thus seemsreasonable to assume that prior works could also achieve better performance ifoptimized in a similar way.

7C O N C L U S I O N A N D O U T L O O K
This section summarizes the research and contributions presented in this disserta-tion, concludes our research, and discusses limitations and future work.
7.1 summary
This dissertation was motivated by the fact that one out of three mobile devicesis not protected against unauthorized access, primarily because of the perceivedburden of explicit authentication [28, 50, 51]. The core research question I wederived from this problem is: How can usability and security of mobile device userauthentication be improved by utilizing risk estimation and transparent biometricsgathered across a group of trusted devices? In order to address this question, onefirst needs to understand – among other things – how mobile devices are usedwith regards to authentication, context, and form factor. Since no suitable study ofmobile device usage characteristics existed, we formulated our secondary researchquestion II: How do context, form factor, and lock status affect mobile device usagesession characteristics? To answer this question, we conducted a large scale, longterm analysis of mobile device usage. Accessing the largest available dataset ofmobile device usage traces, however, proved challenging due to the enormous sizeof the dataset and our very limited computational resources. We thus first had toanswer research question III: How can researchers share and access large evolvingdatasets in a repeatable, verifiable, and efficient manner using only commodityhardware? The contributions of this dissertation consequently correspond to thesethree research questions, as outlined in the following section.
7.2 contributions
7.2.1 Sharing Large Scientific Datasets
We developed Picky, a novel approach for repeatable and efficient sharing of largeevolving scientific datasets. Picky features a number of properties that, dependingon the nature of the dataset, are desirable:
• It enables clients to download and process only a subset of the originaldataset by enabling both file and intra-file selectivity.
• It allows dataset providers to publish updates without having clients to re-download content already present.
• Publishers are able to patch published data, for instance to correct errors.
53

54 conclusion and outlook
• The consistency of the downloaded dataset can be verified to ensure correct-ness of received data.
• Strong versioning, which facilitates reproducibility of results irrespective ofupdates or patches.
• A potentially reduction in dataset size due to compression friendly contentreordering.
Evaluated against a number of large public datasets, we found that common stud-ies can save up to 99% in traffic and storage cost if Picky is used to disseminatedatasets of significant size. Picky is released under open source license1 and usedsuccessfully to provide the Device Analyzer dataset, a dataset of several terabyte,to interested researches.
7.2.2 Mobile Device Usage Characteristics
We conducted the by far largest study of mobile device usage as of today, basedon 56 million usage sessions from 225 billion mobile device usage records. Unlikesimilar studies, we included interactions in which the device is not unlocked. Wealso analyzed how device usage differs, depending on the context. With littleprevious knowledge about the impact of form factor on device usage, we were toour best knowledge the first to analyze and compare usage characteristics of bothsmartphones and tablets. Among the key contributions of our research are thefollowing findings:
• Smartphones are used three times more per day than tablets (60 vs. 23 times).
• Devices are unlocked in only 46 % of the interactions.
• Office context accounts for 19 % smartphones usage and home for 27 %.
• On average, sessions last 307 sec. on smartphones and 963 sec. on tablets.
• The daily usage of both smartphones and tablets are similar (93 vs. 81 min).
Aside from the detailed analysis and results, we also published the code used toprocess and analyze the data under open source license.2
7.2.3 Risk-Aware Multi-Modal Cross-Device Authentication
We designed, evaluated, and implemented CORMORANT, an extensible Androidframework that leverages a dynamic set of explicit and implicit authenticationmechanism as well as continuous risk estimation, shared securely across a groupof trusted devices to enhance usability and increase security at the same time. Thecore features of CORMORANT are:
• A simple but powerful API, allowing it to be enhanced by third party authen-tication and risk plugins at runtime.
1 https://github.com/ucam-cl-dtg/picky
2 https://github.com/hintzed/mobile-device-usage-processing
7.3 conclusion 55
• End-to-end encrypted communication using the Signal messaging protocol.
• Device distance approximation using Bluetooth Low Energy beacons.
• Risk estimation based on location, time, and nearby devices.
• Authentication using gait, voice, face, or keystroke dynamics recognition.
• Three novel dynamic score level fusion algorithms.
Since complex authentication systems are hard to evaluate with regards to securityusing conventional user studies, we also developed a novel evaluation approachusing a large-scale agent-based simulation. Our approach allows quantifying us-ability and security of novel authentication systems as well as comparing perfor-mance ceteris paribus to conventional password-based authentication.
We found that CORMORANT is able to improve usability and convenience of authen-tication by reducing the frequency of password entries required on smartphonesby 98.28%. With inconvenience being the prime reason for the still poor adoptionof authentication on mobile devices, we argue that CORMORANT could contributeto more devices being secured by authentication by reducing the authenticationeffort substantially. But CORMORANT is also able to improve security significantlyover conventional authentication. If configured to focus on security, the probabilityof robberies resulting in unauthorized data access can be reduced by up to 99.60%without increasing the number of password entries.
7.3 conclusion
Mobile devices enabling convenient access to our digital lives are ubiquitous todayin ever increasing numbers. The more devices we use, the more access to sensitiveresources and services they facilitate, the more important securing those devicesagainst unauthorized access using strong authentication becomes. At the sametime, the more frequently we interact with those devices, the more cumbersomedo traditional knowledge-based means of authentication become. Transparent bio-metric authentication and risk adaptive security configurations are two promisingtechniques to alleviate the burden of authentication and increase security at thesame time. In the research presented in this dissertation, we demonstrated howboth techniques can be combined into an authentication system that spans all ofthe devices a user owns and operates and thus scales with the increasing num-ber of mobile devices per person. Using a novel simulation-based evaluation ap-proach, we were able to show that the system we propose can increase security andusability of mobile device authentication substantially, compared to conventionalknowledge-based authentication. The adoption of concepts and techniques fromthis dissertation could hence contribute to tackling inconvenience, the main reasonwhy one out of three mobile devices is still not protected against unauthorizedaccess. Ultimately, our work contributes to Mark Weiser’s vision of ubiquitouscomputing where technology recedes into the background with every device be-ing transparently and effortlessly protected, ensuring the integrity and privacy ofthe services and data it serves as a gateway to.
56 conclusion and outlook
7.4 limitations and outlook for future work
While we evaluated the concept of CORMORANT extensively, the actual implementa-tion presented in this dissertation has yet to be evaluated with regards to usability.To this end, a lab study with actual users should be conducted, in which along theusability also the robustness in different adversarial scenarios like staged devicetheft could be assessed. For further analysis, a field study could be conducted toascertain how the system performs in situ with regards to usability and practical-ity.
We firmly believe that the simulation-based evaluation approach could comple-ment the methods researchers have at their disposal for evaluating complex dy-namic authentication systems. Unlike other methods, it allows to objectively quan-tify security – which is a key capability when balancing usability and security.It also can potentially be used to compare different authentication systems andthus facilitate a common benchmark for future research. To unlock this potential,ideally a dataset containing all relevant data would need to be created to avoidmerging unrelated datasets and stochastic approximations like we had to resort to.Furthermore, the infrastructure developed in the course of this dissertation needsto be generalized to accommodate other projects and productionized so it can beopen sourced and conveniently used by others, as we have already been asked todo.
The principal limitation of any novel authentication system for mobile devices to-day is the inability to reliably lock and unlock the device. On modern mobileoperating systems like Android, applications are sandboxed and confined to pre-vent a rogue app from taking control over the device [89], limiting their abilitiesto the available APIs, with no public API available today for unlocking Androiddevices programmatically. Consequently, research projects like CORMORANT arelimited to e. g. a visual indicator to signify the lock state. Since this does not of-fer any protection against unauthorized access, third-party authentication systemslike CORMORANT can not practically be used to unlock devices aside from demon-strating the concept unless they are either adopted by the Android Open SourceProject (AOSP) or a public API is introduced. This also limits how such systemscan be evaluated without exposing study participants to the risk of unauthorizeddevice access. Consequently, we will bring our research to the attention of theAOSP maintainers in order to attempt widespread dissemination of the conceptsdeveloped in this dissertation.
B I B L I O G R A P H Y
[1] Yomna Abdelrahman, Mohamed Khamis, and Stefan Schneegaßand FlorianAlt. “Stay Cool! Understanding Thermal Attacks on Mobile-based User Au-thentication.” In: Proceedings of the 2017 CHI Conference on Human Factors inComputing Systems (CHI’17). 2017, pp. 3751–3763. doi: 10.1145/3025453.3025461.
[2] David Sánchez Aguado, Romina Ahumada, Andrés Almeida, Scott F. An-derson, Brett H. Andrews, Borja Anguiano, Erik Aquino Ortíz, AlfonsoAragón-Salamanca, Maria Argudo-Fernández, Marie Aubert, et al. “TheFifteenth Data Release of the Sloan Digital Sky Surveys: First Release ofMaNGA Derived Quantities, Data Visualization Tools and Stellar Library.”In: The Astrophysical Journal Supplement Series 240.2 (2019), p. 23. doi: 10.3847/1538-4365/aaf651.
[3] Sherif Akoush, Lucian Carata, Ripduman Sohan, and Andy Hopper. “Mr-Lazy: Lazy Runtime Label Propagation for MapReduce.” In: Proceedings ofthe 6th USENIX conference on Hot Topics in Cloud Computing (HotCloud’14)(2014), pp. 17–17.
[4] Yusuf Albayram, Mohammad Maifi Hasan Khan, Theodore Jensen, andNhan Nguyen. “"...better to use a lock screen than to worry about saving afew seconds of time": Effect of Fear Appeal in the Context of SmartphoneLocking Behavior.” In: Proceedings of the Thirteenth USENIX Conference onUsable Privacy and Security (SOUPS’17). 2017, pp. 49–63.
[5] Joël Alwen, Sandro Coretti, and Yevgeniy Dodis. “The Double Ratchet: Se-curity Notions, Proofs, and Modularization for the Signal Protocol.” In: Ad-vances in Cryptology – EUROCRYPT 2019. Ed. by Yuval Ishai and VincentRijmen. Springer International Publishing, 2019, pp. 129–158.
[6] Sayedul Aman, Haowen Jiang, Cuyler Quint, Kumar Yelamarthi, and AhmedAbdelgawad. “Reliability Evaluation of iBeacon for Micro- Localization.” In:7th Annual Ubiquitous Computing, Electronics & Mobile Communication Confer-ence (UEMCON’16). 2016, pp. 1–5. doi: 10.1109/UEMCON.2016.7777904.
[7] Panagiotis Andriotis, Theo Tryfonas, and George Oikonomou. “ComplexityMetrics and User Strength Perceptions of the Pattern-Lock Graphical Au-thentication Method.” In: Proceedings of the Second International Conference onHuman Aspects of Information Security, Privacy, and Trust (HAS’14). Springer-Verlag New York, Inc., 2014, pp. 115–126. doi: 10.1007/978-3-319-07620-1_11.
[8] Adam J. Aviv, Katherine Gibson, Evan Mossop, Matt Blaze, and Jonathan M.Smith. “Smudge Attacks on Smartphone Touch Screens.” In: Proceedings ofthe 4th USENIX conference on Offensive technologies (WOOT’10) (2010), pp. 1–10.
57
58 Bibliography
[9] Cheila. Bergamini, Luiz S. Oliveira, Alessandro L. Koerich, and RobertSabourin. “Combining different biometric traits with one-class classifica-tion.” In: Signal Processing 89.11 (Nov. 2009), pp. 2117–2127. doi: 10.1016/j.sigpro.2009.04.043.
[10] Joseph Bonneau, Sören Preibusch, and Ross Anderson. “A Birthday PresentEvery Eleven Wallets? The Security of Customer-Chosen Banking PINs.”In: Financial Cryptography and Data Security. Ed. by Angelos D. Keromytis.Springer Berlin Heidelberg, 2012, pp. 25–40. doi: 10.1007/978- 3- 642-32946-3_3.
[11] Jeff Bonwick, Matt Ahrens, Val Henson, Mark Maybee, and Mark Shellen-baum. “The Zettabyte File System.” In: Proceedings of the 2nd Usenix Confer-ence on File and Storage Technologies. Vol. 215. 2003.
[12] Beth Brakewood and Russell A. Poldrack. “The ethics of secondary dataanalysis: Considering the application of Belmont principles to the sharingof neuroimaging data.” In: NeuroImage 82.15 (2013), pp. 671–676. doi: 10.1016/j.tplants.2014.08.004.
[13] Frank Breitinger and Claudia Nickel. “User Survey on Phone Security andUsage.” In: Proceedings of the Special Interest Group on Biometrics and ElectronicSignatures (BIOSIG’10). 2010, pp. 139–144.
[14] Anne Cambon-Thomsen, Emmanuelle Rial-Sebbag, and Bartha M. Knop-pers. “Trends in Ethical and Legal Frameworks for the use of Human Bio-banks.” In: European Respiratory Journal 30.2 (2007), pp. 373–382. doi: 10.1183/09031936.00165006.
[15] Jagmohan Chauhan, Jathushan Rajasegaran, Suranga Seneviratne, ArchanMisra, Aruna Seneviratne, and Youngki Lee. “Performance Characteriza-tion of Deep Learning Models for Breathing-based Authentication on Re-source-Constrained Devices.” In: Proceedings of the ACM on Interactive, Mo-bile, Wearable and Ubiquitous Technologies (IMWUT) 2.4 (Dec. 2018), 158:1–158:24. doi: 10.1145/3287036.
[16] Guanling Chen and David Kotz. A Survey of Context-Aware Mobile ComputingResearch. Technical Report. 2000.
[17] Cisco. Cisco Visual Networking Index: Global Mobile Data Traffic Forecast Update,2016–2021. White Paper. 2017.
[18] Laura Clarke, Xiangqun Zheng-Bradley, Richard Smith, Eugene Kulesha,Chunlin Xiao, et al. “The 1000 Genomes Project: data management andcommunity access.” In: Nature Methods 9.5 (2012), pp. 459–462. doi: 10 .
1038/nmeth.1974.
[19] Joseph Paul Cohen and Henry Z. Lo. “Academic Torrents: A Community-Maintained Distributed Repository.” In: Proceedings of the 2014 Annual Con-ference on Extreme Science and Engineering Discovery Environment (XSEDE’14).2014. doi: 10.1145/2616498.2616528.

Bibliography 59
[20] Katriel Cohn-Gordon, Cas Cremers, Benjamin Dowling, Luke Garratt, andDouglas Stebila. “A Formal Security Analysis of the Signal Messaging Pro-tocol.” In: 2017 IEEE European Symposium on Security and Privacy (EuroS P).April. 2017, pp. 451–466. doi: 10.1109/EuroSP.2017.27.
[21] Christian Collberg and Todd A. Proebsting. “Repeatability in ComputerSystems Research.” In: Communications of the ACM 59.3 (Feb. 2016), pp. 62–69. doi: 10.1145/2812803.
[22] Heather Crawford, Karen Renaud, and Tim Storer. “A framework for con-tinuous, transparent mobile device authentication.” In: Computers & Security39.Part B (2013), pp. 127–136. doi: 10.1016/j.cose.2013.05.005.
[23] Sarat C. Dass, Karthik Nandakumar, and Anil K. Jain. “A Principled Ap-proach to Score Level Fusion in Multimodal Biometric Systems.” In: Inter-national Conference on Audio- and Video-Based Biometric Person Authentication(AVBPA’05). Springer, 2005, pp. 1049–1058.
[24] Yale Law School Roundtable on Data and Code Sharing. “Reproducible Re-search: Addressing the Need for Data and Code Sharing in ComputationalScience.” In: Computing in Science & Engineering 12 (2010), pp. 8–12. doi:10.1109/MCSE.2010.113.
[25] New York City Police Department. NYPD Complaint Data Historic dataset.2016. url: https : / / data . cityofnewyork . us / Public - Safety / NYPD -
Complaint-Data-Historic/qgea-i56i.
[26] United Nations Office on Drugs and Crime. Crime and Criminal Justice Statis-tics. 2018. url: https://data.unodc.org.
[27] Nathan Eagle and Alex (Sandy) Pentland. “Reality Mining: Sensing Com-plex Social Systems.” In: Personal Ubiquitous Computing 10.4 (Mar. 2006),pp. 255–268. doi: 10.1007/s00779-005-0046-3.
[28] Serge Egelman, Sakshi Jain, Rebecca S. Portnoff, Kerwell Liao, Sunny Con-solvo, and David Wagner. “Are You Ready to Lock?” In: Proceedings ofthe 2014 ACM SIGSAC Conference on Computer and Communications Security(CCS’14) (2014), pp. 750–761. doi: 10.1145/2660267.2660273.
[29] Nasif Ekiz and Paul D. Amer. “Transport layer reneging.” In: Computer Com-munications 52 (2014), pp. 82–88. doi: 10.1016/j.comcom.2014.05.009.
[30] Council of European Union. Directive (EU) 2015/2366. 2015. url: https :
//eur-lex.europa.eu/legal-content/en/TXT/?uri=CELEX:32015L2366.
[31] Hossein Falaki, Ratul Mahajan, Srikanth Kandula, Dimitrios Lymberopou-los, Ramesh Govindan, and Deborah Estrin. “Diversity in Smartphone Us-age.” In: Proceedings of the 8th international conference on Mobile systems, appli-cations, and services (MobiSys’10) (2010), pp. 179–194. doi: 10.1145/1814433.1814453.
[32] A. Annis Fathima, S. Vasuhi, N. T. Babu, V. Vaidehi, and Teena Mary Treesa.“Fusion Framework for Multimodal Biometric Person Authentication Sys-tem.” In: IAENG International Journal of Computer Science 41.1 (2014).

60 Bibliography
[33] Marcus Felson and Erika Poulsen. “Simple indicators of crime by time ofday.” In: International Journal of Forecasting 19 (2003), pp. 595–601. doi: 10.1016/S0169-2070(03)00093-1.
[34] Adam R. Ferguson, Jessica L. Nielson, Melissa H. Cragin, Anita E. Bandrow-ski, and Maryann E. Martone. “Big data from small data: data-sharing in the’long tail’ of neuroscience.” In: Nature Neuroscience 17.11 (2014), pp. 1442–1447. doi: 10.1038/nn.3838.
[35] J. Fierrez-Aguilar, J. Ortega-Garcia, D. Garcia-Romero, and J. Gonzalez-Rodriguez. “A Comparative Evaluation of Fusion Strategies for MultimodalBiometric Verification.” In: Audio- and Video-Based Biometric Person Authenti-cation (AVBPA’03). Ed. by Gerhard Goos, Juris Hartmanis, Jan van Leeuwen,Josef Kittler, and Mark S. Nixon. Vol. 2688. Springer Berlin Heidelberg, 2003,pp. 830–837. doi: 10.1007/3-540-44887-X_96.
[36] Findling, Rainhard D. and Rene Mayrhofer. “Towards Pan Shot Face Un-lock: Using Biometric Face Information from Different Perspectives to Un-lock Mobile Devices.” In: International Journal of Pervasive Computing andCommunications 9.3 (2013), pp. 190–208. doi: 10.1108/IJPCC-05-2013-0012.
[37] Rainhard D. Findling. “Unobtrusive Mutual Mobile Authentication withBiometrics and Mobile Device Motion.” PhD thesis. Oct. 2017.
[38] Rainhard D. Findling, Daniel Hintze, Muhammad Muaaz, and René Mayr-hofer. Prototypical Implementation and Demonstration of Multiple Multi-ChannelDevice Authentication Protocols Using Embedded Sensors on Various Off-the-shelfMobile Phones. Technical Report. University of Applied Sciences Upper Aus-tria, JR-Center u’smile, 2014.
[39] Rainhard D. Findling, Michael Hölzl, and René Mayrhofer. “Mobile Match-on-Card Authentication Using Offline-Simplified Models with Gait andFace Biometrics.” In: IEEE Transactions on Mobile Computing 17.11 (Nov. 2018),pp. 2578–2590. doi: 10.1109/TMC.2018.2812883.
[40] Rainhard D. Findling, Muhammad Muaaz, Daniel Hintze, and René Mayr-hofer. “ShakeUnlock: Securely Unlock Mobile Devices by Shaking themTogether.” In: Proceedings of the 12th International Conference on Advances inMobile Computing and Multimedia (MoMM’12) (2014), pages 165–174.
[41] Rainhard D. Findling, Muhammad Muaaz, Daniel Hintze, and René Mayr-hofer. “ShakeUnlock: Securely Transfer Authentication States Between Mo-bile Devices.” In: IEEE Transactions on Mobile Computing 16.4 (2017), pp. 1163–1175. doi: 10.1109/TMC.2016.2582489.
[42] Ronald A. Fisher. Statistical Methods for Research Workers. Edinburgh Oliver& Boyd, 1925.
[43] Sergey Fomel and Jon F. Claerbout. “Guest Editors’ Introduction: Repro-ducible Research.” In: Computing in Science & Engineering 11 (1 2008), pp. 5–7. doi: 10.1109/MCSE.2009.14.
[44] Suneet Narula Garg, Renu Vig, and Savita Gupta. “A Survey on DifferentLevels of Fusion in Multimodal Biometrics.” In: Indian Journal of Science andTechnology 10.44 (2017). doi: 10.17485/ijst/2017/v10i44/120575.
Bibliography 61
[45] Google. Connect your Android phone to your Chromebook. url: https : / /
support.google.com/chromebook/answer/9094445?hl=en.
[46] Samuel W. Greenhouse and Seymour Geisser. “On methods in the analysisof profile data.” In: Psychometrika 24.2 (June 1959), pp. 95–112. doi: 10.1007/BF02289823.
[47] Robert L. Grossman, Yunhong Gu, Joe Mambretti, Michal Sabala, Alex Sza-lay, and Kevin White. “An overview of the Open Science Data Cloud.” In:Proceedings of the 19th ACM International Symposium on High Performance Dis-tributed Computing (HPDC’10) (2010), pp. 377–384. doi: 10.1145/1851476.1851533.
[48] Nazirah Abd Hamid, Suhailan Safei, Siti Dhalila Mohd Satar, SuriayatiChuprat, and Rabiah Ahmad. “Mouse Movement Behavioral Biometric Sys-tems.” In: 2011 International Conference on User Science and Engineering (i-USEr). Nov. 2011, pp. 206–211. doi: 10.1109/iUSEr.2011.6150566.
[49] Brooks Hanson, Andrew M. Sugden, and Bruce M. Alberts. “Making DataMaximally Available.” In: Science 331 (6018 2011), p. 649. doi: 10.1126/science.1203354.
[50] Marian Harbach, Alexander De Luca, Nathan Malkin, and Serge Egelman.“Keep on Lockin’ in the Free World: A Multi-National Comparison of Smart-phone Locking.” In: Proceedings of the 2016 CHI Conference on Human Factorsin Computing Systems (CHI’16) (2016), pp. 4823–4827. doi: 10.1145/2858036.2858273.
[51] Marian Harbach, Emanuel Von Zezschwitz, Andreas Fichtner, AlexanderDe Luca, and Matthew Smith. “It’s a Hard Lock Life: A Field Study ofSmartphone (Un) Locking Behavior and Risk Perception.” In: Symposium onUsable Privacy and Security (SOUPS’14) (2014), pp. 213–230.
[52] Avinatan Hassidim, Yossi Matias, Moti Yung, and Alon Ziv. Ephemeral Iden-tifiers: Mitigating Tracking & Spoofing Threats to BLE Beacons. Technical Report.Google, 2016, pp. 1–11. url: https://developers.google.com/beacons/eddystone-eid-preprint.pdf.
[53] Eiji Hayashi, Sauvik Das, Shahriyar Amini, Jason I. Hong, and Ian Oakley.“CASA: Context-Aware Scalable Authentication.” In: Proceedings of the NinthSymposium on Usable Privacy and Security (SOUPS’13). 3. 2013. doi: 10.1145/2501604.2501607.
[54] Eiji Hayashi and Jason Hong. “A Diary Study of Password Usage in DailyLife.” In: Proceedings of the SIGCHI Conference on Human Factors in ComputingSystems (CHI’11) (2011), pp. 2627–2630. doi: 10.1145/1978942.1979326.
[55] Mingxing He, Shi-Jinn Horng, Pingzhi Fan, Ray-Shine Run, Rong-Jian Chen,Jui-Lin Lai, Muhammad Khurram Khan, and Kevin Octavius Sentosa. “Per-formance evaluation of score level fusion in multimodal biometric systems.”en. In: Pattern Recognition 43.5 (May 2010), pp. 1789–1800. doi: 10.1016/j.patcog.2009.11.018.
62 Bibliography
[56] National Institutes of Health. Final NIH Statement on Sharing Research Data.2003. url: http://grants.nih.gov/grants/guide/notice-files/NOT-OD-03-032.html.
[57] Allison P. Heath, Matthew Greenway, Raymond Powell, Jonathan Spring,Rafael Suarez, David Hanley, Chai Bandlamudi, Megan E. McNerney, KevinP. White, and Robert L Grossman. “Bionimbus: a cloud for managing, ana-lyzing and sharing large genomics datasets.” In: Journal of the American Med-ical Informatics Association 21.6 (2014), pp. 969–975. doi: 10.1136/amiajnl-2013-002155.
[58] Amir Herzberg and Haya Shulman. “Vulnerable Delegation of DNS Resolu-tion.” In: European Symposium on Research in Computer Security (ESORICS’13)8134 (2013), pp. 219–236. doi: 10.1007/978-3-642-40203-6_13.
[59] Daniel Hintze. “Towards Transparent Multi-Device-Authentication.” In: Ad-junct Proceedings of the 2015 ACM International Joint Conference on Pervasiveand Ubiquitous Computing (UbiComp’15 Adjunct). 2015, pp. 435–440. doi: 10.1145/2800835.2801644.
[60] Daniel Hintze, Rainhard D. Findling, Muhammad Muaaz, Eckhard Koch,and René Mayrhofer. “CORMORANT: Towards Continuous Risk-AwareMulti-Modal Cross-Device Authentication.” In: Adjunct Proceedings of the2015 ACM International Joint Conference on Pervasive and Ubiquitous Com-puting (UbiComp’15 Adjunct) (2015), pp. 169–172. doi: 10.1145/2800835.2800906.
[61] Daniel Hintze, Rainhard D. Findling, Muhammad Muaaz, Sebastian Scholz,and René Mayrhofer. “Diversity in Locked and Unlocked Mobile Device Us-age.” In: Adjunct Proceedings of the 2014 ACM International Joint Conference onPervasive and Ubiquitous Computing (UbiComp’14 Adjunct). 2014, pp. 379–384.doi: 10.1145/2638728.2641697.
[62] Daniel Hintze, Rainhard D. Findling, Sebastian Scholz, and René Mayrhofer.“Mobile Device Usage Characteristics: The Effect of Context and Form Fac-tor on Locked and Unlocked Usage.” In: Proceedings of the 12th InternationalConference on Advances in Mobile Computing and Multimedia (MoMM’14). 2014,pp. 105–114. doi: 10.1145/2684103.2684156.
[63] Daniel Hintze, Matthias Füller, Sebastian Scholz, Rainhard D. Findling,Muhammad Muaaz, Philipp Kapfer, Eckhard Koch, and René Mayrhofer.“CORMORANT: Ubiquitous Risk-Aware Multi-Modal Biometric Authenti-cation across Mobile Devices.” In: Proceedings of the ACM on Interactive, Mo-bile, Wearable and Ubiquitous Technologies (IMWUT) 3.85 (3 2019). doi: 10.1145/3351243.
[64] Daniel Hintze, Matthias Füller, Sebastian Scholz, Rainhard D. Findling,Muhammad Muaaz, Philipp Kapfer, Wilhelm Nüßer, and René Mayrhofer.“CORMORANT: On Implementing Risk-Aware Multi-Modal Biometric Cross-Device Authentication For Android.” In: Proceedings of the 17th InternationalConference on Advances in Mobile Computing and Multimedia (MoMM’19). Ac-cepted for publication, pp. 1–10.

Bibliography 63
[65] Daniel Hintze, Philipp Hintze, Rainhard D. Findling, and René Mayrhofer.“A Large-Scale, Long-Term Analysis of Mobile Device Usage Characteris-tics.” In: Proceedings of the ACM on Interactive, Mobile, Wearable and UbiquitousTechnologies (IMWUT) 1.13 (2 2017). doi: 10.1145/3090078.
[66] Daniel Hintze, Dominik Mähl, and Willi Nüsser. “Softwareverteilung mitKipeto [Software Deployment using Kipeto].” In: JavaSPEKTRUM (Apr. 2011).
[67] Daniel Hintze, Muhammad Muaaz, Rainhard D. Findling, Sebastian Scholz,Eckhard Koch, and René Mayrhofer. “Confidence and Risk Estimation Plug-ins for Multi-Modal Authentication on Mobile Devices using CORMORANT.”In: Proceedings of the 13th International Conference on Advances in Mobile Com-puting and Multimedia (MoMM’15). 2015, pp. 384–388. doi: 10.1145/2837126.2843845.
[68] Daniel Hintze and Andrew Rice. “Picky: Efficient and Reproducible Shar-ing of Large Datasets Using Merkle-Trees.” In: 2016 IEEE 24th InternationalSymposium on Modeling, Analysis and Simulation of Computer and Telecommu-nication Systems (MASCOTS’16) (2016), pp. 30–38. doi: 10.1109/MASCOTS.2016.25.
[69] Daniel Hintze, Sebastian Scholz, Eckhard Koch, and René Mayrhofer. “Lo-cation-based Risk Assessment for Mobile Authentication.” In: Adjunct Pro-ceedings of the 2016 ACM International Joint Conference on Pervasive and Ubiq-uitous Computing (UbiComp’16 Adjunct). 2016, pp. 85–88. doi: 10 . 1145 /
2968219.2971448.
[70] Christopher G. Hocking, Steven M. Furnell, Nathan L. Clarke, and Paul L.Reynolds. “Authentication Aura - A distributed approach to user authenti-cation.” In: Information Assurance and Security 6.2 (2011), pp. 149–156.
[71] Troy Hunt. Have i been pwned dataset. url: https://haveibeenpwned.com/Passwords.
[72] Adam Hurkala and Jaroslaw Hurkala. “Architecture of Context-Risk-AwareAuthentication System for Web Environments.” In: The Third InternationalConference on Informatics Engineering and Information Science (ICIEIS’14) (2014),pp. 219–228.
[73] Anil Jain, Karthik Nandakumar, and Arun Ross. “Score Normalization inMultimodal Biometric Systems.” In: Pattern Recognition 38.12 (2005), pp. 2270–2285. doi: 10.1016/j.patcog.2005.01.012.
[74] Markus Jakobsson, Elaine Shi, Philippe Golle, and Richard Chow. “ImplicitAuthentication for Mobile Devices.” In: Proceedings of the 4th USENIX con-ference on Hot topics in security (HotSec’09) (2009), p. 9.
[75] Borja Jiménez. “Modeling of Mobile End-User Context.” PhD thesis. HelsinkiUniversity of Technology, 2008.
[76] Philipp Kapfer. “PhonyKeyboard: Sensor-enhanced Keystroke DynamicsAuthentication on Mobile Devices.” Master’s Thesis. Johannes Kepler Uni-versity Linz, 2016.
64 Bibliography
[77] P. Kartik, R. V. S. S. Vara Prasad, and S. R. Mahadeva Prasanna. “NoiseRobust Multimodal Biometric Person Authentication System using Face,Speech and Signature Features.” In: 2008 Annual IEEE India Conference. Vol. 1.Dec. 2008, pp. 23–27. doi: 10.1109/INDCON.2008.4768795.
[78] Jan Krissler. Hacker fakes German minister’s fingerprints using photos of herhands. 2016. url: https://jankrissler.blogspot.com/2016/09/hacker-fakes-german-ministers.html.
[79] Morgan G. Langille and Jonathan A. Eisen. “BioTorrents: A File SharingService for Scientific Data.” In: PLoS ONE 5.4 (2010), pp. 1–5. doi: 10.1371/journal.pone.0010071.
[80] Arash Habibi Lashkari, Samaneh Farmand, Omar Bin Zakaria, and RosliSaleh. “Shoulder Surfing attack in graphical password authentication.” In:International Journal of Computer Science and Information Security (IJCSIS) 6.2(2009).
[81] Changhyun Lee, D. K. Lee, and Sue Moon. “Unmasking the Growing UDPTraffic in a Campus Network.” In: International Conference on Passive andActive Network Measurement (PAM’12) (2012), pp. 1–10. doi: 10.1007/978-3-642-28537-0_1.
[82] Randall J. LeVeque, Ian M. Mitchell, and Victoria Stodden. “ReproducibleResearch for Scientific Computing: Tools and Strategies for Changing theCulture.” In: Computing in Science & Engineering 14 (4 2012), pp. 13–17.
[83] Chuang Ma, Hao Helen Zhang, and Xiangfeng Wang. “Machine learningfor Big Data analytics in plants.” In: Trends in Plant Science 19.12 (2014),pp. 798–808. doi: 10.1016/j.tplants.2014.08.004.
[84] Juan P. Madrid and Duccio Macchetto. “High-Impact Astronomical Obser-vatories.” In: Bulletin of the American Astronomical Society. Vol. 41. Jan. 2009,pp. 913–914.
[85] Eric Malmi. “Quality Matters: Usage-Based App Popularity Prediction.” In:Adjunct Proceedings of the 2014 ACM International Joint Conference on Pervasiveand Ubiquitous Computing (UbiComp’14 Adjunct). 2014, pp. 391–396.
[86] Gonçalo M. Marques and Rui Pitarma. “Smartphone Application for En-hanced Indoor Health Environments.” In: Journal of Information Systems En-gineering & Management 1.4 (2016), pp. 1–9. doi: 10.20897/lectito.201649.
[87] John W. Mauchly. “Significance Test for Sphericity of a Normal n-VariateDistribution.” In: The Annals of Mathematical Statistics 11.2 (June 1940), pp. 204–209. doi: 10.1214/aoms/1177731915.
[88] Donald E. Maurer and John P. Baker. “Fusing multimodal biometrics withquality estimates via a Bayesian belief network.” In: Pattern Recognition. PartSpecial issue: Feature Generation and Machine Learning for Robust Multi-modal Biometrics 41.3 (Mar. 2008), pp. 821–832. doi: 10.1016/j.patcog.2007.08.008.
[89] René Mayrhofer, Jeffrey Vander Stoep, Chad Brubaker, and Nick Kralevich.“The Android Platform Security Model.” In: Computing Research Repositoryabs/1904.05572 (2019). arXiv: 1904.05572.
Bibliography 65
[90] René Mayrhofer, Edgar Weippl, Damjan Buhov, Rainhard D. Findling, DanielHintze, Michael Hölzl, Georg Merzdovnik, Muhammad Muaaz, and MichaelRoland. User-friendly Secure Mobile Environments (Final Report for JRC u’smile).Technical Report. University of Applied Sciences Upper Austria, JR-Centeru’smile, 2017.
[91] Mark R. Meiss, Filippo Menczer, Santo Fortunato, Alessandro Flammini,and Alessandro Vespignani. “Ranking Web Sites with Real User Traffic.” In:Proceedings of the 2008 International Conference on Web Search and Data Mining(WSDM’08) (2008), pp. 65–76. doi: 10.1145/1341531.1341543.
[92] Ralph C. Merkle. “A Digital Signature Based on a Conventional EncryptionFunction.” In: Lecture Notes in Computer Science 293 (1987), pp. 369–378.doi: 10.1007/3-540-48184-2_32.
[93] Signal Messenger. Facebook Messenger deploys Signal Protocol for end-to-endencryption. 2016. url: https://signal.org/blog/facebook-messenger.
[94] Signal Messenger. Open Whisper Systems partners with Google on end-to-endencryption for Allo. 2016. url: https://signal.org/blog/allo/.
[95] Signal Messenger. WhatsApp’s Signal Protocol integration is now complete. 2016.url: https://signal.org/blog/whatsapp-complete.
[96] Signal Messenger. Signal partners with Microsoft to bring end-to-end encryptionto Skype. 2018. url: https://signal.org/blog/skype-partnership/.
[97] Vishwath Mohan. Better Biometrics in Android P. June 2018. url: https://security.googleblog.com/2018/06/better- biometrics- in- android-
p.html.
[98] M. Muaaz and R. Mayrhofer. “Smartphone-Based Gait Recognition: FromAuthentication to Imitation.” In: IEEE Transactions on Mobile Computing 16.11(Nov. 2017), pp. 3209–3221. doi: 10.1109/TMC.2017.2686855.
[99] Muhammad Muaaz and Rene Mayrhofer. “Orientation Independent CellPhone Based Gait Authentication.” In: Proceedings of the 12th InternationalConference on Advances in Mobile Computing and Multimedia (MoMM’14) (2014).
[100] Milton L. Mueller and Hadi Asghari. “Deep packet inspection and band-width management: Battles over BitTorrent in Canada and the United States.”In: Telecommunications Policy 36.6 (2012), pp. 462–475. doi: 10 . 1016 / j .
telpol.2012.04.003.
[101] Ildar Muslukhov, Y. Boshmaf, Cynthia Kuo, Jonathan Lester, and K. Beznosov.“Know Your Enemy: The Risk of Unauthorized Access in Smartphonesby Insiders.” In: Proceedings of the 15th International Conference on Human-Computer Interaction with Mobile Devices and Services (MobileHCI’13) (2013),pp. 271–280. doi: 10.1145/2493190.2493223.
[102] Satoshi Nakamoto. Bitcoin: A Peer-to-Peer Electronic Cash System. 2009. url:http://www.bitcoin.org/bitcoin.pdf.
[103] Karthik Nandakumar, Yi Chen, Sarat C. Dass, and Anil Jain. “Likelihoodratio-based biometric score fusion.” In: IEEE transactions on pattern analysisand machine intelligence 30.2 (2008), pp. 342–347.

66 Bibliography
[104] Claudia Nickel. “Accelerometer-based Biometric Gait Recognition for Au-thentication on Smartphones.” PhD thesis. TU Darmstadt, June 2012.
[105] Earl Oliver. “The Challenges in Large-Scale Smartphone User Studies.” In:Proceedings of the 2nd ACM International Workshop on Hot Topics in Planet-scaleMeasurement (HotPlanet’10) (2010), pp. 1–5. doi: 10.1145/1834616.1834623.
[106] Antti Oulasvirta, Tye Rattenbury, Lingyi Ma, and Eeva Raita. “Habits makesmartphone use more pervasive.” In: Personal and Ubiquitous Computing 16.1(June 2011), pp. 105–114. doi: 10.1007/s00779-011-0412-2.
[107] Roger D. Peng. “Reproducible Research in Computational Science.” In: Sci-ence 334.6060 (2011), pp. 1226–1227. doi: 10.1126/science.1213847. eprint:https://science.sciencemag.org/content/334/6060/1226.full.pdf.
[108] Charlie Pinder, Russell Beale, and Robert J Hendley. “Accept the Banana: Ex-ploring Incidental Cognitive Bias Modification Techniques on Smartphones.”In: CHI Extended Abstracts on Human Factors in Computing Systems (2016),pp. 2923–2931. doi: 10.1145/2851581.2892453.
[109] Heather A. Piwowar and Wendy W Chapman. “A Review of Journal Poli-cies for Sharing Research Data.” In: Proceedings of the 12th International Con-ference on Electronic Publishing (ELPUB’08) June (2008), pp. 1–14. doi: 10.1038/npre.2008.1701.1.
[110] Norman Poh and Josef Kittler. “A Unified Framework for Biometric ExpertFusion Incorporating Quality Measures.” In: IEEE Transactions on PatternAnalysis and Machine Intelligence 34.1 (Jan. 2012), pp. 3–18. doi: 10.1109/TPAMI.2011.102.
[111] Russell A. Poldrack and Krzysztof J. Gorgolewski. “Making big data open:data sharing in neuroimaging.” In: Nature Neuroscience 17.11 (2014), pp. 1510–1517. doi: 10.1038/nn.3818.
[112] Consumer Reports. Smart phone thefts rose to 3.1 million in 2013. 2014. url:https://www.consumerreports.org/cro/news/2014/04/smart- phone-
thefts-rose-to-3-1-million-last-year/index.htm.
[113] Douglas A. Reynolds, Thomas F. Quatieri, and Robert B. Dunn. “SpeakerVerification Using Adapted Gaussian Mixture Models.” In: Digital SignalProcessing 10.1-3 (2000), pp. 19–41. doi: https://doi.org/10.1006/dspr.1999.0361.
[114] Andrew Rice and Alastair R. Beresford. “The Device Analyzer Competi-tion.” In: Adjunct Proceedings of the 2014 ACM International Joint Conferenceon Pervasive and Ubiquitous Computing (UbiComp’14 Adjunct). 2014, pp. 403–407. doi: 10.1145/2638728.2641696.
[115] Oriana Riva, Chuan Qin, and Karin Strauss. “Progressive Authentication:Deciding When to Authenticate on Mobile Phones.” In: Proceedings of the21th USENIX Security Symposium (2011), pp. 301–316.
[116] Arun Ross and Anil K. Jain. “Multimodal Biometrics: An Overview.” In:12th European Signal Processing Conference September (2004), pp. 1221–1224.
Bibliography 67
[117] Conrad Sanderson and Kuldip K. Paliwal. Information Fusion and Person Ver-ification Using Speech and Face Information. Research Paper IDIAP-RR. 2002,pp. 02–33.
[118] Priti Sanjekar and Jayantrao Patil. “An Overview of Multimodal Biomet-rics.” In: Signal & Image Processing: An International Journal (SIPIJ) 4.1 (Feb.2013), pp. 57–64. doi: 10.5121/sipij.2013.4105.
[119] Maxim V. Shapovalov, Adrian A. Canutescu, and Roland L. Dunbrack. “Bio-Downloader: Bioinformatics downloads and updates in a few clicks.” In:Bioinformatics 23.11 (2007), pp. 1437–1439. doi: 10.1093/bioinformatics/btm120.
[120] Sumit Shekhar, Vishal M. Patel, Nasser M. Nasrabadi, and Rama Chellappa.“Joint Sparse Representation for Robust Multimodal Biometrics Recogni-tion.” In: IEEE Transactions on Pattern Analysis and Machine Intelligence 36.1(Jan. 2014), pp. 113–126. doi: 10.1109/TPAMI.2013.109.
[121] Hiew Moi Sim, Hishammuddin Asmuni, Rohayanti Hassan, and Razib M.Othman. “Multimodal biometrics: Weighted score level fusion based onnon-ideal iris and face images.” In: Expert Systems with Applications 41.11(2014), pp. 5390–5404. doi: https://doi.org/10.1016/j.eswa.2014.02.051.
[122] Mridula Singh, Patrick Leu, AbdelRahman Abdou, and Srdjan Capkun.“UWB-ED: Distance Enlargement Attack Detection in Ultra-Wideband.” In:28th USENIX Security Symposium (USENIX Security 19). USENIX Associa-tion, Aug. 2019, pp. 73–88.
[123] Husnjak Siniša, Perakovic Dragan, and Cvitic Ivan. “Relevant Affect Factorsof Smartphone Mobile Data Traffic.” In: Promet – Traffic & Transportation 28.4(2016), pp. 435–444. doi: 10.7307/ptt.v28i4.2091.
[124] Adam Skillen, David Barrera, and Paul C. van Oorschot. “Deadbolt: Lock-ing Down Android Disk Encryption.” In: Proceedings of the Third ACM Work-shop on Security and Privacy in Smartphones & Mobile Devices (SPSM’13) (2013),pp. 3–14. doi: 10.1145/2516760.2516771.
[125] Tapio Soikkeli. “The Effect of Context on Smartphone Usage Sessions.” Mas-ter’s Thesis. Aalto University School of Science, 2011.
[126] Frank Stajano. “Pico: No more passwords!” In: International Workshop onSecurity Protocols (2011), pp. 49–81.
[127] Open Whisper Systems. Signal Specification. 2018. url: https://signal.org/docs/.
[128] Jiayao Tan, Xiaoliang Wang, Cam-Tu Nguyen, and Yu Shi. “SilentKey: ANew Authentication Framework through Ultrasonic-based Lip Reading.”In: Proceedings of the ACM on Interactive, Mobile, Wearable and Ubiquitous Tech-nologies (IMWUT) 2 (2018), pp. 1–18. doi: 10.1145/3191768.
[129] Andrew S Tanenbaum. Computer Networks. 5th. Prentice Hall ProfessionalTechnical Reference, 1996, pp. 349–351. doi: 10.1016/j.comnet.2008.04.002.
68 Bibliography
[130] The CAIDA UCSD Anonymized Internet Traces 2014. url: http://www.caida.org/data/passive/passive_2014_dataset.xml.
[131] Nils Ole Tippenhauer, Heinrich Luecken, Marc Kuhn, and Srdjan Capkun.“UWB Rapid-bit-exchange System for Distance Bounding.” In: Proceedings ofthe 8th ACM Conference on Security & Privacy in Wireless and Mobile Networks(WiSec’15). 2015, 2:1–2:12. doi: 10.1145/2766498.2766504.
[132] Khai N. Truong, Thariq Shihipar, and Daniel J. Wigdor. “Slide to X: Unlock-ing the Potential of Smartphone Unlocking.” In: In Proceedings of the SIGCHIConference on Human Factors in Computing Systems (CHI’14). 2014, pp. 3635–3644. doi: 10.1145/2556288.2557044.
[133] John W. Tukey. “Comparing Individual Means in the Analysis of Variance.”In: Biometrics 5.2 (1949), pp. 99–114.
[134] Hannu Verkasalo. “Contextual patterns in mobile service usage.” In: Per-sonal and Ubiquitous Computing 13.5 (Mar. 2008), pp. 331–342. doi: 10.1007/s00779-008-0197-0.
[135] Daniel T. Wagner, Andrew Rice, and Alastair R. Beresford. “Device Ana-lyzer: Understanding smartphone usage.” In: 10th International Conferenceon Mobile and Ubiquitous Systems: Computing, Networking and Services (Mo-biQuitous’13). 2013. doi: 10.1007/978-3-319-11569-6_16.
[136] Daniel T. Wagner, Andrew Rice, and Alastair R. Beresford. “Device An-alyzer: Large-scale Mobile Data Collection.” In: SIGMETRICS PerformanceEvaluation Review 41.4 (Apr. 2014), pp. 53–56. doi: 10.1145/2627534.2627553.
[137] F. Wang and J. Han. “Multimodal biometric authentication based on scorelevel fusion using support vector machine.” In: Opto-Electronics Review 17.1(Jan. 2009), pp. 59–64. doi: 10.2478/s11772-008-0054-8.
[138] Lei Wang, Kang Huang, Ke Sun, Wei Wang, Chen Tian, Lei Xie, and QingGu. “Unlock with Your Heart: Heartbeat-based Authentication on Commer-cial Mobile Phones.” In: Proceedings of the ACM on Interactive, Mobile, Wear-able and Ubiquitous Technologies (IMWUT) 2.3 (Sept. 2018), 140:1–140:22. doi:10.1145/3264950.
[139] Yunhong Wang, Tieniu Tan, and Anil K. Jain. “Combining Face and Iris Bio-metrics for Identity Verification.” In: Proceedings of the 4th International Con-ference on Audio- and Video-based Biometric Person Authentication (AVBPA’03).2003, pp. 805–813.
[140] Mark Weiser. “The Computer for the 21st Century.” In: Scientific American265.3 (1991), pp. 94–104.
[141] Evan Welbourne and Emmanuel Munguia Tapia. “CrowdSignals: A Callto Crowdfund the Community’s Largest Mobile Dataset.” In: Proceedingsof the 2014 ACM International Joint Conference on Pervasive and UbiquitousComputing: Adjunct Publication (UbiComp’14 Adjunct). 2014, pp. 873–877. doi:10.1145/2638728.2641309.
[142] Scott Wright. The Symantec Smartphone Honey Stick Project. 2012. url: http://www.symantec.com/content/en/us/about/presskits/b- symantec-
smartphone-honey-stick-project.en-us.pdf.

Bibliography 69
[143] Jeff Yan, Alan Blackwells, Ross Anderson, and Alasdair Grant. “PasswordMemorability and Security: Empirical Results.” In: IEEE Security & Privacy2.5 (2004), pp. 25–31. doi: 10.1109/MSP.2004.81.
[144] Yafei Yang, Lu Xiao, Yongjin Kim, and David Julian. “Case Study: TrustEstablishment in Personal Area Networks.” In: Proceedings of the 4th Interna-tional Symposium on Wireless Pervasive Computing (ISWPC’09) (2009), pp. 1–5.doi: 10.1109/ISWPC.2009.4800572.
[145] Emanuel von Zezschwitz, Alexander De Luca, Philipp Janssen, and Hein-rich Hussmann. “Easy to Draw, but Hard to Trace?: On the Observability ofGrid-based (Un)Lock Patterns.” In: Proceedings of the 33rd Annual ACM Con-ference on Human Factors in Computing Systems (CHI’15). 2015, pp. 2339–2342.doi: 10.1145/2702123.2702202.
[146] Emanuel von Zezschwitz, Paul Dunphy, and Alexander De Luca. “Patternsin the Wild: A Field Study of the Usability of Pattern and PIN-based Au-thentication on Mobile Devices.” In: Proceedings of the 15th International Con-ference on Human-Computer Interaction with Mobile Devices and Services (Mo-bileHCI’13) (2013), pp. 261–270.
[147] Min Zhang, Maurizio Dusi, Wolfgang John, and Changjia Chen. “Analysisof UDP Traffic Usage on Internet Backbone Links.” In: 2009 Ninth AnnualInternational Symposium on Applications and the Internet (2009), pp. 280–281.doi: 10.1109/SAINT.2009.65.


Part II
C O N S T I T U E N T P U B L I C AT I O N S

8E F F I C I E N T A N D R E P R O D U C I B L E S H A R I N G O F L A R G ED ATA S E T S
The following paper has been published as:
Publication
Title Picky: Efficient and Reproducible Sharing of LargeDatasets Using Merkle-Trees
Authors Daniel Hintze and Andrew Rice
Proceedings 2016 IEEE 24th International Symposium on Modeling,Analysis and Simulation of Computer and Telecommuni-cation Systems (MASCOTS’16), p. 30–38
Acceptance rate 15%
Candidate’s Contribution
Contribution The candidate designed and implemented the proposedsystem, conducted the evaluation, and interpreted the re-sults. He wrote the manuscript, acted as correspondingauthor and presented the results during the 2016 IEEE24th International Symposium on Modeling, Analysis andSimulation of Computer and Telecommunication Systems(MASCOTS’16) on the 19th September 2016 in London,United Kingdom.
Overall percentage 90%
Co-Authors
By signing, each co-author certifies that the candidate’s stated contribution to thepublication is accurate (as detailed above); permission is granted for the candidateto include the publication his doctoral thesis; and that the sum of all co-authorcontributions is equal to 100% less the candidate’s stated contribution.
Exclu
ded
Andrew Rice
© 2016 Copyright held IEEE.Included with permission by the publisher.https://doi.org/10.1109/MASCOTS.2016.25
73


Picky: Efficient and Reproducible Sharing of LargeDatasets using Merkle-Trees
Daniel HintzeFHDW University of Applied Sciences
Furstenallee 3 - 533102 Paderborn, Germany
Email: [email protected]
Andrew RiceComputer Laboratory
University of Cambridge15 JJ Thomson Ave., Cambridge, CB3 0FD, UK
Email: [email protected]
Abstract—There is growing demand for researchers to sharedatasets in order to allow others to reproduce results or in-vestigate new questions. The most common option is to simplydeposit the data online in its entirety. However, this mechanismof distribution becomes impractical as the size of the datasetincreases or if the dataset is frequently changing as new data iscollected. In this paper we describe P I C K Y, a new Merkle treebased system for sharing large datasets which allows users todownload selected portions and to receive incremental updates.We demonstrate the viability of our approach by quantifying itsbenefit when applied to a number of large datasets used in thenetworking and measurement community.
I . I N T R O D U C T I O N
The design and performance of computer systems andnetworks is commonly evaluated based on public datasetsof significant size. In general most scientific domains, e. g.genetics [1], neuroscience [2], plant science [3] and computerscience [4] deal with increasing amounts of data from experi-ments and simulations today. Since research is largely publiclyfunded, it has been argued that researchers have an ethicalduty to share scientific data in order to maximize the scientificcontribution and facilitate a broad use of data [5]. Moreover,funding bodies increasingly require data sharing to be anintegral part of research projects [6]. Sharing data not onlyreduces the costs of science [7] and facilitates further research,it is also crucial for validating approaches and repeating resultsin order to improve reproducibility [8]–[10].
Sharing and accessing datasets the size of several terabytesup to petabytes, however, requires significant computationalresources and is thus challenging from a practical point of view,even if researchers are only interested in a small fraction ofthe data. Researchers lacking an adequate institutional infras-tructure or relevant technical skills frequently find it hard toaccess such datasets [11]. Efficient sharing techniques thereforefacilitate access to scientific data for less-well equipped orfunded researchers, making the ability to conduct excellentresearch less of a privilege of economic wealth.
When facing the question of how to make a digital datasetof substantial size available to other researchers, there are fourdifferent approaches to consider: Datasets can be shared offlineby physically transferring storage media [12], which is slowand expensive. Sharing datasets directly through HTTP or FTPdownloads is more common today, hosting data on either an
institutional website or in a data repository. Downloading hugedatasets, however, is cumbersome and error prone. Peer-to-peerapproaches like BitTorrent have been proposed as alternatives[13], [14], but inflict a loss of control on the dataset owner.Finally, cloud processing reverses the process by bringing codeto the data and thus is advisable for very large datasets, butprocessing is more costly and complex compared to otheroptions [15], [16]. In this paper we present the design andevaluation of P I C K Y, a simple yet powerful approach forrepeatable and efficient sharing of large evolving scientificdatasets. The contributions of this paper are as follows:
• We describe a novel data organisation model that fa-cilitates repeatable, verifiable and efficient sharing oflarge datasets, featuring incremental updates and selectivedownloads.
• We show that our approach is beneficial by applying it tothree large datasets from different domains and calculatingthe benefits for a selection of network measurementstudies in the literature. We find that P I C K Y would havesaved researchers between 26% and 93% of network andstorage costs.
I I . R E L AT E D W O R K
Early examples of processing systems that allow certainqueries in multi-dimensional datasets are the Active DataRepository [17] and DataCutter [18], a middleware infras-tructure for processing datasets stored in archival storagesystems across a wide-area network. Co-Sites [19] is an onlineresource management system to facilitate collaboration amonggeographically distributed research sites. Scibox [20] is a cloud-based infrastructure that features data reduction functions tosubset a dataset or perform computations within the cloudrather than locally, but does not feature intra-file subsetting.Another example for cloud-based processing are cloud-basedheterogeneous computing frameworks [21], designed specif-ically for multimedia mining applications, as well as Sectorand Sphere [22], storage and compute clouds that allow user-defined functions within and across data centres. PreDatA [23]is a middleware for preparing and characterizing data whilstbeing produced on a peta-byte scale. Somewhat related to ourlogical data model is the Logical Information Systems as aFile System [24], that enables dynamic information queries on
2016 IEEE 24th International Symposium on Modeling, Analysis and Simulation of Computer and Telecommunication Systems
2375-0227/16 $31.00 © 2016 IEEE
DOI 10.1109/MASCOTS.2016.25
30

intra-file level. We distinguish P I C K Y from distributed versioncontrol systems (such as Git) by its ability to distribute slices(along many dimensions) of a dataset whilst maintaining usefulfunctionality such as versioning and distributing updates.
I I I . L O G I C A L D ATA M O D E L
Since scholars in many cases are only interested in particularaspects of a larger dataset, enabling them to select and down-load only certain subsets saves resources and enables accessto datasets otherwise too large to process using commodityhardware.
To enable selectivity, contextual knowledge about the contentand structure of the dataset is required. Real world scientificdatasets mostly come in form of some file structure. While filescontain the actual content of a dataset, directory structures andfile names are commonly used to encode metadata describingthe content, allowing for selectivity on file level. Files usuallyeither constitute atomic binary data, for instance images, or canbe considered collections of self-contained entries. Examplesare network trace files containing sequences of independentnetwork packets [25] and event logs consisting of eventscapturing, e. g. mobile device usage [4]. Selectivity at the entrylevel is desirable, if only a subset of entries is relevant for aparticular research question, for instance only network trafficto a single UDP port [26] or certain usage events [27].
In order to enable selecting subsets of a dataset not only onfile level but also on entry level in a generic way, a model forassociating metadata with files and entries is necessary. Weexpect these metadata to come in form of key-value attributes,defined and provided by the dataset publisher based on whichdataset consumers are then able select which subset, i. e. whichfiles containing which entries, they wish to download.
I V. P H Y S I C A L D ATA M O D E L
A. Indexing
To prepare a dataset for publication, a repository and anindex file are created based on the original dataset by applyingthe following steps:
1) File Processing: Each file of the dataset is associatedwith a number of dataset-specific attributes in key-value formthat allow users of the dataset to assess the content of the file.In addition, the file’s relative path, filename and timestamp arerecorded in order to restore these attributes on client side.
2) Entry Extraction: Subsequently, each file is split intoone or multiple atomic entries, depending on the file’s content.Entries can be of equal size, separated by a line break ordefined by a binary format (e.g. network packets). Since oursystem therefore can not know how to define entries, thecontent of the file is streamed through a function implementedby the dataset owner to provide associated attributes each timeone entry passes the data stream.
3) Chunk Persistence: Entries are grouped by their set ofattributes into collection of entries called chunks. In additionto the entry data itself each chunk also contains the lengthof the data stored and a sequence id identifying the relativepositioning of the entry within the source file. The content
of a chunk is compressed and written to disk when eitherthe entire file is processed or the size of the compressedentries exceeds a threshold Cmax, in which case an additionalchunk for subsequent entries with the same attribute set iscreated. The file format used to persist chunks starts with aprotocol version to allow future changes, followed by a stringnaming the applied compression algorithm and the length ofthe uncompressed content. Finally, the compressed entries arewritten to the file, as depicted in Figure 1.
Fig. 1. Physical Data Model
4) Repository Storage: Chunks are stored in a repository,which is a form of content addressable storage system (CAS).A repository is basically a file structure, in which blobs, suchas chunks, are stored using a content hash. This approachensures deduplication to save storage and bandwidth whilealso allowing us to verify the integrity of the repository.
5) Dataset Index Structure: All chunks featuring the sameset of attributes constitute a block. A block contains the asso-ciated attributes followed by a list of chunk hashes. If a clientrequests a particular attribute then the blocks containing thatattribute are used to identify the chunks to send to the client.For each file within the dataset, a file reference containingmetadata like name, relative path, timestamp, dataset specificattributes, binary file header and the blocks constituting thefile is added to the index. All file references together form adataset index, which also contains optional metadata describingthe dataset, for instances a short description, an URL pointingto further reading and an icon image. The dataset index iscompressed and stored as a single file in the repository, againusing the hashed content as an identifier. The physical datamodel hence implements a Merkle tree.
To retrieve a dataset index file from the repository, its id,e. g. its hash, is required. To translate from human readablelabels to repository ids, references are created. References are
31

stored alongside the repository and point to a dataset indexfile, being basically a substitution for symlinks, which arenot available on every operating system. Figure 1 outlines thegeneral picture of reference, dataset index and chunks.
B. Patches, Upgrades and Versioning
Existing sharing mechanisms offer limited to no supportfor applying patches and upgrades to published datasets inan efficient way, i. e. without requiring users to download theentire dataset again. There is usually no versioning schemeand so independently reproducing results is hard.
In P I C K Y, these properties are achieved by maintaining asingle repository for different versions of the same or evenmultiple datasets. When a new version of a dataset is tobe published, the indexing procedure is carried out again,reusing the existing repository. Unchanged chunks in thedataset produce identical content hashes as during previousindexing, and are stored only once due to the underlying CASprinciple. Upgrades, i. e., appending new data to existing filesor new files to the dataset, result in new chunks being stored inthe repository. Patches, i. e., changing already published files,only affects the corresponding chunks and not entire files. Forexample, changing a single entry of an arbitrary large file atmost requires clients to download one chunk of size Cmax
rather than the entire file. Entries are deleted by updating theirlength to zero.
Since the dataset index structure implements a Merkle tree,each distinct version of the dataset results in a new index file.Dataset owners would typically create references to each indexfile following some version naming scheme, e. g., using currentdate or incrementing a number. Since multiple references canpoint to the same index file, maintaining a head reference tothe current version is possible. By using the hash to identifya particular index version, users are guaranteed to retrieve anexact copy of the specified version of a dataset, even if it hasbeen altered meanwhile. Hence, this strong versioning schemefacilitates reproducibility of results for datasets under change.
C. Client Access
In order to allow clients to access the dataset, the repositorycontaining the dataset index needs to be made available throughan arbitrary file transfer protocol like HTTP. An obvious choiceis using an off-the-shelf web server such as Nginx or Apacheto deliver the repository as static content. However, filesystem,ftp and ssh access are also available.
A client-side application forms the counterpart of the server-side dataset indexing and enables the selective downloadingand subsequent reconstruction of the dataset. Given a datasetreference, the client resolves the reference and obtains thedataset index file, which contains all information required toselect subsets of the dataset down to file entry level.
D. Example
In this section we illustrate our data model by applying itto a simple sample dataset. It should be noted that in largereal-world datasets, the number of files, blocks, chunks and
entries is multiple orders of magnitude higher (see Table I).The sample dataset contains three small network trace files inpcap format, each containing a pcap header and a number ofTCP and/or UDP packets, as outlined in Figure 2.
Fig. 2. Example dataset containing three network trace files
To create the repository and prepare the dataset for sharing,each file is parsed using an entry parser (usually providedby the dataset publisher). The entry parser yields the pcapheader, file attributes (such as the last modified date) and mostimportantly the number of entries (in this case packets).
Each entry is associated with a number of attributes, namelythe protocol family as well as the destination port. Entriesare prefixed with their relative position within the source file.Entries are grouped by their attributes so that for each uniquecombination of attributes in the source file there exists at leastone chunk file. When the size of a chunk file exceeds Cmax,subsequent entries are written to a new chunk file with thesame attribute set. In our example, we assume the attribute set[TCP, Port 80] in Trace_2.pcap exceeds Cmax. Asa result, the sample dataset is expanded into 9 chunk files asoutlined in Figure 3, each stored using the hash of its contentsas a reference.
Fig. 3. Example dataset chunks
After parsing the entire dataset and creating the chunk files,the dataset structure is written to a single index file. Theindex file contains a logical file entry for each source filein the dataset and metadata such as the description of thedataset. Each logical file entry contains the pcap header of therespective source file, the filename, last modified timestampand any other user-defined metadata. These are followed bya number of blocks, each representing a unique combination
32

of entry attributes. Blocks in turn are basically an orderedcollection of chunk references (hashes of chunk files), asoutlined in Figure 4. Once the index file is assembled, theindexing process is complete and the repository is ready forpublishing.
A client intending to access the dataset first downloadsthe index file to learn the structure of the dataset. Based onthis information, the client is capable of identifying whichchunks are required to reassemble the dataset so that all entriesfeaturing a chosen set of attributes are present. For the sakeof this example, we assume the client is only interested inTCP traffic to port 22 (SSH). Using the index information,the client establishes that two blocks in two files contain thedesired attributes. Knowing which blocks to restore, the clientidentifies all chunk references within these blocks and proceedsto download them. See Figure 5 for an outline of the relevantchunks.
Fig. 4. Example dataset index file
Once all the required chunks have been downloaded, thesubset of the original dataset is reconstructed, and valid pcapfiles are created. Each selected file is created using information
Fig. 5. Chunks containing TCP traffic to port 22
present in the file entry data structure, including the originalbinary file header. Subsequently, entries read from the chunksare sequentially written to the destination files, using therelative sequence id to preserve the original entry order whenreading from several different block’s chunks at once. Onceall chunks have been processed, the dataset subset containingonly TCP traffic to port 22 as outlined in Figure 6 is readyfor further usage.
Fig. 6. Subset of the original dataset containing only TCP traffic to port 22
V. I M P L E M E N TAT I O N
We implemented this process in Java. The implementationconsists of the following two parts:
A. Indexer
During index creation, a given dataset directory is traversed.Each file is run as a byte stream through a parsing interface,allowing dataset providers to apply their own definition ofentries, to assign attributes for files and entries and a file headerif needed. For common file formats like pcap network traces,however, we supply default implementations. The indexingprocess runs in parallel, being primary CPU-bound due to theamount of decompressing, hashing and compressing.
B. Client
Since one of our goals was to simplify access to datasets ofsubstantial size for research with a less technical background,we aimed to develop a download client that is robust, powerfuland easy to use.
After downloading the single index file, the client generatesa generic user interfaces that enables to define a subset of
33
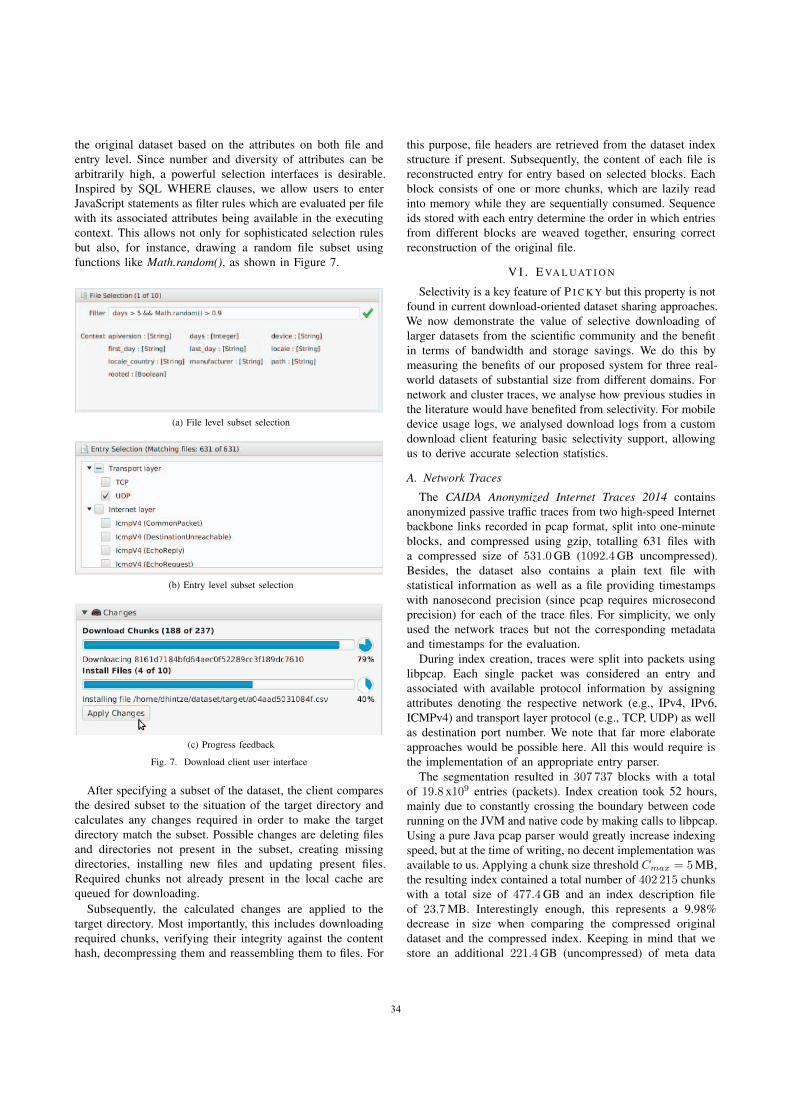
the original dataset based on the attributes on both file andentry level. Since number and diversity of attributes can bearbitrarily high, a powerful selection interfaces is desirable.Inspired by SQL WHERE clauses, we allow users to enterJavaScript statements as filter rules which are evaluated per filewith its associated attributes being available in the executingcontext. This allows not only for sophisticated selection rulesbut also, for instance, drawing a random file subset usingfunctions like Math.random(), as shown in Figure 7.
(a) File level subset selection
(b) Entry level subset selection
(c) Progress feedback
Fig. 7. Download client user interface
After specifying a subset of the dataset, the client comparesthe desired subset to the situation of the target directory andcalculates any changes required in order to make the targetdirectory match the subset. Possible changes are deleting filesand directories not present in the subset, creating missingdirectories, installing new files and updating present files.Required chunks not already present in the local cache arequeued for downloading.
Subsequently, the calculated changes are applied to thetarget directory. Most importantly, this includes downloadingrequired chunks, verifying their integrity against the contenthash, decompressing them and reassembling them to files. For
this purpose, file headers are retrieved from the dataset indexstructure if present. Subsequently, the content of each file isreconstructed entry for entry based on selected blocks. Eachblock consists of one or more chunks, which are lazily readinto memory while they are sequentially consumed. Sequenceids stored with each entry determine the order in which entriesfrom different blocks are weaved together, ensuring correctreconstruction of the original file.
V I . E VA L U AT I O N
Selectivity is a key feature of P I C K Y but this property is notfound in current download-oriented dataset sharing approaches.We now demonstrate the value of selective downloading oflarger datasets from the scientific community and the benefitin terms of bandwidth and storage savings. We do this bymeasuring the benefits of our proposed system for three real-world datasets of substantial size from different domains. Fornetwork and cluster traces, we analyse how previous studies inthe literature would have benefited from selectivity. For mobiledevice usage logs, we analysed download logs from a customdownload client featuring basic selectivity support, allowingus to derive accurate selection statistics.
A. Network Traces
The CAIDA Anonymized Internet Traces 2014 containsanonymized passive traffic traces from two high-speed Internetbackbone links recorded in pcap format, split into one-minuteblocks, and compressed using gzip, totalling 631 files witha compressed size of 531.0GB (1092.4GB uncompressed).Besides, the dataset also contains a plain text file withstatistical information as well as a file providing timestampswith nanosecond precision (since pcap requires microsecondprecision) for each of the trace files. For simplicity, we onlyused the network traces but not the corresponding metadataand timestamps for the evaluation.
During index creation, traces were split into packets usinglibpcap. Each single packet was considered an entry andassociated with available protocol information by assigningattributes denoting the respective network (e.g., IPv4, IPv6,ICMPv4) and transport layer protocol (e.g., TCP, UDP) as wellas destination port number. We note that far more elaborateapproaches would be possible here. All this would require isthe implementation of an appropriate entry parser.
The segmentation resulted in 307 737 blocks with a totalof 19.8 x10⁹ entries (packets). Index creation took 52 hours,mainly due to constantly crossing the boundary between coderunning on the JVM and native code by making calls to libpcap.Using a pure Java pcap parser would greatly increase indexingspeed, but at the time of writing, no decent implementation wasavailable to us. Applying a chunk size threshold Cmax = 5MB,the resulting index contained a total number of 402 215 chunkswith a total size of 477.4GB and an index description fileof 23.7MB. Interestingly enough, this represents a 9.98%decrease in size when comparing the compressed originaldataset and the compressed index. Keeping in mind that westore an additional 221.4GB (uncompressed) of meta data
34

by assigning a unique 64-bit sequence number and as wellas a 32-bit integer holding the entry length to each of the19.8 x109 packets to allow for correct ordering of entries duringreassembly. The reduction in storage space can be explainedby gzip compression performing better on files with similarcontent (or, more precisely, a higher redundancy within 32Kblocks). Since we are effectively grouping network packets byprotocols, similarity increases, for instance through repeatingheader fields.
At the network protocol level, 99.66% of the stored data areIPv4 traffic while only 0.1% is IPv6 traffic. The fraction of IPv6traffic is lower than what is reported in other studies, whereIPv6 is found to be, for instance, 0.64% [28] of the trafficin 2014. However, our numbers are close to correspondingstatistics by CAIDA1. Also, it was found that IPv6 adoptionat the edges of the network is significantly less than in thenetwork core [29]. 0.23% of the dataset consists of ICMPv4traffic and only 0.006% of ICMPv6 packets.
On transport protocol level, we distinguished TCP and UDPtraffic. We found 73.2% of the dataset contains TCP packetswhile UDP made up 11.4%. This leaves 15,4% of the datasetclassified as OTHER. Again, this fraction could have beenclassified by putting more effort into parsing.
The third level of packet classification is based on TCP andUDP ports. While not guaranteeing correct results, ports areoften used as an efficient way of deriving application protocolinformation from network traces—deep packet inspectionnot even possible unless application data has been collected[30]. For simplicity, we only considered well-known (0–1023)destination ports though more a fine grain classification wouldbe possible. The most commonly occurring ports are 80(HTTP) with a fraction of 15.6%, 443 (HTTPS) with 8.2%and 53 (DNS) with 0.5% of the dataset. Figure 8 outlines theresulting dataset fragmentation (not showing traffic to portshigher than 1023 as well as HTTP and HTTPS traffic).
Fig. 8. Caida dataset fragmentation by destination port (excluding http/httpsand traffic to ports higher than 1023)
1https://www.caida.org/data/passive/trace stats/
P I C K Y allows us to form subsets of the original datasetbased on arbitrary filtering criteria from the three level of entryclassification. For instance, a client interested in IPv6 traffic toUDP port 161 (SNMP) would only be required to download34.5 kB instead of downloading the entire 531.0GB networktrace dataset. Even when including the index file, this stillmeans a reduction in network traffic and client-side storagerequirements by 99.996%. To determine realistic improvementsfor scientific applications, we analysed a number of publishedstudies using large network trace datasets that based theirresearch on only a part of the trace. For comparability, weassume the CAIDA dataset was used, even if the studies werebased on an other version of the dataset or a different networktrace dataset of significant size.
When it comes to downloading only subsets, a numberof studies [31]–[33] can be found that analyse only trafficfor a particular transport protocol, e. g. TCP. Using the corre-sponding subset would saved 182.5GB or 34.37% of networktraffic and client-side storage compared to the full dataset.Interestingly, some authors noted that they “did not haveenough processing capacity to filter all CAIDA traces” [33],highlighting the point that computational resource limitationsdo affect the scientific community, motivating resource efficientsharing techniques. The potential benefits for researchers onlyinterested in UDP traffic [34], [35] are even greater, since UDPtraces account for only 10.24% of the dataset. Subsets based onapplication protocols derived from well-known port numbersare also applicable to real-world studies. One study analysedthe CAIDA dataset for packets related to web and mail traffic[30], which is a subset 21.43% the size of the full dataset. Weare, however, not able to construct a subset including peer-to-peer traffic comparable to what is used in [30], since theunderlying protocols are not bound to well-known ports. Inanother the authors propose a method to generate realisticcover traffic for HTTPS, SMTP, and SSH [36]. By applyingport-level selection, the relevant subset is only 7.5% the sizeof the original dataset.
B. Mobile Device Usage Logs
We also evaluated the proposed approach on the basis of theDevice Analyzer Dataset.2 Containing usage data from 30 393Android devices collected over the course of 4 years by now,it is the largest publicly available dataset of this kind as oftoday [4]. Data are continuously collected and new versionsof the dataset are published periodically, demanding bothversioning and upgradability. For each participating device,the dataset contains a sequential log file of 263 key/value pairsalong timestamps, recorded either periodically or event-based(see Figure 9). At the time of evaluation, the dataset featuresan uncompressed size of 11 531.7GB and a compressed sizeof 1610.93GB respectively. For index generation, a virtualmachine running Ubuntu Linux with 8 cores (2.27GHz) and16GB main memory was used. Dataset files were read from
2http://deviceanalyzer.cl.cam.ac.uk
35
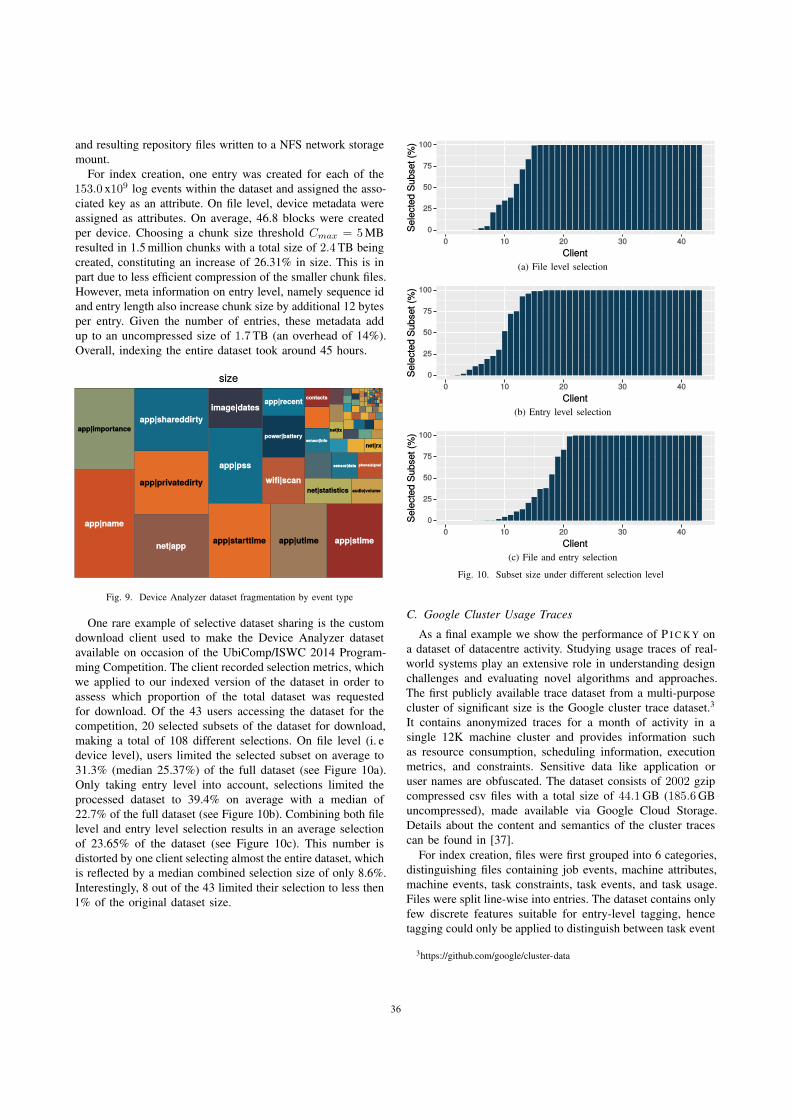
and resulting repository files written to a NFS network storagemount.
For index creation, one entry was created for each of the153.0 x109 log events within the dataset and assigned the asso-ciated key as an attribute. On file level, device metadata wereassigned as attributes. On average, 46.8 blocks were createdper device. Choosing a chunk size threshold Cmax = 5MBresulted in 1.5 million chunks with a total size of 2.4TB beingcreated, constituting an increase of 26.31% in size. This is inpart due to less efficient compression of the smaller chunk files.However, meta information on entry level, namely sequence idand entry length also increase chunk size by additional 12 bytesper entry. Given the number of entries, these metadata addup to an uncompressed size of 1.7TB (an overhead of 14%).Overall, indexing the entire dataset took around 45 hours.
Fig. 9. Device Analyzer dataset fragmentation by event type
One rare example of selective dataset sharing is the customdownload client used to make the Device Analyzer datasetavailable on occasion of the UbiComp/ISWC 2014 Program-ming Competition. The client recorded selection metrics, whichwe applied to our indexed version of the dataset in order toassess which proportion of the total dataset was requestedfor download. Of the 43 users accessing the dataset for thecompetition, 20 selected subsets of the dataset for download,making a total of 108 different selections. On file level (i. edevice level), users limited the selected subset on average to31.3% (median 25.37%) of the full dataset (see Figure 10a).Only taking entry level into account, selections limited theprocessed dataset to 39.4% on average with a median of22.7% of the full dataset (see Figure 10b). Combining both filelevel and entry level selection results in an average selectionof 23.65% of the dataset (see Figure 10c). This number isdistorted by one client selecting almost the entire dataset, whichis reflected by a median combined selection size of only 8.6%.Interestingly, 8 out of the 43 limited their selection to less then1% of the original dataset size.
(a) File level selection
(b) Entry level selection
(c) File and entry selection
Fig. 10. Subset size under different selection level
C. Google Cluster Usage Traces
As a final example we show the performance of P I C K Y ona dataset of datacentre activity. Studying usage traces of real-world systems play an extensive role in understanding designchallenges and evaluating novel algorithms and approaches.The first publicly available trace dataset from a multi-purposecluster of significant size is the Google cluster trace dataset.3
It contains anonymized traces for a month of activity in asingle 12K machine cluster and provides information suchas resource consumption, scheduling information, executionmetrics, and constraints. Sensitive data like application oruser names are obfuscated. The dataset consists of 2002 gzipcompressed csv files with a total size of 44.1GB (185.6GBuncompressed), made available via Google Cloud Storage.Details about the content and semantics of the cluster tracescan be found in [37].
For index creation, files were first grouped into 6 categories,distinguishing files containing job events, machine attributes,machine events, task constraints, task events, and task usage.Files were split line-wise into entries. The dataset contains onlyfew discrete features suitable for entry-level tagging, hencetagging could only be applied to distinguish between task event
3https://github.com/google/cluster-data
36

Original Format Picky Format
Dataset Files Format Size Compressed Index Blocks Chunks Entries Compressed Overhead
CAIDA 2014 631 libpcap 1092.4GB 531.0GB 23.7MB 307 737 402 215 19.8 x10⁹ 477.4GB -9.98%
Cluster Traces 2002 csv 185.6GB 44.1GB 1.4MB 16 722 25 714 1.4 x10⁹ tab51.1GB 15.87%
Device Analyzer 30 393 key/value 11 531.7GB 1610.93GB 118.8MB 1.7 x10⁶ 2.1 x10⁶ 153.0 x10⁹ 2034.8GB 26.31%
TABLE IC O M PA R I N G I N D E X C H A R A C T E R I S T I C S A N D O V E R H E A D F O R D I F F E R E N T D ATA S E T S
type and job event type, as well as task execution constrainttypes. Processing was performed on a physical Ubuntu Linuxserver equipped with an Intel i7-3770 3.40GHz CPU and 16GB main memory. A local SATA hard drive was used forpersistent storage. With a chunk size threshold Cmax = 5MB,index creation took 5.5 hours, splitting 2002 csv files line wiseinto 1.4 x10⁹ entries, forming 16 722 blocks broken down to25 714 chunks. The final index description file requires 1.4MBof space while the entire index is 51.1GB in size, resultingin an overhead of 15.87% compared to the original datasetformat, again due to less efficient compression and 15.97GB(8.6%) of additional metadata.
Since the dataset contains only few discrete features suitablefor entry-level attribute association, the utility of entry-levelsubset selection is limited to applications in which only certaincluster event types are relevant such as the prediction ofmachine REMOVE events [38] (See Figure 11).
Fig. 11. Google Cluster Usage Traces fragmentation by event type
V I I . C O N C L U S I O N
In this paper, we presented P I C K Y, a novel approach forrepeatable and efficient sharing of large evolving scientificdatasets. P I C K Y features a number of properties that, de-pending on the nature of the dataset, are desirable. It allowsdataset providers to publish updates without having clientsto re-download content already present. Likewise, publishersare able to patch published data, for instance to correct errors.Consistency of the downloaded dataset can be verified to ensure
correctness of received data. P I C K Y features versioning,which facilitates reproducibility of results by obtaining an exactcopy despite any number of updates or patches. It also enablescommon access control schemes by working over arbitrary fileexchange protocols. The most important feature, however, isthe capability to download and process only a subset of theoriginal dataset by enabling both file and intra-file selectivity.
We implemented P I C K Y and evaluated the concept byapplying it to three different scientific datasets. We showed thatour approach works well for datasets with an uncompressedsize of 11 531.7GB and handles 153.0 x10⁹ entries and more.Given a corresponding parsing function, P I C K Y handles textbased files and arbitrary binary protocols equally well. Thoughour approach introduces 12 bytes of metadata per entry,we noted that for some datasets, we actually accomplish areduction in size through the inherent compression-friendlyfile reorganisation.
We showed that there is value in selective downloading ofscientific datasets by analysing both access statistics from theprovider of a large dataset as well as previous studies analysingsuch datasets. We found that 40% of the users that specified asubset narrowed their choice down to less then 1% the size ofthe original dataset, resulting in significant reduction in trafficrelated cost, much faster access as well as lower computationalresource requirements on client side. From looking at hownetwork trace datasets are used in literature, we found thatusers who are working with a subset could save 26.8% to92.5% of the size of the original dataset in both network trafficand local storage.
P I C K Y is released4 under the Apache License, Version 2.0and used successfully to provide the Device Analyzer dataset,now containing traces of more than 30 576 mobile devices, tointerested researches.
A C K N O W L E D G M E N T
The authors gratefully acknowledge funding by the GermanFederal Ministry of Education and Research.
4https://github.com/ucam-cl-dtg/picky
37
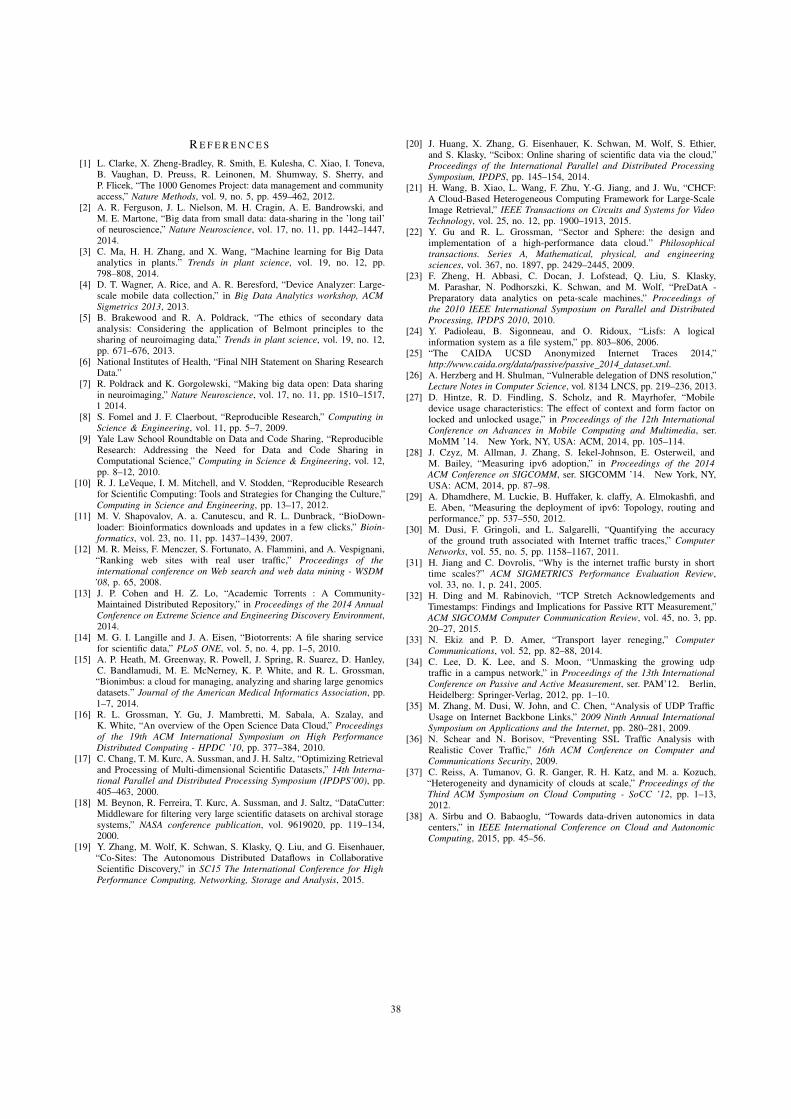
R E F E R E N C E S
[1] L. Clarke, X. Zheng-Bradley, R. Smith, E. Kulesha, C. Xiao, I. Toneva,B. Vaughan, D. Preuss, R. Leinonen, M. Shumway, S. Sherry, andP. Flicek, “The 1000 Genomes Project: data management and communityaccess,” Nature Methods, vol. 9, no. 5, pp. 459–462, 2012.
[2] A. R. Ferguson, J. L. Nielson, M. H. Cragin, A. E. Bandrowski, andM. E. Martone, “Big data from small data: data-sharing in the ’long tail’of neuroscience,” Nature Neuroscience, vol. 17, no. 11, pp. 1442–1447,2014.
[3] C. Ma, H. H. Zhang, and X. Wang, “Machine learning for Big Dataanalytics in plants.” Trends in plant science, vol. 19, no. 12, pp.798–808, 2014.
[4] D. T. Wagner, A. Rice, and A. R. Beresford, “Device Analyzer: Large-scale mobile data collection,” in Big Data Analytics workshop, ACMSigmetrics 2013, 2013.
[5] B. Brakewood and R. A. Poldrack, “The ethics of secondary dataanalysis: Considering the application of Belmont principles to thesharing of neuroimaging data,” Trends in plant science, vol. 19, no. 12,pp. 671–676, 2013.
[6] National Institutes of Health, “Final NIH Statement on Sharing ResearchData.”
[7] R. Poldrack and K. Gorgolewski, “Making big data open: Data sharingin neuroimaging,” Nature Neuroscience, vol. 17, no. 11, pp. 1510–1517,1 2014.
[8] S. Fomel and J. F. Claerbout, “Reproducible Research,” Computing inScience & Engineering, vol. 11, pp. 5–7, 2009.
[9] Yale Law School Roundtable on Data and Code Sharing, “ReproducibleResearch: Addressing the Need for Data and Code Sharing inComputational Science,” Computing in Science & Engineering, vol. 12,pp. 8–12, 2010.
[10] R. J. LeVeque, I. M. Mitchell, and V. Stodden, “Reproducible Researchfor Scientific Computing: Tools and Strategies for Changing the Culture,”Computing in Science and Engineering, pp. 13–17, 2012.
[11] M. V. Shapovalov, A. a. Canutescu, and R. L. Dunbrack, “BioDown-loader: Bioinformatics downloads and updates in a few clicks,” Bioin-formatics, vol. 23, no. 11, pp. 1437–1439, 2007.
[12] M. R. Meiss, F. Menczer, S. Fortunato, A. Flammini, and A. Vespignani,“Ranking web sites with real user traffic,” Proceedings of theinternational conference on Web search and web data mining - WSDM
’08, p. 65, 2008.[13] J. P. Cohen and H. Z. Lo, “Academic Torrents : A Community-
Maintained Distributed Repository,” in Proceedings of the 2014 AnnualConference on Extreme Science and Engineering Discovery Environment,2014.
[14] M. G. I. Langille and J. A. Eisen, “Biotorrents: A file sharing servicefor scientific data,” PLoS ONE, vol. 5, no. 4, pp. 1–5, 2010.
[15] A. P. Heath, M. Greenway, R. Powell, J. Spring, R. Suarez, D. Hanley,C. Bandlamudi, M. E. McNerney, K. P. White, and R. L. Grossman,“Bionimbus: a cloud for managing, analyzing and sharing large genomicsdatasets.” Journal of the American Medical Informatics Association, pp.1–7, 2014.
[16] R. L. Grossman, Y. Gu, J. Mambretti, M. Sabala, A. Szalay, andK. White, “An overview of the Open Science Data Cloud,” Proceedingsof the 19th ACM International Symposium on High PerformanceDistributed Computing - HPDC ’10, pp. 377–384, 2010.
[17] C. Chang, T. M. Kurc, A. Sussman, and J. H. Saltz, “Optimizing Retrievaland Processing of Multi-dimensional Scientific Datasets,” 14th Interna-tional Parallel and Distributed Processing Symposium (IPDPS’00), pp.405–463, 2000.
[18] M. Beynon, R. Ferreira, T. Kurc, A. Sussman, and J. Saltz, “DataCutter:Middleware for filtering very large scientific datasets on archival storagesystems,” NASA conference publication, vol. 9619020, pp. 119–134,2000.
[19] Y. Zhang, M. Wolf, K. Schwan, S. Klasky, Q. Liu, and G. Eisenhauer,“Co-Sites: The Autonomous Distributed Dataflows in CollaborativeScientific Discovery,” in SC15 The International Conference for HighPerformance Computing, Networking, Storage and Analysis, 2015.
[20] J. Huang, X. Zhang, G. Eisenhauer, K. Schwan, M. Wolf, S. Ethier,and S. Klasky, “Scibox: Online sharing of scientific data via the cloud,”Proceedings of the International Parallel and Distributed ProcessingSymposium, IPDPS, pp. 145–154, 2014.
[21] H. Wang, B. Xiao, L. Wang, F. Zhu, Y.-G. Jiang, and J. Wu, “CHCF:A Cloud-Based Heterogeneous Computing Framework for Large-ScaleImage Retrieval,” IEEE Transactions on Circuits and Systems for VideoTechnology, vol. 25, no. 12, pp. 1900–1913, 2015.
[22] Y. Gu and R. L. Grossman, “Sector and Sphere: the design andimplementation of a high-performance data cloud.” Philosophicaltransactions. Series A, Mathematical, physical, and engineeringsciences, vol. 367, no. 1897, pp. 2429–2445, 2009.
[23] F. Zheng, H. Abbasi, C. Docan, J. Lofstead, Q. Liu, S. Klasky,M. Parashar, N. Podhorszki, K. Schwan, and M. Wolf, “PreDatA -Preparatory data analytics on peta-scale machines,” Proceedings ofthe 2010 IEEE International Symposium on Parallel and DistributedProcessing, IPDPS 2010, 2010.
[24] Y. Padioleau, B. Sigonneau, and O. Ridoux, “Lisfs: A logicalinformation system as a file system,” pp. 803–806, 2006.
[25] “The CAIDA UCSD Anonymized Internet Traces 2014,”http://www.caida.org/data/passive/passive 2014 dataset.xml.
[26] A. Herzberg and H. Shulman, “Vulnerable delegation of DNS resolution,”Lecture Notes in Computer Science, vol. 8134 LNCS, pp. 219–236, 2013.
[27] D. Hintze, R. D. Findling, S. Scholz, and R. Mayrhofer, “Mobiledevice usage characteristics: The effect of context and form factor onlocked and unlocked usage,” in Proceedings of the 12th InternationalConference on Advances in Mobile Computing and Multimedia, ser.MoMM ’14. New York, NY, USA: ACM, 2014, pp. 105–114.
[28] J. Czyz, M. Allman, J. Zhang, S. Iekel-Johnson, E. Osterweil, andM. Bailey, “Measuring ipv6 adoption,” in Proceedings of the 2014ACM Conference on SIGCOMM, ser. SIGCOMM ’14. New York, NY,USA: ACM, 2014, pp. 87–98.
[29] A. Dhamdhere, M. Luckie, B. Huffaker, k. claffy, A. Elmokashfi, andE. Aben, “Measuring the deployment of ipv6: Topology, routing andperformance,” pp. 537–550, 2012.
[30] M. Dusi, F. Gringoli, and L. Salgarelli, “Quantifying the accuracyof the ground truth associated with Internet traffic traces,” ComputerNetworks, vol. 55, no. 5, pp. 1158–1167, 2011.
[31] H. Jiang and C. Dovrolis, “Why is the internet traffic bursty in shorttime scales?” ACM SIGMETRICS Performance Evaluation Review,vol. 33, no. 1, p. 241, 2005.
[32] H. Ding and M. Rabinovich, “TCP Stretch Acknowledgements andTimestamps: Findings and Implications for Passive RTT Measurement,”ACM SIGCOMM Computer Communication Review, vol. 45, no. 3, pp.20–27, 2015.
[33] N. Ekiz and P. D. Amer, “Transport layer reneging,” ComputerCommunications, vol. 52, pp. 82–88, 2014.
[34] C. Lee, D. K. Lee, and S. Moon, “Unmasking the growing udptraffic in a campus network,” in Proceedings of the 13th InternationalConference on Passive and Active Measurement, ser. PAM’12. Berlin,Heidelberg: Springer-Verlag, 2012, pp. 1–10.
[35] M. Zhang, M. Dusi, W. John, and C. Chen, “Analysis of UDP TrafficUsage on Internet Backbone Links,” 2009 Ninth Annual InternationalSymposium on Applications and the Internet, pp. 280–281, 2009.
[36] N. Schear and N. Borisov, “Preventing SSL Traffic Analysis withRealistic Cover Traffic,” 16th ACM Conference on Computer andCommunications Security, 2009.
[37] C. Reiss, A. Tumanov, G. R. Ganger, R. H. Katz, and M. a. Kozuch,“Heterogeneity and dynamicity of clouds at scale,” Proceedings of theThird ACM Symposium on Cloud Computing - SoCC ’12, pp. 1–13,2012.
[38] A. Sırbu and O. Babaoglu, “Towards data-driven autonomics in datacenters,” in IEEE International Conference on Cloud and AutonomicComputing, 2015, pp. 45–56.
38


9L O N G - T E R M A N A LY S I S O F M O B I L E D E V I C E U S A G EC H A R A C T E R I S T I C S
The following paper has been published as:
Publication
Title A Large-Scale, Long-Term Analysis of Mobile Device UsageCharacteristics
Authors Daniel Hintze, Philipp Hintze, Rainhard D. Findling, andRené Mayrhofer
Journal Proceedings of the ACM on Interactive, Mobile, Wearableand Ubiquitous Technologies (IMWUT), Volume 1, Issue 2,Article 13, June 2017
Acceptance rate 9%
Candidate’s Contribution
Contribution The candidate wrote the code to parse and analyze the data,conducted most of the analysis with the exception of the re-peated measurement ANOVA, and interpreted the results.He wrote the manuscript, acted as corresponding authorand presented the results during the 2017 ACM Interna-tional Joint Conference on Pervasive and Ubiquitous Com-puting on the 14th September 2017 in Wailea, HI, USA
Overall percentage 90%
Co-Authors
By signing, each co-author certifies that the candidate’s stated contribution to thepublication is accurate (as detailed above); permission is granted for the candidateto include the publication his doctoral thesis; and that the sum of all co-authorcontributions is equal to 100% less the candidate’s stated contribution.
Exclu
ded
Exclu
ded
Exclu
ded
Philipp Hintze Rainhard D. Findling René Mayrhofer
85
86 Bibliography
Prior Publications
Parts and preliminary versions of this work have previously been published in
• Daniel Hintze, Rainhard D. Findling, Muhammad Muaaz, Sebastian Scholz,and René Mayrhofer. “Diversity in Locked and Unlocked Mobile DeviceUsage.” In: Adjunct Proceedings of the 2014 ACM International Joint Conferenceon Pervasive and Ubiquitous Computing (UbiComp’14 Adjunct). 2014, pp. 379–384. doi: 10.1145/2638728.2641697, � Winning entry out of 22 paperssubmitted to the UbiComp/ISWC 2014 Programming Competition, and
• Daniel Hintze, Rainhard D. Findling, Sebastian Scholz, and René Mayrhofer.“Mobile Device Usage Characteristics: The Effect of Context and Form Factoron Locked and Unlocked Usage.” In: Proceedings of the 12th InternationalConference on Advances in Mobile Computing and Multimedia (MoMM’14). 2014,pp. 105–114. doi: 10.1145/2684103.2684156,
and are not included in this dissertation.
© 2017 Copyright held by the authors. Publication rights licensed to ACM.Included with permission by the publisher.https://doi.org/10.1145/3090078

13
A Large-Scale, Long-Term Analysis of Mobile Device UsageCharacteristics
DANIEL HINTZE, FHDW University of Applied Sciences PaderbornPHILIPP HINTZE, University of MünsterRAINHARD D. FINDLING, University of Applied Sciences Upper AustriaRENÉ MAYRHOFER, Johannes Kepler University Linz
Today, mobile devices like smartphones and tablets have become an indispensable part of people’s lives, posing many newquestions e.g., in terms of interaction methods, but also security. In this paper, we conduct a large scale, long term analysisof mobile device usage characteristics like session length, interaction frequency, and daily usage in locked and unlockedstate with respect to location context and diurnal pattern. Based on detailed logs from 29,279 mobile phones and tabletsrepresenting a total of 5,811 years of usage time, we identify and analyze 52.2 million usage sessions with some participantsproviding data for more than four years.
Our results show that context has a highly significant effect on both frequency and extent of mobile device usage, withmobile phones being used twice as much at home compared to in the office. Interestingly, devices are unlocked for only 46%of the interactions. We found that with an average of 60 interactions per day, smartphones are used almost thrice as often astablet devices (23), while usage sessions on tablets are three times longer, hence are used almost for an equal amount of timethroughout the day. We conclude that usage session characteristics differ considerably between tablets and smartphones.These results inform future approaches to mobile interaction as well as security.
CCS Concepts: • Human-centered computing → Empirical studies in HCI; Mobile devices; Tablet computers; Em-pirical studies in ubiquitous and mobile computing;
General Terms: Human Factors, Security, Measurement
Additional Key Words and Phrases: Daily interactions, Device unlocking, Locked usage, Session length, Smartphone, Tablet,Usage session, User context
ACM Reference format:Daniel Hintze, Philipp Hintze, Rainhard D. Findling, and René Mayrhofer. 2017. A Large-Scale, Long-Term Analysis of MobileDevice Usage Characteristics. Proc. ACM Interact. Mob. Wearable Ubiquitous Technol. 1, 2, Article 13 (June 2017), 21 pages.DOI: http://dx.doi.org/10.1145/3090078
Preliminary versions of this work have been published in UbiComp 2014 [9] and MoMM 2014 [10], which are extended by using an updatedversion of the underlying dataset twice the size, a more detailed analysis, and specific consideration of differences in device locking.Authors’ addresses: D. Hintze, FHDW, Fürstenallee 5, 33102 Paderborn, Germany; email: [email protected]; P. Hintze, University ofMünster, Malmedyweg 15, 48149 Münster, Germany; email: [email protected]; R. Findling, University of Applied Sciences UpperAustria, Softwarepark 11, 4232 Hagenberg, Austria; email: [email protected]; R. Mayrhofer, Johannes Kepler University Linz,Altenbergerstr. 69, 4040 Linz, Austria; email: [email protected] to make digital or hard copies of all or part of this work for personal or classroom use is granted without fee provided thatcopies are not made or distributed for profit or commercial advantage and that copies bear this notice and the full citation on the first page.Copyrights for components of this work owned by others than the author(s) must be honored. Abstracting with credit is permitted. To copyotherwise, or republish, to post on servers or to redistribute to lists, requires prior specific permission and/or a fee. Request permissions [email protected].© 2017 Copyright held by the owner/author(s). Publication rights licensed to ACM. 2474-9567/2017/6-ART13 $15.00DOI: http://dx.doi.org/10.1145/3090078
Proceedings of the ACM on Interactive, Mobile, Wearable and Ubiquitous Technologies, Vol. 1, No. 2, Article 13. Publication date: June 2017.
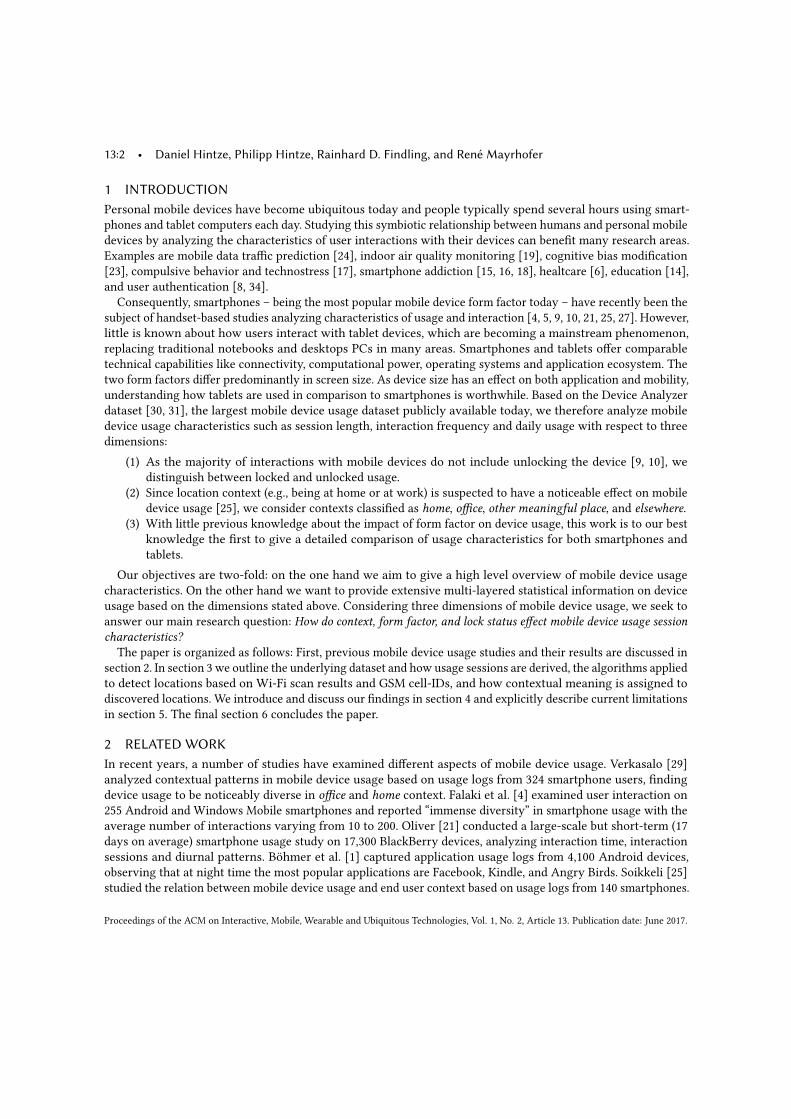
13:2 • Daniel Hintze, Philipp Hintze, Rainhard D. Findling, and René Mayrhofer
1 INTRODUCTIONPersonal mobile devices have become ubiquitous today and people typically spend several hours using smart-phones and tablet computers each day. Studying this symbiotic relationship between humans and personal mobiledevices by analyzing the characteristics of user interactions with their devices can benefit many research areas.Examples are mobile data traffic prediction [24], indoor air quality monitoring [19], cognitive bias modification[23], compulsive behavior and technostress [17], smartphone addiction [15, 16, 18], healtcare [6], education [14],and user authentication [8, 34].
Consequently, smartphones – being the most popular mobile device form factor today – have recently been thesubject of handset-based studies analyzing characteristics of usage and interaction [4, 5, 9, 10, 21, 25, 27]. However,little is known about how users interact with tablet devices, which are becoming a mainstream phenomenon,replacing traditional notebooks and desktops PCs in many areas. Smartphones and tablets offer comparabletechnical capabilities like connectivity, computational power, operating systems and application ecosystem. Thetwo form factors differ predominantly in screen size. As device size has an effect on both application and mobility,understanding how tablets are used in comparison to smartphones is worthwhile. Based on the Device Analyzerdataset [30, 31], the largest mobile device usage dataset publicly available today, we therefore analyze mobiledevice usage characteristics such as session length, interaction frequency and daily usage with respect to threedimensions:
(1) As the majority of interactions with mobile devices do not include unlocking the device [9, 10], wedistinguish between locked and unlocked usage.
(2) Since location context (e.g., being at home or at work) is suspected to have a noticeable effect on mobiledevice usage [25], we consider contexts classified as home, office, other meaningful place, and elsewhere.
(3) With little previous knowledge about the impact of form factor on device usage, this work is to our bestknowledge the first to give a detailed comparison of usage characteristics for both smartphones andtablets.
Our objectives are two-fold: on the one hand we aim to give a high level overview of mobile device usagecharacteristics. On the other hand we want to provide extensive multi-layered statistical information on deviceusage based on the dimensions stated above. Considering three dimensions of mobile device usage, we seek toanswer our main research question: How do context, form factor, and lock status effect mobile device usage sessioncharacteristics?
The paper is organized as follows: First, previous mobile device usage studies and their results are discussed insection 2. In section 3 we outline the underlying dataset and how usage sessions are derived, the algorithms appliedto detect locations based on Wi-Fi scan results and GSM cell-IDs, and how contextual meaning is assigned todiscovered locations. We introduce and discuss our findings in section 4 and explicitly describe current limitationsin section 5. The final section 6 concludes the paper.
2 RELATED WORKIn recent years, a number of studies have examined different aspects of mobile device usage. Verkasalo [29]analyzed contextual patterns in mobile device usage based on usage logs from 324 smartphone users, findingdevice usage to be noticeably diverse in office and home context. Falaki et al. [4] examined user interaction on255 Android and Windows Mobile smartphones and reported “immense diversity” in smartphone usage with theaverage number of interactions varying from 10 to 200. Oliver [21] conducted a large-scale but short-term (17days on average) smartphone usage study on 17,300 BlackBerry devices, analyzing interaction time, interactionsessions and diurnal patterns. Böhmer et al. [1] captured application usage logs from 4,100 Android devices,observing that at night time the most popular applications are Facebook, Kindle, and Angry Birds. Soikkeli [25]studied the relation between mobile device usage and end user context based on usage logs from 140 smartphones.
Proceedings of the ACM on Interactive, Mobile, Wearable and Ubiquitous Technologies, Vol. 1, No. 2, Article 13. Publication date: June 2017.
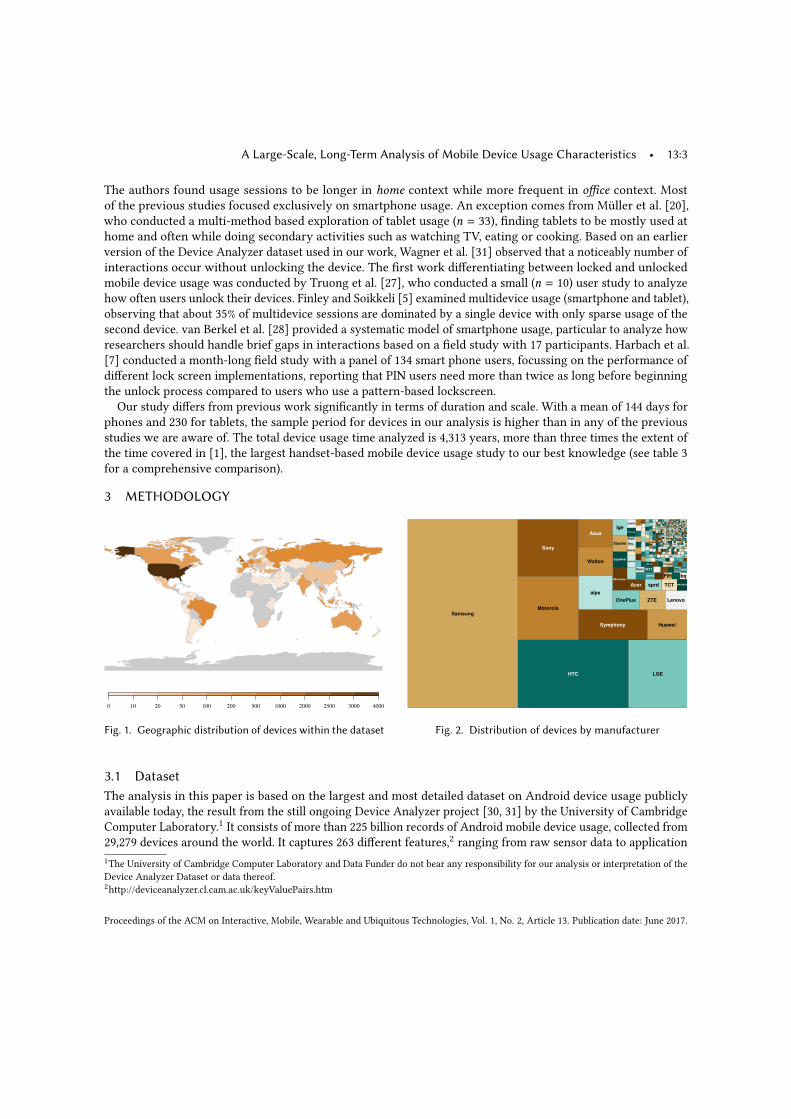
A Large-Scale, Long-Term Analysis of Mobile Device Usage Characteristics • 13:3
The authors found usage sessions to be longer in home context while more frequent in office context. Mostof the previous studies focused exclusively on smartphone usage. An exception comes from Müller et al. [20],who conducted a multi-method based exploration of tablet usage (n = 33), finding tablets to be mostly used athome and often while doing secondary activities such as watching TV, eating or cooking. Based on an earlierversion of the Device Analyzer dataset used in our work, Wagner et al. [31] observed that a noticeably number ofinteractions occur without unlocking the device. The first work differentiating between locked and unlockedmobile device usage was conducted by Truong et al. [27], who conducted a small (n = 10) user study to analyzehow often users unlock their devices. Finley and Soikkeli [5] examined multidevice usage (smartphone and tablet),observing that about 35% of multidevice sessions are dominated by a single device with only sparse usage of thesecond device. van Berkel et al. [28] provided a systematic model of smartphone usage, particular to analyze howresearchers should handle brief gaps in interactions based on a field study with 17 participants. Harbach et al.[7] conducted a month-long field study with a panel of 134 smart phone users, focussing on the performance ofdifferent lock screen implementations, reporting that PIN users need more than twice as long before beginningthe unlock process compared to users who use a pattern-based lockscreen.
Our study differs from previous work significantly in terms of duration and scale. With a mean of 144 days forphones and 230 for tablets, the sample period for devices in our analysis is higher than in any of the previousstudies we are aware of. The total device usage time analyzed is 4,313 years, more than three times the extent ofthe time covered in [1], the largest handset-based mobile device usage study to our best knowledge (see table 3for a comprehensive comparison).
3 METHODOLOGY
Fig. 1. Geographic distribution of devices within the dataset Fig. 2. Distribution of devices by manufacturer
3.1 DatasetThe analysis in this paper is based on the largest and most detailed dataset on Android device usage publiclyavailable today, the result from the still ongoing Device Analyzer project [30, 31] by the University of CambridgeComputer Laboratory.1 It consists of more than 225 billion records of Android mobile device usage, collected from29,279 devices around the world. It captures 263 different features,2 ranging from raw sensor data to application1The University of Cambridge Computer Laboratory and Data Funder do not bear any responsibility for our analysis or interpretation of theDevice Analyzer Dataset or data thereof.2http://deviceanalyzer.cl.cam.ac.uk/keyValuePairs.htm
Proceedings of the ACM on Interactive, Mobile, Wearable and Ubiquitous Technologies, Vol. 1, No. 2, Article 13. Publication date: June 2017.
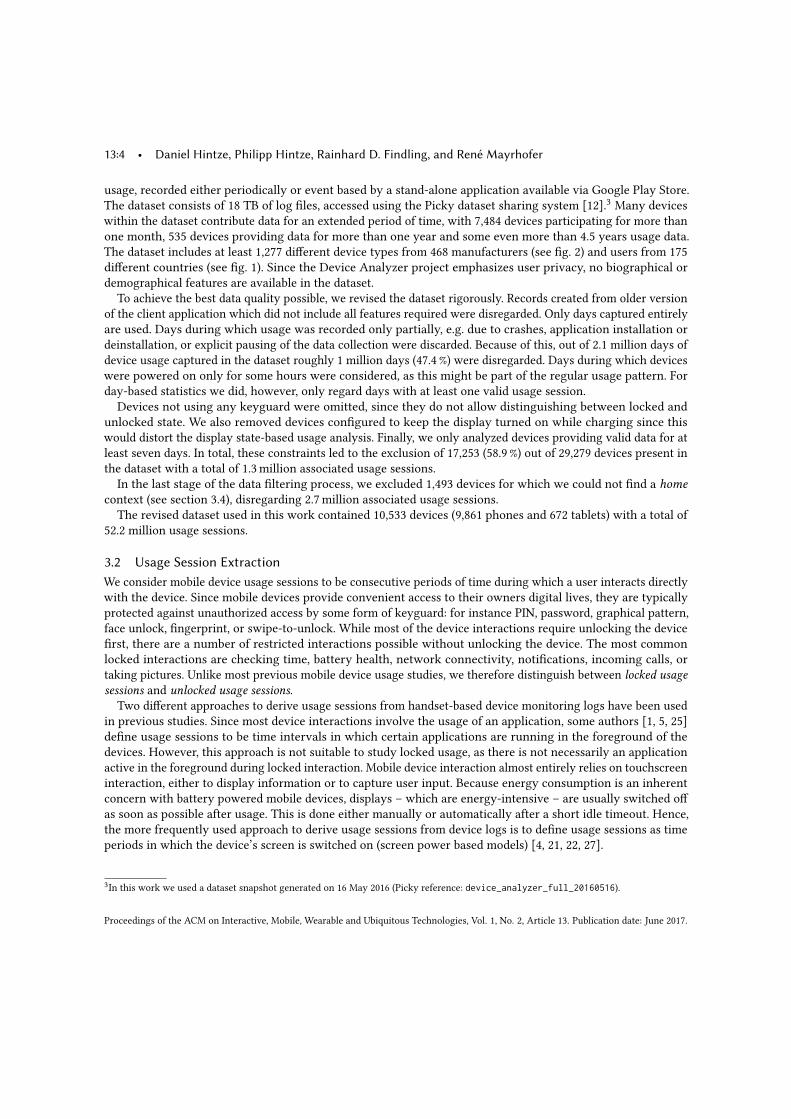
13:4 • Daniel Hintze, Philipp Hintze, Rainhard D. Findling, and René Mayrhofer
usage, recorded either periodically or event based by a stand-alone application available via Google Play Store.The dataset consists of 18 TB of log files, accessed using the Picky dataset sharing system [12].3 Many deviceswithin the dataset contribute data for an extended period of time, with 7,484 devices participating for more thanone month, 535 devices providing data for more than one year and some even more than 4.5 years usage data.The dataset includes at least 1,277 different device types from 468 manufacturers (see fig. 2) and users from 175different countries (see fig. 1). Since the Device Analyzer project emphasizes user privacy, no biographical ordemographical features are available in the dataset.
To achieve the best data quality possible, we revised the dataset rigorously. Records created from older versionof the client application which did not include all features required were disregarded. Only days captured entirelyare used. Days during which usage was recorded only partially, e.g. due to crashes, application installation ordeinstallation, or explicit pausing of the data collection were discarded. Because of this, out of 2.1 million days ofdevice usage captured in the dataset roughly 1 million days (47.4%) were disregarded. Days during which deviceswere powered on only for some hours were considered, as this might be part of the regular usage pattern. Forday-based statistics we did, however, only regard days with at least one valid usage session.Devices not using any keyguard were omitted, since they do not allow distinguishing between locked and
unlocked state. We also removed devices configured to keep the display turned on while charging since thiswould distort the display state-based usage analysis. Finally, we only analyzed devices providing valid data for atleast seven days. In total, these constraints led to the exclusion of 17,253 (58.9%) out of 29,279 devices present inthe dataset with a total of 1.3million associated usage sessions.In the last stage of the data filtering process, we excluded 1,493 devices for which we could not find a home
context (see section 3.4), disregarding 2.7million associated usage sessions.The revised dataset used in this work contained 10,533 devices (9,861 phones and 672 tablets) with a total of
52.2 million usage sessions.
3.2 Usage Session ExtractionWe consider mobile device usage sessions to be consecutive periods of time during which a user interacts directlywith the device. Since mobile devices provide convenient access to their owners digital lives, they are typicallyprotected against unauthorized access by some form of keyguard: for instance PIN, password, graphical pattern,face unlock, fingerprint, or swipe-to-unlock. While most of the device interactions require unlocking the devicefirst, there are a number of restricted interactions possible without unlocking the device. The most commonlocked interactions are checking time, battery health, network connectivity, notifications, incoming calls, ortaking pictures. Unlike most previous mobile device usage studies, we therefore distinguish between locked usagesessions and unlocked usage sessions.
Two different approaches to derive usage sessions from handset-based device monitoring logs have been usedin previous studies. Since most device interactions involve the usage of an application, some authors [1, 5, 25]define usage sessions to be time intervals in which certain applications are running in the foreground of thedevices. However, this approach is not suitable to study locked usage, as there is not necessarily an applicationactive in the foreground during locked interaction. Mobile device interaction almost entirely relies on touchscreeninteraction, either to display information or to capture user input. Because energy consumption is an inherentconcern with battery powered mobile devices, displays – which are energy-intensive – are usually switched offas soon as possible after usage. This is done either manually or automatically after a short idle timeout. Hence,the more frequently used approach to derive usage sessions from device logs is to define usage sessions as timeperiods in which the device’s screen is switched on (screen power based models) [4, 21, 22, 27].
3In this work we used a dataset snapshot generated on 16 May 2016 (Picky reference: device_analyzer_full_20160516).
Proceedings of the ACM on Interactive, Mobile, Wearable and Ubiquitous Technologies, Vol. 1, No. 2, Article 13. Publication date: June 2017.

A Large-Scale, Long-Term Analysis of Mobile Device Usage Characteristics • 13:5
Although naïve screen power based usage session extraction comes fairly close to actual device interaction,some pitfalls exist which – in our experience – can distort the results noticeably if not considered carefully.Consider e.g., incoming phone calls, which activate the screen to display the caller’s number and to allow theuser to answer the call. If the call goes unanswered, a naïve screen power based approach would falsely considerthis a session of user interaction. Or consider phones with touchscreens that utilize a proximity sensor to switchoff the screen when the device is held closely to a user’s head, e.g., during a call, in order to prevent accidentaltouch events caused by the user’s ear. As users tend to slightly shift the phone’s position during calls, this wouldresult in naïve screen power based models mistakenly recognizing multiple short usage sessions instead of oneconsecutive session. We observed that overall 12.7% of the changes in screen power state on smartphones areactually related to calls and hence do not constitute the boundaries of genuine user interaction sessions. Thesefindings are based on a state machine based usage session extraction approach capable of avoiding mentionedpitfalls – which we consequently incorporate in our approach (see fig. 3).
locked, display off locked, ringing
locked, display on locked, active call
first event last event screen|power (on)screen|power (off)
phone|offhook/ start locked session
screen|power (on)screen|power (off)
phone|idle/ start auth. stopwatch
phone|idle
phone|ringing
screen|power (off)shutdown/ end locked session/ discard auth. stopwatch
screen|power (on)/ start locked session
/ start auth. stopwatch
phone|keyguardremoved/ start unlocked session/ stop auth. stopwatch
unlocked
unlocked, call
phone|idlephone|ringingphone|calling
screen|power (on)screen|power (off)
screen|power (off)shutdown/ end unlocked session
Fig. 3. State machine for session detection
3.3 Device Form FactorWe assume device form factors to have a considerable impact on device usage. We therefore analyze usage sessionscharacteristics with respect to device form factors – namely smartphone and tablet devices. One previously usedapproach to distinguish form factors in device logs is based on the device’s ability to place or answer phonecalls [9]. However, some tablet devices are capable of performing GSM voice call (e.g., the Galaxy Tab 10.1). Hencewe chose the screen diagonal as a discriminator for form factors. Devices featuring a screen size of 7′′ or higherare considered to be tablets while devices with smaller screens are regarded as smartphones. We calculate thescreen diagonal from screen resolution and pixel density stated in the dataset.
3.4 User Context ClassificationPeople use their mobile devices in different ways, depending on their current situation. For instance, in an officesituation people might be more likely to use their smartphones to make phone calls or check for next meetings,while at home devices might be used more to browse the Internet or watch movies. Research by [25] reflects these
Proceedings of the ACM on Interactive, Mobile, Wearable and Ubiquitous Technologies, Vol. 1, No. 2, Article 13. Publication date: June 2017.
13:6 • Daniel Hintze, Philipp Hintze, Rainhard D. Findling, and René Mayrhofer
different usage patterns by observing that usage sessions are 37% longer in home context over office context, buthappen 56% more often in office context over home context.
Deriving context from aggregated information is often difficult. Nevertheless, information on time and locationcan be combined in order to derive contextual place information. Based on previous research by [13] and [26] wedistinguish four different place-related user contexts: home, office, other meaningful, and elsewhere.
While home and office are self-explanatory, other meaningful refers to places that do not have the characteristicsof home and office, but still a significant amount of time is spent there. A frequently visited gym, for instance,would be considered an other meaningful place. Any place that is not classified as one of these three contexts isassigned the elsewhere context. This includes, but is not limited to, less frequent visited places like restaurants aswell as transitions between other contexts.
Unlike other studies [13, 25, 26], we do not assign an abroad context for places outside users’ home country.The reason being that [25] found that on average users spend only 2% of their time abroad, making this contextnegligible for the analysis of average usage patterns.Alongside extracting locked and unlocked sessions, we derive the context these sessions occurred in, based
on time and location information. While the Device Analyzer dataset provides timestamps, obtaining locationinformation requires some effort. The dataset does not contain GPS information, which would be of little use inindoor or urban environments anyway. The Device Analyzer application records coarse locations of devices asreturned by the network provider. Since recording such information raises privacy concerns, participants wererequested to opt-in for sharing their location for research purposes – which only 1.12% of the users chose to do,precluding further analysis due to sample size.Hence we derive location information from two other sources of information which can be related to device
locations indirectly: GSM cell IDs and Wi-Fi scan results. GSM cell IDs were anonymized by hashing in thedataset to protect participants’ privacy. Further, while the option to opt-out from recording anonymized GSM cellIDs existed too, only 2.41% chose to do so – leaving records for 97.59% of participating devices. Wi-Fi scan results,including SSID and MAC address of Wi-Fi access points within range are anonymized as well and are availablefor all capable devices in the dataset. An algorithm to extract location context information from handset-basedGSM cell ID data has been proposed by [13], extended to utilize Wi-Fi scan data by [26] and applied to a studyof smartphone usage in [25]. For our research, we implemented the extended algorithm while applying somesimplifications for the sake of computation time ([25, 26] applied the algorithm on a dataset of 140 devices whilethe dataset we use contains 29,279 devices). The algorithm consists of two parts: first, meaningful locations areidentified, which requires different approaches for cell ID data and Wi-Fi scan results. Subsequently, contextssuch as home or office are assigned to the identified locations based on time information.
3.4.1 Deriving Places from Cell Data. A mobile phone is almost always connected to a cell tower, uniquelyidentified by cell identifier (CID) and location area code (LAC). As these attributes are anonymized in the datasetused in this work, we cannot relate them to geographic coordinates by using a database like OpenCellID4.However, since a cell tower has a fixed position and a limited range, it could be considered to be one place interms of user context detection. As cell tower placement aims to minimize areas without network coverage andenhance connectivity robustness, adjacent cells usually overlap each other. Devices may dynamically switchbetween cells if another one is considered “better” than the current cell. As a result, it is not unlikely for even astationary mobile phone to be connected to several different cells over the course of time [33]. Moving the device,for instance in an office building, possibly even increases the number of different cells a device is connected towhile still being in the same abstract place (e.g., office context). In order to obtain places from cell data, adjacentcells therefore need to be clustered. For our implementation, we apply a clustering algorithm based on minimumcircular subsequences proposed by [33]. Given a sequence of cell IDs a device has been connected to, [33] defines4http://opencellid.org
Proceedings of the ACM on Interactive, Mobile, Wearable and Ubiquitous Technologies, Vol. 1, No. 2, Article 13. Publication date: June 2017.
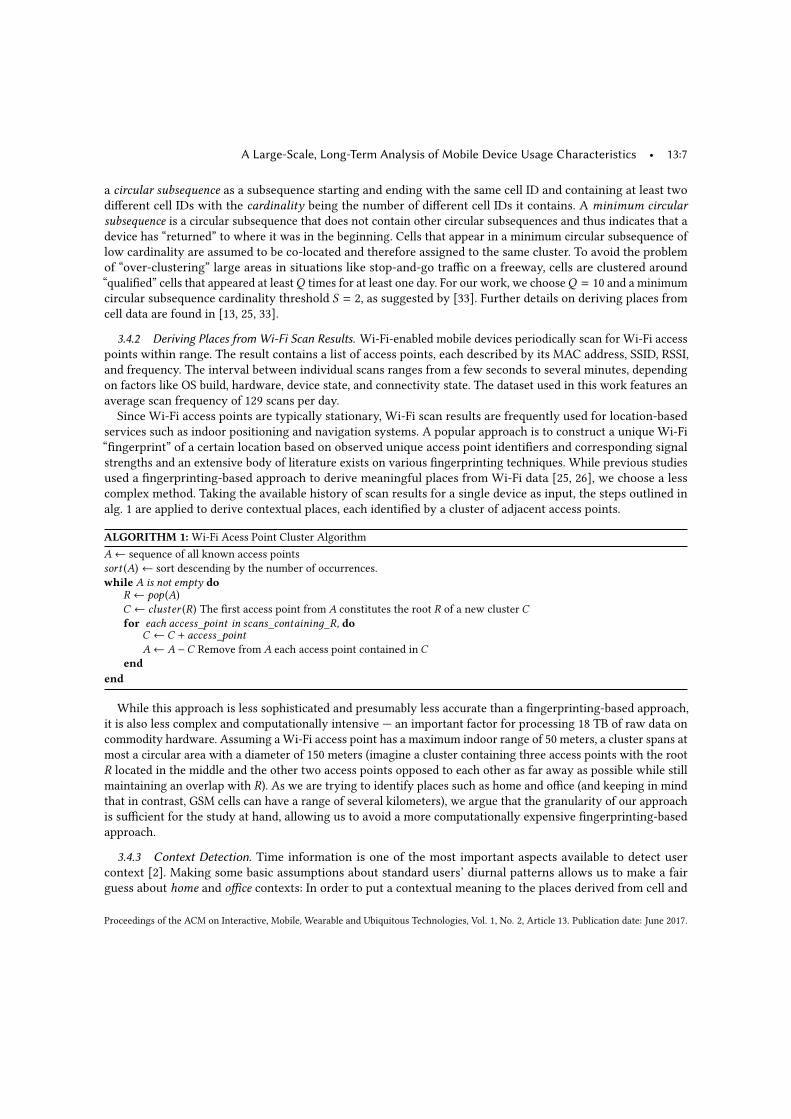
A Large-Scale, Long-Term Analysis of Mobile Device Usage Characteristics • 13:7
a circular subsequence as a subsequence starting and ending with the same cell ID and containing at least twodifferent cell IDs with the cardinality being the number of different cell IDs it contains. A minimum circularsubsequence is a circular subsequence that does not contain other circular subsequences and thus indicates that adevice has “returned” to where it was in the beginning. Cells that appear in a minimum circular subsequence oflow cardinality are assumed to be co-located and therefore assigned to the same cluster. To avoid the problemof “over-clustering” large areas in situations like stop-and-go traffic on a freeway, cells are clustered around“qualified” cells that appeared at leastQ times for at least one day. For our work, we chooseQ = 10 and a minimumcircular subsequence cardinality threshold S = 2, as suggested by [33]. Further details on deriving places fromcell data are found in [13, 25, 33].
3.4.2 Deriving Places from Wi-Fi Scan Results. Wi-Fi-enabled mobile devices periodically scan for Wi-Fi accesspoints within range. The result contains a list of access points, each described by its MAC address, SSID, RSSI,and frequency. The interval between individual scans ranges from a few seconds to several minutes, dependingon factors like OS build, hardware, device state, and connectivity state. The dataset used in this work features anaverage scan frequency of 129 scans per day.Since Wi-Fi access points are typically stationary, Wi-Fi scan results are frequently used for location-based
services such as indoor positioning and navigation systems. A popular approach is to construct a unique Wi-Fi“fingerprint” of a certain location based on observed unique access point identifiers and corresponding signalstrengths and an extensive body of literature exists on various fingerprinting techniques. While previous studiesused a fingerprinting-based approach to derive meaningful places from Wi-Fi data [25, 26], we choose a lesscomplex method. Taking the available history of scan results for a single device as input, the steps outlined inalg. 1 are applied to derive contextual places, each identified by a cluster of adjacent access points.
ALGORITHM 1: Wi-Fi Acess Point Cluster AlgorithmA← sequence of all known access pointssort (A) ← sort descending by the number of occurrences.while A is not empty do
R ← pop (A)C ← cluster (R) The first access point from A constitutes the root R of a new cluster Cfor each access_point in scans_containinд_R, do
C ← C + access_pointA← A −C Remove from A each access point contained in C
endend
While this approach is less sophisticated and presumably less accurate than a fingerprinting-based approach,it is also less complex and computationally intensive — an important factor for processing 18 TB of raw data oncommodity hardware. Assuming a Wi-Fi access point has a maximum indoor range of 50 meters, a cluster spans atmost a circular area with a diameter of 150 meters (imagine a cluster containing three access points with the rootR located in the middle and the other two access points opposed to each other as far away as possible while stillmaintaining an overlap with R). As we are trying to identify places such as home and office (and keeping in mindthat in contrast, GSM cells can have a range of several kilometers), we argue that the granularity of our approachis sufficient for the study at hand, allowing us to avoid a more computationally expensive fingerprinting-basedapproach.
3.4.3 Context Detection. Time information is one of the most important aspects available to detect usercontext [2]. Making some basic assumptions about standard users’ diurnal patterns allows us to make a fairguess about home and office contexts: In order to put a contextual meaning to the places derived from cell and
Proceedings of the ACM on Interactive, Mobile, Wearable and Ubiquitous Technologies, Vol. 1, No. 2, Article 13. Publication date: June 2017.
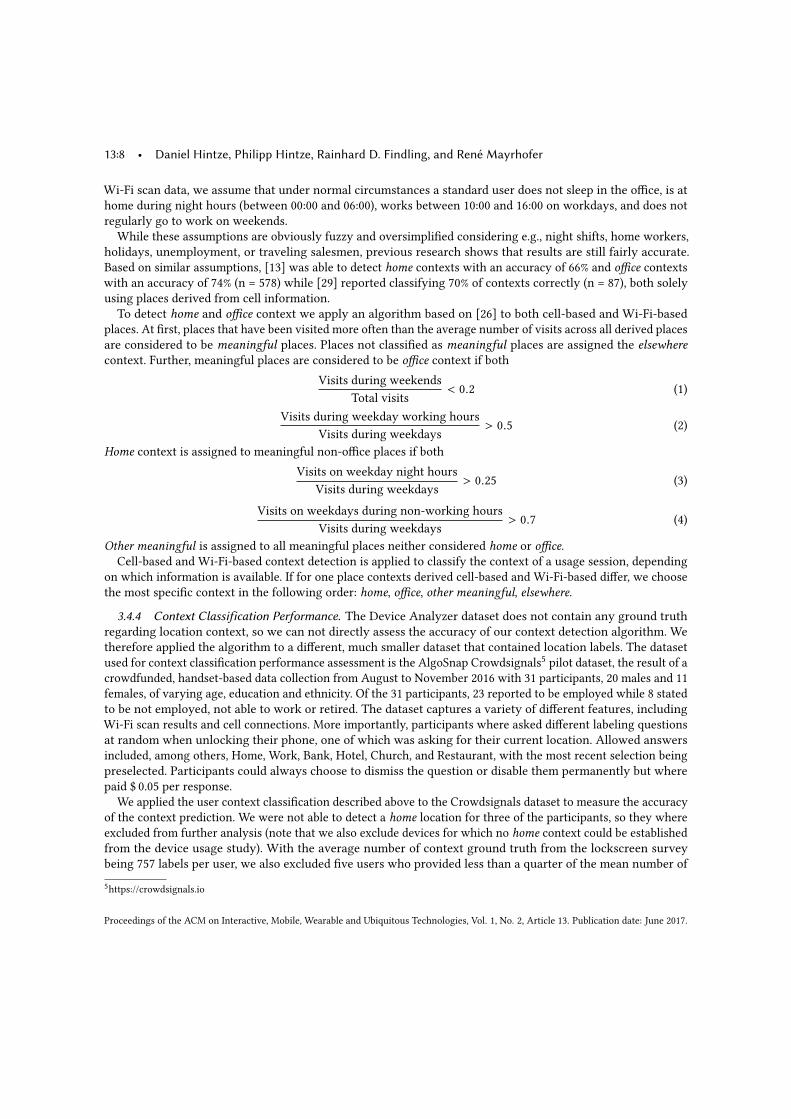
13:8 • Daniel Hintze, Philipp Hintze, Rainhard D. Findling, and René Mayrhofer
Wi-Fi scan data, we assume that under normal circumstances a standard user does not sleep in the office, is athome during night hours (between 00:00 and 06:00), works between 10:00 and 16:00 on workdays, and does notregularly go to work on weekends.
While these assumptions are obviously fuzzy and oversimplified considering e.g., night shifts, home workers,holidays, unemployment, or traveling salesmen, previous research shows that results are still fairly accurate.Based on similar assumptions, [13] was able to detect home contexts with an accuracy of 66% and office contextswith an accuracy of 74% (n = 578) while [29] reported classifying 70% of contexts correctly (n = 87), both solelyusing places derived from cell information.To detect home and office context we apply an algorithm based on [26] to both cell-based and Wi-Fi-based
places. At first, places that have been visited more often than the average number of visits across all derived placesare considered to be meaningful places. Places not classified as meaningful places are assigned the elsewherecontext. Further, meaningful places are considered to be office context if both
Visits during weekendsTotal visits < 0.2 (1)
Visits during weekday working hoursVisits during weekdays > 0.5 (2)
Home context is assigned to meaningful non-office places if bothVisits on weekday night hours
Visits during weekdays > 0.25 (3)
Visits on weekdays during non-working hoursVisits during weekdays > 0.7 (4)
Other meaningful is assigned to all meaningful places neither considered home or office.Cell-based and Wi-Fi-based context detection is applied to classify the context of a usage session, depending
on which information is available. If for one place contexts derived cell-based and Wi-Fi-based differ, we choosethe most specific context in the following order: home, office, other meaningful, elsewhere.
3.4.4 Context Classification Performance. The Device Analyzer dataset does not contain any ground truthregarding location context, so we can not directly assess the accuracy of our context detection algorithm. Wetherefore applied the algorithm to a different, much smaller dataset that contained location labels. The datasetused for context classification performance assessment is the AlgoSnap Crowdsignals5 pilot dataset, the result of acrowdfunded, handset-based data collection from August to November 2016 with 31 participants, 20 males and 11females, of varying age, education and ethnicity. Of the 31 participants, 23 reported to be employed while 8 statedto be not employed, not able to work or retired. The dataset captures a variety of different features, includingWi-Fi scan results and cell connections. More importantly, participants where asked different labeling questionsat random when unlocking their phone, one of which was asking for their current location. Allowed answersincluded, among others, Home, Work, Bank, Hotel, Church, and Restaurant, with the most recent selection beingpreselected. Participants could always choose to dismiss the question or disable them permanently but wherepaid $ 0.05 per response.
We applied the user context classification described above to the Crowdsignals dataset to measure the accuracyof the context prediction. We were not able to detect a home location for three of the participants, so they whereexcluded from further analysis (note that we also exclude devices for which no home context could be establishedfrom the device usage study). With the average number of context ground truth from the lockscreen surveybeing 757 labels per user, we also excluded five users who provided less than a quarter of the mean number of5https://crowdsignals.io
Proceedings of the ACM on Interactive, Mobile, Wearable and Ubiquitous Technologies, Vol. 1, No. 2, Article 13. Publication date: June 2017.

A Large-Scale, Long-Term Analysis of Mobile Device Usage Characteristics • 13:9
ground truth labels. Finally, we removed three more users who seemed to have provided a significant amount ofimplausible labels. One user, for example, reported being in a restaurant every single time over the course ofseveral weeks - most likely submitting the answer to earn money but not actually adjusting the selected location.
Table 1. Context detection confusion matrix
ReferencePrediction Home Office Other
Home 3,777 704 1,616Office 261 939 649Other 1,494 854 1,735
Table 2. Classifier statistics by class
Home Office OtherSensitivity 0.6828 0.3761 0.4338Specificity 0.6429 0.9045 0.7076
Pos Pred Value 0.6195 0.5078 0.4249Neg Pred Value 0.7041 0.8470 0.7150
Balanced Accuracy 0.6628 0.6403 0.5707
For the remaining 21 users we evaluated the performance of our context classification algorithm againstthe ground truth labels from the Crowdsignals dataset. Aberrant from the algorithm stated above, we did notdistinguish between other meaningful and elsewhere contexts because the ground truth labels did not allow toreliably distinguish them. The results in table 2 show that with 62% the performance of home context detection isclose to [13], who reported a positive predictive value (PPV) of 66%. Office detection, however, performs less wellwith a PPV of only 51% whereas [13] reported 74%. As table 1 shows, class distribution in the ground truth isnotably skewed, so the balanced accuracy offers a more meaningful metric. The classification achieves a balancedaccuracy of 66% for home detection and 64% for office detection. When interpreting these results, however, oneshould keep in mind that the labels used as ground truth itself contain a certain degree of human error, thuslimiting the validity of this performance analysis.
4 RESULTS AND DISCUSSIONIn this section we present and discuss our results. Studying locked and unlocked usage sessions for certaincharacteristics constitute the core results of this work. Examined characteristics include: average device usagetime per day, average usage session duration and average amount of usage sessions per day. For each locked,unlocked, and overall usage sessions we compute mean and median number of daily interactions as well as meanand median daily usage time in regard to context and form factor. For each device, this is done by calculating themean and median for each feature over all observed days. The mean and median locked, unlocked, and overallsession durations are calculated across the entire observation period for each device, again in relation to contextand form factor. We then calculate the grand mean (mean of the means of all devices) and the grand median(median of the medians of all devices). Table 3 summarizes our results and compares them to findings of previousmobile device usage studies.
4.1 Context DetectionComparing GSM and Wi-Fi-based location detection, as expected we found Wi-Fi-based location detection toyield better results in most situations. Quality of results was measured by the amount of distinctly detectedhome and office contexts. We assume two reasons for the higher quality of Wi-Fi-based location detection: First,Wi-Fi signals have a smaller signal range compared to GSM signals, hence allowing a more precise detection oflocations. Secondly, parameterizing the clustering of cell IDs means to balance under- and over-clustering, inwhich either multiple clusters exist for one abstract location or multiple locations are falsely grouped together.Moreover, cell ID information are not available for around half the analyzed tablet devices. However, Wi-Fi-basedlocation detection as well does not always yield results, for instance at work places without any Wi-Fi accesspoints in range.
Proceedings of the ACM on Interactive, Mobile, Wearable and Ubiquitous Technologies, Vol. 1, No. 2, Article 13. Publication date: June 2017.

13:10 • Daniel Hintze, Philipp Hintze, Rainhard D. Findling, and René Mayrhofer
Hence, combining both location sources improved the overall result in every situation. In particular, homecontext could be detected for 88% of the phones and 83% of the tablet devices, as outlined in fig. 4. For 80% ofthe phone-type devices office context was detected while only for 53% of the tablet devices an office contextwas found. This is to be expected, considering that tablet devices are less handy and thus less often brought towork, compared to smartphones. To not distort results, we excluded devices for which no home context could bedetected from consecutive usage session analysis.
Fig. 4. Context detection results Fig. 5. Repeated measures ANOVA descriptives of daily ses-sion count on phones by context
4.2 Number of Daily InteractionsWhen looking at the number of daily interactions, it is noticeable that the majority of interactions does notinclude unlocking the device. Overall, people used their phones on average 60 times per day but only unlockedthem for half (46%) of the interactions. Tablet devices are used less than half as often, namely 23 times perday on average with a similar unlocked usage share of 38%. Since locked usage only allows for a limited setof actions, mainly checking information, the high proportion of locked sessions can be explained by checkinghabits as described by Oulasvirta et al. [22]. We note that the average number of daily device interactions variesconsiderably across users, as figs. 6 and 7 illustrate.
Fig. 6. Mean number of sessions per day/user on phones Fig. 7. Mean number of sessions per day/user on tablets
Proceedings of the ACM on Interactive, Mobile, Wearable and Ubiquitous Technologies, Vol. 1, No. 2, Article 13. Publication date: June 2017.
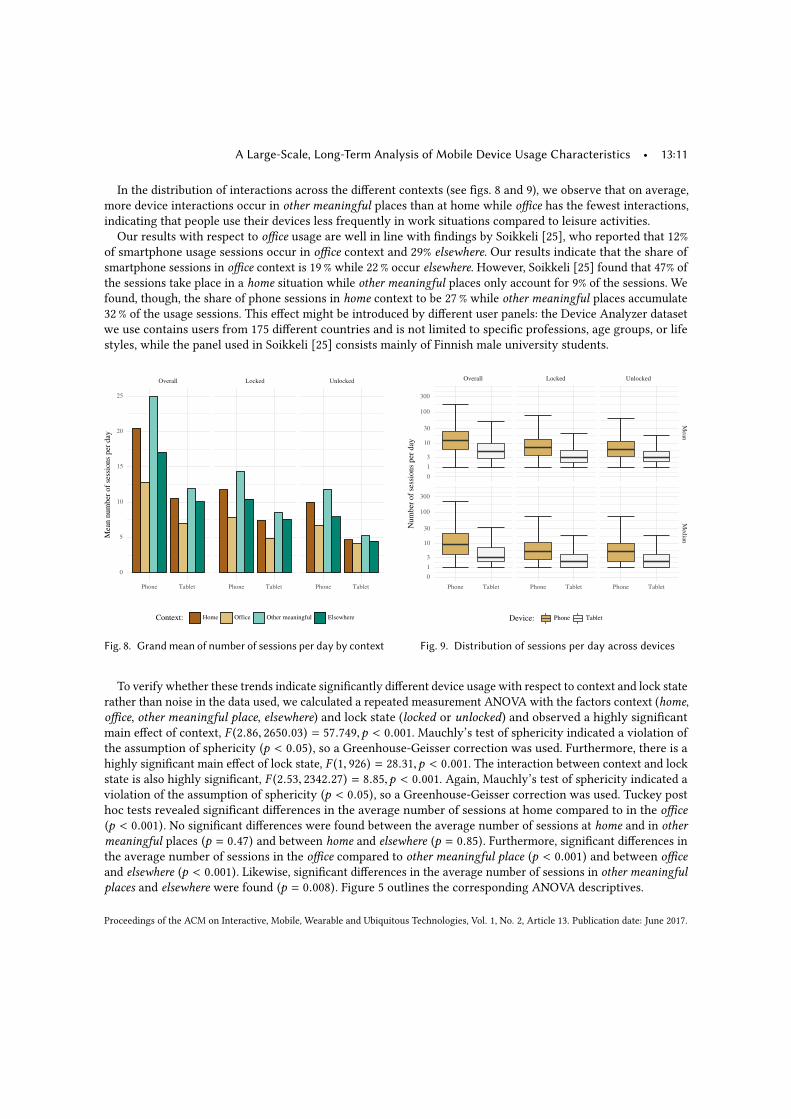
A Large-Scale, Long-Term Analysis of Mobile Device Usage Characteristics • 13:11
In the distribution of interactions across the different contexts (see figs. 8 and 9), we observe that on average,more device interactions occur in other meaningful places than at home while office has the fewest interactions,indicating that people use their devices less frequently in work situations compared to leisure activities.Our results with respect to office usage are well in line with findings by Soikkeli [25], who reported that 12%
of smartphone usage sessions occur in office context and 29% elsewhere. Our results indicate that the share ofsmartphone sessions in office context is 19% while 22% occur elsewhere. However, Soikkeli [25] found that 47% ofthe sessions take place in a home situation while other meaningful places only account for 9% of the sessions. Wefound, though, the share of phone sessions in home context to be 27% while other meaningful places accumulate32% of the usage sessions. This effect might be introduced by different user panels: the Device Analyzer datasetwe use contains users from 175 different countries and is not limited to specific professions, age groups, or lifestyles, while the panel used in Soikkeli [25] consists mainly of Finnish male university students.
Fig. 8. Grandmean of number of sessions per day by context Fig. 9. Distribution of sessions per day across devices
To verify whether these trends indicate significantly different device usage with respect to context and lock staterather than noise in the data used, we calculated a repeated measurement ANOVA with the factors context (home,office, other meaningful place, elsewhere) and lock state (locked or unlocked) and observed a highly significantmain effect of context, F (2.86, 2650.03) = 57.749,p < 0.001. Mauchly’s test of sphericity indicated a violation ofthe assumption of sphericity (p < 0.05), so a Greenhouse-Geisser correction was used. Furthermore, there is ahighly significant main effect of lock state, F (1, 926) = 28.31,p < 0.001. The interaction between context and lockstate is also highly significant, F (2.53, 2342.27) = 8.85,p < 0.001. Again, Mauchly’s test of sphericity indicated aviolation of the assumption of sphericity (p < 0.05), so a Greenhouse-Geisser correction was used. Tuckey posthoc tests revealed significant differences in the average number of sessions at home compared to in the office(p < 0.001). No significant differences were found between the average number of sessions at home and in othermeaningful places (p = 0.47) and between home and elsewhere (p = 0.85). Furthermore, significant differences inthe average number of sessions in the office compared to other meaningful place (p < 0.001) and between officeand elsewhere (p < 0.001). Likewise, significant differences in the average number of sessions in other meaningfulplaces and elsewhere were found (p = 0.008). Figure 5 outlines the corresponding ANOVA descriptives.
Proceedings of the ACM on Interactive, Mobile, Wearable and Ubiquitous Technologies, Vol. 1, No. 2, Article 13. Publication date: June 2017.

13:12 • Daniel Hintze, Philipp Hintze, Rainhard D. Findling, and René Mayrhofer
Fig. 10. Repeated measures ANOVA descriptives of meanusage session duration on phones by context
Fig. 11. Kernel density estimate for locked session durationdistribution.
4.3 Session DurationRegarding session duration, we found that in general, usage sessions on tablet devices last more than twice aslong as phone usage sessions. Locked sessions on average last 107 seconds on phones (median 57 seconds) whilespanning 271 seconds on tablet devices (median 84 seconds). Locked sessions being longer for tablet devicescompared to smartphones are presumably caused by the fact that tablets are configured with an average displaytimeout of 6.6minutes while smartphones feature a mean display timeout of only 2.8minutes. As locked usagesessions are usually short, they are more prone to distortion caused by display timeouts counted towards usagetime in cases in which the user does not manually switch off the device’s screen, which technically marks the endof the usage session. Figure 11 illustrates the degree of distortion, outlining common display timeout intervals inthe kernel density estimate for the distribution of locked session duration.
Fig. 12. Grand mean of session duration by context Fig. 13. Distribution of session duration across devices
Average unlocked sessions span 307 seconds on phones (median 73 seconds) while lasting for 963 seconds ontablets (median 297 seconds). Interestingly, context seems to have a noticeable effect on session duration (see
Proceedings of the ACM on Interactive, Mobile, Wearable and Ubiquitous Technologies, Vol. 1, No. 2, Article 13. Publication date: June 2017.

A Large-Scale, Long-Term Analysis of Mobile Device Usage Characteristics • 13:13
fig. 12): In home context, sessions on both tablet and phone devices are considerably longer than in other contextswhile sessions in office context are usually the shortest. On tablet devices, for instance, unlocked sessions inhome context have an average duration of 11.4 minutes while in office context, unlocked sessions would only last6.7 minutes.Again, session duration is highly diverse, both across sessions and across users by more than an order of
magnitude. For example, the median across the mean unlocked session lengths of tablet devices is 683 seconds,compared to a mean of 963 seconds, which is biased by a mean session length of up to 387 minutes on somedevices. Figure 13 therefore again depicts the distribution of both mean and median of the session duration perdevice for locked, unlocked and overall usage.
To verify the statistical significance of the observed trends a repeated measurement ANOVA with the factorscontext (home, office, other meaningful place, elsewhere) and lock state (locked or unlocked) was calculated forthe average sessions duration per day. There was a highly significant main effect of context, F (1.46, 1698.55) =21.67,p < 0.001. Mauchly’s test of sphericity indicated a violation of the assumption of sphericity (p < 0.05),so a Greenhouse-Geisser correction was used. Furthermore, there was a highly significant main effect of lockstate, F (1, 1165) = 718.58,p < 0.001. The interaction between context and lock state was also highly significant,F (1.67, 1947.04) = 10.82,p < 0.001. Mauchly’s test of sphericity again indicated a violation of the assumption ofsphericity (p < 0.05), so a Greenhouse-Geisser correction was used. Tuckey post hoc tests revealed significantdifferences in the average session length at home compared to in the office (p < 0.001) and at home comparedto at the other meaningful place (p < 0.001) or elsewhere (p < 0.001). Furthermore, significant differences inthe average session length in office compared to other meaningful place (p < 0.019) were found. There were nosignificant differences in the average session length between office and elsewhere (p = 0.095) and between othermeaningful place and elsewhere (p = 0.93). Figure 10 outlines the corresponding ANOVA descriptives
Fig. 14. Grand mean of device usage per day by context Fig. 15. Distribution of daily usage across devices
4.4 Daily Usage DurationWe found that the average locked device usage per day for phones and tablets is fairly close (36 minutes vs.25 minutes), as the tablets’ longer sessions compensate for the higher number of sessions on phones. Unlocked
Proceedings of the ACM on Interactive, Mobile, Wearable and Ubiquitous Technologies, Vol. 1, No. 2, Article 13. Publication date: June 2017.
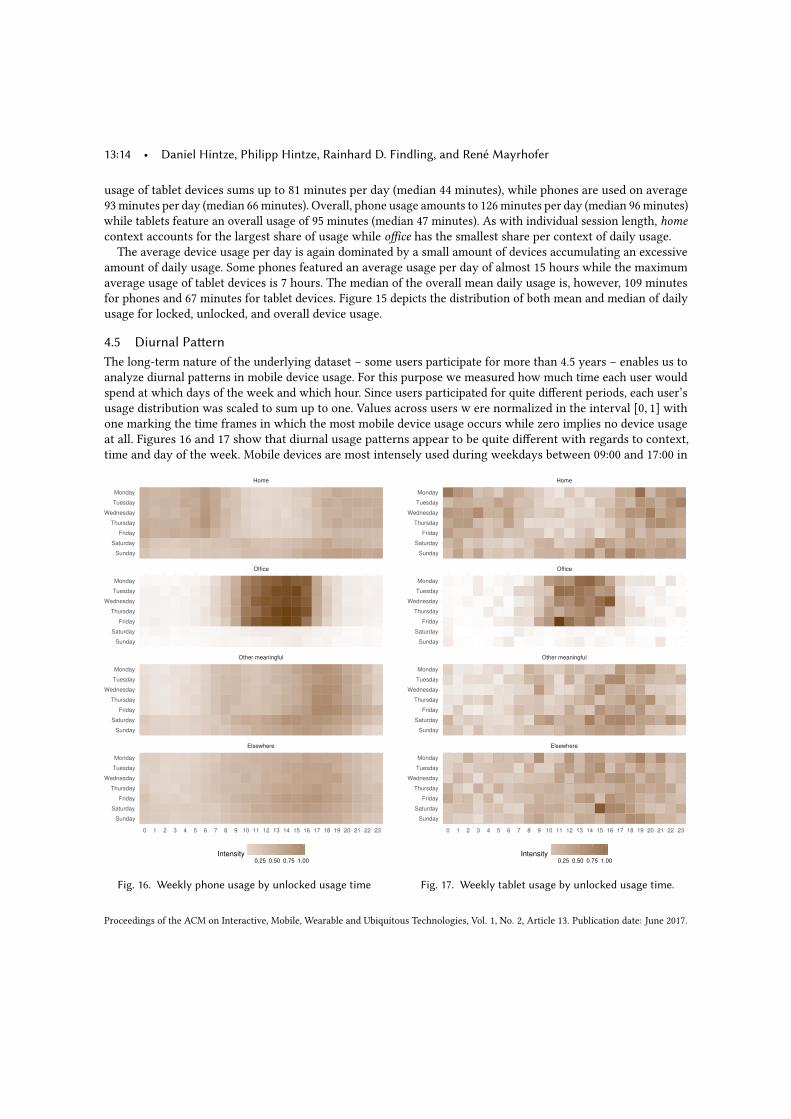
13:14 • Daniel Hintze, Philipp Hintze, Rainhard D. Findling, and René Mayrhofer
usage of tablet devices sums up to 81 minutes per day (median 44 minutes), while phones are used on average93minutes per day (median 66minutes). Overall, phone usage amounts to 126minutes per day (median 96minutes)while tablets feature an overall usage of 95 minutes (median 47 minutes). As with individual session length, homecontext accounts for the largest share of usage while office has the smallest share per context of daily usage.
The average device usage per day is again dominated by a small amount of devices accumulating an excessiveamount of daily usage. Some phones featured an average usage per day of almost 15 hours while the maximumaverage usage of tablet devices is 7 hours. The median of the overall mean daily usage is, however, 109 minutesfor phones and 67 minutes for tablet devices. Figure 15 depicts the distribution of both mean and median of dailyusage for locked, unlocked, and overall device usage.
4.5 Diurnal PatternThe long-term nature of the underlying dataset – some users participate for more than 4.5 years – enables us toanalyze diurnal patterns in mobile device usage. For this purpose we measured how much time each user wouldspend at which days of the week and which hour. Since users participated for quite different periods, each user’susage distribution was scaled to sum up to one. Values across users w ere normalized in the interval [0, 1] withone marking the time frames in which the most mobile device usage occurs while zero implies no device usageat all. Figures 16 and 17 show that diurnal usage patterns appear to be quite different with regards to context,time and day of the week. Mobile devices are most intensely used during weekdays between 09:00 and 17:00 in
Fig. 16. Weekly phone usage by unlocked usage time Fig. 17. Weekly tablet usage by unlocked usage time.
Proceedings of the ACM on Interactive, Mobile, Wearable and Ubiquitous Technologies, Vol. 1, No. 2, Article 13. Publication date: June 2017.
A Large-Scale, Long-Term Analysis of Mobile Device Usage Characteristics • 13:15
the office context, e.g., at work or in class. For home and other meaningful, one can observe different pattern forweekdays and weekends. At home, usage during early morning hours seems to be less intense at weekends thanduring the week while the reverse seems to be true for other meaningful places. These patterns are quite obviousfor phones while the tablet data seem more noisy. This is at least in part due to the fact that significantly moredata was available for phones than for tablets (a total of more than 207 years of active phone usage sessions vs. 12years of active tablet usage). We note that analyzing diurnal pattern across all users is not ideal, since users withdifferent patterns, e.g., morning person and late riser, blur the overall picture when combined. It is still sufficientto illustrate the point that context, time and day of week seem to have a notable effect on mobile device usage.When considering day-based statistics, it is also worth pointing out that the extent of device usage tends to
vary considerably on the long term. Figure 18 shows the monthly usage of a single phone over the course of 42months (67,844 usage sessions), with usage varying from 37.5 hours to 9.8 hours per month.
Fig. 18. Usage of a single phone over the course of several months
4.6 Device UnlockingApart from analyzing unlocked device usage, we analyzed how users lock their devices based on all devices withinthe original dataset featuring the required information. Unlocking a device requires either slide-to-unlock orsome form of authentication like PIN, password, or graphical pattern. Since the underlying dataset unfortunatelyonly labels graphical pattern-based unlocking explicitly, means of comparing different authentication methodsare limited. However, pattern unlock seems to be quite popular, as it is enabled on 35% of the smartphones andon 24% of the tablet devices. Of these devices, 72% are configured to provide visual feedback while entering thepattern, increasing the vulnerability to so-called shoulder surfing attacks, i.e., capturing the secret pattern bylooking over the user’s shoulder during device unlocking [3, 32]. On 8% of the phones and 15% of the tablets noform of device locking, not even slide-to-unlock, is enabled (see fig. 19).
One aspect of the usability of unlocking mechanisms is the speed at which the device can be unlocked. Usingthe state machine approach described in fig. 3, we measure the time between turning the device’s screen on andunlocking the device, indicated by a USER_PRESENT intent broadcasted by the Android system when the deviceis unlocked. The 20.7 million unlocking sessions we extracted that way, however, also contain sessions in whichthe user turns the device on but only attempts to unlock it after several minutes (given a long display timeout isconfigured). We therefore choose an upper limit of 10 seconds and only take shorter unlocking sessions intoaccount, which leaves us with 19.6 million sessions.
Proceedings of the ACM on Interactive, Mobile, Wearable and Ubiquitous Technologies, Vol. 1, No. 2, Article 13. Publication date: June 2017.
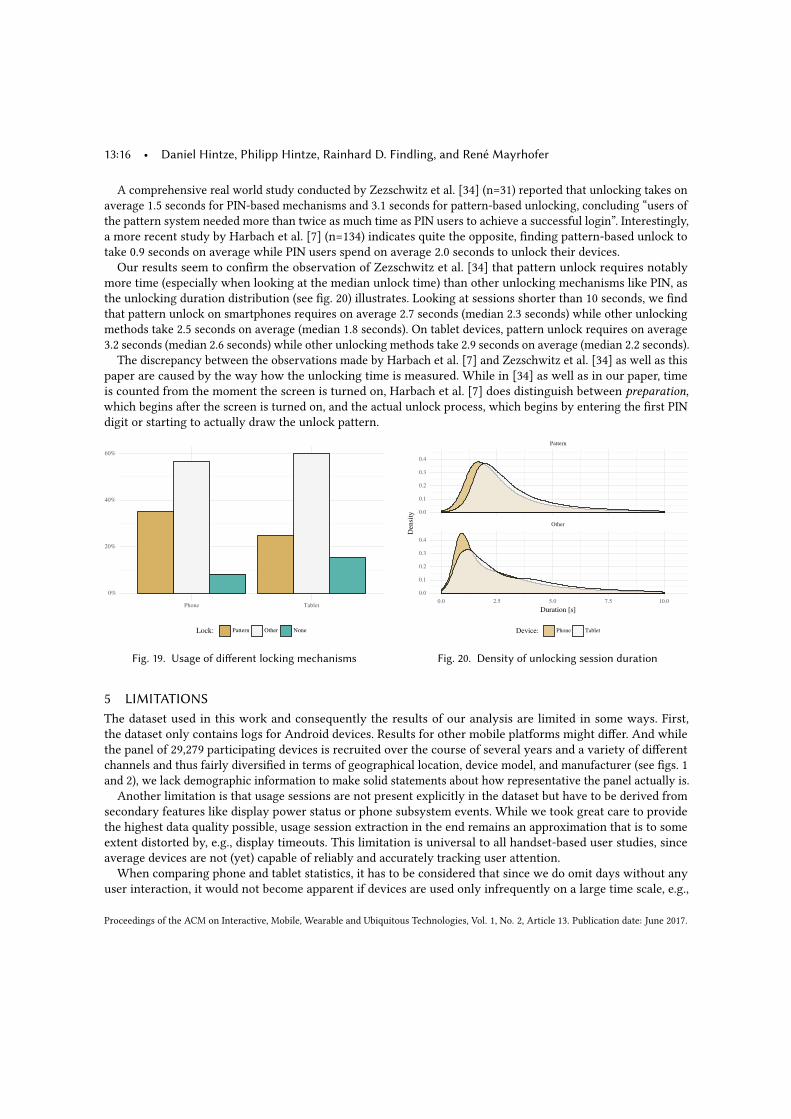
13:16 • Daniel Hintze, Philipp Hintze, Rainhard D. Findling, and René Mayrhofer
A comprehensive real world study conducted by Zezschwitz et al. [34] (n=31) reported that unlocking takes onaverage 1.5 seconds for PIN-based mechanisms and 3.1 seconds for pattern-based unlocking, concluding “users ofthe pattern system needed more than twice as much time as PIN users to achieve a successful login”. Interestingly,a more recent study by Harbach et al. [7] (n=134) indicates quite the opposite, finding pattern-based unlock totake 0.9 seconds on average while PIN users spend on average 2.0 seconds to unlock their devices.Our results seem to confirm the observation of Zezschwitz et al. [34] that pattern unlock requires notably
more time (especially when looking at the median unlock time) than other unlocking mechanisms like PIN, asthe unlocking duration distribution (see fig. 20) illustrates. Looking at sessions shorter than 10 seconds, we findthat pattern unlock on smartphones requires on average 2.7 seconds (median 2.3 seconds) while other unlockingmethods take 2.5 seconds on average (median 1.8 seconds). On tablet devices, pattern unlock requires on average3.2 seconds (median 2.6 seconds) while other unlocking methods take 2.9 seconds on average (median 2.2 seconds).
The discrepancy between the observations made by Harbach et al. [7] and Zezschwitz et al. [34] as well as thispaper are caused by the way how the unlocking time is measured. While in [34] as well as in our paper, timeis counted from the moment the screen is turned on, Harbach et al. [7] does distinguish between preparation,which begins after the screen is turned on, and the actual unlock process, which begins by entering the first PINdigit or starting to actually draw the unlock pattern.
Fig. 19. Usage of different locking mechanisms Fig. 20. Density of unlocking session duration
5 LIMITATIONSThe dataset used in this work and consequently the results of our analysis are limited in some ways. First,the dataset only contains logs for Android devices. Results for other mobile platforms might differ. And whilethe panel of 29,279 participating devices is recruited over the course of several years and a variety of differentchannels and thus fairly diversified in terms of geographical location, device model, and manufacturer (see figs. 1and 2), we lack demographic information to make solid statements about how representative the panel actually is.
Another limitation is that usage sessions are not present explicitly in the dataset but have to be derived fromsecondary features like display power status or phone subsystem events. While we took great care to providethe highest data quality possible, usage session extraction in the end remains an approximation that is to someextent distorted by, e.g., display timeouts. This limitation is universal to all handset-based user studies, sinceaverage devices are not (yet) capable of reliably and accurately tracking user attention.When comparing phone and tablet statistics, it has to be considered that since we do omit days without any
user interaction, it would not become apparent if devices are used only infrequently on a large time scale, e.g.,
Proceedings of the ACM on Interactive, Mobile, Wearable and Ubiquitous Technologies, Vol. 1, No. 2, Article 13. Publication date: June 2017.

A Large-Scale, Long-Term Analysis of Mobile Device Usage Characteristics • 13:17
once per month. While tablets in our analysis are used on average on less days of the observation period comparedto phones, we think the discrepancy is not at a scale that prohibits direct comparison. In particular, we used onaverage 81% of all days recorded on phones and 74% of all days in the observation period recorded on tablets.
The context classification algorithm used in our work is, due to a lack of ground truth, fuzzy, which has to betaken into account when interpreting the results in terms of different contexts.The dataset does not contain information to infer whether multiple devices, e.g., a phone and a tablet, are
owned by the same person. This does limit our results to device-based statistics instead of user-based statistics,which might be more relevant for certain applications (see [5] for such an analysis).
While we argue that the aspects of mobile device usage analyzed in this paper are very useful for a number offields and applications, there are doubtlessly a number of other device usage features for which a large scalestudy could provide useful insights, for instance which applications users spend time on or how users switchbetween different applications. One work that studied those features on a larger scale (n = 4125) is Böhmer et al.[1], but given that their data were collected more than 7 years ago and modern smartphones have only beenaround for about 10 years, a new analysis based on current data would certainly be useful. While the DeviceAnalyzer dataset contains information about installed and used applications, they are obfuscated to protect theprivacy of the participants and allow no insight into the purpose of the application or even comparison acrossusers. Therefore, we were unfortunately not able to provide more insight into these aspects within the scope ofthis study.
6 CONCLUSIONIn this work we studied locked and unlocked mobile device usage with respect to device form factor and usercontext. For our study we extracted a total of 56.3 million usage sessions from 225 billion mobile device usagerecords using a sophisticated screen power state machine-based approach. By combining anonymized GSM cellIDs, Wi-Fi scan results, and timestamps of records we derived location information for usage sessions. Throughmaking (presumably) reasonable assumptions about standard users’ diurnal patterns, we were able to makefair guesses about users’ locational context, identifying home context for 88% and office context for 80% of thesmartphone devices.
Consistent with previous studies we found high diversity in device usage characteristics, both across sessionsand users, varying with more than an order of magnitude. We observed that on average, smartphones are usedalmost thrice as much per day as tablet devices (60 times vs. 23 times). However, devices are unlocked in only46% of the interactions. Given the limited forms of interaction available in locked state, the high share of lockedusage indicates that the majority of usage constitutes some form of short information checking. Our resultsshow that 19% of smartphone usage occurs in office context and 27% in home context. Contrary to the numberof interactions, we found that the duration of usage sessions is in general more than twice as long for tabletscompared to smartphones: on average, unlocked sessions on phones last 307 seconds while tablet usage sessionsaccount for 963 seconds. Thus, the daily usage of both smartphones and tablets are not far off (93 minutesvs. 81 minutes). Again, home context accounts for the largest share of usage while office has the smallest shareper context of daily usage.Our work shows that despite offering similar technical capabilities, smartphones and tablets are used quite
differently. While substantial research has been conducted with respect to smartphone usage, little work hasbeen done to analyze tablet usage. With the increasing ubiquity of mobile devices, people tend to simultaneouslyown and use several devices of different form factors like phones, tablets, and smartwatches. Further researchis needed, e.g., on when and why users change between different device types, and to include the newer formfactors like smartwatches, -glasses, etc.The results of our work are applicable to a number of research topics but are also relevant for practitioners.
Application developers for instance should make use of the – somewhat surprising – fact that a signification
Proceedings of the ACM on Interactive, Mobile, Wearable and Ubiquitous Technologies, Vol. 1, No. 2, Article 13. Publication date: June 2017.
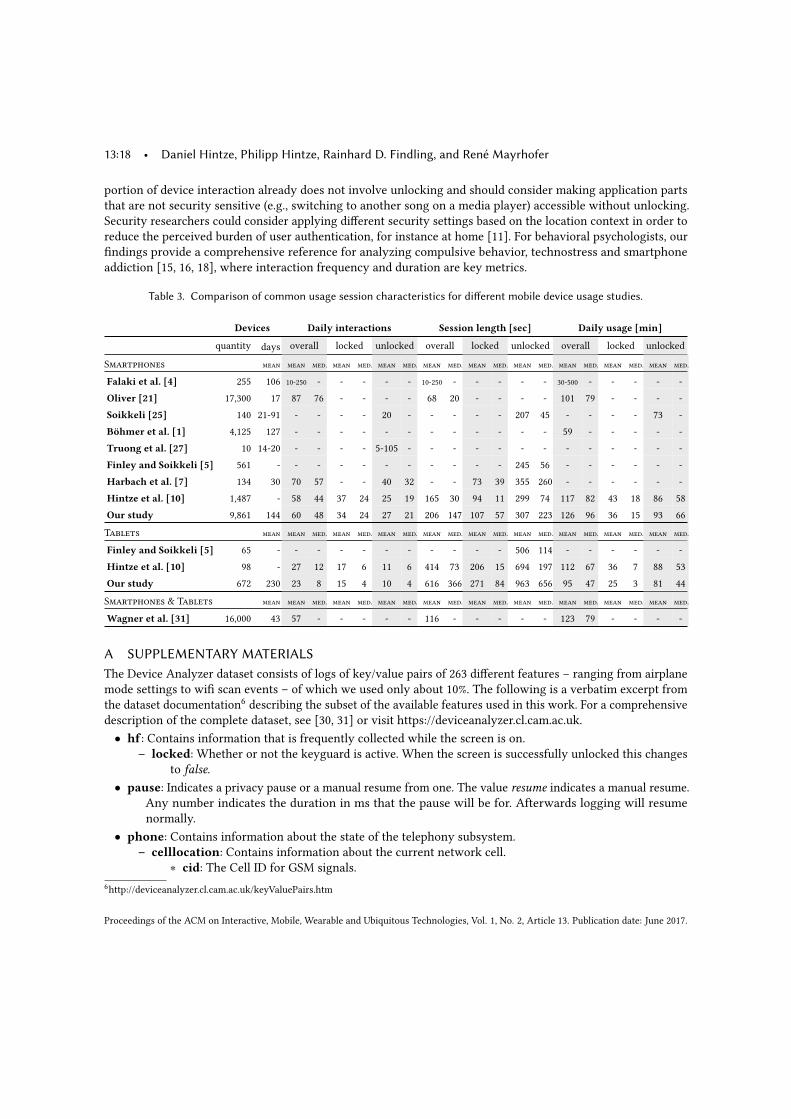
13:18 • Daniel Hintze, Philipp Hintze, Rainhard D. Findling, and René Mayrhofer
portion of device interaction already does not involve unlocking and should consider making application partsthat are not security sensitive (e.g., switching to another song on a media player) accessible without unlocking.Security researchers could consider applying different security settings based on the location context in order toreduce the perceived burden of user authentication, for instance at home [11]. For behavioral psychologists, ourfindings provide a comprehensive reference for analyzing compulsive behavior, technostress and smartphoneaddiction [15, 16, 18], where interaction frequency and duration are key metrics.
Table 3. Comparison of common usage session characteristics for different mobile device usage studies.
Devices Daily interactions Session length [sec] Daily usage [min]
quantity days overall locked unlocked overall locked unlocked overall locked unlocked
Smartphones mean mean med. mean med. mean med. mean med. mean med. mean med. mean med. mean med. mean med.
Falaki et al. [4] 255 106 10-250 - - - - - 10-250 - - - - - 30-500 - - - - -Oliver [21] 17,300 17 87 76 - - - - 68 20 - - - - 101 79 - - - -Soikkeli [25] 140 21-91 - - - - 20 - - - - - 207 45 - - - - 73 -Böhmer et al. [1] 4,125 127 - - - - - - - - - - - - 59 - - - - -Truong et al. [27] 10 14-20 - - - - 5-105 - - - - - - - - - - - - -Finley and Soikkeli [5] 561 - - - - - - - - - - - 245 56 - - - - - -Harbach et al. [7] 134 30 70 57 - - 40 32 - - 73 39 355 260 - - - - - -Hintze et al. [10] 1,487 - 58 44 37 24 25 19 165 30 94 11 299 74 117 82 43 18 86 58Our study 9,861 144 60 48 34 24 27 21 206 147 107 57 307 223 126 96 36 15 93 66Tablets mean mean med. mean med. mean med. mean med. mean med. mean med. mean med. mean med. mean med.
Finley and Soikkeli [5] 65 - - - - - - - - - - - 506 114 - - - - - -Hintze et al. [10] 98 - 27 12 17 6 11 6 414 73 206 15 694 197 112 67 36 7 88 53Our study 672 230 23 8 15 4 10 4 616 366 271 84 963 656 95 47 25 3 81 44Smartphones & Tablets mean mean med. mean med. mean med. mean med. mean med. mean med. mean med. mean med. mean med.
Wagner et al. [31] 16,000 43 57 - - - - - 116 - - - - - 123 79 - - - -
A SUPPLEMENTARY MATERIALSThe Device Analyzer dataset consists of logs of key/value pairs of 263 different features – ranging from airplanemode settings to wifi scan events – of which we used only about 10%. The following is a verbatim excerpt fromthe dataset documentation6 describing the subset of the available features used in this work. For a comprehensivedescription of the complete dataset, see [30, 31] or visit https://deviceanalyzer.cl.cam.ac.uk.• hf: Contains information that is frequently collected while the screen is on.
– locked: Whether or not the keyguard is active. When the screen is successfully unlocked this changesto false.
• pause: Indicates a privacy pause or a manual resume from one. The value resume indicates a manual resume.Any number indicates the duration in ms that the pause will be for. Afterwards logging will resumenormally.
• phone: Contains information about the state of the telephony subsystem.– celllocation: Contains information about the current network cell.
∗ cid: The Cell ID for GSM signals.6http://deviceanalyzer.cl.cam.ac.uk/keyValuePairs.htm
Proceedings of the ACM on Interactive, Mobile, Wearable and Ubiquitous Technologies, Vol. 1, No. 2, Article 13. Publication date: June 2017.
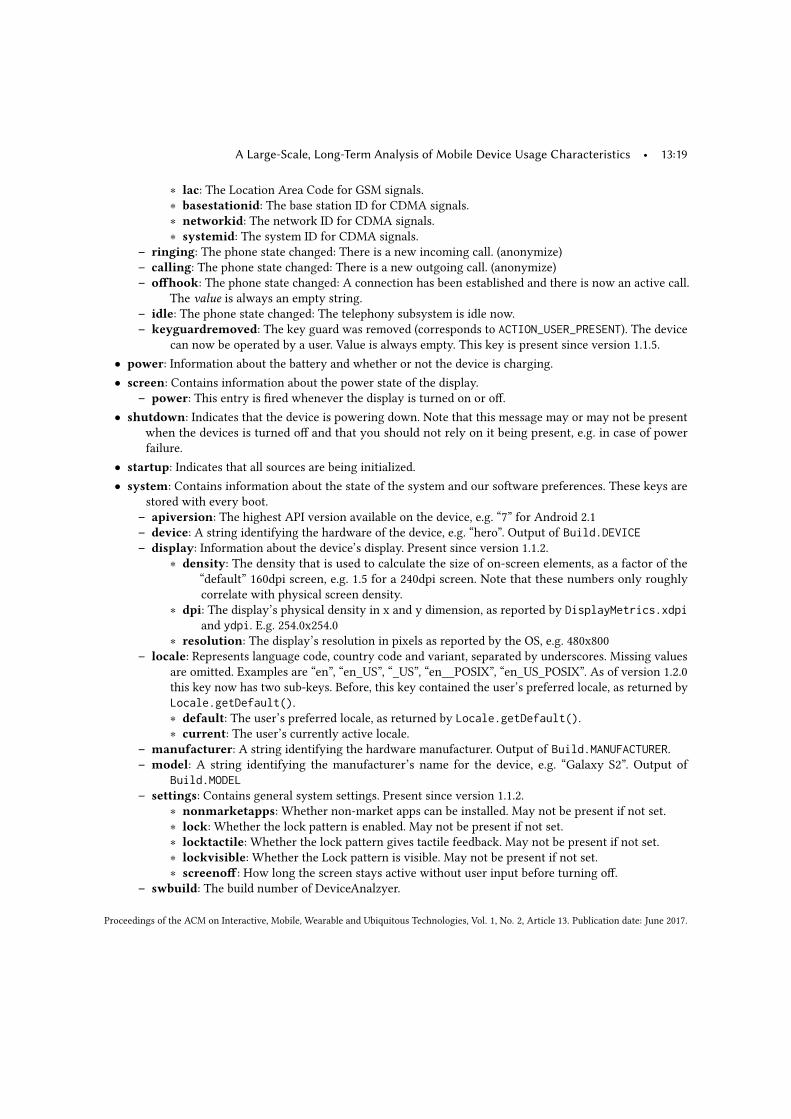
A Large-Scale, Long-Term Analysis of Mobile Device Usage Characteristics • 13:19
∗ lac: The Location Area Code for GSM signals.∗ basestationid: The base station ID for CDMA signals.∗ networkid: The network ID for CDMA signals.∗ systemid: The system ID for CDMA signals.
– ringing: The phone state changed: There is a new incoming call. (anonymize)– calling: The phone state changed: There is a new outgoing call. (anonymize)– offhook: The phone state changed: A connection has been established and there is now an active call.
The value is always an empty string.– idle: The phone state changed: The telephony subsystem is idle now.– keyguardremoved: The key guard was removed (corresponds to ACTION_USER_PRESENT). The device
can now be operated by a user. Value is always empty. This key is present since version 1.1.5.• power: Information about the battery and whether or not the device is charging.• screen: Contains information about the power state of the display.
– power: This entry is fired whenever the display is turned on or off.• shutdown: Indicates that the device is powering down. Note that this message may or may not be present
when the devices is turned off and that you should not rely on it being present, e.g. in case of powerfailure.
• startup: Indicates that all sources are being initialized.• system: Contains information about the state of the system and our software preferences. These keys are
stored with every boot.– apiversion: The highest API version available on the device, e.g. “7” for Android 2.1– device: A string identifying the hardware of the device, e.g. “hero”. Output of Build.DEVICE– display: Information about the device’s display. Present since version 1.1.2.
∗ density: The density that is used to calculate the size of on-screen elements, as a factor of the“default” 160dpi screen, e.g. 1.5 for a 240dpi screen. Note that these numbers only roughlycorrelate with physical screen density.
∗ dpi: The display’s physical density in x and y dimension, as reported by DisplayMetrics.xdpiand ydpi. E.g. 254.0x254.0
∗ resolution: The display’s resolution in pixels as reported by the OS, e.g. 480x800– locale: Represents language code, country code and variant, separated by underscores. Missing values
are omitted. Examples are “en”, “en_US”, “_US”, “en__POSIX”, “en_US_POSIX”. As of version 1.2.0this key now has two sub-keys. Before, this key contained the user’s preferred locale, as returned byLocale.getDefault().∗ default: The user’s preferred locale, as returned by Locale.getDefault().∗ current: The user’s currently active locale.
– manufacturer: A string identifying the hardware manufacturer. Output of Build.MANUFACTURER.– model: A string identifying the manufacturer’s name for the device, e.g. “Galaxy S2”. Output of
Build.MODEL– settings: Contains general system settings. Present since version 1.1.2.
∗ nonmarketapps: Whether non-market apps can be installed. May not be present if not set.∗ lock: Whether the lock pattern is enabled. May not be present if not set.∗ locktactile: Whether the lock pattern gives tactile feedback. May not be present if not set.∗ lockvisible: Whether the Lock pattern is visible. May not be present if not set.∗ screenoff: How long the screen stays active without user input before turning off.
– swbuild: The build number of DeviceAnalzyer.
Proceedings of the ACM on Interactive, Mobile, Wearable and Ubiquitous Technologies, Vol. 1, No. 2, Article 13. Publication date: June 2017.

13:20 • Daniel Hintze, Philipp Hintze, Rainhard D. Findling, and René Mayrhofer
– swversion: The human-readable version string of DeviceAnalyzer.• tethering: Generated when the system’s tethering state changes
– active: Lists all active tethering devices. If none are present, this entry is omitted.– available: Lists all available tethering devices. If none are present, this entry is omitted.– errored: Lists all failed tethering devices. If none are present, this entry is omitted.
• wifi: Contains information about currently visible wifi networks.– scancomplete: Marker that indicates that a wifi scan finished. The value contains the number of visible
APs, which will follow immediately after this marker.– scan: Results of a scan for wifi networks in range
∗ [BSSID]: The access point’s MAC address. (anonymize)∗ ssid: The network name that is displayed to the user. Multiple access points can belong to one
network. (anonymize)
ACKNOWLEDGMENTSWe thank the University of Cambridge for providing access to the Device Analyzer dataset and in particularAndrew Rice for instantaneously answering all our questions. Furthermore, we thank the four anonymousreviewers whose constructive criticism and suggestions helped improve and clarify an earlier draft of this paper.Additionally, we thank Klaus-Dieter Labahn for his thorough proofreading. Finally, we gratefully acknowledgefunding by the German Federal Ministry of Education and Research as well as u’smile, the Josef Ressel Center forUser-Friendly Secure Mobile Environments, funded by the Christian Doppler Gesellschaft, A1 Telekom AustriaAG, Drei-Banken-EDV GmbH, LG Nexera Business Solutions AG, NXP Semiconductors Austria GmbH, andÖsterreichische Staatsdruckerei GmbH.
REFERENCES[1] Matthias Böhmer, Brent Hecht, Johannes Schöning, Antonio Krüger, and Gernot Bauer. 2011. Falling asleep with Angry Birds, Facebook
and Kindle - A Large Scale Study on Mobile Application Usage. Proceedings of the 13th International Conference on Human ComputerInteraction with Mobile Devices and Services - MobileHCI ’11 January (2011), 47. DOI:https://doi.org/10.1145/2037373.2037383
[2] Guanling Chen and David Kotz. 2000. A Survey of Context-Aware Mobile Computing Research. Technical Report.[3] Alexander De Luca, Marian Harbach, Emanuel von Zezschwitz, Max-Emanuel Maurer, Bernhard Ewald Slawik, Heinrich Hussmann,
and Matthew Smith. 2014. Now You See Me , Now You Don’t - Protecting Smartphone Authentication from Shoulder Surfers. Sigchi(2014), 2937–2946. DOI:https://doi.org/10.1145/2556288.2557097
[4] Hossein Falaki, Ratul Mahajan, Srikanth Kandula, Dimitrios Lymberopoulos, Ramesh Govindan, and Deborah Estrin. 2010. Diversity inSmartphone Usage. Proceedings of the 8th international conference on Mobile systems, applications, and services - MobiSys ’10 (2010), 179.DOI:https://doi.org/10.1145/1814433.1814453
[5] Benjamin Finley and Tapio Soikkeli. 2016. Multidevice mobile sessions: A first look. Pervasive and Mobile Computing (in press) (2016).DOI:https://doi.org/10.1016/j.pmcj.2016.11.001
[6] Preetinder S Gill, Ashwini Kamath, and Tejkaran Singh Gill. 2012. Distraction: an assessment of smartphone usage in health care worksettings. Risk Manag Healthc Policy 5, 1 (2012), 105–14.
[7] Marian Harbach, Alexander De Luca, and Serge Egelman. 2016. The Anatomy of Smartphone Unlocking: A Field Study of Android LockScreens. In Proceedings of the 2016 CHI Conference on Human Factors in Computing Systems.
[8] Daniel Hintze, Rainhard Dieter Findling, Muhammad Muaaz, Eckhard Koch, and René Mayrhofer. 2015. CORMORANT: TowardsContinuous Risk-Aware Multi-Modal Cross-Device Authentication. UbiComp 2015 Adjunct Publication (2015).
[9] Daniel Hintze, Rainhard D Findling, Muhammad Muaaz, Sebastian Scholz, and René Mayrhofer. 2014. Diversity in Locked and UnlockedMobile Device Usage. In UbiComp 2014 Adjunct Publication. 379–384.
[10] Daniel Hintze, Rainhard Dieter Findling, Sebastian Scholz, and René Mayrhofer. 2014. Mobile Device Usage Characteristics: The Effectof Context and Form Factor on Locked and Unlocked Usage. In Proceedings of MoMM 2014.
[11] Daniel Hintze, Muhammad Muaaz, Rainhard Dieter Findling, Sebastian Scholz, Eckhard Koch, and René Mayrhofer. 2015. Confidenceand Risk Estimation Plugins for Multi-Modal Authentication on Mobile Devices using CORMORANT. In Proceedings of MoMM 2015.384–388.
Proceedings of the ACM on Interactive, Mobile, Wearable and Ubiquitous Technologies, Vol. 1, No. 2, Article 13. Publication date: June 2017.
A Large-Scale, Long-Term Analysis of Mobile Device Usage Characteristics • 13:21
[12] Daniel Hintze and Andrew Rice. 2016. Picky: Efficient and Reproducible Sharing of Large Datasets Using Merkle-Trees. 2016 IEEE 24thInternational Symposium on Modeling, Analysis and Simulation of Computer and Telecommunication Systems (MASCOTS) (2016), 30–38.DOI:https://doi.org/10.1109/MASCOTS.2016.25
[13] Borja Jiménez. 2008. Modeling of Mobile End-User Context. Ph.D. Dissertation. Helsinki University of Technology.[14] Jeffrey H Kuznekoff and Scott Titsworth. 2013. The impact of mobile phone usage on student learning. Communication Education 62, 3
(2013), 233–252.[15] Min Kwon, Joon-Yeop Lee, Wang-Youn Won, Jae-Woo Park, Jung-Ah Min, Changtae Hahn, Xinyu Gu, Ji-Hye Choi, and Dai-Jin Kim.
2013. Development and validation of a smartphone addiction scale (SAS). PloS one 8, 2 (2013), e56936.[16] Heyoung Lee, Heejune Ahn, Samwook Choi, and Wanbok Choi. 2014. The SAMS: Smartphone Addiction Management System and
Verification. Journal of Medical Systems 38, 1 (2014), 1. DOI:https://doi.org/10.1007/s10916-013-0001-1[17] Yu-Kang Lee, Chun-Tuan Chang, You Lin, and Zhao-Hong Cheng. 2014. The dark side of smartphone usage: Psychological traits,
compulsive behavior and technostress. Computers in Human Behavior 31 (2014), 373–383. DOI:https://doi.org/10.1016/j.chb.2013.10.047[18] Yu-Hsuan Lin, Yu-Cheng Lin, Yang-Han Lee, Po-Hsien Lin, Sheng-Hsuan Lin, Li-Ren Chang, Hsien-Wei Tseng, Liang-Yu Yen, Cheryl
C H Yang, and Terry B J Kuo. 2015. Time distortion associated with smartphone addiction: Identifying smartphone addiction via amobile application (App). Journal of Psychiatric Research 65 (2015), 139–145. DOI:https://doi.org/10.1016/j.jpsychires.2015.04.003
[19] Gonçalo M. S. Marques and Rui Pitarma. 2016. Smartphone Application for Enhanced Indoor Health Environments. Journal ofInformation Systems Engineering & Management 1, 4 (2016), 1–9. DOI:https://doi.org/10.20897/lectito.201649
[20] Hendrik Müller, Jennifer Gove, and John Webb. 2012. Understanding Tablet Use - A Multi-Method Exploration. Proceedings of the14th International Conference on Human-Computer Interaction with Mobile Devices and Services (MobileHCI’12) (2012), 1–10. DOI:https://doi.org/10.1145/2371574.2371576
[21] Earl Oliver. 2010. The Challenges in Large-Scale Smartphone User Studies. Proceedings of the 2nd ACM International Workshop on HotTopics in Planet-scale Measurement - HotPlanet ’10 (2010), 1. DOI:https://doi.org/10.1145/1834616.1834623
[22] Antti Oulasvirta, Tye Rattenbury, Lingyi Ma, and Eeva Raita. 2011. Habits make smartphone use more pervasive. Personal and UbiquitousComputing 16, 1 (jun 2011), 105–114. DOI:https://doi.org/10.1007/s00779-011-0412-2
[23] Charlie Pinder, Russell Beale, and Robert J Hendley. 2016. Accept the Banana : Exploring Incidental Cognitive Bias ModificationTechniques on Smartphones. CHI Extended Abstracts on Human Factors in Computing Systems (2016), 2923–2931. DOI:https://doi.org/10.1145/2851581.2892453
[24] Husnjak Siniša, Peraković Dragan, and Cvitić Ivan. 2016. Relevant Affect Factors of Smartphone Mobile Data Traffic. Promet -Traffic&Transportation 28, 4 (2016), 435–444. DOI:https://doi.org/10.7307/ptt.v28i4.2091
[25] Tapio Soikkeli. 2011. The effect of context on smartphone usage sessions. Master’s Thesis. Aalto University School of Science.[26] T. Soikkeli, J. Karikoski, and H. Hammainen. 2011. Diversity and End User Context in Smartphone Usage Sessions. 2011 Fifth International
Conference on Next Generation Mobile Applications, Services and Technologies (Sept 2011), 7–12. DOI:https://doi.org/10.1109/NGMAST.2011.12
[27] Khai N. Truong, Thariq Shihipar, and Daniel J. Wigdor. 2014. Slide to X: Unlocking the Potential of Smartphone Unlocking. InProceedings of the SIGCHI Conference on Human Factors in Computing Systems (CHI ’14). ACM, New York, NY, USA, 3635–3644. DOI:https://doi.org/10.1145/2556288.2557044
[28] Niels van Berkel, Chu Luo, Theodoros Anagnostopoulos, Denzil Ferreira, Jorge Goncalves, Simo Hosio, and Vassilis Kostakos. 2016. ASystematic Assessment of Smartphone Usage Gaps. Proceedings of the 2016 CHI Conference on Human Factors in Computing Systems(2016), 4711–4721. DOI:https://doi.org/10.1145/2858036.2858348
[29] Hannu Verkasalo. 2008. Contextual patterns in mobile service usage. Personal and Ubiquitous Computing 13, 5 (mar 2008), 331–342.DOI:https://doi.org/10.1007/s00779-008-0197-0
[30] Daniel T. Wagner, Andrew Rice, and Alastair R. Beresford. 2013. Device Analyzer: Large-scale mobile data collection. In Big DataAnalytics workshop, ACM Sigmetrics 2013.
[31] Daniel T. Wagner, Andrew Rice, and Alastair R. Beresford. 2013. Device Analyzer: Understanding smartphone usage. In 10th InternationalConference on Mobile and Ubiquitous Systems: Computing, Networking and Services.
[32] Susan Wiedenbeck, Jim Waters, Leonardo Sobrado, and Jean-Camille Birget. 2006. Design and evaluation of a shoulder-surfingresistant graphical password scheme. Proceedings of the working conference on Advanced visual interfaces - AVI ’06 (2006), 177. DOI:https://doi.org/10.1145/1133265.1133303
[33] Yafei Yang, Lu Xiao, Yongjin Kim, and David Julian. 2009. Case Study: Trust Establishment in Personal Area Networks. Proceedings ofISWPC 2009 (2009), 1–5.
[34] Emanuel Von Zezschwitz, Paul Dunphy, and Alexander De Luca. 2013. Patterns in the Wild: A field study of the usability of patternand pin-based authentication on Mobile Devices. Proceedings of the 15th International Conference on Human-Computer Interaction withMobile Devices and Services (2013), 261–270.
Received February 2017; revised April 2017; accepted May 2017
Proceedings of the ACM on Interactive, Mobile, Wearable and Ubiquitous Technologies, Vol. 1, No. 2, Article 13. Publication date: June 2017.

10C R O S S - D E V I C E B I O M E T R I C A U T H E N T I C AT I O N - C O N C E P T
The following paper has been published as:
Publication
Title CORMORANT: Ubiquitous Risk-Aware Multi-Modal Bio-metric Authentication across Mobile Devices
Authors Daniel Hintze, Matthias Füller, Sebastian Scholz, RainhardD. Findling, Muhammad Muaaz, Philipp Kapfer, EckhardKoch, and René Mayrhofer
Journal Proceedings of the ACM on Interactive, Mobile, Wearableand Ubiquitous Technologies (IMWUT), Volume 3, Issue 3,Article 85, September 2019
Acceptance rate 23%
Candidate’s Contribution
Contribution The candidate developed the concept of CORMORANT, therisk assessment techniques, two out of three score level fu-sion algorithms, and the simulation-based evaluation ap-proach. Matthias Füller developed the Kalman filter fusionalgorithm and contributed to implementing the simulation.The candidate conducted the evaluation and interpretedthe results. He wrote the manuscript except for sections3.2 and 4.3, acted as corresponding author, and presentedthe results during the 2019 ACM International Joint Confer-ence on Pervasive and Ubiquitous Computing on the 13th
September 2019 in London, UK.
Overall percentage 90%
Co-Authors
By signing, each co-author certifies that the candidate’s stated contribution to thepublication is accurate (as detailed above); permission is granted for the candidateto include the publication his doctoral thesis; and that the sum of all co-authorcontributions is equal to 100% less the candidate’s stated contribution.
Exclu
ded
Exclu
ded
Exclu
ded
Exclu
ded
Matthias Füller Sebastian Scholz Rainhard D. Findling Muhammad Muaaz
Exclu
ded
Exclu
ded
Exclu
ded
Philipp Kapfer Eckhard Koch René Mayrhofer
109

110 Bibliography
Prior Publications
Parts and preliminary versions of this work have previously been published in
• Daniel Hintze. “Towards Transparent Multi-Device-Authentication.” In: Ad-junct Proceedings of the 2015 ACM International Joint Conference on Pervasive andUbiquitous Computing (UbiComp’15 Adjunct). 2015, pp. 435–440. doi: 10.1145/2800835.2801644, and
• Daniel Hintze, Rainhard D. Findling, Muhammad Muaaz, Eckhard Koch,and René Mayrhofer. “CORMORANT: Towards Continuous Risk-Aware Multi-Modal Cross-Device Authentication.” In: Adjunct Proceedings of the 2015ACM International Joint Conference on Pervasive and Ubiquitous Computing (Ubi-Comp’15 Adjunct) (2015), pp. 169–172. doi: 10.1145/2800835.2800906,
and are not included in this dissertation.
© 2019 Copyright held by the authors. Publication rights licensed to ACM.Included with permission by the publisher.https://doi.org/10.1145/3351243

85
CORMORANT: Ubiquitous Risk-Aware Multi-Modal BiometricAuthentication across Mobile Devices
DANIEL HINTZE, Institute of Networks and Security, Johannes Kepler University Linz, AustriaMATTHIAS FÜLLER, FHDW University of Applied Sciences Paderborn, GermanySEBASTIAN SCHOLZ, FHDW University of Applied Sciences Paderborn, GermanyRAINHARD D. FINDLING, Department of Communications and Networking, Aalto University, FinlandMUHAMMAD MUAAZ, Faculty of Engineering and Science, University of Agder, NorwayPHILIPP KAPFER, Institute of Networks and Security, Johannes Kepler University Linz, AustriaECKHARD KOCH, FHDW University of Applied Sciences Paderborn, GermanyRENÉ MAYRHOFER, Institute of Networks and Security, Johannes Kepler University Linz, Austria
People own and carry an increasing number of ubiquitous mobile devices, such as smartphones, tablets, and notebooks. Beingsmall and mobile, those devices have a high propensity to become lost or stolen. Since mobile devices provide access to theirowners’ digital lives, strong authentication is vital to protect sensitive information and services against unauthorized access.However, at least one in three devices is unprotected, with inconvenience of traditional authentication being the paramountreason. We present the concept of CORMORANT , an approach to significantly reduce the manual burden of mobile userverification through risk-aware, multi-modal biometric, cross-device authentication. Transparent behavioral and physiologicalbiometrics like gait, voice, face, and keystroke dynamics are used to continuously evaluate the user’s identity without explicitinteraction. The required level of confidence in the user’s identity is dynamically adjusted based on the risk of unauthorizedaccess derived from signals like location, time of day and nearby devices. Authentication results are shared securely withtrusted devices to facilitate cross-device authentication for co-located devices. Conducting a large-scale agent-based simulationof 4 000 users based on more than 720 000 days of real-world device usage traces and 6.7 million simulated robberies and theftssourced from police reports, we found the proposed approach is able to reduce the frequency of password entries required onsmartphones by 97.82% whilst simultaneously reducing the risk of unauthorized access in the event of a crime by 97.72%,compared to conventional knowledge-based authentication.CCS Concepts: • Security and privacy→ Multi-factor authentication; Usability in security and privacy; Biometrics;• Computing methodologies→ Simulation evaluation.
Additional Key Words and Phrases: multi device authentication, user friendly authentication, risk aware authentication
Preliminary versions of this work have been published in UbiComp 2015 [33, 36], UbiComp 2016 [38], and MoMM 2015 [34].Authors’ addresses: Daniel Hintze, [email protected], Institute of Networks and Security, Johannes Kepler University Linz, Linz, 4040,Altenbergerstr. 69, Austria; Matthias Füller, [email protected], FHDW University of Applied Sciences Paderborn, Fürstenallee 5,Paderborn, 33102, Germany; Sebastian Scholz, [email protected], FHDW University of Applied Sciences Paderborn, Fürstenallee5, Paderborn, 33102, Germany; Rainhard D. Findling, [email protected], Department of Communications and Networking, AaltoUniversity, Maarintie 8, Espoo, 02150, Finland; Muhammad Muaaz, [email protected], Faculty of Engineering and Science, Universityof Agder, Grimstad, 4898, Jon Lilletuns vei 9, Norway; Philipp Kapfer, [email protected], Institute of Networks and Security, JohannesKepler University Linz, Linz, 4040, Altenbergerstr. 69, Austria; Eckhard Koch, [email protected], FHDW University of Applied SciencesPaderborn, Fürstenallee 5, Paderborn, 33102, Germany; René Mayrhofer, [email protected], Institute of Networks and Security, JohannesKepler University Linz, Linz, 4040, Altenbergerstr. 69, Austria.
Permission to make digital or hard copies of all or part of this work for personal or classroom use is granted without fee provided thatcopies are not made or distributed for profit or commercial advantage and that copies bear this notice and the full citation on the first page.Copyrights for components of this work owned by others than the author(s) must be honored. Abstracting with credit is permitted. To copyotherwise, or republish, to post on servers or to redistribute to lists, requires prior specific permission and/or a fee. Request permissions [email protected].© 2019 Copyright held by the owner/author(s). Publication rights licensed to ACM.2474-9567/2019/9-ART85 $15.00https://doi.org/10.1145/3351243
Proc. ACM Interact. Mob. Wearable Ubiquitous Technol., Vol. 3, No. 3, Article 85. Publication date: September 2019.
85:2 • Hintze et al.
ACM Reference Format:Daniel Hintze, Matthias Füller, Sebastian Scholz, Rainhard D. Findling, Muhammad Muaaz, Philipp Kapfer, Eckhard Koch,and René Mayrhofer. 2019. CORMORANT: Ubiquitous Risk-Aware Multi-Modal Biometric Authentication across MobileDevices. Proc. ACM Interact. Mob. Wearable Ubiquitous Technol. 3, 3, Article 85 (September 2019), 23 pages. https://doi.org/10.1145/3351243
1 INTRODUCTIONSmartphones, tablets, notebooks, and other mobile devices have long become an indispensable part of everydaylife, allowing easy access to valuable assets, information and services.
Being small and mobile, those devices have a high propensity to become lost or stolen. A study found that in2013, 3.1 million Americans became victims of smartphone theft while 1.4 million lost their device [12]. When asmartphone is lost, the person who finds it tries to access sensitive personal or business data in over 80% of thecases [88]. Strong user authentication is thus crucial to protect against the risk of unauthorized access. To that end,knowledge-based mechanisms like PIN, pattern, and password are commonly applied today. Besides well-studiedshortcomings like people being bad at choosing and remembering adequate secrets [4, 8, 89] or vulnerabilityto shoulder surfing [79], thermal attacks [1], and smudge attacks [5], these authentication techniques require asignificant amount of scarce user attention in proportion to the usually short usage sessions [35]. An effect thatis even further amplified by the inability of current approaches to scale with the ever growing number of devicesused simultaneously, as users need to authenticate separately on every device. One out of three smartphoneusers thus chooses to not enable authentication, with inconvenience being the paramount reason as to why[2, 18, 27, 28].As a promising approach to overcome the aforementioned drawbacks, continuous unobtrusive user identity
verification using different biometrics has been proposed [42, 63, 64]. Commonly used traits include gait [57],mouth motions [68], heartbeat [84], breathing acoustics [9], voice [59], mouse movement [26], and keystrokedynamics [44].
User authentication on mobile devices is generally applied to defend against the risk of unauthorized access todata and services through an adversary with physical access to the device [50]. This risk, however, is dynamicand highly depends on spatial and temporal context. Considering risk in order to apply as much security asneeded but as little as possible, potentially enables less obtrusive, adequately tailored and thus user-friendlysecurity mechanisms [30, 41].
Approaches towards multi-modal biometric authentication systems proposed so far usually operate on a singledevice [62] only. With the increasing number of different interconnected devices owned and used by a singleindividual, it seems desirable to extend the scope in order to leverage contextual and biometric informationgathered within a group of trusted devices to increase both security and usability [40, 67].
In this paper, we therefore present the concept ofCORMORANT , a novel approach towards risk-aware, multi-modalbiometric, cross-device continuous user authentication across multiple trusted mobile devices. Our contributionsare as follows:• We present an approach towards dynamically combining explicit and implicit authentication mechanismswith continuous risk estimation, shared securely across a group of trusted devices to significantly reduceexplicit authentication overhead and increase security at the same time.• We introduce three novel algorithms to fuse authentication scores in a set of dynamic biometrics acrossdifferent devices, taking risk, uncertainty, and device distance into account.• We propose a novel evaluation technique for dynamic authentication approaches that measures securityand usability precisely and facilitates the comparison with conventional authentication measures based ona large-scale simulation of 4 000 users based on more than 720 000 days of real-world device usage tracesand 6.7 million robberies and thefts sourced from policy reports.
Proc. ACM Interact. Mob. Wearable Ubiquitous Technol., Vol. 3, No. 3, Article 85. Publication date: September 2019.
CORMORANT: Ubiquitous Risk-Aware Multi-Modal Biometric Authentication across Mobile Devices • 85:3
The paper is organized as follows. Section 2 describes related work. Section 3 outlines the overall conceptand elaborates how risk estimation can be implemented on mobile devices. In section 4, we introduce threecross-device score-level fusion algorithms for biometric matching scores that take risk and device distance intoaccount.Section 5 gives insights into how we optimized and evaluated the concept of CORMORANT using a large-scale
simulation based on real-world data. In section 6, we discuss the experimental results. Finally, section 7 concludesthis paper by discussing our results and giving an outlook on future work.
2 RELATED WORKOur work combines three areas of mobile device authentication research, namely risk-aware (or risk-based)authentication, multi-modal authentication, and multi-device (or cross-device) authentication.
2.1 Risk-Aware AuthenticationSince risk is ultimately the cause for any security measures, it has been considered in different aspects of computersecurity for quite some time to dynamically adjust security settings. It is for instance applied to mitigate onlinebanking or credit card fraud, e.g., by using the customer’s purchase history to identify fraudulent transaction[87]. A subset of risk-aware authentication are location based authentication systems, which detect fraudulenttransactions by verifying the user’s presence at the place of transaction [70]. Diep et al. [17] proposed a contextualrisk-based access control system based on a mathematical scoring technique assigning numerical weights torisk factors to improve confidentiality, integrity, and availability of the resulting access control model. Therisk-based authentication system introduced in [71] defines risk differently from our work as the likelihoodof an intruder impersonating a genuine user, which is continuously evaluated based on mouse and keystrokedynamics. In [7], the concept of risk is applied to develop a risk-aware role based access control system that allowsto enforce risk-related constraints in scenarios where certain combinations of permission are considered toopowerful (or risky) and should thus not be assigned to the same role. Hayashi et al. [30] introduced Context-AwareScalable Authentication (CASA), in which the required strength of authentication is dynamically selected basedon contextual information like time and location, showing it is possible to simultaneously improve usability andsecurity using dynamic authentication systems. A combination of multi-device and risk-aware authentication isdescribed in [10], where a threat level is computed based on other trusted devices in the vicinity and used toadjust the security settings of a smartphone. The more trusted devices are close by, the less likely it is that theone in question has been lost or stolen. A similar assumption is found in [40]. The distinction between sourcesof risk and biometric authentication is not always clear. RSA‘s SecurID Risk-Based Authentication product forinstance "scores each authentication request in real time based on information about [...] the user‘s typical log-inpattern"1 – which arguably constitutes a behavioral biometric as well.
2.2 Multi-Modal AuthenticationMulti-modal biometric systems, i.e., systems incorporating biometric information from multiple sources, havebeen well studied for several decades to overcome some drawbacks of unimodal biometrics or to defend againstspoofing attacks [61]. Recently, the concept of multi-modal biometrics has been successfully applied to thedomain of mobile devices. The authors of [48] utilize face, teeth and voice authentication on mobile devices. Faceand voice biometrics are also combined for mobile user identification in [72]. In [13], the authors propose anauthentication framework using keystroke dynamics and speaker verification on mobile devices, reporting a 67%reduction of explicit authentication. Khan et al. [47] introduced Itus, a framework for implicit authentication onAndroid devices which shares some goals with our approach, for instance allowing researchers to integrate novel1https://www.rsa.com/en-us/products/rsa-securid-suite/securid-tokenless-authentication
Proc. ACM Interact. Mob. Wearable Ubiquitous Technol., Vol. 3, No. 3, Article 85. Publication date: September 2019.
85:4 • Hintze et al.
authentication mechanisms into the framework. However, Itus is implemented as a library to be integrated inthird party applications requiring dedicated authentication, whereas the system we propose features a dynamicset of individual applications, coordinated by a core process at runtime.
2.3 Multi-Device AuthenticationMulti-device authentication usually means sensing and taking leverage of nearby trusted devices. An earlycontribution in this direction comes from Varshavsky et al. [78], who proposed a technique to authenticateco-located devices using knowledge of the shared radio environment as proof of physical proximity. Stajano[67] introduced Pico in order to avoid password challenges for different accounts and devices. Pico unlocks adevice only in the presence of k-out-of-n Picosiblings, small encrypted hardware tokens communicating viaBluetooth which the user needs to carry simultaneously, e.g., on a keychain. Chow et al. [11] implemented acloud-based framework for implicit authentication named TrustCube with a corresponding Android client. It isdesigned to serve as a federated authentication for third parties, with one example being the authorization ofcredit card transactions at a store checkout. Findling et al. [23] proposed to transfer authentication state betweenmobile devices by conjointly shaking them together, using acceleration data to ensure verify that both devices areco-location. Hocking et al. [40] proposed the concept of an Authentication Aura, "an area of close proximity to anindividual in which an increase in user identity confidence can be gained from other trusted and present devices,their current state of authentication confidence, the surrounding location and the behaviour of the individual"[39]. A preliminary architecture for a dynamic multi-modal risk-based authentication system that takes multipledevices into account has been proposed in [33] and later expanded in [34, 36, 38]. Gordon et al. [25] patented asystem for behavior-based, invisible multi-factor authentication that features some of the key characteristics ofour approach, namely using different transparent biometrics across multiple devices. Their approach differs fromours in that it relies on convolutional deep neural networks to learn subject-specific features. Riva et al. [60]presented a framework for progressive authentication on mobile phones. On an abstract level, their approach hasthe highest resemblance with our concept. It supports continuous multi-modal biometrics, including face andvoice recognition. The authors also consider different levels of authentication confidence, though they choose adiscrete scale while we use an continuous interval. Finally, the authors take nearby devices into account, thoughrather rudimentary. The authors report a 42% reduction in required explicit authentication attempts. Our approachis different from their work in that the set of biometrics used is dynamic at runtime, a more sophisticated notionof multi-device authentication is used, and that risk is taken into account for making security decisions.
3 APPROACHAbout a third of mobile devices is not protected by authentication with the inconvenience of the manual effortbeing the primary reason [2, 18, 27, 28]. Our research goal is to devise a system capable of significantly reducingthe user’s effort of authentication without sacrificing security. To that end, we developed the concept of an mobileauthentication framework that utilizes transparent biometrics and risk estimation across trusted devices in closeproximity.
3.1 OverviewTransparent biometrics like gait recognition can be employed to unobtrusively and continuously evaluate theuser’s identity. However, transparent biometric authentication only yields sporadic results, e.g., when the user isactually walking in the case of gait recognition. Furthermore, not every device comes equipped with the necessarysensors. We therefore use a dynamic set of multiple biometric authentication plugins, as well as knowledgeor possession-based authentication mechanisms, e.g., as fallback mechanism should biometric authenticationbe unavailable. Each plugin reports its level of confidence in the genuine user’s presence in the interval [0, 1].
Proc. ACM Interact. Mob. Wearable Ubiquitous Technol., Vol. 3, No. 3, Article 85. Publication date: September 2019.

CORMORANT: Ubiquitous Risk-Aware Multi-Modal Biometric Authentication across Mobile Devices • 85:5
Throughout this paper, we will assume gait recognition, face recognition, speaker recognition, and keystrokedynamics, with which the authors have prior experience and performance data on mobile devices [22, 44, 52, 53].We emphasize, however, that those are merely examples and that the system we propose can conceptuallyintegrate all forms of explicit and implicit authentication.The fundamental purpose of user authentication in the context of mobile devices is to prevent unauthorized
access to data and services accessible through the device. Authentication mechanisms like lock screens featuringPIN, password, or pattern commonly used on mobile devices to protect against unauthorized access are usuallyrather static. Once configured, the level of protection provided, e.g., as a function of the password complexity,remains fixed until the user changes the security settings. The actual risk of unauthorized access a device isexposed to, however, is far from static but depends on the current situation: devices are frequently lost in publictransport, but rarely at home. More robberies per capita are committed e.g., in Latin American countries than inAsian countries [75]. Crime rates are higher at night than during daytime [20]. Users are generally faced withthree choices: They can configure their devices according to the highest conceivable risk and bear the addedburden of e.g., entering a more complex password even in situations perceived less risky. Alternatively, userscan choose a less secure configuration, e.g., no lock screen or a short passphrase, that might not be sufficient toprotect the device under adverse conditions like shoulder surfing. Ultimately, users could manually adjust thesettings when their perceived risk changes to balance usability and security, which is even suggested as a viablestrategy by some authors [65]. To automate the adaptation, CORMORANT relies on risk plugins to continuouslyasses the risk of unauthorized access in the interval [0, 1] and adjust the authentication requirements accordingly.In section 3.3, we suggest three different approaches to quantify risk using signals like location, time of day, anddevice usage as examples.Since people increasingly carry and use multiple devices simultaneously, the third pillar of CORMORANT is to
leverage authentication and risk information established on a single device on other devices belonging to thesame user. To that end, a secure, end-to-end encrypted communication between trusted devices is established.The confidence and risk measurements of individual plugins are periodically broadcast within the group, alongwith location information. This allows, for instance, for a device to be accessible if it is in close proximity to adevice that has successfully established the user’s identity.For estimating the distance between devices, different techniques and signals can be used, for instance GPS,
WiFi, GSM, UWB, and Bluetooth [3, 29, 69]. We note that generally such radio based localization techniques aresusceptible to spoofing or amplification attacks if a powerful attacker is equipped with the necessary hardware. Ifan attacker possessing the capability to spoof the distance estimation (e.g., a governmental agency) is assumed inthe user’s personal threat model, it is advisable to refrain from using the multi-device authentication functionalityof CORMORANT but restrain its scope to individual devices.
A major choice with any authentication systems is the threat model. For mobile authentication, this includesin particular whom to consider an attacker with regards to insiders, e.g., people familiar with the victim [54].Depending on personal circumstances, a user might for instance be voluntarily sharing access to a personaldevice with their spouse but determined to prevent their children from accessing the device without supervision.For now, we assume devices will only be used by a single user and not shared, though CORMORANT could beextended in the future to accommodate more diverse usage models.
3.2 Example ScenarioFor a better understanding, we illustrate how the proposed system would function using a short practicalexample, with fig. 1 depicting the system state over time: A CORMORANT user is walking to a café, carrying anidle notebook in their backpack as well as a mobile phone in their pocket. A gait recognition plugin is activeon the phone and identifies the walking user with a certain confidence. Reaching the café at t5min , the user
Proc. ACM Interact. Mob. Wearable Ubiquitous Technol., Vol. 3, No. 3, Article 85. Publication date: September 2019.
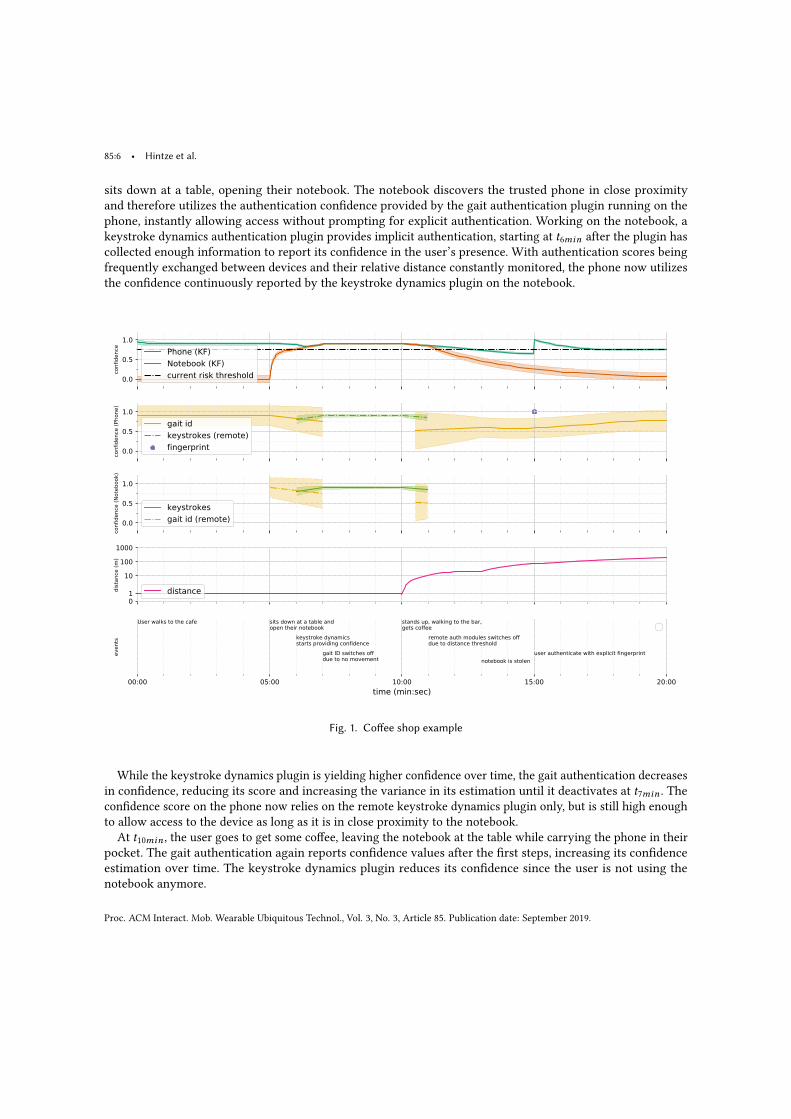
85:6 • Hintze et al.
sits down at a table, opening their notebook. The notebook discovers the trusted phone in close proximityand therefore utilizes the authentication confidence provided by the gait authentication plugin running on thephone, instantly allowing access without prompting for explicit authentication. Working on the notebook, akeystroke dynamics authentication plugin provides implicit authentication, starting at t6min after the plugin hascollected enough information to report its confidence in the user’s presence. With authentication scores beingfrequently exchanged between devices and their relative distance constantly monitored, the phone now utilizesthe confidence continuously reported by the keystroke dynamics plugin on the notebook.
0.0
0.5
1.0
confid
ence Phone (KF)
Notebook (KF)
current risk threshold
0.0
0.5
1.0
confid
ence
(Phone)
gait id
keystrokes (remote)
fingerprint
0.0
0.5
1.0
confid
ence
(N
ote
book)
keystrokes
gait id (remote)
01
10
100
1000
dis
tance
(m
)
distance
00:00 05:00 10:00 15:00 20:00
time (min:sec)
events
User walks to the cafe sits down at a table andopen their notebook
keystroke dynamicsstarts providing confidence
gait ID switches offdue to no movement
stands up, walking to the bar,gets coffee
remote auth modules switches offdue to distance threshold
notebook is stolen
user authenticate with explicit fingerprint
Fig. 1. Coffee shop example
While the keystroke dynamics plugin is yielding higher confidence over time, the gait authentication decreasesin confidence, reducing its score and increasing the variance in its estimation until it deactivates at t7min . Theconfidence score on the phone now relies on the remote keystroke dynamics plugin only, but is still high enoughto allow access to the device as long as it is in close proximity to the notebook.
At t10min , the user goes to get some coffee, leaving the notebook at the table while carrying the phone in theirpocket. The gait authentication again reports confidence values after the first steps, increasing its confidenceestimation over time. The keystroke dynamics plugin reduces its confidence since the user is not using thenotebook anymore.
Proc. ACM Interact. Mob. Wearable Ubiquitous Technol., Vol. 3, No. 3, Article 85. Publication date: September 2019.
CORMORANT: Ubiquitous Risk-Aware Multi-Modal Biometric Authentication across Mobile Devices • 85:7
At t11min , the remote authentication plugins on both devices are no longer taken into account for computingthe overall confidence as their distance exceeds a certain threshold. The phone now relies on the gait authenti-cation plugin alone. Since the user is not constantly walking in the café, the confidence estimation of the gaitauthentication is lower compared to the confidence earlier in the example. The notebook now has no activeauthentication plugin and the overall confidence decays over time.At t13min , the notebook is stolen from the table by an opportunistic thief walking out of the café unnoticed.
Due to the constant decay of the overall confidence estimation, the score level of the notebook is below thecurrent access threshold, so the thief is unable to access the device automatically, without interaction required bythe genuine user.Upon returning to the table, the user notices that their notebook has been stolen and removes the stolen
device from the group of trusted devices. Since the overall confidence is below the access threshold, the user ischallenged with an explicit authentication using their fingerprint at time t15min to increase the overall confidenceover the threshold level.
3.3 Risk AssessmentTo illustrate the concept, we developed three simple risk estimation approaches utilizing macro location, timeof day, and intrusion detection, which are outlined in the following sections. We note, however, that moresophisticated approaches towards risk estimation could be developed and used within CORMORANT .
3.3.1 Macro Location. Location is arguably one of the most important factors regarding the probability of losinga device by accident or its getting robbed or stolen, so we developed a simple macro location-based risk estimationplugin. We consider macro location to be the country the device is currently in as the probability of device theft orrobbery varies widely on a country level. For instance, in 2015 there were 195.6 robberies per 100 000 populationin Belgium but only 2.19 per 100 000 population in Singapore [75]. To compute the macro location risk, we usestatistics on the national level of police-recorded theft and robbery offenses[75] to compute the relative nationalcrime risk.Neither the data available nor the method itself should be considered an exact measure, because of a) the
differences that exist between the legal definitions of offenses in countries, the different methods of countingand recording offenses, and differences in the share of criminal offenses that are not reported to or detected bylaw enforcement authorities (i.e., the dark figure) [75] and b) the simplicity of the approach. However, it is still auseful signal regarding the relative probability of losing a device by means of crime based on macro location.
3.3.2 Time of Day. It is common knowledge that the probability of crime varies over time, being higher duringnight than at daytime. Felson and Poulsen [20] for instance found that roughly 1
3 of all robberies occur at daytime(5:00 to 16:59) and 2
3 in the other half of the day. To derive the risk of device theft from the time of day, weanalyzed about 38 600 police reports from New York City [16] in which a personal electronic device was the maintarget of a crime to compute the frequency of cases based on time of day. To derive a risk value in the interval[0, 1] from the current time of day, we modeled the risk level proportional to the temporal distribution of casesincidents.
3.3.3 Intrusion Detection. In a multi-device scenario, CORMORANT has near realtime information about thelocation and authentication state of all trusted devices a user possesses. In an adversarial situation in which anattacker manages to gain access to a device, for instance by successfully spoofing a biometric authentication orby snatching an unlocked device, the intrusion can potentially be detected by the framework. We developed anintrusion detection risk plugin that constantly keeps track of all devices on which the legitimate user is currentlyauthenticated as well as the relative distance between the devices. First, a distance-based intrusion risk metricri, j |i , j is computed over all possible device pairs from the set of devices on which the user is currently believed
Proc. ACM Interact. Mob. Wearable Ubiquitous Technol., Vol. 3, No. 3, Article 85. Publication date: September 2019.
85:8 • Hintze et al.
to be successfully authenticated. ri, j grows exponentially in the interval [0, 1] with increasing estimated distancedi, j between devices i and j in meter. Once di, j exceeds a user-defined distance thresholdm, which defaults to500 meters, the maximum risk 1 is assumed. The absolute intrusion risk is computed as max ri, j on all devices,
ri, j =2di, jm − 1 if 0 ≤ di, j ≤ m,
1 if di, j > m.
4 MULTI DEVICE SCORE LEVEL FUSIONAuthentication plugins in CORMORANT are dynamic and assumed be installed or removed at runtime. They leveragedifferent means of authentication to provide a score of their confidence in the genuine user’s presence. In orderto make decisions, e.g., locking or unlocking a device, those scores need to be fused to obtain a single confidencemetric, a problem known as multimodal score level fusion.Available approaches can be divided into simple analytic, machine learning, and probabilistic approaches.
Analytic fusion methods, e.g., sum rule [32, 46] or dynamic weighted average fusion [19] use static or changingweights for each source of information to sum up to a single score value. They are easy to understand andscale well, but are hard to adjust at runtime. Machine learning approaches like support vector machines (SVM)[6, 21, 83] or neural networks [85] performwell for fusing scores from different sources, but need to be individuallytrained for each configuration. Probabilistic or estimation-based methods like likelihood ratio statistics [15, 55],Bayesian Belief Networks [49], or Gaussian Mixture Models [58] use different probabilistic approaches to modeluncertainty (quality) in the fusion process. Depending on the chosen method, they support a dynamic number ofsources and can include different kinds of uncertainties in their calculations. A discussion on different score levelfusion methods can be found in [24].
None of the established score level fusion algorithms is directly applicable forCORMORANT , since novel propertieslike distance between devices and risk information need to be considered during fusion as well. We thus designedthree novel fusion algorithms for CORMORANT , which are outlined in the following.
4.1 Max Weighted Score Threshold FusionWe developed a max weighted score threshold algorithm, which is simple to implement and computationallyefficient. Each individual plugin is assigned a static weight (W ). On every tick, all co-located trusted devices,including the device running the algorithm, are iterated and all active confidence plugins are queried for thehighest confidence value. Confidence results from remote devices are adjusted by a remote_factor, allowing to putless trust in those devices. Risk-plugins are queried on the local device for the maximum risk value.
The previous confidence is degenerated by a constant component as well as a risk dependent component. Theconstant factor can be configured independently for different device types (e.g., smartphone vs notebook) as wellas whether the device is actively used or idle (Dact vs. Didle ). It ensures that confidence erodes over time if notreinforced. The risk-dependent component ensures the level of confidence required corresponds to the currentrisk assessment. This is achieved by subtracting the current risk multiplied by a constant αr isk from the previousconfidence.The algorithm compares the maximum of the current confidence and the degenerated previous confidence
against a constant threshold and grants access to the device if the confidence is equal or greater than the threshold.Algorithm 1 specifies the max weighted score threshold fusion algorithm in detail
4.2 Mean Weighted Score Threshold FusionWe developed another fusion algorithm which is similar to the max weighted score threshold fusion algorithm,but computes the mean score across both risk and authentication plugins instead of the maximum. Again, each
Proc. ACM Interact. Mob. Wearable Ubiquitous Technol., Vol. 3, No. 3, Article 85. Publication date: September 2019.
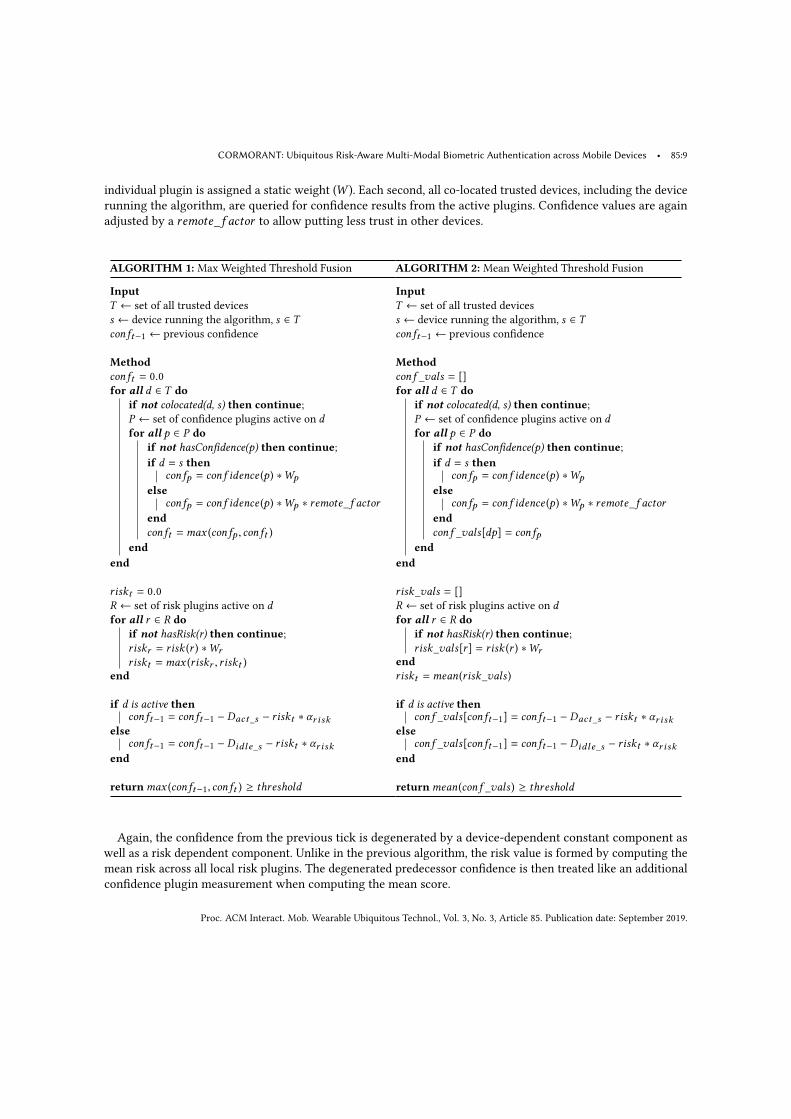
CORMORANT: Ubiquitous Risk-Aware Multi-Modal Biometric Authentication across Mobile Devices • 85:9
individual plugin is assigned a static weight (W ). Each second, all co-located trusted devices, including the devicerunning the algorithm, are queried for confidence results from the active plugins. Confidence values are againadjusted by a remote_f actor to allow putting less trust in other devices.
ALGORITHM 1: Max Weighted Threshold Fusion
InputT ← set of all trusted devicess ← device running the algorithm, s ∈ Tconft−1 ← previous confidence
Methodconft = 0.0for all d ∈ T do
if not colocated(d, s) then continue;P ← set of confidence plugins active on dfor all p ∈ P do
if not hasConfidence(p) then continue;if d = s then
confp = conf idence (p) ∗Wpelse
confp = conf idence (p) ∗Wp ∗ remote_f actorendconft =max (confp , conft )
endend
riskt = 0.0R ← set of risk plugins active on dfor all r ∈ R do
if not hasRisk(r) then continue;riskr = risk (r ) ∗Wrriskt =max (riskr , riskt )
end
if d is active thenconft−1 = conft−1 − Dact_s − riskt ∗ αr isk
elseconft−1 = conft−1 − Didle_s − riskt ∗ αr isk
end
returnmax (conft−1, conft ) ≥ threshold
ALGORITHM 2: Mean Weighted Threshold Fusion
InputT ← set of all trusted devicess ← device running the algorithm, s ∈ Tconft−1 ← previous confidence
Methodconf _vals = []for all d ∈ T do
if not colocated(d, s) then continue;P ← set of confidence plugins active on dfor all p ∈ P do
if not hasConfidence(p) then continue;if d = s then
confp = conf idence (p) ∗Wpelse
confp = conf idence (p) ∗Wp ∗ remote_f actorendconf _vals[dp] = confp
endend
risk_vals = []R ← set of risk plugins active on dfor all r ∈ R do
if not hasRisk(r) then continue;risk_vals[r ] = risk (r ) ∗Wr
endriskt =mean(risk_vals )
if d is active thenconf _vals[conft−1] = conft−1 − Dact_s − riskt ∗ αr isk
elseconf _vals[conft−1] = conft−1 − Didle_s − riskt ∗ αr isk
end
returnmean(conf _vals ) ≥ threshold
Again, the confidence from the previous tick is degenerated by a device-dependent constant component aswell as a risk dependent component. Unlike in the previous algorithm, the risk value is formed by computing themean risk across all local risk plugins. The degenerated predecessor confidence is then treated like an additionalconfidence plugin measurement when computing the mean score.
Proc. ACM Interact. Mob. Wearable Ubiquitous Technol., Vol. 3, No. 3, Article 85. Publication date: September 2019.
85:10 • Hintze et al.
The algorithm compares the current mean confidence against a constant threshold and grants access to thedevice if the mean confidence is equal or greater. Algorithm 2 specifies the mean weighted score threshold fusionalgorithm in detail.
4.3 Kalman FilterA Kalman filter (KF) is a set of algorithms that make use of a series of measurements over time and account foruncertainty and noise in the measurements by estimating a joint probability distribution over the variables foreach timestep [86]. The general KF assumes the state transition xk = Fkxk−1 +Bkuk +wk where xk−1 is the stateof the previous timestep, Fk is the state transition model applied to xk−1, Bk is the control-input model applied tocontrol vector uk , and wk is the process noise assumed to be drawn from a zero mean normal distribution withvariance Q, wk ∼ N (0,Q ).
The measurement observation zk of state xk is based on zk = Hkxk + vk where Hk is the observation modelwhich maps the true state space into the observed space and vk is the observation model noise which is assumedto be zero mean white noise with covariance Rk , vk ∼ N (0,Rk ).We use a KF to estimate the overall confidence in the genuine user’s presence based on the confidence
information provided by the authentication plugins with the following configuration:
State Variable: The state variable x represents the overall confidence. It is an estimation based on previousconfidence results and the dynamics of the filter in form of a 1 × 1-vector with a value in the range [0, 1].
State Transition Function: The state transition function describes the dynamic of the system over time is denotedas xk+1 = Fxk. Due to the simple state variable above, the state transition function is represented by matrix Fwithsize 1× 1. The desired behavior for an authentication system is that the overall confidence decays over time whenno new authentication information is available, thus the single element of the transition function F = [f1] shouldhave f1 < 1. In such case, the prediction function of the filter follows a simple decay function xt+n = xt · f n1 . Theactual value of f1 depends on the desired behavior of the system and is configurable depending on the preferencesof the user, the security required, and the risk level sensed by the risk estimation plugins.
Control Function: A Kalman filter could make use of control inputs to improve the modeling and thus the stateestimation of the process. So far, there is no control input in our concept, thus B = 0.
Process Variance: To account for system variance, the Kalman filter assumes that the state transition has someGaussian noise which is modeled with matrix Q. Since our process dynamics is modeled by a single scalar f1,Q is a scalar value as well. The noise in this case might be everything that is not covered by the system model.However, the system model assumes that confidence is decaying slowly over time and there is no control inputthat might change the state. Thus, every change in the confidence score (apart from the decay) is modeled as aprocess variance byQ. The specific value ofQ has a significant influence on the behavior of the system. A KF witha small Q value will have a higher confidence in its system model and less confidence in the measurements. Thus,the system change slowly when new authentication information arrives. Setting Q to a large value forces the KFto emphasize on new information of the authentication plugin. While a large Q is undesirable in state estimationof physical systems, this behavior is required for our application to swiftly react upon changing authenticationinformation.
Measurement Function: The measurement function defines the mapping from overall confidence x to the singleauthentication measurements z as zk = Hkxk + vk , with vk ∼ N (0,Rk ).
The dimension of the measurement matrixH as well as the measurements z itself is 1×m withm as the numberof available authentication plugins. Plugins can be inactive if they lack current confidence measurements,e.g.,when the device is resting idle on a desk. The filter adapts to active and inactive authentication plugins by
Proc. ACM Interact. Mob. Wearable Ubiquitous Technol., Vol. 3, No. 3, Article 85. Publication date: September 2019.

CORMORANT: Ubiquitous Risk-Aware Multi-Modal Biometric Authentication across Mobile Devices • 85:11
changing the elements of the measurement matrix H depending on the authentication plugin state, using 1 and 0to denote active and inactive plugins.
Measurement Variance and Covariance: The authentication plugins need to map their estimation to a Gaussiandistribution and provide their variance estimation σi along with their measurement zi . The σi of a plugin dependson their authentication system and the current measurement as well. E.g. a face authentication has a low variancein their confidence value in good and a higher variance in lower lighting conditions. The aspect of the covariancein the authentication plugins can be handled by the measurement matrix by setting the covariance of themeasurement matrix to values different from zero. The measurement matrix will finally look as follows:
R =
σ1 σ12 .. σ1m
σ12 σ2 .....
.... . .
σ1m σ2m . . . σm
Where the variance estimationσi are the diagonal elements, representing the variance of the current authenticationplugin confidence. The variance values σi can be adjusted by CORMORANT in order to change the weight ofan authentication plugin in the system. The off-diagonal elements σi j in R define the covariances betweenauthentication plugin i and j. The covariance can not be defined by the plugin itself, since it does not knowwhat authentication plugin configuration might be applied in a specific CORMORANT instance. The covariance istherefore based on the method of authentication used by the plugin, e.g., the underlying biometric trait.
5 EVALUATIONEstablished techniques like cross-validation are available to measure the performance of individual biometrics.Evaluating an entire system like CORMORANT adequately, however, is challenging due to its highly dynamic andenvironment-dependent nature. Fundamentally, two conflicting objectives need to be quantified - security andusability. While some usability aspects can be measured relatively easy, e.g., by counting and comparing thenumber of explicit authentication processes, gauging security is difficult. Real-world security incidents are rareand hard to detect once authentication is successfully spoofed. Lab studies allow to simulate unauthorized access,but don’t scale beyond a confined environment and few participants and are thus limited in generalizability. Rivaet al. [60], whose framework shares most similarities with ours, for instance used a lab study with 9 participantsand 26 attempts of unauthorized access to evaluate their system. Hayashi et al. [30], who proposed a morepreliminary system that shares some key ideas with CORMORANT , conducted a one-week field study with 32participants.
Handset-based real-world user studies allow to overcome these limitations and facilitate measuring usabilityin real-world context [80]. However, genuine unauthorized access isn’t common enough to be an integral part ofa user study as theft, robbery, and device loss is still rather infrequent on the level of an individual, let alone hardto reliably detect and quantify.Given these limitations, we propose to evaluate the overall performance of complex authentication systems
like CORMORANT using an elaborate simulation driven by real-world device usage and crime data. Besides beingan extraordinary useful tool to iteratively evaluate different hypotheses or to optimize a dynamic system, itfacilitates precise quantification of security, obtaining repeatable results, and direct comparison of differentapproaches under the exact same conditions.
Our evaluation approach is to simulate devices, user, environment, measurement noise, uncertainty errors, aswell as malicious actors, as realistically as possible. Having full control over the simulation parameters allows us
Proc. ACM Interact. Mob. Wearable Ubiquitous Technol., Vol. 3, No. 3, Article 85. Publication date: September 2019.
85:12 • Hintze et al.
to evaluate the performance of CORMORANT compared with conventional, password-based authentication ceterisparibus, i.e., in the same situation.
5.1 DatasetsTo make our evaluation as realistic as possible, we rely on real-world data for our simulation model whereverfeasible. To simulate mobile device configurations, interactions, contextual location, and other parameters, we usemobile device logs captured by the Device Analyzer project [81, 82] by the University of Cambridge ComputerLaboratory.2 It consists of more than 225 billion records of Android mobile device usage, collected from 29 279devices around the world.3 Many devices within the dataset contribute data for an extended period of time, with7 484 devices participating for more than one month, 535 devices providing data for more than one year andsome even more than 4.5 years of usage data. We used the techniques elaborated in detail in Hintze et al. [35] toextract a total of 52.2 million mobile device usage sessions, as well as supplementary information like contextuallocations and display timeout settings, to form the core of our simulation model.
Crime rates are known to vary based on factors like time, season, and location [20]. To reflect these influencesin the simulation as accurately as possible, we utilize the New York City Police Department (NYPD) ComplaintData Historic dataset [16], in particular the 38 641 reports of crimes between 2012 and 2016 in which a personalelectronic device was the main target of a felony. The dataset contains, among other information, date and time,location, contextual location (e.g., in front of supermarket), as well as a description of the crime type. It is used todrive the simulation of unauthorized access attempts in the course of robberies, theft, or burglary.
5.2 Simulation ModelWe employ a discrete time agent-based simulation with a one-second tick resolution, modeling 4 494 users and38 641 criminal offenders in the city of New York, based on 807 195 days of real-world device usage data.
5.2.1 Devices. We model 4 494 device owners, each using a smartphone, a tablet, and a notebook, selectingonly users with at least 60 days of continuous device usage in the Device Analyzer dataset. Each of the 4 494smartphone usage traces derived from the dataset is associated with a device owner. The usage trace is pivotalfor simulating the device owners daily routine, for instance the commute between different places, as well asmodeling smartphone interactions. It also determines the temporal boundaries of the owner simulation, from 60to 1 216 days, depending on the length of the individual usage trace.
Each device owner is associated with a tablet usage trace to drive the tablet usage simulation. Since the datasetcontains fewer tablet traces than smartphone traces, tablet traces are used for simulating more than one deviceowner. Moreover, since smartphone and tablet usage traces are not temporally aligned, we only consider the timeof day and sequence of days relative to the smartphone usage, but disregard calendrical information like monthor year.Unfortunately, no suitable real-world dataset containing notebook usage traces was available to us. We thus
modeled notebook usage stochastically based on average usage characteristics of information workers. Onaverage, notebooks are used 204 minutes (SD 15) per day in on average 4.5 (SD 0.5) separate usage sessions during7:00 in the morning and 22:00 in the evening, as found in corresponding studies [31, 45].
5.2.2 Device Owner. Device owners are modeled primarily based on real world smartphone usage data fromthe Device Analyzer dataset. Each device owner corresponds to an individual smartphone from the dataset.Depending on the participation duration, device owners are modeled for a period of 60 to 1216 days. A device
2The University of Cambridge Computer Laboratory and Data Funder do not bear any responsibility for our analysis or interpretation of theDevice Analyzer Dataset or data thereof.3In this work we used a dataset snapshot generated on 16 May 2016 (Picky [37] reference: device_analyzer_full_20160516).
Proc. ACM Interact. Mob. Wearable Ubiquitous Technol., Vol. 3, No. 3, Article 85. Publication date: September 2019.
CORMORANT: Ubiquitous Risk-Aware Multi-Modal Biometric Authentication across Mobile Devices • 85:13
owner features a number of properties: Each owner has a home location in one of the five boroughs of New YorkCity, i.e., Manhattan, Brooklyn, Queens, The Bronx, and Staten Island, assigned stochastically based on the City’sresidents population distribution as per U.S. Census Bureau [77]. An owner also has a work location in one of theboroughs. With 72.6% probability [76], home and work location are in the same borough. If located in a differentborough, the work location is assigned stochastically based on New York’s labor force distribution as per NewYork State Department of Labor [56]. Owners commute between the following contextual locations: Home, office,other meaningful place (e.g. a gym or café), and elsewhere. Contextual locations and the commute between themare derived individually from spatio-temporal usage patterns of the smartphone usage log forming the backbonedriving the simulation of a single device owner as described in detail in [35]. During commute, the owner isconsidered to be in transit. We also track the current district of owners, which is inferred from contextual location,home location, and work location.
When changing locations, device owners randomly leave behind the notebook or tablet at home or in the officewith 30% probability. When arriving at a location where a device was previously left behind, the owner picks itup with equal probability.
To drive biometric authentication, we simulate the underlying user behavior. To facilitate speech recognition,device owners, as well as other people in the vicinity of the device, randomly speak in sequences between 30seconds up to 10 minutes throughout the day. The amount of words spoken per day is modeled as a normaldistribution based on the average number of words spoken per day [51]. For every device owner we simulate fiveother speakers. This causes the speech recognition to frequently report low confidence in the user’s identity,despite the device being controlled by the device owner. This allows us to evaluate the performance and resilienceof CORMORANT under close to realistic conditions with regards to noise, measurement errors, and false negatives.
Device owners randomly walk in sequences between 30 seconds up to 10 minutes throughout the day, modeledprobabilistic based on the hour of day, peaking at noon and lowest during night hours. Owners do not walkwhilst working on a notebook. The total number of steps per day is modeled as a normal distribution based onthe average number of step per day taken by US adults [73].
When interacting with a device, owners randomly type using the device’s keyboard, averaging 1 900 keystrokesper hour [43] with an assumed average typing speed of 200 keystrokes per minute, thus are roughly typing 10%of the usage time.
Owners also look into the front-facing camera of the device when interacting with the device. Pictures takenhave a probability of 50% of containing a face usable for face recognition, as empirically established in [14].Device interactions for smartphone and tablet are driven by the associated device usage log from the Device
Analyzer dataset, hence based on real-world device usage. Every interaction corresponds to a usage sessionin the dataset with regards to temporal occurrence, duration, and contextual location. Notebook interactionsare modeled stochastically as described above. Only devices currently carried by the owner are considered forinteractions.
5.2.3 Crime. Crimes are sourced from the NYPD police report database [16]. For every tick of the simulation,applicable crimes are simulated. To determine if a crime is applicable in a given state of the simulation, firstdate and time of the crime are considered. While we disregard the year, we do consider month, day, and exacttime of day in the matching to account for, e.g., seasonal changes in crime rates. Depending on the type ofcrime, further simulation state is taken into account. For robberies and larceny, a device owner needs to be inthe district in which the crime occurred as well as in the same context. Contextual locations are mapped fromthe police report to the contexts derived from the smartphone usage traces. For instance, crimes at bus stopsare mapped to transient whereas crimes reported to have occurred in residences are mapped to home context.Burglaries can take place if they are reported for the same district as the home or office location of the device
Proc. ACM Interact. Mob. Wearable Ubiquitous Technol., Vol. 3, No. 3, Article 85. Publication date: September 2019.
85:14 • Hintze et al.
owner. When committing a crime, each device that could potentially be affected beyond the first one is robbed orstolen randomly with 50% probability.
On every simulation tick, all applicable crimes are committed. Every simulated owner thus becomes the victimof a crime on average every four minutes. When a crime is committed, the simulation forks, e.g., the currentstate of the simulated world is copied. The initial simulation continues as if the crime did not happen whereas inthe fork, the crime and its consequences are simulated. The crime simulation now features an attacker, who ismodeled conceptually similar to the device owner with regards to behavior like walking, speaking, or typing. Anattacker will try to access devices under his control, starting randomly within the first five minutes after thecrime was committed. If access is denied by the authentication system, the attacker waits randomly up to 120seconds and again tries to gain access. At most, an attacker will attempt access 10 times. If an attacker gainsaccess, e.g., by guessing the password, he will access the device until the authentication system locks it again, butat most for 60 minutes.
To quantify the security of different authentication systems and configurations, we track how often an attackercompromises a device and for how long. However, the system per design can display some small latency whenadjusting to a new user, mainly to avoid locking out the legitimate owner on a single false negative. We thus onlyconsider a device compromised if the attacker has access for more than two seconds in total.
5.2.4 Authentication. We simulate two authentication systems. A traditional, knowledge-based authenticationsystem on each individual device is used as a reference to evaluate CORMORANT against.
For password-based authentication, the strength of the password is modeled based on empirical studies on theaverage password security for a given device type. For the traditional authentication system, we assume thatsmartphones and tablets are protected by a graphical pattern as commonly used on Android devices. Based onfindings by Uellenbeck et al. [74], the attacker has a 4% probability of successfully guessing the graphical patternwithin the 10 tries. For notebooks we assume a stronger password. With at most 10 tries, the attacker successfullyguesses the password with 0.1% probability, based on the analysis of 70 million passwords by Bonneau [8].
For CORMORANT , we simulate gait recognition, face recognition, speaker recognition, and keystroke dynamics,as well as a classic password challenge as fallback. The biometrics are driven based on empirical data gathered onmobile devices during the implementing and evaluating of those biometrics in adjacent research efforts [22, 44,52, 53]. Device owners and attackers are randomly associated with participants in the corresponding evaluationdatasets. For biometrics, we draw matching scores and measurement variance from the corresponding distributionwhen activated by the user’s simulated behavior. The biometrics hence show the same error characteristics andnoise in the simulation as seen during their empirical evaluation. When using CORMORANT as the authenticationsystem, we assume tablet and smartphone to be protected by passwords of strength equal to the notebookpassword, as it is only used as a fallback if none of the biometrics is active or provides enough confidence to allowaccess. This is necessary as generally any advanced authentication system that falls back to knowledge-basedauthentication is by nature less secure than relying only on the same knowledge-based authentication challengealone, as the probability to obtain unauthorized access via biometrics or the knowledge-based fallback is additive.
5.2.5 Risk. The time-of-day risk estimation as well as the intrusion detection work as outlined above. Since thesimulation is confined to New York, the macro location risk detection is static, as it estimates risk on the level ofindividual countries. For the simulation, we replace it with a simple micro-location risk detection based on thenumber of relevant crimes per capita for each of the five boroughs [16, 77].
5.3 BaselineWe evaluate the performance of CORMORANT relative to the currently most common form of authentication,i.e., knowledge-based authentication. Though in reality only two out of three devices would be protected by
Proc. ACM Interact. Mob. Wearable Ubiquitous Technol., Vol. 3, No. 3, Article 85. Publication date: September 2019.

CORMORANT: Ubiquitous Risk-Aware Multi-Modal Biometric Authentication across Mobile Devices • 85:15
authentication [2, 18, 27, 28], we assume all devices to use authentication since we are primarily interested inthe direct comparison between CORMORANT and traditional knowledge-based authentication. We establish thebaseline by running the simulation with an independent password system on every simulated device. When anattacker attempts to access a device in the aftermath of a crime, he could gain access by either attempting accessbefore the display lock timeout secures the device if it was used immediately before the crime, or by mounting asuccessful guessing attack on the password within ten tries. We measure how often and for how long an attackergains unauthorized access as a scale for security and how often the legitimate owner enters the password as ameasure for usability. The number of password entries is realistic, as each instance corresponds to a real-worlddevice unlock within the dataset. The extent of unauthorized access, however is not to be interpreted as anabsolute measure, as every simulated owner is the victim of a crime several times per hour. By running the exactsame simulation ceteris paribus, down to the second in which a crime occurs, with a different authenticationsystem, however, we can compare the relative number and extent of unauthorized access against the baseline togauge the relative difference in security.
5.4 Parameter OptimizationThe simulation framework outlined above not only allows evaluating systems like CORMORANT but also facilitatesoptimization of the overall system using heuristic search techniques from artificial intelligence. We thus employeddifferent optimization strategies in order to establish optimal configurations for a number of goals. We useda number of different techniques like random restart hill climbing, simulated annealing, and gradient descentiteratively with increasing simulation size to find optimal solutions for a given goal. The goals were to maximizeusability without compromising security, to maximize security without compromising usability, and to maximizeboth security and usability equally. The cost function to optimize usability for instance would score on thereduction in explicit authentication necessary as fallback when biometric confidence wasn’t sufficient to obtainaccess to the device relative to the number of password entries in the baseline, as long as the overall frequencyand duration of unauthorized access did not exceed the baseline. Due to the extent of the simulation and ourcomputational resources being limited to about 20 000 CPU hours, we could only use up to 10% of the deviceusage data (449 devices with 80 432 days of usage) for optimization purposes and retained 90% of the dataset forthe evaluation. Since the crime dataset is small by comparison, we split training and evaluation data equally toobtain enough crime instances.
5.5 Simulation-based Evaluation versus User StudyWe found that using a simulation-based evaluation as opposed to employing a traditional lab or field study withactual human users offers a number of benefits but also comes with limitations. A simulation – assuming theunderlying framework and datasets are publicly available and generic enough to be project agnostic – could allowresearchers to repeat results and compare approaches. Similar to how standardized frameworks are used in otherareas, like statistical tests in cryptography [66], a standardized simulation could form the basis of a benchmarkfor biometric authentication frameworks or fusion algorithms. A simulation can also easily cover multiple ordersof magnitude more usage time than traditional user-based studies, as its scalability is essentially only limited bythe availability of suitable usage data to drive the simulation. The most important benefit we found, however,is the ability to measure and quantify security to at least some extent, which is hard to do on a larger scale inuser-based studies. This not only allowed us to quantify the security of CORMORANT in direct comparison toclassical authentication systems but also facilitated optimizing for different goals like usability versus security.However, the simulation approach also has a number of drawbacks compared to traditional user-based
evaluation. First and foremost the simulation and thus the results can only be as good as the underlying dataset.The way datasets are sourced, preprocessed, and interpreted allows for the manifestation of biases and errors. Also
Proc. ACM Interact. Mob. Wearable Ubiquitous Technol., Vol. 3, No. 3, Article 85. Publication date: September 2019.
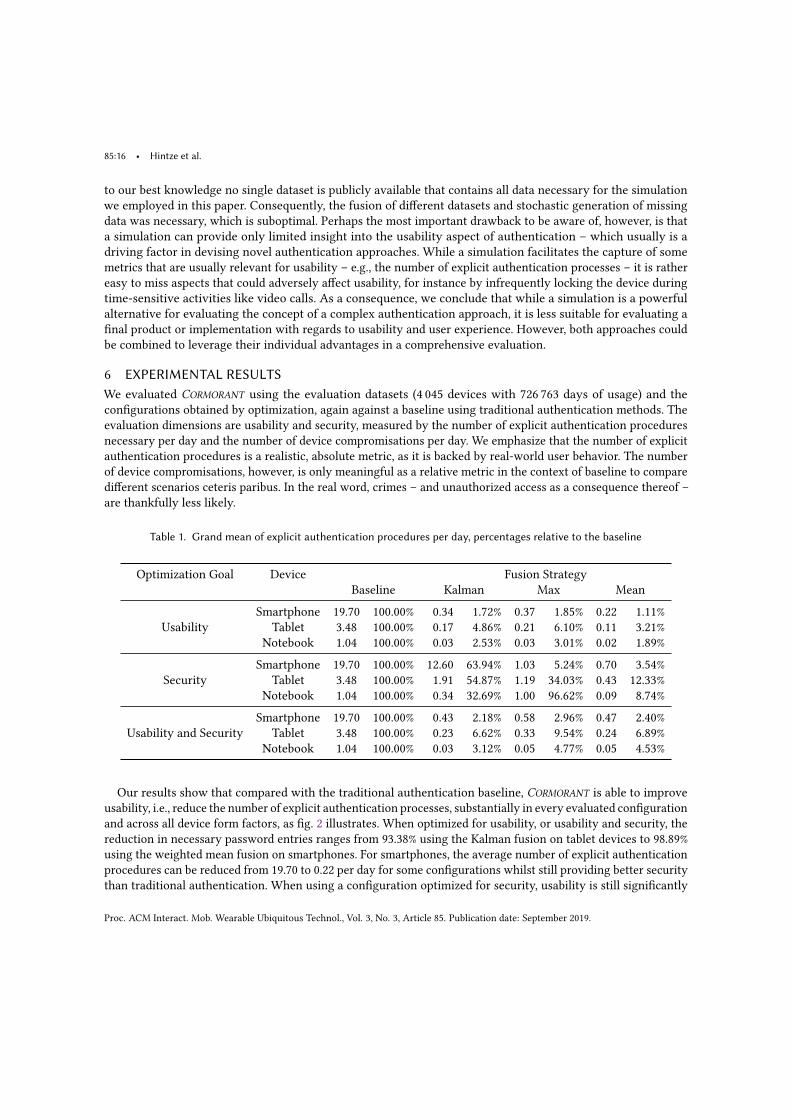
85:16 • Hintze et al.
to our best knowledge no single dataset is publicly available that contains all data necessary for the simulationwe employed in this paper. Consequently, the fusion of different datasets and stochastic generation of missingdata was necessary, which is suboptimal. Perhaps the most important drawback to be aware of, however, is thata simulation can provide only limited insight into the usability aspect of authentication – which usually is adriving factor in devising novel authentication approaches. While a simulation facilitates the capture of somemetrics that are usually relevant for usability – e.g., the number of explicit authentication processes – it is rathereasy to miss aspects that could adversely affect usability, for instance by infrequently locking the device duringtime-sensitive activities like video calls. As a consequence, we conclude that while a simulation is a powerfulalternative for evaluating the concept of a complex authentication approach, it is less suitable for evaluating afinal product or implementation with regards to usability and user experience. However, both approaches couldbe combined to leverage their individual advantages in a comprehensive evaluation.
6 EXPERIMENTAL RESULTSWe evaluated CORMORANT using the evaluation datasets (4 045 devices with 726 763 days of usage) and theconfigurations obtained by optimization, again against a baseline using traditional authentication methods. Theevaluation dimensions are usability and security, measured by the number of explicit authentication proceduresnecessary per day and the number of device compromisations per day. We emphasize that the number of explicitauthentication procedures is a realistic, absolute metric, as it is backed by real-world user behavior. The numberof device compromisations, however, is only meaningful as a relative metric in the context of baseline to comparedifferent scenarios ceteris paribus. In the real word, crimes – and unauthorized access as a consequence thereof –are thankfully less likely.
Table 1. Grand mean of explicit authentication procedures per day, percentages relative to the baseline
Optimization Goal Device Fusion StrategyBaseline Kalman Max Mean
UsabilitySmartphone 19.70 100.00% 0.34 1.72% 0.37 1.85% 0.22 1.11%
Tablet 3.48 100.00% 0.17 4.86% 0.21 6.10% 0.11 3.21%Notebook 1.04 100.00% 0.03 2.53% 0.03 3.01% 0.02 1.89%
SecuritySmartphone 19.70 100.00% 12.60 63.94% 1.03 5.24% 0.70 3.54%
Tablet 3.48 100.00% 1.91 54.87% 1.19 34.03% 0.43 12.33%Notebook 1.04 100.00% 0.34 32.69% 1.00 96.62% 0.09 8.74%
Usability and SecuritySmartphone 19.70 100.00% 0.43 2.18% 0.58 2.96% 0.47 2.40%
Tablet 3.48 100.00% 0.23 6.62% 0.33 9.54% 0.24 6.89%Notebook 1.04 100.00% 0.03 3.12% 0.05 4.77% 0.05 4.53%
Our results show that compared with the traditional authentication baseline, CORMORANT is able to improveusability, i.e., reduce the number of explicit authentication processes, substantially in every evaluated configurationand across all device form factors, as fig. 2 illustrates. When optimized for usability, or usability and security, thereduction in necessary password entries ranges from 93.38% using the Kalman fusion on tablet devices to 98.89%using the weighted mean fusion on smartphones. For smartphones, the average number of explicit authenticationprocedures can be reduced from 19.70 to 0.22 per day for some configurations whilst still providing better securitythan traditional authentication. When using a configuration optimized for security, usability is still significantly
Proc. ACM Interact. Mob. Wearable Ubiquitous Technol., Vol. 3, No. 3, Article 85. Publication date: September 2019.
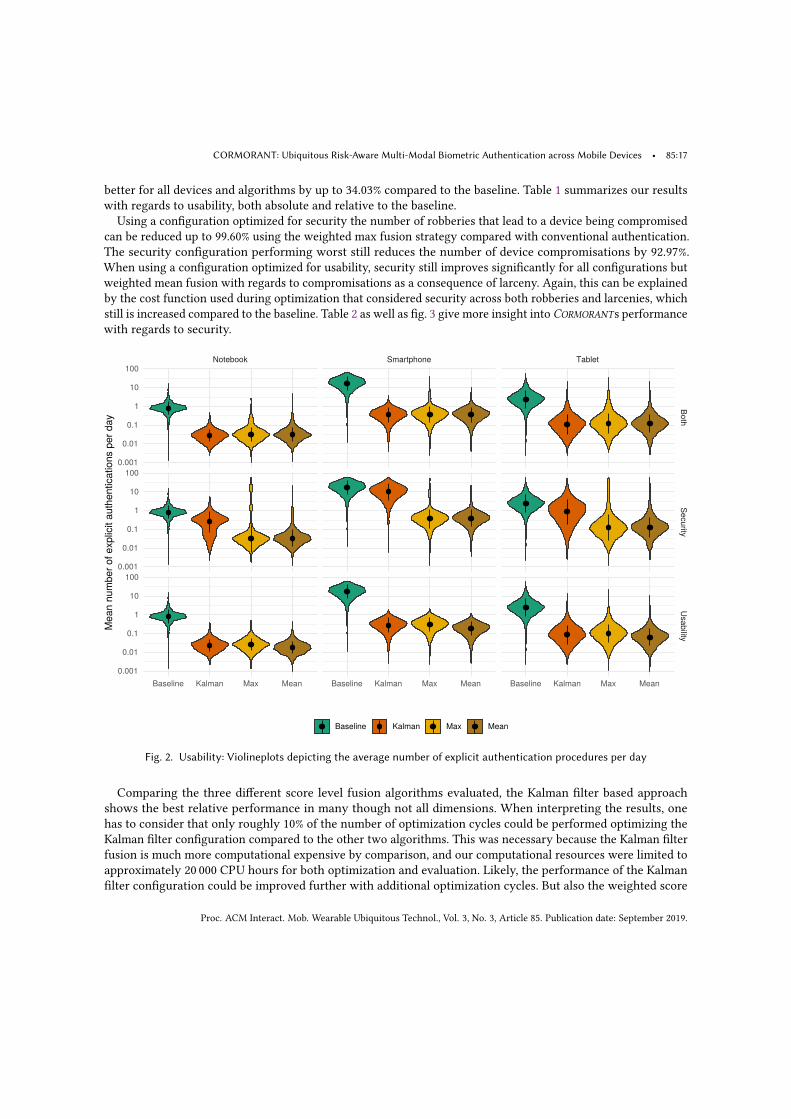
CORMORANT: Ubiquitous Risk-Aware Multi-Modal Biometric Authentication across Mobile Devices • 85:17
better for all devices and algorithms by up to 34.03% compared to the baseline. Table 1 summarizes our resultswith regards to usability, both absolute and relative to the baseline.
Using a configuration optimized for security the number of robberies that lead to a device being compromisedcan be reduced up to 99.60% using the weighted max fusion strategy compared with conventional authentication.The security configuration performing worst still reduces the number of device compromisations by 92.97%.When using a configuration optimized for usability, security still improves significantly for all configurations butweighted mean fusion with regards to compromisations as a consequence of larceny. Again, this can be explainedby the cost function used during optimization that considered security across both robberies and larcenies, whichstill is increased compared to the baseline. Table 2 as well as fig. 3 give more insight into CORMORANTs performancewith regards to security.
Fig. 2. Usability: Violineplots depicting the average number of explicit authentication procedures per day
Comparing the three different score level fusion algorithms evaluated, the Kalman filter based approachshows the best relative performance in many though not all dimensions. When interpreting the results, onehas to consider that only roughly 10% of the number of optimization cycles could be performed optimizing theKalman filter configuration compared to the other two algorithms. This was necessary because the Kalman filterfusion is much more computational expensive by comparison, and our computational resources were limited toapproximately 20 000 CPU hours for both optimization and evaluation. Likely, the performance of the Kalmanfilter configuration could be improved further with additional optimization cycles. But also the weighted score
Proc. ACM Interact. Mob. Wearable Ubiquitous Technol., Vol. 3, No. 3, Article 85. Publication date: September 2019.
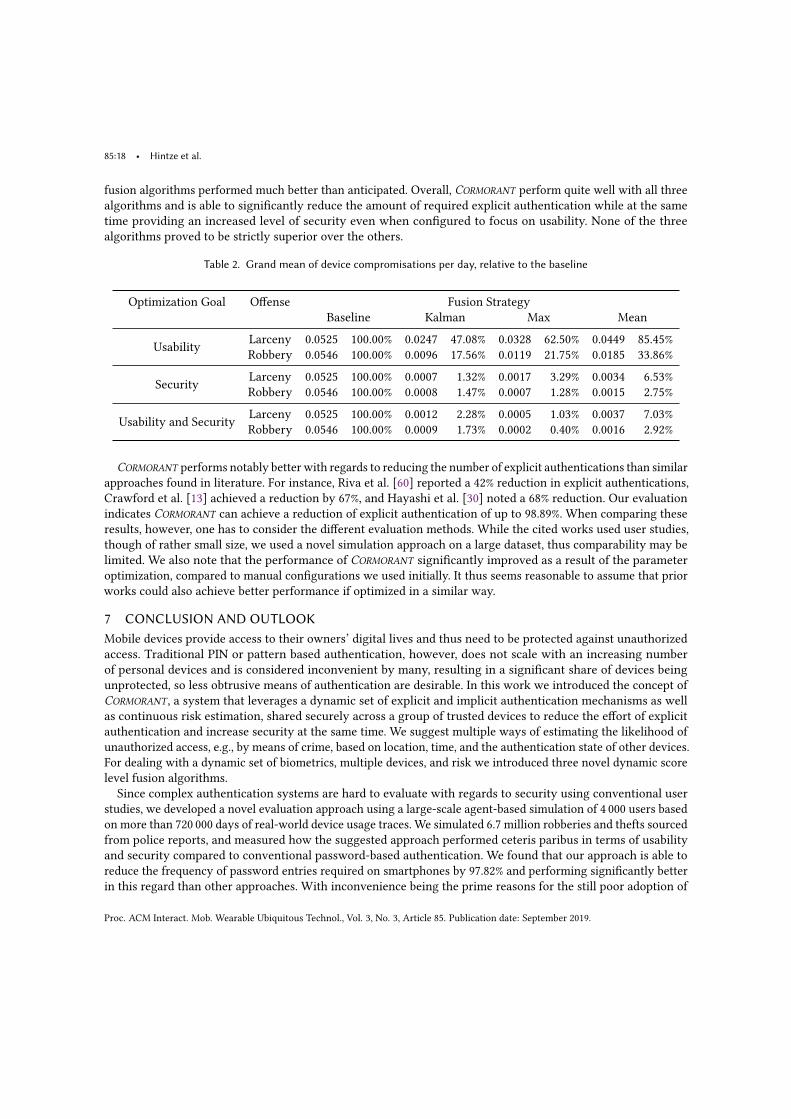
85:18 • Hintze et al.
fusion algorithms performed much better than anticipated. Overall, CORMORANT perform quite well with all threealgorithms and is able to significantly reduce the amount of required explicit authentication while at the sametime providing an increased level of security even when configured to focus on usability. None of the threealgorithms proved to be strictly superior over the others.
Table 2. Grand mean of device compromisations per day, relative to the baseline
Optimization Goal Offense Fusion StrategyBaseline Kalman Max Mean
Usability Larceny 0.0525 100.00% 0.0247 47.08% 0.0328 62.50% 0.0449 85.45%Robbery 0.0546 100.00% 0.0096 17.56% 0.0119 21.75% 0.0185 33.86%
Security Larceny 0.0525 100.00% 0.0007 1.32% 0.0017 3.29% 0.0034 6.53%Robbery 0.0546 100.00% 0.0008 1.47% 0.0007 1.28% 0.0015 2.75%
Usability and Security Larceny 0.0525 100.00% 0.0012 2.28% 0.0005 1.03% 0.0037 7.03%Robbery 0.0546 100.00% 0.0009 1.73% 0.0002 0.40% 0.0016 2.92%
CORMORANT performs notably better with regards to reducing the number of explicit authentications than similarapproaches found in literature. For instance, Riva et al. [60] reported a 42% reduction in explicit authentications,Crawford et al. [13] achieved a reduction by 67%, and Hayashi et al. [30] noted a 68% reduction. Our evaluationindicates CORMORANT can achieve a reduction of explicit authentication of up to 98.89%. When comparing theseresults, however, one has to consider the different evaluation methods. While the cited works used user studies,though of rather small size, we used a novel simulation approach on a large dataset, thus comparability may belimited. We also note that the performance of CORMORANT significantly improved as a result of the parameteroptimization, compared to manual configurations we used initially. It thus seems reasonable to assume that priorworks could also achieve better performance if optimized in a similar way.
7 CONCLUSION AND OUTLOOKMobile devices provide access to their owners’ digital lives and thus need to be protected against unauthorizedaccess. Traditional PIN or pattern based authentication, however, does not scale with an increasing numberof personal devices and is considered inconvenient by many, resulting in a significant share of devices beingunprotected, so less obtrusive means of authentication are desirable. In this work we introduced the concept ofCORMORANT , a system that leverages a dynamic set of explicit and implicit authentication mechanisms as wellas continuous risk estimation, shared securely across a group of trusted devices to reduce the effort of explicitauthentication and increase security at the same time. We suggest multiple ways of estimating the likelihood ofunauthorized access, e.g., by means of crime, based on location, time, and the authentication state of other devices.For dealing with a dynamic set of biometrics, multiple devices, and risk we introduced three novel dynamic scorelevel fusion algorithms.Since complex authentication systems are hard to evaluate with regards to security using conventional user
studies, we developed a novel evaluation approach using a large-scale agent-based simulation of 4 000 users basedon more than 720 000 days of real-world device usage traces. We simulated 6.7 million robberies and thefts sourcedfrom police reports, and measured how the suggested approach performed ceteris paribus in terms of usabilityand security compared to conventional password-based authentication. We found that our approach is able toreduce the frequency of password entries required on smartphones by 97.82% and performing significantly betterin this regard than other approaches. With inconvenience being the prime reasons for the still poor adoption of
Proc. ACM Interact. Mob. Wearable Ubiquitous Technol., Vol. 3, No. 3, Article 85. Publication date: September 2019.
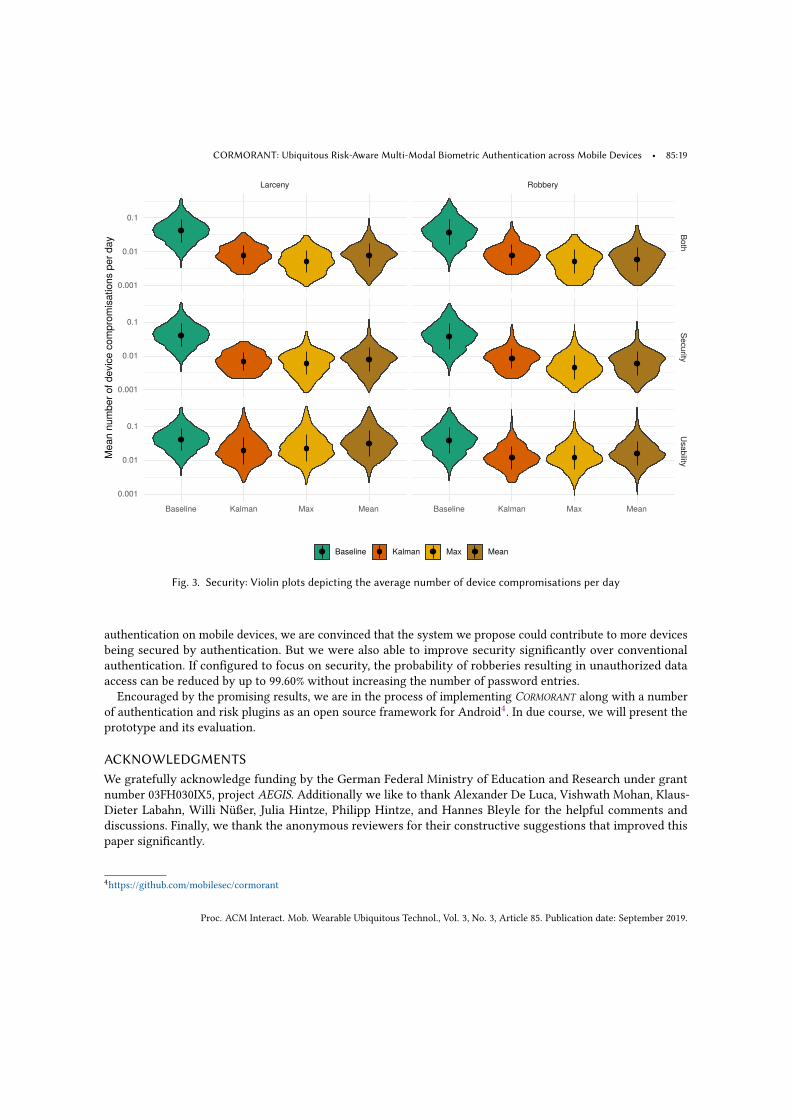
CORMORANT: Ubiquitous Risk-Aware Multi-Modal Biometric Authentication across Mobile Devices • 85:19
Fig. 3. Security: Violin plots depicting the average number of device compromisations per day
authentication on mobile devices, we are convinced that the system we propose could contribute to more devicesbeing secured by authentication. But we were also able to improve security significantly over conventionalauthentication. If configured to focus on security, the probability of robberies resulting in unauthorized dataaccess can be reduced by up to 99.60% without increasing the number of password entries.
Encouraged by the promising results, we are in the process of implementing CORMORANT along with a numberof authentication and risk plugins as an open source framework for Android4. In due course, we will present theprototype and its evaluation.
ACKNOWLEDGMENTSWe gratefully acknowledge funding by the German Federal Ministry of Education and Research under grantnumber 03FH030IX5, project AEGIS. Additionally we like to thank Alexander De Luca, Vishwath Mohan, Klaus-Dieter Labahn, Willi Nüßer, Julia Hintze, Philipp Hintze, and Hannes Bleyle for the helpful comments anddiscussions. Finally, we thank the anonymous reviewers for their constructive suggestions that improved thispaper significantly.
4https://github.com/mobilesec/cormorant
Proc. ACM Interact. Mob. Wearable Ubiquitous Technol., Vol. 3, No. 3, Article 85. Publication date: September 2019.
85:20 • Hintze et al.
REFERENCES[1] Yomna Abdelrahman, Mohamed Khamis, Stefan Schneegaß, and Florian Alt. 2017. Stay Cool! Understanding Thermal Attacks on
Mobile-based User Authentication. In Proceedings of the 2017 CHI Conference on Human Factors in Computing Systems (CHI ’17).[2] Yusuf Albayram, Mohammad Maifi Hasan Khan, Theodore Jensen, and Nhan Nguyen. 2017. "...better to use a lock screen than to worry
about saving a few seconds of time": Effect of Fear Appeal in the Context of Smartphone Locking Behavior. In SOUPS. 49–63.[3] Sayedul Aman, Haowen Jiang, Cuyler Quint, Kumar Yelamarthi, and Ahmed Abdelgawad. 2016. Reliability Evaluation of iBeacon for
Micro- Localization. In Ubiquitous Computing, Electronics & Mobile Communication Conference (UEMCON). 1–5. https://doi.org/10.1109/UEMCON.2016.7777904
[4] Panagiotis Andriotis, Theo Tryfonas, and George Oikonomou. 2014. Complexity Metrics and User Strength Perceptions of the Pattern-Lock Graphical Authentication Method. In Proceedings of the Second International Conference on Human Aspects of Information Security,Privacy, and Trust - Volume 8533. Springer-Verlag New York, Inc., New York, NY, USA, 115–126. https://doi.org/10.1007/978-3-319-07620-1_11
[5] Adam J. Aviv, Katherine Gibson, Evan Mossop, Matt Blaze, and Jonathan M. Smith. 2010. Smudge Attacks on Smartphone Touch Screens.Proceedings of the 4th USENIX conference on Offensive technologies (2010), 1–10.
[6] C. Bergamini, L.S. Oliveira, A.L. Koerich, and R. Sabourin. 2009. Combining different biometric traits with one-class classification. SignalProcessing 89, 11 (Nov. 2009), 2117–2127. https://doi.org/10.1016/j.sigpro.2009.04.043
[7] Khalid Zaman Bijon, Ram Krishnan, and Ravi Sandhu. 2013. A framework for risk-aware role based access control. 2013 IEEE Conferenceon Communications and Network Security (CNS) (2013), 462–469. https://doi.org/10.1109/CNS.2013.6682761
[8] J. Bonneau. 2012. The Science of Guessing: Analyzing an Anonymized Corpus of 70 Million Passwords. In 2012 IEEE Symposium onSecurity and Privacy. 538–552. https://doi.org/10.1109/SP.2012.49
[9] Jagmohan Chauhan, Jathushan Rajasegaran, Suranga Seneviratne, ArchanMisra, Aruna Seneviratne, and Youngki Lee. 2018. PerformanceCharacterization of Deep Learning Models for Breathing-based Authentication on Resource-Constrained Devices. Proc. ACM Interact.Mob. Wearable Ubiquitous Technol. 2, 4, Article 158 (Dec. 2018), 24 pages. https://doi.org/10.1145/3287036
[10] Richard Chow, Philippe J. P. Golle, and Jessica N. Staddon. 2012. Adjusting security level of mobile device based on presence or absenceof other mobile devices nearby. https://doi.org/10.1126/science.Liquids
[11] Richard Chow, Markus Jakobsson, Ryusuke Masuoka, Jesus Molina, Yuan Niu, Elaine Shi, and Zhexuan Song. 2010. Authenticationin the Clouds : A Framework and its Application to Mobile Users. ACM workshop on Cloud computing security (2010), 1–6. https://doi.org/10.1145/1866835.1866837
[12] Consumer Reports. 2014. Smart phone thefts rose to 3.1 million in 2013. https://www.consumerreports.org/cro/news/2014/04/smart-phone-thefts-rose-to-3-1-million-last-year/index.htm
[13] Heather Crawford, Karen Renaud, and Tim Storer. 2013. A framework for continuous, transparent mobile device authentication.Computers and Security 39, PART B (2013), 127–136.
[14] David Crouse, Hu Han, Deepak Chandra, Brandon Barbello, and Anil K. Jain. 2015. Continuous authentication of mobile user:Fusion of face image and inertial Measurement Unit data. In 2015 International Conference on Biometrics (ICB). 135–142. https://doi.org/10.1109/ICB.2015.7139043
[15] Sarat C. Dass, Karthik Nandakumar, and Anil K. Jain. 2005. A principled approach to score level fusion in multimodal biometric systems.In International conference on audio-and video-based biometric person authentication. Springer, 1049–1058.
[16] New York City Police Department. 2016. NYPD Complaint Data Historic dataset. https://data.cityofnewyork.us/Public-Safety/NYPD-Complaint-Data-Historic/qgea-i56i
[17] Nguyen Ngoc Diep, Sungyoung Lee, Young-Koo Lee, and HeeJo Lee. 2007. Contextual Risk-Based Access Control. Security andManagement (2007).
[18] Serge Egelman, Sakshi Jain, Rebecca S Portnoff, Kerwell Liao, Sunny Consolvo, and David Wagner. 2014. Are You Ready to Lock?Proceedings of the 2014 ACM SIGSAC Conference on Computer and Communications Security (2014), 750–761. https://doi.org/10.1145/2660267.2660273
[19] A. Annis Fathima, S. Vasuhi, N. T. Babu, V. Vaidehi, and Teena Mary Treesa. 2014. Fusion Framework for Multimodal Biometric PersonAuthentication System. IAENG International Journal of Computer Science 41, 1 (2014).
[20] Marcus Felson and Erika Poulsen. 2003. Simple indicators of crime by time of day. International Journal of Forecasting 19 (2003), 595–601.https://doi.org/10.1016/S0169-2070(03)00093-1
[21] J. Fierrez-Aguilar, J. Ortega-Garcia, D. Garcia-Romero, and J. Gonzalez-Rodriguez. 2003. A Comparative Evaluation of Fusion Strategiesfor Multimodal Biometric Verification. In Audio- and Video-Based Biometric Person Authentication, Gerhard Goos, Juris Hartmanis,Jan van Leeuwen, Josef Kittler, and Mark S. Nixon (Eds.). Vol. 2688. Springer Berlin Heidelberg, Berlin, Heidelberg, 830–837. http://link.springer.com/10.1007/3-540-44887-X_96 DOI: 10.1007/3-540-44887-X_96.
[22] Rainhard D. Findling, Michael Hölzl, and René Mayrhofer. 2018. Mobile Match-on-Card Authentication Using Offline-Simplified Modelswith Gait and Face Biometrics. IEEE Transactions on Mobile Computing 17, 11 (Nov 2018), 2578–2590. https://doi.org/10.1109/TMC.2018.
Proc. ACM Interact. Mob. Wearable Ubiquitous Technol., Vol. 3, No. 3, Article 85. Publication date: September 2019.

CORMORANT: Ubiquitous Risk-Aware Multi-Modal Biometric Authentication across Mobile Devices • 85:21
2812883[23] RainhardD. Findling,MuhammadMuaaz, Daniel Hintze, and RenéMayrhofer. 2017. ShakeUnlock: Securely Transfer Authentication States
BetweenMobile Devices. IEEE Transactions onMobile Computing 16, 4 (April 2017), 1163–1175. https://doi.org/10.1109/TMC.2016.2582489[24] Suneet Narula Garg, Renu Vig, and Savita Gupta. 2017. A Survey on Different Levels of Fusion in Multimodal Biometrics. Indian Journal
of Science and Technology 10, 44 (2017).[25] Dawud Gordon, John Tanios, and Oleksii Levkovskyi. 2019. Deep Learning for Behavior-Based, Invisible Multi-Factor Authentication.
https://patents.justia.com/patent/20190044942[26] Nazirah Abd Hamid, Suhailan Safei, Siti Dhalila Mohd Satar, Suriayati Chuprat, and Rabiah Ahmad. 2011. Mouse movement behavioral
biometric systems. In 2011 International Conference on User Science and Engineering (i-USEr). 206–211. https://doi.org/10.1109/iUSEr.2011.6150566
[27] Marian Harbach, Alexander De Luca, Nathan Malkin, and Serge Egelman. 2016. Keep on Lockin’ in the Free World: A Multi-NationalComparison of Smartphone Locking. Proceedings of the 2016 CHI Conference on Human Factors in Computing Systems - CHI ’16 (2016),4823–4827. https://doi.org/10.1145/2858036.2858273
[28] Marian Harbach, Emanuel Von Zezschwitz, Andreas Fichtner, Alexander De Luca, and Matthew Smith. 2014. It’s a Hard Lock Life:A Field Study of Smartphone (Un) Locking Behavior and Risk Perception. Symposium on Usable Privacy and Security (SOUPS) (2014),213–230.
[29] Avinatan Hassidim, Yossi Matias, Moti Yung, and Alon Ziv. 2016. Ephemeral Identifiers : Mitigating Tracking & Spoofing Threats to BLEBeacons. (2016), 1–11.
[30] Eiji Hayashi, Sauvik Das, Shahriyar Amini, Jason I. Hong, and Ian Oakley. 2013. CASA: context-aware scalable authentication. InSymposium on Usable Privacy and Security (SOUPS).
[31] Eiji Hayashi and Jason Hong. 2011. A diary study of password usage in daily life. Proceedings of the 2011 annual conference on Humanfactors in computing systems - CHI ’11 (2011), 2627. https://doi.org/10.1145/1978942.1979326
[32] Mingxing He, Shi-Jinn Horng, Pingzhi Fan, Ray-Shine Run, Rong-Jian Chen, Jui-Lin Lai, Muhammad Khurram Khan, and Kevin OctaviusSentosa. 2010. Performance evaluation of score level fusion in multimodal biometric systems. Pattern Recognition 43, 5 (May 2010),1789–1800. https://doi.org/10.1016/j.patcog.2009.11.018
[33] Daniel Hintze. 2015. Towards transparent multi-device-authentication. In UbiComp/ISWC’15 Adjunct. ACM, 435–440.[34] Daniel Hintze, Rainhard D. Findling, Muhammad Muaaz, Eckhard Koch, and René Mayrhofer. 2015. CORMORANT: Towards Continuous
Risk-Aware Multi-Modal Cross-Device Authentication. UbiComp 2015 Adjunct Publication (2015).[35] Daniel Hintze, Philipp Hintze, Rainhard D. Findling, and René Mayrhofer. 2017. A Large-Scale, Long-Term Analysis of Mobile
Device Usage Characteristics. Proceedings of the ACM on Interactive, Mobile, Wearable and Ubiquitous Technologies 1, 2 (2017), 1–21.https://doi.org/10.1145/3090078
[36] Daniel Hintze, Muhammad Muaaz, Rainhard D. Findling, Sebastian Scholz, Eckhard Koch, and René Mayrhofer. 2015. Confidenceand Risk Estimation Plugins for Multi-Modal Authentication on Mobile Devices using CORMORANT. In Proceedings of MoMM 2015.384–388.
[37] Daniel Hintze and Andrew Rice. 2016. Picky: Efficient and Reproducible Sharing of Large Datasets Using Merkle-Trees. 2016 IEEE 24thInternational Symposium on Modeling, Analysis and Simulation of Computer and Telecommunication Systems (MASCOTS) (2016), 30–38.https://doi.org/10.1109/MASCOTS.2016.25
[38] Daniel Hintze, Sebastian Scholz, Eckhard Koch, and René Mayrhofer. 2016. Location-based Risk Assessment for Mobile Authentication.In Proceedings of the 2016 ACM International Joint Conference on Pervasive and Ubiquitous Computing: Adjunct. http://dx.doi.org/10.1145/2968219.2971448
[39] Christopher George Hocking. 2014. Authentication Aura. Dissertation. Plymouth University.[40] Christopher G. Hocking, Steven M. Furnell, Nathan L. Clarke, and Paul L. Reynolds. 2011. Authentication Aura - A distributed approach
to user authentication. Information Assurance and Security 6, 2 (2011).[41] Adam Hurkala and Jaroslaw Hurkala. 2014. Architecture of Context-Risk-Aware Authentication System for Web Environments.
ICIEIS’2014 (2014), 219–228.[42] Markus Jakobsson, Elaine Shi, Philippe Golle, and Richard Chow. 2009. Implicit authentication for mobile devices. HotSec’09 (2009).[43] Jack A. Jones. 2007. An Introduction to Factor Analysis of Information Risk (FAIR). http://www.riskmanagementinsight.com/media/
docs/FAIR{_}introduction.pdf[44] Philipp Kapfer. 2016. PhonyKeyboard: Sensor-enhanced Keystroke Dynamics Authentication on Mobile Devices. Master Thesis. Johannes
Kepler University Linz.[45] Amy K. Karlson, A. J. Brush, and Stuart Schechter. 2009. Can I Borrow Your Phone? Understanding Concerns When Sharing Mobile
Phones. Proceedings of the SIGCHI Conference on Human Factors in Computing Systems (2009), 1647–1650. http://dl.acm.org/citation.cfm?id=1518953
[46] P. Kartik, R. V. S. S. Vara Prasad, and S. R. Mahadeva Prasanna. 2008. Noise robust multimodal biometric person authentication systemusing face, speech and signature features. In 2008 Annual IEEE India Conference, Vol. 1. 23–27. https://doi.org/10.1109/INDCON.2008.
Proc. ACM Interact. Mob. Wearable Ubiquitous Technol., Vol. 3, No. 3, Article 85. Publication date: September 2019.
85:22 • Hintze et al.
4768795[47] Hassan Khan, Aaron Atwater, and Urs Hengartner. 2014. Itus : An Implicit Authentication Framework for Android. In Proceedings of the
20th annual international conference on Mobile computing and networking (2014), 507–518. https://doi.org/10.1145/2639108.2639141[48] Dong Ju Kim, Kwang Woo Chung, and Kwang Seok Hong. 2010. Person Authentication using Face, Teeth and Voice Modalities for
Mobile Device Security. IEEE Transactions on Consumer Electronics 56, 4 (2010), 2678–2685. https://doi.org/10.1109/TCE.2010.5681156[49] Donald E. Maurer and John P. Baker. 2008. Fusing multimodal biometrics with quality estimates via a Bayesian belief network. Pattern
Recognition 41, 3 (March 2008), 821–832. https://doi.org/10.1016/j.patcog.2007.08.008[50] René Mayrhofer, Jeffrey Vander Stoep, Chad Brubaker, and Nick Kralevich. 2019. The Android Platform Security Model. CoRR
abs/1904.05572 (2019). arXiv:1904.05572 http://arxiv.org/abs/1904.05572[51] Matthias R Mehl, Simine Vazire, Nairán Ramírez-Esparza, Richard B. Slatcher, and James W. Pennebaker. 2007. Are women really more
talkative than men? Science 317, 5834 (6 7 2007), 82. https://doi.org/10.1126/science.1139940[52] Muhammad Muaaz and Rene Mayrhofer. 2014. Orientation Independent Cell Phone Based Gait Authentication. Proceedings of MoMM
2014 (2014).[53] M. Muaaz and R. Mayrhofer. 2017. Smartphone-Based Gait Recognition: From Authentication to Imitation. IEEE Transactions on Mobile
Computing 16, 11 (Nov 2017), 3209–3221. https://doi.org/10.1109/TMC.2017.2686855[54] Ildar Muslukhov, Y Boshmaf, Cynthia Kuo, Jonathan Lester, and K Beznosov. 2013. Know Your Enemy: The Risk of Unauthorized Access
in Smartphones by Insiders. Proceedings of the 15th international conference on Human-computer interaction with mobile devices andservices (MobileHCI ’13) (2013), 271–280. https://doi.org/10.1145/2493190.2493223
[55] Karthik Nandakumar, Yi Chen, Sarat C. Dass, and Anil Jain. 2008. Likelihood ratio-based biometric score fusion. IEEE transactions onpattern analysis and machine intelligence 30, 2 (2008), 342–347.
[56] New York State Department of Labor. 2018. Local Area Unemployment Statistics. (2018).[57] Claudia Nickel. 2012. Accelerometer-based Biometric Gait Recognition for Authentication on Smartphones. Ph.D. Dissertation. TU
Darmstadt.[58] N. Poh and J. Kittler. 2012. A Unified Framework for Biometric Expert Fusion Incorporating Quality Measures. IEEE Transactions on
Pattern Analysis and Machine Intelligence 34, 1 (Jan. 2012), 3–18. https://doi.org/10.1109/TPAMI.2011.102[59] Douglas A. Reynolds, Thomas F. Quatieri, and Robert B. Dunn. 2000. Speaker Verification Using Adapted Gaussian Mixture Models.
Digital Signal Processing 10, 1 (2000), 19 – 41. https://doi.org/10.1006/dspr.1999.0361[60] Oriana Riva, Chuan Qin, Karin Strauss, and Dimitrios Lymberopoulos. 2011. Progressive Authentication: Deciding When to Authenticate
on Mobile Phones. Proceedings of the 21st USENIX Security Symposium (2011), 1–16.[61] Arun Ross and Anil K Jain. 2004. Multimodal Biometrics: an Overview. Signal Processing September (2004), 1221–1224. https:
//doi.org/citeulike-article-id:460352[62] P. S. Sanjekar and J. B. Patil. 2013. An Overview of Multimodal Biometrics. Signal & Image Processing (SIPIJ) 4, 1 (2013), 57–64.[63] S. Shekhar, V.M. Patel, N.M. Nasrabadi, and R. Chellappa. 2014. Joint Sparse Representation for RobustMultimodal Biometrics Recognition.
IEEE Transactions on Pattern Analysis and Machine Intelligence 36, 1 (Jan 2014), 113–126. https://doi.org/10.1109/TPAMI.2013.109[64] Hiew Moi Sim, Hishammuddin Asmuni, Rohayanti Hassan, and Razib M Othman. 2014. Multimodal biometrics: Weighted score level
fusion based on non-ideal iris and face images. Expert Systems with Applications 41, 11 (2014), 5390–5404. https://doi.org/10.1016/j.eswa.2014.02.051
[65] Adam Skillen, David Barrera, and Paul C. van Oorschot. 2013. Deadbolt. Proceedings of the Third ACM workshop on Security and privacyin smartphones & mobile devices - SPSM ’13 (2013), 3–14. https://doi.org/10.1145/2516760.2516771
[66] Juan Soto. 1999. Statistical testing of random number generators. In Proceedings of the 22nd National Information Systems SecurityConference, Vol. 10. NIST Gaithersburg, MD, 12.
[67] Frank Stajano. 2011. Pico: No more passwords! Lecture Notes in Computer Science 7114 LNCS (2011), 49–81.[68] Jiayao Tan, Xiaoliang Wang, Cam-Tu Nguyen, and Yu Shi. 2018. SilentKey: A New Authentication Framework through Ultrasonic-
based Lip Reading. Proceedings of the ACM on Interactive, Mobile, Wearable and Ubiquitous Technologies 2 (2018), 1–18. https://doi.org/10.1145/3191768
[69] Nils Ole Tippenhauer, Heinrich Luecken, Marc Kuhn, and Srdjan Capkun. 2015. UWB Rapid-bit-exchange System for Distance Bounding.In Proceedings of the 8th ACM Conference on Security & Privacy in Wireless and Mobile Networks (WiSec ’15). ACM, New York, NY, USA,Article 2, 12 pages. https://doi.org/10.1145/2766498.2766504
[70] Netanya Tomer Eden and Boaz Avigad. 2012. Location Based Authentication System. https://doi.org/10.1126/science.Liquids[71] Issa Traore, Isaac Woungang, Mohammad S. Obaidat, Youssef Nakkabi, and Iris Lai. 2012. Combining Mouse and Keystroke Dynamics
Biometrics for Risk-Based Authentication in Web Environments. 2012 Fourth International Conference on Digital Home (2012), 138–145.[72] P. Tresadern, T. F. Cootes, N. Poh, P. Matejka, A. Hadid, Christophe Lévy, C. McCool, and S. Marcel. 2013. Mobile Biometrics: Combined
Face and Voice Verification for a Mobile Platform. IEEE Pervasive Computing 12, 01 (2013), 79–87.[73] Catrine Tudor-Locke, William D. Johnson, and Peter T. Katzmarzyk. 2009. Accelerometer-determined steps per day inus adults. Medicine
and Science in Sports and Exercise (2009). https://doi.org/10.1249/MSS.0b013e318199885c
Proc. ACM Interact. Mob. Wearable Ubiquitous Technol., Vol. 3, No. 3, Article 85. Publication date: September 2019.

CORMORANT: Ubiquitous Risk-Aware Multi-Modal Biometric Authentication across Mobile Devices • 85:23
[74] Sebastian Uellenbeck, Markus Dürmuth, Christopher Wolf, and Thorsten Holz. 2013. Quantifying the Security of Graphical Passwords:The Case of Android Unlock Patterns. In Proceedings of the 2013 ACM SIGSAC Conference on Computer & Communications Security(CCS ’13). ACM, New York, NY, USA, 161–172. https://doi.org/10.1145/2508859.2516700
[75] United Nations Office on Drugs and Crime. 2018. Crime and Criminal Justice Statistics. https://data.unodc.org[76] U.S. Census Bureau. 2013. Census Bureau Reports 1.6 Million Workers Commute into Manhattan Each Day. (2013). https://www.census.
gov/newsroom/press-releases/2013/cb13-r17.html[77] U.S. Census Bureau. 2018. Annual Estimates of the Resident Population: April 1, 2010 to July 1, 2017. (2018).[78] Alex Varshavsky, Adin Scannell, Anthony LaMarca, and Eyal de Lara. 2007. Amigo: Proximity-Based Authentication of Mobile Devices.
In UbiComp 2007: Ubiquitous Computing. Berlin, Heidelberg, 253–270.[79] Emanuel von Zezschwitz, Alexander De Luca, Philipp Janssen, and Heinrich Hussmann. 2015. Easy to Draw, but Hard to Trace?: On
the Observability of Grid-based (Un)Lock Patterns. In Proceedings of the 33rd Annual ACM Conference on Human Factors in ComputingSystems (CHI ’15). ACM, New York, NY, USA, 2339–2342. https://doi.org/10.1145/2702123.2702202
[80] Emanuel von Zezschwitz, Paul Dunphy, and Alexander De Luca. 2013. Patterns in the Wild: A Field Study of the Usability of Patternand PIN-based Authentication on Mobile Devices. (2013), 261–270.
[81] Daniel T. Wagner, Andrew Rice, and Alastair R. Beresford. 2013. Device Analyzer: Large-scale mobile data collection. In Big DataAnalytics workshop, ACM Sigmetrics 2013.
[82] Daniel T. Wagner, Andrew Rice, and Alastair R. Beresford. 2013. Device Analyzer: Understanding smartphone usage. In 10th InternationalConference on Mobile and Ubiquitous Systems: Computing, Networking and Services.
[83] F. Wang and J. Han. 2009. Multimodal biometric authentication based on score level fusion using support vector machine. Opto-ElectronicsReview 17, 1 (Jan. 2009). https://doi.org/10.2478/s11772-008-0054-8
[84] Lei Wang, Kang Huang, Ke Sun, Wei Wang, Chen Tian, Lei Xie, and Qing Gu. 2018. Unlock with Your Heart: Heartbeat-basedAuthentication on Commercial Mobile Phones. Proc. ACM Interact. Mob. Wearable Ubiquitous Technol. 2, 3, Article 140 (Sept. 2018),22 pages. https://doi.org/10.1145/3264950
[85] Yunhong Wang, Tieniu Tan, and Anil K. Jain. 2003. Combining Face and Iris Biometrics for Identity Verification. In Proceedings of the4th International Conference on Audio- and Video-based Biometric Person Authentication (AVBPA’03). Springer-Verlag, Berlin, Heidelberg,805–813. http://dl.acm.org/citation.cfm?id=1762222.1762327
[86] Christopher K. Wikle and L. Mark Berliner. 2007. A Bayesian tutorial for data assimilation. Physica D: Nonlinear Phenomena 230, 1(2007), 1 – 16. https://doi.org/10.1016/j.physd.2006.09.017
[87] Gregory D Williamson. 2006. Enhanced Authentication In Online Banking. Journal of Economic Crime Management Fall 4, 2 (2006),1–42.
[88] Scott Wright. 2012. The Symantec Smartphone Honey Stick Project. Symantec Corporation (2012). http://www.symantec.com/content/en/us/about/presskits/b-symantec-smartphone-honey-stick-project.en-us.pdf
[89] Jeff Yan, Alan Blackwells, Ross Anderson, and Alasdair Grant. 2004. Password Memorability and Security: Empirical Results. IEEESecurity & Privacy 2, 5 (2004), 25–31.
Proc. ACM Interact. Mob. Wearable Ubiquitous Technol., Vol. 3, No. 3, Article 85. Publication date: September 2019.


11C R O S S - D E V I C E B I O M E T R I C A U T H E N T I C AT I O N -I M P L E M E N TAT I O N
The following paper has accepted for publication as:
Publication
Title CORMORANT: On Implementing Risk-Aware Multi-Modal Biometric Cross-Device Authentication For Android
Authors Daniel Hintze, Matthias Füller, Sebastian Scholz, RainhardD. Findling, Muhammad Muaaz, Philipp Kapfer, WilhelmNüßer, and René Mayrhofer
Proceedings Proceedings of the 17th International Conference on Ad-vances in Mobile Computing and Multimedia (MoMM’19),(accepted, pending publication)
Candidate’s Contribution
Contribution The candidate designed and led the implementation ofthe CORMORANT framework including client, backend, plu-gin API, and risk evaluation plugins. He supported theco-authors who implemented individual biometric plug-ins. The candidate wrote the manuscript, with the excep-tion of section 4, acted as corresponding author, and willpresent the results during the International Conference onAdvances in Mobile Computing and Multimedia, 2-4 De-cember 2019 in Munich, Germany.
Overall percentage 60%
Co-Authors
By signing, each co-author certifies that the candidate’s stated contribution to thepublication is accurate (as detailed above); permission is granted for the candidateto include the publication his doctoral thesis; and that the sum of all co-authorcontributions is equal to 100% less the candidate’s stated contribution.
Exclu
ded
Exclu
ded
Exclu
ded
Exclu
ded
Matthias Füller Sebastian Scholz Rainhard D. Findling Muhammad Muaaz
Exclu
ded
Exclu
ded
Exclu
ded
Philipp Kapfer Wilhelm Nüßer René Mayrhofer
135
136 Bibliography
Prior Publications
Parts and preliminary versions of this work have previously been published in
• Daniel Hintze, Muhammad Muaaz, Rainhard D. Findling, Sebastian Scholz,Eckhard Koch, and René Mayrhofer. “Confidence and Risk Estimation Plug-ins for Multi-Modal Authentication on Mobile Devices using CORMORANT.”in: Proceedings of the 13th International Conference on Advances in Mobile Com-puting and Multimedia (MoMM’15). 2015, pp. 384–388. doi: 10.1145/2837126.2843845, and
• Daniel Hintze, Sebastian Scholz, Eckhard Koch, and René Mayrhofer. “Loca-tion-based Risk Assessment for Mobile Authentication.” In: Adjunct Proceed-ings of the 2016 ACM International Joint Conference on Pervasive and UbiquitousComputing (UbiComp’16 Adjunct). 2016, pp. 85–88. doi: 10.1145/2968219.
2971448
and are not included in this dissertation.
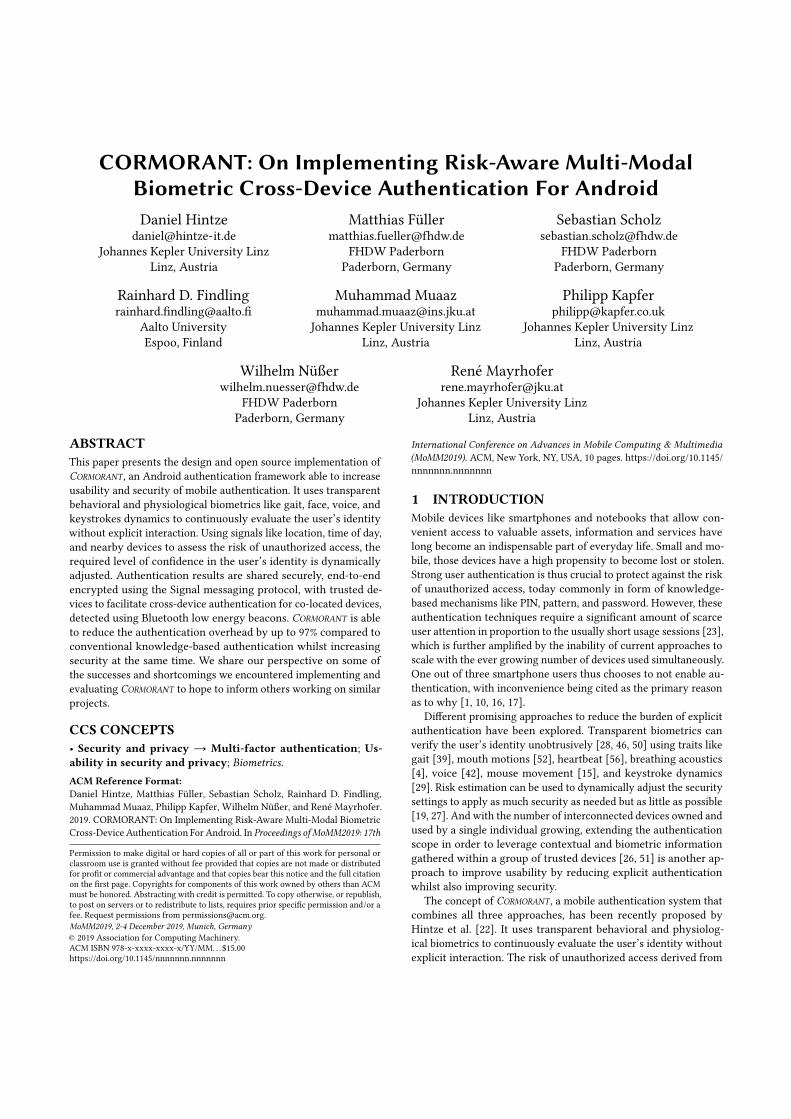
CORMORANT: On Implementing Risk-Aware Multi-ModalBiometric Cross-Device Authentication For AndroidDaniel Hintze
[email protected] Kepler University Linz
Linz, Austria
Matthias Fü[email protected]
FHDW PaderbornPaderborn, Germany
Sebastian [email protected]
FHDW PaderbornPaderborn, Germany
Rainhard D. [email protected]
Aalto UniversityEspoo, Finland
Muhammad [email protected] Kepler University Linz
Linz, Austria
Philipp [email protected]
Johannes Kepler University LinzLinz, Austria
Wilhelm Nüß[email protected]
FHDW PaderbornPaderborn, Germany
René [email protected]
Johannes Kepler University LinzLinz, Austria
ABSTRACTThis paper presents the design and open source implementation ofCORMORANT , an Android authentication framework able to increaseusability and security of mobile authentication. It uses transparentbehavioral and physiological biometrics like gait, face, voice, andkeystrokes dynamics to continuously evaluate the user’s identitywithout explicit interaction. Using signals like location, time of day,and nearby devices to assess the risk of unauthorized access, therequired level of confidence in the user’s identity is dynamicallyadjusted. Authentication results are shared securely, end-to-endencrypted using the Signal messaging protocol, with trusted de-vices to facilitate cross-device authentication for co-located devices,detected using Bluetooth low energy beacons. CORMORANT is ableto reduce the authentication overhead by up to 97% compared toconventional knowledge-based authentication whilst increasingsecurity at the same time. We share our perspective on some ofthe successes and shortcomings we encountered implementing andevaluating CORMORANT to hope to inform others working on similarprojects.
CCS CONCEPTS• Security and privacy → Multi-factor authentication; Us-ability in security and privacy; Biometrics.ACM Reference Format:Daniel Hintze, Matthias Füller, Sebastian Scholz, Rainhard D. Findling,Muhammad Muaaz, Philipp Kapfer, Wilhelm Nüßer, and René Mayrhofer.2019. CORMORANT: On Implementing Risk-Aware Multi-Modal BiometricCross-Device Authentication For Android. In Proceedings of MoMM2019: 17th
Permission to make digital or hard copies of all or part of this work for personal orclassroom use is granted without fee provided that copies are not made or distributedfor profit or commercial advantage and that copies bear this notice and the full citationon the first page. Copyrights for components of this work owned by others than ACMmust be honored. Abstracting with credit is permitted. To copy otherwise, or republish,to post on servers or to redistribute to lists, requires prior specific permission and/or afee. Request permissions from [email protected], 2-4 December 2019, Munich, Germany© 2019 Association for Computing Machinery.ACM ISBN 978-x-xxxx-xxxx-x/YY/MM. . . $15.00https://doi.org/10.1145/nnnnnnn.nnnnnnn
International Conference on Advances in Mobile Computing & Multimedia(MoMM2019). ACM, New York, NY, USA, 10 pages. https://doi.org/10.1145/nnnnnnn.nnnnnnn
1 INTRODUCTIONMobile devices like smartphones and notebooks that allow con-venient access to valuable assets, information and services havelong become an indispensable part of everyday life. Small and mo-bile, those devices have a high propensity to become lost or stolen.Strong user authentication is thus crucial to protect against the riskof unauthorized access, today commonly in form of knowledge-based mechanisms like PIN, pattern, and password. However, theseauthentication techniques require a significant amount of scarceuser attention in proportion to the usually short usage sessions [23],which is further amplified by the inability of current approaches toscale with the ever growing number of devices used simultaneously.One out of three smartphone users thus chooses to not enable au-thentication, with inconvenience being cited as the primary reasonas to why [1, 10, 16, 17].
Different promising approaches to reduce the burden of explicitauthentication have been explored. Transparent biometrics canverify the user’s identity unobtrusively [28, 46, 50] using traits likegait [39], mouth motions [52], heartbeat [56], breathing acoustics[4], voice [42], mouse movement [15], and keystroke dynamics[29]. Risk estimation can be used to dynamically adjust the securitysettings to apply as much security as needed but as little as possible[19, 27]. And with the number of interconnected devices owned andused by a single individual growing, extending the authenticationscope in order to leverage contextual and biometric informationgathered within a group of trusted devices [26, 51] is another ap-proach to improve usability by reducing explicit authenticationwhilst also improving security.
The concept of CORMORANT , a mobile authentication system thatcombines all three approaches, has been recently proposed byHintze et al. [22]. It uses transparent behavioral and physiolog-ical biometrics to continuously evaluate the user’s identity withoutexplicit interaction. The risk of unauthorized access derived from
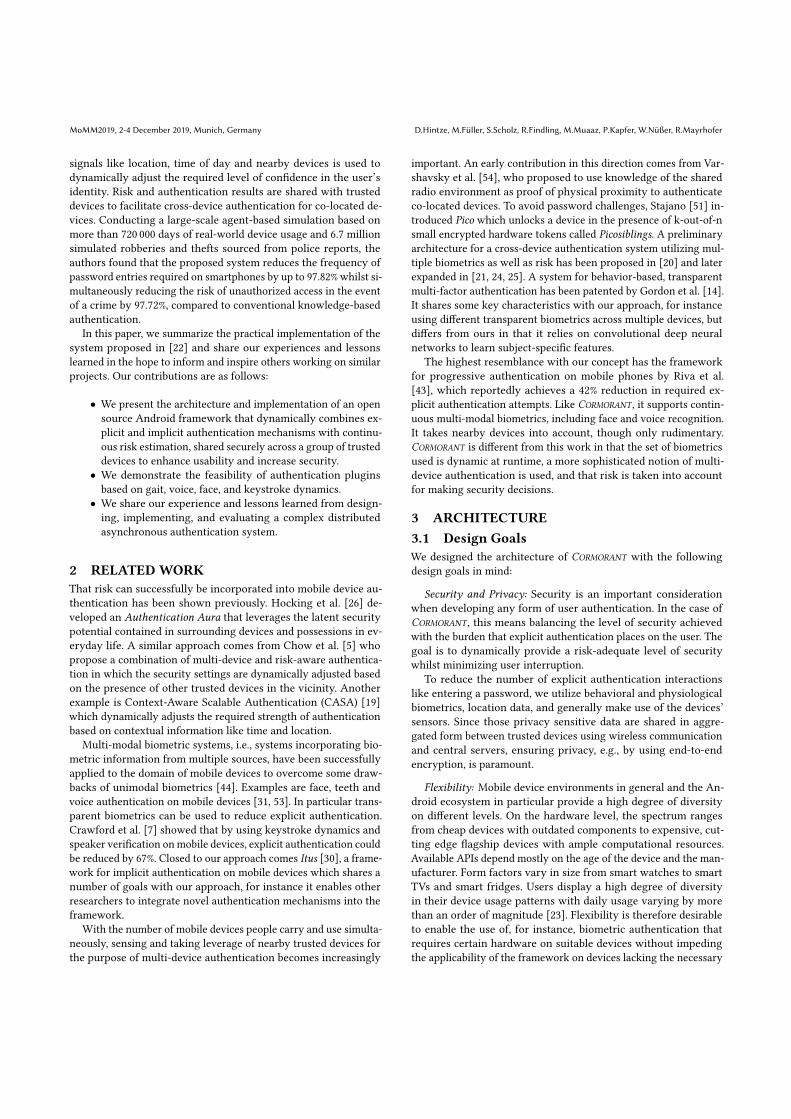
MoMM2019, 2-4 December 2019, Munich, Germany D.Hintze, M.Füller, S.Scholz, R.Findling, M.Muaaz, P.Kapfer, W.Nüßer, R.Mayrhofer
signals like location, time of day and nearby devices is used todynamically adjust the required level of confidence in the user’sidentity. Risk and authentication results are shared with trusteddevices to facilitate cross-device authentication for co-located de-vices. Conducting a large-scale agent-based simulation based onmore than 720 000 days of real-world device usage and 6.7 millionsimulated robberies and thefts sourced from police reports, theauthors found that the proposed system reduces the frequency ofpassword entries required on smartphones by up to 97.82% whilst si-multaneously reducing the risk of unauthorized access in the eventof a crime by 97.72%, compared to conventional knowledge-basedauthentication.
In this paper, we summarize the practical implementation of thesystem proposed in [22] and share our experiences and lessonslearned in the hope to inform and inspire others working on similarprojects. Our contributions are as follows:
• We present the architecture and implementation of an opensource Android framework that dynamically combines ex-plicit and implicit authentication mechanisms with continu-ous risk estimation, shared securely across a group of trusteddevices to enhance usability and increase security.• We demonstrate the feasibility of authentication pluginsbased on gait, voice, face, and keystroke dynamics.• We share our experience and lessons learned from design-ing, implementing, and evaluating a complex distributedasynchronous authentication system.
2 RELATEDWORKThat risk can successfully be incorporated into mobile device au-thentication has been shown previously. Hocking et al. [26] de-veloped an Authentication Aura that leverages the latent securitypotential contained in surrounding devices and possessions in ev-eryday life. A similar approach comes from Chow et al. [5] whopropose a combination of multi-device and risk-aware authentica-tion in which the security settings are dynamically adjusted basedon the presence of other trusted devices in the vicinity. Anotherexample is Context-Aware Scalable Authentication (CASA) [19]which dynamically adjusts the required strength of authenticationbased on contextual information like time and location.
Multi-modal biometric systems, i.e., systems incorporating bio-metric information from multiple sources, have been successfullyapplied to the domain of mobile devices to overcome some draw-backs of unimodal biometrics [44]. Examples are face, teeth andvoice authentication on mobile devices [31, 53]. In particular trans-parent biometrics can be used to reduce explicit authentication.Crawford et al. [7] showed that by using keystroke dynamics andspeaker verification onmobile devices, explicit authentication couldbe reduced by 67%. Closed to our approach comes Itus [30], a frame-work for implicit authentication on mobile devices which shares anumber of goals with our approach, for instance it enables otherresearchers to integrate novel authentication mechanisms into theframework.
With the number of mobile devices people carry and use simulta-neously, sensing and taking leverage of nearby trusted devices forthe purpose of multi-device authentication becomes increasingly
important. An early contribution in this direction comes from Var-shavsky et al. [54], who proposed to use knowledge of the sharedradio environment as proof of physical proximity to authenticateco-located devices. To avoid password challenges, Stajano [51] in-troduced Pico which unlocks a device in the presence of k-out-of-nsmall encrypted hardware tokens called Picosiblings. A preliminaryarchitecture for a cross-device authentication system utilizing mul-tiple biometrics as well as risk has been proposed in [20] and laterexpanded in [21, 24, 25]. A system for behavior-based, transparentmulti-factor authentication has been patented by Gordon et al. [14].It shares some key characteristics with our approach, for instanceusing different transparent biometrics across multiple devices, butdiffers from ours in that it relies on convolutional deep neuralnetworks to learn subject-specific features.
The highest resemblance with our concept has the frameworkfor progressive authentication on mobile phones by Riva et al.[43], which reportedly achieves a 42% reduction in required ex-plicit authentication attempts. Like CORMORANT , it supports contin-uous multi-modal biometrics, including face and voice recognition.It takes nearby devices into account, though only rudimentary.CORMORANT is different from this work in that the set of biometricsused is dynamic at runtime, a more sophisticated notion of multi-device authentication is used, and that risk is taken into accountfor making security decisions.
3 ARCHITECTURE3.1 Design GoalsWe designed the architecture of CORMORANT with the followingdesign goals in mind:
Security and Privacy: Security is an important considerationwhen developing any form of user authentication. In the case ofCORMORANT , this means balancing the level of security achievedwith the burden that explicit authentication places on the user. Thegoal is to dynamically provide a risk-adequate level of securitywhilst minimizing user interruption.
To reduce the number of explicit authentication interactionslike entering a password, we utilize behavioral and physiologicalbiometrics, location data, and generally make use of the devices’sensors. Since those privacy sensitive data are shared in aggre-gated form between trusted devices using wireless communicationand central servers, ensuring privacy, e.g., by using end-to-endencryption, is paramount.
Flexibility: Mobile device environments in general and the An-droid ecosystem in particular provide a high degree of diversityon different levels. On the hardware level, the spectrum rangesfrom cheap devices with outdated components to expensive, cut-ting edge flagship devices with ample computational resources.Available APIs depend mostly on the age of the device and the man-ufacturer. Form factors vary in size from smart watches to smartTVs and smart fridges. Users display a high degree of diversityin their device usage patterns with daily usage varying by morethan an order of magnitude [23]. Flexibility is therefore desirableto enable the use of, for instance, biometric authentication thatrequires certain hardware on suitable devices without impedingthe applicability of the framework on devices lacking the necessary
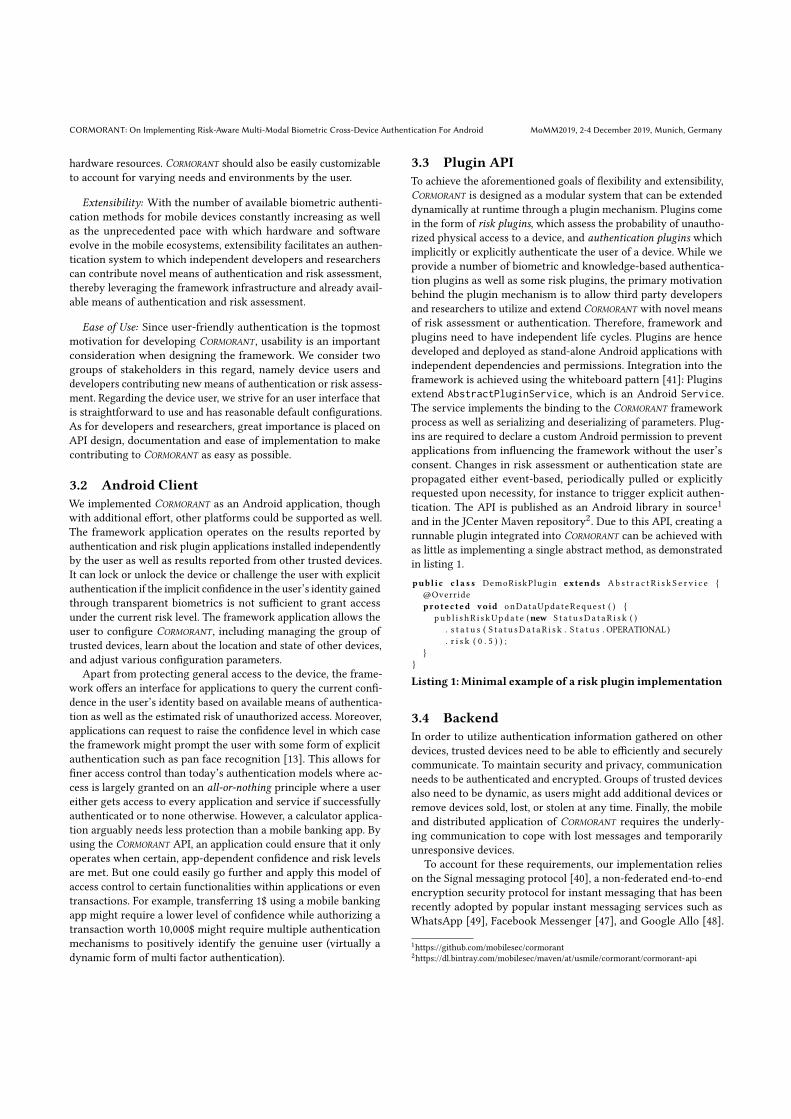
CORMORANT: On Implementing Risk-Aware Multi-Modal Biometric Cross-Device Authentication For Android MoMM2019, 2-4 December 2019, Munich, Germany
hardware resources. CORMORANT should also be easily customizableto account for varying needs and environments by the user.
Extensibility: With the number of available biometric authenti-cation methods for mobile devices constantly increasing as wellas the unprecedented pace with which hardware and softwareevolve in the mobile ecosystems, extensibility facilitates an authen-tication system to which independent developers and researcherscan contribute novel means of authentication and risk assessment,thereby leveraging the framework infrastructure and already avail-able means of authentication and risk assessment.
Ease of Use: Since user-friendly authentication is the topmostmotivation for developing CORMORANT , usability is an importantconsideration when designing the framework. We consider twogroups of stakeholders in this regard, namely device users anddevelopers contributing new means of authentication or risk assess-ment. Regarding the device user, we strive for an user interface thatis straightforward to use and has reasonable default configurations.As for developers and researchers, great importance is placed onAPI design, documentation and ease of implementation to makecontributing to CORMORANT as easy as possible.
3.2 Android ClientWe implemented CORMORANT as an Android application, thoughwith additional effort, other platforms could be supported as well.The framework application operates on the results reported byauthentication and risk plugin applications installed independentlyby the user as well as results reported from other trusted devices.It can lock or unlock the device or challenge the user with explicitauthentication if the implicit confidence in the user’s identity gainedthrough transparent biometrics is not sufficient to grant accessunder the current risk level. The framework application allows theuser to configure CORMORANT , including managing the group oftrusted devices, learn about the location and state of other devices,and adjust various configuration parameters.
Apart from protecting general access to the device, the frame-work offers an interface for applications to query the current confi-dence in the user’s identity based on available means of authentica-tion as well as the estimated risk of unauthorized access. Moreover,applications can request to raise the confidence level in which casethe framework might prompt the user with some form of explicitauthentication such as pan face recognition [13]. This allows forfiner access control than today’s authentication models where ac-cess is largely granted on an all-or-nothing principle where a usereither gets access to every application and service if successfullyauthenticated or to none otherwise. However, a calculator applica-tion arguably needs less protection than a mobile banking app. Byusing the CORMORANT API, an application could ensure that it onlyoperates when certain, app-dependent confidence and risk levelsare met. But one could easily go further and apply this model ofaccess control to certain functionalities within applications or eventransactions. For example, transferring 1$ using a mobile bankingapp might require a lower level of confidence while authorizing atransaction worth 10,000$ might require multiple authenticationmechanisms to positively identify the genuine user (virtually adynamic form of multi factor authentication).
3.3 Plugin APITo achieve the aforementioned goals of flexibility and extensibility,CORMORANT is designed as a modular system that can be extendeddynamically at runtime through a plugin mechanism. Plugins comein the form of risk plugins, which assess the probability of unautho-rized physical access to a device, and authentication plugins whichimplicitly or explicitly authenticate the user of a device. While weprovide a number of biometric and knowledge-based authentica-tion plugins as well as some risk plugins, the primary motivationbehind the plugin mechanism is to allow third party developersand researchers to utilize and extend CORMORANT with novel meansof risk assessment or authentication. Therefore, framework andplugins need to have independent life cycles. Plugins are hencedeveloped and deployed as stand-alone Android applications withindependent dependencies and permissions. Integration into theframework is achieved using the whiteboard pattern [41]: Pluginsextend AbstractPluginService, which is an Android Service.The service implements the binding to the CORMORANT frameworkprocess as well as serializing and deserializing of parameters. Plug-ins are required to declare a custom Android permission to preventapplications from influencing the framework without the user’sconsent. Changes in risk assessment or authentication state arepropagated either event-based, periodically pulled or explicitlyrequested upon necessity, for instance to trigger explicit authen-tication. The API is published as an Android library in source1and in the JCenter Maven repository2. Due to this API, creating arunnable plugin integrated into CORMORANT can be achieved withas little as implementing a single abstract method, as demonstratedin listing 1.public c l a s s DemoRiskPlugin extends Ab s t r a c t R i s k S e r v i c e {
@Overrideprotected void onDataUpdateReques t ( ) {
pub l i s hR i s kUpda t e (new S t a t u sDa t aR i s k ( ). s t a t u s ( S t a t u sDa t aR i s k . S t a t u s . OPERATIONAL ). r i s k ( 0 . 5 ) ) ;
}}
Listing 1: Minimal example of a risk plugin implementation
3.4 BackendIn order to utilize authentication information gathered on otherdevices, trusted devices need to be able to efficiently and securelycommunicate. To maintain security and privacy, communicationneeds to be authenticated and encrypted. Groups of trusted devicesalso need to be dynamic, as users might add additional devices orremove devices sold, lost, or stolen at any time. Finally, the mobileand distributed application of CORMORANT requires the underly-ing communication to cope with lost messages and temporarilyunresponsive devices.
To account for these requirements, our implementation relieson the Signal messaging protocol [40], a non-federated end-to-endencryption security protocol for instant messaging that has beenrecently adopted by popular instant messaging services such asWhatsApp [49], Facebook Messenger [47], and Google Allo [48].
1https://github.com/mobilesec/cormorant2https://dl.bintray.com/mobilesec/maven/at/usmile/cormorant/cormorant-api

MoMM2019, 2-4 December 2019, Munich, Germany D.Hintze, M.Füller, S.Scholz, R.Findling, M.Muaaz, P.Kapfer, W.Nüßer, R.Mayrhofer
Signal offers a number of desirable security properties, includingforward and future secrecy. The protocol has recently been formallyanalyzed with no major flaws found in its design [6].
To use the Signal protocol for asynchronous communication, aserver is required to temporarily store and distribute messages be-tween devices. The server also holds pre-send batches of ephemeralpublic keys to allow encrypting messages for devices currentlyoffline and thus unavailable for direct exchange of ephemeral keys.
As basis for theCORMORANT backend, we forked the Signal server3implemented by OpenWhisper Systems under AGPLv3 open sourcelicense which serves as backend infrastructure for the Signal mes-saging application. The Signal codebase was modified to removesome external dependencies not necessary for CORMORANT , for in-stance Apple Push Notifications (APN), Amazon Web Services stor-age, and Twillio’s SMS service. Unlike the Signal application, wedon’t use phone numbers but universally unique identifiers (UUIDs)as device identifiers in CORMORANT , so the server code was adaptedto support UUIDs.
TheCORMORANT backend consists of four components. AnApacheHTTP Server, configured as an reverse proxy that accept HTTPSconnections coming from the Android clients and authenticatesitself using a Let’s Encrypt4 X.509 TLS certificate. Requests are for-warded to the CORMORANT Signal server which provides REST-APIsfor creating accounts, distributing devices’ public keys, sendingmessages as well as a WebSocket-API for retrieving messages. APostgreSQL database serves as permanent storage for device ac-counts, public keys, and (encrypted) messages until they are deliv-ered to the target device. A Redis in-memory data structure storeis used as a shared cache in case multiple servers are required tohandle the system load. The backend is deployed on an UbuntuLinux 16.04 server hosted on Amazon Elastic Compute Cloud (EC2).The code is available under AGPLv3 open source license,5 allowingcurious or particularly privacy conscious users to deploy and hosttheir own instance of the backend if desired.
3.5 Distance EstimationTo facilitate multi-device authentication, being able to accuratelyestimate the distance between trusted devices is crucial. To thisend, we implemented coarse and fine distance estimation:
Coarse Distance Estimation: For coarse distance estimation, eachdevice determines its own location using the Google Services FusedLocation Provider. The Fused Location Provider utilizes GPS, WiFiand GSM data in order to determine the device’s current locationwith an accuracy of 3 to 10 meters. The location in form of latitudeand longitude coordinates is then periodically broadcasted to otherdevices within the same group.
After obtaining location information, each device uses Loca-tion.distanceBetween() from the Android Location Framework tocompute the approximate relative distance in meters between thetwo devices.
3https://github.com/WhisperSystems/Signal-Server4https://letsencrypt.org5https://github.com/mobilesec/cormorant-signal-server
Fine Distance Estimation: While the coarse distance estimationis fairly energy efficient, the accuracy is too coarse for some appli-cations within the proposed framework. In addition, it is of limitedavailability in some indoor scenarios. We therefore utilize Blue-tooth Low Energy Beacons to gain a finer distance estimation whendevices are spaced only centimeters to few meters apart.
Each device publishes a Bluetooth beacon signal by repeatedlysending a static advertisement packet, which requires little power,and simultaneously scans for nearby beacons. A published beaconis configured with the framework specific manufacturer ID, majorand minor numbers intended to identify and distinguish groupsand individual beacons, and the device’s UUID. While the latteris necessary to assign a discovered beacon to the correspondingtrusted group member, the former is configured in order to markCORMORANT beacons which are filtered by the framework’s beaconscanner.
Once a beacon sent by a device within the same group is dis-covered, the distance between the devices is computed from thereceived signal strength indicator (RSSI) by applying an estimationmodel developed by Aman et al. [2]. It calculates the estimateddistance between the devices d in meters by comparing the cur-rent RSSI with the transmitting power (txPower ) of the beacon.The transmitting power is a calibrated value, which consists of thesignal level at the reference distance of one meter.
d = 0.89976 ∗ ( RSSI
txPower)7.7095 + 0.111.
Security Limitation. We note that our current implementation offine distance estimation is susceptible to unauthorized tracking byother Bluetooth receivers within range, which might compromisea user’s privacy to some extent. A measure to mitigate trackingwould be to apply cryptographic randomization to the broadcastidentifier as proposed in [18].
Apart from tracking, Bluetooth beacons in general can be spoofedby amplifying the Bluetooth signal. In a scenario where two devicesconstituting a group are in different locations, an attacker couldreceive the beacon signal of one device, then relay it to an attackercontrolled device in the vicinity of the second trusted device, whichthen sends out a similar signal, posing as the trusted device. Tomitigate this attack, fine distance estimation is only applied whendevices are believed to be in close proximity based on the coarsedistance estimation. However, GPS, WiFi, and GSM signals are gen-erally also susceptible to spoofing if a powerful attacker is equippedwith the necessary hardware. If an attacker possessing the capabil-ity to spoof the distance estimation (e.g., a governmental agency)is assumed in the user’s personal threat model, it is advisable torefrain from using the multi-device authentication functionality ofCORMORANT but restrain its scope to individual devices.
4 AUTHENTICATIONWe implemented a number of behavioral and physiological biomet-ric authentication plugins for CORMORANT along with some trivialknowledge-based plugins like PIN and password as fallbacks. Thefollowing sections outline the biometric means of authenticationcurrently available for CORMORANT .

CORMORANT: On Implementing Risk-Aware Multi-Modal Biometric Cross-Device Authentication For Android MoMM2019, 2-4 December 2019, Munich, Germany
Figure 1: Gait recognition overview
4.1 Gait RecognitionGait as a biometric trait offers an unobtrusive way of recognizingindividuals from their walking styles. Various studies have exploredthe feasibility of deploying gait authentication on off-the-shelfmobile devices [9, 32, 37, 39]. We have developed a gait plugin thatimplicitly processes accelerometer data and delivers authenticationresults to the CORMORANT framework. Figure 1 outlines the stepsinvolved in the enrollment and the verification phases. To enroll, agait template is created by walking ≈ 300 meters at normal pace,carrying the mobile phone in the trousers’ front pocket. Once thegait template is generated, the plugin automatically switches tocontinuous verification which is similar to the enrollment phase.Details about the gait template generation process can be foundin [37, 38]. Capturing acceleration data is fairly power-intensive.We therefore utilize a low-powered ever-on step detector sensor toavoid recording accelerometer data when the user is not actuallywalking. Once the user starts walking, the step detector triggers theplugin which in turn registers to the accelerometer sensor to startrecording acceleration values. Accelerometer data are recorded fora period of fifteen seconds, after which the application checks if theuser is still walking bymonitoring the timestamps between the stepstaken by the user, and if so, continues to record acceleration data. Inparallel, previously recorded data are processed and authenticationresults computed by applying a matching engine that uses DynamicTime Warping (DTW) distance to compare live gait cycles with theenrolled template.
To evaluate the performance of our gait authentication plugin,we have recorded biometric gait data from 35 participants (6 fe-males and 29 males) using a Google Nexus Android phone. For datacollection purpose, we developed an Android application whichrecords three dimensional (X ,Y , and Z axis) accelerometer data at asampling rate of 100Hz and writes it to a text file with timestamps.Participants were asked to wear a trousers with not-too-loose frontpockets. For capturing a distinctive walking style, the phone or
Figure 2: Gait recognition evaluation results
sensor must be placed close to the body otherwise it might pickup too much random noise. In the data recording phase, the phonewas placed inside the trousers’ right side pocket. Participants wereasked to walk at their normal pace in a 68 meter long straight cor-ridor (with no stairs). They were told to wait for one second atthe end of the walk then turn around and wait for another secondbefore starting their new walk. In one session, every subject walked4 × 68 = 272 meters or in other words completed two rounds ofthe corridor. For every subject, data recording was conducted intwo different sessions. An average gap between the sessions wasabout 25 days. Eight walks were recorded for every subject in twodifferent sessions. The first walk was used to generate the referencetemplate of the subjects, whereas, the remaining walks were used togenerate probe templates. Once the reference and probe templatesare generated they are compared against each other by using DTWto compute inter-class and intra-class distances. Using this data setwe have obtained a 13% Equal Error Rate (EER) as shown in fig. 2.
4.2 Keystroke Dynamics RecognitionEvery person has their own individual typing style while enteringdata into a computer system. By employing these so called key-stroke dynamics, it is possible to recognize the user of a device.Keystroke dynamics is an implicit and unobtrusive biometric featurethat can be captured without any user interaction apart from usualkeyboard input. An important design decision is whether keystrokerecognition should be static or dynamic. For static recognition, thesystem is aware of the text to be entered beforehand and can trainthe classifier for specific input sequences. Dynamic recognition,however, is much more difficult as any interaction of a user with thekeyboard is taken into account and the system has to continuouslyre-evaluate whether that matches the user’s general behavior. Theincreased difficulty is offset by the possibility to authenticate usersmore often. The main component of keystroke dynamics recogni-tion is measuring the flow of key presses and extracting timing

MoMM2019, 2-4 December 2019, Munich, Germany D.Hintze, M.Füller, S.Scholz, R.Findling, M.Muaaz, P.Kapfer, W.Nüßer, R.Mayrhofer
Figure 3: Keystroke dynamics authentication overview
information. Commonly used metrics are digraphs (press-to-presstime between one and the consecutive key) and dwell time (time akey is held down). These timings can be gathered using any typeof keyboard, but mobile devices contain a vast array of sensorsavailable for enhancing performance. In addition, a touch screentells much more about a user’s interaction with the keyboard thanother devices. This can be the pressure applied to the screen foreach keystroke, angle and size of the finger on the screen, or therelative position of the finger to the pressed key.
The CORMORANT keystroke dynamics plugin is a static recogni-tion system for password inputs. These usually stay the same for along time, have relatively few characters and are therefore quickerto verify than whole texts. Also, they distinguish different typistsmore easily as the genuine user has more training. We extended thestandard keyboard contained in the Android AOSP with functional-ity to capture keystroke behavior and an API to indicate successfullogins. Classification is performed using a Greedy MaximumMatchScores (GMMS) measure with modification to minimize insteadof maximizing [35]. The keystroke timings are augmented by theaforementioned touch metrics, gravity and accelerometer sensordata. These are captured every time a keystroke event (pressing orreleasing a key) occurs.
For evaluation, we developed an app using a randomly generatedsix-character password with one number at start and end as login.We asked three male owners of identical Google Nexus 4 phonesand a male owning a Samsung Galaxy S4 to enter this passwordover three months and a total of 100 times each. They were asked todistribute acquisitions over various situations during the day. Thisresulted in 300 samples for training and evaluating the algorithmand 100 samples for testing whether the trained model is portablebetween devices. For evaluation, the enrollment phase ended afterthe first ten acquisitions, the rest were used for verification. Pickingthe optimum data sources as explained above, we could obtain a17.19% EER as shown in fig. 4.
Figure 4: Keystroke dynamics authentication results
4.3 Speaker RecognitionSpeaker recognition is a technique that allows to identify individ-uals from their voice samples. Speaker recognition systems canbe divided into two types: text-dependent and text-independent [3].In text-dependent speaker recognition systems users use the sameutterance for enrollment and verification phase. Whereas, in atext-independent system, users are not bound to use the same utter-ance for enrollment and verification process. Moreover, a speakerrecognition system on smartphones can be used in explicit andimplicit fashion. Considering the use cases and types of speakerrecognition systems, we have designed a speaker verification plu-gin that uses the Gaussian Mixture Model-Universal BackgroundModel (GMM-UBM) verification framework, and it can be used inboth implicit and explicit scenarios. Briefly, a GMM-UBM approachconsists of three main steps. Firstly, a UBM is trained offline byusing Expectation Maximization (EM), and the training data forUBM is obtained by pooling the feature vectors extracted from thespeech data of lots of subjects. In general, a UBM is intended torepresent a subject independent distribution of acoustic features.Secondly, user specific models are adapted from the UBM by usingthe Maximum-A-Posteriori (MAP) adaptation, and finally the fea-ture vectors extracted from the test data are evaluated against theUBM and user specific model and a likelihood ratio test is carriedout to accept or reject genuine and impostor users. Details aboutthe GMM-UBM approach can be found in [42]. Figure 5 showsvarious steps of the enrollment and the verification process. In theenrollment phase, first, users are required to download pre-trainedUBM models from a server as per their use case. This is due tothe reason that training a UBM is a computation intensive task,and it will also be cumbersome for users to collect data from a lotof subjects. Thereafter, users are asked to record speech sampleswhich are used to adapt speaker specific models. These speakerspecific models are stored in the database. In the verification phase,
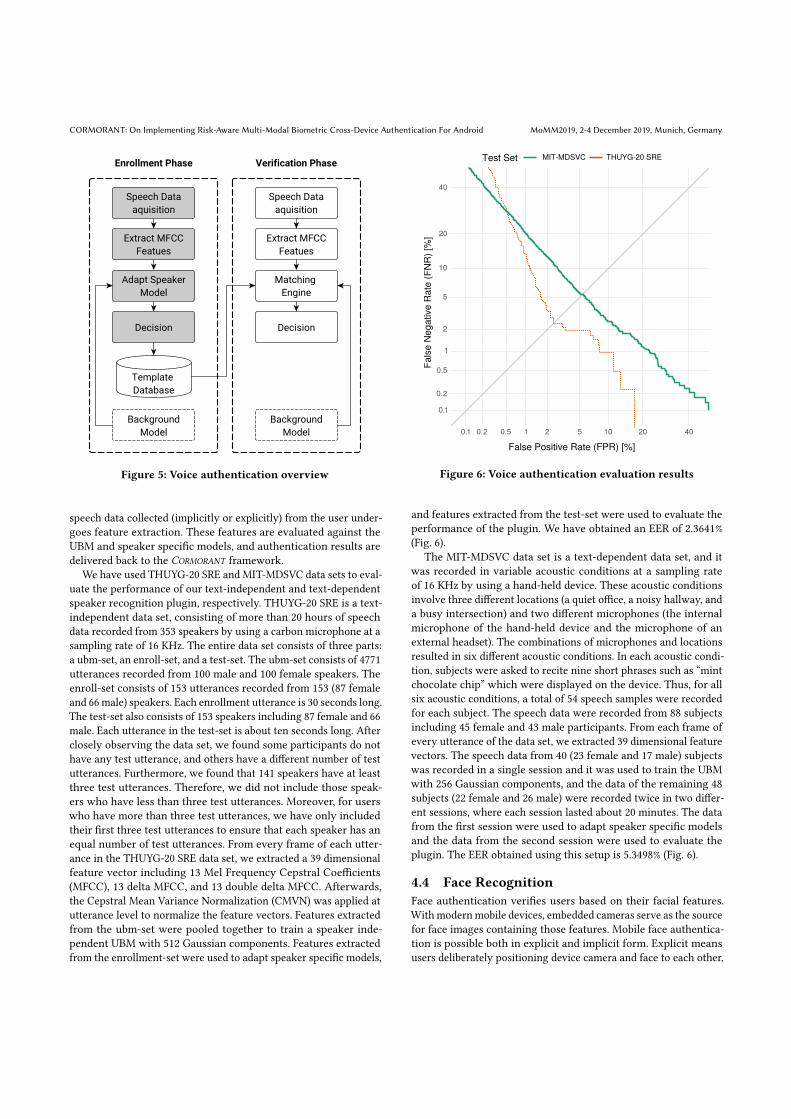
CORMORANT: On Implementing Risk-Aware Multi-Modal Biometric Cross-Device Authentication For Android MoMM2019, 2-4 December 2019, Munich, Germany
Figure 5: Voice authentication overview
speech data collected (implicitly or explicitly) from the user under-goes feature extraction. These features are evaluated against theUBM and speaker specific models, and authentication results aredelivered back to the CORMORANT framework.
We have used THUYG-20 SRE and MIT-MDSVC data sets to eval-uate the performance of our text-independent and text-dependentspeaker recognition plugin, respectively. THUYG-20 SRE is a text-independent data set, consisting of more than 20 hours of speechdata recorded from 353 speakers by using a carbon microphone at asampling rate of 16 KHz. The entire data set consists of three parts:a ubm-set, an enroll-set, and a test-set. The ubm-set consists of 4771utterances recorded from 100 male and 100 female speakers. Theenroll-set consists of 153 utterances recorded from 153 (87 femaleand 66 male) speakers. Each enrollment utterance is 30 seconds long.The test-set also consists of 153 speakers including 87 female and 66male. Each utterance in the test-set is about ten seconds long. Afterclosely observing the data set, we found some participants do nothave any test utterance, and others have a different number of testutterances. Furthermore, we found that 141 speakers have at leastthree test utterances. Therefore, we did not include those speak-ers who have less than three test utterances. Moreover, for userswho have more than three test utterances, we have only includedtheir first three test utterances to ensure that each speaker has anequal number of test utterances. From every frame of each utter-ance in the THUYG-20 SRE data set, we extracted a 39 dimensionalfeature vector including 13 Mel Frequency Cepstral Coefficients(MFCC), 13 delta MFCC, and 13 double delta MFCC. Afterwards,the Cepstral Mean Variance Normalization (CMVN) was applied atutterance level to normalize the feature vectors. Features extractedfrom the ubm-set were pooled together to train a speaker inde-pendent UBM with 512 Gaussian components. Features extractedfrom the enrollment-set were used to adapt speaker specific models,
Figure 6: Voice authentication evaluation results
and features extracted from the test-set were used to evaluate theperformance of the plugin. We have obtained an EER of 2.3641%(Fig. 6).
The MIT-MDSVC data set is a text-dependent data set, and itwas recorded in variable acoustic conditions at a sampling rateof 16 KHz by using a hand-held device. These acoustic conditionsinvolve three different locations (a quiet office, a noisy hallway, anda busy intersection) and two different microphones (the internalmicrophone of the hand-held device and the microphone of anexternal headset). The combinations of microphones and locationsresulted in six different acoustic conditions. In each acoustic condi-tion, subjects were asked to recite nine short phrases such as “mintchocolate chip” which were displayed on the device. Thus, for allsix acoustic conditions, a total of 54 speech samples were recordedfor each subject. The speech data were recorded from 88 subjectsincluding 45 female and 43 male participants. From each frame ofevery utterance of the data set, we extracted 39 dimensional featurevectors. The speech data from 40 (23 female and 17 male) subjectswas recorded in a single session and it was used to train the UBMwith 256 Gaussian components, and the data of the remaining 48subjects (22 female and 26 male) were recorded twice in two differ-ent sessions, where each session lasted about 20 minutes. The datafrom the first session were used to adapt speaker specific modelsand the data from the second session were used to evaluate theplugin. The EER obtained using this setup is 5.3498% (Fig. 6).
4.4 Face RecognitionFace authentication verifies users based on their facial features.With modernmobile devices, embedded cameras serve as the sourcefor face images containing those features. Mobile face authentica-tion is possible both in explicit and implicit form. Explicit meansusers deliberately positioning device camera and face to each other,

MoMM2019, 2-4 December 2019, Munich, Germany D.Hintze, M.Füller, S.Scholz, R.Findling, M.Muaaz, P.Kapfer, W.Nüßer, R.Mayrhofer
while implicit means that cameras capture facial features withoutusers deliberately cooperating, e.g., during conventional deviceusage.
Figure 7: Face authentication overview
With the CORMORANT face authentication plugin 6 enrollmentis explicit, while verification can be both explicit and implicit. Forenrollment users need to deliberately take a predefined numberof images of their faces in different settings, e.g., with variationin face illumination. For explicit face verification with our plugin,users deliberately position the device’s camera and their face toeach other to provide an authentication confidence measurementto CORMORANT . In contrast, with implicit authentication our plugincontinuously utilizes faces visible to the device camera and pro-vides the corresponding authentication confidence measurementsto CORMORANT . The latter can typically be done while users interactwith mobile devices and the embedded front facing cameras capturetheir faces. In both settings, the faces captured during authentica-tion are compared to enrollment faces to deduce an authenticationacceptance or rejection.
In terms of processing, the plugin at first applies grayscaling,downscaling, and histogram equalization to an original image. Itthen performs Viola and Jones face detection [34, 55] and segmentsthe quadratic region around the largest detected face, should itsdiagonal be at least 1
4 of the diagonal of the image. Segmentedfaces are downscaled and their histogram is equalized again. Thenfeatures are extracted as coefficients of amultiresolution analysis 2Ddiscrete wavelet transform using the Daubechies Least-Asymmetric2D wavelet [8]. During enrollment the features of each capturedface are stored in the enrollment template. During authenticationthose are compared pairwise with features from newly capturedfaces, using the pairwise absolute distance between feature vectorswith a precomputed Linear Discriminant Analysis (LDA) model6The CORMORANT face authentication plugin source code is public at https://github.com/mobilesec/authentication-framework-plugin-face.
(shipped with the face authentication plugin) to deduce the finalauthentication acceptance or rejection [12] as depicted in fig. 7.
Figure 8: Face authentication evaluation results
The face authentication approach underlying the CORMORANT
face authentication plugin has been evaluated on subsets of the Yale-B [33] and the Panshot Face Unlock database [11], containing 511pictures of 27 participants and 600 pictures of 30 participants. Theevaluation procedure utilized a 50/50 gallery insensitive trainingand test set split. Evaluation of different setups and selection ofthe optimal choice thereof only utilized data from the training set,internally using a ten-fold cross validation as resampling technique.The selected setup from training data uses eight face images inthe enrollment template and four newly recorded face images forauthentication, which allows for a total computation time of aboutone second, once faces have been captured. Keeping this durationshort is important, as results should be available as quickly aspossible when performing face authentication explicitly. This setupfurther achieved an EER of 2.4% and 5.3% for the Yale-B and thePanshot Face Unlock database on the previously held-back testset [12] (fig. 8).
5 LESSONS LEARNEDIn this section we share our perspective on some of the successesand shortcomings we encountered implementing and evaluatingCORMORANT in a hope to inform others working on similar projects.
One design decision that in particular proofed very valuable wasto introduce a plugin mechanism that decoupled different imple-mentations of risk evaluation and authentication from the mainframework and from one another. Since essentially each of theseplugins was developed by a different researcher across a number ofresearch groups and institutes, it maximized autonomy and flexibil-ity that only a minimal API needed to be implemented. Dependen-cies, architecture, permissions, configurations, enrollment and alikewere handled in the individual plugin projects which lowered the

CORMORANT: On Implementing Risk-Aware Multi-Modal Biometric Cross-Device Authentication For Android MoMM2019, 2-4 December 2019, Munich, Germany
entry barrier for onboarding new plugins significantly. Since plug-ins are run as standalone applications as far as the Android runtimeis concerned, crashes also only affected an individual plugin and notthe entire system. However, we also noted a number of downsidesto this approach. On the framework part, it significantly increasesthe complexity since it needs to handle intra process communica-tion as well as the unpredictable appearance and disappearanceof individual plugin processes. Another consequence was that itbecame much harder to create an appealing user experience. Forinstance, installing the framework without a minimal set of riskand authentication plugins limits its utility substantially. Also thelook and feel of each plugin is naturally different from the coreframework and the rest, making it a rather patchy experience. Westill believe that in the context of a research project, the benefits ofthe plugin approach outweigh its drawbacks.
A critical capability when developing a novel authenticationmechanism for mobile devices is the ability to reliably lock and un-lock the device. On modern mobile operating systems, applicationsare sandboxed and confined to prevent a rogue app from takingcontrol over the device [36], thus a dedicated API for controllingthe lockscreen is necessary. When we started this project in 2014,such an API still existed in form of the KeyguardManager whichallowed locking – and more importantly – unlocking an Androiddevice programmatically. However, KeyguardManager was depre-cated with API level 15 and no longer works on modern devices.Another still existing API is the DevicePolicyManager, mainly in-tended to allow companies to remotely manage their mobile devicefleet. It facilitates locking a device programatically, yet does not sup-port unlocking it. Still an API perfect for projects like CORMORANT
exists in form of the TrustAgentService, a ”service that notifiesthe system about whether it believes the environment of the de-vice to be trusted”7, which enables Android’s smart lock featureslike face unlock or unlock by Bluetooth devices in range. Unfortu-nately, the API is marked as @SystemApi and thus hidden from thepublic API. To circumvent the visibility restriction, it is necessaryto ”root” the device, thereby obtaining more or less full controlover the operating system. However, this would mean violatingAndroid’s security model [36] which might be acceptable for a re-search project but is ill advised to apply on actual consumer devices.So after KeyguardManager ceased working on current devices, weunfortunately had to abandon ambition to integrate directly withthe native Android lock screen and had to resort – like other authen-tication research projects (e.g. [45]) – to a purely visual indicatorto signify the lock state. Since this does not offer any protectionagainst unauthorized access, third-party authentication systemslike CORMORANT can not practically be used to unlock devices asidefrom demonstrating the concept unless they are either adoptedby the Android Open Source Project or a public API similar toTrustAgentService is introduced. This also limits how such systemscan be evaluated without exposing study participants to the risk ofunauthorized device access.
This leads us to the most challenging problem we encountered:The question of how to evaluate a complex and dynamic authenti-cation system like CORMORANT . Fundamentally, the two conflicting
7https://android.googlesource.com/platform/frameworks/base/+/d4efaac/core/java/android/service/trust/TrustAgentService.java
objectives usability and security are of most interest. For subcom-ponents like individual biometrics, we could use established tech-niques like cross-validation to measure their performance in bothregards, quantified e.g., by their Equal Error Rate. For assessing theoverall usability of the system, handset-based user studies can beconducted. Usually, usability is then quantified by comparing thenumber of explicit authentication interactions against either a con-trol group or a baseline established transparently in the background[57]. Measuring security e.g., by evaluating unauthorized access ispractically impossible [22] to do in such a study, as theft, robbery,and device loss are luckily rather infrequent on the level of an in-dividual – besides being also hard to reliably detect and quantify.This is problematic, as measuring only usability without accountingfor security at the same time can arguably be misleading, giventhat ultimately authentication could be disabled entirely to max-imize usability. Lab studies are sometimes used to overcome thislimitation by simulating unauthorized access, but they don’t scalebeyond a controlled environment and a limited number of partici-pants (e.g., n = 9 [43]) and are thus limited in their generalizability.We therefore chose to refrain from evaluating the performance ofCORMORANT in that way and refer to the extensive simulation-basedevaluation of the underlying concept of CORMORANT as reported in[22], which relies on real world experimental data gathered dur-ing the implementation of the individual biometrics in this paperand therefore as close to the implementation presented here aspossible. Since the problem of how to evaluate the overall systemgenerally applies to similar projects as well, one potential solutioncould be for the research community to converge on a commonsimulation model that could be applied to assess individual imple-mentations, similar to how standardized datasets allow to comparethe performance of different implementations of biometric systems.
6 CONCLUSION AND FUTUREWORKIn this paper we presented the lessons learned from designing andimplementing CORMORANT , an open source Android authenticationframework that facilitates to reduce the overhead of manual authen-tication by up to 97% [22] whilst improving security at the sametime. While challenging, we found no insurmountable obstacleswith regards to implementing various biometrics, risk estimationsor the framework itself. However, given the for security reasonsrestrictive Android API and runtime environment, we note thatsupport from the operating system vendor is generally necessaryfor CORMORANT and similar projects to be of practical applicability.We also found that evaluating such complex authentication systemsin form of user studies is infeasible as security can’t be adequatelymeasured and consider standardized large-scale simulations a vi-able alternative. Finally we invite interested researches to make useof our open source contributions presented in this paper.8
REFERENCES[1] Yusuf Albayram, et al. 2017. "...better to use a lock screen than to worry about
saving a few seconds of time": Effect of Fear Appeal in the Context of SmartphoneLocking Behavior. In SOUPS. 49–63.
[2] Sayedul Aman, et al. 2016. Reliability Evaluation of iBeacon for Micro- Localiza-tion. In Ubiquitous Computing, Electronics & Mobile Communication Conference(UEMCON). 1–5.
8https://github.com/mobilesec/cormorant
MoMM2019, 2-4 December 2019, Munich, Germany D.Hintze, M.Füller, S.Scholz, R.Findling, M.Muaaz, P.Kapfer, W.Nüßer, R.Mayrhofer
[3] Frédéric Bimbot, et al. 2004. A Tutorial on Text-independent Speaker Verification.EURASIP J. Appl. Signal Process. 2004 (Jan. 2004), 430–451.
[4] Jagmohan Chauhan, et al. 2018. Performance Characterization of Deep LearningModels for Breathing-based Authentication on Resource-Constrained Devices.Proc. ACM Interact. Mob. Wearable Ubiquitous Technol. 2, 4, Article 158 (Dec. 2018),24 pages.
[5] Richard Chow, Philippe J. P. Golle, and Jessica N. Staddon. 2012. Adjustingsecurity level of mobile device based on presence or absence of other mobiledevices nearby.
[6] Katriel Cohn-Gordon, et al. 2017. A Formal Security Analysis of the SignalMessaging Protocol. Proceedings - 2nd IEEE European Symposium on Security andPrivacy, EuroS and P 2017 November (2017), 451–466.
[7] Heather Crawford, Karen Renaud, and Tim Storer. 2013. A framework for con-tinuous, transparent mobile device authentication. Computers and Security 39,PART B (2013), 127–136.
[8] Ingrid Daubechies. 1993. Orthonormal bases of compactly supported waveletsII. Variations on a theme. SIAM Journal on Mathematical Analysis 24, 2 (1993),499–519.
[9] Mohammad Omar Derawi. 2012. Smartphones and Biometrics: Gait and ActivityRecognition. Ph.D. Dissertation. Gjøvik University College.
[10] Serge Egelman, et al. 2014. Are You Ready to Lock? Proceedings of the 2014 ACMSIGSAC Conference on Computer and Communications Security (2014), 750–761.
[11] Rainhard D. Findling. 2013. Pan Shot Face Unlock: Towards Unlocking PersonalMobile Devices using Stereo Vision and Biometric Face Information from multiplePerspectives. Master’s thesis. University of Applied Sciences Upper Austria,Hagenberg, Austria.
[12] Rainhard D. Findling, Michael Hölzl, and René Mayrhofer. 2018. Mobile Match-on-Card Authentication Using Offline-Simplified Models with Gait and FaceBiometrics. IEEE Transactions on Mobile Computing 17, 11 (Nov 2018), 2578–2590.
[13] Rainhard D. Findling and René Mayrhofer. 2013. Towards Pan Shot Face Unlock:Using Biometric Face Information from Different Perspectives to Unlock MobileDevices. International Journal of Pervasive Computing and Communications (2013),190–208.
[14] Dawud Gordon, John Tanios, and Oleksii Levkovskyi. 2019. Deep Learning forBehavior-Based, Invisible Multi-Factor Authentication. https://patents.justia.com/patent/20190044942
[15] Nazirah Abd Hamid, et al. 2011. Mouse movement behavioral biometric systems.In 2011 International Conference on User Science and Engineering (i-USEr). 206–211.
[16] Marian Harbach, et al. 2016. Keep on Lockin’ in the Free World: A Multi-NationalComparison of Smartphone Locking. Proceedings of the 2016 CHI Conference onHuman Factors in Computing Systems - CHI ’16 (2016), 4823–4827.
[17] Marian Harbach, et al. 2014. It’s a Hard Lock Life: A Field Study of Smartphone(Un) Locking Behavior and Risk Perception. Symposium on Usable Privacy andSecurity (SOUPS) (2014), 213–230.
[18] Avinatan Hassidim, et al. 2016. Ephemeral Identifiers : Mitigating Tracking &Spoofing Threats to BLE Beacons. (2016), 1–11.
[19] Eiji Hayashi, et al. 2013. CASA: context-aware scalable authentication. In Sym-posium on Usable Privacy and Security (SOUPS).
[20] Daniel Hintze. 2015. Towards transparent multi-device-authentication. In Ubi-Comp/ISWC’15 Adjunct. ACM, 435–440.
[21] Daniel Hintze, et al. 2015. CORMORANT: Towards Continuous Risk-AwareMulti-Modal Cross-Device Authentication. UbiComp 2015 Adjunct Publication(2015).
[22] Daniel Hintze, et al. 2019. CORMORANT: Ubiquitous Risk-Aware Multi-ModalBiometric Authentication Across Mobile Devices. Proceedings of the ACM onInteractive, Mobile, Wearable and Ubiquitous Technologies 3 (2019), to appear. Issue3.
[23] Daniel Hintze, et al. 2017. A Large-Scale, Long-Term Analysis of Mobile DeviceUsage Characteristics. Proceedings of the ACM on Interactive, Mobile, Wearableand Ubiquitous Technologies 1, 2 (2017), 1–21.
[24] Daniel Hintze, et al. 2015. Confidence and Risk Estimation Plugins for Multi-Modal Authentication on Mobile Devices using CORMORANT. In Proceedings ofMoMM 2015. 384–388.
[25] Daniel Hintze, et al. 2016. Location-based Risk Assessment for Mobile Authenti-cation. In Proceedings of the 2016 ACM International Joint Conference on Pervasiveand Ubiquitous Computing: Adjunct. http://dx.doi.org/10.1145/2968219.2971448
[26] Christopher G. Hocking, et al. 2011. Authentication Aura - A distributed approachto user authentication. Information Assurance and Security 6, 2 (2011).
[27] Adam Hurkala and Jaroslaw Hurkala. 2014. Architecture of Context-Risk-AwareAuthentication System for Web Environments. ICIEIS’2014 (2014), 219–228.
[28] Markus Jakobsson, et al. 2009. Implicit authentication for mobile devices. Hot-Sec’09 (2009).
[29] Philipp Kapfer. 2016. PhonyKeyboard: Sensor-enhanced Keystroke Dynamics Au-thentication on Mobile Devices. Master Thesis. Johannes Kepler University Linz.
[30] Hassan Khan, Aaron Atwater, and Urs Hengartner. 2014. Itus : An Implicit Authen-tication Framework for Android. In Proceedings of the 20th annual internationalconference on Mobile computing and networking (2014), 507–518.
[31] Dong Ju Kim, Kwang Woo Chung, and Kwang Seok Hong. 2010. Person Authen-tication using Face, Teeth and Voice Modalities for Mobile Device Security. IEEETransactions on Consumer Electronics 56, 4 (2010), 2678–2685.
[32] Jennifer R Kwapisz, Gary M Weiss, and Samuel A Moore. 2010. Cell phone-basedbiometric identification. In Biometrics: Theory Applications and Systems (BTAS),2010 Fourth IEEE International Conference on. IEEE, 1–7.
[33] Kuang-Chih Lee, J. Ho, and D. J. Kriegman. 2005. Acquiring linear subspaces forface recognition under variable lighting. IEEE Transactions on Pattern Analysisand Machine Intelligence 27, 5 (May 2005), 684–698.
[34] Rainer Lienhart and Jochen Maydt. 2002. An Extended Set of Haar-Like Featuresfor Rapid Object Detection. In IEEE International Conference on Image Processing2002. 900–903.
[35] Emanuele Maiorana, et al. 2011. Keystroke dynamics authentication for mobilephones. In Proceedings of the 2011 ACM Symposium on Applied Computing - SAC’11. ACM Press, New York, New York, USA, 21.
[36] René Mayrhofer, et al. 2019. The Android Platform Security Model. CoRRabs/1904.05572 (2019). arXiv:1904.05572 http://arxiv.org/abs/1904.05572
[37] Muhammad Muaaz and Rene Mayrhofer. 2014. Orientation Independent CellPhone Based Gait Authentication. Proceedings of MoMM 2014 (2014).
[38] M. Muaaz and R. Mayrhofer. 2017. Smartphone-Based Gait Recognition: FromAuthentication to Imitation. IEEE Transactions on Mobile Computing 16, 11 (Nov2017), 3209–3221.
[39] Claudia Nickel. 2012. Accelerometer-based Biometric Gait Recognition for Authen-tication on Smartphones. Ph.D. Dissertation. TU Darmstadt.
[40] Open Whisper Systems. 2018. Signal Specification. https://signal.org/docs/[41] OSGi Alliance. 2004. Listeners Considered Harmful: The Whiteboard Pattern.
(2004), 16 pages.[42] Douglas A. Reynolds, Thomas F. Quatieri, and Robert B. Dunn. 2000. Speaker
Verification Using Adapted Gaussian Mixture Models. Digital Signal Processing10, 1 (2000), 19 – 41.
[43] Oriana Riva, et al. 2011. Progressive Authentication: Deciding When to Authen-ticate on Mobile Phones. Proceedings of the 21st USENIX Security Symposium(2011), 1–16.
[44] Arun Ross and Anil K Jain. 2004. Multimodal Biometrics: an Overview. SignalProcessing September (2004), 1221–1224.
[45] Stefan Schneegass, et al. 2014. SmudgeSafe: Geometric Image Transformationsfor Smudge-resistant User Authentication. In Proceedings of the 2014 ACM Inter-national Joint Conference on Pervasive and Ubiquitous Computing (UbiComp ’14).ACM, New York, NY, USA, 775–786.
[46] S. Shekhar, et al. 2014. Joint Sparse Representation for Robust MultimodalBiometrics Recognition. IEEE Transactions on Pattern Analysis and MachineIntelligence 36, 1 (Jan 2014), 113–126.
[47] Signal Messenger. 2016. Facebook Messenger deploys Signal Protocol for end-to-end encryption. (2016). https://signal.org/blog/facebook-messenger
[48] Signal Messenger. 2016. Open Whisper Systems partners with Google on end-to-end encryption for Allo. (2016). https://signal.org/blog/allo/
[49] Signal Messenger. 2016. WhatsApp’s Signal Protocol integration is now complete.(2016). https://signal.org/blog/whatsapp-complete
[50] Hiew Moi Sim, et al. 2014. Multimodal biometrics: Weighted score level fusionbased on non-ideal iris and face images. Expert Systems with Applications 41, 11(2014), 5390–5404.
[51] Frank Stajano. 2011. Pico: No more passwords! Lecture Notes in Computer Science7114 LNCS (2011), 49–81.
[52] Jiayao Tan, et al. 2018. SilentKey: A New Authentication Framework throughUltrasonic-based Lip Reading. Proceedings of the ACM on Interactive, Mobile,Wearable and Ubiquitous Technologies 2 (2018), 1–18.
[53] P. Tresadern, et al. 2013. Mobile Biometrics: Combined Face and Voice Verificationfor a Mobile Platform. IEEE Pervasive Computing 12, 01 (2013), 79–87.
[54] Alex Varshavsky, et al. 2007. Amigo: Proximity-Based Authentication of MobileDevices. In UbiComp 2007: Ubiquitous Computing. Berlin, Heidelberg, 253–270.
[55] P. Viola and M. Jones. 2001. Rapid object detection using a boosted cascade ofsimple features. Proceedings of these 2001 IEEE Computer Society Conference onComputer Vision and Pattern Recognition 1 (2001), 511–518.
[56] Lei Wang, et al. 2018. Unlock with Your Heart: Heartbeat-based Authenticationon Commercial Mobile Phones. Proc. ACM Interact. Mob. Wearable UbiquitousTechnol. 2, 3, Article 140 (Sept. 2018), 22 pages.
[57] Emanuel Von Zezschwitz, Paul Dunphy, and Alexander De Luca. 2013. Patternsin the Wild: A field study of the usability of pattern and pin-based authenticationon Mobile Devices. Proceedings of the 15th International Conference on Human-Computer Interaction with Mobile Devices and Services (2013), 261–270.

Part III
A P P E N D I X

D A N I E L H I N T Z E
personal information
Lemgo, Germany, 30 April 1985Born
GermanNationality
experience
Apr 2018–Present Software Engineer, Google
Research and Machine IntelligenceGoogle
Jun-Aug 2017 Software Engineering Intern, Google
Chrome Security, working on CORS RFC1918.Google
Feb-Mar 2015 Visiting Researcher, University of Cambridge
Two-month visit at the University of Cambridge Computer Laboratorys DigitalUniversity of CambridgeTechnology Group under supervision of Andrew Rice, working on efficient,reproducible and selective sharing of large scientific datasets (PICKY).
2005-2018 Software Developer, Ecclesia Group
Working on various projects, including an Eclipse based DMS andEcclesia Groupcorrespondence creation system, handling 80 million documents.
2010-2018 Research Assistant, FHDW
Holding Computer Science lectures and working in research projects at theFHDWFHDW University of Applied Sciences.
education
2013—Present Johannes Kepler University Linz
Computer Science · Institute of Networks and SecurityDoctor of PhilosophyThesis: Continuous Risk-Aware Multi-Modal Authentication Across Mobile Devices
2010-2013 FHDW University of Applied Sciences
IT-Management and Information Systems · Graduation top of the classMaster of ScienceThesis: Approaches to Context-Based Security for Smart Mobile Devices
2008-2010 FHDW University of Applied Sciences
Business Informatics · Graduation top of the classBachelor of ScienceThesis: Optimizing Human Computer Interaction for Document-based Workflows
other information
2016 · Franz Wagner AwardAwards
2014 · MoMM 2014 Best Paper Award
2014 · UbiComp/ISWC 2014 Programming Competition Winner
2008 · Vocational Scholarship for the Highly Talented
German · MothertongueLanguages
English · Fluent
September 28, 2019