content June 15.indd - Reserve Bank of India
102
JUNE 2015 VOLUME LXIX NUMBER 6
-
Upload
khangminh22 -
Category
Documents
-
view
0 -
download
0
Transcript of content June 15.indd - Reserve Bank of India

JUNE 2015
VOLUME LXIX NUMBER 6

EDITORIAL COMMITTEEBrajamohan MisraB. K. BhoiGautam ChatterjeeAmitava Sardar
EDITOR Sanjay Kumar Hansda
The Reserve Bank of India Bulletin is issued monthly by the Department of Economic and Policy Research, Reserve Bank of India, under the direction of the Editorial Committee.The Central Board of the Bank is not responsible for interpretation and opinions expressed. In the case of signed articles, the responsibility is that of theauthor.
© Reserve Bank of India 2015
All rights reserved.Reproduction is permitted provided an acknowledgment of the source is made.
For subscription to Bulletin, please refer toSection ‘Recent Publications’
The Reserve Bank of India Bulletin can beaccessed at http://www.bulletin.rbi.org.in

CONTENTS
Monetary Policy Statement for 2015-16
Second Bi-monthly Monetary Policy Statement, 2015-16 1
Speech
Going Bust for GrowthRaghuram G. Rajan 7
Indian Banking Sector: Emerging Challenges and Way ForwardS. S. Mundra 19
Indian Payments System KaleidoscopeS. S. Mundra 27
Articles
Industrial Outlook Survey: 2014-15 33
Infl ation Expectations Survey of Households: 2014-15 43
Current Statistics 51
Recent Publications 88


MONETARY POLICY STATEMENT FOR 2015-16
Second Bi-monthly Monetary Policy Statement, 2015-16


1
MONETARY POLICY STATEMENT FOR 2015-16Second Bi-monthly Monetary Policy Statement, 2015-16
RBI Bulletin June 2015
data suggest that the global recovery is still slow and
getting increasingly differentiated across regions. In
the United States, the economy shrank in Q1 owing
to harsh weather conditions, the strength of the US
dollar weighing on exports and a decline in non-
residential fi xed investment. In the euro area, fi nancial
conditions have eased due to the European Central
Bank’s (ECB) quantitative easing and a depreciating
euro. There has, however, been some moderation in
composite purchasing managers’ indices (PMI),
economic sentiment and consumer confi dence in
April. In Japan, growth surprised on the upside in Q1,
supported by private demand as business spending
boosted inventories and personal consumption. For
most emerging market economies (EMEs) ,
macroeconomic conditions remain challenging due to
domestic fragilities, exacerbated by bouts of fi nancial
market turbulence. China continues to decelerate in
spite of monetary easing. The recent fi rming up of
crude prices has reduced headwinds to growth for
some energy exporters, while increasing them for
importers. Even absent a decisive economic recovery
or adverse geopolitical shocks, oil prices appear to be
volatile.
3. Global fi nancial markets have also been volatile,
with risk-on risk-off shifts induced by changing
perceptions of monetary policies in the advanced
economies. Global currency markets continue to be
dominated by the strength of the US dollar, with the
G3 currencies refl ecting the asynchronicity of their
monetary policy stances. Volatility in global bond
markets has increased with a number of factors at
play: unwinding of European assets by investors due
to the Greek crisis; rapidly changing expectations
around the Fed’s forward guidance; sharp movements
Monetary and Liquidity Measures
On the basis of an assessment of the current and
evolving macroeconomic situation, it has been decided
to:
reduce the policy repo rate under the liquidity
adjustment facility (LAF) by 25 basis points
from 7.5 per cent to 7.25 per cent with
immediate effect;
keep the cash reserve ratio (CRR) of scheduled
banks unchanged at 4.0 per cent of net
demand and time liabilities (NDTL);
continue to provide liquidity under overnight
repos at 0.25 per cent of bank-wise NDTL at
the LAF repo rate and liquidity under 14-day
term repos as well as longer term repos of up
to 0.75 per cent of NDTL of the banking
system through auctions; and
continue with overnight/term variable rate
repos and reverse repos to smooth liquidity.
Consequently, the reverse repo rate under the
LAF stands adjusted to 6.25 per cent, and the marginal
standing facility (MSF) rate and the Bank Rate to 8.25
per cent.
Assessment
2. Since the first bi-monthly monetary policy
statement of 2015-16 issued in April 2015, incoming
Second Bi-monthly Monetary Policy Statement, 2015-16 Dr. Raghuram G. Rajan, Governor*
* Released on June 2, 2015.

2
MONETARY POLICY STATEMENT FOR 2015-16 Second Bi-monthly Monetary Policy Statement, 2015-16
RBI Bulletin June 2015
in crude prices; and market corrections due to changes
in risk tolerance.
4. As anticipated, the Central Statistics Offi ce has
revised downwards its estimate of India’s gross value
added (GVA) at basic prices for 2014-15 by 30 basis
points from the advance estimates. Domestic
economic activity remains moderate in Q1 of 2015-16.
Agricultural activity was adversely affected by
unseasonal rains and hailstorms in north India during
March 2015, impinging on an estimated 94 lakh
hectares of area sown under the rabi crop. Refl ecting
this, the third advance estimates of the Ministry of
Agriculture indicate a contraction in foodgrains
production by more than 5 per cent in relation to the
preceding year’s level. Successive estimates have been
pointing to a worsening of the situation, with the
damage to crops like pulses and oilseeds – where
buffer foodstocks are not available in the central pool
– posing an upside risk to food inflation. For
the kharif season, the outlook is clouded by the fi rst
estimates of the India Meteorological Department
(IMD), predicting that the southwest monsoon will
be 7 per cent below the long period average. This has
been exacerbated by the confi rmation of the onset
of El Nino by the Australian Bureau of Meteorology.
5. What is clear is that contingency plans for food
management, including storage of adequate quantity
of seeds and fertilisers for timely supply, crop
insurance schemes, credit facilities, timely release of
food stocks and the repair of disruptions in food
supply chains, including through imports and de-
hoarding, need to be in place to manage the impact
of low production on infl ation. Infl ation control will
also be helped by limiting the increase in agricultural
support prices.
6. Industrial production has been recovering,
albeit unevenly. The sustained weakness of
consumption spending, especially in rural areas as
indicated in the slowdown in sales of two-wheelers
and tractors, continues to operate as a drag. Corporate
sales have contracted. The disappointing earnings
performance could have been worse if not for the
decline in input costs. Capacity utilisation has been
falling in several industries, indicative of the slack in
the economy. While an upturn in capital goods
production seems underway, clear evidence of a
revival in investment demand will need to build on
the tentative indications of unclogging of stalled
investment projects, stabilising of private new
investment intentions and improving sales of
commercial vehicles. In April, output from core
industries constituting 38 per cent of the index of
industrial production declined across the board,
barring coal production. The sustained revival of coal
output augurs well for electricity generation and
mining and quarrying, going forward. There is some
optimism on gas pricing and availability. The
resolution of power purchase processes has to be
expedited and power distribution companies’ fi nancial
stress has to be addressed on a priority basis. Some
public sector banks will need more capital to clean up
their balance sheets and support lending as investment
revives.
7. Leading indicators of services sector activity are
emitting mixed signals. A pick-up in service tax
collections, sales of trucks, railway freight, domestic

3
MONETARY POLICY STATEMENT FOR 2015-16Second Bi-monthly Monetary Policy Statement, 2015-16
RBI Bulletin June 2015
air passenger and air freight traffi c could augur well
for transport and communication and trade. On the
other hand, the slowdown in tourist arrivals, railway
traffi c and international air passenger and freight
traffic could affect hotels, restaurants and some
constituents of transportation services adversely. The
services PMI declined in April 2015, mainly on account
of slowdown in new business orders. Community and
personal services are likely to be held back by the
ongoing fi scal consolidation.
8. In April, retail inflation measured by the
consumer price index (CPI) decelerated for the second
month in a row, supported by favourable base effects
[of about (-) 0.8 per cent] that moderated the rise in
the price index for the fourth successive month. Food
infl ation softened to a contra-seasonal four-month
low, with the impact of unseasonal rains yet to show
up. Vegetables infl ation continued to ease, along with
that of other sub-groups such as cereals, oil, sugar and
spices. On the other hand, protein items, especially
milk and pulses, continued to impart upward
infl ationary pressures.
9. Fuel inflation rose for the fourth successive
month to a twelve-month high, driven by prices of
electricity and fi rewood. Infl ation in these components
was accentuated by base effects – the recent price
uptick coming on top of muted increases a year ago.
Infl ation excluding food and fuel rose marginally.
House rent, education, medical and transport
expenses were among the major drivers of infl ation
in this category. Rural wage growth, although still
moderate, picked up. Infl ation expectations remain
in high single digits, although they may adapt further
to current low infl ation. Yet, both input and output
price pressures remain muted as refl ected in the
Reserve Bank’s industrial outlook survey. Purchasing
managers’ indices also corroborate these developments.
10. Liquidity conditions eased in April 2015 after the
tightness in the second half of March 2015 on account
of advance tax outflows and financial year-end
behaviour of banks. The Reserve Bank’s liquidity
management operations were reversed in view of the
improvement in liquidity conditions through April.
During May, however, rapid increases in currency in
circulation and a build-up of government balances
resulted in liquidity conditions tightening again.
Accordingly, fi ne tuning operations of varying tenors
were conducted, besides the regular overnight repo
at fi xed rate and 14-day variable rate repo auctions.
These injections helped meet the frictional liquidity
requirements. In May, the average daily net liquidity
injected through LAF fi xed rate repos, besides regular
14-day variable rate repos, additional variable rate
repos and MSF, was `1031 billion as compared with
`819 billion in April. As a result, weighted average
money market rates shadowed the policy rate. Longer
term interest rates, particularly gilts, hardened in early
May on international cues but eased in the second
half of the month, particularly after the issuance of
the new benchmark bond.
11. Merchandise export growth has weakened
steadily since July 2014 and entered into contraction
from January 2015 through April, with a recent
shrinking of even volumes exported. The deterioration
in export performance affected economies across Asia
as global demand fell and the fall in commodity prices

4
MONETARY POLICY STATEMENT FOR 2015-16 Second Bi-monthly Monetary Policy Statement, 2015-16
RBI Bulletin June 2015
impacted terms of trade for commodity exporters.
From December 2014 onwards, merchandise import
growth also turned negative, led by a sharp decline in
the volume of oil imports as inventory build-up by
refi neries subsided. Gold imports spiked in the month
of March and remained elevated in April owing to
festival demand and regulatory relaxations. Notably,
the volume of imports has been recording increases,
despite the value decline. Given these developments,
the reduction in the current account defi cit resulting
from the sharp decline in oil prices has begun to
reverse, though the size of the defi cit is expected to
be contained to about 1.5 per cent of GDP this year.
Net exports are, therefore, unlikely to contribute as
much to growth going forward as they did in the past
fi nancial year. Consequently growth will depend more
on a strengthening of domestic fi nal demand. While
portfolio and direct foreign investment fl ows were
buoyant during 2014-15, with net foreign direct
investment to India at US$ 36.6 billion and net
portfolio infl ows at US$ 41 billion, the year 2015-16
has begun with net portfolio outfl ows in the wake of
a reduction in global portfolio allocations to India.
Foreign exchange reserves are around US$ 350 billion,
providing a strong second line of defence to good
macroeconomic policies if external markets turn
signifi cantly volatile.
Policy Stance and Rationale
12. Banks have started passing through some of the
past rate cuts into their lending rates, headline
infl ation has evolved along the projected path, the
impact of unseasonal rains has been moderate so far,
administered price increases remain muted, and the
timing of normalisation of US monetary policy seems
to have been pushed back. With low domestic capacity
utilization, still mixed indicators of recovery, and
subdued investment and credit growth, there is a case
for a cut in the policy rate today.
13. Yet, of the risks to infl ation identifi ed in April,
three still cloud the picture. First, some forecasters,
notably the IMD, predict a below-normal southwest
monsoon. Astute food management is needed to
mitigate possible infl ationary effects. Second, crude
prices have been firming amidst considerable
volatility, and geo-political risks are ever present.
Third, volatility in the external environment could
impact infl ation. Therefore, a conservative strategy
would be to wait, especially for more certainty on both
the monsoon outturn as well as the effects of
government responses if it turns out to be weak. With
still weak investment and the need to reduce supply
constraints over the medium term to stay on the
proposed disinfl ationary path (to 4 per cent in early
2018), however, a more appropriate stance is to front-
load a rate cut today and then wait for data that clarify
uncertainty. Meanwhile banks should pass through
the sequence of rate cuts into lending rates.
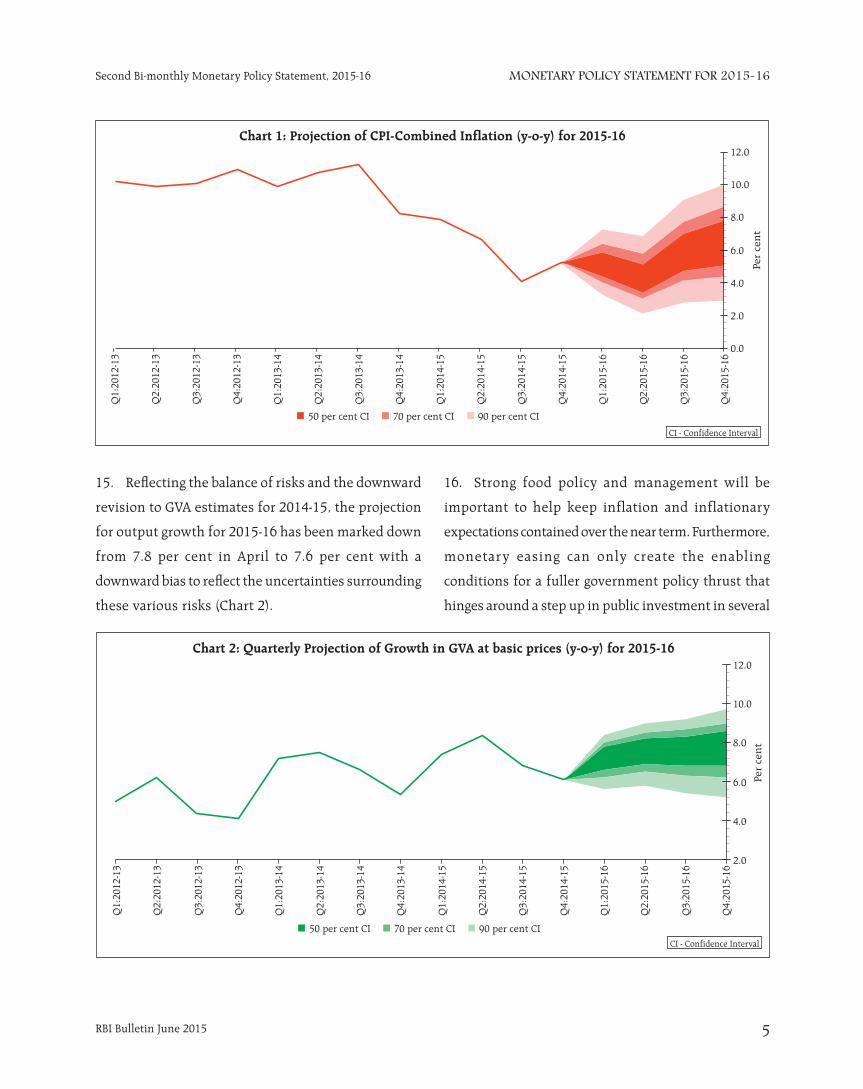
14. Assuming reasonable food management, infl ation
is expected to be pulled down by base effects till
August but to start rising thereafter to about 6.0 per
cent by January 2016 – slightly higher than the
projections in April. Putting more weight on the IMD’s
monsoon projections than the more optimistic
projections of private forecasters as well as accounting
for the possible infl ationary effects of the increases
in the service tax rate to 14 per cent, the risks to the
central trajectory are tilted to the upside (Chart 1).
5
MONETARY POLICY STATEMENT FOR 2015-16Second Bi-monthly Monetary Policy Statement, 2015-16
RBI Bulletin June 2015
15. Refl ecting the balance of risks and the downward
revision to GVA estimates for 2014-15, the projection
for output growth for 2015-16 has been marked down
from 7.8 per cent in April to 7.6 per cent with a
downward bias to refl ect the uncertainties surrounding
these various risks (Chart 2 ).
16. Strong food policy and management will be
important to help keep inflation and inflationary
expectations contained over the near term. Furthermore,
monetary easing can only create the enabling
conditions for a fuller government policy thrust that
hinges around a step up in public investment in several

6
MONETARY POLICY STATEMENT FOR 2015-16 Second Bi-monthly Monetary Policy Statement, 2015-16
RBI Bulletin June 2015
areas that can also crowd in private investment. This
will be important to relieve supply constraints and aid
disinfl ation over the medium term. A targeted infusion
of bank capital into scheduled public sector commercial
banks, especially those that implement concerted
strategies to clean up stressed assets, is also warranted
so that adequate credit fl ows to the productive sectors
as investment picks up.
17. The third bi-monthly monetary policy statement
will be announced on August 4, 2015.

SPEECH
Going Bust for GrowthRaghuram G. Rajan
Indian Banking Sector: Emerging Challenges and Way ForwardS. S. Mundra
Indian Payments System KaleidoscopeS. S. Mundra


SPEECH
RBI Bulletin June 2015 7
Going Bust for Growth
How does one offset weak household and
government demand if debt write-downs are off the
table? Ideally, the response would be to incentivize
investment and job creation through low interest rates
and tax incentives. But if fi nal demand from consumers
is likely to be very weak for a considerable period of
time because of debt overhang, the real return on new
investment may collapse. The Wicksellian neutral real
rate – loosely speaking the interest rate required to
bring the economy back to full employment with stable
infl ation – may even be strongly negative.2 This typically
has been taken as grounds for aggressive monetary
policy. Because policy rates cannot be reduced
signifi cantly below zero (though a number of European
countries are testing these limits), equilibrium long
term interest rates may stay higher than levels
necessary to incentivize investment. Hence, central
banks have embarked on unconventional monetary
policy (UMP), which would directly lower long rates.
Another way to stimulate demand is for
governments that still have the ability to borrow to
increase spending. Since this will increase already-high
levels of government debt, proponents suggest
investing in infrastructure, which may have high
returns today when construction costs and interest
rates are low. However, high-return infrastructure
investment is harder to identify and implement in
developed countries where most obvious investments
have already been made – political infl uence is as likely
to create bridges to nowhere or unviable high speed
train networks as needed infrastructure. Also, while
everyone can see the need for repair and renovation of
existing infrastructure, this requires far more
There are few areas of robust growth around the
world, with the IMF repeatedly reducing its growth
forecasts in recent quarters. This period of slow growth
is particularly dangerous because both industrial
countries and emerging markets need high growth to
quell rising domestic political tensions. Policies that
attempt to divert growth from others rather than create
new growth are more likely under these circumstances.
Even as we create conditions for sustainable growth,
we need new rules of the game, enforced impartially
by multilateral organisations, to ensure countries
adhere to international responsibilities.
The conventional diagnosis and remedy
Why is the world fi nding it so hard to restore pre-
Great Recession growth rates? The obvious answer is
that the fi nancial boom preceding the Great Recession
left industrial countries with an overhang of debt, and
debt, whether on governments, households, or banks,
is holding back growth.1 While the remedy may be to
write down debt so as to revive demand from the
indebted, it is debatable whether additional debt
fuelled demand is sustainable in the long run. At any
rate, large-scale debt write-offs (or fi scal transfers to the
heavily indebted) seem politically diffi cult even if they
are economically warranted.
* Rem arks by Dr. Raghuram G. Rajan, Governor of the Reserve Bank of India on May 19, 2015 to the Economic Club of New York. Dr. Rajan thanks Dr. Prachi Mishra of the Reserve Bank for very useful comments and research support.
1 See the interesting evidence in Atif Mian and Amir Sufi , House of Debt (Princeton University Press, New Jersey, 2014) and the cross-country evidence in Carmen Reinhart and Kenneth Rogoff, This Time is Different (Princeton University Press, New Jersey, 2008). For an illuminating overall view of the global fi nancial crisis and the policy remedies, see Martin Wolf, The Shifts and the Shocks: What We’ve Learned and Have Still to Learn from the Financial Crisis (Penguin USA 2015).
2 Tho ugh see a thoughtful piece by Claudio Borio and Piti Disyatat at http://www.voxeu.org/article/low-interest-rates-secular-stagnation-and-debt suggesting that the real neutral interest rate may be infl uenced by low policy rates. Intuitively, the authors argue that low policy rates can sow the seeds for investment misallocation, fi nancial distress, and debt overhang, all of which can combine to drive down the future real return on investment, and therefore the real neutral long term rate today.
Going Bust for Growth*Raghuram G. Rajan

SPEECH
RBI Bulletin June 20158
Going Bust for Growth
decentralised spending than mega projects, and may
be harder to initiate and fi nance from the centre.
Put differently, high-return infrastructure
investment is a good idea but may be hard to implement
on a large scale for most advanced country governments.
To the extent that such debt fuelled spending creates
a self-fulfi lling virtuous cycle of confi dence and activity,
it can be a bridge to sustainable growth. But to the
extent that it misallocates capital (because there are
insuffi cient ‘shovel-ready’ projects, so much of the
emergency spending is diverted to rent-seeking pork),
it can worsen public anxieties about the future,
reducing corporate investment and increasing
household savings.
All this highlights another concern. Even if
stimulus works in raising growth temporarily – and the
above discussion suggests it may not – this growth has
to be a bridge to sustained aggregate demand. But what
if it isn’t?
The Productivity Puzzle, Secular Stagnation, and other concerns.
The arguments I have just enunciated for action
apply to an economy where nothing fundamentally is
wrong except perhaps excessive debt – what is needed
is a cyclical return of growth to potential growth. Yet a
number of economists such as Tyler Cowen, Robert
Gordon, and Larry Summers have raised the possibility
that potential growth in industrial countries had fallen
even before the Great Recession. Perhaps then the
growth that we are trying to return to is unachievable
without serious distortions.
The term ‘secular stagnation’ used by Larry
Summers to describe the current persistent economic
malaise, echoing Alvin Hansen’s speech in 1938 in the
midst of the Great Depression, has caught on.3 But
different economists focus on different aspects and
causes of the stagnation.4 Summers emphasises the
inadequacy of aggregate demand, and the fact that the
zero lower bound as well as the potential for fi nancial
instability prevents monetary policy from being more
active. Among the reasons for weak aggregate demand
include ageing populations that want to consume less
and the increasing income share of the very rich, whose
marginal propensity to consume is small.
Tyler Cowen and Robert Gordon on the other hand,
emphasise a weak supply potential.5 They argue that
the post-World War II years were an aberration because
growth was helped in industrial countries by
reconstruction, the spread of technologies such as
electricity, telephones, and automobiles, rising
educational attainment, higher labour participation
rates as women entered the work force, a restoration
of global trade, and increasing investments of capital.
However, post-war total factor productivity growth – the
part of growth stemming from new ideas and methods
of production – was lower than its 1920-50 high. More
recently, not only has productivity growth fallen further
(with a temporary positive uptick towards the end of
the 1990s because of the IT revolution), but growth has
been held back by the headwinds of plateauing
education levels and labour participation rates, as well
as a shrinking labour force in some countries because
of population ageing.
It is obvious from these lists of factors that it is
hard to disentangle the effects of weak aggregate
demand from slow growth in potential supply.
Population ageing contributes to both. Indeed, one may
cause the other. For example, anticipating a slowdown
4 See , for example, ‘The Crises of Democratic Capitalism’, Wolfgang Streeck, New Left Review 71, Sept/Oct 2011 or ‘The True Lessons of the Recession: The West Can’t Borrow and Spend its Way to Recovery’, Raghuram Rajan, Foreign Affairs, Volume 91, no 3, May/June 2012 .
5 Tyl er Cowen (2013), The Great Stagnation, Ebook, Gordon, R. (2012), ‘Is US Economic Growth Over? Faltering Innovation Confronts Six Headwinds’, NBER Working Paper 18315.
3 Sum mers, L. (2014), ‘U.S. Economic Prospects: Secular Stagnation, Hysterisis and Zero Lower Bound’, speech delivered to the National Association for Business Economics, Economic Policy Conference, February 24, 2014.

SPEECH
RBI Bulletin June 2015 9
Going Bust for Growth
in growth potential, households, worried about
impending retirement in the face of undeliverable
pension and healthcare entitlements, may try and build
savings. This will depress demand further. Conversely,
anticipated weak demand may reduce incentives for
corporations to invest in physical and human capital,
causing supply potential to grow more slowly.
Structural reforms, typically ones that increase
competition, foster innovation, and drive institutional
change, are the way to raise potential growth. But these
immediately hurt protected constituencies that have
become accustomed to the rents they get from the
status quo. Moreover, the gains to constituencies that
are benefi ted are typically later and uncertain while the
pain is immediate and its incidence clear. No wonder
Jean-Claude Juncker, then Luxembourg’s prime
minister, said at the height of the Euro crisis, ‘We all
know what to do, we just don›t know how to get re-
elected after we›ve done it!’
The Growth Imperative
If indeed fundamentals are such that the industrial
world has, and will, grow slowly for a while before new
technologies and new markets come to the rescue,
would it be politically easy to settle for slower growth?
After all, per capita income is high in industrial
countries, and a few years of slow growth would not
be devastating at the aggregate level. Why is there so
much of a political need for growth?
One reason is the need to fulfil government
commitments. As sociologist Wolfgang Streeck writes,
in the strong growth years of the 1960s when visions
of a ‘Great Society’ seemed attainable, industrial
economies made enormous promises of social security
to the wider public.6 Promises have been augmented
since then in some countries by politically convenient
(because hidden from budgets) but fi scally unsound
increases in pension and old age healthcare
commitments to public sector workers. And most
recently, the government debt taken on before and after
the Great Recession has added to government
commitments, even while the Baby Boomer generation
has started retiring in large numbers. Without the
immediate promise of growth, all these commitments
could soon be seen as unsustainable.
Another reason to desire growth is that economies
tend to favour insiders – those who have jobs for
example. The brunt of the joblessness caused by slow
growth is born by new entrants to the labour market.
Not only are they unemployed in larger numbers, but
the lifetime earnings of cohorts that enter the labour
force in diffi cult times is lower. Growth is necessary
for inter-generational equity, especially because these
are the generations that will be working to pay off
commitments to older generations. Given these are also
the cohorts that can take to the streets, growth is
essential for social harmony.
Not only are the benefi ts of growth unequally
distributed across generations, they are also very
unequally distributed within generation. Because of
changes in technology and the expansion of global
competition, routine repetitive jobs, whether done by
the skilled or the unskilled, have diminished greatly in
industrial countries. Many of these jobs, ranging from
assembly line worker to legal aides or insurance clerks,
have either been automated or outsourced. The
desirable high-paying jobs are non-routine skilled ones
such as that of a consultant or an app designer, but they
require skills. The middle class recognises that they
need quality higher education and training to not slip
into competing with the poor for low-skilled non-
routine jobs such as security guard or gardener. But the
poor quality early education they have received, as well
as the prohibitive cost of quality higher education, puts
many better livelihoods out of reach. With every
percentage point of growth creating fewer ‘good’ jobs 6 See ‘The Crises of Democratic Capitalism’, Wolfgang Streeck, New Left Review 71, Sept/Oct 2011.

SPEECH
RBI Bulletin June 201510
Going Bust for Growth
for the unskilled or moderately skilled, more growth
is needed to keep them happily employed. Equally, the
rapid deterioration in skills for the unemployed is an
additional reason to push for growth.
The Defl ation Fear
Finally, a big factor persuading authorities in
industrial countries to push for higher growth is the
fear of defl ation. The canonical example here is Japan,
where many are persuaded that the key mistake it made
was to slip into defl ation, which has persisted and held
back growth.
A closer look at the Japanese experience suggests
that it is by no means clear that its growth has been
slower than warranted let alone that defl ation caused
slow growth. It is true that after its devastating crisis
in the early 1990s, Japan may have prolonged the
slowdown by not taking early action to clean up its
banking system or restructure over-indebted
corporations. But once it took decisive action in the late
1990s and early 2000s, Japanese growth per capita or
per worker looks comparable with other industrial
countries (Table 1).7 Slow aggregate Japanese economic
growth may simply be because its population is
shrinking, and fewer people are entering the labour
force rather than because it is underperforming other
developed economies.
What about the deleterious effects of defl ation? One worrisome effect of defl ation is that if wages are downwardly-sticky, real wages rise and cause unemployment. Yet Japanese unemployment has averaged 4.5 per cent between 2000-2014, compared to 6.4 per cent in the US and 9.4 per cent in the Euro area during the same period.8 In part, the Japanese have obtained wage fl exibility by moving away from the old lifetime unemployment contracts for new hires to short term contracts. Indeed, with the decline in union power across industrial countries and the increase in temporary or even ‘zero hour’ workers, downward wage fl exibility may be signifi cantly higher than previously estimated. While not without social costs, such fl exibility allows an economy to cope with sustained defl ation.
Another concern has been that moderately low infl ation spirals down into seriously large defl ation, where the zero lower bound on nominal interest rates keeps real interest rates unconscionably high. Once again, it is not clear this happened in Japan. In the years 1999 to 2012, average CPI defl ation ranged between -0.01 per cent in 2004 to -1.3 per cent in 2009, but without any clear spiralling pattern (Figure 1).
7 I f irst learnt of these facts from Jean Claude Trichet. For a more comprehensive look at defl ation, see Claudio Borio, Magdalena Erdem, Andrew Filardo and Boris Hofmann, ‘The costs of defl ations: a historical perspective’, BIS Quarterly Review March 2015. 8 Sou rce. World Economic Outlook Database, IMF.
Table 1. Growth in Real GDP Per Capita: Advanced Economies: 1996-2014
Japan United States Euro area
1996-2000 0.63 3.10 2.41
2001-2005 1.05 1.56 0.99
2006-2010 0.35 -0.12 0.41
2011-2014 0.91 1.38 0.13
Source: World Economic Outlook Database, IMF.

SPEECH
RBI Bulletin June 2015 11
Going Bust for Growth
Even if deflation is moderate, it may cause
customers to postpone purchases and increase savings
in anticipation of a lower price in the future, especially
if the zero lower bound raises real interest rates above
their desired value. In Fig 2, we plot household savings
as a share of GDP in Japan against the defl ation rate.
Again, it is hard to see a sustained pattern of higher
savings with higher defl ation.
F inally, it is true that defl ation increases the real
burden of existing debt, thus exacerbating debt
overhang. But this is true of any unanticipated
disinfl ation, and is not specifi c to defl ation. If debt is
excessive, a targeted restructuring is better than
infl ating it away across the board.
Regardless of all these arguments, the spectre of
defl ation haunts central bankers. When coupled with
the other political concerns raised by slow and unequal
growth listed above, it is no wonder that the authorities
in developed countries do not want to settle for low
growth, even if that is indeed their economy’s potential.
So the central dilemma in industrial economies
has been how to reconcile the political imperative for
strong growth with the reality that cyclical stimulus
measures have proved ineffective in restoring high
growth, debt write-offs are politically unacceptable, and
structural reforms have the wrong timing, politically
speaking, of pain versus gain. There is, however, one
other channel for growth – exports.
Emerging Market Response
If industrial countries are stuck in low growth, can
emerging markets (I use the term broadly to also stand
for developing or frontier markets) take up the global
slack in demand? After all, emerging markets have a
clear need for infrastructure investment, as well as
growing populations that can be a source of final
demand. Why cannot industrial countries export to
emerging markets as a way to bolster growth? After all,
they have done so in the past.
Emerging markets have no less of an imperative
for growth than industrial countries. While many do
not have past entitlement promises to deliver on, some
have ageing populations that have to be provided for,
and many have young, poor, populations with sky-high
expectations of growth. Ideally, emerging markets
would invest for the future, funded by the rich world,
thus bolstering aggregate world demand.
The 1990s were indeed a period when emerging
markets borrowed from the rest of the world in
attempting to fi nance infrastructure and development.
It did not end well, with credit booms, large unviable
prestige projects, and eventual busts. The Mexican
Crisis of 1994, the Asian Crisis of 1997-98, and the
Argentinian Crisis of 2001 highlighted the inability of
emerging markets to manage large increases in domestic
investment funded by foreign capital infl ows. The
lesson from the 1990s crises was that emerging market
reliance on foreign capital for growth was dangerous.
With investment prudently limited to domestic savings,
this naturally curtailed their ability to serve as growth
engines for the world.
Fo llowing the 1990s crises, as the dotted line
in Figure 3 indicates, a number of emerging markets

SPEECH
RBI Bulletin June 201512
Going Bust for Growth
went further to run current account surpluses after
cutting investment sharply, and started accumulating
foreign exchange reserves to preserve exchange
competitiveness. Rather than generating excess
demand for the world’s goods, they became suppliers
(or equivalently, savers), searching for demand
elsewhere. And the debt-fuelled demand from the
industrial countries before the Global Financial Crisis,
as indicated by their current account defi cits, spilled
over into a demand for emerging market goods. The
years before the crisis were years of plenty for countries
like China that catered directly to industrial country
demand, and countries in Africa, Asia, and Latin
America that sold commodities and intermediate goods
to the direct suppliers.
In 2005, Ben Bernanke, then a governor at the
Federal Reserve, coined the term ‘Global Savings Glut’
to describe the current account surpluses, especially of
emerging markets, that were fi nding their way into the
United States.9 He argued that these depressed US
interest rates, enhancing consumption, and the US
current account defi cit. Bernanke pointed to a number
of adverse consequences to the United States from
these fl ows including the misallocation of resources to
non-traded goods like housing away from tradable
manufacturing. He suggested that it would be good if
United States’ current account defi cit shrank, but that
primarily required emerging markets to reduce their
exchange rate intervention rather than actions on the
part of the United States.
So pre-global fi nancial crisis, emerging markets
and industrial countries were locked in a dangerous
relationship of capital fl ows and demand that reversed
the equally dangerous pattern before the emerging
market crises in the late 1990s. Sustained exchange rate
intervention by emerging market central banks, as well
as an excessive tolerance for leverage in industrial
countries contributed to the eventual global disaster.
But post-fi nancial crisis, the pattern is reversing once
again.
Post global fi nancial crisis, much like the emerging
markets in the early 2000s, industrial countries have
curtailed their investment without increasing their
consumption (as a fraction of GDP), thus reducing their
demand for foreign goods and their reliance on foreign
fi nance. Indeed, as the solid line in Figure 3 indicates,
advanced economies ran current account surpluses in
2013 and were also projected to do so in 2014, a shift
in current account balances of about 1.5 percentage
points of GDP since 2008.
The counterpart of this shift of advanced
economies from current account deficit (demand
creating) to surplus (supply creating) has been a
substantial fall in current account surpluses in emerging
markets over the same period. This relative increase in
demand for foreign goods from emerging markets has
come about through a ramp up in investment from
2008, rather than a fall in savings – a shift of 2.7
9 ‘T he Global Saving Glut and the U.S. Current Account Defi cit’, remarks by Governor Bernanke at the Sandridge Lecture, Virginia Association of Economists, Richmond, Virginia on March 10, 2005,http://www.federalreserve.gov/boarddocs/speeches/2005/200503102/

SPEECH
RBI Bulletin June 2015 13
Going Bust for Growth
percentage points of GDP in current account balances
between 2008 and 2014. Facilitating or causing this shift
has been a broad appreciation of real effective exchange
rates in emerging markets and a depreciation in
industrial country rates between 2006-2014.
Have industrial country central banks policies,
similar to the sustained exchange rate intervention by
emerging market central banks in the early 2000s,
accelerated this current account adjustment? Possibly,
and likely candidates would be what are broadly called
unconventional monetary policies (UMP).
Unconventional Monetary Policy
Unconventional monetary policies include both
policies where the central bank attempts to commit to
hold interest rates at near zero for long, as well as
policies that affect central bank balance sheets such as
buying assets in certain markets, including exchange
markets, in order to affect market prices.10
There clearly is a role for unconventional policies
– when markets are broken or grossly dysfunctional,
central bankers may step in with their balance sheets
to mend markets. The key question is what happens
when these policies are prolonged long beyond
repairing markets to actually distorting them. The
benefi t to cost ratio there is less clear.
Take, for instance, the zero-lower-bound problem.
Because short term policy rates cannot be pushed much
below zero, and because long rates tack on a risk
premium to short rates, central banks may use UMP to
directly affect long rates. Direct action by a risk tolerant
central bank, such as purchasing long bonds, effectively
shrinks the risk premium available on remaining long
assets.11
This has two effects. First, those who can rebalance
between short and long assets now prefer holding short
term assets because, risk adjusted, these are a better
deal. Thus as the central bank increases bond purchases
under quantitative easing, the willingness of commercial
10 Fo r an excellent overview, see Claudio Borio and P. Disyatat, ‘Unconventional monetary policies: An appraisal’, The Manchester School; Vol. 78, Issue s1, pp. 53-89, September 2010
11 Fo r instance, because the most risk averse holders of existing long bonds sell fi rst and move to holding short term assets.

SPEECH
RBI Bulletin June 201514
Going Bust for Growth
banks to hold unremunerated reserves rather than long
term assets increases. Second, those institutions that
cannot shift to short term assets, such as pension funds,
bond mutual funds, and insurance companies, will
either continue holding their assets and suffer a relative
under-compensation for risk, or turn to riskier assets.
This behaviour, also termed the “search for yield”, will
occur if the relative under-compensation for risk in
more exotic assets is lower, or simply because
institutions have to meet a fi xed nominal rate of return
constraint on their portfolios. Of course, such portfolio
rebalancing will also take place because the central bank
buys long duration bonds out of institutional portfolios,
leaving them cash to redeploy.
None of this need be a problem if everyone knows
when to stop. Unfortunately, there are few constraints
on central banks undertaking these policies since they
are self-fi nancing (commercial banks become more
willing to hold central bank reserves as the risk
premium on long bonds shrinks). If the policy does not
seem to be increasing growth, one can simply do more.
All the while, the distortion in asset prices and the
mis-allocation of funds can increase, which can be very
costly when the central bank decides to exit.
Equally important though, is that domestic fund
managers can search for yield abroad, depreciating the
sending country’s currency and causing the receiving
country’s currency to appreciate, perhaps signifi cantly
more so than ordinary monetary policy. This may
indeed cause the increase in domestic competitiveness
that could energize the sending country’s exports. But
such increases in competitiveness and ‘demand
shifting’ can be very detrimental for global stability,
especially if unaccompanied by domestic demand
creation.
Spill Overs to Emerging Markets and Musical Crises
If UMP enhances financial risk taking in the
originating country without enhancing domestic
investment or consumption, the exchange rate impact
of UMP may simply shift demand away from countries
not engaging in UMP, without creating much
compensating domestic demand for their goods. If so,
UMP would resemble very much the exchange rate
intervention policies of the emerging markets pre-
global fi nancial crisis.
Indeed, the post-global crisis capital fl ows into
emerging markets have been huge, despite the best
efforts of emerging markets to push them back by
accumulating reserves (net capital fl ows to emerging
economies reached US$ 550 bn in 2013 compared to
US$120 bn in 2006).12 13 These fl ows have increased
local leverage, not just due to the direct effect of cross-
border banking fl ows but also the indirect effect, as the
appreciating exchange rate and rising asset prices,
especially of real estate, make it seem that emerging
market borrowers have more equity than they really
have. Bernanke’s concerns in 2005 about mal-
investment in the United States resulting from capital
inflows from emerging markets have surfaced in
emerging markets post-crisis as a result of capital
infl ows from industrial countries.
Have crises in emerging markets in the 1990s been
transformed into crises in industrial countries in the
2000s and once again into vulnerabilities in emerging
markets in the 2010s, as countries react to the problem
of inadequate global demand by exporting their
problems to other countries? The ‘taper tantrum’ in
July 2013 certainly seemed to suggest that emerging
markets that ran large current account defi cits were
12 Ba sed on the World Economic Outlook database. Emerging economies
include ‘emerging and developing’ countries. Net capital fl ows include
net direct investment, net protfolio investment, and ‘other’ net
investment.
13 In deed, similar to the behavior of commercial banks, the willingness
of emerging market central banks to hold short term paper in response
to capital infl ows enhances the ability of the industrial country central
bank to engage in further UMP. In a sense, emerging market central banks
provide liquidity for foreign investors by holding precautionary reserves.

SPEECH
RBI Bulletin June 2015 15
Going Bust for Growth
vulnerable once again.14 Is the world engaged in a
macabre game of musical crises as each country
attempts to boost growth? If possibly yes, as suggested
by the previous discussion, how do we break this cycle?
Good Policies…and Good Behaviour
In an ideal world, the political imperative for
growth would not outstrip the economy’s potential.
Given that we do not live in such a world, and given
that social security commitments, over-indebtedness,
and poverty are not going to disappear, it is probably
wiser to look for ways to enhance sustainable growth.
Clearly, the long run response to weak global
growth should be policies that promote innovation as
well as structural reforms that enhance effi ciency.
Given that growth within countries is poorly distributed,
policies that improve the domestic distribution of
capabilities and opportunities without signifi cantly
dampening incentives for innovation and effi ciency are
also needed.
In the short run though, the need for sensible
investment is paramount. In industrial countries, green
energy initiatives such as carbon taxes or emission
limits, while giving industry clear signals on where to
invest, also have the ability to move the needle on
aggregate investment and help long run goals on
environment protection.
Most emerging markets have large infrastructure
investment needs. We still need to understand how to
improve project selection and fi nance – too much public
sector involvement results in sloth and rent seeking,
too much private sector involvement leads to risk
intolerance and profiteering. Going forward, well-designed public private partnerships, drawing on successful experiences elsewhere, should complement private initiative.
The Australian Presidency of the G 20 created a welcome mechanism to share best investment practices across countries. At the same time, we must recognise that large scale investment projects need patient risk capital, which is in short supply in emerging markets. Private investors rarely have the risk tolerance that governments or multilateral institutions have. So, in addition to knowledge sharing, global growth would benefi t from an augmentation of the capital base of multilateral institutions like the World Bank, the African Development Bank, and the Asian Development Bank, so that they can provide part of the patient risk tolerant capital the emerging world needs. Despite competing domestic demands, industrial countries should recognise the important catalytic role that the development banks can play and help bolster their capital. At the very least, they should not stand in the way of others augmenting capital and taking more ownership.
Clearly, sensible investment has a much better chance of paying dividends when macroeconomic policies are sound. And such policies are easier when the adverse spill overs from cross-border capital fl ows are limited. This may require new rules of the game for policy making.
New Rules of the Game?
How do we focus on domestic demand creation and avoid this game of musical crises with countries trying to depreciate their exchange rate through sustained direct exchange rate intervention or through unconventional monetary policies (where demand creating transmission channels are blocked)?15 It might
14 Fo r those who advocate allowing exchange rate adjustment as central to macro-management, it should be sobering that countries that allowed the real exchange rate to appreciate the most during the prior period of quantitative easing suffered the greatest adverse impact to fi nancial conditions (see Eichengreen, Barry and Poonam Gupta (2013), ‘Tapering Talk: The Impact of Expectations of Reduced Federal Reserve Security Purchases on Emerging Markets’, Working Paper, University of California, Berkeley and Mishra, Prachi, Kenji Moriyama, Papa N’Diaye and Lam Nguyen (2014), ‘The Impact of Fed Tapering Announcements on Emerging Markets’, IMF working paper).
15 Se e also a very thoughtful piece by Fabrizio Saccomanni, ‘Monetary spillovers? Boom and bust? Currency wars?’, The international monetary system strikes back’, BIS Special Governors Meeting, Manila, February 2015.

SPEECH
RBI Bulletin June 201516
Going Bust for Growth
be useful to examine and challenge the rationales used
to justify such actions.
Rationale 1: Would the world not be better off if
we grew strongly?
Undoubtedly, if there were no negative spill overs
from a country’s actions, the world would indeed be
better off if the country grew. But the whole point about
policies that primarily affect domestic growth by
depreciating the domestic exchange rate is that they
work by pulling growth from others, not creating
growth for others.
Rationale 2: We are in a deep recession. We need
to use any means available to jump start growth. Once
we get out of recession, the payoff for other countries
from our growth will be considerable.
This may be a legitimate rationale if the policy is
a ‘one-off’ and once the country gets out of its growth
funk, it is willing to let its currency appreciate so that
it absorbs imports, thus pulling other countries with
it. But if the strengthening currency leads to a
continuation of the unconventional policies as the
country’s authorities become unwilling to give back the
growth they obtained by undervaluing their currency,
or if the strengthening currency leads to greater
domestic political clamour about foreign countries
undervaluing their currencies, this rationale is suspect.
Moreover, policies that encourage sustained
unidirectional capital outfl ows to other countries can
be very debilitating for the recipient’s fi nancial stability,
over and above any effects on their competitiveness.
Thus any ‘one-off’ has to be limited in duration.
Rationale 3: Our domestic mandate requires us to
do what it takes to fulfi l our infl ation objective, and
unconventional monetary policy is indeed necessary
when we hit against the zero lower bound.
This rationale has two weaknesses. First, it places
a domestic mandate above an international
responsibility. If this were seen to be legitimate, then
no country would ever respect international
responsibilities when inconvenient. Second, it
implicitly assumes that the only way to achieve the
infl ation mandate is through unconventional monetary
policy (even assuming UMPs are successful in elevating
infl ation on a sustained basis, for which there is little
evidence).
Rationale 4: We take into account the feedback
effects to our economy from the rest of the world while
setting policy. Therefore, we are not oblivious to the
consequences of unconventional monetary policies on
other countries.
Ideally, responsible global citizenship would
require a country to act as it would act in a world
without boundaries. In such a world, a policy maker
should judge whether the overall positive domestic and
international benefi ts of a policy, discounted over time,
outweigh its costs. Some policies may have largely
domestic benefi ts and foreign costs, but they may be
reasonable in a world without boundaries because more
people are benefi ted than are hurt.
By this defi nition, Rationale 4 does not necessarily
amount to responsible global citizenship because a
country only takes into account the global ‘spillbacks’
to itself from any policies it undertakes, instead of the
spill overs also. So, for example, Country A may destroy
industry I in country B through its policies, but will
only take into account the spillback from industry I
purchasing less of country A’s exports.
Rationale 5: Monetary policy with a domestic
focus is already very complicated and hard to
communicate. It would be impossibly complex if we
were additionally burdened with having to think about
the effects of (unconventional) monetary policies on
other countries.
This widely-heard rationale is really an
abandonment of responsibility. It amounts to asserting

SPEECH
RBI Bulletin June 2015 17
Going Bust for Growth
that the monetary authority only has a domestic
mandate, which is Rationale 3 above. In an
interconnected globalised world, ‘complexity’ cannot
be a defense.
Rationale 6: We will do what we must, you can
adjust.
Adjustments are never easy, and sometimes very
costly – one reason why Ben Bernanke placed the
burden of change in his ‘Savings Glut’ speech outside
the United States. Emerging markets may not have the
institutions that can weather the exchange rate
volatility and credit growth associated with large capital
fl ows – for instance, sharp exchange rate depreciations
can translate quickly into infl ation if the emerging
market central bank does not have credibility, while
exchange rate depreciations may be more easily
endured by an industrial country.
The bottom line is that multilateral institutions
like the IMF should re-examine the ‘rules of the game’
for responsible policy, and develop a consensus
around new ones. No matter what a central bank’s
domestic mandate, international responsibilities
should not be ignored. The IMF should analyse each
new unconventional monetary policy (including
sustained unidirectional exchange rate intervention),
and based on their effects and the agreed rules of the
game, declare them in- or out-of-bounds. By halting
policies that primarily work through the exchange
rate, it will also contribute to solving a classic
Prisoner’s Dilemma problem associated with policies
that depreciate the exchange rate – once some
countries undertake these policies, staying out is
diffi cult (the country that eschews these policies sees
its currency appreciate and demand fall). Exit is also
diffi cult (the exiting country faces sharp appreciation).
Therefore, in the absence of collective action, these
policies will be undertaken even when sub-optimal,
and will carry on too long.
Of course, with country authorities in almost
every industrial country focused on appeasing populist
anti-trade anti-fi nance (and anti-central bank) political
movements, there is little appetite for taking on further
international commitments. We clearly need further
dialogue and public debate on the issues that have been
raised, while recognising that progress will require
strong political leadership.
International Safety Nets
Emerging economies have to work to reduce
vulnerabilities in their economies, to get to the point
where, like Australia or Canada, they can allow
exchange rate fl exibility to do much of the adjustment
for them to capital infl ows. But the needed institutions
take time to develop. In the meantime, the diffi culty
for emerging markets in absorbing large amounts of
capital quickly and in a stable way should be seen as a
constraint, much like the zero lower bound, rather than
something that can be altered quickly. Even while
resisting the temptation of absorbing fl ows, emerging
markets will look to safety nets.
So another way to prevent a repeat of substantial
emerging market reserve accumulation, this time for
precautionary rather than competitive purposes, is to
build stronger international safety nets. For instance,
one possibility is an unsolicited liquidity line from the
IMF, where countries are pre-qualifi ed by the IMF and
told (perhaps privately) how much of a line they would
qualify for under current policy – with access limits
revised in the annual dialogue the Fund has with a
country, and any curtailment becoming effective 6
months later. Access to the line would get activated by
the IMF Board in a situation of generalised liquidity
shortage (as, for example, when policy tightening in
source countries after an extended period of low rates
causes investment managers to become risk averse).
In turn, the Fund could fi nance this liquidity by
intermediating swaps with central banks (and thus

SPEECH
RBI Bulletin June 201518
Going Bust for Growth
guaranteeing central banks against default). Such
proposals allow countries access to liquidity without
the stigma of approaching the Fund, and without the
conditionality that accompanies most Fund
arrangements, and thus are more likely to be
acceptable as precautionary measures. It would also
be a useful exercise for the Fund, in a period of
growing vulnerability to capital fl ow reversals, to
determine those countries that do not have own,
bilateral , regional, or multi lateral l iquidity
arrangements to fall back on, and to work to improve
their access to some safety net.
Conclusion
The current non-system in international monetary
policy is, in my view, a source of substantial risk, both
to sustainable growth as well as to the fi nancial sector.
It is not an industrial country problem, nor an emerging
market problem, it is a problem of collective action. We
are being pushed towards competitive monetary easing
and musical crises.
I use Depression era terminology because I fear
that in a world with weak aggregate demand, we may
be engaged in a risky competition for a greater share of
it. We are thereby also creating fi nancial sector risks for
when unconventional policies end.
We need stronger well-capitalised multilateral
institutions with widespread legitimacy, some of which
can provide patient capital and others that can monitor
new rules of the game. We also need better international
safety nets. And each one of us has to work hard in our
own countries to develop a consensus for free trade,
open markets, and responsible global citizenry. If we
can achieve all this even as recent economic events
make us more parochial and inward-looking, we will
truly have set the stage for the strong sustainable
growth we all desperately need.

SPEECH
RBI Bulletin June 2015 19
Indian Banking Sector: Emerging Challenges and Way Forward
and India is no exception. Our banking system, at the
present juncture is, however, facing significant
challenges from several quarters. These challenges, if
not addressed quickly and adequately, may result in
loss of opportunities as and when the economic growth
starts picking up momentum. In a sense, it has
implications for both- the banks as well as for the
economy as a whole, because as I mentioned earlier, a
strong banking system is one of the essential pre-
requisites in the quest for growth. In my lecture today,
I intend to focus on the economic landscape and the
emerging challenges for the banking system at the
current juncture.
Macroeconomic Landscape
3. Since the onset of the Financial Crisis in 2008, the
global economy has continued to face rough weather
and the Indian economy and our banking system have
not remained immune. Recovery has been moderate
and sometimes uneven. Different jurisdictions
continue to be tormented by fi nancial fragilities and
macroeconomic imbalances. Geopolitical risks
surrounding oil prices and the uneven effects of
currency and commodity price movements also pose
signifi cant threat to economic stability. Sustenance of
highly accommodative monetary policy in the Advanced
Economies has also created monetary policy challenges
in emerging markets like India.
Challenges for the Banking System
4. It is against this challenging backdrop that the
banking system in India has been operating for a
relatively long period of time which has resulted in an
adverse impact on the asset quality, capital adequacy
and profi tability of our banks. But the tough situation
in which the banking system finds itself is also
attributable in a large measure to the bankers’
inexperience and aggression. Let me delve upon these
challenges and the way forward in a bit of detail.
Shri Sharad Sharma, Managing Director, State Bank
of Mysore; Shri Karthak, Regional Director for
Karnataka, RBI; senior colleagues from the banking
fraternity; ladies and gentlemen! It is a privilege for me
to deliver the inaugural memorial lecture in the honour
of His Highness Sri Nalwadi Krishnaraja Wadiyar,
former Maharaja of Mysore. It is quite apt that a
memorial lecture has been instituted by State Bank of
Mysore in the honour of Sri Krishnaraja Wadiyar. The
prophetic Maharaja of Mysore, during his lifetime, had
earned sobriquets of being a philosopher-king and a
‘Rajarshi’ or a “saintly king” from no less a person than
the Father of the Nation. It is a glowing testimony of
his popularity and prowess that Mysore in his times
was regarded as “the best administered state in the
world”. As Lord Sankey noted “princes from other
sections of India were sent to Mysore for administrative
training” and hence, holding this memorial lecture at
this newly opened learning Centre holds an added
significance. During his reign, Maharaja Wadiyar
worked towards social causes like poverty alleviation
and economic regeneration by improving rural
reconstruction, public health, industry and education;
some of the goals that the policy makers are presently
pursuing with support from the banking sector.
2. The banks are the lifelines of the economy and
play a catalytic role in activating and sustaining
economic growth, especially, in developing countries
* Lecture delivered by Shri S.S.Mundra, Deputy Governor, Reserve Bank of India at Bangalore on April 29, 2015 as part of the Memorial Lecture series launched by State Bank of Mysore in the memory of His Highness Sri Nalwadi Krishnaraja Wadiyar.
Indian Banking Sector: Emerging Challenges and Way Forward*S. S. Mundra

SPEECH
RBI Bulletin June 201520
Indian Banking Sector: Emerging Challenges and Way Forward
i) Asset Quality
Though on the whole, the banking system has
remained resilient, asset quality has seen
sustained pressure due to continued economic
slowdown. The levels of gross non-performing
advances (GNPAs) and net NPAs (NNPAs) for the
system have been elevated. As per preliminary
data received at the RBI for March 15, while the
GNPAs have increased to 4.45 per cent for the
system as a whole, the NNPAs have also climbed
up to 2.36 per cent. When seen in isolation, the
NPA ratios do not appear very distressing;
however, if we add the portfolio of restructured
assets to the GNPA numbers, this rises alarmingly.
Stressed Assets Ratio (Gross NPA+ Restructured
Standard Advances to Gross Advances) for the
system as a whole stood at 10.9 per cent as at the
end of March 2015. The level of distress is not
uniform across the bank groups and is more
pronounced in respect of public sector banks. The
Gross NPAs for PSBs as on March 2015 stood at
5.17 per cent while the stressed assets ratio stood
at 13.2 per cent, which is nearly 230 bps more than
that for the system.
It is pertinent here to also note the observations
made in the Global Financial Stability Report
released by IMF recently. Referring to the high
levels of corporate leverage, the report highlights
that 36.9 per cent of India’s total debt is at risk,
which is among the highest in the emerging
economies while India’s banks have only 7.9 per
cent loss absorbing buffer, which is among the
lowest. While these numbers might need an
independent validation, regardless of that, it
underscores the relative riskiness of the asset
portfolio of the Indian banks.
As you all know, the RBI has taken various steps
to improve the system’s ability to deal with
corporate and fi nancial institution distress. This
includes issuance of guidelines on “Early
Recognition of Financial Distress, Prompt Steps
for Resolution and Fair Recovery for Lenders:
Framework for Revitalising Distressed Assets in
the Economy, detailed guidelines on formation of
Joint Lenders’ Forum (JLF), Corrective Action Plan
(CAP), ‘Refi nancing of Project Loans’, ‘Sale of NPAs
by Banks’ and other regulatory measures, which
emphasised the need for early recognition of
fi nancial distress and for taking prompt steps for
rectifi cation, restructuring or recovery, thereby
ensuring that interests of lenders and investors
are protected.
Various reports that I get suggest that the
implementation of JLF framework needs further
improvement on the ground level. We have
received representations from bigger lenders
about non-cooperation from a few lenders. On the
other hand, smaller lenders have voiced their
concerns about being arm twisted by bigger
lenders. Unless, there is proper co-ordination
between the interested parties, all the revival
efforts are likely to fall fl at.
The RBI had given a road map for ending the
regulatory forbearance on asset classifi cation of
restructured accounts long back and accordingly,
the forbearance has come to an end on March 31,
2015. There has been a lot of clamor from all
quarters for extending this forbearance. Our stand
on this issue has been absolutely clear. I wish to
highlight that ‘Restructuring’ per se is not
necessarily a forbidden word. It is a legitimate
fi nancial activity practiced the world over to help
the borrowers tide over short term problems and
to preserve economic value in the system. I don’t
know why restructuring a loan which is under
short term stress should not be done. What we
are saying is that, the banks must acknowledge

SPEECH
RBI Bulletin June 2015 21
Indian Banking Sector: Emerging Challenges and Way Forward
the problem, admit that the account is facing stress
as of now, but is expected to recover in future.
Hence, make a small provision and reverse it when
the account becomes satisfactory and starts
paying. Staying in denial mode does not help
anyone especially in an interconnected world
where regulation making has become global and
so has the public scrutiny. Any forbearance
extended by the regulator will be discounted by
the investor/analyst community while assessing
the bank’s fi nancials.
ii) Capital Adequacy of Banks
Concerns have been raised about the ability of our
banks to raise additional capital to support their
business and I would admit that these concerns
are not entirely misplaced, especially for the public
sector banks. Higher level of capital adequacy is
needed due to higher provisioning requirements
resulting from deterioration in asset quality,
kicking in of the Basel III Capital norms, capital
required to cover additional risk areas under the
risk based supervision framework as also to
sustain and meet the impending growth in credit
demand, going forward.
Though at present, the banking system is
adequately capitalised, challenges are on the
horizon for some of the banks. For the system as
a whole, the CRAR has been steadily declining and
as at the end of March 2015, it stood at 12.70 per
cent as against 13.01 per cent as at the end of
March 2014. Our concerns are larger in respect of
the PSBs where the CRAR has declined further to
11.24 per cent from 11.40 per cent over the last
year.
The poor valuations of bank stocks, especially the
PSBs, are not helping matters either, as raising
equity has become diffi cult. When even the best
performing PSBs have been hesitant to tap the
markets for augmenting their capital levels, it
would be diffi cult for the weaker PSBs to raise
resources from the market. There is a constraint
on the owners insofar as meeting the capital needs
of the PSBs and hence, the underperforming banks
are faced with the challenge of looking at newer
ways of meeting their capital needs. A singular
emphasis on profi tability ratios (based on RoA and
RoE) perhaps fails to capture other aspects of
performance of banks and could perhaps encourage
a short term profi tability-oriented view by bank
management. However, without getting into the
merits of this approach, from a regulatory stand
point, we feel that some of these poorly managed
banks could slide below the minimum regulatory
threshold of capital if they don’t get their acts
together soon enough. Of course, the pressure
may lessen somewhat if, going forward, the asset
quality improves on account of higher growth,
resulting in higher retained earnings for banks.
The need of the hour for all banks, and more
specifi cally, in respect of the PSBs, is that capital
must be conserved and utilised as effi ciently as
possible.
iii) LCR Framework
As you are aware, the Liquidity Coverage Ratio
(LCR) regime has kicked in for the banks from
January 1, 2015 with a minimum requirement of
60 per cent to be gradually increased to 100 per
cent by January 1, 2019 in a phased manner. The
LCR is a ratio of High Quality Liquid Assets (HQLA)
to the Total Net Cash Outflows prescribed to
address the short term liquidity risk of banks and
the banks would be required to maintain a stock
of HQLAs on an ongoing basis equal to the Total
Net Cash Outfl ows.
Banks have been asking for reduction in SLR citing
the implementation of the LCR framework. To a

SPEECH
RBI Bulletin June 201522
Indian Banking Sector: Emerging Challenges and Way Forward
certain extent their request has merit. SLR
essentially serves the same purpose as the LCR.
However, SLR does not assume certain outfl ow
rates for liabilities while outfl ow and infl ow rates
under the LCR framework are based on certain
assumptions of stress. Presently, apart from
maintaining LCR at 60 per cent, the banks have to
maintain SLR of 21.5 per cent of the NDTL. Going
forward, as the LCR requirements gradually
increase, it may be desirable to reduce the SLR
progressively. Presently, there is a special
dispensation wherein RBI has permitted banks to
reckon up to 7 per cent of the SLR towards LCR (2
per cent of MSF and 5 per cent under FALLCR[1]).
Our regulatory department is seized of the issue
and would take appropriate measures to address
this issue going forward.
iv) Unhedged Forex Exposures
The wild gyrations in the forex market have the
potential to infl ict signifi cant stress in the books
of Indian companies who have heavily borrowed
abroad. This stress, besides impacting repayment
of forex liabilities, eventually hampers their debt
repayment capability to the domestic lenders as
well. It is precisely with this consideration that
the RBI has been advocating a curb on the
increasing tendency of the corporates to dollarise
their debts without adequate risk mitigation.
Our supervision of banks’ books has highlighted
the need for the banks to have more robust
policies for risk mitigation on account of unhedged
foreign currency exposure of their corporate
borrowers. Inadequacies of data further complicate
the impact assessment of such exposures across
the banking system. The banks have been advised
to factor in this risk into their policies/pricing
decision and also devise means for sharing of
information on such exposures amongst
themselves. Regulatory guidelines have also since
been issued outlining the capital and provisioning
requirements for exposure to entities with
signifi cant unhedged forex exposures.
v) Human Resource Issues
I do not need to emphasise the HR issues in banks.
This is a decade of retirement for the PSBs and I
am sure those working there are already feeling
the pinch of the loss of experienced hands in their
day-to-day operations. While the recruitments
would be happening at the junior levels, there
would be a virtual vacuum at the middle and
senior level for some time to come. The absence
of middle management could lead to adverse
impact on banks’ decision making process as this
segment of officers played a critical role in
translating the top management’s strategy into
workable action plans. Some of the major banks
are also suffering on account of prolonged
leadership vacuums at the top. All banks, including
those in the private sector, are witnessing high
attrition rates, giving rise to resource gaps. The
problem is set to get accentuated further once the
banks that have been newly licensed/likely to be
licensed, start hiring. Therefore, bridging resource
gaps and managing employee turnover are major
challenges that banks need to be prepared to
address.
The banks need to continuously enhance the skill
levels of their employees so as to remain viable
and competitive and to take advantage of new
opportunities. The banking personnel, across the
cadres need to be suitably trained to acquire
necessary skill sets to perform their jobs more
efficiently. The biggest challenge is to build
capacity at a rate which matches the loss of
existing talent and skills to retirement, poaching
and resignations. The training initiatives must 1 Facility to Avail Liquidity for Liquidity Coverage Ratio.

SPEECH
RBI Bulletin June 2015 23
Indian Banking Sector: Emerging Challenges and Way Forward
ensure that the available talent pool in the banks
is able to always keep pace with the fast changing
ways in which banking is conducted. Of course,
in these challenges also lie an inherent opportunity
for banks to redraw their organisational profi le
and to create HR systems and processes best suited
to the needs of the future.
vi) Revision to the Priority Sector Lending Guidelines
The revised priority sector lending guidelines have
been released last week. Lending to a few new
sub-sectors like renewable energy, social
infrastructure and to the medium enterprises
would now be treated as priority sector lending.
Concept of a tradable Priority Sector Lending
Certifi cate (PSLC) has also been introduced, which
would enable the ‘defi cit’ banks to buy these
certifi cates from ‘surplus’ banks to meet their
targets.
There is also readjustment in some sub-targets,
whereby the banks are now required to
progressively achieve 8 per cent of lending to Small
and Marginal Farmers and 7.5 per cent to the micro
enterprises among the MSEs in a phased manner.
This has been brought about with an underlying
objective of making available fi nance to the most
needy and the most alienated of the borrowers.
This may probably pose a bit of a challenge initially
but I believe with proper planning, these targets
could be achieved sooner rather than later.
vii) PMJDY and beyond
I must compliment the banking sector for
wholeheartedly working for the success of the
PMJDY scheme. The numbers speak for themselves.
More than 14.5 crore accounts opened. That leads
to the question- what next? Flow of individual
savings, albeit howsoever small combined with
fl ows from direct benefi t transfer would be crucial
to give an initial push to keep these accounts active
while extending productive/need-based credit
would be the second crucial step. The onus is upon
all of us to ensure that the window of opportunity
that has been presented by the opening of such a
large number of accounts, is not put to waste by
allowing the accounts to turn inactive.
The credit absorption capacity of the farmers can
be enhanced through consolidation of fragmented
landholdings by ushering in land reforms or
through pooling of land holdings in a SHG format.
Similarly, customers may also be trained to
undertake non-farm activities. Efforts to enhance
the credit absorption capacity must also be
supplemented through financial literacy and
vocational training initiatives. Improved fi nancial
literacy would aid the inculcation of a savings
culture and investment habit amongst the
customers, which can be leveraged by the banks
by offering suitable small savings, investment and
pension products.
A major challenge for the banks would be to
manage their banking correspondent model
effectively. The problems relating to their viability,
governance, cash management, linkage and
oversight from a base branch need to be quickly
addressed. The entire fi nancial inclusion ecosystem
must progressively develop, if the momentum
gathered under the PMJDY exercise has to be
sustained for all-round benefi t of all stakeholders.
viii) Globalisation of Regulation- making process
As I alluded to a little earlier, banking regulations
are getting increasingly globalised, subject of
course to certain national discretions. As members
of the standard setting bodies like BCBS and FSB,
we are committed to implement these regulations
in our jurisdictions. There is a process for peer
review of regulatory guidelines issued by various

SPEECH
RBI Bulletin June 201524
Indian Banking Sector: Emerging Challenges and Way Forward
jurisdictions to ascertain compliance with the
global standards, failure to adhere to which would
render the jurisdiction non-compliant to the
standards. While we do participate in the
regulation making process and suggest
modifi cations to protect the rightful interests of
the domestic economy, very often, we have to
abide by the larger framework. I will give just one
example viz. the large exposures regime, for which
a consultation paper on new SBL/GBL norms has
already been released by the RBI.
ix) Technology and its impact
Let me briefly touch upon an issue which is
relatively much more pertinent for the PSBs, i.e. use of technology in banking. All PSBs are now on
CBS platform and have developed capabilities to
offer anywhere banking. Few have also started
offering basic banking transactions on mobile for
their customers. But this is just scrapping the
surface as the technology can be leveraged for a
far greater effect. PSBs must be able to leverage
technology for building data warehouses and then
be able to do data mining and analytics. The goal
should be to use data for effective decision making
at various levels, including product customisation,
developing business models and delivery channels,
etc.
PSBs must be able to pitch suitable products for
their customers through internet and mobile
banking channels. Traditional businesses are
slowly moving on-line and e-commerce is the
preferred choice of the gen-next customer. The
challenge before the PSBs is to upscale their
capabilities, train their employees on the new
technologies to benefi t from the possibilities that
adoption of technology can open up.
A good thing going for the banks is the current
recruitment of youngsters in the work force. This
new-generation staff is tech-savvy and can quickly
connect with technology. The enterprising among
them must be accorded freedom to experiment
and suggest ways in which the bank could
reengineer its processes for its own benefi t and
that of its customers. This would require a change
in mind-set of the senior/Top Management and
this must happen if the PSBs have to compete
effi ciently and effectively with the private sector
counterparts in future.
x) Treating Customers Fairly
Protection of bank customers has been one of the
thrust areas for the RBI in recent times. As you
may be aware, the RBI has issued a Charter of
Customer Rights based on the global best practices.
The Charter comprises of following fi ve rights:
Right to Fair Treatment
Right to Transparency, Fair and Honest Dealing
Right to Suitability
Right to Privacy
Right to Grievances Redress and Compensation
A model customer rights policy jointly prepared
by IBA and BCSBI incorporating these rights has
been circulated to all banks by IBA. The banks have
been advised to prepare a Board Approved Policy
based on the model policy before July 31, 2015.
The RBI may review the policies framed by the
banks and their implementation as part of our
supervisory assessment over the next 12-18
months.
xi) KYC/AML Compliance
Let me now turn to another very important issue
which is equally challenging for the private sector
banks as well and that is, compliance with the
KYC/AML norms. A majority of the enforcement
action by the banking sector regulator in the recent
past has been on account of these violations.

SPEECH
RBI Bulletin June 2015 25
Indian Banking Sector: Emerging Challenges and Way Forward
The instances of fake e-mails soliciting
unsuspecting customers to make payments to
certain bank accounts as a precursor to receiving
prize or lottery winnings from abroad, have
become quite rampant. It is surprising that even
well-educated individuals are falling prey to such
incredulous offers. While spreading financial
literacy remains a huge challenge, the banks
cannot be absolved of their responsibilities in the
sequence of events. Most of this money is being
transferred through banking channels and
obviously, there is a defi ciency in KYC compliance.
Money muling is another common occurrence
which highlights defi ciencies in risk categorisation
of customers and monitoring of transactions.
I am emphasising on this issue because banks need
to be sensitive to the possibility of regulatory
strictures/penalties for non-compliance.
Consistent monitoring of transactions is necessary
to prevent money muling. A few banks in the past
have already been fined for deficiencies in
adherence to KYC/AML norms and with our
commitment to comply with the FATF norms; I
can only forewarn you that the frequency and
severity of such penalties would rise in future.
xii) Balance Sheet Management
Over the past few years we have witnessed an
increasing propensity to defer or delay provisions
in an apparent attempt to post higher net profi ts.
Probably, this short term vision is also in part
attributable to short term tenure which the CEOs/
CMDs get. It must be appreciated that CEOs/CMDs
would come and go but the institutions are
perpetual entities. The only thing which can
perpetuate their existence is a stronger and
healthier balance sheet. It must be realised that
the fi rst step towards resolving a problem is to
acknowledge its existence. The problems which
are swept under the carpet for a quarter or two
would need to be encountered thereafter, with
the issue getting further complicated in the
interim.
Making higher provisions would not only add
strength to the balance sheet, but also lead to
better control over tax out-go and the dividend
pay-out, besides adding credibility to the bank’s
fi nancial statements. While a lower net profi t
would make headlines for a day or two, believe
me the savvy long-term investors/analysts do not
read too much into the short term blips. If they
understand that the Management is sincere about
repairing the balance sheet, they would drive up
the valuation of your stocks, which would help
you in the long-term. With most banks in dire need
of capital, the retained earnings need to increase
progressively.
As a part of balance sheet management exercise,
the Board/Top Management would have to
proactively take a call on the likely components
of their balance sheets and what shape they would
like the balance sheet to take in future. The
objective of optimal utilisation of capital would
have to be necessarily kept in mind while evolving
balance sheet management strategies.
xiii) Risk Management
Risk is inevitable in the banking business and
hence, a sound risk management framework is
the touchstone of an efficient bank. The risk
management effectively aims at balancing the
Risk-Return Trade-off which is “maximising return
for a given risk” and “minimising risk for a given
return”. The responsibility of setting a risk
appetite for the bank as a whole is that of the Board
and the Top Management. In practice, however,
we seldom see the articulation of an objective risk
appetite statement by the PSBs. If you haven’t set
out a risk limit for each type of risk that the bank

SPEECH
RBI Bulletin June 201526
Indian Banking Sector: Emerging Challenges and Way Forward
runs and an aggregate risk appetite for the bank
as a whole, how do you measure and monitor risk?
We must understand that risk management is
integral to the success of the bank and hence, the
Top Management should strive to put in place an
effi cient risk management framework keeping in
view the changing market dynamics and the
regulatory prescriptions.
Conclusion
5. In conclusion, I would once again like to invoke
Krishnaraja Wadiyar in whose memory this lecture has
been instituted. Maharaja was known to be a man of
action, a man of deeds and a person of compassion and
empathy for his subjects. The bankers present here
would do a great service to the memory of the Maharaja
if they could imbibe these qualities in their day-to-day
operations, particularly while dealing with their
customers.
6. As we have noted, these are challenging times for
the banking sector but as the clichéd proverb goes
“Every cloud has a silver lining”. The future leaders in
the banking industry would be those who identify this
silver lining early and initiate necessary steps to
leverage the opportunity. The impending competition
from new banks and the large number of new accounts
opened under the PMJDY Scheme are two instances
that readily come to mind of the challenges that could
be turned into opportunities. Besides this, banks as the
key players in the country’s fi nancial system also carry
the responsibility of supporting economic growth, once
the economic cycle turns favourable. Banks have to
prepare themselves for meeting this responsibility by
nurturing a healthier balance sheet.
I conclude by wishing the State Bank of Mysore
management the very best on this occasion and thank
you all for patient hearing!

SPEECH
RBI Bulletin June 2015 27
Indian Payments System Kaleidoscope
globe. What I propose to do in my address is to briefl y
trace the recent developments in the area of payment
systems in India, highlight some of the issues and
challenges that are likely to assume importance in the
foreseeable future and the way forward in dealing
with these challenges. Let me, however, begin with
emphasising the importance of the payment system
for the economy.
Importance of Payment Systems
3. We all know that safe, secure and efficient
payment systems are vital for the working of fi nancial
markets and more generally for the economy itself.
Any disruption to the payment system has the
potential to disrupt the functioning of the fi nancial
markets and lead to systemic instability. When we talk
about such large scale disruption probably we have in
mind the bigger and systemically important payment
infrastructure and larger payment system members,
viz. Financial Institutions, Exchange Settlement
System, Central Counter Parties and so on. At the other
end of the spectrum, the payment system has to also
serve the retail customers. In that sense, the payment
systems also have an inclusion mandate so that the
day to day needs of the people like remittance of funds
and small value payments are met. It is also important
to emphasise here that the Central Bank and the
Government are also interested in weaning people
away from cash and induce them to use cashless mode
of payments like card, mobile, direct debit etc.
Role of payment system in promoting financial
inclusion
4. Let me briefl y touch upon the role of payment
system in promoting fi nancial inclusion.There is a
strong linkage between fi nancial inclusion and the
payment systems. The financial inclusion in its
simplest form refers to banking inclusion where the
Shri. M. Balachandran, Chairman, National
Payments Corporation of India (NPCI); Shri A.P.Hota,
MD & CEO, NPCI; members of the NPCI Board, other
distinguished guests, delegates to the Conference
from India and abroad; ladies and gentlemen! It is a
privilege to be in the midst of this distinguished
gathering to deliver the valedictory address at the
“International Conference on National Payment
Schemes” this afternoon. Indeed, this is a unique
initiative by NPCI, the fi rst of its kind to be held in
India, which has provided a forum for interaction
amongst the market participants and institutions from
various jurisdictions engaged in various payment
system related activities.
2. I observe that over the past day and a half of the
conference, representatives from various countries-
both developed and developing- have made
presentations about innovative ways in which they
have been making a difference to the payment systems
in their respective countries through diverse product
and service offerings. I understand that evolution and
growth of card payment mechanism and mobile
payments have been deliberated upon and so also, the
issues of cyber security, innovation in payment
systems, challenges/opportunities faced by the global
payment systems, etc. I am sure all of you present
here must have immensely benefitted from this
experience sharing exercise and I believe that you
have a better appreciation of the national payment
schemes operating in different economies across the
* Valedictory address delivered by Shri S. S. Mundra, Deputy Governor, Reserve Bank of India at the International Conference on National Payment Schemes organised by NPCI on May 22, 2015.
Indian Payments System Kaleidoscope*S. S. Mundra

SPEECH
RBI Bulletin June 201528
Indian Payments System Kaleidoscope
endeavour is to link the unbanked population with
the formal banking system by opening their bank
accounts. To inculcate the banking and savings habit
amongst the people, it is important that all individuals
have bank accounts where funds could be held - which
initially could be through remittances in form of direct
benefi t transfers under the Central/State Government
schemes.
5. The PMJDY scheme launched by the Government
of India has achieved stupendous success in linking
the unbanked with the banking system. Bank accounts
have been opened for nearly 99.99 per cent of the
households in India which has brought in 150 mn new
customers coming into the banking system fold while
nearly 135 mn RuPay debit cards have also been issued.
These are huge numbers on a standalone basis and
the payment system must be geared to handle this
multi-fold increase in transaction volume. The
payment system would need to be robust enough to
process, settle and reconcile millions of new
transactions day in and day out. I am sure that the
Indian participants present here would leverage upon
the intricacies of a wide variety of payment system
infrastructure learnt during the course of the
conference to improve the payment system
infrastructure in the country to be able to cater to the
needs of a billion people.
Evolution of payment systems in India
6. I now turn to some of the important developments
that have taken place in the area of payment system
in India under the guidance and oversight of Reserve
Bank of India.
• Introduction of MICR clearing to mechanise
the cheque clearing system in early 1980s
• Setting up of the Institute for Development
and Research in Banking Technology (IDRBT)
in 1996 with an aim of technological
upgradation and development of a reliable
communication network
• Introduction of Electronic Clearing Service
and Electronic Funds Transfer in the 1990s
• Permitting issuance of Credit and Debit cards
by the banks in 1990s
• Interconnectivity of ATMs across the country
by introducing the National Financial Switch
in 2003
• Following the improvement in the Information
Technology and introduction of CBS by banks,
RTGS and NEFT introduced by the RBI in 2004
• Introduction of Cheque Truncation System
(February 2008) and new RTGS with enhanced
features (October 2013)
• The second factor authentication for the ‘card
not present’ transaction, the fi rst of its kind
in the world, introduced by the RBI (February
2009)
• Launch of RuPay – a domestic card payment
network (March 2012)
7. Let me also give you a sense of the manner in
which the volume and value of payment system
transactions have gone up in recent years. In volume
terms, the no. of transactions handled in the RTGS
has gone up to 92.77 mn as at the end of March 2015
from 68.51 mn as at the end of March 2013. During
the same period, in value terms, these transactions
have gone up from ̀ 677 tn to ̀ 754 tn. Under the retail
payments (including paper clearing and retail
electronic clearing), the volume handled more than
doubled from 694 mn as at the end of March 2013 to
1687 mn as at the end of March 2015. Similarly, in

SPEECH
RBI Bulletin June 2015 29
Indian Payments System Kaleidoscope
value terms also, this has more than doubled to `65
tn from about `32 tn. Further, the volume and value
of card payments have also more than doubled in both
volume and value terms during this period. The
volume handled as at the end of March 2015 was 1,737
mn transactions with a value of `3.3 tn. These
numbers are mighty impressive considering the level
of economic development in the country but as I
mentioned earlier, there is much more work needed
to be done going forward. We need to develop the
capabilities to handle more and more number of
transactions in a safe, secure and effi cient manner, if
our objective of weaning consumers away from cash
has to be achieved.
8. S e v e r a l i n i t i a t i v e s f o r i n f r a s t r u c t u r e
enhancements are currently on which include
implementation of Trade Receivables and Discounting
System and the Bharat Bill Payment System. The RBI
had come out with a Vision Document for 2012-15
earlier and most of the objectives set out therein have
been accomplished. The vision of RBI is to ensure that
all “Payments and Settlement Systems in the country
are safe, effi cient, interoperable, authorised, accessible,
inclusive and compliant with international standards”.
As I mentioned earlier, a sound and effi cient payment
system is a pre-requisite for a stable fi nancial system
and with the increasing volume and value of
transactions, Central Banks can ill-afford to ignore
payment systems. The RBI has also initiated the
process of setting up of Payment Banks to further
fi nancial inclusion.
Role of NPCI
9. You would have gone into the details of the role
of NPCI in the sessions during the course of this
conference. Since, I had the distinction of serving on
the Board of NPCI for some time, I would briefl y say
a few words on the role and achievements of NPCI. It
was set up with an objective of ensuring pan-India
payment systems with uniform business processes
and standards and has already created an enabling eco
system necessary for handling this huge task. Some
of the achievements of NPCI which have signifi cantly
altered the retail payments landscape in the country
are as under:
• The National Financial Switch (NFS), a vast
network of ATMs, has enhanced accessibility
to cash withdrawal and other basic banking
facilities for customers, besides facilitating
value added services such as bill payments.
• Cheque Truncation System (CTS) - It has been
rolled out successfully in three grid locations
across the country covering over 85 per cent
of cheque volume processed. NPCI has now
begun to facilitate the repository of images
of cheques processed in CTS.
• Immediate Payment Service (IMPS) which
started in October 2010 as an inter-bank
mobile payment system has, over the years,
transformed into a multi-channel 24x7
remittance platform in the country, accessible
through net banking, mobile banking, at BC
point, at branches as well as at ATMs.
• RuPay - the domestic card system which was
launched in 2011 has slowly gained popularity
and with its linkage under the Jan DhanYojana
has become a household name.
• Aadhaar based payments, through linkage of
biometric identifi er with bank accounts, is
facilitating the benefit payments to bank
accounts of millions of benefi ciaries, and will
have significance on financial inclusion
efforts in the country.

SPEECH
RBI Bulletin June 201530
Indian Payments System Kaleidoscope
• National Unifi ed USSD Platform (NUUP) – The
setting up of National Unifi ed USSD Platform
for providing an interoperable USSD based
mobile banking system is an unparalled feat
in itself as it links all telcos and all major
banks, and offers services in over 11
languages. It has a lot of expectations as well
as its potential for enabling fi nancial inclusion
is enormous.
10. The above are some of the milestones in the
journey of NPCI thus far. I fervently hope NPCI is
geared up to handle the huge volume of payments
arising out of recent initiatives of the Government to
distribute social benefits to the citizens in the
electronic mode.
Replicating global success stories
11. There are many success stories within different
geographies across the globe in the arena of payment
systems. To mention a few – the m-pesa system of
Kenya, the ‘tap and go’ card scheme at Singapore, the
union pay card scheme of China. If these models
have worked so well and have been so successful in
their respective countries, can we not simply
replicate the model in our jurisdictions? The answer,
I am afraid, is a big NO. Let me say why with the
example of India.
12. India is diverse - in the sense of social customs,
culture, religious beliefs. The diversity and multitude
of population and geographic spread of the country-
are some factors which make our task extremely
complex. The ease with which people can handle
technology also differs across people of different age
groups, income levels, literacy levels etc. Hence, it is
diffi cult to design product which can work seamlessly
across all sections of the society. Thus, while it is true
that no scheme or model can work seamlessly across
all economies; what might indeed be best is learn from
the other successful delivery models and customise
the product and service offerings to suit the DNA of
the respective economy and society.
Technology and the payment systems
13. Growing mobile and internet penetration has
opened new avenues for the payment systems
services. This is refl ected in the way the new age
customer transacts her business. To quote Brett King,
the author of ‘Bank 3.0’:
“Customers don’t use channel or products in
isolation of one another. Everyday customers
would interact with banks in various ways. They
might wire money to a third party, visit ATM to
withdraw cash, go online to check salary credit,
pay an utility bill , use their credit card to
purchase some goods from a retailer , fi ll out a
personal loan application online, ring up the call
centre to see what their credit card balance is or
report a lost card. More sophisticated they are,
they may also trade some stocks, transfer some
cash from their Euro A/c to USD a/c put up a lump
sum in a Mutual Fund or sign up a home
insurance policy online”.
14. The above statement denotes the diverse set of
banking applications which technology can support.
In fact, there is a need of a single channel solution to
multiple product offerings. It must, however, be
remembered that technology is just an enabler. Almost
all banks in India have invested heavily in web-based
and mobile-based delivery banking and payment
solutions. Very often, these channels are supported
by different vendors and also one use different
technology which increases complexity and involves
cost. Technology is ever evolving and adoption of new
technology for staying contemporaneous is a costly

SPEECH
RBI Bulletin June 2015 31
Indian Payments System Kaleidoscope
proposition. It is pertinent, therefore, that all the
capabilities of the technology enabled delivery
solutions are optimally exploited, so that we are not
saddled with unproductive investments.
15. While there is a lot of euphoria around the
adoption of mobile banking and mobile payments, the
model has been relatively less successful barring a few
countries where the right environmental factors
existed. I am talking here about the delivery of
fi nancial and payment services by using the mobile
device rather than its use as an access channel for
internet banking etc. In the Indian context, an
objective analysis would reveal various reasons for
slow adoption. There are technical issues like type of
handsets, variety of operating systems, encryption
requirements, inter-operable platforms or the lack of
it, absence of standardised communication structures,
diffi culty in downloading application, time lag in
activation etc. These get accentuated by the operational
diffi culties in on-boarding merchants and customers
and customer ownership issues. The interplay of these
factors has stymied the deployment and adoption of
mobile banking as an effective and widely accepted
delivery channel. Issues of co-ordination and
cooperation between banks and telcos, is another
aspect which acts as either a driver or a barrier to the
adoption of mobile banking. These issues need to be
quickly resolved if the mobile payments have to
succeed in our country.
Emerging Scenario
16. It would be interesting here to visualise few
scenarios which may emerge in future:
• Simultaneous impact of playing out of Reed’s
law and Moore’s law where both “the
payment space” and “the pinpoints” within
the space would grow exponentially.
• Whether some of the technology companies
and retail banks can undergo transformation
to such an extent that the technology fi rm
would appear more like a retail bank and
vice-a-versa.
• More and more collaboration between a bank
and non-bank.
• The gradual shifting of micro payments to
mobiles leading to reduction in requirements
of physical currency notes and coins.
• Salaries and payments distributed directly on
the mobile wallet akin to currency distribution.
• With the reduction in cash transaction, ATMs
might have to offer other services rather than
only dispensing cash in order to remain
relevant.
• Ease of credit through KYC, Mass Market
Credit Rating at the click of a button.
• Whether cross-border transactions can also
happen on mobiles in future?
The payment system players would have to gear
up to accommodate and leverage upon such
possibilities going ahead.
Regulatory Challenges
17. The innovations in the payment system space
and introduction of new products are already posing
challenges for the regulators and these challenges are
likely to intensify going forward. Some of the possible
dilemmas/challenges that the regulators would be
faced with in future are:
• Whether payment and settlement would
remain banks’ preserve? If not, what would
be regulatory stance?

SPEECH
RBI Bulletin June 201532
Indian Payments System Kaleidoscope
• What would be the way forward in regulating
virtual currencies?
• Cloud computing and Cyber Security.
• Striking the right balance between ease of
doing business and ensuring security.
• Challenges from mobile transactions
becoming more user centric than transaction
centric.
• Monitoring of cross-currency/cross-border
mobile transactions, not if but when they
happen.
The most important challenge for the regulator
would be to do a tight rope walk between providing
the “Right Guidance but not at the cost of stifl ing
innovation”.
Conclusion
18. Let me conclude by once again congratulating
NPCI for organising this international Conference.
The institution has so far overcome diffi cult challenges
and made significant achievements in different
spheres of retail payment arena. However, it is just
the beginning. It would need to be nimble-footed and
innovate continuously to meet the challenges
emanating from a dynamic world. As I said before,
such conferences serve as an important forum to
exchange ideas. I do hope that there are signifi cant
takeaways for the participants, which would help
shape the design of robust and effi cient payment
systems to handle multitude of transactions and
contribute to the economic growth in the respective
jurisdictions.
Thank you!

ARTICLES
Industrial Outlook Survey: 2014-15
Infl ation Expectations Survey of Households: 2014-15


ARTICLE
RBI Bulletin June 2015 33
Industrial Outlook Survey: 2014-15
The survey schedule is canvassed among a fi xed panel of 2,500 manufacturing companies, mostly with paid-up capital above `5 million, representing a good mix of size and industry groups. The panel of respondents is kept uniform to the extent possible and is updated with addition of new companies or deletion of closed/merged companies as and when felt necessary. The survey is voluntary and the response rates have been around 70 per cent in 2014-15.
This article analyses the survey responses for four quarters- from April-June 2014 to January-March 2015 (i.e. FY:2014-15). The quarterly survey results are regularly disseminated through the RBI website. The related data tables (annual series) are presented in Annex.
II. Business sentiments improved
The Business Expectation Index (BEI), which is computed as a weighted average of the Net Response (NR)1 of nine select performance parameters2, gives a single snapshot of the industrial outlook in each quarter. For each of the survey round, two indices are computed – one based on the assessment of current quarter and another based on expectation of next quarter.
During the fi nancial year 2014-15, the BEI (based on assessment) remained optimistic, hovering over the threshold level of 100, which separates contraction and expansion in the economy. The BEI (assessment) fell below 100 during Q2 and Q3 of the previous year (FY:2013-14). The BEI (assessment) showed improvement in the business situation in the fi rst two quarters of FY:2014-15 and moderated in the third quarter. However, it again showed a pick-up in the last quarter, which is partly due to seasonality (Chart 1).
This annual article, third in the series, presents the findings of Industrial Outlook Survey (IOS) conducted quarterly during FY:2014-15 (covering 66th to 69th rounds of the survey). In the first two quarters, the business sentiments in the manufacturing sector reflected improvements followed by weaker conditions in third quarter. However, the fourth quarter witnessed some reversal with improving business sentiments, which is partly due to seasonality. On an annual basis, the business situation remained better during FY:2014-15 as compared to FY:2013-14.
I. Introduction
The Reserve Bank of India monitors trends in various macroeconomic indicators in the process of formulating the monetary policy in India. However, most of these indicators are available with a time lag. In order to bridge the gap, the Reserve Bank conducts a few forward looking surveys covering corporate and household sectors. With more economic activities coming in the ambit of organised sector and the corporate sector being one of the key sectors in the economy, business sentiment surveys, which capture the sentiments that drive the current and near term business decisions, provide key information inputs for policy formulation. Many other central banks also conduct such business sentiment surveys seeking qualitative information on various business parameters.
In line with international practices, the Reserve Bank has been conducting the Industrial Outlook Survey (IOS) for Indian manufacturing sector on a quarterly basis, since 1998. The survey captures the assessment of business sentiments for the current quarter and expectation for the ensuing quarter, based on qualitative responses on a set of parameters pertaining to the demand conditions, financial conditions, employment conditions and price situation.
* Prepared in the Division of Enterprise Surveys, Department of Statistics and Information Management. Reserve Bank Of India, Mumbai. The latest round of the survey data was released on April 7, 2015 on RBI website and is available at http://rbidocs.rbi.org.in/rdocs/Publications/PDFs/IOSDAS070415.pdf. The survey results are those of the respondents and are not necessarily shared by the Reserve Bank of India.
1 Net Response is the percentage difference between the optimistic (positive) and pessimistic (negative) responses.2 The detailed methodology used for the analysis of survey data was published in the article ‘Quarterly Industrial Outlook Survey: Trends since 2000-01’ in the RBI Monthly Bulletin of October 2009. However, for ready reference, the nine parameters considered for computation of BEI are – (1) overall business situation, (2) production, (3) order books, (4) inventory of raw material, (5) inventory of finished goods, (6) profit margin, (7) employment, (8) exports and (9) capacity utilisation.
Industrial Outlook Survey: 2014-15*

ARTICLE
RBI Bulletin June 201534
Industrial Outlook Survey: 2014-15
On an annual basis, the 4-quarter average3 BEI for 2014-15 stands at 105.7, which was 100.4 in the previous year. The improvement in business situation in the 2014-15, as indicated by BEI is seen across most of the parameters (which constitute BEI), except three, viz., ‘Inventory of raw material’, ‘inventory of fi nished goods’ and ‘exports’. Signifi cant improvements are seen in the parameters ‘overall business situation‘, ‘production’, ‘order books’ and ‘profit margin’(Chart 2).
Generally the index based on expectation remains higher than the index based on assessment. The BEI (outlook/expectation) continued to be above the BEI (assessment) in FY:2014-15; and their gap widened in the third quarter of the year and narrowed down subsequently in Q4. On an annual basis, the 4-quarter average BEI (outlook) stood higher at 114.8 in FY:2014-15 as compared to 111.7 in FY:2013-14.
III. Demand conditions indicate improvement in FY:2014-15
The survey collects perceptions of Indian manufacturers on the demand conditions through various parameters, namely, production, order books, capacity utilisation, level of inventory, exports and imports. In respect of most of the above parameters, outlook during 2014-15 improved as compared to the corresponding position a year ago.
Outlook on production declined in the quarter Q1:2014-15, partly refl ecting seasonality; it improved gradually in the next two quarters and again went down in Q4. The outlook matched the assessment in the fi rst half of the fi nancial year. However, the sentiments appeared to be somewhat opposite in the second half (Chart 3).
The assessment of order book improved in Q1:2014-15 and gradually declined in the next two quarters and again picked-up signifi cantly in the last quarter. Nevertheless, in absolute sense, the net
3 Simple arithmetic average of the net responses of nine business parameters of BEI, over the four quarters of the Financial Year.

ARTICLE
RBI Bulletin June 2015 35
Industrial Outlook Survey: 2014-15
response for production and order books remained in the positive territory throughout the year, which is indicative of sustained growth (Chart 4).
The outlook on capacity utilisation (CU) refl ected similar movement as of production (Chart 5). The net response of capacity utilisation (assessment) also remained in the positive zone throughout the year since Q2:2013-14, when it touched the neutral (zero) level. However, it bounced back signifi cantly in Q4:2013-14. On an annual basis, the CU remained marginally higher in FY:2014-15 from previous year.
Outlook on exports remained range bound during 2014-15 and the assessment showed a gradual decline except for a marginal improvement in Q2:2014-15 (Chart 6). As indicated in the earlier section, this is one of the nine parameters used for the computation of BEI and one of the three parameters, which remained less optimistic in 2014-15 as compared to the previous year on an annual basis.
The outlook on imports continued to fl uctuate during the fi rst three quarters in FY:2014-15 (Chart 7). However, the outlook remained fl at during the last

ARTICLE
RBI Bulletin June 201536
Industrial Outlook Survey: 2014-15
quarter of the year as well as in the fi rst quarter of 2015-16. The assessment of Imports showed a declining trend since Q2:2014-15.
According to the survey, in FY:2014-15 most of the responding fi rms (about 80 per cent) reported ‘average’ in the inventory levels of both raw material and fi nished goods on a quarterly basis. Of the remaining, on annual basis, relatively higher percentage of respondents reported with ‘above average’ level of inventory than those reported ‘below average’ during FY:2014-15. As indicated in the earlier section, both these components of BEI, did not contribute towards the increase of the composite index.
IV. Revival of Financial situation is in a modest pace
The survey assesses the fi nancial situation based on several parameters. In addition to an evaluation of the overall fi nancial situation, responses are obtained specifi cally on availability of fi nance, cost of external fi nance and profi t margin.
The optimism level in the assessment of overall financial situation gradually increased except in Q3:2014-15 when it dipped marginally. However, improvement was observed in the last quarter (Chart 8).
The optimism level in the expectation of overall financial situation continued to be upward since
Q3:2013-14. This happened subsequent to the declining period from Q1:2011-12 to Q3:2013-14. Nevertheless, during these period it remained in the positive territory. The outlook for Q1:2015-16 remains fl at.
As regards availability of fi nance (different sources like, internal accruals, banks/other fi nancial institutions and overseas are covered separately), majority of companies (varying in the range of 65-90 per cent for different sources) reported ‘no change’ in the situation. Based on the remaining responses, the assessment remained optimistic but range bound in the fi rst three quarters of FY:2014-15 and showed some improvement in the last quarter.
Though most of the companies indicated ‘increase’ or ‘no change’ in ‘cost of fi nance’, the sentiment has improved gradually during 2014-15; the outlook for Q1:2015-16 indicated further improvement (Chart 9).
The assessment of ‘profi t margin’ continued to remain negative since Q1:2008-09. During the year, the assessment remained range bound for the fi rst three quarters. However, in the last quarter it improved substantially although it continued to remain in the zone of pessimism (Chart 10). The outlook (expectation) improved substantially in Q3:2014-15 and entered in the zone of optimism, which was not witnessed since Q2:2011-12. The outlook for Q1:2015-16 remained range bound.

ARTICLE
RBI Bulletin June 2015 37
Industrial Outlook Survey: 2014-15
V. Employment and Price Situation
The survey seeks perception of the companies on employment. Generally 70-80 per cent of companies reported ‘no change’ in the employment level on quarter-to-quarter basis and based on the remaining responses the optimism level was the highest in Q4:2014-15. However, the outlook for Q1:2015-16 indicated a reversal in the optimism level.
As regards price situation, the survey elicits current assessment as well as one quarter ahead outlook on cost of raw material and selling prices from the respondent companies. The sentiment on cost of raw material, which improved during the year, extended the trend since Q3:2013-14 (Chart 11).
Although, net response of ‘cost of raw material’ continued to remain pessimistic, the secular (upward) trend indicates that lesser number of companies assessed and expected that cost of raw material would rise. The outlook for Q1:2015-16 indicated further easing in the cost of raw material.
The percentage of respondent reporting ‘decrease’ in the cost of fi nance and cost of raw material has increased gradually during the year. Further, the net response of selling price continued to witness downward trend during the year. The downward trend in selling price was sharper in the assessment than in the expectation (Chart 12).
VI. Conclusion
During the FY:2014-15, the BEI (assessment) showed improvement over FY:2013-14 except in Q3:2014-15. Majority of individual parameters (used for BEI computation) showed improvement during FY:2014-15 over FY:2013-14. In particular, the net responses of production, capacity utilisation and order books showed marked improvement in FY:2014-15 over FY:2013-14. Going forward, BEI (expectation) for Q1:2015-16 indicates no change in the business sentiments.
Improved sentiments on cost of fi nance and cost of raw material were observed during FY:2014-15 along with the declining selling price. The net response of profit margin, although in negative terrain, has improved during FY:2014-15 over the previous year.

ARTICLE
RBI Bulletin June 201538
Industrial Outlook Survey: 2014-15
Table 1: Assessment & Expectation for Production (Percentage responses)@
Year $ Total response
Assessment Expectation
Increase Decrease No change Net response#
Increase Decrease No change Net response#
2009-10 1189 41.8 18.0 40.2 23.7 41.5 14.6 43.9 26.8
2010-11 1395 51.5 11.4 37.1 40.2 51.7 8.2 40.1 43.5
2011-12 1429 44.1 15.8 40.1 28.3 49.5 9.3 41.2 40.2
2012-13 1414 37.7 18.7 43.6 19.1 45.8 10.5 43.7 35.3
2013-14 1216 33.0 20.0 47.0 13.0 40.5 12.0 47.5 28.5
2014-15 1533 35.4 17.2 47.4 18.2 42.2 10.3 47.4 31.9
Q1:2015-16 39.6 10.9 49.5 28.7
‘Increase’ in production is optimistic.@: Due to rounding off percentage may not add up to 100. #: Net Response (NR) is the difference of percentage of the respondents reporting optimism and that reporting pessimism.$: Annual responses are arithmetic mean of quarterly responses.The above footnotes (@, # and $) are applicable for all the tables from 1 to 17.
Table 2: Assessment & Expectation for Order Books(Percentage responses)
Year Total response
Assessment Expectation
Increase Decrease No change Net response Increase Decrease No change Net response
2009-10 1189 37.4 18.0 44.5 19.4 38.7 15.9 45.4 22.8
2010-11 1395 44.7 9.7 45.5 35.0 46.5 6.9 46.5 39.6
2011-12 1429 39.1 16.2 44.8 22.9 44.3 9.5 46.2 34.8
2012-13 1414 32.7 18.7 48.6 14.0 40.4 10.5 49.1 29.9
2013-14 1216 29.7 20.4 49.9 9.3 36.3 12.2 51.5 24.1
2014-15 1533 31.4 16.5 52.0 14.9 38.3 9.7 52.0 28.5
Q1:2015-16 37.8 10.5 51.7 27.3
‘Increase’ in order books is optimistic.
Table 3: Assessment & Expectation for Pending Orders (Percentage responses)
Year Total response
Assessment Expectation
Below Normal
Above Normal
Normal Net response
Below Normal
Above Normal
Normal Net response
2009-10 1189 5.1 20.7 74.2 15.6 4.8 19.6 73.7 14.8
2010-11 1395 7.2 12.6 80.2 5.4 7.3 10.7 82.0 3.5
2011-12 1429 5.4 16.2 78.4 10.7 6.6 12.4 81.0 5.8
2012-13 1414 5.1 18.4 76.4 13.3 5.6 14.2 80.2 8.7
2013-14 1216 4.5 19.1 76.4 14.6 4.9 16.1 79.0 11.2
2014-15 1533 5.1 17.1 77.8 11.9 5.5 12.6 81.9 7.1
Q1:2015-16 6.9 13.1 80.1 6.2
‘Below Normal’ in pending orders is optimistic.
Annex

ARTICLE
RBI Bulletin June 2015 39
Industrial Outlook Survey: 2014-15
Table 4: Assessment & Expectation for Capacity Utilisation (Percentage responses)
Parameter Options Assessment Expectation
2011-12 2012-13 2013-14 2014-15 2011-12 2012-13 2013-14 2014-15
Capacity Utilisation (CU)-(main product)
Increase 28.5 24.2 22.2 23.0 33.1 30.6 26.6 27.8
No Change 56.7 58.7 58.9 60.5 57.6 58.7 61.3 61.6
Decrease 14.8 17.1 18.9 16.5 9.3 10.6 12.1 10.6
Net Response 13.6 7.6 3.4 6.6 20.0 14.5 17.1 17.1
Level of CU (compared to the average in last 4 quarters)
Above normal 12.6 9.8 9.0 9.8 13.5 11.2 10.3 10.2
Normal 71.0 71.4 70.9 71.4 75.6 76.6 74.8 76.5
Below Normal 16.4 18.9 20.0 18.8 10.9 12.3 14.9 13.2
Net Response -3.8 -9.1 -11.0 -9.0 2.5 -1.1 -4.6 -3.0
Assessment of Production Capacity (with regard to expected demand in next 6 months)
More than adequate 11.9 13.3 14.9 13.9 12.2 12.6 14.5 13.0
Adequate 80.3 78.4 77.0 77.2 81.3 80.5 78.1 80.3
Less than adequate 7.8 8.3 8.5 8.4 6.5 6.9 7.4 6.7
Net Response 4.2 4.9 6.0 5.5 5.6 5.7 7.0 6.3
‘Increase’ in capacity utilisation is optimistic.
Table 5: Assessment & Expectation for Exports(Percentage responses)
Year Total response
Assessment Expectation
Increase Decrease No change Net response Increase Decrease No change Net response
2009-10 1189 23.6 22.3 54.1 1.4 24.6 17.3 58.2 7.3
2010-11 1395 31.8 12.5 55.6 19.3 32.4 9.5 58.1 22.9
2011-12 1429 28.8 14.6 56.7 14.2 32.5 9.9 57.6 22.6
2012-13 1414 25.3 15.0 59.7 10.2 29.6 10.2 60.1 19.4
2013-14 1216 25.6 14.6 59.8 10.9 27.9 10.0 62.1 17.8
2014-15 1533 24.8 14.0 61.2 10.9 29.8 8.6 61.5 21.2
Q1:2015-16 27.6 8.1 64.3 19.5
‘Increase’ in exports is optimistic.
Table 6: Assessment & Expectation for Imports (Percentage responses)
Year Total response
Assessment Expectation
Increase Decrease No change Net response Increase Decrease No change Net response
2009-10 1189 21.9 12.8 65.3 9.1 19.2 11.2 69.6 7.9
2010-11 1395 27.7 6.7 65.6 20.9 26.0 5.4 68.6 20.6
2011-12 1429 22.9 8.1 69.0 14.8 24.1 6.5 69.4 17.6
2012-13 1414 20.3 10.7 69.0 9.6 22.1 7.4 70.5 14.7
2013-14 1216 18.8 11.9 69.3 7.0 20.0 9.0 71.0 11.1
2014-15 1533 19.8 9.3 70.9 10.5 19.8 7.0 73.2 12.9
Q1:2015-16 20.3 7.9 71.8 12.4
‘Increase’ in imports is optimistic.

ARTICLE
RBI Bulletin June 201540
Industrial Outlook Survey: 2014-15
Table 7: Assessment & Expectation for level of Inventory (Raw Material and Finished Goods)(Percentage responses)
Parameter Options Assessment Expectation
2011-12 2012-13 2013-14 2014-15 2011-12 2012-13 2013-14 2014-15
Inventory of raw material
Below average 6.9 7.6 8.2 8.1 5.6 5.6 6.0 6.2Average 79.5 80.4 78.9 79.2 84.2 84.3 83.8 84.0Above average 13.6 12.0 13.0 12.7 10.2 10.0 10.2 9.8Net Response 10.2 10.0 10.2 9.8 -4.7 -4.4 -4.2 -3.6
Inventory of fi nished goods
Below average 6.3 7.0 7.6 7.7 5.7 6.4 6.5 6.7Average 78.9 78.6 76.6 76.3 83.9 84.1 82.3 82.6Above average 14.8 14.3 15.8 16.6 10.5 9.5 11.2 10.7Net Response -8.5 -7.3 -8.1 -8.3 -4.8 -3.2 -4.7 -4.0
‘Below average’ in inventory of raw material and fi nished goods is optimistic.
Table 8: Assessment & Expectation for Employment Outlook (Percentage responses)
Year Total response
Assessment Expectation
Increase Decrease No change Net response Increase Decrease No change Net response
2009-10 1189 16.3 10.1 73.6 6.2 14.0 9.7 76.4 4.32010-11 1395 24.0 6.1 70.0 17.9 22.7 4.7 72.5 18.02011-12 1429 21.4 6.9 71.6 14.5 22.0 5.3 72.8 16.72012-13 1414 17.3 9.7 73.0 7.7 19.2 6.6 74.2 12.62013-14 1216 13.7 11.5 74.8 2.2 14.9 8.1 77.0 6.82014-15 1533 15.4 9.0 75.6 6.5 15.8 6.7 77.6 9.1Q1:2015-16 15.8 7.0 77.2 8.8
‘Increase’ in employment is optimistic.
Table 9: Assessment & Expectation for Overall Financial Situation (Percentage responses)
Year Total response
Assessment Expectation
Better Worsen No change Net response Better Worsen No change Net response
2009-10 1189 35.5 11.9 52.6 23.5 36.4 11.1 52.6 25.32010-11 1395 39.1 7.3 53.6 31.7 42.9 5.2 51.9 37.82011-12 1429 30.2 13.8 56.0 16.4 36.7 7.9 55.4 28.92012-13 1414 27.0 14.3 58.7 12.8 34.7 8.6 56.7 26.02013-14 1216 23.3 15.9 60.7 7.4 31.9 10.1 58.0 21.72014-15 1533 27.1 12.9 60.0 14.2 33.7 7.4 58.9 26.3Q1:2015-16 34.3 8.0 57.7 26.3
‘Better’ overall fi nancial situation is optimistic.
Table 10: Assessment & Expectation for Working Capital Finance Requirement (Percentage responses)
Year Total response
Assessment Expectation
Increase Decrease No change Net response Increase Decrease No change Net response
2009-10 1189 39.8 10.9 46.9 26.9 33.7 5.6 60.7 28.22010-11 1395 38.1 4.8 57.0 33.3 36.6 3.7 59.7 32.82011-12 1429 39.2 5.5 55.3 33.7 38.1 4.5 57.4 33.62012-13 1414 36.0 6.2 57.8 29.8 36.0 4.3 59.6 31.72013-14 1216 33.4 7.2 59.4 26.2 33.0 5.8 61.2 27.32014-15 1533 32.5 6.5 61.0 26.1 32.8 5.0 62.2 27.8Q1:2015-16 32.3 5.1 62.6 27.2
‘Increase’ in working capital fi nance is optimistic.

ARTICLE
RBI Bulletin June 2015 41
Industrial Outlook Survey: 2014-15
Table 11: Assessment & Expectation for Availability of Finance (Percentage responses)
Parameter Options Assessment Expectation
2013-14 2014-15 2013-14 2014-15
Availability of fi nance (from internal accruals)
Improve 20.4 23.0 24.6 25.7No Change 67.2 66.2 67.9 67.5Worsen 12.3 10.7 7.5 6.8Net Response 8.1 12.3 17.1 19.0
Availability of Finance(from banks & other sources)
Improve 17.1 19.7 19.0 20.8No Change 74.2 73.1 76.2 24.6Worsen 8.7 7.2 4.8 4.6Net Response 8.4 12.6 14.2 16.2
Availability of Finance (from overseas, if applicable)
Improve 9.8 11.3 10.9 11.8No Change 80.9 83.3 84.4 84.6Worsen 6.3 5.4 4.8 3.6Net Response 3.5 5.9 6.1 8.2
‘Improvement’ in availability of fi nance is optimistic.
Table 12: Assessment & Expectation for Cost of External Finance (Percentage responses)
Year Total response
Assessment Expectation
Decrease Increase No change Net response Decrease Increase No change Net response
2009-10 1189 23.7 8.4 67.9 -15.3 25.1 6.8 68.1 -18.32010-11 1395 36.5 4.9 58.6 -31.7 30.7 4.8 64.5 -25.92011-12 1429 50.2 3.4 46.4 -46.8 42.5 3.8 53.7 -38.62012-13 1414 32.1 7.1 60.9 -25.0 29.7 8.4 61.9 -21.32013-14 1216 33.2 6.4 60.4 -26.8 27.4 7.0 65.6 -20.42014-15 1533 25.7 6.6 67.7 -19.2 23.9 6.1 70.0 -17.8Q1:2015-16 21.8 8.8 69.4 -13.0
‘Decrease’ in cost of external fi nance is optimistic.
Table 13: Assessment & Expectation for Cost of Raw Material (Percentage responses)
Year Total response
Assessment Expectation
Decrease Increase No change Net response Decrease Increase No change Net response
2009-10 1189 51.5 7.7 40.7 -43.8 39.4 7.9 47.3 -31.52010-11 1395 66.7 2.5 30.7 -64.2 52.8 2.6 44.5 -50.22011-12 1429 65.6 4.5 29.9 -61.0 55.9 3.8 40.4 -52.12012-13 1414 60.7 4.0 35.3 -56.7 51.7 3.2 45.2 -48.52013-14 1216 58.9 3.5 37.5 -55.4 50.0 3.3 46.7 -46.72014-15 1533 48.3 6.1 45.6 -42.1 45.0 3.9 51.0 -41.1Q1:2015-16 38.8 6.0 55.2 -32.8
‘Decrease’ in cost of raw material is optimistic.
Table 14: Assessment & Expectation for Selling Price (Percentage responses)
Year Total response
Assessment Expectation
Increase Decrease No change Net response Increase Decrease No change Net response
2009-10 1189 19.9 17.9 62.0 2.0 17.9 16.2 65.9 1.72010-11 1395 30.8 11.4 57.8 19.5 24.8 8.8 66.4 16.02011-12 1429 28.0 14.4 57.6 13.6 27.9 9.7 62.4 18.22012-13 1414 25.6 11.7 62.7 13.8 25.6 7.9 66.5 17.72013-14 1216 22.7 13.7 63.6 9.0 22.7 8.8 68.5 14.02014-15 1533 20.1 13.8 66.1 6.3 21.4 8.0 70.5 13.4Q1:2015-16 19.1 8.8 72.1 10.3
‘Increase’ in selling price is optimistic.

ARTICLE
RBI Bulletin June 201542
Industrial Outlook Survey: 2014-15
Table 15: Assessment & Expectation for Profi t Margin(Percentage responses)
Year Total response
Assessment Expectation
Increase Decrease No change Net response Increase Decrease No change Net response
2009-10 1189 17.5 30.8 51.7 -13.3 18.2 26.6 55.2 -8.4
2010-11 1395 21.2 24.3 54.5 -3.0 23.8 17.8 58.4 5.9
2011-12 1429 16.5 30.4 53.1 -13.9 21.2 20.7 58.1 0.5
2012-13 1414 15.6 31.8 52.6 -16.2 19.9 22.0 58.1 -2.0
2013-14 1216 13.2 33.5 53.3 -20.3 17.7 23.2 59.0 -5.5
2014-15 1533 14.1 28.5 57.4 -14.5 18.3 20.2 61.6 -1.9
Q1:2015-16 18.8 19.3 61.9 -0.5
‘Increase’ in profi t margin is optimistic.
Table 16: Assessment & Expectation for Overall Business Situation (Percentage responses)
Year Total response
Assessment Expectation
Better Worsen No change Net response Better Worsen No change Net response
2009-10 1189 41.6 13.0 45.4 28.7 42.0 12.0 46.0 30.0
2010-11 1395 48.0 7.0 45.0 41.0 50.4 5.4 44.2 45.1
2011-12 1429 37.5 13.6 48.9 23.9 45.1 7.6 47.3 37.5
2012-13 1414 32.7 15.2 52.1 17.5 42.3 8.5 49.1 33.8
2013-14 1216 29.3 17.5 53.3 11.8 39.1 9.9 50.9 29.2
2014-15 1533 33.3 13.1 53.6 20.2 42.2 7.2 50.6 35.0
Q1:2015-16 42.7 6.7 50.6 36.0
‘Better’ Overall Business Situation is optimistic .
Table 17: Assessment & Expectation for Salary/Other Remuneration(Percentage responses)
Year Total response
Assessment Expectation
Better Worsen No change Net response Better Worsen No change Net response
2013-14 1216 29.5 3.5 67.0 26.1 23.9 2.9 73.2 21.0
2014-15 1533 31.1 3.9 65.0 27.2 26.9 3.3 69.8 23.6
Q1:2015-16 27.4 3.9 68.7 23.5
‘Increase in Salary / other remuneration’ is optimistic.
Table 18: Business Expectation Index (BEI)Year BEI-Assessment BEI-Expectation
2009-10 109.5 110.8
2010-11 119.9 122.7
2011-12 112.7 119.9
2012-13 105.3 115.5
2013-14 100.4 111.7
2014-15 105.7 114.8
Q1:2015-16 115.2

ARTICLE
RBI Bulletin June 2015 43
Infl ation Expectations Survey of Households: 2014-15
3 respectively, and current and expected infl ation rates in Block 4.
The qualitative response options for price changes are (i) price increase more than current rate, (ii) price increase similar to current rate, (iii) price increase less than current rate, (iv) no change in prices, and (v) decline in prices. The quantitative response on infl ation rate is collected in terms of specifi ed intervals - the lowest being ‘less than 1 per cent’ and the highest being ‘16 per cent and above’, with size of each intermediate class being 100 basis points.
3. Survey Results
3.1 Movements of Price Expectations for the next Three-Month and the next One-Year periods:
The percentage of respondents, expecting increase in general prices in the next three-month and the next one-year moderated during the fi nancial year 2014-15. These proportions reached a minimum (72.4 per cent and 79.8 per cent respectively) in Q3:2014-15 before moving up marginally in Q4:2014-15. The percentage of respondents, expecting general price to increase by ‘more than current rate’ in the next three-month period decreased from 41.2 per cent in Q1: 2014-15 to 28.3 per cent in Q4:2014-15. Similarly, the said expectations for the next one-year period decreased from 47.4 per cent to 32.9 per cent for the same time horizon.
The cross-tabulation of three-month ahead and one-year ahead general price expectations in the last four survey rounds are presented in Tables 3.1 to 3.4. Out of the respondents expecting ‘price increase more than current rate’ during three-month ahead, majority also expected the same for the next one-year period in all the four survey rounds during the year indicating consistently aligned opinion.
Moderation in price expectations, as refl ected in the decline in percentage of households expecting price increase more than current rate, occurred across all the product groups since Q2:2013-14 (Chart-1). However, the general price expectations are more closely aligned with price expectations on food-product group as
Introduction
The Reserve Bank has been conducting Inflation Expectations Survey of Households (IESH) on a quarterly basis, since September 2005. The survey elicits qualitative and quantitative responses on expected price changes and infl ation for the next three-month period and the next one-year period. Infl ation expectations of households are subjective assessments, based on their individual consumption baskets and therefore, may not match the actual infl ation numbers released periodically by the Government. These infl ation expectations should not be treated as forecast of the offi cial measure of infl ation, though they may indicate the course of infl ation in the near-term.
The quarterly survey results of IESH are released regularly on RBI website. This article presents analysis over a longer horizon covering the last four (36th to 39th) rounds of survey.
2. Sample Coverage and Information Sought
The survey is conducted in 16 cities. The major metropolitan cities, viz., Delhi, Kolkata, Mumbai and Chennai are represented by 500 households each, while another twelve cities, viz., Jaipur, Lucknow, Bhopal, Ahmedabad, Patna, Guwahati, Bengaluru, Hyderabad, Kolhapur, Nagpur, Thiruvananthapuram and Bhubaneswar are represented by 250 households each. Total sample size for this survey is 5,000. The respondents are selected from each city to provide a good geographical coverage and ensuring adequate representation of gender and occupation.
The survey schedule is organized in four blocks covering the respondent profi le in Block 1, general and product group-wise price expectations in Blocks 2 and
* Prepared in the Division of Household Surveys, Department of Statistics and Information Management. Reserve Bank of India, Mumbai. The previous annual article was published in June, 2014 issue of the RBI Bulletin. The survey results are based on replies of the respondents and are not necessarily shared by the Reserve Bank.
Inflation Expectations Survey of Households: 2014-15*

ARTICLE
RBI Bulletin June 201544
Infl ation Expectations Survey of Households: 2014-15
Distribution of households’ responses on infl ation rate is presented in Table 1. It shows that highest proportion of respondents reported infl ation rate as 'more than 16 per cent’ during the fi rst two quarters of 2014-15. Subsequently, the distribution shifted towards the lower rates with higher share of respondents in the range ‘upto 10 per cent’.
compared to other product groups. Comparatively, less number of households expected price to increase more than current rate for ‘household durables’. On the other hand, since Q2:2013-14, highest proportion of households expected price to increase more than current rate for ‘housing prices’. However, this percentage has also declined over time. The trend is similar for both three-month ahead and one-year ahead expectations (Chart 2).
3.2 Respondents’ Current Infl ation Perception vis-à-vis Expectations
In terms of quantitative responses on infl ation rates, the average infl ation perception and expectations (three-month ahead and one-year ahead) remained elevated till Q2:2014-15 and then declined sharply to single digit in the last two quarters (Charts 3). It can be observed that infl ation expectations broadly moved in tandem with the current infl ation perceptions. Also, infl ation expectations have been generally higher than the current perceptions. However, the median infl ation expectations for three-month ahead period was lower than the current perception in Q3:2014-15 and Q4:2014-15 - a phenomenon, last observed in Q4:2013-14.

ARTICLE
RBI Bulletin June 2015 45
Infl ation Expectations Survey of Households: 2014-15
3.3 Identifi cation of Major Sources of Variation
An analysis of variance (ANOVA) revealed that city
has been a signifi cant source of variation for current
infl ation perceptions and infl ation expectations in
every round (Table 4). Other signifi cant sources of
variation were age-group and occupation-category of
the respondents. Age-group was the signifi cant source
of variation for current infl ation perceptions and three-
month ahead infl ation expectations in Q2: 2014-15, whereas occupation-category was the signifi cant source of variation for current infl ation perceptions, three-month and one-year ahead infl ation expectations in Q3:2014-15.
3.4 City-wise Infl ation Expectations
From Charts 4 and 5, it can be seen that in each quarter of the year 2014-15, city-wise expected infl ation

ARTICLE
RBI Bulletin June 201546
Infl ation Expectations Survey of Households: 2014-15
rates varied considerably refl ecting the divergence in consumption and price pattern in each city. Moderation in rate of infl ation expectations during the last two quarters of 2014-15 was well spread across the cities (Charts 4 and 5). Hyderabad recorded the lowest infl ation expectations for both periods of three-month ahead and one-year ahead in Q3:2014-15 whereas Delhi recorded the lowest in Q4:2014-15 (Table 5).
3.5 Occupation-wise Inflation Perceptions and Expectations
Respondents from various occupation categories showed similar trend with respect to inflation perception over the quarters (Chart 6). Generally, retired persons and housewives reported relatively higher infl ation rates whereas others category respondents, mainly unemployed and students, reported relatively lower infl ation rates.
3.6 Bootstrap Confi dence Interval for Estimates of Infl ation Rates
Drawing 10,000 re-samples using Simple Random Sampling with Replacement (SRSWR), the 99 per cent
bootstrap confi dence intervals for mean infl ation are given in Table 6. It is observed that the confi dence interval has a small width indicating that the point estimates are quite precise for estimating the population mean of households’ inflation perceptions and expectations.
4. Conclusions
The median rates of infl ation perceptions and expectations of households moderated to single digit in second half of 2014-15. The moderation is well spread across the cities and occupational categories covered in the survey. The moderation in price expectations was also observed across various product-groups. Among the product-groups, highest proportion of households expected ‘housing prices’ to increase more than current rate whereas lowest proportion was for 'household durables’. The general price expectations are more closely aligned with price expectations on food products as compared to other product groups. City has been a significant source of variation for infl ation perceptions and expectations as observed throughout the survey history.

ARTICLE
RBI Bulletin June 2015 47
Infl ation Expectations Survey of Households: 2014-15
Annex-Data Tables
Table 1. Distribution of Perceived and Expected Infl ation Rates(in per cent)
Infl ation Rate
Current Infl ation Rates Infl ation Expectations Three-month Ahead
Infl ation Expectations One-year Ahead
Q1: 2014-15
Q2: 2014-15
Q3: 2014-15
Q4: 2014-15
Q1: 2014-15
Q2: 2014-15
Q3: 2014-15
Q4: 2014-15
Q1 : 2014-15
Q2: 2014-15
Q3: 2014-15
Q4: 2014-15
<1 0.20 0.16 1.04 0.48 0.67 0.09 1.68 0.89 1.92 0.73 0.80 0.72
1-2 0.41 0.53 1.86 0.80 1.27 1.06 2.42 1.64 0.39 0.40 1.53 1.64
2-3 0.79 0.71 3.74 2.22 1.39 1.61 4.29 2.80 0.75 0.67 3.39 2.92
3-4 0.63 0.75 4.14 3.24 0.87 1.70 4.82 6.02 0.71 0.71 5.45 5.51
4-5 2.62 2.47 6.52 11.33 3.17 3.69 9.57 8.92 1.99 2.07 10.34 7.74
5-6 3.47 3.16 9.60 8.31 3.71 4.08 11.66 8.65 3.17 2.36 11.04 6.18
6-7 2.88 2.15 6.68 7.25 4.00 2.32 7.74 7.16 2.97 1.73 6.75 7.84
7-8 2.56 3.22 9.54 10.07 3.44 3.20 6.12 9.42 3.29 2.20 5.38 9.59
8-9 3.93 2.84 8.26 6.18 3.93 2.47 5.76 9.44 3.47 2.76 6.08 6.33
9-10 9.88 10.54 13.56 16.47 5.50 6.97 7.64 9.21 7.40 7.67 8.20 10.60
10-11 15.47 13.24 12.78 9.63 7.85 7.70 6.82 7.84 8.70 7.05 7.88 7.82
11-12 3.18 2.59 2.56 4.30 4.05 5.21 6.44 5.44 4.59 4.00 4.16 4.19
12-13 3.51 3.69 1.34 1.04 6.24 4.88 4.67 2.37 3.72 3.18 3.53 1.96
13-14 1.52 4.72 0.56 0.60 3.93 2.36 2.02 1.74 2.35 1.96 2.04 1.75
14-15 4.50 6.89 3.38 3.72 4.72 4.35 3.79 3.71 4.52 5.65 4.29 4.90
15-16 6.83 4.34 2.58 3.46 8.14 5.16 3.28 2.45 8.06 6.18 3.78 4.44
>=16 37.62 37.99 11.86 10.89 37.13 43.15 11.28 12.28 42.02 50.67 15.35 15.88
Total 100.0 100.0 100.0 100.0 100.0 100.0 100.0 100.0 100.0 100.0 100.0 100.0
Table 2: Derived Perceived and Expected Infl ation Rates(in per cent)
Survey Round Survey Quarter ended
Current Expectations
Three-month Ahead One-year Ahead
Mean Median Mean Median Mean Median
30 Q3:2012-13 11.0 10.4 11.9 11.9 13.3 14.4
31 Q4:2012-13 10.7 10.3 11.3 11.3 12.5 13.0
32 Q1:2013-14 11.0 10.5 11.7 11.4 12.4 12.7
33 Q2:2013-14 11.8 11.0 12.8 14.5 13.5 16.0
34 Q3:2013-14 12.3 13.2 12.2 13.9 13.5 16.0
35 Q4:2013-14 12.2 13.3 12.3 12.9 13.1 15.3
36 Q1:2014-15 12.6 13.3 12.5 14.0 12.8 15.0
37 Q2:2014-15 12.7 13.8 12.7 14.6 13.5 16.0
38 Q3:2014-15 9.0 8.8 8.8 8.3 9.3 8.9
39 Q4:2014-15 9.1 9.0 9.0 8.5 9.6 9.1
Note: Derived from the distribution observed in Table-1

ARTICLE
RBI Bulletin June 201548
Infl ation Expectations Survey of Households: 2014-15
Table 3.1. Cross-tabulation of General Price Expectations for Three-month Ahead and One-year Ahead (Q1:2014-15: Round 36)
Gen
eral
pri
ce e
xpec
tati
ons
One
-yea
r A
head
General price expectations Three-month Ahead
Price increase
more than current rate
Price increase
similar to current rate
Price increase
less than current rate
No change in price
Decline in price
Total
Price increase more than current rate 32.3 6.3 3.3 4.0 1.6 47.4
Price increase similar to current rate 4.4 11.7 2.8 2.2 0.9 22.0
Price increase less than current rate 1.8 2.0 6.9 2.3 1.2 14.2
No change in price 1.6 0.9 1.0 2.5 1.4 7.4
Decline in price 1.0 0.7 1.0 1.7 4.6 9.0
Total 41.2 21.5 14.8 12.7 9.8 100.0
Table 3.2. Cross-tabulation of General Price Expectations for Three-month Ahead and One-year Ahead (Q2:2014-15: Round 37)
Gen
eral
pri
ce e
xpec
tati
ons
One
-yea
r A
head
General price expectations Three-month Ahead
Price increase
more than current rate
Price increase
similar to current rate
Price increase
less than current rate
No change in price
Decline in price
Total
Price increase more than current rate 33.5 8.7 2.7 2.3 0.9 48.0
Price increase similar to current rate 5.9 15.0 3.3 2.4 0.9 27.4
Price increase less than current rate 2.6 3.0 6.6 1.8 0.5 14.6
No change in price 1.3 1.3 0.7 1.6 0.6 5.5
Decline in price 0.6 0.9 0.4 0.9 1.7 4.5
Total 43.9 28.8 13.7 9.0 4.6 100.0
Table 3.3. Cross-tabulation of General Price Expectations for Three-month Ahead and One-year Ahead (Q3:2014-15: Round 38)
Gen
eral
pri
ce e
xpec
tati
ons
One
-yea
r A
head
General price expectations Three-month Ahead
Price increase
more than current rate
Price increase
similar to current rate
Price increase
less than current rate
No change in price
Decline in price
Total
Price increase more than current rate 18.5 6.3 3.9 2.7 0.8 32.1
Price increase similar to current rate 3.9 16.1 4.2 4.7 1.1 29.9
Price increase less than current rate 1.4 2.7 9.2 3.2 1.3 17.8
No change in price 1.3 1.3 1.8 4.5 2.3 11.2
Decline in price 0.7 0.6 0.7 1.5 5.5 9.0
Total 25.7 27.0 19.8 16.5 11.0 100.0

ARTICLE
RBI Bulletin June 2015 49
Infl ation Expectations Survey of Households: 2014-15
Table 3.4. Cross-tabulation of General Price Expectations for Three-month Ahead and One-year Ahead (Q4:2014-15: Round 39)
Gen
eral
pri
ce e
xpec
tati
ons
One
-yea
r A
head
General price expectations Three-month Ahead
Price increase
more than current rate
Price increase
similar to current rate
Price increase
less than current rate
No change in price
Decline in price
Total
Price increase more than current rate 19.8 5.0 2.4 4.2 1.4 32.9
Price increase similar to current rate 4.6 13.4 5.4 3.4 2.0 28.8
Price increase less than current rate 1.9 2.7 10.8 3.7 1.4 20.6
No change in price 1.5 1.6 1.8 2.8 2.3 10.0
Decline in price 0.5 1.3 0.7 1.4 3.9 7.8
Total 28.3 24.0 21.2 15.4 11.1 100.0
Table 4: ANOVA Results: Factors that Explain the Total Variability
Survey Round Survey Quarter Current Three-month Ahead One-year Ahead
30 Q3:2012-13 City, Age, Category City, Category City, Category, Age
31 Q4:2012-13 City, Category City, Category City, Category, Age
32 Q1:2013-14 City, Category City City
33 Q2:2013-14 City, Age City, Age City
34 Q3:2013-14 City, Gender, Age City, Category City, Category
35 Q4:2013-14 City, Category, Gender, Age City, Category, Gender City, Category, Gender
36 Q1:2014-15 City City City
37 Q2:2014-15 City, Age City, Age City
38 Q3:2014-15 City, Category City, Category City, Category
39 Q4:2014-15 City City City

ARTICLE
RBI Bulletin June 201550
Infl ation Expectations Survey of Households: 2014-15
Table 6: 99% Bootstrap Confi dence Intervals (BCI) based on 10,000 resamples
Survey Round
Survey Quarter
Current Three-month Ahead One-year Ahead
99% BCI for Mean
Interval width 99% BCI for Mean
Interval width 99% BCI for Mean
Interval width
36 Q1:2014-15 (12.41, 12.71) 0.30 (12.31, 12.65) 0.34 (12.65, 12.98) 0.3337 Q2:2014-15 (12.54, 12.83) 0.29 (12.49, 12.82) 0.33 (13.37, 13.67) 0.30
38 Q3:2014-15 (8.81, 9.11) 0.30 (8.64, 8.97) 0.33 (9.11, 9.45) 0.34
39 Q4:2014-15 (8.91, 9.20) 0.29 (8.80, 9.13) 0.33 (9.39, 9.72) 0.33
Table 5: Median Infl ation Perceptions and Expectations
Current Three-month Ahead One-year Ahead
Q1: 2014-15
Q2: 2014-15
Q3: 2014-15
Q4: 2014-15
Q1: 2014-15
Q2: 2014-15
Q3: 2014-15
Q4: 2014-15
Q1 : 2014-15
Q2: 2014-15
Q3: 2014-15
Q4: 2014-15
Ahmadabad 12.9 13.8 9.7 6.9 13.3 15.1 9.4 7.4 14.4 15.8 10.1 8.4
Bengaluru 9.0 9.1 4.8 5.3 6.5 6.7 5.3 7.3 10.4 9.4 4.6 7.1
Bhopal 10.3 9.7 9.7 9.1 12.1 10.9 11.6 9.7 12.3 14.2 12.2 10.0
Bhubaneswar 10.7 11.0 9.4 9.3 9.9 12.2 11.0 8.3 11.8 14.5 10.9 8.4
Chennai 16.2 15.5 8.9 8.6 16.3 16.0 5.9 7.7 16.3 16.1 6.8 8.2
Delhi 14.1 15.5 6.0 5.4 15.7 16.1 7.2 5.3 16.1 16.2 6.5 4.8
Guwahati 16.2 16.3 8.3 9.9 16.2 16.4 6.0 11.0 16.1 16.4 6.5 10.5
Hyderabad 10.0 10.4 3.3 9.5 12.0 12.0 3.9 8.5 12.0 14.3 3.9 8.9
Jaipur 14.2 11.6 9.4 8.0 11.4 13.7 6.3 8.6 14.1 15.7 9.0 9.2
Kolhapur 16.1 13.9 8.7 11.6 16.1 16.1 8.2 10.4 16.0 16.0 7.4 11.8
Kolkata 16 15.4 9.6 10.4 16.1 15.6 8.9 9.8 16.1 16.2 9.7 11.1
Lucknow 16.4 16.2 9.8 7.9 16.3 16.3 11.0 10.1 16.2 16.3 10.8 9.6
Mumbai 9.7 10.8 9.7 8.0 8.9 10.6 9.0 7.9 9.3 10.8 9.7 7.2
Nagpur 16.2 16.2 5.7 11.3 16.2 16.4 6.7 10.3 16.3 16.4 6.0 11.8
Patna 10.7 10.5 8.8 9.2 12.7 11.9 9.9 10.2 11.2 13.4 10.2 10.6
Thiruvananthapuram 16.2 16.1 9.9 8.1 10.9 14.5 11.0 5.4 16.3 16.3 11.8 9.5

CURRENT STATISTICS
Select Economic Indicators
Reserve Bank of India
Money and Banking
Prices and Production
Government Accounts and Treasury Bills
Financial Markets
External Sector
Payment and Settlement Systems
Occasional Series


CURRENT STATISTICS
RBI Bulletin June 2015 51
No. Title Page
1 Select Economic Indicators 53
Reserve Bank of India
2 RBI – Liabilities and Assets 54
3 Liquidity Operations by RBI 55
4 Sale/ Purchase of U.S. Dollar by the RBI 55
4A Maturity Breakdown (by Residual Maturity) of Outstanding Forwards of RBI (US$ Million) 56
5 RBI's Standing Facilities 56
Money and Banking
6 Money Stock Measures 57
7 Sources of Money Stock (M3) 58
8 Monetary Survey 59
9 Liquidity Aggregates 59
10 Reserve Bank of India Survey 60
11 Reserve Money – Components and Sources 60
12 Commercial Bank Survey 61
13 Scheduled Commercial Banks' Investments 61
14 Business in India – All Scheduled Banks and All Scheduled Commercial Banks 62
15 Deployment of Gross Bank Credit by Major Sectors 63
16 Industry-wise Deployment of Gross Bank Credit 64
17 State Co-operative Banks Maintaining Accounts with the Reserve Bank of India 65
Prices and Production
18 Consumer Price Index (Base: 2010=100) 66
19 Other Consumer Price Indices 66
20 Monthly Average Price of Gold and Silver in Mumbai 66
21 Wholesale Price Index 67
22 Index of Industrial Production (Base: 2004-05=100) 69
Government Accounts and Treasury Bills
23 Union Government Accounts at a Glance 69
24 Treasury Bills – Ownership Pattern 70
25 Auctions of Treasury Bills 70
Financial Markets
26 Daily Call Money Rates 71
27 Certificates of Deposit 72
28 Commercial Paper 72
29 Average Daily Turnover in Select Financial Markets 72
30 New Capital Issues by Non-Government Public Limited Companies 73
Contents

CURRENT STATISTICS
RBI Bulletin June 201552
No. Title Page
External Sector
31 Foreign Trade 74
32 Foreign Exchange Reserves 74
33 NRI Deposits 74
34 Foreign Investment Inflows 75
35 Outward Remittances under the Liberalised Remittance Scheme (LRS) for Resident Individuals 75
36 Indices of Real Effective Exchange Rate (REER) and Nominal Effective Exchange Rate (NEER) of the Indian Rupee
76
37 External Commercial Borrowings (ECBs) 76
38 India’s Overall Balance of Payments (US $ Million) 77
39 India's Overall Balance of Payments (` Billion) 78
40 Standard Presentation of BoP in India as per BPM6 (US $ Million) 79
41 Standard Presentation of BoP in India as per BPM6 (` Billion) 80
42 International Investment Position 81
Payment and Settlement Systems
43 Payment System Indicators 82
Occasional Series
44 Small Savings 83
45 Ownership Pattern of Government of India Dated Securities (Face Value) 84
46 Combined Receipts and Disbursements of the Central and State Governments 85
Notes: .. = Not available. – = Nil/Negligible. P = Preliminary/Provisional. PR = Partially Revised.

CURRENT STATISTICS
RBI Bulletin June 2015 53
Item2014-15
11 Real Sector (% Change) 1.1 GDP 7.2 1.1.1 Agriculture 0.2 1.1.2 Industry 6.6 1.1.3 Services 9.4 1.1a Final Consumption Expenditure 6.4 1.1b Gross Fixed Capital Formation 4.6
2014-15
1 1.2 Index of Industrial Production 2.22 Money and Banking (% Change) 2.1 Scheduled Commercial Banks 2.1.1 Deposits 11.4 2.1.2 Credit 9.5 2.1.2.1 Non-food Credit 9.7 2.1.3 Investment in Govt. Securities 13.2 2.2 Money Stock Measures 2.2.1 Reserve Money (M0) 11.3 2.2.2 Broad Money (M3) 11.13 Ratios (%) 3.1 Cash Reserve Ratio 4.00 3.2 Statutory Liquidity Ratio 21.50 3.3 Cash-Deposit Ratio 5.0 3.4 Credit-Deposit Ratio 76.5 3.5 Incremental Credit-Deposit Ratio 64.8 3.6 Investment-Deposit Ratio 29.2 3.7 Incremental Investment-Deposit Ratio 33.24 Interest Rates (%) 4.1 Policy Repo Rate 7.50 4.2 Reverse Repo Rate 6.50 4.3 Marginal Standing Facility (MSF) Rate 8.50 4.4 Bank Rate 8.50 4.5 Base Rate 10.00/10.25 4.6 Term Deposit Rate >1 Year 8.00/8.75 4.7 Savings Deposit Rate 4.00 4.8 Call Money Rate (Weighted Average) 7.36 4.9 91-Day Treasury Bill (Primary) Yield 8.27 4.10 182-Day Treasury Bill (Primary) Yield 8.14 4.11 364-Day Treasury Bill (Primary) Yield 7.98 4.12 10-Year Government Securities Yield 7.805 RBI Reference Rate and Forward Premia 5.1 INR-US$ Spot Rate (` Per Foreign Currency) 62.59 5.2 INR-Euro Spot Rate (` Per Foreign Currency) 67.51 5.3 Forward Premia of US$ 1-month (%) 9.78 3-month (%) 8.50 6-month (%) 8.116 Inflation (%) 6.1 All India Consumer Price Index 5.5 6.2 Consumer Price Index for Industrial Workers 6.9 6.3 Wholesale Price Index 1.5 6.3.1 Primary Articles 3.1 6.3.2 Fuel and Power -2.9 6.3.3 Manufactured Products 2.27 Foreign Trade (% Change) 7.1 Imports 0.3 7.2 Exports -2.8
No. 1: Select Economic Indicators
2013-14 2014-15
Q3 Q4 Q3 Q4
2 3 4 5
6.6 5.3 6.8 6.13.8 4.4 -1.1 -1.45.5 5.5 3.8 7.28.3 5.6 11.1 8.05.4 4.7 7.1 5.55.3 -1.4 2.4 4.1
2014 2015Mar. Apr. Mar. Apr.
2 3 4 5-0.5 3.7 2.1 ..
14.2 14.7 11.4 11.814.0 13.8 9.5 9.814.2 14.2 9.8 10.110.3 12.6 13.2 14.0
14.4 8.9 11.3 11.48.3 11.4 11.1 11.0
4.00 4.00 4.00 4.00
23.00 23.00 21.50 21.504.7 4.9 5.0 4.9
77.8 76.8 76.5 75.476.8 15.2 64.8 29.228.7 28.9 29.2 29.521.6 41.1 33.2 40.3
8.00 8.00 7.50 7.507.00 7.00 6.50 6.509.00 9.00 8.50 8.509.00 9.00 8.50 8.50
10.00/10.25 10.00/10.25 10.00/10.25 9.75/10.258.00/9.25 8.00/9.25 8.00/8.75 8.00/8.50
4.00 4.00 4.00 4.008.59 8.46 7.36 7.518.86 8.86 8.27 7.948.86 8.90 8.14 7.908.96 8.92 7.98 7.918.84 8.89 7.80 7.89
60.10 60.34 62.59 63.4082.58 83.31 67.51 68.49
9.78 8.34 9.78 7.678.79 8.38 8.50 7.518.95 8.21 8.11 7.44
8.3 8.6 5.3 4.96.7 7.1 6.3 5.86.0 5.6 -2.3 -2.77.3 7.0 0.1 -0.3
11.8 9.3 -12.6 -13.03.7 3.7 -0.2 -0.5
0.9 -14.1 -13.5 -7.5
-0.7 4.5 -21.3 -14.0

CURRENT STATISTICS
RBI Bulletin June 201554
No. 2: RBI - Liabilities and Assets
(` Billion)
Last Friday/ Friday2014 2015
May Apr. 24 May 8 May 15 May 22 May 29
2 3 4 5 6 7
1 Issue Department
1 Liabilities
101 1.1.1 Notes in Circulation13,480.32 14,727.51 14,963.62 15,052.83 15,004.81 14,918.94
102 1.1.2 Notes held in Banking Department0.12 0.12 0.14 0.13 0.11 0.13
103 1.1/1.2 Total Liabilities (Total Notes Issued) or Assets13,480.45 14,727.63 14,963.75 15,052.96 15,004.92 14,919.07
2 Assets
104 1.2.1 Gold Coin and Bullion662.88 624.40 644.17 644.17 644.17 644.17
105 1.2.2 Foreign Securities12,805.27 14,090.03 14,307.31 14,397.01 14,349.52 14,262.20
106 1.2.3 Rupee Coin 1.84 2.73 1.81 1.31 0.76 2.23
107 1.2.4 Government of India Rupee Securities10.46 10.46 10.46 10.46 10.46 10.46
2 Banking Department
1 Liabilities
108 2.1.1 Deposits3,712.07 5,183.32 5,281.44 5,202.25 5,224.94 5,276.19
109 2.1.1.1 Central Government1.01 1.00 1.00 1.01 1.01 1.01
110 2.1.1.2 Market Stabilisation Scheme– – – – – –
111 2.1.1.3 State Governments0.43 0.42 0.42 0.42 0.42 0.42
112 2.1.1.4 Scheduled Commercial Banks3,344.67 3,732.24 3,541.58 3,605.23 3,616.32 3,708.87
113 2.1.1.5 Scheduled State Co-operative Banks34.82 32.55 33.14 33.00 32.74 32.72
114 2.1.1.6 Non-Scheduled State Co-operative Banks4.98 11.91 11.77 11.69 11.64 11.92
115 2.1.1.7 Other Banks168.81 189.14 187.54 186.90 185.85 187.60
116 2.1.1.8 Others157.36 1,216.05 1,505.98 1,363.99 1,376.96 1,333.64
117 2.1.2 Other Liabilities8,278.70 8,361.76 8,756.46 8,773.41 8,571.30 8,555.48
118 2.1/2.2 Total Liabilities or Assets11,990.77 13,545.08 14,037.90 13,975.65 13,796.23 13,831.66
2 Assets
119 2.2.1 Notes and Coins0.12 0.12 0.14 0.13 0.11 0.13
120 2.2.2 Balances held Abroad4,151.78 6,417.18 6,878.27 6,754.11 6,653.87 6,860.09
121 2.2.3 Loans and Advances
122 2.2.3.1 Central Government147.04 – – – – –
123 2.2.3.2 State Governments 4.10 17.33 9.23 13.68 6.79 3.50
124 2.2.3.3 Scheduled Commercial Banks312.50 1,130.90 1,165.27 1,212.19 1,139.43 967.66
125 2.2.3.4 Scheduled State Co-op.Banks0.35 – 0.35 – – –
126 2.2.3.5 Industrial Dev. Bank of India– – – – – –
127 2.2.3.6 NABARD– – – – – –
128 2.2.3.7 EXIM Bank– – – – – –
129 2.2.3.8 Others71.63 52.58 40.91 49.43 49.16 51.70
2.2.4 Bills Purchased and Discounted
130 2.2.4.1 Internal– – – – – –
131 2.2.4.2 Government Treasury Bills– – – – – –
132 2.2.5 Investments6,553.39 5,216.19 5,212.83 5,212.87 5,212.66 5,212.63
133 2.2.6 Other Assets 749.86 710.78 730.91 733.23 734.21 735.95
134 2.2.6.1 Gold602.14 567.20 585.15 585.15 585.15 585.15
Item
2014-15
1
1 Issue Department
1.1 Liabilities
1.1.1 Notes in Circulation 14,264.95
1.1.2 Notes held in Banking Department 0.12
1.1/1.2 Total Liabilities (Total Notes Issued) or Assets 14,265.06
1.2 Assets
1.2.1 Gold Coin and Bullion 642.29
1.2.2 Foreign Securities 13,609.92
1.2.3 Rupee Coin 2.38
1.2.4 Government of India Rupee Securities 10.46
2 Banking Department
2.1 Liabilities
2.1.1 Deposits 5,953.69
2.1.1.1 Central Government 1.01
2.1.1.2 Market Stabilisation Scheme –
2.1.1.3 State Governments 21.40
2.1.1.4 Scheduled Commercial Banks 3,573.56
2.1.1.5 Scheduled State Co-operative Banks 35.10
2.1.1.6 Non-Scheduled State Co-operative Banks 11.24
2.1.1.7 Other Banks 189.63
2.1.1.8 Others 2,121.76
2.1.2 Other Liabilities 8,002.15
2.1/2.2 Total Liabilities or Assets 13,955.84
2.2 Assets
2.2.1 Notes and Coins 0.12
2.2.2 Balances held Abroad 6,408.77
2.2.3 Loans and Advances
2.2.3.1 Central Government –
2.2.3.2 State Governments 57.60
2.2.3.3 Scheduled Commercial Banks 1,403.93
2.2.3.4 Scheduled State Co-op.Banks –
2.2.3.5 Industrial Dev. Bank of India –
2.2.3.6 NABARD –
2.2.3.7 EXIM Bank –
2.2.3.8 Others 107.73
2.2.4 Bills Purchased and Discounted
2.2.4.1 Internal –
2.2.4.2 Government Treasury Bills –
2.2.5 Investments 5,260.32
2.2.6 Other Assets 717.38
2.2.6.1 Gold 583.45
As on the Last Friday/ Friday
Reserve Bank of India

CURRENT STATISTICS
RBI Bulletin June 2015 55
2014 2015
Apr. Mar. Apr.
2 3 4
5,870.00 7,671.00 5,431.00
7,850.00 10,651.00 9,756.00
1,980.00 2,980.00 4,325.00
366.41 481.28 346.36
5,870.00 56,882.00 5,431.00
366.41 3,430.69 346.36
–32,062.00 8,322.00 5,172.00
No. 4: Sale/ Purchase of U.S. Dollar by the RBI
Item2014-15
1
1 Net Purchase/ Sale of Foreign Currency (US$ Million) (1.1–1.2) 56,882.00
1.1 Purchase (+) 126,604.00
1.2 Sale (–) 69,722.00
2 ` equivalent at contract rate ( ` Billion) 3,430.69
3 Cumulative (over end-March) (US $ Million) 56,882.00
( ` Billion) 3,430.69
4 Outstanding Net Forward Sales (–)/ Purchase (+) at the end of month (US$ Million)
8,322.00
No. 3: Liquidity Operations by RBI
(` Billion)
Date Liquidity Adjustment Facility
MSFStandingLiquidityFacilities
OMO (Outright) Net Injection (+)/Absorption (-)
(1+3+5+6+8-2-4-7)
Repo ReverseRepo
TermRepo/
OvernightVariable
Rate Repo
TermReverseRepo/
OvernightVariable
Rate ReverseRepo
Sale Purchase
1 2 3 4 5 6 7 8 9Apr. 1, 2015 – – – – – – – – –Apr. 2, 2015 – 1,014.93 – – 2.25 – – – –1,012.68Apr. 4, 2015 – 108.78 – – 22.50 – – – –86.28Apr. 6, 2015 12.67 421.90 – 503.63 9.00 –0.50 – – –904.36Apr. 7, 2015 17.17 228.98 155.02 396.64 0.90 – 6.00 – –458.53Apr. 8, 2015 19.29 37.02 – 184.84 19.49 –3.34 2.30 – –188.72Apr. 9, 2015 61.31 30.47 – 97.06 2.50 – 1.55 – –65.27Apr. 10, 2015 55.88 40.03 155.04 – 26.31 – 5.70 – 191.50Apr. 11, 2015 – 45.22 – – – – – – –45.22Apr. 13, 2015 81.49 25.28 150.06 3.76 3.30 –3.00 2.55 – 200.26Apr. 15, 2015 119.67 28.07 84.70 – 33.70 –0.39 3.00 – 206.61Apr. 16, 2015 157.48 59.15 – – – – 2.05 – 96.28Apr. 17, 2015 189.62 143.45 235.08 – 2.15 0.19 2.55 – 281.04Apr. 18, 2015 – 9.41 – – 28.30 – – – 18.89Apr. 20, 2015 201.64 31.38 100.05 – 2.62 – 4.30 – 268.63Apr. 21, 2015 192.24 46.39 247.04 – 0.42 – 3.00 – 390.31Apr. 22, 2015 51.36 58.56 100.04 – 1.45 –3.39 5.00 – 85.90Apr. 23, 2015 141.47 116.12 – – 74.43 1.45 3.90 – 97.33Apr. 24, 2015 210.89 80.47 176.75 – – –0.70 3.40 – 303.07Apr. 25, 2015 – 64.22 – – – – – – –64.22Apr. 27, 2015 193.69 135.12 100.02 – 3.30 –0.50 – – 161.39Apr. 28, 2015 195.71 115.99 180.78 – 2.25 –2.03 – – 260.72Apr. 29, 2015 188.38 136.78 86.90 – 1.00 –0.90 – – 138.60Apr. 30, 2015 190.28 64.49 365.06 – 28.50 1.47 – – 520.82

CURRENT STATISTICS
RBI Bulletin June 201556
No. 5: RBI's Standing Facilities
Item
2014-15
1
1 MSF 41.9
2 Export Credit Refinance for Scheduled Banks
2.1 Limit 128.2
2.2 Outstanding 51.8
3 Liquidity Facility for PDs
3.1 Limit 28.0
3.2 Outstanding 17.0
4 Others
4.1 Limit –
4.2 Outstanding –
5 Total Outstanding (1+2.2+3.2+4.2) 110.7
(` Billion)
2014 2015
Apr. 18 Dec. 26 Jan. 23 Feb. 20 Mar. 20 Apr. 17 May 29
2 3 4 5 6 7 8
15.7 33.3 14.2 0.9 41.9 2.2 13.1
572.4 129.6 129.0 131.0 128.2 127.1 127.1
312.9 68.4 69.4 56.8 51.8 45.5 39.9
28.0 28.0 28.0 28.0 28.0 28.0 28.0
26.7 17.1 18.8 19.8 17.0 20.6 20.6
– – – – – – –
– – – – – – –
355.3 118.8 102.4 77.5 110.7 68.3 73.5
As on the Last Reporting Friday
Item As on April 30, 2015
Long (+) Short (-) Net (1-2)
1 2 3
1. Upto 1 month 3,660 610 3,050
2. More than 1 month and upto 3 months 7,670 530 7,140
3. More than 3 months and upto 1 year 23,132 2,181 20,951
4. More than 1 year 0 25,969 -25,969
Total (1+2+3+4) 34,462 29,290 5,172
No. 4 A : Maturity Breakdown (by Residual Maturity) of Outstanding Forwards of RBI (US$ Million)

CURRENT STATISTICS
RBI Bulletin June 2015 57
Money and Banking
Item
2014-15 2014 2015
Apr. 18 Mar. 20 Apr. 3 Apr. 17
1 2 3 4 5
1 Currency with the Public (1.1 + 1.2 + 1.3 – 1.4) 13,869.9 12,909.3 13,870.1 13,884.9 14,318.3
1.1 Notes in Circulation 14,288.8 13,276.1 14,289.1 14,293.5 14,746.0
1.2 Circulation of Rupee Coin 187.0 167.4 187.0 187.0 187.0
1.3 Circulation of Small Coins 7.4 7.4 7.4 7.4 7.4
1.4 Cash on Hand with Banks 613.4 541.6 613.4 603.1 622.2
2 Deposit Money of the Public 9,109.3 8,296.9 9,053.1 10,352.5 9,073.0
2.1 Demand Deposits with Banks 8,963.5 8,273.5 8,963.5 10,459.8 8,977.7
2.2 ‘Other’ Deposits with Reserve Bank 145.9 23.4 89.6 -107.3 95.4
3 M (1 + 2) 22,979.2 21,206.2 22,923.2 24,237.4 23,391.3
4 Post Office Saving Bank Deposits 467.0 435.1 467.0 467.0 467.0
5 M (3 + 4) 23,446.2 21,641.2 23,390.2 24,704.4 23,858.3
6 Time Deposits with Banks 82,777.5 75,668.7 82,777.5 84,564.2 84,139.6
7 M (3 + 6) 105,756.8 96,874.9 105,700.7 108,801.6 107,530.9
8 Total Post Office Deposits 1,729.2 1,594.2 1,729.2 1,729.2 1,729.2
9 M (7 + 8) 107,485.9 98,469.1 107,429.9 110,530.8 109,260.1
No. 6: Money Stock Measures
(` Billion)
Outstanding as on March 31/last reporting Fridays of the month/reporting Fridays
1
2
3
4

CURRENT STATISTICS
RBI Bulletin June 201558
No. 7: Sources of Money Stock (M )
Sources
2014-15 2014 2015
Apr. 18 Mar. 20 Apr. 3 Apr. 17
1 2 3 4 5
1 Net Bank Credit to Government 30,151.2 30,550.7 30,057.1 30,647.9 31,706.9
1.1 RBI’s net credit to Government (1.1.1–1.1.2) 3,734.1 6,568.8 3,640.0 3,782.7 4,549.2
1.1.1 Claims on Government 5,307.3 6,570.6 5,295.3 5,266.3 5,237.9
1.1.1.1 Central Government 5,258.3 6,551.1 5,260.4 5,258.3 5,233.2
1.1.1.2 State Governments 49.0 19.4 34.8 7.9 4.7
1.1.2 Government deposits with RBI 1,573.3 1.8 1,655.3 1,483.5 688.7
1.1.2.1 Central Government 1,572.8 1.0 1,630.7 1,475.4 688.3
1.1.2.2 State Governments 0.4 0.8 24.6 8.1 0.4
1.2 Other Banks’ Credit to Government 26,417.1 23,981.9 26,417.1 26,865.2 27,157.6
2 Bank Credit to Commercial Sector 70,558.0 64,688.0 70,464.2 73,241.7 70,875.0
2.1 RBI’s credit to commercial sector 148.5 89.9 54.6 148.5 63.8
2.2 Other banks’ credit to commercial sector 70,409.6 64,598.1 70,409.6 73,093.3 70,811.2
2.2.1 Bank credit by commercial banks 65,646.8 60,130.4 65,646.8 68,309.6 66,039.2
2.2.2 Bank credit by co-operative banks 4,710.3 4,414.2 4,710.3 4,735.9 4,724.4
2.2.3 Investments by commercial and co-operative banks in other securities 52.5 53.4 52.5 47.7 47.6
3 Net Foreign Exchange Assets of Banking Sector (3.1 + 3.2) 22,021.1 19,630.3 21,840.5 22,104.6 22,045.1
3.1 RBI’s net foreign exchange assets (3.1.1–3.1.2) 21,272.8 18,416.1 21,092.2 21,356.2 21,296.8
3.1.1 Gross foreign assets 21,273.0 18,416.4 21,092.4 21,356.5 21,297.0
3.1.2 Foreign liabilities 0.2 0.3 0.2 0.2 0.2
3.2 Other banks’ net foreign exchange assets 748.3 1,214.2 748.3 748.3 748.3
4 Government’s Currency Liabilities to the Public 194.4 174.7 194.4 194.4 194.4
5 Banking Sector’s Net Non-monetary Liabilities 17,168.0 18,168.8 16,855.5 17,387.0 17,290.5
5.1 Net non-monetary liabilities of RBI 7,941.6 8,625.2 7,972.4 8,024.9 7,996.0
5.2 Net non-monetary liabilities of other banks (residual) 9,226.4 9,543.6 8,883.2 9,362.1 9,294.5
M (1+2+3+4–5) 105,756.8 96,874.9 105,700.7 108,801.6 107,530.9
(` Billion)
Outstanding as on March 31/last reporting Fridays of the month/reporting Fridays
3
3

CURRENT STATISTICS
RBI Bulletin June 2015 59
No. 8: Monetary Survey
Item
2014-15 2014 2015Apr. 18 Mar. 20 Apr. 3 Apr. 17
1 2 3 4 5Monetary AggregatesNM1 (1.1 + 1.2.1+1.3) 22,979.2 21,206.2 22,923.2 24,237.4 23,391.3NM (NM + 1.2.2.1) 59,021.3 54,109.1 58,965.3 61,081.5 60,051.5NM (NM + 1.2.2.2 + 1.4 = 2.1 + 2.2 + 2.3 – 2.4 – 2.5) 105,331.5 96,488.6 105,275.4 108,419.1 107,062.81 Components1.1 Currency with the Public 13,869.9 12,909.3 13,870.1 13,884.9 14,318.31.2 Aggregate Deposits of Residents 89,057.0 81,391.1 89,057.0 92,335.6 90,444.7 1.2.1 Demand Deposits 8,963.5 8,273.5 8,963.5 10,459.8 8,977.7 1.2.2 Time Deposits of Residents 80,093.5 73,117.6 80,093.5 81,875.8 81,467.1 1.2.2.1 Short-term Time Deposits 36,042.1 32,902.9 36,042.1 36,844.1 36,660.2 1.2.2.1.1 Certificates of Deposit (CDs) 2,974.5 3,865.2 2,974.5 3,234.9 2,967.7 1.2.2.2 Long-term Time Deposits 44,051.5 40,214.7 44,051.5 45,031.7 44,806.91.3 ‘Other’ Deposits with RBI 145.9 23.4 89.6 –107.3 95.41.4 Call/Term Funding from Financial Institutions 2,258.7 2,164.8 2,258.7 2,306.0 2,204.52 Sources2.1 Domestic Credit 105,399.2 99,577.3 105,207.7 108,323.0 107,391.1 2.1.1 Net Bank Credit to the Government 30,151.2 30,550.7 30,057.1 30,647.9 31,706.9 2.1.1.1 Net RBI credit to the Government 3,734.1 6,568.8 3,640.0 3,782.7 4,549.2 2.1.1.2 Credit to the Government by the Banking System 26,417.1 23,981.9 26,417.1 26,865.2 27,157.6 2.1.2 Bank Credit to the Commercial Sector 75,248.0 69,026.6 75,150.6 77,675.1 75,684.2 2.1.2.1 RBI Credit to the Commercial Sector 148.5 89.9 54.6 148.5 63.8 2.1.2.2 Credit to the Commercial Sector by the Banking System 75,099.6 68,936.7 75,096.0 77,526.7 75,620.5 2.1.2.2.1 Other Investments (Non-SLR Securities) 4,653.3 4,318.5 4,653.3 4,396.6 4,756.82.2 Government’s Currency Liabilities to the Public 194.4 174.7 194.4 194.4 194.42.3 Net Foreign Exchange Assets of the Banking Sector 19,441.0 16,314.4 19,260.4 19,071.4 19,474.2 2.3.1 Net Foreign Exchange Assets of the RBI 21,272.8 18,416.1 21,092.2 21,356.2 21,296.8 2.3.2 Net Foreign Currency Assets of the Banking System –1,831.8 –2,101.6 –1,831.8 –2,284.8 –1,822.62.4 Capital Account 16,773.5 16,142.8 16,773.5 16,788.8 16,892.12.5 Other items (net) 2,929.6 3,435.1 2,613.6 2,381.0 3,104.7
(` Billion)
Outstanding as on March 31/last reporting Fridays of themonth/reporting Fridays
12
3
1
2
No. 9: Liquidity Aggregates(` Billion)
Aggregates 2014-15 2014 2015Apr. Feb. Mar. Apr.
1 2 3 4 51 NM 105,331.5 96,488.6 104,006.9 105,331.5 107,062.8
2 Postal Deposits 1,729.2 1,594.2 1,716.1 1,729.2 1,729.23 L ( 1 + 2) 107,060.7 98,082.8 105,723.0 107,060.7 108,792.0
4 Liabilities of Financial Institutions 29.3 29.3 29.3 29.3 29.3 4.1 Term Money Borrowings 26.6 26.6 26.6 26.6 26.6 4.2 Certificates of Deposit 0.3 0.3 0.3 0.3 0.3 4.3 Term Deposits 2.5 2.5 2.5 2.5 2.55 L (3 + 4) 107,090.0 98,112.1 105,752.3 107,090.0 108,821.3
6 Public Deposits with Non-Banking Financial Companies 251.3 .. .. 251.3 ..7 L (5 + 6) 107,341.3 .. .. 107,341.3 ..
1
2
3
3

CURRENT STATISTICS
RBI Bulletin June 201560
No. 10: Reserve Bank of India Survey
Item
2014-15 2014 2015Apr. 18 Mar. 20 Apr. 3 Apr. 17
1 2 3 4 51 Components1.1 Currency in Circulation 14,483.2 13,450.9 14,483.5 14,487.9 14,940.41.2 Bankers’ Deposits with the RBI 4,655.6 3,470.4 3,959.0 3,940.2 3,831.4 1.2.1 Scheduled Commercial Banks 4,396.7 3,266.2 3,730.7 3,682.0 3,598.61.3 ‘Other’ Deposits with the RBI 145.9 23.4 89.6 -107.3 95.4Reserve Money (1.1 + 1.2 + 1.3 = 2.1 + 2.2 + 2.3 – 2.4 – 2.5) 19,284.7 16,944.7 18,532.1 18,320.9 18,867.22 Sources2.1 RBI’s Domestic Credit 5,759.1 6,979.1 5,217.9 4,795.1 5,372.0 2.1.1 Net RBI credit to the Government 3,734.1 6,568.8 3,640.0 3,782.7 4,549.2 2.1.1.1 Net RBI credit to the Central Government (2.1.1.1.1 + 2.1.1.1.2 + 2.1.1.1.3 + 2.1.1.1.4 – 2.1.1.1.5) 3,685.5 6,550.1 3,629.8 3,782.9 4,544.9
2.1.1.1.1 Loans and Advances to the Central Government – – – – – 2.1.1.1.2 Investments in Treasury Bills – – – – – 2.1.1.1.3 Investments in dated Government Securities 5,256.2 6,548.6 5,257.6 5,256.2 5,231.9 2.1.1.1.3.1 Central Government Securities 5,245.7 6,538.1 5,247.1 5,245.7 5,221.5 2.1.1.1.4 Rupee Coins 2.2 2.5 2.8 2.2 1.3 2.1.1.1.5 Deposits of the Central Government 1,572.8 1.0 1,630.7 1,475.4 688.3 2.1.1.2 Net RBI credit to State Governments 48.6 18.6 10.3 -0.2 4.3 2.1.2 RBI’s Claims on Banks 1,876.6 320.4 1,523.2 863.9 759.0 2.1.2.1 Loans and Advances to Scheduled Commercial Banks 1,876.1 318.7 1,522.8 863.4 758.6 2.1.3 RBI’s Credit to Commercial Sector 148.5 89.9 54.6 148.5 63.8 2.1.3.1 Loans and Advances to Primary Dealers 24.1 26.7 17.0 24.1 20.6 2.1.3.2 Loans and Advances to NABARD – – – – –2.2 Government’s Currency Liabilities to the Public 194.4 174.7 194.4 194.4 194.42.3 Net Foreign Exchange Assets of the RBI 21,272.8 18,416.1 21,092.2 21,356.2 21,296.8 2.3.1 Gold 1,191.6 1,296.2 1,225.7 1,191.6 1,191.6 2.3.2 Foreign Currency Assets 20,081.4 17,120.1 19,866.6 20,164.8 20,105.42.4 Capital Account 8,166.4 8,231.3 8,166.4 8,166.4 8,166.42.5 Other Items (net) -224.8 393.8 -194.0 -141.5 -170.4
(` Billion)
Outstanding as on March 31/last reporting Fridays of themonth/reporting Fridays
No. 11: Reserve Money - Components and Sources
Item
2014-15 2014 2015Apr. 25 Mar. 27 Apr. 3 Apr. 10 Apr. 17 Apr. 24
1 2 3 4 5 6 7Reserve Money (1.1 + 1.2 + 1.3 = 2.1 + 2.2 + 2.3 + 2.4 + 2.5 – 2.6) 19,284.7 16,974.6 18,365.0 18,320.9 18,607.5 18,867.2 18,988.7
1 Components1.1 Currency in Circulation 14,483.2 13,421.6 14,459.4 14,487.9 14,761.2 14,940.4 14,921.91.2 Bankers' Deposits with RBI 4,655.6 3,529.8 3,809.5 3,940.2 3,750.7 3,831.4 3,965.81.3 ‘Other’ Deposits with RBI 145.9 23.2 96.2 -107.3 95.5 95.4 100.92 Sources2.1 Net Reserve Bank Credit to Government 3,734.1 6,437.5 3,820.9 3,782.7 4,468.2 4,549.2 4,362.62.2 Reserve Bank Credit to Banks 1,876.6 474.8 1,018.2 863.9 568.6 759.0 1,050.92.3 Reserve Bank Credit to Commercial Sector 148.5 89.9 120.3 148.5 67.5 63.8 65.12.4 Net Foreign Exchange Assets of RBI 21,272.8 18,654.9 21,244.2 21,356.2 21,131.5 21,296.8 21,698.62.5 Government's Currency Liabilities to the Public 194.4 174.7 194.4 194.4 194.4 194.4 194.42.6 Net Non- Monetary Liabilities of RBI 7,941.6 8,857.2 8,033.0 8,024.9 7,822.7 7,996.0 8,382.9
(` Billion)
Outstanding as on March 31/ last Fridays of the month/ Fridays

CURRENT STATISTICS
RBI Bulletin June 2015 61
No. 13: Scheduled Commercial Banks' Investments
(` Billion)
Item As onMarch 20,
2015
2014 2015
Apr. 18 Mar. 20 Apr. 03 Apr. 17
1 2 3 4 51 SLR Securities 24,918.3 22,623.8 24,918.3 25,501.8 25,784.42 Commercial Paper 467.9 147.3 467.9 402.4 453.13 Shares issued by 3.1 PSUs 81.8 81.5 81.8 81.5 80.6 3.2 Private Corporate Sector 365.8 330.4 365.8 370.7 372.6 3.3 Others 32.7 9.8 32.7 53.7 32.24 Bonds/Debentures issued by 4.1 PSUs 809.5 797.6 809.5 792.8 760.8 4.2 Private Corporate Sector 1,159.2 1,207.3 1,159.2 1,208.7 1,149.2 4.3 Others 505.1 490.8 505.1 606.7 579.45 Instruments issued by 5.1 Mutual funds 585.6 520.2 585.6 184.0 646.3 5.2 Financial institutions 627.6 644.1 627.6 606.5 592.8
No. 12: Commercial Bank Survey
Item
2014-15 2014 2015Apr. 18 Mar. 20 Apr. 3 Apr. 17
1 2 3 4 51 Components1.1 Aggregate Deposits of Residents 83,172.5 75,733.9 83,172.5 86,426.4 84,530.6 1.1.1 Demand Deposits 8,034.1 7,313.0 8,034.1 9,523.4 8,041.5 1.1.2 Time Deposits of Residents 75,138.3 68,420.9 75,138.3 76,903.0 76,489.1 1.1.2.1 Short-term Time Deposits 33,812.2 30,789.4 33,812.2 34,606.4 34,420.1 1.1.2.1.1 Certificates of Deposits (CDs) 2,974.5 3,865.2 2,974.5 3,234.9 2,967.71.1.2.2 Long-term Time Deposits 41,326.1 37,631.5 41,326.1 42,296.7 42,069.01.2 Call/Term Funding from Financial Institutions 2,258.7 2,164.8 2,258.7 2,306.0 2,204.52 Sources2.1 Domestic Credit 95,298.5 87,005.9 95,298.5 98,157.8 96,545.8 2.1.1 Credit to the Government 25,028.5 22,606.1 25,028.5 25,482.2 25,764.5 2.1.2 Credit to the Commercial Sector 70,270.0 64,399.7 70,270.0 72,675.6 70,781.3 2.1.2.1 Bank Credit 65,646.8 60,130.4 65,646.8 68,309.6 66,039.2 2.1.2.1.1 Non-food Credit 64,702.6 59,203.5 64,702.6 67,617.4 65,167.9 2.1.2.2 Net Credit to Primary Dealers 35.7 22.7 35.7 39.5 55.1 2.1.2.3 Investments in Other Approved Securities 23.9 17.6 23.9 19.6 19.9 2.1.2.4 Other Investments (in non-SLR Securities) 4,563.7 4,228.9 4,563.7 4,306.9 4,667.12.2 Net Foreign Currency Assets of Commercial Banks (2.2.1–2.2.2–2.2.3) –1,831.8 –2,101.6 –1,831.8 –2,284.8 –1,822.6 2.2.1 Foreign Currency Assets 1,647.0 1,357.5 1,647.0 1,700.9 1,634.9 2.2.2 Non-resident Foreign Currency Repatriable Fixed Deposits 2,684.0 2,539.3 2,684.0 2,688.5 2,672.6 2.2.3 Overseas Foreign Currency Borrowings 794.8 919.8 794.8 1,297.2 784.92.3 Net Bank Reserves (2.3.1+2.3.2–2.3.3) 2,745.4 3,415.4 2,745.4 3,345.7 3,385.9 2.3.1 Balances with the RBI 3,730.7 3,266.2 3,730.7 3,682.0 3,598.6 2.3.2 Cash in Hand 537.4 467.8 537.4 527.2 545.8 2.3.3 Loans and Advances from the RBI 1,522.8 318.7 1,522.8 863.4 758.62.4 Capital Account 8,365.4 7,669.7 8,365.4 8,380.7 8,484.02.5 Other items (net) (2.1+2.2+2.3–2.4–1.1–1.2) 2,415.5 2,751.1 2,415.5 2,105.6 2,889.9 2.5.1 Other Demand and Time Liabilities (net of 2.2.3) 3,796.6 3,182.2 3,796.6 3,696.7 3,507.5 2.5.2 Net Inter-Bank Liabilities (other than to PDs) –766.1 –564.9 –766.1 –704.2 –640.5
(` Billion)
Outstanding as on last reporting Fridays of the month/reporting Fridays of the month

CURRENT STATISTICS
RBI Bulletin June 201562
No. 14: Business in India - All Scheduled Banks and All Scheduled Commercial Banks
(` Billion)
All Scheduled Commercial Banks
2014-15 2014 2015
Apr. Mar. Apr.
5 6 7 8
147 145 147 147
1,561.5 1,239.0 1,561.5 1,572.3
1,102.0 829.3 1,102.0 1,148.9
398.2 344.4 398.2 368.5
61.4 65.3 61.4 54.9
92,163.6 84,852.0 92,163.6 94,225.0
85,332.9 78,331.3 85,332.9 87,551.1
7,940.3 7,412.0 7,940.3 8,292.0
77,392.6 70,919.3 77,392.6 79,259.2
2,258.7 2,339.0 2,258.7 2,479.2
4,572.0 4,181.7 4,572.0 4,194.7
1,582.0 472.5 1,582.0 1,130.9
– – – –
1,582.0 472.5 1,582.0 1,130.9
4,264.3 3,799.9 4,264.3 4,280.2
533.5 478.8 533.5 548.0
3,730.7 3,321.1 3,730.7 3,732.2
2,217.7 1,860.9 2,217.7 2,299.5
1,374.1 1,123.5 1,374.1 1,568.4
91.3 112.8 91.3 103.2
1,282.7 1,010.8 1,282.7 1,465.2
225.9 213.3 225.9 104.0
189.2 151.3 189.2 191.3
428.5 372.8 428.5 435.8
24,918.3 22,653.0 24,918.3 25,812.8
24,897.5 22,634.6 24,897.5 25,791.7
20.7 18.5 20.7 21.0
65,364.2 60,134.7 65,364.2 66,012.6
944.2 987.9 944.2 898.7
63,123.9 57,888.1 63,123.9 63,785.3
344.1 371.3 344.1 345.7
1,199.9 1,156.2 1,199.9 1,228.4
241.2 251.9 241.2 216.0
455.2 467.3 455.2 437.2
Item
All Scheduled Banks
2014-15 2014 2015
Apr. Mar. Apr.
1 2 3 4
Number of Reporting Banks 214 212 214 214
1 Liabilities to the Banking System 1,619.2 1,288.7 1,619.2 1,628.4
1.1 Demand and Time Deposits from Banks 1,153.7 876.0 1,153.7 1,202.3
1.2 Borrowings from Banks 404.1 347.4 404.1 371.1
1.3 Other Demand and Time Liabilities 61.5 65.3 61.5 55.0
2 Liabilities to Others 94,577.6 87,153.3 94,577.6 96,673.9
2.1 Aggregate Deposits 87,651.2 80,541.3 87,651.2 89,902.1
2.1.1 Demand 8,125.7 7,591.0 8,125.7 8,482.6
2.1.2 Time 79,525.6 72,950.3 79,525.6 81,419.6
2.2 Borrowings 2,279.0 2,354.8 2,279.0 2,503.3
2.3 Other Demand and Time Liabilities 4,647.3 4,257.3 4,647.3 4,268.5
3 Borrowings from Reserve Bank 1,582.5 474.8 1,582.5 1,131.4
3.1 Against Usance Bills /Promissory Notes – – – –
3.2 Others 1,582.5 474.8 1,582.5 1,131.4
4 Cash in Hand and Balances with Reserve Bank 4,379.4 3,911.0 4,379.4 4,393.5
4.1 Cash in Hand 544.9 489.8 544.9 559.6
4.2 Balances with Reserve Bank 3,834.6 3,421.2 3,834.6 3,834.0
5 Assets with the Banking System 2,581.2 2,248.4 2,581.2 2,677.7
5.1 Balances with Other Banks 1,540.2 1,253.2 1,540.2 1,742.0
5.1.1 In Current Account 109.3 129.9 109.3 117.1
5.1.2 In Other Accounts 1,430.9 1,123.3 1,430.9 1,624.9
5.2 Money at Call and Short Notice 374.3 391.7 374.3 256.0
5.3 Advances to Banks 192.5 155.7 192.5 194.7
5.4 Other Assets 474.2 447.8 474.2 485.1
6 Investment 25,610.7 23,340.0 25,610.7 26,502.1
6.1 Government Securities 25,586.6 23,318.9 25,586.6 26,477.8
6.2 Other Approved Securities 24.0 21.1 24.0 24.3
7 Bank Credit 67,426.9 61,976.5 67,426.9 68,041.2
7a Food Credit 1,078.0 1,098.3 1,078.0 1,032.5
7.1 Loans, Cash-credits and Overdrafts 65,154.2 59,702.7 65,154.2 65,782.6
7.2 Inland Bills-Purchased 348.6 374.9 348.6 350.9
7.3 Inland Bills-Discounted 1,221.1 1,172.7 1,221.1 1,248.2
7.4 Foreign Bills-Purchased 242.6 255.2 242.6 217.1
7.5 Foreign Bills-Discounted 460.3 470.9 460.3 442.5
As on the Last Reporting Friday (in case of March)/ Last Friday

CURRENT STATISTICS
RBI Bulletin June 2015 63
No. 15: Deployment of Gross Bank Credit by Major Sectors
(` Billion)
Item Outstanding as on Growth (%)
Mar. 20,2015
2014 2015 Financialyear so far
Y-o-Y
Apr. 18 Mar. 20 Apr. 17 2015-16 2015
1 2 3 4 5 61 Gross Bank Credit 61,023 56,370 61,023 61,282 0.4 8.7
1.1 Food Credit 994 887 994 868 –12.6 –2.2
1.2 Non-food Credit 60,030 55,483 60,030 60,414 0.6 8.9
1.2.1 Agriculture & Allied Activities 7,659 6,865 7,659 7,835 2.3 14.1
1.2.2 Industry 26,488 24,987 26,488 26,582 0.4 6.4
1.2.2.1 Micro & Small 3,800 3,533 3,800 3,887 2.3 10.0
1.2.2.2 Medium 1,265 1,233 1,265 1,266 0.1 2.7
1.2.2.3 Large 21,422 20,221 21,422 21,429 0.0 6.0
1.2.3 Services 13,994 13,234 13,994 14,221 1.6 7.5
1.2.3.1 Transport Operators 878 904 878 924 5.2 2.1
1.2.3.2 Computer Software 166 169 166 176 6.0 4.1
1.2.3.3 Tourism, Hotels & Restaurants 363 390 363 376 3.6 –3.7
1.2.3.4 Shipping 100 95 100 101 1.2 5.8
1.2.3.5 Professional Services 745 717 745 843 13.2 17.6
1.2.3.6 Trade 3,556 3,186 3,556 3,624 1.9 13.7
1.2.3.6.1 Wholesale Trade 1,795 1,644 1,795 1,751 –2.4 6.5
1.2.3.6.2 Retail Trade 1,762 1,542 1,762 1,872 6.3 21.4
1.2.3.7 Commercial Real Estate 1,665 1,530 1,665 1,664 –0.0 8.8
1.2.3.8 Non-Banking Financial Companies (NBFCs) 3,117 3,119 3,117 3,222 3.3 3.3
1.2.3.9 Other Services 3,404 3,122 3,404 3,292 –3.3 5.4
1.2.4 Personal Loans 11,889 10,397 11,889 11,775 –1.0 13.3
1.2.4.1 Consumer Durables 153 137 153 156 1.8 13.8
1.2.4.2 Housing 6,256 5,467 6,256 6,419 2.6 17.4
1.2.4.3 Advances against Fixed Deposits 625 588 625 627 0.3 6.7
1.2.4.4 Advances to Individuals against share & bonds 45 34 45 53 17.7 58.6
1.2.4.5 Credit Card Outstanding 305 254 305 313 2.6 22.9
1.2.4.6 Education 634 601 634 638 0.7 6.2
1.2.4.7 Vehicle Loans 1,505 1,337 1,505 1,265 –15.9 –5.3
1.2.4.8 Other Personal Loans 2,366 1,979 2,366 2,304 –2.6 16.4
1.2A Priority Sector 20,103 18,493 20,103 20,192 0.4 9.2
1.2A.1 Agriculture & Allied Activities 7,659 6,865 7,659 7,835 2.3 14.1
1.2A.2 Micro & Small Enterprises 8,003 7,292 8,003 8,126 1.5 11.4
1.2A.2.1 Manufacturing 3,800 3,533 3,800 3,887 2.3 10.0
1.2A.2.2 Services 4,203 3,759 4,203 4,240 0.9 12.8
1.2A.3 Housing 3,224 3,068 3,224 3,203 –0.6 4.4
1.2A.4 Micro-Credit 177 178 177 176 –0.6 –1.1
1.2A.5 Education Loans 592 569 592 592 0.0 4.0
1.2A.6 State-Sponsored Orgs. for SC/ST 3 3 3 4 0.5 2.0
1.2A.7 Weaker Sections 4,049 3,679 4,049 4,015 –0.8 9.2
1.2A.8 Export Credit 426 482 426 440 3.3 –8.7

CURRENT STATISTICS
RBI Bulletin June 201564
No. 16: Industry-wise Deployment of Gross Bank Credit
(` Billion)
Industry Outstanding as on Growth (%)
Mar. 20,2015
2014 2015 Financialyear so far
Y-o-Y
Apr. 18 Mar. 20 Apr. 17 2015-16 2015
1 2 3 4 5 6
1 Industry 26,488 24,987 26,488 26,582 0.4 6.4
1.1 Mining & Quarrying (incl. Coal) 354 357 354 360 1.7 0.8
1.2 Food Processing 1,710 1,487 1,710 1,687 –1.4 13.4
1.2.1 Sugar 414 365 414 426 3.0 16.8
1.2.2 Edible Oils & Vanaspati 211 218 211 209 –0.5 –3.8
1.2.3 Tea 32 29 32 32 –0.8 7.3
1.2.4 Others 1,054 875 1,054 1,019 –3.3 16.5
1.3 Beverage & Tobacco 186 180 186 190 2.2 5.5
1.4 Textiles 2,013 2,002 2,013 2,032 1.0 1.5
1.4.1 Cotton Textiles 1,000 999 1,000 1,000 –0.0 0.1
1.4.2 Jute Textiles 22 20 22 22 –3.1 8.8
1.4.3 Man-Made Textiles 204 213 204 212 4.1 –0.4
1.4.4 Other Textiles 787 770 787 798 1.5 3.7
1.5 Leather & Leather Products 102 99 102 103 0.9 3.6
1.6 Wood & Wood Products 97 91 97 98 1.8 7.8
1.7 Paper & Paper Products 340 326 340 339 –0.2 4.2
1.8 Petroleum, Coal Products & Nuclear Fuels 560 583 560 558 –0.5 –4.4
1.9 Chemicals & Chemical Products 1,542 1,620 1,542 1,516 –1.7 –6.5
1.9.1 Fertiliser 254 253 254 213 –16.1 –15.9
1.9.2 Drugs & Pharmaceuticals 493 478 493 509 3.3 6.5
1.9.3 Petro Chemicals 331 445 331 333 0.7 –25.3
1.9.4 Others 465 444 465 461 –0.8 3.8
1.10 Rubber, Plastic & their Products 376 359 376 373 –0.7 3.9
1.11 Glass & Glassware 88 93 88 90 2.3 –3.0
1.12 Cement & Cement Products 559 547 559 568 1.6 3.9
1.13 Basic Metal & Metal Product 3,851 3,555 3,851 3,834 –0.4 7.8
1.13.1 Iron & Steel 2,833 2,638 2,833 2,838 0.2 7.6
1.13.2 Other Metal & Metal Product 1,018 917 1,018 996 –2.2 8.6
1.14 All Engineering 1,529 1,436 1,529 1,545 1.1 7.6
1.14.1 Electronics 367 356 367 372 1.4 4.6
1.14.2 Others 1,162 1,081 1,162 1,173 1.0 8.6
1.15 Vehicles, Vehicle Parts & Transport Equipment 680 659 680 692 1.8 5.0
1.16 Gems & Jewellery 717 676 717 715 –0.4 5.7
1.17 Construction 725 668 725 741 2.3 10.8
1.18 Infrastructure 9,234 8,435 9,234 9,326 1.0 10.6
1.18.1 Power 5,576 4,898 5,576 5,652 1.4 15.4
1.18.2 Telecommunications 918 899 918 978 6.5 8.7
1.18.3 Roads 1,678 1,590 1,678 1,669 –0.5 5.0
1.18.4 Other Infrastructure 1,062 1,047 1,062 1,027 –3.3 –2.0
1.19 Other Industries 1,824 1,811 1,824 1,815 –0.5 0.2

CURRENT STATISTICS
RBI Bulletin June 2015 65
No. 17: State Co-operative Banks Maintaining Accounts with the Reserve Bank of India
(` Billion)
Last Reporting Friday (in case of March)/Last Friday/ Reporting Friday
2014 2015
Jan. 31 Dec. 26 Jan. 9 Jan. 23 Jan. 30
2 3 4 5 6
Number of Reporting Banks 31 31 31 31 31
1 Aggregate Deposits (2.1.1.2+2.2.1.2) 406.0 404.6 406.5 405.9 406.3
2 Demand and Time Liabilities
2.1 Demand Liabilities 127.5 139.8 137.4 138.9 135.4
2.1.1 Deposits
2.1.1.1 Inter-Bank 14.9 28.1 24.7 27.8 28.2
2.1.1.2 Others 73.8 76.7 78.1 76.2 74.5
2.1.2 Borrowings from Banks 13.2 8.5 6.8 7.2 5.5
2.1.3 Other Demand Liabilities 32.1 26.4 27.8 27.6 27.1
2.2 Time Liabilities 848.9 852.3 850.6 852.8 851.3
2.2.1 Deposits
2.2.1.1 Inter-Bank 506.0 512.6 511.1 512.7 511.2
2.2.1.2 Others 332.2 327.8 328.4 329.7 331.8
2.2.2 Borrowings from Banks – 0.6 0.2 – 0.4
2.2.3 Other Time Liabilities 10.4 11.3 10.9 10.4 7.9
3 Borrowing from Reserve Bank – – – – –
4 Borrowings from a notified bank / State Government 370.3 433.9 432.6 431.5 431.5
4.1 Demand 152.7 173.9 172.1 171.7 171.7
4.2 Time 217.6 260.0 260.5 259.7 259.7
5 Cash in Hand and Balances with Reserve Bank 37.7 40.2 40.4 38.0 40.8
5.1 Cash in Hand 2.2 2.4 2.2 2.1 2.2
5.2 Balance with Reserve Bank 35.5 37.8 38.3 35.8 38.6
6 Balances with Other Banks in Current Account 10.5 7.5 7.7 6.7 5.8
7 Investments in Government Securities 265.4 281.3 281.4 274.8 276.9
8 Money at Call and Short Notice 186.6 201.7 203.6 191.9 191.5
9 Bank Credit (10.1+11) 369.1 380.1 404.9 378.8 409.9
10 Advances
10.1 Loans, Cash-Credits and Overdrafts 369.0 380.0 404.8 378.8 409.9
10.2 Due from Banks 645.6 697.5 698.8 697.3 697.3
11 Bills Purchased and Discounted 0.1 0.1 0.1 0.1 0.1
Item
2013-14
1
Number of Reporting Banks 31
1 Aggregate Deposits (2.1.1.2+2.2.1.2) 417.9
2 Demand and Time Liabilities
2.1 Demand Liabilities 139.7
2.1.1 Deposits
2.1.1.1 Inter-Bank 25.4
2.1.1.2 Others 76.2
2.1.2 Borrowings from Banks 7.2
2.1.3 Other Demand Liabilities 30.9
2.2 Time Liabilities 899.5
2.2.1 Deposits
2.2.1.1 Inter-Bank 541.4
2.2.1.2 Others 341.7
2.2.2 Borrowings from Banks 5.9
2.2.3 Other Time Liabilities 10.2
3 Borrowing from Reserve Bank –
4 Borrowings from a notified bank / State Government 337.9
4.1 Demand 162.6
4.2 Time 175.3
5 Cash in Hand and Balances with Reserve Bank 43.0
5.1 Cash in Hand 2.2
5.2 Balance with Reserve Bank 40.8
6 Balances with Other Banks in Current Account 8.3
7 Investments in Government Securities 289.4
8 Money at Call and Short Notice 213.9
9 Bank Credit (10.1+11) 388.2
10 Advances
10.1 Loans, Cash-Credits and Overdrafts 388.2
10.2 Due from Banks 650.1
11 Bills Purchased and Discounted –
Last Reporting Friday (in case of March)/Last Friday/ Reporting Friday

CURRENT STATISTICS
RBI Bulletin June 201566
No. 18: Consumer Price Index (Base: 2012=100)
Rural Urban Combined
Apr. 14 Mar. 15 Apr. 15 Apr. 14 Mar. 15 Apr. 15 Apr. 14 Mar. 15 Apr. 15
4 5 6 7 8 9 10 11 12
117.2 123.1 123.5 118.2 123.9 124.6 117.6 123.4 123.9
120.2 123.3 123.3 122.5 124.0 123.8 120.9 123.5 123.5
118.9 124.7 125.6 121.7 126.7 128.2 119.9 125.4 126.5
118.1 118.9 117.3 113.3 113.5 110.0 116.2 116.8 114.5
117.0 126.0 126.7 117.0 125.9 126.3 117.0 126.0 126.6
109.7 111.8 112.0 103.1 104.8 104.5 107.3 109.2 109.2
125.5 130.9 134.1 126.7 123.8 130.6 126.1 127.6 132.5
120.5 128.0 127.7 121.2 131.4 130.7 120.7 129.2 128.7
111.0 119.9 121.6 111.0 127.2 131.3 111.0 122.4 124.9
102.6 98.9 97.8 100.3 93.2 91.6 101.8 97.0 95.7
111.2 119.4 119.8 115.3 127.4 127.7 112.6 122.1 122.4
113.5 118.9 119.4 112.7 117.0 117.2 113.2 118.1 118.5
118.7 127.7 128.5 121.0 129.2 129.5 119.8 128.4 129.0
115.4 124.7 125.4 117.6 128.8 130.1 116.0 125.8 126.7
117.8 125.5 126.1 115.7 120.9 121.3 117.0 123.7 124.2
118.1 126.0 126.6 116.3 121.7 122.1 117.4 124.3 124.8
116.1 122.9 123.4 112.5 116.9 117.2 114.6 120.4 120.8
- - - 113.9 118.6 119.2 113.9 118.6 119.2
113.4 120.6 121.3 110.9 114.4 114.7 112.5 118.3 118.8
111.5 115.5 116.1 111.4 113.8 114.2 111.5 114.7 115.2
113.7 120.2 120.9 113.4 118.0 118.4 113.6 119.2 119.7
111.8 118.2 118.7 111.0 114.3 114.6 111.5 116.7 117.1
111.2 111.6 112.1 111.2 108.4 108.4 111.2 109.9 110.2
110.5 115.5 116.0 111.2 115.4 115.6 110.9 115.4 115.8
113.0 119.4 119.9 112.5 120.6 121.7 112.7 120.1 121.0
108.9 110.8 111.5 109.1 111.3 111.8 109.0 111.0 111.6
115.4 121.1 121.6 114.7 119.1 119.7 115.1 120.2 120.7
Group/Sub group 2014-15
Rural Urban Combined
1 2 3
1 Food and beverages 122.6 124.1 123.1
1.1 Cereals and products 122.0 123.9 122.6
1.2 Meat and fish 122.3 125.5 123.5
1.3 Egg 119.0 118.4 118.7
1.4 Milk and products 122.3 122.7 122.5
1.5 Oils and fats 110.6 103.7 108.1
1.6 Fruits 128.6 126.1 127.4
1.7 Vegetables 140.0 146.7 142.3
1.8 Pulses and products 115.1 117.8 116.0
1.9 Sugar and confectionery 102.8 99.5 101.7
1.10 Spices 115.0 122.6 117.5
1.11 Non-alcoholic beverages 116.4 114.9 115.8
1.12 Prepared meals, snacks, sweets etc. 123.0 125.4 124.1
2 Pan, tobacco and intoxicants 120.0 123.7 120.9
3 Clothing and footwear 121.7 118.5 120.5
3.1 Clothing 122.1 119.2 121.0
3.2 Footwear 119.6 114.7 117.6
4 Housing - 116.1 116.1
5 Fuel and light 116.5 112.3 114.9
6 Miscellaneous 113.6 113.1 113.4
6.1 Household goods and services 116.9 115.8 116.4
6.2 Health 114.9 112.5 114.0
6.3 Transport and communication 112.0 110.3 111.1
6.4 Recreation and amusement 112.8 113.3 113.1
6.5 Education 116.4 118.4 117.6
6.6 Personal care and effects 109.4 110.2 109.7
General Index (All Groups) 119.5 118.1 118.9
Source: Central Statistics Office, Ministry of Statistics and Programme Implementation, Government of India.
No. 19: Other Consumer Price Indices
2014 2015Apr. Mar. Apr.
4 5 6
242 254 256
771 803 805
773 807 809
Item Base Year LinkingFactor
2014-15
1 2 3
1 Consumer Price Index for Industrial Workers 2001 4.63 251
2 Consumer Price Index for Agricultural Labourers 1986-87 5.89 800
3 Consumer Price Index for Rural Labourers 1986-87 – 802
Source: Labour Bureau, Ministry of Labour and Employment, Government of India.
No. 20: Monthly Average Price of Gold and Silver in Mumbai
Source: Business Standard/Business Line/The Economic Times, Mumbai for Gold and Silver prices in Mumbai.
Item 2014-15 2014 2015
Apr. Mar. Apr.
1 2 3 4
1 Standard Gold ( per 10 grams) 27,415 29,329 26,168 26,6832 Silver ( per kilogram) 40,558 43,607 37,176 37,491
`
`
Prices and Production

CURRENT STATISTICS
RBI Bulletin June 2015 67
No. 21: Wholesale Price Index(Base: 2004-05 = 100)
2014 2015
Apr. Feb. Mar. (P) Apr. (P)
3 4 5 6180.8 175.6 176.1 176.0242.4 240.9 239.6 241.8239.0 250.7 249.4 252.7230.2 237.6 235.6 237.1230.5 233.5 230.9 231.4228.9 256.7 257.8 264.1225.4 234.9 232.0 242.1220.0 227.8 217.6 217.1229.9 240.8 243.9 262.6230.5 247.4 247.3 247.6279.6 288.4 290.1 290.8266.0 314.3 311.1 310.2252.5 233.9 232.1 233.9216.9 205.8 202.2 203.5235.3 191.8 192.5 202.8210.8 202.6 204.2 207.0216.7 213.8 209.4 207.3192.0 238.6 178.7 152.7345.6 247.7 252.1 246.6378.1 353.0 382.0 353.0206.3 217.8 218.3 217.8348.8 195.1 186.7 193.2211.8 181.2 187.3 184.2189.8 189.8 189.8 189.8233.1 183.4 194.1 188.6167.6 170.1 167.6 169.1154.6 154.0 153.9 153.8171.6 170.6 170.1 169.8187.0 206.3 206.8 207.0172.8 165.8 167.9 165.3172.8 176.3 174.7 172.9148.2 146.6 147.5 150.6183.8 173.7 171.2 168.8146.1 145.6 145.4 144.6220.8 222.4 228.8 227.0187.6 174.9 172.8 177.8185.0 204.8 196.8 209.7188.8 197.0 197.7 200.5197.4 202.7 203.2 203.5136.1 136.2 136.8 136.3171.7 179.4 179.4 179.4159.1 167.1 167.4 167.5234.8 241.3 241.7 242.4143.1 140.4 139.9 140.3165.5 157.9 157.9 156.8185.8 170.0 170.1 168.9142.7 144.4 144.2 143.4134.7 132.4 130.6 133.1134.0 131.2 129.5 132.9137.0 136.3 134.1 133.7157.5 159.9 160.0 160.0188.8 200.0 201.1 202.6114.5 115.3 115.2 115.2189.0 189.5 189.0 192.0155.5 157.5 158.0 159.6190.8 191.8 190.1 192.0218.7 218.6 217.9 222.7153.8 149.5 149.6 151.7
Commodities Weight 2014-15
1 21 ALL COMMODITIES 100.000 181.21.1 PRIMARY ARTICLES 20.118 248.9 1.1.1 Food articles 14.337 253.4 1.1.1.1 Food Grains 4.090 235.0 1.1.1.1.1 Cereals 3.373 233.6 1.1.1.1.2 Pulses 0.717 241.4 1.1.1.2 Fruits & Vegetables 3.843 257.4 1.1.1.2.1 Vegetables 1.736 276.7 1.1.1.2.2 Fruits 2.107 241.5 1.1.1.3 Milk 3.238 242.6 1.1.1.4 Eggs, Meat & Fish 2.414 282.3 1.1.1.5 Condiments & Spices 0.569 298.8 1.1.1.6 Other Food Articles 0.183 249.5 1.1.2 Non-Food Articles 4.258 212.0 1.1.2.1 Fibres 0.877 215.2 1.1.2.2 Oil Seeds 1.781 208.9 1.1.2.3 Other Non-Food Articles 1.386 215.5 1.1.2.4 Flowers 0.213 203.5 1.1.3 Minerals 1.524 309.3 1.1.3.1 Metallic Minerals 0.489 391.6 1.1.3.2 Other Minerals 0.135 212.0 1.1.3.3 Crude Petroleum 0.900 279.11.2 FUEL & POWER 14.910 203.4 1.2.1 Coal 2.094 189.8 1.2.2 Mineral Oils 9.364 219.6 1.2.3 Electricity 3.452 167.81.3 MANUFACTURED PRODUCTS 64.972 155.1 1.3.1 Food Products 9.974 172.9 1.3.1.1 Dairy Products 0.568 199.6 1.3.1.2 Canning, Preserving & Processing of Food 0.358 167.3 1.3.1.3 Grain Mill Products 1.340 175.1 1.3.1.4 Bakery Products 0.444 149.0 1.3.1.5 Sugar, Khandsari & Gur 2.089 182.8 1.3.1.6 Edible Oils 3.043 145.1 1.3.1.7 Oil Cakes 0.494 227.0 1.3.1.8 Tea & Coffee Proccessing 0.711 189.6 1.3.1.9 Manufacture of Salt 0.048 196.2 1.3.1.10 Other Food Products 0.879 194.0 1.3.2 Beverages, Tobacco & Tobacco Products 1.762 200.8 1.3.2.1 Wine Industries 0.385 137.1 1.3.2.2 Malt Liquor 0.153 177.5 1.3.2.3 Soft Drinks & Carbonated Water 0.241 162.5 1.3.2.4 Manufacture of Bidi, Cigarettes, Tobacco & Zarda 0.983 238.7 1.3.3 Textiles 7.326 142.6 1.3.3.1 Cotton Textiles 2.605 162.6 1.3.3.1.1 Cotton Yarn 1.377 179.4 1.3.3.1.2 Cotton Fabric 1.228 143.9 1.3.3.2 Man-Made Textiles 2.206 135.2 1.3.3.2.1 Man-Made Fibre 1.672 134.3 1.3.3.2.2 Man-Made Fabric 0.533 138.0 1.3.3.3 Woollen Textiles 0.294 159.5 1.3.3.4 Jute, Hemp & Mesta Textiles 0.261 192.8 1.3.3.5 Other Misc. Textiles 1.960 115.0 1.3.4 Wood & Wood Products 0.587 187.7 1.3.4.1 Timber/Wooden Planks 0.181 156.9 1.3.4.2 Processed Wood 0.128 191.1 1.3.4.3 Plywood & Fibre Board 0.241 214.7 1.3.4.4 Others 0.038 152.5

CURRENT STATISTICS
RBI Bulletin June 201568
No. 21: Wholesale Price Index (Concld.)(Base: 2004-05 = 100)
2014 2015
Apr. Feb. Mar. (P) Apr. (P)
3 4 5 6149.4 151.4 152.6 153.1149.1 149.8 152.4 151.8132.0 134.7 134.6 134.3170.7 175.0 174.4 178.4144.9 142.0 142.0 141.8115.6 113.9 114.2 114.0160.4 157.7 157.5 157.3146.2 141.1 141.2 141.1150.1 147.9 148.4 148.1176.3 177.2 177.3 176.4176.3 177.7 177.8 177.3176.4 172.3 172.8 168.9140.8 137.2 137.6 137.5155.3 155.3 156.1 155.9153.2 150.6 150.8 150.7156.6 155.2 155.6 155.1153.3 143.8 144.1 144.3150.8 152.9 153.2 153.1154.4 155.6 156.1 156.3130.6 138.1 137.3 135.9149.5 149.7 150.0 149.9146.5 142.1 142.3 142.6128.5 129.7 129.7 130.0160.7 160.4 160.6 160.3157.0 154.5 154.7 154.2152.9 150.7 150.6 147.8165.5 149.7 151.1 152.8150.9 154.4 153.8 153.9166.7 176.2 177.9 177.6184.5 195.3 193.3 196.3133.5 137.7 138.7 139.7162.7 174.0 177.7 175.5176.3 177.8 178.4 178.8166.5 163.6 162.4 162.0156.5 152.8 151.4 150.9159.0 151.3 149.4 150.3165.1 161.0 159.5 159.3153.5 147.4 145.4 144.7132.9 133.7 134.0 132.3164.8 167.7 167.1 164.8144.6 146.3 146.5 146.6159.0 155.7 157.2 153.7166.7 168.1 167.9 167.4141.0 145.2 144.6 144.3191.1 189.9 190.1 189.4214.0 212.7 211.8 211.8133.4 135.2 135.3 134.9145.1 149.8 149.3 149.8151.9 153.3 153.2 153.2138.4 141.5 141.5 141.5164.3 165.8 165.8 165.7120.3 120.6 120.6 120.5124.5 127.9 127.8 127.6138.4 139.0 138.3 137.8151.6 156.8 158.9 157.0117.4 121.4 121.6 121.7
89.6 89.3 89.1 89.290.0 91.7 91.7 91.796.8 99.6 99.6 98.5
135.7 137.1 136.8 137.4135.0 136.1 135.6 136.4136.3 139.7 139.8 140.0150.6 150.2 150.1 150.2
Commodities Weight 2014-15
1 2 1.3.5 Paper & Paper Products 2.034 150.6 1.3.5.1 Paper & Pulp 1.019 149.9 1.3.5.2 Manufacture of boards 0.550 133.8 1.3.5.3 Printing & Publishing 0.465 172.2 1.3.6 Leather & Leather Products 0.835 145.0 1.3.6.1 Leathers 0.223 116.0 1.3.6.2 Leather Footwear 0.409 161.8 1.3.6.3 Other Leather Products 0.203 143.1 1.3.7 Rubber & Plastic Products 2.987 149.9 1.3.7.1 Tyres & Tubes 0.541 177.3 1.3.7.1.1 Tyres 0.488 177.5 1.3.7.1.2 Tubes 0.053 176.1 1.3.7.2 Plastic Products 1.861 140.2 1.3.7.3 Rubber Products 0.584 155.3 1.3.8 Chemicals & Chemical Products 12.018 152.8 1.3.8.1 Basic Inorganic Chemicals 1.187 156.2 1.3.8.2 Basic Organic Chemicals 1.952 150.9 1.3.8.3 Fertilisers & Pesticides 3.145 152.0 1.3.8.3.1 Fertilisers 2.661 154.9 1.3.8.3.2 Pesticides 0.483 135.8 1.3.8.4 Paints, Varnishes & Lacquers 0.529 149.9 1.3.8.5 Dyestuffs & Indigo 0.563 144.8 1.3.8.6 Drugs & Medicines 0.456 129.3 1.3.8.7 Perfumes, Cosmetics, Toiletries etc. 1.130 160.6 1.3.8.8 Turpentine, Plastic Chemicals 0.586 156.5 1.3.8.9 Polymers including Synthetic Rubber 0.970 152.4 1.3.8.10 Petrochemical Intermediates 0.869 161.8 1.3.8.11 Matches, Explosives & other Chemicals 0.629 153.5 1.3.9 Non-Metallic Mineral Products 2.556 172.8 1.3.9.1 Structural Clay Products 0.658 192.1 1.3.9.2 Glass, Earthenware, Chinaware & their Products 0.256 135.4 1.3.9.3 Cement & Lime 1.386 169.6 1.3.9.4 Cement, Slate & Graphite Products 0.256 177.7 1.3.10 Basic Metals, Alloys & Metal Products 10.748 165.6 1.3.10.1 Ferrous Metals 8.064 155.6 1.3.10.1.1 Iron & Semis 1.563 156.8 1.3.10.1.2 Steel: Long 1.630 164.7 1.3.10.1.3 Steel: Flat 2.611 150.8 1.3.10.1.4 Steel: Pipes & Tubes 0.314 133.4 1.3.10.1.5 Stainless Steel & alloys 0.938 167.2 1.3.10.1.6 Castings & Forgings 0.871 145.6 1.3.10.1.7 Ferro alloys 0.137 159.1 1.3.10.2 Non-Ferrous Metals 1.004 168.7 1.3.10.2.1 Aluminium 0.489 144.9 1.3.10.2.2 Other Non-Ferrous Metals 0.515 191.2 1.3.10.3 Metal Products 1.680 211.7 1.3.11 Machinery & Machine Tools 8.931 134.7 1.3.11.1 Agricultural Machinery & Implements 0.139 148.7 1.3.11.2 Industrial Machinery 1.838 152.4 1.3.11.3 Construction Machinery 0.045 141.1 1.3.11.4 Machine Tools 0.367 165.0 1.3.11.5 Air Conditioner & Refrigerators 0.429 120.6 1.3.11.6 Non-Electrical Machinery 1.026 126.9 1.3.11.7 Electrical Machinery, Equipment & Batteries 2.343 138.6 1.3.11.8 Electrical Accessories, Wires, Cables etc. 1.063 156.1 1.3.11.9 Electrical Apparatus & Appliances 0.337 119.8 1.3.11.10 Electronics Items 0.961 89.7 1.3.11.11 IT Hardware 0.267 91.5 1.3.11.12 Communication Equipments 0.118 98.8 1.3.12 Transport, Equipment & Parts 5.213 136.2 1.3.12.1 Automotives 4.231 135.3 1.3.12.2 Auto Parts 0.804 138.1 1.3.12.3 Other Transport Equipments 0.178 150.0
Source: Office of the Economic Adviser, Ministry of Commerce and Industry, Government of India.

CURRENT STATISTICS
RBI Bulletin June 2015 69
March
2014 20156 7
General Index
General IndexGeneral Index193.3 197.3
Sectoral Classification
Sectoral Classification1. Mining & Quarrying147.2 148.52. Manufacturing204.7 209.33. Electricity 173.0 176.4
Use-Based Classification
Use-Based Classification1. Basic Goods176.3 180.42. Capital Goods303.8 326.93. Intermediate Goods160.3 163.44. Consumer Goods203.9 202.54(a).Consumer Durables274.4 261.44(b).Consumer Non-durables175.9 179.2
April-March
2013-14 2014-154 5
General Index
General IndexGeneral IndexGeneral Index172.0 176.8
Sectoral Classification
Sectoral ClassificationMining & QuarryingMining & Quarrying124.7 126.5ManufacturingManufacturing181.9 186.0ElectricityElectricity 164.7 178.6
Use-Based Classification
Use-Based ClassificationBasic GoodsBasic Goods156.9 167.7Capital GoodsCapital Goods242.6 257.7Intermediate GoodsIntermediate Goods151.3 153.7Consumer GoodsConsumer Goods185.3 178.9Consumer DurablesConsumer Durables264.2 231.1Consumer Non-durablesConsumer Non-durables154.0 158.3
No. 22: Index of Industrial Production (Base:2004-05=100)
Industry Weight 2013-14 2014-15
1 2 3General IndexGeneral Index 100.00 172.0 176.8
1 Sectoral Classification 1.1 Mining and Quarrying 14.16 124.7 126.5 1.2 Manufacturing 75.53 181.9 186.0 1.3 Electricity 10.32 164.7 178.6
2 Use-Based Classification 2.1 Basic Goods 45.68 156.9 167.7 2.2 Capital Goods 8.83 242.6 257.7 2.3 Intermediate Goods 15.69 151.3 153.7 2.4 Consumer Goods 29.81 185.3 178.9 2.4.1 Consumer Durables 8.46 264.2 231.1 2.4.2 Consumer Non-Durables 21.35 154.0 158.3
Source : Central Statistics Office, Ministry of Statistics and Programme Implementation, Government of India.
Government Accounts and Treasury BillsNo. 23: Union Government Accounts at a Glance
(Amount in ` Billion)
Budget Account Item CodePercentageto RevisedEstimates
Percentage to Budget Estimates
5 6
97.6 2.299.3 –0.390.4 12.798.3 20.3
123.4 1.695.7 2.397.9 23.097.8 8.798.2 9.198.1 8.698.2 3.799.5 14.396.9 7.697.4 7.395.1 8.297.8 8.797.9 8.497.2 10.998.8 26.197.9 23.096.6 111.1
Source : Controller General of Accounts, Ministry of Finance, Government of India.
Item Financial Year
April 20152014- 15 2015-16 2015-16(Revised
Estimates)(ProvisionalAccounts)
(BudgetEstimates)
1 2 3 4
1 Revenue Receipts 11,262.9 10,994.4 11,415.8 253.1 1.1 Tax Revenue (Net) 9,084.6 9,024.8 9,198.4 -28.1 1.2 Non-Tax Revenue 2,178.3 1,969.6 2,217.3 281.32 Capital Receipts 5,548.6 5,453.2 6,359.0 1,293.0 2.1 Recovery of Loans 108.9 134.4 107.5 1.7 2.2 Other Receipts 313.5 300.0 695.0 16.1 2.3 Borrowings and Other Liabilities 5,126.3 5,018.8 5,556.5 1,275.23 Total Receipts (1+2) 16,811.6 16,447.6 17,774.8 1,546.24 Non-Plan Expenditure 12,132.2 11,911.4 13,122.0 1,194.6 4.1 On Revenue Account 11,219.0 11,002.6 12,060.3 1,043.0 4.1.1 Interest Payments 4,113.5 4,040.2 4,561.5 169.9 4.2 On Capital Account 913.3 908.8 1,061.7 151.65 Plan Expenditure 4,679.3 4,536.2 4,652.8 351.6 5.1 On Revenue Account 3,668.8 3,574.9 3,300.2 241.1 5.2 On Capital Account 1,010.5 961.4 1,352.6 110.56 Total Expenditure (4+5) 16,811.6 16,447.6 17,774.8 1,546.27 Revenue Expenditure (4.1+5.1) 14,887.8 14,577.5 15,360.5 1,284.18 Capital Expenditure (4.2+5.2) 1,923.8 1,870.1 2,414.3 262.19 Revenue Deficit (7-1) 3,624.9 3,583.1 3,944.7 1,031.010 Fiscal Deficit {6-(1+2.1+2.2)} 5,126.3 5,018.8 5,556.5 1,275.211 Gross Primary Deficit [10-4.1.1] 1,012.7 978.6 995.0 1,105.3

CURRENT STATISTICS
RBI Bulletin June 201570
(` Billion)
2014 2015Apr. 25 Mar. 20 Mar. 27 Apr. 3 Apr. 10 Apr. 17 Apr. 24
2 3 4 5 6 7 8
– – – – – – –– – – – – – –
738.4 924.5 838.1 1,090.8 869.0 791.5 681.58.5 10.2 14.7 14.9 8.5 10.6 8.5
346.4 411.3 446.9 416.7 460.6 441.8 485.1368.3 237.6 284.1 256.7 259.8 273.2 307.7416.9 449.1 368.3 368.3 361.8 361.8 448.8358.4 351.8 264.9 240.5 283.2 289.0 262.3
259.8 243.7 231.5 226.6 256.9 257.9 277.3258.1 317.8 408.9 398.3 378.4 385.5 416.3
74.1 14.9 13.9 13.9 7.1 7.1 7.1172.2 181.9 113.9 129.5 122.6 114.6 129.2
409.7 328.0 330.8 307.1 379.2 366.6 344.1538.9 652.2 657.3 614.5 633.2 671.6 681.2
6.9 12.0 12.0 12.0 12.0 12.0 12.0432.5 492.1 483.4 489.6 458.2 432.4 454.3
4,389.0 4,627.0 4,468.7 4,579.5 4,490.4 4,415.5 4,515.7
No. 24: Treasury Bills – Ownership Pattern
Item 2014-15
11 14-day
1.1 Banks –1.2 Primary Dealers –1.3 State Governments 838.11.4 Others 14.7
2 91-day2.1 Banks 446.92.2 Primary Dealers 284.12.3 State Governments 368.32.4 Others 264.9
3 182-day3.1 Banks 231.53.2 Primary Dealers 408.93.3 State Governments 13.93.4 Others 113.9
4 364-day4.1 Banks 330.84.2 Primary Dealers 657.34.3 State Governments 12.04.4 Others 483.4
5 Total 4,468.7
No. 25: Auctions of Treasury Bills(Amount in ` Billion)
Date ofAuction
NotifiedAmount
Bids Received Bids Accepted TotalIssue(6+7)
Cut-offPrice
Implicit Yieldat Cut-offPrice (per
cent)
Number Total Face Value Number Total Face ValueCompetitive Non-
CompetitiveCompetitive Non-
Competitive
1 2 3 4 5 6 7 8 9 1091-day Treasury Bills
2015-16 Apr. 6 80 56 214.19 8.02 18 80.00 8.02 88.02 98.08 7.8519Apr. 8 80 84 328.00 46.00 31 80.00 46.00 126.00 98.08 7.8519Apr. 15 80 83 264.04 30.27 50 80.00 30.27 110.27 98.08 7.8519Apr. 22 80 71 192.58 89.54 53 80.00 89.54 169.54 98.07 7.8936Apr. 29 80 66 180.03 29.00 55 80.00 29.00 109.00 98.06 7.9353
182-day Treasury Bills2014-15 Mar. 25 60 45 176.45 5.35 19 60.00 5.35 65.35 96.10 8.13882015-16 Apr. 8 60 64 193.67 1.81 16 60.00 1.81 61.81 96.22 7.8786Apr. 22 60 54 141.84 0.41 28 60.00 0.41 60.41 96.21 7.9002
364-day Treasury Bills2014-15 Mar. 18 60 79 188.53 0.02 21 60.00 0.02 60.02 92.63 7.97822015-16 Apr. 6 60 69 147.00 – 46 60.00 – 60.00 92.74 7.8498Apr. 15 60 74 177.19 0.10 28 60.00 0.10 60.10 92.71 7.8848Apr. 29 60 70 178.72 0.13 31 60.00 0.13 60.13 92.69 7.9082

CURRENT STATISTICS
RBI Bulletin June 2015 71
No. 26: Daily Call Money Rates
As on 05 Jun,2015 Range of Rates Weighted Average Rates
1 Borrowings/ Lendings Borrowings/ Lendings
1 2
April 4, 2015 4.00-7.50 6.57
April 6, 2015 5.00-7.80 7.25
April 7, 2015 5.75-7.75 7.29
April 8, 2015 6.00-7.70 7.35
April 9, 2015 6.00-7.90 7.44
April 10, 2015 5.00-8.05 7.56
April 11, 2015 4.00-7.00 6.45
April 13, 2015 5.00-8.00 7.42
April 15, 2015 6.00-8.00 7.42
April 16, 2015 6.20-7.75 7.37
April 17, 2015 5.00-7.80 7.36
April 18, 2015 4.00-8.45 7.56
April 20, 2015 6.20-8.00 7.65
April 21, 2015 6.20-7.85 7.27
April 22, 2015 6.00-8.10 7.37
April 23, 2015 6.10-8.75 7.73
April 24, 2015 5.50-7.95 7.45
April 25, 2015 4.00-7.06 6.50
April 27, 2015 6.20-7.90 7.47
April 28, 2015 6.00-7.80 7.44
April 29, 2015 6.00-7.85 7.51
April 30, 2015 5.50-8.50 7.68
May 2, 2015 4.50-6.92 5.81
May 5, 2015 5.75-7.80 7.30
May 6, 2015 6.00-7.60 7.33
May 7, 2015 6.00-8.85 7.78
May 8, 2015 5.50-7.80 7.14
May 9, 2015 5.00-7.50 6.38
May 11, 2015 6.00-8.25 7.61
May 12, 2015 6.00-7.75 7.24
May 13, 2015 6.00-7.80 7.39
May 14, 2015 6.00-7.75 7.46
May 15, 2015 5.25-7.82 7.26
(Per cent per annum)
Financial Markets

CURRENT STATISTICS
RBI Bulletin June 201572
No. 27: Certificates of Deposit
Item 2014 2015
Apr. 18 Mar. 6 Mar. 20 Apr. 3 Apr. 17
1 2 3 4 5
1 Amount Outstanding ( Billion) 3,877.3 2,742.7 2,809.7 3,291.0 2,981.9
1.1 Issued during the fortnight ( Billion) 117.7 668.6 650.9 443.3 151.1
2 Rate of Interest (per cent) 8.45-9.88 7.55-9.16 8.38-9.10 8.10-8.90 7.76-8.36
`
`
No. 28: Commercial Paper
Item 2014 2015
Apr. 30 Mar. 15 Mar. 31 Apr. 15 Apr. 30
1 2 3 4 5
1 Amount Outstanding ( Billion) 1,538.1 2,561.2 1,932.7 2,443.2 2,682.7
1.1 Reported during the fortnight ( Billion) 349.1 596.5 694.3 684.8 678.9
2 Rate of Interest (per cent) 8.58-13.30 7.91-13.06 7.44-14.92 7.78-11.36 7.84-12.03
`
`
(` Billion)
2014 2015
Apr. 25 Mar. 27 Apr. 3 Apr. 10 Apr. 17 Apr. 24
2 3 4 5 6 7
215.1 285.1 185.7 246.7 171.0 171.7
88.5 3.1 139.6 64.0 72.2 44.7
4.4 5.8 7.9 5.9 3.4 11.4
989.1 1,794.4 1,426.5 1,676.9 1,285.9 1,247.4
1,000.5 1,097.6 996.9 987.1 1,282.6 1,107.5
– – – – – –
48,124 68,251 77,297 65,471 54,100 63,422
809.3 553.1 559.7 656.4 572.3 839.5
25.1 18.2 17.4 13.3 29.4 19.8
32.3 33.3 45.0 61.2 28.9 29.4
17.7 12.1 6.2 18.8 23.5 23.0
32.8 19.0 32.5 44.1 64.5 34.7
– – – – – –
917.1 635.7 660.8 793.9 718.7 946.3
1.4 2.0 – 3.7 3.3 7.0
No. 29: Average Daily Turnover in Select Financial Markets
Item 2014-15
1
1 Call Money 190.3
2 Notice Money 65.4
3 Term Money 4.1
4 CBLO 1,168.3
5 Market Repo 1,097.6
6 Repo in Corporate Bond 0.3
7 Forex (US $ million) 56,541
8 Govt. of India Dated Securities 772.4
9 State Govt. Securities 15.8
10 Treasury Bills
10.1 91-Day 35
10.2 182-Day 12.1
10.3 364-Day 21.4
10.4 Cash Management Bills 0.7
11 Total Govt. Securities (8+9+10) 857.4
11.1 RBI –

CURRENT STATISTICS
RBI Bulletin June 2015 73
Apr. 2014 Apr. 2015
No. ofIssues
Amount No. ofIssues
Amount
7 8 9 10
1 Equity Shares 4 7.8 5 88.9
1A Premium3 7.0 5 87.7
1.1 Prospectus1 1.8 3 13.9
1.1.1 Premium1 1.7 3 13.1
1.2 Rights 3 6.0 2 75.0
1.2.1 Premium2 5.3 2 74.6
2 Preference Shares – – – –
2.1 Prospectus– – – –
2.2 Rights – – – –
3 Debentures 2 3.0 1 4.1
3.1 Convertible – – – –
3.1.1 Prospectus– – – –
3.1.2 Rights– – – –
3.2 Non-Convertible 2 3.0 1 4.1
3.2.1 Prospectus2 3.0 1 4.1
3.2.2 Rights– – – –
4 Bonds – – – –
4.1 Prospectus– – – –
4.2 Rights – – – –
5 Total (1+2+3+4)6 10.8 6 93.0
5.1 Prospectus3 4.8 4 18.0
5.2 Rights 3 6.0 2 75.0
2014-15 (Apr.-Apr.) 2015-16 (Apr.-Apr.)
No. ofIssues
Amount No. ofIssues
Amount
3 4 5 6
1 Equity Shares 4 7.8 5 88.9
1A Premium3 7.0 5 87.7
1.1 Prospectus1 1.8 3 13.9
1.1.1 Premium1 1.7 3 13.1
1.2 Rights 3 6.0 2 75.0
1.2.1 Premium2 5.3 2 74.6
2 Preference Shares – – – –
2.1 Prospectus– – – –
2.2 Rights – – – –
3 Debentures 2 3.0 1 4.1
3.1 Convertible – – – –
3.1.1 Prospectus– – – –
3.1.2 Rights– – – –
3.2 Non-Convertible 2 3.0 1 4.1
3.2.1 Prospectus2 3.0 1 4.1
3.2.2 Rights– – – –
4 Bonds – – – –
4.1 Prospectus– – – –
4.2 Rights – – – –
5 Total (1+2+3+4)6 10.8 6 93.0
5.1 Prospectus3 4.8 4 18.0
5.2 Rights 3 6.0 2 75.0
No. 30: New Capital Issues By Non-Government Public Limited Companies
Security & Type of Issue 2014-15
No. ofIssues
Amount
1 2
1 Equity Shares 63 93.1
1A Premium 53 76.8
1.1 Prospectus 46 30.4
1.1.1 Premium 40 28.0
1.2 Rights 17 62.8
1.2.1 Premium 13 48.8
2 Preference Shares – –
2.1 Prospectus – –
2.2 Rights – –
3 Debentures 23 77.7
3.1 Convertible – –
3.1.1 Prospectus – –
3.1.2 Rights – –
3.2 Non-Convertible 23 77.7
3.2.1 Prospectus 23 77.7
3.2.2 Rights – –
4 Bonds – –
4.1 Prospectus – –
4.2 Rights – –
5 Total (1+2+3+4) 86 170.9
5.1 Prospectus 69 108.1
5.2 Rights 17 62.8
(Amount in ` Billion)
Source: Based on prospectus/advertisements issued by companies, replies to Reserve Bank’s questionnaire and information received from SEBI, stock exchanges, press reports, etc.
* *
* : Data is Provisional
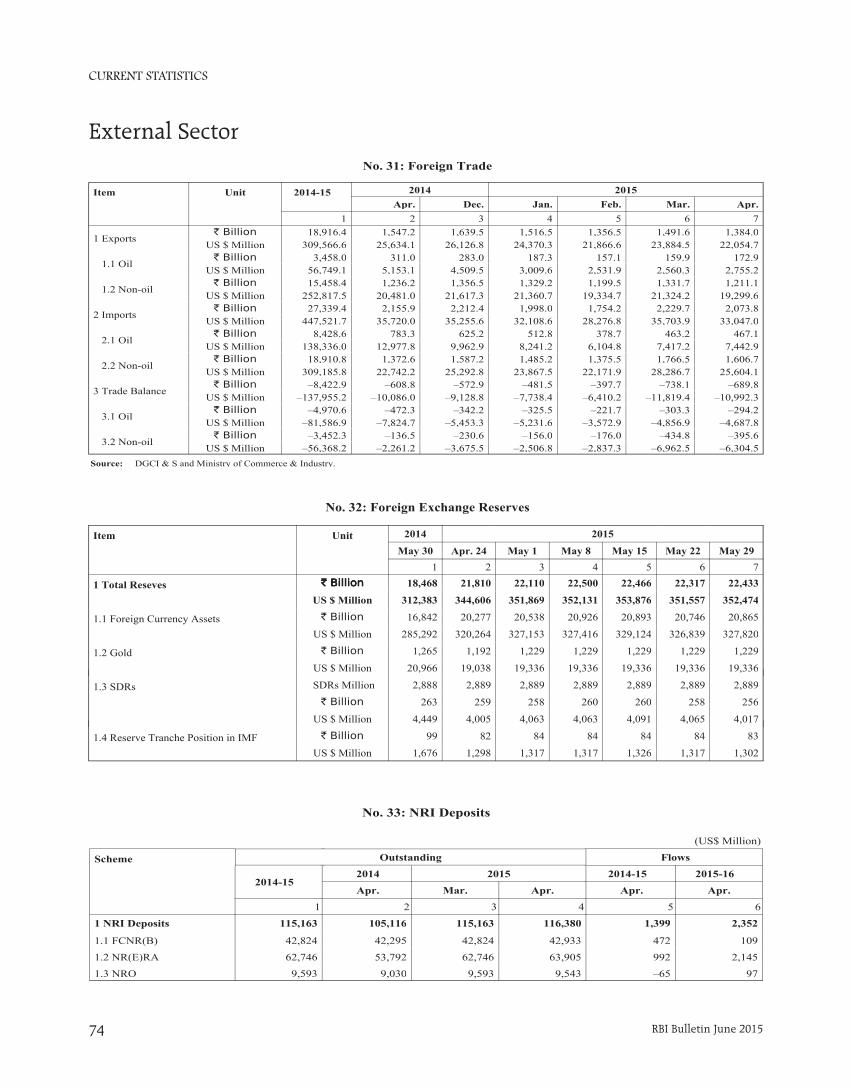
CURRENT STATISTICS
RBI Bulletin June 201574
No. 31: Foreign Trade
Item Unit 2014-15 2014 2015Apr. Dec. Jan. Feb. Mar. Apr.
1 2 3 4 5 6 7
1 Exports` Billion 18,916.4 1,547.2 1,639.5 1,516.5 1,356.5 1,491.6 1,384.0
US $ Million 309,566.6 25,634.1 26,126.8 24,370.3 21,866.6 23,884.5 22,054.7
1.1 Oil` Billion 3,458.0 311.0 283.0 187.3 157.1 159.9 172.9
US $ Million 56,749.1 5,153.1 4,509.5 3,009.6 2,531.9 2,560.3 2,755.2
1.2 Non-oil` Billion 15,458.4 1,236.2 1,356.5 1,329.2 1,199.5 1,331.7 1,211.1
US $ Million 252,817.5 20,481.0 21,617.3 21,360.7 19,334.7 21,324.2 19,299.6
2 Imports` Billion 27,339.4 2,155.9 2,212.4 1,998.0 1,754.2 2,229.7 2,073.8
US $ Million 447,521.7 35,720.0 35,255.6 32,108.6 28,276.8 35,703.9 33,047.0
2.1 Oil` Billion 8,428.6 783.3 625.2 512.8 378.7 463.2 467.1
US $ Million 138,336.0 12,977.8 9,962.9 8,241.2 6,104.8 7,417.2 7,442.9
2.2 Non-oil` Billion 18,910.8 1,372.6 1,587.2 1,485.2 1,375.5 1,766.5 1,606.7
US $ Million 309,185.8 22,742.2 25,292.8 23,867.5 22,171.9 28,286.7 25,604.1
3 Trade Balance` Billion –8,422.9 –608.8 –572.9 –481.5 –397.7 –738.1 –689.8
US $ Million –137,955.2 –10,086.0 –9,128.8 –7,738.4 –6,410.2 –11,819.4 –10,992.3
3.1 Oil` Billion –4,970.6 –472.3 –342.2 –325.5 –221.7 –303.3 –294.2
US $ Million –81,586.9 –7,824.7 –5,453.3 –5,231.6 –3,572.9 –4,856.9 –4,687.8
3.2 Non-oil` Billion –3,452.3 –136.5 –230.6 –156.0 –176.0 –434.8 –395.6
US $ Million –56,368.2 –2,261.2 –3,675.5 –2,506.8 –2,837.3 –6,962.5 –6,304.5Source: DGCI & S and Ministry of Commerce & Industry.
1.4 Reserve Tranche Position in IMF ` Billion 99 82 84 84 84 84 83
US $ Million 1,676 1,298 1,317 1,317 1,326 1,317 1,302
1.3 SDRs SDRs Million 2,888 2,889 2,889 2,889 2,889 2,889 2,889
` Billion 263 259 258 260 260 258 256
US $ Million 4,449 4,005 4,063 4,063 4,091 4,065 4,017
No. 32: Foreign Exchange Reserves
Item Unit 2014 2015
May 30 Apr. 24 May 1 May 8 May 15 May 22 May 29
1 2 3 4 5 6 7
1 Total Reseves ` Billion` Billion` Billion` Billion 18,468 21,810 22,110 22,500 22,466 22,317 22,433
US $ Million 312,383 344,606 351,869 352,131 353,876 351,557 352,474
1.1 Foreign Currency Assets ` Billion 16,842 20,277 20,538 20,926 20,893 20,746 20,865
US $ Million 285,292 320,264 327,153 327,416 329,124 326,839 327,820
1.2 Gold ` Billion 1,265 1,192 1,229 1,229 1,229 1,229 1,229
US $ Million 20,966 19,038 19,336 19,336 19,336 19,336 19,336
No. 33: NRI Deposits
(US$ Million)
Flows
2014-15 2015-16
Apr. Apr.
5 6
1,399 2,352
472 109
992 2,145
–65 97
2014 2015
Apr. Mar. Apr.
2 3 4
105,116 115,163 116,380
42,295 42,824 42,933
53,792 62,746 63,905
9,030 9,593 9,543
Scheme
2014-15
1
1 NRI Deposits 115,163
1.1 FCNR(B) 42,824
1.2 NR(E)RA 62,746
1.3 NRO 9,593
Outstanding
External Sector

CURRENT STATISTICS
RBI Bulletin June 2015 75
No. 34: Foreign Investment Inflows(US$ Million)
2014 2015
Apr. Mar. Apr.
4 5 6
1.1 Net Foreign Direct Investment (1.1.1–1.1.2) 1,981 1,714 2,721
1.1.1 Direct Investment to India (1.1.1.1–1. 1.1.2) 1,969 2,267 2,761
1.1.1.1 Gross Inflows/Gross Investments 2,622 3,483 4,724
1.1.1.1.1 Equity 1,779 2,206 3,679
1.1.1.1.1.1 Government (SIA/FIPB) 99 241 79
1.1.1.1.1.2 RBI 1,141 1,640 3,225
1.1.1.1.1.3 Acquisition of shares 465 236 301 1.1.1.1.1.4 Equity capital of unincorporated bodies 74 89 74
1.1.1.1.2 Reinvested earnings 686 819 686
1.1.1.1.3 Other capital 156 458 358
1.1.1.2 Repatriation/Disinvestment 652 1,215 1,962
1.1.1.2.1 Equity 635 1,191 1,957
1.1.1.2.2 Other capital 18 24 6 1.1.2 Foreign Direct Investment by India (1.1.2.1+1.1.2.2+1.1.2.3–1.1.2.4) –11 553 41
1.1.2.1 Equity capital 221 556 284
1.1.2.2 Reinvested Earnings 92 87 92
1.1.2.3 Other Capital 196 482 332
1.1.2.4 Repatriation/Disinvestment 521 572 668
1.2 Net Portfolio Investment (1.2.1+1.2.2+1.2.3–1.2.4) –77 2,038 3,174
1.2.1 GDRs/ADRs – – –
1.2.2 FIIs –69 2,032 3,129
1.2.3 Offshore funds and others – – –
1.2.4 Portfolio investment by India 8 –5 –45
1 Foreign Investment Inflows 1,904 3,752 5,894
2014-15 2015-16
Apr. Apr.
2 3
1.1 Net Foreign Direct Investment (1.1.1–1.1.2) 1,981 2,721
1.1.1 Direct Investment to India (1.1.1.1–1. 1.1.2) 1,969 2,761
1.1.1.1 Gross Inflows/Gross Investments 2,622 4,724
1.1.1.1.1 Equity 1,779 3,679
1.1.1.1.1.1 Government (SIA/FIPB) 99 79
1.1.1.1.1.2 RBI 1,141 3,225
1.1.1.1.1.3 Acquisition of shares 465 301 1.1.1.1.1.4 Equity capital of unincorporated bodies 74 74
1.1.1.1.2 Reinvested earnings 686 686
1.1.1.1.3 Other capital 156 358
1.1.1.2 Repatriation/Disinvestment 652 1,962
1.1.1.2.1 Equity 635 1,957
1.1.1.2.2 Other capital 18 6 1.1.2 Foreign Direct Investment by India (1.1.2.1+1.1.2.2+1.1.2.3–1.1.2.4) –11 41
1.1.2.1 Equity capital 221 284
1.1.2.2 Reinvested Earnings 92 92
1.1.2.3 Other Capital 196 332
1.1.2.4 Repatriation/Disinvestment 521 668
1.2 Net Portfolio Investment (1.2.1+1.2.2+1.2.3–1.2.4) –77 3,174
1.2.1 GDRs/ADRs – –
1.2.2 FIIs –69 3,129
1.2.3 Offshore funds and others – –
1.2.4 Portfolio investment by India 8 –45
1 Foreign Investment Inflows 1,904 5,894
Item 2014-15
1
1.1 Net Foreign Direct Investment (1.1.1–1.1.2) 32,628
1.1.1 Direct Investment to India (1.1.1.1–1. 1.1.2) 34,427
1.1.1.1 Gross Inflows/Gross Investments 44,291
1.1.1.1.1 Equity 31,885
1.1.1.1.1.1 Government (SIA/FIPB) 2,219
1.1.1.1.1.2 RBI 22,530
1.1.1.1.1.3 Acquisition of shares 6,185 1.1.1.1.1.4 Equity capital of unincorporated bodies 952
1.1.1.1.2 Reinvested earnings 8,983
1.1.1.1.3 Other capital 3,423
1.1.1.2 Repatriation/Disinvestment 9,864
1.1.1.2.1 Equity 9,612
1.1.1.2.2 Other capital 252 1.1.2 Foreign Direct Investment by India (1.1.2.1+1.1.2.2+1.1.2.3–1.1.2.4) 1,799
1.1.2.1 Equity capital 4,075
1.1.2.2 Reinvested Earnings 1,092
1.1.2.3 Other Capital 3,280
1.1.2.4 Repatriation/Disinvestment 6,649
1.2 Net Portfolio Investment (1.2.1+1.2.2+1.2.3–1.2.4) 40,934
1.2.1 GDRs/ADRs –
1.2.2 FIIs 40,923
1.2.3 Offshore funds and others –
1.2.4 Portfolio investment by India –11
1 Foreign Investment Inflows 73,562
No. 35: Outward Remittances under the Liberalised Remittance Scheme (LRS) for Resident Individuals
(US$ Million)2014 2015
Feb. Dec. Jan. Feb.2 3 4 5
74.8 95.1 150.9 122.52.5 3.4 3.1 3.61.4 3.2 5.1 7.0
10.6 15.8 13.7 18.616.6 30.1 33.6 38.8
– 0.2 0.1 0.50.7 0.8 0.7 0.88.6 11.1 20.0 14.60.3 0.8 0.6 0.49.6 20.2 51.4 24.8
24.4 9.4 22.6 13.3
Item 2013-14
11 Outward Remittances under the LRS 1,093.9 1.1 Deposit 31.6 1.2 Purchase of immovable property 58.7 1.3 Investment in equity/debt 165.5 1.4 Gift 267.1 1.5 Donations 2.0 1.6 Travel 15.9 1.7 Maintenance of close relatives 173.9 1.8 Medical Treatment 4.7 1.9 Studies Abroad 159.3 1.10 Others 215.3

CURRENT STATISTICS
RBI Bulletin June 201576
No. 36: Indices of Real Effective Exchange Rate (REER) and Nominal Effective Exchange Rate (NEER) of the Indian Rupee
68.58 70.90 68.94
117.51 125.68 122.21
101.23 104.65 101.76
104.20 111.45 108.37
2014 2015
May April May
3 4 5
74.13 76.13 74.45
107.05 112.09 109.63
75.31 77.41 75.69
109.26 114.72 112.172013-14 2014-15 6-Currency Trade Based Weights
1 Base: 2004-05 (April-March) =100
1.1 NEER 67.75 68.63
1.2 REER 112.77 120.02
2 Base: 2013-14 (April-March) =100
2.1 NEER 100.00 101.30
2.2 REER 100.00 106.43
Item
2013-14 2014-15
1 2
36-Currency Export and Trade Based Weights (Base: 2004-05=100)
1 Trade-Based Weights
1.1 NEER 72.32 74.08
1.2 REER 103.27 108.93
2 Export-Based Weights
2.1 NEER 73.56 75.21
2.2 REER 105.48 111.24
(Amount in US$ Million)
2014 2015
Apr. Mar. Apr.
2 3 4
34 105 47
1,677 1,943 669
11 6 2
1,526 722 58
45 111 49
3,203 2,665 729
6.61 5.22 5.27
2.08 1.83 1.86
0.00-9.28 0.00-10.60 0.00-12.00
No. 37: External Commercial Borrowings (ECBs)
Item 2014-15
1
1 Automatic Route
1.1 Number 733
1.2 Amount 19,215
2 Approval Route
2.1 Number 88
2.2 Amount 9,170
3 Total (1+2)
3.1 Number 821
3.2 Amount 28,385
4 Weighted Average Maturity (in years) 6.49
5 Interest Rate (per cent)
5.1 Weighted Average Margin over 6-month LIBOR or reference rate for Floating Rate Loans 2.12
5.2 Interest rate range for Fixed Rate Loans 0.00-13.50

CURRENT STATISTICS
RBI Bulletin June 2015 77
No. 38: India's Overall Balance of Payments
(US $ Million)
Item
Oct-Dec 2013 (PR) Oct-Dec 2014 (P)
Credit Debit Net Credit Debit Net
1 2 3 4 5 6
Overall Balance of Payments(1+2+3) 266,988 247,885 19,103 261,893 248,712 13,1821 CURRENT ACCOUNT (1.1+ 1.2) 138,057 142,154 –4,097 139,114 147,509 –8,3951.1 MERCHANDISE 79,795 112,947 –33,152 78,999 118,246 –39,2471.2 INVISIBLES (1.2.1+1.2.2+1.2.3) 58,262 29,207 29,054 60,115 29,263 30,852 1.2.1 Services 37,643 19,523 18,120 39,639 19,352 20,287 1.2.1.1 Travel 5,091 2,748 2,343 5,461 3,676 1,786 1.2.1.2 Transportation 4,114 3,421 693 4,657 4,125 532 1.2.1.3 Insurance 487 290 197 565 314 251 1.2.1.4 G.n.i.e. 104 171 –67 158 224 –66 1.2.1.5 Miscellaneous 27,847 12,893 14,953 28,797 11,013 17,784 1.2.1.5.1 Software Services 17,475 654 16,821 18,692 848 17,844 1.2.1.5.2 Business Services 6,905 6,720 186 7,207 7,068 139 1.2.1.5.3 Financial Services 1,708 1,277 432 1,334 736 598 1.2.1.5.4 Communication Services 516 219 297 537 222 315 1.2.2 Transfers 17,649 1,269 16,380 17,542 1,150 16,392 1.2.2.1 Official 401 229 172 130 265 –135 1.2.2.2 Private 17,247 1,040 16,208 17,412 885 16,527 1.2.3 Income 2,970 8,416 –5,446 2,934 8,760 –5,827 1.2.3.1 Investment Income 2,150 7,763 –5,613 2,008 8,144 –6,136 1.2.3.2 Compensation of Employees 820 653 167 926 617 3092 CAPITAL ACCOUNT (2.1+2.2+2.3+2.4+2.5) 128,931 105,144 23,787 122,779 99,427 23,3522.1 Foreign Investment (2.1.1+2.1.2) 54,564 46,108 8,456 67,179 53,543 13,636 2.1.1 Foreign Direct Investment 9,689 3,623 6,066 11,596 4,240 7,356 2.1.1.1 In India 7,188 1,410 5,778 9,796 2,152 7,644 2.1.1.1.1 Equity 4,224 1,324 2,900 6,588 2,084 4,504 2.1.1.1.2 Reinvested Earnings 2,374 – 2,374 2,379 – 2,379 2.1.1.1.3 Other Capital 590 86 504 829 68 761 2.1.1.2 Abroad 2,501 2,213 288 1,799 2,088 –288 2.1.1.2.1 Equity 2,501 1,292 1,209 1,799 1,179 620 2.1.1.2.2 Reinvested Earnings – 297 –297 – 260 –260 2.1.1.2.3 Other Capital – 624 –624 – 649 –649 2.1.2 Portfolio Investment 44,875 42,485 2,390 55,583 49,303 6,280 2.1.2.1 In India 44,777 42,243 2,534 55,354 49,204 6,150 2.1.2.1.1 FIIs 44,777 42,243 2,534 55,354 49,204 6,150 2.1.2.1.1.1 Equity 36,278 30,057 6,221 40,972 40,728 243 2.1.2.1.1.2 Debt 8,498 12,186 –3,688 14,382 8,475 5,906 2.1.2.1.2 ADR/GDRs – – – – – – 2.1.2.2 Abroad 98 242 –144 230 99 1302.2 Loans (2.2.1+2.2.2+2.2.3) 31,440 28,429 3,012 28,456 27,792 664 2.2.1 External Assistance 1,044 1,084 –40 1,387 1,130 258 2.2.1.1 By India 11 61 –50 15 128 –113 2.2.1.2 To India 1,033 1,023 10 1,372 1,002 370 2.2.2 Commercial Borrowings 7,551 3,340 4,211 9,498 7,739 1,759 2.2.2.1 By India 234 90 144 410 38 373 2.2.2.2 To India 7,317 3,250 4,067 9,088 7,702 1,386 2.2.3 Short Term to India 22,846 24,005 –1,159 17,570 18,923 –1,353 2.2.3.1 Suppliers' Credit > 180 days & Buyers' Credit 22,846 23,255 –409 16,821 18,923 –2,102 2.2.3.2 Suppliers' Credit up to 180 days – 750 –750 749 – 7492.3 Banking Capital (2.3.1+2.3.2) 38,288 22,530 15,758 23,650 13,149 10,501 2.3.1 Commercial Banks 38,100 22,530 15,570 23,335 13,149 10,186 2.3.1.1 Assets 3,191 7,811 –4,620 6,526 446 6,081 2.3.1.2 Liabilities 34,909 14,719 20,190 16,809 12,703 4,105 2.3.1.2.1 Non-Resident Deposits 33,025 11,577 21,448 14,493 10,910 3,583 2.3.2 Others 188 – 188 315 – 3152.4 Rupee Debt Service – – – – – –2.5 Other Capital 4,638 8,077 –3,439 3,495 4,944 –1,4493 Errors & Omissions – 586 –586 – 1,776 –1,7764 Monetary Movements (4.1+ 4.2) – 19,103 –19,103 – 13,182 –13,182 4.1 I.M.F. – – – – – – 4.2 Foreign Exchange Reserves (Increase - / Decrease +) – 19,103 –19,103 – 13,182 –13,182

CURRENT STATISTICS
RBI Bulletin June 201578
No. 39: India's Overall Balance of Payments
(` Billion)
Item
Oct-Dec 2013 (PR) Oct-Dec 2014 (P)
Credit Debit Net Credit Debit Net
1 2 3 4 5 6
Overall Balance of Payments(1+2+3) 16,567 15,382 1,185 16,220 15,403 8161 CURRENT ACCOUNT (1.1+ 1.2) 8,567 8,821 –254 8,616 9,136 –5201.1 MERCHANDISE 4,951 7,009 –2,057 4,893 7,323 –2,4311.2 INVISIBLES (1.2.1+1.2.2+1.2.3) 3,615 1,812 1,803 3,723 1,812 1,911 1.2.1 Services 2,336 1,211 1,124 2,455 1,199 1,256 1.2.1.1 Travel 316 171 145 338 228 111 1.2.1.2 Transportation 255 212 43 288 255 33 1.2.1.3 Insurance 30 18 12 35 19 16 1.2.1.4 G.n.i.e. 6 11 –4 10 14 –4 1.2.1.5 Miscellaneous 1,728 800 928 1,784 682 1,101 1.2.1.5.1 Software Services 1,084 41 1,044 1,158 53 1,105 1.2.1.5.2 Business Services 428 417 12 446 438 9 1.2.1.5.3 Financial Services 106 79 27 83 46 37 1.2.1.5.4 Communication Services 32 14 18 33 14 20 1.2.2 Transfers 1,095 79 1,016 1,086 71 1,015 1.2.2.1 Official 25 14 11 8 16 –8 1.2.2.2 Private 1,070 65 1,006 1,078 55 1,024 1.2.3 Income 184 522 –338 182 543 –361 1.2.3.1 Investment Income 133 482 –348 124 504 –380 1.2.3.2 Compensation of Employees 51 41 10 57 38 192 CAPITAL ACCOUNT (2.1+2.2+2.3+2.4+2.5) 8,001 6,525 1,476 7,604 6,158 1,4462.1 Foreign Investment (2.1.1+2.1.2) 3,386 2,861 525 4,161 3,316 845 2.1.1 Foreign Direct Investment 601 225 376 718 263 456 2.1.1.1 In India 446 88 359 607 133 473 2.1.1.1.1 Equity 262 82 180 408 129 279 2.1.1.1.2 Reinvested Earnings 147 – 147 147 – 147 2.1.1.1.3 Other Capital 37 5 31 51 4 47 2.1.1.2 Abroad 155 137 18 111 129 –18 2.1.1.2.1 Equity 155 80 75 111 73 38 2.1.1.2.2 Reinvested Earnings – 18 –18 – 16 –16 2.1.1.2.3 Other Capital – 39 –39 – 40 –40 2.1.2 Portfolio Investment 2,785 2,636 148 3,442 3,053 389 2.1.2.1 In India 2,779 2,621 157 3,428 3,047 381 2.1.2.1.1 FIIs 2,779 2,621 157 3,428 3,047 381 2.1.2.1.1.1 Equity 2,251 1,865 386 2,538 2,522 15 2.1.2.1.1.2 Debt 527 756 –229 891 525 366 2.1.2.1.2 ADR/GDRs – – – – – – 2.1.2.2 Abroad 6 15 –9 14 6 82.2 Loans (2.2.1+2.2.2+2.2.3) 1,951 1,764 187 1,762 1,721 41 2.2.1 External Assistance 65 67 –2 86 70 16 2.2.1.1 By India 1 4 –3 1 8 –7 2.2.1.2 To India 64 63 1 85 62 23 2.2.2 Commercial Borrowings 469 207 261 588 479 109 2.2.2.1 By India 15 6 9 25 2 23 2.2.2.2 To India 454 202 252 563 477 86 2.2.3 Short Term to India 1,418 1,490 –72 1,088 1,172 –84 2.2.3.1 Suppliers' Credit > 180 days & Buyers' Credit 1,418 1,443 –25 1,042 1,172 –130 2.2.3.2 Suppliers' Credit up to 180 days – 47 –47 46 – 462.3 Banking Capital (2.3.1+2.3.2) 2,376 1,398 978 1,465 814 650 2.3.1 Commercial Banks 2,364 1,398 966 1,445 814 631 2.3.1.1 Assets 198 485 –287 404 28 377 2.3.1.2 Liabilities 2,166 913 1,253 1,041 787 254 2.3.1.2.1 Non-Resident Deposits 2,049 718 1,331 898 676 222 2.3.2 Others 12 – 12 20 – 202.4 Rupee Debt Service – – – – – –2.5 Other Capital 288 501 –213 216 306 –903 Errors & Omissions – 36 –36 – 110 –1104 Monetary Movements (4.1+ 4.2) – 1,185 –1,185 – 816 –816 4.1 I.M.F. – – – – – – 4.2 Foreign Exchange Reserves (Increase - / Decrease +) – 1,185 –1,185 – 816 –816

CURRENT STATISTICS
RBI Bulletin June 2015 79
(US $ Million)
Item Oct-Dec 2013 (PR) Oct-Dec 2014 (P)Credit Debit Net Credit Debit Net
1 2 3 4 5 61 Current Account (1.A+1.B+1.C) 137,707 141,930 –4,223 139,025 147,251 –8,226 1.A Goods and Services (1.A.a+1.A.b) 117,438 132,469 –15,032 118,638 137,598 –18,960 1.A.a Goods (1.A.a.1 to 1.A.a.3) 79,795 112,947 –33,152 78,999 118,246 –39,247 1.A.a.1 General merchandise on a BOP basis 79,214 109,812 –30,597 78,999 107,168 –28,169 1.A.a.2 Net exports of goods under merchanting 580 – 580 – – – 1.A.a.3 Nonmonetary gold – 3,135 –3,135 – 11,078 –11,078 1.A.b Services (1.A.b.1 to 1.A.b.13) 37,643 19,523 18,120 39,639 19,352 20,287 1.A.b.1 Manufacturing services on physical inputs owned by others 18 5 13 28 5 24 1.A.b.2 Maintenance and repair services n.i.e. 30 63 –33 66 54 12 1.A.b.3 Transport 4,114 3,421 693 4,657 4,125 532 1.A.b.4 Travel 5,091 2,748 2,343 5,461 3,676 1,786 1.A.b.5 Construction 299 320 –21 351 273 78 1.A.b.6 Insurance and pension services 487 290 197 565 314 251 1.A.b.7 Financial services 1,708 1,277 432 1,334 736 598 1.A.b.8 Charges for the use of intellectual property n.i.e. 179 1,024 –845 181 1,300 –1,120 1.A.b.9 Telecommunications, computer, and information services 18,035 932 17,102 19,279 1,155 18,124 1.A.b.10 Other business services 6,905 6,720 186 7,207 7,068 139 1.A.b.11 Personal, cultural, and recreational services 301 193 109 289 403 –114 1.A.b.12 Government goods and services n.i.e. 104 171 –67 158 224 –66 1.A.b.13 Others n.i.e. 371 2,360 –1,989 62 20 42 1.B Primary Income (1.B.1 to 1.B.3) 2,970 8,416 –5,446 2,934 8,760 –5,827 1.B.1 Compensation of employees 820 653 167 926 617 309 1.B.2 Investment income 1,819 7,711 –5,892 1,616 8,089 –6,473 1.B.2.1 Direct investment 824 3,469 –2,645 745 2,936 –2,190 1.B.2.2 Portfolio investment 90 1,190 –1,100 29 1,662 –1,633 1.B.2.3 Other investment 130 3,052 –2,922 97 3,490 –3,393 1.B.2.4 Reserve assets 775 – 775 744 1 744 1.B.3 Other primary income 331 52 279 392 55 338 1.C Secondary Income (1.C.1+1.C.2) 17,299 1,045 16,254 17,454 893 16,561 1.C.1 Financial corporations, nonfinancial corporations, households, and NPISHs 17,247 1,040 16,208 17,412 885 16,527 1.C.1.1 Personal transfers (Current transfers between resident and/ non-resident households) 16,713 986 15,728 16,773 803 15,970 1.C.1.2 Other current transfers 534 54 480 639 82 557 1.C.2 General government 52 6 47 41 8 342 Capital Account (2.1+2.2) 406 297 110 271 317 –45 2.1 Gross acquisitions (DR.)/disposals (CR.) of non-produced nonfinancial assets 41 35 6 152 23 129 2.2 Capital transfers 365 261 103 119 293 –1743 Financial Account (3.1 to 3.5) 128,909 124,209 4,700 122,597 112,550 10,047 3.1 Direct Investment (3.1A+3.1B) 9,689 3,623 6,066 11,596 4,240 7,356 3.1.A Direct Investment in India 7,188 1,410 5,778 9,796 2,152 7,644 3.1.A.1 Equity and investment fund shares 6,598 1,324 5,274 8,967 2,084 6,883 3.1.A.1.1 Equity other than reinvestment of earnings 4,224 1,324 2,900 6,588 2,084 4,504 3.1.A.1.2 Reinvestment of earnings 2,374 – 2,374 2,379 – 2,379 3.1.A.2 Debt instruments 590 86 504 829 68 761 3.1.A.2.1 Direct investor in direct investment enterprises 590 86 504 829 68 761 3.1.B Direct Investment by India 2,501 2,213 288 1,799 2,088 –288 3.1.B.1 Equity and investment fund shares 2,501 1,589 912 1,799 1,439 361 3.1.B.1.1 Equity other than reinvestment of earnings 2,501 1,292 1,209 1,799 1,179 620 3.1.B.1.2 Reinvestment of earnings – 297 –297 – 260 –260 3.1.B.2 Debt instruments – 624 –624 – 649 –649 3.1.B.2.1 Direct investor in direct investment enterprises – 624 –624 – 649 –649 3.2 Portfolio Investment 44,875 42,485 2,390 55,583 49,303 6,280 3.2.A Portfolio Investment in India 44,777 42,243 2,534 55,354 49,204 6,150 3.2.1 Equity and investment fund shares 36,278 30,057 6,221 40,972 40,728 243 3.2.2 Debt securities 8,498 12,186 –3,688 14,382 8,475 5,906 3.2.B Portfolio Investment by India 98 242 –144 230 99 130 3.3 Financial derivatives (other than reserves) and employee stock options 2,286 1,498 788 1,866 4,209 –2,343 3.4 Other investment 72,059 57,500 14,558 53,553 41,616 11,936 3.4.1 Other equity (ADRs/GDRs) – – – – – – 3.4.2 Currency and deposits 33,213 11,577 21,636 14,808 10,910 3,898 3.4.2.1 Central bank (Rupee Debt Movements; NRG) 188 – 188 315 – 315 3.4.2.2 Deposit-taking corporations, except the central bank (NRI Deposits) 33,025 11,577 21,448 14,493 10,910 3,583 3.4.2.3 General government – – – – – – 3.4.2.4 Other sectors – – – – – – 3.4.3 Loans (External Assistance, ECBs and Banking Capital) 13,670 15,377 –1,707 19,728 11,108 8,619 3.4.3.A Loans to India 13,425 15,226 –1,801 19,302 10,943 8,359 3.4.3.B Loans by India 245 151 94 426 165 260 3.4.4 Insurance, pension, and standardized guarantee schemes 13 181 –168 211 135 76 3.4.5 Trade credit and advances 22,846 24,005 –1,159 17,570 18,923 –1,353 3.4.6 Other accounts receivable/payable - other 2,317 6,361 –4,043 1,237 541 696 3.4.7 Special drawing rights – – – – – – 3.5 Reserve assets – 19,103 –19,103 – 13,182 –13,182 3.5.1 Monetary gold – – – – – – 3.5.2 Special drawing rights n.a. – – – – – – 3.5.3 Reserve position in the IMF n.a. – – – – – – 3.5.4 Other reserve assets (Foreign Currency Assets) – 19,103 –19,103 – 13,182 –13,1824 Total assets/liabilities 128,909 124,209 4,700 122,597 112,550 10,047 4.1 Equity and investment fund shares 47,775 34,891 12,884 54,044 48,694 5,350 4.2 Debt instruments 78,817 63,855 14,962 67,316 50,133 17,183 4.3 Other financial assets and liabilities 2,317 25,463 –23,146 1,237 13,722 –12,4865 Net errors and omissions – 586 –586 – 1,776 –1,776
No. 40: Standard Presentation of BoP in India as per BPM6

CURRENT STATISTICS
RBI Bulletin June 201580
(` Billion)
Item Oct-Dec 2013 (PR) Oct-Dec 2014 (P)Credit Debit Net Credit Debit Net
1 2 3 4 5 61 Current Account (1.A+1.B+1.C) 8,545 8,807 –262 8,610 9,120 –509 1.A Goods and Services (1.A.a+1.A.b) 7,287 8,220 –933 7,348 8,522 –1,174 1.A.a Goods (1.A.a.1 to 1.A.a.3) 4,951 7,009 –2,057 4,893 7,323 –2,431 1.A.a.1 General merchandise on a BOP basis 4,915 6,814 –1,899 4,893 6,637 –1,745 1.A.a.2 Net exports of goods under merchanting 36 – 36 – – – 1.A.a.3 Nonmonetary gold – 195 –195 – 686 –686 1.A.b Services (1.A.b.1 to 1.A.b.13) 2,336 1,211 1,124 2,455 1,199 1,256 1.A.b.1 Manufacturing services on physical inputs owned by others 1 – 1 2 0 1 1.A.b.2 Maintenance and repair services n.i.e. 2 4 –2 4 3 1 1.A.b.3 Transport 255 212 43 288 255 33 1.A.b.4 Travel 316 171 145 338 228 111 1.A.b.5 Construction 19 20 –1 22 17 5 1.A.b.6 Insurance and pension services 30 18 12 35 19 16 1.A.b.7 Financial services 106 79 27 83 46 37 1.A.b.8 Charges for the use of intellectual property n.i.e. 11 64 –52 11 81 –69 1.A.b.9 Telecommunications, computer, and information services 1,119 58 1,061 1,194 72 1,122 1.A.b.10 Other business services 428 417 12 446 438 9 1.A.b.11 Personal, cultural, and recreational services 19 12 7 18 25 –7 1.A.b.12 Government goods and services n.i.e. 6 11 –4 10 14 –4 1.A.b.13 Others n.i.e. 23 146 –123 4 1 3 1.B Primary Income (1.B.1 to 1.B.3) 184 522 –338 182 543 –361 1.B.1 Compensation of employees 51 41 10 57 38 19 1.B.2 Investment income 113 478 –366 100 501 –401 1.B.2.1 Direct investment 51 215 –164 46 182 –136 1.B.2.2 Portfolio investment 6 74 –68 2 103 –101 1.B.2.3 Other investment 8 189 –181 6 216 –210 1.B.2.4 Reserve assets 48 – 48 46 0 46 1.B.3 Other primary income 21 3 17 24 3 21 1.C Secondary Income (1.C.1+1.C.2) 1,073 65 1,009 1,081 55 1,026 1.C.1 Financial corporations, nonfinancial corporations, households, and NPISHs 1,070 65 1,006 1,078 55 1,024 1.C.1.1 Personal transfers (Current transfers between resident and/ non-resident households) 1,037 61 976 1,039 50 989 1.C.1.2 Other current transfers 33 3 30 40 5 35 1.C.2 General government 3 – 3 3 0 22 Capital Account (2.1+2.2) 25 18 7 17 20 –3 2.1 Gross acquisitions (DR.)/disposals (CR.) of non-produced nonfinancial assets 3 2 – 9 1 8 2.2 Capital transfers 23 16 6 7 18 –113 Financial Account (3.1 to 3.5) 7,999 7,708 292 7,593 6,971 622 3.1 Direct Investment (3.1A+3.1B) 601 225 376 718 263 456 3.1.A Direct Investment in India 446 88 359 607 133 473 3.1.A.1 Equity and investment fund shares 409 82 327 555 129 426 3.1.A.1.1 Equity other than reinvestment of earnings 262 82 180 408 129 279 3.1.A.1.2 Reinvestment of earnings 147 – 147 147 – 147 3.1.A.2 Debt instruments 37 5 31 51 4 47 3.1.A.2.1 Direct investor in direct investment enterprises 37 5 31 51 4 47 3.1.B Direct Investment by India 155 137 18 111 129 –18 3.1.B.1 Equity and investment fund shares 155 99 57 111 89 22 3.1.B.1.1 Equity other than reinvestment of earnings 155 80 75 111 73 38 3.1.B.1.2 Reinvestment of earnings – 18 –18 – 16 –16 3.1.B.2 Debt instruments – 39 –39 – 40 –40 3.1.B.2.1 Direct investor in direct investment enterprises – 39 –39 – 40 –40 3.2 Portfolio Investment 2,785 2,636 148 3,442 3,053 389 3.2.A Portfolio Investment in India 2,779 2,621 157 3,428 3,047 381 3.2.1 Equity and investment fund shares 2,251 1,865 386 2,538 2,522 15 3.2.2 Debt securities 527 756 –229 891 525 366 3.2.B Portfolio Investment by India 6 15 –9 14 6 8 3.3 Financial derivatives (other than reserves) and employee stock options 142 93 49 116 261 –145 3.4 Other investment 4,471 3,568 903 3,317 2,577 739 3.4.1 Other equity (ADRs/GDRs) – – – – – – 3.4.2 Currency and deposits 2,061 718 1,343 917 676 241 3.4.2.1 Central bank (Rupee Debt Movements; NRG) 12 – 12 20 – 20 3.4.2.2 Deposit-taking corporations, except the central bank (NRI Deposits) 2,049 718 1,331 898 676 222 3.4.2.3 General government – – – – – – 3.4.2.4 Other sectors – – – – – – 3.4.3 Loans (External Assistance, ECBs and Banking Capital) 848 954 –106 1,222 688 534 3.4.3.A Loans to India 833 945 –112 1,195 678 518 3.4.3.B Loans by India 15 9 6 26 10 16 3.4.4 Insurance, pension, and standardized guarantee schemes 1 11 –10 13 8 5 3.4.5 Trade credit and advances 1,418 1,490 –72 1,088 1,172 –84 3.4.6 Other accounts receivable/payable - other 144 395 –251 77 33 43 3.4.7 Special drawing rights – – – – – – 3.5 Reserve assets – 1,185 –1,185 – 816 –816 3.5.1 Monetary gold – – – – – – 3.5.2 Special drawing rights n.a. – – – – – – 3.5.3 Reserve position in the IMF n.a. – – – – – – 3.5.4 Other reserve assets (Foreign Currency Assets) – 1,185 –1,185 – 816 –8164 Total assets/liabilities 7,999 7,708 292 7,593 6,971 622 4.1 Equity and investment fund shares 2,965 2,165 799 3,347 3,016 331 4.2 Debt instruments 4,891 3,962 928 4,169 3,105 1,064 4.3 Other financial assets and liabilities 144 1,580 –1,436 77 850 –7735 Net errors and omissions – 36 –36 – 110 –110
No. 41: Standard Presentation of BoP in India as per BPM6

CURRENT STATISTICS
RBI Bulletin June 2015 81
(US$ Million)
2013 2014
Dec. Sep. Dec.
Assets Assets Assets
3 4 5
–318,581 –357,731 –356,505
Item 2013-14
Assets
1
6 IIP (Assets - Liabilities) –336,970
(US$ Million)
2013 2014
Dec. Sep. Dec.
Assets Liabilities Assets Liabilities Assets Liabilities
3 4 5 6 7 8
119,838 226,552 129,290 252,294 129,578 252,331
82,733 215,631 89,967 241,017 89,607 241,210
37,105 10,920 39,322 11,277 39,972 11,122
1,340 179,588 1,282 212,371 1,430 211,772
1,184 132,348 947 144,848 1,095 141,157
156 47,241 335 67,523 335 70,615
43,849 371,346 44,055 381,535 38,799 382,857
10,859 88,369 7,474 82,483 6,341 81,028
5,553 171,071 5,142 177,419 4,169 178,670
13,867 98,772 14,972 108,870 11,935 110,199
13,570 13,134 16,468 12,763 16,354 12,960
293,878 – 313,841 – 320,649 –
458,904 777,485 488,468 846,199 490,456 846,961
No. 42: International Investment Position
Item2013-14
Assets Liabilities
1 2
1 Direct Investment Abroad/in India 128,709 242,741
1.1 Equity Capital and Reinvested Earnings 90,902 231,724
1.2 Other Capital 37,807 11,017
2 Portfolio Investment 1,206 197,489
2.1 Equity 946 139,661
2.2 Debt 261 57,828
3 Other Investment 49,554 380,433
3.1 Trade Credit 8,742 83,938
3.2 Loan 6,863 179,472
3.3 Currency and Deposits 17,862 103,993
3.4 Other Assets/Liabilities 16,087 13,030
4 Reserves 304,223 –
5 Total Assets/ Liabilities 483,693 820,663
As on Financial Year /Quarter End

CURRENT STATISTICS
RBI Bulletin June 201582
No. 43: Payment System Indicators
Value (` Billion)
2015
Feb. Mar. Apr.
6 7 8
70,910.56 106,712.08 82,958.17
48,516.93 75,649.95 54,876.54
8,897.18 11,771.54 10,323.29
13,496.46 19,290.59 17,758.34
58,540.05 73,780.35 65,647.89
14,190.98 18,444.70 14,589.10
20,525.10 21,077.25 19,754.22
6,839.66 7,476.18 7,329.24
13,685.44 13,601.07 12,424.98
23,823.97 34,258.41 31,304.57
6,808.13 8,027.11 7,650.61
5,447.55 6,666.52 6,414.51
– – –
– – –
– – –
1,360.59 1,360.59 1,236.10
5,513.03 7,718.51 6,586.90
149.81 155.17 152.10
159.34 151.26 128.10
5,046.41 7,173.02 6,043.58
75.90 94.15 100.89
81.56 144.92 162.23
1,906.21 2,277.09 2,297.09
156.50 181.33 181.51
1.96 2.34 2.29
154.55 178.99 179.22
1,749.70 2,095.76 2,115.58
1,668.06 1,987.48 2,000.73
81.64 108.28 114.85
24.42 29.80 27.57
8.76 10.82 11.96
13.64 16.24 13.64
2.01 2.74 1.97
148.88 168.85 188.62
– – –
– – –
– – –
– – –
– – –
130,205.94 179,254.36 147,409.88
2014-15
5
929,332.89
631,050.74
122,981.62
175,300.73
752,000.42
167,645.96
258,916.76
101,561.62
157,355.15
325,437.69
85,434.14
66,769.93
1,850.40
614.51
1,235.89
16,939.34
65,365.51
1,739.78
2,019.14
59,803.83
581.87
1,220.88
25,415.27
1,922.63
23.47
1,899.16
23,492.65
22,279.16
1,213.49
213.42
81.84
105.35
26.24
1,035.30
–
–
–
–
–
1,682,461.11
Volume (Million )
2015
Feb. Mar. Apr.
2 3 4
7.69 9.67 7.90
7.34 9.26 7.54
0.35 0.41 0.36
0.001 0.001 0.001
0.23 0.27 0.23
0.02 0.02 0.02
0.07 0.08 0.07
0.07 0.07 0.06
0.009 0.010 0.009
0.13 0.17 0.14
93.66 102.80 94.37
76.65 88.54 80.91
- - -
- - -
- - -
17.01 14.25 13.46
208.98 242.07 211.40
19.11 20.27 19.69
8.34 8.57 4.86
81.19 106.00 83.53
10.08 12.02 12.37
90.27 95.21 90.96
688.21 757.66 753.85
49.92 57.34 57.74
0.37 0.44 0.43
49.55 56.91 57.31
638.29 700.31 696.11
570.39 624.21 615.76
67.90 76.11 80.35
30.31 54.10 74.36
24.08 46.11 67.05
6.19 7.94 7.26
0.04 0.06 0.04
18.53 19.67 19.75
558.89 574.56 585.92
20.86 21.11 21.29
538.03 553.45 564.64
178747 181398 182475
1095356 1126735 1125952
1,029.07 1,166.56 1,142.11
System
2014-15
1
1 RTGS 92.78
1.1 Customer Transactions 88.39
1.2 Interbank Transactions 4.38
1.3 Interbank Clearing 0.012
2 CCIL Operated Systems 3.03
2.1 CBLO 0.21
2.2 Govt. Securities Clearing 1.09
2.2.1 Outright 0.98
2.2.2 Repo 0.109
2.3 Forex Clearing 1.73
3 Paper Clearing 1,196.51
3.1 Cheque Truncation System (CTS) 964.86
3.2 MICR Clearing 22.43
3.2.1 RBI Centres 7.50
3.2.2 Other Centres 14.93
3.3 Non-MICR Clearing 209.82
4 Retail Electronic Clearing 1,687.44
4.1 ECS DR 226.01
4.2 ECS CR (includes NECS) 115.35
4.3 EFT/NEFT 927.55
4.4 Immediate Payment Service (IMPS) 78.37
4.5 National Automated Clearing House (NACH) 340.17
5 Cards 8,423.99
5.1 Credit Cards 619.41
5.1.1 Usage at ATMs 4.29
5.1.2 Usage at POS 615.12
5.2 Debit Cards 7,804.57
5.2.1 Usage at ATMs 6,996.48
5.2.2 Usage at POS 808.09
6 Prepaid Payment Instruments (PPIs) 314.46
6.1 m-Wallet 255.00
6.2 PPI Cards 58.91
6.3 Paper Vouchers 0.55
7 Mobile Banking 171.92
8 Cards Outstanding 574.56
8.1 Credit Card 21.11
8.2 Debit Card 553.45
9 Number of ATMs (in actuals) 181398
10 Number of POS (in actuals) 1126735
11 Grand Total (1.1+1.2+2+3+4+5+6) 11,718.19
Payment and Settlement Systems

CURRENT STATISTICS
RBI Bulletin June 2015 83
No. 44: Small Savings
(` Billion)
2013 2014
Nov. Sep. Oct. Nov.
2 3 4 5
151.02 193.77 178.60 180.81
6,127.59 6,235.30 6,239.66 6,241.25
137.42 175.46 163.71 164.50
3,798.09 3,930.92 3,936.53 3,939.16
71.85 92.39 87.34 85.71
392.39 447.74 450.74 449.23
– – – –
– – – –
0.02 0.01 0.10 0.04
38.64 37.02 37.21 37.02
– –0.02 – –
2.85 2.42 2.38 2.39
13.33 18.00 14.70 16.21
2,026.46 2,016.75 2,016.27 2,015.64
1.30 2.27 2.56 2.52
228.15 207.30 199.65 195.20
19.13 28.14 23.75 25.73
375.12 466.35 473.88 482.39
249.31 321.28 327.29 334.30
16.65 19.11 19.29 19.49
38.19 40.02 40.14 40.29
70.97 85.94 87.16 88.31
31.79 34.67 35.26 34.29
734.32 753.06 756.12 757.01
–0.06 0.06 0.06 0.06
0.22 0.22 0.22 0.22
10.98 13.17 10.74 11.18
1,902.79 1,834.69 1,830.23 1,825.66
10.94 13.09 10.77 11.07
699.88 807.29 814.47 821.32
– – – –
8.99 8.91 8.86 8.91
0.04 0.08 –0.03 0.07
1,153.00 940.37 925.72 910.91
0.04
0.04
–0.76 –0.81 –0.81 –0.80
–0.57 –0.52 –0.52 –0.52
42.25 79.45 82.51 85.80
2.62 5.14 4.15 5.13
426.71 469.69 472.90 476.43
Scheme 2013-14
1
1 Small Savings Receipts 2,020.60
Outstanding 6,214.97
1.1 Total Deposits Receipts 1,780.40
Outstanding 3,866.31
1.1.1 Post Office Saving Bank Deposits Receipts 946.50
Outstanding 430.17 1.1.2 MGNREG Receipts –
Outstanding – 1.1.3 National Saving Scheme, 1987 Receipts 0.80
Outstanding 38.69 1.1.4 National Saving Scheme, 1992 Receipts 0.05
Outstanding 2.77 1.1.5 Monthly Income Scheme Receipts 179.91
Outstanding 2,020.85 1.1.6 Senior Citizen Scheme Receipts 19.94
Outstanding 224.92 1.1.7 Post Office Time Deposits Receipts 246.74
Outstanding 407.14 1.1.7.1 1 year Time Deposits Outstanding 273.43 1.1.7.2 2 year Time Deposits Outstanding 17.67 1.1.7.3 3 year Time Deposits Outstanding 39.15 1.1.7.4 5 year Time Deposits Outstanding 76.89 1.1.8 Post Office Recurring Deposits Receipts 386.46
Outstanding 741.49 1.1.9 Post Office Cumulative Time Deposits Outstanding 0.06 1.1.10 Other Deposits Outstanding 0.22 1.2 Saving Certificates Receipts 169.46
Outstanding 1,882.58
1.2.1 National Savings Certificate VIII issue Receipts 169.24
Outstanding 750.86 1.2.2 Indira Vikas Patras Receipts 0.04
Outstanding 8.96 1.2.3 Kisan Vikas Patras Receipts 0.18
Outstanding 1,067.54 1.2.4 Kisan Vikas Patras - 2014 Receipts
Outstanding 1.2.5 National Saving Certificate VI issue Outstanding –0.77 1.2.6 National Saving Certificate VII issue Outstanding –0.50 1.2.7 Other Certificates Outstanding 56.49 1.3 Public Provident Fund Receipts 70.74
Outstanding 466.08
Source: Accountant General, Post and Telegraphs.
Occasional Series

CURRENT STATISTICS
RBI Bulletin June 201584
No. 45: Ownership Pattern of Government of India Dated Securities
(Per cent)
Category 2014 2015
Mar. Jun. Sep. Dec. Mar.
1 2 3 4 5
1 Commercial Banks 44.46 43.43 42.95 42.77 43.30
2 Non-Bank PDs 0.11 0.28 0.20 0.34 0.31
3 Insurance Companies 19.54 20.21 20.55 21.02 20.87
4 Mutual Funds 0.78 1.29 1.26 1.68 1.89
5 Co-operative Banks 2.76 2.76 2.71 2.57 2.62
6 Financial Institutions 0.72 1.51 1.44 0.73 2.07
7 Corporates 0.79 0.89 1.06 1.12 1.25
8 Foreign Portfolio Investors 1.68 2.45 3.37 3.62 3.67
9 Provident Funds 7.18 7.21 7.13 7.47 7.58
10 RBI 16.05 15.03 14.33 13.23 9.54
11 Others 5.92 4.94 4.99 5.45 6.90

CURRENT STATISTICS
RBI Bulletin June 2015 85
No. 46: Combined Receipts and Disbursements of the Central and State Governments
(` Billion)
Item 2009-10 2010-11 2011-12 2012-13 2013-14 RE 2014-15 BE
1 2 3 4 5 6
1 Total Disbursements 18,521.19 21,451.45 24,217.68 26,949.34 31,953.34 35,985.06
1.1 Developmental 10,628.08 12,676.97 14,209.38 15,741.62 18,717.73 21,000.74 1.1.1 Revenue 8,513.03 10,260.24 11,394.64 12,807.14 15,048.07 16,582.49 1.1.2 Capital 1,868.38 1,935.80 2,163.39 2,446.11 3,184.40 4,028.47 1.1.3 Loans 246.67 480.93 651.35 488.38 485.26 389.78 1.2 Non-Developmental 7,687.34 8,520.46 9,695.88 10,850.47 12,751.57 14,454.37 1.2.1 Revenue 7,086.94 7,765.94 8,923.61 9,991.40 11,663.72 13,158.12 1.2.1.1 Interest Payments 3,145.70 3,485.61 4,000.03 4,543.06 5,436.70 6,118.51 1.2.2 Capital 594.08 747.48 754.79 837.14 1,065.99 1,257.51 1.2.3 Loans 6.32 7.04 17.48 21.93 21.86 38.73 1.3 Others 205.77 254.02 312.42 357.24 484.04 529.952 Total Receipts 18,458.08 21,535.61 24,540.62 27,690.29 31,390.86 35,701.74
2.1 Revenue Receipts 12,105.59 15,788.20 16,926.79 19,716.19 23,522.48 27,028.75 2.1.1 Tax Receipts 9,846.11 12,500.67 14,427.52 16,879.59 19,208.73 22,028.85 2.1.1.1 Taxes on commodities and services 5,580.66 7,393.66 8,745.55 10,385.91 11,768.52 13,536.10 2.1.1.2 Taxes on Income and Property 4,249.31 5,087.19 5,654.12 6,462.73 7,409.54 8,458.74 2.1.1.3 Taxes of Union Territories (Without Legislature) 16.14 19.82 27.85 30.94 30.67 34.01 2.1.2 Non-Tax Receipts 2,259.48 3,287.53 2,499.27 2,836.60 4,313.75 4,999.90 2.1.2.1 Interest Receipts 257.48 250.78 288.70 355.43 360.44 347.54 2.2 Non-debt Capital Receipts 368.92 322.93 441.23 389.20 376.21 727.23 2.2.1 Recovery of Loans & Advances 114.99 82.06 253.70 129.29 113.20 79.64 2.2.2 Disinvestment proceeds 253.93 240.87 187.53 259.91 263.01 647.593 Gross Fiscal Deficit [ 1 - ( 2.1 + 2.2 ) ] 6,046.68 5,340.32 6,849.66 6,843.95 8,054.64 8,229.07
3A Sources of Financing: Institution-wise .. .. .. .. .. ..
3A.1 Domestic Financing 5,936.30 5,104.76 6,725.18 6,771.94 8,000.24 8,171.74 3A.1.1 Net Bank Credit to Government 3,918.53 3,147.10 3,898.30 3,352.80 3,295.90 .. 3A.1.1.1 Net RBI Credit to Government 1,500.10 1,849.70 1,391.80 548.40 1,081.30 .. 3A.1.2 Non-Bank Credit to Government 2,017.77 1,957.66 2,826.88 3,419.14 4,704.34 .. 3A.2 External Financing 110.38 235.56 124.48 72.01 54.40 57.34 3B Sources of Financing: Instrument-wise .. .. .. .. .. ..
3B.1 Domestic Financing 5,936.30 5,104.76 6,725.18 6,771.94 8,000.24 8,171.74 3B.1.1 Market Borrowings (net) 5,070.19 4,151.75 6,195.07 6,536.94 6,609.87 7,106.01 3B.1.2 Small Savings (net) –374.62 –545.34 190.88 –85.70 –121.35 –34.31 3B.1.3 State Provident Funds (net) 355.35 362.36 334.33 329.94 331.59 366.85 3B.1.4 Reserve Funds –155.71 35.62 178.51 –4.12 58.28 –153.49 3B.1.5 Deposits and Advances 175.68 342.92 122.10 27.22 78.92 61.28 3B.1.6 Cash Balances 63.12 –84.16 –322.94 –740.96 562.48 283.32 3B.1.7 Others 802.30 841.61 27.23 708.62 480.45 542.07 3B.2 External Financing 110.38 235.56 124.48 72.01 54.40 57.344 Total Disbursements as per cent of GDP 28.6 27.5 26.9 27.0 28.2 28.45 Total Receipts as per cent of GDP 28.5 27.6 27.2 27.7 27.7 28.26 Revenue Receipts as per cent of GDP 18.7 20.3 18.8 19.7 20.7 21.47 Tax Receipts as per cent of GDP 15.2 16.0 16.0 16.9 16.9 17.48 Gross Fiscal Deficit as per cent of GDP 9.3 6.9 7.6 6.9 7.1 6.5
Source : Budget Documents of Central and State Governments.

CURRENT STATISTICS
RBI Bulletin June 201586
Explanatory Notes to the Current Statistics
Table No. 11.2 & 6: Annual data are averages of months.3.5 & 3.7: Relate to ratios of increments over financial year so far.4.1 to 4.4, 4.8, 4.12 & 5: Relate to the last day of the month/financial year. 4.5, 4.6 & 4.7: Relate to five major banks on the last Friday of the month/financial year. 4.9 to 4.11: Relate to the last auction day of the month/financial year.
Table No. 22.1.2: Include paid-up capital, reserve fund and Long-Term Operations Funds. 2.2.2: Include cash, fixed deposits and short-term securities/bonds, e.g., issued by IIFC (UK).
Table No. 4 Maturity-wise position of outstanding forward contracts is available at http://nsdp.rbi.org.in under ‘‘Reserves Template’’.
Table No. 5 Special refinance facility to Others, i.e. to the EXIM Bank, is closed since March 31, 2013.
Table No. 6 For scheduled banks, March-end data pertain to the last reporting Friday.2.2: Exclude balances held in IMF Account No.1, RBI employees’ provident fund, pension fund, gratuity and superannuation fund.
Table Nos. 7 & 113.1 in Table 7 and 2.4 in Table 11: Include foreign currency denominated bonds issued by IIFC (UK).
Table No. 8NM2 and NM3 do not include FCNR (B) deposits.2.4: Consist of paid-up capital and reserves.2.5: includes other demand and time liabilities of the banking system.
Table No. 9Financial institutions comprise EXIM Bank, SIDBI, NABARD and NHB. L1 and L2 are compiled monthly and L3 quarterly. Wherever data are not available, the last available data have been repeated.
Table No. 15Data are provisional and relate to select banks which cover 95 per cent of total non-food credit extended by all scheduled commercial banks.1.2A.2.1 : Manufacturing include `335 billion and item 1.2A.2.2 : Services includes `34 billion credit to medium enterprises for the month of March 2014 only.
Table No. 172.1.1: Exclude reserve fund maintained by co-operative societies with State Co-operative Banks2.1.2: Exclude borrowings from RBI, SBI, IDBI, NABARD, notified banks and State Governments.4: Include borrowings from IDBI and NABARD.
Table No. 24Primary Dealers (PDs) include banks undertaking PD business.
Table No. 30 Exclude private placement and offer for sale. 1: Exclude bonus shares.2: Include cumulative convertible preference shares and equi-preference shares.
Table No. 32Exclude investment in foreign currency denominated bonds issued by IIFC (UK), SDRs transferred by Government of India to RBI and foreign currency received under SAARC SWAP arrangement. Foreign currency assets in US dollar take into account appreciation/depreciation of non-US currencies (such as Euro, Sterling, Yen and Australian Dollar) held in reserves. Foreign exchange holdings are converted into rupees at rupee-US dollar RBI holding rates.

CURRENT STATISTICS
RBI Bulletin June 2015 87
Table No. 341.1.1.1.2 & 1.1.1.1.1.4: Estimates.1.1.1.2: Estimates for latest months. ‘Other capital’ pertains to debt transactions between parent and subsidiaries/branches of FDI enterprises.Data may not tally with the BoP data due to lag in reporting.
Table No. 351.10: Include items such as subscription to journals, maintenance of investment abroad, student loan repayments and credit card payments.
Table No. 36 Increase in indices indicates appreciation of rupee and vice versa. For 6-Currency index, base year 2012-13 is a moving one, which gets updated every year. REER figures are based on Consumer Price Index (combined). Methodological details are available in December 2005 and April 2014 issues of the Bulletin.
Table No. 37Based on applications for ECB/Foreign Currency Convertible Bonds (FCCBs) which have been allotted loan registration number during the period.
Table Nos. 38, 39, 40 & 41 Explanatory notes on these tables are available in December issue of RBI Bulletin, 2012.
Table No. 431.3: Pertain to multilateral net settlement batches.3.1: Pertain to two centres - New Delhi and Chennai. 3.3: Pertain to clearing houses managed by 21 banks.6: Available from December 2010.7: Include IMPS transactions.
Table No. 441.1.1: Receipts include interest credited to depositors’ account from time to time. 1.1.9: Relate to 5-year, 10-year and 15-year cumulative time deposits. Exclude Public Provident Fund.1.2.4 to 1.2.6: Negative figures are due to rectification of misclassification. 1.3: Data relate to Post Office transactions.
Table 45Includes securities issued under the Market Stabilisation Scheme and the special securities, e.g., issued to the oil marketing companies.
Table 46(-): Indicates surplus/net outflow.Total receipts and total expenditure exclude National Calamity Contingency Fund expenditure.1 & 2: Data are net of repayments of the Central Government (including repayments to the NSSF) and State Governments.1.3: Represents compensation and assignments by States to local bodies and Panchayati Raj institutions.2: Data are net of variation in cash balances of the Central and State Governments and includes borrowing receipts of the Central and State Governments.3A.1.1: Data as per RBI records. 3B.1.1: Includes borrowings through dated securities and 364-day Treasury Bills.3B.1.2: Represent net investment in Central and State Governments’ special securities by the National Small Savings Fund (NSSF).3B.1.6: Include Ways and Means Advances by the Centre to the State Governments.3B.1.7: Include Treasury Bills (excluding 364-day Treasury Bills), loans from financial institutions, insurance and pension funds, remittances, cash balance investment account.
Detailed explanatory notes are available in the relevant press releases issued by RBI and other publications/releases of the Bank such as Handbook of Statistics on the Indian Economy.

RECENT PUBLICATIONSRECENT PUBLICATIONS
RBI Bulletin June 201588
Name of Publication Price
India Abroad
1. Reserve Bank of India Bulletin 2015 `200 per copy (over the counter)
`240 per copy (inclusive of postage)
`2,800 (one year subscription - inclusive of postage)
US$ 11 per copy (inclusive of postage)
US$ 130 (one-year subscription)
(inclusive of air mail courier charges)
2. Handbook of Statistics on the Indian Economy 2013-14
`300 (Normal)
`350 (inclusive of postage)
`225 (concessional)
`275 (concessional with postage)
US$ 35 (inclusive of air mail courier charges)
3. Report on Currency and Finance 2009-12 Fiscal-Monetary Co-ordination
`515 (normal)
`555 (inclusive of postage)
US$ 16 per copy (inclusive air mail courier charges)
4. Report on Currency and Finance 2003-08 Vol. I to V (Special Issue)
`1,100 (normal)
` 1,170 (inclusive of postage)
` 830 (concessional)
` 900 (concessional inclusive of postage)
US$ 55 per copy (inclusive air mail courier charges)
5. State Finances -A Study of Budgets of 2014-15
`390 per copy (over the counter)
`430 per copy (including postal charges)
US$ 14 per copy
(inclusive air mail courier charges)
6. Handbook of Statistics on State Government Finances 2010
CD-ROM
`80 (normal)
`105 (inclusive of postage)
`60 (concessional)
`85 (concessional inclusive of postage)
US$ 16 per CD (inclusive of air mail courier charges)
US$ 4 per CD
(inclusive of registered air mail charges)
7. CD Compendium of Articles on State Finances (1950-51 to 2010-11)
`280 (over the counter)
`305 (inclusive of postal charges)
`210 (concessional)
`235 (concessional inclusive of postage)
US$ 8 (inclusive of air mail book post charges)
8. Mint Road Milestones RBI at 75 `1,650 per copy (over the counter) US$ 50 per copy (inclusive of air mail courier charges)
9. India’s Financial Sector, An Assessment Vol. I to VI 2009
`2,000 per copy (over the counter)
`2,300 per copy (inclusive postal charges)
`1,500 per copy (concessional price )
`1,800 per copy (concessional inclusive of postage)
US$ 40 per set and
US$ 120 per set(inclusive of air mail courier charges)
10. The Paper and the Promise: A Brief History of Currency & Banknotes in India, 2009
`200 per copy (over the counter) US$ 30 per copy(inclusive of air mail courier charges)
11. Report of the committee on Fuller Capital account Convertibility (Tarapore Committee Report II)
`140 per copy (normal)
`170 (per copy by post)
US$ 25 per copy((inclusive of air mail courier charges)
12. A Profi le of Banks 2012-13 `80 per copy (over the counter)
`110 per copy (inclusive of postal charges)
US$ 7 per copy(inclusive of air mail courier charges)
Recent Publications of the Reserve Bank of India

RECENT PUBLICATIONSRECENT PUBLICATIONS
RBI Bulletin June 2015 89
Name of Publication Price
India Abroad
13. Selected Banking Indicators 1981 to 2002 (On CD-ROM)
`250 per CD (over the counter)
`300 per CD (including postal charges)
US$ 75 (per CD)
(inclusive of air mail courier charges)
14. Statistical Tables Relating to Banks in India 2012-13
`240 per copy (over the counter)
`300 (inclusive of postage)
US$ 13 per copy(inclusive of air mail courier charges)
15. Quarterly Statistics on Deposits and Credit of Scheduled Commercial Banks 1981-2003 (on CD-ROM)
`185 per copy (over the counter)
`240 per copy (including postal charges)
US$ 20 per copyUS$ 55 per copy(inclusive of air mail courier charges)
16. Basic Statistical Returns of Scheduled Commercial Banks in India Vol. 41 March 2012
`270 per copy (over the counter)
`310 per copy (inclusive of postal charges)
US$ 10 per copy(inclusive of air mail courier charges)
17. Private Corporate Business Sector in India - Selected Financial Statistics from 1950-51 to 1997-98
`500 per CD (over the counter) US$ 100 per CD ROM(inclusive of air mail courier charges)
18. Banking Glossary (2012) `80 (normal) (postage extra)
Notes
1. Many of the above publications are available at the RBI website (www.rbi.org.in).
2. Time Series data are available at the Database on Indian Economy (http://dbie.rbi.org.in).
3. The Reserve Bank of India History 1935-1997 (4 Volumes), Challenges to Central Banking in the Context of Financial Crisis and the Regional Economy of India: Growth and Finance are available at leading book stores in India.
General Instructions
1. Publications once sold will not be taken back.
2. Publications will not be supplied on a consignment VPP basis.
3. Wherever concessional price is not indicated, a discount of 25 per cent is available for students, teachers/lecturers, academic/education institutions, public libraries and book sellers in India provided the proof of eligibility is submitted from the concerned institution. Back issues of the publication are generally not available.
4. The publications are available for sale (Monday to Friday), at the Sales and Distribution Division, Department of Corporate Services, Reserve Bank of India, Amar Building, Ground Floor, Sir P. M. Road, Fort, P. B. No.1036, Mumbai - 400 001. The contact number of Sales Section is 022-2260 3000 Extn.: 4002, Email: [email protected].
5. Subscription should be sent by NEFT/demand draft/cheque payable at Mumbai in favour of Reserve Bank of India, Mumbai to the Chief General Manager, Department of Corporate Services, Reserve Bank of India, 2nd fl oor, Main Building, Mumbai - 400 001.
Following information is required to be fi lled in NEFT form by you
Benefi ciary Name Department of Corporates Services, RBI
Name of the Bank Reserve Bank of India
Branch and addess Fort, Mumbai
IFSC of Bank Branch RBIS0MBPA04
Type of Account Current Account
Account Number 41-8970927-04
Sender to reciver information Subscriber No. ..........
Name of RBI Publication........
6. Every endeavour will be made to despatch publications expeditiously. In case of rush of orders, dispatch will be executed on a fi rst-come fi rst-served basis. It may take a minimum of a month’s time to complete formalities and then to dispatch the available publications. Complaints regarding ‘non-receipt of publication’ may be sent within a period of 2 months.
7. Kindly send your subscription number, name, address, and email id to [email protected] enabling us to communicate with you in an effi cient manner.