consumer behaviour towards online shopping - Christ College ...
86
1 “CONSUMER BEHAVIOUR TOWARDS ONLINE SHOPPING A STUDY BASED ON THRISSUR DISTRICT” Project report submitted to CHRIST COLLEGE (AUTONOMOUS), IRINJALAKUDA In partial fulfilment of the requirement for the award of the degree of Bachelor of Arts in Economics Submitted by AKSHAY KUMAR K A (Reg. no.CCASAECR22) Under the supervision of Sr. Rosy V.O. POST GRADUATE DEPARTMENT OF ECONOMICS CHRIST COLLEGE (AUTONOMOUS), IRINJALAKKUDA UNIVERSITY OF CALICUT MARCH 2021
-
Upload
khangminh22 -
Category
Documents
-
view
0 -
download
0
Transcript of consumer behaviour towards online shopping - Christ College ...
1
“CONSUMER BEHAVIOUR TOWARDS ONLINE SHOPPING
A STUDY BASED ON THRISSUR DISTRICT”
Project report submitted to
CHRIST COLLEGE (AUTONOMOUS), IRINJALAKUDA
In partial fulfilment of the requirement for the award of the degree of
Bachelor ofArts inEconomics
Submitted by
AKSHAY KUMAR K A (Reg. no.CCASAECR22)
Under the supervisionofSr. Rosy V.O.
POST GRADUATE DEPARTMENT OF ECONOMICS
CHRISTCOLLEGE(AUTONOMOUS), IRINJALAKKUDA
UNIVERSITY OF CALICUT
MARCH2021
2
CERTIFICATE
This is to certify that the project report entitled “CONSUMER BEHAVIOURTOWARDS ONLINE SHOPPING : A STUDY BASED ON THRISSURDISTRICT” is a bonafied record of project work done by Mr. Akshay Kumar K Ain partial fulfillment of requirement for the award of the degree of Bachelor of Artsin Economics under my guidance and supervision and that it has not previouslyformed the basis for awarding for any degree, diploma, associate ship, or fellowship.
Prof. Sr. Rosy. V.O.
Head of the department
Research Department of Economics
Christ College (Autonomous), Irinjalakuda
Place: Irinjalakuda
Date: 30/03/2021
3
DECLARATION
I Akshay Kumar K A hereby declare that the project work entitled “CONSUMERBAHAVIOUR TOWARDS ONLINE SHOPPING: A STUDY BASED ONTHRISSUR DISTRICT” is a bonafide research paper in partial fulfillment ofrequirement for the award of degree of Bachelor of Arts in Economics under theguidance and supervision of Rev. Sr. Rosy V.O, Assistant Professor, Department ofEconomics, Christ College (Autonomous) Irinjalakuda. I also declare that thisproject report has not previously formed the basis for the award of any degree,diploma, associateship, fellowship or other similar type of recognition.
PLACE: Irinjalakuda
Date: 30/03/2021
Mr. Akshay Kumar K A
4
ACKNOWLEDGEMENT
The investigator acknowledge his profound gratitude and gracious thanks to Rev.
Sr. Rosy V.O, Assistant Professor, Department of Economics, Christ College
(Autonomous), Irinjalakuda for her valuable guidance and encouragement
throughout the preparation of this project report.
The investigator express his sincere thanks to Prof. Sr. Rosy V.O., HoD
Research Dept of Economics and all the faculty members of the Department of
Economics, Christ College (Autonomous), Irinjalakuda for their co-operation
and help.
The investigator acknowledge his sincere gratitude to Fr. Dr. Jolly Andrews CMI,
Principal, Christ College (Autonomous) Irinjalakuda for providing various
facilities.
The investigator owe his gratitude to the library staff of Christ College
(Autonomous), Irinjalakuda.
The investigator would like to express his gratitude to parents, brothers, sisters
and friends for their timely support and co-operation. Above all praise and
thanks to God Almighty who showers his plentiful blessing.
Place: Irinjalakuda
Date: 30/03/21
Mr. Akshay Kumar K A
5
CONTENTS
CHAPTER 1
DESIGN OF STUDY
1.1 INTRODUCTION 14
1.2 SIGNIFICANCE OF THE STUDY 15
1.3 OBJECTIVES OF THE STUDY 16
1.4 METHODOLOGY OF THE STUDY 16
1.5 REVIEW OF LITERATURE 17
1.6 LIMITATIONS OF THE STUDY 22
1.7 CHAPTER SCHEME 22
CHAPTER 2
AN OVERVIEW OF THE STUDY
2.1 INTRODUCTION 24
2.2 ONLINE SHOPPING IN THE WORLD 24
2.2.1 INTRODUCTION 24
2.2.2 TYPES OF E-COMMERCE 25
2.2.3 HISTORY OF E-COMMERCE 27
2.2.4 GLOBAL SALES IN ONLINE SHOPPING 28
2.3 ONLINE SHOPPING IN THE INDIA 28
2.3.1 INTRODUCTION 28
2.3.2 EVOLUTION OF ONLINE SHOPPING IN INDIA 28
2.3.3 MODES OF PAYMENT USED IN ONLINE SHOPPING 31
2.3.4 CURRENT SCENARIO OF ONLINE SHOPPING IN INDIA 31
2.3.5 FUTURE OF ONLINE SHOPPING IN INDIA 32
2.3.6 MAJOR ONLINE SHOPPING PLATFORMS IN INDIA 33
2.4 ONLINE SHOPPING IN KERALA 33
6
CHAPTER 3
DATA ANALYSIS AND INTERPRETATION
3.1 INTRODUCTION 38
3.2 PROFILE OF THRISSUR DISTRICT 38
3.3 DATA ANALYSIS AND INTERPRETATION 40
3.3.1 CLASSIFICATION ON THE BASIS OF AGE 40
3.3.2 CLASSIFICATION ON THE BASIS OF GENDER 41
3.3.3 CLASSIFICATION ON THE BASIS OF RELIGION 42
3.3.4 CLASSIFICATION ON THE BASIS OF MONTHLY INCOME 43
3.3.5 CLASSIFICATION ON THE BASIS OF EMPLOYMENT 44
3.3.6 CLASSIFICATION ON THE BASIS OF EDUCATIONALQUALIFICATION
45
3.3.7 CLASSIFICATION ON THE BASIS OF THEIR USAGE INONLINE SHOPPING
46
3.3.8 CLASSIFICATION ON THE BASIS OF THE COMMODITIESTHEY PURCHASE THROUGH ONLINE SHOPPING
47
3.3.9 CLASSIFICATION ON THE BASIS OF THEIR PREFERENCE INSHOPPING METHOD
48
3.3.10 CLASSIFICATION ON THE BASIS OF SATISFACTION LEVELOF ONLINE SHOPPING
49
2.4.1 INTRODUCTION 33
2.4.2 GROWTH OF E-COMMERCE IN KERALA 34
2.4.3 KEY E-COMMERCE PLATFORMS OR PORTALS IN KERALA 35
2.4.4 E-COMMERCE ADOPTION BY SMEs IN KERALA 36

7
3.3.11 CLASSIFICATION ON THE BASIS OF PROBLEMS FACED 50
3.3.12 CLASSIFICATION ON THE BASIS OF PROFICIENCY ON THEINTERNET
51
3.3.13 CLASSIFICATION ON THE BASIS OF FAVOURITE ONLINESHOPPING SITES
52
3.3.14 CLASSIFICATION ON THE BASIS OF AMOUNT OF SPENDING 53
3.3.15 CLASSIFICATION ON THE BASIS OF CRITERIA FOCUSSEDDURING ONLINE SHOPPING
53
3.3.16 CLASSIFICATION ON THE BASIS OF RISK FACTOR INELECTRONIC PAYMENT DURING ONLINE SHOPPING
54
3.3.17 CLASSIFICATION ON THE BASIS OF TYPE OF PAYMENTPREFERRED
55
3.3.18 CLASSIFICATION ON THE BASIS OF FEATURES NECESSARYFOR AN ONLINE SHOPING SITE
56
3.3.19 CLASSIFICATION ON THE BASIS OF SPECIFICATION OF RISKFACTORS IN ELECTRONIC PAYMENT DURING ONLINE
SHOPPING
57
3.3.20 CLASSIFICATION ON THE BASIS OF CONSUMER’SWILLINGNESS TO PREFER ONLINE SHOPPING METHOD IN
COVID-19 PANDEMIC ERA
58
3.3.21 CLASSIFICATION ON THE BASIS OF CATEGORIES OFPRODUCTS PURCHASED MOST DURING COVID-19
PANDEMIC
59
3.3.22 CLASSIFICATION ON THE BASIS OF AMOUNT OF SPENDINGDURING COVID 19 PANDEMIC
60
3.3.23 CLASSIFICATION ON THE BASIS OF CONSUMER’SPREFERENCE ON THE APPROPRIATE TIMIMG FOR ONLINE
SHOPPING
61
3.3.24 CLASSIFICATION ON THE BASIS OF DISTRIBUTION ON THEBASIS OF WHETHER THE CONSUMERS USE SOCIAL
NETWORKING SITES AND ONLINE SHOPPING PLATFORMSTO SPOT THE LATEST TRENDS
62
3.3.25 CLASSIFICATION ON THE BASIS OFWHETHER THECONSUMERS CONSIDER REVIEWS OR RATINGS DISPLAYED
ON THE PRODUCT INFORMATION
63
3.3.26 CLASSIFICATION ON THE BASIS OF FACTORS WHICHMAKES FESTIVE SALES IN ONLINE SHOPPING PLATFORMS
MORE ATTRACTIVE TO SHOP
64
8
3.3.27 CLASSIFICATION ON THE BASIS OF USE OF FREE COUPONSREWARDED FROM ONLINE PAYMENT PLATFORMS OR
ONLINE SHOPPING METHODS
65
3.3.28 CLASSIFICATION ON THE BASIS OF UNDERSTANDING OFINFLUENCE OF ADVERTISEMENTS IN SOCIAL MEDIA
PLATFORMS
66
3.329 CLASSIFICATION ON THE BASIS OF THEIR SHOPPING BASEDON REVIEWS OF YOUTUBER’S RECOMMENDATIONS
67
3.3.30 CLASSIFICATION ON THE BASIS OF UNDERSTANDING THATCERTAIN PRODUCTS ARE CHEAPER IN CERTAIN ONLINE
SHOPPING PLATFORMS
68
3.3.31 CLASSIFICATION ON THE BASIS OF HAVING SUBSCRIPTIONIN ONLINE SHOPPING PLATFORMS
69
3.3.32 CLASSIFICATION ON THE BASIS OF BENEFITS THEYRECEIVE FOM THESE MEMBERSHIP
70
CHAPTER 4
FINDINGS AND CONCLUSION
4.1 INTRODUCTION 73
4.2 FINDINGS 73
4.3 SUGGESTIONS 75
4.4 CONCLUSION 75
BIBILIOGRAPHY
QUESTIONNAIRE
9
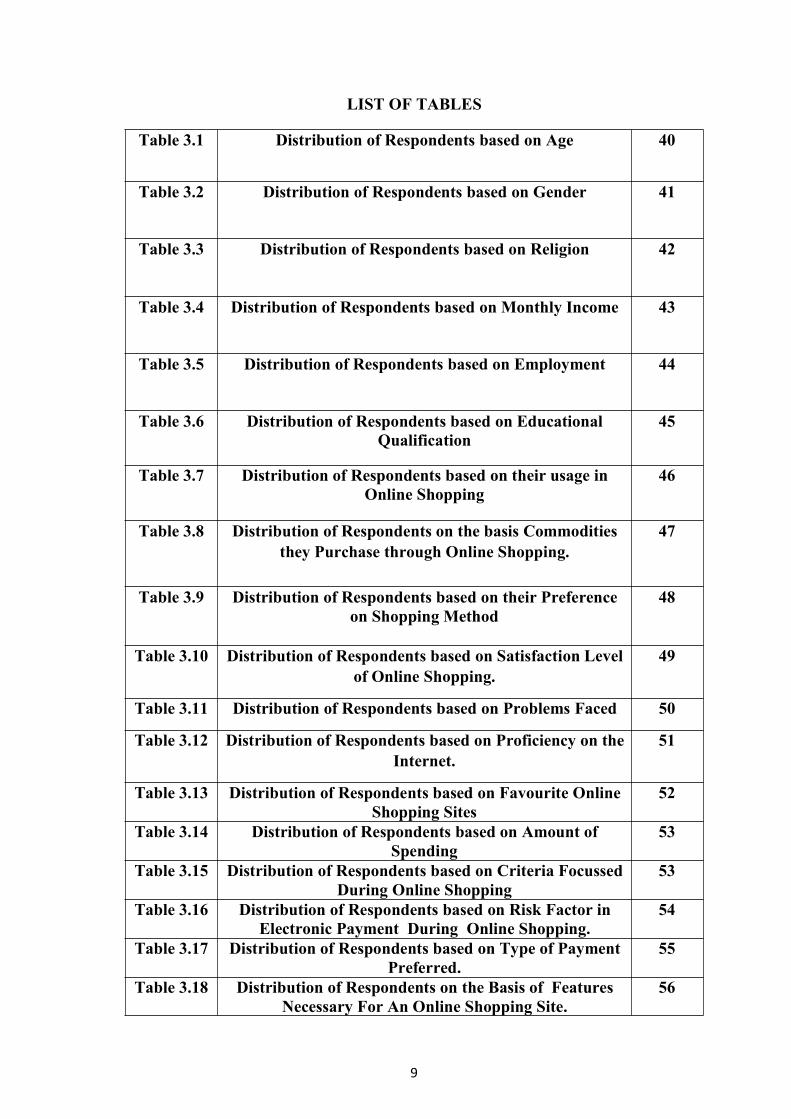
LIST OF TABLES
Table 3.1 Distribution of Respondents based on Age 40
Table 3.2 Distribution of Respondents based on Gender 41
Table 3.3 Distribution of Respondents based on Religion 42
Table 3.4 Distribution of Respondents based on Monthly Income 43
Table 3.5 Distribution of Respondents based on Employment 44
Table 3.6 Distribution of Respondents based on EducationalQualification
45
Table 3.7 Distribution of Respondents based on their usage inOnline Shopping
46
Table 3.8 Distribution of Respondents on the basis Commoditiesthey Purchase through Online Shopping.
47
Table 3.9 Distribution of Respondents based on their Preferenceon Shopping Method
48
Table 3.10 Distribution of Respondents based on Satisfaction Levelof Online Shopping.
49
Table 3.11 Distribution of Respondents based on Problems Faced 50
Table 3.12 Distribution of Respondents based on Proficiency on theInternet.
51
Table 3.13 Distribution of Respondents based on Favourite OnlineShopping Sites
52
Table 3.14 Distribution of Respondents based on Amount ofSpending
53
Table 3.15 Distribution of Respondents based on Criteria FocussedDuring Online Shopping
53
Table 3.16 Distribution of Respondents based on Risk Factor inElectronic Payment During Online Shopping.
54
Table 3.17 Distribution of Respondents based on Type of PaymentPreferred.
55
Table 3.18 Distribution of Respondents on the Basis of FeaturesNecessary For An Online Shopping Site.
56
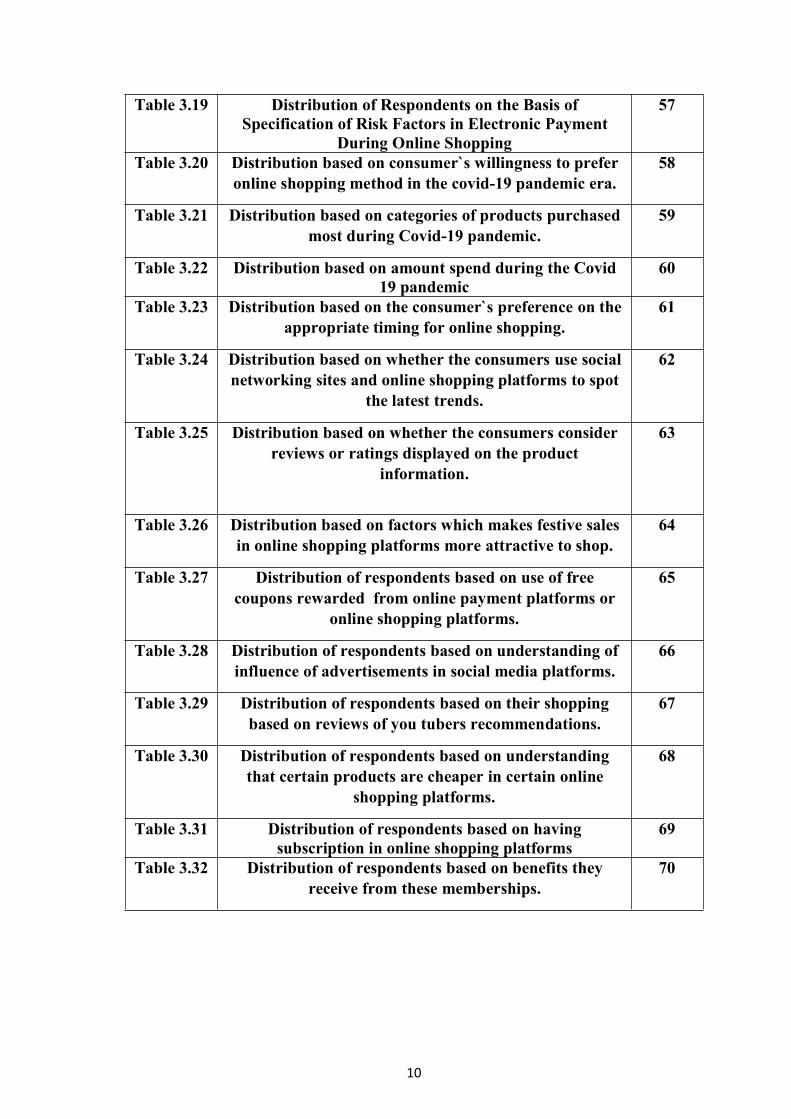
10
Table 3.19 Distribution of Respondents on the Basis ofSpecification of Risk Factors in Electronic Payment
During Online Shopping
57
Table 3.20 Distribution based on consumer`s willingness to preferonline shopping method in the covid-19 pandemic era.
58
Table 3.21 Distribution based on categories of products purchasedmost during Covid-19 pandemic.
59
Table 3.22 Distribution based on amount spend during the Covid19 pandemic
60
Table 3.23 Distribution based on the consumer`s preference on theappropriate timing for online shopping.
61
Table 3.24 Distribution based on whether the consumers use socialnetworking sites and online shopping platforms to spot
the latest trends.
62
Table 3.25 Distribution based on whether the consumers considerreviews or ratings displayed on the product
information.
63
Table 3.26 Distribution based on factors which makes festive salesin online shopping platforms more attractive to shop.
64
Table 3.27 Distribution of respondents based on use of freecoupons rewarded from online payment platforms or
online shopping platforms.
65
Table 3.28 Distribution of respondents based on understanding ofinfluence of advertisements in social media platforms.
66
Table 3.29 Distribution of respondents based on their shoppingbased on reviews of you tubers recommendations.
67
Table 3.30 Distribution of respondents based on understandingthat certain products are cheaper in certain online
shopping platforms.
68
Table 3.31 Distribution of respondents based on havingsubscription in online shopping platforms
69
Table 3.32 Distribution of respondents based on benefits theyreceive from these memberships.
70
11
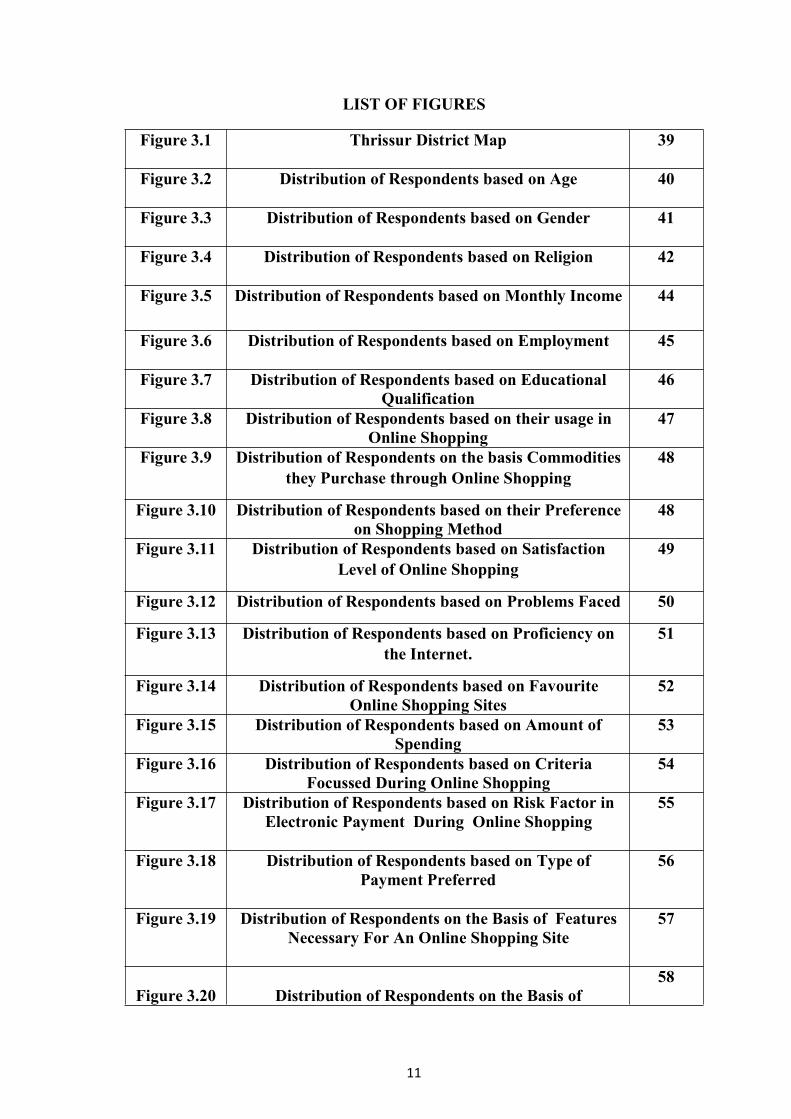
LIST OF FIGURES
Figure 3.1 Thrissur District Map 39
Figure 3.2 Distribution of Respondents based on Age 40
Figure 3.3 Distribution of Respondents based on Gender 41
Figure 3.4 Distribution of Respondents based on Religion 42
Figure 3.5 Distribution of Respondents based on Monthly Income 44
Figure 3.6 Distribution of Respondents based on Employment 45
Figure 3.7 Distribution of Respondents based on EducationalQualification
46
Figure 3.8 Distribution of Respondents based on their usage inOnline Shopping
47
Figure 3.9 Distribution of Respondents on the basis Commoditiesthey Purchase through Online Shopping
48
Figure 3.10 Distribution of Respondents based on their Preferenceon Shopping Method
48
Figure 3.11 Distribution of Respondents based on SatisfactionLevel of Online Shopping
49
Figure 3.12 Distribution of Respondents based on Problems Faced 50
Figure 3.13 Distribution of Respondents based on Proficiency onthe Internet.
51
Figure 3.14 Distribution of Respondents based on FavouriteOnline Shopping Sites
52
Figure 3.15 Distribution of Respondents based on Amount ofSpending
53
Figure 3.16 Distribution of Respondents based on CriteriaFocussed During Online Shopping
54
Figure 3.17 Distribution of Respondents based on Risk Factor inElectronic Payment During Online Shopping
55
Figure 3.18 Distribution of Respondents based on Type ofPayment Preferred
56
Figure 3.19 Distribution of Respondents on the Basis of FeaturesNecessary For An Online Shopping Site
57
Figure 3.20 Distribution of Respondents on the Basis of58
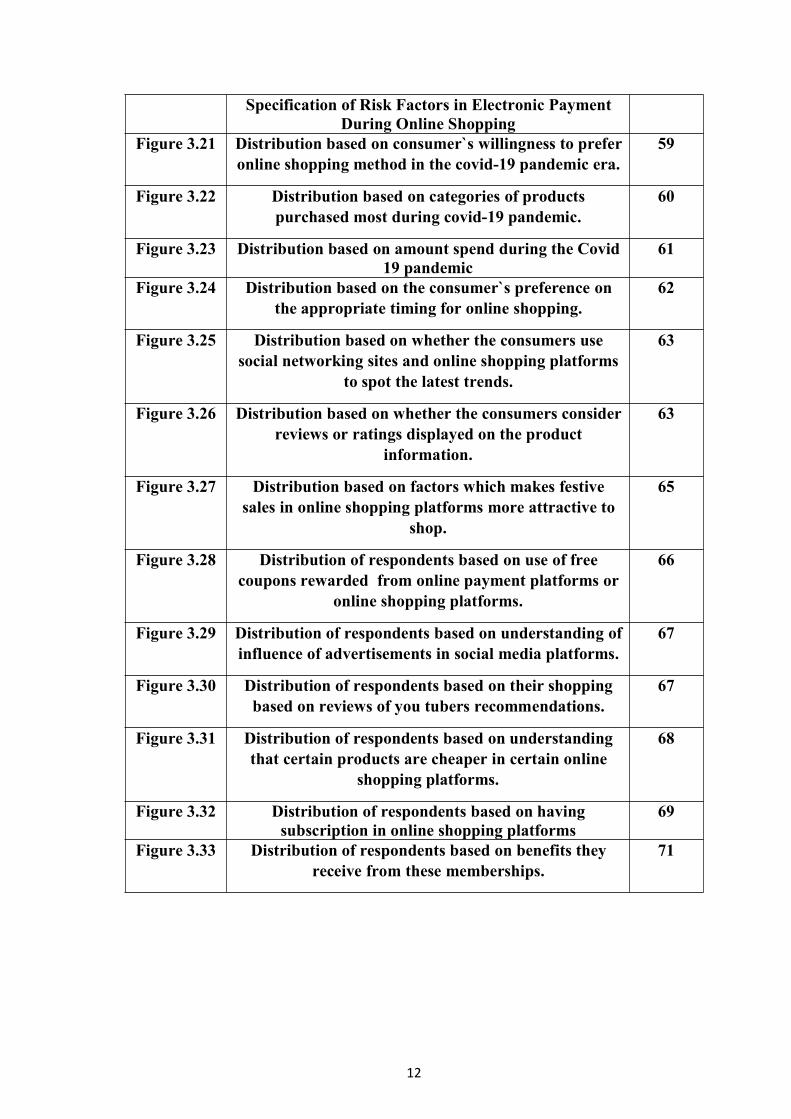
12
Specification of Risk Factors in Electronic PaymentDuring Online Shopping
Figure 3.21 Distribution based on consumer`s willingness to preferonline shopping method in the covid-19 pandemic era.
59
Figure 3.22 Distribution based on categories of productspurchased most during covid-19 pandemic.
60
Figure 3.23 Distribution based on amount spend during the Covid19 pandemic
61
Figure 3.24 Distribution based on the consumer`s preference onthe appropriate timing for online shopping.
62
Figure 3.25 Distribution based on whether the consumers usesocial networking sites and online shopping platforms
to spot the latest trends.
63
Figure 3.26 Distribution based on whether the consumers considerreviews or ratings displayed on the product
information.
63
Figure 3.27 Distribution based on factors which makes festivesales in online shopping platforms more attractive to
shop.
65
Figure 3.28 Distribution of respondents based on use of freecoupons rewarded from online payment platforms or
online shopping platforms.
66
Figure 3.29 Distribution of respondents based on understanding ofinfluence of advertisements in social media platforms.
67
Figure 3.30 Distribution of respondents based on their shoppingbased on reviews of you tubers recommendations.
67
Figure 3.31 Distribution of respondents based on understandingthat certain products are cheaper in certain online
shopping platforms.
68
Figure 3.32 Distribution of respondents based on havingsubscription in online shopping platforms
69
Figure 3.33 Distribution of respondents based on benefits theyreceive from these memberships.
71
13
CHAPTER 1
DESIGN OF THE STUDY
14
1.1 INTRODUCTION
Online shopping is a form of e-commerce which permits consumers to directlypurchase goods or services from a seller by using the Internet. Other names are e-shop, e-store, Internet shop, web store, virtual store and online store. An online shoparouses the physical similarity of buying products as well as services from internetshop and this process of shopping is called business-to-consumer online shopping.Online shopping is the practice in which consumers decide to buy the productthrough internet. Internet has developed into a new distributive channel for manyproducts. Using the internet to shop online has become a primary reason to use theinternet, combined with searching of products and finding information about them.Therefore, internet has developed as a highly competitive market, where thecompetition over consumers is fierce. In some social networking site like E Bay, e-shopping is being done, where some retail online shops are available. The use ofInternet in India offers a growing prospect for e- shopping. If E-customers know thefactors that affect online behaviour, and the relationships between these factors,further they can build their new marketing strategies to transform probablecustomers into lively customers, Consumer behaviour is treated as an applieddiscipline because some decisions significantly affect customer’s behaviour andexpected actions. Consumer behaviour is the study of how individual customers,groups or organisations select, buy, use, and dispose ideas, goods and services tosatisfy their needs and wants. It refers to the actions of the consumers in the marketplace and the underlying motives for those actions.
Online Shopping becomes more popular into people’s daily life, lot of people preferonline shopping to normal shopping. Online shopping is easy and convenient forpeople to pick up the product they want using internet. People just need to click thepointer to finish the whole shopping process. Online shopping makes shopping easyand life become easy too. There are various reasons of shifting the customers buyingpatterns towards online retail shop. The facility of comparing your product withcompetitive products based on price, colour, size and quality is one of the biggestbenefits of online shopping. Online Shopping is booking delivery of a new andtraditional sale products and service to the customer through electronic channels. Itfacilitates receiving prompt information on financial products and services. For thecustomers the important benefits are anywhere purchasing through internet andmobile. It has also facilitated the use of secured Debit card and Credit card andonline bank transaction and cash on delivery.
Internet has changed the way of consumer’s store and has rapidly developed into aglobal perspective. Many companies started using online shopping with the aim of
15
reducing marketing costs, that will lead to reduce the price of their products to stayforward in very highly competitive markets. Companies also use the Internet todeliver, connect and distribute information and products. Customer uses the Internetin so many ways not only for buying the products, but also to compare productstructures, prices, warrantees and delivery services. Many specialists are positiveabout the future of online marketing business. Along with the development of E-retailing, scholars continue to explain E-consumers ’behaviour from diverseperspective. Many of the studies have assumptions which are based on classicalmodels of consumer behaviour, and then study the validity of e-marketing.
Consumers find a product of interest by visiting the website of the retailer directlyor by searching among alternative vendors using a shopping search engine, whichdisplays the same product's availability and pricing at different e-retailers theprocess is called business to- consumer (B2C) online shopping. As of 2016,customers can shop online using a range of different computers and devices,including desktop computers, laptops, tablet computers and smart phones. It is alsopopular as e- shop, e-store, online store and virtual store. Earlier food, cloth andshelter were called as primary need but today one more need is added in that is“internet”. Due to revolution in telecommunication sector internet has changed theway consumers shop and buy goods and services. Both domestic companies as wellas MNC’s have started using the Internet with an objective of cutting marketingcosts and thereby reducing the price of their products to stay ahead in heavycompetition. Companies also use the Internet to convey communicates anddisseminate information, to sell the product, to take feedback and to conductsatisfaction surveys with customers. Customers use the Internet not only to buy theproduct online, but also to compare prices, product features and after sale servicefacilities they will receive. In addition to the tremendous potential of the E-businessmarket, the Internet provides a unique opportunity for companies to reach existingand potential customers more efficiently.
1.2 SIGNIFICANCE OF THE STUDY
Online shopping has been recognized as the most easiest and convenient form ofshopping around the world. It saves both the energy and time of the consumers andalso due to the economies of scale consumers are enjoying the added benefits of costreduction. The emergence and thriving of online shopping leads to the generation ofmore and more employment opportunities and also it widens the size of the marketwhich is an essential requisition of a stable economy. The emergence of onlineshopping brings a healthy competition in the market. The healthy competition isbeneficial to the consumers and increases the transparency and credibility ofconsumers. It also lead the producers to boost innovations. When we analyse therecent era of covid-19 pandemic where social distancing norms are necessary andmandatory, online shopping is both convenient and safest and also it determines theaccess of people towards a better shopping experience. There have been numerable
16
studies relate to this topic- consumers behavior towards online shopping. But in therecent era of pandemic it gained more significance and in the evolving technologicalera the study have a great significance. Thus, as an economic student it is very muchnecessary to analyse the consumers behavior towards online shopping and toidentify its impact, its problems and providing solution for the betterment of theeconomy. Online shopping is gaining more and more relevance in the recent years.As people are struggling in their busy schedule, they prefer online shopping overoffline shopping. Even though many studies have taken place in this area, thepresent study concentrate on consumer patterns and behavior of the consumers tounderstand the changing consumer behavior towards online shopping and what arethe improvements needed in online shopping platforms and help them to be awareof needs and requirements of consumers. And since the study is conducted in thecontext of covid-19 pandemic, it focused on the impact of the same in onlineshopping.
1.3 OBJECTIVES OF THE STUDY
To study the factors affecting consumer behaviour on online shopping. To figure out the impact of Covid -19 on consumer behaviour towards
online shopping. To study the role of marketing strategies in boosting online shopping.
1.4 METHODOLOGY OF THE STUDY
For achieving the objectives of the present study we have used both primary as wellas secondary data. Thrissur corporation in Thrissur district was selected as thesample area. The corporation includes 55 wards. Out of the 55 wards one ward(ward 44) was selected randomly using lottery method. There are 1873 householdsin ward 44. 50 households were randomly selected for conducting the survey. Thedata was collected through online survey method with the help of Google forms.The secondary data has been collected from magazines, journals, articles etc. Simplestatistical tools such as percentages, pie diagrams, bar diagrams are used foranalyzing the data.
17
1.5 REVIEW OF LITERATURE
Pritam P. Kothari, Shivganga S. Maindargi (2016) performed a research study on AStudy on Customers Attitude towards Online Shopping in India and its Impact: WithSpecial Reference to Solapur City. After the data analysis and interpretation, theresearcher found that occupation of consumers is independent of Purchase habit ofconsumers in online shopping. Finally, the researcher concluded that the future ofonline shopping in India looks very bright. Online shopping gives customers bestalternatives to save money and time. Companies Offers detail product information,easy mode of payment, facility of comparison of price and very importantcompletely hassle free shopping experience. The Success of online shoppingdepends on its popularity, its brand image and its unique promotional policies.
Ashish Bhatt (2014) performed a research work on “Consumer Attitude towardsOnline Shopping in Selected Regions of Gujarat”. After the analysis, some of theFindings was 49.5% users of both Regions agreed that the Data of product shown ononline is sufficient, 32% users Strongly felt that online transaction is safe, 46.5%users of Both Regions do payment by cash on delivery, 29.5% users Both Regionspurchased computer accessories, 40.5% users Of both Regions are purchasing theproducts through online More than Rs.2500 and The mean value of computerAccessories is 2.83 which mean the data is highly Significance. Finally, theresearcher concluded that online Shopping is gaining more popularity among people,especially among the younger generation and become equally popular among all agegroups.
Ashwini.N, Manjula. R (2016) performed a research study on “An Empirical Studyon Consumers Perception towards Online Shopping”. Then Most of the respondentssay online shopping helps them quick accessibility of a wide variety of products.Cash on delivery and easy replacement is one of the advantages of online shopping.Finally, the researcher concludes that Online shopping enables the customers to buyfrom any part of the world at any time providing better opportunity and benefits likecash on delivery, easy replacement, convenience, fast refund, time saving andsecured Delivery of the product, confidentiality, etc. The site enables them tobrowse before they shop, and to research the product so they have more confidencein what they are buying.
Lakshmi. S. (2016) performed a research study on “Consumer Buying Behaviourtowards Online Shopping”. Finally, the author concludes that the convenience andtrust were the most essential variables for consumers when they decide to shoponline. Web design and delivery time were not the important variables forconsumers while doing online shopping purchases. Young generation prefers buying
18
goods from the original source, so they prefer online shopping. Buying online canbe of great benefit to the consumer in terms of convenience, saving time and money.
K.S. Silpa, P.U. Rajasree, P. Balasubramanian (2016) Performed a research study on“A Study on Peoples‟ Perceptions towards Online Shopping”. As a result of dataAnalysis, the researcher concludes that most People favours to do online shopping,even if they felt some Difficulties. People who are non-shoppers are ready to doOnline shopping in the future if they get proper awareness and knowledge. Most ofthe people agree that in the near future online shopping will be more on demandthan offline shopping. More people prefer cash on delivery than net banking. Mostpeople do not shop online due to Fear of the quality of goods, afraid to give out theircredit Card details and, they find conventional methods m enjoyable. Onlineshopping will take over as the prime Marketing and selling channel in India in nearfuture.
Sonal Kala (2015) performed a research study on “Behaviour of Customers‟towards Online Shopping in India”. After the data analysis, the Author concludesthat Consumers have been seen to reveal Different buying Behaviour’s whenshopping online than, when they are shopping in a physical retail store. There is Nosignificant difference between the response of male and female managementstudents at Jaipur National University. The respondents have perceived onlineshopping in a Positive manner.
G.R.Shalini, K.S.HemaMalini (2015) conducted a Research work on Characteristicsof Online Shopping and Their Consumer Intention towards the Purchase of OnlineProducts in the Chennai city. From the data Analysis, the author Conclude thatpeople select flip cart for online shopping and online shopping had become a trendin this generation. The study reveals that there is positive relationship between thewebsite characteristics and attitude, trust and intention towards online purchasing.
S.Aruna, A. John William (2015) performed a research Study on “A Study ofConsumer Behaviour towards Online Shopping in Coimbatore District”. From thedata analysis result, the researcher concludes that people mostly prefer onlineshopping to Traditional shopping because of the technological Advancements. It hasbecome popular and is extremely convenient. Though it is convenient there arevarious Factors such as price, quality of the product and delivery Time whichcustomers look before online shopping. So, the online websites must of aware ofthese factors to be Successful and retain the customers. The result from the study isthat online shopping is growing rapidly in a Positive manner. By removing littleflaws, it can be much Profitable. S. Aruna, A. John William (2015)
R.Shanthi, DestiKannaiah (2015) performed a research Study on“Consumer’sPerception on Online Shopping”. From the data analysis result, theresearcher concludes that Youngsters are attached to the online shopping and hence

19
the elder people don’t use online shopping much as compared to the younger ones.It is also found that most of the people who shop online buys books online Followedby tickets (railway, movie, concerts).
KalpanaMathur, Arti Sharma (2014) performed a research study on “A Study ofonline Shopping Habits of Consumers in India”. From the data analysis result, theresearcher concludes that visiting shops, malls or retail outlets are more timeconsuming. Hence, many people preferred to shop online. The online shoppinghabits are gaining quick market and are growing every year because of theincreasing Internet usage of people and availability of Internet connections onmobile at cheaper rates. There is no significant relation between use of discountcoupons and occupation.
PratiksinhVaghela (2014) performed a research work on “A Study on ConsumerPerception towards Online Shopping”. After The analysis, finally researcherconcludes that most of the Customers were perceived that online shopping is betterOption than manual shopping and most of the customers were satisfied with theironline shopping transactions. Customers are accessing their net at their home andoffice/ College. Largely customers are buying clothe, electronics Items andaccessories.
Renuka Sharma, Kiran Mehta, Shashank Sharma (2014) performed a research workon “Understanding Online Shopping Behaviour of Indian Shoppers”. After the Dataanalysis and interpretation, the researcher concludes That Indian customers are alsogetting addicted to the online Shopping and they do like various features of onlineShopping as by rest of the world. Most of the internet Users belong to the youngstercategory and most Goods and services demanded are related only to these Segments.
GagandeepNagra, R. Gopal (2013) performed a research Study on “A study ofFactors Affecting on Online Shopping Behaviour of Consumers”. After the dataAnalysis, the researcher concludes that the gender does Impact Possession ofinternet and Frequency of online Purchase of consumer’s occupation is ademographic Variable which does not impact any of the variables. The Respondentshad perceived online shopping in a positive Manner. On-line shopping in India issignificantly affected by various Demographic factors like age, gender, maritalStatus, family size and income.
PreetiSrivastava (2013) performed a research work on “A Study of ConsumerOnline Shopping Attitude and Behaviour towards Jewellery”. Percentage analysisand bar charts were used to analyse the data for interpretation and conclusionpurpose. From the data analysis result, the researcher concludes that the Peopleacross the different ages are highly encouraged for online shopping. The people areMotivated for various reasons viz. Product variety and Design, fashionable andtrendiness, convenience, effective Presentation, gifts and offers, payment facility.
20
ManishaKinker, N.K. Shukla (2016) performed a Research study on “An Analysisof Consumer Behaviours towards Online Shopping of Electronic Goods Withspecial Reference to Bhopal and Jabalpur city”. The findings of the proposedResearch work are as follows as Customer-Oriented Factors “Time Saving‟,“Product Quality‟, “Product Price‟, “Convenience‟, “Accessibility‟, “ShopAnywhere and Anytime‟ are the main specific factors influence customers Attitudestoward electronic product online shopping. The Minor factors thatinfluencecustomer’s attitudes toward Electronic product online shopping aretechnological Factors, assured quality, cash on delivery and various Promotions anddiscounts. The attitude towards online Shopping is different in Bhopal and Jabalpurcity. After the Data analysis, the researcher concludes that the electronic Productonline market takes a high percent of individuals shopping on it.
A. T. Jaganathan, J. Suresh Kumar, M. Sakthivel, M. Mohanraj (2016) performed aresearch work on “A Study on Customer Perception towards Online Shopping,Namakkal”. After the data analysis and interpretation, the Researcher conclude thatthe consumer’s perception on online shopping varies from person to another and thePerception is limited to a certain extent with the availability Of the properconnectivity and the exposure to the online Shopping must be improved to make thecustomer Satisfied. The students are attached to the online shopping and hence theelder people don’t use online shopping much as compared to the younger ones, soawareness has been fashioned in the coming era. The online transaction should beflexible for the customers who perceived in shopping.
Saban Kumar K.C, Arun Kumar Timalsina (2016) Carried out a research work on“Online Grocery Shopping Attitudes among the Consumer in Kathmandu Valley”.As a result of data analysis, the Researchers conclude that majority respondents i.e.,86% were found to be aware about online shopping. Similarly, 89% of therespondents were positive about the online Shopping of grocery items whereas therest were negative. The Result also depicts that 52% respondents were aware aboutexisting online portals. The freshness and delivery Timing were given moreimportance than payment system and pricing while shopping vegetables and fruititems Online.
SnehalChincholkar (2016) performed a research work on “Consumer Behaviourtowards Online Grocery Retail Store “Localbanya.com” in Mumbai Region”. Whiledoing online purchasing cash on delivery and debit Cards are most preferred modeof payment. As a result of Data analysis, the researcher concludes that slowly ourTraditional way of grocery shopping may see a drastic Change.
Pawan Kumar, Kanchan (2017) performed a research Study on “Online ShoppingBehaviour among Students with Special Reference to Ludhiana, Punjab, India”. Asa Result of data analysis, the researchers conclude that Students are those who

21
mostly go for online shopping. There are several factors such as quality of products,Delivery time, products checking on the spot, return policy Etc. which customerlook before online shopping. So, the online websites must look after those factors tobe Successful and retain the customers. Online shopping among students ofLudhiana was grown in a positive Manner and decision on demonetization certainlyhelped the online shoppers to attract more and more customers.
M. Dhanalakshmi, M. Sakthivel, M. Nandhini (2017) Performed a research study on“A Study on Customer Perception towards Online Shopping, Salem”. As a result ofdata analysis and Interpretation, the researchers conclude that the consumer’sPerception of online shopping varies from person to another,and the perception islimited to a certain extent by the Availability of the proper connectivity and theexposure to the online shopping must be improved to make the Customer satisfied.
Simranjit Singh, Sonia Bajwa (2017) had carried out a Research study on “buyingbehaviour of consumer towards Counterfeit products: a case study of moga city”. Astructures Questionnaire was used by following the convenience sampling method.The data were described with the help of Pivot table and pie charts with percentages.
Priyanka Sharma (2017) performed a research study on “Consumer Behaviourtowards Online Shopping-An Empirical Study With Reference To Bhiwani City,Haryana”. The people having an annual income Below Rs 2, 50,000 prefer cash ondelivery and above Rs 2, 50,000 prefers Internet banking payments. Cash ondelivery Is found the most popular payment method for online Shopping amongconsumers.. The Majority Of the respondents buy from flipkart.com which is thusone of the leading online shopping websites in India. The Main barrier is the safetyof payment and privacy issue in The process of online shopping. This increases lowlevels of Trust on online stores; therefore, sellers must make proper Strategies toincrease the consumer’s level of trust with them.
ChaturvediAnd Gupta (2014) also observe the effect of social media on consumers’purchase Intentions. They conclude that social media is a powerful and low-costplatform for Sales promotions to attract and reach the maximum number ofconsumers.
Vinerean et al. (2013), Forbes and Vespoli (2013), and Leerapong and Mardjo(2013) analyse the importance of social media and its effects on online purchasing.Vinerean et al. (2013) state that social media influence online shopping.
Forbes AndVespoli (2013) indicate that people consider the views of opinionleaders in Social media when they make a purchase and buy both expensive andinexpensive Products according to their recommendations. Accordingly, they advisecompanies to encourage their customers to post on social media. Anotherimplication is that Consumers desire information now, so there is a shift from
22
traditional social media Platforms, such as Facebook, to ‘quicker’ social mediaplatforms, such as Twitter.
1.6 LIMITATIONS OF THE STUDY
The study has certain limitations:
▪ the study was limited due to small size of available data, time and resources.
▪ the study was confined to Thrissur district of Kerala.
▪ there might be errors due to the bias from the respondents.
▪ Consumer utility is a subjective aspect and hence drawing generalizations from itmay be erroneous.
1.7 CHAPTER SCHEME
Both primary and secondary data is used in the study. The work is divided into fourchapters. The very first chapter is an introductory chapter, which consists ofsignificance of the study, research problem, objectives of the study, methodology,review of literature, limitations and scheme of the study.
The second chapter deals with an overview about online shopping, its origin,evolution, growth and consumer behaviour pattern towards online shopping etc. inglobal, Indian, Kerala context. The third chapter consists of data analysis andinterpretations. The fourth chapter serves as the concluding chapter, a summary ofthe findings of study, some suggestions and recommendations and conclusions arealso provided in this chapter.
23
CHAPTER TWO
ONLINE SHOPPING AN OVERVIEW

24
2.1. INTRODUCTION
Online shopping is a form of electronic commerce which allows consumers to
directly buy goods or services from a seller over the Internet using a web browser.
Alternative names are e-web store, e-shop, e-store, Internet shop, web-shop, web
store, online store, and online storefront and virtual store. Mobile commerce
describes purchasing from an online retailer's mobile optimized online site or app.
An online shop evokes the physical analogy of buying products or services at a
bricks-and-mortar retailer or shopping centre; the process is called business-to-
consumer online shopping. In the case where a business buys from another business,
the process is called business-to-business online shopping. The largest of these
online retailing corporations are Alibaba, Amazon.com, and eBay. Consumer
behaviour can be defined as those acts of individuals (consumers) directly involved
in obtaining, using, and disposing of economic goods and services, including the
decision processes that precede and determine these acts. It is also called buyer
behaviour. Consumer behaviour refers to human behaviours which go in making
purchase decisions. When consumers make decisions, they are engaged in problem-
solving talks, that is, satisfying a perceived need.
2.2. ONLINE SHOPPING IN THEWORLD
2.2.1. INTRODUCTION
Online shopping has obtained very important position in the 21st century as most of
the people are busy, loaded with hectic schedule. In such a situation online shopping
became the easiest and most suitable mode for their shopping. Internet has changed
the way of consumer's store and has rapidly developed into a global perspective. An
online shop arouses the physical similarity of buying products as well as services
from internet shop and this process of shopping is called business-to-consumer
online shopping.
The internet has revolutionized businesses, economies, and societies all over the
globe. It is constantly unleashing new business models, creating new products and
services, changing the way consumers shop and businesses sell their products. The
25
increasing number of Internet users every year indicates increased awareness of
Internet’s benefits for the people across the world. As Internet is becoming more
widely used and is playing a very significant role in every sector of human life, for
example in studies, in business, entertainment, social life and in online shopping, the
internet brought a revolution in the human life, it is very helpful in every sector.
Online shopping is also growing tremendously. As many businesses are attempting
to globalize their sales, Internet becomes the primary means of advertising and
selling their products or services worldwide. Many businesses are creating web
pages in addition to their retail stores, and many start their businesses with online
stores alone. Internet is changing the consumer behaviour toward online shopping
because it is easy, and consumers can get huge range of variety and can compare the
prices easily and it is convenient too. Online shopping is getting famous ever than
before and it’s making a great space in the consumer market, and because of this
more consumers attracting toward online shopping everyday all around the world.
Consumer shopping habits have changed drastically over the last few years thanks
to the explosion of Ecommerce. Online shopping is a part of the Ecommerce
activities and we need to know about Ecommerce before moving further forward. E
commerce is the buying and selling of goods or services on the internet. It
encompasses a wide variety of data, systems and tools for online buyers and sellers,
including mobile shopping and online payment encryption. Most business with an
ecommerce presence utilizes an ecommerce store or an ecommerce platform to
conduct online marketing and sales activities and to oversee logistics and fulfilment.
2.2.2. TYPES OF ECOMMERCE
Generally, there are six main models of ecommerce that businesses can be
categorized into 6. Let’s review each type of electronic commerce in a bit more
detail.
1. Business-to-Consumer (B2C).
B2C ecommerce encompasses transactions made between a business and a
consumer. B2C is one of the most popular sales models in the ecommerce context.
26
For example, when you buy shoes from an online shoe retailer, it’s a business-to-
consumer transaction.
2. Business-to-Business (B2B).
Unlike B2C, B2B ecommerce encompasses sales made between businesses, such as
a manufacturer and a wholesaler or retailer. B2B is not consumer-facing and
happens only between businesses.
Business-to-business sales often focus on raw materials or products that are
repackaged before being sold to customers.
3. Consumer-to-Consumer (C2C).
C2C is one of the earliest forms of ecommerce. Customer-to-customer relates to the sale
of products or services between customers. This includes C2C selling relationships,
such as those seen on eBay or Amazon.
4. Consumer-to-Business (C2B).
C2B reverses the traditional ecommerce model, meaning individual consumers make
their products or services available for business buyers.
For example, the iStock Photo business model in which stock photos is available online
for purchase directly from different photographers.
5. Business-to-Administration (B2A)
B2A covers the transactions made between online businesses and administrations. An
example would be the products and services related to legal documents, social security,
etc.
6. Consumer-to-Administration (C2A).
C2A is like B2A, but consumers sell online products or services to an administration.
C2Amight include online consulting for education, online tax preparation, etc.
B2A and C2A are focused on increased efficiency within the government via the
support of information technology.
27
2.2.3. HISTORYOF ECOMMERCE
Ecommerce was introduced about 40 years ago in its earliest form. Since then,
electronic commerce has helped countless businesses grow with the help of new
technologies, improvements in internet connectivity, added security with payment
gateways, and widespread consumer and business adoption.
Ecommerce Timeline
1969: CompuServe is founded by electrical engineering students Dr. John R. Goltz
and Jeffrey Wilkins, early CompuServe technology was built utilizing a dial-up
connection. In the 1980s, CompuServe introduced some of the earliest forms of
email and internet connectivity to the public and dominated the ecommerce
landscape through the mid-1990s.
1979: Michael Aldrich invents electronic shopping. This made it possible for closed
information systems to be opened and shared by outside parties for secure data
transmission — and the technology became the foundation for modern ecommerce.
1982: Boston Computer Exchange launches. When Boston Computer Exchange
launched, it was the world’s first ecommerce company.
1994: Marc Andreessen and Jim Clark co-created Netscape Navigator as a web
browsing tool. During the 1990s, Netscape Navigator became the primary web
browser on the Windows platform, before the rise of modern giants like Google.
1995: Jeff Bezos introduced Amazon primarily as an ecommerce platform for books.
1998: PayPal launches as an ecommerce payment system.
By 2000, it would merge with Elon Musk’s online banking company and begin its
rise to fame and popularity.
1999: Alibaba Online launched as an online marketplace. It went on to turn into a
major B2B, C2C, and B2C platform that’s widely used today.
2000: Google introduces Google AdWords as an online advertising tool. Google
Adwords was introduced as a way for ecommerce businesses to advertise to people
using Google search.
28
With the help of short-text ad copy and display URLs, online retailers began using
the tool in a pay-per-click (PPC) context. PPC advertising efforts are separate
from search engine optimization (SEO). And thus, the requirements for the growth
and establishment of online shopping have been made by the advent of Ecommerce
facilities, described above.
2.2.5. GLOBAL SALES IN ONLINE SHOPPING
E-commerce sales hit $25.6 trillion globally in 2018, up 8% from 2017. According to
the UNCTAD analysis, the estimated 2018 e-commerce sales value, which includes
business-to-business (B2B) and business-to-consumer (B2C) sales, was equivalent to
30% of global gross domestic product (GDP) that year. The 2017 value of global e-
commerce was estimated at $23.8 trillion, based on a revised methodology.
2.3. ONLINE SHOPPPING IN INDIA
2.3.1. INTRODUCTION
Online shopping in India had a rather slow and disorderly journey, it has not picked
up as much as it should have primarily since internet penetration itself was quite low
and secondly, the customers were not aware about it as well. It is convenient, faster
and sometimes also cheaper than the traditional buying. Now a day’s buying train
ticket, bus ticket, air ticket all of them have gone through online option as well.
Rather than standing in a long queue and waiting for your turn to purchase a ticket,
people are finding it simpler to log on to a website and buy it. In some instances,
you may have to pay a premium for an online purchase, but it is still preferred
because the convenience factor is much higher.
2.3.2. EVOLUTION OF ONLINE SHOPPING IN INDIA
In mid-nineties: Introduction of E-Commerce The year 1991 was noted as a new
chapter in the history of the online world where e-commerce became a hot choice
amongst the commercial use of the internet. Later in 1995 e-commerce started in
India. At that time nobody would have even thought that the buying and selling
29
online or say the online trading or services that we enjoy today will become a
routine trend in the world and India will also share a good proportion of this success.
Around 2002: IRCTC teaches India to Book ticket online India first came into
interaction with the online E-Commerce via the IRCTC. The government of India
took the initiative and experimented this online strategy to make it convenient for its
public to book the train tickets online. Because of this initiative passengers were
first time encountered with the online ticket booking from anywhere at any time.
This was a great boon to the common man as now they don’t have to wait for long
in line, no issues for wastage of time during unavailability of the trains, no burden
on the ticket bookers and many more. With the advancements in the technology as
the years passed on have been also seen in the IRCTC Online system as now one
can book tickets (tatkal, normal, etc.) on one go, easy payments, can check the
status of the ticket and availability of the train as well. Moreover, you can see there
are lot many things are available on the irctc website like hotel booking, planning
your tour destination, flight booking, cab booking, best deals and discounts in
mydala site, you can make payments using Paytm as well as booking tickets using
cash on delivery facility and all these things you can operate thorough your smart
phone as well. This is a very big achievement in the history of India in the field of
online E-Commerce. Both the snapshots you can see how the site was in 2002 and
how it appears in 2015.
Around 2003: Introduction of Low-Cost Airline with Air Deccan After the
astonishing success of the IRCTC, the online ticket booking system was followed
by the airlines (like Air Deccan, Indian Airlines, SpiceJet, etc.). Airline agency
encouraged, online booking to save the commission which was given to the agents
and thus in this way it made the major population of the country to try online air
ticket booking for the first time. Today, the booking system is not just limited to the
transportation rather hotel bookings, bus booking etc. are being done using the
websites like MakeMyTrip, Yatra, Redbus.in and so on.
Around 2007 and later on: Heavy Discounted Model of Flipkart the recognition of
the ecommerce on a large scale by the Indian people influenced other business
players also to try this technique for their E-businesses and gain high profits.
30
Though online shopping has been present in India since the 2000 but it gained
attractiveness only with deep discount model of Flipkart. This was in a way re-
launching of online shopping in India. Very soon other portals like Amazon,
Flipkart, Jabong, and Rediff, India times etc. started hunting India for their
businesses. Earlier the site in 2000 contains lot of information regarding the news
and happenings. Presently if you see the website, it has got various links for
shopping and various promotional activities. Xiaomi (pronounced she-yow-mee) is
one of the fastest-growing tech companies in the world. It’s the sixth-largest handset
maker on earth and No.3 in China, behind Samsung Electronics and Lenovo Group,
according to research firm Canalys. In India they have joined hands with flipkart to
sell their products. Xiaomi's Mi3 smartphone went out of stock on e-commerce
retailer Flipkart, after just 39 minutes of going on sale on 22 July 2014 at 12 PM,
and this they have continued their sale which went out of stock just in few seconds.
They went on with the same strategy for their many other brands like Redmi, mi4
and so on. They found this strategy very attractive. Many other companies like
Lenovo and Micromax also followed this same strategy. The strategy was to make
the mobile models exclusively available only on the flipkart website and nowhere
else. Those who are interested need to register for the same within the specific time
limit and then they would be eligible to buy that model.
Around 2014: Current Scenario Online shopping in its early stage was a simple
medium for shopping with fewer options. The users can just place an order and pay
cash on delivery. But, in last few years this field has been renewed to a high extent
and hence captivated many customers. Today, the online shopping has become a
trend in India and the reason behind the adoption of this technique lies in the
attractive online websites, discounted sales, user friendly interface, bulky online
stores with new fashion, easy payment methods (i.e., secure pay online via gateways
like PayPal, net banking, credit/debit card or cash-on-delivery), no bound-on
quantity & quality, one can choose the items based on size, colour, price, free home
delivery, etc.
31
2.3.5. MODES OF PAYMENT USED IN ONLINE SHOPPING
Online shoppers commonly use credit card or PayPal account to make payments.
Some other use Cash on Delivery, Debit Card, Online e-Payment, Mobile Payments,
Bank Transfer. According to the reviews the basic mode of payment used is cash on
delivery (COD) as it is secure.
2.3.6. CURRENT SCENARIO OF ONLINE SHOPPING IN INDIA
Early stage of online shopping was a simple medium for shopping with fewer
options. The users can just place an order and pay cash on delivery. But in the last
few years, this field renovated to a high extent and hence fascinated many customers.
Today, the online shopping has become a trend in India and the reasons behind this
technique lie in the attractive online websites, user-friendly interface, bulky online
stores with new fashion, easy payment methods, unrestricted quantity, quality etc.
One can choose the items based on size, colour, price, etc. Despite being a
developing country, India has shown a commendable increase in the e-commerce
industry in the last couple of years, thereby hitting the market with a boom. Though
the Indian online market is far behind the US and UK, it has been growing fast.
Further, discounts, coupons, offers, referral systems, 30 days return guarantee, 1-7
days delivery time, etc. have added a new flavour to the online shopping and the E-
markets Industry. COVID-19 lockdowns which lead to a surge in online orders of
essential items for same day delivery especially in tier-1 cities like Mumbai,
Kolkata, Bengaluru, Chennai and New Delhi.Flipkart will debut a hyperlocal
service called Flipkart Quick in Bengaluru to start 90 minutes deliveries. Amazon
observed spike in page views with four times increase in “Add to Cart” during the
lockdown, leading to doubling of sales. It also started selling auto insurance in
partnership with Acko General Insurance which is available to users through
Amazon app and mobile website. With opening of 10 new warehouses, the count of
Amazon warehouse in India stands at 60 across 15 states that has an area equivalent
to more than 100 football fields.
32
Report from software as a service (SaaS) provider Unicommerce shows increasing
penetration of e-commerce beyond tier-1 cities with major growth coming from tier-
2 and tier-3 towns/villages due to increasing vernacular language content and
improving last mile delivery. Consumers are also diversifying their purchasing
option from large scale e-commerce channels like Amazon or Flipkart to specific
retail brand websites. As per Goldman Sachs, three or four players can co-exist in
the e-commerce space given the size of India but travel, food delivery; ride-hailing
services will see a maximum of two players capturing the market. Reliance Jio will
increase competition in grocery, fintech, online retail, food delivery. From February
2020 to June 2020 during the Covid19 lock-down period, e-commerce increased by
117% with the delivery of only essential supplies that is now bigger than the pre-
Covid19 level. Flipkart surpassed 1.5 billion visits per month with 45% growth in
monthly active user while 30% growth in transaction per consumer.
Though the sector has witnessed tremendous growth and is expected to grow, many
e-commerce ventures have faced tremendous pressure to ensure cash flows. But it
has not worked out for all the e-commerce websites. Many of them like Dhingana,
IndiaPlaza.in, eBay-India, Rock.in, Seventy MM amongst others had to close or
change their business models to survive. In March 2020, the Government of India
Closures, restricted online sales of all goods except for critical items including food,
pharmaceuticals, and medical equipment. Many Indian start-ups including Urban
Company, BookMyShow, Pepper fry and Nykaa, which do not feature in the
government’s list of notified essential services, are running at a loss due to COVID-
19 pandemic.
Considering the Covid-19 pandemic, the Indian government issued a directive to
stop delivery of non-essential items by e-commerce platforms. This led to many e-
commerce platforms to collaborate and sell essential goods. McCoy Mart partnered
with Rossari Biotech Ltd to sell hand sanitizers. Flipkart partnered with Uber for
last mile delivery of essentials to its customers.
2.3.7. FUTURE OF ONLINE SHOPPING IN INDIA
Today online shopping has become a booming industry in India. Today, marketers
can promote their products and services using the Internet over a wide geographical

33
area. These days‟ companies collaborate with discounts and daily deals sites to earn
profits upon rising trends of online shopping. Google has estimated that in India
there are more than 100 million Internet users and among them half of the users‟
access Internet for their purchases. India’s plan to rebuild and modernize the Indian
Postal infrastructure will no doubt, boost the e-commerce sector. India’s current
dynamics are like what existed in China like, growing broadband penetration,
acceptance of online marketplaces, and lack of physical retail infrastructure in many
places due to high really costs etc.
2.3.8. MAJOR ONLINE SHOPPING PLATFORMS IN INDIA
Online shopping has grown very fast in India. Only in 2012, online shopping or e-
commerce number has crossed 600 from 100. Best of few online shopping are;
Flipkart.com
Amazon.in
Snapdeal.com
Jabong.com
Mynthra.com
Homeshop18.co m
Shopclues.com
eBay.com
paytm.com
2.4. ONLINE SHOPPING IN KERALA
2.4.1. INTRODUCTION
The digital developments of Kerala are exemplary. Kerala is well ahead of rest of
the states in e-matters. As per the TRAI’s (Telecom Regulatory Authority of India)
figures in 2016, Kerala has 35% Internet penetration, covering about 20percent of
the households through broadband and another 15 per cent through mobile. Kerala
has the highest mobile penetration in the country, i.e., around 95%. There are more
than 30 million mobile connections for a population of 33 million and still a rapid
growth is happening in the usage of smart phones. The state holds75% e-literacy.
Kerala has been declared as a ‘First complete digital state’ in 2015. In addition,

34
about 57% of the mobile subscribers access the Internet (second highest in India)
and Kerala is the forerunner in the adoption of IT Services. Kerala ranked third in
the Internet Readiness among large Indian state category. There is a tremendous
growth opportunity for Kerala in ecommerce. The high internet and mobile
penetration, preference towards consumerism, the high literacy rates and much
higher technical adoption of people of Kerala all are favourable for ecommerce
growth. The steady growth rate of 50 - 60 per cent in Kerala recorded in 2013- 2016
can be continued. As suggested by Shopclues officials, Kerala can easily account for
4% of the overall sale in the country. However, it is important that the state
authorities develop a conducive atmosphere for ecommerce and the regulations need
to be simplified. It is also expected that as GST is introduced, consumer state like
Kerala is going to get a big advantage from ecommerce.
The state of Kerala is well ahead of other states in e-mattersAs per a report that
appeared in the New Indian Express (14th September 2016) the ecommerce sector
in Kerala has recorded a steady growth rate of 50 - 60 percent from 2013- 2016.
Kerala also has a huge potential for growth (New Indian Express, 4th May 2017).
Despite the phenomenal growth of ecommerce in India, studies on ecommerce in
India, especially in Kerala are minimal. The vast potential of conducting business
over the Internet remains largely untapped these days.
2.4.2 GROWTH OF ECOMMERCE IN KERALA
Kerala is a small maritime state of Indian peninsula with 14 revenue districts. It is a
highly consumer state with the highest density of population compared to the other
states of India. In the past few years, Kerala has witnessed amazing growth and
development in its economy. Kerala’s economy is primarily based on agriculture,
tourism, industries and foreign remittances (Gulf money) [32]. According to IBEF,
in the year 2015-2016, primary sector (agriculture, mining and quarrying segments)
contributed 12.69%, secondary (manufacturing, construction, electricity, water and
gas supply) 19.51% and tertiary (storage, transport, and financial real estate
segments) contributed 67.8% to the state’s GSDP [33]. In 2016-17, at national and
state level seven percent growth rate in the economy was reported and primarily the
tertiary sector has upsurged the economic growth in the State [34]. 4.1. Benefits of
35
E-commerce in the Perspective of Kerala Online shopping have become very
common, largely due to the convenience and time saving option. The additional
feature of safe transactions has also attracted more customers. The development of a
dynamic and user-friendly e-commerce website with different features including
search products, customization of products, 24x7 technical support and maintenance,
security features for safe transaction, tracking of orders and info on shipping, track
history, prompt delivery, etc. attracts the customer easily and effectively, and
increases the online sales. The dependence on the e-commerce portals to obtain the
products instantly is increasing worldwide.
2.4.3. KEY E-COMMERCE PLATFORMS OR PORTALS IN KERALA
To expand the e-business trading, Kerala State Industrial Enterprises Ltd (KSIE)
has hosted their own e-com portal. This is one of the initiatives, which will provide
opportunities for SMEs to join this venture as “partners in progress” and will allow
them to showcase their products and grab the opportunities for business in the
global market. The e-com portal of the company “www.keralarcade.com” allows the
customers to browse the wide range of products and visit the partner micro-sites.
This is first of its kind in Kerala and with the facility of online payment. In another
e-commerce move, household retailer major Alapatt Super Shoppe, a part of Alapatt
group has become the first offline appliances retailer in the state to open a secured
online shopping portal for appliances from leading brands and with an option of free
home delivery of appliances to the six central districts of Kerala including Kochi.
The same group plans to climb another level by setting up an APP to facilitate the
shopping. Another e-commerce example, ‘Keralaspecial.in’ portal focuses on
marketing and selling of exquisite products like handlooms, handicrafts, spices, gift
articles and apparels for Keralites across the world. They procure high quality
products from the manufacturers and sellers to provide the best customer service. To
enable prompt delivery, they are linked up with India Post and other courier services
and provide both COD and e-payments method.
36
2.4.4. E-COMMERCEADOPTION BY SMEs IN KERALA
The e-commerce adoption by SMEs will be a cost effective medium to increase the
global sale. In a study comprising of SMEs in these countries, it was found that
adoption of e-commerce had following benefits including extended market reach,
rise in sales, improved communication with outside world, better company image,
higher speed of data processing, and increased employee productivity. Present day
Kerala has excellent digital connectivity, communication network, highly skilled
human resources and a relatively good industrial infrastructure to support the
growth of the MSME Sector. As on September 17, 2015, Kerala witnessed a total of
2, 57,466 registered and working SSIs/MSMEs with a total investment of 17,
98,646.38 lakh and production of the total value of goods and services worth
67,65,143.93 lakh. This sector by itself generated 13, 18,666 numbers of
employment. The Snapdeal, an online marketplace in partnership with KPMG
published the study titled ‘Impact of E-commerce on SMEs in India', which
examined the macro-impact of e-Commerce sector on the growth of SMEs in India.
According to KPMG, initiatives like seller training programs, seller financing
program to SMEs can help to plug the gaps and could facilitate adoption of e-
commerce by SMEs. The Government of Kerala has conceived plants to develop e-
commerce portals as a virtual showroom to showcase handicraft and other Kerala
specific products. Additionally, the government is encouraging MSME’s to
participate in National & International Trade fairs and B2B meets by providing
subsidies and incentives. Additionally, major e-commerce player Amazon tried to
partner with SMEs in Kerala. In 2015, Chai Cart an initiative was launched to
spread awareness among local SMEs and sellers on the benefits of online sale on the
Amazon India marketplace. Kerala has a market for buyers as well as sellers and
local sellers can trade several items including books, electronics, home, kitchen, and
personal care on the e-commerce portals.

37
CHAPTER THREE
DATA ANALYSIS
38
3.1 INTRODUCTION
In this chapter an attempt has been made to study the consumer behaviour towardsonline shopping in Thrissur district, Kerala. The purpose of the study was there forto establish this by the means of quantitative analysis about the age group, gender ofthe online consumers, and type of items purchased by the consumers, mostpopularly used online shopping sites, etc.Thrissur district is situated in the state Kerala in India. Thrissur is known as thecultural capital of Kerala. Thrissur is a revenue district situated in the central part ofthe state. Spanning an area of about 3,032 square kilometres, Thrissur district ishome to over 10% of Kerala’s population. Thrissur district is bordered by thedistricts of Palakkad and Malappuram to the north, and the districts of Ernakulamand Idukki to the south. The Arabian Sea lies to the west and Western Ghatsstretches towards the east. It is situated in south western India (10.52°N 76.21°E)and is in the central part of Kerala.According to the 2011 census Thrissur district has a population of 3,110,327. Thisgives it a ranking of 113th in India (out of a total of 640). The district has apopulation density of 1,026 inhabitants per square kilometre (2,660/sq. mi). Itspopulation growth rate over the decade 2001–2011 was 4.58%. Thrissur has a sexratio of 1109 females for every 1000 males, and a literacy rate of 95.32%.Thrissur district in consisted of one corporation, 7 municipalities and 255 villages.The 7 municipalities in Thrissur are Chavakkad, Chalakudy, Irinjalakuda,Guruvayoor, Kodungaloor, Kunnamkulam and Wadakkanchery.
3.2 PROFILE OF THRISSUR DISTRICT
The name Thrissur is derived from 'Thiru-Shiva-Perur', which literally translates to"The City with the name of the Lord Siva". Thrissur was also known as"Vrishabhadripuram" and "Thenkailasam" (Kailasam of the South) in ancient days.Another interpretation is 'Tri-shiva-peroor' or the big land with 3 Shiva temples,which refers to the three places where Lord Shiva resides –namely Vadakkumnathan Temple, Asokeswaram Siva Temple nearVadakkechira, Irattachira Siva Temple.Thrissur was once the capital of the Kingdom of Cochin. The region was ruled bythe Kulasekharas in the ancient times the history after 12th century records theprominence and decadence of PerumbadappuSwarupam. The 14th and 15 centuriesconstituted a period of aggressive wars during which the Samorins of Calicutacquired a large part of the present Thrissur District. In the subsequent centuries thePortugese dominated the scene. Later the Portuguese fall and other Europeanpowers like Dutch and English fought for the region and eventually the English heldthe power. During the English period Cochin had received the status of a princelystate. In 1947, India gained independence from the British colonial rule. Cochin wasthe first princely state to join the Indian Union willingly. Post-independence, E.IkkandaWarrier became first Prime Minister of Cochin. Then in 1949, Travancore-Cochin state came into being by the merger of Cochin and Travancore. Finally,
39
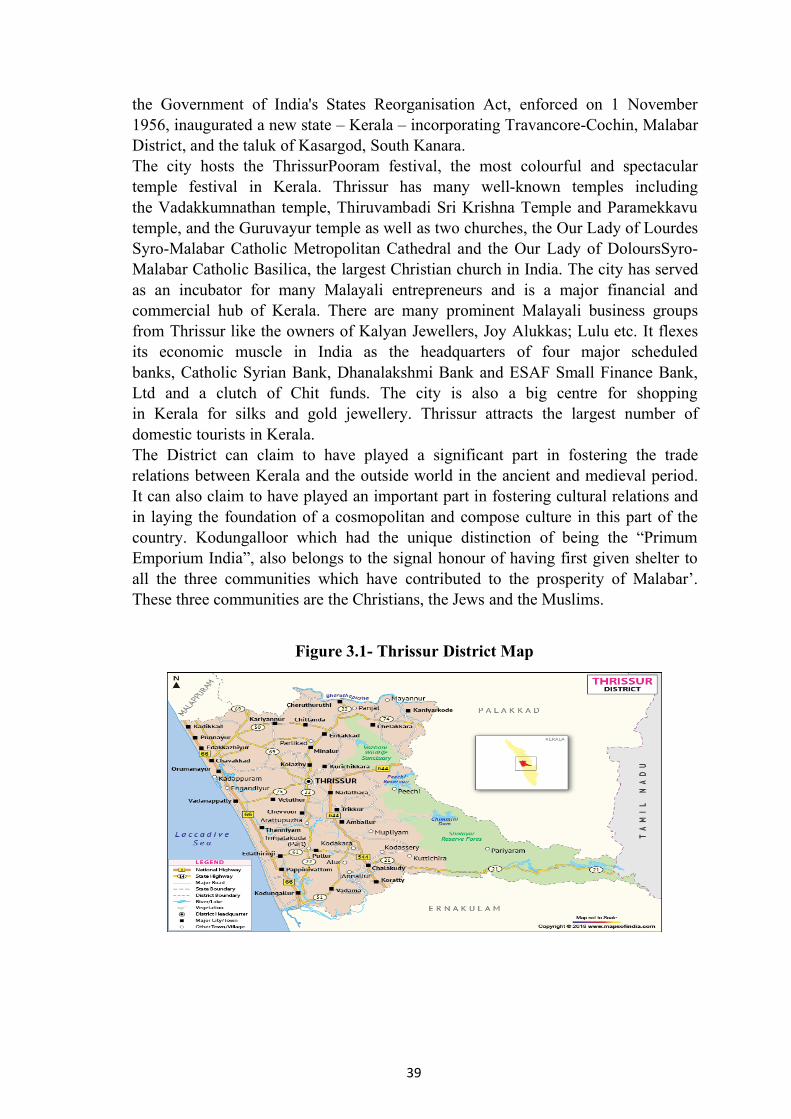
the Government of India's States Reorganisation Act, enforced on 1 November1956, inaugurated a new state – Kerala – incorporating Travancore-Cochin, MalabarDistrict, and the taluk of Kasargod, South Kanara.The city hosts the ThrissurPooram festival, the most colourful and spectaculartemple festival in Kerala. Thrissur has many well-known temples includingthe Vadakkumnathan temple, Thiruvambadi Sri Krishna Temple and Paramekkavutemple, and the Guruvayur temple as well as two churches, the Our Lady of LourdesSyro-Malabar Catholic Metropolitan Cathedral and the Our Lady of DoloursSyro-Malabar Catholic Basilica, the largest Christian church in India. The city has servedas an incubator for many Malayali entrepreneurs and is a major financial andcommercial hub of Kerala. There are many prominent Malayali business groupsfrom Thrissur like the owners of Kalyan Jewellers, Joy Alukkas; Lulu etc. It flexesits economic muscle in India as the headquarters of four major scheduledbanks, Catholic Syrian Bank, Dhanalakshmi Bank and ESAF Small Finance Bank,Ltd and a clutch of Chit funds. The city is also a big centre for shoppingin Kerala for silks and gold jewellery. Thrissur attracts the largest number ofdomestic tourists in Kerala.The District can claim to have played a significant part in fostering the traderelations between Kerala and the outside world in the ancient and medieval period.It can also claim to have played an important part in fostering cultural relations andin laying the foundation of a cosmopolitan and compose culture in this part of thecountry. Kodungalloor which had the unique distinction of being the “PrimumEmporium India”, also belongs to the signal honour of having first given shelter toall the three communities which have contributed to the prosperity of Malabar’.These three communities are the Christians, the Jews and the Muslims.
Figure 3.1- Thrissur District Map
40
3.3 DATA ANALYSIS AND INTERPRETATION
Data analysis is very important in every project work. This chapter is mainlyconfined to the detailed analysis of available data in order to know about the factsrelated to consumer behavior towards online shopping.
In this chapter, 50 households were randomly selected for conducting the survey.Survey was strictly based on well-structured questionnaire. Percentage analysis andaverage test is mainly use for the purpose of analyzing data. Data analysis is aprocess used to inspect, clean, transform and remodel data with a view to reach to acertain conclusion for a given situation. It is a process of obtaining raw data andconverting it into information.
3.3.1 CLASSIFICATION ON THE BASIS OF AGE
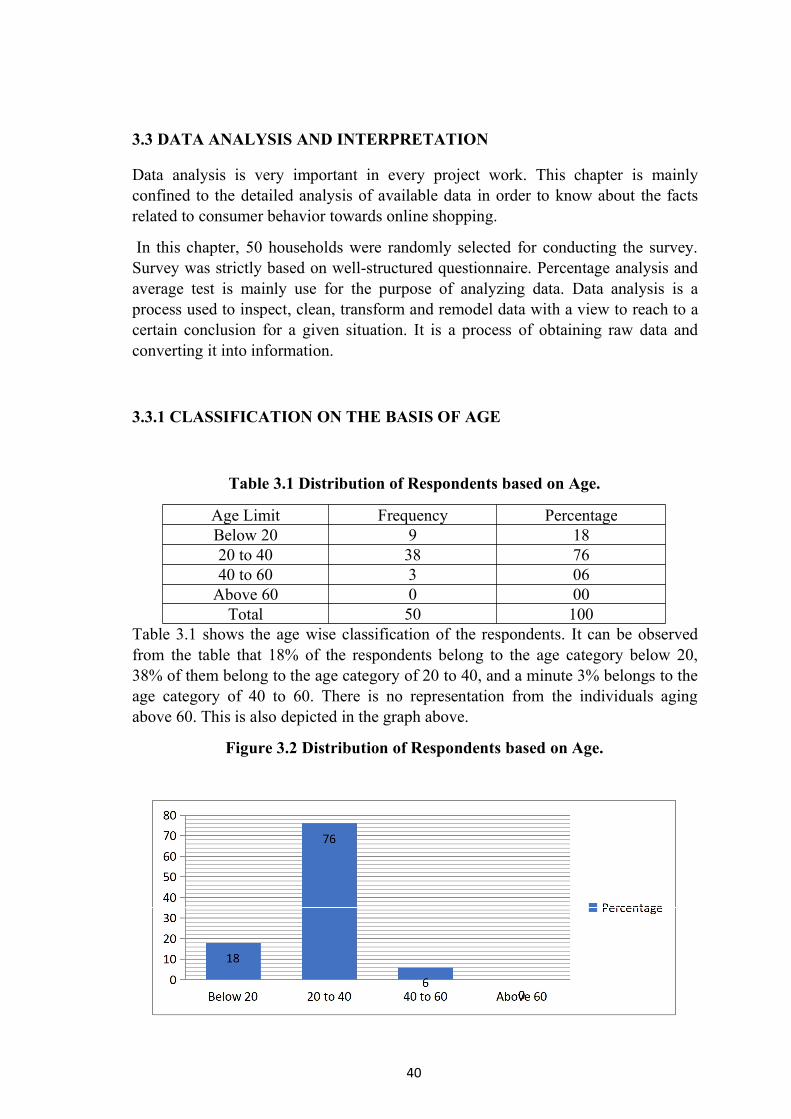
Table 3.1 Distribution of Respondents based on Age.
Age Limit Frequency PercentageBelow 20 9 1820 to 40 38 7640 to 60 3 06Above 60 0 00Total 50 100
Table 3.1 shows the age wise classification of the respondents. It can be observedfrom the table that 18% of the respondents belong to the age category below 20,38% of them belong to the age category of 20 to 40, and a minute 3% belongs to theage category of 40 to 60. There is no representation from the individuals agingabove 60. This is also depicted in the graph above.
Figure 3.2 Distribution of Respondents based on Age.
41
3.3.2 CLASSIFICATION ON THE BASIS OF GENDER
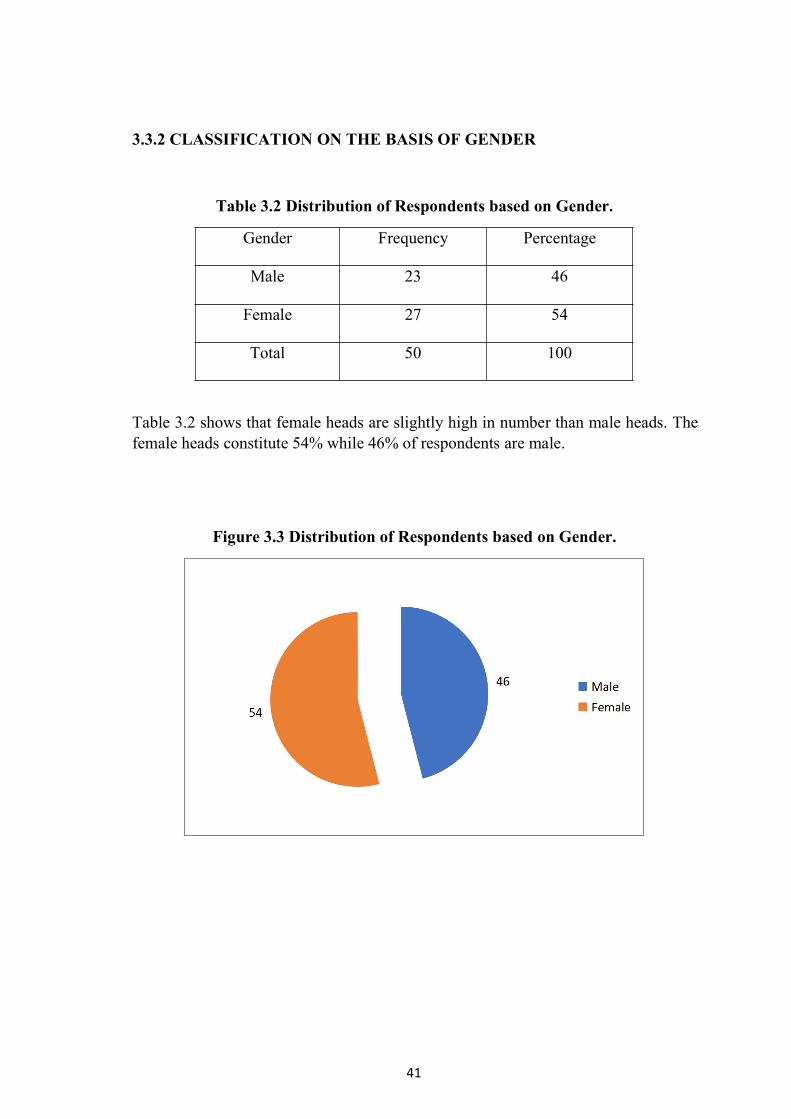
Table 3.2 Distribution of Respondents based on Gender.
Gender Frequency Percentage
Male 23 46
Female 27 54
Total 50 100
Table 3.2 shows that female heads are slightly high in number than male heads. Thefemale heads constitute 54% while 46% of respondents are male.
Figure 3.3 Distribution of Respondents based on Gender.

42
3.3.3 CLASSIFICATION ON THE BASIS OF RELIGION
Table 3.3 Distribution of Respondents based on Religion.
Religion Frequency PercentageHindu 32 64
Christian 14 28Muslim 2 04Atheist 1 02Others 1 02Total 50 100
Table 3.3 shows religious wise classification of households. Among the 50respondent’s majority of the individuals, with a proportion of 64%, belongs toHindu religion. 28% of individuals are Christians, and a 4% of Muslims are alsothere. There is a minute representation, with 2%, from atheist class. There is also anindividual from an unknown religion. The table is depicted in the graph above.
Figure 3.4 Distribution of Respondents based on Religion.
43
3.3.4 CLASSIFICATION ON THE BASIS OF MONTHLY INCOME
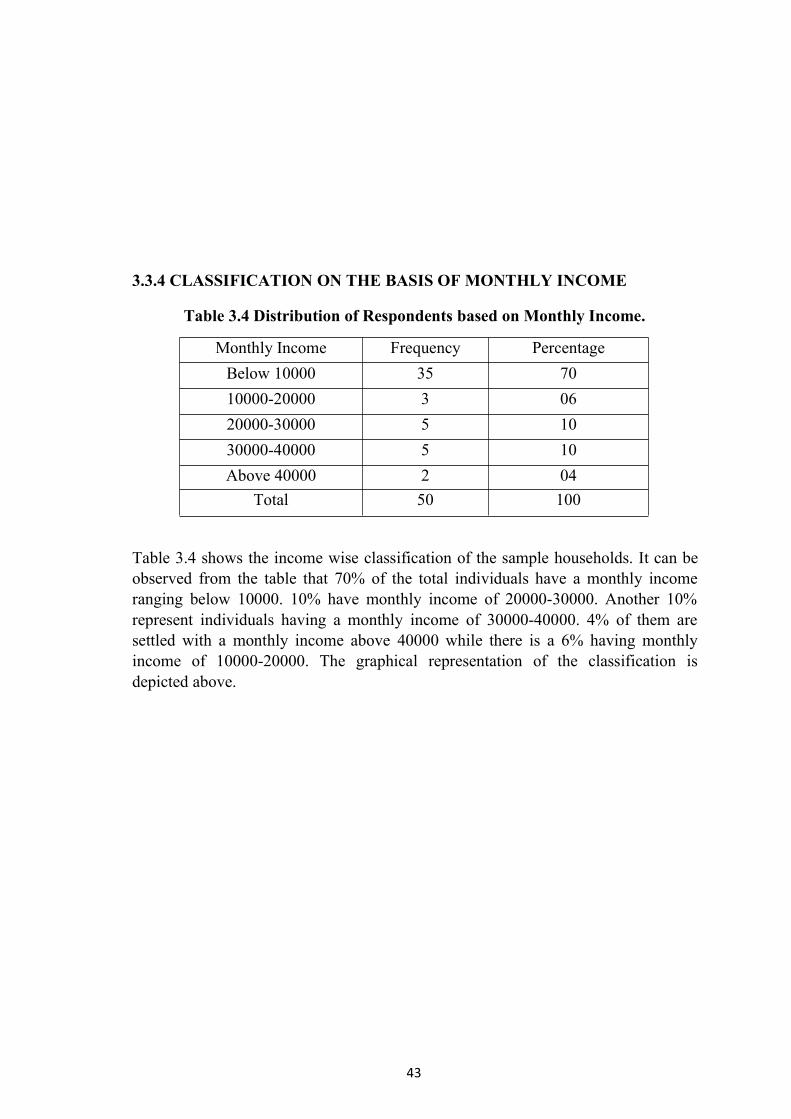
Table 3.4 Distribution of Respondents based on Monthly Income.
Monthly Income Frequency Percentage
Below 10000 35 70
10000-20000 3 06
20000-30000 5 10
30000-40000 5 10
Above 40000 2 04
Total 50 100
Table 3.4 shows the income wise classification of the sample households. It can beobserved from the table that 70% of the total individuals have a monthly incomeranging below 10000. 10% have monthly income of 20000-30000. Another 10%represent individuals having a monthly income of 30000-40000. 4% of them aresettled with a monthly income above 40000 while there is a 6% having monthlyincome of 10000-20000. The graphical representation of the classification isdepicted above.

44
Figure 3.5 Distribution of Respondents based on Monthly Income.
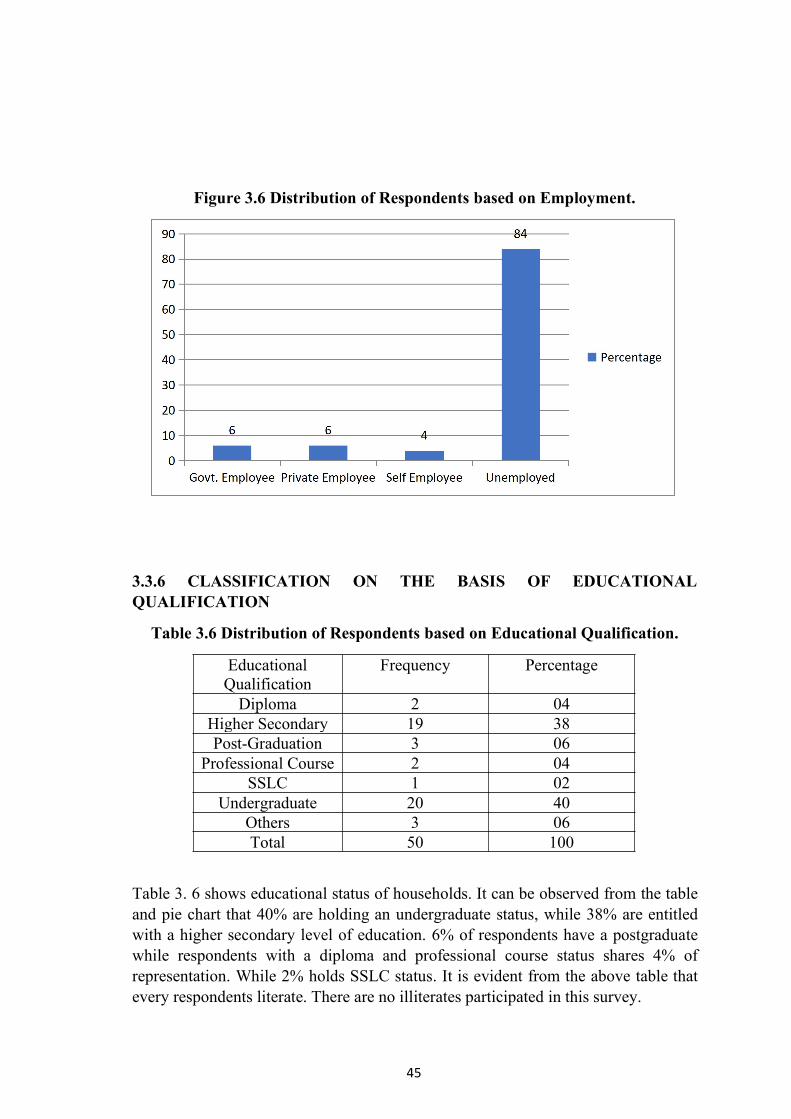
3.3.5 CLASSIFICATION ON THE BASIS OF EMPLOYMENT
Table 3.5 Distribution of Respondents based on Employment.
Occupation Frequency Percentage
Govt. Employee 3 06
Private Employee 3 06
Self-Employee 2 04
Unemployed 42 84
Total 50 100
From table 3.5, occupation wise classification of the respondents shows that, among50 respondents whose responses are being analysed, 84% of them are unemployed.6% of them are government employees while another 6% are private employees.There is a 2% representation of self-employed individuals. Only 16% of them areemployed with any type of jobs but the rest 84% are unemployed. This category ofindividuals includes housewives, students and other people who do not have anyjobs. The classification of individuals based on their occupation is given above.
45
Figure 3.6 Distribution of Respondents based on Employment.
3.3.6 CLASSIFICATION ON THE BASIS OF EDUCATIONALQUALIFICATION
Table 3.6 Distribution of Respondents based on Educational Qualification.
EducationalQualification
Frequency Percentage
Diploma 2 04Higher Secondary 19 38Post-Graduation 3 06
Professional Course 2 04SSLC 1 02
Undergraduate 20 40Others 3 06Total 50 100
Table 3. 6 shows educational status of households. It can be observed from the tableand pie chart that 40% are holding an undergraduate status, while 38% are entitledwith a higher secondary level of education. 6% of respondents have a postgraduatewhile respondents with a diploma and professional course status shares 4% ofrepresentation. While 2% holds SSLC status. It is evident from the above table thatevery respondents literate. There are no illiterates participated in this survey.

46
Figure 3.7 Distribution of Respondents based on Educational Qualification.
3.3.7 CLASSIFICATION ON THE BASIS OF THEIR USAGE IN ONLINESHOPPING
Table 3.7 Distribution of Respondents based on their usage in Online Shopping.
Particulars Frequency Percentage
Yes 44 88
No 6 12
Total 50 100
Table 3.7 shows the proportion of respondents based on their usage of onlineshopping. It is to check how much of the respondents have used online shoppingmethod as a shopping solution. And from the table it is evident that mostrespondents 88% of them have experienced online shopping while a small butsignificant 12% respondents haven`t done shopping through online.
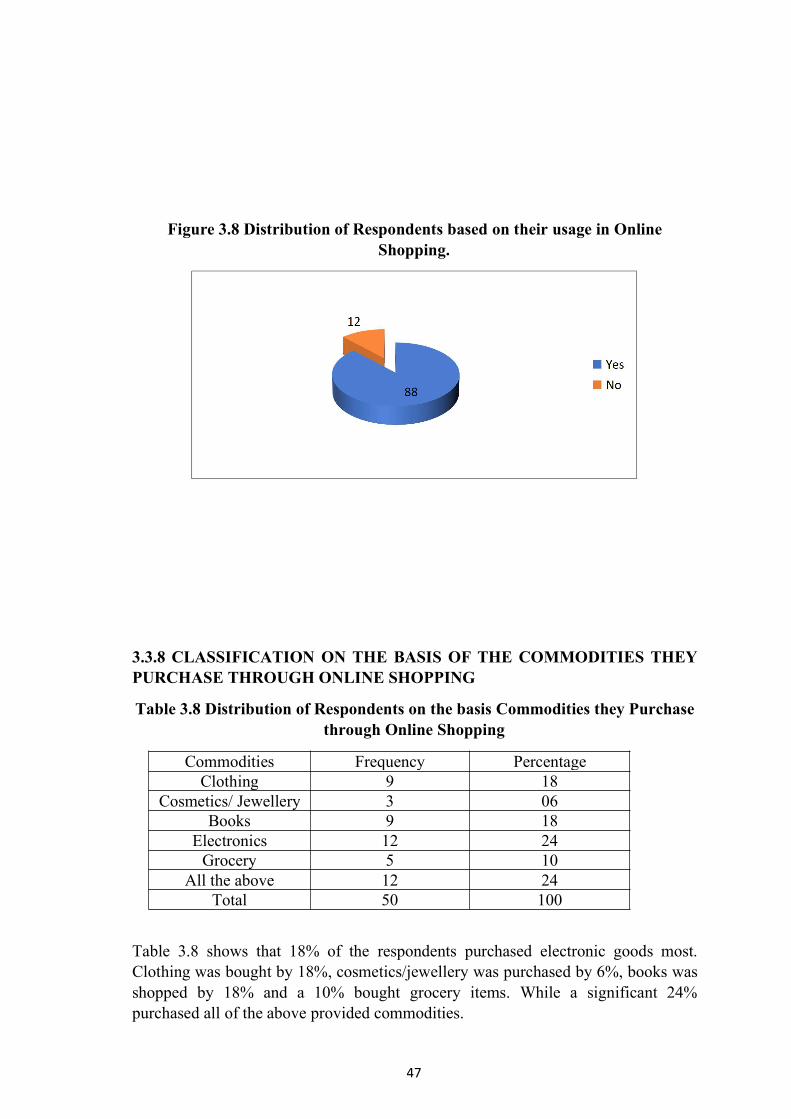
47
Figure 3.8 Distribution of Respondents based on their usage in OnlineShopping.
3.3.8 CLASSIFICATION ON THE BASIS OF THE COMMODITIES THEYPURCHASE THROUGH ONLINE SHOPPING
Table 3.8 Distribution of Respondents on the basis Commodities they Purchasethrough Online Shopping
Commodities Frequency PercentageClothing 9 18
Cosmetics/ Jewellery 3 06Books 9 18
Electronics 12 24Grocery 5 10
All the above 12 24Total 50 100
Table 3.8 shows that 18% of the respondents purchased electronic goods most.Clothing was bought by 18%, cosmetics/jewellery was purchased by 6%, books wasshopped by 18% and a 10% bought grocery items. While a significant 24%purchased all of the above provided commodities.
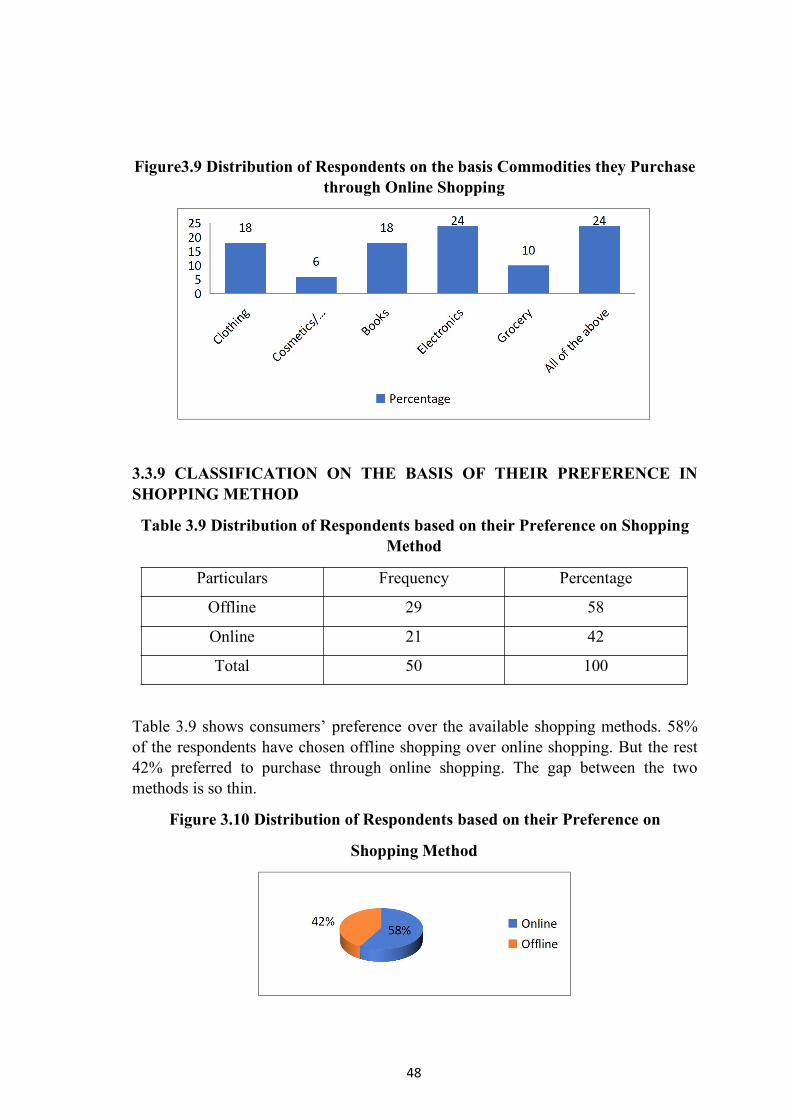
48
Figure3.9 Distribution of Respondents on the basis Commodities they Purchasethrough Online Shopping
3.3.9 CLASSIFICATION ON THE BASIS OF THEIR PREFERENCE INSHOPPING METHOD
Table 3.9 Distribution of Respondents based on their Preference on ShoppingMethod
Particulars Frequency Percentage
Offline 29 58
Online 21 42
Total 50 100
Table 3.9 shows consumers’ preference over the available shopping methods. 58%of the respondents have chosen offline shopping over online shopping. But the rest42% preferred to purchase through online shopping. The gap between the twomethods is so thin.
Figure 3.10 Distribution of Respondents based on their Preference on
Shopping Method

49
3.3.10 CLASSIFICATION ON THE BASIS OF SATISFACTION LEVEL OFONLINE SHOPPING
Table 3.10 Distribution of Respondents based on Satisfaction Level of OnlineShopping
Satisfaction level Frequency Percentage
Yes 30 60
No 20 40
Total 50 100
Table 3.10 shows how much satisfied they are with the usage of online shopping.We can see that 60% of the respondents were satisfied with the use of onlineshopping while the remaining 40% were not satisfied.
Figure 3.11 Distribution of Respondents based on Satisfaction Level of OnlineShopping

50
3.3.11 CLASSIFICATION ON THE BASIS OF PROBLEMS FACED
Table 3.11 Distribution of Respondents based on Problems Faced.
Problems faced Frequency PercentageCheap quality of
product16 32
Delay in delivery 3 6Product damage 7 14
Others 10 20All the above 3 6
No problem faced 11 22Total 50 100
From the table 3.11 we can derive that cheap quality of product is the majorproblem faced by 32% of respondents. While a 14% of respondents go with productdamage as the major problem. 6% of respondents identify delay in delivery as abigger issue while a 20% of respondents goes with other problems which are notdescribed here. 6% of the respondents feel that all the above problems are faced bythem. 22% of respondents admits that they haven`t faced any problems. Theclassifications of problem faced by the respondents are described in the graph below.
Figure 3.12 Distribution of Respondents based on Problems Faced.
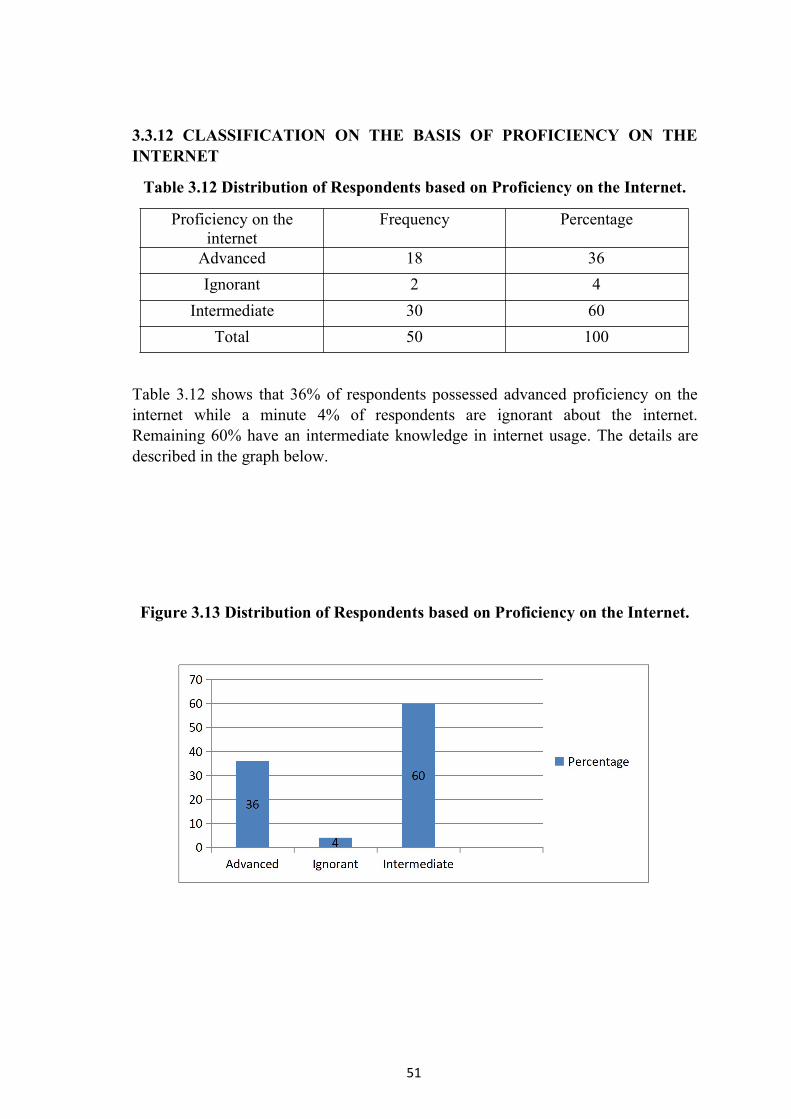
51
3.3.12 CLASSIFICATION ON THE BASIS OF PROFICIENCY ON THEINTERNET
Table 3.12 Distribution of Respondents based on Proficiency on the Internet.
Proficiency on theinternet
Frequency Percentage
Advanced 18 36
Ignorant 2 4
Intermediate 30 60
Total 50 100
Table 3.12 shows that 36% of respondents possessed advanced proficiency on theinternet while a minute 4% of respondents are ignorant about the internet.Remaining 60% have an intermediate knowledge in internet usage. The details aredescribed in the graph below.
Figure 3.13 Distribution of Respondents based on Proficiency on the Internet.
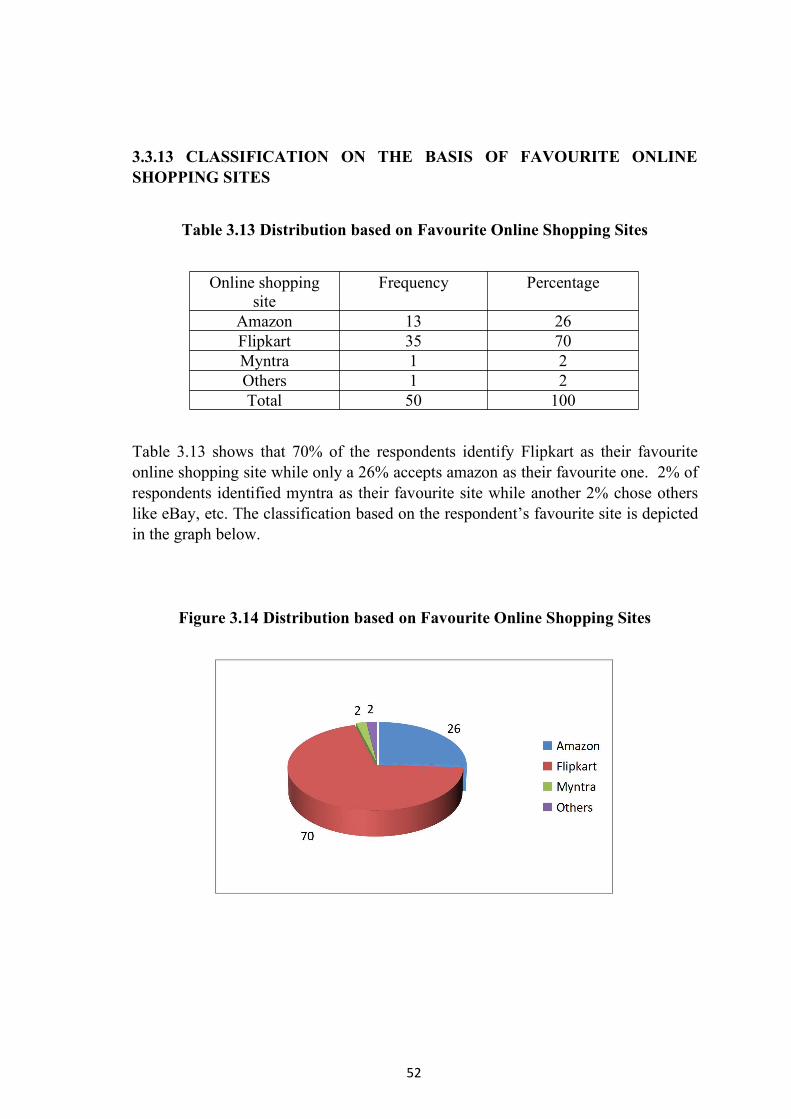
52
3.3.13 CLASSIFICATION ON THE BASIS OF FAVOURITE ONLINESHOPPING SITES
Table 3.13 Distribution based on Favourite Online Shopping Sites
Online shoppingsite
Frequency Percentage
Amazon 13 26Flipkart 35 70Myntra 1 2Others 1 2Total 50 100
Table 3.13 shows that 70% of the respondents identify Flipkart as their favouriteonline shopping site while only a 26% accepts amazon as their favourite one. 2% ofrespondents identified myntra as their favourite site while another 2% chose otherslike eBay, etc. The classification based on the respondent’s favourite site is depictedin the graph below.
Figure 3.14 Distribution based on Favourite Online Shopping Sites

53
3.3.14 CLASSIFICATION ON THE BASIS OF AMOUNT OF SPENDING
Table 3.14 Distribution of Respondents based on Amount of Spending.
Amount of spending Frequency PercentageBelow 5000 33 665000-15000 9 1815000-25000 5 10Above 25000 3 6
Total 50 100Table 3.14 shows that 66% of the respondents spend an amount below 5000 Rs.While a 18% spend amount ranging between 5000-15000 Rs. Another 10%purchased for a value between 15000-25000 Rs. And 6% of the respondents spendamount greater than 25000.
Figure 3.15 Distribution of Respondents based on Amount of Spending.
3.3.15 CLASSIFICATION ON THE BASIS OF CRITERIA FOCUSSEDDURING ONLINE SHOPPING
Table 3.15 Distribution based on Criteria Focussed During Online Shopping
Criteria focussed duringonline shopping
Frequency Percentage
Any brand 1 2Price of the product 9 18Quality of the product 11 22Ratings and customer
reviews6 12
All the above 23 46Total 50 100
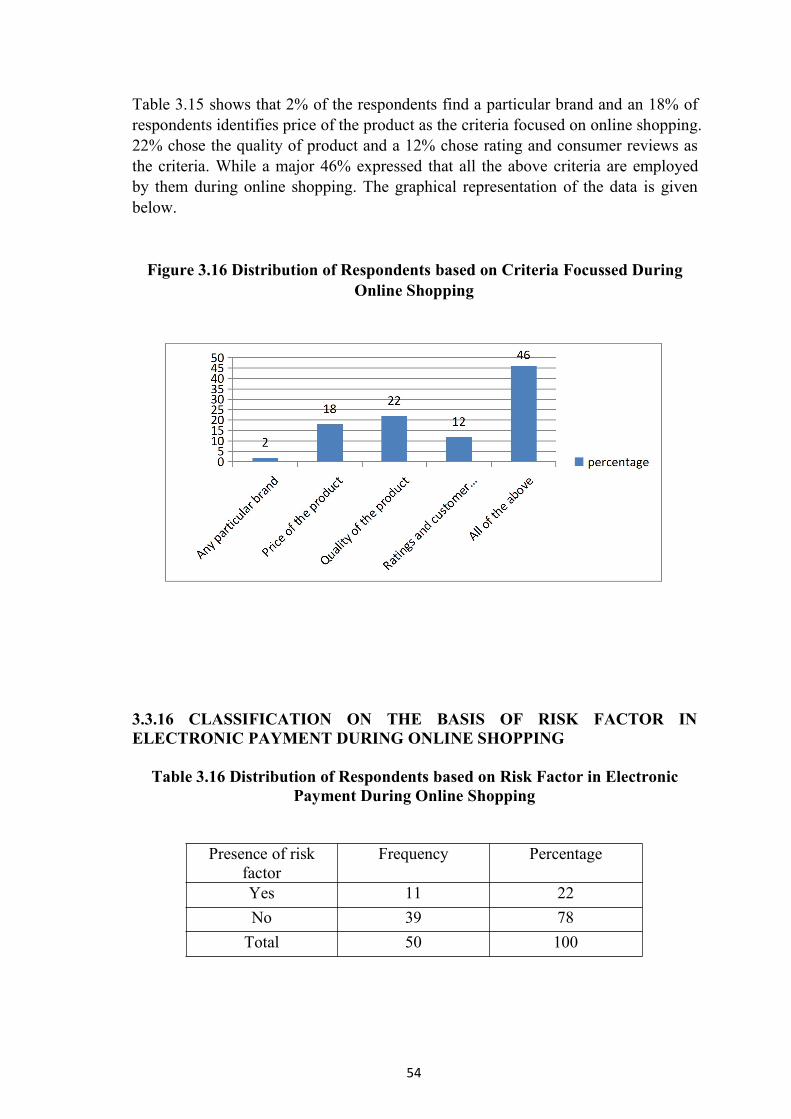
54
Table 3.15 shows that 2% of the respondents find a particular brand and an 18% ofrespondents identifies price of the product as the criteria focused on online shopping.22% chose the quality of product and a 12% chose rating and consumer reviews asthe criteria. While a major 46% expressed that all the above criteria are employedby them during online shopping. The graphical representation of the data is givenbelow.
Figure 3.16 Distribution of Respondents based on Criteria Focussed DuringOnline Shopping
3.3.16 CLASSIFICATION ON THE BASIS OF RISK FACTOR INELECTRONIC PAYMENT DURING ONLINE SHOPPING
Table 3.16 Distribution of Respondents based on Risk Factor in ElectronicPayment During Online Shopping
Presence of riskfactor
Frequency Percentage
Yes 11 22
No 39 78
Total 50 100

55
Table 3.16 tells us that 78% respondents ascertain that there is no risk factor inelectronic payment during online shopping. While a 22% finds a risk factor in theelectronic payments.
Figure 3.17 Distribution of Respondents based on Risk Factor in ElectronicPayment During Online Shopping
3.3.17 CLASSIFICATION ON THE BASIS OF TYPE OF PAYMENTPREFERRED
Table 3.17 Distribution of Respondents based on Type of Payment Preferred
Table 3.17 shows that 72% of the respondents rely on cash on delivery as thepayment option. While 14% chose UPI transactions. An 8% of the respondents usestheir respective commercial bank`s net banking and on the other side a minute 4%utilises their credit/debit cards for conducting transactions. And a 2% uses walletsfor payment activities. The classification of the respondents based on their preferredpayment options are given below.
Type of Payment Frequency PercentageATM debit/credit card 2 4
Cash on delivery 36 72Net Banking 4 8
UPI 7 14Wallets 1 2Total 50 100

56
Figure 3.18 Distribution of Respondents based on Type of Payment Preferred
3.3.18 CLASSIFICATION ON THE BASIS OF FEATURES NECESSARYFOR AN ONLINE SHOPING SITE
Table 3.18 Distribution of Respondents on the Basis of Features Necessary foran Online Shopping Site
Features Frequency Percentage
Credibility 3 6Customer friendly 8 16
Design 3 6Multiple payment gateway 2 4Privacy and secure checkout 4 8
All the above 30 60Total 50 100
Table 3.18 shows that 6% of respondents identify credibility as the major featurenecessary for an online shopping site. While another 6% goes along with the featureof design. 16% respondents feel that an online shopping site should be customerfriendly while a 4% suggests it should include multiple payment gateways. An 8%strongly feels for the privacy and security as the major feature. While 60% of therespondents maintains a view that all the above features are essential for an onlineshopping site. The prescribed classification is depicted in the graph below.
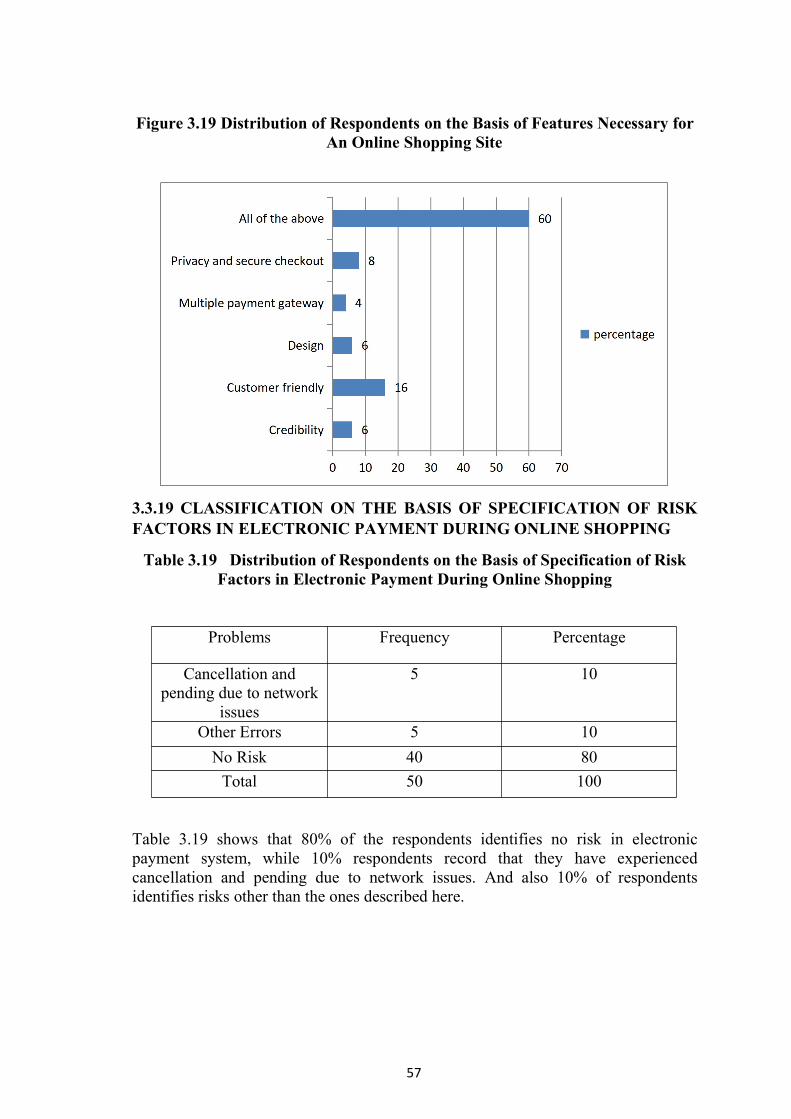
57
Figure 3.19 Distribution of Respondents on the Basis of Features Necessary forAn Online Shopping Site
3.3.19 CLASSIFICATION ON THE BASIS OF SPECIFICATION OF RISKFACTORS IN ELECTRONIC PAYMENT DURING ONLINE SHOPPING
Table 3.19 Distribution of Respondents on the Basis of Specification of RiskFactors in Electronic Payment During Online Shopping
Problems Frequency Percentage
Cancellation andpending due to network
issues
5 10
Other Errors 5 10
No Risk 40 80
Total 50 100
Table 3.19 shows that 80% of the respondents identifies no risk in electronicpayment system, while 10% respondents record that they have experiencedcancellation and pending due to network issues. And also 10% of respondentsidentifies risks other than the ones described here.
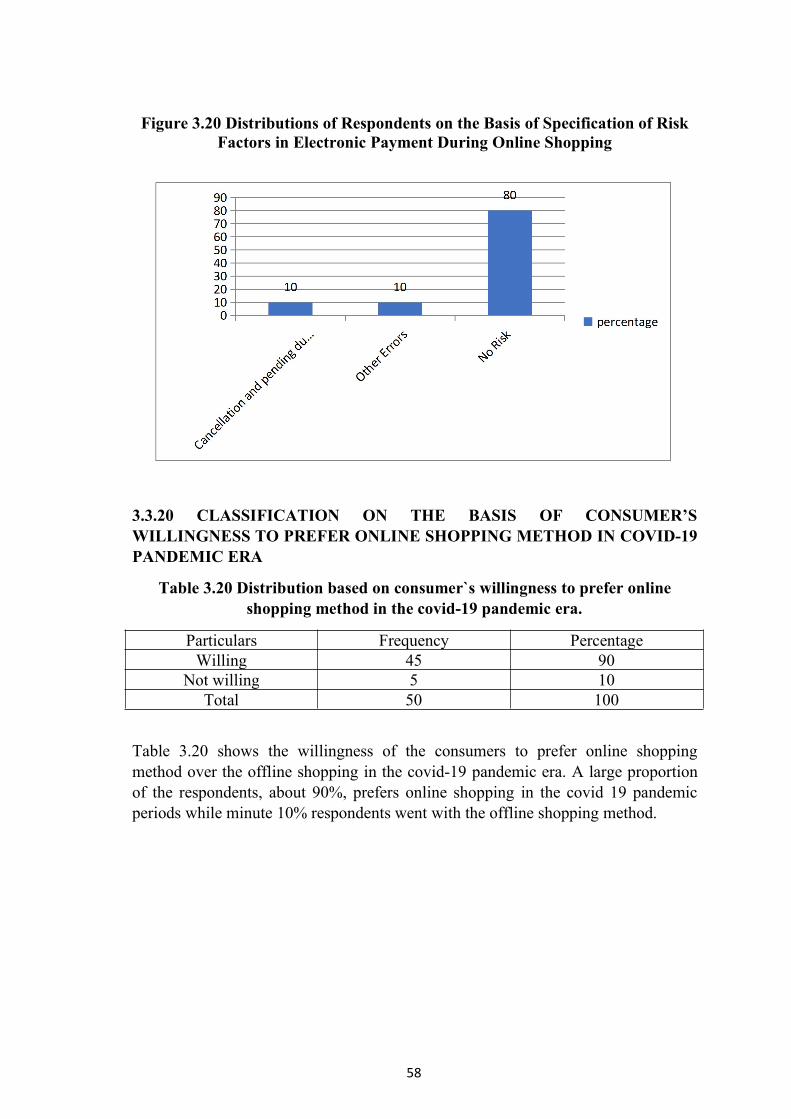
58
Figure 3.20 Distributions of Respondents on the Basis of Specification of RiskFactors in Electronic Payment During Online Shopping
3.3.20 CLASSIFICATION ON THE BASIS OF CONSUMER’SWILLINGNESS TO PREFER ONLINE SHOPPING METHOD IN COVID-19PANDEMIC ERA
Table 3.20 Distribution based on consumer`s willingness to prefer onlineshopping method in the covid-19 pandemic era.
Particulars Frequency PercentageWilling 45 90
Not willing 5 10Total 50 100
Table 3.20 shows the willingness of the consumers to prefer online shoppingmethod over the offline shopping in the covid-19 pandemic era. A large proportionof the respondents, about 90%, prefers online shopping in the covid 19 pandemicperiods while minute 10% respondents went with the offline shopping method.
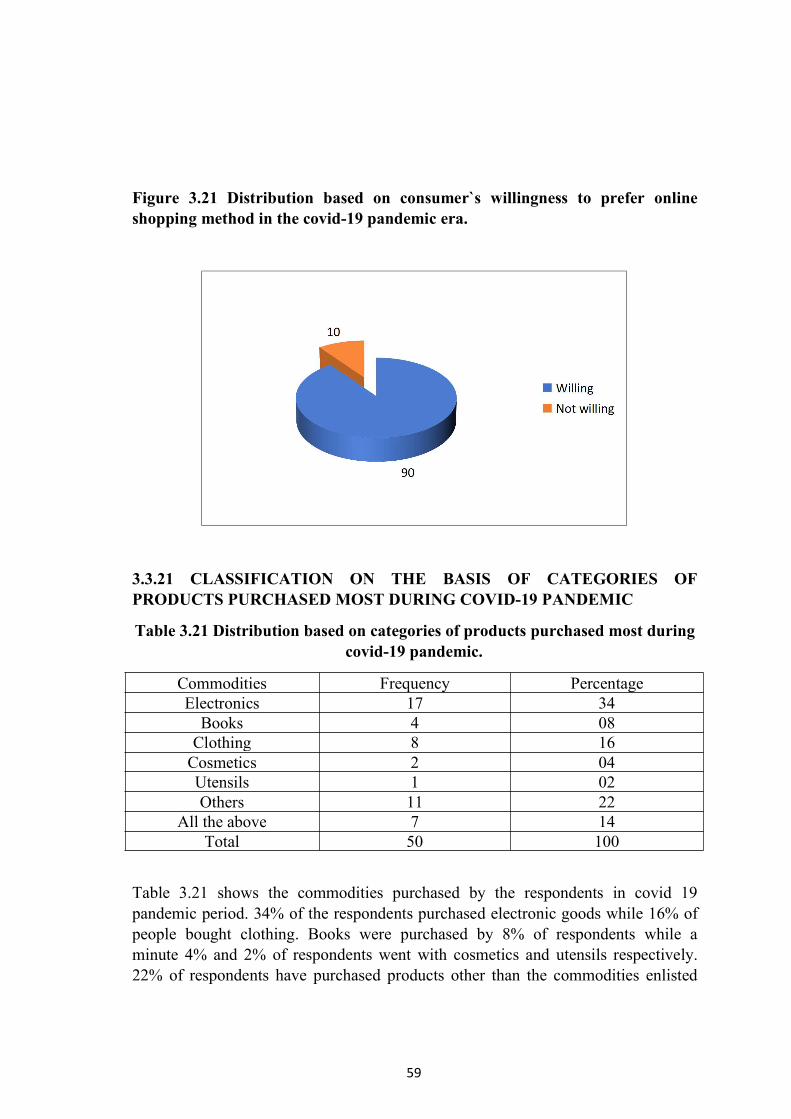
59
Figure 3.21 Distribution based on consumer`s willingness to prefer onlineshopping method in the covid-19 pandemic era.
3.3.21 CLASSIFICATION ON THE BASIS OF CATEGORIES OFPRODUCTS PURCHASED MOST DURING COVID-19 PANDEMIC
Table 3.21 Distribution based on categories of products purchased most duringcovid-19 pandemic.
Commodities Frequency PercentageElectronics 17 34Books 4 08Clothing 8 16Cosmetics 2 04Utensils 1 02Others 11 22
All the above 7 14Total 50 100
Table 3.21 shows the commodities purchased by the respondents in covid 19pandemic period. 34% of the respondents purchased electronic goods while 16% ofpeople bought clothing. Books were purchased by 8% of respondents while aminute 4% and 2% of respondents went with cosmetics and utensils respectively.22% of respondents have purchased products other than the commodities enlisted
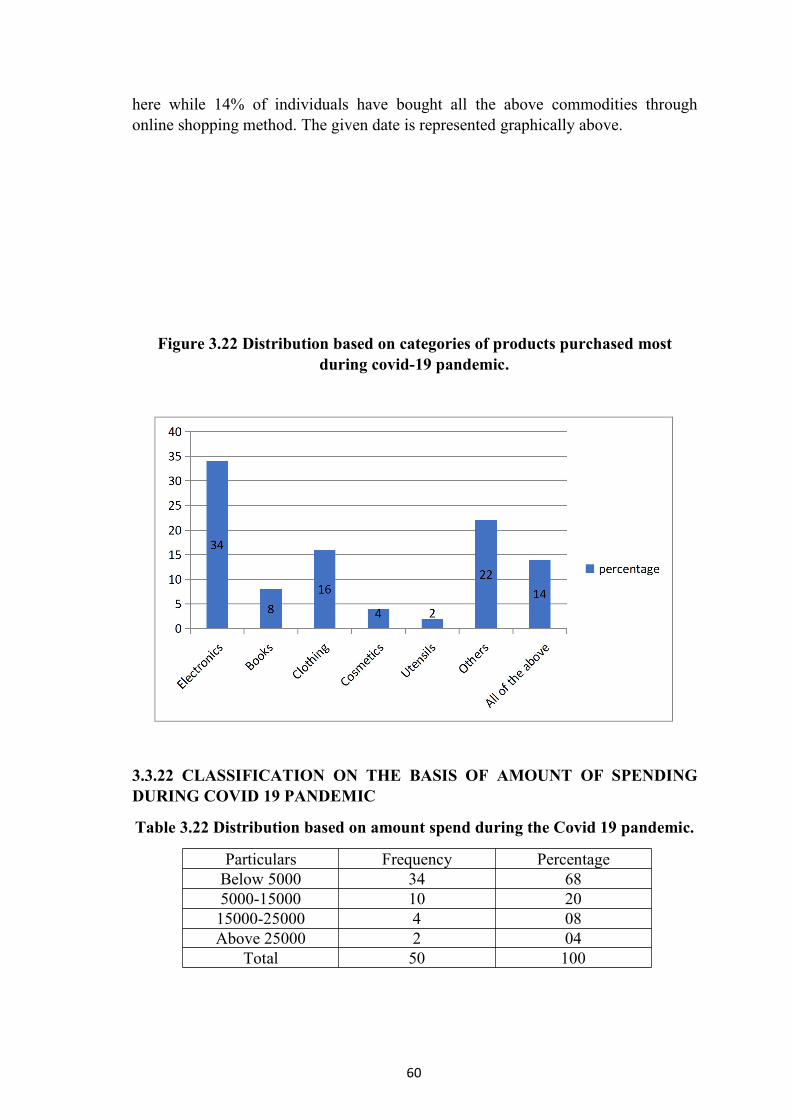
60
here while 14% of individuals have bought all the above commodities throughonline shopping method. The given date is represented graphically above.
Figure 3.22 Distribution based on categories of products purchased mostduring covid-19 pandemic.
3.3.22 CLASSIFICATION ON THE BASIS OF AMOUNT OF SPENDINGDURING COVID 19 PANDEMIC
Table 3.22 Distribution based on amount spend during the Covid 19 pandemic.
Particulars Frequency PercentageBelow 5000 34 685000-15000 10 2015000-25000 4 08Above 25000 2 04
Total 50 100
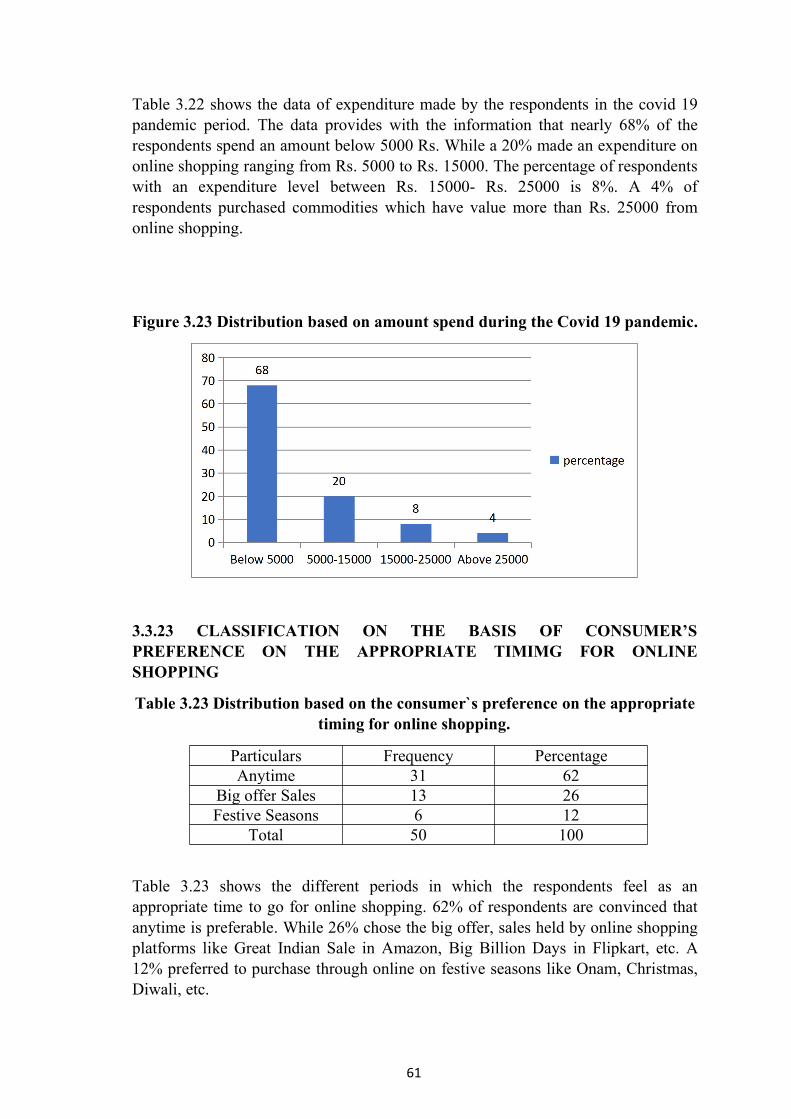
61
Table 3.22 shows the data of expenditure made by the respondents in the covid 19pandemic period. The data provides with the information that nearly 68% of therespondents spend an amount below 5000 Rs. While a 20% made an expenditure ononline shopping ranging from Rs. 5000 to Rs. 15000. The percentage of respondentswith an expenditure level between Rs. 15000- Rs. 25000 is 8%. A 4% ofrespondents purchased commodities which have value more than Rs. 25000 fromonline shopping.
Figure 3.23 Distribution based on amount spend during the Covid 19 pandemic.
3.3.23 CLASSIFICATION ON THE BASIS OF CONSUMER’SPREFERENCE ON THE APPROPRIATE TIMIMG FOR ONLINESHOPPING
Table 3.23 Distribution based on the consumer`s preference on the appropriatetiming for online shopping.
Particulars Frequency PercentageAnytime 31 62
Big offer Sales 13 26Festive Seasons 6 12
Total 50 100
Table 3.23 shows the different periods in which the respondents feel as anappropriate time to go for online shopping. 62% of respondents are convinced thatanytime is preferable. While 26% chose the big offer, sales held by online shoppingplatforms like Great Indian Sale in Amazon, Big Billion Days in Flipkart, etc. A12% preferred to purchase through online on festive seasons like Onam, Christmas,Diwali, etc.
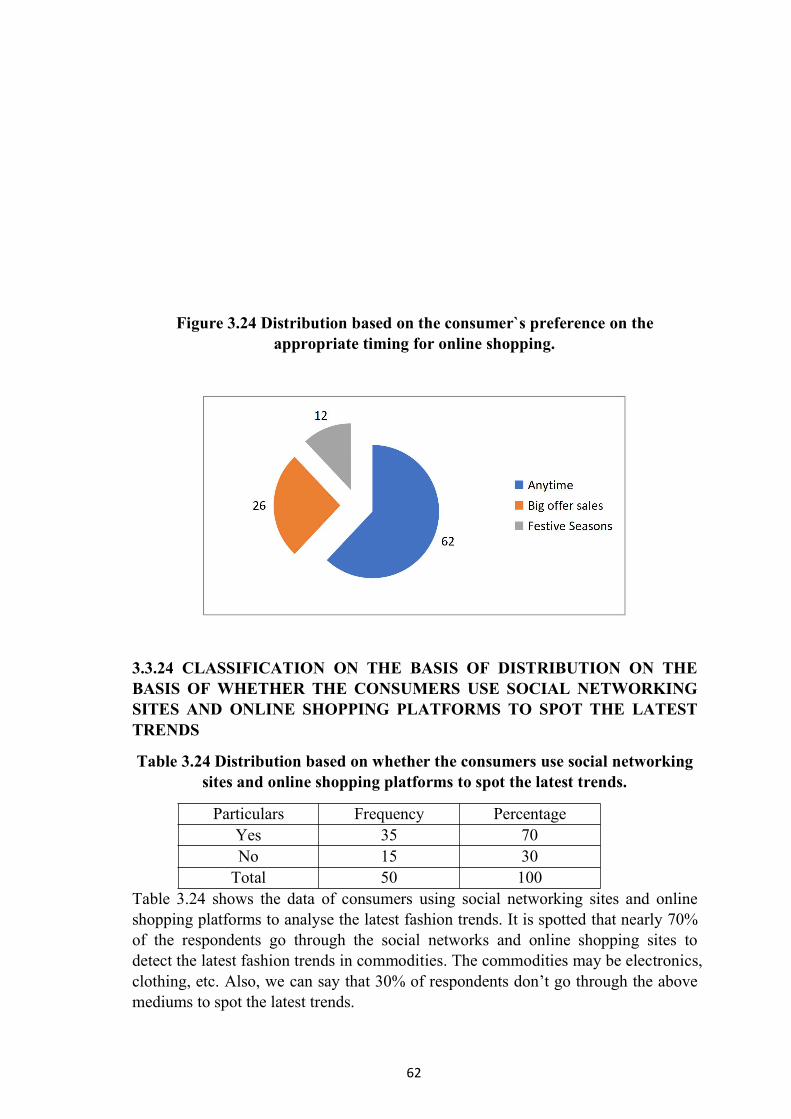
62
Figure 3.24 Distribution based on the consumer`s preference on theappropriate timing for online shopping.
3.3.24 CLASSIFICATION ON THE BASIS OF DISTRIBUTION ON THEBASIS OF WHETHER THE CONSUMERS USE SOCIAL NETWORKINGSITES AND ONLINE SHOPPING PLATFORMS TO SPOT THE LATESTTRENDS
Table 3.24 Distribution based on whether the consumers use social networkingsites and online shopping platforms to spot the latest trends.
Particulars Frequency PercentageYes 35 70No 15 30Total 50 100
Table 3.24 shows the data of consumers using social networking sites and onlineshopping platforms to analyse the latest fashion trends. It is spotted that nearly 70%of the respondents go through the social networks and online shopping sites todetect the latest fashion trends in commodities. The commodities may be electronics,clothing, etc. Also, we can say that 30% of respondents don’t go through the abovemediums to spot the latest trends.
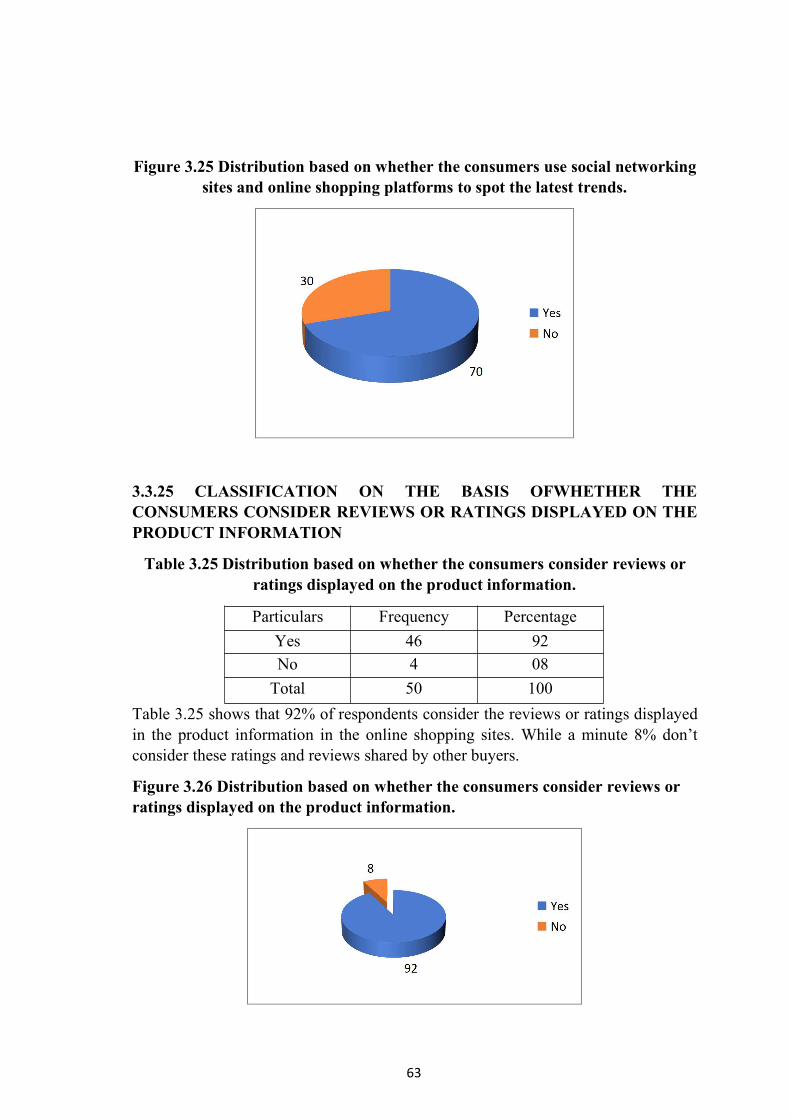
63
Figure 3.25 Distribution based on whether the consumers use social networkingsites and online shopping platforms to spot the latest trends.
3.3.25 CLASSIFICATION ON THE BASIS OFWHETHER THECONSUMERS CONSIDER REVIEWS OR RATINGS DISPLAYED ON THEPRODUCT INFORMATION
Table 3.25 Distribution based on whether the consumers consider reviews orratings displayed on the product information.
Particulars Frequency Percentage
Yes 46 92
No 4 08
Total 50 100
Table 3.25 shows that 92% of respondents consider the reviews or ratings displayedin the product information in the online shopping sites. While a minute 8% don’tconsider these ratings and reviews shared by other buyers.
Figure 3.26 Distribution based on whether the consumers consider reviews orratings displayed on the product information.
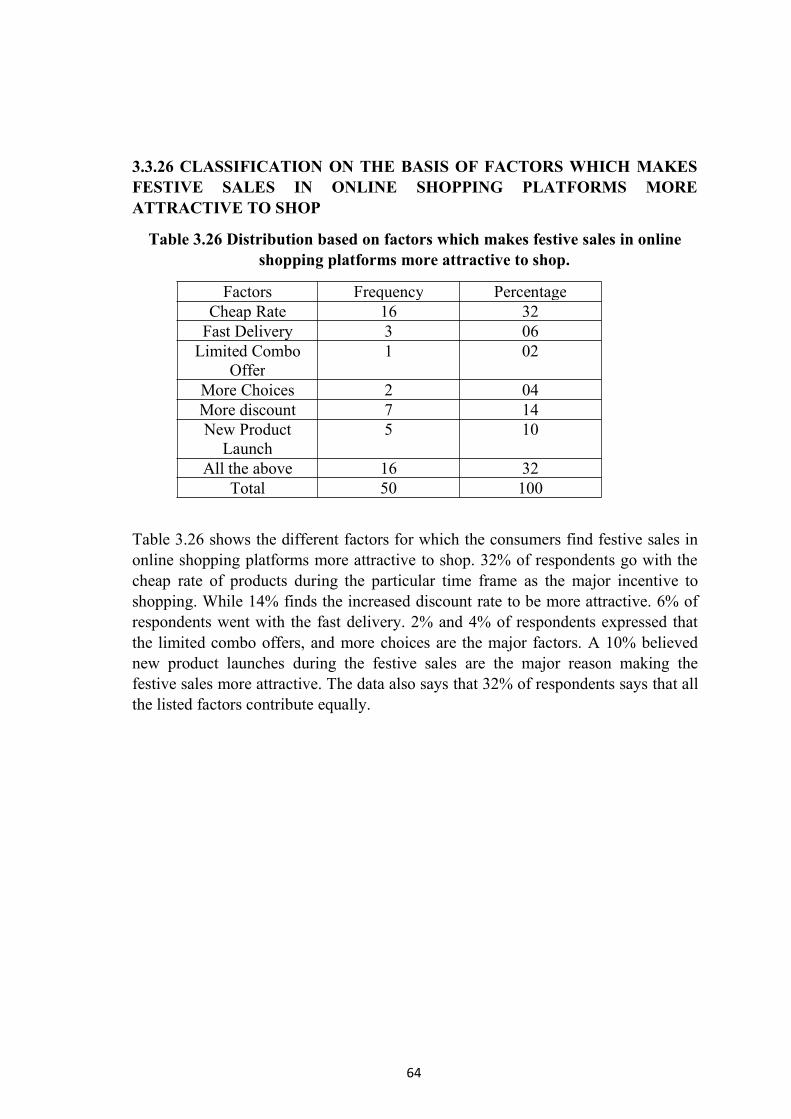
64
3.3.26 CLASSIFICATION ON THE BASIS OF FACTORS WHICH MAKESFESTIVE SALES IN ONLINE SHOPPING PLATFORMS MOREATTRACTIVE TO SHOP
Table 3.26 Distribution based on factors which makes festive sales in onlineshopping platforms more attractive to shop.
Factors Frequency PercentageCheap Rate 16 32Fast Delivery 3 06Limited Combo
Offer1 02
More Choices 2 04More discount 7 14New Product
Launch5 10
All the above 16 32Total 50 100
Table 3.26 shows the different factors for which the consumers find festive sales inonline shopping platforms more attractive to shop. 32% of respondents go with thecheap rate of products during the particular time frame as the major incentive toshopping. While 14% finds the increased discount rate to be more attractive. 6% ofrespondents went with the fast delivery. 2% and 4% of respondents expressed thatthe limited combo offers, and more choices are the major factors. A 10% believednew product launches during the festive sales are the major reason making thefestive sales more attractive. The data also says that 32% of respondents says that allthe listed factors contribute equally.
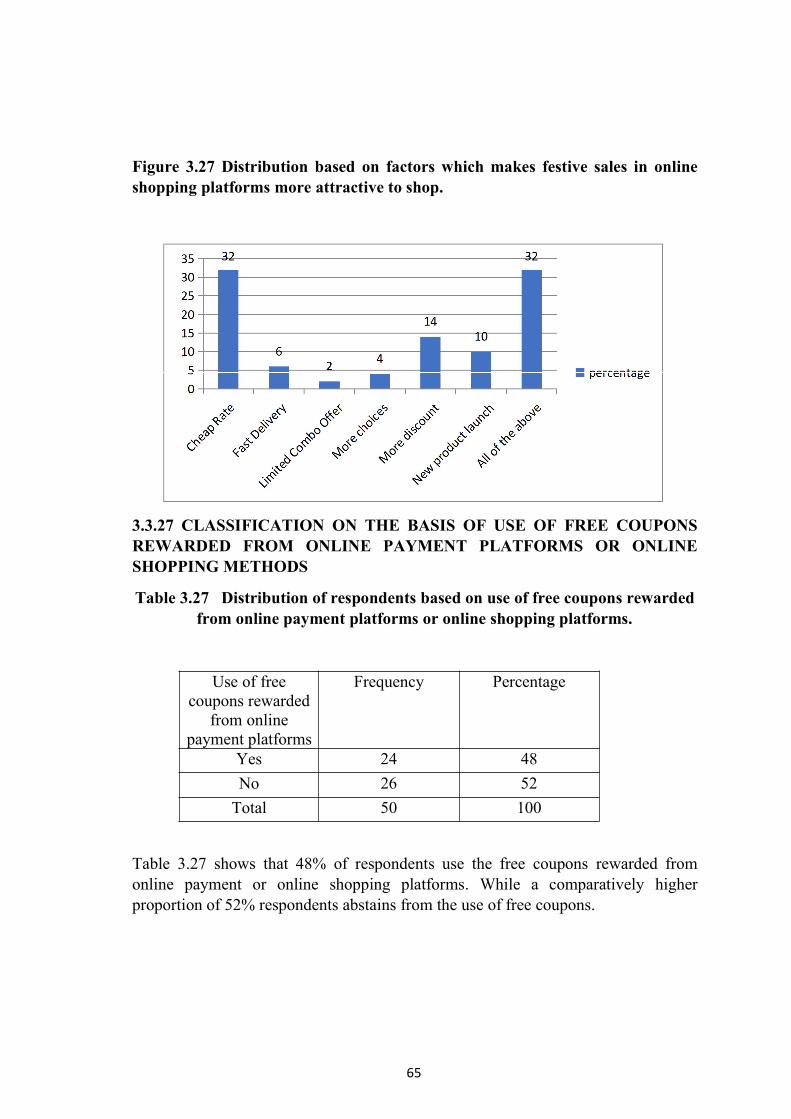
65
Figure 3.27 Distribution based on factors which makes festive sales in onlineshopping platforms more attractive to shop.
3.3.27 CLASSIFICATION ON THE BASIS OF USE OF FREE COUPONSREWARDED FROM ONLINE PAYMENT PLATFORMS OR ONLINESHOPPING METHODS
Table 3.27 Distribution of respondents based on use of free coupons rewardedfrom online payment platforms or online shopping platforms.
Use of freecoupons rewarded
from onlinepayment platforms
Frequency Percentage
Yes 24 48
No 26 52
Total 50 100
Table 3.27 shows that 48% of respondents use the free coupons rewarded fromonline payment or online shopping platforms. While a comparatively higherproportion of 52% respondents abstains from the use of free coupons.

66
Figure 3.28 Distribution of respondents based on use of free coupons rewardedfrom online payment platforms or online shopping platforms.
3.3.28 CLASSIFICATION ON THE BASIS OF UNDERSTANDING OFINFLUENCE OF ADVERTISEMENTS IN SOCIAL MEDIA PLATFORMS
Table 3.28 Distribution of respondents based on understanding of influence ofadvertisements in social media platforms.
Advertisements insocial mediainfluencing
purchasing habits
Frequency Percentage
Yes 34 68No 16 32Total 50 100
Table 3.28 shows that 68% of the respondents identifies themselves that theadvertisements in social media are influencing their purchasing habits. While theremaining 32% are not at all influenced by the advertisements, they come across insocial media platforms.
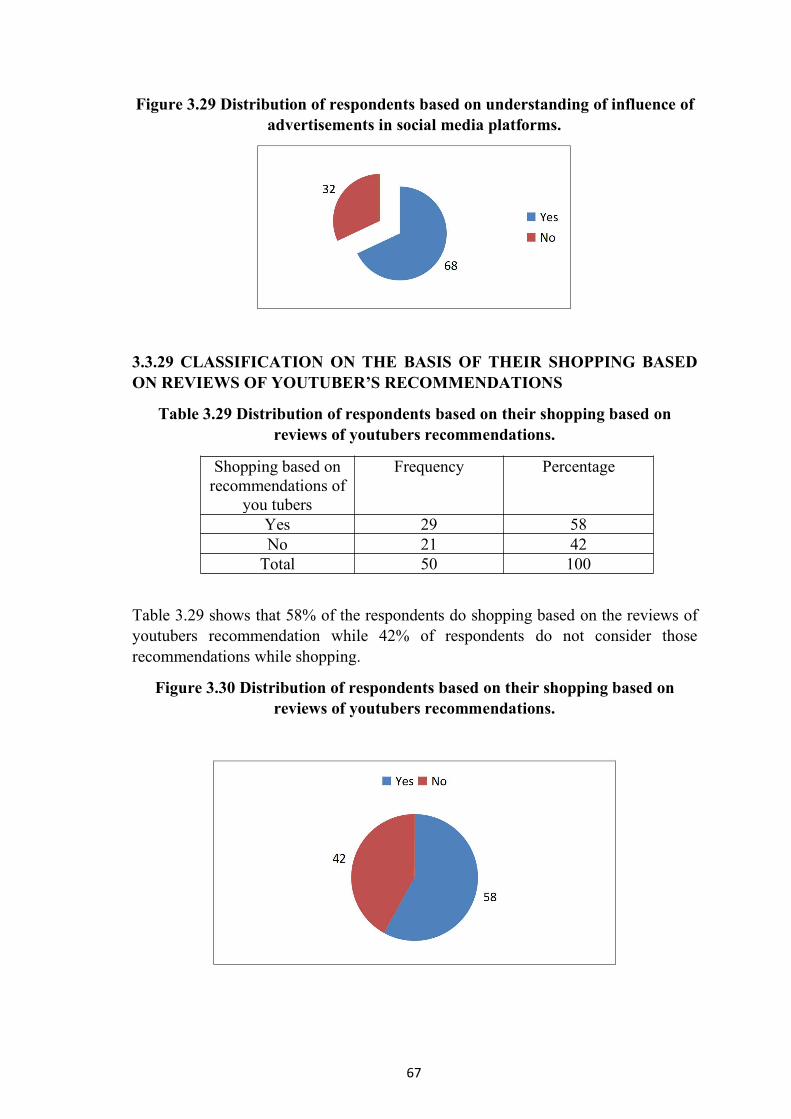
67
Figure 3.29 Distribution of respondents based on understanding of influence ofadvertisements in social media platforms.
3.3.29 CLASSIFICATION ON THE BASIS OF THEIR SHOPPING BASEDON REVIEWS OF YOUTUBER’S RECOMMENDATIONS
Table 3.29 Distribution of respondents based on their shopping based onreviews of youtubers recommendations.
Shopping based onrecommendations of
you tubers
Frequency Percentage
Yes 29 58No 21 42Total 50 100
Table 3.29 shows that 58% of the respondents do shopping based on the reviews ofyoutubers recommendation while 42% of respondents do not consider thoserecommendations while shopping.
Figure 3.30 Distribution of respondents based on their shopping based onreviews of youtubers recommendations.

68
3.3.30 CLASSIFICATION ON THE BASIS OF UNDERSTANDING THATCERTAIN PRODUCTS ARE CHEAPER IN CERTAIN ONLINE SHOPPINGPLATFORMS
Table 3.30 Distribution of respondents based on understanding that certainproducts are cheaper in certain online shopping platforms.
Noticing that certainproducts are
cheaper in certainonline shopping
platforms
Frequency Percentage
Yes 39 78
No 11 22Total 50 100
Table 3.30 shows the classification of the respondents based on their awareness ofprice discriminations in different online shopping sites. 78% of the people noticesthat certain products are cheaper in certain online shopping platforms compared toother shopping platforms. While a 22% of respondents didn’t seemed to havenoticed it.
Figure 3.31 Distribution of respondents based on understanding that certainproducts are cheaper in certain online shopping platforms
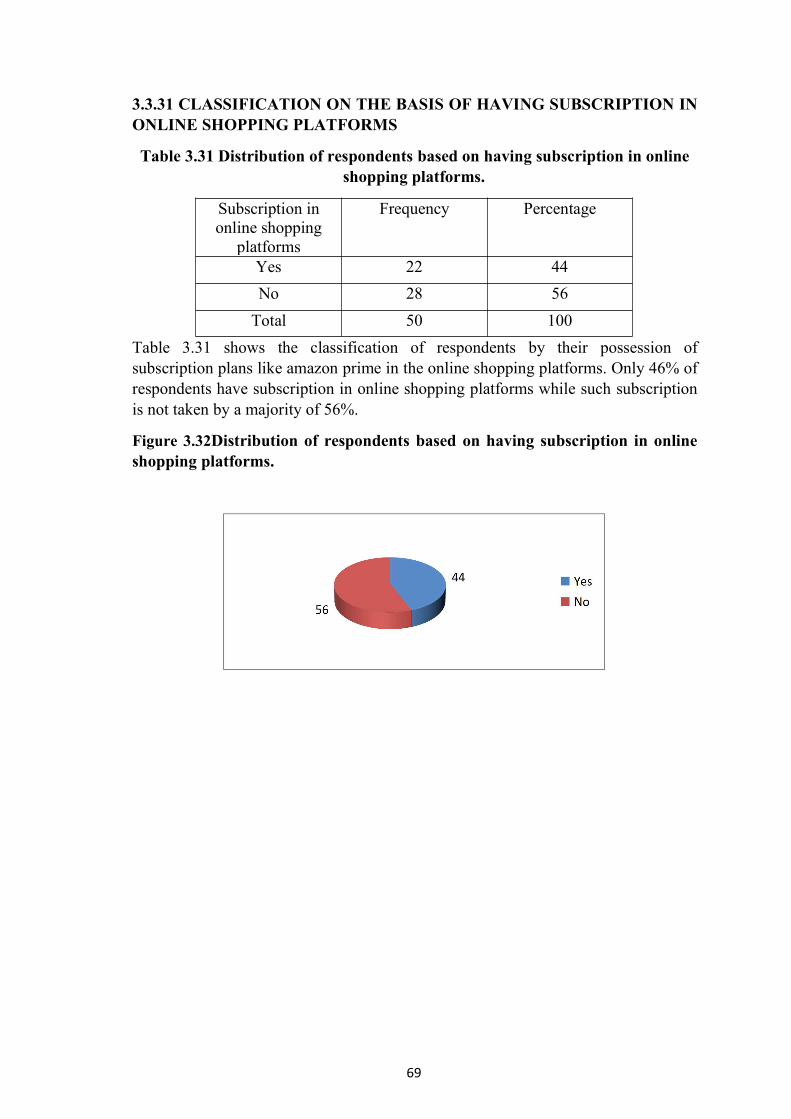
69
3.3.31 CLASSIFICATION ON THE BASIS OF HAVING SUBSCRIPTION INONLINE SHOPPING PLATFORMS
Table 3.31 Distribution of respondents based on having subscription in onlineshopping platforms.
Subscription inonline shopping
platforms
Frequency Percentage
Yes 22 44
No 28 56
Total 50 100
Table 3.31 shows the classification of respondents by their possession ofsubscription plans like amazon prime in the online shopping platforms. Only 46% ofrespondents have subscription in online shopping platforms while such subscriptionis not taken by a majority of 56%.
Figure 3.32Distribution of respondents based on having subscription in onlineshopping platforms.
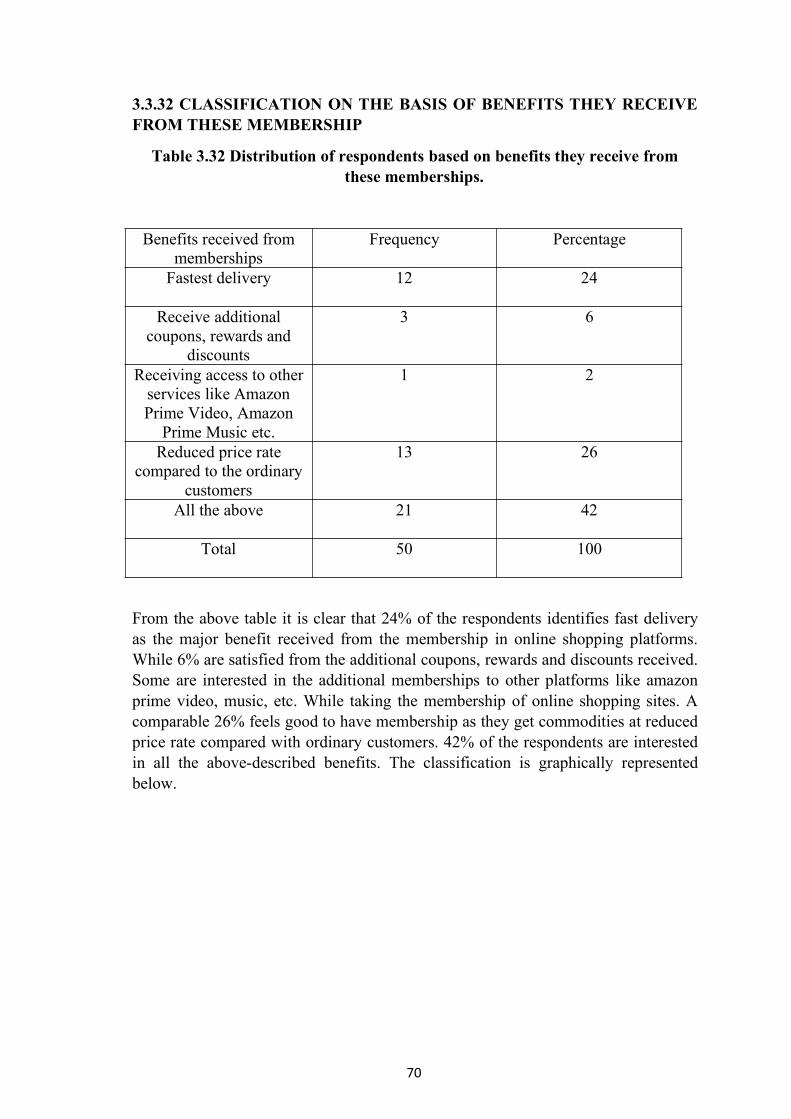
70
3.3.32 CLASSIFICATION ON THE BASIS OF BENEFITS THEY RECEIVEFROM THESE MEMBERSHIP
Table 3.32 Distribution of respondents based on benefits they receive fromthese memberships.
Benefits received frommemberships
Frequency Percentage
Fastest delivery 12 24
Receive additionalcoupons, rewards and
discounts
3 6
Receiving access to otherservices like AmazonPrime Video, Amazon
Prime Music etc.
1 2
Reduced price ratecompared to the ordinary
customers
13 26
All the above 21 42
Total 50 100
From the above table it is clear that 24% of the respondents identifies fast deliveryas the major benefit received from the membership in online shopping platforms.While 6% are satisfied from the additional coupons, rewards and discounts received.Some are interested in the additional memberships to other platforms like amazonprime video, music, etc. While taking the membership of online shopping sites. Acomparable 26% feels good to have membership as they get commodities at reducedprice rate compared with ordinary customers. 42% of the respondents are interestedin all the above-described benefits. The classification is graphically representedbelow.
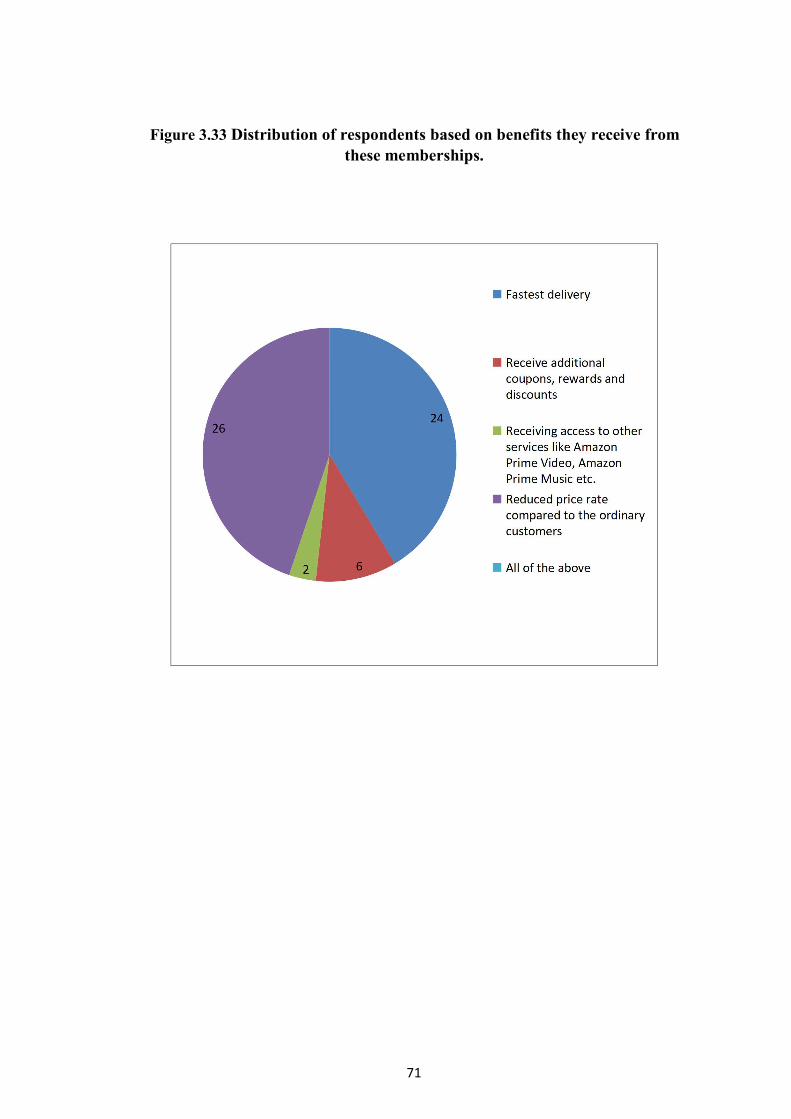
71
Figure 3.33 Distribution of respondents based on benefits they receive fromthese memberships.
72
CHAPTER 4FINDINGS, SUGGESTIONS AND CONCLUSION
73
4.1 INTRODUCTION
Shopping is an integral part of humans in the social life. In the recent era shoppingmethod has been shifting more towards to the online method substituting the offlineshopping method. The consumer behaviour towards online shopping is revealing apositive trend and their confidence on online shopping is increasing. The onlinemethod of shopping is highly convenient form of shopping, it is a time and energysaving shopping experience, the price of the products are relatively lesser comparedto the retail stores. These makes the consumers more attached to the online shoppingBut along with these advantages there are certain disadvantages which discomfortsthe consumes like delay in delivery, delivery of bad products and other relatedproblems. There are so many imperatives and impediments in the consumerbehaviour towards online shopping.
The present study “Consumer behaviour towards online shopping – a study based onThrissur district” provides an insight into the consumer behaviour towards onlineshopping among the consumers in Thrissur corporation area of Thrissur district. 50households were randomly selected for conducting the survey. Sample survey hasbeen conducted based on the prepared schedule of questions which cover variousaspects consumer behaviour towards online shopping. The survey is conductedthrough google forms. The objectives of the study were to study the factors affectingthe consumer behaviour in online shopping and its rate of influence, to figure outthe impact of covid 19 in the consumer behaviour towards online shopping, to studythe role of marketing tricks in boosting online shopping.
The study is divided into 4 chapters. First chapter deals with introduction,significance of the study, statement of the problem, objectives of the study, reviewof literature, methodology, scheme and limitations of the study. The second chapterprovides an overview of consumer behaviour towards online shopping. Thirdchapter gives the analysis of the sample survey. Findings and conclusion are dealt inthe fourth chapter.
4.2 FINDINGS
The study aimed to know the consumers behaviour towards online shopping withreference to Thrissur district. Following are the major findings of the study.
● 88% of the respondents have used online shopping.
● 58% of the respondents preferred online shopping over offline shopping.
● 60% of the respondents are satisfied with the usage of online shopping.

74
● There are certain problems faced by the consumers. Among them cheap quality ofthe product is the major one. 32% of respondents faced it. 6% of consumers alsofaces issues like delay in delivery and 14% faced product damage.
● 60% of the respondents have an intermediate knowledge in internet usage.
● Even though Amazon stands as the world’s best online shopping site, 705 of theusers identifies Flipkart as their favourite one.
● 60% of the respondents consider all the mentioned criteria such as credibility,customer friendly, design, multiple payment gateway, privacy and secure checkoutas features necessary for an online shopping site.
● 78% of the respondents ascertain that there is no risk factor in electronic paymentduring online shopping.
● 78% of the respondents are satisfied with current online payment methods but72% of them prefer cash on delivery as their payment method.
●46% of the respondents expressed that all the criteria mentioned ( any brand, priceof the product, quality of the product, ratings and customer reviews) are focussedduring online shopping.
● During covid-19 pandemic era, 90% of the respondents preferred online shoppingover offline shopping.
● Electronics was the top purchased commodity during the covid-19 pandemic. Itwas purchased by 34% of the respondents.
● 68% of the respondents spent an amount less than Rs 5000 for online shoppingduring covid-19 pandemic.
● 62% of the consumers do not have any appropriate time for online shopping. Theydo not wait for discount sales and purchases at any time. 38% consider festive salesand offer periods as an appropriate time to shop online.
● 70% of the respondents use social networking sites and online shopping platformsto spot the latest trend.
● 92% of the consumers relies hugely on product reviews or rating displayed onproduct information in online shopping sites to formulate buying decisions.
● Respondents are almost neutral in the use of free coupons rewarded from onlineshopping/payment platforms. While 52% of the respondents abstain from their use,48% make use of them.
● 68% of the consumers are aware that their buying decisions are influenced byadvertisements.
75
● 78% of the respondents are aware that certain products are cheaper in certainonline shopping platforms.
● 56% of the respondents do not have subscription in online shopping platformswhile 44% have it.
● 42% of the respondents are interested in all kinds of benefits from thosesubscription such as fastest delivery, receiving additional coupons, rewards anddiscounts, receiving access to services like Amazon prime video etc.
4.3 SUGGESTIONS
Based on the study the following suggestions were formed for the improvement ofonline shopping.
Since the consumer couldn’t physically evaluate the product, the authoritiesof the online shopping sites should check the quality of the product beforeapproving the product to put into sales.
The e-commerce companies and the respective courier services linked withthe companies should try to eliminate delay in delivery of the product.
Authorities should avoid delay in refunding, product return and other relatedprocedures.
4.4 CONCLUSION
From the study, it is clear that though majority of people are familiar with onlineshopping and make use of it, still there is a small portion of population who areunaware about this and doesn’t use it. Even though people are almost satisfied withthe online shopping they are faced with few problems like cheap quality of productand delay in delivery. Online shopping platforms should take necessary steps torectify them. And also we understood that marketing strategies play a major role inboosting online shopping. Online shopping has increased considerably during thecontext of covid-19 and is gaining significance nowadays.
76
BIBILIOGRAPHY
1. P. Kothari, Shivganga S. Maindargi (2016) A Study on Customers Attitudetowards Online Shopping
2. Ashish Bhatt (2014) “Consumer Attitude towards Online Shopping in SelectedRegions of Gujarat”, Journal of Marketing Management, Vol. 2, No. 2, pp. 29-56,ISSN: 2333-6080.
3. Ashwini.N, Manjula. R (2016) “An Empirical Study On Consumers PerceptionTowards Online Shopping”, International Journal of Management and CommerceInnovations, Vol. 3, Issue 2, pp: (1103-1110), ISSN 2348-7585.
4. Lakshmi. S. (2016) “Consumer Buying Behaviour towards Online Shopping”,International Journal of Research – Granthaalayah, Vol. 4, No. 8: SE (2016): 60-65
5. K.S. Silpa, P.U. Rajasree, P. Balasubramanian (2016) “A Study on Peoples‟Perceptions towards Online Shopping”, Bonfring International Journal of IndustrialEngineering and Management Science, Vol. 6, No. 3, August 2016, ISSN 2277-5056.
6. Sonal Kala (2015) “Behaviour of Customers‟ towards Online Shopping in India”,International Journal of Core Engineering & Management (IJCEM), Volume 2,Issue 4, ISSN: 2348 9510
7. G.R.Shalini, K.S.HemaMalini (2015) “A Study Of Online Shopping WebsiteCharacteristics And Its Impact On Consumer Intention To Purchase Online InChennai”, International Research Journal of Engineering and Technology (IRJET),Volume: 02 Issue: 09, ISSN: 2395-0072.
8. “A Study On Consumer Behaviour Towards Online Shopping In CoimbatoreDistrict”, International Journal of Research In Business Management, Vol. 3, Issue7, Jul 2015, 51-62, ISSN: 2347-4572.
9. R.Shanthi, DestiKannaiah (2015) “Consumer’s Perception on Online Shopping”,Journal of Marketing and Consumer Research, Vol.13, ISSN 2422-8451.
10. KalpanaMathur, Arti Sharma (2014) “A Study of Online Shopping Habits ofConsumers in India”, International Journal on Customer Relations, Volume 2 Issue1 PP 23-28.
11. PratiksinhVaghela (2014) “A Study on Consumer Perception towards OnlineShopping”, International Journal of Technology Marketing, Volume 4, Issue 12,ISSN: 2249-1058
12. Renuka Sharma, Kiran Mehta, Shashank Sharma (2014) “Understanding OnlineShopping Behaviour of Indian Shoppers”, International Journal of Management &Business Studies, Vol. 4, Issue 3, ISSN: 2231- 2463
77
13. GagandeepNagra, R. Gopal (2013) “A study of Factors Affecting on OnlineShopping Behaviour of Consumers”, International Journal of Scientific andResearch Publications, Volume 3, Issue 6, June 2013, ISSN 2250-3153
14. PreetiSrivastava (2013) “A Study of Consumer Online Shopping Attitude andBehaviour towards Jewellery”, International Journal of Scientific Research inRecent Sciences (IJSRRS), Vol – 1, Issue – 1, PP (21-24).
15. ManishaKinker, N.K. Shukla (2016) “An Analysis of Consumer Behaviourstowards Online Shopping of Electronic Goods With special reference to Bhopal andJabalpur city”, International Journal of Innovation and Applied Studies, Vol. 14 No.1 Jan. 2016, pp. 218-235, ISSN 2028-9324.
16. A. T. Jaganathan, J. Suresh Kumar, M. Sakthivel, M. Mohanraj (2016) “AStudy on Customer Perception Towards Online Shopping, Namakkal”, InternationalEducation & Research Journal [IERJ], Volume: 2, Issue: 7, ISSN: 2454-9916.
17. Saban Kumar K.C, Arun Kumar Timalsina (2016) “Consumer Attitudestowards Online Grocery Shopping in Kathmandu Valley”, Proceedings of IOEGraduate Conference, 2016, pp. 133–138.
18. SnehalChincholkar (2016) “Consumer Behaviour Towards Online GroceryRetail Store “Localbanya.com” in Mumbai Region”, International Journal ofResearch in Management & Technology (IJRMT), Vol.6, No.2, Mar-Apr 2016,ISSN: 2249-9563.
19. Pawan Kumar, Kanchan (2017) “Online Shopping Behaviour among Studentswith Special Reference to Ludhiana, Punjab, India”, Journal of Marketing andConsumer M. Dhanalakshmi, M. Sakthivel, M. Nandhini (2017) “A Study onCustomer Perception towards Online Shopping, Salem”, International Journal ofAdvanced Research (IJAR), 5(1), ISSN: 2320-540 Research, Vol.33, 2017, ISSN2422-8451
20. Singh, S., &Bajwa, S. (2017). Buying Behaviour of Consumer towardsCounterfeit Products: A Case Study ofMoga City. International Journal ofEngineering Sciences & Research Technology, 6(8), 329-337. Retrieved August 18,2017
21. Priyanka Sharma (2017) “Consumer Behaviour towards Online Shopping-AnEmpirical Study With Reference To Bhiwani City, Haryana”, 6th Internationalconference on recent trends in Engineering, science & management, ISBN: 978-93-86171-21-4
22. Chaturvedi, S., & Gupta, S. (2014). Effect of Social Media on Online ShoppingBehaviour of Apparels in Jaipur City: An Analytical Review. Journal of BusinessManagement, Commerce & Research, 2(7) 1-8. 24
23. Vinerean, S., Certina, I., Dumitrescu, L., &Tichindelean, M. (2013). TheEffects of Social Media Marketing on Online Consumer Behavior. International
78
Journal of Business and Management, 8(14), 66-79. Doi:10.5539/ijbm.v8n14p66Consumer Purchase Intention Research Based on SocialMedia Marketing. International Journal of Business and Social Science, 5(10-1), 92-97.
24. http://hdl.handle.net/10603/247741
25. Consumer behaviour in online shopping with special reference to Kerala,Brijesh George John,Mahatma Gandhi University
26. https://shodhganga.inflibnet.ac.in/
27. International Journal of Management, Technology and Engineering Volume 8,Issue X, OCTOBER/2018 ISSN NO : 2249-7455E-commerce in Kerala: A platformfor business enterprises to venture into the global market and boost economicgrowth SilpaSasankan Assistant Professor of Commerce, SreeNarayana College forWomen, Kollam [email protected]
28. http://ijamtes.org/gallery/11.oct%20ijmte%20-%201011.pdf
29. ISSN : 2230-9519 (Online) | ISSN : 2231-2463 (Print) IJMBS Vol. 4, Issue 3,Spl- 1 July - Sept 2014www.jmbs.com International Journal of Management &Business Studies 9Understanding Online Shopping Behaviour of Indian Shoppers1Dr. Renuka Sharma, 2Dr. Kiran Mehta, 3Shashank Sharma
30. https://www.tandfonline.com/doi/full/10.1080/23311975.2018.1514940
31. https://www.ijitee.org/wp-content/uploads/papers/v8i12S/L112710812S19.pdf
32. https://shodhganga.inflibnet.ac.in/handle/10603/218873

79
QUESTIONNAIRE
1. Panchayath/Municipality/Corporations
2. Ward Number/ Division Number
3. Name
4. Age
5. Gender
Male⃞
Female⃞
Transgender⃞
6. Religion
Hindu⃞
Christian⃞
Muslim⃞
80
Atheist⃞
Others⃞
7. Educational Qualification
SSLC⃞
Higher Secondary⃞
Under Graduate⃞
Post Graduate⃞
Diploma⃞
Professional⃞
Other Courses⃞
8. Employment Status
Government Employee⃞
Private Employee⃞
Self-Employed⃞
Unemployed⃞
9. Monthly Income
Below 10000⃞
10000-20000⃞
20000-30000⃞
30000-40000⃞
Above 40000⃞
10. Have you ever had online shopping?
Yes⃞
No⃞
11. If you never had online shopping, please specify the reason

81
I don’t know about internet⃞
Shopping risk of credit card⃞
Transaction internet illiteracy⃞
Risk of identity theft⃞
Other reasons⃞
12.What type of commodity did you purchase through online shopping?
Electronics⃞
Clothings⃞
Cosmetic jewellery⃞
Books⃞
Grocery⃞
All of the above⃞
13.Which shopping method is more suitable for you?
Online⃞
Offline⃞
14. Have you felt any problems while purchasing through online shopping?
Yes⃞
No⃞
15. If yes, what kind of problem?
Delay in delivery⃞
Cheap quality of product⃞
Product damage⃞
All of the above⃞
Others⃞
16. How would you describe your proficiency on the internet?
82
Ignorant⃞
Intermediate⃞
Advanced⃞
17.Which is your favourite online shopping site
Flipkart⃞
Amazon⃞
Snapdeal⃞
Myntra⃞
Jabong⃞
Ebay⃞
Others⃞
18. Select an approximate amount you will spend per year on online shopping?
Below 5000⃞
5000-10000⃞
10000-15000⃞
15000-20000⃞
20000-25000⃞
25000-30000⃞
Above 30000⃞
19. Features you think necessary for an online shopping site?
Multiple payment gateway⃞
Credibility⃞
Social networking integration⃞
Design⃞
Customer friendly⃞
Privacy and secure checkout⃞
83
All of the above⃞
20.Which type of payment do you prefer?
Cash on delivery⃞
Debit/ Credit card⃞
UPI payment⃞
Wallet payment⃞
Net banking⃞
21. Have you felt any risk factor in electronic payment during online shopping?
Yes⃞
No⃞
22. If yes, please specify
23.What do you focus while shopping online?
Quality of the product⃞
Product price⃞
Particular brand⃞
Ratings and customer reviews⃞
All of the above⃞
24. Do you prefer online shopping than offline shopping at the present situationof covid-19 pandemic?
Yes⃞
No⃞
25.Which are the categories of products you purchased most during the covid 19pandemic?
Electronics⃞
Cosmetic/jewellery⃞
84
Medicines⃞
Books⃞
Clothing⃞
Utensils⃞
All of the above⃞
Others⃞
26. How much did you spend during the covid 19 pandemic for online shopping?
Below 5000⃞
5000-15000⃞
15000-25000⃞
Above 25000⃞
27.Which is your most appropriate time for online shopping?
Any time⃞
Festive season like Onam, Christmas, Diwali, etc.⃞Festive sales in online shopping platforms(Big billion days, amazon great
Indian festival. etc.)⃞
28.What makes festive sales in online shopping platforms more attractive toshop?
Cheap rate or offer price which is lower than usual selling price⃞
New product launches⃞
Limited combo offers⃞
More discounts⃞
More choices/latest arrivals⃞
Fast delivery⃞
All of the above⃞
29. Do you use social networking sites and online shopping platforms to spot thelatest fashion trends?
85
Yes⃞
No⃞
30. Do you consider reviews, ratings displayed on the product information?
Yes⃞
No⃞
31. Did you make use of free coupons for online shopping which you wererewarded from online payment platforms?
Yes⃞
No⃞
32. Do you find advertisements of commodities according to your searchactivities present on your social media platforms influence your purchasinghabits?
Yes⃞
No⃞
33. Did you shop online based on the reviews from famous bloggers oryoutubers from their recommendation regarding certain products?
Yes⃞
No⃞
34. Did you notice that certain products are cheaper in certain online shoppingplatforms than other platforms?
Yes⃞
No⃞
35. Did you have subscription in online shopping platforms like amazon prime,flipkart plus, etc.?
Yes⃞
No⃞
86
36.What kind of benefits do you receive from these memberships?
Reduced price rate compared to the ordinary customers⃞
Fastest delivery compared to ordinary customers⃞
Receive additional coupons rewards and discounts⃞Receiving access to other services like amazon prime video, amazon prime
music, etc.⃞
All of the above⃞