Construction of large signaling pathways using an adaptive perturbation approach with...
14
This journal is c The Royal Society of Chemistry 2012 Mol. BioSyst., 2012, 8, 1571–1584 1571 Cite this: Mol. BioSyst., 2012, 8, 1571–1584 Construction of large signaling pathways using an adaptive perturbation approach with phosphoproteomic dataw Ioannis N. Melas,z a Alexander Mitsos,z b Dimitris E. Messinis, a Thomas S. Weiss, c Julio-Saez Rodriguez d and Leonidas G. Alexopoulos* a Received 21st November 2011, Accepted 28th February 2012 DOI: 10.1039/c2mb05482e Construction of large and cell-specific signaling pathways is essential to understand information processing under normal and pathological conditions. On this front, gene-based approaches offer the advantage of large pathway exploration whereas phosphoproteomic approaches offer a more reliable view of pathway activities but are applicable to small pathway sizes. In this paper, we demonstrate an experimentally adaptive approach to construct large signaling pathways from phosphoproteomic data within a 3-day time frame. Our approach—taking advantage of the fast turnaround time of the xMAP technology—is carried out in four steps: (i) screen optimal pathway inducers, (ii) select the responsive ones, (iii) combine them in a combinatorial fashion to construct a phosphoproteomic dataset, and (iv) optimize a reduced generic pathway via an Integer Linear Programming formulation. As a case study, we uncover novel players and their corresponding pathways in primary human hepatocytes by interrogating the signal transduction downstream of 81 receptors of interest and constructing a detailed model for the responsive part of the network comprising 177 species (of which 14 are measured) and 365 interactions. Introduction Recent advancements in high throughput technologies are changing the focus of modern biology from the study of individual genes, proteins, or pathways into studying biological systems as a whole. 1 Technologies, such as DNA or protein microarrays for gene expression or protein concentration, Mass Spectrometry (MS) for proteomics, and Yeast two- hybrid (Y2H) screen for Protein–Protein Interactions (PPIs), have led to the construction of vast datasets, addressing cellular behavior on both genomic and proteomic levels. Compilation of all these heterogeneous data into predictive, functional models of cellular processes cannot be tackled by reductionist approaches. 2–4 Instead, markup languages, data annotation, and advanced mathematical modeling are used to make this integration feasible. 5–14 These models are usually depicted in computable pathway maps and used for gaining a deeper understanding of cell’s machinery as well as for identi- fying pathway alterations that take place in complex diseases and cannot be regarded as mere malfunction of a single constituent, that being a gene or a protein. 1 Both gene- and protein-based approaches endeavor the construction of large signaling pathways. A major advantage of the genomic approaches in the pathway construction is the unbiased exploration of the whole genome at the transcrip- tional level. 15–17 However, inconsistencies between protein abundance and corresponding mRNA levels in mammalian cells 18,19 reveal that gene expression alone might not be able to fully explain the function of signaling pathways 1 and thus, proteomic measurements are frequently used for validating gene expression data. On this front, measurement of protein phosphorylation state is considered one of the most reliable surrogates for studying the activity of signaling pathways. 20 However, in contrast to gene expression data, proteomic and phosphoproteomic technologies are far from capable to cover the whole proteome level. 4 Proteomic technologies applied today can be divided into two main categories, the ones that make no a priori assump- tion about the sample’s protein content (e.g. MS), and affinity- based methods (e.g. protein arrays, xMAP technology, aptamers) that rely on antibodies or aptamers to detect a predetermined set of targets. 21 MS and affinity-based methods serve different needs in studying signal transduction networks. MS supports the measurement of thousands of signals, however, it is limited a Dept of Mechanical Engineering National Technical University of Athens, 15780 Zografou, Greece. E-mail: [email protected] b Dept of Mechanical Engineering, Massachusetts Institute of Technology, Cambridge, MA 02139, USA c Center for Liver Cell Research, Department of Pediatrics and juvenile Medicine, University Medical Center Regensburg, Regensburg, Germany d European Bioinformatics Institute (EMBL-EBI), Wellcome Trust Genome Campus, Cambridge CB10 1SD, UK, and European Molecular Biology Laboratory (EMBL), Genome Biology Unit, Meyerhofstrasse 1, D-69117 Heidelberg, Germany w Electronic supplementary information (ESI) available. See DOI: 10.1039/c2mb05482e z These authors contributed equally to this work. Molecular BioSystems Dynamic Article Links www.rsc.org/molecularbiosystems PAPER Downloaded by Massachusetts Institute of Technology on 19/04/2013 20:47:07. Published on 23 March 2012 on http://pubs.rsc.org | doi:10.1039/C2MB05482E View Article Online / Journal Homepage / Table of Contents for this issue
Transcript of Construction of large signaling pathways using an adaptive perturbation approach with...

This journal is c The Royal Society of Chemistry 2012 Mol. BioSyst., 2012, 8, 1571–1584 1571
Cite this: Mol. BioSyst., 2012, 8, 1571–1584
Construction of large signaling pathways using an adaptive perturbation
approach with phosphoproteomic dataw
Ioannis N. Melas,za Alexander Mitsos,zb Dimitris E. Messinis,aThomas S. Weiss,
c
Julio-Saez Rodriguezdand Leonidas G. Alexopoulos*
a
Received 21st November 2011, Accepted 28th February 2012
DOI: 10.1039/c2mb05482e
Construction of large and cell-specific signaling pathways is essential to understand information
processing under normal and pathological conditions. On this front, gene-based approaches offer
the advantage of large pathway exploration whereas phosphoproteomic approaches offer a more
reliable view of pathway activities but are applicable to small pathway sizes. In this paper, we
demonstrate an experimentally adaptive approach to construct large signaling pathways from
phosphoproteomic data within a 3-day time frame. Our approach—taking advantage of the
fast turnaround time of the xMAP technology—is carried out in four steps: (i) screen optimal
pathway inducers, (ii) select the responsive ones, (iii) combine them in a combinatorial fashion to
construct a phosphoproteomic dataset, and (iv) optimize a reduced generic pathway via an
Integer Linear Programming formulation. As a case study, we uncover novel players and their
corresponding pathways in primary human hepatocytes by interrogating the signal transduction
downstream of 81 receptors of interest and constructing a detailed model for the responsive part
of the network comprising 177 species (of which 14 are measured) and 365 interactions.
Introduction
Recent advancements in high throughput technologies are
changing the focus of modern biology from the study of
individual genes, proteins, or pathways into studying biological
systems as a whole.1 Technologies, such as DNA or protein
microarrays for gene expression or protein concentration,
Mass Spectrometry (MS) for proteomics, and Yeast two-
hybrid (Y2H) screen for Protein–Protein Interactions (PPIs),
have led to the construction of vast datasets, addressing
cellular behavior on both genomic and proteomic levels.
Compilation of all these heterogeneous data into predictive,
functional models of cellular processes cannot be tackled by
reductionist approaches.2–4 Instead, markup languages, data
annotation, and advanced mathematical modeling are used to
make this integration feasible.5–14 These models are usually
depicted in computable pathway maps and used for gaining a
deeper understanding of cell’s machinery as well as for identi-
fying pathway alterations that take place in complex diseases
and cannot be regarded as mere malfunction of a single
constituent, that being a gene or a protein.1
Both gene- and protein-based approaches endeavor the
construction of large signaling pathways. A major advantage
of the genomic approaches in the pathway construction is the
unbiased exploration of the whole genome at the transcrip-
tional level.15–17 However, inconsistencies between protein
abundance and corresponding mRNA levels in mammalian
cells18,19 reveal that gene expression alone might not be able to
fully explain the function of signaling pathways1 and thus,
proteomic measurements are frequently used for validating
gene expression data. On this front, measurement of protein
phosphorylation state is considered one of the most reliable
surrogates for studying the activity of signaling pathways.20
However, in contrast to gene expression data, proteomic and
phosphoproteomic technologies are far from capable to cover
the whole proteome level.4
Proteomic technologies applied today can be divided into
two main categories, the ones that make no a priori assump-
tion about the sample’s protein content (e.g.MS), and affinity-
based methods (e.g. protein arrays, xMAP technology, aptamers)
that rely on antibodies or aptamers to detect a predetermined
set of targets.21 MS and affinity-based methods serve different
needs in studying signal transduction networks. MS supports
the measurement of thousands of signals, however, it is limited
aDept of Mechanical Engineering National Technical University ofAthens, 15780 Zografou, Greece. E-mail: [email protected]
bDept of Mechanical Engineering, Massachusetts Institute ofTechnology, Cambridge, MA 02139, USA
cCenter for Liver Cell Research, Department of Pediatrics andjuvenile Medicine, University Medical Center Regensburg,Regensburg, Germany
dEuropean Bioinformatics Institute (EMBL-EBI), Wellcome TrustGenome Campus, Cambridge CB10 1SD, UK, and EuropeanMolecular Biology Laboratory (EMBL), Genome Biology Unit,Meyerhofstrasse 1, D-69117 Heidelberg, Germany
w Electronic supplementary information (ESI) available. See DOI:10.1039/c2mb05482ez These authors contributed equally to this work.
MolecularBioSystems
Dynamic Article Links
www.rsc.org/molecularbiosystems PAPER
Dow
nloa
ded
by M
assa
chus
etts
Ins
titut
e of
Tec
hnol
ogy
on 1
9/04
/201
3 20
:47:
07.
Publ
ishe
d on
23
Mar
ch 2
012
on h
ttp://
pubs
.rsc
.org
| do
i:10.
1039
/C2M
B05
482E
View Article Online / Journal Homepage / Table of Contents for this issue

1572 Mol. BioSyst., 2012, 8, 1571–1584 This journal is c The Royal Society of Chemistry 2012
to screening cells under few experimental conditions because
of the semi-automated procedures in sample handling and the
extensive data processing times.22–24 Complementary to MS
approaches, reverse phase protein arrays and xMAP technol-
ogy are confined by a predetermined number of measured
proteins but are capable of measuring thousands of samples in a
single day.25 This advantage—if coupled to assay automation
and automated data gathering—opens the road for studying
cellular pathways in an adaptive fashion in a short time frame.
From the computational standpoint, analysis of phospho-
proteomic data is of major interest in the systems biology
community. On this front, the Dialogue for Reverse Engineering
Assessments and Methods (DREAM3 and 4 conferences)
have crowd-sourced the analysis of phosphoproteomic data
in an effort to identify advantages and limitations of mathe-
matical models for pathway construction.26 Data analysis is
mostly tackled by two classes of methods: data-driven and
topology-driven.27–30 Data-driven analysis is based on methodo-
logies from the field of statistics such as Principal Component
Analysis (PCA), Partial Least Squares Regression (PLSR),
Multiple linear Regression (MR) and clustering, and is applicable
to large signaling pathways.25,31–33 Although such models are
most of the time predictive, they make no use of a priori
knowledge of signaling topology. On the other hand, topology-
driven methods use canonical pathways as a scaffold for building
descriptive models of the signaling network. Formalisms such as
Ordinary/Partial Differential Equations (ODE’s/PDE’s),27,34
Fuzzy Logic and Boolean Modeling35–45 are used to represent
the mechanics of signal transduction. Within the topology-driven
methods, ODE’s are applicable only for small topologies since they
incorporate a large amount of free parameters (rate constants) for
modeling in great detail how signal propagates from one protein to
another. For medium to large topologies Boolean modeling is
currently the method of choice and is used for emphasizing the
structural properties of the pathway (feedback loops, shortest
paths, node dependencies, etc.).36,46–49
As high throughput phosphoproteomic data were made
available, several methods have emerged based on the idea
of optimizing a generic topology to fit the experimental
results.29,50,51 The initial idea on optimization50 lies on a
Boolean representation of a 7-receptor canonical pathway that
is capable of simulating the signal transduction cascade and
compare it to the experimental data. A Genetic Algorithm
(GA) is used to prune the canonical pathway so it best fits a
proteomic dataset and construct a cell-specific pathway. An
alternative approach is introduced in ref. 51 based on an
Integer Linear Programming (ILP) formulation that results
in drastically faster computational times while also providing
an optimality guarantee. The rules of the Boolean logic are
encoded in the constraints of the ILP formulation and solved by
state of the art commercial solvers. The computational effi-
ciency of the ILP approach makes it applicable to optimization
of large topologies. However, for both computational methods,
the quality of the generated pathways relies on the experimental
procedure that should incorporate a very large number of
treatments to constrain the generic topology. In typical phos-
phoproteomic datasets25,51 the treatments include single stimulus
and combination of up to two stimuli (out of B10) and the
pre-treatment with up to two inhibitors (out of B5). It is
understandable that such an experimental procedure is applicable
to small topologies—no larger than 10 receptors—but for large
topologies the number of treatments grows exponentially and
becomes experimentally impracticable.
In this work, we propose a new method for constructing large
topologies based on optimization of canonical pathways with
phosphoproteomic data. On the experimental front we propose
an adaptive approach that is based on the fast turnaround time
of the xMAP technology. Cells are plated on 96-well plates and a
4-step adaptive procedure is employed that includes: (1) ligand
screening, (2) a bimodal model for stimuli selection, (3) design,
implementation, and acquisition of phosphoproteomic data from
combinatorial treatments with selected stimuli in the same batch
of cells, and (4) an ILP formulation for pathway construction
that guarantees a global optimal solution in a computationally
efficient manner. As a case study, we interrogate the signal
transduction network of primary human hepatocytes down-
stream of 81 receptors, which includes all major players of liver
homeostasis but also unknown and less known ligands.
The 4-step approach was implemented in 3-days time frame.
In day 1 the cells are plated. In day 2 the cells are treated with
81 stimuli, phosphoproteomic data acquired, optimal ligand
candidates selected, and new experimental conditions designed.
In day 3 combinatorial treatments for the responsive ligands
are performed, data acquired, and the ILP optimization is
employed. As a result, a detailed, cell-specific signaling path-
way of primary human hepatocytes, incorporating 15 ligands,
177 species and 365 reactions, is constructed within 3 days. To
our knowledge, our approach is a first attempt to construct
large signaling topologies in an adaptive manner by combining
high throughput proteomic measurements with state of the art
optimization algorithms.
Results
Our method employs a 4-step adaptive approach performed
in a 3-day time frame that includes ligand screening, ligand
selection, design and implementation of combinatorial treat-
ments, and pathway optimization. The 4-step procedure is
presented in Fig. 1 and detailed in the following sections.
Ligand screening
Primary human hepatocytes were isolated and plated in 96-well
plates using standard methods as briefly described in Materials
and Methods (day 1).52 A library of 81 stimuli was put together
that consist of all major cytokines, chemokines, and other known
and unknown (i.e. randomly selected) activators of hepatocyte
physiology. Instead of testing the concentration of each individual
stimulus (i.e., by performing a dose response curve and measuring
the phosphorylation levels of several downstream proteins) we
decided to employ a semi-automated text mining approach that
searches the literature and builds a histogram of treated concen-
trations of a particular stimulus (see Materials and Methods).
The concentration histogram provides the user with the most
commonly used concentrations found in the literature and enables
him to choose a high concentration level.
The stimuli library (see the complete names in Table 1)
consists of prototypical players in the medical literature such
as the EGFR pathway (BTC, EGF, TGFA, NRG1, HBEGF),
Dow
nloa
ded
by M
assa
chus
etts
Ins
titut
e of
Tec
hnol
ogy
on 1
9/04
/201
3 20
:47:
07.
Publ
ishe
d on
23
Mar
ch 2
012
on h
ttp://
pubs
.rsc
.org
| do
i:10.
1039
/C2M
B05
482E
View Article Online

This journal is c The Royal Society of Chemistry 2012 Mol. BioSyst., 2012, 8, 1571–1584 1573
HGF pathway (HGF), Insulin pathway (INS, IGF1), Toll
Like Receptor Stimuli (LPS, FLAGELLIN, ODN2006,
IMIQUIMOD, HKSA, SSRNA40, OSM, PAM3CSK4,
POLYIC), the BMP family (BMP2, BMP4, BMP7), the TNF
family (TNF, TNFSF10, TNFSF11, TNFSF12, TNFSF14,
TNFRSF11B, TNFSF13B, CD40LG), several inflammatory
and pleiotropic interleukins (IL1A, IL1B, IL2, IL3, IL4, IL6,
IL7, IL8, IL10, IL12, IL13, IL17A, IL19, IL22), lectins
(LGALS1, LGALS3), interferons (IFNB1, IFNG, IFN1 cluster),
inflammatory and other chemokines (CXCL1, CXCL10,
CXCL11, CXCL12, CCL2, CCL4, CCL5, CCL11), the fibroblast
growth factor family (FGF2, FGF4, FGF23), Follistatin-like 1
(FSTL-1), WNT signaling (WNT), as well as several other
inflammatory or pleiotropic activators: INHBA, ADIPOQ,
DEFB1, FCER2, EPGN, EREG, CSF3, GDF5, GDNF,
CSF2, LEP, CSF1, MIA, PDGFB, RLN2, RLN3, TGFB1,
LTA, VEGF121, FST, NOG. High-throughput bead-based
ELISA experiments using semi-automated xMAP techno-
logy (Luminex, Texas, USA) are performed to measure the
‘‘in vitro average phosphorylation level’’ of 14 key phospho-
proteins at 5 and 25 minutes (IKB, JNK, HSP27, CREB,
ERK, STAT3, IRS1S, AKT, GSK3, MAPK14 (i.e. p38),
RPS6KA1 (i.e. p90RSK), MAP2K1 (i.e. MEK1), RSP6KB1/2/3
(i.e. p70S6K), EGFR). The selection of the above-mentioned
signals is based on previous results (14) and assay availability at
the time of this study. The procedure is described in theMaterials
and Methods section and is based on ref. 25 with some minor
modifications. Data were acquired and analyzed the same day
and plotted as shown in Fig. 2 using the DataRail software.53
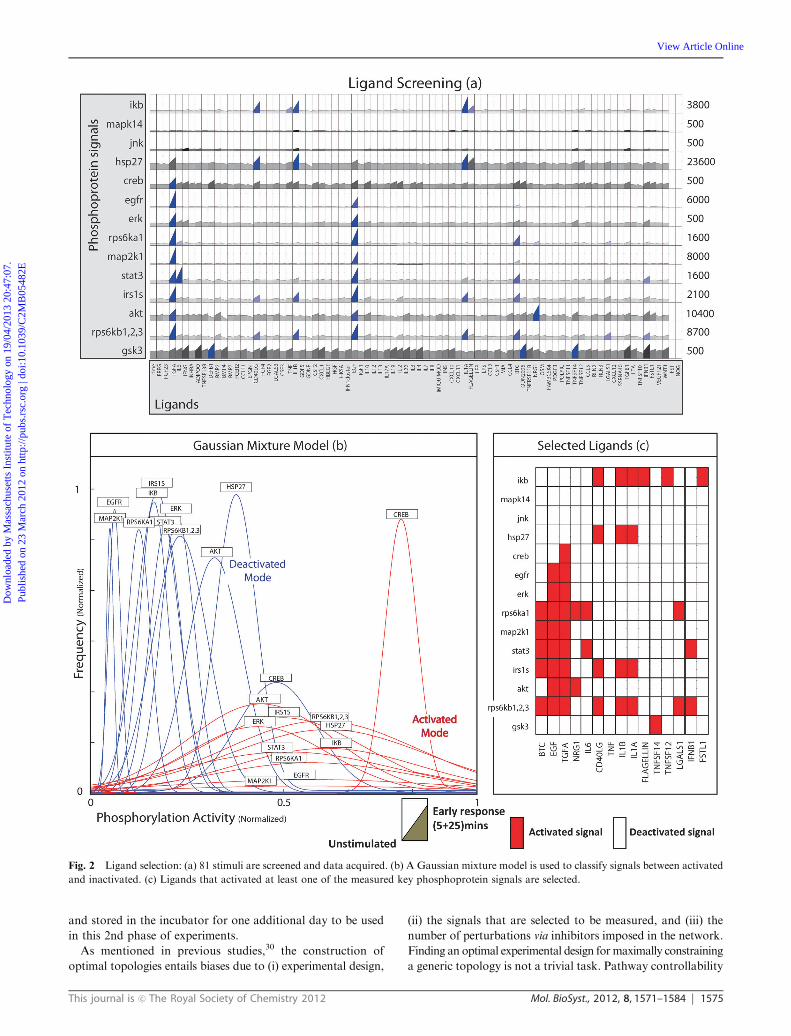
Ligand selection
66 out of the 81 inducers did not lead to a significant activation
of a key phosphoprotein (Fig. 2a). A logic-based simulation of
Fig. 1 Experimental and computational workflow: (a) cells are plated in 96 well plates. (b) Cells are treated with 81 stimuli. (c) For each stimulus,
the phosphorylation activity of 14 intracellular signals is measured at 5 and 25 minutes post stimulus. (d) Optimal inducers are selected based on a
Gaussian mixture model. (e) The selected inducers are used in a combinatorial fashion. (f) Second phosphoproteomic experiment is performed and
data acquired. (g) The generic pathway is pre-processed via CellNetOptimizer and its (h) observable/controllable part is conserved for
optimization. (i) The pathway is optimized via an Integer Linear Programming formulation.
Dow
nloa
ded
by M
assa
chus
etts
Ins
titut
e of
Tec
hnol
ogy
on 1
9/04
/201
3 20
:47:
07.
Publ
ishe
d on
23
Mar
ch 2
012
on h
ttp://
pubs
.rsc
.org
| do
i:10.
1039
/C2M
B05
482E
View Article Online

1574 Mol. BioSyst., 2012, 8, 1571–1584 This journal is c The Royal Society of Chemistry 2012
the generic pathway (see Fig. S1 (ESIw)) such in ref. 36 showed
that in 56 out of the 66 unresponsive stimuli, hepatocytes
should have responded since at least one of the 14 key phospho-
proteins are downstream of the ligand in the generic topology.
For 10 out of the 66 unresponsive stimuli, we cannot observe
their activity because we miss measurements of all downstream
signals (see the following discussion on observability). In order
to select all active ligands, data acquired from the first step were
normalized and a Gaussian Mixture Distribution (GMD)
model was fitted to discretize data to 0 or 1 (OFF or ON
respectively) as detailed in Materials and Methods and plotted
in Fig. 2b. The algorithm leads to the selection of 15 stimuli
based on their strong or marginal activation of at least one key
phosphoprotein, termed ‘‘active responders’’ (Fig. 2c).
Primary human hepatocytes responded to IL6, FLAGELLIN,
TNF, IFNB1, TGFA, TNFSF14, TNFSF12, IL1A, EGF, IL1B,
NRG1, BTC, CD40LG, DEFB1 and LGALS1. As positive
control observations, TGFA, EGF, NRG1 and BTC being
EGFR ligands activated signals related to pro-growth path-
ways, namely AKT, MAP2K1 (MEK), ERK, RPS6KB1,2,3
and RPS6KA1. IL1A, IL1B and TNF activated signals
lying in inflammatory pathways like IKB and HSP27; IL6
activated STAT3. Moreover, less known players were
identified: CD40LG, a member of the TNF superfamily, had
a significant effect on IKB, HSP27, IRS1S and RPS6KB1,2,3;
FLAGELLIN, a TLR5 ligand activated IKB and HSP27;
LGALS1 (also referred as GALECTIN-1) activated RPS6KA1,
RPS6KB1,2,3 and had a medium size effect on STAT3,
IKB and IRS1S; TNFSF12 and TNFSF14 also belonging to
the TNF superfamily yielded medium size responses from
RPS6KB1,2,3, IKB, IRS1S, HSP27 GSK3 and AKT.
This set of ligands together with IFNB1 which in spite of
having medium effects on very few of the signals (STAT3,
RPS6KB1,2,3) is known to play a major role in liver homeo-
stasis, were included in the follow-up experiment.
Design and execution of the combinatorial experiment
In the second phase of the experimental procedure, the 15 stimuli,
found to have strong effects on the 14 key phosphoproteins
in primary hepatocytes, are introduced in a combinatorial
manner in order to build the training dataset that will constrain
the generic topology. The execution of the combinatorial experi-
ment is taking place on the 3rd day of the procedure with the
same batch of primary human hepatocytes plated in day one
Table 1 Stimuli abbreviations. For cytokines, the HUGO nomenclature has been used
Acronym Full name (HUGO nomenclature) Acronym Full name (HUGO nomenclature)
BTC Betacellulin IL22 Interleukin 22EGF Epidermal growth factor LGALS1 Lectin, galactoside-binding, soluble, 1TGFA Transforming growth factor, a LGALS3 Lectin, galactoside-binding, soluble, 3NRG1 Neuregulin 1 IFNB1 Interferon, b1, fibroblastHBEGF Heparin-binding EGF-like growth factor IFNG Interferon, gHGF Hepatocyte growth factor IFN1cluster Interferon, type 1, clusterINS Insulin CXCL1 Chemokine (C–X–C motif) ligand 1IGF1 Insulin-like growth factor 1 CXCL10 Chemokine (C–X–C motif) ligand 10LPS Interferon regulatory factor 6 CXCL11 Chemokine (C–X–C motif) ligand 11FLAGELLIN Component of the bacterial flagellar filament CXCL12 Chemokine (C–X–C motif) ligand 12ODN2006 Synthetic oligonucleotides CCL2 Chemokine (C–C motif) ligand 2IMIQUIMOD Imidazoquinoline amine analogue to guanosine CCL4 Chemokine (C–C motif) ligand 4HKSA Preparation of Listeria monocytogenes CCL5 Chemokine (C–C motif) ligand 5SSRNA40 20-mer single-stranded RNA oligo CCL11 Chemokine (C–C motif) ligand 11OSM Oncostatin M FGF2 Fibroblast growth factor 2 (basic)PAM3CSK4 Synthetic tripalmitoylated lipopeptide FGF4 Fibroblast growth factor 4POLYIC Synthetic analog of double-stranded RNA FGF23 Fibroblast growth factor 23BMP2 Bone morphogenetic protein 2 FSTL1 Follistatin-like 1BMP4 Bone morphogenetic protein 4 WNT Wingless-type MMTV integration site family, mem. 1BMP7 Bone morphogenetic protein 7 INHBA Inhibin, beta ATNF Tumor necrosis factor ADIPOQ Adiponectin, C1Q and collagen domain containingTNFSF10 Tumor necrosis factor lig. superfamily, #10 DEFB1 Defensin, beta 1TNFSF11 Tumor necrosis factor lig. superfamily, #11 FCER2 Fc fragment of IgE, low affinity II, receptor for CD23TNFSF12 Tumor necrosis factor lig. superfamily, #12 EPGN Epithelial mitogen homologTNFSF14 Tumor necrosis factor lig. superfamily, #14 EREG EpiregulinTNFRSF11B Tumor necrosis factor rec. superfamily, #11b CSF3 Colony stimulating factor 3 (granulocyte)TNFSF13B Tumor necrosis factor lig. superfamily, #13b GDF5 Growth differentiation factor 5CD40LG CD40 ligand GDNF Glial cell derived neurotrophic factorIL1A Interleukin 1 a CSF2 Colony stimulating factor 2IL1B Interleukin 1 b LEP LeptinIL2 Interleukin 2 CSF1 Colony stimulating factor 1 (macrophage)IL3 Interleukin 3 MIA Melanoma inhibitory activityIL4 Interleukin 4 PDGFB Platelet-derived growth factor a polypeptideIL6 Interleukin 6 RLN2 Relaxin 2IL7 Interleukin 7 RLN3 Relaxin 3IL8 Interleukin 8 TGFB1 Transforming growth factor, beta 1IL10 Interleukin 10 LTA Lymphotoxin a (TNF superfamily, member 1)IL12 Interleukin 12 VEGF121 Vascular endothelial growth factorIL13 Interleukin 13 FST FollistatinIL17A Interleukin 17 a NOG NogginIL19 Interleukin 19D
ownl
oade
d by
Mas
sach
uset
ts I
nstit
ute
of T
echn
olog
y on
19/
04/2
013
20:4
7:07
. Pu
blis
hed
on 2
3 M
arch
201
2 on
http
://pu
bs.r
sc.o
rg |
doi:1
0.10
39/C
2MB
0548
2E
View Article Online
This journal is c The Royal Society of Chemistry 2012 Mol. BioSyst., 2012, 8, 1571–1584 1575
and stored in the incubator for one additional day to be used
in this 2nd phase of experiments.
As mentioned in previous studies,30 the construction of
optimal topologies entails biases due to (i) experimental design,
(ii) the signals that are selected to be measured, and (iii) the
number of perturbations via inhibitors imposed in the network.
Finding an optimal experimental design formaximally constraining
a generic topology is not a trivial task. Pathway controllability
Fig. 2 Ligand selection: (a) 81 stimuli are screened and data acquired. (b) A Gaussian mixture model is used to classify signals between activated
and inactivated. (c) Ligands that activated at least one of the measured key phosphoprotein signals are selected.
Dow
nloa
ded
by M
assa
chus
etts
Ins
titut
e of
Tec
hnol
ogy
on 1
9/04
/201
3 20
:47:
07.
Publ
ishe
d on
23
Mar
ch 2
012
on h
ttp://
pubs
.rsc
.org
| do
i:10.
1039
/C2M
B05
482E
View Article Online

1576 Mol. BioSyst., 2012, 8, 1571–1584 This journal is c The Royal Society of Chemistry 2012
and observability,50 assay cost limitations, assay performance,
reagent performance, and experimental compatibility with
12 � 8 well plate layout should be taken into consideration.
Based on previous assessment of model sensitivity to changes
in experimental design,30 in this study we created a dataset that
is experimentally feasible and includes all single treatments,
the majority of combination of two together, and the presence
or absence of two selective inhibitors, MEKi and PI3Ki (see
the Phospho-proteomic experiments section in Materials and
Methods). Although combinations of more than two ligands
may uncover more complex cross-talks and synergistic effects,
if done rigorously, the number of experiments needed to
include all the different combinations would increase signifi-
cantly, consequently increasing both the experimental and
computational costs. Instead of incorporating more combina-
torial patterns we chose to increase the number of interrogated
ligands, since the main purpose of this paper is the broad,
qualitative, less detailed study of the signaling network in
human hepatocytes.
The complexity of the combinatorial dataset in Fig. 3 offers
little potential for manual inspection. Nevertheless, a few basic
trends can be identified. MEKi and PI3Ki have blocked their
nominal targets: the activation of ERK is clearly inhibited by
MEKi under any treatment and PI3Ki blocks the activation of
AKT under any treatment. The single treatments included in
the second dataset are grouped together and aligned with the
respective treatments from the first dataset, so a direct com-
parison can be made: as positive controls, all the pro-growth
stimuli have activated AKT, MAP2K1 (MEK), ERK,
RPS6KB1,2,3 and RPS6KA1, as in the first dataset and the
pro-inflammatory ligands activated MAPK14, HSP27 and JNK.
Despite the fact that qualitatively most ligands performed the
same in the 1st and 2nd dataset, few quantitative differences
can also be observed: (i) the JNK and MAPK14 signals clearly
respond to IL1A, IL1B and TNF in contrast to the first
dataset that shows marginal—if any—JNK and MAPK14
activation. (ii) TGFA, EGF and BTC show strong activation
in both phases but with some increased activation levels in
some of the signals in the second phase (MAPK14, JNK,
HSP27). From our experience, mismatches in measurements
of this kind are common even when both experiments are
performed under the exact same conditions, with the same
batch of reagents, and on the same batch of cells from the
same donor. What is important for the optimization process is
the encapsulation of the clear trends of the signals, since small
levels of noise are countered by internal replicates of the
dataset and the normalization procedure.
Clustering
Clustering algorithms (see Materials and Methods) can be
utilized to provide powerful insight when such a large panel of
ligands is screened. By evaluating the Euclidean distance (in <14)
amongst the 81 stimuli, we identify the ones that exhibit
similar profiles to prototypical anabolic or catabolic behavior.
The second dataset is clustered hierarchically respective to
both axes (stimuli and signals). As far as the stimuli axes are
concerned, they seem to be separated into 2 main clusters,
the 1st cluster includes IL6, BTC, EGF, TGFA and NRG1,
the 2nd cluster includes CD40LG, TNF, IL1B, IL1A and
FLAGELLIN, while IFNB1, FSTL1, LGALS1, TNFSF12,
TNFSF14 yield marginal response, therefore are left out of all
clusters and the analysis that follows. In a similar fashion
signals are separated into 2 main clusters. The first one consists
of EGFR, ERK, MAP2K1, RPS6KA1, STAT3, IRS1S, AKT,
RPS6KB1/2/3 and GSK3. The second cluster consists of IKB,
MAPK14, HSP27 and CREB. Interestingly, the ligands of the first
cluster share some pro-growth qualities by activating signals in the
first cluster (pro-growth signals), whereas the second stimuli cluster
consisting of pro-inflammatory stimuli activates mostly the second
signal cluster (pro-inflammatory signals) (see also Fig. 3). Such a
procedure reveals the inflammatory role of FLAGGELIN and
CD40LG, two less-known stimuli that cluster closely to proto-
typical inflammatory ones. For a clustering analysis of the full
combinatorial dataset see S2 and Fig. S3 (ESIw).
Construction of generic pathway
The generic pathway presented in Fig. 1 (and in more detail in
Fig. S1, ESIw) is constructed downstream of 81 receptors of
interest and in the neighborhood of 14 measured proteins.
Several online databases were queried, but most of the reactions
were obtained from KEGG (http://www.genome.jp/kegg/) and
Ingenuity (http://www.ingenuity.com/). Conflicting reports on
protein interactions were handled by manual search of
PubMed database and selection of the most cited alternative.
Addressing the problem of combining pathways from various
databases, the HUGO Gene Nomenclature Committee database
(http://www.genenames.org) was used to ensure standardized
protein names. The pathway was built and visualized using
Graphviz (http://www.graphviz.org/) in a similar fashion to
ref. 50 following manual curation. The resulting topology is
made of more than 500 species and 1000+ reactions (see
Fig. 1g and Fig. S1, ESIw).
Pathway pre-processing: controllability, observability and
feedback loops
Out of the 81 stimuli interrogated originally, only 15 were
found to have strong effects on any of the key phosphorylation
signals. Thus, a large portion of the generic pathway can be
removed before the optimization procedure that is either non-
perturbed (by the 15 cytokines) or non-observable.50 Using
Warshall’s algorithm for transitive closure, as implemented in
CellNetOptimizer (CellNOpt) toolbox,50 the connectivity of
every node to the 14 signals and 15 cytokines is examined (see
Material and Methods). If a pathway exists leading from at
least a perturbed receptor to an arbitrary node A, then A is
considered controllable. If a pathway exists leading from A to
at least a signal, then A is considered observable. The observable
and controllable subset of the generic topology is plotted in
Fig. 1 (and in more detail in Fig. S2, ESIw) numbers 177
species and 365 reactions and is the network to be optimized
by the ILP. Note that the reduction of the network also results
in a significant reduction of the optimization formulation
which makes it computationally more tractable.
The generic topology numbers a large amount of feedback
loops that have to be identified before the optimization
procedure. The presence of a feedback loop implies that
Dow
nloa
ded
by M
assa
chus
etts
Ins
titut
e of
Tec
hnol
ogy
on 1
9/04
/201
3 20
:47:
07.
Publ
ishe
d on
23
Mar
ch 2
012
on h
ttp://
pubs
.rsc
.org
| do
i:10.
1039
/C2M
B05
482E
View Article Online

This journal is c The Royal Society of Chemistry 2012 Mol. BioSyst., 2012, 8, 1571–1584 1577
species can affect their own activation state. ODEs (or other
frameworks for dynamic modeling) support this kind of
dependencies, since the feedback occurs in a subsequent time
point. The Boolean approach used herein utilizes only ‘‘early
response data’’ and thus assumes only a feed-forward approach
where feedback loops are not considered. Thus, the feedback
loops present in the generic topology are identified using an
in-house Depth-First Search algorithm and additional con-
straints are crafted to prohibit the ILP from including them in
the solution (see S3, ESIw).
Fig. 3 Combinatorial experiment: (a) design of the combinatorial experiment. The illustrated stimuli treatments are repeated 3 times: without any
inhibitor present, with a MEK inhibitor (MEKi), and with a PI3K inhibitor (PI3Ki). (b) Phosphoproteomic data are acquired acquisition and
plotted in DataRail.
Dow
nloa
ded
by M
assa
chus
etts
Ins
titut
e of
Tec
hnol
ogy
on 1
9/04
/201
3 20
:47:
07.
Publ
ishe
d on
23
Mar
ch 2
012
on h
ttp://
pubs
.rsc
.org
| do
i:10.
1039
/C2M
B05
482E
View Article Online

1578 Mol. BioSyst., 2012, 8, 1571–1584 This journal is c The Royal Society of Chemistry 2012
Pathway optimization
The optimization procedure is built around an Integer Linear
Programming formulation, that receives as input a generic
topology and a phosphoproteomic dataset, and by altering the
topology that contradicts experimental observations delivers a
signaling pathway that fits the experimental dataset with the
least possible discrepancies.51 Pathway optimization relies on
the minimization of a two term objective function, the first
term penalizes the experiments-topology mismatch and the
second term either penalizes or rewards the size of the path-
way30,50 (see also ILP Formulation in Materials and Methods).
Penalty weights are adjusted by assuming very small values so
that the goodness of fit is always prioritized over the size of the
pathway.30 In contrast to our previous procedures50,51 that
utilize the minimization of pathway size as a method to narrow
down the solution pool, we consider additional pathway
solutions of larger size that may bear strong biological signi-
ficance and should be conserved. Therefore, in the current
analysis we apply the ILP formulation under 2 different
settings: first by using the standard procedure with small
positive size weights, we minimize the size of the pathway;
second by using small negative reaction weights we maximize
the size of the pathway while retaining the prioritization over the
goodness of fit. The dual-settings approach we adopt aims to
obtain a superset of all possible pathway solutions, i.e., pathways
with more nodes and edges but with the same match of the
experimental data. Additionally, we provide an indicative solution
with the minimum number of reactions. The ILP formulation was
solved by GUROBI (Gurobi library version 3.0.1. Houston,
Texas: Gurobi Optimization, Inc., http://www.gurobi.com/)
through GAMS54 and the optimization results are illustrated in
Fig. 4. Dashed lines correspond to the ‘‘negative weights’’-solution
and the bold ones to the minimum-size solution. For a better
assessment of the ILP performance and differences between
positive and negative size weights see also S4 (ESIw).Out of the original 365 reactions present in the reduced
canonical pathway, 204 were removed by the ILP formulation
(Fig. 4) for the maximum-size solution (superset has 161
reactions—Fig. 4, ‘‘dashed lines’’). In the minimum-size
solution only 53 reactions are included. As positive control
observations, the modular activation patterns described pre-
viously are conserved. The pro-growth stimuli, namely EGF,
TGFA, NRG1, BTC and IL6, signal through similar, partially
overlapping pathways and activate the first signal cluster
consisting of EGFR, AKT, MAP2K1, ERK, STAT3 and
RPS6KA1. On the other hand TNF, CD40LG, IL1A, IL1B
and FLAGELLIN signal through TRAF6, TRAF2 and the
MAPKs and activate MAPK14, IKB, JNK, HSP27 and
CREB. RPS6KB1/2/3, GSK3 and IRS1S, although seemed
to respond to pro-growth stimuli, are removed from the
pathway, since their basal level is relatively high implying a
low signal to noise ratio and causing the fold change to drop
below 2 (that is the threshold for considering a signal activated,
see also ref. 17 and 24 and Materials and Methods section). In
more detail, concerning the EGFR pathway: NRG1, BTC,
EGF and TGFA signal viaGRB2 to RAS and then to (i) PI3K-
AKT and to (ii) RAF - MAP2K1 - ERK - RPS6KA -
CREB, ERK - STAT3. Another branch downstream of IL6
signals via JAK1 to (i) PI3K - AKT and to (ii) STAT3.
Concerning the pro-inflammatory ligands (IL1A, IL1B,
FLAGELLIN, CD40LG and TNF): IL1A, IL1B and
FLAGELLIN signal through TRAF6 to MAP3K7 and then
to (i) NIK- IKB, and to (ii) MAP2K4- JNK,MAP2K4-
MAPK14, MAP2K4 - MAPK11 - HSP27, MAPK11 -
RPS6KA4 - CREB. CD40LG signals through TRAF5 to
NIK and activates IKB. TNF signals through TRAF2 to
MAP3K7 and activates MAPK14, CREB, HSP27, JNK and
IKB. It is clear that minimum-size solution (bold lines) and
superset of possible solutions (dashed lines) serve the exact
same functionality in terms of connecting stimuli to signals.
Their sole difference is that the superset of possible solutions
includes, apart from the shortest, all alternative paths for
achieving that connectivity.
The optimization procedure caused the fitness error to drop
from 31% to 7%, validating that the canonical pathway alone
could not capture the signal transduction mechanisms of the
specific cell type. The ILP formulation managed to fit the basic
trends of the experimental dataset and construct a hepatocyte-
specific signaling pathway. See S5 (ESIw) for a more detailed
inspection of fitness error, before and after the optimization
procedure.
Conclusions
In this manuscript, we propose an approach capable of
interrogating signal transduction downstream of 81 receptors
of interest and subsequently, constructing a detailed view of
the signaling pathway for the responsive part of the network,
numbering 15 receptors, 177 species and 365 reactions, all
within a 3-day time frame. In contrast to MS-based techniques,
the fast turnaround time of the xMAP technology allowed an
adaptive approach that learns from a functional phospho-
proteomic screen to define the most appropriate combinatorial
experiments for pathway construction. The 3-day approach is
performed on the same batch of cultured primary cells, thus
reducing cell differentiation and eliminating donor-to-donor varia-
bility. On the computational front, the ILP formulation solved by
Gurobi, a state of the art commercial solver, has successfully
negotiated the optimization of a canonical pathway to best fit the
functional characteristics of the interrogated cell line.
In contrast to most approaches applied today that focus on
the well-studied and the most-cited pathways, in this project
we rely on a functional screen of a large library of stimuli to
select the most appropriate inducers of hepatocyte intracellular
activity. As expected, most ligands we found correspond to
well-known and highly cited ‘‘prototypical’’ players for liver
homeostasis but surprisingly, we also uncover poorly and
unreported stimuli that induced strong intracellular responses.
Clustering analysis combined with literature search was able to
uncover the potential role of those stimuli due to their func-
tional similarity with ‘‘prototypical’’ ones. On the other hand,
our literature-unbiased approach for ligand selection cannot
identify all active players for 4 main reasons: (i) it is based on
key measured signals that might not belong to the downstream
cascade of the activator (e.g., WNT signaling could not be
detected due to the absence of a beta-Catenin signal55); (ii) the
phosphorylation events are below the limits of detection of
Dow
nloa
ded
by M
assa
chus
etts
Ins
titut
e of
Tec
hnol
ogy
on 1
9/04
/201
3 20
:47:
07.
Publ
ishe
d on
23
Mar
ch 2
012
on h
ttp://
pubs
.rsc
.org
| do
i:10.
1039
/C2M
B05
482E
View Article Online

This journal is c The Royal Society of Chemistry 2012 Mol. BioSyst., 2012, 8, 1571–1584 1579
the assay; (iii) the activation occurs in a different time point than
the one measured (i.e. not at 5 and 25 minutes). (iv) Finally,
since ligands are screened based on their individual effects on
the measured proteins, synergistic effects cannot be captured
at this point. Implying that players may be left out of the
following steps of the analysis with strong, yet unidentified,
synergistic effects. In fact, components showing only synergistic
effects are lost at this point. As more phosphoprotein assays
Fig. 4 Optimized pathway: the optimized pathway consists of the reactions and nodes conserved by the ILP formulation.
Dow
nloa
ded
by M
assa
chus
etts
Ins
titut
e of
Tec
hnol
ogy
on 1
9/04
/201
3 20
:47:
07.
Publ
ishe
d on
23
Mar
ch 2
012
on h
ttp://
pubs
.rsc
.org
| do
i:10.
1039
/C2M
B05
482E
View Article Online

1580 Mol. BioSyst., 2012, 8, 1571–1584 This journal is c The Royal Society of Chemistry 2012
are added in the future and more time points are selected,
more activators can be identified.
Based on our ligand screening approach we identified two
under-reported compounds: Flagellin and CD40LG. Flagellin,
a TLR5 inducer, was found to activate pro-inflammatory
pathways, and function—as the clustering analysis revealed—
in a similar way to TNF, IL1A and IL1B; enforcing the
hypothesis that hepatocytes assume an active role in immuno-
surveillance mechanisms.25,56 Moreover, CD40LG, a member
of the TNF superfamily previously reported to be expressed in
T-cells and affect B-cells and endothelial cells, is identified as
having a clear effect on primary hepatocytes by activating the
NFkB pathway. CD40LG induced activation of IKB and P38/
HSP27 cluster closely resembling the prototypical TNF, IL1B
and IL1A inflammatory players, validating its role in liver
inflammation. Even though the role of CD40L in hepatocyte
physiology is not clear from the literature, a single study by
Zhou et al.57 identifies CD40 as a driving factor in the patho-
genesis of fulminant hepatitis via its upregulation in Kupffer
cells and hepatocytes. Together with the present results,
CD40L should be considered a major inflammatory player
in liver physiology. Apart from the identification of novel
players, the high throughput screening revealed clustering of
the stimuli in two main groups, the first one consisting of
EGF, TGFA, NRG1, BTC and IL6, sharing some pro-growth
qualities and the second one consisting of TNF, IL1A, IL1B,
FLAGELLIN and CD40LG activating mostly pro-inflammatory
pathways (IKB, MAPK14, HSP27, JNK). As expected, this
modularity has led to the construction of partially overlapping
pathways, namely, EGF, TGFA, BTC and NRG1 all signal
through the EGFR and GRB2 adaptor protein, while IL1A,
IL1B and FLAGELLIN signal through the IL1R and IRAK.
The ILP formulation conserved a subset of the reactions
found in the canonical pathway, shaping a descriptive model
of how signal propagates in primary hepatocytes. However,
the construction of Boolean models of signaling pathways
from phosphoproteomic data entails several validation issues
related to optimal experimental design, model sensitivity to the
generic topology, and calibration of the weights of the two
objective terms (detailed description can be found in ref. 30
and 50). The major limitations in pathway optimization rely
on two main factors: pathway controllability (e.g., how many
stimuli and downstream inhibitors can be used), pathway
observability, and experimental design. Amongst all, the number
of the key phosphoprotein signals is of utmost importance for
increased pathway observability. Surprisingly, just 14 phospho-
protein signals used in this study were sufficient to give a
pathway coverage equal to 68.5% of the generic (685 out of
the 1000 reactions can be observed from the generic topology
when all stimuli are used). Further development of high
throughput assays will enable us to increase the pathway
coverage but also increase the quality of results since more
than one signal in the same pathway increase the reliability of
the pathway topology.
Construction of predictive models for the intracellular
signaling cascades is the cornerstone for understanding cellular
behavior. Here we presented an integrative approach to construct
large scale signaling pathways, based on an adaptive collection
of high throughput phosphoproteomic data and a priori
knowledge of protein connectivity. State of the art optimiza-
tion algorithms were coupled to an ILP optimization formula-
tion to prune a canonical pathway of 177 nodes and 365
reactions to best fit the dataset at hand. Our approach sheds
light into the complex signaling mechanisms of primary human
hepatocytes and constitutes a proof-of-principle for construc-
tion of large pathways based on combinatorial data and a
limited number of measured signals.
Methods
Hepatocyte isolation and plating
Liver tissue samples are obtained from patients undergoing
partial hepatectomy for metastatic liver tumor secondary to
colorectal cancer. Tumor aggregates are resected including a
safety margin within the normal tissue and histological exami-
nation by a pathologist confirms that tumor-free liver tissue is
obtained for cell isolation. Procedures are performed using
protocols approved by the local ethical committee and according
to the guidelines of the charitable state-controlled foundation
Human Tissue and Cell Research with the patient’s informed
consent.58 Primary human hepatocytes were isolated and the
cell viability was examined by Trypan blue exclusion.52 If cell
preparations had a viability of more than 80% they were
plated in collagen type I-coated 96 well plates at a density of
1.2 � 105 cells cm�2 and cultivated in Williams Medium E
(Biochrom AG, Berlin, Germany) supplemented with 2 mM
l-glutamine (Invitrogen), 100 nM dexamethasone (Sigma) and
1% penicillinstreptomycin (Invitrogen).
Determining treated concentrations of stimuli
A custom, semi-automated, literature mining approach was
implemented for determining the saturated levels of the 81
stimuli in the library. Google search engine was queried with
the stimuli name (and common aliases found in HUGO Gene
Nomenclature Committee database) preceded by ‘‘mg/ml’’,
‘‘ng/ml’’, ‘‘mM’’, ‘‘mM’’, ‘‘nM’’, etc. and each time the first 100
results were reviewed. The system searches the first 100 results
of Google Scholar for the preferred concentration format of
the search term, results are stored and the numeric results are
filtered. Then the system evaluates the frequency of appear-
ance for the different concentrations.
The stimuli concentrations that hepatocytes were treated
with are: ADIPOQ (100 ng ml�1), TNFSF13B (25 ng ml�1),
DEFB1 (100 ng ml�1), BMP2 (100 ng ml�1), BMP4 (100 ng ml�1),
BMP7 (100 ng ml�1), FCER2 (100 ng ml�1), CD40LG (1000
ng ml�1), CTGF (50 ng ml�1), CCL11 (100 ng ml�1), FGF2
(50 ng ml�1), FGF4 (50 ng ml�1), FGF23 (50 ng ml�1), FST
(100 ng ml�1), CSF3 (50 ng ml�1), GDF5 (100 ng ml�1),
GDNF (100 ng ml�1), CSF2 (50 ng ml�1), IFNA1 (100 ng ml�1),
IFNB1 (100 ng ml�1), IL29 (100 ng ml�1), IL3 (50 ng ml�1),
IL10 (50 ng ml�1), IL12 (50 ng ml�1), IL13 (50 ng ml�1), IL19
(100 ng ml�1), IL22 (100 ng ml�1), CXCL11 (100 ng ml�1),
LEP (100 ng ml�1), CSF1 (50 ng ml�1), MIA (500 ng ml�1),
NOG (200 ng ml�1), TNFSF11 (50 ng ml�1), RLN2
(100 ng ml�1), RLN3 (100 ng ml�1), CXCL12 (100 ng ml�1),
LTA (100 ng ml�1), TNFSF10 (100 ng ml�1), TNFSF12
(100 ng ml�1), VEGFA (100 ng ml�1), IGFBP1 (100 ng ml�1),
Dow
nloa
ded
by M
assa
chus
etts
Ins
titut
e of
Tec
hnol
ogy
on 1
9/04
/201
3 20
:47:
07.
Publ
ishe
d on
23
Mar
ch 2
012
on h
ttp://
pubs
.rsc
.org
| do
i:10.
1039
/C2M
B05
482E
View Article Online

This journal is c The Royal Society of Chemistry 2012 Mol. BioSyst., 2012, 8, 1571–1584 1581
IGFBP3 (100 ng ml�1), LGALS1 (2000 ng ml�1), LGALS3
(2000 ng ml�1), TNFRSF11B (100 ng ml�1), WNT1
(100 ng ml�1), Pam3CSK (1000 ng ml�1), HKLM (108 c ml�1),
PolyIC (10 000 ng ml�1), LPS (10 000 ng ml�1), Flagellin
(1000 ng ml�1), FSL1 (1000 ng ml�1), Imiquimod
(1000 ng ml�1), ssRNA (1000 ng ml�1), ODN2006 (5 mM),
TGFA (200 ng ml�1), BTC (50 ng ml�1), EGF (100 ng ml�1),
EPGN (100 ng ml�1), EREG (100 ng ml�1), CXCL1
(100 ng ml�1), HBEGF (50 ng ml�1), NRG1 (100 ng ml�1),
HGF (100 ng ml�1), IFNG (100 ng ml�1), Igf1 (100 ng ml�1),
IL1A (20 ng ml�1), IL1B (20 ng ml�1), IL2 (50 ng ml�1), IL4
(50 ng ml�1), IL6 (100 ng ml�1), IL7 (100 ng ml�1), IL8
(100 ng ml�1), IL17A (100 ng ml�1), CXCL10 (100 ng ml�1),
TNFSF14 (100 ng ml�1), CCL2 (100 ng ml�1), CCL4
(100 ng ml�1), OSM (100 ng ml�1), PDGF-BB (100 ng ml�1),
CCL5 (100 ng ml�1), TGFB1 (10 ng ml�1), TNF (100 ng ml�1),
INS (1720 ng ml�1).
Phospho-proteomic experiments
Phosphoproteomic measurements were carried out using
bead-based ELISA type assays (xMAP technology). The
following phosphoprotein bead set from Bio-Rad were used:
IkB-a (Ser32/Ser36), JNK (Thr183/Tyr185), HSP27 (Ser78),
CREB (Ser133), ERK1/2 (Thr202/Tyr204, Thr185/Tyr187),
STAT3 (Ser727), IRS1Ser (Ser636/Ser639), Akt (Ser473),
GSK3(Ser21/Ser9), MAPK14 (i.e. p38) (Thr180/Tyr182),
RPS6KA1 (i.e. p90RSK) (Thr359/Ser363), MAP2K1
(i.e. MEK1) (Ser217/Ser221), RSP6KB1/2/3 (i.e. p70S6K)
(Thr421/Ser424). The EGFR signal (total tyrosine) was
measured using the Millipore assay. The signals are chosen
based on the availability of the reagents and quality controls
performed at the early phases of the experimental setup.
Originally, 20 signals were measured, including (apart from
the 14 mentioned above) BCR245 (B-Cell Receptor), IRB
(Insulin Receptor B), PDGFR, SRC, CMET and IRS1T.
However, high basal levels and experimental noise led to our
decision to exclude them from the dataset. The experimental
protocol25 was altered and the incubation times were set to
1 hour for the samples/beads treatment, 2 hours for the
secondary antibody, and 10 minutes for the PE in order to
minimize the total experimental time and make it compatible
with the adaptive procedure.
At the second day of the procedure (after the hepatocyte
plating in day 1) each of the 81 stimuli was applied in each well
and cells were treated in separate plates for 5 and 25 minutes.
The selection of these two time points was based on preliminary
results, published in ref. 25, that identified 5 and 25 minutes as
the optimal reporters of early phosphorylation activities. At
the end of the treatment cell lysates were collected using a
standard lysate procedure.25 Lysates from the two time points
were pooled together in a 1 : 1 ratio and the mixed lysate—
that corresponds to an ‘‘average early signaling response’’—
was measured using the Luminex xMAP technology. Mixing
cell lysates serves multiple purposes such as significant decrease
of experimental cost and improvement of data quality.30,51
In the 3rd day of the experimental procedure (follow-up
phosphoproteomic dataset) a multicombinatorial treatment of
cells is needed with the addition of inhibitors. In this case,
primary human hepatocytes were pre-treated with inhibitors
for 40 minutes. Two very selective kinase inhibitors were
chosen at concentrations sufficient to inhibit at least 95%
phosphorylation of the nominal target as determined by dose–
response assays in previous work.25 The following concentra-
tions were chosen: MEK/PD325901 (100 nM), PI3K/PI-103
(10 mM). After the pretreatment period, cells were stimulated
with a combination of stimuli selected from a library of 16
cytokines using the same concentrations and the same signals
were measured as in the first step.
Gaussian bimodal distribution for ligand selection and data
normalization
The Gaussian Mixture Distribution (GMD) was used at the
core of the ligand selection procedure. The measured phos-
phorylation values of each of the 14 signals were used to fit a
GMD consisting of 2 modes, the deactivated and the activated
mode. Subsequently for each measured phosphorylation value,
the probability distribution function (PDF) was evaluated
respective to both modes: if the PDF respective to the first
mode (deactivated) was greater than the PDF respective to the
second mode (activated) then the signal was considered to be
ON (otherwise OFF). This way the experimental dataset was
discretized to 0 and 1 (OFF and ON). Only stimuli that
activated at least one of the signals were included in the
follow-up steps of the proposed methodology. The Statistics
Toolbox of Matlab was used for this analysis and more
specifically the gmdistribution.fit() and pdf() functions.
A different normalization procedure was used for the com-
binatorial dataset, since the large number of experiments
performed with a strong activator and in the presence of
inhibitors led to very dispersed distributions that complicated
data discretization. The normalization scheme used is similar
to the one introduced in ref. 26. The fold change increase of
the signal (before and after stimulation) is evaluated and
passed through a hill function filter to be scaled from 0 to 1.
In more detail:
xk;mj jnormalized ¼
xkmj jt¼1xkmjjt¼0
� �n
pn þ xkmjjt¼1
xkmjjt¼0
� �n
where
xk,mj |normalized is the normalized measured value of species j
in experiment k,
xk,mj |t=0 is the unstimulated measured value of species j in
experiment k,
xk,mj |t=1 is the stimulated measured value of species j in
experiment k,
n is the hill coefficient, herein n = 4,
p is a user defined threshold representing the fold change
increase beyond which the signal is considered activated. In the
analysis presented herein p = 2, implying a 2-fold increase or
greater must take place for a signal to be considered activated.
Clustering
Clustering is performed using TM4 MeV (http://www.tm4.
org/mev/). Data are reconfigured into a 2-d matrix and
Dow
nloa
ded
by M
assa
chus
etts
Ins
titut
e of
Tec
hnol
ogy
on 1
9/04
/201
3 20
:47:
07.
Publ
ishe
d on
23
Mar
ch 2
012
on h
ttp://
pubs
.rsc
.org
| do
i:10.
1039
/C2M
B05
482E
View Article Online

1582 Mol. BioSyst., 2012, 8, 1571–1584 This journal is c The Royal Society of Chemistry 2012
imported to MeV. Hierarchical clustering is performed respec-
tive to both axes according to the Euclidean distance and rows
and columns were reordered automatically. Other metrics
were also used, but offered little insight beyond what had
already been acquired using the Euclidean distance, therefore
are left out of the results section.
CellNOpt Preprocessing
Preprocessing of the generic pathway was performed using
CellNOpt50 (http://www.ebi.ac.uk/saezrodriguez/software.html)
to remove the non-observable and non-controllable part of it.
Node ‘‘A’’ is considered non-observable when its activation state
cannot be inferred based on the measured signals. This occurs
when there are no paths leading from ‘‘A’’ to any of the signals.
In CellNOpt the shortest path from ‘‘A’’ to each of the signals is
computed using Warshall’s algorithm, if such a path does not
exist, node ‘‘A’’ and all reactions leading from/to it are removed.
Node ‘‘B’’ is considered non-controllable, when its activation
state cannot be perturbed by any stimulus or inhibitor. This
occurs when there are no paths leading from any stimulus to this
node. Warshall’s algorithm is used to compute the shortest paths
from every stimulus to node ‘‘B’’, if such a path does not exist,
node B and all reactions leading from/to it are removed.
ILP formulation
Pathway optimization via an ILP formulation was first intro-
duced in ref. 51. Although the core of the formulation (i.e., the
inequality constraints) remains the same, the objective func-
tion is modified to account for the minimization of both the
measurement–prediction mismatch and the pathway size at the
same time, as in ref. 26 and 19. In ref. 51 the measurement–
prediction mismatch was minimized first resulting in a collec-
tion of solutions, where all the pathways scored the same
optimal-goodness of fit, and subsequently the pathway’s size
was minimized resulting in a solution that incorporates the
fewest reactions. The objective function used throughout the
paper is of the following form:
Xj:k
akj jxkj � xk;mj j þXi
biyi ð1Þ
where,
- j A {1,. . .,ns} is the set of species (nodes) included in the
pathway,
- i A {1,. . .,nr} is the set of reactions (edges) included in the
pathway,
- k A {1,. . .,ne} is the set of experiments,
- xkj is the predicted value of species j in the experiment k,
- xk,mj is the measured value of species j in experiment k,
- akj are user defined weights (for species j in experiment k)
- yi is the presence (or absence) of reaction i (assumes
Boolean values only)
- bi are user defined weights (for reaction i).
The first term of (1) corresponds to the measurement–pre-
diction mismatch, and its minimization guarantees the good-
ness of fit of the solution. The summation is performed only
over the measured species for each experiment. The second
term of (1) if bi > 0 minimizes the size of the pathway, else if
bi o 0 maximizes the size of the pathway.
The linear constraints that complete the formulation are:
zki r yi, i = 1,. . .,nr, k =1,. . .,ne. (2)
zki r xkj i = 1,. . .,nr, k =1,. . .,ne, j A Ri (3)
zki r 1 � xkj i = 1,. . .,nr, k =1,. . .,ne, j A li. (4)
zki � yi þXj2Ri
ðxkj � 1Þ�Xj2Iiðxkj Þ; i ¼ 1; . . . ; nr; k ¼ 1; . . . ; ne:
ð5Þ
xki Z zkj i = 1,. . .,nr, k =1,. . .,ne, j A Pi. (6)
xkj �X
i¼1;...;nr:j2Pi
zki ; j ¼ 1; . . . ; ns; k ¼ 1; . . . ; ne: ð7Þ
xkj = 0, k =1,. . .,ne, j A Mk,0 (8)
xkj = 1, k =1,. . .,ne, j A Mk,1 (9)
X A [0,1]ne�ns, y A {0,1}nr, Z A [0,1]ne�nr, (10)
where,
- zki corresponds to the activation or not (1 or 0 respectively)
of equation i in experiment k,
- Ri is the set of reactants in reaction i,
- Pi is the set of products in reaction i,
- Mk,1 is a set of species introduced in the system in
experiment k (imposed treatments),
- Mk,0 is a set of species excluded from the system in
experiment k.
Complete details of the ILP formulation can be found in
ref. 51. Note in particular that herein the variables xkj and zkiare relaxed to continuous. As demonstrated in ref. 27 this
results in an exact reformulation.
The resulting MILP is of significant size with 365 binary
variables and approximately 60000 continuous variables and
200000 constraints. Gurobi version 3.0.1 was used to solve this
problem to sufficiently tight tolerance (optcr = 0.10) in an
acceptable computational time of approximately 1.5 hours. Note
that the tractable computational time is in part achieved by the
relaxation of the integer variables xkj (species j present in experi-
ment k) and zkj (reaction i activated in experiment k) to continuous
(i.e., xkj A [0,1], zki A [0,1]) proposed in ref. 51. Note also that the
size of the MILP is drastically reduced by the preprocessing of the
signaling network performed by CellNetOptimizer.
Acknowledgements
We would like to thank Katerina Chairakaki for help with the
experimental procedure, Andreas Schuppert for help with the
experimental design, and Anastasios Papanastasiou for imple-
menting the semi-automated text mining procedure for identi-
fying optimal ligand concentrations. LGA and INM are
funded by the Marie Curie International Reintegration Grant
(MIRG-14-CT-2007-046531), and the Virtual Liver Network.
AM is grateful for funding through the Rockwell Inter-
national Career Development Professorship. Financial support
from the Deutsche Forschungsgemeinschaft (German Research
Association) through grant GSC 111 is gratefully acknowledged.
We would like to thank Gurobi Optimization for providing
the Gurobi solver free of charge.
Dow
nloa
ded
by M
assa
chus
etts
Ins
titut
e of
Tec
hnol
ogy
on 1
9/04
/201
3 20
:47:
07.
Publ
ishe
d on
23
Mar
ch 2
012
on h
ttp://
pubs
.rsc
.org
| do
i:10.
1039
/C2M
B05
482E
View Article Online

This journal is c The Royal Society of Chemistry 2012 Mol. BioSyst., 2012, 8, 1571–1584 1583
References
1 K. Aggarwal and K. H. Lee, Briefings Funct. Genomics Proteomics,2003, 2, 175–184.
2 H. Kitano, Science, 2002, 295, 1662–1664.3 S. Boccaletti, V. Latora, Y. Moreno, M. Chavez and D. U. Hwang,Phys. Rep., 2006, 424, 175–308.
4 J. Saez-Rodriguez, L. G. Alexopoulos and G. Stolovitzky, Sci.Signaling, 2011, 4, 10.
5 L. Stromback and P. Lambrix, Bioinformatics, 2005, 21,4401–4407.
6 M. Hucka, A. Finney, H. M. Sauro, H. Bolouri, J. C. Doyle,H. Kitano, A. P. Arkin, B. J. Bornstein, D. Bray, A. Cornish-Bowden, A. A. Cuellar, S. Dronov, E. D. Gilles, M. Ginkel,V. Gor, Goryanin II, W. J. Hedley, T. C. Hodgman, J. H.Hofmeyr, P. J. Hunter, N. S. Juty, J. L. Kasberger, A. Kremling,U. Kummer, N. Le Novere, L. M. Loew, D. Lucio, P. Mendes,E. Minch, E. D. Mjolsness, Y. Nakayama, M. R. Nelson, P. F.Nielsen, T. Sakurada, J. C. Schaff, B. E. Shapiro, T. S. Shimizu,H. D. Spence, J. Stelling, K. Takahashi, M. Tomita, J. Wagner,J. Wang and S. Forum, Bioinformatics, 2003, 19, 524–531.
7 A. Morgat, E. Coissac, E. Coudert, K. B. Axelsen, G. Keller,A. Bairoch, A. Bridge, L. Bougueleret, I. Xenarios and A. Viari,Nucleic Acids Res., 2012, 40, D761–D769.
8 E. Demir, M. P. Cary, S. Paley, K. Fukuda, C. Lemer, I. Vastrik,G. Wu, P. D’Eustachio, C. Schaefer, J. Luciano, F. Schacherer,I. Martinez-Flores, Z. Hu, V. Jimenez-Jacinto, G. Joshi-Tope,K. Kandasamy, A. C. Lopez-Fuentes, H. Mi, E. Pichler,I. Rodchenkov, A. Splendiani, S. Tkachev, J. Zucker,G. Gopinath, H. Rajasimha, R. Ramakrishnan, I. Shah,M. Syed, N. Anwar, O. Babur, M. Blinov, E. Brauner,D. Corwin, S. Donaldson, F. Gibbons, R. Goldberg,P. Hornbeck, A. Luna, P. Murray-Rust, E. Neumann,O. Reubenacker, M. Samwald, M. van Iersel, S. Wimalaratne,K. Allen, B. Braun, M. Whirl-Carrillo, K. H. Cheung,K. Dahlquist, A. Finney, M. Gillespie, E. Glass, L. Gong, R. Haw,M. Honig, O. Hubaut, D. Kane, S. Krupa, M. Kutmon, J. Leonard,D. Marks, D. Merberg, V. Petri, A. Pico, D. Ravenscroft, L. Ren,N. Shah, M. Sunshine, R. Tang, R. Whaley, S. Letovksy,K. H. Buetow, A. Rzhetsky, V. Schachter, B. S. Sobral,U. Dogrusoz, S. McWeeney, M. Aladjem, E. Birney, J. Collado-Vides, S. Goto, M. Hucka, N. Le Novere, N. Maltsev, A. Pandey,P. Thomas, E. Wingender, P. D. Karp, C. Sander and G. D. Bader,Nat. Biotechnol., 2010, 28, 935–942.
9 P. Shannon, A. Markiel, O. Ozier, N. S. Baliga, J. T. Wang,D. Ramage, N. Amin, B. Schwikowski and T. Ideker, Genome Res.,2003, 13, 2498–2504.
10 S. Maere, K. Heymans and M. Kuiper, Bioinformatics, 2005, 21,3448–3449.
11 D. Smedley, S. Haider, B. Ballester, R. Holland, D. London,G. Thorisson and A. Kasprzyk, BMC Genomics, 2009, 10, 22.
12 A. Garg, K. Mohanram, G. De Micheli and I. Xenarios, MethodsMol. Biol. (Totowa, N. J.), 2012, 786, 397–443.
13 R. Apweiler, M. J. Martin, C. O’Donovan, M. Magrane, Y. Alam-Faruque, R. Antunes, D. Barrell, B. Bely, M. Bingley, D. Binns,L. Bower, P. Browne, W. M. Chan, E. Dimmer, R. Eberhardt,F. Fazzini, A. Fedotov, R. Foulger, J. Garavelli, L. G. Castro,R. Huntley, J. Jacobsen, M. Kleen, K. Laiho, D. Legge, Q. A. Lin,W. D. Liu, J. Luo, S. Orchard, S. Patient, K. Pichler, D. Poggioli,N. Pontikos, M. Pruess, S. Rosanoff, T. Sawford, H. Sehra,E. Turner, M. Corbett, M. Donnelly, P. van Rensburg,I. Xenarios, L. Bougueleret, A. Auchincloss, G. Argoud-Puy,K. Axelsen, A. Bairoch, D. Baratin, M. C. Blatter, B. Boeckmann,J. Bolleman, L. Bollondi, E. Boutet, S. B. Quintaje, L. Breuza,A. Bridge, E. deCastro, E. Coudert, I. Cusin, M. Doche,D. Dornevil, S. Duvaud, A. Estreicher, L. Famiglietti,M. Feuermann, S. Gehant, S. Ferro, E. Gasteiger, A. Gateau,V. Gerritsen, A. Gos, N. Gruaz-Gumowski, U. Hinz, C. Hulo,N. Hulo, J. James, S. Jimenez, F. Jungo, T. Kappler, G. Keller,V. Lara, P. Lemereier, D. Lieberherr, X. Martin, P. Masson,M. Moinat, A. Morgat, S. Paesano, I. Pedruzzi, S. Pilbout,S. Poux, M. Pozzato, N. Redaschi, C. Rivoire, B. Roechert,M. Schneider, C. Sigrist, K. Sonesson, S. Staehli, E. Stanley,A. Stutz, S. Sundaram, M. Tognolli, L. Verbregue, A. L. Veuthey,C. H. Wu, C. N. Arighi, L. Arminski, W. C. Barker, C. M. Chen,
Y. X. Chen, P. Dubey, H. Z. Huang, R. Mazumder, P. McGarvey,D. A. Natale, T. G. Natarajan, J. Nchoutmboube, N. V. Roberts,B. E. Suzek, U. Ugochukwu, C. R. Vinayaka, Q. H. Wang,Y. Q. Wang, L. S. Yeh, J. A. Zhang and U. Consortium, NucleicAcids Res., 2011, 39, D214–D219.
14 S. Kachalo, R. R. Zhang, E. Sontag, R. Albert and B. DasGupta,Bioinformatics, 2008, 24, 293–295.
15 J. P. Cobb, M. N. Mindrinos, C. Miller-Graziano, S. E. Calvano,H. V. Baker, W. Xiao, K. Laudanski, B. H. Brownstein,C. M. Elson, D. L. Hayden, D. N. Herndon, S. F. Lowry,R. V. Maier, D. A. Schoenfeld, L. L. Moldawer, R. W. Davis,R. G. Tompkins, P. Bankey, T. Billiar, D. Camp, I. Chaudry,B. Freeman, R. Gamelli, N. Gibran, B. Harbrecht, W. Heagy,D. Heimbach, J. Horton, J. Hunt, J. Lederer, J. Mannick,B. McKinley, J. Minei, E. Moore, F. Moore, R. Munford,A. Nathens, G. O’Keefe, G. Purdue, L. Rahme, D. Remick,M. Sailors, M. Shapiro, G. Silver, R. Smith, G. Stephanopoulos,G. Stormo, M. Toner, S. Warren, M. West, S. Wolfe andV. Young, Proc. Natl. Acad. Sci. U. S. A., 2005, 102, 4801–4806.
16 K. Basso, A. A. Margolin, G. Stolovitzky, U. Klein, R. Dalla-Faveraand A. Califano, Nat. Genet., 2005, 37, 382–390.
17 S. Bornholdt, Science, 2005, 310, 449–451.18 B. Schwanhausser, D. Busse, N. Li, G. Dittmar, J. Schuchhardt,
J. Wolf, W. Chen and M. Selbach, Nature, 2011, 473, 337–342.19 L. Anderson and J. Seilhamer, Electrophoresis, 1997, 18, 533–537.20 A. Pandey and M. Mann, Nature, 2000, 405, 837–846.21 L. G. Alexopoulos, J. Saez-Rodriguez and C. W. Espelin, in Drug
Efficacy, Safety, and Biologics Discovery: Emerging Technologiesand Tools, ed. S. Ekins and J. J. Xu, Wiley, 2009, pp. 29–52.
22 R. M. Ewing, P. Chu, F. Elisma, H. Li, P. Taylor, S. Climie,L. McBroom-Cerajewski, M. D. Robinson, L. O’Connor, M. Li,R. Taylor, M. Dharsee, Y. Ho, A. Heilbut, L. Moore, S. Zhang,O. Ornatsky, Y. V. Bukhman, M. Ethier, Y. Sheng, J. Vasilescu,M. Abu-Farha, J. P. Lambert, H. S. Duewel, Stewart II, B. Kuehl,K. Hogue, K. Colwill, K. Gladwish, B. Muskat, R. Kinach,S. L. Adams, M. F. Moran, G. B. Morin, T. Topaloglou andD. Figeys, Mol. Syst. Biol., 2007, 3, 89.
23 J. F. Rual, K. Venkatesan, T. Hao, T. Hirozane-Kishikawa,A. Dricot, N. Li, G. F. Berriz, F. D. Gibbons, M. Dreze,N. Ayivi-Guedehoussou, N. Klitgord, C. Simon, M. Boxem,S. Milstein, J. Rosenberg, D. S. Goldberg, L. V. Zhang,S. L. Wong, G. Franklin, S. Li, J. S. Albala, J. Lim,C. Fraughton, E. Llamosas, S. Cevik, C. Bex, P. Lamesch,R. S. Sikorski, J. Vandenhaute, H. Y. Zoghbi, A. Smolyar,S. Bosak, R. Sequerra, L. Doucette-Stamm, M. E. Cusick,D. E. Hill, F. P. Roth and M. Vidal, Nature, 2005, 437, 1173–1178.
24 J. V. Olsen, M. Vermeulen, A. Santamaria, C. Kumar,M. L. Miller, L. J. Jensen, F. Gnad, J. Cox, T. S. Jensen,E. A. Nigg, S. Brunak and M. Mann, Sci. Signaling, 2010, 3, ra3.
25 L. G. Alexopoulos, J. Saez-Rodriguez, B. D. Cosgrove,D. A. Lauffenburger and P. K. Sorger, Mol. Cell. Proteomics,2010, 9, 1849–1865.
26 R. J. Prill, D. Marbach, J. Saez-Rodriguez, P. K. Sorger,L. G. Alexopoulos, X. Xue, N. D. Clarke, G. Altan-Bonnet andG. Stolovitzky, PLoS One, 2010, 5, e9202.
27 B. B. Aldridge, J. M. Burke, D. A. Lauffenburger and P. K. Sorger,Nat. Cell Biol., 2006, 8, 1195–1203.
28 J. J. Hughey, T. K. Lee and M. W. Covert,Wiley Interdiscip. Rev.:Syst. Biol. Med., 2010, 2, 194–209.
29 M. K. Morris, J. Saez-Rodriguez, D. C. Clarke, P. K. Sorger andD. A. Lauffenburger, PLoS Comput. Biol., 2011, 7, e1001099.
30 I. Melas, A. Mitsos, D. Messinis, T. Weiss and L. Alexopoulos,BMC Syst. Biol., 2011, 5, 107.
31 K. Y. Yeung and W. L. Ruzzo, Bioinformatics, 2001, 17, 763–774.32 J. C. Liao, R. Boscolo, Y. L. Yang, L. M. Tran, C. Sabatti and
V. P. Roychowdhury, Proc. Natl. Acad. Sci. U. S. A., 2003, 100,15522–15527.
33 R. Albert, B. Dasgupta, R. Dondi, S. Kachalo, E. Sontag,A. Zelikovsky andK.Westbrooks, J. Comput. Biol., 2007, 14, 927–949.
34 A. Funahashi, Y. Matsuoka, A. Jouraku, M. Morohashi,N. Kikuchi and H. Kitano, Proc. IEEE, 2008, 96, 1254–1265.
35 B. B. Aldridge, J. Saez-Rodriguez, J. L. Muhlich, P. K. Sorger andD. A. Lauffenburger, PLoS Comput. Biol., 2009, 5, e1000340.
36 S. Klamt, J. Saez-Rodriguez and E. D. Gilles, BMC Syst. Biol.,2007, 8, 1–2.
Dow
nloa
ded
by M
assa
chus
etts
Ins
titut
e of
Tec
hnol
ogy
on 1
9/04
/201
3 20
:47:
07.
Publ
ishe
d on
23
Mar
ch 2
012
on h
ttp://
pubs
.rsc
.org
| do
i:10.
1039
/C2M
B05
482E
View Article Online

1584 Mol. BioSyst., 2012, 8, 1571–1584 This journal is c The Royal Society of Chemistry 2012
37 J. Saez-Rodriguez, L. Simeoni, J. A. Lindquist, R. Hemenway,U. Bommhardt, B. Arndt, U. U. Haus, R. Weismantel, E. D. Gilles,S. Klamt and B. Schraven, PLoS Comput. Biol., 2007, 3, 1580–1590.
38 M. K. Morris, J. Saez-Rodriguez, P. K. Sorger and D. A.Lauffenburger, Biochemistry, 2010, 49, 3216–3224.
39 J. Thakar, M. Pilione, G. Kirimanjeswara, E. T. Harvill andR. Albert, PLoS Comput. Biol., 2007, 3, 1022–1039.
40 T. Helikar, J. Konvalina, J. Heidel and J. A. Rogers, Proc. Natl.Acad. Sci. U. S. A., 2008, 105, 1913–1918.
41 S. Bornholdt, J. R. Soc., Interface, 2008, 5(Suppl 1), S85–S94.42 L. Calzone, L. Tournier, S. Fourquet, D. Thieffry, B. Zhivotovsky,
E. Barillot and A. Zinovyev, PLoS Comput. Biol., 2010, 6, e1000702.43 C. Chaouiya, A. Naldi and D. Thieffry, Methods Mol. Biol.
(Totowa, N. J.), 2012, 804, 463–479.44 L. Mendoza and I. Xenarios, Theor. Biol. Med. Modell., 2006,
3, 13, DOI: 10.1186/1742-4682-3-13.45 S. Watterson, S. Marshall and P. Ghazal, Drug Discovery Today,
2008, 13, 447–456.46 K. Klemm and S. Bornholdt, Proc. Natl. Acad. Sci. U. S. A., 2005,
102, 18414–18419.47 A. Naldi, J. Carneiro, C. Chaouiya and D. Thieffry, PLoS Comput.
Biol., 2010, 6, e1000912.48 O. Sahin, H. Frohlich, C. Lobke, U. Korf, S. Burmester,
M. Majety, J. Mattern, I. Schupp, C. Chaouiya, D. Thieffry,A. Poustka, S. Wiemann, T. Beissbarth and D. Arlt, BMC Syst.Biol., 2009, 3, 1, DOI: 10.1186/1752-0509-3-1.
49 S. Uhlmann, H. Mannsperger, J. D. Zhang, E. A. Horvat,C. Schmidt, M. Kublbeck, F. Henjes, A. Ward, U. Tschulena,K. Zweig, U. Korf, S. Wiemann and O. Sahin, Mol. Syst. Biol.,2012, 8, 570.
50 J. Saez-Rodriguez, L. G. Alexopoulos, J. Epperlein, R. Samaga,D. A. Lauffenburger, S. Klamt and P. K. Sorger, Mol. Syst. Biol.,2009, 5, 331.
51 A. Mitsos, I. N. Melas, P. Siminelakis, A. D. Chairakaki,J. Saez-Rodriguez and L. G. Alexopoulos, PLoS Comput. Biol.,2009, 5, e1000591.
52 T. S. Weiss, S. Pahernik, I. Scheruebl, K.-W. Jauch andW. E. Thasler, J. Hepatology, 2003, 38, 476–482.
53 J. Saez-Rodriguez, A. Goldsipe, J. Muhlich, L. G. Alexopoulos,B. Millard, D. A. Lauffenburger and P. K. Sorger, Bioinformatics,2008, 24, 840–847.
54 A. Brooke, D. Kendrick and A. Meeraus, GAMS: User’s Guide,The Scientific Press, Redwood City, California, 1988.
55 K. Luckert, F. Gotschel, P. K. Sorger, A. Hecht, T. O. Joosand O. Potz, Mol. Cell. Proteomics, 2011, 10, M110.007377,Epub 4 March 2011.
56 B. Gao, W. I. Jeong and Z. G. Tian, Hepatology, 2008, 47,729–736.
57 F. Zhou, M. N. Ajuebor, P. L. Beck, T. Le, C. M. Hogaboam andM. G. Swain, Hepatology, 2005, 42, 372–380.
58 W. E. Thasler, T. S. Weiss, K. Schillhorn, P.-T. Stoll, B. Irrgangand K.-W. Jauch, Cell Tissue Banking, 2003, 4, 49–56.
Dow
nloa
ded
by M
assa
chus
etts
Ins
titut
e of
Tec
hnol
ogy
on 1
9/04
/201
3 20
:47:
07.
Publ
ishe
d on
23
Mar
ch 2
012
on h
ttp://
pubs
.rsc
.org
| do
i:10.
1039
/C2M
B05
482E
View Article Online