
Effect of injection timing on the exhaust emissions of a diesel engine using diesel–methanol blends
Upload
khangminh22Category
view
3download
0
Constraints on the Operation of a DI Diesel
Engine in Partially-premixed Combustion Mode
Benjamin Keeler, MEng. (Hons)
Thesis submitted to The University of Nottingham
for the degree of Doctor of Philosophy
May 2009
ABSTRACT
CONSTRAINTS ON THE OPERATION OF A DI DIESEL
ENGINE IN PARTIALLY-PREMIXED COMBUSTION MODE
Benjamin Keeler, 2009
Partially-premixed Charge Compression Ignition (PCCI) combustion is defined by
increased levels of premixed charge whilst retaining control over combustion through
injection timing. An experimental investigation has been carried out on a current
generation DI diesel engine, equipped with High Pressure Common Rail (HPCR) fuel
injection equipment and an external Exhaust Gas Recirculation (EGR) system. The aims
of the investigation were to determine the constraints imposed on operating a PCCI
combustion strategy with the aim of simultaneously reducing engine-out net soot and NOx
emissions.
The work was carried out at fully-warm steady-state conditions at engine speeds of 1500
rpm and 1800 rpm, predominantly using a single injection strategy. With a single
injection the Start of Injection (SOI), fuel rail pressure, and rate of EGR have been
examined with a view to realising PCCI combustion. Timing ranges of -20º to +3ºATDC,
rail pressures of 500-1200 bar, and EGR rates of 0-60% have been investigated. The
responses looked at have been engine-out soot, NOx, HC, and CO emissions, fuel
consumption, and combustion noise. It is shown that variation of the parameters has
allowed PCCI combustion to be achieved in a restricted operating region, offering
improvement in the NOx-soot trade-off. This region is limited on the available test engine
by oxygen availability due to the specifications of the turbocharger and EGR systems.
Engine speeds up to 2000 rpm (at 2.5 bar BMEP), and loads of 4.4 bar gross IMEP (at
1500 rpm) have been found to be the limits, beyond which soot and CO emissions rise
excessively.
It is shown that enhancing the mixing time and intensity are both desirable in achieving
PCCI combustion. The net soot reduction mechanism exploited with PCCI combustion
strategies is reducing soot formation to outweigh the reduction in oxidation. Enhancing
the mixing intensity by increasing injection pressure is highly effective at reducing soot
output, but at the expense of brake specific fuel consumption. Increasing the mixing time
can also be effective in reducing soot output, but careful parameter selection is required to
avoid excessive soot output. Retarded or highly advanced injection timings are shown to

reduce net soot output, but both have associated trade-offs and penalties. Retarding
combustion is effective at lowering soot and NOx emissions with low associated noise, but
a fuel economy penalty is paid. Advanced combustion phasing can result in large peak
rates of increase of pressure, which have been shown to correlate well with combustion
noise. Overall soot reductions of up to 97% were achieved, but with associated penalties.
One of the most acceptable reductions of ~90% came at the cost of a 6% increase in fuel
consumption, highlighting that improvements in emissions are achievable with PCCI
strategies with acceptable trade-offs.

ACKNOWLEDGEMENTS
I do not believe the experiences of working within the Engines Research Group at
Nottingham University can be equalled. I feel honoured to have been part of such a
wonderful and lively group and thank all who have contributed to my time here, both
professionally and personally.
I am indebted to, and wish to express my gratitude towards, Professor Paul Shayler for
providing both the opportunity and the support to carry out this PhD. I would not be in the
position I am without his help and encouragement.
One of the reasons this research group has been so successful is the fantastic technical
staff. I would like to thank all those who have assisted me for their patience, and hard
work. Special thanks go to Geoff Fryer, John McGhee, and John Clark. Each is a
character unto their own, and as well as the expertise they have offered, they made the
experience of completing this PhD so much more enjoyable. I would also like to thank all
of my research colleagues, both past and present for their support and humour. You have
all made it a great place to work. Special thanks go to Dave and Nino, although everyone
has contributed in their own unique way.
I wish to thank my family and friends for their love, support, and understanding during this
journey. In particular I thank my parents, my grandparents, and John and Denise. Their
unquestioning support has been magnificent. Finally, I would like to thank my dearest
Becky for her love and support during this time. I know at times I have not been the
easiest to deal with, but I thank her for being there. Without her, this work would never
have come to fruition.
B. Keeler i University of Nottingham
CONTENTS
NOMENCLATURE .........................................................................................................III
ABBREVIATIONS...........................................................................................................VI
CHAPTER 1 INTRODUCTION....................................................................................... 1
1.1 OVERVIEW ............................................................................................................. 11.2 EMISSIONS LEGISLATION ....................................................................................... 21.3 DIESEL COMBUSTION SYSTEMS ............................................................................. 31.4 THESIS OBJECTIVES ............................................................................................... 61.5 LAYOUT OF THESIS ................................................................................................ 7
CHAPTER 2 LITERATURE REVIEW........................................................................... 9
2.1 INTRODUCTION ...................................................................................................... 92.2 PCCI COMBUSTION ............................................................................................... 92.3 CONCEPTUAL COMBUSTION MODELS................................................................... 122.4 FORMATION OF EMISSIONS................................................................................... 132.5 COMBUSTION NOISE ............................................................................................ 172.6 ENGINE OPERATING PARAMETERS WITH CURRENT GENERATION HARDWARE ..... 182.7 CONCLUDING REMARKS ...................................................................................... 22
CHAPTER 3 INTERPRETATION OF PCCI PROCESSES AND DESCRIPTIONOF TEST FACILITIES ................................................................................................... 23
3.1 INTRODUCTION .................................................................................................... 233.2 INTERPRETATION OF PCCI PROCESSES AND DEFINITION OF STUDY ..................... 233.3 ENGINE TEST FACILITIES ..................................................................................... 263.4 ENGINE INSTRUMENTATION ................................................................................. 283.5 DATA ACQUISITION SYSTEMS .............................................................................. 303.6 CONCLUDING REMARKS ...................................................................................... 31
CHAPTER 4 DATA PROCESSING .............................................................................. 32
4.1 INTRODUCTION .................................................................................................... 324.2 EXHAUST GAS WET AND DRY ANALYSIS............................................................. 324.3 CALCULATION OF AFR ........................................................................................ 334.4 VOLUMETRIC AND GRAVIMETRIC ANALYSES....................................................... 344.5 EMISSIONS UNITS AND CONVERSION.................................................................... 354.6 EXHAUST GAS RECIRCULATION ........................................................................... 364.7 EQUIVALENCE RATIOS ......................................................................................... 374.8 COMBUSTION EFFICIENCY.................................................................................... 374.9 IN-CYLINDER ANALYSES ..................................................................................... 374.10 HEAT RELEASE ANALYSIS ................................................................................... 424.11 CONCLUDING REMARKS ...................................................................................... 45
CHAPTER 5 STUDIES OF NOISE, IGNITION DELAY, AND COMBUSTIONPHASING TO SUPPORT ASSESSMENT OF PCCI COMBUSTION ...................... 46
5.1 INTRODUCTION .................................................................................................... 465.2 COMBUSTION NOISE ............................................................................................ 465.3 IGNITION DELAY AND THE START OF COMBUSTION ............................................. 525.4 EFFECT OF COMBUSTION PHASING ON CO, HC, AND FUEL CONSUMPTION .......... 565.5 CONCLUDING REMARKS ...................................................................................... 60
B. Keeler ii University of Nottingham
CHAPTER 6 ENGINE BASELINE PERFORMANCE AND PROTECTION OFPRESSURE TRANSDUCERS AGAINST SOOT ......................................................... 61
6.1 INTRODUCTION .................................................................................................... 616.2 ENGINE BASELINE PERFORMANCE ....................................................................... 616.3 STANDARD TEST POINT ....................................................................................... 636.4 TRANSDUCER ADAPTORS ..................................................................................... 646.5 CONCLUDING REMARKS ...................................................................................... 67
CHAPTER 7 EXHAUST GAS RECIRCULATION..................................................... 68
7.1 INTRODUCTION .................................................................................................... 687.2 TEMPERATURE ..................................................................................................... 687.3 EQUIVALENCE RATIO........................................................................................... 707.4 EFFECT ON EMISSIONS ......................................................................................... 717.5 EFFECT OF EGR ON THE ENGINE AND MAINTENANCE.......................................... 747.6 CONCLUDING REMARKS ...................................................................................... 74
CHAPTER 8 FUEL INJECTION PARAMETERS...................................................... 76
8.1 INTRODUCTION .................................................................................................... 768.2 INJECTION TIMING AT BASELINE FUEL RAIL PRESSURE ....................................... 768.3 POST INJECTIONS.................................................................................................. 798.4 EFFECT OF RAISING FUEL RAIL PRESSURE ........................................................... 808.5 CONCLUDING REMARKS ...................................................................................... 89
CHAPTER 9 OPERATING LIMITS OF PCCI COMBUSTION............................... 91
9.1 INTRODUCTION .................................................................................................... 919.2 LOAD LIMITS OF PCCI COMBUSTION................................................................... 929.3 SPEED LIMITS OF PCCI COMBUSTION .................................................................. 999.4 CONCLUDING REMARKS .................................................................................... 103
CHAPTER 10 DISCUSSION AND CONCLUSIONS ................................................ 105
10.1 DISCUSSION ....................................................................................................... 10510.2 FURTHER WORK ................................................................................................ 11410.3 CONCLUSIONS.................................................................................................... 115
REFERENCES ............................................................................................................... 117
TABLES .......................................................................................................................... 127
FIGURES ........................................................................................................................ 136
APPENDICES................................................................................................................. 209
B. Keeler iii University of Nottingham
NOMENCLATURE
ASOI ºCA After Start of Injection
ATDC ºCA After Top Dead Centre
b - Constant
B m Bore
β - Premixed Fraction (Proportionality Factor)
BMEP bar Brake Mean Effective Pressure
BSx kg/kWh Brake Specific Emissions of Substance x
bsfc kg/kWh Brake Specific Fuel Consumption
c m/s, - Speed of Sound, constant
d m Diameter
pc kJ/kg K Specific, Molar Heat Capacity at Constant Pressure
pc kJ/kmolK Molar Heat Capacity at Constant Pressure
vc kJ/kg K, Specific, Molar Heat Capacity at Constant Volume
vc kJ/kmolK Molar Heat Capacity at Constant Volume
CA º Crank Angle
CO %, kg/kg exh Carbon Monoxide
CO2 %, kg/kg exh Carbon Dioxide
EA kJ/kmol Apparent Activation Energy
EGR %, - Exhaust Gas Recirculation
EIx g/kg fuel Emissions Index of Substance x
EOI ºCA End of Injection
FMEP bar Friction Mean Effective Pressure
H kJ Enthalpy
fh kJ/kmol Molar Enthalpy of Formation
HC ppm, kg/kg exh Unburned Hydrocarbons
H2O %, kg/kg Water
ID ºCA, ms Ignition Delay Period
IMEP bar Indicated Mean Effective Pressure
LHV MJ/kg Lower Heating Value
MAF kg/hr Mass Air Flow-rate
MAP Pa, bar Manifold Absolute Pressure
m kg Mass
m kg/s Mass Flow Rate
Nomenclature
B. Keeler iv University of Nottingham
m kg/kmol Molar Mass
n kmol Number of Moles, polytropic index
N rpm Crankshaft (Engine) Rotational Speed
NO ppm, kg/kg Nitric Oxide
NOx ppm, kg/kg exh Oxides of Nitrogen
nr - Crank Revolutions per Engine Cycle
O2 %, kg/kg exh Oxygen
OH - Hydroxyl Radical
p bar Pressure
P kW Power
PMEP bar Pumping Mean Effective Pressure
Q J Heat
R kJ/kg K Specific Gas Constant
R~
kJ/kmol K Universal Gas Constant
R2 - Coefficient of Determination
ROHR J/º (J/deg) Rate of Heat Release
S m Spray Tip Penetration
t ms Spray Duration
T K, Nm Temperature, Torque
V m3 Volume
W J Work done
xx kg/kg exh Dry Mass Fraction of Substance x
xx ~ %, ppm Dry Mole Fraction of Substance x
xx kg/kg exh Wet Mass Fraction of Substance x
xx~ %, ppm Wet Mole Fraction of Substance x
λ - Excess Air Ratio
γ (Gamma) - Ratio of Specific Heat Capacities (cp/cv)
ψ - Molar N/O ratio
- Air-Fuel Equivalence Ratio
2O - Oxygen-Fuel Equivalence Ratio
η % Efficiency
ρ kg/m3 Density
id º, ms Ignition Delay
Nomenclature
B. Keeler v University of Nottingham
Subscripts
b Brake
bg Burned Gas
c Cylinder, Cycle
comb Combustion
d Displaced
exh Exhaust
f Frequency
fc Fresh Charge
g Gross
ht Heat transfer
i Indicated, intake
n Net
p Passage
rail Fuel Rail
tot Total
vol Volumetric
B. Keeler vi University of Nottingham
ABBREVIATIONS
AFR Air to Fuel Ratio
AFRs Stoichiometric Air to Fuel Ratio
BDC Bottom Dead Centre
BGT Bulk Gas Temperature
CAN Control Area Network
CFD Computational Fluid Dynamics
CI Compression Ignition
CLD Chemiluminescent Detector
CN Cetane Number
CNL Combustion Noise Level
CoV Coefficient of Variation
Cyl Cylinder
DI Direct Injection
DOC Diesel Oxidation Catalyst
DOE Design of Experiments
DPF Diesel Particulate Filter
ECU Electronic Control Unit
EGR Exhaust Gas Recirculation
EOC End of Combustion
EVO Exhaust Valve Opening
FCV Fuel Cell Vehicle
FFT Fast Fourier Transform
FGT Fixed Geometry Turbine
FID Flame Ionisation Device
FIE Fuel Injection Equipment
FSN Filter Smoke Number
FSO Full Scale Output
GFC Gas Filter Correlation
HCCI Homogeneous Charge Compression Ignition
HD Heavy Duty
HP High Pressure
HPCR High Pressure Common Rail
IC Internal Combustion
INCA Integrated Calibration and Acquisition System
ISFC Indicated Specific Fuel Consumption
Abbreviations
B. Keeler vii University of Nottingham
IVC Inlet Valve Closing
LNT Lean NOx Trap
LTC Low Temperature Combustion
MCC Mixing-Controlled Temperature Combustion
MFB Mass Fraction Burned
MK Modulated Kinetics
NEDC New European Drive Cycle
NVH Noise, Vibration, and Harshness
OEM Original Equipment Manufacturer
OFR Oxygen Fuel Ratio
PAH Polycyclic Aromatic Hydrocarbon
PARA Paramagnetic (Oxygen Sensor)
PCCI Partially-premixed Charge Compression Ignition
PM Particulate Matter
PWM Pulse Width Modulation
SOC Start of Combustion
SOF Soluble Organic Fraction
SOI Start of Injection
Stk Stroke
TDC Top Dead Centre
TLA Thermodynamic Loss Angle
UNIBUS UNIform BUlky combustion System
VGT Variable Geometry Turbine
B. Keeler 1 University of Nottingham
CHAPTER 1
INTRODUCTION
1.1 Overview
The subject of this thesis is Partially-premixed Charge Compression Ignition (PCCI)
combustion strategies for compression ignition engines, and in particular what constrains
the implementation of these strategies on diesel engines. PCCI differs from conventional
diesel combustion in that it further promotes fuel-air mixing to limit high temperature
combustion. The mixing that occurs in a conventional diffusion flame is relatively slow,
and premixing fuel and air towards a more homogeneous state before the onset of hot gas
reactions (start of combustion) clearly distinguishes PCCI from conventional diesel
combustion. However, techniques used to improve responses such as lowering soot
frequently result in a deterioration of other responses. As will be discussed, the lower
combustion temperatures and enhanced mixing exploited with PCCI combustion has the
potential to significantly reduce oxides of nitrogen (NOx) and particulate emissions
simultaneously. Exhaust emissions, fuel consumption, and combustion noise responses
are investigated when attempting to employ a PCCI strategy on a multi-cylinder Direct
Injection (DI) diesel engine of current generation hardware.
Interest in PCCI is the result of concerns over climate change and the role of emissions
from the transport sector in this. The accumulation of evidence [1] that climate change is
occurring and that carbon dioxide (CO2) emissions from burning fossil fuels is responsible
has focused attention on the problem and in particular the contribution from automotive
vehicles. There is currently no restriction on CO2 emissions but there are vehicle taxation
incentives to use low emissions vehicles and European targets for average CO2 emissions
per kilometre for manufacturers [2]. In recent years ever more stringent legislation has
been imposed on vehicle emissions with an aim to reduce their polluting effect. In Europe
legislation has been through the Euro Stage system, the most recent of which was Euro
Stage IV in 2005, but with Euro V coming into force in 2009 [3]. In order to meet future
limits on emissions, automotive manufacturers are seeking improvements to aftertreatment
systems such as Lean NOx Traps (LNT), catalytic converters, and particulate filters.
Naturally manufacturers aim to minimise the costs of these aftertreatment systems so are
developing existing technologies as well as new approaches to comply with legislation.
Reduction of engine-out emissions is vital to achieving this.
Chapter 1 Introduction
B. Keeler 2 University of Nottingham
Within this chapter the emissions legislation that is driving the industry to reduce
pollutants is summarised, and a short history of diesel combustion systems presented.
Conventional and premixed charge combustion systems are introduced, before some of the
alternatives to diesel engines and future industry technology are reviewed. The chapter
concludes with the objectives of this thesis, and finally a description of the overall thesis
layout.
1.2 Emissions Legislation
PCCI strategies offer simultaneous reductions in NOx and soot emissions which are being
heavily targeted by legislation. Research into effective strategies to reduce these species is
required to meet future targets. Since 1992 new cars and light vehicles have been required
to meet emission standards known as “Euro” standards. Each successive Euro standard
(starting at Euro Stage I in 1992 to Stage IV in 2005) has become stricter and limited the
polluting species from vehicle tailpipes more aggressively. Particulates and NOx are
considered to pose the most serious environmental and health problems and Euro V due to
come into force later in 2009 would see an 80% reduction in particulate matter and a 28%
reduction in oxides of nitrogen relative to Euro IV limits. To comply with Euro V and VI,
diesel engine cars would have to be fitted with particulate filters, a potentially expensive
aftertreatment system. Table 1.1 summarises the evolution of the Euro emission standards
for diesel engine cars [3]. The data for PM and NOx emissions are illustrated in Figure 1.1
as these are currently the species being targeted most heavily and those of greatest
importance to this research work.
In 1997 the Kyoto Protocol to the United Nations Framework Convention on Climate
Change was adopted with the aim of reducing the emission of Greenhouse gases deemed
responsible for climate change. Between 2008 and 2012 industrialized nations have
committed to reduce greenhouse gas emissions by an average of 5% compared to 1990
levels [4]. Included within the targeted gases is CO2, one of the main products of
combustion of hydrocarbon fuels. To encourage consumers to reduce CO2 emissions, or
their so called “carbon footprint”, since 2001 Vehicle Excise Duty for new cars in the UK
has been determined by their CO2 output and fuel type [5]. Together with the substantial
level of tax on automotive fuels imposed by the government, diesel powered vehicles are
becoming ever more attractive due to their excellent fuel economy and improved
drivability. Diesel engine vehicles offer lower fuel consumption and thus reduced CO2
output compared to gasoline vehicles for a number of important reasons. The relative
contributions are highly dependent upon the operating conditions (duty cycle), but are here
listed in approximate order of their relative contribution at low power part load (urban
driving):
Chapter 1 Introduction
B. Keeler 3 University of Nottingham
Diesel engines conventionally operate without throttling the intake air, reducing
pumping losses.
Although the calorific value of diesel is actually slightly lower than that of
gasoline it has a greater density, resulting in a higher volumetric energy density.
Fuel is sold per litre and fuel consumption is commonly stated in mpg or l/km,
both favouring diesel over gasoline.
Diesel engines generally have higher compression ratios, increasing the ideal
thermal efficiency [6].
Diesel engines operate with higher gearing and lower engine speed. Although
friction tends to be higher than for gasoline engines, for a given power output, less
power is dissipated as parasitic losses due to the lower engine speed.
1.3 Diesel Combustion Systems
1.3.1 Introduction to Diesel Engines
The history of diesel engines can be traced back to the late 19th century when Rudolf
Diesel embarked on the development of an internal combustion engine that ignited the fuel
through compression. Since then there have been many major developments in diesel
engine technology, with notable improvements in fuel injection over the past 15 years.
The first Common-Rail (CR) injection system was introduced in 1997 paving the way for
future improvements. The opportunities made available by the introduction of High
Pressure Common Rail (HPCR) electronic controlled fuel injection systems has allowed
much greater flexibility in injection strategy and engine operation due to fuel pressure
generation and injection being separate events. The high injection pressures and capability
of multiple injections made possible with the use of the HPCR has brought about
improvements in engine emissions and noise, whilst maintaining the excellent fuel
consumption and energy efficiencies of the compression ignition engine [6].
Fiscal incentives and changing public opinion of diesel engines as the source of power for
their vehicles has led to a dramatic increase in the market share of diesel car sales in
Western Europe. Back in 1999 diesel cars accounted for 28.4% of all new cars sold,
however, by 2006 diesel engine cars had outsold those fuelled by gasoline for the first
time. As Figure 1.2 illustrates, the growing current market share of diesel engine cars
continues to increase and was 52.2% in the first half of 2007 [7]. By the end of 2007 this
figure had reached 53.3% [8].
Chapter 1 Introduction
B. Keeler 4 University of Nottingham
1.3.2 Conventional Compression Ignition Combustion
Current “conventional” diesel combustion strategies typically involve a pre-injection
(pilot) and a main injection, although some strategies employ more than one pilot injection
and split-main injections. Modest intake boost pressures and EGR rates are employed,
with typical operating ranges of modern diesel engines with conventional strategies
approximately 600-4500 rpm and up to 20 bar Brake Mean Effective Pressure (BMEP)
load output. The phases that characterise diesel combustion are shown in Figure 1.3 and
discussed below.
Following the injection and combustion of the pilot, the main fuel quantity is injected at
point “A”. The time between injection and Start of Combustion (SOC) is the Ignition
Delay (ID) period (A-B) where fuel and air mixes before the premixed combustion phase
(B-C). The fuel that has mixed with air to within flammability limits during the ignition
delay period burns in this phase. Combustion within this phase typically has high rates of
heat release with short duration combustion. The mixing-controlled combustion (MCC) or
diffusion burning phase (C-D) follows once the fuel burned during the premixed phase has
been consumed. Mixing of fuel and air determines the rate of combustion and as such a
lower rate of heat release over a longer crank angle period is detected. Late combustion
completes the combustion process with low rates of heat release (D-) [9]. As will be
discussed, the length of the ignition delay period and the ratio of premixed-to-mixing
controlled combustion have great influence on emissions formation and output.
The use of a pilot injection promotes the ignition of the main injection event by increasing
in-cylinder temperatures and pressures. The shortened ignition delay of the main injection
increases the ratio of diffusion-to-premixed burning, reducing rates of heat release and
combustion noise. As will be discussed in the Literature Review that follows this
Introduction, increased diffusion burning results in higher soot output and as such new
approaches must be developed to reduce these engine-out emissions.
1.3.3 Partially-premixed Charge Compression Ignition and Low Temperature
Combustion Systems
In 1988 Kamimoto and Bae [10] presented an equivalence ratio-temperature (Φ-T) plot
which has been the basis for many studies on premixed and low temperature combustion.
The authors demonstrated that soot and NOx are formed within confined regions in the Φ-
T plane (here referring to local conditions). Fuel-air equivalence ratio is discussed in
Chapter 4, but describes how lean or rich a mixture is. High values of Φ relate to rich
mixtures, and Φ=1 corresponds to a stoichiometric mixture. Figure 1.4 and other Φ-T
maps presented within this thesis include contours based on documented findings of
Chapter 1 Introduction
B. Keeler 5 University of Nottingham
Kitamura et al. [11], who examined the effect of fuel composition on soot yield. The
contours indicate the relative concentrations of the two emission formations. A soot
formation peninsula is evident at Φ>2 and between temperatures of 1600-2500 K, whilst
NOx formation occurs at temperatures greater than 2200 K and Φ<2. Avoiding these
formation regions is thus fundamental to reducing soot and NOx production. A version of
Φ-T diagram reproduced from Akihama et al. [12] is shown in Figure 1.4, highlighting
previously proposed regions to exploit to reduce soot and NOx formation.
Over recent years low temperature diesel combustion systems have become the focus of
attention for many researchers aiming to exploit the potential benefits of limiting
combustion temperatures so as to avoid the production of NOx and soot. Improved
premixing reduces the amount of slow MCC which is responsible for the majority of soot
production that occurs at the high-temperature, fuel-rich spray core. More details on MCC
and the associated soot and NO active regions are presented in Chapter 2.
A distinction can be made between these low temperature systems, differentiated by
whether or not control over combustion phasing is coupled to the fuel injection event [13].
In the case of Homogeneous Charge Compression Ignition (HCCI) combustion,
combustion phasing is dominated by chemical reaction kinetics and decoupled from
injection timing [13] and as such there is a lack of control over combustion. Highly
advanced injection timings are used to create a homogenous mixture of fuel and air prior
to ignition. The premixed combustion that occurs avoids the high temperature diffusion
burning and thus limits combustion temperatures which are required for NOx formation,
whilst maintaining low local equivalence ratios (Φ<2) avoids the soot formation peninsula.
Unfortunately HCCI combustion systems are subject to several problems that limit their
practical application. The low volatility of diesel makes vaporisation of the fuel more
difficult when injected early in the cycle into lower cylinder pressure and temperature [14].
HCCI systems also suffer from wall wetting and over-leaning problems, a consequence of
the early injection, giving rise to high unburned hydrocarbon (HC) emissions. Moreover,
the rapid rates of heat releases that occur with the almost instantaneous combustion result
in high rates of cylinder pressure rise and excessive peak pressures.
In the case of Partially-premixed Charge Compression Ignition (PCCI) control over
combustion with injection strategy is retained and a greater percentage of the total charge
is premixed prior to ignition relative to conventional diesel combustion. Various injection
strategies are available for PCCI combustion, but commonly advanced injection timings
are used in conjunction with high rates of EGR to reduce NOx and increase mixing time.
As with HCCI combustion the mixing of fuel and air and ignition with PCCI are
Chapter 1 Introduction
B. Keeler 6 University of Nottingham
independent processes, but there is insufficient time available to allow complete premixing
of the fuel-air mixture before the start of combustion and as such many regions rich of
stoichiometric exist (partial stratification). The combustion process takes place at
generally higher premixed-to-diffusion burning ratios (but not homogeneous) and lower
temperature than a conventional diesel combustion process [15] as indicated in Figure 1.5.
However, a significant proportion of the heat can be released in a mixing-controlled
process, resulting in high peak combustion temperatures [13]. Although both charge
mixing systems have the advantage of lower soot and NOx emissions, HCCI combustion
has the major disadvantage of being harder to control. Some proposed PCCI strategies
have been found to be particularly effective and show great promise for future
developments. A short review of three such works is provided in the Literature Review.
1.3.4 Alternatives to Diesel Engines and Future Research Focus
As well as developing diesel engine technology and strategies such as PCCI and HCCI, the
automotive industry is also exploring many alternatives. Table 1.2 offers a short review of
four significant research interests, including the advantages offered, how they are
achieved, and current obstacles to their implementation. However, despite the potential
offered by these research fields, diesel powered vehicles are still increasing in market
share and warrant further research into new approaches to reduce emissions.
1.4 Thesis Objectives
The next generation of emissions targets require considerable reductions in NOx and soot
output. The advantages offered by Compression Ignition (CI) systems and HPCR fuel
injection equipment (FIE) will have to be further exploited in conjunction with EGR
systems to minimise engine-out emissions. Current combustion strategies involve pilot
and main injection events with the use of cooled EGR. However, to reduce soot output
new approaches must be taken to ensure legislative targets are met. The main challenge
can be summarised as simultaneously reducing soot and NOx emissions without creating
excessive levels of combustion noise, whilst maintaining the excellent engine efficiency
and fuel consumption that are currently offered by modern diesel engines.
Unfortunately measures often taken to reduce one emission species typically result in an
increase of another. A classic example is the use of EGR to reduce NOx emissions leading
to increases in HC and soot output. The reduction in oxygen availability and combustion
temperature together with an increase in equivalence ratio results in trade-offs requiring
careful parameter optimisation. However, potential combustion regimes have been
proposed that can achieve reductions in soot and NOx simultaneously, but these frequently
suffer from a number of issues that restrict their practical applicability. One such approach
Chapter 1 Introduction
B. Keeler 7 University of Nottingham
that has attracted much attention is that of low temperature combustion (LTC) with higher
levels of premixed charge. By reducing local equivalence ratios and limiting combustion
temperatures it is possible to greatly reduce the formation of soot and NOx as described
above, but problems arise concerning control of the combustion, excessive combustion
noise, and reduced combustion and fuel efficiencies [16]. Future challenges for the next
generation of diesel engines include minimising emission responses without incurring too
high a fuel consumption or other penalty.
A limited number of proposed partial solutions have been documented in the literature.
The approaches taken by many researchers are currently limited to laboratory
environments and may be impractical for real world applications in vehicles. The purpose
of the work contained within this thesis is to develop the understanding of what
approaches are successful and the constraints encountered in adapting a modern DI diesel
engine to operate a PCCI strategy whilst, importantly, maintaining control over
combustion through injection strategy. Ultimately the main aim is to simultaneously
reduce soot and NOx emissions without incurring excessive penalties. Specifically, the
output of soot, NOx, HC and CO emissions, fuel consumption and combustion noise level
will be considered. In the available literature the effect on combustion noise level is rarely
considered in detail, with qualitative statements about the likelihood of excessive noise
being a potential issue more common, if mentioned at all. An exception is a paper co-
authored by the author of this thesis [17]. Due to the nature of increased premixed
combustion, rapid rates of heat release can result in high combustion noise levels,
potentially limiting its application. Within this thesis, implications as to any required
engine maintenance and instrumentation are also presented. The author’s work also lends
itself to being further developed to meet specific targets through optimised calibration,
which is a potential future project.
1.5 Layout of Thesis
Following this introduction a review of pertinent literature regarding PCCI and low
temperature combustion, emission formation, together with current generation hardware
are given in Chapter 2. An interpretation of the processes involved with PCCI combustion
and a review of the test facilities and sensors is given in Chapter 3, which details the
engine rig setup and the data acquisition systems. The experimental facilities allowed the
desired measurements to be taken and recorded before being processed as explained in
Chapter 4. Included are the calculation of AFR, emissions calculations and the units used
within this thesis, calculation of temperatures, and heat release analysis, the latter of which
is invaluable in understanding the combustion characteristics. The experimental
Chapter 1 Introduction
B. Keeler 8 University of Nottingham
conditions presented are representative of those encountered during NEDC operation. The
data presented are concentrated at 1500 rpm and 1800 rpm.
The factors and strategies relating to combustion noise are investigated in Chapter 5
together with the influence and determination of start of combustion and the ignition
delay. Collection and assessment of data to analyse the engine baseline performance are
evaluated in Chapter 6. This was carried out to establish the overall behaviour of the
engine under ECU control to establish any limitations that may be encountered. Whilst
carrying out this investigation a problem with one of the sensors was encountered and a
new pressure transducer adaptor designed. This is discussed in detail, together with
analysis of a standard test point, used to monitor repeatability and identify errors.
Chapters 7 and 8 respectively deal with the effect of EGR and injection strategies on
emissions, the determinants of their production and output, the trade-offs that exist, and
what can be achieved using different strategies. The findings are then exploited in Chapter
9 to investigate the speed and load limits of PCCI combustion, which clearly highlights the
challenges of reducing soot and NOx without incurring significant penalties. Finally in
Chapter 10 the final discussions and conclusions are presented together with proposed
further work.
B. Keeler 9 University of Nottingham
CHAPTER 2
LITERATURE REVIEW
2.1 Introduction
This review is separated into seven sections and begins with an introduction into PCCI
combustion, how it differs from conventional combustion, and an overview of practical
applications. Mixing-controlled combustion plays a highly important role in emission
formation and a well accepted conceptual model is reviewed with an emphasis placed on
the development of the fuel jet, local mixture conditions, and their consequences. The
chapter then moves on to review the formation of emissions with particular attention paid
to NOx and soot as the simultaneous reduction of these is one of the main aims of the
research. Combustion noise is reviewed before current generation hardware and the
potential they offer in engine development are covered. Finally, conclusions drawn from
the available literature are given.
2.2 PCCI Combustion
2.2.1 Introduction to PCCI Combustion
Various combustion strategies have been proposed to avoid the soot and NOx formation
regions as shown in Figures 1.4 and 1.5. As was introduced in Chapter 1, PCCI
combustion is defined by increased amounts of premixed charge relative to conventional
combustion, whilst importantly retaining control over combustion through injection
strategy. Several different acronyms have been used in the literature when investigating
PCCI combustion, but this is the notation that will be used explicitly throughout this
thesis. Figure 1.5 adapted from [18] expands upon Figure 1.4 to demonstrate the regions
encompassed during conventional and PCCI combustion. The figure demonstrates the
effect of increasing the rate of EGR and improving mixing as the larger conventional
combustion area shifts and shrinks to the PCCI combustion area. Overall local
equivalence ratios are more uniform and temperatures lower than with conventional
combustion.
The summary of operating regions depicted in Figure 1.5 provides a useful overview of the
challenge faced. However, computational works have been published that further develop
the understanding of combustion progression within the Φ-T plane. Figure 2.1 illustrates
example time histories of two combustion events, one resulting in high soot output, the

Chapter 2 Literature Review
B. Keeler 10 University of Nottingham
other low soot. The time period included ranges from 20% to 80% Mass Fraction Burned
(MFB) and summarises the Computational Fluid Dynamics (CFD) findings documented in
[12]. The shaded areas represent regions that encompass the majority of gas cells from the
3D-CFD calculation, but do not give density information. Instead they are drawn here to
describe the combustion progression for the two cases. Although initially starting with
similar profiles, as the combustion event progresses two key differences are seen to be the
maximum temperatures reached and the distribution of equivalence ratios. By 60% MFB
(third diagrams from top) the high smoke condition significantly encroaches the soot
formation peninsula, whereas the smokeless case merely approaches it. As more fuel is
burned (bottom diagrams) some of the gas cells of the smokeless case do indeed impinge
the soot formation region, but the lower temperatures help minimise the formation. In
contrast a much greater proportion of the high smoke condition gas cells fall in the soot
formation region, with higher peak temperatures. The overall result is clearly greater
overall formation of soot in the high smoke case, but the diagrams do not give any
indication as to the relative oxidation processes. Nevertheless, net soot output is likely to
be significantly higher for the high soot formation case, which highlights the need to
reduce formation. This is exploited in PCCI strategies.
Despite the charge not being completely premixed (homogeneous), the same principles are
applied to obtain low emissions as with HCCI [19]. The factors used to manipulate
combustion conditions towards the PCCI mode of operation are primarily the injection
strategy and level of EGR. The effect of increasing EGR is to lower combustion
temperatures and reduce oxygen availability. The decrease in oxygen concentration and
combustion temperatures reduces the rate of oxidation of species including soot, HC and
CO [20]. Injection timings with PCCI are not as advanced as in HCCI, and in some cases
are in fact retarded after TDC [21, 22]. When injection is advanced, long ignition delays
enhance premixing and lower flame temperatures due to the formation of overall lean
mixtures, as described with HCCI operation [23], whilst retarded timings look to exploit
the lower temperatures in the expansion stroke. The level of EGR used is higher than in
conventional operation, but must be selected in conjunction with injection timing to
maintain desired combustion phasing. Unfortunately advancing injection timing to
compensate for the increase in ignition delay with EGR to allow nearer optimum
combustion phasing is likely to result in increased soot output as demonstrated by work
published by the author in Ref. [17].
2.2.2 Practical Implementations of PCCI
Although many studies have been carried out on premixed charge combustion, only a
limited number of practical operation modes have been demonstrated in real engines [24].
Chapter 2 Literature Review
B. Keeler 11 University of Nottingham
Three proposed strategies are discussed below together with their limitations and engine
demands.
The Modulated Kinetics (MK) concept developed by Kimura et al. [21, 22, 25] is a
promising combustion mode that utilises increased EGR rates, increased injection
pressure, high swirl rates, and retarded injection (close to or after TDC) to lower
combustion temperatures and limit the formation of NOx and soot. In-cylinder gas
temperatures are relatively low for retarded combustion phasings, and as such thermal
decomposition of the diesel fuel is inhibited, which reduces soot production. A key
feature of the MK concept is that the ignition delay must be longer than the injection
duration so that all of the fuel is injected prior to ignition, allowing better premixing. This
places an upper limit on the quantity of fuel deliverable at realistically achievable fuel rail
pressures, thus limiting load output. Nevertheless, the second generation MK systems
expanded the operating range and can now meet the criteria set by the Japanese 10-15
mode urban drive cycle for light-duty vehicles [24]. Unfortunately not all production
engines are capable of generating the swirl ratios required, and the available test engine
used in this thesis was not equipped with working port deactivation to generate swirl. The
degree to which the temperature of EGR gases and intake charge has to be reduced is also
a major consideration in the application of MK, and an appropriate compression ratio must
be used to avoid early ignition.
The UNIform BUlky combustion System (UNIBUS) proposed by Toyota involves the
combination of an early injection (for example -36 to -54°ATDC) followed by a later
trigger injection (for example +5°ATDC) into the produced cold flame. NOx emissions
below 70 ppm with simultaneous near zero smoke have been reported [26]. Injecting the
main fuel quantity into a cool flame promotes the evaporation of the fuel, but the
temperatures experienced are not high enough for thermal cracking of the hydrocarbon
fuel which would result in increased soot output [24]. The UNIBUS mode of operation
has been used to cover half the speed and load map [26], but is ineffective for high intake
temperatures and inappropriate compression ratios since combustion must be avoided
during injection to avoid MCC [27]. Precise control over injection timing is required to
prevent the fuel spray impinging on the cylinder walls, and boost pressure must be
sufficiently high to limit rates of pressure rise [26].
Akihama et al. [12] demonstrated that smokeless combustion is not limited to lean
equivalence ratios when they presented a comprehensive Φ-T map based on 3D-CFD
analysis, detailing the soot and NOx production regions. As illustrated by Figure 1.4,
HCCI represents only a small region of the operating map, with the possibility of running
Chapter 2 Literature Review
B. Keeler 12 University of Nottingham
with very high local equivalence ratios achievable if temperatures are kept below the 1600
K required for soot formation. In their work large amounts of cooled EGR (up to 60%)
were used to restrict temperatures inside the fuel jet to below the soot formation threshold.
However, the high EGR requirement limits power output. The PCCI combustion regime is
therefore not limited to extremely lean mixtures and control over combustion phasing and
rate can be maintained, both clear practical benefits over current HCCI operation.
However, load output is a major hindrance to this combustion strategy due to the levels of
dilution required to limit temperatures [12], and combustion noise can also be excessive
for inappropriately phased combustion.
2.3 Conceptual Combustion Models
The conceptual model of mixing-controlled combustion proposed by Dec [28] and added
to by Flynn et al. [29] has been widely referred to as a description of the early stages of
mixing-controlled combustion which identifies the regions of initial soot formation, fuel-
rich premixed burn, thermal NO production and soot oxidation. Figure 2.2 illustrates an
idealised sequence of schematics for the conceptual model prior to the end of injection.
The cold fuel jet is seen to initially penetrate the combustion chamber as liquid fuel (1.0º-
2.0ºASOI). Downstream of the injector air is entrained into the fuel jet which begins to
vaporise and from 2.0ºASOI onwards a vapour region begins to develop. By 3.0ºASOI the
liquid fuel has reached its maximum penetration with hot air vaporizing all fuel beyond
this location.
The vapour phase continues to propagate downstream of the liquid jet, with a head vortex
emerging at approximately 4.5ºASOI. By 5.0ºASOI temperatures in the plume reach ~750
K and fuel breakdown begins, leading to the formation of large Polycyclic Aromatic
Hydrocarbons (PAH) across the leading portion of the jet. Temperatures increase to ~825
K as these reactions continue and more hot air is entrained, increasing the rates of
oxidation reactions with temperatures in the range 1600-1700 K reached. The penetrating
jet causes these products of rich combustion to be pushed aside before being re-entrained
into the jet. Importantly these re-entrained species mostly comprise carbon monoxide
(CO) and hydrocarbons derived from the fuel that act as the building blocks of
particulates.
By 6.0ºASOI small soot particles are seen to form over a large region of the jet cross
section that arise from the first part of the fuel-rich premixed burn. From 6.5ºASOI Figure
2.2 shows the presence of a thin diffusion flame on the jet periphery between the fuel-rich
premixed burn products and the surrounding fresh air where temperatures of ~2700 K are
reached [28, 29]. The last part of the premixed burn is represented by the schematic at
Chapter 2 Literature Review
B. Keeler 13 University of Nottingham
8.0ºASOI. The jet continues to grow and soot concentration increases, most significantly
in the leading edge of the head vortex, whilst the diffusion flame continues as a thin
reaction zone on the boundary between the jet and surrounding air. By 9.0ºASOI the
remainder of the premixed air is consumed and combustion evolves to purely MCC.
The final schematic in part (a) of Figure 2.2 indicates the head vortex has become well
formed contains a much larger soot concentration (which by this point are also of larger
size). Soot particle size remains small in the central part of the jet except in the head
vortex, whilst the soot formed originating from the diffusion flame continue to be present
along the jet periphery. Beyond the 10.0ºASOI timeframe, a MCC quasi-steady reacting
fuel jet occurs as illustrated by Figure 2.2 part (b) which continues to the end of injection.
The overall shape and soot distribution do not change significantly, except that particle
size within the head vortex increase. Labelled are the production zones of various species,
together with associated temperatures.
Although mixing-controlled combustion remains important in PCCI combustion, the
combustion that occurs in PCCI regimes is not conventional and as such the conceptual
model above has been updated to include features of early-injection low temperature
combustion [16], as shown by Figure 2.3. Fuel penetrates further into the cylinder than in
the conventional conceptual model (note the different scales), a potential source for
increased HC emissions should wall wetting occur. The first stage fuel ignition
contributes to the vaporisation of the liquid fuel, whilst the enhanced mixing results in
significantly lower soot formation in the second-stage combustion. The fuel-rich regions
in the head of the jet are the location of soot formation [16]. This updated conceptual
model is for early-injection low-temperature diesel combustion (LTC), but other LTC
injection strategies exist whose features may differ to those noted above.
2.4 Formation of Emissions
2.4.1 Soot
Particulate Matter (PM) is an umbrella term that can be sub-divided. Eastwood [30]
separates particulate matter (PM) into three categories; Insoluble Fraction, Soluble
Organic Fraction (SOF), and Sulphates. Soot is generally accepted to be the insoluble
fraction of particulate matter, whilst the latter two categories are described as volatiles
since their physical state is strongly dependent on temperature. A more detailed summary
of these can be found in [31]. Soot forms early in the combustion process when local fuel
rich areas exist, whereas soot oxidation occurs later when more air is entrained into the
fuel spray [32]. The main path of carbon molecules in diesel combustion is to react with
Chapter 2 Literature Review
B. Keeler 14 University of Nottingham
oxygen to form carbon monoxide and, later, carbon dioxide. Thus the molecular
carbon/oxygen ratio in the reactants is the determinant in the formation of solid carbon, the
critical ratio being unity [9]. When the ratio is greater than one, some of the carbon
molecules will fail to bond with oxygen, forming solid carbon. It is therefore crucial to
keep local fuel-air equivalence ratios low to avoid this formation. Soot is known to form
instantly as very small condensation nuclei. Surface growth and the coalescence of nuclei
lead to the formation of primary particles called spherules, which have a consistent
diameter of approximately 30 nm. The spherules can undergo one of two processes;
agglomeration into larger particles, or oxidation, effectively a surface burning process
which provides gas phase products [32]. Heywood [9] summarises the processes leading
to the production of soot particles as; Nucleation, surface growth, agglomeration, and
finally adsorption and condensation.
In experimental work, soot output in the exhaust is considered as the net result of two
competing processes; soot formation and soot oxidation [33, 34]. Mixing-controlled
combustion discussed in the previous section is deemed responsible for the majority of the
soot formation where fuel pyrolysis takes place in poor oxygen availability (high local Φ).
Combustion propagation in the MCC phase is dependent on fuel-air mixing, with the lack
of oxygen and slower burning providing suitable conditions for soot formation. The
review above in section 2.3 also details formation locations of soot and the corresponding
soot distribution pattern within the spray, shown schematically in Figure 2.2. A reduction
in the relative proportion of fuel burned in the MCC phase and subsequent increase in
proportion of premixed burning forms the basis of PCCI strategies to reduce soot
formation.
2.4.2 Oxides of Nitrogen
Emissions of NOx are being strongly targeted by legislation as they contribute to the
formation of acid rain and photochemical smog [6]. Almost all production of NO occurs
during mixing-controlled combustion. Both diesel and gasoline engines produce high
levels of NOx, but in gasoline engines these can be removed with the use of 3-way
catalysts which are unfortunately unsuitable for diesel applications due to the excess air
[19].
The most widely accepted mechanism for the thermal formation of nitric oxide (NO) is
that of Zeldovich [35], described by the equations below [9]. High combustion
temperatures cause oxygen molecules to dissociate to atomic oxygen, which initiates nitric
oxide formation chain reactions. The availability of oxygen and the in-cylinder
temperatures are key variables in the formation of nitric oxide.
Chapter 2 Literature Review
B. Keeler 15 University of Nottingham
2O N NO N (2.1)
2N O NO O (2.2)
N OH NO H (2.3)
Although NO dominates the composition of NOx, up to 10-30% of the total oxides of
nitrogen can be composed of nitrogen dioxide (NO2), generated by the conversion
mechanism [9]:
2 2NO HO NO OH (2.4)
Heywood [9] explains that the critical time period for the formation of oxides of nitrogen
in compression ignition engines is between the start of combustion and the occurrence of
peak cylinder pressure when the burned gas temperatures are highest. As temperatures
cool due to volume expansion and mixing of hot gases with cooler burned gas, the
equilibrium reactions are quenched and the decomposition of NO stopped. The mixing
with cooler burned gases does not occur with gasoline engines which are assumed to have
essentially uniform mixture. As such the freezing process occurs more rapidly in diesel
combustion and much less NO decomposition occurs [9].
The conceptual model of diesel combustion described previously and depicted in Figure
2.2 indicates the location of NO formation on the flame periphery. High temperatures
result from combustion within the diffusion flame since conditions are near stoichiometric.
These conditions are ideal for NO production by the thermal mechanism, with formation
occurring on the lean side of the jet periphery (where oxygen is present) [28]. However,
the flame front covers a small area and this thermal mechanism is relatively slow. A major
proportion of total NO formation may therefore occur during the later stages of the
diffusion burning or in hot-gas reactions after combustion terminates. Compression of
previously burned mixture to higher temperatures increases the NO formation rate.
Despite lower peak temperatures during this time, residence time for NO formation is
appreciably longer and the amount of gas involved can be much greater [28]. The
intensity of the premixed burn is significant in MCC since air temperature increases with
premixed intensity, raising the temperature in the diffusion flame, resulting in higher NO
production [17, 36]. As will be discussed, exhaust gas recirculation (EGR) is a technique
frequently used to reduce oxides of nitrogen.
2.4.3 Unburned Hydrocarbons and Carbon Monoxide
Unburned hydrocarbon (HC) emissions are compounds derived from the fuel. HC
emissions contribute to the formation of smog and may include photochemically reactive
species as well as carcinogens [37]. Their output is highly dependent on oxygen
availability and as such emissions of unburned hydrocarbons are generally lower in
Chapter 2 Literature Review
B. Keeler 16 University of Nottingham
concentration than gasoline engines because diesel engines operate with excess air (lean)
[9]. Potential sources of HC emissions include [38]:
Fuel impingement on combustion cylinder walls with insufficient air motion to
evaporate it before the end of combustion
Fuel that becomes trapped in crevices surrounded by cool metal surfaces
Fuel injected and mixed beyond the limit of flammability (over-lean)
Fuel that is injected late in the cycle, such as with post injections
Evaporation or entrainment of lubrication oil from cylinder walls
Quenching of combustion flame on cylinder walls
Evaporation of fuel trapped in the injector sac nozzle [39]
Fuel that is insufficiently mixed with air to combust (over-rich) [40]
Near complete oxidation of HCs has been found to require temperatures of at least ~1200
K [41]. This temperature has been reported to be independent of original fuel type, which
is intuitive since the final reaction chemistry is unaffected by the original fuel structure
[42].
Carbon Monoxide (CO) is a product of incomplete combustion, formed when hydrocarbon
species are not completely oxidised to carbon dioxide. It is a colourless and odourless gas
highly toxic to human beings and other life forms. As with unburned hydrocarbons there
are several potential sources of CO emissions which include over lean mixture regions that
burn slowly and over rich regions that have insufficient oxygen availability for complete
combustion [43]. High CO have been found to occur in lean regions in the temperature
range 800<T<1400 K as well as in rich mixtures at all temperatures high enough to oxidise
the source fuel [41]. In hydrocarbon flames the dominant reactions for oxidation of carbon
monoxide are [42]:
2CO OH CO H (2.5)
2 2CO HO CO OH (2.6)
2 2CO O CO O (2.7)
Of particular importance in the oxidation of CO is the amount of OH present. Sjöberg and
Dec [42] demonstrated OH radical concentration increases exponentially with peak charge
temperature. They explain that oxidation of CO is dominated by the reaction described in
Equation 2.5, and as such the oxidation process is highly sensitive to temperature. A
minimum temperature of ~1500 K was found to be necessary for near complete CO
oxidation, a figure consistent with [41]. A weak dependence on engine speed has also
previously been reported, although the required minimum temperature remained 1500 K
±50 K in the range 600-2400 rpm [44]. The speed affects the dwell time at peak
temperature, but the process is dominated by the sensitivity of OH radical production to
Chapter 2 Literature Review
B. Keeler 17 University of Nottingham
temperature. As with HCs, the original fuel compound does not affect the final oxidation
process and was deemed independent of fuel type and autoignition characteristics [42], but
the required local equivalence ratio varies in accordance with fuel in order to attain the
required threshold temperature. Complete oxidation of HCs occurs at lower temperature
than that of CO [41], allowing CO to remain in an unoxidised state, leading to higher CO
than HC emissions.
Improvements in engine-out emissions combined with the use of highly effective
aftertreatment systems such as Diesel Oxidation Catalysts (DOC) have significantly
reduced tailpipe emissions of HC and CO. However, future emissions legislative targets
require significant reductions in NOx and soot emissions. The use of higher levels of EGR
and increased equivalence ratios together with other in-cylinder measures to reduce the
formation of these species could have an adverse affect on HC and CO output, especially
as oxidation catalysts require a minimum “light-off” temperature in the region of 190-
200°C for effective catalytic conversion [45].
2.5 Combustion Noise
Noise emitted by a vehicle has been subject to mandatory standards for nearly 40 years
[46]. As Figure 2.4 illustrates, noise limits have been reduced from 82 dB(A) in 1976 to
the current level of 74 dB(A) [46], but there is currently no specific legislation relating to
the noise attributed to combustion from a motor vehicle. However, it is unlikely that
Combustion Noise Levels (CNL) greater than 85 dB(A) will be acceptable to engine
manufacturers [17] since extra noise dampening will be required for passenger comfort,
incurring increased cost, weight, and taking up further space within the engine bay. The
contributions to overall engine noise are summarised in the flow chart in Figure 2.5.
Combustion noise is the noise radiated in response to the compression and combustion
pressure development. It is highly dependent upon the rate of increase of cylinder pressure
following ignition, the peak cylinder pressure, and the compression ratio [38]. As shown
in Figure 2.5, it can be separated into direct and indirect sources [47] and flow noise.
Direct combustion noise is attributed to gas forces acting on the structure assuming that
the piston velocity in the axial and transverse directions is zero. This noise is transmitted
through the cylinder head, upper part of the engine block, and via the crank train, main
bearings and crankcase. Indirect combustion noise is the result of gas forces causing
components to move through their clearances, causing impacts. An example is that of
piston slap where the cold piston is forced into the cylinder wall [47].
Chapter 2 Literature Review
B. Keeler 18 University of Nottingham
High rates of change of in-cylinder pressure have been shown to have a major influence in
the combustion noise generated [17]. Rapid rates of heat release are a possible side effect
of PCCI combustion since a greater proportion of the heat is released in a shorter period of
time compared with conventional combustion. Higher levels of combustion noise are
therefore a potential issue. Combustion noise can be reduced by retarding combustion
relative to TDC, incurring a thermal efficiency penalty. The fuel consumption penalty
becomes significant. Employing a pilot injection can be effective at decreasing the
ignition delay of the main injection and thus reducing the rate of heat release and
consequently in-cylinder pressure rise. This is a highly effective method for containing
combustion noise, but as will be discussed in later sections, comes at the expense of soot
output. Moreover, increasing boost pressure has also been reported as being effective in
decreasing the rate of change of pressure due to increasing heat capacity [26, 48].
2.6 Engine Operating Parameters with Current Generation
Hardware
2.6.1 Intake Charge Conditions
Boosting the intake air is beneficial in achieving higher load outputs and maintaining
equivalence ratios sufficiently low to avoid increasing soot output and deteriorating
combustion efficiency [27]. Increasing intake pressure, either with the use of a
turbocharger driven off the exhaust system or a supercharger driven from the crankshaft
enables a greater mass of air and EGR into the cylinder, increasing the output capability of
the engine [49]. Increasing boost pressure can shorten ignition delay, but can allow higher
levels of EGR and more retarded injection timings [50], both of which can be exploited for
PCCI combustion. The greater flow of air into the engine can also increase the overall
heat capacity of the charge, which has been shown to be beneficial in reducing rates of
pressure rise in the cylinder [26, 48].
Variable Geometry Turbine (VGT) turbochargers are widely employed to improve the
efficiency of the exhaust gas turbocharging process. The energy transfer from exhaust gas
to turbine impeller can be regulated by moveable nozzle guide vanes, which change the
gas flow area and angle of incidence onto the turbine [51]. Figure 2.6 illustrates a
schematic of a VGT turbocharger with two settings, one for high turbocharger pressure,
and the other for low. At low-speed low-load conditions when exhaust gas energy is low,
little work is transferred to the turbocharger. However, although varying the turbocharger
vanes will have limited effect on boost pressure, it can strongly influence exhaust manifold
pressure, the driving force of EGR flow. Thus, by moving the VGT vanes as well as the
EGR valves, better control over EGR flow rate is possible. Hawley et al. [52] reported a
Chapter 2 Literature Review
B. Keeler 19 University of Nottingham
reduction in NOx levels of up to 45% using VGT combined with EGR, compared to Fixed
Geometry Turbine (FGT) levels, without compromising fuel consumption or smoke.
Exploiting the highly coupled nature of the VGT turbocharger and external EGR systems
is vital to reach performance targets. With FGTs there is limited useable boost below
engine speeds of around 2000 rpm, and at higher speeds the pressure ratio would be too
great so has to be limited with a wastegate to maintain constant pressure. VGT
turbochargers are more flexible in operation than conventional wastegated turbochargers
and as well as boosting the power density of the engine, VGT turbocharging can
potentially improve brake specific fuel consumption (bsfc) by reducing pumping losses.
By optimising boost pressure, especially at part load where pumping losses play an
important role on fuel economy, significant bsfc improvements are possible [53].
Exhaust Gas Recirculation (EGR) is a technique commonly used to control NOx formation
and emission in both diesel and gasoline engines. For a pipe of fixed dimensions, external
EGR flow is determined by the driving force between the exhaust and inlet manifolds
( exh ip p ). This pressure difference is governed by the EGR valve and VGT vane
positions (where appropriate), but a limit exists as to the level of EGR that can be achieved
without the addition of a system that maintains a pressure difference between the two
manifolds. This is generally achieved by throttling the intake air, which reduces the fresh
air inlet manifold pressure allowing more EGR flow due to the higher exhaust-side
pressure due to the effects of the turbocharger [52].
EGR is essential to achieve simultaneous low soot and NOx output in PCCI combustion
without prohibitively high fuel consumption penalties due to poor combustion phasing.
However, lower temperatures can cause deterioration in combustion efficiency (especially
at low load). Recycled exhaust gas acts as a diluent. Increasing the level of EGR reduces
the oxygen concentration (dilution effect) and increases thermal capacity of the charge as
oxygen-containing fresh air is displaced by burned gas products (thermal effect) [54-56].
In particular carbon dioxide (CO2) and water (H2O) have high heat capacities and act to
lower in-cylinder temperatures and slow the rate of heat release [13]. The reduction in
peak temperature is beneficial in reducing NOx [57] and soot formation since the EGR rate
influences the path in the Φ-T plane through changes in the flame temperature and ignition
[13]. However, Aceves and Flowers [58] found that in low temperature diesel combustion
soot precursors are low at low EGR, but increase rapidly as EGR is raised. After reaching
a maximum they decreased rapidly to near zero as the charge mixture approached
stoichiometric. It was also found that reducing the rate of mixing and increasing
temperature tend to increase the equivalence ratio at ignition, considerably increasing soot
precursor production. Several studies including [12, 59, 60] have demonstrated a
Chapter 2 Literature Review
B. Keeler 20 University of Nottingham
reduction in soot output once the EGR rate exceeds a threshold. At this point departure
from conventional EGR-soot and NOx-soot trade-offs is realised, allowing the
simultaneous reduction of both emissions.
Although EGR gases are cooled prior to reaching the inlet manifold, intake temperature
rises with EGR fraction as cooler fresh air is displaced. Reducing intake temperatures has
been shown to be beneficial in reducing NOx and soot emissions. When developing the
MK regime, Kimura et al. [22] reported a decrease in intake gas temperature from 117°C
to 67°C resulted in a reduction in the order of 90% in soot emission, and around 30% for
NOx. Ishikawa et al. [61] investigated the effect of heat exchanger efficiency of an EGR
cooler on combustion by improving cooler heat rejection from 2.8kW to 7.3kW. The
temperature in the intake manifold decreased from 110°C to 36°C, increasing in the charge
density and oxygen concentration. This resulted in a reduction of soot emissions due to
minimising the high equivalence ratio zone, Φ>2, but at the expense of HC emissions.
Limiting flame temperatures with high rates of EGR contained NOx output. Overall, faster
reaction rates due to increased oxygen availability were deemed to be offset by slower
reaction rates due to cooler temperatures and increased thermal capacity, leading to no
overall change in heat release or NOx.
2.6.2 Fuel Injection Equipment and Operating Parameters
A schematic of a typical High Pressure Common Rail (HPCR) system is shown in Figure
2.7. In a HPCR fuel injection system pressure generation and fuel injection are separate
events, allowing highly flexible injection strategies at much higher pressures [6]. Fuel is
pressurised by a High Pressure (HP) pump before being delivered to a common-rail
accumulator, which helps reduce the variation in the high pressure of the fuel [62]. The
fuel is then delivered to the individual injectors via short rigid pipes, with the injection
event controlled by the ECU. Modern HPCR systems can achieve injection pressures of
up to 2000 bar and up to 6 injections per cycle per cylinder, allowing significant
reductions in engine-out emissions, noise and fuel consumption [63].
The latest generation common-rail Fuel Injection Equipment (FIE) incorporates piezo-
electric controlled injectors that are capable of extremely rapid switching and as such the
possibility of shorter injection durations, very small injection quantities, and multiple
injections per cycle [6]. Piezo injectors exploit the piezoelectric properties of crystals to
deform when a voltage is applied. This change in structure is transmitted hydraulically to
the rapidly switching nozzle needle, acting much faster than conventional solenoid
injectors. However, the HPCR system is subject to certain limitations. The major
disadvantage from a technical point of view is that of rail interactions. When an injector
Chapter 2 Literature Review
B. Keeler 21 University of Nottingham
nozzle opens to inject fuel into the cylinder, a pressure wave travels upstream of the
injector into the common-rail, resulting in pressure oscillations [62]. The subsequent
injection may then be affected by this pressure wave, resulted in an incorrect fuel delivery
in that injection event [64]. These injection-to-injection variations are most severe
following a main injection since a large fuel quantity is usually delivered. The pressure
wave from a pilot or other low quantity injection is normally small in amplitude and as
such does not cause the same problem [62].
The Start of Injection (SOI) influences the temperature during the ignition delay period,
the peak flame temperature reached, as well as the cooling of the in-cylinder charge during
the latter part of the combustion process as volume expansion takes place [13]. Retarding
injection timing is effective at lowering combustion temperatures, which reduces thermal
decomposition and thus soot formation [20, 24]. Retarding injection timing from -7° to
+5°ATDC is a key modification in the MK mode of operation, resulting in reduced NOx
but increased HC emissions [25]. Retarding timing is also effective at prolonging ignition
delay, allowing more mixing time. Another approach for reducing soot output is
advancing SOI for a single injection, which can be effective in increasing the ignition
delay and providing more time for premixing. However, combustion must be phased so as
to avoid increased NOx, HC and CO emissions and increased fuel consumption, but soot
output is highly dependent upon injection timing [17]. With a two injection strategy,
Kook and Bae [14] found advancing the main injection provided sufficient time for
homogeneous premixing, but that if the main injection was too advanced the vaporization
of the diesel fuel was reduced due to the lower initial air temperature, increasing wall
wetting. The second (smaller) injection timing was optimised to promote ignition for the
given air temperature, resulting in lower emissions.
As well as investigating injection timings, injection pressure is also the focus of attention.
For a fixed fuel injection quantity, increasing the injection pressure shortens the injection
duration. Increasing injection pressure is associated with reduced soot emissions [23, 57]
due to better atomisation and enhanced air entrainment, reducing formation. The higher
associated jet velocities are advantageous in achieving a premixed state between fuel and
air [14]. Increasing injection pressure has been found to promote early soot formation near
to the injector, but to reduce soot concentration more rapidly later in the cycle, reducing
residence time for soot formation [34]. The improvement has been attributed to improved
oxidation of formed soot since higher OH radicals have been predicted with higher
pressures [23], the concentration of which is known to have a significant influence in the
oxidation process of soot [9].
Chapter 2 Literature Review
B. Keeler 22 University of Nottingham
However, the ignition delay can be reduced and combustion is commonly advanced with
increased injection pressure. This increases rates of heat release (faster burning) with
shorter associated combustion duration and high peak pressures, which can lead to
increased NOx emissions [59]. In one study NOx emissions increased considerably,
especially at part load and low speed [65]. It is also worthwhile to note here that within
the available literature the effect on combustion noise has mainly been hypothesised but
not investigated directly. Fuel consumption has also been reported to decrease with
increased injection pressure in some studies [15, 57] as combustion phasing is advanced
and combustion duration shortened. The fuel’s energy is therefore released at a more
efficient combustion phasing and overcomes the higher parasitic losses associated with the
generation of higher pressures [59], although this was reported in a heavy duty engine.
Another concern is that of over-penetration of the spray leading to increased HC and soot
emissions. Spray penetration, S, has been correlated to the following expression [66]:
b
cfuel cylinder
cylinder
p pS A d t
p
(2.8)
Where d is the nozzle hole diameter, A, b and c are constants, and t is the spray duration.
Higher fuel pressure can therefore result in greater spray penetration, potentially resulting
in increased HC and soot emissions should wall wetting occur.
2.7 Concluding Remarks
Within this chapter the concept of PCCI combustion has been reviewed together with
important emissions formation mechanisms and current generation engine hardware.
PCCI combustion potentially offers a solution to simultaneously reducing NOx and soot
emissions by reducing formation of both species. The operating regions that are exploited
to achieve this have been introduced and a description given to where PCCI combustion
falls relative to other operating strategies. Some of the most successful PCCI strategies
have been reviewed, but problems exist with each of the proposals, meaning their
implementation on all diesel engines may not be possible. The determination of engine-
out emissions is highly complex, and reviews into mechanisms and conceptual models to
explain the formation and oxidation of important species have been given. The operation
of current generation hardware, including VGT turbochargers, EGR systems and HPCR
FIE were included since control over intake conditions, mixture preparation, and injection
capabilities are fundamental to PCCI strategies. Chapter 3 will expand upon the PCCI
processes and give details on the test equipment used during the experimental
investigations.
B. Keeler 23 University of Nottingham
CHAPTER 3
INTERPRETATION OF PCCI PROCESSES
AND DESCRIPTION OF TEST FACILITIES
3.1 Introduction
The purpose of this chapter is to examine the available combustion strategies to achieve
the goal of simultaneously reducing soot and NOx emissions, and summarise the
experimental facilities available. The first part of the chapter presents interpretations of
conventional and PCCI processes with the use of Φ-T maps, which help to define the
study. The requirements for the engine test facility thus required control over the injection
strategy and EGR rate in order to assess the relative benefits and hindrances to adapting
the combustion strategy from its baseline calibration.
The second part of the chapter describes the test engine and experimental facilities used
within this thesis. Instrumentation was required to monitor various pressures,
temperatures, speeds, as well as exhaust emissions. The engine had previously been used
for a former project and had been installed on the test bed and instrumented with many of
the required sensors, which included thermocouples, pressure transducers, speed sensors,
and exhaust analysers. In particular, in-cylinder pressure data and the composition of
exhaust species were required to a high degree of accuracy and repeatability. Additional
instrumentation installed included the smoke and combustion noise meters which will be
discussed within this chapter. Short reviews of the specifications of the dynamometer,
cooling, EGR and fuel systems are presented before an overview of the engine sensors and
emissions measurement equipment are given. The data acquisition equipment and control
of the ECU and engine parameters are detailed before concluding remarks are offered.
3.2 Interpretation of PCCI Processes and Definition of Study
Reducing soot formation is a key mechanism to reducing net soot output with PCCI
strategies. Avoidance of the soot formation peninsula in the Φ-T plane is required to
achieve this, but a number of combustion paths are available. The use of EGR to reduce
temperatures is vital to PCCI combustion strategies. Figure 3.1 illustrates the maximum
temperatures that could be obtained at a given equivalence ratio for complete combustion.
The contours on the left diagram, reproduced from Refs [13, 67], represent the maximum
Chapter 3 Interpretation of PCCI Processes and Description of Test Facilities
B. Keeler 24 University of Nottingham
temperatures that can be achieved for fuel mixed with ambient air initially at 1000 K for
varying levels of ambient oxygen concentration. The effect of increasing dilution on the
combustion paths is clear. As the ambient oxygen concentration decreases, the maximum
temperature obtainable at a specified equivalence ratio decreases. This is a key
mechanism in the adaptation to PCCI combustion. However, the paths illustrated in
Figure 3.1 are for equilibrium mixture temperatures, and in reality a distribution of fuel-air
mixtures and temperatures will be present. Therefore ensuring the overall ambient oxygen
concentration is below 15% does not guarantee that the soot and NOx formation regions
will be avoided. However, the degree to which the overall oxygen availability is reduced
does place a limit on load output for complete combustion. The right diagram, adapted
from [60], represents the maximum achievable temperatures of fuel packets in the jet core
with an ambient oxygen concentration of 10% for different initial ambient temperatures.
Increasing ambient gas temperature clearly raises the core temperature at a given
equivalence ratio, implying that control over ambient temperature can be used to aid the
avoidance of the soot and NOx formation regions.
Developing upon this, four proposed combustion paths are described below together with
the factors used to achieve them. Paths taken by typical fuel parcels through the Φ-T plane
under conventional, PCCI, and HCCI combustion are illustrated in Figure 3.2, adapted
from [13]. A distribution of equivalence ratios will actually be present along the paths and
therefore even though the arrows may not pass through either formation region, some
formation of that species may occur depending on the spread of the distribution. The
conceptual diagrams help to explain the mechanisms to achieve reduced soot and NOx
emissions and should be viewed whilst reading the following strategy summaries, which
are based on the proposed findings of Kook et al. [13]. Conventional combustion will be
discussed first, before a short summary given to HCCI. More detail is given to two
different PCCI strategies, comparing and contrasting how they achieve the emission
reductions. The proposed paths offer insight into the causes for soot and NOx formation,
but say nothing about other responses such as fuel consumption, combustion noise, or
combustion efficiency. These will be investigated within this thesis.
Conventional combustion is characterised by adiabatic mixing processes followed by rapid
premixed combustion. During the premixed burn, rates of heat release are high and little
additional mixing takes place. The charge is insufficiently mixed prior to the onset of
premixed combustion to avoid the soot formation peninsula. Once the premixed fuel has
been consumed, the speed of combustion is limited by the rate of mixing between fuel and
air. This mixing-controlled combustion significantly increases the peak temperatures
encountered, which follow the peak combustion temperature curve referred to in Figure
Chapter 3 Interpretation of PCCI Processes and Description of Test Facilities
B. Keeler 25 University of Nottingham
3.1. The increase in temperature and reduction in local equivalence ratio as mixing
continues causes the fuel packets to enter the NOx formation region, before cooling as the
cylinder volume increases. Both soot and NOx emissions are therefore generated from
conventional combustion [13].
With the proposed pathway for HCCI combustion mixing of the fuel and air is essentially
complete prior to the onset of combustion. The fuel is burned within the premixed phase
with no MCC to consider and both formation regions are avoided. Two PCCI strategies
are summarised below with reference to the path taken. Both strategies use increased
levels of dilution to limit temperatures and exploit high levels of premixing to avoid soot
formation.
The first proposed paths for PCCI combustion is for retarded injection timing (around
TDC) and moderate-high levels of EGR (~15% O2 concentration). Start of combustion
occurs in the expansion stroke and as such in-cylinder temperatures during the ignition
delay period are lower than for conventional combustion. This provides more time for
mixing and helps generate lower local equivalence ratios at SOC compared with
conventional combustion. The late phasing and expanding volume cools the charge and
combined with the diluent molecules limits the peak temperatures encountered. Soot
formation is expected to be greatest at the end of premixed burning as this is when the path
is closest to the soot peninsula. Mixing-controlled combustion follows the premixed
phase, which increases the temperature and reduces local equivalence ratios. Dilution and
the retarded phasing and slower mixing rates during MCC allow combustion temperatures
to be limited and are highly effective at avoiding the NOx formation region. Modulated
Kinetics introduced in section 2.2 is an example combustion strategy that exploits this path
[13].
The second proposed PCCI combustion path is for advanced injection timing (around -
20ºATDC) and high levels of EGR (~10% O2 concentration). The higher level of dilution
compared with the retarded strategy described above could be expected to result in a
higher local equivalence ratio at SOC. However, the extended ignition delay allows more
time for mixing and the two cases have similar local equivalence ratios at ignition,
although the advanced strategy remains higher. Should the temperature increase
sufficiently the path would still pass through the soot formation peninsula. The premixed
phase finishes close to TDC and temperatures increase, following the peak flame
temperature curve until volume expansion cools the charge. Large amounts of air must be
mixed with the partially-burned fuel to achieve low equivalence ratios due to the low
oxygen availability. It can therefore be difficult to complete the mixing processes before
Chapter 3 Interpretation of PCCI Processes and Description of Test Facilities
B. Keeler 26 University of Nottingham
in-cylinder temperatures decrease below the ~1500 K threshold required for complete
rapid oxidation of CO [41, 42], resulting in reduced combustion efficiency. It is
worthwhile to note that the equivalence ratio at which the mixture temperature reaches that
required for the start of significant heat release increases with the level of dilution due to
the extra heat capacity of diluent molecules [13]. This effect can be seen in Figure 3.2
whereby the equivalence ratio at the end of mixing for the advanced (more dilute) case is
higher than that of the retarded (less dilute) path. This has repercussions when attempting
to avoid the soot formation region.
The above discussion underlines the aims of PCCI combustion strategies to avoid the
formation regions of both soot and NOx. However, it is apparent that there is not one
single solution to the problem and many variables must be considered. The factors
manipulated to adapt towards a PCCI operating strategy within this thesis are the injection
strategy and the rate of EGR. A review of the available test facilities used within these
investigations is detailed below and will conclude this chapter.
3.3 Engine Test Facilities
The experimental studies were carried out on a batch 2 (pre-production) Lion V6 2.7l DI
diesel engine, the production version of which is present in the S-Type, XF and XJ Series
Jaguar cars. Table 3.1 summarises the engine specification. The engine was installed on a
test bed with instrumentation, together with data acquisition systems and an integrated rig
control system. The engine was equipped with twin-VGT turbochargers which adjust the
exhaust-gas pressure acting on the turbine in response to the required turbocharger
pressure, an intercooler, and had an external EGR system. This enabled the engine to
provide a specified maximum power of 206 bhp (152 kW) at 4000 rpm, and maximum
torque of 435 Nm at 1900 rpm. Intercooling reduced the temperature of the compressed
intake air, thus increasing its density and oxygen availability for combustion, resulting in
improved efficiency of the cylinder charge process. The engine had a high HPCR direct
injection fuel system including ‘multiple-point’ injection. The fuel quantity provided by
each of the six Siemens VDO Automotive piezo actuated injectors allowed highly accurate
fuel metering of up to six injections per cycle per cylinder at up to 1650 bar fuel rail
pressure. The orifice diameters of 140 microns provided an extremely fine spray of diesel
fuel to help create a uniform fuel-air mixture.
A manual gearbox supplied by Jaguar was run in top gear corresponding to a ratio of 1:1,
connecting the engine to the dynamometer, which in turn simulated the load conditions.
The Froude AG250 eddy current engine dynamometer had a maximum power of 250kW, a
speed limit of 6000 rpm, and maximum torque of 1200 Nm. The casing housed twin
Chapter 3 Interpretation of PCCI Processes and Description of Test Facilities
B. Keeler 27 University of Nottingham
magnetizing coils that produce a retarding controllable magnetic field that resisted the
applied torque. A precision strain gauge load cell provided a measurement of total input
torque to an accuracy of ±0.25% of full rated torque of dynamometer. The dynamometer
had low inertia and could measure speed to an accuracy of ±1 rpm [68]. Calibration was
carried out using weights loaded at a known distance from the centre of rotation.
Two independent cooling systems were used to dissipate heat generated by the test rig.
The first, illustrated in Figure 3.3, was used to dissipate the heat generated by the
dynamometer, engine cooling system, and the EGR coolers. The engine radiator was
replaced with a heat exchanger to reduce the engine coolant temperature. The cooling
lines were connected to a Carter air blast cooler with heat load of 530kW, consisting of a
fin coil (tube bundle) with the hot coolant flowing inside the tubes and the cooling
(ambient) air perpendicular over the tubes. The second cooling system was used for the
intake intercooler and fuel coolers, and used cold water from the mains supply. The high
rail pressure caused the temperature of the fuel to increase and had to be reduced in the
injector overflow return line. An electronically controlled valve was used to regulate the
water flow though the intercooler. The valve opening controlled the water flow to achieve
a post-compressor air inlet temperature of 35ºC.
Exhaust gas was diverted from the exhaust system via an external circuit incorporating
EGR valves actuated by stepper motors with positional feedback (one per bank) and
returned to the intake side of the engine. Prior to re-entry into the intake manifold the
recycled exhaust gases passed through production shell-and-tube heat exchangers. The
engine induced air flow was measured by hot-wire anemometer Mass Air Flow (MAF)
sensors, monitored by the engine and data acquisition systems. Due to known deviation of
MAF sensor readings air flow to the engine was calculated using an oxygen balance, an
explanation of which is detailed in Chapter 4. The exhaust system was modified to enable
safe extraction of the exhaust gases from the laboratory and the Diesel Particulate Filter
(DPF) removed to prevent it clogging with particulates and requiring regeneration.
An AVL 733S Fuel Balance was used to measure the fuel flow over a 120s period to allow
an accurate value to be recorded. It operated on a gravimetric measuring principle and
allowed for a direct measurement of the fuel mass consumed. Its 1800g capacity was
sufficient for a continuous measurement and allowed consumptions of 0-150 kg/h to be
measured to an accuracy of 0.1%. Figure 3.4 illustrates the setup of the fuel circuit,
including the integration of the AVL Fuel Balance.
Chapter 3 Interpretation of PCCI Processes and Description of Test Facilities
B. Keeler 28 University of Nottingham
3.4 Engine Instrumentation
The positions of pressure, temperature, and speed sensors are shown on the schematic in
Figure 3.5. In-cylinder pressure could be measured in five of the six cylinders using three
Optrand D322 fibre optic (two in bank A and one in bank B), and two Kistler 6055B (one
per bank) pressure transducers. A dummy glow-plug was installed in the remaining sixth
cylinder. Each Kistler transducer was connected to a Kistler 5011 charge amplifier,
consisting of a high-gain inverting voltage amplifier with a MOSFET as its input to
achieve high insulation resistance [69]. The transducers were installed in the glow plug
ports and replaced the glow plugs which were surplus to requirement since cold starts were
not carried out below laboratory ambient temperatures. As will be discussed in following
chapters, high levels of soot were encountered during engine testing, both under
conventional combustion strategy and when exploring the field of PCCI combustion. This
gave rise to clogging of the adaptors in which the pressure transducers were mounted. The
impact on the pressure measurements and subsequent post processing of the data such as
IMEP was significant. An investigation was carried out to evaluate four designs of
adaptor to provide protection against thermal shock and fouling. This investigation is
discussed in detail in Chapter 6.
All other engine pressures were measured using Kulite PT 2054 (2000 Series) pressure
transducers. These low power transducers had an accuracy of 0.01% and resolution of
0.001% [70]. Pressure measurements were taken at various positions throughout the
intake, exhaust, aftertreatment, and EGR sections of the engine. K-Type thermocouples
calibrated in a thermostatic oil bath were located throughout the intake, exhaust,
aftertreatment, and EGR sections of the engine. Temperatures of oil and coolant at various
stages were also measured with these thermocouples. The turbochargers on each bank of
the engine were fitted with Micro-Epsilon turboSPEED 135 sensors, with a speed range of
500-400000 rpm and an output 0-10 V with resolution of 0.1% FSO [71]. These speeds
were monitored to check the operation of the turbochargers.
Combustion Noise Level (CNL) was measured using an AVL 450 combustion noise
meter. The device enabled outputs representative of the overall noise level to be given in
dB or an A-weighted sound pressure level in dB(A) by changing the position of an
electrical jumper. The use of such a weighting has previously been found to correlate well
with subjective assessment of loudness or noisiness for different types of sound [72].
Computation of an overall noise level involves analysis of multiple frequencies that are
weighted prior to output of the best approximation of the noise loudness. Noise levels are
given in decibels, a logarithmic scale whereby an increase in 10 dB signifies a doubling in
loudness [73]. Within this thesis CNL will be given in dB(A).
Chapter 3 Interpretation of PCCI Processes and Description of Test Facilities
B. Keeler 29 University of Nottingham
To monitor the crankshaft position, a Hohner W4D91R (W-series) incremental optical
encoder was connected to the crankshaft via a mounting disk. It was suitable for speeds up
to 6000 rpm and had two outputs; one pulse every half degree of crankshaft rotation to
trigger the data acquisition system, and one pulse every complete revolution (every 360º).
The encoder TDC marker was set to match TDC in cylinder 1 on bank A using an AVL
428 TDC capacitance probe. Using this sensor the metallic piston acted as a capacitance
plate such that the voltage output was inversely proportional to the distance between the
probe and the piston. Therefore TDC is known to be the location of the stationary point
from the probe voltage output. Any difference (error) between the shaft encoder position
and true TDC was then accounted for in the online dSPACE model.
A MaxSys 900 Series Model 964D Emission System was used to analyse the engine
emissions by taking a continuous sample of exhaust gas. It comprised a main rack
containing the analysers, cooler/dryer, distribution oven and internal heating line
controllers. A smaller rack containing the Model 352 Duel Stream Heated Pre-filter/pump
unit and external heated line controllers and associated equipment was also incorporated
into the system. The CO2 analyser for measuring levels in the intake manifold was
contained in an additional smaller rack. Figure 3.6 illustrates the setup of the emissions
analysers. Sample exhaust gas was drawn from downstream of the turbocharger through a
heated sample line maintained at 190ºC to prevent water condensation. The sample passed
to the Model 352 unit where it was passed through a disposable filter before passing into
the Model 340 Distribution Oven. The sample was then split into two streams, one hot
and the other cold. One stream was heated and fed to the HC and NOx analysers. The
second stream passed to the Model 203SM cooler/dryer to remove the water vapour before
the CO, CO2, and O2 analysers. The specifications of the five analysers are given in Table
3.2, which includes the specification of the regulated span gases required for calibration of
each of the analysers. The analysers were calibrated for both zero and span gases before
every testing session and the engine would be run periodically at a standard test condition
to ensure consistency of the data and check for errors before the required testing was
carried out. Analysis of the standard test condition is given in Chapter 6.
An AVL 415S Variable Sampling Smoke Meter was used for measurement of the soot
content of the exhaust gas. The variable sampling volume allowed even very low soot
concentrations in the exhaust to be measured. The smoke meter measured the exhaust gas
volume that passed through the filter paper in a measuring pipe and calculated the effective
length. It determined the paper blackening with an optical reflectometer head, and
subsequently determined the soot content in the gas. The Filter Smoke Number (FSN) as
Chapter 3 Interpretation of PCCI Processes and Description of Test Facilities
B. Keeler 30 University of Nottingham
defined in ISO 10054, soot concentration (mg/m3), and pollution level (%) could be
output.
3.5 Data Acquisition Systems
A dSPACE modular hardware system was used for data acquisition from the engine
sensors and for engine control. It consisted of a single processor, three A/D boards, and a
Control Area Network (CAN) board. A schematic showing the individual inputs and
outputs of the individual boards, together with how they were integrated into the test rig
are shown in Figure 3.7. Table 3.3 details the specifications of the A/D boards.
The DS1005 PPC board featured a Motorola PowerPC 750 processor running at 480MHz
and provided the real-time calculation power to the system and the interface to the I/O
boards and to the host PC. The peripheral high speed bus interface to the dSPACE I/O
boards allowed for transfer rates up to 20 Mbytes/s. Two DS2003 A/D boards specifically
designed for the implementation of high-speed multivariable digital controllers were used
for the analogue sensors. They incorporated two separate 16-bit A/D converters with 32
channels per board and were programmable over the range 4-16bit. The input voltage
range for the channels was ±5V or ±10V. Figure 3.7 denotes the inputs and outputs of the
two boards. A DS2001 high-speed A/D board was used for the in-cylinder pressure
transducers. The data acquisition system was triggered every half-degree of crankshaft
rotation by the optical shaft encoder. This board had five parallel A/D channels,
programmable resolution (4, 8, 12, or 16-bit resolution).
The DS4302 CAN Interface board featured four CAN channels and connected the modular
dSPACE system to the BUS. It allowed the dSPACE system to participate in CAN-bus
traffic without the need for additional interface electronics. The ECU monitored the
measurements of the engine sensors and controlled the required actuators. Monitored
values included temperatures, crankshaft and camshaft angular positions, pressures, and
feedback from engine actuators. With the use of look-up tables and stored maps the ECU
output the required signal to the engine actuators. For example, if the EGR rate required is
deemed to be 30% at a particular condition, the ECU sends signals to the VGT vane
actuators and EGR valves to facilitate this result. The position of the EGR valves is
monitored with positional feedback, allowing the parameters to be continuously updated as
required. ECU measurement signals were monitored and recorded using the PC based
software package INCA (Integrated Calibration and Acquisition System), connected to the
PC via CAN link. Engine sensor measurements such as fuel rail pressure, injection
duration, MAF, intake temperature and pressure, and coolant temperature could be
recorded. INCA also allowed certain calibration variables to be overridden, including; the
Chapter 3 Interpretation of PCCI Processes and Description of Test Facilities
B. Keeler 31 University of Nottingham
injection timing (SOI) and quantities of up to six injections per cylinder per cycle together
with their respective injection quantities, EGR valve positions, VGT vane positions, fuel
rail pressure, and the ability to disable fuel injection events individually. A screenshot of
the INCA user-interface with selected features labelled is given in Figure 3.8.
3.6 Concluding Remarks
This chapter has introduced the processes that are characteristic of conventional and PCCI
combustion strategies, and has reviewed the test facilities used within this thesis. The use
of Φ-T maps is invaluable in understanding the combustion paths taken. The use of EGR
to dilute the intake charge will be discussed in detail later in the thesis, but its effect on
potential combustion paths through its influence on oxygen concentration and ambient gas
temperatures is highly important in PCCI combustion strategies. The test facilities were
required to provide control over injection strategy and EGR rate to assess the adaptation
from baseline calibration. The hardware and equipment used to measure and record the
desired responses is the same for both strategies has been reviewed. The processing of the
acquired data will be discussed in the following chapter.
B. Keeler 32 University of Nottingham
CHAPTER 4
DATA PROCESSING
4.1 Introduction
In this chapter the processing of the data recorded from the engine is documented. Firstly
the water content removed from the exhaust has to be accounted for when processing the
emissions data. The details of the procedure employed are given before the air-to-fuel
ratio (AFR) calculation is presented, after which volumetric and gravimetric analyses of
the emissions data are detailed. A section is provided on the conversion between different
emissions units and why they may be used. The definitions and calculations of EGR rate
and equivalence ratios are presented together with the calculation of combustion
efficiency. The definition of mean effective pressures used to analyse engine load
behaviour are given, before moving onto the determination of bulk-gas temperature from
in-cylinder pressure measurements. The assumptions and procedure for calculating a
constant pressure adiabatic temperature based on an equilibrium combustion program from
the literature are presented, before concluding the chapter with the evaluation of the ratio
of specific heats and net heat release analysis.
4.2 Exhaust Gas Wet and Dry Analysis
Complete combustion of the hydrocarbon diesel fuel results in water and carbon dioxide
according the simplified combustion equation [9]:
2 2 2 2 2 214 2 4 4
a b
b b b bC H a O N aCO H O a N a O
(4.1)
Where ψ is the molar N/O ratio =3.773 for air, and a/b is the H/C ratio =1.9 for the test
fuel. The masses of the products can be calculated for different values of the excess air
ratio, λ, (note diesel CI engines run lean so λ >1). The total mass of the exhaust is
calculated and divided by the total number of moles of exhaust to give the molecular
weight of the exhaust.
The exhaust gas is chilled to 5ºC to condense the majority of the water vapour out. The
amount of water removed can be found from a psychrometric chart for air at atmospheric
pressure. This shows that the saturation limit for air at 5ºC is 0.55% by mass. Since the
amount of water in the exhaust gas prior to entering the dryer is known from the simplified
combustion equation above, the water lost in the dryer, and hence the amount of water still
Chapter 4 Data Processing
B. Keeler 33 University of Nottingham
present in the exhaust gas can be calculated. The ‘wetting’ process detailed in Appendix 1
is based on the method in [74], adapted for diesel combustion using the molecular
composition of the test fuel. The dry percentage of the constituents in the exhaust from the
emissions analysers can thus be converted to actual (wet) percentage of the constituents in
the exhaust using equation 4.2:
2
2
( )H Oexhausti
exhaust H O
i
exhaust
exhaust
m lostmx
m mx
m
m
(4.2)
At lower AFR the difference between the amount of oxygen in the exhaust assuming
complete combustion for a wet, dry and part wet (0.55% wet) becomes more significant
[74] and thus must be accounted for in subsequent calculations. The percentage difference
between the wet values and the 0.55% wet values are plotted against λ in Figure 4.1 for
1<λ<5. The equation of the power curve fit for the difference between wet and 0.55% wet
gives the basis for the conversion from the analysers to wet values. The samples measured
by the CO2, O2, and CO analysers are ‘dry’ samples and as such the water removed from
the exhaust must be accounted for. The wet molar fractions (%) of the measured
emissions are calculated using:
1.020.141 1i
i
xx
(4.3)
Where “*” denotes dry fractions
Since the analysers do not measure nitrogen, hydrogen, or water concentrations, the
following expressions are used to determine their values [9]:
2
2
2
0.5/ 1
CO CO
H O
CO CO
x xx y
x K x
(4.4)
2
2
2
H O CO
H
CO
x xx
K x
(4.5)
Where y=1.9 and K=3.5.
The nitrogen content is determined by considering that mole fractions add up to 1:
2 2 2 2 21CO CO O N H O HC NOx Hx x x x x x x x (4.6)
4.3 Calculation of AFR
The test engine is equipped with MAF sensors that are monitored by the ECU. However,
the accuracy of these sensors is known to vary according to running conditions [31]. For

Chapter 4 Data Processing
B. Keeler 34 University of Nottingham
this reason the AFR has been calculated using exhaust gas constituents through a molar
oxygen balance. The molar oxygen balance is performed by comparing the theoretical
oxygen content with the measured oxygen content:
2
2 1.02
14
0.141 13.773 1
2 4 4
O
O
ba
xx
b b ba a a
(4.7)
The difference between the two wet oxygen balances is calculated and an iterative goal-
seek macro function employed to reduce the error to zero by changing λ. The AFR is then
determined using the known composition of the diesel fuel:
sAFR AFR (4.8)
This allows the mass flow of air to be calculated:
air fuelm AFR m (4.9)
The above method has been used by several authors, including [31]. However, when
conditions approach stoichiometric, incomplete combustion can cause a deviation in the
calculated AFR. Once a close approximation of the wet molar fractions of the measured
exhaust gases had been determined using λ obtained from the above approach, the actual
AFR is then calculated using the following expression using “wet” molar constituents as
appropriate [9]:
2 2 2
2
/ 2 / 24.773
CO CO H O Oair
f HC CO CO
x x x xMAFR
M x x x
(4.10)
Here 28.96 and 13.93air fM M for an H/C ratio of 1.9. The difference between the
two oxygen balances is illustrated in Figure 4.2. Note the divergence of the values of AFR
as stoichiometric conditions are approached. The difference in the AFR values obtained
using the MAF sensor readings and the calculated AFR are depicted in Figure 4.3. From
this point onwards the AFR and mass flow of air discussed relate to those quantities
calculated from the oxygen balance based on exhaust composition in Equation 4.10 and
not from the MAF sensors.
4.4 Volumetric and Gravimetric Analyses
The emissions analysers record volumetric (molar) concentrations of species in the exhaust
in ppm or %. However, it is useful to display emissions in other terms such as mass
fractions and flow rates. The conversion from volumetric to gravimetric analysis is given
below. Starting from the mass fraction of each gas:
i i ii
i i i
m n mx
m n m
(4.11)
Chapter 4 Data Processing
B. Keeler 35 University of Nottingham
The wet mass fractions (kg/kg-exhaust) of the measured emissions to be calculated:
ii i
exhaust
mx x
m
(4.12)
The (wet) emission flow rates (kg/s) are calculated:
exhaust fuel airm m m (4.13)
i i exhaustm x m (4.14)
The emission flow rates can be normalised by the fuel flow rate, resulting in the
calculation of the Emission Index (EI):
ii
fuel
mEI
m
(4.15)
When analysing trade-offs between various emissions, brake specific terms have also been
calculated to allow comparison of emissions at different test points and load outputs:
i exhausti
b
x mbs
P
(4.16)
4.5 Emissions Units and Conversion
Units commonly used in the research field and associated published works include molar
fractions in ppm and %, the gravimetric fraction of kg/kg-exhaust, mass flow rate of
emissions (kg/s), brake specific emissions (g/kWh), and emission indices (kg/kg-fuel).
Mass flow rates of emissions can be considered particularly useful when performing drive-
cycle testing and analyses, but trade-offs at different engine operating conditions such as
speeds and loads are not so easily compared. Instead the emissions results are commonly
normalised by fuel quantity or power output to allow easier comparison of data at different
conditions. Emissions indices are normalised by the mass flow of fuel as described by
equation 4.15. This allows data from different test conditions to be better compared since
in general load is dependent on and scales with fuel delivery.
Brake specific units normalise the mass flow rate of the species by the brake power output
(equation 4.16). This is again useful when comparing emissions at different conditions,
but can mask the response of the emissions if dominated by the brake power. For
example, Figure 4.4 illustrates NOx emissions displayed in brake specific units and as an
emissions index. The general trend for both units is NOx decreasing with retarding SOI
until around -2.5ºATDC. The emissions index at TDC increases slightly, possibly due to
the low concentrations being measured in this example. However, brake load output
deteriorates rapidly retarding from -2.5ºATDC to TDC as combustion is phased much later
in the expansion stroke, causing a significantl increase in the brake specific NOx emission.
The effect of brake output on a running condition can be analysed by examining the bsfc,
Chapter 4 Data Processing
B. Keeler 36 University of Nottingham
allowing a clearer understanding of brake load output and exhaust emissions. Since the
majority of the testing within this work has been carried out at near fixed fuel flow rates,
and brake load output has not been maximised for each test point, the majority of the data
will be presented as emissions indices. Table 4.1 details the procedures to convert
between the units discussed. To provide an example, at a typical operating condition of
1800 rpm 9.7 mg, 43% EGR (Φ=0.6), 600 bar fuel rail pressure, single injection SOI -
2.5ºATDC the HC and CO values listed in Table 4.2 were obtained using the conversions.
The AVL 415S Smoke Meter displays the output of soot content in the exhaust as a Filter
Smoke Number (FSN), defined according to the standard ISO 10054 as the loss of
reflectivity of filter paper after sampling an exhaust gas column of 405 mm length. The
correlation between FSN and soot concentration (mg/m3) used has been that of Christian et
al. [75], given by Equation 4.17 for FSN values less than 8 and illustrated in Figure 4.5 for
0≤FSN≤4.
1
0.405
FSN
soot FSN e
(4.17)
Where 5.32 and 0.31 for smoke meter with heated line.
The mass flow rate of soot is calculated from the soot concentration as described by [76]:
3
3
/ //
/
exhaust
sample
Soot g m m g hrSoot g hr
g m
(4.18)
Where sample is the sample gas density at the measurement location.
4.6 Exhaust Gas Recirculation
The definition of rate of Exhaust Gas Recirculation (EGR) used within this thesis is:
EGR EGR
i air EGR
m mEGR
m m m
(4.19)
It defines the mass of recycled exhaust gas as a fraction of the total inlet gas. The EGR
rate is calculated by comparing the CO2 in the exhaust and CO2 in the intake manifold as
described by the equation below, the derivation of which can be found in Appendix 2:
intake atmospheric
exhaust atmospheric
2 2
2 2
CO COEGR
CO CO
(4.20)
The above equation contains wet constituents. Since there is more water in the exhaust
than in the intake and/or in the atmosphere, it is important to perform the EGR calculation
with the wet molar fractions.
Chapter 4 Data Processing
B. Keeler 37 University of Nottingham
4.7 Equivalence Ratios
The fuel-air equivalence ratio (Φ) is the ratio between the actual AFR and the
stoichiometric AFR, defined by:
s
actual
AFR
AFR (4.21)
Since diesel engines generally run lean of stoichiometric (in contrast to gasoline engines),
this parameter is used instead of the excess air ratio (λ). The fuel-air equivalence ratio
above is based on the fuel delivered and the fresh air induced into the engine. It therefore
does not account for the oxygen contribution to the charge from EGR. Instead the oxygen-
to-fuel ratio (OFR) defined in equation 4.22 below is a more reliable measure since
oxygen contributions from the fresh air and EGR are accounted for:
2
2 ,0.2331
O aO exh
f f
m m EGROFR x
m m EGR
(4.22)
The fuel-oxygen equivalence ratio (2O ) is obtained from this OFR which relates the
actual OFR to that dictated by the combustion stoichiometry. It is used to give an
indication of how lean/rich the mixture is since the composition of the combustion
products is greatly affected by this parameter:
2
0.233s sO
OFR AFR
OFR OFR
(4.23)
4.8 Combustion Efficiency
Combustion efficiency is defined as the fraction of the fuel energy released by the
combustion process given the energy supplied:
f
c
f LHV
Q
m Q
(4.24)
It has been calculated from the combustion inefficiency (1- c ), as described by [9]:
1[ /( )]
i
f
i LHVic
f a f LHV
x Q
m m m Q
(4.25)
Where ix are the mass fractions of combustible products in the exhaust (CO, HCs, soot,
and H2) and QLHV are the lower heating values for each species.
4.9 In-Cylinder Analyses
4.9.1 Processing of in-cylinder pressure data
In order to reduce the impact of noise on the pressure signals 100 consecutive cycles of
data were recorded and noise spikes from electromagnetic interference removed by

Chapter 4 Data Processing
B. Keeler 38 University of Nottingham
filtering the recorded signals with a user-designed Matlab script. In order to not remove
useful and correct data, careful selection of the filter was required. Passing the data
through a Butterworth filter was found to be extremely effective removing the noise
spikes, but was also found to remove true values. This becomes especially apparent when
analysing the rate of heat release data and this filter was therefore not used. Instead a
maximum allowable peak pressure and rate of change of pressure were set based on the
operating conditions with safety margins so as not to interfere with the true pressure signal
readings. For example, for an operating condition of 1000 rpm 2.5 bar BMEP (54 Nm) the
peak pressures did not exceed 50 bar. The filter limits were set at 75 bar and 30 bar/ºCA
(note data will be presented in later chapters that shows peak rates of pressure encountered
did not exceed 21 bar/ºCA). Any data point that exceeded the prescribed limits was
removed and replaced with “Not-a-Number” (NaN). Once the noise spikes had been
removed, the 100 cycles were ensemble-averaged (with NaN entries being ignored from
the calculation) to obtain one average pressure trace per operating condition. Figure 4.6
illustrates an example of 100 consecutive cycles plotted after filtered (red crosses), and the
subsequent ensemble-averaged pressure trace (black line). This ensemble-averaged data
was then processed to calculate mean effective pressures, peak rates of change of pressure,
heat release, and subsequent ignition delay.
Mean Effective Pressures (MEP) are relative performance measurements that scale the
work output by the engine displacement. This is a more useful quantity than torque when
comparing outputs from different engines since values are relative. For example, 200 Nm
might be near maximum torque output for a 1.5l diesel engine at a given engine speed,
whereas 200 Nm on a 3.0l test engine could be approaching half peak torque. However,
the BMEP would be normalised such that the BMEP of the smaller displacement engine
was twice that of the larger displacement engine. Details of the calculation of brake,
indicated, pumping, and friction mean effective pressures are given below.
Brake power delivered to the dynamometer by the engine is given by:
2bP N T (4.26)
BMEP is a measure of the work output of an engine available at the dynamometer.
2b r r
d d
P n n TBMEP
V N V
(4.27)
Indicated performance parameters use in-cylinder pressure data to calculate the work
delivered to the piston by the gas. They give insight into combustion performance and aid
in the understanding of combustion characteristics. The Net Indicated Mean Effective
Pressure (IMEPn) is defined as the work delivered to the piston over the entire 4 strokes of
the cycle, per unit displaced volume [9]:
Chapter 4 Data Processing
B. Keeler 39 University of Nottingham
720
, 0c in
n
d d
p dVWIMEP
V V
(4.28)
The Gross IMEP is the work delivered to the piston over the compression and expansion
strokes only, per unit displaced volume [9]:
180
, 180c ig
g
d d
p dVWIMEP
V V
(4.29)
Both IMEPs are calculated from a numerical integration using the recorded pressure data.
For the data presented in this thesis the interval is constant at 0.5ºCA, which corresponds
to the highest resolution output from the shaft encoder. The accuracy of the calculated
IMEPs is highly dependent on correct phasing of pressure and volume data and even small
phase changes can result in large percentage errors being introduced, highlighting the
requirement to set the shaft encoder TDC marker output as close as possible to TDC of the
engine (described in section 3.4). The difference between the two definitions is the
pumping work, which represents the work done on the in-cylinder gases by the piston over
the inlet and exhaust:
g nPMEP IMEP IMEP (4.30)
The level of friction is estimated using:
nFMEP IMEP BMEP (4.31)
Note that here FMEP includes the contribution from auxiliary work (amep).
4.9.2 Estimation Bulk Gas Temperature
An estimate of the mass-averaged in-cylinder bulk-gas temperature through the closed part
of the cycle is necessary for determining the ratio of specific heats (γ) which is a function
of temperature and composition, as well as for estimation of the initial enthalpy of the
reactants (fuel and air) prior to the start of combustion. The in-cylinder bulk-gas
temperature was estimated from the in-cylinder pressure and volume, with the calculation
divided into three regions as summarised by Table 4.3; compression (1-2), combustion (2-
3), and expansion (3-4), demonstrated by the idealised indicator diagram shown in Figure
4.7. The polytropic exponent, n, was determined for each test case from a log p-log v plot.
Two values were calculated, one for compression stroke and one for the expansion stroke.
The temperature at each interval between BDC of intake (1) to SOC (2) was calculated
assuming a polytropic process using equation 4.32:
11
intake
intake
ni
i
pT T
p
(4.32)
The temperature rise due to combustion is approximated using the method described by
Brunt et al. [77]. During the combustion process (2-3) it is assumed that the combustion
Chapter 4 Data Processing
B. Keeler 40 University of Nottingham
can be idealised by dividing into a number of constant volume combustion processes,
illustrated by the small step changes on the p-v schematic shown in Figure 4.7, and that the
pressure change due change in volume and heat transfer to the walls can be modelled as a
series of polytropic processes. The incremental pressure rise due to combustion can be
expressed as:
1
1
n
icomb i i
i
Vp p p
V
(4.33)
Assuming perfect gas relationships and that the combustion takes place at fixed volume,
the temperature rise due to combustion at each interval can be approximated by the
equation [77]:
1comb icomb
p VT
m R
(4.34)
Where air fuel egr residualsm m m m m
Therefore the temperature at each interval during combustion is calculated as the
combination of the temperature rise due to combustion and the polytropic temperature
changes:
1
1
1
n
ii i comb
i
VT T T
V
(4.35)
The residual fraction is unknown, but a value of 5% of total trapped mass has been used
throughout this thesis. For a diesel engine 17.3:1 compression ratio the value could be
expected to range from 3-10%, but the value used is consistent with other published work
[9, 77]. If the actual residual fraction were greater, 10% for example, an error in the mass
of trapped charge would result that would lead to an error in the calculated mass and
temperature. However, the extra mass of residuals as a fraction of the total trapped charge
is small. In this example an error in mass estimation of ~5.5% would occur. This effect
has been investigated by other researchers [77, 78] who concluded that an error in mass
estimation (or temperature) of under 5% is acceptable for heat release analysis for
combustion diagnosis purposes. Brunt et al. [77] documented a charge temperature error
of 10% typically leads to a 3% error in calculated heat release. Overall in the calculation
of the temperatures and the ratio of specific heats presented, the contribution of the
residuals is small compared with other variables such as inlet temperature, pressure, and
fraction of external EGR, nevertheless its contribution has been considered.
Once combustion has terminated the pressure and temperature rises due to combustion are
zero. The decrease in temperature from EOC-EVO (3-4) is estimated using a polytropic
expansion with temperature and pressure at EOC as a reference point:
Chapter 4 Data Processing
B. Keeler 41 University of Nottingham
11
EOC
EOC
ni
i
pT T
p
(4.36)
An example case is demonstrated in Figure 4.8 which shows estimated bulk-gas
temperature against crank angle location. In this example SOC is +0.5°ATDC, EOC is
+32°ATDC:
4.9.3 Adiabatic Flame Temperature
Two adiabatic flame temperatures are defined, one for constant pressure and one for
constant volume. Conventional DI diesel combustion and PCCI combustion typically span
many crank angle degrees in combustion duration. The constant volume definition gives
the temperature that occurs without any work delivered to the piston, and with no heat
transfer or change in kinetic or potential energy (constant internal energy assumption).
The constant pressure definition gives the temperature resulting from combustion without
any heat transfer or change in kinetic or potential energy (constant enthalpy assumption).
This definition using constant pressure is the one that will be used explicitly for the
following adiabatic flame temperature calculations. For a constant pressure process the
change in enthalpy is zero. From the First Law of Thermodynamics [79];
Reactants Products 0H H (4.37)
The enthalpy of the reactants is calculated by:
Reactants , , 298.15i f i p i initialH n h c T (4.38)
Since molar enthalpies are temperature dependent, data were taken from Rogers and
Mayhew [80] to enable more accurate values to be used within the enthalpy calculations.
Polynomial functions were applied to the data of each species to yield equations that could
be used to calculate the heat capacity of the species at any desired temperature. Figure 4.9
illustrates the data graphically. The enthalpy of formation of the fuel fuelfh ,
~ was
calculated from the definition that the molar enthalpy at the reference temperature (298.15
K) is zero, i.e. 0 /refh T kJ kmol . Turns [79] tabulates coefficients for polynomials
for the calculation of fuel enthalpy and specific heat for reference state of zero enthalpy of
the elements at 298.15 K and 1 atm;
2 3 4 1
1 2 3 4 5 6/ 41842 3 4 5
fh kJ kmol a a a a a a
(4.39)
2 3 21 2 3 4 5/ 4.184pc kJ kmol K a a a a a (4.40)
Where 1000/)(KT
The coefficients used are summarised in Table 4.4. The enthalpy of formation of the fuel
is estimated from data available for a general diesel fuel of molecular formula

Chapter 4 Data Processing
B. Keeler 42 University of Nottingham
7.188.10 HC and molecular weight 148.6 kg/kmol, which is a smaller chain hydrocarbon with
lower molecular weight than the fuel experimental fuel. In the absence of any data on a
more similar compound this will be used to estimate the enthalpy of the diesel.
Substituting in the coefficients and assuming that the molar enthalpy at 298.15 K is zero
the result , 180 /f fuelh MJ kmol was obtained.
A chemical equilibrium code based on the work of Olikara and Borman [81] and obtained
from Turns [79] was used to calculate the constant pressure adiabatic flame temperature by
solving the First Law problem described in Equation 4.37. The program calculates the
adiabatic flame temperature for adiabatic constant-pressure combustion with specified fuel
composition, reactant enthalpy, fuel-air equivalence ratio, and pressure. The effects on
composition and intake temperature of EGR are included in the calculation through the
calculation of the molar fractions of the species and inlet temperature. It is assumed that
the oxidiser is air with a simplified composition of 79% N2, and 21% O2, and eleven
species are considered in the products of combustion: H, O, N, H2, OH, CO, NO, O2, H2O,
CO2, and N2. The calculation was performed based on inputs of the stoichiometric fuel-air
equivalence ratio (Φ=1). Using the overall fuel-air equivalence ratio would assume
mixture homogeneity, but these conditions will not be achieved in practice. The use of the
stoichiometric fuel-air equivalence ratio was expected to be more reliable when
considering a standard diesel diffusion flame which would be present. As stated above the
analysis assumed constant pressure, whereas in reality this does not strictly occur as fuel is
burned over a finite number of crank angle degrees and thus pressures and volumes.
However, either the constant pressure or constant volume constraint must be applied. The
purpose of the calculation was to investigate the relationship between soot and NOx output
and temperature for different running conditions. As will be demonstrated in the thesis,
the calculation proved sufficient in providing insight into the combustion behaviour.
4.10 Heat Release Analysis
Heat release analysis has been performed to gain insight into combustion characteristics.
The apparent net heat release (Qn) represents the work done on the piston and the increase
in sensible energy of the trapped mass, but does not consider heat transfer or blowby
losses. Apparent gross heat release (Qg) corresponds to the total amount of chemical
energy released from the fuel during combustion such that:
g blowbyn htdQ dQdQ dQ
d d d d
(4.41)
Although analysis of gross heat release would be preferable in an ideal world, the aims of
the research were in understanding constraints imposed on injection and EGR strategies
Chapter 4 Data Processing
B. Keeler 43 University of Nottingham
with a view to reducing emissions. Heat rejection has therefore not been calculated.
Instead the heat release data presented within this thesis are net quantities. Net heat
release analysis is well documented and enables good insight into combustion
characteristics and differences between running conditions without the need to calculate
heat transfer which is both a potential source of error and more complicated. The apparent
net rate of heat release ( nROHR ), ndQ d , was calculated from the single-zone First Law
of thermodynamics [9]:
1
1 1ndQ dV dp
p Vd d d
(4.42)
A Matlab script was used to calculate the heat release. During the first iteration, the ratio
of specific heats was kept constant ( 1.35 ). Once the net rate of heat release was
calculated, the cumulative net heat release was evaluated by an integration process of
interval 0.5ºCA.
The computed apparent rate of heat release is highly sensitive to the calculation of , the
value of which is known to be a function of both temperature and composition and
therefore varies during the cycle. Ideally a multi-zone model would be used to calculate
accounting for fuel specification, AFR, EGR, charge pressure and temperature, and
development through the cycle, but commonly is determined as a function of
temperature only [82]. However, due to the varied levels of dilution and composition used
during the investigations within this thesis, to improve the accuracy of the computed value
a second iteration of the analysis was performed, this time accounting for charge
composition and temperature. Values of γ were calculated for fresh charge (pre-
combustion) and for burned gases (post-combustion) based on the known AFR, rate of
EGR, and composition of the exhaust gas products.
Here fresh charge (fc) consists of injected fuel and induced fresh air. pc for the injected
fuel (diesel) in the vapour phase is calculated using Equation 4.40 and the molecular
weight of the fuel. pc values for air at different temperatures were obtained from tables of
thermodynamic properties in Rogers and Mayhew [80] and plotted to yield a polynomial
expression as a function of temperature. pc of the mass averaged mixture of fuel and fresh
air was obtained using:
, ,
, /1
p fuel p Air
p fc
c AFR cc kJ kg K
AFR
(4.43)
Chapter 4 Data Processing
B. Keeler 44 University of Nottingham
The ratio of specific heats was calculated using:
p
p
c
c R
(4.44)
Where R is assumed to be that of fresh air.
The final composition in the exhaust (burned gas) was known from the emissions analysis,
but intermediate products and reactions were not accounted for. Assuming the burned
mixture was in equilibrium, for each species i in its standard state at temperature T, the
specific heat ,p ic was approximated by [9]:
4 2 3 41 2 3 4 5
,
i i i i i
p i
i
a a T a T a T a T Rc
m
(4.45)
The coefficients for CO2, H2O, CO, O2, and N2 were obtained from a NASA equilibrium
program which uses JANAF tables of thermodynamic data. The heat capacity of the
burned gas was calculated as a function of temperature based on the mass-averaged
exhaust gas composition:
2 2 2 2 2 2 2 2, , , , , ,p bg CO p CO H O p H O CO p CO O p O N p Nc x c x c x c x c x c (4.46)
γ was calculated at each time interval (every 0.5ºCA) using equations 4.46 and 4.44 as a
function of temperature for the exhaust gas composition of the data set. This process was
performed for each data set to account for the differences in AFR and burned gas
composition for each condition. Figure 4.10 illustrates an example of the variation of the
ratio of specific heats for fresh charge and burned gas with temperature for an AFR of
21.8.
The computed values of fc and bg were then used to calculate a more accurate mass-
averaged value, , calculated in three separate zones. Before SOC the charge consists of
fresh air, EGR, residuals, and fuel once injected, and can be expected to be fairly well
mixed. for the first region (SOI-SOC) is thus given by:
fc fc bg EGR residuals
SOI SOC
total
m m m
m
(4.47)
Where fc fuel airm m m and total fc EGR residualsm m m m
From the start to the end of combustion (SOC-EOC) the composition of the cylinder
contents changes continuously as fresh air oxidises the fuel to form burned gas products.
Although the pressure throughout the cylinder is constant, heterogeneous combustion
conditions result in temperature distributions, with fresh charge and burned gas species at
different temperatures. This would influence the value of . Since the pressure was used
to estimate the in-cylinder bulk-gas temperature only a single average temperature was
Chapter 4 Data Processing
B. Keeler 45 University of Nottingham
obtained which does not allow the temperature differences to be dealt with individually.
However, to achieve a reasonable approximation of the average value of a weighting
has been applied during the combustion development to account for changes in
composition and subsequent values of . A simple linear Mass-Fraction Burned (MFB)
profile was established over the interval SOC to EOC using the cumulative heat release
calculated during the first iteration (where 1.35 ). The true MFB profile more
resembles an ‘S’ shape, but for the purpose of calculating , the simpler approximation
was deemed sufficient. The gradient of the straight line was normalised by the maximum
cumulative heat release (Qn) to give the MFB, ranging from 0 at SOC to 1 at EOC. This
was then used in the second iteration of heat release calculations, this time using different
γ values for fresh charge and burned gas that vary with temperature and mixture
composition according to equation 4.48:
1fc fc bg fc bg EGR residuals
SOC EOC
total
MFB m MFB m m m
m
(4.48)
Weighting the value of using the masses of fresh charge and burned gas in conjunction
with the MFB profile was deemed to be the best practical approach. Although the
necessary assumption of homogeneous charge and temperature distribution will
incorporate a source of error in the determination of , the above approach gives a good
estimation. Finally, once combustion has terminated (EOC-EVO) the in-cylinder
composition is assumed to be homogeneous and consisting of burned gas such that:
EOC EVO bg (4.49)
The variation of the ratio of specific heats with crank angle location is illustrated in Figure
4.11 for fresh charge using the calculated AFR, burned gas using the exhaust gas
composition, and the mixture composition using equations 4.46-4.48.
4.11 Concluding Remarks
This chapter has detailed the calculations performed on the acquired test data used to
assess the relative performance of the engine and combustion strategies presented within
this thesis. The calculated quantities provide insight into the behaviour of the system and
aid the understanding of the mechanisms responsible for the combustion behaviour. This
allows the benefits and penalties of PCCI and conventional strategies to be analysed.
Particular attention has been paid to the calculation of AFR, in-cylinder bulk-gas
temperature, constant pressure adiabatic flame temperature, and the calculation of heat
release. As will be discussed, these parameters are invaluable in understanding the
responses presented.

B. Keeler 46 University of Nottingham
CHAPTER 5
STUDIES OF NOISE, IGNITION DELAY, AND
COMBUSTION PHASING TO SUPPORT
ASSESSMENT OF PCCI COMBUSTION
5.1 Introduction
This chapter is divided into three sections which individually examine the determinants
and relative importance of noise, ignition delay, and combustion phasing. Increasing the
level of premix is potentially liable to increase combustion noise, which must be
considered when developing a combustion strategy. An investigation into the factors that
determine the ignition delay is then presented, before the effect of combustion phasing on
emissions and fuel consumption is analysed. A summary of pertinent findings completes
the chapter.
5.2 Combustion Noise
5.2.1 Introduction
Although there is no direct regulation of combustion noise, levels are restricted by OEMs
for quality reasons to meet customer expectations of low NVH (Noise, Vibration, and
Harshness). The premixing of the charge which is exploited with PCCI strategies to limit
soot and NOx formation tends also to increase noise, which is a serious disadvantage of
this strategy. Combustion noise is a source of potential annoyance for both passengers and
people outside of the vehicle. Values above 85 dB(A) are unlikely to be acceptable [17],
although a development target of 90 dB(A) opens up the range of strategies available. The
focus of the first section of this chapter is to investigate the factors responsible for the
generation of combustion noise and potential solutions to limit its level. In this chapter,
the contribution of combustion noise to total engine noise and to exterior pass-by noise is
introduced. The measurement of online combustion noise is discussed and compared to
interior (cabin) noise obtained from the recorded pressure history using proprietary
software. Analysis of pertinent literature revealed that peak pressures and peak rates of
pressure of rise strongly affect combustion noise level [83]. Consequently the importance
of the rate of change of in-cylinder pressure (first derivative of pressure with respect to
crank angle) is analysed and correlations at three different engine speeds presented, before
Chapter 5 Studies of Noise, Ignition Delay, and Combustion Phasing to SupportAssessments of PCCI Combustion
B. Keeler 47 University of Nottingham
the ratio of ignition delay to peak rate of net heat release is considered as a potential
strategy development tool. Spectral analysis of in-cylinder pressure data are presented to
investigate the distribution of the energy contained in pressure traces and to attempt to
identify differences between conventional and PCCI combustion.
5.2.2 Contributions to Overall Pass-By Noise
There are many noise sources from vehicles, including noise derived from rotating
components (for example the crankshaft, camshaft, tyres, alternator, and water pump),
torsional vibrations, structural distortion (from combustion and stress waves within the
engine structure), inlet and exhaust noise, cooling fans, brake noise, road noise, and wind
noise. The sources of noise that contribute to the overall pass-by noise of two passenger
vehicles travelling in accordance with ISO 362 [84] are presented in Figure 5.1 [85]. Five
general categories have been used to describe the contributors for a DI diesel and a
gasoline powered vehicle at 74(+1) dB(A) and 74 dB(A) respectively. Engine noise from
the diesel powered vehicle is seen to contribute significantly more to the overall pass-by
noise than the corresponding gasoline vehicle, highlighting the importance of this
contribution. The data presented in Figure 5.1 are representative of noise contributions at
approximately 50 km/h. The relative contributions of each source will vary according to
many factors, primarily vehicle speed. For example, at speeds of 15 km/h and less,
propulsion noise (noise from engine, transmission, intake and exhaust systems) becomes
most dominant [86]. Engine noise can be further separated into sub-divisions as
previously illustrated by Figure 2.5. Within this thesis only combustion noise is
considered in detail.
5.2.3 Interior (cabin) Noise
Passenger comfort within the vehicle cabin has become an important factor in the selection
and purchase of a vehicle. The overall interior noise can be considered the combination of
airborne and structure borne noise sources. The crank-based pressure data that were
supplied online to the AVL 450 Combustion Noise meter were also processed using
proprietary software to generate a representative noise in the interior (cabin) of a passenger
vehicle similar to the ones the test engine is installed. The main function of the software is
to weight the noise spectra into frequency bands to give an audible noise representation of
the effect of pressure changes within the cylinder. Figure 5.2 illustrates there is a clear
relationship between combustion noise (as measured by the AVL 450 Combustion Noise
meter) and vehicle interior noise, with interior noise increasing with combustion noise. If
a limit on interior noise is imposed, for example 65 dB(A), combustion noise has to be
contained in this example below 80 dB(A) for the broad frequency band (a larger
frequency range) and below 85 dB(A) for the frequency band associated with combustion

Chapter 5 Studies of Noise, Ignition Delay, and Combustion Phasing to SupportAssessments of PCCI Combustion
B. Keeler 48 University of Nottingham
noise. To put this in context, 60 dB(A) is approximately the noise level that would be
experienced in a restaurant or department store, and 70 dB(A) that from a loud radio [72].
5.2.4 Rate of Change of Pressure
As was discussed in Chapter 1, combustion noise is deemed to be strongly dependent on
the peak pressure, the peak rate of change of pressure (the first derivative of pressure), and
the engine speed. With this in mind the relationship between the peak rate of change of
pressure measured in pressure per unit time, here presented as MPa/ºCA was investigated.
Figure 5.3 illustrates the clear dependence of combustion noise on peak rate of change of
in-cylinder pressure at engine speeds of 1200 rpm, 1500 rpm and 1800 rpm. At low
Combustion Noise Levels (CNL) the peak rate of pressure change is low, around 0.15
MPa/°CA for 72 dB(A). Here the maximum rate of pressure change is that of the motored
compression of the charge. From 68-80 dB(A) Figure 5.3 shows that very small changes
in peak rate of pressure increase can result in large variations in noise output for the data at
1500 rpm and 1800 rpm, but the values encountered are nevertheless low and should not
pose a problem or limitation to any such calibration. In slight contrast the 1200 rpm data
can be seen to diverge more progressively. As degree of constant-volume combustion
increases and the combustion becomes more rapid, the rate of change of pressure increases
resulting in higher CNL. As the peak rate of pressure rise increases from approximately
0.20 MPa/°CA the 1500 rpm and 1800 rpm responses begin to separate. Beyond this point
CNL values recorded are higher for the faster engine speed for a given rate of pressure
change, attributable to changes in frequency, dominated by engine speed.
Converting the derivative of the pressure rise from the crank domain to the time domain
compensates for differences in the crank-angle duration since at higher engine speed one
degree of rotation takes place in a shorter time period measured in milliseconds. Figure
5.4 illustrates the same CNL data as Figure 5.3 but in this case combustion noise is plotted
against the first derivative of pressure with respect to time (i.e. MPa/ms). Smaller
differences between the three data sets are noticed compared to when plotted in the crank
domain. Noticeably, beyond approximately 85 dB(A) the data at 1500 rpm and 1200 rpm
appear to have a very similar dependence on the rate of change of pressure, whereas the
data at 1800 rpm continues to be at higher noise levels. This could potentially be
attributed to the relative weightings of frequency components and peak pressures
calculated using the AVL combustion noise meter algorithm. However, since only a
single digital output was recorded for each data point, additional investigation would be
required to further develop the understanding. Nevertheless Figure 5.3 and Figure 5.4
clearly demonstrate the importance of limiting rates of pressure rise to control combustion
noise levels, and provide insight into the limiting values.
Chapter 5 Studies of Noise, Ignition Delay, and Combustion Phasing to SupportAssessments of PCCI Combustion
B. Keeler 49 University of Nottingham
A CNL of 85 dB(A) is seen to be exceeded beyond 0.3 MPa/°CA at 1800 rpm, 0.45
MPa/°CA at 1500 rpm, whilst 0.70 MPa/ºCA must be reached at 1200 rpm before
achieving the same noise output. Rates of change greater than these values result in
unacceptably high levels of noise generated, but the CNL at slower speeds continues to be
lower, with peak values less than 92 dB(A) in contrast to the 96.5 dB(A) encountered at
1800 rpm despite equal, if not greater rates of change of pressure. The limitation of
combustion noise can thus be deemed a function of engine speed, potentially allowing
further exploitation of the PCCI combustion strategy at lower engine speeds. Relatively
simple rational functions have been fitted to the three data sets as shown in Figure 5.3.
Correlations such as these could be used by the ECU in conjunction with an installed in-
cylinder pressure transducer to monitor CNL online, but more mapping at different engine
speeds would be required to create a detailed and implementable data set.
Figure 5.5 highlights the importance of combustion phasing on rate of pressure rise.
Retarding the start of combustion is clearly an effective approach to control the pressure
rise and thus combustion noise, but phasing combustion too retarded of TDC is
thermodynamically inefficient and comes at the expense of other responses such as
combustion efficiency and fuel consumption. These will be discussed later in this chapter.
Figure 5.5 also demonstrates that for a given speed and fuelling, different peak rates of
pressure rise can occur at the same start of combustion location. This is to be expected
since the combustion profile is highly dependent on injection timing and ignition delay, as
well as rate of EGR. For example, at 1500 rpm with a total fuel injection quantity per
cylinder of 6.8 mg, rates of pressure rise vary by up to 0.4 MPa/°CA at a given SOC
location. The lower rates are clearly beneficial to suppressing combustion noise, but soot,
CO, HC, and/or fuel consumption are liable to increase.
5.2.5 Ratio of Ignition Delay to Peak Rate of Net Heat Release
Increased ignition delay periods are desirable to allow time for fuel-air premixing, but can
result in high rates of heat release following ignition. EGR is effective at decreasing the
rate of heat release which tends to limit or reduce CNL. EGR also increases the ignition
delay, suggesting that maximising the ratio of ignition delay to peak rate of heat release
might be a successful development strategy. Figure 5.6 illustrates a near asymptotic
relationship between the maximum rate of pressure rise and ratio of ignition delay to peak
rate of net heat release, approximated by the non-linear regression model labelled.
Results for the ratio are shown plotted against combustion noise in Figure 5.7, previously
presented in [17], for total fuel quantities of 9.7 mg/stk/cyl at 1800 rpm. For the single
injection cases, SOI has been varied at 43% EGR, and EGR has been varied for an
injection timing of -5°ATDC. The 43% EGR rate was selected to allow direct comparison
Chapter 5 Studies of Noise, Ignition Delay, and Combustion Phasing to SupportAssessments of PCCI Combustion
B. Keeler 50 University of Nottingham
with other data at similar operating conditions not presented here, whilst the -5ºATDC
injection timing was selected to allow desirable combustion phasing with respect to fuel
consumption. Data from a pilot-plus-main case are also considered with a 0.8 mg pilot
injection SOI -25°ATDC and main injection SOI +1°ATDC. A low level of combustion
noise is associated with high values of this ratio, indicating that large ignition delays
allowing a high degree of premixing do not necessarily lead to high combustion noise.
However, increased dilution requires a greater mass of air to be mixed with the fuel to
achieve the same local equivalence ratio, requiring more time for mixing [87]. This can
lead to increased soot output, which will be discussed in Chapter 7.
When the corresponding bsfc values are plotted against the same ratio (Figure 5.8) it is
clear that the reduction in noise can be commonly associated with poor phasing or low
combustion efficiency which incurs a high fuel economy penalty. The range bounded by
unacceptable fuel economy penalty or unacceptable noise is narrow [17]. If a soot penalty
is accepted, a conventional pilot injection can be used to reduce ignition delay and limit
noise. In Figure 5.9 there is a clear separation of with- and without-pilot injection trends
and for a given ignition delay, noise is much lower when the pilot injection is used. The
data points within the dashed oval have pilot injection and a common main SOI of
+1°ATDC. Additionally, the results show that increasing EGR reduces rates of heat
release and CNL.
Long ignition delays with low associated rate of pressure rise can be achieved using a
single injection by retarding the combustion, but the poor phasing and deterioration in
combustion gives rise to a high fuel economy penalty. At timings giving better phased
combustion, increasing EGR to very high levels limits peak heat release rates and
combustion noise but work output again deteriorates and intake throttling or other means
are required to achieve the necessary gas recycling rate [17].
5.2.6 Spectral Analysis of In-Cylinder Pressure Data
The distribution of the sound energy is important in determining the perceived annoyance
to the individual and is evaluated in the algorithm embedded in the AVL combustion noise
meter. With this in mind a Fast Fourier Transform (FFT) has been performed on in-
cylinder pressure data to investigate the noise characteristics. FFT analysis is a procedure
used to analyse the frequency components of a signal. A two-sided power spectrum
displays half the energy at the positive frequency and half at the negative frequency.
Although there are both positive and negative frequency components, the negative
components are commonly emitted when displaying the power spectrum by converting to
a single-sided power spectrum, which is what is presented within this thesis.
Chapter 5 Studies of Noise, Ignition Delay, and Combustion Phasing to SupportAssessments of PCCI Combustion
B. Keeler 51 University of Nottingham
Figure 5.10 illustrates the resultant power spectrum for the total frequency range analysed
at an engine speed of 1800 rpm, equating to a frequency of 30 Hz. Four injection timings
of -20, -10, -1, and 0°ATDC are included, with corresponding combustion noise levels of
96.5, 94.0, 86.1, and 81.1 dB(A) respectively. Low frequencies are seen to dominate the
power spectrum. Figure 5.11 presents the same data as Figure 5.10, but against a linear
frequency axis and logarithmic amplitude axis. Since there are two revolutions per cycle
(4-stroke engine cycle) half engine frequency harmonics also appear. In Figure 5.10 the
fundamental frequency (f) together with selected harmonics are labelled. These
frequencies are all dependent on engine speed and common to all data series presented.
The power spectrum increases with advancing injection timing in line with advancing
combustion phasing, peak rates of change of pressure, and consequently combustion noise.
However, combustion noise is normally associated with higher frequencies [88], which
can be more clearly seen through inspection of Figure 5.11. The level decreases with
increasing frequency for all data series, but the most advanced injection timing
(corresponding to the highest combustion noise level) is consistently highest, especially at
the lower frequencies included (around 300 Hz). In the interval 4.5-6.5 kHz an increase in
amplitude is apparent for all data series. The peak level in this range is highest for the
most advanced injection timing (-20°ATDC) and gradually decreases as the timing is
retarded. This is associated with a wave travelling across the cylinder chamber (knock),
the fundamental frequency of which is dictated according to:
R Tf
(5.1)
Where 2 l for the first harmonic and l is the piston bowl diameter.
The frequency of this pressure wave is highlighted in Figure 5.11 by a dashed oval. As
injection timing is retarded, mixture temperatures decrease. This slows down the speed of
the wave ( c R T ) and reduces its frequency. Overall noise output is calculated
from the sum of the frequency contents within a given range. The higher spectral levels of
the more advanced timings across a large frequency range are therefore consistent with
combustion noise increasing with advancing combustion.
5.2.7 Comparison between Conventional and PCCI combustion
The results obtained when applying the FFT to three different pressure histories at 1800
rpm are illustrated in Figure 5.12 and serve to investigate the differences in spectra for the
different strategies. In contrast to the data presented above, the data in Figure 5.12 are at
constant brake load output (2.5 bar BMEP), but vary in SOI and EGR. As the legend
describes, two of the data sets are for advanced single injections, and one for a
conventional pilot-plus-main strategy. The data are ordered from highest to lowest
combustion noise level. The same characteristics as identified in Figure 5.10 and Figure
Chapter 5 Studies of Noise, Ignition Delay, and Combustion Phasing to SupportAssessments of PCCI Combustion
B. Keeler 52 University of Nottingham
5.11 are present, although the crest in the amplitude in the frequency range attributed to
knock appears more constant at 5.5 kHz than found with the injection timing sweep in the
previous section. Interestingly, there also appears to be two spikes in amplitude around
this region for the pilot-plus-main case. This is potentially attributable to the two distinct
combustion events that occur in cylinder, and appear to act to spread the spectral density
over a wider frequency range. For a given load output, slightly different characteristics are
therefore apparent depending on the combustion strategy employed. Reducing the spectral
density at a given frequency is potentially beneficial in reducing perceived noise since
noise concentrated in a narrow bandwidth is considered noisier than if the same energy
were spread over a wider band. However, high-frequency noise (for example above 1.5
kHz) is judged to be noisier than a lower frequency noise which is equally loud [89]. This
concludes the discussion on noise. In the section that follows, the determination of the
ignition delay will be investigated.
5.3 Ignition Delay and the Start of Combustion
5.3.1 Introduction
Ignition Delay (ID) is a key parameter in achieving low soot and NOx emissions, since
increasing its duration provides more time for fuel-air mixing, potentially allowing higher
fractions of pre-mixed charge. In this chapter, correlations for ignition delay are examined
and the effect of ignition delay on fuel consumption and emission responses is discussed.
The definition and determination of the start of combustion are detailed before the forms
of previous ignition delay correlations are covered. From here, evaluation of a suitable
ignition delay correlation for the author’s data is presented with the aim of understanding
the factors and mechanisms that determine the length of this period.
5.3.2 Determination of the Start of Combustion
The ignition delay period is defined as the time between the start of injection (SOI) and the
start of combustion (SOC). The SOC and the preceding ID period are important in
mixture preparation. As explained in Chapter 1, the ignition delay is the time where the
fuel mixes with the air in the cylinder prior to the onset of combustion. The length of this
period significantly affects the development of combustion and heat release. As well as
chemical factors many physical factors are known to affect the ignition delay, including;
intake air temperature and pressure, injection timing, load, fuel droplet size, injection
velocity and rate, engine speed, oxygen concentration, and swirl rate [9].
Cool flame reactions are a phenomena associated with premixed combustion where low
temperature combustion occurs before the start of the main ignition. The cool flame
energy that is released causes in-cylinder pressure to increase, modifying the

Chapter 5 Studies of Noise, Ignition Delay, and Combustion Phasing to SupportAssessments of PCCI Combustion
B. Keeler 53 University of Nottingham
thermodynamic state of the mixture. This has a significant effect over hot gas reactions
since the main ignition occurs at a higher pressure than it would have in the absence of
cool flame reactions [90]. Within this thesis the SOC for a main injection is defined as the
crank angle location at which 10% of the cumulative heat release occurs, consistent with
the definition used in [13, 17]. This criterion has been chosen so as to associate the SOC
with that of the start of rapid high-temperature reactions and be distinguished from the
cool flame reactions when two-stage ignition is evident. An example determination of
SOC is given in Figure 5.13.
5.3.3 Ignition Delay Correlations
The length of the ignition delay is influenced by both physical and chemical factors and is
known to be a function of mixture temperature, pressure, equivalence ratio, and fuel
properties [9]. Many correlations have been proposed to predict ignition delay, the most
common of which use a semi-empirical expression as proposed by Wolfer [91] which is
based on the Arrhenius Equation;
eAE
n R Tid A p
(5.2)
Where /AE R is an apparent activation energy for the fuel autoignition process, and A and
n are empirical constants dependent upon the fuel and airflow characteristics [13]. Table
5.1 summarises the empirical constants employed in widely-used correlations with diesel
fuel that take the form of Equation 5.2. As can be seen from the data in the table, the
values of apparent activation energy and adjustable constants vary considerably between
studies, which were carried out using a diesel engine, a constant-volume combustion
bomb, or a steady flow reactor. Many factors are responsible for the differences in the
values of empirical constants reported, but disparities in the equipment employed and the
method of mixture preparation are likely to be the most significant [9]. Moreover, as well
as adopting the above expression, the studies of both Assanis et al. [92] and Kook et al.
[13] include terms to take account of oxygen availability through global equivalence ratio
and oxygen concentration terms respectively. When considering PCCI combustion
strategies this is significant, since high rates of dilution play an important role in
determining the ignition delay.
Chapter 5 Studies of Noise, Ignition Delay, and Combustion Phasing to SupportAssessments of PCCI Combustion
B. Keeler 54 University of Nottingham
A correlation for ignition delay has been developed from the experimental data collected
following the approach taken in [13] accounting for oxygen availability. Including this
term yields Equation 5.3, re-arranged to give Equation 5.4:
2 , eAE
n f R Tid O cylp x A
(5.3)
2 ,
1ln lnn f A
id O cyl
Ep x A
R T
(5.4)
For simplicity, the constants n and f were initially set to 1. A value of n=1±0.02 was used
by the many of the works summarised in Table 5.1. The apparent activation energy and
the constant A were determined by fitting experimental data to Equation 5.4. Data for
single injections are shown in Figure 5.14 over a wide range of injection timings, fuel
injection quantities, and rates of EGR. For injection timings within the data set around
TDC, SOC commonly occurs further into the expansion stroke. For a single injection the
temperature and pressure at SOC are therefore frequently lower than at the SOI conditions.
The temperature and pressure data have been weighted in favour of SOC conditions in
order to improve the fit and reduce scatter within the data. Increasing the weighting
towards SOC conditions from 50% to 80% improved the coefficient of determination (R2)
from 0.29 to 0.80 as well as changing the profile of the line. In accordance with Equation
5.4, the gradient of the line yields the apparent activation energy and the offset enables the
calculation of A. Equation 5.5 gives the expression for ignition delay obtained from the
experimental data:
2
1692/1 1115 ( )T
id Op X e ms (5.5)
A regression analysis was performed to improve the selection of constants by minimising
the least-square error between measured and predicted values. Table 5.2 summarises three
of the results, along with the data from the method described above. As can be seen there
are many combinations of constants that yield very similar coefficients of determination.
Applying sensible constraints to the ranges that these constants can take is thus important.
The best fit of the data is shown to be obtained with a high value for the empirical constant
A and relatively low value for the apparent activation energy. This indicates that the
expression is more sensitive to the average temperature than those listed in Table 5.1. This
is attributed to the determination of SOC and average temperature between studies, noting
that the data in this thesis were weighted in favour of SOC conditions. Nevertheless,
despite the detailed regression analysis, the fit was not significantly improved from the
initial method which was much more time efficient. The final equation for predicting
ignition delay is given by:
2
1400/1.10 0.85,484 ( )
T
id O cylp x e ms (5.6)
Chapter 5 Studies of Noise, Ignition Delay, and Combustion Phasing to SupportAssessments of PCCI Combustion
B. Keeler 55 University of Nottingham
Figure 5.15 demonstrates the effectiveness of the expression to predict the ignition delay.
In the order of 220 different data points (~80% at 1800 rpm, ~20% at 1500 rpm) at various
SOIs ranging from -20° to +3° and EGR rates in the range 0%-61% were used for the
determination of the expression. However, extrapolation of the correlation outside of the
original range of operating conditions could result in inaccurate prediction [9]. The data
presented relate to single injections and the correlation is thus not valid for the main
injection following one or more pilot injections. The use of multiple injection strategies
may require extra attention to calibrate for changes in mixture preparation and
thermodynamic state. For example, the correlation has been found to over-predict main
ignition delay when a single pilot is also employed. The majority of this data predicted
values within +30% of the unity gradient line (x=y), but improved calibration would be
required should this be developed further and is beyond the scope of this investigation.
The high coefficient of determination value for use with single injections indicates the
effectiveness of the relationship with all of the data within the ±20% error bands.
Heywood [9] explains that a lower value of /AE R indicates the importance of physical
processes and that they are relevant to chemical processes. Overall the relationship clearly
demonstrates that fuel introduced into increased pressures and temperatures reduces the
ignition delay. High oxygen concentrations are also seen to reduce the delay since there is
increased chance of fuel and air mixing to within flammability limits and promoting
conditions suitable for ignition. Dilution slows down chemical reactions and limits the
temperature rise from early low-temperature reactions due to the high heat capacity of
recycled gases [13], thus allowing more time for mixing. However, the reduced oxygen
availability in-cylinder necessitates a greater mass of air to be mixed with the fuel to
achieve a given fuel-air equivalence ratio, which requires more mixing time and thus may
offset the benefits of increased ignition delay [13, 87]. This trade-off will be discussed
further later in the thesis.
It is clear that both mixing and reaction kinetics play an important role in determining the
length of the ignition delay period. For a given oxygen concentration, increased fuel-air
mixing though higher swirl ratios or increased mixing intensity due to higher injection
pressures should reduce the ignition delay as flammability limits for combustion are
reached earlier (mixing mechanism). Temperature and pressure are also key variables in
determining the rate of reaction through reaction kinetics. Knowledge of the
thermodynamic conditions in-cylinder is thus vital when predicting the location of start of
combustion and the length of the ignition delay period. A model developed by Watson
[83] indicates the relative importance of the ignition delay on diesel combustion. In this
Chapter 5 Studies of Noise, Ignition Delay, and Combustion Phasing to SupportAssessments of PCCI Combustion
B. Keeler 56 University of Nottingham
model the total fuel burned in the premixed stage is defined as a fraction of the total fuel
injected, expressed as a proportionality factor, β.
premix
total
m
m (5.7)
Where the proportionality factor is given by:
1b
cid
a
(5.8)
An increase in the ignition delay therefore favours a higher value of proportionality factor,
β, and thus relative amount of premixed burning, but a strong dependence on equivalence
ratio can also be seen. The parameters manipulated to increase the ignition delay are thus
important when attempting to increase the amount of premixed burning. The subsequent
section continues to develop the understanding by examining the effect of combustion
phasing, which logically follows on from analysis of ignition delay and the start of
combustion.
5.4 Effect of Combustion Phasing on CO, HC, and Fuel
Consumption
5.4.1 Introduction
The final section of this chapter pertains to the effect of combustion phasing (primarily
through SOC). Here in-cylinder pressure data are analysed and implications for load
output and combustion efficiency discussed together with the effect of dilution and charge
mixing.
5.4.2 In-Cylinder Analysis
When considering the performance of a combustion system, gross indicated performance
quantities are commonly used since they are representative of the useful work available at
the shaft and are not affected by ancillary loading, frictional losses, and the gas exchange
processes [93]. The work delivered to the piston over the compression and expansion
strokes is shown in Figure 5.16 to be a function of the location of start of combustion.
Maximum work output is obtained for starts of combustion around TDC. Combustion that
begins too advanced of TDC in the compression stroke results in reduced work output.
Figure 5.17 details the in-cylinder analysis of an example SOI timing sweep at a fixed rate
of EGR. Depicted within the figure are in-cylinder pressure prior to TDC and part way
down the expansion stroke (a), P.dV which is used to calculate the IMEP and helps
identify where work is gained and lost (b), the net rate of heat release (c), and finally the
cumulative net heat release (d). Notably for advanced combustion phasings, and
improving progressively as timing is retarded, ringing of the pressure traces is evident in
Chapter 5 Studies of Noise, Ignition Delay, and Combustion Phasing to SupportAssessments of PCCI Combustion
B. Keeler 57 University of Nottingham
Figure 5.17. Ringing is a phenomenon associated with rapid changes of pressure which
trigger acoustic modes in the combustion chamber [94]. Commonly encountered with
premixed combustion, ringing manifests itself through oscillations on the pressure trace,
and is more clearly identifiable on the rate of heat release graphs (c).
Advanced combustion from the earliest injection timings (-20 and -15°ATDC) are seen to
occur extremely rapidly with short combustion duration and high rates of heat release.
Although combustion efficiencies for these points are very high (~99%) the cumulative net
heat releases are lower relative to more retarded combustion phasing, attributed to a
greater amount of heat transfer and blowby losses [17]. Graph a also indicates pressures
well above compression pressures before TDC. Analysis of graph b reveals that some
negative work is introduced. Although the value of P·dV increases to a more positive
value compared with later injection timings, recovering some of the work, the lower
associated pressures down the expansion stroke result in the overall sum over the
compression and expansion strokes (IMEPg) being lower, indicating lower work output.
This will naturally impact on bsfc.
For advanced injection timings that result in the shortest ignition delay period (~SOI-
7.5ºATDC) less time is available for fuel-air premixing. Since the EGR rate remains
constant and mixing intensity should not be significantly varied (swirl ratio should be
relatively constant and injection pressure remains unchanged), no noteworthy increase in
the rate of mixing should occur. This leads to the formation of fuel rich regions which can
result in increased emissions [41]. Figure 5.16 also shows that combustion that is
excessively retarded of TDC also results in a decrease in work output, which deteriorates
significantly the further into the expansion stroke combustion begins. Figure 5.17 reveals
that as injection timing is retarded, combustion phasing retards and combustion duration
increases. The reduction in peak rates of heat release and spreading out of the combustion
do not cause the total net heat released to decrease until the latest start of combustion (SOI
+1.5°ATDC). However, work output clearly decreases as SOC is retarded. Figure 5.18
elucidates to deteriorating combustion efficiency, corroborated by Figure 5.17 which
demonstrates the spreading out and retarding of the combustion reduces the maximum
P·dV values reached. Examination of Figure 5.18 also reveals advancing combustion
phasing (SOC) to be desirable in maximising combustion efficiency. Naturally the same
combustion efficiency can occur for different starts of combustion.
The use of a pilot injection of conventional timing (~-20ºATDC) reduces the ignition delay
of the main injection, advancing its combustion relative to single injection cases even for
very high equivalence ratios (as labelled on Figure 5.18). However, these low air-to-fuel
Chapter 5 Studies of Noise, Ignition Delay, and Combustion Phasing to SupportAssessments of PCCI Combustion
B. Keeler 58 University of Nottingham
ratios in combination with the injection timings employed evidently led to rapid
deterioration in combustion efficiency. High rates of EGR retard the pilot combustion
phasing, which for fixed main injection timing can result in the main fuel quantity being
delivered into or very soon after the pilot combustion event. The higher associated
pressures and temperatures act to shorten the ignition delay, giving the main fuel injection
less time to mix with air. However, the high overall equivalence ratios require more time
for mixing due to the low oxygen availability. This leads to a greater proportion of MCC
of the main fuel injection. High levels of dilution combined with the downward motion of
the piston in the expansion stroke results in longer combustion duration and reduced
temperatures, which hinders the complete oxidation of CO and HCs which have been
found to require temperatures of at least 1500 K and 1200 K respectively for complete
oxidation [41, 42, 44]. It is clear therefore, that deterioration in combustion efficiency is
strongly but not uniquely dependent on the location of start of combustion. Consequently
calibration parameters such as rate of EGR and injection strategy must be carefully
matched so as to avoid such deteriorations as revealed in Figure 5.18.
Specific fuel consumption exhibits an inverse relationship with work output. The top
graph of Figure 5.19 illustrates that gross indicated specific fuel consumption (isfcg) is a
function of combustion phasing, where isfcg is given by [9]:
,
f
g
i g
misfc
W
(5.9)
Gross isfc can be seen to be dependent on the SOC location, but multiple values for the
same SOC location are evident. This is related to both the combustion efficiency (Figure
5.18) and duration (defined as the period between SOC and EOC). In general terms when
combustion occurs in the expansion stroke shorter combustion durations result in lower
isfc since a greater proportion of the fuel’s chemical energy is released closer to TDC.
Conversely when combustion is advanced and phased in the compression stroke longer
combustion durations are beneficial in reducing isfc since less negative work is introduced.
This is a simplified evaluation of the trend since heat transfer and blowby effects have not
been investigated which also influence work output [95], significantly so under certain
conditions such as cold start where heat transfer is high and the net heat released (for a
given quantity of fuel burned) is reduced.
The lower speed-load condition (1500 rpm 6.8 mg fuelling) illustrated in Figure 5.19 has
higher gross indicated specific fuel consumption. This may be attributed to the net result
of decreased mechanical efficiency and increase in indicated fuel conversion efficiency as
the load is reduced, and a decrease in indicated efficiency (due to increasing importance of
frictional and heat losses) and increased mechanical efficiency as the speed decreases [9].
Chapter 5 Studies of Noise, Ignition Delay, and Combustion Phasing to SupportAssessments of PCCI Combustion
B. Keeler 59 University of Nottingham
5.4.3 Effect of EGR
The reduction in oxygen availability with increased EGR slows down the chemical
reactions and extends combustion duration as well as increasing the time required for
mixing. For highly advanced injection timings (such as -20ºATDC) this is beneficial since
the dilution extends the ignition delay, thus better combustion phasing and reducing fuel
consumption result. Conversely for more retarded injection timings that result in load
outputs lower than maximum potential output, the reduced oxygen availability with
dilution is detrimental to fuel consumption since SOC and the subsequent combustion
occurs later in the expansion stroke. The severity of deterioration in fuel economy is
dependent on other calibration factors such as fuel rail pressure and quantity delivered, but
in general increasing the EGR rate worsens fuel consumption for these injection timings
and accelerates the fuel consumption penalty. This offers the opportunity to retard
injection timings and lower the rate of EGR for constant fuel consumption if a constraint
were to be imposed on a particular response, such as CO or HC emissions for a given
running condition. However, the consequent effects on combustion noise and other
emission responses would have to be determined, with NOx and combustion noise likely
increasing (soot is more difficult to predict given the complexity of the formation and
oxidation and resultant engine-out emission).
5.4.4 Temperature and Mixing
Low emissions of both CO and HC are encountered when combustion is advanced,
especially before TDC. Figure 5.19 reveals CO continues to decrease (albeit slightly) with
advancing SOC from TDC, however HC (shown in the bottom graph) increases slightly
from its minimum value just prior to TDC. This can be attributed to a small degree of
over-leaning of the fuel-air mixture as injection timings are advanced where a small
proportion of the fuel mixes lean of the flammability limit, or to wall wetting.
Nevertheless the most advanced injection timings within the data sets displayed are not
constrained by CO and HC emissions. This is mirrored by Figure 5.18 which indicated
very high levels of combustion efficiency for SOC around and before TDC.
Long ignition delays are known to be a source of HC formation due to over-mixing. Work
carried out by Musculus et al. [96] has lead to the understanding that a large proportion of
the lean mixtures are formed at the end of injection where jet velocities are slowing down.
Advancing injection timings to increase the ignition delay can thus cause increases in the
formation of HC and CO emissions, but for suitably phased combustion, oxidation
processes can be sufficiently completed on engine time scales to minimise engine-out
emissions. This is not necessarily the case for retarded phasings. As combustion is
retarded past TDC, CO and HC begin to increase. The fuel is burned in a cooler
Chapter 5 Studies of Noise, Ignition Delay, and Combustion Phasing to SupportAssessments of PCCI Combustion
B. Keeler 60 University of Nottingham
environment further away from the thermodynamically efficient location of TDC, leading
to less complete combustion and increased CO and HC emissions in the exhaust.
Analysis of Figure 5.19 highlights the severity of the increase in incomplete combustion
with retarding SOC. For the data points where a pilot injection is used the injection
timings of the pilot and main injections are fixed at -25° and +1.0°ATDC respectively,
with varying level of dilution dictating the main SOC. The deterioration in combustion is
seen to occur more rapidly than the data points without a pilot injection, highlighting the
sensitivity to EGR-SOI combination. The pilot injection reduces the main ignition delay
of the main injection which tends to advance the combustion, but the combustion duration
increases as the ratio of diffusion-to-premixed burning increases. A greater proportion of
the fuel is therefore burned further into the cooler expansion stroke, leading to less
complete combustion. The data with pilot at 1800 rpm 9.7 mg indicate a threshold is
reached, after which extremely high CO penalties are encountered.
Figure 5.19 also indicates that higher load conditions generally result in lower CO and HC
emissions. Higher temperatures favour complete oxidation of formed combustible species
including CO and HC, which have been reported to require at least ~1500 K and ~1200 K
respectively [41, 42, 44]. The improved oxidation of the species allows more retarded
combustion phasing with higher loads before deterioration in combustion efficiency. Also,
as noted by [42], at lower fuelling quantities the production of the majority of CO and HC
is dominated by incomplete bulk-gas reactions. The net result is an increase in engine-out
emissions as shown.
5.5 Concluding Remarks
Increasing the ignition delay allows more time for fuel-air premixing, but this can be
achieved in a number of ways. Conditions at the time of injection play an important role
in its determination and can be exploited through injection timing. The reduction of
oxygen availability with increased EGR increases ignition delay, but will be shown to
have important consequences in the soot output. The start of combustion (phasing) must
be considered when analysing the relative performance of combustion strategies. In
general, the highest combustion efficiencies are obtained for advanced phasings, whilst
minimum indicated specific fuel consumption is obtained when SOC is marginally
retarded of TDC. Combustion phasing affects the heat release of the fuel and greatly
influences combustion noise output, which correlates well with the peak rate of pressure
rise. This tends to increase with advancing phasing and rates of heat release and
combustion phasing must therefore be considered when employing potential strategies.
B. Keeler 61 University of Nottingham
CHAPTER 6
ENGINE BASELINE PERFORMANCE
AND PROTECTION OF PRESSURE
TRANSDUCERS AGAINST SOOT
6.1 Introduction
The performance of the test engine operating with a calibration designed for conventional
combustion is investigated within this chapter. This calibration was installed as a
development aid for test bed operation and as such was not of product release quality. At
the conditions examined, the calibration makes use of settings which are representative of
those of the final product. Amongst other factors the strategy makes use of pilot(s) and
main injections, EGR, VGT vane control, and fuel rail pressure variation.
The chapter begins with the findings from a test matrix completed to evaluate the
responses obtained when operating under the pre-production calibration. In particular the
trends of emissions and fuel consumption are presented, together with anomalies
encountered with the testing. Following this, the evaluation of a standard operating point
run periodically to assess the repeatability and consistency of results obtained is discussed.
One problem encountered was fouling of in-cylinder pressure transducers and their
adaptors. The design and performance of four different transducer adaptors are scrutinised,
before the final discussion and conclusions relating to the chapter are given.
6.2 Engine Baseline Performance
In order to understand the engine calibration and ascertain what limits the use of a
conventional DI Diesel strategy, a reference set of data was obtained to provide a useful
baseline from which the performance characteristics of the PCCI combustion could be
compared. The relative benefits and penalties of employing a PCCI strategy can then be
better understood, as well as providing insight into potential limitations of the test engine.
The test engine used was an early development version of the production engine with
components and features which were revised in later versions. The deficiencies of the
early design were responsible for isolated problems at particular speeds. A prime example
was of a pressure wave travelling through the intake system at certain test conditions
Chapter 6 Engine Baseline Performance and Protection of Pressure Transducers
B. Keeler 62 University of Nottingham
around 2000 rpm due to the lack of a tuned intake system with the test bed installation.
This wave caused an oscillation in turbo speeds with the compressor surging then slowing.
The condition 2000 rpm 200 Nm was an example case of this phenomenon, hence the
slightly lower engine speed used for mapping the engine performance.
During the baseline performance experiments the dynamometer was used to fix the engine
speed, whilst the load was controlled by the position of the pedal which supplied the ECU
with a torque demand input. The standard settings in the ECU were used for all other
variables and recorded as described per Chapter 3. Once the emissions analysers had
reached the required operating temperature and had been successfully calibrated, the
engine was warmed up at 1500 rpm 50 Nm with the EGR valves closed. Once the engine
was fully warm and the coolant and oil temperatures had become stable, the engine speed
and load of the first test point were selected. Table 6.1 illustrates the test matrix
completed by taking emission measurements from both engine banks for the baseline
mapping of the engine. The test matrix was completed three times over a two week period
to allow an average set of data to be obtained, and any anomalies identified. The averaged
emissions indices for each test point are illustrated in Figure 6.1 together with the average
EGR rates and bsfc figures, the latter of which are seen to reduce with load for a given
engine speed.
Graph 5 of Figure 6.1 clearly highlights the scale of the problem faced with regard to soot
output from running a conventional DI diesel strategy. Smoke values in excess of 1.0 FSN
are evident for the majority of the test points covered, highlighting the need to investigate
strategies to reduce soot output. PCCI strategies potentially offer a solution, but any
change in calibration must not incur excessive penalties from other responses such as
emissions and fuel consumption. It should be noted that the pre-production strategy
calibration was set up for low NOx emissions and as such higher soot output could be
expected since this would be oxidised by the DPF prior to tailpipe emission. Graph 1
(Figure 6.1) confirms the calibration has been realised, except for the 1000 rpm 150 Nm
condition, where EGR was very low (graph 4), a possible anomaly in the prototype
calibration. Noticeably soot emissions are very low at this point, true to the conventional
NOx-soot trade-off.
A general trend of CO and HC emissions decreasing with increasing load is evident. As
loads increase a greater amount of energy can be recovered by the turbocharger and higher
boost pressure can be generated, increasing the availability of oxygen in the cylinder for
oxidation of the fuel and combustible species. The higher in-cylinder temperatures
encountered due to the release of increased amounts of chemical energy from higher fuel
Chapter 6 Engine Baseline Performance and Protection of Pressure Transducers
B. Keeler 63 University of Nottingham
quantities is also beneficial to the oxidation processes. Again at a condition of 1500 rpm
200 Nm soot and CO emissions have not yet been optimised.
6.3 Standard Test Point
During the course of the experiments a standard test point was carried out periodically to
ensure the engine and analysers were working correctly, and so consistency of results
could be evaluated. In total 37 in-cylinder pressure data readings were taken, whilst 30
sets of data were recorded for all other data (such as emissions) over a period of 20 months
which encompassed the major timeframe of data acquisition. The number of samples (30
or 37) is listed in Table 6.2, the difference coming from the fact that the emissions
analysers were not used for every testing session. The operating conditions for the
standard test point were 1500 rpm, 0.8 mg pilot injection SOI -20.5º (demand), 7.0 mg
main injection SOI +1.8ºATDC (demand), EGR valves Pulse Width Modulation (PWM)
52%, VGT vanes PWM 7%, and the intake throttle wide open.
Day-to-day variations in ambient conditions such as laboratory temperature inevitably
occur, but it is important that the engine and analysers behave in a consistent and
repeatable manner. Performing a standard condition allows these differences to be
quantified and any potential errors in the equipment rectified before testing continued. It
was found that the CO2 analyser for the intake measurement, together with the NOx and
HC analysers required the most careful attention since these were the analysers with which
errors had been detected on numerous occasions. The standard test point also allowed
conclusions to be drawn as to the accuracy and validity of the experimental data and the
sensitivity of specific parameter measurements. Table 6.2 details the responses obtained
over the 20 month period. The greatest variations were found in CO, HC, NOx, and smoke
emissions. Larger relative variations in CO and NOx emissions can be attributed to the
low values being measured. In the case of CO, the lowest measurement range that the
emission analyser could be set to was 0-5%, whilst the average value of 0.12% was
obtained from the standard test. Small variations in the value obtained on a particular test
therefore result in high percentage and Coefficient of Variation (CoV) differences.
Similarly, NOx readings were low, again resulting in large percentage differences. Due to
the complexity involved in soot formation and oxidation, and ultimately net output,
variation in smoke emissions is inevitable. As will be discussed later in the thesis, small
changes in temperature, airflow through the engine, rate of EGR, or other variables can
significantly affect soot emissions.
Air temperature was found to vary significantly over the course of the experimental work.
Over the standard condition testing, air temperature (in the laboratory) varied from 15°C to
Chapter 6 Engine Baseline Performance and Protection of Pressure Transducers
B. Keeler 64 University of Nottingham
26°C depending on the time of year, weather conditions, and the number of other engines
operating in the laboratory at the same time. This affects several parameters, notably the
AFR, and is believed to affect the in-cylinder behaviour of the induced gases. Engine
speed, load output (brake and indicated), fuel rail pressure, and fuel consumed by the
engine were all within 2% CoV, signifying the engine operating conditions were well
controlled and repeatable. Overall analysis of the standard test point shows that a good
degree of repeatability and accuracy was obtained, whilst the responses that showed
greater variation could be explained logically, and in real world applications variations
will naturally occur.
6.4 Transducer Adaptors
6.4.1 Introduction
Accurate measurement of in-cylinder pressure is essential when examining combustion
characteristics and responses to applied inputs. Within the context of a fixed test-bed
research environment it is not unreasonable to expect to have to perform regular
maintenance on equipment including sensors. During this investigation the majority of the
pressure data have been post-processed, but the use of such data in monitoring online
applications (for example in closed-loop control of fuel injection strategy) are becoming
evermore common [97]. In-cylinder pressure measured online could potentially be used
by the engine ECU to balance cylinders, improving engine vibration and smooth running
of the engine, as well as monitoring combustion noise and improving the use of commonly
used look-up tables. A more detailed review of such applications can be found in [31].
Two Kistler 6055B transducers used to measure cylinder pressure were installed in place
of the glow plugs. This requires the use of an adaptor to simulate the dimensions of a
glow plug as well as being robust and non-sensitive to both thermal shock and fouling.
Since a significant part of the experimental work carried out was at conditions producing
extreme soot levels not produced on a working strategy, there existed a possibility of
fouling of particular screens. In total four different pressure transducer adaptors were
tested in the engine, all installed in the glow-plug holes. Problems with original designs
clogging with soot had been encountered hence the experimentation with the following
designs. The designs tested are illustrated in Figure 6.2, where the letters correspond to
the following description;
a) Multi-hole on flats (15xΦ1mm)
b) Multi-hole on chamfer (4xΦ1mm)
c) Open (no shielding)
d) Slot (Φ2.5 mm, slot 1mm x 22mm)
Chapter 6 Engine Baseline Performance and Protection of Pressure Transducers
B. Keeler 65 University of Nottingham
6.4.2 Multi-hole Design Adaptors
Adaptors (a) and (b) are dimensionally most similar to the glow-plugs they replaced. The
1mm diameter drilled holes allow the pressure to be transferred through to the transducer
diaphragm for measurement. Both designs offer good shielding of the transducer,
ensuring the combustion flame is quenched and unable to reach the diaphragm. Standing
waves and Helmholz resonance are not an issue since there are no open passages to
consider. With adaptor (a) three flats were machined onto the main shaft and 5 holes
drilled along each with equal spacing. In adaptor (b) four holes were drilled into the
chamfer between the main shaft and transducer housing. Adaptor (b) was initially
installed in both cylinders containing the reference Kistler 6055B transducers. However,
during preliminary testing IMEP measurements were found to deteriorate with time.
When the adaptors were removed, it became apparent that the drilled holes had become
clogged with soot, potentially hindering accurate pressure measurement.
It was found that adaptor (a) could be left in the sooty environment of the engine longer
than adaptor (b), but the holes still eventually became packed with soot, requiring
cleaning. The effect of this clogging will be discussed in section 6.4.5. Figure 6.3
provides photographs of adaptors (a) and (d) when clean and after an extended period
within the engine (dirty). Although organic deposits are found around and within the slot
adaptor (d), it is evident that significantly less obstruction to pressure measurement is
introduced compared to the more fouled multi-hole adaptor (a).
6.4.3 Open Design Adaptor
Removing the tip of the adaptor was considered (c), but this leaves the transducer exposed
with insufficient shielding. The problem of clogging is therefore potentially exchanged for
one related to thermal shock which can occur since there is no flame shield to quench the
high-temperature combustion flame. Thermal shock results in temporary deformation of
the transducer diaphragm, causing an incorrect pressure to be recorded. Although a minor
consideration, a slightly larger change of approximately 1.5% in compression ratio is also
encountered. For these reasons the open design was not used to collect the data presented
within this work.
6.4.4 Slot Design Adaptor
With adaptor (d) a 22mm long 1mm slot was machined to allow soot to exit the adaptor.
The open channel allowed effective pressure measurement, whilst the slot helped to solve
the clogging issue and prevent resonant frequencies interfering with the measurement.
The slot adaptor was designed to maintain the clearance volume as close as possible to that
of the original setup with standard glow plugs installed. The reduction in compression

Chapter 6 Engine Baseline Performance and Protection of Pressure Transducers
B. Keeler 66 University of Nottingham
ratio was calculated to be 0.17, or 1%, an acceptable concession given the benefits
provided during testing with high soot.
The final design negated the need for holes by having a hollow tip with sufficient material
to ensure the required strength and structural rigidity. A slot machined down the side of
the tip allows gas and soot to escape the cylindrical body, thus solving the problem of
sooting. Keeping the slot at a width of 1mm also ensured that the combustion flame was
quenched before reaching the transducer diaphragm, thus protecting against thermal shock.
As noted above, photographs of clean and dirty slot adaptors are shown in Figure 6.3.
6.4.5 Adaptor Performance over Time
Due to the nature of the testing involved during the investigation, high values of soot
emissions were experienced. As mentioned above, this resulted in the adaptors housing
the in-cylinder pressure transducers to become clogged. The IMEP data that are included
in Table 6.2 are an average of two cylinders on opposing engine banks, separated by 360°
in the firing order (cylinders 3 and 4). The slot transducer adaptor (d) was installed in
cylinder 3, whilst cylinder 4 contained adaptor (a) with holes drilled on flats. Figure 6.4
illustrates the variation in IMEP for the two cylinders, whilst Figure 6.5 shows the average
IMEP of the two cylinders together with the engine BMEP at the standard test condition
over time. Cylinder 3 is known to be more powerful than 4, and as such a difference in
IMEP between the two is expected. However, after test point 12 both net and gross IMEP
values from cylinder 4 deteriorate to lower values, attributed (at least in part) to the
clogging of the transducer adaptor. The drop in IMEP occurred during the closed part of
the cycle since gross IMEP values decreased (compression and expansion strokes only),
whilst the pumping work remained relatively constant, resulting in the net IMEP
continuing to be a fixed amount lower than that of the gross. The drop in IMEP was in the
region of 0.25 bar and as such it was not possible to detect any anomalies in P.dV data
(used in IMEP calculations). After the transducers and adaptors were removed and
cleaned (Micro solution followed by ultrasonic bath) and the engine conditioned for an
extra period, the IMEP values can be seen to increase closer to previous values (point 16
onwards). Variations can be expected in the absolute values over the year due to ambient
conditions such as changes in temperature, humidity, and pressure, especially over the
periods of time included within the data (~20 months). Once cleaned, IMEP values are
seen to be consistently higher than when the adaptor was clogged. It is worthwhile to note
that combustion noise levels recorded were not adversely affected, despite using the same
pressure signal that was recorded by the data acquisition system. This implies combustion
noise measurement is less sensitive than IMEP.
Chapter 6 Engine Baseline Performance and Protection of Pressure Transducers
B. Keeler 67 University of Nottingham
Figure 6.4 also displays the IMEP data from cylinder 3. Both gross and net IMEP values
for this cylinder are seen to be much more stable across the data range with much lower
variability. Although the transducer adaptor in this cylinder did become tarnished with
soot (see Figure 6.3), and some soot was found on the transducer diaphragm, it was not
subject to clogging and no pronounced dip in IMEP is noticed.
6.5 Concluding Remarks
This chapter has described the analysis of the pre-production engine under its baseline
calibration and highlighted the requirement to resolve an important issue regarding in-
cylinder pressure measurement. By acquiring steady state data over a matrix of speed and
load conditions the behaviour of the engine under a conventional combustion strategy was
assessed. High net soot output was encountered at the majority of conditions tested, which
resulted in fouling of the in-cylinder pressure transducer adaptor. The designed transducer
adaptor reduced maintenance intervals. In terms of practical application this offers a clear
advantage should online pressure monitoring be required by the ECU, for cylinder
balancing or monitoring combustion noise. However, some of the test conditions
generated extreme soot outputs that would not be experienced in a production engine. The
use of a standard test point has been invaluable in ensuring the correct operation and
repeatability of the engine and sensors.
B. Keeler 68 University of Nottingham
CHAPTER 7
EXHAUST GAS RECIRCULATION
7.1 Introduction
This chapter addresses the use of EGR and examines the benefits and consequences of
employing high fractions of recycled gas with an aim to reduce NOx and soot emissions,
CNL, and help control combustion phasing. As was explained in Chapter 2, EGR has
been used extremely effectively to lower combustion temperatures and limit NOx
formation. However, increasing the level of EGR frequently results in increases in soot
output due to lower oxygen concentration and lower combustion temperatures. When
adapting to operate a PCCI strategy, trade-offs encountered and any negative effects must
be identified and the limits understood, which are the main aims of the chapter. Particular
attention is paid to the effects of temperature and equivalence ratio to understanding the
emissions responses. Notably, temperature and oxygen availability will be shown to play
key roles in the determination of net soot output, consistent with the formation regions
shown in Figure 1.4. After discussing the effects on soot output when using varying levels
of EGR, NOx, CO and HC emissions are studied. Finally the potential detrimental effects
to the engine and extra required maintenance are discussed.
7.2 Temperature
Charge temperature at the time of fuel injection affects the development of combustion
and the formation of emissions. Although the Φ-T diagrams point to the significance of
temperatures between 1600K and 2500K in the formation of soot in fuel rich zones, local
Φ-T maps require detailed CFD simulations. An adiabatic flame temperature based on the
stoichiometric fuel-air equivalence ratio is relatively easy to calculate with software
available in the literature and provides a simple indicator of temperatures associated with
high net soot emissions. This is likely to be a more reliable measure of temperature in a
standard diesel diffusion flame than using the overall equivalence ratio, but only a fraction
of the mixture will be at this equivalence ratio. Here, the adiabatic flame temperature has
been calculated using the experimentally measured exhaust gas composition, the AFR, and
the in-cylinder bulk-gas temperature to estimate the initial enthalpy of the reactants.
Experimental data for NOx emissions and net soot concentration in the exhaust gases are
plotted against adiabatic flame temperature in Figure 7.1. Note that net soot reflects the
difference between the two competing processes of formation and oxidation. Although the
Chapter 7 Exhaust Gas Recirculation
B. Keeler 69 University of Nottingham
partially-premixed diesel combustion is not homogeneous, high levels of net soot output
nevertheless fall within a relatively narrow range of values of local stoichiometric
adiabatic flame temperatures (bottom graph). Figure 7.1 illustrates that the highest levels
of soot output occur in a critical range of temperatures 1600-2700K, similar to the soot
formation temperatures indicated on the Φ-T diagrams [17]. The top graph illustrates the
relationship between the stoichiometric adiabatic flame temperature and NOx emissions.
Low values are associated with temperatures below approximately 2300 K, after which
they increase exponentially. This value compares well with the NO formation regions
illustrated on the Φ-T maps which indicate the importance of temperatures over 2200 K
(with Φ<2). Maintaining the peak flame temperature below this value is therefore
necessary to minimise NOx output. The knowledge gained from these relationships is
extremely useful in understanding the mechanisms involved, but these temperatures are
adiabatic estimates that represent the maximum values expected since heat transfer,
incomplete combustion, or molecular dissociation would act to lower these values.
Factors other than temperature are also important in determining the level of emissions,
including oxygen availability and the degree of fuel-air mixing.
Despite passing through heat exchangers, the EGR gases are still much hotter than the
fresh air that is displaced. This causes an increase in the intake temperature, illustrated by
Figure 7.2 for three different speed-fuelling combinations. This increases the initial
temperature of the reactants prior to ignition. The maximum achievable flame temperature
also increases with ambient gas temperature as previously illustrated in Figure 3.1.
Control over intake temperatures therefore has important ramifications in influencing local
temperatures. Pickett et al. [60] demonstrated that the rate of soot precursor formation and
the peak precursor yield increased with ambient temperature, but that the increased
temperature was also beneficial to their oxidation. Similarly, the benefits of reducing
intake temperature by improving the cooling of the EGR gas have been demonstrated in
[61]. Increased oxygen concentration due to higher intake density was found to limit the
amount of mixture with Φ>2 (locally), allowing the soot formation peninsula to be avoided
to a greater extent. Nevertheless, the effect of the dilution with EGR is to lower the
adiabatic flame temperatures as demonstrated in Figure 7.3. This influences the path taken
in the Φ-T plane and can move local conditions into (or out of) the soot formation
peninsula and is one of the mechanisms producing potentially large swings in soot
emissions [17]. Although soot formation occurs on the local scale, global parameters
clearly affect local conditions and the subsequent reactions.
Chapter 7 Exhaust Gas Recirculation
B. Keeler 70 University of Nottingham
7.3 Equivalence Ratio
The overall fuel-air equivalence ratio is dictated by the relative amount of air flow since
control over the fuel injected is always maintained. The increase in temperature associated
with the recirculation of exhaust gases causes a thermal throttling effect, resulting in an
increase in equivalence ratio if the injected fuel quantity is kept constant.
The relationship between EGR and overall equivalence ratio is important. Typically the
deterioration in soot or combustion efficiency places an upper limit in its value. Assuming
EGR is not limited by other factors, such as pressure gradient between the exhaust and
intake manifolds, it will be constrained by the relationship between stoichiometric air-to-
fuel ratio ( sAFR ), mass flow rate of fuel, and the total mass flow rate in the cylinder.
Basing the overall equivalence on air and fuel induced in the fresh charge, then [17]:
1
C
EGR
(7.1)
Where
2
s f
i vol d
AFR mC
NnV
(7.2)
The derivation of the above equation can be found in Appendix 3. The intake air density
is taken as the air density in the inlet manifold (mixture of fresh air and EGR). The
relationship between calculated using the above Equations and Equation 4.21 is linear
since they yield the same equivalence ratio. The expressions presented here allow the
contributing factors to the determination of equivalence ratio to be separated and highlight
the dependence of on EGR. Figure 7.4 demonstrates three fixed fuelling rates with
14.6sAFR (that of the test fuel). As EGR displaces air in the intake flow, overall
equivalence ratio increases and eventually exceeds an indicative upper limit, an example
of which is shown in the Figure. As fuelling is increased, the upper limit on EGR drops
from ~65% to ~45% then to ~25% for the three cases presented. Since the EGR will
contribute to the oxygen content of the trapped charge, in effect lowering the equivalence
ratio, these will be conservative limits on EGR [17].
To lower the equivalence ratio the air flow has to be increased or the fuelling rate
decreased. A trade-off between available boost and EGR is encountered due to the highly
coupled nature of the turbocharger-EGR systems. For the test engine there was limited
boost pressure available at the lower fuelling quantities (9.7 mg and 6.8 mg) at mid-high
rates of EGR. Although more boost is available at higher fuelling rates, which can be
helpful in lowering Φ, for a given rate of EGR the overall equivalence ratio will be higher
Chapter 7 Exhaust Gas Recirculation
B. Keeler 71 University of Nottingham
than with a lower fuelling rate (as indicated by Figure 7.4). As previously mentioned
reducing the intake temperature to increase its density is potentially an effective way to
increase the air flow through the engine and consequently reduce the overall equivalence
ratio.
7.4 Effect on Emissions
7.4.1 Soot
For a given rate of EGR the fuel-air equivalence ratio depends on the fuel quantity
delivered. Therefore the data presented in the graphs in this Chapter are plotted against
equivalence ratio. The fuel-oxygen equivalence ratio is important when considering soot
output as it affects both the formation and oxidation processes. As the overall fuel-oxygen
equivalence ratio increases, the oxygen concentration in the cylinder decreases. The
higher level of dilution extends the ignition delay to allow more time for mixing [23, 27],
but the mass of air that must be mixed with the fuel to achieve the same equivalence ratio
increases [13]. Although the soot formation rate decreases with increasing EGR as
combustion temperatures are lowered, the time required for mixing increases as the
oxygen entrainment rate is low, effectively increasing the stoichiometric AFR (by mass)
[87]. This increases the residence time at conditions suitable for soot formation. The soot
formation rate is also highly dependent upon charge temperature. Higher charge
temperatures significantly increase this rate, leading to the conclusion that intake cooling
is a necessity for limiting soot production. This requires that EGR gases be sufficiently
cooled prior to intake and highlights the requirement for EGR coolers of appropriate
efficiency.
Lower oxygen concentration in the cylinder with increased EGR also reduces oxidation of
the formed soot. The retarding of combustion phasing results in less time available for
soot oxidation processes. If temperatures decrease significantly with the expanding
volume, complete oxidation may not be possible. The combination of increased formation
and reduced oxidation can therefore lead to increased net soot output as illustrated by
Figure 7.5. Akihama et al. [12] showed that low values of soot can still be achieved at
high equivalence ratios if temperatures are kept low enough and/or mixing is enhanced
sufficiently to avoid (or limit) the residence time in the soot formation peninsula in the Φ-
T plane (Figure 1.4). However, achieving this at higher loads is extremely challenging.
The effectiveness of increasing EGR to lower soot and NOx is in agreement with the work
of other researchers. Figure 7.6 demonstrates the effect of increasing the level of EGR on
soot emissions. Taking the data at 1800 rpm 9.7 mg shown in the bottom graph as an
Chapter 7 Exhaust Gas Recirculation
B. Keeler 72 University of Nottingham
example, for an injection timing of -5°ATDC increasing EGR from 30% to 50% shows a
significant increase in soot output. Although combustion temperatures will be lowered by
the additional dilution, the reduction in temperature is not sufficient to prevent fuel
pyrolysis and as such soot formation still occurred. The increase in equivalence ratio
requires more mixing time and prolongs the time for soot precursor formation [13, 87]. As
EGR is further increased to 52% and then 54% soot output decreased, attributed to
temperatures reducing below that required for fuel pyrolysis. When this occurred the soot
formation rate decreased faster than soot oxidation rate, resulting in reduced net soot
output, consistent with the findings of [20]. The resultant combustion is seen in Figure 7.7
to be much more retarded and peak rates of heat release much lower as EGR increased and
temperatures lowered. This trend of soot initially increasing then decreasing when an
EGR threshold is reached is consistent with other contemporary works including [12, 20,
23]. However, as Figure 7.6 indicates, this trend is not always seen to occur. Here soot
output for several data series are seen to exhibit the conventional EGR-soot trade-off,
indicating PCCI combustion is not achieved. Low soot output is still obtainable at high
equivalence ratios with retarded injection timing and combustion phasing, but this results
in deteriorating combustion efficiency and increased fuel consumption. For example, for
the rich point circled on the top graph of Figure 7.6 the molar content of CO is 1.7% (EICO
0.23 kg/kg-fuel). Reducing soot formation is crucial to PCCI strategies since oxidation
processes are negatively affected by reductions in oxygen availability and lower
temperatures. Avoiding the formation regions as shown in Figure 3.2 is essential.
7.4.2 NOx
The Φ-T maps indicate that the formation of oxides of nitrogen occurs above 2200 K at
local equivalence ratios less than 2. Emissions of NOx are primarily controlled with EGR,
although injection timing and mixture preparation also affect their production. Diluting
the intake mixture with EGR lowers combustion temperatures as the diluent molecules
absorb heat. In particular the burned gas products of H2O and CO2 have high heat
capacities. The reduction in temperature and oxygen availability is detrimental to soot
oxidation, but is advantageous in suppressing NOx. The reduction of NOx with increasing
equivalence ratio is illustrated in Figure 7.8. Clearly the higher the EGR rate (and
consequently equivalence ratio), the lower the NOx emitted. However, the figure suggests
that once a certain equivalence ratio is reached, the extra increase in EGR required to
further reduce NOx emissions requires a much larger relative increase in Φ which is likely
to impose constraints on other responses such as soot, combustion efficiency, and fuel
consumption. Beyond this condition dependent threshold further increase of EGR may
result in a case of diminishing returns of benefit-cost when considering all responses
collectively.
Chapter 7 Exhaust Gas Recirculation
B. Keeler 73 University of Nottingham
7.4.3 NOx-Soot Trade-off
With conventional combustion a well documented trade-off between soot and NOx
emissions exists. Increasing the rate of EGR has been shown to reduce NOx emissions, but
can result in increased soot. However, extending the time for mixing and reducing
combustion temperatures can be effective in reducing both emissions. Figure 7.9
demonstrates the effect of varying EGR fraction on the trade-off at fixed injection timings.
For the higher fuelling case (top graph) low soot is shown to be achievable for retarded
injection timings where combustion occurs later in the cooler conditions of the expansion
stroke. Slightly more advanced injection timings are seen to be prone to higher outputs of
soot, exhibiting the traditional trade-off with NOx. This highlights the importance of
correctly matching EGR and injection timing. Departure from the traditional NOx-soot
trade-off is also evident, which ultimately is the goal of employing low-temperature PCCI
combustion. Starting from low EGR and increasing the recycled fraction, soot is seen to
increase. After reaching its peak it then begins to fall, at which point both soot and NOx
decrease with increasing EGR, demonstrating simultaneous low soot and NOx values can
be achieved through equivalence ratio control with appropriate injection timing.
7.4.4 CO, HC, bsfc, and the NOx-HC trade-off
The sources of CO and HC emissions differ. CO is a product of incomplete combustion,
and the many sources of HC emissions have been discussed in Chapter 2. Nevertheless,
oxidation of both species is dependent on oxygen availability and temperature and thus
highly sensitive to the rate of EGR. Figure 7.10 illustrates the effect on CO and HC
emissions for the same data sets presented above for soot and NOx. A dependence on SOI
can be seen where a more retarded injection timing, with corresponding more retarded
combustion phasing, generally results in higher CO and HC emissions. The deterioration
in HC can also be seen to occur at lower equivalence ratios for more retarded injection
timings. Spatially, increasing EGR slows down the rate of oxidation throughout the
cylinder, significantly so in the squish volume, resulting in increased CO and HC
emissions from this region [41]. The greater mass of air that must be mixed with the fuel
with increased dilution is also detrimental to the oxidation processes of CO and HC.
Higher fuelling quantities generate higher load output and higher in-cylinder bulk-gas
temperatures due to the extra chemical energy released compared with lower fuelling rates.
The extra temperature is beneficial to the oxidation processes and as such combustion
phasing can be more retarded before combustion efficiency deteriorates rapidly. The
effect of dilution on specific fuel consumption is also significant. The bottom graph of
Figure 7.10 demonstrates that bsfc tends to increase with increasing equivalence ratio, but
that the severity of the increase is also a function of injection timing. Raising EGR
fraction retards combustion phasing and the causes the heat release to spread out.
Chapter 7 Exhaust Gas Recirculation
B. Keeler 74 University of Nottingham
Combined with the deterioration in combustion efficiency (shown by the increase in CO
and HC emissions), the result is reduced load output and a consequential increase in bsfc.
NOx and HC emissions have shown a traditional trade-off relationship. Whereas the NOx-
SOOT trade-off can be improved by shifting combustion away from the formation regions
in the Φ-T plane, NOx and HC behave in opposite ways with EGR and temperature. As
the equivalence ratio is increased (by increasing the rate of EGR), NOx emissions reduce
but at the expense of HC emissions, illustrated in Figure 7.11. Retarding combustion can
be effective at reducing NOx, but again HC emissions increase due to the lower
temperatures affecting their oxidation.
7.5 Effect of EGR on the Engine and Maintenance
The use of increased levels of EGR has been shown to potentially result in significant
increases in soot emissions. The effect on the reliability of the engine must also be
considered for a practical application. Certain vulnerabilities have been noted that have
required extra maintenance to be carried out to uphold smooth running of the engine.
Components and systems affected include:
In-cylinder pressure transducer adaptors clogging (design dependent)
EGR valves sticking due to clogging effect or contamination (results in turbo
speed imbalance between the two banks)
Internal surfaces of EGR coolers becoming fouled due to soot deposition. This can
affect the thermal performance of the cooler [98] and restrict the gas pathway.
Although the maintenance on these parts is relatively straightforward in a test bed
environment, reduced service intervals on vehicles would not necessarily be tolerated by
consumers and access to the affected components is less readily available when installed in
a vehicle. Also, it is interesting to note that the next generation V6 diesel engine which is
due to replace the 2.7l version will be equipped with different EGR and turbocharger
systems. In the new 3.0l setup the EGR valves will be located on the exhaust manifold
side of the EGR cooler (hot-side) in contrast to the inlet side (cold-side) on the current
generation engines [99]. This change has been implemented to prevent condensation of
combustion deposits which can affect the efficiency of the EGR system, which will
hopefully improve the problem of sticking valves noted above.
7.6 Concluding Remarks
The use of EGR is necessary to limit combustion temperatures and avoid excessive NOx
formation, but soot output is liable to increase. To avoid increases in net soot output
formation must be reduced to a greater extent than oxidation. Increasing EGR raises the
overall fuel-air equivalence ratio proportional to 1/ 1 EGR . Despite increasing ignition
Chapter 7 Exhaust Gas Recirculation
B. Keeler 75 University of Nottingham
delay, a greater mass of ambient air must be mixed with the fuel to attain a given local
equivalence ratio, which consequently affects the combustion path in the Φ-T plane.
Although a highly complex process, high levels of net soot fall within a relatively narrow
range of adiabatic flame temperatures (1600-2700K) based on the stoichiometric
equivalence ratio. Similarly, NOx output is relatively low until a threshold flame
temperature of 2300K after which it increases exponentially. The effect of global
parameters on local conditions is therefore highly important, and EGR rates must be
carefully selected with injection timing to avoid excessive emissions and appropriate
combustion phasing.
B. Keeler 76 University of Nottingham
CHAPTER 8
FUEL INJECTION PARAMETERS
8.1 Introduction
Injection timings have a significant effect on formation and oxidation of emission species,
combustion noise levels, and fuel consumption. Within this chapter these responses are
investigated when subjected to injection timing (SOI) sweeps, ranging from retarded of
TDC, to highly advanced in the compression stroke up to -20ºATDC. Work published by
the author in [17] documented the effect on emissions at baseline fuel rail pressure, with
particular interest paid to soot emissions. The benefits and penalties of various injection
timings are assessed to provide an understanding of the trade-offs encountered when
exploiting potential strategies to simultaneously reduce soot and NOx emissions. When a
pilot injection of conventional timing is employed (~-20ºATDC) its combustion increases
the in-cylinder pressure and temperature and reduces the ignition delay of the main
injection as explained in Chapter 5. Consequently, less time is available for premixing of
the main injection. Results previously presented have highlighted the effect this has on
soot emissions. The use of a conventional pilot injection strategy is thus limited by soot
output due to reduced levels of premixed charge and increased levels of MCC. The effect
of a pilot will be discussed in Chapter 10, but in the following chapter in order to provide a
clearer understanding of the influence of injection timing on the responses the results
presented concentrate on single injection strategies at fixed rate of EGR. Two speed-
fuelling rates comparable to NEDC conditions are presented and scrutinised, before the
possibility of adding a post-main injection to reduce soot output is discussed. The second
part of the chapter addresses the effect of raising rail pressure on the responses
investigated.
8.2 Injection Timing at Baseline Fuel Rail Pressure
8.2.1 Soot and NOx output
As with increasing the level of dilution, injection timing greatly affects the level of soot
output, as illustrated in Figure 8.1 graph a. The earliest injection timings presented allow
long ignition delays to premix the charge. With reference to Figure 3.2 this allows the
soot formation region to be avoided to a greater extent. Combustion occurs before TDC
with rapid rates of heat release and short associated combustion durations (Figure 5.17 on
Chapter 8 Fuel Injection Parameters
B. Keeler 77 University of Nottingham
page 164). Plenty of time for oxidation of formed soot is available as the combustion
process is complete soon after TDC, but this is dependent on oxygen availability and
temperature. For advanced injection timings such as -15° to -10°ATDC, ignition delays
shorten (Figure 8.1 graph b) as the in-cylinder pressure and temperature increase
approaching TDC. The reduced mixing time allows for less premixing, with the
combustion path more akin to that of conventional combustion (Figure 3.2 top graph) with
increased diffusion burning and higher soot output. Further retarding injection timing can
be seen to result in lower soot output. This is attributed to lower temperatures as
combustion occurs further into the expansion stroke, whilst further extending the ignition
delay, providing more time for mixing. Combustion commences at a lower local
equivalence ratio than for the advanced SOI PCCI strategy due to the SOI-EGR
combination, which helps to avoid the soot formation region. Examination of the in-
cylinder pressure data reveals that combustion spreads out and lower rates of heat release
are generated. The effect of EGR rate on soot output is also shown in Figure 8.1 graph a
for two speed-fuelling conditions. Although the same rise and fall in soot is found with
injection timing for all four data sets, higher rates of EGR clearly result in more violent
swings in soot output. Despite increasing the ignition delay (Figure 8.1 graph b), the
increased time for soot formation with increased dilution combined with lower soot
oxidation rates results in higher net peak soot outputs as the soot formation peninsula in
the Φ-T plane is not avoided. Peak soot output was found to correspond to when the start
of combustion is a few degrees retarded of TDC (note, SOC is not shown here, but can be
determined from Figure 8.1 graph b), which corresponds to optimal fuel economy.
As noted in [100], injection timing has a major effect on NOx emissions, with the
emissions increasing with timing advance. This is illustrated in Figure 8.1 graph c where
NOx emissions increase with advancing injection timing at fixed EGR. Since NOx
formation is kinetically governed, and its production occurs predominantly within the
diffusion flame and in the burned gases following the end of combustion, there must still
be partial heterogeneity even at the most advanced injection timings. Peak in-cylinder
pressures increase in line with advancing SOI as combustion is advanced (Figure 5.17
graph a on page 164). The increase in NOx emissions correlates with the peak in-cylinder
pressure as injection timing is advanced as shown by Figure 8.2. The higher pressures
lead to higher combustion temperatures and residence (dwell) time at conditions suitable
for NO formation as previously burned gases are compressed to higher pressures and
temperatures. This trend was also found experimentally using the same test engine by
Catanese [31], who proposed a generic function for the prediction of NOx emissions which
correlated well with a function of peak in-cylinder pressure. It should be noted that
combustion efficiencies deteriorate for the more retarded combustion phasings and as such
Chapter 8 Fuel Injection Parameters
B. Keeler 78 University of Nottingham
less of the fuel energy is released. Consequently there is less opportunity for NOx
formation. However, the differences in combustion efficiencies between advanced (for
example -10ºATDC) and highly advanced (-20ºATDC) injection timings is negligible for
the data presented (<~1%), but NOx emissions are seen to be consistently higher for the
more advanced timings. This highlights a minor drawback when displaying data in the
form of emission indices.
The NOx-soot trade-off for different injection timings is illustrated in Figure 8.3 with a
single injection. Two rates of EGR are given for each speed-fuel quantity condition
presented. At the lower rates of EGR for each of the conditions (35% and 50%) the NOx
range within the trade-offs is seen to be larger, but the soot range smaller. In both cases
higher peak soot outputs were found at the higher EGR rates. The optimum points are
generally seen to be at the most retarded injection timings, where NOx is minimised and
soot is close to the minimum. However, this results in poor combustion efficiency and
high fuel consumption as combustion phasing is retarded excessively far away from TDC.
Highly advanced injection timings that resulted in extremely low levels of soot (Figure 8.1
graph a) can be seen in Figure 8.1 graph c to be at the expense of higher NOx emissions. If
such advanced injection timings were to be used a high rate of EGR is shown to help
reduce the NOx penalty, but combustion noise levels are still excessively high (~96 dB(A)
for this case).
8.2.2 Fuel consumption, CO, and HC
Low emissions of both CO and HC were encountered when combustion was advanced,
especially before TDC. Graph a of Figure 8.4 illustrates that CO continued to decrease
with advancing SOI from TDC, however HC (shown in graph b) increased slightly from
its minimum value corresponding to an SOI of -12.5ºATDC where combustion was phased
just prior to TDC. This could be attributed to a degree of over-leaning of the fuel-air
mixture where a small proportion of the fuel mixes lean of the flammability limit. Wall
wetting by the fuel spray due to over-penetration in the lower ambient density environment
is also possible. Nevertheless even the most advanced injection timings within the data
sets displayed exhibit low CO and HC emissions and do not constrain the choice of
advanced timing strategies. As combustion is retarded past TDC, CO and HC begin to
increase. As was discussed in Chapter 5, the fuel is burned in a cooler environment further
away from the thermodynamically efficient location of TDC. The residence times above
the temperatures required for rapid near complete oxidation (1500 K and 1200 K for CO
and HC respectively [41]) are reduced, leading to less complete combustion. The effect of
EGR on the emission responses is also visible in the figures. Increased dilution is seen to
result in higher CO and HC emissions, a consequence of reduced oxidation rates.
Chapter 8 Fuel Injection Parameters
B. Keeler 79 University of Nottingham
For advanced injections the major source of CO and HC production likely stems from
excessive fuel penetration in the squish volume with lower ambient density, leading to
over-rich mixture formation. With more retarded injections less fuel is delivered to the
squish region and more to the piston bowl. Over-lean mixtures can form that lead to
slower combustion and therefore delayed oxidation in cooler environments. This leads to
an increase in emissions, the severity of which accelerates with retardation [41].
Inspection of Figure 8.4 graph c illustrates an optimum SOI exists for each speed-fuel
quantity condition. The lowest specific fuel consumption values are obtained when SOC
occurs slightly retarded of TDC. Here no negative work is introduced in the compression
stroke that later would have to be recovered. Therefore adjusting the SOI to compensate
for the increase in ignition delay with higher levels of EGR allows fuel consumption to be
minimised. However, comparison with Figure 8.1 reveals that these timings occur within
the higher regions of soot output, as more of the fuel is burned under conventional
combustion conditions, potentially prohibiting the use of these timings.
Load conditions also affect the emission indices for CO and HC and bsfc, with responses
increasing as the fuel quantity was reduced. Taking the cases of 1800 rpm 9.7 mg 43%
EGR and 1500 rpm 6.8 mg 60% EGR as examples, both have very similar overall fuel-air
equivalence ratios (0.62) but the lower speed-load case has consistently higher CO and HC
emissions across the timing range. Sjöberg and Dec [42] explain that the formation of
these species is dominated by incomplete bulk-gas reactions as fuelling is decreased.
Over-lean mixtures with associated low combustion temperatures hinder complete
oxidation of CO in the time periods available.
8.3 Post injections
The effectiveness of adding a post–main injection has been examined. The chief difficulty
observed with the main-only and pilot-plus-main injection strategies is limiting soot levels
at combinations of EGR and injection timings which offer acceptable noise, NOx and bsfc
outputs. A post-main injection has been used to increase soot oxidation previously formed
by the main fuel combustion. Yun and Reitz [101] and others [102-104] suggest that a
small post-main injection raises temperature and generates turbulence promoting mixing
both of which help the oxidation of soot formed earlier. The results plotted in Figure 8.5
are for a post-main injection of 0.8 mg/stk/cyl (injector demand) with the main quantity
adjusted to maintain the total injected constant at 9.7 mg/stk/cyl. The data cover a range
of timings of the post-main injection for two rates of EGR; 35% and 45%. Minimum soot
output can be seen to occur when the post-main is injected in the range 20-30°ATDC. At
this timing, the post-main reduced soot by ¼-⅓, whilst NOx and combustion noise remain
Chapter 8 Fuel Injection Parameters
B. Keeler 80 University of Nottingham
unchanged and the penalty in HC emissions is negligible at earliest timing in the range
(shown in Figure 8.5) [17]. This level of soot reduction is consistent with other published
works [102-104], and the use of a post-main injection therefore allows an improvement in
the NOx-soot trade-off. As illustrated by Figure 8.5 the disadvantage of the post-main
injection is a fuel consumption penalty is incurred because the post-main fuel has been
taken from the main event and contributes relatively little to the work output. If the post-
main is injected too early, such as in the region shaded in Figure 8.5, the fuel is injected
into the main combustion event resulting in increased pyrolysis of the fuel and higher soot
output. Retarding the post-main past the optimum stated can still reduce soot output, but
at the expense of fuel economy and HC emissions.
Maintaining the desired fuel injection quantities was also a significant problem with the
current test engine setup. Following the main injection event a pressure wave can travel
through the common-rail accumulator, leading to instability in the system and fuel rail
interactions where an incorrect post injection is delivered (in quantity and injection
pressure). Damping of these pressure oscillations may be required should subsequent
injection strategies be pursued further. Overall although post injections can reduce soot,
this has not been found to be a particularly effective route to limit soot emissions with the
available test engine and the benefit must be weighed against penalties to fuel
consumption and HC emissions [17]. Reducing the amount of soot formed was deemed a
higher priority, and will be pursued further in the subsequent sections of the thesis. The
use of multiple injections to reduce soot emissions can be found in other pertinent works,
including Eastwood [105] and Brooks [76].
8.4 Effect of Raising Fuel Rail Pressure
8.4.1 Overview
The effect of fuel rail pressure has been investigated with the aim of reducing soot and
NOx emissions by improving mixture preparation. Pickett and Siebers [67] explain that
increasing the distance between the injector and the farthest upstream location of high
temperature combustion (the lift-off length) allows greater entrainment of air into the fuel
jet. Figure 8.6 illustrates the proposed effect on the combustion path through the Φ-T
plane for a generic PCCI strategy. The effects of raising rail pressure on the responses
examined earlier in the chapter have been explored, with particular attention paid to soot.
The degree to which the rail pressure has to be increased to obtain the desired reductions
in soot output is also investigated. The changes in combustion characteristics are
discussed and related to the effects on emission, fuel consumption, and combustion noise
responses. Two different operating conditions are presented throughout, culminating in a
Chapter 8 Fuel Injection Parameters
B. Keeler 81 University of Nottingham
discussion of implications when considering potential combustion strategies. The findings
of this chapter are incorporated into the investigations in Chapter 9 to determine a broader
operating region of PCCI combustion.
The injection pressure was increased by raising the pressure in the fuel rail. Figure 8.7
illustrates the reduction in injection duration with increasing fuel rail pressure. Although
the engine could theoretically deliver up to 1650 bar rail pressure, this level was not
approached for safety reasons since the engine was a pre-production model. The highest
rail pressure demanded was 1200 bar, leaving a generous safety margin, but allowing the
trends to be examined. In the data presented, injection timing sweeps were carried out at
fixed EGR rates at two different speed-load conditions; Case A at 1500 rpm 6.8 mg, and
case B at 1800 rpm 9.7 mg. EGR rates of 60% and 48% (average Φ of 0.6 and 0.8) were
used for the two cases respectively to facilitate low NOx emissions and help limit
combustion noise from excessive rates of heat release. Results from experiments at
baseline rail pressures have been included in the results to act as a benchmark against
which the responses at higher rail pressure can be compared.
Before the findings are discussed, it is worthwhile to note here that a discrepancy is
noticed in the responses for the injection timing of -5ºATDC for case B, highlighted by
dotted circles where appropriate on Figure 8.12 through to Figure 8.16. For this data,
despite the injection timing, fuel quantity, and fuel rail pressure being fixed in the engine
management, the combustion phasing was retarded by several degrees. This caused
reductions in combustion noise and soot, and increased CO and HC emissions as well as
bsfc. The exact cause of the retarded heat release is unknown, but this isolated condition
highlights the importance of control over FIE.
8.4.2 Combustion characteristics
The in-cylinder pressure data and derived heat release analysis for three example injection
timings of -17.5º, -12.5º, and -2.5º are shown in Figure 8.8, Figure 8.9, and Figure 8.10
respectively. These timings are representative of highly advanced, advanced, and
relatively retarded injection timings and will act as examples for results discussed in the
following sections. Comparison of the three Figures reveals that rates of change of
pressure and the peak pressures encountered decrease as injection timing is retarded,
reducing the combustion noise level (shown later in Figure 8.18). It is also interesting to
note that the total net heat released increases as injection timing and consequently
combustion phasing is retarded. This is in spite of the fact that combustion efficiency
deteriorates as combustion is more retarded in phasing, attributable to reduced heat
transfer and blowby loses [17].

Chapter 8 Fuel Injection Parameters
B. Keeler 82 University of Nottingham
For the most advanced SOI, rates of heat release tend to increase from 600 bar to 1200 bar
rail pressure, but the differences in peak rates for the highest pressures are marginal. Very
similar heat release profiles are noted for rail pressures of 800 and 1000 bar, although
differences in emission and fuel consumption responses are found. For an advanced SOI
(-12.5ºATDC), rate of heat release increases with rail pressure and combustion can be seen
to be slightly more advanced for the highest two rail pressures (Figure 8.9). In all cases
combustion is phased such that the majority of the fuel energy is released after TDC,
which helps to improve indicated fuel conversion efficiency relative to the most advanced
injection timings.
The effects of increasing rail pressure with injections close to TDC, such as -2.5ºATDC, is
to advance the combustion phasing leading to a reduction in ignition delay (Figure 8.11).
The peak rate of heat release and cumulative total for the 1200 bar case are lower than the
other rail pressure cases. This can be partly explained by a deterioration in combustion
efficiency as indicated by Figure 8.12 (bottom graphs), but does not offer a complete
explanation. During the testing the fuel quantity demand was adjusted to maintain total
fuel consumption to a target mass flow rate. With the experimental setup it was not
possible to measure the actual fuel delivered to individual cylinders and as such variations
in the distribution of fuel between the cylinders could theoretically vary slightly depending
on the rail pressure and injection timing. The effect of cylinder balancing was previously
investigated on the test engine by a previous researcher [31], but this was not implemented
into the engine strategy. Variations in fuel delivered and thus potential heat released could
therefore have occurred. The emissions results are presented in terms of emissions indices
and therefore account for variations in fuelling, but the calculated Mean Effective
Pressures and heat release analysis are not normalised by fuel quantity.
Conditions suitable for auto-ignition must be reached before the onset of combustion
reactions. For the current test engine the earliest SOC obtained has been in the region -
10°ATDC. Combustion does not initiate until at least this location, where temperature and
pressures are suitable providing the charge has mixed within flammability limits. As
illustrated by Figure 8.11 the ignition delay for the most advanced injections is therefore
not greatly affected by the increase in injection pressure. However, increased mixing
intensity and enhanced air entrainment are achieved. For advanced injection timings, such
as -7.5°ATDC (corresponding to near peak soot output), the fuel is injected into a hotter
and higher pressure environment compared with the advanced injection timing cases.
Thermodynamic conditions are favourable for ignition once the charge has mixed
sufficiently. The increased injection pressures enhance the mixing and as such reduce the
Chapter 8 Fuel Injection Parameters
B. Keeler 83 University of Nottingham
time required to mix within flammability limits. This can advance the combustion and
hence shorten the ignition delay, as shown in Figure 8.11 for SOIs more retarded than -
7.5ºATDC.
8.4.3 Soot and NOx Output
The effect of fuel rail pressure on soot emissions for different injection timings is
illustrated in Figure 8.13. As the legends indicate, variations in the overall equivalence
ratio were obtained due to differences in airflow through the engine. Naturally variations
between individual points exist but all were within 5% of the mean value of Φ. The same
trend of soot output increasing, reaching a maximum in the SOI range -10° to -5°ATDC,
then decreasing as injection timing was further advanced was encountered at all injection
pressures, consistent with the findings presented at baseline rail pressure. As the rail
pressure increases, soot output clearly decreases across the whole injection timing range.
The higher speed-load condition has higher associated soot output which can be attributed
to a number of causes. Firstly despite the lower EGR rate, the equivalence ratio is
significantly higher. Secondly, the tolerance to EGR decreases as the fuel quantity
increases and a greater amount of chemical energy is released [106]. This will be
discussed further in Chapter 9 where load and speed limits are investigated.
The locations of peak soot output highlighted on Figure 8.13 vary between the two
conditions with the corresponding SOI for the higher speed-load case (case B) being more
advanced (bottom graph). In both cases, however, a reduction in soot output of 94-96%
was achieved when increasing the fuel pressure from the respective baseline values to the
maximum values presented (900 bar and 1200 bar). Better atomization of the fuel with
increased injection pressure resulting in a greater number of droplets of smaller size,
combined with improved air entrainment within the fuel spray helps to reduce local
equivalence ratios. For example, by increasing injection pressure from 900 bar to 1200
bar Nishida et al. [107] reported an increase of approximately 40% more air entrained into
the spray which reduced the average equivalence ratio of the spray. The increase in jet
velocity also creates increased in-cylinder turbulence and improved fuel-air mixing
intensity [18, 108]. The combined effects result in lower local equivalence ratios and
shifts conditions away from the soot formation region [18]. Returning to the proposed
combustion path in the Φ-T plane depicted in Figure 8.6, the lower local equivalence ratios
that form with lower spatial fuel density in the cylinder which helps to avoid the soot
formation region shown on the Φ-T maps. Soot oxidation is also likely improved as found
by [23], who predicted higher concentrations of OH radicals with increased rail pressures.
However, in the experimental work presented within this thesis it is not possible to
separate the effects since it is net soot in the exhaust that is measured. Although reduction
Chapter 8 Fuel Injection Parameters
B. Keeler 84 University of Nottingham
in soot is obtained across the entire timing range with increased rail pressures, it is most
noticeable around peak soot output timings, where ignition delay and thus mixing time are
shortest. The greater proportion of diffusion burning at the lowest rail pressure (600 bar in
case B) is possibly more identifiable from the cumulative heat release graphs (c) than in
(b) for the earlier injection timings (Figure 8.8 and Figure 8.9) since it is not masked by
ringing. For these timing examples, the lowest pressure has lower associated peak rates of
heat release and longer combustion durations. This more progressive burning has
emission response implications, leading to higher relative levels of soot.
Despite the reduced mixing time with increased injection pressure for SOIs around TDC,
soot emissions are still reduced since the benefit from improved mixing intensity
outweighs the penalty of less mixing time. It is evident that both improving mixing
intensity (increased injection pressures) as well as longer mixing times (advanced injection
providing long ignition delays) are effective at reducing soot emissions [18, 108].
However, combustion temperatures were still high enough to form NOx, but the data
presented in Figure 8.14 demonstrate the high rates of EGR (60% and 48%) were effective
at suppressing its formation with peak values obtained not exceeding 1.1 g/kg fuel at either
test condition. Advancing SOI from -2.5° to -20°ATDC resulted in an increase in NOx
emissions. The higher in-cylinder pressures encountered at advancing timings lead to an
increase in generation of NOx as noted previously. Examination of Figure 8.14 reveals
that a stronger dependency exists with overall equivalence ratio than rail pressure in that
higher equivalence ratio data sets (510 and 700 bar) exhibit lower NOx outputs. This
suggests that control over dilution dominates the effect on NOx emissions to a greater
extent than rail pressure at this condition, which does not limit the strategy of raising
pressure. In contrast, when rail pressure was increased in case B, a minor increase in NOx
emissions was detected. Although Figure 8.11 demonstrates that large differences in
ignition delay were not found, peak rates of heat release were generally greater for the
higher injection pressures, especially across the timing range -15º to -7.5ºATDC where
bsfc is at its minimum. Yun et al. [108] demonstrated similar findings with NOx
increasing with increasing rail pressure, but their results were obtained without EGR and
found ignition delay decreased. However, the use of heavy rates of EGR in this current
investigation maintained extremely low NOx values (~30 ppm), in contrast to the 1200
ppm encountered in [108] which could account for some of the differences. Mixture
preparation must also be considered. The more advanced phasing and higher associated
temperatures with increased rail pressure would tend to increase NOx production, but the
improved mixing intensity with higher rail pressures leads to the formation of lower local
equivalence ratios and reduces the amount of high temperature mixing-controlled
combustion, thus partially offsetting the effect [15]. The combination of high rates of

Chapter 8 Fuel Injection Parameters
B. Keeler 85 University of Nottingham
EGR and improved mixing are thus countered by increased peak pressures as rail pressure
increased, leading to only negligible variations on NOx emissions. With reference to the
Φ-T maps, the simplified combustion regions highlighted in Figure 1.5 demonstrate the
effect of increasing the level of dilution and improving mixture preparation as combustion
progresses from conventional to PCCI.
Despite the EGR rate being regulated to maintain the target value, the equivalence ratio
became slightly leaner as injection timing is retarded. The more retarded combustion that
ensued resulted in higher pressures at EVO, and consequently those pre-turbine, allowing
more work to be recovered by the turbochargers. Boost pressure increased (albeit
slightly), but AFR increased by 8% between the most advanced SOI to the most retarded.
The increased air flow and intake pressure resulted in more oxygen in the cylinder which
could enhance NOx formation, but temperatures were likely lower due to the phasing, more
than counteracting the oxygen availability in formation terms.
8.4.4 Fuel Consumption
Although increasing the injection pressure is highly effective at reducing soot emissions, a
fuel consumption penalty is incurred. The severity of the increase in bsfc when raising
fuel pressure from the baseline values is illustrated in Figure 8.15. To minimise the
penalty, injection timing can be phased so as to maximise brake load output, but this
corresponds to the range of peak soot output. Circled on the graphs are the lowest bsfc
points for baseline and highest pressure cases. Increases in bsfc of 32% and 16% are
incurred for cases A and B respectively whilst the corresponding soot emissions fall 94%
and 97%. However, Figure 8.13 reveals that significant reductions in soot can still be
obtained without raising the fuel pressure TO the maximum values. This is promising
when considering the soot-bsfc trade-off illustrated in Figure 8.16. For example, in case B
increasing fuel pressure to 800 bar yields an 88% reduction in soot at the cost of only 6%
bsfc increase relative to the baseline fuel pressure. In practical terms this might well be a
more realistic strategy, corroborated by the proposals in [65]. As the top graph on Figure
8.13 demonstrates, the reduction in soot with increasing fuel pressure is more progressive
than the higher speed-load condition, but the overall soot emissions indices are lower.
Although increasing fuel pressure in this case from 510 bar to 700 bar lowers soot by 73%
at minimum bsfc timings, a significant expense of a 22% increase in fuel consumption is
still incurred.
One of the main contributing factors to the increase in bsfc is the extra power consumed
by the High Pressure (HP) fuel injection pump that increases in proportion to the rail
pressure [6]. This is identified in the increase in Friction Mean Effective Pressure (FMEP)
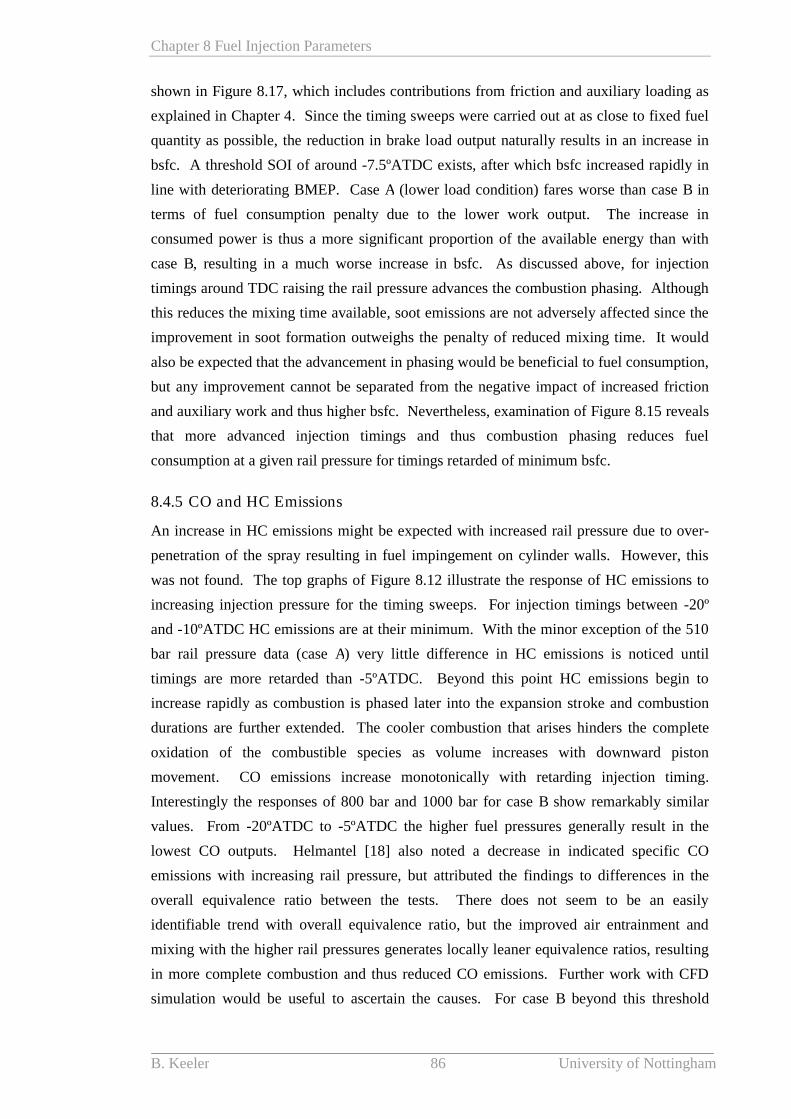
Chapter 8 Fuel Injection Parameters
B. Keeler 86 University of Nottingham
shown in Figure 8.17, which includes contributions from friction and auxiliary loading as
explained in Chapter 4. Since the timing sweeps were carried out at as close to fixed fuel
quantity as possible, the reduction in brake load output naturally results in an increase in
bsfc. A threshold SOI of around -7.5ºATDC exists, after which bsfc increased rapidly in
line with deteriorating BMEP. Case A (lower load condition) fares worse than case B in
terms of fuel consumption penalty due to the lower work output. The increase in
consumed power is thus a more significant proportion of the available energy than with
case B, resulting in a much worse increase in bsfc. As discussed above, for injection
timings around TDC raising the rail pressure advances the combustion phasing. Although
this reduces the mixing time available, soot emissions are not adversely affected since the
improvement in soot formation outweighs the penalty of reduced mixing time. It would
also be expected that the advancement in phasing would be beneficial to fuel consumption,
but any improvement cannot be separated from the negative impact of increased friction
and auxiliary work and thus higher bsfc. Nevertheless, examination of Figure 8.15 reveals
that more advanced injection timings and thus combustion phasing reduces fuel
consumption at a given rail pressure for timings retarded of minimum bsfc.
8.4.5 CO and HC Emissions
An increase in HC emissions might be expected with increased rail pressure due to over-
penetration of the spray resulting in fuel impingement on cylinder walls. However, this
was not found. The top graphs of Figure 8.12 illustrate the response of HC emissions to
increasing injection pressure for the timing sweeps. For injection timings between -20º
and -10ºATDC HC emissions are at their minimum. With the minor exception of the 510
bar rail pressure data (case A) very little difference in HC emissions is noticed until
timings are more retarded than -5ºATDC. Beyond this point HC emissions begin to
increase rapidly as combustion is phased later into the expansion stroke and combustion
durations are further extended. The cooler combustion that arises hinders the complete
oxidation of the combustible species as volume increases with downward piston
movement. CO emissions increase monotonically with retarding injection timing.
Interestingly the responses of 800 bar and 1000 bar for case B show remarkably similar
values. From -20ºATDC to -5ºATDC the higher fuel pressures generally result in the
lowest CO outputs. Helmantel [18] also noted a decrease in indicated specific CO
emissions with increasing rail pressure, but attributed the findings to differences in the
overall equivalence ratio between the tests. There does not seem to be an easily
identifiable trend with overall equivalence ratio, but the improved air entrainment and
mixing with the higher rail pressures generates locally leaner equivalence ratios, resulting
in more complete combustion and thus reduced CO emissions. Further work with CFD
simulation would be useful to ascertain the causes. For case B beyond this threshold
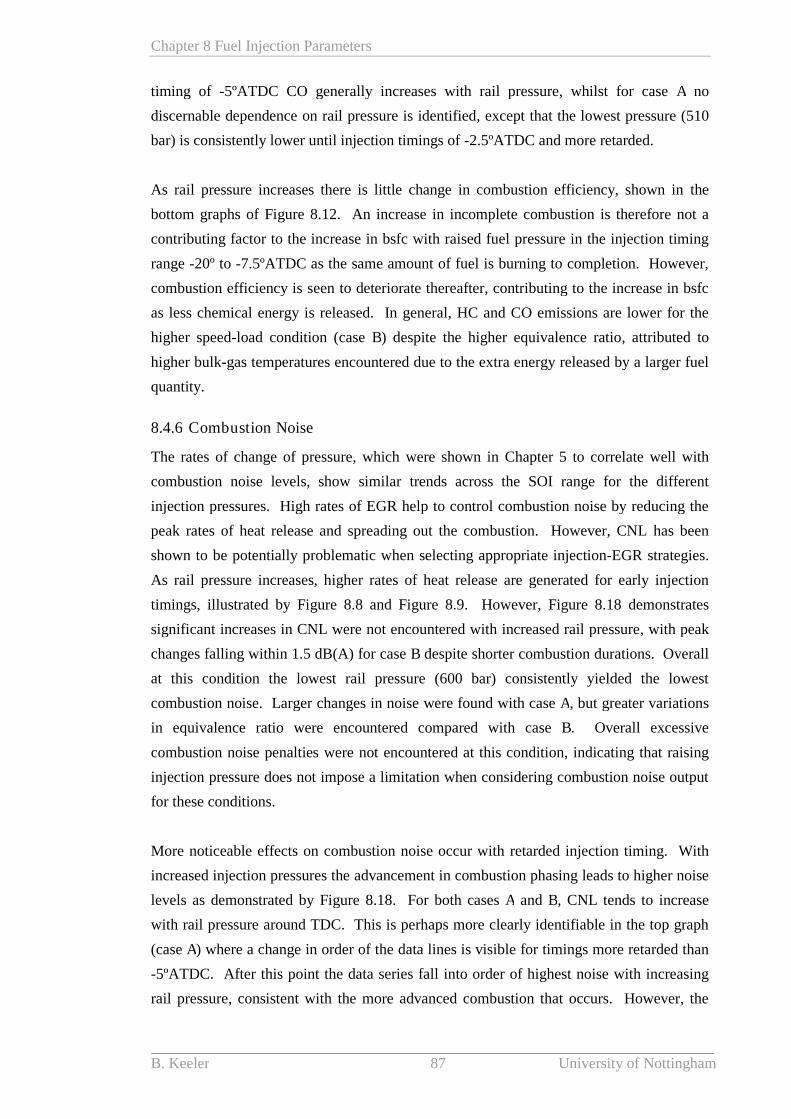
Chapter 8 Fuel Injection Parameters
B. Keeler 87 University of Nottingham
timing of -5ºATDC CO generally increases with rail pressure, whilst for case A no
discernable dependence on rail pressure is identified, except that the lowest pressure (510
bar) is consistently lower until injection timings of -2.5ºATDC and more retarded.
As rail pressure increases there is little change in combustion efficiency, shown in the
bottom graphs of Figure 8.12. An increase in incomplete combustion is therefore not a
contributing factor to the increase in bsfc with raised fuel pressure in the injection timing
range -20º to -7.5ºATDC as the same amount of fuel is burning to completion. However,
combustion efficiency is seen to deteriorate thereafter, contributing to the increase in bsfc
as less chemical energy is released. In general, HC and CO emissions are lower for the
higher speed-load condition (case B) despite the higher equivalence ratio, attributed to
higher bulk-gas temperatures encountered due to the extra energy released by a larger fuel
quantity.
8.4.6 Combustion Noise
The rates of change of pressure, which were shown in Chapter 5 to correlate well with
combustion noise levels, show similar trends across the SOI range for the different
injection pressures. High rates of EGR help to control combustion noise by reducing the
peak rates of heat release and spreading out the combustion. However, CNL has been
shown to be potentially problematic when selecting appropriate injection-EGR strategies.
As rail pressure increases, higher rates of heat release are generated for early injection
timings, illustrated by Figure 8.8 and Figure 8.9. However, Figure 8.18 demonstrates
significant increases in CNL were not encountered with increased rail pressure, with peak
changes falling within 1.5 dB(A) for case B despite shorter combustion durations. Overall
at this condition the lowest rail pressure (600 bar) consistently yielded the lowest
combustion noise. Larger changes in noise were found with case A, but greater variations
in equivalence ratio were encountered compared with case B. Overall excessive
combustion noise penalties were not encountered at this condition, indicating that raising
injection pressure does not impose a limitation when considering combustion noise output
for these conditions.
More noticeable effects on combustion noise occur with retarded injection timing. With
increased injection pressures the advancement in combustion phasing leads to higher noise
levels as demonstrated by Figure 8.18. For both cases A and B, CNL tends to increase
with rail pressure around TDC. This is perhaps more clearly identifiable in the top graph
(case A) where a change in order of the data lines is visible for timings more retarded than
-5ºATDC. After this point the data series fall into order of highest noise with increasing
rail pressure, consistent with the more advanced combustion that occurs. However, the
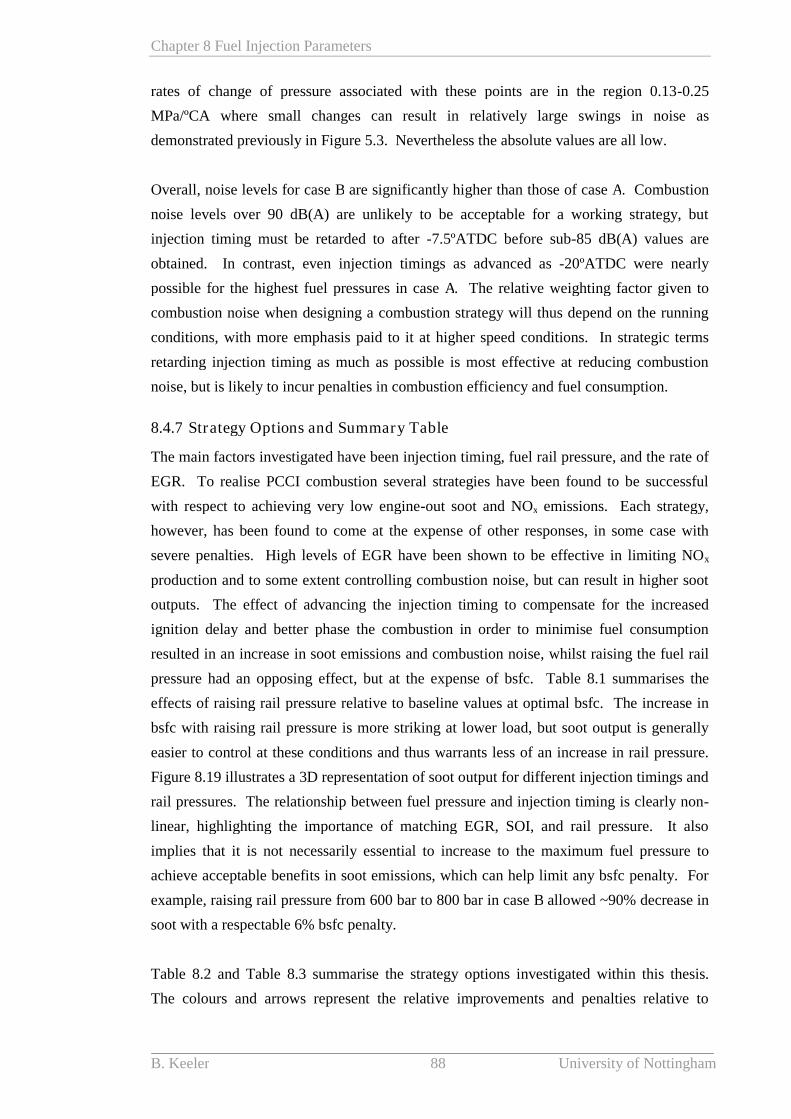
Chapter 8 Fuel Injection Parameters
B. Keeler 88 University of Nottingham
rates of change of pressure associated with these points are in the region 0.13-0.25
MPa/ºCA where small changes can result in relatively large swings in noise as
demonstrated previously in Figure 5.3. Nevertheless the absolute values are all low.
Overall, noise levels for case B are significantly higher than those of case A. Combustion
noise levels over 90 dB(A) are unlikely to be acceptable for a working strategy, but
injection timing must be retarded to after -7.5ºATDC before sub-85 dB(A) values are
obtained. In contrast, even injection timings as advanced as -20ºATDC were nearly
possible for the highest fuel pressures in case A. The relative weighting factor given to
combustion noise when designing a combustion strategy will thus depend on the running
conditions, with more emphasis paid to it at higher speed conditions. In strategic terms
retarding injection timing as much as possible is most effective at reducing combustion
noise, but is likely to incur penalties in combustion efficiency and fuel consumption.
8.4.7 Strategy Options and Summary Table
The main factors investigated have been injection timing, fuel rail pressure, and the rate of
EGR. To realise PCCI combustion several strategies have been found to be successful
with respect to achieving very low engine-out soot and NOx emissions. Each strategy,
however, has been found to come at the expense of other responses, in some case with
severe penalties. High levels of EGR have been shown to be effective in limiting NOx
production and to some extent controlling combustion noise, but can result in higher soot
outputs. The effect of advancing the injection timing to compensate for the increased
ignition delay and better phase the combustion in order to minimise fuel consumption
resulted in an increase in soot emissions and combustion noise, whilst raising the fuel rail
pressure had an opposing effect, but at the expense of bsfc. Table 8.1 summarises the
effects of raising rail pressure relative to baseline values at optimal bsfc. The increase in
bsfc with raising rail pressure is more striking at lower load, but soot output is generally
easier to control at these conditions and thus warrants less of an increase in rail pressure.
Figure 8.19 illustrates a 3D representation of soot output for different injection timings and
rail pressures. The relationship between fuel pressure and injection timing is clearly non-
linear, highlighting the importance of matching EGR, SOI, and rail pressure. It also
implies that it is not necessarily essential to increase to the maximum fuel pressure to
achieve acceptable benefits in soot emissions, which can help limit any bsfc penalty. For
example, raising rail pressure from 600 bar to 800 bar in case B allowed ~90% decrease in
soot with a respectable 6% bsfc penalty.
Table 8.2 and Table 8.3 summarise the strategy options investigated within this thesis.
The colours and arrows represent the relative improvements and penalties relative to
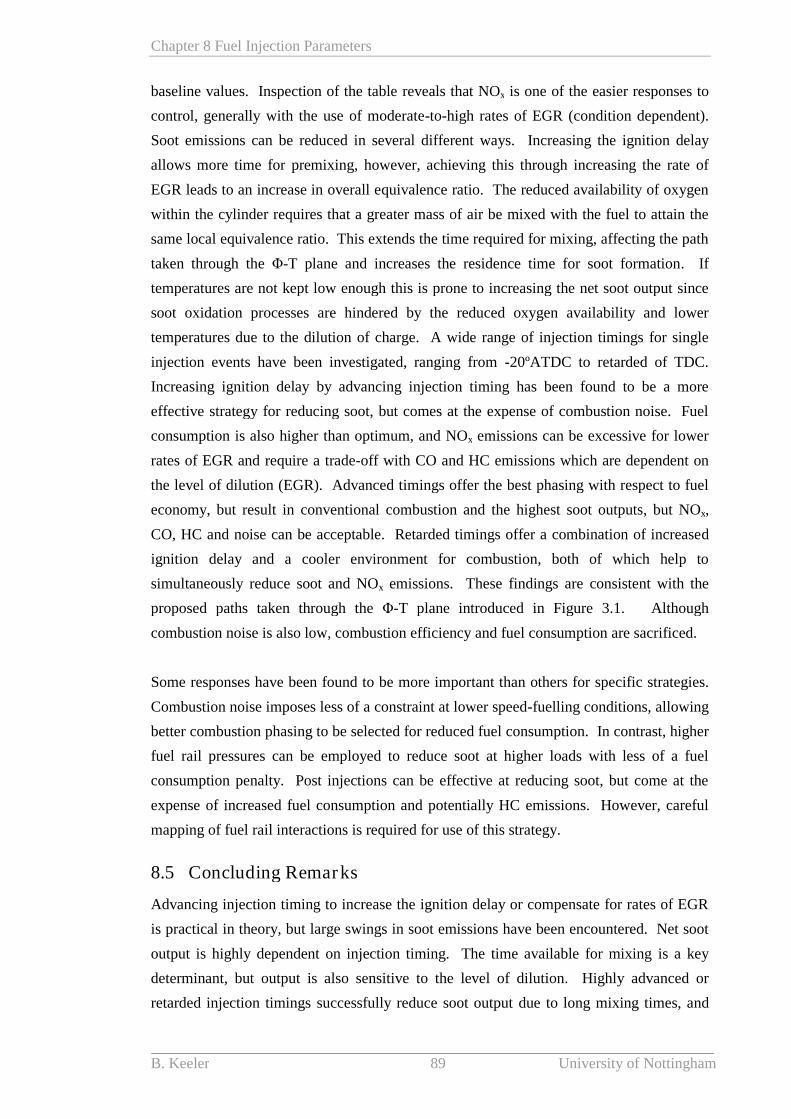
Chapter 8 Fuel Injection Parameters
B. Keeler 89 University of Nottingham
baseline values. Inspection of the table reveals that NOx is one of the easier responses to
control, generally with the use of moderate-to-high rates of EGR (condition dependent).
Soot emissions can be reduced in several different ways. Increasing the ignition delay
allows more time for premixing, however, achieving this through increasing the rate of
EGR leads to an increase in overall equivalence ratio. The reduced availability of oxygen
within the cylinder requires that a greater mass of air be mixed with the fuel to attain the
same local equivalence ratio. This extends the time required for mixing, affecting the path
taken through the Φ-T plane and increases the residence time for soot formation. If
temperatures are not kept low enough this is prone to increasing the net soot output since
soot oxidation processes are hindered by the reduced oxygen availability and lower
temperatures due to the dilution of charge. A wide range of injection timings for single
injection events have been investigated, ranging from -20ºATDC to retarded of TDC.
Increasing ignition delay by advancing injection timing has been found to be a more
effective strategy for reducing soot, but comes at the expense of combustion noise. Fuel
consumption is also higher than optimum, and NOx emissions can be excessive for lower
rates of EGR and require a trade-off with CO and HC emissions which are dependent on
the level of dilution (EGR). Advanced timings offer the best phasing with respect to fuel
economy, but result in conventional combustion and the highest soot outputs, but NOx,
CO, HC and noise can be acceptable. Retarded timings offer a combination of increased
ignition delay and a cooler environment for combustion, both of which help to
simultaneously reduce soot and NOx emissions. These findings are consistent with the
proposed paths taken through the Φ-T plane introduced in Figure 3.1. Although
combustion noise is also low, combustion efficiency and fuel consumption are sacrificed.
Some responses have been found to be more important than others for specific strategies.
Combustion noise imposes less of a constraint at lower speed-fuelling conditions, allowing
better combustion phasing to be selected for reduced fuel consumption. In contrast, higher
fuel rail pressures can be employed to reduce soot at higher loads with less of a fuel
consumption penalty. Post injections can be effective at reducing soot, but come at the
expense of increased fuel consumption and potentially HC emissions. However, careful
mapping of fuel rail interactions is required for use of this strategy.
8.5 Concluding Remarks
Advancing injection timing to increase the ignition delay or compensate for rates of EGR
is practical in theory, but large swings in soot emissions have been encountered. Net soot
output is highly dependent on injection timing. The time available for mixing is a key
determinant, but output is also sensitive to the level of dilution. Highly advanced or
retarded injection timings successfully reduce soot output due to long mixing times, and
Chapter 8 Fuel Injection Parameters
B. Keeler 90 University of Nottingham
cool combustion. Unfortunately optimum timing with regards to fuel economy
corresponds to near peak soot output. Increasing mixing intensity by raising fuel rail
pressure is highly effective at reducing soot emissions across all injection timings, but
comes with an associated fuel consumption penalty due to the extra power consumed by
the HP fuel pump. Both injection timing and rail pressure parameters affect local
conditions, and the selection of each varies according to condition. For example, at lower
speed-load conditions there is less scope to increase rail pressure, but soot and noise output
impose less of a constraint even for optimum fuel economy. In contrast, higher speed-load
conditions require more retarded phasing and higher rail pressure to achieve acceptable
reductions.
B. Keeler 91 University of Nottingham
CHAPTER 9
OPERATING LIMITS OF PCCI
COMBUSTION
9.1 Introduction
Thus far the majority of the data presented have been at fixed engine speeds, and at
fuelling rates with associated loads in the range 0.7-4.9 bar BMEP. However, these
combinations cover only a relatively small region of the operating map of the engine.
Consequently the load and speed limits that dictate the practical operating region of PCCI
combustion with the current test engine will be investigated in two separate studies.
Building on the knowledge obtained in the previous chapters a single injection strategy
was employed in both investigations with injection timings around TDC (-5° to
+3°ATDC). This was chosen to exploit the lower temperatures and pressures of the
expansion stroke to facilitate low soot, NOx, and CNL responses.
Presented first is the load limit investigation, carried out at fixed engine speed. Work
documented in the available literature points to oxygen deficiency and intolerance to EGR
as posing limits [15, 109]. As such particular attention is paid to analysis of in-cylinder
pressure data and equivalence ratio to help explain the emission responses presented. The
effect on load output with increased fuelling is discussed, which highlights the importance
of equivalence ratio at both ends of the load scale. The section concludes with a
discussion of potential strategies to allow increased load outputs together with the
operating limits and potential implications.
The second section of the chapter covers the speed limit study conducted at constant load.
As with the load study the aim is to determine how much engine speed can be increased
before the said penalties are encountered. Although little pertinent information was found
in the available literature, it was anticipated that the reduced mixing time at higher engine
speeds would be the major hindrance to PCCI combustion. An overview of the
experimentation methodology is followed by the analysis of the in-cylinder pressure data
and the emission responses, ultimately allowing conclusions as to the limiting mechanisms
to be drawn. A discussion as to the potential strategies is included at the end of the
investigation, before final conclusions concerning the whole chapter are given.
Chapter 9 Operating Limits of PCCI Combustion
B. Keeler 92 University of Nottingham
9.2 Load Limits of PCCI Combustion
The upper limit of achievable load output of PCCI combustion was investigated by
increasing fuelling at a fixed engine speed of 1500 rpm and EGR rate. SOI was adjusted
to maintain constant location of peak combustion pressure (here defining combustion
phasing), which maintained the location of peak rate of heat release [109]. The
experiments were carried out at four fuel rail pressures varying from 550 bar to 1200 bar at
an engine speed of 1500 rpm. The pressures selected were consistent with the three
pressures employed at 1500 rpm together with the maximum pressure used at 1800 rpm in
Chapter 8. 1500 rpm was selected as a representative speed to allow comparison with the
data presented in the previous chapters together with work in the available literature. The
fixed rates of EGR and combustion phasings presented were chosen based on preliminary
tests to enable NOx and combustion noise to be contained without excessive fuel
consumption penalties, and to provide the opportunity to have low soot outputs with
combustion in the cooler expansion stroke. Two data sets are presented at 45% EGR and a
combustion phasing of +13ºATDC (Case A), and 35% EGR with +16ºATDC phasing
(Case B).
Within this section in-cylinder pressure data are analysed to gain an understanding of the
combustion characteristics together with a discussion on the overall equivalence ratios
which will be shown to play a central role in determination of the limits. Following this,
the emission responses, fuel consumption implications, and noise output are scrutinised to
allow potential strategy paths to be proposed and hardware implications discussed. The
speed limit investigation is then presented.
9.2.1 In-cylinder pressure analysis and equivalence ratio behaviour
The in-cylinder pressure and heat release data presented in Figure 9.1 are for the lowest
fuel rail pressure of 550 bar, but are representative of the combustion characteristics
encountered at each rail pressure when increasing load. In graph a the in-cylinder peak
combustion pressures are seen to increase with load. The rate of heat release curves,
shown in graph b, indicate that the location of peak rate of heat release remains constant
corresponding to the location of peak rate of change of pressure. Importantly the peak rate
increases with load which has noise ramifications.
The cool flame reactions characteristic of two-stage premixed ignition remain conspicuous
across the load range for case A but become less distinct at the highest load for case B.
This effect is more exaggerated at lower fuel rail pressures, with the cool flame reactions
more identifiable at the higher pressures (900-1200 bar) due to enhanced mixing and
Chapter 9 Operating Limits of PCCI Combustion
B. Keeler 93 University of Nottingham
improved air entrainment. The differences between cases A and B are attributed to
differences in mixture preparation resulting from the combined effects of varying levels of
dilution and SOI location. At increased loads the higher EGR and more advanced
injection timing of case A potentially favours the cool flame reactions which affect the
main ignition and subsequent hot gas reactions which occur at a higher pressure than
without the cool flame [90]. The improved visibility of the cool flame heat release at the
higher dilution case (A) is potentially explained by the higher equivalence ratio of the
premixed fuel, leading to higher rates of low-temperature heat release since reaction rates
are proportional to the fuel concentration [110]. However, as will be discussed in
following sections, this does not necessarily have a positive effect on emission responses.
As fuelling and load are increased the combustion characteristics can be more clearly
separated into two phases; premixed combustion and a mixing-controlled burning “bump”.
This is reflected in Figure 9.1 graphs b and c whereby a greater proportion of the fuel
energy is seen to be released at a slower rate (MCC) leading to longer combustion
durations. This indicates a change in the combustion regime as the characteristics of PCCI
combustion become less apparent [109] with a reduction in the degree of premix and a
subsequent increase in the proportion of mixing-controlled combustion. Figure 9.2
demonstrates the effect on gross IMEP load output and fuel-oxygen equivalence ratio as
the fuel quantity injected increased. Load output increased linearly with fuelling up to
~11.5 mg for case A and ~15 mg for case B. Beyond these fuelling rates further increase
resulted in little extra load output and in fact a reduction for case A caused by the
diminishing tolerance to EGR. The increase in equivalence ratio with fuelling is caused by
the inability to increase the induction of fresh air. As load output is increased the exhaust
gas temperature (shown in Figure 9.3 at the post turbine location) increased linearly which
directly impacted the intake temperature (and density) due to the fixed rate of EGR.
Despite a marginal increase of up to 4% in intake pressure, this increase in temperature
throttled the engine of fresh oxygen-containing air. With the engine setup very little extra
boost pressure was available due to limitations predominantly caused by the highly
coupled nature of the turbocharger-EGR systems. The lack of control over the induced
fresh air caused by the load-EGR schedules therefore introduced a limitation. For
example, little boost pressure was available at low loads, whilst the use of high EGR rates
also limited the energy that could be recovered by the turbocharger. This could potentially
be overcome by hardware changes such as the type and or size of the aspiration system
(for example use of a crank driven supercharger), or by facilitating further cooling the
EGR gases and thus intake temperature to increase intake density and fresh air flow into
the engine. It is also important to note here that increasing the fuel-air equivalence ratio
with increasing fuelling results in different engine behaviour compared to when the
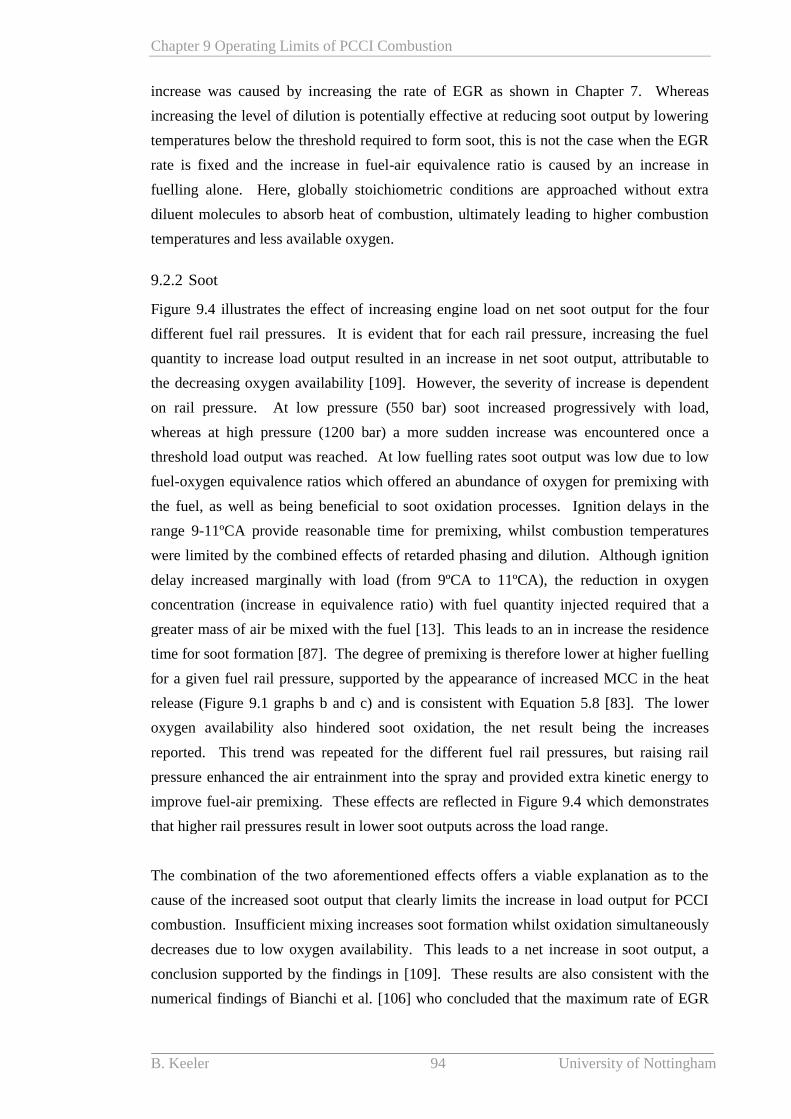
Chapter 9 Operating Limits of PCCI Combustion
B. Keeler 94 University of Nottingham
increase was caused by increasing the rate of EGR as shown in Chapter 7. Whereas
increasing the level of dilution is potentially effective at reducing soot output by lowering
temperatures below the threshold required to form soot, this is not the case when the EGR
rate is fixed and the increase in fuel-air equivalence ratio is caused by an increase in
fuelling alone. Here, globally stoichiometric conditions are approached without extra
diluent molecules to absorb heat of combustion, ultimately leading to higher combustion
temperatures and less available oxygen.
9.2.2 Soot
Figure 9.4 illustrates the effect of increasing engine load on net soot output for the four
different fuel rail pressures. It is evident that for each rail pressure, increasing the fuel
quantity to increase load output resulted in an increase in net soot output, attributable to
the decreasing oxygen availability [109]. However, the severity of increase is dependent
on rail pressure. At low pressure (550 bar) soot increased progressively with load,
whereas at high pressure (1200 bar) a more sudden increase was encountered once a
threshold load output was reached. At low fuelling rates soot output was low due to low
fuel-oxygen equivalence ratios which offered an abundance of oxygen for premixing with
the fuel, as well as being beneficial to soot oxidation processes. Ignition delays in the
range 9-11ºCA provide reasonable time for premixing, whilst combustion temperatures
were limited by the combined effects of retarded phasing and dilution. Although ignition
delay increased marginally with load (from 9ºCA to 11ºCA), the reduction in oxygen
concentration (increase in equivalence ratio) with fuel quantity injected required that a
greater mass of air be mixed with the fuel [13]. This leads to an in increase the residence
time for soot formation [87]. The degree of premixing is therefore lower at higher fuelling
for a given fuel rail pressure, supported by the appearance of increased MCC in the heat
release (Figure 9.1 graphs b and c) and is consistent with Equation 5.8 [83]. The lower
oxygen availability also hindered soot oxidation, the net result being the increases
reported. This trend was repeated for the different fuel rail pressures, but raising rail
pressure enhanced the air entrainment into the spray and provided extra kinetic energy to
improve fuel-air premixing. These effects are reflected in Figure 9.4 which demonstrates
that higher rail pressures result in lower soot outputs across the load range.
The combination of the two aforementioned effects offers a viable explanation as to the
cause of the increased soot output that clearly limits the increase in load output for PCCI
combustion. Insufficient mixing increases soot formation whilst oxidation simultaneously
decreases due to low oxygen availability. This leads to a net increase in soot output, a
conclusion supported by the findings in [109]. These results are also consistent with the
numerical findings of Bianchi et al. [106] who concluded that the maximum rate of EGR
Chapter 9 Operating Limits of PCCI Combustion
B. Keeler 95 University of Nottingham
tolerated by the system under PCCI combustion diminishes with increasing load where a
greater amount of energy is released with higher fuel quantities. This leads to the
conclusion that mixture preparation is intrinsic to reducing soot output [14, 113, 115] so as
to avoid the formation peninsula as indicated in the Φ–T maps or limit any associated
residence time.
9.2.3 Combustion efficiency and Fuel consumption
At the lowest load conditions CO and HC emissions were particularly high, although this
is not unique to PCCI combustion. At these conditions a clear trend of combustible
species (CO and HC) increasing with rail pressure was identifiable. Since injection timing
and air-flow did not vary significantly, no discernable differences in spray penetration
would be expected, pointing to over-leaning of the mixture as the source of the increase.
Combustion efficiency improved with increasing load as the higher associated
temperatures aid oxidation processes. Figure 9.5 illustrates that HC emissions decreased
monotonically with increasing load, whilst CO emissions followed a very similar trend
until a threshold, after which they increased rapidly. Kim et al. [41] reported finding CO
decreasing but HC remaining relatively unchanged as load increased. They attributed the
higher CO at lower load to incomplete combustion of lean mixtures at relatively low
temperatures in the squish volume. At the lowest loads presented soot yield does not
impose a limitation, but inferior combustion efficiencies caused by over-lean mixtures and
lower temperatures are potentially problematic. The near linear relationship between
engine load and exhaust gas temperature downstream of the turbine outlet which would be
immediately upstream of the oxidation catalyst is plotted in Figure 9.3. Contemporary
DOCs typically require temperatures of ~200ºC for light-off [15]. It can be seen that an
engine output of approaching 3 bar IMEPg is required to produce the required gas
temperature. These low operating loads potentially impose a limitation on the operating
regime and would require careful optimisation and selection of aftertreatment systems of
suitable conversion efficiency for a practical application.
Figure 9.6 illustrates the effect on bsfc of raising load output. The contours reflect the
differences in BMEP caused by the increase in fuel rail pressure. Although differences in
mixture preparation and the subsequent combustion occur due to varying amounts of
kinetic energy and disparity in spray breakup, the major difference in the values is
attributed to the extra power consumed by the high pressure fuel pump [111]. However,
analysis of Figure 9.1 graph b indicates that combustion duration is shortened with
increasing rail pressure. Since combustion phasing is fixed, less of the fuel’s energy is
released further away from TDC which improves thermal efficiency and acts to somewhat
reduce the fuel consumption penalty.
Chapter 9 Operating Limits of PCCI Combustion
B. Keeler 96 University of Nottingham
Fuel consumption decreased with increasing load output until a threshold was reached.
The decrease at a given rail pressure is credited to a lower fraction of the overall work
being lost in overcoming friction. Higher rates of heat transfer to cylinder walls would,
however, be expected due to higher in-cylinder temperatures, but this has not been
investigated and will not be discussed further in this work. The extra energy released
when fuelling and load output are increased generates higher bulk-gas temperatures which
are beneficial to the oxidation processes of soot, CO and HCs, but is offset by the lower
oxygen availability as equivalence ratios increase. Once the threshold was reached Figure
9.6 indicates that fuel consumption begins to deteriorate in-line with the increase in CO
and soot. Although bulk-gas temperatures are significantly higher than the lower load
tests and exceeded the 1500 K required for complete oxidation of CO to CO2 [41, 42, 44],
the availability of oxygen was low. Therefore, despite long residence times for oxidation,
CO emissions remained high. As such the mixture was too rich to sustain complete
combustion and dramatic increases in CO output were recorded, consistent with the
findings in [109]. The increase in MCC caused a more spread out heat release (longer
combustion duration) and likely acted to further decrease combustion efficiency due to the
expanding combustion volume [27]. Temporarily not taking into account the fuel
consumption penalty, engine-out CO emissions of over 130 g/kg-fuel (0.8% wet
volumetric fraction in this example) were encountered for case A at 4.1 bar IMEPg.
Although exhaust temperatures were well in excess of the 200ºC for light-off of
contemporary DOCs [15], values of this order are unrealistic for any real-world
application. Combustion efficiency can therefore also be deemed a limit to the attainable
load output under PCCI combustion.
9.2.4 NOx and Combustion Noise
Retarded combustion phasings and appropriate levels of dilution contained NOx emissions
to peak values of 2.2 g/kg-fuel and 4.4 g/kg-fuel for cases A and B respectively.
Increasing the fuelling and load might have been expected to increase NOx production due
to greater chemical energy being released leading to longer residence times at conditions
above the 2200 K required for their formation. However, the opposite can be see to have
occurred in the NOx-soot trade-off graphed in Figure 9.7 whereby lower NOx emissions
were obtained at higher loads, consistent with the findings of Yun and Reitz [109]. Since
combustion temperatures were higher, this result was attributed to the significantly lower
oxygen availability and inferior mixing, which resulted in higher local equivalence ratios
that avoided the NO formation region shown in the Φ-T maps. Moreover, increasing fuel
rail pressure could have been expected to increase NOx formation due to more rapid
combustion, but this is offset against improved fuel-air premixing, leading to little
variation in NOx emissions at a given load output. Figure 9.7 also illustrates for the same
Chapter 9 Operating Limits of PCCI Combustion
B. Keeler 97 University of Nottingham
load output lower NOx emissions were obtained with a higher EGR rate despite more
advanced combustion phasing (Case A). However, in both cases higher rates of EGR
would be required at lower load due to the higher oxygen concentration. The appropriate
rate of EGR required is a function of fuelling (load), consistent with Equation 8.2. For
combustion better phased with respect to minimised fuel consumption (around TDC),
excessive rates of change in pressure and subsequently high levels of combustion noise
can also occur. Since the location of peak rate of heat release was maintained constant,
increasing the quantity of fuel delivered provided the potential for increased rates of
pressure rise. This was manifested in the increase in combustion noise illustrated by
Figure 9.8 with a much larger increase found with the lower EGR case. At the lowest
loads increasing rail pressure has been shown to cause deterioration in combustion
efficiency due to over-leaning. Less energy is therefore released for a given fuel injection
quantity which reduces the rates of heat release and peak changes in pressure. When the
higher load combustion limit was reached and combustion efficiency deteriorated, noise
similarly decreased since less energy was released and the rate of pressure rise decreased.
9.2.5 Potential Strategy
On the basis that NOx emissions do not constrain the increase in load, the proposed
strategy involves minimising soot yield and fuel consumption until the aforementioned
combustion limits are reached. If an excessively high fuel rail pressure were to be
employed, brake load output decreases. The approach is therefore to keep the rail pressure
as low as possible within the development target soot limits. Should an optimisation
routine be carried out the relative importance of fuel consumption and soot would have to
be weighted, but within this work one generic strategy is described based on minimising
soot output within a maximum bsfc penalty of up to 5% of minimum bsfc at the particular
operating load. In general terms the minimum bsfc was associated with the lowest rail
pressure (550 bar), which therefore mainly acted as the baseline for each load. Figure 9.9
illustrates the soot-bsfc trade-off strategy path following this criterion. Fuelling is
increased at the lowest fuel rail pressure permitted to minimise bsfc. Once the soot
outputs associated with the various rail pressures begin to diverge the gain in soot
reduction becomes more significant, at which point the operating point moves to a higher
rail pressure. With selected points labelled, Figure 9.9 shows that the appropriate rail
pressure increases with load for both cases, but that an optimum point is reached beyond
which soot increases rapidly. Using this method the optimum point would be chosen as
4.4 bar IMEPg using a rail pressure of 900 bar (Case B). This limit is comparable with the
findings in [109] but significantly lower soot emissions were obtained in the work
presented in this thesis for similar NOx outputs, attributed to lower rates of EGR but more
retarded injection timings employed.
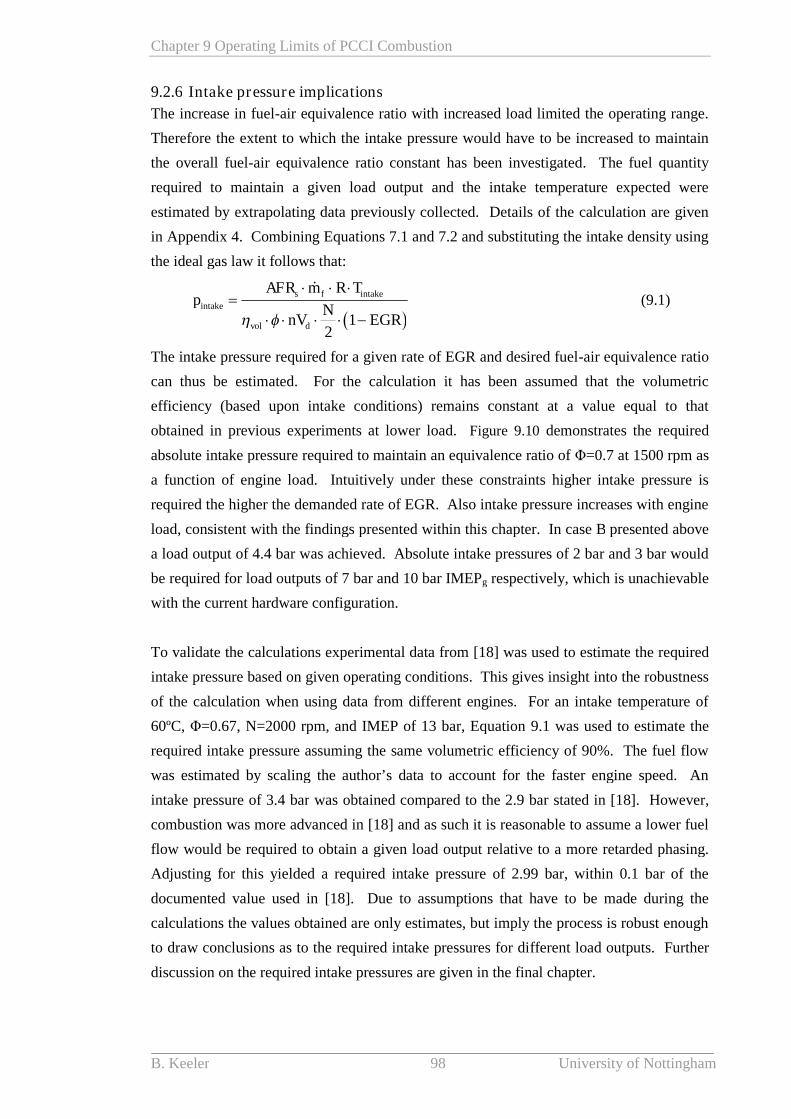
Chapter 9 Operating Limits of PCCI Combustion
B. Keeler 98 University of Nottingham
9.2.6 Intake pressure implications
The increase in fuel-air equivalence ratio with increased load limited the operating range.
Therefore the extent to which the intake pressure would have to be increased to maintain
the overall fuel-air equivalence ratio constant has been investigated. The fuel quantity
required to maintain a given load output and the intake temperature expected were
estimated by extrapolating data previously collected. Details of the calculation are given
in Appendix 4. Combining Equations 7.1 and 7.2 and substituting the intake density using
the ideal gas law it follows that:
intake
intake
12
s f
vol d
AFR m R Tp
NnV EGR
(9.1)
The intake pressure required for a given rate of EGR and desired fuel-air equivalence ratio
can thus be estimated. For the calculation it has been assumed that the volumetric
efficiency (based upon intake conditions) remains constant at a value equal to that
obtained in previous experiments at lower load. Figure 9.10 demonstrates the required
absolute intake pressure required to maintain an equivalence ratio of Φ=0.7 at 1500 rpm as
a function of engine load. Intuitively under these constraints higher intake pressure is
required the higher the demanded rate of EGR. Also intake pressure increases with engine
load, consistent with the findings presented within this chapter. In case B presented above
a load output of 4.4 bar was achieved. Absolute intake pressures of 2 bar and 3 bar would
be required for load outputs of 7 bar and 10 bar IMEPg respectively, which is unachievable
with the current hardware configuration.
To validate the calculations experimental data from [18] was used to estimate the required
intake pressure based on given operating conditions. This gives insight into the robustness
of the calculation when using data from different engines. For an intake temperature of
60ºC, Φ=0.67, N=2000 rpm, and IMEP of 13 bar, Equation 9.1 was used to estimate the
required intake pressure assuming the same volumetric efficiency of 90%. The fuel flow
was estimated by scaling the author’s data to account for the faster engine speed. An
intake pressure of 3.4 bar was obtained compared to the 2.9 bar stated in [18]. However,
combustion was more advanced in [18] and as such it is reasonable to assume a lower fuel
flow would be required to obtain a given load output relative to a more retarded phasing.
Adjusting for this yielded a required intake pressure of 2.99 bar, within 0.1 bar of the
documented value used in [18]. Due to assumptions that have to be made during the
calculations the values obtained are only estimates, but imply the process is robust enough
to draw conclusions as to the required intake pressures for different load outputs. Further
discussion on the required intake pressures are given in the final chapter.
Chapter 9 Operating Limits of PCCI Combustion
B. Keeler 99 University of Nottingham
9.3 Speed Limits of PCCI Combustion
The second limiting factor investigated was the engine speed limit. As the engine speed
increases each crank angle interval takes place in a shorter period in the time domain. It is
likely, therefore that ignition delay times will shorten as engine speed increases, allowing
less time for premixing. Soot would thus be expected to be a limiting factor. A similar
approach to the load limit investigation was adopted whereby the rate of EGR and
combustion phasing were maintained constant, but in this study the brake work output was
kept constant at 2.5 bar BMEP (54 Nm) and the engine speed increased using the
dynamometer. The delivered fuel quantity and injection timing were adjusted to maintain
both the combustion phasing and brake torque output. A single test case is presented
throughout. The presentation of the findings follows the same structure as the load study,
with in-cylinder and equivalence ratio data analysed before considering soot emissions,
fuel consumption and combustion efficiency, NOx emissions and combustion noise. Final
strategies are proposed before the chapter concludes with a discussion on both studies.
9.3.1 In-cylinder pressure analysis and equivalence ratio behaviour
The representative in-cylinder pressure and heat release data presented in Figure 9.11 are
again at the lowest fuel rail pressure of 550 bar, and are representative of the combustion
characteristics encountered at each rail pressure. Graph a illustrates the in-cylinder peak
compression pressures increased with engine speed. As the engine speed was increased
the mass flow rate of fresh air naturally increased (in kg/s), but a marginal decrease in air
flow through the engine per stroke (in kg/stk) was encountered (not plotted here). The
decrease in airflow of approximately 6% from 1000 rpm to 2000 rpm was, however,
somewhat offset by a small increase in intake pressure (in the order of 4% increase from
1000 rpm to 2000 rpm). The higher intake pressures therefore led to higher compression
pressure into which the fuel was injected. Although little change in the peak combustion
pressure is noticed, graph a indicates that higher pressures were sustained further down the
expansion stroke. This is reflected in Figure 9.12 whereby for a given fuel rail pressure
IMEPg generally increased with engine speed. Also displayed in Figure 9.12 is the fuel-
oxygen equivalence ratio. The increase in equivalence ratios is attributed to the combined
effects of a marginal decrease in air flow through the engine per stroke, and an increase in
the required fuel delivery (depicted in Figure 9.13).
The rate of heat release and cumulative net heat release plots illustrated in graphs b and c
respectively indicate a change in combustion characteristics as engine speed increased.
The rate of heat release plotted in J/ºCA decreased with increasing engine speed.
However, 1ºCA takes place in a shorter time in ms at higher engine speed. The net rate of
heat release plotted in J/ms (or kW) is therefore greater for a higher engine speed (for a
Chapter 9 Operating Limits of PCCI Combustion
B. Keeler 100 University of Nottingham
given release in J/ºCA). Nevertheless the decrease in peak rate of heat release from 1000
rpm to 2000 rpm was approximately 20 J/ºCA, which does not represent a 50% decrease.
The cool flame reactions also became less distinct and dampened as speed increased.
These last two observations are indicative of a change in combustion characteristics.
Graph c of Figure 9.11 illustrates a more progressive combustion profile as engine speed
increased. A smaller fraction of the heat was released in the premixed phase with a
subsequent increase in the amount of MCC. Combustion duration increased, with a
greater proportion of the fuel energy released further away from TDC. The cumulative
total heat release increased with speed because a greater quantity of fuel was required to
maintain the load output of 2.5 bar BMEP. As well as combustion phasing, the relative
amount of heat transfer and friction are also important, although the discussion here will
not go into great detail. The average heat transfer per unit time increases with engine
speed as do frictional losses [9]. As was noted in Chapter 1, one of the benefits of diesel
engines is that they operate at slower speeds with higher gearing which helps to reduce
power lost to friction. However, the analysis here concentrates on brake output and
combustion characteristics.
9.3.2 Soot
When investigating the load limits the increase in equivalence ratios caused large increases
in soot and CO emissions, with an associated fuel economy penalty. Figure 9.14 illustrates
the effect on soot emissions for increasing engine speeds. As found previously in Chapter
8 and the earlier part of this Chapter, higher fuel rail pressures had lower associated net
soot outputs at all rail pressures, but soot output remained essentially low until an engine
speed of 1500 rpm was reached. Beyond that, more significant increases in soot output
were liable to be encountered, but are a function of rail pressure. Intuitively, a faster
engine speed was attainable at higher rail pressure before soot output increased rapidly.
The fuel quantities varied from 9.1 to 11.1 mg/stk/cyl depending on the test point, but as
with the previous chapters the emissions were normalised by the fuel quantity to allow a
clearer representation (displayed as emission indices).
Since data presented prior to this study have been at fixed engine speed, ignition delay has
been displayed in units of crank-angle degrees (ºCA). However, it is important to consider
the mixture preparation and combustion in the time domain to account for the changes in
engine speed. Figure 9.15 illustrates ignition delay plotted in both the crank and time
domains. As engine speed increased, in order to maintain the combustion phasing and
brake load output the fuel injection had to be increased in quantity and advanced in timing.
The location of the start of combustion remained relatively constant and as such the
Chapter 9 Operating Limits of PCCI Combustion
B. Keeler 101 University of Nottingham
ignition delay in crank-angle degrees increased with engine speed. However, it can be
seen that the delay period in ms decreased with increasing speed. The fuel and air
therefore had less time to mix prior to the onset of hot gas reactions. Comparison of
Figure 9.12 and Figure 9.14 indicates a clear relationship between fuel-oxygen
equivalence ratio and soot output. The increase in equivalence ratio required a greater
mass of air to be mixed with the fuel and together with the reduced mixing time resulted in
a lower degree of premixing and longer residence times in regions suitable for soot
formation. This is in agreement with Figure 9.11 where lower rates of heat release (in
J/ºCA) and longer combustion durations are visible at higher engine speeds. The reduction
in the degree of premixing and subsequent increase in the amount of mixing-controlled
combustion is hence deemed responsible for an increase in soot formation, whilst the
lower oxygen availability with increasing engine speed hinders oxidation processes.
Moreover the reactions take place in a time period inversely proportional to the engine
speed, and consequently time available for oxidation decreases with increasing engine
speed.
9.3.3 Combustion efficiency and Fuel consumption
The CO and HC emission responses are illustrated in Figure 9.16 for the different engine
speeds. As engine speed increased a minor decrease in HC emissions was recorded, whilst
CO emissions remained effectively constant until a speed of 2000 rpm, after which their
emission approximately doubled. The higher temperatures achieved at faster speeds
helped to reduce the HC output, but CO emissions were not improved. This latter
observation can be explained by recalling that complete oxidation of CO to CO2 requires
higher temperatures than the oxidation processes of HC. The increase in equivalence ratio
with increasing engine speed previously discussed also meant that oxygen availability was
lower, which naturally had an adverse effect on oxidation processes. As the engine speed
exceeded 2000 rpm the reduced time available for oxidation together with the possibility
of incomplete mixing provided potential reasons for the increase in CO emissions.
At a given engine speed the bsfc increased with fuel rail pressure. As illustrated by Figure
9.17 optimal bsfc was found around 1250 rpm for all cases tested and can be seen to
increase with engine speed. Although not plotted here, combustion efficiency was not
found to deteriorate until speeds in excess of 2000 rpm, indicating that combustion
phasing was more likely responsible for the bsfc increase. Figure 9.13 demonstrates the
fuel flow required to maintain the load output. In contrast to the units of mg/stk/cyl
displayed in the load study previously, here fuel flow required to maintain load output is
given on secondary vertical axis in the form of g/s to account for engine speed. As well as
advancing the injection timing to maintain the combustion phasing, an increase in fuel
Chapter 9 Operating Limits of PCCI Combustion
B. Keeler 102 University of Nottingham
quantity delivered was required to maintain the brake load output. This is identified in the
cumulative heat release (Figure 9.11 graph c) whereby a greater fraction of the energy is
released closer to TDC for the slower engine speeds. As engine speeds increased there
was less time available to the combustion processes which increased in duration in the
crank domain. For example, at +15ºATDC the heat released was ~220 J at 1000 rpm but
only ~175 J at 2000 rpm. The extra energy at higher speed was released further into the
expansion stroke, which was less efficient at generating work output and required higher
fuel inputs resulting in increased bsfc. A consequence of this was higher exhaust
temperatures as less of the fuel energy was transferred to the coolant and more energy was
passed to exhaust enthalpy. As with the load study, the engine-out emissions of CO
constrain the selection of PCCI combustion as engine speed increased. The linear increase
in exhaust temperature as speed was increased is shown in Figure 9.13, together with the
total fuel quantity required to maintain the load. It can be seen that for the operating
conditions presented, the exhaust gas temperature was only below 200ºC for the 1000 rpm
test case. Assuming conversion rates of any catalytic converter are high for temperatures
in excess of this level (~200ºC), tailpipe emissions should not be in excess of the
legislative demands. However, as decreases in combustion efficiency manifested in this
case through significant increases in CO emissions, careful consideration may be required
for an optimal strategy.
9.3.4 NOx and Combustion Noise
Combustion noise level was shown previously to be a function of engine speed (Figure
5.3). The data presented in Figure 9.18 illustrate that combustion noise increased with
engine speed. However, the reduced fraction of premixed combustion and increased
amount of MCC might have been expected to reduce combustion noise. As engine speed
increased the first derivative of pressure with respect to crank angle decreased, but when
viewed in the time domain the peak rate of change of pressure in MPa/ms increased
slightly, although no clearly identifiable trend in the data was found. However, the
frequency distribution of the noise will have changed, resulting in an overall increase in
measured combustion noise. Combustion noise of 85 dB(A) or lower is desirable for
passenger comfort, which was attainable until an engine speed of 1500 rpm. Further
increases in noise with higher speeds were recorded, but sub-90 dB(A) levels for all
operating speeds less than 2250 rpm provides a suitable operating range when considering
the limitation posed by engine speed.
Similarly with NOx emissions, no discernable trend in the data plotted in Figure 9.19 can
be noticed except that in all cases NOx output is extremely low and below 0.6 g/kg-fuel.
The use of retarded combustion phasing and appropriate rates of EGR therefore allowed
Chapter 9 Operating Limits of PCCI Combustion
B. Keeler 103 University of Nottingham
engine speed to be increased without further consideration of NOx emissions. A general
trend could be a minor decrease in NOx output as speed increases, potentially due to the
more retarded combustion phasing and reduced oxygen availability, but nevertheless
values within 0.1 g/kg-fuel of the mean are encountered for all data points.
9.3.5 Potential Strategy
Soot, CO, and combustion noise have been found to pose the greatest obstacles when
increasing engine speed whilst operating a PCCI combustion strategy. Fuel consumption,
NOx, and HC emissions were less of an issue. The strategy proposed below is based upon
the fact that soot is the main limiting response. Increasing fuel rail pressure has been
shown to increase bsfc due to the extra power consumed by the high pressure fuel pump,
highlighted in Figure 9.17. Using this data and the same criteria as with the load limit
study, namely allowing a maximum increase of 5% from minimum bsfc at each engine
speed, the minimum soot outputs were chosen to provide a strategy path. Figure 9.20
illustrates this path, starting from the lowest engine speed of 1000 rpm, and extending up
to 2250 rpm. Soot output can be seen to increase with engine speed except for the increase
from 1250 to 1500 rpm, caused by the increase in fuel rail pressure. Minimum bsfc is
found at 1250 rpm, which is partly due to a lower rail pressure of 700 bar being selected
from the 5% bsfc criteria, and partly due to the bsfc contour profile shown in Figure 9.17.
Except for engine speeds of 1250 and 2250 rpm, fuel rail pressure of 900 bar was chosen.
This allowed the best reduction in soot output without exceeding the fuel consumption
criteria. However, a general trend of soot increasing from 1500 rpm upward is clear, the
penalties of which become more severe the faster the engine speed. Unlike the load study,
from this point a trade-off between soot and bsfc does not exist, rather they both increase
together. From the data presented it can be concluded that 2000 rpm is a reasonable limit
to the PCCI combustion, beyond which soot output increases sharply. Figure 9.14-Figure
9.19 show that up to this speed the emission responses do not pose a serious issue with the
operating regime, although combustion noise levels in the region 88-89 dB(A) were
encountered. It should be noted that the conclusions given here are based on the data
presented, and have not been optimised. The aim has been to give the reader an
understanding as to the limits encountered when attempting to increase the speed output of
the engine, and not provide a final calibration. A discussion of the findings of the two
studies will now be given to summarise the findings, which concludes this chapter.
9.4 Concluding Remarks
Oxygen availability limited the speed and load output of PCCI combustion. Although
conditions remained globally lean, locally insufficient mixing occurred to sustain PCCI
combustion. As fuel delivery was increased to increase load output, overall equivalence
Chapter 9 Operating Limits of PCCI Combustion
B. Keeler 104 University of Nottingham
ratios increased, requiring a greater mass of ambient air be mixed with the fuel. This was
a hardware limit due to the trade-off between boost and EGR deliverable by the engine.
For the generic PCCI strategy fuel rail pressure should be kept as low as possible within
soot limits in order to minimise any bsfc penalty. As fuelling is increased, the operating
point effectively moves along the NOx-soot trade-off from high NOx and low soot, to low
NOx and high soot. As load demands increase more retarded injection timings with higher
rail pressure and lower rates of EGR (or increased boost pressures) are ideal. Overall the
load and speed limits reported are similar to those documented in the available literature,
including [21, 25], but the limits presented in this thesis were obtained without hardware
modifications to a current generation DI diesel engine.
Maximum sustainable engine speed was similarly limited by oxygen availability and the
inability to premix the fuel with air within engine timescales. Although the mass flow of
induced air increased with speed, the actual fresh air induced per stroke decreased. In
contrast fuel delivery had to be increased to maintain the desired load output, leading to an
increase in overall equivalence ratio. Accompanied by a reduction in ignition delay,
increased soot output resulted. Raising rail pressure was effective up to a threshold, but
penalties in fuel consumption dominated the trade-off after a given engine speed. The
speed limit is thus also hardware limited and methods for improving mixing and/or
increasing the oxygen availability are required to expand the operating range. The
proposed strategy to increase engine speed makes use of moderately high fuel rail
pressures for the majority of engine speeds, but beyond a threshold speed, soot and bsfc
increase simultaneously, despite increasing rail pressure.
Figure 9.21 illustrates the speeds and loads tested for the majority of the data presented
within this chapter and the rest of the thesis. Highlighted are the speed and load limits that
have been discussed above, together with the limits associated with the Modulated
Kinetics (MK) combustion regime. The speed and load limits encountered within this
study are comparable with those of the 1st generation MK [25]. Comparison of the limits
with this study highlight allowing variable swirl ratio could help significantly in the
expansion of the operating regions. Similarly, further cooling of the EGR gases was
employed in the 2nd generation MK regimes with great benefit in soot and NOx emissions.
However, this would require hardware modifications which will be discussed further in the
Chapter 10 that follows. Little other pertinent literature relating to the speed limits of
PCCI combustion was found, but comparable limits were found with Eastwood et al. [105]
although significantly lower smoke output was achieved in the work documented in this
thesis.
B. Keeler 105 University of Nottingham
CHAPTER 10
DISCUSSION AND CONCLUSIONS
10.1 Discussion
This chapter is divided into three sections beginning with a discussion of the objectives of
the work, a review of the important mechanisms exploited to reduce NOx and soot output,
together with the feasibility and future of PCCI combustion strategies. Following this
further work is proposed, that has been separated into work that originates from limitations
with the available test facilities, and work that would compliment and build upon the
findings of the current investigation. Conclusions of the thesis are then presented.
10.1.1 Objectives of the work
The main aim of this investigation has been to determine if and how far a modern DI
diesel engine could be operated on a PCCI combustion strategy to simultaneously reduce
soot and NOx emissions without changes to engine hardware. Although the available test
engine was of pre-production specification, it allowed manipulation of injection strategy
and EGR rate which was exploited in the investigation. Comparison of the findings with
other published work provides insight into what hardware changes maybe beneficial to
increase the operating range or improve specific responses.
The concept of reducing soot and NOx formation through control over temperature and
mixing can be traced back to the original Φ-T presented by Kamimoto and Bae [10].
However, as was discussed in Chapter 2 work reported in the literature is typically limited
to hardware and operating conditions much narrower than those encountered in real-world
applications. Some of the most successful practical proposals were also reviewed [12, 21,
22, 25, 26], but were limited in their range of operation even with hardware modifications.
In Chapter 3 idealised combustion paths were reviewed to explain the characteristic paths
encountered with different combustion strategies. Engine-out emissions have been
examined in this thesis at speed and load conditions typical of NEDC requirements. Fuel
injection parameters and EGR rates have been studied as routes to enhance the premixing
of the charge and lower combustion temperatures. A generic PCCI strategy was
investigated in Chapters 7-9 to assess the constraints imposed on fuel injection and EGR
strategies to achieve low soot and NOx emissions simultaneously. Importantly, control
Chapter 10 Discussion and Conclusions
B. Keeler 106 University of Nottingham
over combustion through injection strategy was required, which partly distinguished the
combustion regime from HCCI.
10.1.2 Soot and NOx emissions
DI diesel injection gives rise to a distribution of local equivalence ratios and temperatures
in the cylinder. Soot formation occurs in the early stages of mixing-controlled combustion
where inhomogeneity in the fuel-air mixture results in high local equivalence ratios in the
jet core [28]. With reference to the Φ-T maps reviewed in Chapters 2 and 3, soot is known
to form between temperatures of 1600 K and 2500 K at local equivalence ratios greater
than 2. However, a large area under the soot formation peninsula exists that can be
exploited with PCCI combustion. In contrast, a greater proportion of soot oxidation occurs
later in the cycle and continues further in the expansion stroke, the rate of which is highly
dependent on local oxygen availability and temperature. The measured soot content in the
exhaust reflects the difference between these two competing processes and in the
experimental work carried out it has not been possible to separate out the relative
contributions. However, proposed combustion paths and mechanisms presented in
Chapter 3 explain the expected trends in soot formation. Oxidation processes are expected
to be negatively affected by the increased level of dilution employed with PCCI strategies
due to reduced oxygen concentration and lower temperatures. The mechanism for
reducing net soot output with PCCI combustion strategies is thus reducing the amount of
soot formed to outweigh the reduction in oxidation.
NOx is predominantly formed at temperatures greater than 2200 K at local equivalence
ratios under 2 [11, 12]. Ideally both soot and NOx formation regions would be completely
avoided, but this has been found to be no trivial matter. In Chapter 7 it was shown that
global parameters affect local conditions with a strong dependence on stoichiometric
adiabatic flame temperature existing between soot and NOx output. NOx was found to
increase exponentially at temperatures above 2300 K, whilst peak soot outputs were found
in the range 1600-2700 K. Premixing of charge and control over temperatures is therefore
crucial in obtaining simultaneously low emissions and has been the driving force behind
this work.
10.1.3 Practicality of PCCI Combustion with a current generation engine
PCCI combustion is a broad term that encompasses many different operating strategies
that fall between conventional diesel combustion and true HCCI combustion. The charge
is not universally mixed to the same local equivalence ratios as with HCCI, and regions of
inhomogeneous charge remain that result in part of the heat being released during a
mixing-controlled combustion phase. The major benefit over HCCI strategies is that
Chapter 10 Discussion and Conclusions
B. Keeler 107 University of Nottingham
control over combustion is maintained through the injection strategy. Nevertheless, the
premixing of the fuel and air prior to ignition with PCCI combustion is greater than with
conventional combustion.
To increase the amount of premixed charge, methods to increase both the mixing time and
mixing intensity were investigated. Combustion of a conventional pilot injection advances
ignition of the main event, shortening the available time for premixing and reducing
oxygen available to the main injection. The result is higher local equivalence ratios at the
time of ignition. Figure 10.1 illustrates proposed combustion pathways based on
experimental findings at constant injection timing retarded of TDC with and without a
conventional pilot injection. The higher temperature and local equivalence ratio at SOC
when a pilot is employed results in the combustion path passing through both soot and
NOx formation regions. Without a pilot, longer ignition delays are possible and PCCI
combustion can be achieved allowing the soot peninsula to be better avoided. The more
retarded combustion phasing also helps cool the charge as the volume expands, which
allows the NOx formation region to be better avoided. Results presented in Chapters 5-8
highlight the effect of a conventional pilot on soot emissions. Consequently for the
majority of the investigation the pilot injection was removed and the work concentrated on
a generic single injection strategy. The single injection strategies that have been explored
act as a baseline for this generic PCCI strategy. The use of multiple injections, such as
multiple fuel injection events advanced of TDC in the compression stroke may be
beneficial in enhancing fuel-air mixing, but this has not been investigated in this thesis.
Control over NOx emissions has been found to be relatively simple in comparison with
soot output, with moderate-to-high levels of EGR the most practical approach as presented
in Chapters 7 and 8. The overall fuel-air equivalence ratio was shown to increase in
proportion to 1
1 EGR
which limited the level of dilution with increased fuelling
without penalties in HC and CO emissions. Despite increasing the ignition delay, a greater
mass of ambient air must be mixed with the fuel to attain a given local equivalence ratio as
EGR is increased, which can increase soot output [13, 87]. However, departure from the
traditional EGR-soot trade-off was found possible once a threshold EGR level was
reached, although this was not found to be possible for all injection timings. Improvement
in the soot-NOx trade-off is therefore possible when using EGR with appropriate injection
timing, but was shown to come at the expense of combustion efficiency and fuel economy.
In contrast, in Chapter 8 increasing the ignition delay by modifying the injection timing
was shown to be much more effective at reducing soot output. Large swings in soot output
were encountered, with peak soot occurring at timing associated with optimal fuel
Chapter 10 Discussion and Conclusions
B. Keeler 108 University of Nottingham
economy. Both highly advanced and retarded injection timings were found to be most
successful at increasing ignition delay and providing increased mixing time, but with
differing combustion characteristics. In Chapter 8 advanced combustion was shown to
yield low soot, HC, and CO emissions, together with acceptable bsfc, but high rates of heat
release which generated excessive combustion noise. NOx emissions were also shown to
increase with advancing phasing as peak in-cylinder pressures increased. In contrast, for
retarded phasing low soot and NOx emissions were found possible together with low
combustion noise, but at the expense of combustion efficiency and fuel consumption. The
relative benefits of the injection timings were found to be dependent on speed and load
requirements.
As well as increasing the available time for fuel-air premixing, increasing the mixing
intensity is also a key mechanism in achieving PCCI combustion through improved
mixture preparation. Enhancing the mixing intensity of fuel and air can be achieved
through air motion and fuel injection. The test engine was not able to vary swirl, but the
effect of injection pressure was investigated in Chapter 8. As was reviewed in Chapter 2,
increasing rail pressure improves air entrainment in the fuel spray, forming lower local
equivalence ratios. This is extremely beneficial to reducing soot output since soot
formation is reduced and its oxidation potentially improved. However, this was found in
Chapter 8 and Chapter 9 to come with an associated fuel consumption penalty due to
increased work consumed by the high-pressure fuel pump.
The load and speed limits of PCCI combustion were found to be limited by oxygen
availability. The speeds and loads achieved with the generic PCCI strategy presented in
Chapter 9 are consistent with those documented in the literature [25, 26, 105, 109], and are
notably similar to the 1st generation MK strategy [25]. Comparison with these studies and
the UNIBUS concept [26] suggests further cooling of the intake charge and promoting
more premixing could further expand the operating region with PCCI combustion. Lower
fuel rail pressures could also potentially be employed if cooler intake temperatures and
enhanced air mixing were achievable, benefiting fuel consumption. Overall, the results are
encouraging and suggest that improving mixing, together with increasing boost pressure in
combination with the intake density and oxygen concentration with further intake cooling,
could allow higher load and speed limits.
10.1.4 Wider Implications of PCCI Strategies
Within this thesis higher injection pressures, moderate-to-high levels of dilution, and either
highly advanced or retarded injection timings with a single injection have been found to be
beneficial to achieving PCCI combustion. The findings of the investigations in Chapter 9
Chapter 10 Discussion and Conclusions
B. Keeler 109 University of Nottingham
indicated that higher boost pressure is required to limit the overall fuel-air equivalence
ratio to achieve higher speed and load outputs. However, sufficient dilution must still be
employed to limit combustion temperatures. In Chapter 9 a load output of 4.4 bar IMEPg
was obtained at 1500 rpm using 35% EGR and retarded combustion phasing.
Consideration of Equation 9.1 and Figure 9.10 offers insight into the boost pressures
required to increase load at constant fuel-air equivalence ratio. To double the load output
to 9 bar IMEPg an intake pressure of ~2.6 bar (1.6 bar boost) would be required to
maintain the overall equivalence ratio at Φ=0.7. If the required pressure could be
generated without further cooling intake temperatures, very high in-cylinder bulk-gas
temperatures would be generated. As was discussed in Chapter 3 this increases the
maximum achievable temperature in the jet core. The effect on the combustion path
shown in the Φ-T plane as proposed in Figure 3.1 indicates higher soot and NO formation.
Therefore despite maintaining the target overall equivalence ratio PCCI combustion may
not be attainable and the combustion path must still be considered. With boost pressures
this high the tolerance of the engine to excessive in-cylinder pressures must also be
considered. Assuming a polytropic compression process without combustion, motored
pressures of ~100 bar would be experienced with the engine even in the absence of
combustion. With the addition of combustion pressures care would have to be taken not to
exceed peak cylinder pressure limits to avoid damage to, or in the worst case, destruction
of the engine. The general industrial trend is for lowering compression ratios. This would
be beneficial in reducing in-cylinder pressure and bulk-gas temperatures, as well as
providing longer associated ignition delays.
With the available current generation test engine the highly coupled nature of the
turbocharger-EGR systems limited the available boost pressure and thus operating range of
PCCI combustion. The high temperature of the EGR increased the intake temperature
with load, displacing cold fresh air and limiting the available boost pressure. Reducing the
intake temperature is therefore crucial to expanding the operating region of PCCI
combustion. Improved cooling of the EGR gases would increase the intake density and
allow lower intake pressures for a given rate of EGR, but any increase in size of the heat
exchangers would have to be weighed against increased mass, and potential transport
delays must be considered should the path be made longer. The maximum achievable
combustion temperatures would also be reduced, which would benefit the reduction in NO
formation, whilst the lower required boost pressures would limit the motored peak in-
cylinder pressures. Furthermore reducing overall equivalence ratios by increasing boost
pressures would likely result in lower CO and HC emissions due to improved oxygen
availability and higher ambient temperatures, both of which benefit oxidation processes.
The increased heat capacity with higher intake pressures has previously been shown [26,

Chapter 10 Discussion and Conclusions
B. Keeler 110 University of Nottingham
48] to be beneficial in reducing peak rates of pressure rise. As was documented in Chapter
5 this would help reduce combustion noise which correlates well with peak rates of
pressure increase. The extra oxygen availability would require a lower mass of ambient
air to be mixed with the fuel to attain a given local equivalence ratio which would reduce
the time required for mixing and shorten residence times for formation of soot. Lower fuel
rail pressures could then potentially be used which would reduce the power consumed by
the HP fuel pump, ultimately benefiting fuel economy. However, this would have to be
offset against any increase in fuel consumption due to the generation of the required boost
pressure.
Engine technology and hardware have naturally advanced from that of the available test
engine, but the latest available literature is consistent with the findings and proposals of
this thesis. Load outputs achieved in the literature vary depending on the strategy
employed, the test equipment, and development targets set (the maximum allowable
response value). As was reviewed in Chapter 9 loads of up to 13 bar IMEP have been
documented with PCCI combustion, but with excessive combustion noise expected [18].
However, to achieve this, boost pressure of approaching 2 bar and intake temperatures
cooled to 60ºC were required in conjunction with high rates of EGR (46%), fuel rail
pressure (1800 bar), swirl, and extended intake valve opening. Outside of a laboratory
environment or without major EGR heat exchanger modifications, intake temperatures are
likely to be much greater due to the high rate of EGR. This would require even higher
boost pressures to maintain the equivalence ratio of 0.67 used in this particular study.
Generation of the required boost pressures and EGR rates proposed presents a
considerable challenge and changes in hardware would be required to achieve these values
across a large operating range. Even contemporary VGT turbochargers generate little
boost below a threshold exhaust gas mass flow, pointing to supercharging or a more
sophisticated turbocharging process.
Modern electronically controlled HPCR fuel injection systems are also favourable to PCCI
combustion strategies. A great degree of flexibility and control will continue to be
available and research is being conducted into ultra-high pressure fuel injection of ~3000
bar [112]. In conjunction with this, smaller nozzle holes are also being used to further
improve atomisation of the fuel and allow smaller injection quantities to prevent limiting
the injector capabilities. The combined effects are improved air entrainment, and reduced
spray tip penetration and fuel film that adheres to the wall surface [112]. Due to the
smaller orifice area of the nozzles more holes may be required. Even if the current FIE
could provide 3000 bar rail pressures, the findings presented in Chapter 8 indicate the
increase in fuel consumption is likely to be unacceptably high. Doubling rail pressure
Chapter 10 Discussion and Conclusions
B. Keeler 111 University of Nottingham
from 600 bar to 1200 bar increased the minimum bsfc by 16% for at a particular operating
condition (1800 rpm 9.7 mg/stk/cyl), with even more severe bsfc penalties for a lower load
condition (1500 rpm 6.8 mg/stk/cyl). This trade-off must therefore be considered.
The work in this thesis has been carried out at steady state operating conditions, with
results presented in 7-9 illustrating the sensitivity of soot output to changes in AFR.
Transient conditions introduce different challenges, the most serious of which is expected
to be control of AFR since a finite delay exists before the turbocharger and EGR systems
stabilise following a change in demand. Re-mapping of the turbocharger to accommodate
these needs could reduce the impact, but lean or rich mixtures could be generated for very
short periods. This will have adverse effects on emission responses as they do with
conventional strategies and is expected to cause the greatest problem.
10.1.5 Aftertreatment Considerations
The emissions considered in this thesis have been engine-out. In a vehicle the exhaust
system would incorporate aftertreatment systems such as DOCs, LNTs, and/or DPFs. The
exhaust temperatures encountered with the majority of the testing were generally over
200ºC and should thus enable effective catalytic light-off [15] and oxidation of HC and
CO. This could allow a slightly higher concentration of CO and HC species to escape the
cylinder, although this may negatively impact fuel consumption.
The findings at steady state have indicated the combustion system can be very sensitive to
minor changes in EGR (Chapter 7) and injection parameters (Chapter 8), whilst transients
have the potential to cause AFR mismatches and varied mixture preparation. This leads
to the conclusion that a DPF will be required on vehicles for the foreseeable future.
Nevertheless, reducing engine-out soot is still beneficial as it reduces the frequency of
DPF regeneration. For regeneration, temperatures of approximately 600ºC and oxygen
concentrations of ~5% are required [6], but exhaust temperatures this high are rarely
encountered upstream of the DPF except at high engine speeds and loads. The use of a
heavily retarded post injection is commonly used to increase the exhaust temperature, but
has an associated fuel consumption penalty. This penalty is reduced when regeneration
intervals are increased and the potential for downsizing of the aftertreatment is also
possible, which could help reduce weight. The financial cost, however, is still likely to be
relatively high, which will continue to impact the overall cost of vehicles.
10.1.6 Alternatives to PCCI Combustion
Diesel combustion strategies are continually developing to increase performance and
reduce engine-out and tailpipe emissions. PCCI combustion strategies presented face stiff
Chapter 10 Discussion and Conclusions
B. Keeler 112 University of Nottingham
competition from conventional diesel combustion, HCCI, alternative fuelled engines such
as gasoline and biofuels, and non-internal combustion engines.
As indicated in Chapters 5 and 6, conventional combustion has the advantage of a wide
operating range, excellent fuel economy, low HC and CO emissions, and relatively low
combustion noise. A significant engine-out penalty in soot output must be accepted to
operate this regime and places a greater emphasis on the DPF aftertreatment systems. NOx
formation can be reduced effectively by increasing the level of EGR by reducing peak
combustion temperatures and oxygen availability. This is liable to increase soot formation
and negatively affect oxidation, resulting in increased net soot output and movement along
a NOx-soot trade-off. Although lower temperature combustion, local equivalence ratios
are too high to be deemed PCCI combustion.
Although the near zero emissions of soot and NOx offered by HCCI combustion, are
clearly desirable, many problems still exist. Cycle-to-cycle variations in combustion, the
lack of control over combustion with injection timing, poor vaporisation of diesel fuel,
high HC and CO emissions, potentially excessive combustion noise levels, and difficulties
with transient conditions are currently limiting its application.
A limitation of the investigation was that it was not possible to investigate the use of close
coupled injections due to fuel-rail interactions. The use of a split-main injection strategy
has previously been proposed [76] that allowed reductions in NOx and soot of
approximately 20% and 40% respectively with fuel economy and CO penalties of +3%
and +30% respectively, caused by the retarded phasing of the second main injection. Not
all emission and fuel consumption responses could be reduced simultaneously, with trade-
offs required. Nevertheless, at higher speed-load conditions, split-main injection strategies
may have an advantage over PCCI strategies without hardware modifications. In future,
industrial trends may change, with downsizing and turbocharging of gasoline vehicles a
potential substitute. In the long term alternatives to non-renewable fossil fuels must be
found. As was reviewed in 0 several alternatives to diesel powered vehicles are gaining
popularity, including electric, fuel-cell, or hybrid powered vehicles. The use of alternative
fuels including biofuels is also being investigated. The relative merits and current
problems of each are summarised in Table 1.2. Nevertheless, research into diesel
technologies remains at the forefront of engine technology and must continue to be
pursued further.
Chapter 10 Discussion and Conclusions
B. Keeler 113 University of Nottingham
10.1.7 The Future for PCCI Combustion Strategies
PCCI combustion clearly has advantages over conventional combustion in terms of soot
output, but has been shown to be limited in its range of operation. In Chapters 7-9 EGR
was shown to be essential to reduce combustion temperatures to limit NOx without
incurring an excessive fuel consumption penalty. Within this thesis it has been shown that
without engine hardware modifications PCCI combustion is achievable on a contemporary
DI diesel engine. Moreover, several injection and EGR strategies have been shown in
Chapters 7-9 to be successful at achieving PCCI combustion. Strategy selection is a
function of maximum allowable response outputs, engine speed, and required load output.
To avoid excessive combustion noise rate of peak pressure increase must be contained, but
the relative importance of combustion noise was shown in Chapter 5 to increase with
engine speed. Advanced combustion phasing was shown to be potentially problematic
when demanding low combustion noise, but was shown in Chapter 8 to offer very low soot
emissions. Fuel consumption was found to be a function of combustion phasing and
duration, deteriorating rapidly as phasing was retarded. Nevertheless, with the generic
PCCI strategy pursued in this thesis a more retarded combustion phasing with increase fuel
rail pressures was found to offer the best compromise when increasing load output, but
ultimately oxygen availability was found to constrain the operating range. Importantly,
the investigation carried out in this thesis used the same hardware for both PCCI and
conventional strategies. This offers a clear advantage and a duel mode strategy is likely to
be the most acceptable approach when considering the future of PCCI combustion. The
results presented in Chapters 5-9 has shown that PCCI combustion can be employed at low
engine speed-load conditions without hardware modifications. These conditions
encompass a significant proportion of drive-cycles. The mode could then be switched to
conventional combustion or a split-main strategy for higher speed-load operation.
However, the use of next generation hardware offers the possibility of expanding the
operating of PCCI combustion with industrial trends described earlier in this discussion
lending themselves to PCCI strategies. This could allow a greater use of PCCI combustion
and reduced dependence on conventional combustion at higher operating speeds and loads.
Although a DPF would continue to be required, the fuel consumption penalty associated
with its regeneration could be improved. Furthermore, the baseline generic single
injection strategy investigated in this thesis may well be improved with the use of multiple
injections to enhance fuel-air mixing.
Chapter 10 Discussion and Conclusions
B. Keeler 114 University of Nottingham
10.2 Further Work
The boost characteristics of the turbocharger system limited the operating range of
PCCI combustion. The use of a supercharger or remapping of the existing
turbocharger would potentially provide increased flexibility.
Increasing the mixing intensity to enhance premixing is beneficial. Port deactivation
was non-operational on the test engine but was further developed and present on the
later production version. Investigation into the variation of swirl ratio would also
benefit the adaptation to PCCI, potentially allowing slightly lower rail pressures to be
used to limit any fuel economy penalty. Although some pertinent literature is
available, combustion noise must also be considered.
Exploring the effect of compression ratio on adapting to a PCCI strategy would be
interesting since the general industry trend to towards lowering values. This should
increase ignition delays and thus mixing times, but could result in poorer combustion
and thermal efficiencies.
Only fully-warm steady state conditions have been investigated. Transients that would
naturally occur should the strategy be implemented in a vehicle (including drive
cycles) introduce new and different problems. The transient response of EGR and
adequate AFR control/response pose significant challenges.
The full potential of the HPCR FIE has not been fully exploited. Multiple injection
strategies could be investigated with an aim to increasing the premixing of fuel and air
with multiple shots of fuel. The effect of fuel rail interactions must be considered. In
the work presented only one factor at a time has been changed. DOE could be used to
investigate the effects of multiple injection strategies.
The constraints and limits of adapting to a PCCI strategy have been investigated but
not optimised. Optimisation strategies based on reducing specific target emissions
could be developed, for example minimising NOx without exceeding baseline fuel
consumption. Optimisation of load and speed limits over a wider range of EGR-
combustion phasing operating conditions would also be worthwhile.
There is potential scope for investigating the effect of soot clogging under pre-
determined operating conditions with two transducers installed in one cylinder
(measuring the same pressure), but housed in different adaptor designs. This would
allow a more direct comparison of the performance of the adaptors but would require
the cylinder head to be modified to accommodate the two adaptors.
Chapter 10 Discussion and Conclusions
B. Keeler 115 University of Nottingham
10.3 Conclusions
PCCI combustion is defined by high levels of premixed charge whilst retaining control
over combustion through injection timing. It offers the simultaneous reduction of NOx
and soot emissions.
Using an engine of current generation hardware not originally setup for PCCI
strategies, PCCI combustion has been successfully implemented up to an engine load
of 4.4 bar gross IMEP (at 1500 rpm) and up to a conservative engine speed of 2000
rpm (at 2.5 bar BMEP). With the available test engine both were limited by oxygen
availability:
o Load output was limited by the boost characteristics of the turbocharger
coupled with high intake temperatures.
o Speed was limited by poor availability of oxygen and insufficient mixing.
Increasing boost pressures is vital to expand the operating region of PCCI combustion,
but hardware modifications would be necessary to achieve this. Further cooling of
EGR gases to increase intake density would be of great benefit.
A duel mode strategy is most appropriate with PCCI combustion used at lighter speed-
load demands and the regime switched to a conventional strategy for the higher
operating regions, both using the same hardware.
Mixture preparation with PCCI strategies is characterised by lower and more uniform
local equivalence ratios at ignition and increased dilution. The net soot reduction
mechanism exploited with PCCI combustion is decreasing soot formation to outweigh
the reduction in oxidation, which is hindered with increased dilution.
NOx emissions can be well controlled with EGR for both PCCI and conventional
combustion. However, when achieving this with conventional combustion the charge
is not sufficiently premixed to be deemed PCCI combustion. The result is a traditional
NOx-soot trade-off.
Combustion noise is highly dependent on and correlates well with the peak rate of
pressure rise and engine speed, but is not unique to PCCI combustion strategies. With
PCCI strategies high levels of premix and advanced combustion phasing can result in
rapid rates of heat release, which generate large peak rates of increase of pressure and
subsequently excessive combustion noise levels.
Chapter 10 Discussion and Conclusions
B. Keeler 116 University of Nottingham
Using PCCI combustion strategies the emission responses of soot, NOx, CO and HC
have been examined together with fuel consumption and combustion noise level, at
conditions comparable to NEDC requirements. These cannot all be reduced
simultaneously
Operating with a single main injection a number of strategies are available to
simultaneously reduce soot and NOx emissions:
o High EGR and highly advanced injection timing provides a long ignition delay for
premixing. Rapid rates of heat release can result in high combustion noise, but
low CO and HC outputs are achievable. This is a potential strategy for lower
speed-load running conditions where combustion noise levels are lower.
o Moderate-to-high EGR and retarded combustion phasing reduces temperatures and
increases ignition delay to allow further premixing. Combustion efficiency and
increased fuel consumption penalties are paid, but lower rates of heat release result
in low combustion noise. This strategy is more suited to higher load operating
conditions since higher bulk-gas temperatures are generated, beneficial to CO and
HC oxidation processes.
o Increasing fuel rail pressure across all injection timings can significantly reduce
soot output, but a trade-off with bsfc is required due to the power consumed by the
high pressure pump. Large soot reductions of ~-90% at a reasonable bsfc penalty
~+6% are achievable and could allow injection timing to be advanced to improve
isfc.
The addition of a post-main injection reduced soot emissions by up to a third, but
incurred an increase in fuel consumption and HC emissions. Fuel rail interactions also
pose a problem in controlling injection pressures and quantities, which can give rise to
increased fuel consumption and a potential deterioration in combustion.
isfc is primarily a function of combustion phasing and duration. Minimum isfc values
were found when combustion occurs just retarded of TDC, deteriorating when phasing
is advanced or significantly retarded. isfc of PCCI combustion is comparable to
conventional isfc values, but bsfc potentially higher.
Employing PCCI combustion strategies offers the advantage of increased intervals
between DPF regenerations, which benefits fuel economy. Aftertreatment will still be
required to meet tailpipe emission targets due to the sensitivity of combustion to
charge composition and mixture preparation.

References
B. Keeler 117 University of Nottingham
REFERENCES
[1] Intergovernmental Panel on Climate Change (IPCC) Website. Climate Change2007: Synthesis Report. Summary for Policymakers.http://www.ipcc.ch/pdf/assessment-report/ar4/syr/ar4_syr_spm.pdf. AccessedAug. 2008
[2] European Commission Website. Reducing CO2 emissions from light-dutyvehicles. http://ec.europa.eu/environment/air/transport/co2/co2_home.htm.Accessed Aug. 2008
[3] DieselNet: Diesel Emissions Online. Emission Standards: Europe: Cars andLight Trucks. http://www.dieselnet.com/standards/eu/ld.php. DieselnetWebsite, Accessed May 2007
[4] United Nations Framework Convention on Climate Change. Kyoto Protocol.http://unfccc.int/kyoto_protocol/items/2830.php. Accessed Jan. 2008
[5] Environmental Protection UK Website. Car Pollution.http://www.environmental-protection.org.uk/transport/car-pollution/. AccessedJan. 2008
[6] Robert Bosch GmbH. Diesel-Engine Management Systems and Components.John Wiley & Sons Ltd, 4th edition 2005
[7] U.S. Department of Energy: EERE (Energy Efficiency and RenewableEnergy). Diesel Car Sales Top Gasoline Car Sales in Europe.http://www1.eere.energy.gov/vehiclesandfuels/facts/2007_fcvt_fotw481.html.US Dept. of Energy Website, Accessed Sept. 2007
[8] European Automobile Manufacturers' Association (ACEA) Automobileproduction expanded by 5.3% in 2007: Trend toward diesel remains.http://www.acea.be/index.php/news/news_detail/automobile_production_expanded_by_53_in_2007. Accessed Aug. 2008
[9] J. B. Heywood. Internal Combustion Engine Fundamentals. McGraw-HillBook Company, 1988
[10] T. Kamimoto and M.-H. Bae. High Combustion Temperature for the Reductionof Particulate in Diesel Engines. SAE Paper 880423. Society of AutomotiveEngineers, 1988
[11] T. Kitamura, T. Ito, J. Senda and H. Fujimoto. Mechanism of Smokeless DieselCombustion with Oxygenated Fuels Based on the Dependence of theEquivalence Ratio and Temperature on Soot Particle Formation. InternationalJournal of Engine Research, 3 (4). 223-248, 2002
References
B. Keeler 118 University of Nottingham
[12] K. Akihama, Y. Takatori, K. Inagaki, S. Sasaki and A. Dean. Mechanism of theSmokeless Rich Diesel Combustion by Reducing Temperature. SAE Paper2001-01-0655. Society of Automotive Engineers, 2001
[13] S. Kook, C. Bae, P. C. Miles, D. Choi and L. M. Pickett. The Influence ofCharge Dilution and Injection Timing on Low-Temperature Diesel Combustionand Emissions. SAE Paper 2005-01-3837. Society of Automotive Engineers,2005
[14] S. Kook and C. Bae. Combustion Control Using Two-Stage Diesel FuelInjection in a Single-Cylinder PCCI Engine. SAE Paper 2004-01-0938. Societyof Automotive Engineers, 2004
[15] A. Knafl, T. J. Jacobs, S. V. Bohac and D. N. Assanis. The Load Limits of LowTemperature Premixed Compression Ignition Diesel Combustion. ISCE 2006,The 2nd International Symposium on "Clean and High-Efficiency Combustionin Engines", Tianjin, China, 2006
[16] M. Musculus, J. E. Dec and L. M. Pickett. In-Cylinder Imaging ofConventional and Advanced, Low-Temperature Diesel Combustion. DieselEngine Emissions Reduction Conference, Chicago, 2005
[17] B. Keeler and P. J. Shayler. Constraints on Fuel Injection and EGR Strategiesfor Diesel PCCI-Type Combustion. SAE Paper 2008-01-1327. Society ofAutomotive Engineers, 2008
[18] A. Helmantel. Reduction of NOx Emissions from a Light Duty DI DieselEngine in Medium Load Conditions with High EGR Rates. SAE Paper 2008-01-0643. Society of Automotive Engineers, 2008
[19] J. E. Dec. Advanced compression-ignition engines--understanding the in-cylinder processes. Proceedings of the Combustion Institute, 32 (2). 2727-2742, 2009
[20] T. J. Jacobs, S. V. Bohac, D. N. Assanis and P. G. Szymkowicz. Lean and RichPremixed Compression Ignition Combustion in a Light-Duty Diesel Engine.SAE Paper 2005-01-0166. Society of Automotive Engineers, 2005
[21] S. Kimura, O. Aoki, Y. Kitahara and E. Aiyoshizawa. Ultra-Clean CombustionTechnology Combining a Low-Temperature and Premixed CombustionConcept for Meeting Future Emission Standards. SAE Paper 2001-01-0200.Society of Automotive Engineers, 2001
[22] S. Kimura, H. Ogawa, Y. Matsui and Y. Enomoto. An Experimental Analysis ofLow-Temperature and Premixed Combustion for Simultaneous Reduction ofNOx and Particulate Emissions in Direct Injection Diesel Engines.International Journal of Engine Research, 3 (4). 249-259, 2002
[23] F. Tao, Y. Liu, B. H. RempelEwert, D. E. Foster, R. D. Reitz, D. Choi and P.C. Miles. Modelling the Effects of EGR and Injection Pressure on Soot
References
B. Keeler 119 University of Nottingham
Formation in a High-Speed Direct-Injection (HSDI) Diesel Engine Using aMulti-Step Phenomenological Soot Model. SAE Paper 2005-01-0121. Societyof Automotive Engineers, 2005
[24] T. Fang, R. E. Coverdill, F. Chia-fon and R. A. White. Combustion and SootVisualization of Low Temperature Combustion within an HSDI Diesel EngineUsing Multiple Injection Strategy. SAE Paper 2006-01-0078. Society ofAutomotive Engineers, 2006
[25] S. Kimura, O. Aoki, H. Ogawa, S. Muranaka and Y. Enomoto. NewCombustion Concept for Ultra-Clean and High-Efficiency Small DI DieselEngines. SAE Paper 1999-01-3681. Society of Automotive Engineers, 1999
[26] R. Hasegawa and H. Yanagihara. HCCI Combustion in DI Diesel Engine. SAEPaper 2003-01-0745. Society of Automotive Engineers, 2003
[27] W. L. Hardy and R. D. Reitz. A Study of the Effects of High EGR, HighEquivalence ratio, and Mixing Time on Emissions Levels in a Heavy-DutyDiesel Engine for PCCI Combustion. SAE Paper 2006-01-0026. Society ofAutomotive Engineers, 2006
[28] J. E. Dec. A Conceptual Model of DI Diesel Combustion Based on Laser-SheetImaging. SAE Paper 970873. Society of Automotive Engineers, 1997
[29] P. F. Flynn, R. P. Durrett, G. L. Hunter, A. O. Zur Loye, O. C. Akinyemi, J. E.Dec and C. K. Westbrook. Diesel Combustion: An Integrated View CombiningLaser Diagnostics, Chemical Kinetics, and Emperical Validation. SAE Paper1999-01-0509. Society of Automotive Engineers, 1999
[30] P. Eastwood. Critical Topics in Exhaust Gas Aftertreatment. Research Studiespress LTD, 2000
[31] A. Catanese. Emission Characterization and Cylinder Pressure Information forApplications in the Electronic Engine Management of Diesel Engines. Ph.D.thesis, University of Nottingham, 2006
[32] X. Li and J. Wallace. A Phenomenological Model for Soot Formation andOxidation in Direct-Injection Diesel Engines. SAE Paper 952428. Society ofAutomotive Engineers, 1995
[33] R. J. Crooks, G. Sivalingam, M. A. A. Nazha and H. Rajakaruna. Analysis ofSoot Particulate Formation in a High-Pressure Confined Spray-Flame. SAEPaper 1999-01-3488. Society of Automotive Engineers, 1999
[34] R. E. Morgan, M. R. Gold, O. Laguitton, C. Crua and M. R. Heikal.Characterisation of the Soot Formation Processes in a High PressureCombusting Diesel Fuel Spray. SAE Paper 2003-01-3086. Society ofAutomotive Engineers, 2003
[35] Y. B. Zeldovich and P. Y. Sadovnikov. Oxidation of Nitrogen in Combustion.Academy of Sciences, USSR. 1947
References
B. Keeler 120 University of Nottingham
[36] M. Badami, F. Millo and D. D. D'Amata. Experimental Investigation on Sootand NOx Formation in a DI Common Rail Diesel Engine with Pilot Injection.SAE Paper 2001-01-0657. Society of Automotive Engineers, 2001
[37] H. Koren and M. S. Bisesi. Handbook of Environmental Health; Biological,Chemical, and Physical Agents of Environmentally Related Disease. CRCPress, 4th edition 2003
[38] M. F. Russell. The dependence of diesel combustion on injection. Proceedingsof the I Mech E Seminar Future Engine and System Technologies - The EUROIV Challenge, (S490/005/97). 65-82, 1997
[39] M. Taschek, C. Fettes and A. Leipertz. Analysis of the Combustion Process in aHeavy-Duty Transparent Diesel Engine Equipped with 4-Valve Cylinder Headand Common Rail Injetcion System. SAE Paper 2001-01-3181. Society ofAutomotive Engineers, 2001
[40] M. F. Russell, C. D. Young and S. W. Nicol. Modulation of Injection Rate toImprove Direct Injection Diesel Engine Noise. SAE Paper 900349. Society ofAutomotive Engineers, 1990
[41] D. Kim, I. Ekoto, W. F. Colban and P. C. Miles. In-cylinder CO and UHCImaging in a Light-Duty Diesel Engine during PPCI Low-TemperatureCombustion. SAE Paper 2008-01-1602. Society of Automotive Engineers,2008
[42] M. Sjöberg and J. E. Dec. An investigation into lowest acceptable combustiontemperatures for hydrocarbon fuels in HCCI engines. Proceedings of theCombustion Institute, 30 (2). 2719-2726, 2005
[43] I. Khan, G. Greeves and C. Wang. Factors affecting smoke and gaseousemissions from direct injection engines and a method of calculation. SAETransactions 730169. Society of Automotive Engineers, 1973
[44] M. Sjöberg and J. E. Dec. Combined Effects of Fuel-Type and Engine Speed onIntake Temperature Requirements and Completeness of Bulk-Gas Reactions forHCCI Combustion. SAE Paper 2003-01-3173. Society of AutomotiveEngineers, 2003
[45] B. Carberry, G. Grasi, S. Guerin, F. Jayat and R. Konieczny. Pre-TurbochargerCatalyst - Fast catalyst light off evaluation. SAE Paper 2005-01-2142. Societyof Automotive Engineers, 2005
[46] Department for Transport Website. The environmental impacts of road vehiclesin use.http://www.dft.gov.uk/pgr/roads/environment/cvtf/theenvironmentalimpactsofroa3793. Accessed Jan. 2008
[47] A. Saad and EI-Sebai. Combustion Noise Prediction Inside Diesel Engine. SAEPaper 1999-01-1774. Society of Automotive Engineers, 1999
References
B. Keeler 121 University of Nottingham
[48] R. Hasegawa, I. Sakata, T. Koyama and H. Yangagihara. Numerical Analysis ofIgnition Control in HCCI Engine. SAE Paper 2003-01-1817. Society ofAutomotive Engineers, 2003
[49] J.-O. Olsson, P. Tunestal and B. Johansson. Boosting for High Load HCCI.SAE Paper 2004-01-0940. Society of Automotive Engineers, 2004
[50] T. Lee and R. D. Reitz. The Effect of Intake Boost Pressure on MK (ModulatedKinetics) Combustion. JSME International Journal, 46 (Series B, No 3). 2003
[51] R. S. Wijetunge, J. G. Hawley and N. D. Vaughan. Application of AlternativeEGR and VGT Strategies to a Diesel Engine. SAE Paper 2004-01-0899.Society of Automotive Engineers, 2004
[52] J. G. Hawley, F. J. Wallace and A. Cox. Reduction of Steady State NOx Levelsfrom an Automotive Diesel Engine Using Optimised VGT/EGR Schedules. SAEPaper 1999-01-0835. Society of Automotive Engineers, 1999
[53] Y. Chi, J. Cheong, C. Kim and K. Choi. Effects of VGT and InjectionParameters on Performance of HSDI Diesel Engine with Common Rail FIESystem. SAE Paper 2002-01-0504. Society of Automotive Engineers, 2002
[54] N. Ladommatos, S. M. Abdelhalim, H. Zhao and Z. Hu. The Dilution,Chemical, and Thermal Effects of Exhaust Gas Recirculation on Diesel EngineEmissions - Part 1: Effect of Reducing Inlet Charge Oxygen. SAE Paper961165. Society of Automotive Engineers, 1996
[55] N. Ladommatos, S. M. Abdelhalim, H. Zhao and Z. Hu. Effects of EGR onHeat Release in Diesel Combustion. SAE Paper 980184. Society ofAutomotive Engineers, 1998
[56] N. Ladommatos, S. M. Abdelhalim, H. Zhao and Z. Hu. The Dilution,Chemical, and Thermal Effects of Exhaust Gas Recirculation on Diesel EngineEmissions - Part 2: Effect of Carbon Dioxide. SAE Paper 961167. Society ofAutomotive Engineers, 1996
[57] F. Payri, J. Benajes, S. Molina and J. M. Riesco. Reduction of PollutantEmissions in a HD Diesel Engine by Adjustment of Injection Parameters, BoostPressure and EGR. SAE Paper 2003-01-0343. Society of AutomotiveEngineers, 2003
[58] S. M. Aceves and D. L. Flowers. A Detailed Chemical Kinetic Analysis of LowTemperature Non-Sooting Diesel Combustion. SAE Paper 2005-01-0923.Society of Automotive Engineers, 2005
[59] T. Rente, S. Gjirja and I. Denbratt. Experimental Investigation of the Effect ofNeedle Opening (NOP) Pressure on Combustion and Emissions Formation in aHeavy Duty DI Diesel Engine. SAE Paper 2004-01-2921. Society ofAutomotive Engineers, 2004
References
B. Keeler 122 University of Nottingham
[60] L. M. Pickett, J. A. Caton, M. P. B. Musculus and A. E. Lutz. Evaluation of theequivalence ratio-temperature region of diesel soot precursor formation usinga two-stage Langrangian model. International Journal of Engine Research, 7.349-370, 2006
[61] N. Ishikawa, Y. Ohkubo and K. Kudou. Study on the Effects of EGR CoolerPerformance on Combustion Properties of the Pre-mixed Compression IgnitionCombustion by Multi Cylinder DI Diesel Engine. SAE Paper 2007-01-1881.Society of Automotive Engineers, 2007
[62] N. A. Henein, M.-C. Lai, I. Singh, L. Zhong and J. Han. Characteristics of aCommon Rail Diesel Injection System under Pilot and Post Injection Modes.SAE Paper 2002-01-0218. Society of Automotive Engineers, 2002
[63] F. Mallamo, M. Badami and F. Millo. Analysis of Multiple Injection Strategiesfor the Reduction of Emissions, Noise, and BSFC of a DI CR SmallDisplacement Non-Road Diesel Engine. SAE Paper 2002-01-2672. Society ofAutomotive Engineers, 2002
[64] M. Badami, F. Mallamo, F. Millo and E. E. Rossi. Influence if MultipleInjection Strategies on Emissions, Combustion Noise and BSFC of a DICommon Rail Diesel Engine. SAE Paper 2002-01-0503. Society of AutomotiveEngineers, 2002
[65] D. T. Hountalas, D. A. Kouremenos, K. B. Binder, V. Schwarz and G. C.Mavropoulos. Effect of Injection Pressure on the Performance and ExhaustEmissions of a Heavy Duty DI Diesel Engine. SAE Paper 2003-01-0340.Society of Automotive Engineers, 2003
[66] H. Hiroyasu and M. Arai. Structures of Fuel Sprays in Diesel Engines. SAEPaper 900475. Society of Automotive Engineers, 1990
[67] L. M. Pickett and D. L. Siebers. Non-Sooting, Low Flame Temperature Mixing-Controlled DI Diesel Combustion. SAE Paper 2004-01-1399. Society ofAutomotive Engineers, 2004
[68] Froude Hofmann Website. Eddy Current Engine Dynamometers.http://www.froudehofmann.com/product_family_2.htm. Accessed Sept. 2005
[69] Kistler Website. Continuous Pressure Monitoring Products.http://www.kistler.com/gb_en-gb/221_ContinousMonitoring/Continuous-Pressure-Monitoring.html. Accessed Sept. 2005
[70] Paroscientific, Inc. Website. Precision Pressure Instrumentation.www.paroscientific.com. Accessed Sept. 2005
[71] Micro-Epsilon Website. Revolution counter for turbochargers.http://www.micro-epsilon.com/products/custom-designed-sensors/OEM-Automotive/Turbolader_rpm/index.html. Accessed Feb. 2006
References
B. Keeler 123 University of Nottingham
[72] H. W. Lord, W. S. Gatley and H. A. Evensen. Noise Control for Engineers.McGraw-Hill Book Company, 1980
[73] C. Matthews. IMechE Engineers' Data Book. Professional EngineeringPublishing Ltd, 2nd edition 2000
[74] S. T. Jones. Experimental Investigations, Modelling and Control of DirectInjection Gasoline Engines. Ph.D. thesis, University of Nottingham, 2002
[75] R. Christian, F. Knopf, A. Jaschek and W. Schindler. A new method ofmeasuring Filter Smoke Number with increased sensitivity. MTZ 54, 1993
[76] T. D. Brooks. Split-Main Injection Strategies For Diesel Engines And TheirInfluence On Emissions And Fuel Consumption. Ph.D. thesis, University ofNottingham, 2005
[77] M. F. J. Brunt, H. Rai and A. L. Emtage. The Calculation of Heat ReleaseEnergy from Engine Cylinder Pressure Data. SAE Paper 981052. Society ofAutomotive Engineers, 1998
[78] F. Payri, S. Molina, J. Martín and O. Armas. Influence of measurement errorsand estimated parameters on combustion diagnosis. Applied ThermalEngineering, 26 (2-3). 226-236, 2006
[79] S. R. Turns. An Introduction to Combustion: Concepts and Applications.McGraw-Hill Book Company, 2nd edition 2000
[80] G. F. C. Rogers and Y. R. Mayhew. Thermodynamic and Transport Propertiesof Fluids. Blackwell Publishers Ltd, 5th edition 1995
[81] C. Olikara and G. L. Borman. A Computer Program for Calculating Propertiesof Equilibrium Combustion Products with Some Applications to I. C. EnginesSAE Paper 750468. Society of Automotive Engineers, 1975
[82] M. F. J. Brunt and K. C. Platts. Calculation of Heat Release in Direct InjectionDiesel Engines. SAE Paper 1999-01-0187. Society of Automotive Engineers,1999
[83] N. Watson, A. D. Pilley and M. Marzouk. A Combustion Correlation for DieselEngine Simulation. SAE Paper 800029. Society of Automotive Engineers, 1980
[84] Acoustics - Measurement of noise emitted by accelerating road vehicles -Engineering method, International Organization for Standardization.International Organization for Standardization 1998
[85] J. Affenzeller and A. Rust. Road Traffic Noise - a Topic for Today and theFuture. VDA - Technical Congress 2005, 2005
[86] A. Rust. Noise Technology Status Report: Community Noise Research StrategyPlan. Coordination of European Research for Advanced Transport NoiseMitigation (CALM), 2003
References
B. Keeler 124 University of Nottingham
[87] C. A. Idicheria and L. M. Pickett. Soot Formation in Diesel Combustion underHigh-EGR Conditions. SAE Paper 2005-01-3834. Society of AutomotiveEngineers, 2005
[88] A. Kettlety, Senior NVH Engineer, Ford Motor Company Ltd PersonalCommunication. 2007
[89] J. D. Irwin and E. R. Graf. Industrial Noise and Vibration Control. Prentice-Hall, 1979
[90] V. Sohm, S.-C. Kong, D. E. Foster, T. Morikawa and M. Iida. A ComputationalInvestigation into the Cool Flame Region in HCCI Combustion. SAE Paper2004-01-0552. Society of Automotive Engineers, 2004
[91] H. H. Wolfer. Ignition Lag in Diesel Engines. VDI-Forschungsheft 392,Translated by Royal Aircraft Establishment, Farnborough Library No. 358,UDC 621-436.047, August 1959, 1938
[92] D. N. Assanis, Z. S. Filipi, S. B. Fiveland and M. Syrimis. A Predictive IgnitionDelay Correlation under Steady-State and Transient Operation of a DirectInjection Diesel Engine. ASME Journal of Engineering for Gas Turbines andPower 125 (2). 450-457, 2003
[93] A. Ormond. The Influence of Valve Timing and Other Features on theCombustion and Emissions Characteristics of a DISI Engine. Ph.D. thesis,University of Nottingham, 2007
[94] A. Vressner, A. Lundin, M. Christensen, P. Tunestal and B. Johansson.Pressure Oscillations During Rapid HCCI Combustion. SAE Paper 2003-01-3217. Society of Automotive Engineers, 2003
[95] K. Y. Cheng, P. J. Shayler and M. Murphey. The influence of blow-by onindicated work output from a diesel engine under cold start conditions.Proceedings of the I MECH E Part D Journal of Automobile Engineering, 218(3). 333-340, 2004
[96] M. Musculus, T. Lachaux, L. M. Pickett and C. A. Idicheria. End-of-InjectionOver-Mixing and Unburned Hydrocarbon Emissions in Low-Temperature-Combustion Diesel Engines. SAE Paper 2007-01-0907. Society of AutomotiveEngineers, 2007
[97] Ricardo Company Website. Press Release: Ricardo announces clean dieseltechnology breakthrough.http://www.ricardo.com/media/pressreleases/pressrelease.aspx?page=85.Accessed Oct. 2008
[98] Y. Bravo, Y. L. Lázaro and J. J. García-Bernard. Study of Fouling Phenomenaon EGR Coolers Due to Soot Deposits - Development of a Representative TestMethod. SAE Paper 2005-01-1143. Society of Automotive Engineers, 2005
References
B. Keeler 125 University of Nottingham
[99] The New Jaguar XF Diesel S.http://www.jaguar.co.uk/uk/en/latest/news/current/The-new-XF-V6-Diesel-S.htm. Jaguar UK Website, Accessed Jan. 20009
[100] R. C. Yu and S. M. Shahed. Effects of Injection Timing and Exhaust GasRecirculation on Emissions from a D.I. Diesel Engine. SAE Paper 811234.Society of Automotive Engineers, 1981
[101] H. Yun and R. D. Reitz. Combustion optimization in the low-temperaturediesel combustion regime. International Journal of Engine Research, 6 (513).2005
[102] C. Park, S. Kook and C. Bae. Effects of Multiple Injections in a HSDI DieselEngine Equipped With Common Rain Injection System. SAE Paper 2004-01-0127. Society of Automotive Engineers, 2004
[103] F. Payri, J. Benajes, J. V. Pastor and S. Molina. Influence of the Post-InjectionPattern on Performance, Soot and NOx Emissions in a HD Diesel Engine. SAEPaper 2002-01-0502. Society of Automotive Engineers, 2002
[104] S. K. Chen. Simultaneous Reduction of NOx and Particulate Emissions byUsing Multiple Injections in a Small Diesel Engine. SAE Paper 2000-01-3084.Society of Automotive Engineers, 2000
[105] P. Eastwood, Y. Hardalupas, T. Morris, A. Taylor, K. Tufail and T.Winstanley. The effect of multiple fuel-injections on emissions of NOx andsmoke with partially-premixed diesel combustion in a common-rail dieselengine. IMechE Internal Combustion Engines: Performance, Fuel Economyand Emissions. p285-301, 2007
[106] G. M. Bianchi, G. Cazzoli, P. Pelloni and F. E. Corcione. Numerical StudyTowards Smokeless and NOx-less HSDI Diesel Engine Combustion. SAE Paper2002-01-1115. Society of Automotive Engineers, 2002
[107] K. Nishida, J. Gao, T. Manabe and Y. Zhang. Spray and mixture properties ofevaporating fuel spray injected by hole-type direct injection diesel injectorInternational Journal of Engine Research, 9 (4). 347-360, 2008
[108] H. Yun, M. Sellnau, N. Milovanovic and S. Zuelch. Development of PremixedLow-Temperature Diesel Combustion in a HSDI Diesel Engine. SAE Paper2008-01-0639. Society of Automotive Engineers, 2008
[109] H. Yun and R. D. Reitz. An Experimental Investigation on the Effect of Post-Injection Strategies on Combustion and Emissions in the Low-TemperatureDiesel Combustion Regime. Journal of Engineering for Gas Turbines andPower, 129 (279). 2007
[110] D. S. Kim and C. S. Lee. Improved emission characteristics of HCCI engine byvarious premixed fuels and cooled EGR. Fuel, 85 (5-6). 695-704, 2006
References
B. Keeler 126 University of Nottingham
[111] R. Bosch. Diesel-Engine Management Systems and Components. John Wiley &Sons Ltd, 4th Edition 2005
[112] W. Zhang, K. Nishida, J. Gao and D. Miura. An experimental study on flat-wall-impinging spray of microhole nozzles under ultra-high injection pressuresProceedings of the IMechE Part D Journal of Automobile Engineering, 222 (9).1731-1741, 2008
[113] dSPACE GmbH. High-resolution A/D boards.http://www.dspaceinc.com/ww/en/inc/home/products/hw/modular_hardware_introduction/i_o_boards/a_d_boards.cfm. Accessed June 2008
[114] L. J. Spadaccini and J. A. TeVelde. Auto-Ignition Characteristics of Aircraft-Type Fuel. Combustion and Flame, 46. 283-300, 1982
[115] F. Pischinger, U. Reuter and E. Scheid. Self-Ignition of Diesel Sprays and itsDependence on Fuel Properties and Injection Parameters. ASME Journal ofEngineering for Gas Turbines and Power, 110. 399-404, 1988
[116] Nautica Dehumidifier Website. Psychrometric Chart.www.nauticadehumid.com. Accessed Aug. 2007
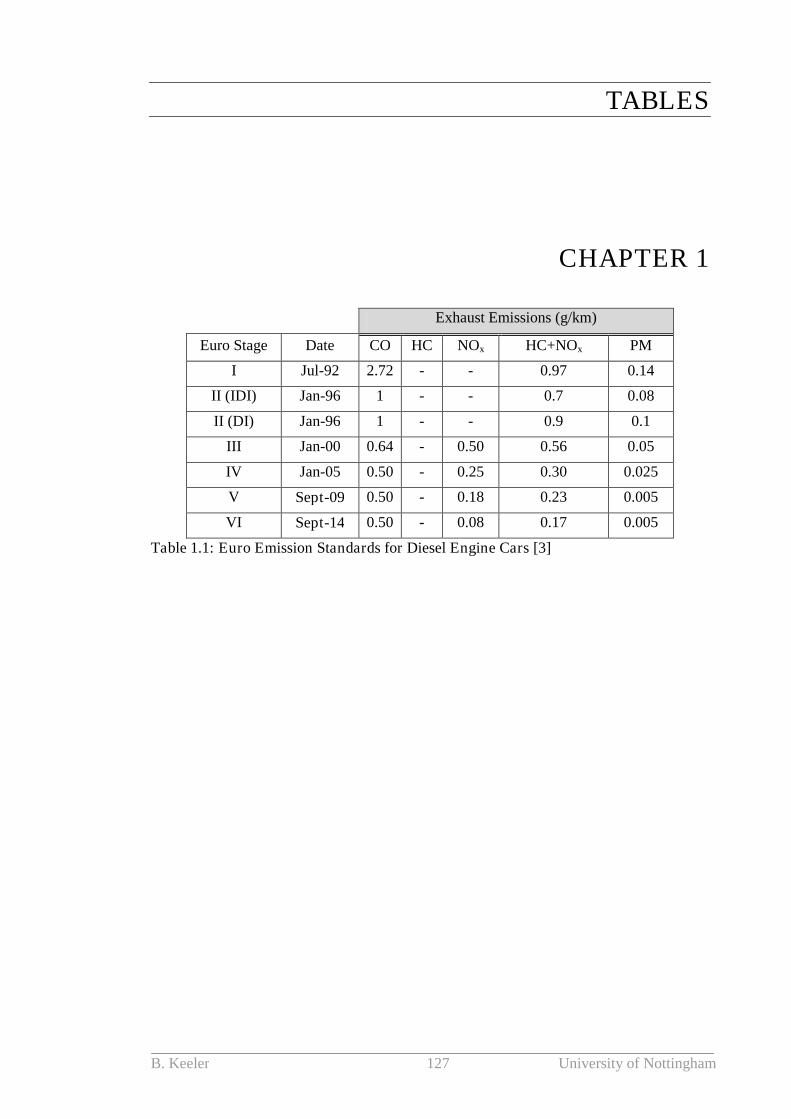
B. Keeler 127 University of Nottingham
TABLES
CHAPTER 1
Exhaust Emissions (g/km)
Euro Stage Date CO HC NOx HC+NOx PM
I Jul-92 2.72 - - 0.97 0.14
II (IDI) Jan-96 1 - - 0.7 0.08
II (DI) Jan-96 1 - - 0.9 0.1
III Jan-00 0.64 - 0.50 0.56 0.05
IV Jan-05 0.50 - 0.25 0.30 0.025
V Sept-09 0.50 - 0.18 0.23 0.005
VI Sept-14 0.50 - 0.08 0.17 0.005
Table 1.1: Euro Emission Standards for Diesel Engine Cars [3]
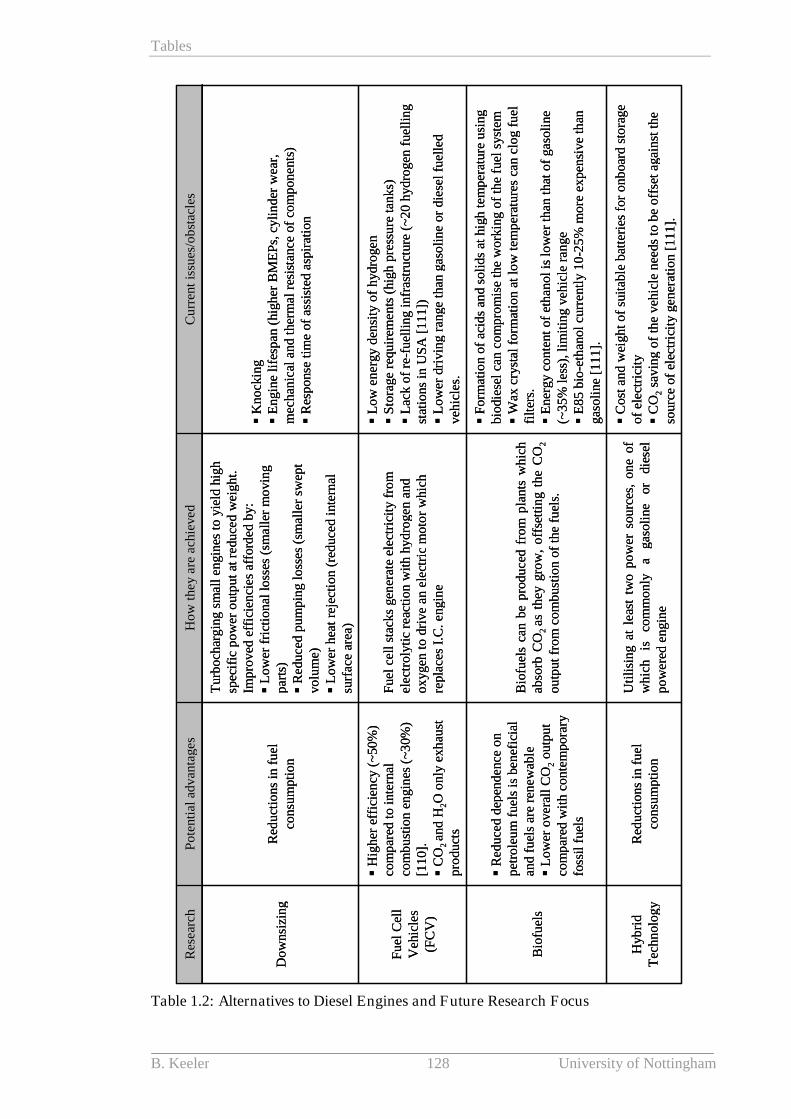
Tables
B. Keeler 128 University of Nottingham
C
ost
and
wei
ght
of
suit
able
bat
teri
esfo
ro
nb
oard
sto
rage
of
elec
tric
ity
C
O2
sav
ing
of
the
veh
icle
nee
dsto
be
offs
etag
ain
stth
eso
urce
ofel
ectr
icit
yge
ner
atio
n[1
11]
.
Uti
lisi
ng
atle
ast
two
po
wer
sou
rces
,o
ne
ofw
hic
his
com
mo
nly
aga
soli
neor
dies
elp
ow
ered
engi
ne
Red
uct
ions
infu
elco
nsu
mpt
ion
Hyb
rid
Tec
hn
olo
gy
F
orm
atio
nof
acid
san
dso
lid
sat
high
tem
per
atur
eu
sing
bio
dies
elca
nco
mp
rom
ise
the
wo
rkin
go
fth
efu
elsy
stem
W
axcr
ysta
lfo
rmat
ion
atlo
wte
mp
erat
ures
can
clo
gfu
elfi
lter
s.
En
ergy
con
tent
of
eth
anol
islo
wer
than
that
of
gaso
line
(~3
5%
less
),li
mit
ing
veh
icle
ran
ge
E8
5b
io-e
than
olcu
rren
tly
10
-25
%m
ore
exp
ensi
veth
ang
aso
line
[11
1].
Bio
fuel
sca
nbe
pro
du
ced
fro
mp
lan
tsw
hic
hab
sorb
CO
2as
they
gro
w,
off
sett
ing
the
CO
2
ou
tput
fro
mco
mb
ust
ion
ofth
efu
els.
R
edu
ced
dep
end
ence
on
pet
role
um
fuel
sis
ben
efic
ial
and
fuel
sar
ere
new
able
L
ow
ero
vera
llC
O2
ou
tpu
tco
mp
ared
wit
hco
nte
mp
orar
yfo
ssil
fuel
s
Bio
fuel
s
L
ow
ener
gyd
ensi
tyo
fh
ydro
gen
S
tora
gere
quir
emen
ts(h
igh
pre
ssu
reta
nks
)
Lac
ko
fre
-fu
elli
ng
infr
astr
uct
ure
(~2
0h
ydro
gen
fuel
lin
gst
atio
nsin
US
A[1
11]
)
Lo
wer
driv
ing
ran
geth
anga
soli
ne
ord
iese
lfu
elle
dv
ehic
les.
Fu
elce
llst
acks
gen
erat
eel
ectr
icit
yfr
om
elec
trol
ytic
reac
tio
nw
ith
hyd
roge
nan
do
xyg
ento
driv
ean
elec
tric
mo
tor
whi
chre
plac
esI.
C.
engi
ne
H
igh
eref
fici
ency
(~50
%)
com
par
edto
inte
rnal
com
bu
stio
nen
gin
es(~
30%
)[1
10]
.
CO
2an
dH
2O
on
lyex
hau
stp
rod
ucts
Fu
elC
ell
Veh
icle
s(F
CV
)
K
no
ckin
g
En
gin
eli
fesp
an(h
igh
erB
ME
Ps,
cyli
nd
erw
ear,
mec
han
ical
and
ther
mal
resi
stan
ceof
com
po
nen
ts)
R
esp
ons
eti
me
ofas
sist
edas
pira
tion
Tur
bo
char
gin
gsm
all
engi
nes
toyi
eld
hig
hsp
ecif
icp
ow
ero
utp
ut
atre
duce
dw
eig
ht.
Imp
rov
edef
fici
enci
esaf
ford
edb
y:
Lo
wer
fric
tio
nal
loss
es(s
mal
ler
mo
vin
gp
arts
)
Red
uce
dp
um
pin
glo
sses
(sm
alle
rsw
ept
volu
me)
L
ow
erh
eat
reje
ctio
n(r
educ
edin
tern
alsu
rfac
ear
ea)
Red
uct
ions
infu
elco
nsu
mpt
ion
Do
wn
sizi
ng
Cu
rren
tis
sues
/ob
stac
les
Ho
wth
eyar
eac
hiev
edP
ote
ntia
lad
van
tage
sR
esea
rch
C
ost
and
wei
ght
of
suit
able
bat
teri
esfo
ro
nb
oard
sto
rage
of
elec
tric
ity
C
O2
sav
ing
of
the
veh
icle
nee
dsto
be
offs
etag
ain
stth
eso
urce
ofel
ectr
icit
yge
ner
atio
n[1
11]
.
Uti
lisi
ng
atle
ast
two
po
wer
sou
rces
,o
ne
ofw
hic
his
com
mo
nly
aga
soli
neor
dies
elp
ow
ered
engi
ne
Red
uct
ions
infu
elco
nsu
mpt
ion
Hyb
rid
Tec
hn
olo
gy
F
orm
atio
nof
acid
san
dso
lid
sat
high
tem
per
atur
eu
sing
bio
dies
elca
nco
mp
rom
ise
the
wo
rkin
go
fth
efu
elsy
stem
W
axcr
ysta
lfo
rmat
ion
atlo
wte
mp
erat
ures
can
clo
gfu
elfi
lter
s.
En
ergy
con
tent
of
eth
anol
islo
wer
than
that
of
gaso
line
(~3
5%
less
),li
mit
ing
veh
icle
ran
ge
E8
5b
io-e
than
olcu
rren
tly
10
-25
%m
ore
exp
ensi
veth
ang
aso
line
[11
1].
Bio
fuel
sca
nbe
pro
du
ced
fro
mp
lan
tsw
hic
hab
sorb
CO
2as
they
gro
w,
off
sett
ing
the
CO
2
ou
tput
fro
mco
mb
ust
ion
ofth
efu
els.
R
edu
ced
dep
end
ence
on
pet
role
um
fuel
sis
ben
efic
ial
and
fuel
sar
ere
new
able
L
ow
ero
vera
llC
O2
ou
tpu
tco
mp
ared
wit
hco
nte
mp
orar
yfo
ssil
fuel
s
Bio
fuel
s
L
ow
ener
gyd
ensi
tyo
fh
ydro
gen
S
tora
gere
quir
emen
ts(h
igh
pre
ssu
reta
nks
)
Lac
ko
fre
-fu
elli
ng
infr
astr
uct
ure
(~2
0h
ydro
gen
fuel
lin
gst
atio
nsin
US
A[1
11]
)
Lo
wer
driv
ing
ran
geth
anga
soli
ne
ord
iese
lfu
elle
dv
ehic
les.
Fu
elce
llst
acks
gen
erat
eel
ectr
icit
yfr
om
elec
trol
ytic
reac
tio
nw
ith
hyd
roge
nan
do
xyg
ento
driv
ean
elec
tric
mo
tor
whi
chre
plac
esI.
C.
engi
ne
H
igh
eref
fici
ency
(~50
%)
com
par
edto
inte
rnal
com
bu
stio
nen
gin
es(~
30%
)[1
10]
.
CO
2an
dH
2O
on
lyex
hau
stp
rod
ucts
Fu
elC
ell
Veh
icle
s(F
CV
)
K
no
ckin
g
En
gin
eli
fesp
an(h
igh
erB
ME
Ps,
cyli
nd
erw
ear,
mec
han
ical
and
ther
mal
resi
stan
ceof
com
po
nen
ts)
R
esp
ons
eti
me
ofas
sist
edas
pira
tion
Tur
bo
char
gin
gsm
all
engi
nes
toyi
eld
hig
hsp
ecif
icp
ow
ero
utp
ut
atre
duce
dw
eig
ht.
Imp
rov
edef
fici
enci
esaf
ford
edb
y:
Lo
wer
fric
tio
nal
loss
es(s
mal
ler
mo
vin
gp
arts
)
Red
uce
dp
um
pin
glo
sses
(sm
alle
rsw
ept
volu
me)
L
ow
erh
eat
reje
ctio
n(r
educ
edin
tern
alsu
rfac
ear
ea)
Red
uct
ions
infu
elco
nsu
mpt
ion
Do
wn
sizi
ng
Cu
rren
tis
sues
/ob
stac
les
Ho
wth
eyar
eac
hiev
edP
ote
ntia
lad
van
tage
sR
esea
rch
Table 1.2: Alternatives to Diesel Engines and Future Research Focus
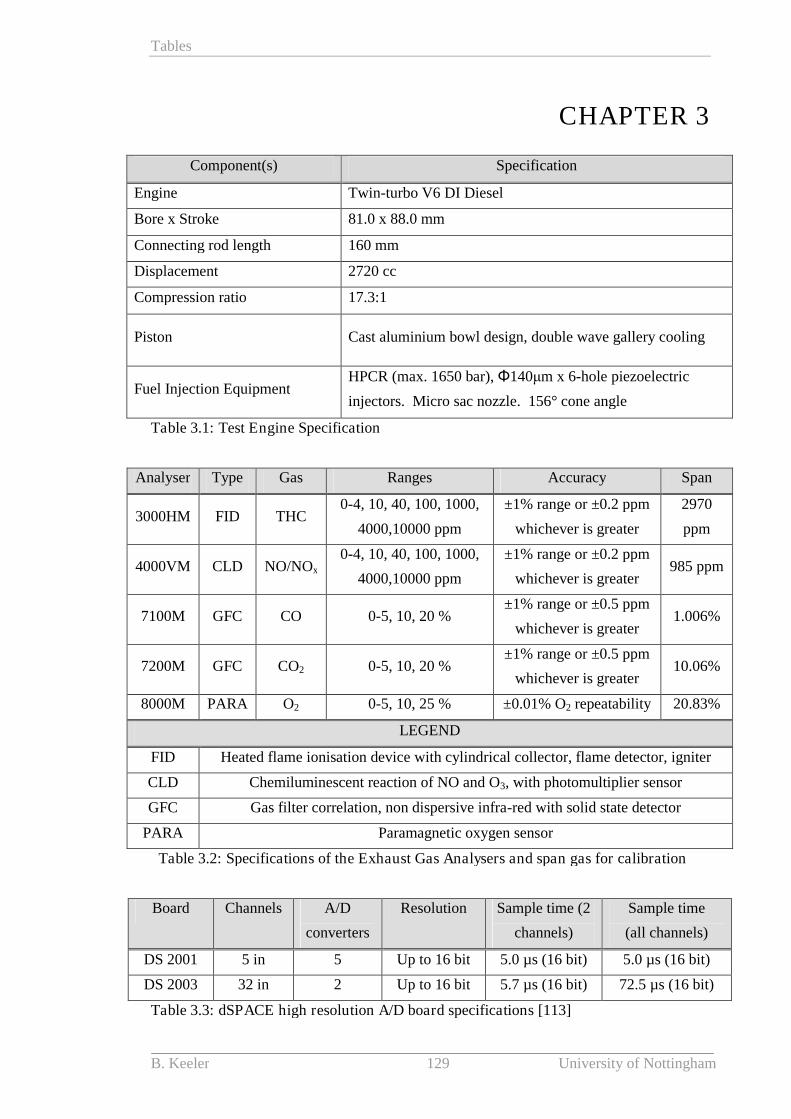
Tables
B. Keeler 129 University of Nottingham
CHAPTER 3
Component(s) Specification
Engine Twin-turbo V6 DI Diesel
Bore x Stroke 81.0 x 88.0 mm
Connecting rod length 160 mm
Displacement 2720 cc
Compression ratio 17.3:1
Piston Cast aluminium bowl design, double wave gallery cooling
Fuel Injection EquipmentHPCR (max. 1650 bar), Φ140μm x 6-hole piezoelectric
injectors. Micro sac nozzle. 156° cone angle
Table 3.1: Test Engine Specification
Analyser Type Gas Ranges Accuracy Span
3000HM FID THC0-4, 10, 40, 100, 1000,
4000,10000 ppm
±1% range or ±0.2 ppm
whichever is greater
2970
ppm
4000VM CLD NO/NOx
0-4, 10, 40, 100, 1000,
4000,10000 ppm
±1% range or ±0.2 ppm
whichever is greater985 ppm
7100M GFC CO 0-5, 10, 20 %±1% range or ±0.5 ppm
whichever is greater1.006%
7200M GFC CO2 0-5, 10, 20 %±1% range or ±0.5 ppm
whichever is greater10.06%
8000M PARA O2 0-5, 10, 25 % ±0.01% O2 repeatability 20.83%
LEGEND
FID Heated flame ionisation device with cylindrical collector, flame detector, igniter
CLD Chemiluminescent reaction of NO and O3, with photomultiplier sensor
GFC Gas filter correlation, non dispersive infra-red with solid state detector
PARA Paramagnetic oxygen sensor
Table 3.2: Specifications of the Exhaust Gas Analysers and span gas for calibration
Board Channels A/D
converters
Resolution Sample time (2
channels)
Sample time
(all channels)
DS 2001 5 in 5 Up to 16 bit 5.0 µs (16 bit) 5.0 µs (16 bit)
DS 2003 32 in 2 Up to 16 bit 5.7 µs (16 bit) 72.5 µs (16 bit)
Table 3.3: dSPACE high resolution A/D board specifications [113]

Tables
B. Keeler 130 University of Nottingham
CHAPTER 4
Convert Emissions to
Molar fraction%, ppm
( ix )
Gravimetricfraction
kg/kg-exh
( ix )
Massflow rate
kg/hr
( im )
Brakespecifickg/kWh
( iBS )
EmissionsIndex
kg/kg-fuel
( iEI )
Molarfraction%, ppm
( ix )
1 i
exh
m
m
i exh
exh
m m
m
i exh
exh b
m m
m P
i exh
exh f
m m
m m
Gravimetricfraction
kg/kg-exh
( ix )
exh
i
m
m
1 exhm exh
b
m
P
exh
f
m
m
Massflow rate
kg/hr
( im )
exh
exh i
m
m m
1
exhm
11
bP
1
fm
Brakespecifickg/kWh
( iBS )
b exh
exh i
P m
m m
b
exh
P
m
bP 1 b
f
P
m
Co
nv
ert
Em
issi
ons
from
EmissionIndex
kg/kg-fuel
( iEI )
f exh
exh i
m m
m m
f
exh
m
m
fm f
b
m
P
1
Table 4.1: Conversion table for emissions species
Unit
ix ix im ibs iEI
HC 227 ppm 329 mg/kg exh 7.2 mg/s 2.5 g/kWh 8.1 g/kg fuel
Sp
ecie
s,i
CO 0.21% 1.5 g/kg exh 33 mg/s 11.3 g/kWh 37 g/kg fuel
Table 4.2: Example unit conversion values from a typical operating point
Process
1-2 Polytropic compression from intake conditions
2-3 Constant volume combustion processes
3-4 Polytropic expansion from EOC conditions
4-1 Isochoric exhaust
Table 4.3: Summary of processes modelled in calculation of bulk-gas temperature

Tables
B. Keeler 131 University of Nottingham
Value
a1 -9.1063
a2 246.97
a3 -143.74
a4 32.329
a5 0.0518
Table 4.4: Coefficients for calculation of molar heat capacity of diesel fuel
CHAPTER 5
Study Ref Fuel Equipment A n /AE R
Wolfer [91] CN>50 Constant-volume bomb 0.44 1.19 8360
Watson [83] Diesel Diesel engine 3.45 1.02 2100
Spadaccini [114]No. 2
DieselSteady flow reactor 4.0E-10 1 20080
Pischinger [115] CN=50 Steady flow reactor 0.0081 1.14 7813
Assanis [92]No. 2D
CN=40Diesel engine 2.4 1.02 2100
Kook [13] CN=47.1 Diesel engine 12.254 1 3242
Table 5.1: Summary of empirical constants employed in ignition delay correlations with
diesel fuels
Constant A n f /AE R Equation R2
n=1.00, f=1.00 115 1.00 1.00 1692 y=0.990x 0.936
/AE R =2100 85 0.95 0.70 2100 y=0.996x 0.895
n=1.02 240 1.02 0.85 1450 y=1.007x 0.948
Unconstrained 484 1.10 0.85 1400 y=1.002x 0.957
Table 5.2: Results of least-squares regression on equation constants for Ignition delay
correlation
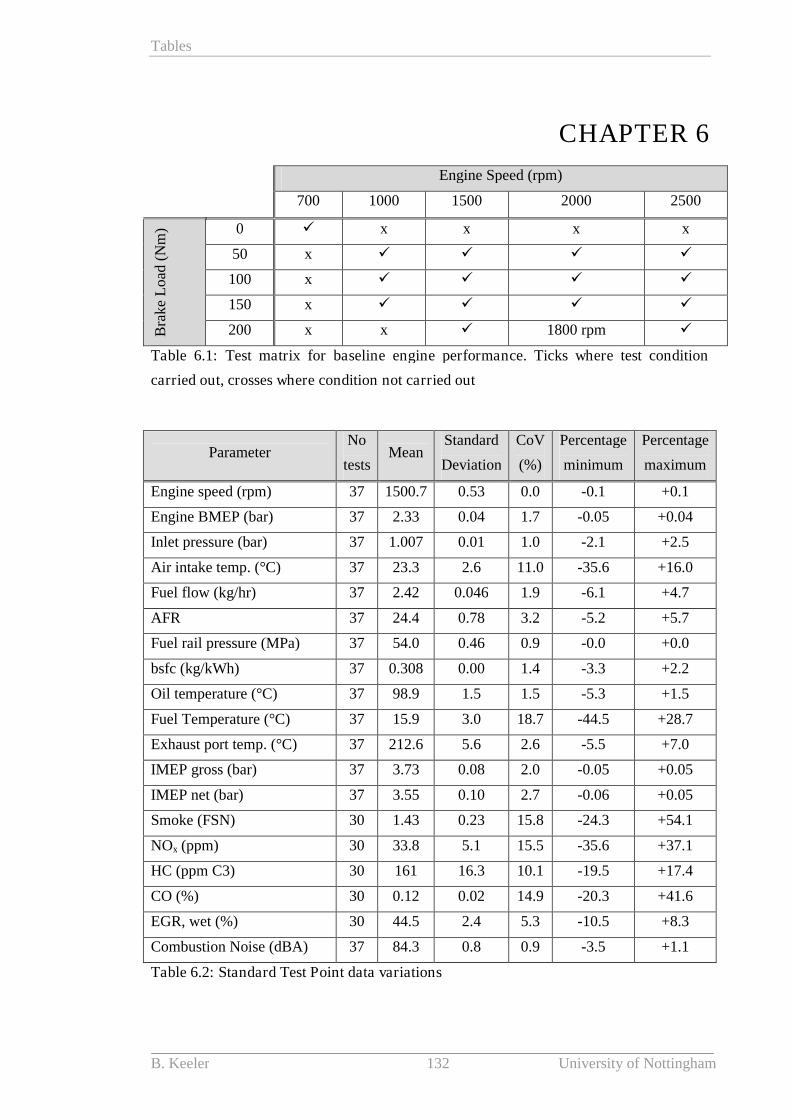
Tables
B. Keeler 132 University of Nottingham
CHAPTER 6
Engine Speed (rpm)
700 1000 1500 2000 2500
0 x x x x
50 x
100 x
150 x
Bra
ke
Lo
ad(N
m)
200 x x 1800 rpm
Table 6.1: Test matrix for baseline engine performance. Ticks where test condition
carried out, crosses where condition not carried out
ParameterNo
testsMean
Standard
Deviation
CoV
(%)
Percentage
minimum
Percentage
maximum
Engine speed (rpm) 37 1500.7 0.53 0.0 -0.1 +0.1
Engine BMEP (bar) 37 2.33 0.04 1.7 -0.05 +0.04
Inlet pressure (bar) 37 1.007 0.01 1.0 -2.1 +2.5
Air intake temp. (°C) 37 23.3 2.6 11.0 -35.6 +16.0
Fuel flow (kg/hr) 37 2.42 0.046 1.9 -6.1 +4.7
AFR 37 24.4 0.78 3.2 -5.2 +5.7
Fuel rail pressure (MPa) 37 54.0 0.46 0.9 -0.0 +0.0
bsfc (kg/kWh) 37 0.308 0.00 1.4 -3.3 +2.2
Oil temperature (°C) 37 98.9 1.5 1.5 -5.3 +1.5
Fuel Temperature (°C) 37 15.9 3.0 18.7 -44.5 +28.7
Exhaust port temp. (°C) 37 212.6 5.6 2.6 -5.5 +7.0
IMEP gross (bar) 37 3.73 0.08 2.0 -0.05 +0.05
IMEP net (bar) 37 3.55 0.10 2.7 -0.06 +0.05
Smoke (FSN) 30 1.43 0.23 15.8 -24.3 +54.1
NOx (ppm) 30 33.8 5.1 15.5 -35.6 +37.1
HC (ppm C3) 30 161 16.3 10.1 -19.5 +17.4
CO (%) 30 0.12 0.02 14.9 -20.3 +41.6
EGR, wet (%) 30 44.5 2.4 5.3 -10.5 +8.3
Combustion Noise (dBA) 37 84.3 0.8 0.9 -3.5 +1.1
Table 6.2: Standard Test Point data variations
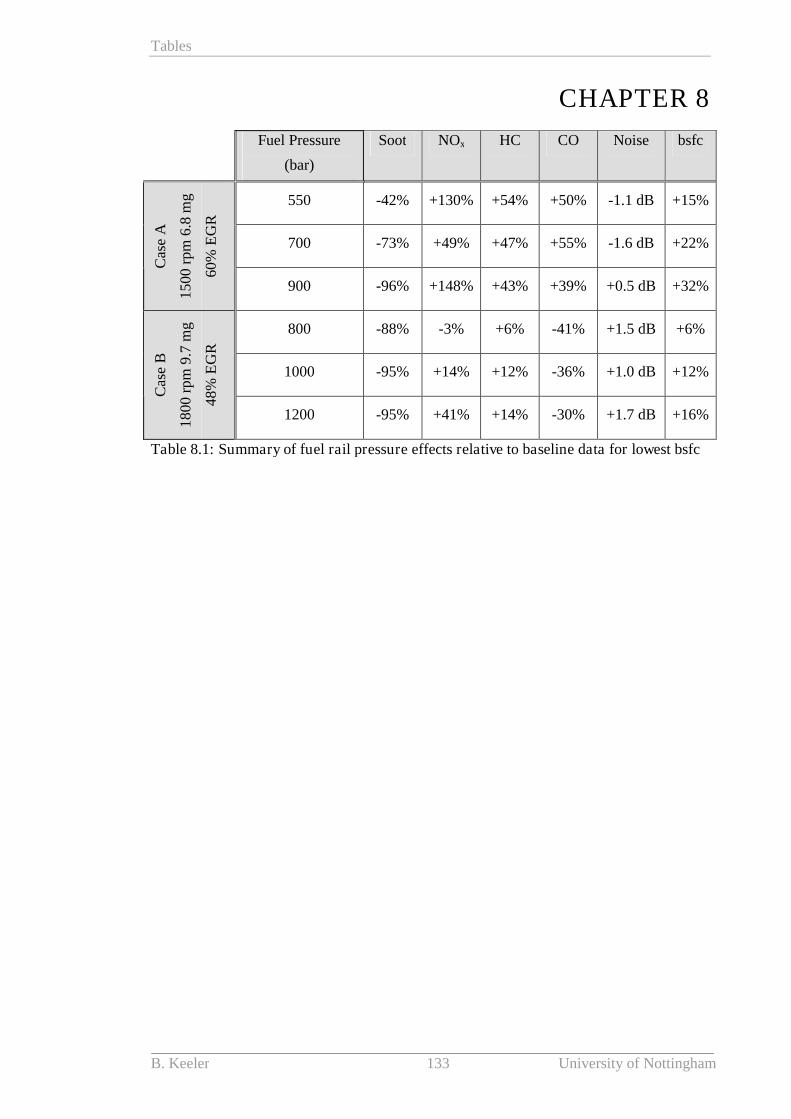
Tables
B. Keeler 133 University of Nottingham
CHAPTER 8
Fuel Pressure
(bar)
Soot NOx HC CO Noise bsfc
550 -42% +130% +54% +50% -1.1 dB +15%
700 -73% +49% +47% +55% -1.6 dB +22%
Cas
eA
15
00
rpm
6.8
mg
60
%E
GR
900 -96% +148% +43% +39% +0.5 dB +32%
800 -88% -3% +6% -41% +1.5 dB +6%
1000 -95% +14% +12% -36% +1.0 dB +12%
Cas
eB
18
00
rpm
9.7
mg
48
%E
GR
1200 -95% +41% +14% -30% +1.7 dB +16%
Table 8.1: Summary of fuel rail pressure effects relative to baseline data for lowest bsfc
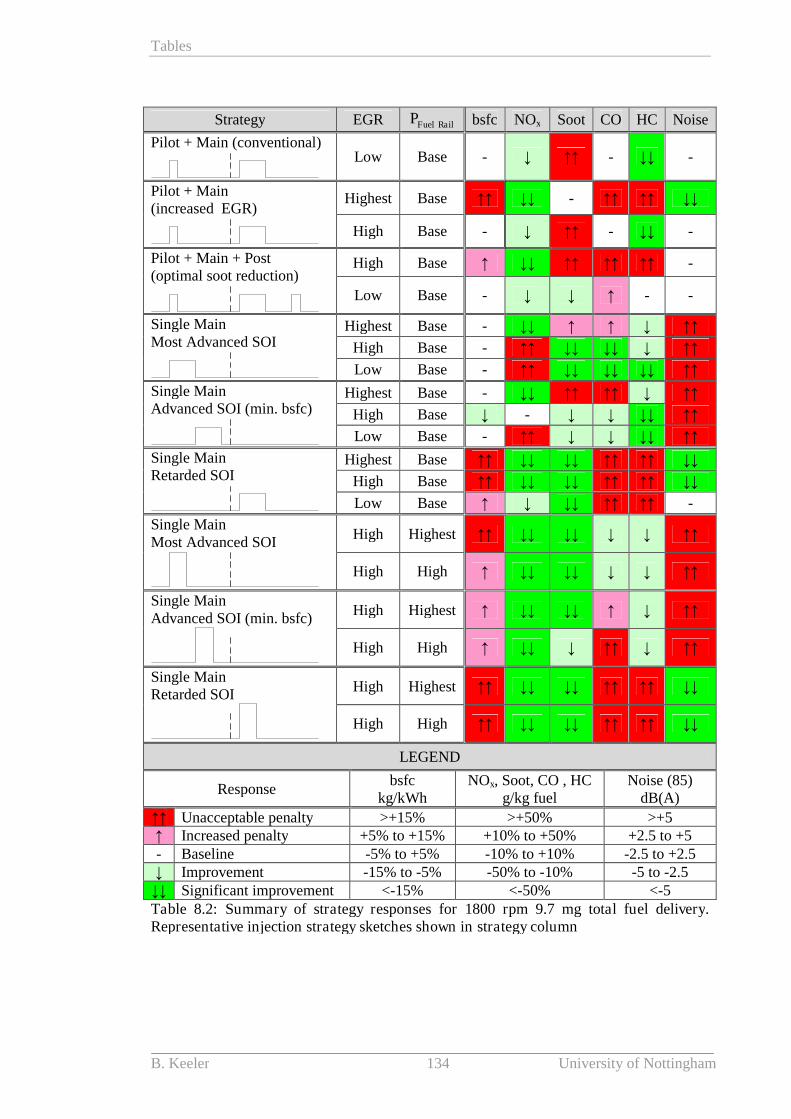
Tables
B. Keeler 134 University of Nottingham
Strategy EGR Fuel RailP bsfc NOx Soot CO HC Noise
Pilot + Main (conventional)Low Base - ↓ ↑↑ - ↓↓ -
Highest Base ↑↑ ↓↓ - ↑↑ ↑↑ ↓↓Pilot + Main(increased EGR)
High Base - ↓ ↑↑ - ↓↓ -
High Base ↑ ↓↓ ↑↑ ↑↑ ↑↑ -Pilot + Main + Post(optimal soot reduction)
Low Base - ↓ ↓ ↑ - -
Highest Base - ↓↓ ↑ ↑ ↓ ↑↑
High Base - ↑↑ ↓↓ ↓↓ ↓ ↑↑
Single MainMost Advanced SOI
Low Base - ↑↑ ↓↓ ↓↓ ↓↓ ↑↑
Highest Base - ↓↓ ↑↑ ↑↑ ↓ ↑↑
High Base ↓ - ↓ ↓ ↓↓ ↑↑
Single MainAdvanced SOI (min. bsfc)
Low Base - ↑↑ ↓ ↓ ↓↓ ↑↑
Highest Base ↑↑ ↓↓ ↓↓ ↑↑ ↑↑ ↓↓
High Base ↑↑ ↓↓ ↓↓ ↑↑ ↑↑ ↓↓
Single MainRetarded SOI
Low Base ↑ ↓ ↓↓ ↑↑ ↑↑ -
High Highest ↑↑ ↓↓ ↓↓ ↓ ↓ ↑↑Single MainMost Advanced SOI
High High ↑ ↓↓ ↓↓ ↓ ↓ ↑↑
High Highest ↑ ↓↓ ↓↓ ↑ ↓ ↑↑Single MainAdvanced SOI (min. bsfc)
High High ↑ ↓↓ ↓ ↑↑ ↓ ↑↑
High Highest ↑↑ ↓↓ ↓↓ ↑↑ ↑↑ ↓↓Single MainRetarded SOI
High High ↑↑ ↓↓ ↓↓ ↑↑ ↑↑ ↓↓
LEGEND
Responsebsfc
kg/kWhNOx, Soot, CO , HC
g/kg fuelNoise (85)
dB(A)
↑↑ Unacceptable penalty >+15% >+50% >+5↑ Increased penalty +5% to +15% +10% to +50% +2.5 to +5- Baseline -5% to +5% -10% to +10% -2.5 to +2.5↓ Improvement -15% to -5% -50% to -10% -5 to -2.5
↓↓ Significant improvement <-15% <-50% <-5Table 8.2: Summary of strategy responses for 1800 rpm 9.7 mg total fuel delivery.Representative injection strategy sketches shown in strategy column
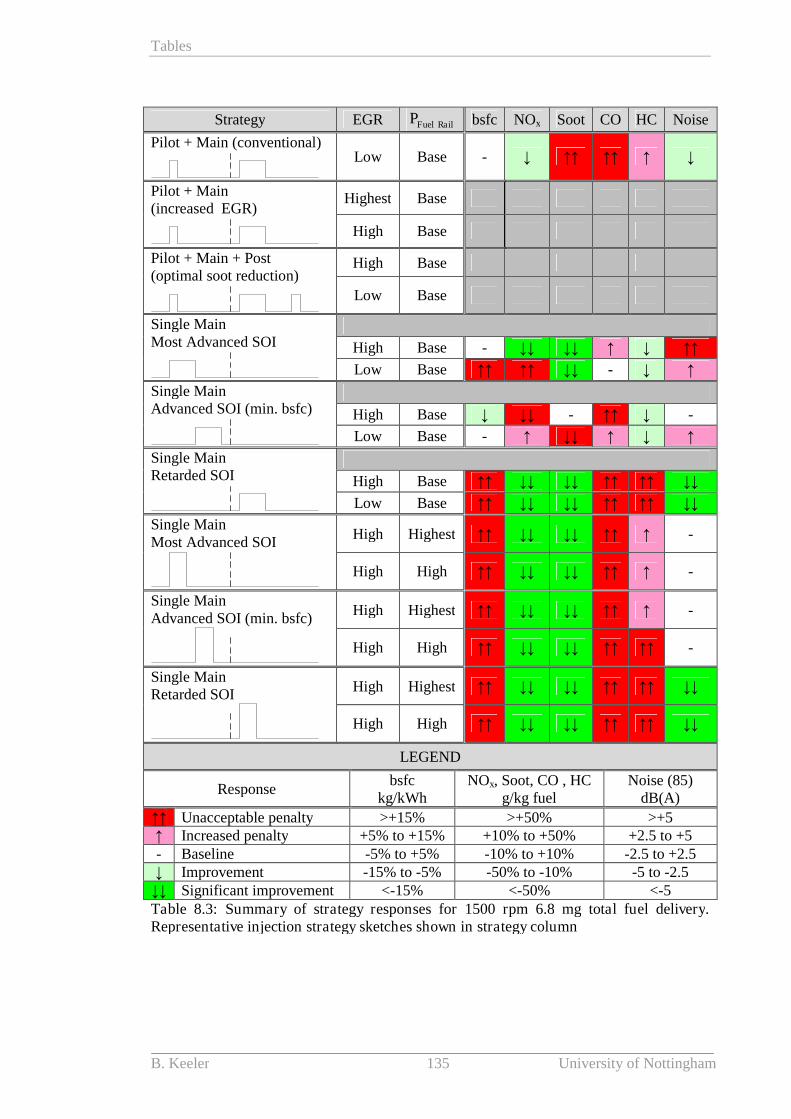
Tables
B. Keeler 135 University of Nottingham
Strategy EGR Fuel RailP bsfc NOx Soot CO HC Noise
Pilot + Main (conventional)Low Base - ↓ ↑↑ ↑↑ ↑ ↓
Highest BasePilot + Main(increased EGR)
High Base
High BasePilot + Main + Post(optimal soot reduction)
Low Base
High Base - ↓↓ ↓↓ ↑ ↓ ↑↑
Single MainMost Advanced SOI
Low Base ↑↑ ↑↑ ↓↓ - ↓ ↑
High Base ↓ ↓↓ - ↑↑ ↓ -
Single MainAdvanced SOI (min. bsfc)
Low Base - ↑ ↓↓ ↑ ↓ ↑
High Base ↑↑ ↓↓ ↓↓ ↑↑ ↑↑ ↓↓
Single MainRetarded SOI
Low Base ↑↑ ↓↓ ↓↓ ↑↑ ↑↑ ↓↓
High Highest ↑↑ ↓↓ ↓↓ ↑↑ ↑ -Single MainMost Advanced SOI
High High ↑↑ ↓↓ ↓↓ ↑↑ ↑ -
High Highest ↑↑ ↓↓ ↓↓ ↑↑ ↑ -Single MainAdvanced SOI (min. bsfc)
High High ↑↑ ↓↓ ↓↓ ↑↑ ↑↑ -
High Highest ↑↑ ↓↓ ↓↓ ↑↑ ↑↑ ↓↓Single MainRetarded SOI
High High ↑↑ ↓↓ ↓↓ ↑↑ ↑↑ ↓↓
LEGEND
Responsebsfc
kg/kWhNOx, Soot, CO , HC
g/kg fuelNoise (85)
dB(A)
↑↑ Unacceptable penalty >+15% >+50% >+5↑ Increased penalty +5% to +15% +10% to +50% +2.5 to +5- Baseline -5% to +5% -10% to +10% -2.5 to +2.5↓ Improvement -15% to -5% -50% to -10% -5 to -2.5
↓↓ Significant improvement <-15% <-50% <-5Table 8.3: Summary of strategy responses for 1500 rpm 6.8 mg total fuel delivery.Representative injection strategy sketches shown in strategy column
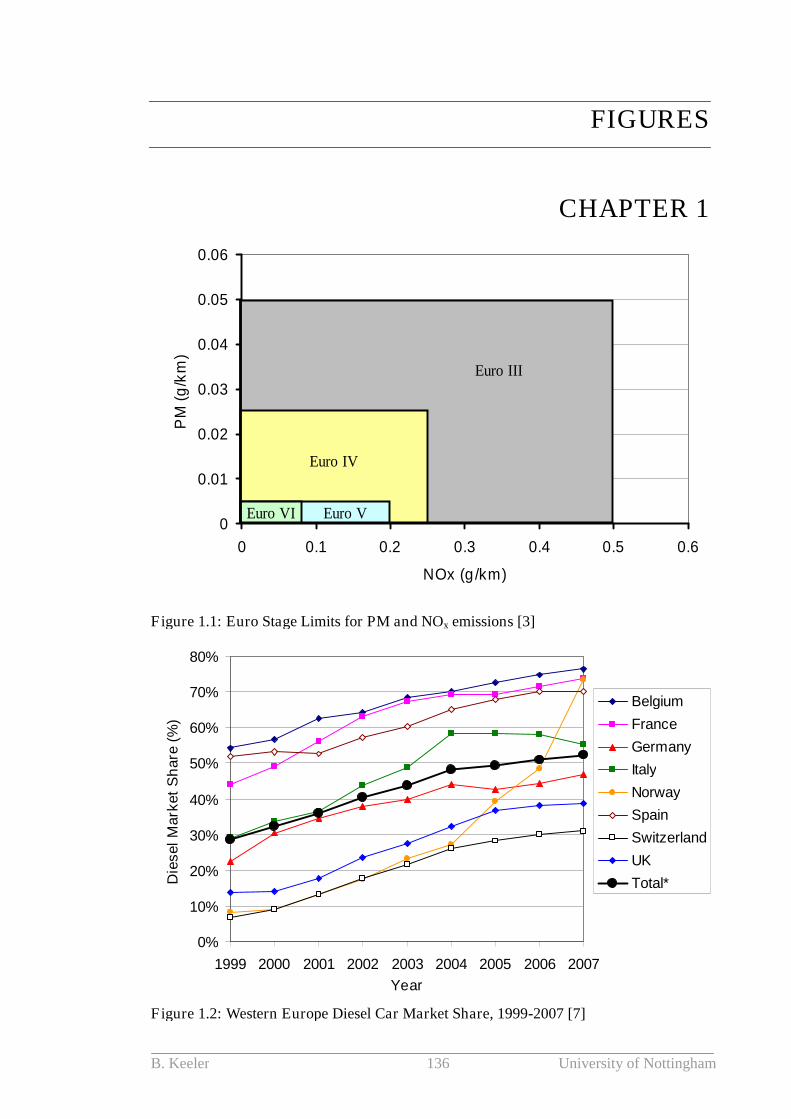
B. Keeler 136 University of Nottingham
FIGURES
CHAPTER 1
0
0.01
0.02
0.03
0.04
0.05
0.06
0 0.1 0.2 0.3 0.4 0.5 0.6
NOx (g/km)
PM
(g/k
m)
Euro III
Euro IV
Euro VEuro VI
Figure 1.1: Euro Stage Limits for PM and NOx emissions [3]
0%
10%
20%
30%
40%
50%
60%
70%
80%
1999 2000 2001 2002 2003 2004 2005 2006 2007
Year
Die
selM
ark
et
Sh
are
(%)
Belgium
France
Germany
Italy
Norway
Spain
Switzerland
UK
Total*
Figure 1.2: Western Europe Diesel Car Market Share, 1999-2007 [7]
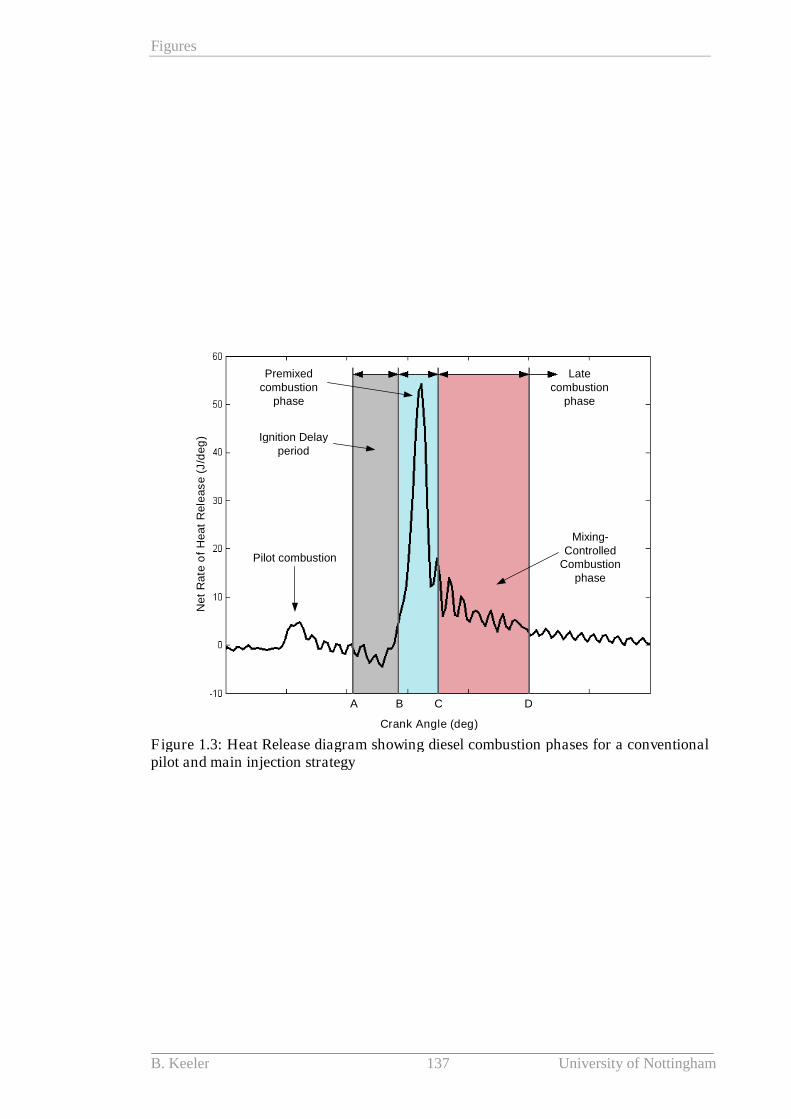
Figures
B. Keeler 137 University of Nottingham
Crank Angle (deg)
Ne
tR
ate
of
He
at
Re
lea
se
(J/d
eg
)
BA C D
Mixing-Controlled
Combustionphase
Ignition Delayperiod
Premixedcombustion
phase
Latecombustion
phase
Pilot combustion
Figure 1.3: Heat Release diagram showing diesel combustion phases for a conventionalpilot and main injection strategy
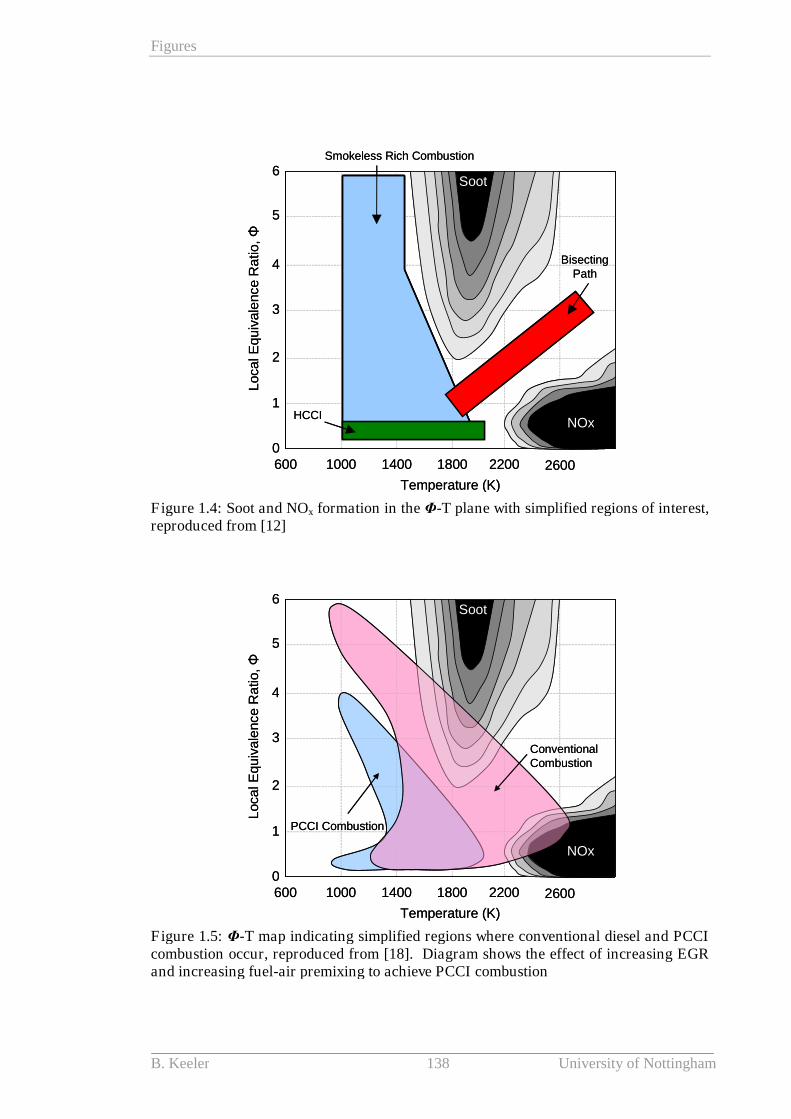
Figures
B. Keeler 138 University of Nottingham
600 1400 1800 2200 260010000
1
2
3
4
5
6
Temperature (K)
Loca
lE
qu
ivale
nce
Ra
tio,Φ
NOx
Soot
BisectingPath
HCCI
Smokeless Rich Combustion
600 1400 1800 2200 260010000
1
2
3
4
5
6
Temperature (K)
Loca
lE
qu
ivale
nce
Ra
tio,Φ
NOx
Soot
BisectingPath
HCCI
Smokeless Rich Combustion
Figure 1.4: Soot and NOx formation in the Φ-T plane with simplified regions of interest,reproduced from [12]
600 1400 1800 2200 260010000
1
2
3
4
5
6
Temperature (K)
Loca
lE
qu
ivale
nce
Ra
tio,Φ
NOx
Soot
ConventionalCombustion
PCCI Combustion
600 1400 1800 2200 260010000
1
2
3
4
5
6
Temperature (K)
Loca
lE
qu
ivale
nce
Ra
tio,Φ
NOx
Soot
ConventionalCombustion
PCCI Combustion
Figure 1.5: Φ-T map indicating simplified regions where conventional diesel and PCCIcombustion occur, reproduced from [18]. Diagram shows the effect of increasing EGRand increasing fuel-air premixing to achieve PCCI combustion
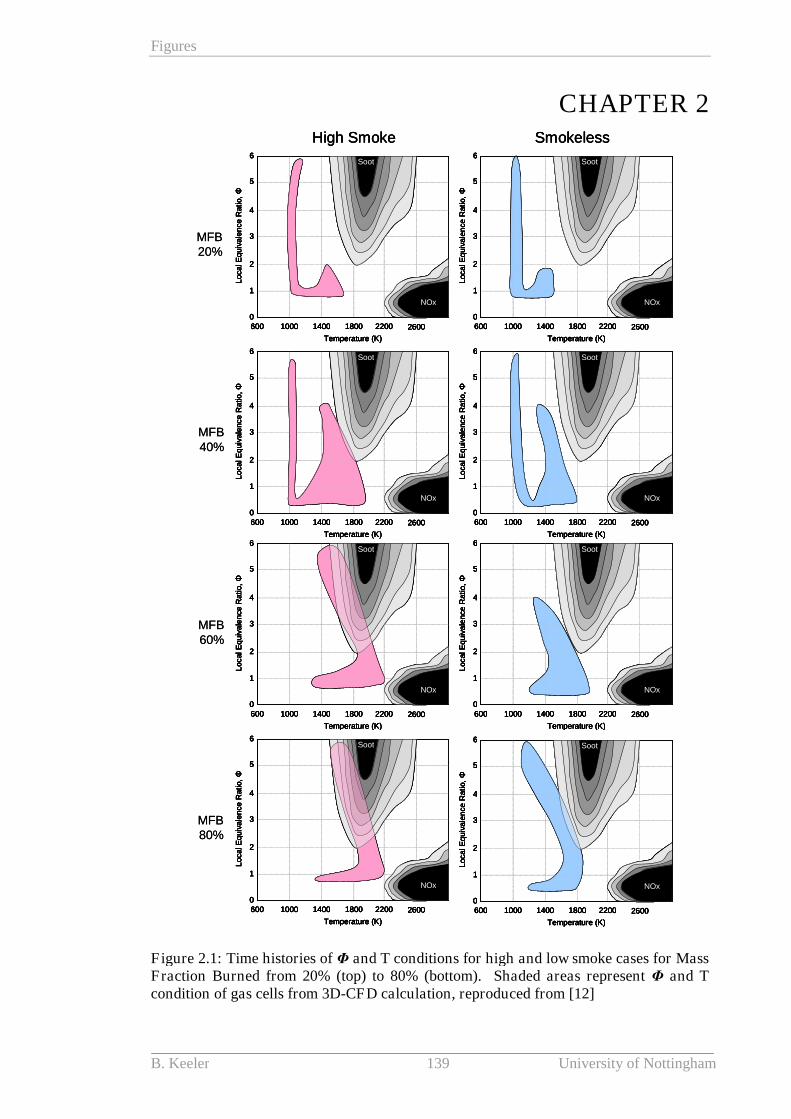
Figures
B. Keeler 139 University of Nottingham
CHAPTER 2
600 1400 1800 2200 260010000
1
2
3
4
5
6
Temperature (K)
LocalE
qu
iva
len
ce
Ratio,Φ
NOx
Soot
600 1400 1800 2200 260010000
1
2
3
4
5
6
Temperature (K)
LocalE
qu
iva
len
ce
Ratio,Φ
NOx
Soot
600 1400 1800 2200 260010000
1
2
3
4
5
6
Temperature (K)
LocalE
qu
iva
len
ce
Ratio,Φ
NOx
Soot
600 1400 1800 2200 260010000
1
2
3
4
5
6
Temperature (K)
Lo
ca
lEq
uiv
ale
nce
Ra
tio
,Φ
NOx
Soot
600 1400 1800 2200 260010000
1
2
3
4
5
6
Temperature (K)
LocalE
qu
iva
len
ce
Ratio,Φ
NOx
Soot
600 1400 1800 2200 260010000
1
2
3
4
5
6
Temperature (K)
LocalE
qu
iva
len
ce
Ratio,Φ
NOx
Soot
600 1400 1800 2200 260010000
1
2
3
4
5
6
Temperature (K)
Lo
ca
lEq
uiv
ale
nce
Ra
tio
,Φ
NOx
Soot
600 1400 1800 2200 260010000
1
2
3
4
5
6
Temperature (K)
LocalE
qu
iva
len
ce
Ratio,Φ
NOx
Soot
High Smoke Smokeless
MFB20%
MFB60%
MFB80%
MFB40%
600 1400 1800 2200 260010000
1
2
3
4
5
6
Temperature (K)
LocalE
qu
iva
len
ce
Ratio,Φ
NOx
Soot
600 1400 1800 2200 260010000
1
2
3
4
5
6
Temperature (K)
LocalE
qu
iva
len
ce
Ratio,Φ
NOx
Soot
600 1400 1800 2200 260010000
1
2
3
4
5
6
Temperature (K)
LocalE
qu
iva
len
ce
Ratio,Φ
NOx
Soot
600 1400 1800 2200 260010000
1
2
3
4
5
6
Temperature (K)
Lo
ca
lEq
uiv
ale
nce
Ra
tio
,Φ
NOx
Soot
600 1400 1800 2200 260010000
1
2
3
4
5
6
Temperature (K)
LocalE
qu
iva
len
ce
Ratio,Φ
NOx
Soot
600 1400 1800 2200 260010000
1
2
3
4
5
6
Temperature (K)
LocalE
qu
iva
len
ce
Ratio,Φ
NOx
Soot
600 1400 1800 2200 260010000
1
2
3
4
5
6
Temperature (K)
Lo
ca
lEq
uiv
ale
nce
Ra
tio
,Φ
NOx
Soot
600 1400 1800 2200 260010000
1
2
3
4
5
6
Temperature (K)
LocalE
qu
iva
len
ce
Ratio,Φ
NOx
Soot
High Smoke Smokeless
600 1400 1800 2200 260010000
1
2
3
4
5
6
Temperature (K)
LocalE
qu
iva
len
ce
Ratio,Φ
NOx
Soot
600 1400 1800 2200 260010000
1
2
3
4
5
6
Temperature (K)
LocalE
qu
iva
len
ce
Ratio,Φ
NOx
Soot
600 1400 1800 2200 260010000
1
2
3
4
5
6
Temperature (K)
LocalE
qu
iva
len
ce
Ratio,Φ
NOx
Soot
600 1400 1800 2200 260010000
1
2
3
4
5
6
Temperature (K)
Lo
ca
lEq
uiv
ale
nce
Ra
tio
,Φ
NOx
Soot
600 1400 1800 2200 260010000
1
2
3
4
5
6
Temperature (K)
LocalE
qu
iva
len
ce
Ratio,Φ
NOx
Soot
600 1400 1800 2200 260010000
1
2
3
4
5
6
Temperature (K)
LocalE
qu
iva
len
ce
Ratio,Φ
NOx
Soot
600 1400 1800 2200 260010000
1
2
3
4
5
6
Temperature (K)
Lo
ca
lEq
uiv
ale
nce
Ra
tio
,Φ
NOx
Soot
600 1400 1800 2200 260010000
1
2
3
4
5
6
Temperature (K)
LocalE
qu
iva
len
ce
Ratio,Φ
NOx
Soot
600 1400 1800 2200 260010000
1
2
3
4
5
6
Temperature (K)
LocalE
qu
iva
len
ce
Ratio,Φ
NOx
Soot
600 1400 1800 2200 260010000
1
2
3
4
5
6
Temperature (K)
LocalE
qu
iva
len
ce
Ratio,Φ
NOx
Soot
600 1400 1800 2200 260010000
1
2
3
4
5
6
Temperature (K)
LocalE
qu
iva
len
ce
Ratio,Φ
NOx
Soot
600 1400 1800 2200 260010000
1
2
3
4
5
6
Temperature (K)
Lo
ca
lEq
uiv
ale
nce
Ra
tio
,Φ
NOx
Soot
600 1400 1800 2200 260010000
1
2
3
4
5
6
Temperature (K)
LocalE
qu
iva
len
ce
Ratio,Φ
NOx
Soot
600 1400 1800 2200 260010000
1
2
3
4
5
6
Temperature (K)
LocalE
qu
iva
len
ce
Ratio,Φ
NOx
Soot
600 1400 1800 2200 260010000
1
2
3
4
5
6
Temperature (K)
LocalE
qu
iva
len
ce
Ratio,Φ
NOx
Soot
600 1400 1800 2200 260010000
1
2
3
4
5
6
Temperature (K)
Lo
ca
lEq
uiv
ale
nce
Ra
tio
,Φ
NOx
Soot
600 1400 1800 2200 260010000
1
2
3
4
5
6
Temperature (K)
LocalE
qu
iva
len
ce
Ratio,Φ
NOx
Soot
600 1400 1800 2200 260010000
1
2
3
4
5
6
Temperature (K)
LocalE
qu
iva
len
ce
Ratio,Φ
NOx
Soot
600 1400 1800 2200 260010000
1
2
3
4
5
6
Temperature (K)
Lo
ca
lEq
uiv
ale
nce
Ra
tio
,Φ
NOx
Soot
600 1400 1800 2200 260010000
1
2
3
4
5
6
Temperature (K)
LocalE
qu
iva
len
ce
Ratio,Φ
NOx
Soot
600 1400 1800 2200 260010000
1
2
3
4
5
6
Temperature (K)
LocalE
qu
iva
len
ce
Ratio,Φ
NOx
Soot
600 1400 1800 2200 260010000
1
2
3
4
5
6
Temperature (K)
LocalE
qu
iva
len
ce
Ratio,Φ
NOx
Soot
600 1400 1800 2200 260010000
1
2
3
4
5
6
Temperature (K)
Lo
ca
lEq
uiv
ale
nce
Ra
tio
,Φ
NOx
Soot
600 1400 1800 2200 260010000
1
2
3
4
5
6
Temperature (K)
LocalE
qu
iva
len
ce
Ratio,Φ
NOx
Soot
High Smoke Smokeless
MFB20%
MFB60%
MFB80%
MFB40%
Figure 2.1: Time histories of Φ and T conditions for high and low smoke cases for MassFraction Burned from 20% (top) to 80% (bottom). Shaded areas represent Φ and Tcondition of gas cells from 3D-CFD calculation, reproduced from [12]
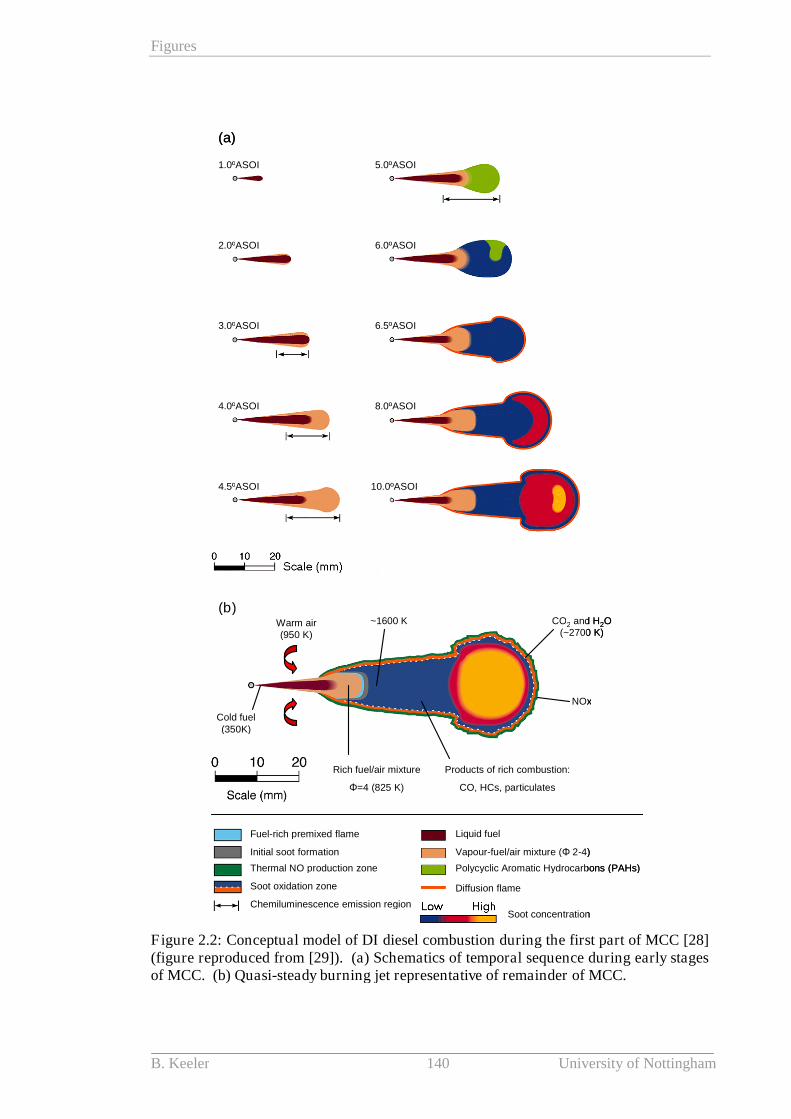
Figures
B. Keeler 140 University of Nottingham
(a)
Fuel-rich premixed flame
Initial soot formation
Thermal NO production zone
Soot oxidation zone
Chemiluminescence emission region
Liquid fuel
Vapour-fuel/air mixture (Φ 2-4)
Polycyclic Aromatic Hydrocarbons (PAHs)
Diffusion flame
4.5ºASOI
4.0ºASOI
3.0ºASOI
2.0ºASOI
1.0ºASOI
10.0ºASOI
8.0ºASOI
6.5ºASOI
6.0ºASOI
5.0ºASOI
(b)Warm air(950 K)
Cold fuel(350K)
CO2 and H2O(~2700 K)
Products of rich combustion:
CO, HCs, particulates
Rich fuel/air mixture
Φ=4 (825 K)
NOx
~1600 K
Soot concentration
Figure 2.2: Conceptual model of DI diesel combustion during the first part of MCC [28](figure reproduced from [29]). (a) Schematics of temporal sequence during early stagesof MCC. (b) Quasi-steady burning jet representative of remainder of MCC.
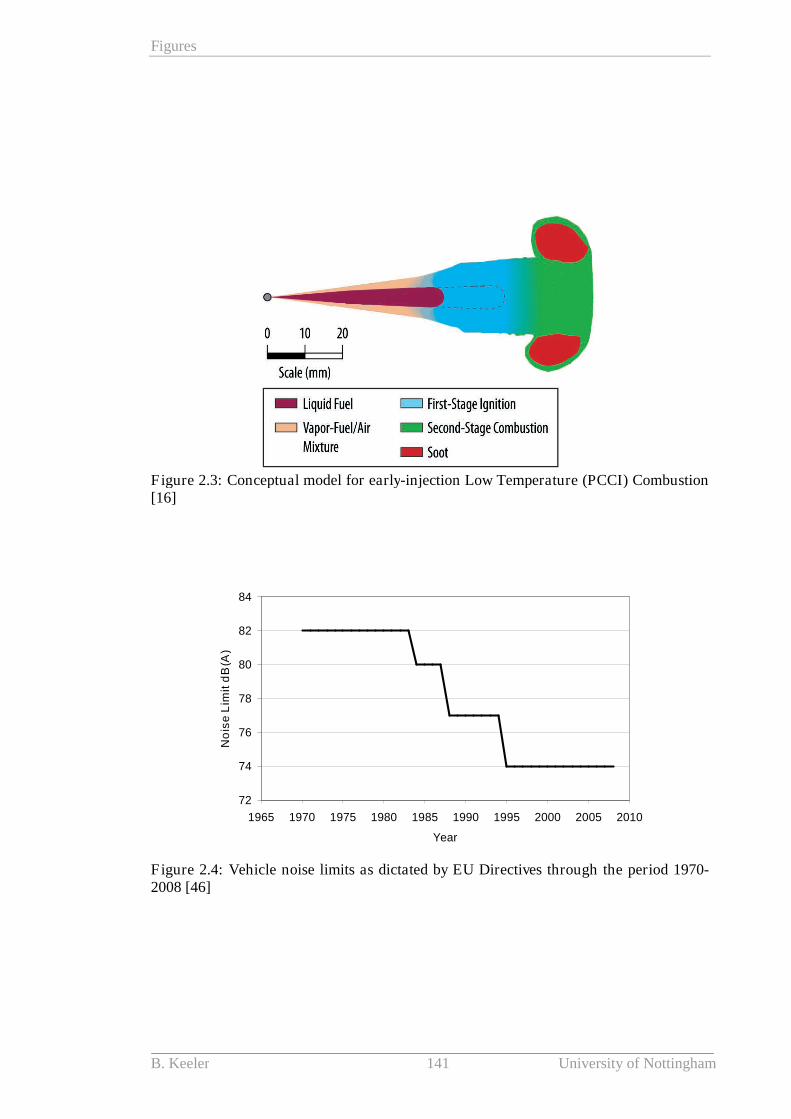
Figures
B. Keeler 141 University of Nottingham
Figure 2.3: Conceptual model for early-injection Low Temperature (PCCI) Combustion[16]
72
74
76
78
80
82
84
1965 1970 1975 1980 1985 1990 1995 2000 2005 2010
Year
No
ise
Lim
itd
B(A
)
Figure 2.4: Vehicle noise limits as dictated by EU Directives through the period 1970-2008 [46]

Figures
B. Keeler 142 University of Nottingham
AccessoryNoise
e.g. FanExhaustIntakePumps
MechanicalNoise
e.g.PistonsCrankshaftValve TrainAlternator
EngineNoise
Direct CombustionNoise
IndirectCombustion Noise
Gas forcestransmitted through
structure
Gas forces movecomponents
through tolerances
Flow of gasese.g. Throughturbocharger
system
Flow Noise
Combustion Noise
Figure 2.5: Sources of Engine Noise
Deflector blade
ActuatorAdjustable ring
Turbine
Low flowexhaustHigh flow
exhaust
Deflector blade
ActuatorAdjustable ring
Turbine
Low flowexhaustHigh flow
exhaust
Deflector blade
ActuatorAdjustable ring
Turbine
Low flowexhaustHigh flow
exhaust
Figure 2.6: Schematic of Variable Geometry Turbine Turbocharger operation. Left:Blades set for high turbocharger pressure. Right: Blades set for low turbochargerpressure. Reproduced from [6]
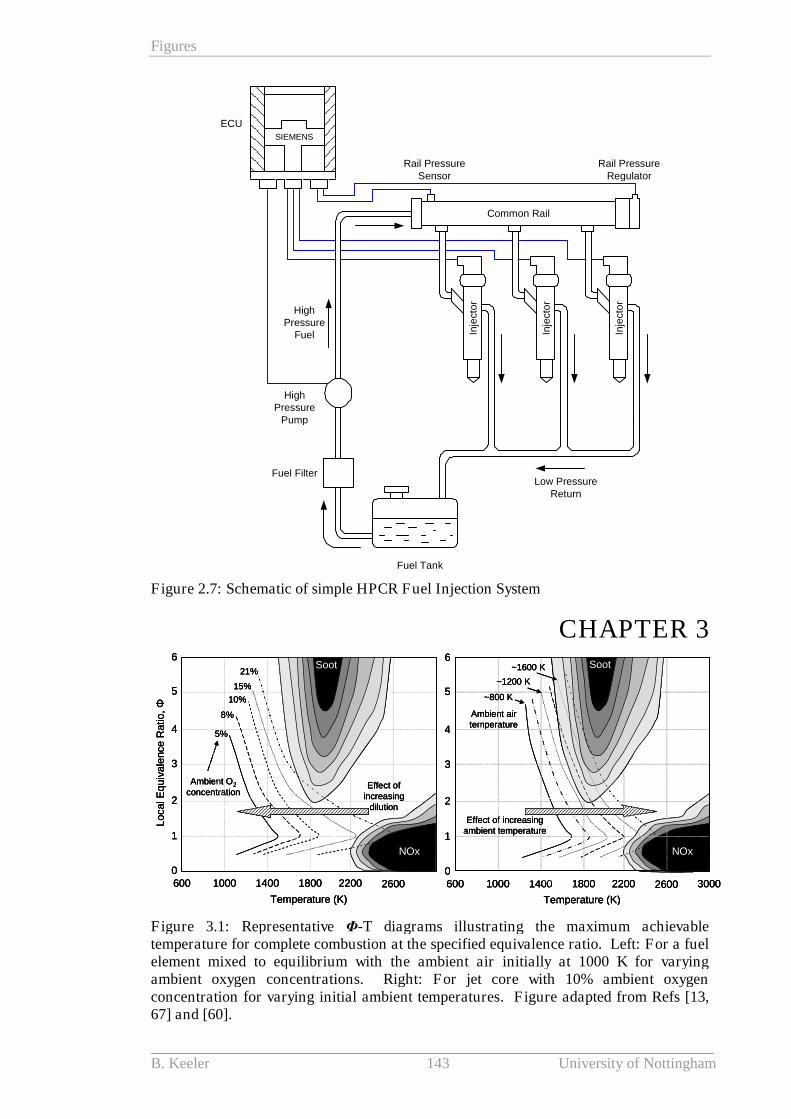
Figures
B. Keeler 143 University of Nottingham
ECU
Fuel Filter
Fuel Tank
HighPressure
Pump
Common Rail
Low PressureReturn
Rail PressureSensor
Rail PressureRegulator
HighPressure
Fuel Inje
cto
r
Inje
cto
r
Inje
cto
r
SIEMENS
Figure 2.7: Schematic of simple HPCR Fuel Injection System
CHAPTER 3
NOx
SootSoot
Effect of increasingambient temperature
~800 K
~1600 K
~1200 K
Ambient airtemperature
Temperature (K)
600 1400 1800 2200 2600 300010000
1
2
3
4
5
6
Temperature (K)
600 1400 1800 2200 260010000
1
2
3
4
5
6
LocalE
qu
iva
lence
Ra
tio
,Φ
NOx
Soot
10%
21%
15%
Ambient O2
concentration
8%
5%
Effect ofincreasing
dilution
NOx
SootSoot
Effect of increasingambient temperature
~800 K
~1600 K
~1200 K
Ambient airtemperature
Temperature (K)
600 1400 1800 2200 2600 300010000
1
2
3
4
5
6
NOx
SootSootSoot
Effect of increasingambient temperature
~800 K
~1600 K
~1200 K
Ambient airtemperature
Temperature (K)
600 1400 1800 2200 2600 300010000
1
2
3
4
5
6
Temperature (K)
600 1400 1800 2200 260010000
1
2
3
4
5
6
LocalE
qu
iva
lence
Ra
tio
,Φ
NOx
Soot
10%
21%
15%
Ambient O2
concentration
8%
5%
Effect ofincreasing
dilution
Temperature (K)
600 1400 1800 2200 260010000
1
2
3
4
5
6
LocalE
qu
iva
lence
Ra
tio
,Φ
NOx
Soot
10%
21%
15%
Ambient O2
concentration
8%
5%
Effect ofincreasing
dilution
Figure 3.1: Representative Φ-T diagrams illustrating the maximum achievabletemperature for complete combustion at the specified equivalence ratio. Left: For a fuelelement mixed to equilibrium with the ambient air initially at 1000 K for varyingambient oxygen concentrations. Right: For jet core with 10% ambient oxygenconcentration for varying initial ambient temperatures. Figure adapted from Refs [13,67] and [60].

Figures
B. Keeler 144 University of Nottingham
Conventional Combustion
PCCI Combustion
HCCI Combustion
Temperature (K)
600 1400 1800 2200 2600 300010000
1
2
3
4
5
6
Loca
lEq
uiv
ale
nce
Ra
tio,Φ
NOx
Soot
Injection
IgnitionDelay
SOCEOC
PremixedBurning
Temperature (K)
600 1400 1800 2200 2600 300010000
1
2
3
4
5
6
Loca
lEq
uiv
ale
nce
Ra
tio,Φ
NOx
Soot
Injection
IgnitionDelay
SOCEOC
PremixedBurning
Temperature (K)
600 1400 1800 2200 2600 300010000
1
2
3
4
5
6
Loca
lEq
uiv
ale
nce
Ra
tio,Φ
NOx
SootInjection
IgnitionDelay
PremixedBurning
Mixing-ControlledCombustion
EOC
SOC
Advanced SOI, high dilution (10% O2)
Retarded SOI, moderate dilution (15% O2)
Temperature (K)
600 1400 1800 2200 2600 300010000
1
2
3
4
5
6
Loca
lEq
uiv
ale
nce
Ra
tio,Φ
NOx
SootInjection
IgnitionDelay
PremixedBurning
Mixing-ControlledCombustion
EOC
SOC
Advanced SOI, high dilution (10% O2)
Retarded SOI, moderate dilution (15% O2)
PremixedBurning
Mixing-ControlledCombustion
Temperature (K)
600 1400 1800 2200 2600 300010000
1
2
3
4
5
6
Lo
ca
lE
qu
iva
lence
Ra
tio,Φ
NOx
SootInjection
IgnitionDelay
SOC
EOC
PremixedBurning
Mixing-ControlledCombustion
Temperature (K)
600 1400 1800 2200 2600 300010000
1
2
3
4
5
6
Lo
ca
lE
qu
iva
lence
Ra
tio,Φ
NOx
SootInjection
IgnitionDelay
SOC
EOC
Figure 3.2: Qualitative representation of proposed paths taken by typical fuel parcels inthe Φ-T plane during combustion for different combustion strategies. Diagram adaptedfrom figure within [13].
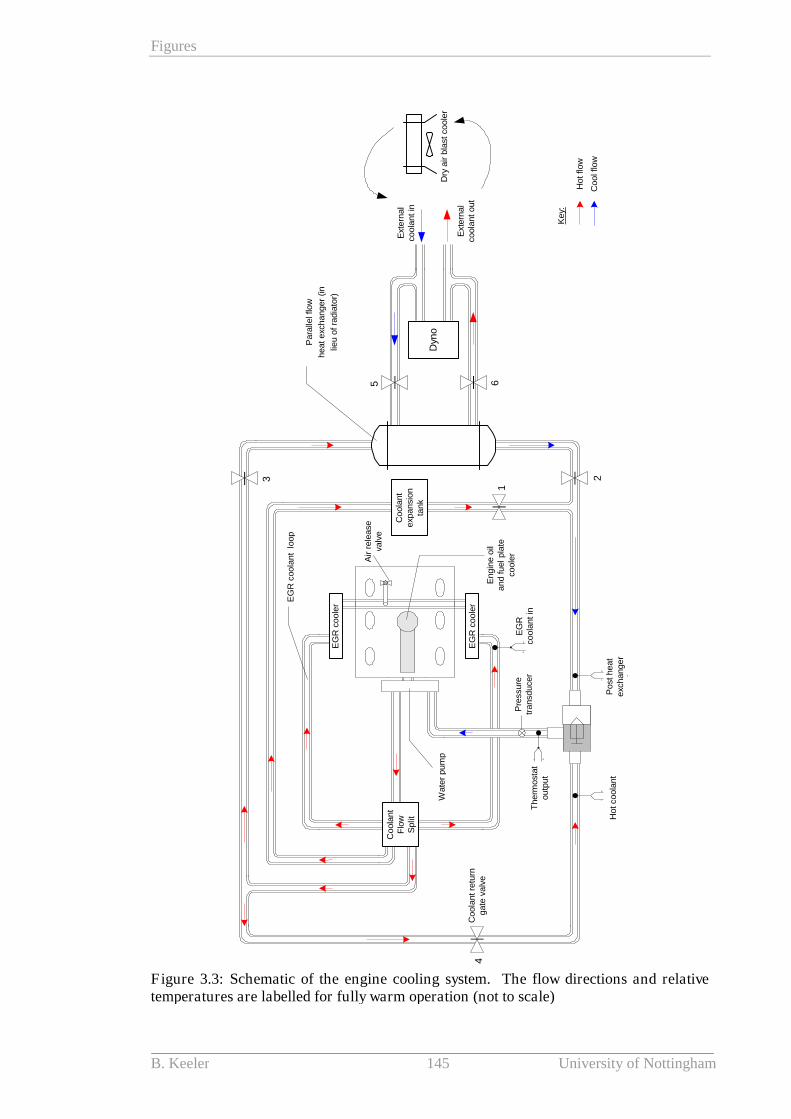
Figures
B. Keeler 145 University of Nottingham
Figure 3.3: Schematic of the engine cooling system. The flow directions and relativetemperatures are labelled for fully warm operation (not to scale)
Ext
ern
al
coola
ntin
Ext
ern
al
coola
ntout
Dyn
oD
ryair
bla
stco
ole
r
5 6
23
Post
heat
exc
hanger
coola
nt
Therm
ost
at
outp
ut
EG
Rco
ola
ntin
Wate
rpum
p
Engin
eoil
and
fuelpla
teco
ole
rP
ressu
retr
ansd
uce
r
EG
Rcoola
nt
loop
Air
rele
ase
valv
e
Hotcoola
nt
Para
llelf
low
heatexc
hanger
(in
lieu
ofra
dia
tor)
1
Coola
nt
Flo
wS
plit
Coola
nt
exp
ansi
on
tank
Coola
ntre
turn
gate
valv
e4
Coolf
low
Hotflo
w
Key:
EG
Rco
ole
r
EG
Rco
ole
r
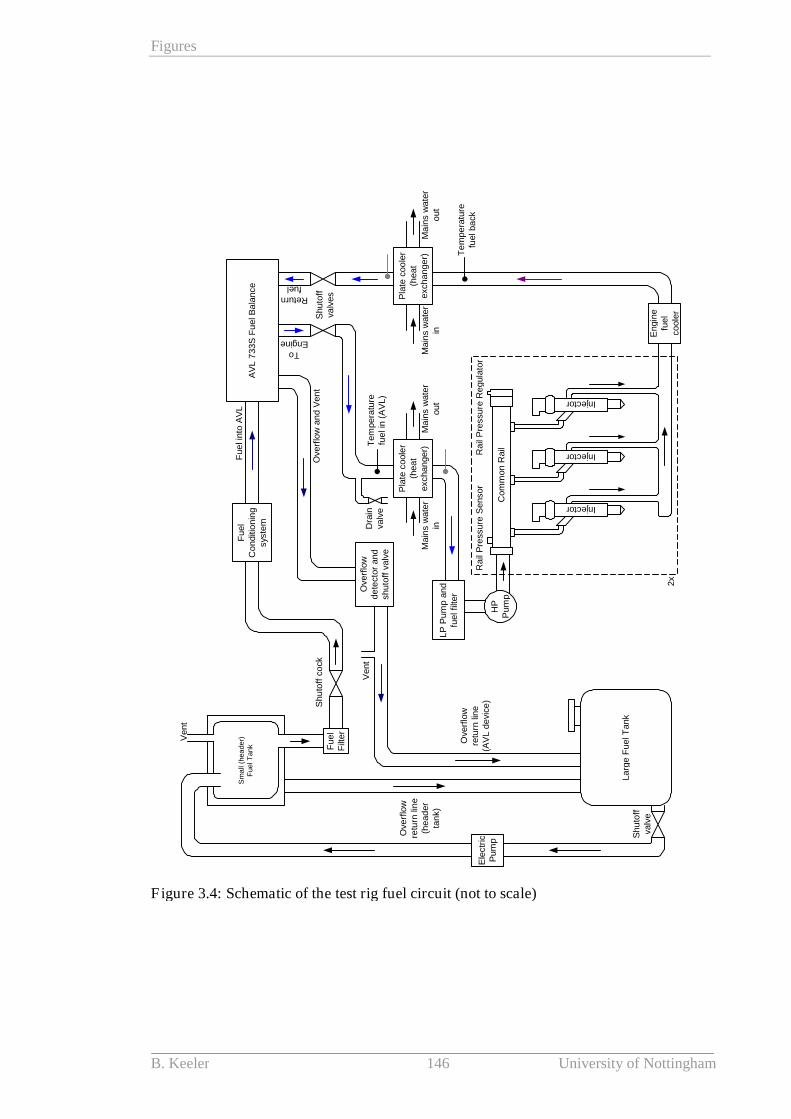
Figures
B. Keeler 146 University of Nottingham
Figure 3.4: Schematic of the test rig fuel circuit (not to scale)
La
rge
FuelT
ank
Ove
rflo
wre
turn
line
(head
er
tan
k)
Fue
lF
ilter
Shu
toff
cock
AV
L7
33S
Fu
elB
ala
nce
Main
sw
ate
rin
Ma
ins
wate
ro
ut
Shuto
ffva
lves
Vent
Dra
inva
lve
Vent
Shu
toff
valv
e
LP
Pum
pand
fuelf
ilter
Pla
tecoole
r(h
ea
texchan
ger)
Ma
ins
wate
rin
Ma
ins
wate
rout
Pla
teco
ole
r(h
eat
exch
ange
r)
Fuel
Co
nditi
onin
gsys
tem
Com
mon
Rail
Ra
ilP
ress
ure
Sensor
Rail
Pre
ssu
reR
egula
tor
Injector
Injector
Injector
HP
Pum
p
Ele
ctr
icP
um
p
Engin
efu
el
coole
r
Ove
rflo
wre
turn
line
(AV
Lde
vice
)
2x
ToEngine
Returnfuel
Ove
rflo
wan
dV
en
t
Fue
linto
AV
L
Ove
rflo
wde
tect
or
and
shuto
ffva
lve
Te
mpe
ratu
refu
elb
ack
Tem
pera
ture
fueli
n(A
VL
)
Sm
all
(hea
der)
FuelT
ank
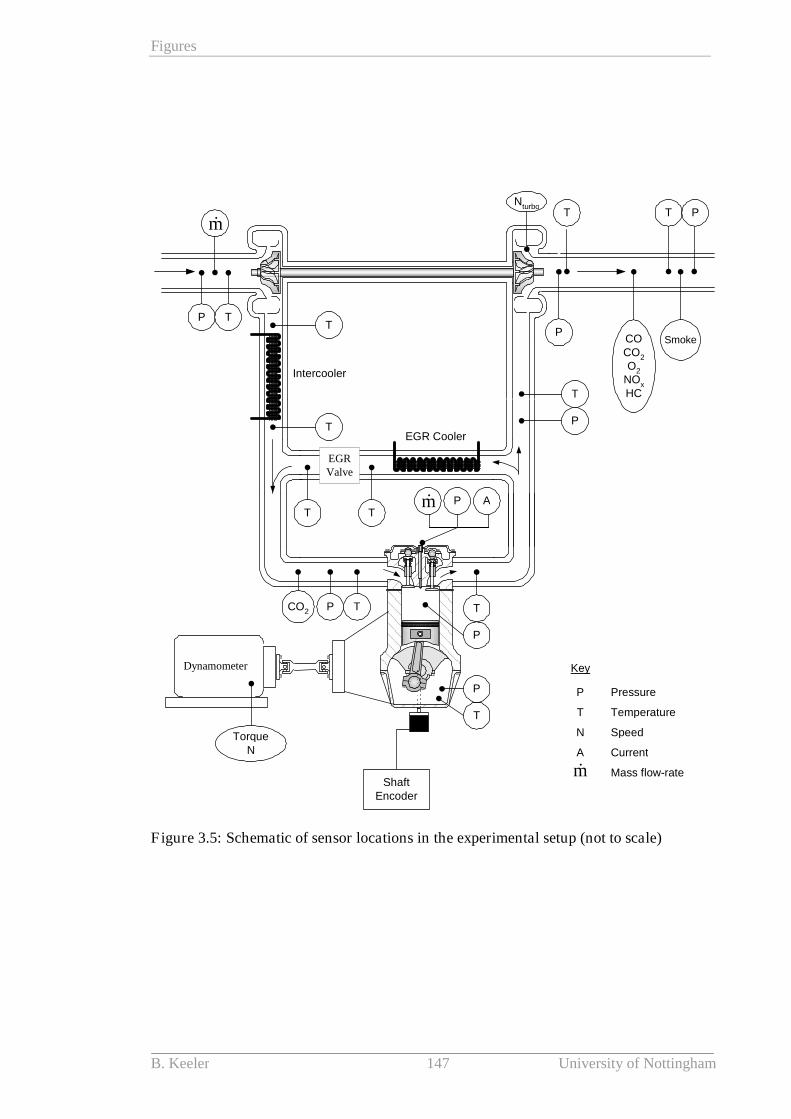
Figures
B. Keeler 147 University of Nottingham
Dynamometer
ShaftEncoder
T
P
T
P
EGRValve
T
P
T P
Smoke
T
P
TP
m
Nturbo
TorqueN
TPCO2
P AmT T
T
T
COCO2
O2
NOx
HC
EGR Cooler
Intercooler
Key
PressureP
TemperatureT
SpeedN
m Mass flow-rate
CurrentA
Figure 3.5: Schematic of sensor locations in the experimental setup (not to scale)
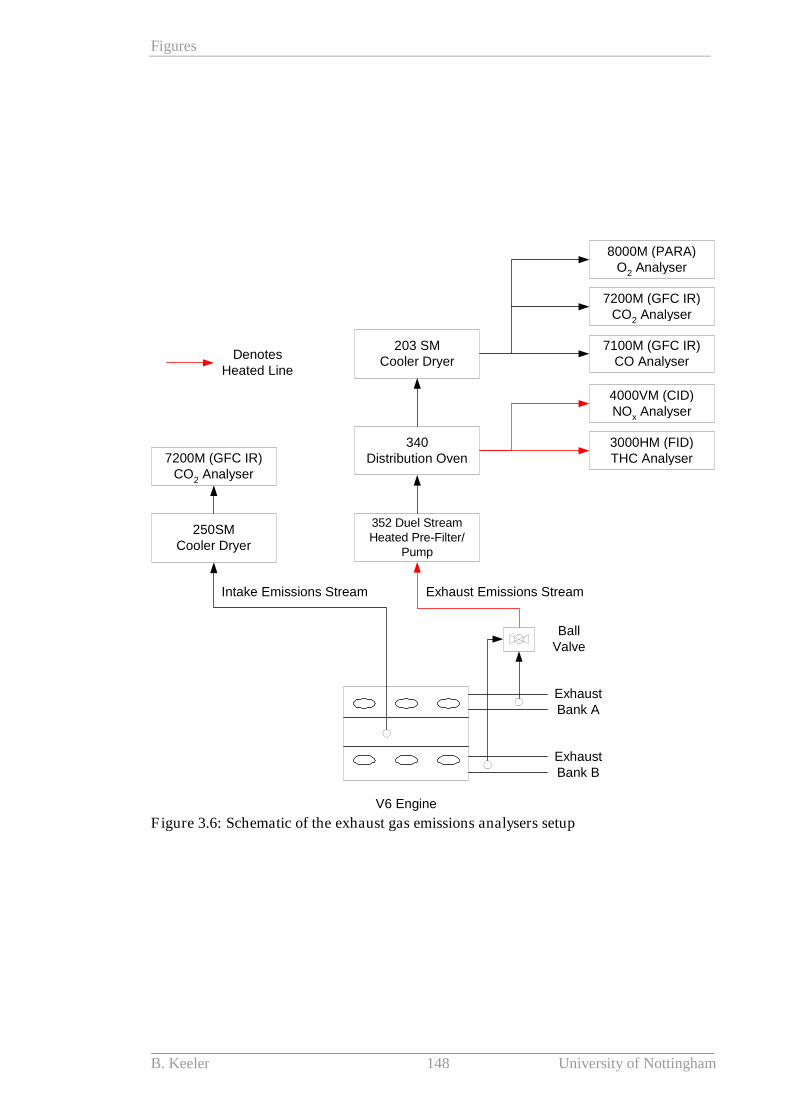
Figures
B. Keeler 148 University of Nottingham
8000M (PARA)O2 Analyser
7200M (GFC IR)CO2 Analyser
7200M (GFC IR)CO
2Analyser
352 Duel StreamHeated Pre-Filter/
Pump
340Distribution Oven
250SMCooler Dryer
203 SMCooler Dryer
3000HM (FID)THC Analyser
4000VM (CID)NOx Analyser
7100M (GFC IR)CO Analyser
V6 Engine
ExhaustBank A
ExhaustBank B
BallValve
Intake Emissions Stream Exhaust Emissions Stream
DenotesHeated Line
Figure 3.6: Schematic of the exhaust gas emissions analysers setup

Figures
B. Keeler 149 University of Nottingham
DS2003_B1ADC board
Pressure Signals
Turbo Signals
Engine Torqueand Speed
Signals
Emissions Signals
Micro-EpsilonDV135 Pre-Amp
Micro-EpsiloneddyNCDT
Sensors
AmplifierDyno Load Cell
SignalEmissions Stack
Kulite PressureTransducers
K-TypeThermocouples
AmplifierTemperature
SignalsDS2003_B2ADC board
DS4302 CANboard
TDC SignalShaft Encoder
(inc amp)
Degree Sensor Divider Box
CAM Sensor CAM Signal
Optrand FibreOptic PressureTransducers
Kistler 6055Pressure
Transducers
In-CylinderPressure Signals
In-CylinderPressure Signals
5011A ChargeAmplifier
DS2001Triggered board
DS1005Processor board
Ethernet
PC - SimulinkControlDesk
ECU
Figure 3.7: Schematic of inputs and outputs in the dSPACE data acquisition system
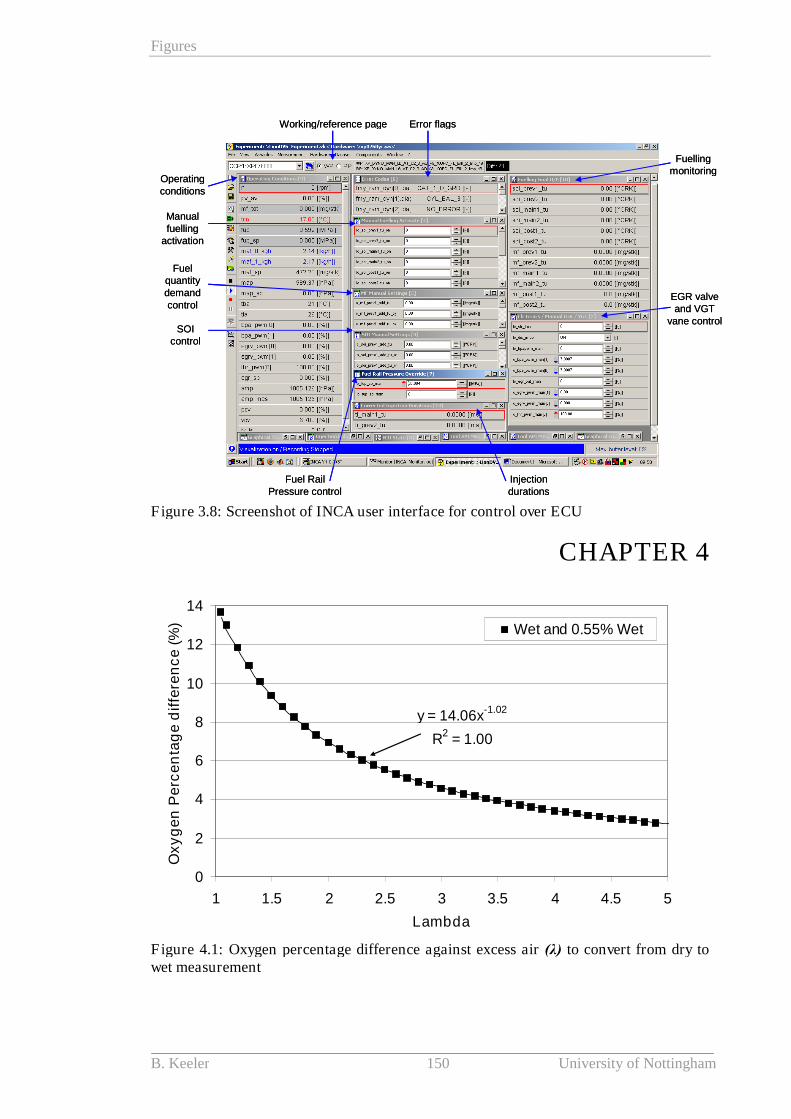
Figures
B. Keeler 150 University of Nottingham
Working/reference page Error flags
Fuellingmonitoring
EGR valveand VGT
vane control
Operatingconditions
Manualfuelling
activation
Fuelquantitydemandcontrol
SOIcontrol
Fuel RailPressure control
Injectiondurations
Working/reference page Error flags
Fuellingmonitoring
EGR valveand VGT
vane control
Operatingconditions
Manualfuelling
activation
Fuelquantitydemandcontrol
SOIcontrol
Fuel RailPressure control
Injectiondurations
Figure 3.8: Screenshot of INCA user interface for control over ECU
CHAPTER 4
y = 14.06x-1.02
R2
= 1.00
0
2
4
6
8
10
12
14
1 1.5 2 2.5 3 3.5 4 4.5 5
Lambda
Ox
yg
en
Pe
rce
nta
ge
dif
fere
nc
e(%
) Wet and 0.55% Wet
Figure 4.1: Oxygen percentage difference against excess air (λ) to convert from dry towet measurement
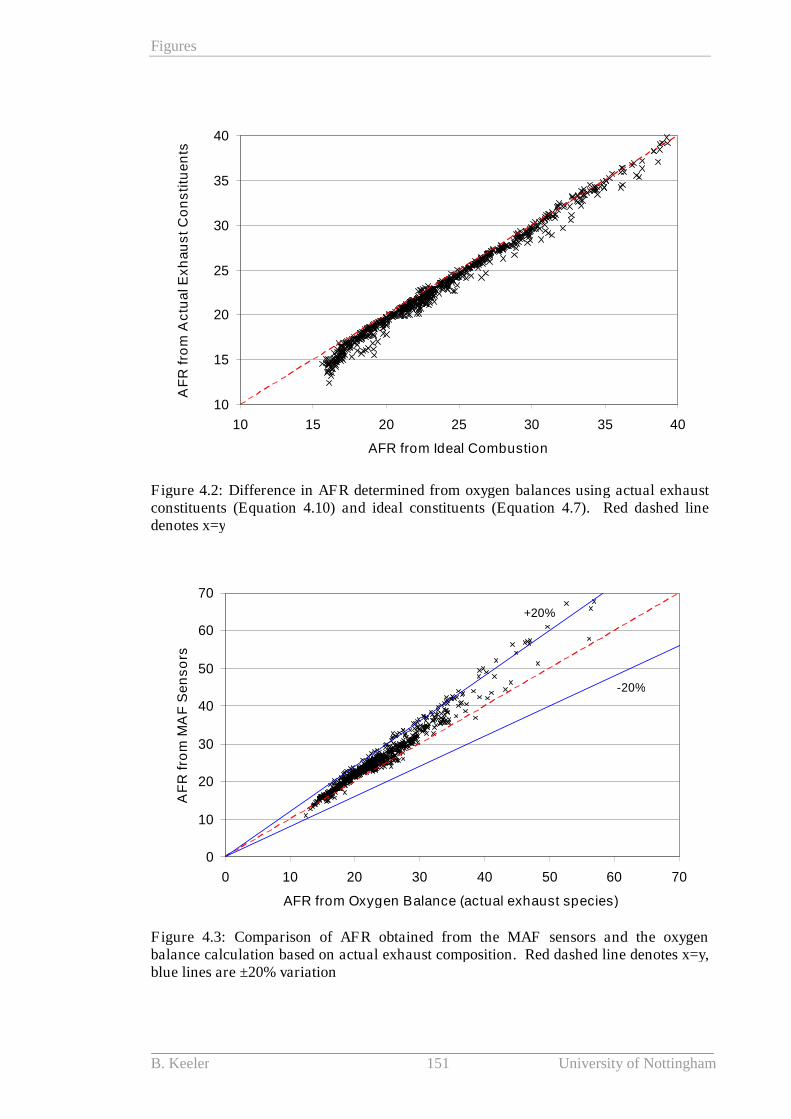
Figures
B. Keeler 151 University of Nottingham
10
15
20
25
30
35
40
10 15 20 25 30 35 40
AFR from Ideal Combustion
AF
Rfr
om
Ac
tua
lE
xh
au
st
Co
ns
titu
en
ts
Figure 4.2: Difference in AFR determined from oxygen balances using actual exhaustconstituents (Equation 4.10) and ideal constituents (Equation 4.7). Red dashed linedenotes x=y
0
10
20
30
40
50
60
70
0 10 20 30 40 50 60 70
AFR from Oxygen Balance (actual exhaust species)
AF
Rfr
om
MA
FS
en
so
rs
+20%
-20%
Figure 4.3: Comparison of AFR obtained from the MAF sensors and the oxygenbalance calculation based on actual exhaust composition. Red dashed line denotes x=y,blue lines are ±20% variation
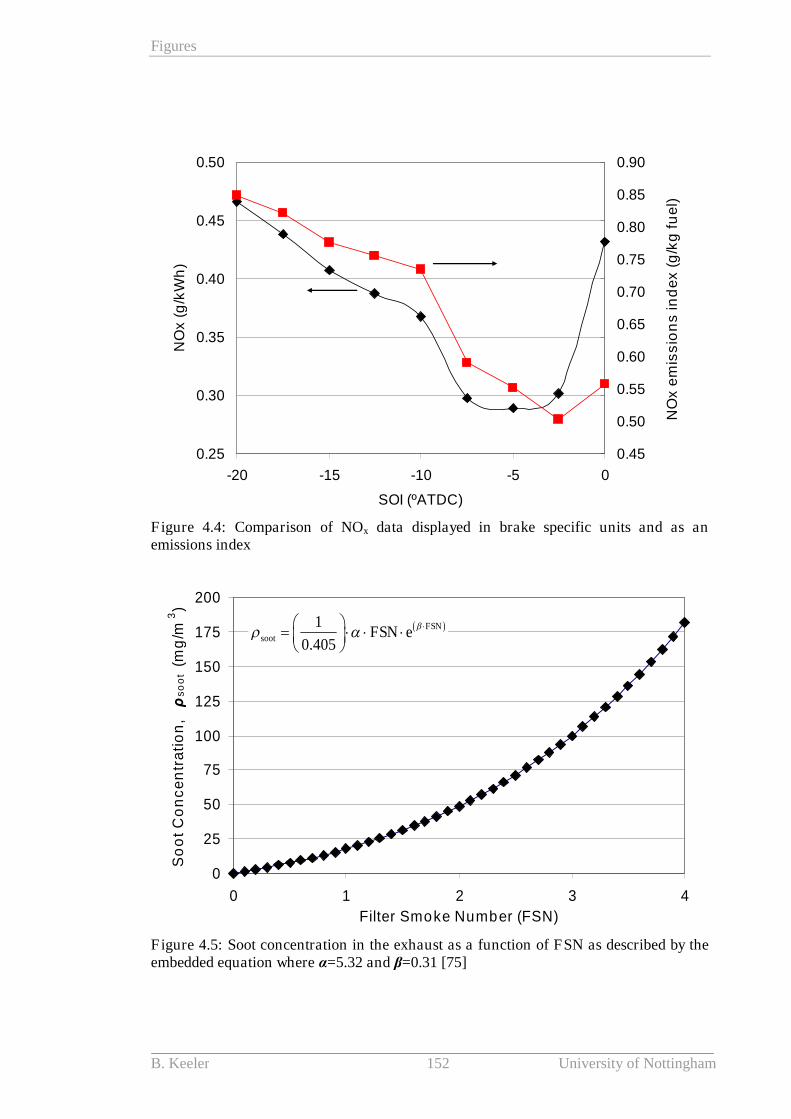
Figures
B. Keeler 152 University of Nottingham
0.25
0.30
0.35
0.40
0.45
0.50
-20 -15 -10 -5 0
SOI (ºATDC)
NO
x(g
/kW
h)
0.45
0.50
0.55
0.60
0.65
0.70
0.75
0.80
0.85
0.90
NO
xe
mis
sio
ns
ind
ex
(g/k
gfu
el)
Figure 4.4: Comparison of NOx data displayed in brake specific units and as anemissions index
0
25
50
75
100
125
150
175
200
0 1 2 3 4
Filter Smoke Number (FSN)
So
ot
Co
nc
en
tra
tio
n,ρ
so
ot
(mg
/m3)
1
0.405
FSN
soot FSN e
Figure 4.5: Soot concentration in the exhaust as a function of FSN as described by theembedded equation where α=5.32 and β=0.31 [75]
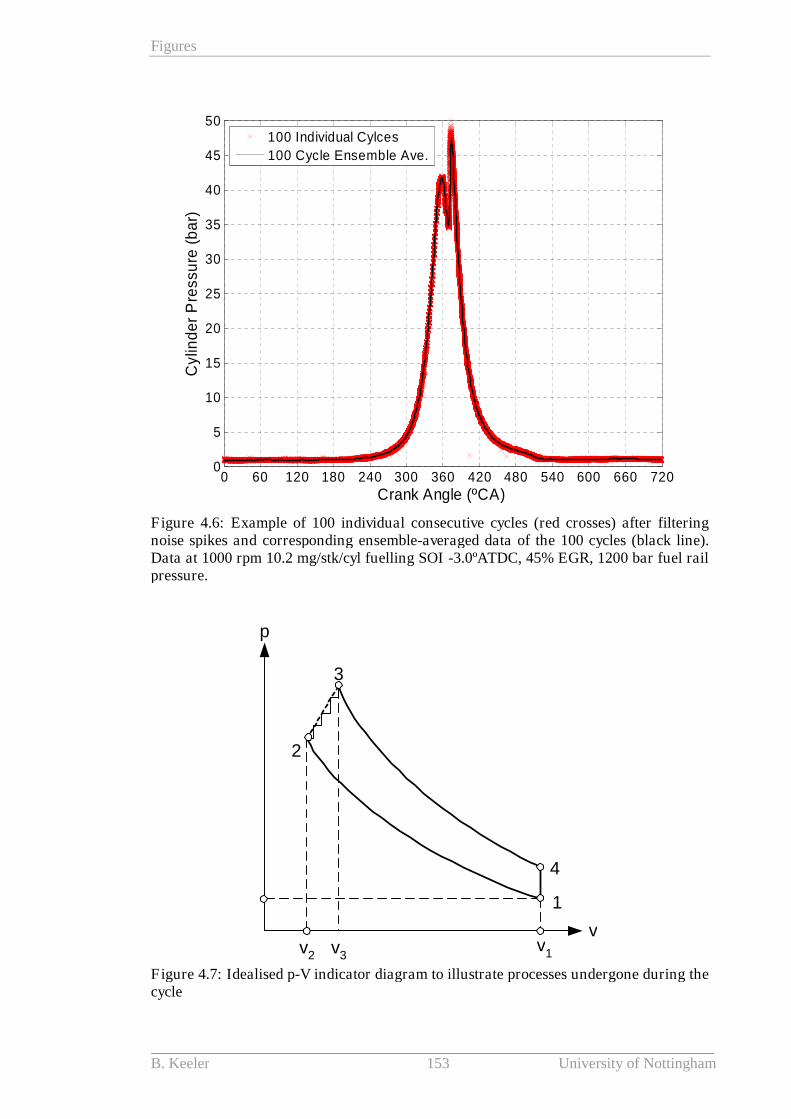
Figures
B. Keeler 153 University of Nottingham
0 60 120 180 240 300 360 420 480 540 600 660 7200
5
10
15
20
25
30
35
40
45
50
Crank Angle (ºCA)
Cylin
de
rP
ressu
re(b
ar)
100 Individual Cylces
100 Cycle Ensemble Ave.
Figure 4.6: Example of 100 individual consecutive cycles (red crosses) after filteringnoise spikes and corresponding ensemble-averaged data of the 100 cycles (black line).Data at 1000 rpm 10.2 mg/stk/cyl fuelling SOI -3.0ºATDC, 45% EGR, 1200 bar fuel railpressure.
3
4
2
1
v2v
1
v
p
v3
Figure 4.7: Idealised p-V indicator diagram to illustrate processes undergone during thecycle

Figures
B. Keeler 154 University of Nottingham
BDC -120 -60 TDC 60 EVO200
400
600
800
1000
1200
1400
1600
1800
Crank Angle (deg)
Estim
ate
dIn
-Cylin
de
rB
ulk
Ga
sT
em
pe
ratu
re(K
)
Figure 4.8: Example of variation bulk-gas temperature during the closed part of thecycle
25
30
35
40
45
50
55
60
700 800 900 1000 1100 1200 1300 1400 1500 1600
Temperature (K)
Mo
lar
He
at
Ca
pa
cit
y(k
J/k
mo
l-K
)
CO CO2 O2 H2O N2CO2 H2OO2 N2CO
Figure 4.9: Molar heat capacities for standard reference state as a function oftemperature. Data obtained from [80]
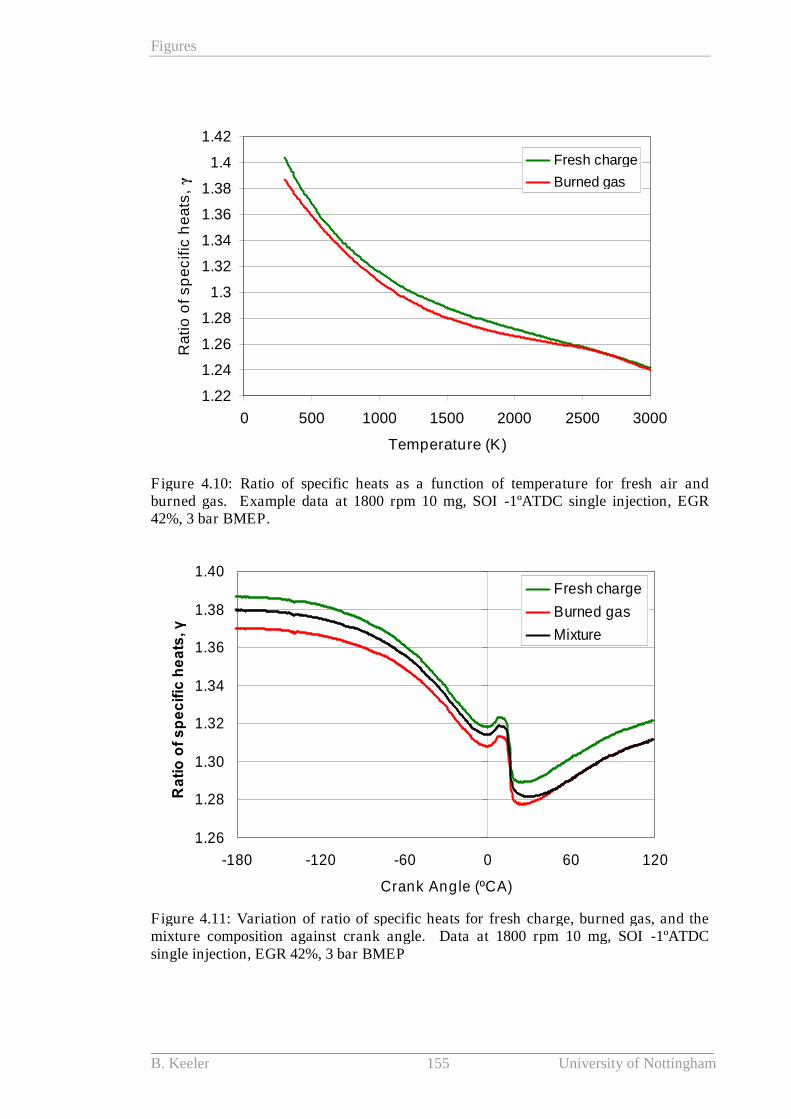
Figures
B. Keeler 155 University of Nottingham
1.22
1.24
1.26
1.28
1.3
1.32
1.34
1.36
1.38
1.4
1.42
0 500 1000 1500 2000 2500 3000
Temperature (K)
Ra
tio
of
sp
ec
ific
he
ats
,γ
Fresh charge
Burned gas
Figure 4.10: Ratio of specific heats as a function of temperature for fresh air andburned gas. Example data at 1800 rpm 10 mg, SOI -1ºATDC single injection, EGR42%, 3 bar BMEP.
1.26
1.28
1.30
1.32
1.34
1.36
1.38
1.40
-180 -120 -60 0 60 120
Crank Angle (ºCA)
Ra
tio
of
sp
ec
ific
he
ats
, γ
Fresh charge
Burned gas
Mixture
Figure 4.11: Variation of ratio of specific heats for fresh charge, burned gas, and themixture composition against crank angle. Data at 1800 rpm 10 mg, SOI -1ºATDCsingle injection, EGR 42%, 3 bar BMEP
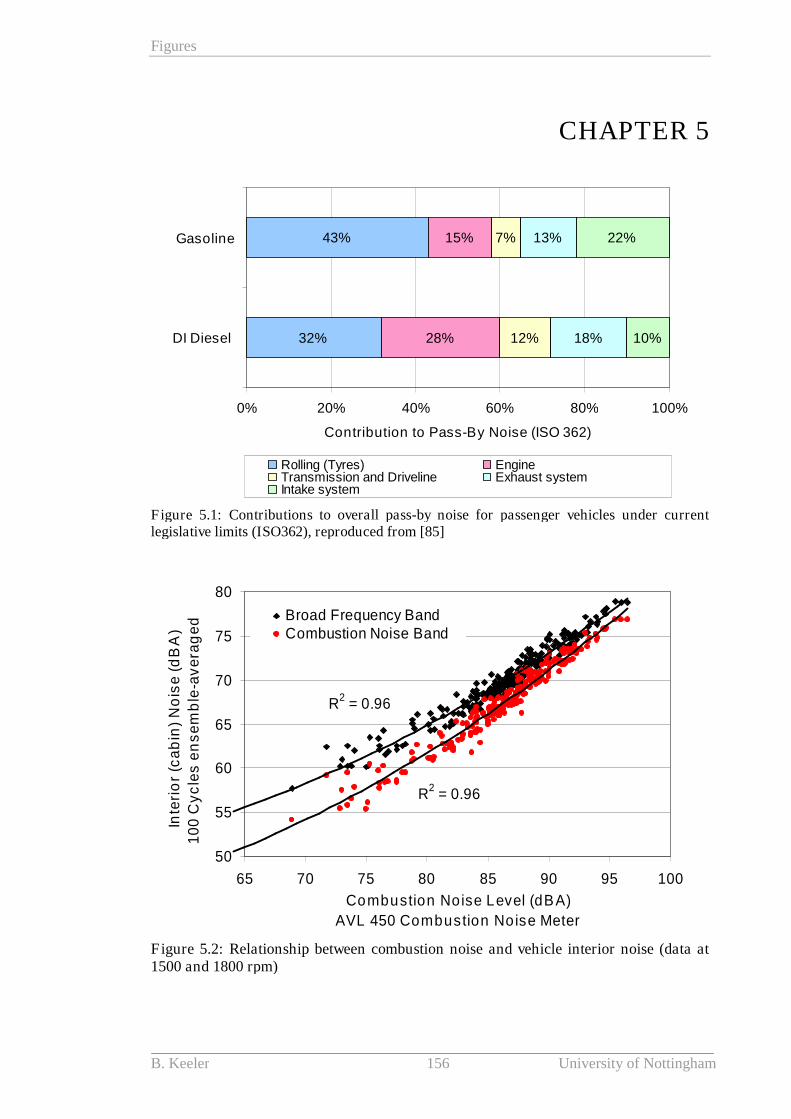
Figures
B. Keeler 156 University of Nottingham
CHAPTER 5
32%
43%
28%
15%
12%
7%
18%
13%
10%
22%
0% 20% 40% 60% 80% 100%
DI Diesel
Gasoline
Contribution to Pass-By Noise (ISO 362)
Rolling (Tyres) EngineTransmission and Driveline Exhaust systemIntake system
Figure 5.1: Contributions to overall pass-by noise for passenger vehicles under currentlegislative limits (ISO362), reproduced from [85]
R2
= 0.96
R2
= 0.96
50
55
60
65
70
75
80
65 70 75 80 85 90 95 100
Combustion Noise Level (dBA)
AVL 450 Combustion Noise Meter
Inte
rio
r(c
ab
in)
No
ise
(dB
A)
10
0C
yc
les
en
se
mb
le-a
ve
rag
ed Broad Frequency Band
Combustion Noise Band
Figure 5.2: Relationship between combustion noise and vehicle interior noise (data at1500 and 1800 rpm)

Figures
B. Keeler 157 University of Nottingham
65
70
75
80
85
90
95
100
0.0 0.2 0.4 0.6 0.8 1.0 1.2 1.4 1.6 1.8 2.0
Peak Rate of Change of Pressure, ΔP/Δθ (MPa/°CA)
[x]
Co
mb
us
tio
nN
ois
e(d
BA
)
[y]
1800 rpm
1500 rpm
1200 rpm
2
0.041 2988
1 33.6 1.02
xy
x x
2
0.145 3184
1 34.0 0.72
xy
x x
2
0.023 2905
1 33.9 1.49
xy
x x
Figure 5.3: Relationship between peak rate of change of in-cylinder pressure inMPa/ºCA and combustion noise at 1200 rpm, 1500 rpm, and 1800 rpm. Various fuelinjection quantities, SOIs, and EGR rates.
65
70
75
80
85
90
95
100
0 5 10 15 20 25
Peak Rate of Change of Pressure, ΔP/Δt (MPa/ms)
Co
mb
us
tio
nN
ois
e(d
BA
)
1800 rpm
1500 rpm
1200 rpm
Figure 5.4: Relationship between peak rate of change of in-cylinder pressure in MPa/msand combustion noise at 1200 rpm, 1500 rpm, and 1800 rpm. Various fuel injectionquantities, SOIs, and EGR rates.
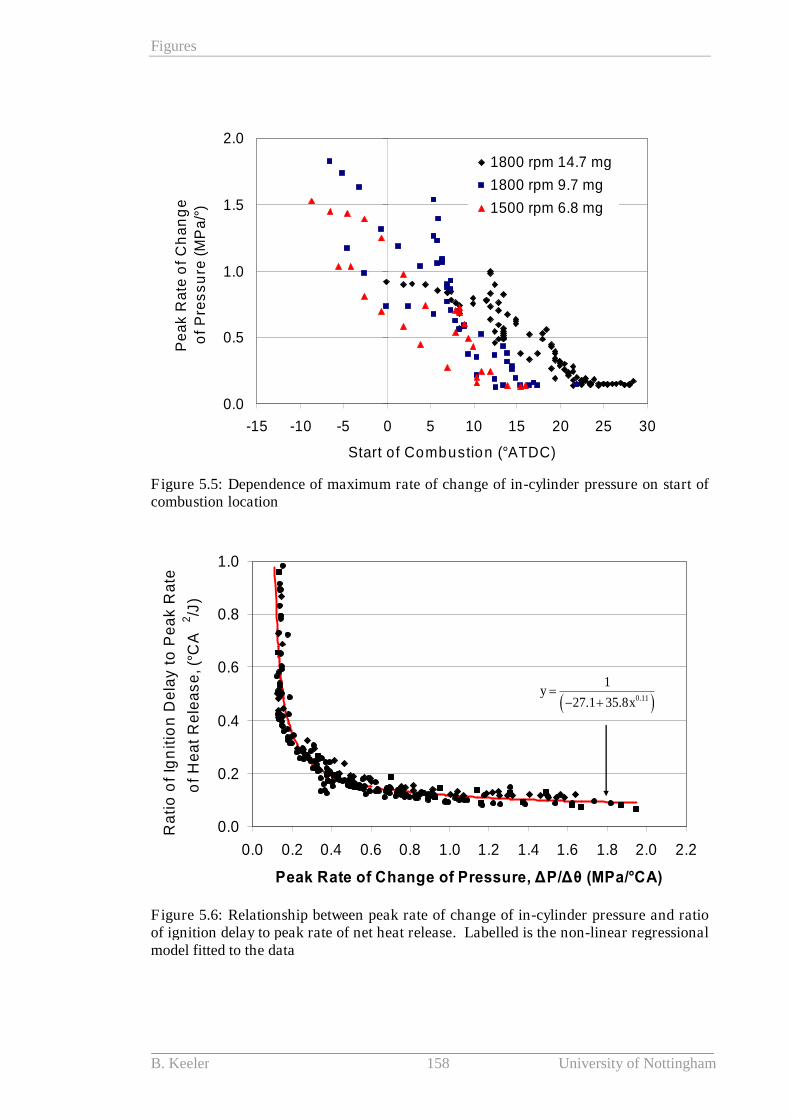
Figures
B. Keeler 158 University of Nottingham
0.0
0.5
1.0
1.5
2.0
-15 -10 -5 0 5 10 15 20 25 30
Start of Combustion (°ATDC)
Pe
ak
Ra
teo
fC
ha
ng
e
of
Pre
ss
ure
(MP
a/°
)
1800 rpm 14.7 mg
1800 rpm 9.7 mg
1500 rpm 6.8 mg
Figure 5.5: Dependence of maximum rate of change of in-cylinder pressure on start ofcombustion location
0.0
0.2
0.4
0.6
0.8
1.0
0.0 0.2 0.4 0.6 0.8 1.0 1.2 1.4 1.6 1.8 2.0 2.2
Peak Rate of Change of Pressure, ΔP/Δθ (MPa/°CA)
Ra
tio
of
Ign
itio
nD
ela
yto
Pe
ak
Ra
te
of
He
at
Re
lea
se
,(°
CA
2/J
)
0.11
1
27.1 35.8y
x
Figure 5.6: Relationship between peak rate of change of in-cylinder pressure and ratioof ignition delay to peak rate of net heat release. Labelled is the non-linear regressionalmodel fitted to the data
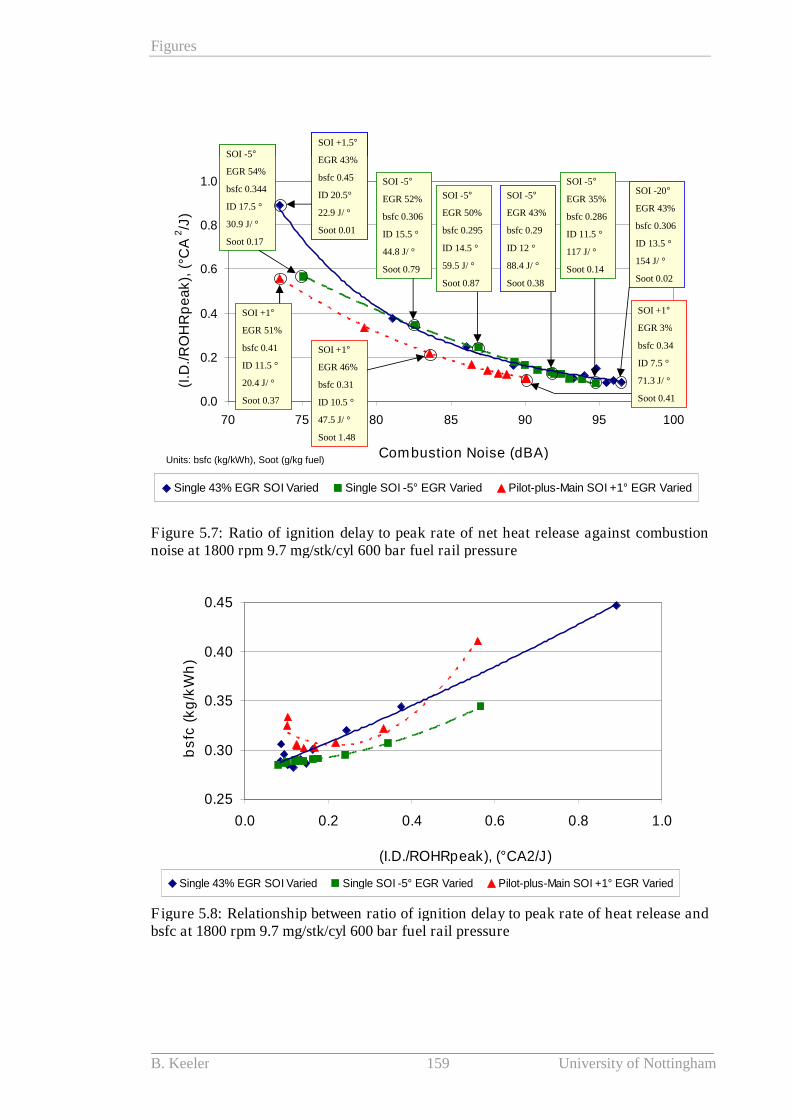
Figures
B. Keeler 159 University of Nottingham
0.0
0.2
0.4
0.6
0.8
1.0
70 75 80 85 90 95 100
Combustion Noise (dBA)
(I.D
./R
OH
Rp
ea
k),
(°C
A2/J
)
Single 43% EGR SOI Varied Single SOI -5° EGR Varied Pilot-plus-Main SOI +1° EGR Varied
SOI +1°
EGR 51%
bsfc 0.41
ID 11.5 °
20.4 J/ °
Soot 0.37
SOI -5°
EGR 54%
bsfc 0.344
ID 17.5 °
30.9 J/ °
Soot 0.17
SOI +1.5°
EGR 43%
bsfc 0.45
ID 20.5°
22.9 J/ °
Soot 0.01
SOI -5°
EGR 52%
bsfc 0.306
ID 15.5 °
44.8 J/ °
Soot 0.79
SOI -5°
EGR 50%
bsfc 0.295
ID 14.5 °
59.5 J/ °
Soot 0.87
SOI -5°
EGR 43%
bsfc 0.29
ID 12 °
88.4 J/ °
Soot 0.38
SOI -5°
EGR 35%
bsfc 0.286
ID 11.5 °
117 J/ °
Soot 0.14
SOI -20°
EGR 43%
bsfc 0.306
ID 13.5 °
154 J/ °
Soot 0.02
SOI +1°
EGR 3%
bsfc 0.34
ID 7.5 °
71.3 J/ °
Soot 0.41
SOI +1°
EGR 46%
bsfc 0.31
ID 10.5 °
47.5 J/ °
Soot 1.48
Units: bsfc (kg/kWh), Soot (g/kg fuel)
Figure 5.7: Ratio of ignition delay to peak rate of net heat release against combustionnoise at 1800 rpm 9.7 mg/stk/cyl 600 bar fuel rail pressure
0.25
0.30
0.35
0.40
0.45
0.0 0.2 0.4 0.6 0.8 1.0
(I.D./ROHRpeak), (°CA2/J)
bs
fc(k
g/k
Wh
)
Single 43% EGR SOI Varied Single SOI -5° EGR Varied Pilot-plus-Main SOI +1° EGR Varied
Figure 5.8: Relationship between ratio of ignition delay to peak rate of heat release andbsfc at 1800 rpm 9.7 mg/stk/cyl 600 bar fuel rail pressure
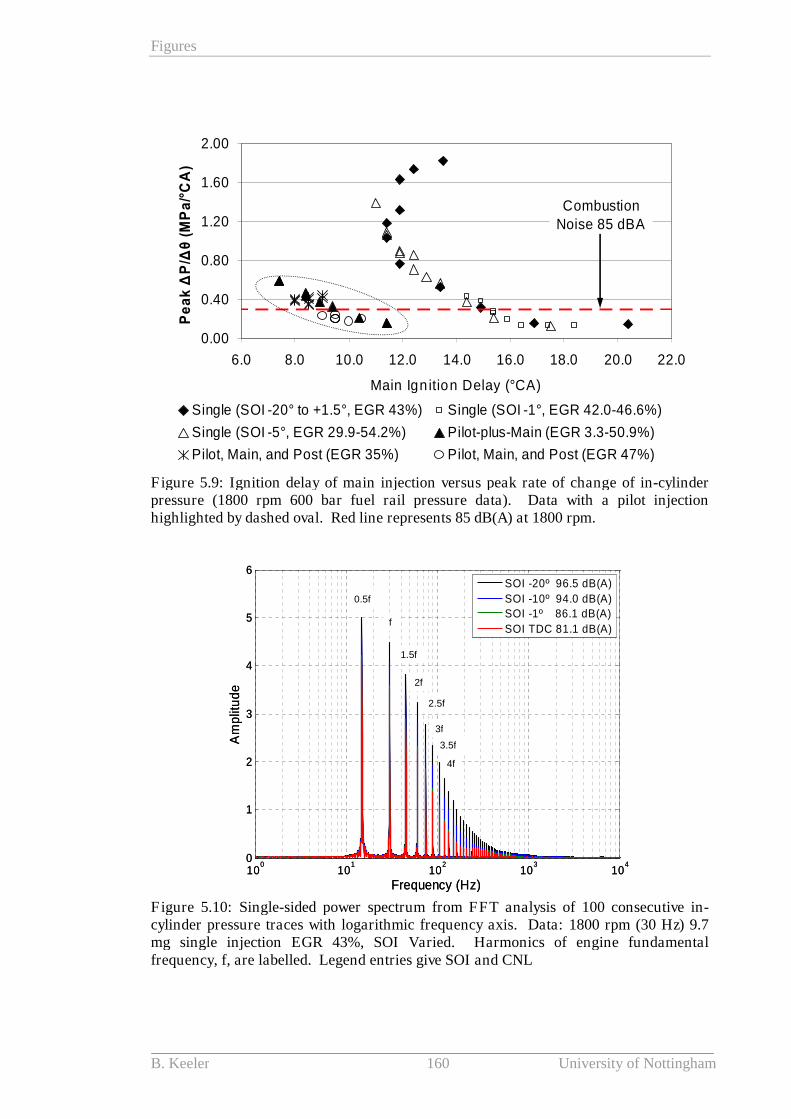
Figures
B. Keeler 160 University of Nottingham
0.00
0.40
0.80
1.20
1.60
2.00
6.0 8.0 10.0 12.0 14.0 16.0 18.0 20.0 22.0
Main Ignition Delay (°CA)
Pe
ak
ΔP
/Δθ
(M
Pa
/°C
A)
Single (SOI -20° to +1.5°, EGR 43%) Single (SOI -1°, EGR 42.0-46.6%)
Single (SOI -5°, EGR 29.9-54.2%) Pilot-plus-Main (EGR 3.3-50.9%)
Pilot, Main, and Post (EGR 35%) Pilot, Main, and Post (EGR 47%)
CombustionNoise 85 dBA
Figure 5.9: Ignition delay of main injection versus peak rate of change of in-cylinderpressure (1800 rpm 600 bar fuel rail pressure data). Data with a pilot injectionhighlighted by dashed oval. Red line represents 85 dB(A) at 1800 rpm.
100
101
102
103
104
0
1
2
3
4
5
6
Frequency (Hz)
Am
plit
ud
e
SOI -20º 96.5 dB(A)
SOI -10º 94.0 dB(A)
SOI -1º 86.1 dB(A)
SOI TDC 81.1 dB(A)
0.5f
f
1.5f
2f
2.5f
3f
3.5f
4f
100
101
102
103
104
0
1
2
3
4
5
6
Frequency (Hz)
Am
plit
ud
e
SOI -20º 96.5 dB(A)
SOI -10º 94.0 dB(A)
SOI -1º 86.1 dB(A)
SOI TDC 81.1 dB(A)
0.5f
f
1.5f
2f
2.5f
3f
3.5f
4f
Figure 5.10: Single-sided power spectrum from FFT analysis of 100 consecutive in-cylinder pressure traces with logarithmic frequency axis. Data: 1800 rpm (30 Hz) 9.7mg single injection EGR 43%, SOI Varied. Harmonics of engine fundamentalfrequency, f, are labelled. Legend entries give SOI and CNL
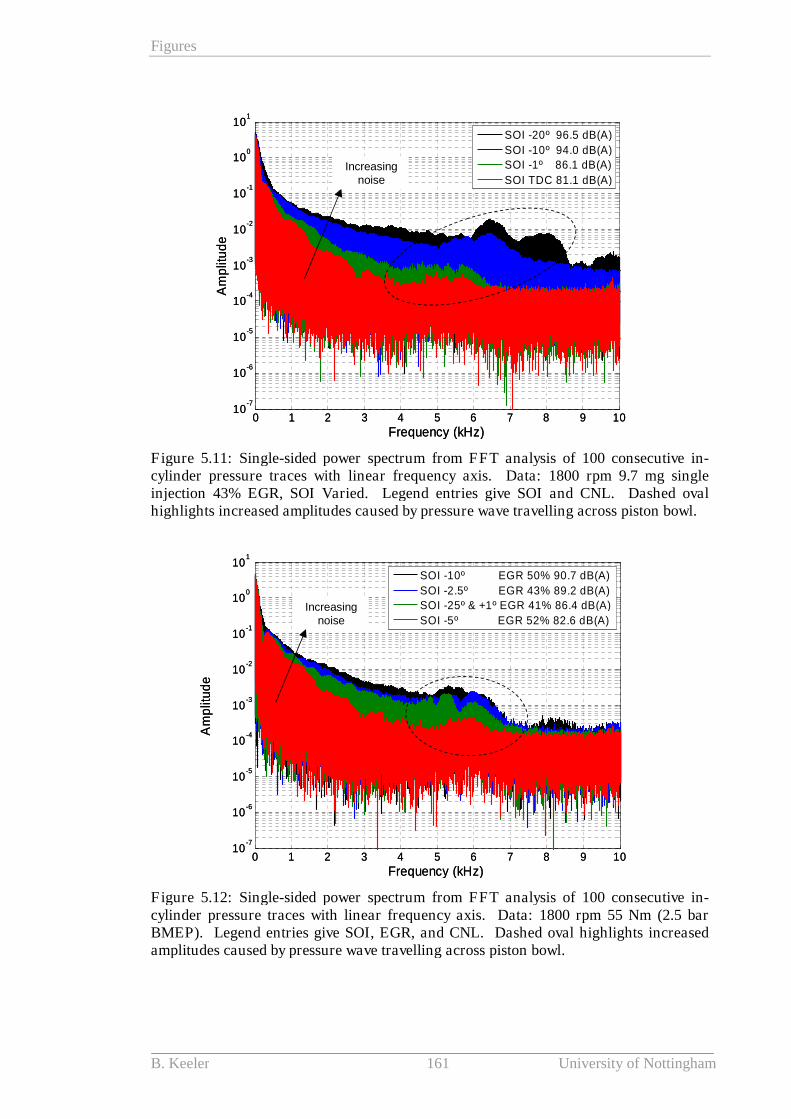
Figures
B. Keeler 161 University of Nottingham
0 1 2 3 4 5 6 7 8 9 1010
-7
10-6
10-5
10-4
10-3
10-2
10-1
100
101
Frequency (kHz)
Am
plit
ud
e
SOI -20º 96.5 dB(A)
SOI -10º 94.0 dB(A)
SOI -1º 86.1 dB(A)
SOI TDC 81.1 dB(A)Increasing
noise
0 1 2 3 4 5 6 7 8 9 1010
-7
10-6
10-5
10-4
10-3
10-2
10-1
100
101
Frequency (kHz)
Am
plit
ud
e
SOI -20º 96.5 dB(A)
SOI -10º 94.0 dB(A)
SOI -1º 86.1 dB(A)
SOI TDC 81.1 dB(A)Increasing
noise
Figure 5.11: Single-sided power spectrum from FFT analysis of 100 consecutive in-cylinder pressure traces with linear frequency axis. Data: 1800 rpm 9.7 mg singleinjection 43% EGR, SOI Varied. Legend entries give SOI and CNL. Dashed ovalhighlights increased amplitudes caused by pressure wave travelling across piston bowl.
0 1 2 3 4 5 6 7 8 9 1010
-7
10-6
10-5
10-4
10-3
10-2
10-1
100
101
Frequency (kHz)
Am
plit
ud
e
SOI -10º EGR 50% 90.7 dB(A)
SOI -2.5º EGR 43% 89.2 dB(A)
SOI -25º & +1º EGR 41% 86.4 dB(A)
SOI -5º EGR 52% 82.6 dB(A)Increasing
noise
0 1 2 3 4 5 6 7 8 9 1010
-7
10-6
10-5
10-4
10-3
10-2
10-1
100
101
Frequency (kHz)
Am
plit
ud
e
SOI -10º EGR 50% 90.7 dB(A)
SOI -2.5º EGR 43% 89.2 dB(A)
SOI -25º & +1º EGR 41% 86.4 dB(A)
SOI -5º EGR 52% 82.6 dB(A)Increasing
noise
Figure 5.12: Single-sided power spectrum from FFT analysis of 100 consecutive in-cylinder pressure traces with linear frequency axis. Data: 1800 rpm 55 Nm (2.5 barBMEP). Legend entries give SOI, EGR, and CNL. Dashed oval highlights increasedamplitudes caused by pressure wave travelling across piston bowl.
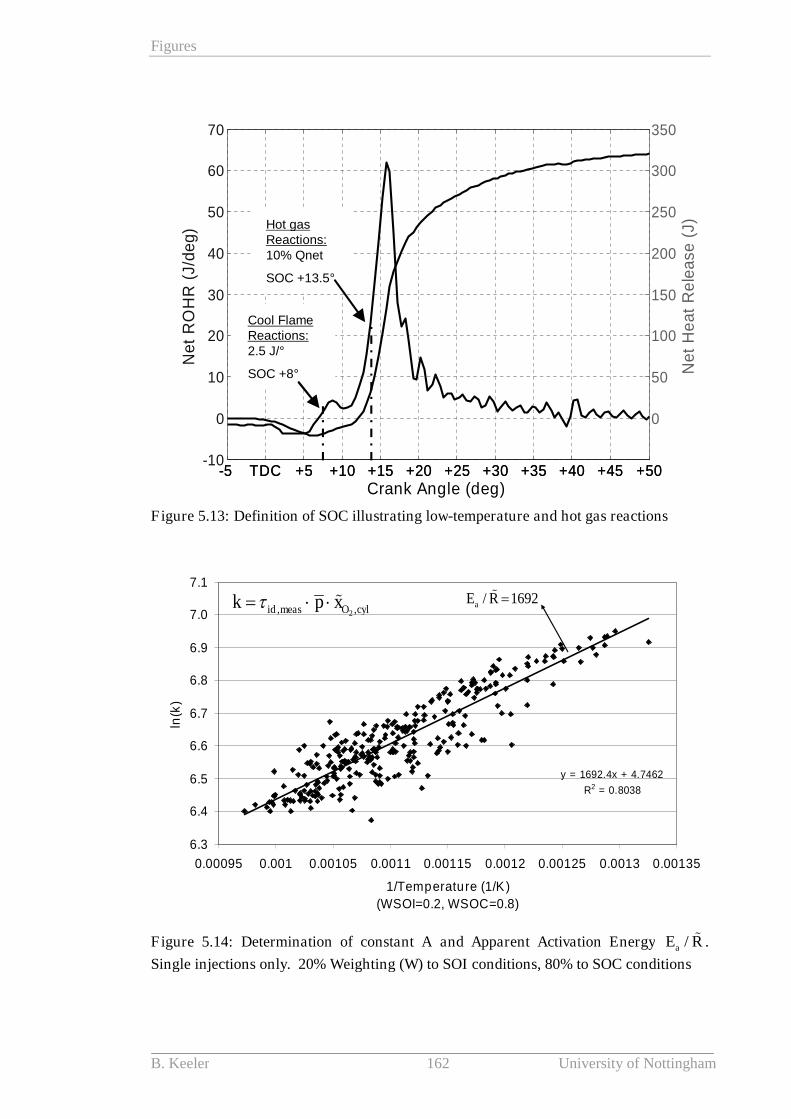
Figures
B. Keeler 162 University of Nottingham
-5 TDC +5 +10 +15 +20 +25 +30 +35 +40 +45 +50-10
0
10
20
30
40
50
60
70
Crank Angle (deg)
Ne
tR
OH
R(J
/de
g)
-5 TDC +5 +10 +15 +20 +25 +30 +35 +40 +45 +50
0
50
100
150
200
250
300
350
Ne
tH
ea
tR
ele
ase
(J)
Cool FlameReactions:2.5 J/°
SOC +8°
Hot gasReactions:10% Qnet
SOC +13.5°
-5 TDC +5 +10 +15 +20 +25 +30 +35 +40 +45 +50-10
0
10
20
30
40
50
60
70
Crank Angle (deg)
Ne
tR
OH
R(J
/de
g)
-5 TDC +5 +10 +15 +20 +25 +30 +35 +40 +45 +50
0
50
100
150
200
250
300
350
Ne
tH
ea
tR
ele
ase
(J)
Cool FlameReactions:2.5 J/°
SOC +8°
Hot gasReactions:10% Qnet
SOC +13.5°
Figure 5.13: Definition of SOC illustrating low-temperature and hot gas reactions
y = 1692.4x + 4.7462
R2 = 0.8038
6.3
6.4
6.5
6.6
6.7
6.8
6.9
7.0
7.1
0.00095 0.001 0.00105 0.0011 0.00115 0.0012 0.00125 0.0013 0.00135
1/Temperature (1/K)
(WSOI=0.2, WSOC=0.8)
ln(k
)
2, ,id meas O cylk p x / 1692aE R
Figure 5.14: Determination of constant A and Apparent Activation Energy /aE R .
Single injections only. 20% Weighting (W) to SOI conditions, 80% to SOC conditions
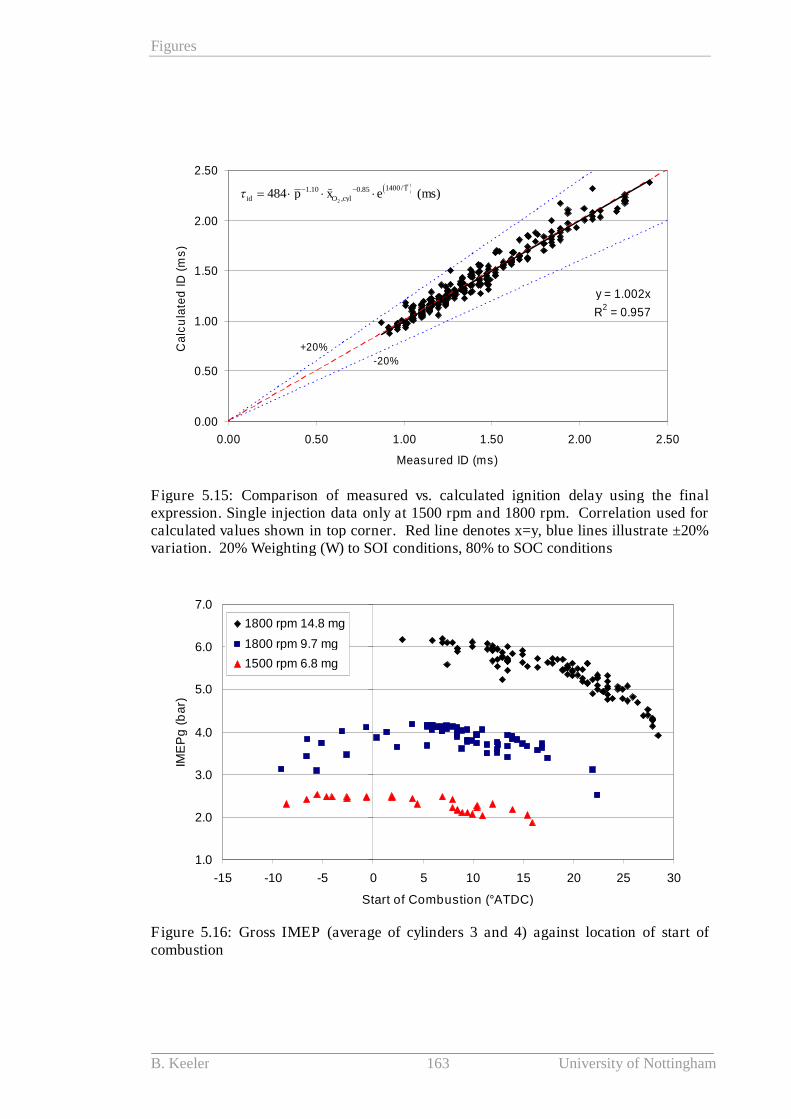
Figures
B. Keeler 163 University of Nottingham
y = 1.002x
R2
= 0.957
0.00
0.50
1.00
1.50
2.00
2.50
0.00 0.50 1.00 1.50 2.00 2.50
Measured ID (ms)
Ca
lcu
late
dID
(ms
)
-20%
+20%
2
1400/1.10 0.85,484 ( )
T
id O cylp x e ms
Figure 5.15: Comparison of measured vs. calculated ignition delay using the finalexpression. Single injection data only at 1500 rpm and 1800 rpm. Correlation used forcalculated values shown in top corner. Red line denotes x=y, blue lines illustrate ±20%variation. 20% Weighting (W) to SOI conditions, 80% to SOC conditions
1.0
2.0
3.0
4.0
5.0
6.0
7.0
-15 -10 -5 0 5 10 15 20 25 30
Start of Combustion (°ATDC)
IME
Pg
(ba
r)
1800 rpm 14.8 mg
1800 rpm 9.7 mg
1500 rpm 6.8 mg
Figure 5.16: Gross IMEP (average of cylinders 3 and 4) against location of start ofcombustion

Figures
B. Keeler 164 University of Nottingham
-20 0 20 40 60
20
40
60
80
Crank Angle (deg)
Cylin
de
rP
ressu
re(b
ar)
-20
-15
-7.5
-2.5
TDC
+1.5
-20 -10 0 10 20 30 40 50
0
50
100
150
Crank Angle (deg)
Ne
tR
OH
R(J
/de
g)
-20 -10 0 10 20 30 40 50
0
100
200
300
400
Crank Angle (deg)
Ne
tH
ea
tR
ele
ase
(J)
-20 -10 0 10 20
-4
-2
0
2
4
6
8
Crank Angle (deg)
P.d
V(P
a.m
3/º
)
b
a
d
c
-20 0 20 40 60
20
40
60
80
Crank Angle (deg)
Cylin
de
rP
ressu
re(b
ar)
-20
-15
-7.5
-2.5
TDC
+1.5
-20 -10 0 10 20 30 40 50
0
50
100
150
Crank Angle (deg)
Ne
tR
OH
R(J
/de
g)
-20 -10 0 10 20 30 40 50
0
100
200
300
400
Crank Angle (deg)
Ne
tH
ea
tR
ele
ase
(J)
-20 -10 0 10 20 30 40 50
0
50
100
150
Crank Angle (deg)
Ne
tR
OH
R(J
/de
g)
-20 -10 0 10 20 30 40 50
0
50
100
150
Crank Angle (deg)
Ne
tR
OH
R(J
/de
g)
-20 -10 0 10 20 30 40 50
0
100
200
300
400
Crank Angle (deg)
Ne
tH
ea
tR
ele
ase
(J)
-20 -10 0 10 20 30 40 50
0
100
200
300
400
Crank Angle (deg)
Ne
tH
ea
tR
ele
ase
(J)
-20 -10 0 10 20
-4
-2
0
2
4
6
8
Crank Angle (deg)
P.d
V(P
a.m
3/º
)
b
-20 -10 0 10 20
-4
-2
0
2
4
6
8
Crank Angle (deg)
P.d
V(P
a.m
3/º
)
b
a
d
c
Figure 5.17: In-cylinder analysis at 1800 rpm 9.7 mg 43% EGR 600 bar rail pressure.a) Cylinder Pressure (bar), b) P.dV (Pa.m3/º), c) Net Rate of heat release (J/º), d)Cumulative net heat release (J). Legend denotes SOI, arrows indicate effect ofretarding injection timing.
86
88
90
92
94
96
98
100
-15 -10 -5 0 5 10 15 20 25 30
Start of Combustion (°ATDC)
Co
mb
us
tio
nE
ffic
ien
cy
(%)
1800 rpm 14.8 mg
1800 rpm 9.7 mg
1500 rpm 6.8 mg
Pilot + Main
High EGR
Φ=0.97
Φ=0.95
Single retardedinjections
Φ=0.60
Φ=0.49
Figure 5.18: Dependence of combustion efficiency on start of combustion. Selected lowefficiency data points are labelled for single and pilot-plus-main injections to highlightfactors that must be considered when aiming to maintain high combustion efficiency
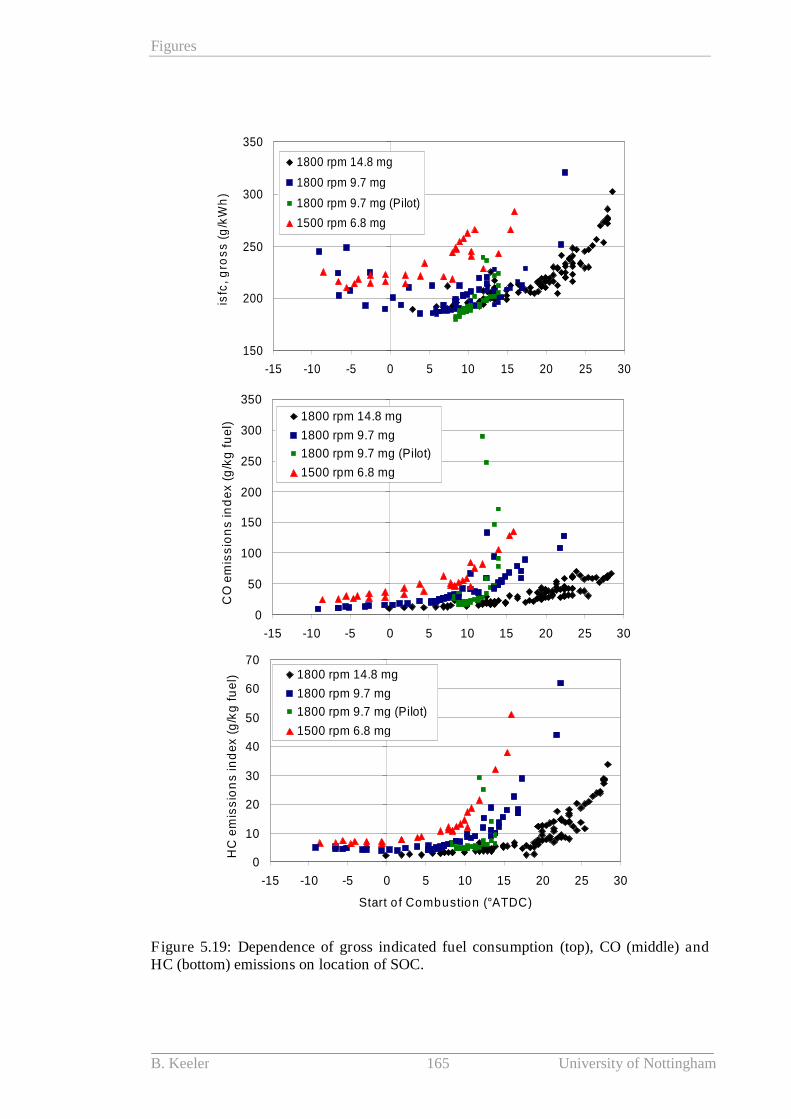
Figures
B. Keeler 165 University of Nottingham
150
200
250
300
350
-15 -10 -5 0 5 10 15 20 25 30
Start of Combustion (°ATDC)
isfc
,g
ros
s(g
/kW
h)
1800 rpm 14.8 mg
1800 rpm 9.7 mg
1800 rpm 9.7 mg (Pilot)
1500 rpm 6.8 mg
0
50
100
150
200
250
300
350
-15 -10 -5 0 5 10 15 20 25 30
Start of Combustion (°ATDC)
CO
em
iss
ion
sin
de
x(g
/kg
fue
l)
1800 rpm 14.8 mg
1800 rpm 9.7 mg
1800 rpm 9.7 mg (Pilot)
1500 rpm 6.8 mg
0
10
20
30
40
50
60
70
-15 -10 -5 0 5 10 15 20 25 30
Start of Combustion (°ATDC)
HC
em
iss
ion
sin
de
x(g
/kg
fue
l) 1800 rpm 14.8 mg
1800 rpm 9.7 mg
1800 rpm 9.7 mg (Pilot)
1500 rpm 6.8 mg
150
200
250
300
350
-15 -10 -5 0 5 10 15 20 25 30
Start of Combustion (°ATDC)
isfc
,g
ros
s(g
/kW
h)
1800 rpm 14.8 mg
1800 rpm 9.7 mg
1800 rpm 9.7 mg (Pilot)
1500 rpm 6.8 mg
0
50
100
150
200
250
300
350
-15 -10 -5 0 5 10 15 20 25 30
Start of Combustion (°ATDC)
CO
em
iss
ion
sin
de
x(g
/kg
fue
l)
1800 rpm 14.8 mg
1800 rpm 9.7 mg
1800 rpm 9.7 mg (Pilot)
1500 rpm 6.8 mg
0
10
20
30
40
50
60
70
-15 -10 -5 0 5 10 15 20 25 30
Start of Combustion (°ATDC)
HC
em
iss
ion
sin
de
x(g
/kg
fue
l) 1800 rpm 14.8 mg
1800 rpm 9.7 mg
1800 rpm 9.7 mg (Pilot)
1500 rpm 6.8 mg
Figure 5.19: Dependence of gross indicated fuel consumption (top), CO (middle) andHC (bottom) emissions on location of SOC.
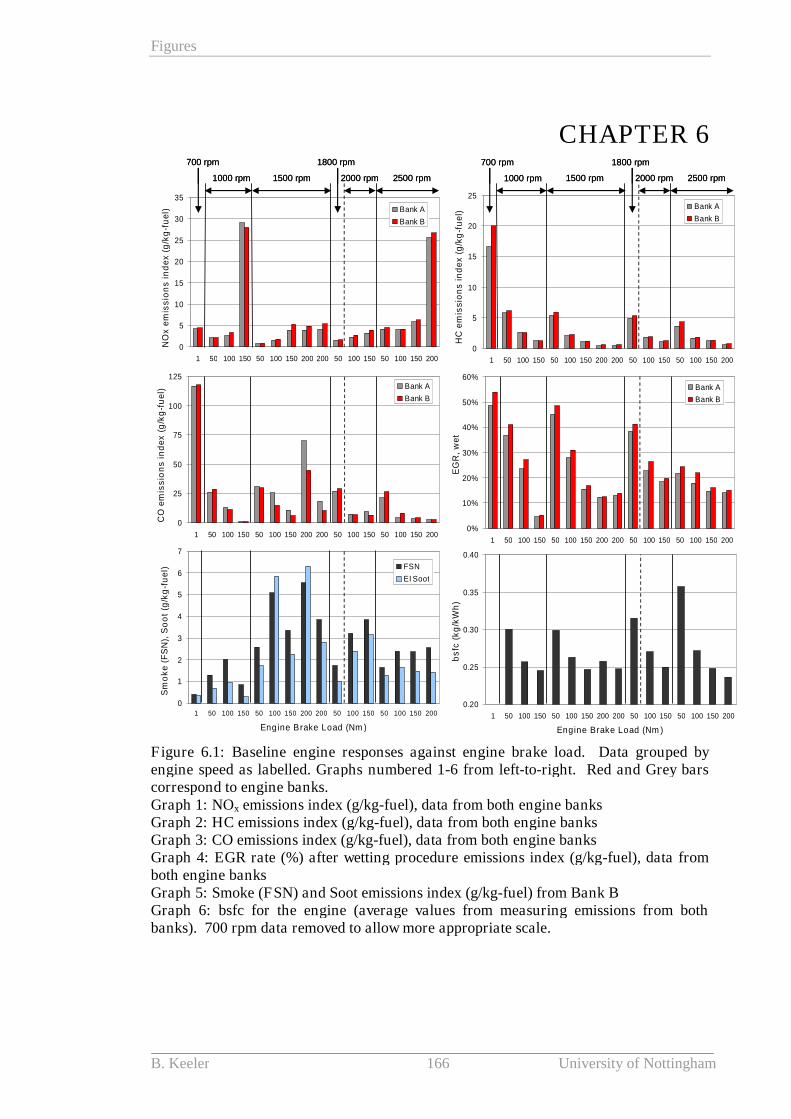
Figures
B. Keeler 166 University of Nottingham
CHAPTER 6
0
5
10
15
20
25
30
35
1 50 100 150 50 100 150 200 200 50 100 150 50 100 150 200
Engine Brake Load (Nm)
NO
xe
mis
sio
ns
ind
ex
(g/k
g-f
ue
l) Bank A
Bank B
0
5
10
15
20
25
1 50 100 150 50 100 150 200 200 50 100 150 50 100 150 200
Engine Brake Load (Nm)
HC
em
iss
ion
sin
de
x(g
/kg
-fu
el)
Bank A
Bank B
0
25
50
75
100
125
1 50 100 150 50 100 150 200 200 50 100 150 50 100 150 200
Engine Brake Load (Nm)
CO
em
iss
ion
sin
de
x(g
/kg
-fu
el)
Bank A
Bank B
.
0
1
2
3
4
5
6
7
1 50 100 150 50 100 150 200 200 50 100 150 50 100 150 200
Engine Brake Load (Nm)
Sm
ok
e(F
SN
),S
oo
t(g
/kg
-fu
el) FSN
EI Soot
0%
10%
20%
30%
40%
50%
60%
1 50 100 150 50 100 150 200 200 50 100 150 50 100 150 200
Engine Brake Load (Nm)
EG
R,
we
t
Bank A
Bank B
1000 rpm 1500 rpm 2500 rpm2000 rpm 1000 rpm 1500 rpm 2500 rpm2000 rpm
700 rpm 1800 rpm 700 rpm 1800 rpm
0.20
0.25
0.30
0.35
0.40
1 50 100 150 50 100 150 200 200 50 100 150 50 100 150 200
Engine Brake Load (Nm)
bs
fc(k
g/k
Wh
)
0
5
10
15
20
25
30
35
1 50 100 150 50 100 150 200 200 50 100 150 50 100 150 200
Engine Brake Load (Nm)
NO
xe
mis
sio
ns
ind
ex
(g/k
g-f
ue
l) Bank A
Bank B
0
5
10
15
20
25
1 50 100 150 50 100 150 200 200 50 100 150 50 100 150 200
Engine Brake Load (Nm)
HC
em
iss
ion
sin
de
x(g
/kg
-fu
el)
Bank A
Bank B
0
25
50
75
100
125
1 50 100 150 50 100 150 200 200 50 100 150 50 100 150 200
Engine Brake Load (Nm)
CO
em
iss
ion
sin
de
x(g
/kg
-fu
el)
Bank A
Bank B
.
0
1
2
3
4
5
6
7
1 50 100 150 50 100 150 200 200 50 100 150 50 100 150 200
Engine Brake Load (Nm)
Sm
ok
e(F
SN
),S
oo
t(g
/kg
-fu
el) FSN
EI Soot
0%
10%
20%
30%
40%
50%
60%
1 50 100 150 50 100 150 200 200 50 100 150 50 100 150 200
Engine Brake Load (Nm)
EG
R,
we
t
Bank A
Bank B
1000 rpm 1500 rpm 2500 rpm2000 rpm 1000 rpm 1500 rpm 2500 rpm2000 rpm
700 rpm 1800 rpm 700 rpm 1800 rpm
0.20
0.25
0.30
0.35
0.40
1 50 100 150 50 100 150 200 200 50 100 150 50 100 150 200
Engine Brake Load (Nm)
bs
fc(k
g/k
Wh
)
Figure 6.1: Baseline engine responses against engine brake load. Data grouped byengine speed as labelled. Graphs numbered 1-6 from left-to-right. Red and Grey barscorrespond to engine banks.Graph 1: NOx emissions index (g/kg-fuel), data from both engine banksGraph 2: HC emissions index (g/kg-fuel), data from both engine banksGraph 3: CO emissions index (g/kg-fuel), data from both engine banksGraph 4: EGR rate (%) after wetting procedure emissions index (g/kg-fuel), data fromboth engine banksGraph 5: Smoke (FSN) and Soot emissions index (g/kg-fuel) from Bank BGraph 6: bsfc for the engine (average values from measuring emissions from bothbanks). 700 rpm data removed to allow more appropriate scale.
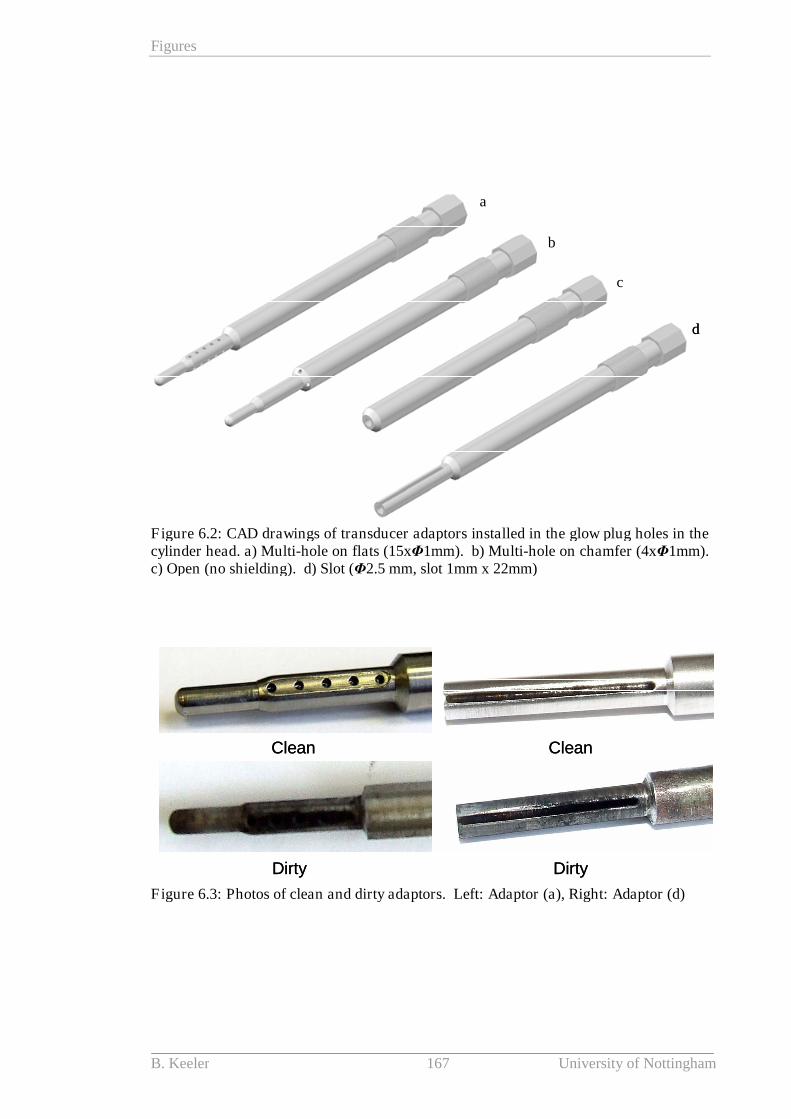
Figures
B. Keeler 167 University of Nottingham
a
b
c
d
a
b
c
d
Figure 6.2: CAD drawings of transducer adaptors installed in the glow plug holes in thecylinder head. a) Multi-hole on flats (15xΦ1mm). b) Multi-hole on chamfer (4xΦ1mm).c) Open (no shielding). d) Slot (Φ2.5 mm, slot 1mm x 22mm)
Clean
Dirty
Clean
Dirty
Clean
Dirty
Clean
Dirty
Figure 6.3: Photos of clean and dirty adaptors. Left: Adaptor (a), Right: Adaptor (d)
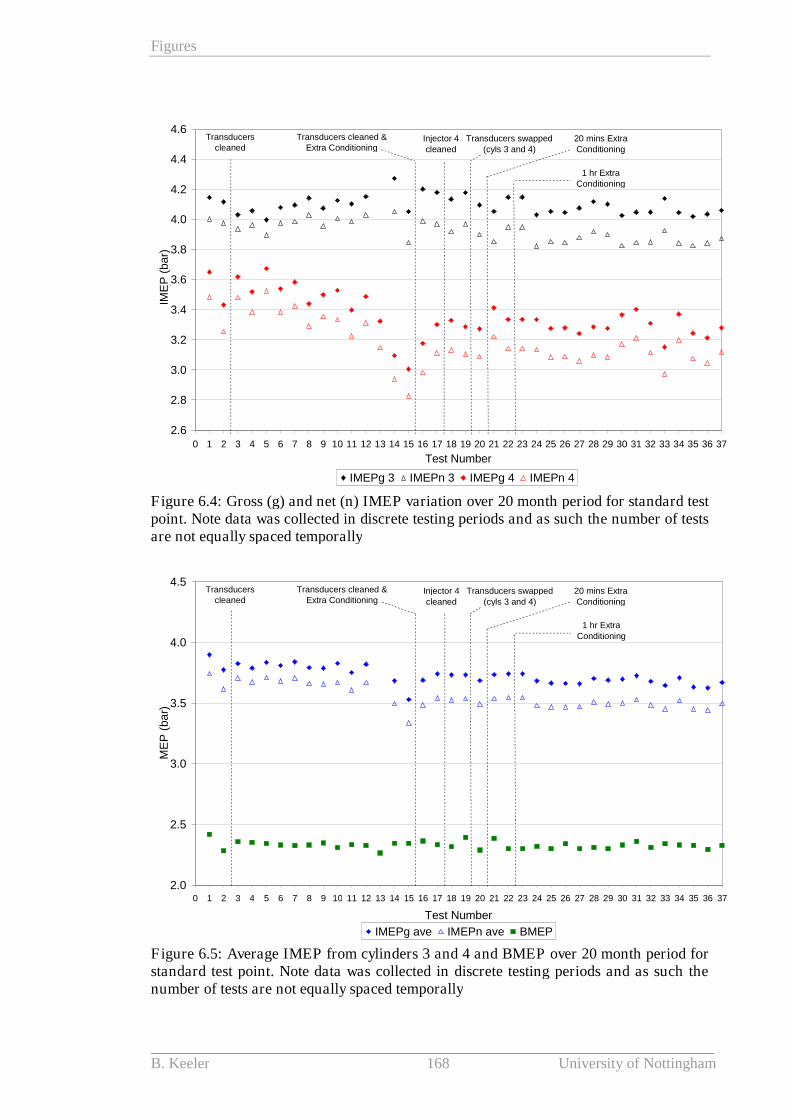
Figures
B. Keeler 168 University of Nottingham
2.6
2.8
3.0
3.2
3.4
3.6
3.8
4.0
4.2
4.4
4.6
0 1 2 3 4 5 6 7 8 9 10 11 12 13 14 15 16 17 18 19 20 21 22 23 24 25 26 27 28 29 30 31 32 33 34 35 36 37
Test Number
IME
P(b
ar)
IMEPg 3 IMEPn 3 IMEPg 4 IMEPn 4
Transducerscleaned
Transducers cleaned &Extra Conditioning
Injector 4cleaned
Transducers swapped(cyls 3 and 4)
1 hr ExtraConditioning
20 mins ExtraConditioning
Figure 6.4: Gross (g) and net (n) IMEP variation over 20 month period for standard testpoint. Note data was collected in discrete testing periods and as such the number of testsare not equally spaced temporally
2.0
2.5
3.0
3.5
4.0
4.5
0 1 2 3 4 5 6 7 8 9 10 11 12 13 14 15 16 17 18 19 20 21 22 23 24 25 26 27 28 29 30 31 32 33 34 35 36 37
Test Number
ME
P(b
ar)
IMEPg ave IMEPn ave BMEP
Transducerscleaned
Transducers cleaned &Extra Conditioning
Injector 4cleaned
Transducers swapped(cyls 3 and 4)
1 hr ExtraConditioning
20 mins ExtraConditioning
Figure 6.5: Average IMEP from cylinders 3 and 4 and BMEP over 20 month period forstandard test point. Note data was collected in discrete testing periods and as such thenumber of tests are not equally spaced temporally
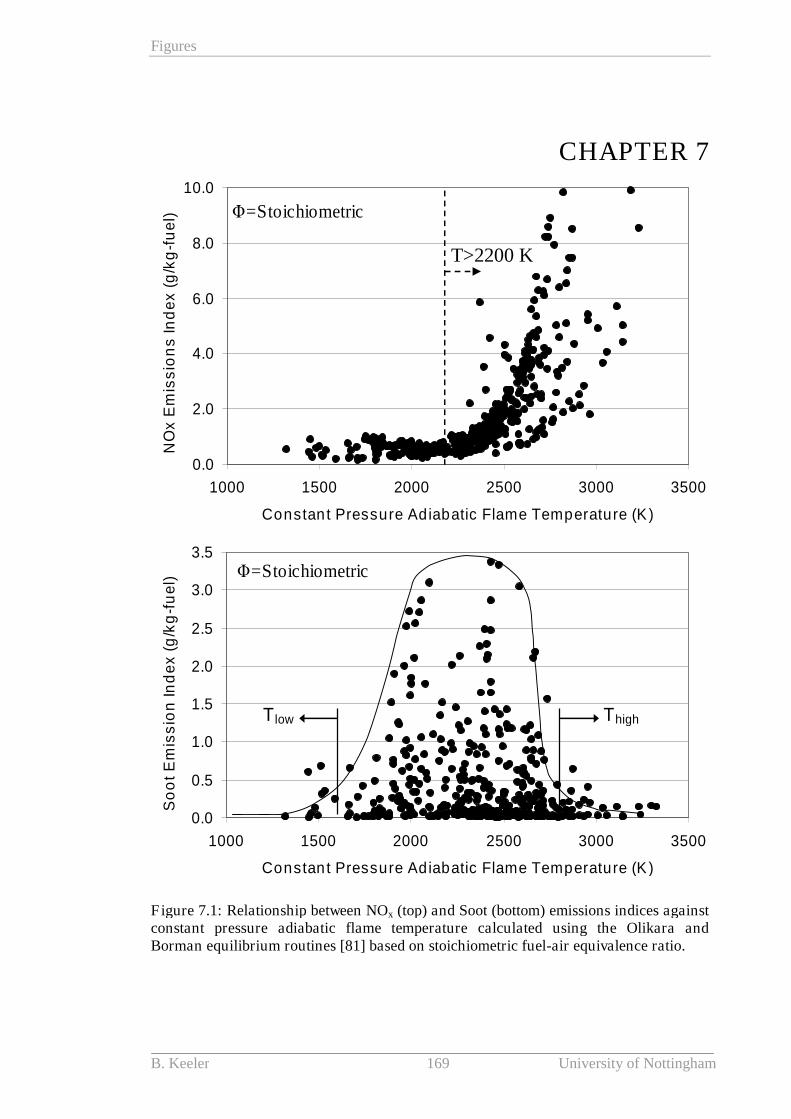
Figures
B. Keeler 169 University of Nottingham
CHAPTER 7
0.0
2.0
4.0
6.0
8.0
10.0
1000 1500 2000 2500 3000 3500
Constant Pressure Adiabatic Flame Temperature (K)
NO
xE
mis
sio
ns
Ind
ex
(g/k
g-f
ue
l) Φ=Stoichiometric
T>2200 K
0.0
0.5
1.0
1.5
2.0
2.5
3.0
3.5
1000 1500 2000 2500 3000 3500
Constant Pressure Adiabatic Flame Temperature (K)
So
ot
Em
iss
ion
Ind
ex
(g/k
g-f
ue
l)
Φ=Stoichiometric
T low Thigh
0.0
2.0
4.0
6.0
8.0
10.0
1000 1500 2000 2500 3000 3500
Constant Pressure Adiabatic Flame Temperature (K)
NO
xE
mis
sio
ns
Ind
ex
(g/k
g-f
ue
l) Φ=Stoichiometric
T>2200 K
0.0
0.5
1.0
1.5
2.0
2.5
3.0
3.5
1000 1500 2000 2500 3000 3500
Constant Pressure Adiabatic Flame Temperature (K)
So
ot
Em
iss
ion
Ind
ex
(g/k
g-f
ue
l)
Φ=Stoichiometric
T low Thigh
Figure 7.1: Relationship between NOx (top) and Soot (bottom) emissions indices againstconstant pressure adiabatic flame temperature calculated using the Olikara andBorman equilibrium routines [81] based on stoichiometric fuel-air equivalence ratio.
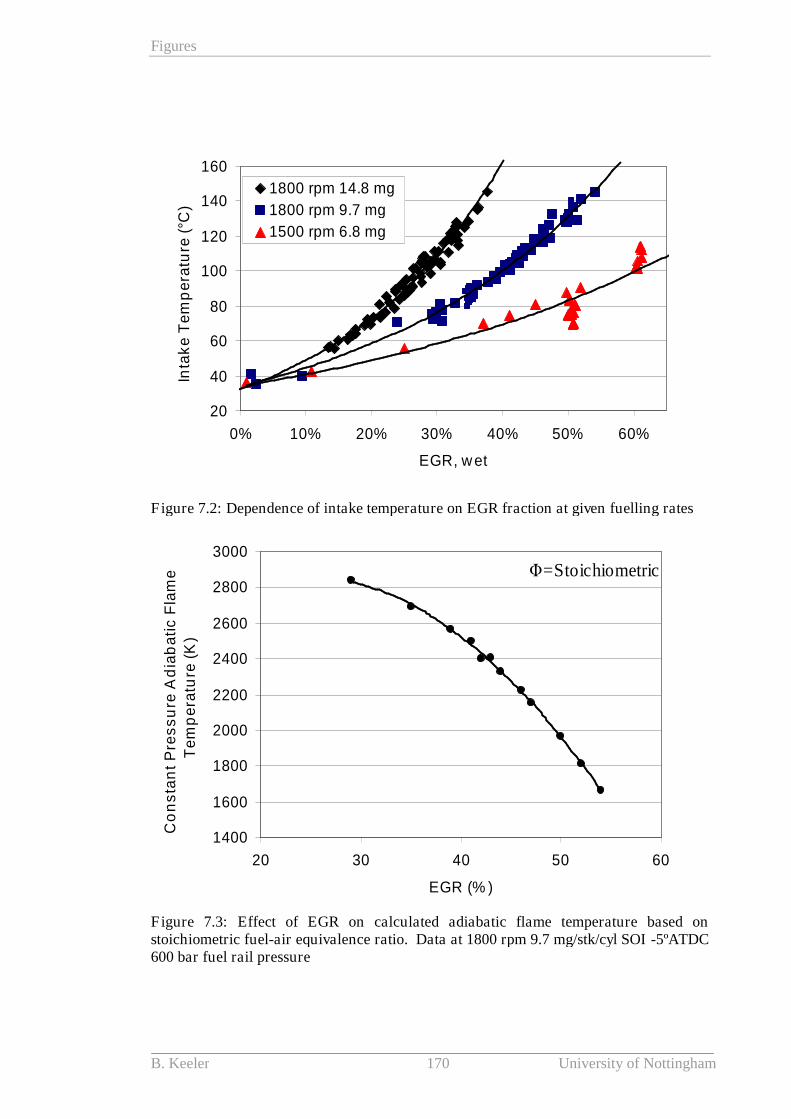
Figures
B. Keeler 170 University of Nottingham
20
40
60
80
100
120
140
160
0% 10% 20% 30% 40% 50% 60%
EGR, wet
Inta
ke
Te
mp
era
ture
(°C
)1800 rpm 14.8 mg
1800 rpm 9.7 mg
1500 rpm 6.8 mg
Figure 7.2: Dependence of intake temperature on EGR fraction at given fuelling rates
1400
1600
1800
2000
2200
2400
2600
2800
3000
20 30 40 50 60
EGR (% )
Co
ns
tan
tP
res
su
reA
dia
ba
tic
Fla
me
Te
mp
era
ture
(K)
Φ=Stoichiometric
Figure 7.3: Effect of EGR on calculated adiabatic flame temperature based onstoichiometric fuel-air equivalence ratio. Data at 1800 rpm 9.7 mg/stk/cyl SOI -5ºATDC600 bar fuel rail pressure
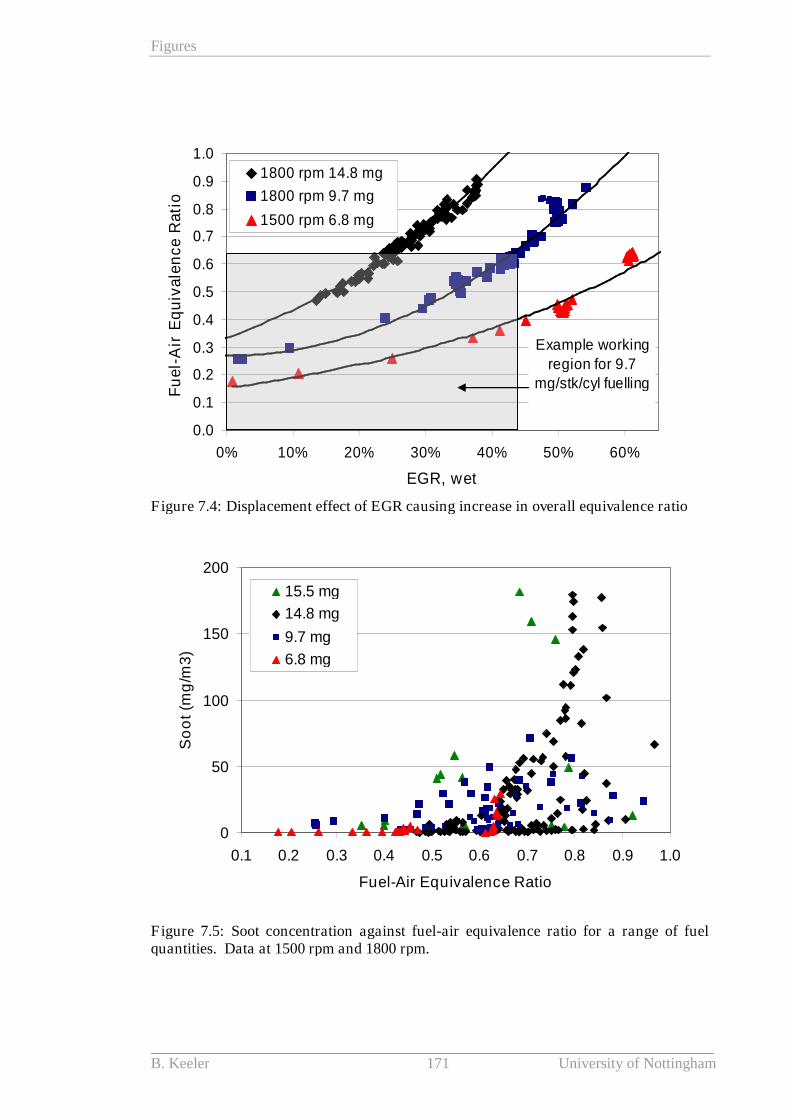
Figures
B. Keeler 171 University of Nottingham
0.0
0.1
0.2
0.3
0.4
0.5
0.6
0.7
0.8
0.9
1.0
0% 10% 20% 30% 40% 50% 60%
EGR, wet
Fu
el-
Air
Eq
uiv
ale
nc
eR
ati
o1800 rpm 14.8 mg
1800 rpm 9.7 mg
1500 rpm 6.8 mg
Example working
region for 9.7mg/stk/cyl fuelling
Figure 7.4: Displacement effect of EGR causing increase in overall equivalence ratio
0
50
100
150
200
0.1 0.2 0.3 0.4 0.5 0.6 0.7 0.8 0.9 1.0
Fuel-Air Equivalence Ratio
So
ot
(mg
/m3
)
15.5 mg
14.8 mg
9.7 mg
6.8 mg
Figure 7.5: Soot concentration against fuel-air equivalence ratio for a range of fuelquantities. Data at 1500 rpm and 1800 rpm.

Figures
B. Keeler 172 University of Nottingham
0.0
0.5
1.0
1.5
2.0
2.5
3.0
0.4 0.5 0.6 0.7 0.8 0.9 1.0 1.1
Fuel-Air Equivalence Ratio
So
ot
em
iss
ion
sin
de
x(g
/kg
fue
l) -1.0°
TDC
+1.2°
+2.5°
+3.5°
Retarded SOI
CO 1.7%
0.0
0.2
0.4
0.6
0.8
1.0
1.2
1.4
1.6
0.2 0.4 0.6 0.8 1.0
Fuel-Air Equivalence Ratio
So
ot
em
iss
ion
sin
de
x(g
/kg
fue
l)
-1.0° -5.0°* -5.0° Pilot -25° Main +1.0°
30% 54%
52%
50%
44%
Figure 7.6: Soot against fuel-air equivalence ratio. Top: 1800 rpm 14.8 mg 600 bar railpressure. Bottom: 1800 rpm 9.7 mg 600 bar rail pressure. Legend entries give the SOI,* indicates intake throttled. Labelled points indicate EGR rate along soot response.
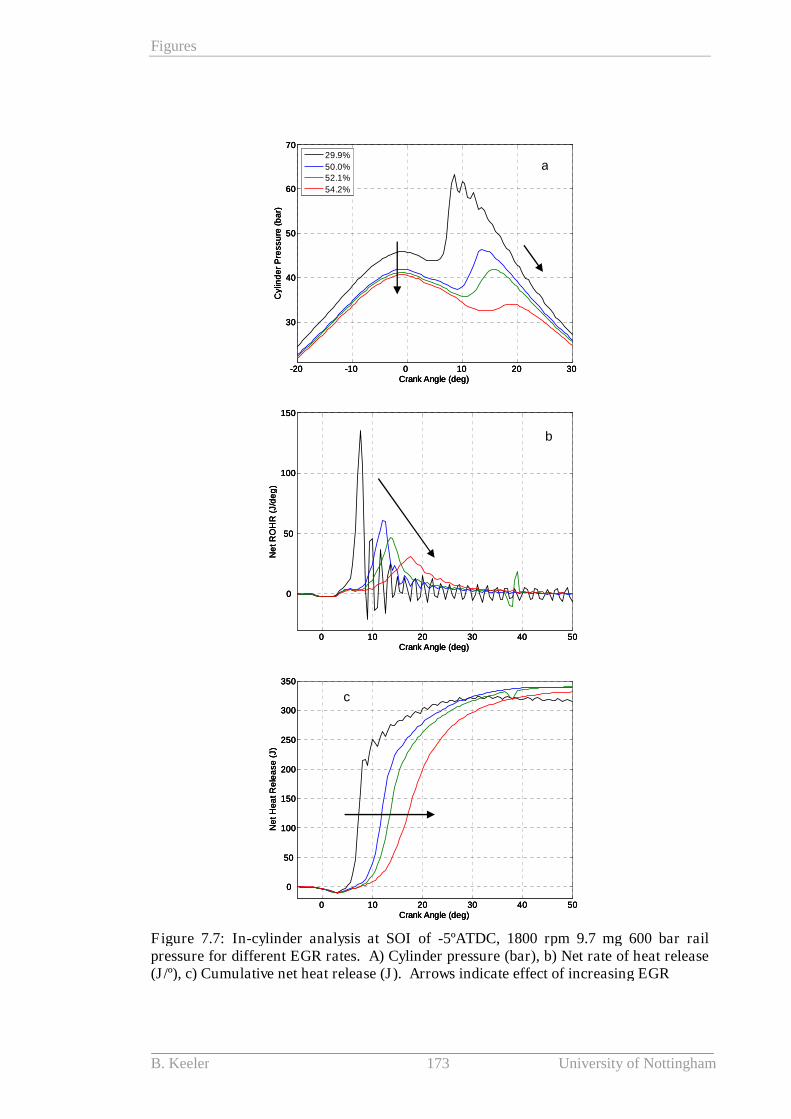
Figures
B. Keeler 173 University of Nottingham
-20 -10 0 10 20 30
30
40
50
60
70
Crank Angle (deg)
Cylin
de
rP
ressu
re(b
ar)
29.9%
50.0%
52.1%
54.2%
a
-20 -10 0 10 20 30
30
40
50
60
70
Crank Angle (deg)
Cylin
de
rP
ressu
re(b
ar)
29.9%
50.0%
52.1%
54.2%
-20 -10 0 10 20 30
30
40
50
60
70
Crank Angle (deg)
Cylin
de
rP
ressu
re(b
ar)
29.9%
50.0%
52.1%
54.2%
a
0 10 20 30 40 50
0
50
100
150
Crank Angle (deg)
Ne
tR
OH
R(J
/de
g)
b
0 10 20 30 40 50
0
50
100
150
Crank Angle (deg)
Ne
tR
OH
R(J
/de
g)
0 10 20 30 40 50
0
50
100
150
Crank Angle (deg)
Ne
tR
OH
R(J
/de
g)
b
0 10 20 30 40 50
0
50
100
150
200
250
300
350
Crank Angle (deg)
Ne
tH
ea
tR
ele
ase
(J)
c
0 10 20 30 40 50
0
50
100
150
200
250
300
350
Crank Angle (deg)
Ne
tH
ea
tR
ele
ase
(J)
0 10 20 30 40 50
0
50
100
150
200
250
300
350
Crank Angle (deg)
Ne
tH
ea
tR
ele
ase
(J)
c
Figure 7.7: In-cylinder analysis at SOI of -5ºATDC, 1800 rpm 9.7 mg 600 bar railpressure for different EGR rates. A) Cylinder pressure (bar), b) Net rate of heat release(J/º), c) Cumulative net heat release (J). Arrows indicate effect of increasing EGR
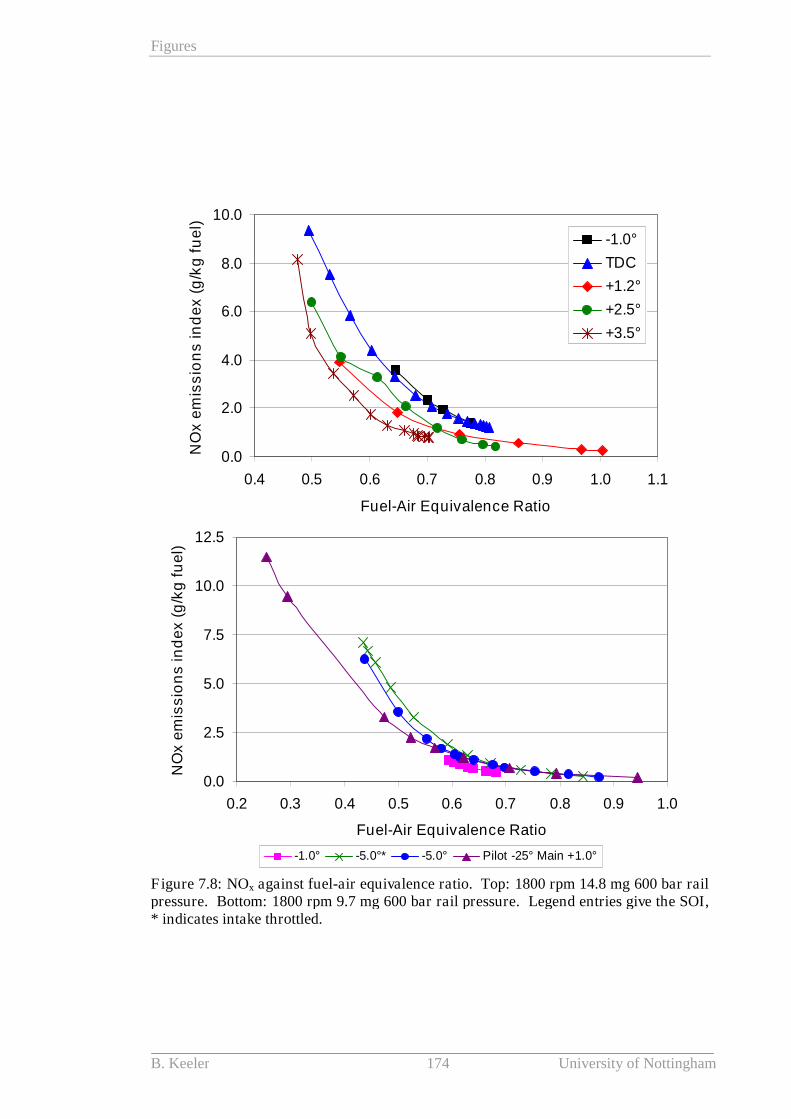
Figures
B. Keeler 174 University of Nottingham
0.0
2.0
4.0
6.0
8.0
10.0
0.4 0.5 0.6 0.7 0.8 0.9 1.0 1.1
Fuel-Air Equivalence Ratio
NO
xe
mis
sio
ns
ind
ex
(g/k
gfu
el)
-1.0°
TDC
+1.2°
+2.5°
+3.5°
0.0
2.5
5.0
7.5
10.0
12.5
0.2 0.3 0.4 0.5 0.6 0.7 0.8 0.9 1.0
Fuel-Air Equivalence Ratio
NO
xe
mis
sio
ns
ind
ex
(g/k
gfu
el)
-1.0° -5.0°* -5.0° Pilot -25° Main +1.0°
0.0
2.0
4.0
6.0
8.0
10.0
0.4 0.5 0.6 0.7 0.8 0.9 1.0 1.1
Fuel-Air Equivalence Ratio
NO
xe
mis
sio
ns
ind
ex
(g/k
gfu
el)
-1.0°
TDC
+1.2°
+2.5°
+3.5°
0.0
2.5
5.0
7.5
10.0
12.5
0.2 0.3 0.4 0.5 0.6 0.7 0.8 0.9 1.0
Fuel-Air Equivalence Ratio
NO
xe
mis
sio
ns
ind
ex
(g/k
gfu
el)
-1.0° -5.0°* -5.0° Pilot -25° Main +1.0°
Figure 7.8: NOx against fuel-air equivalence ratio. Top: 1800 rpm 14.8 mg 600 bar railpressure. Bottom: 1800 rpm 9.7 mg 600 bar rail pressure. Legend entries give the SOI,* indicates intake throttled.
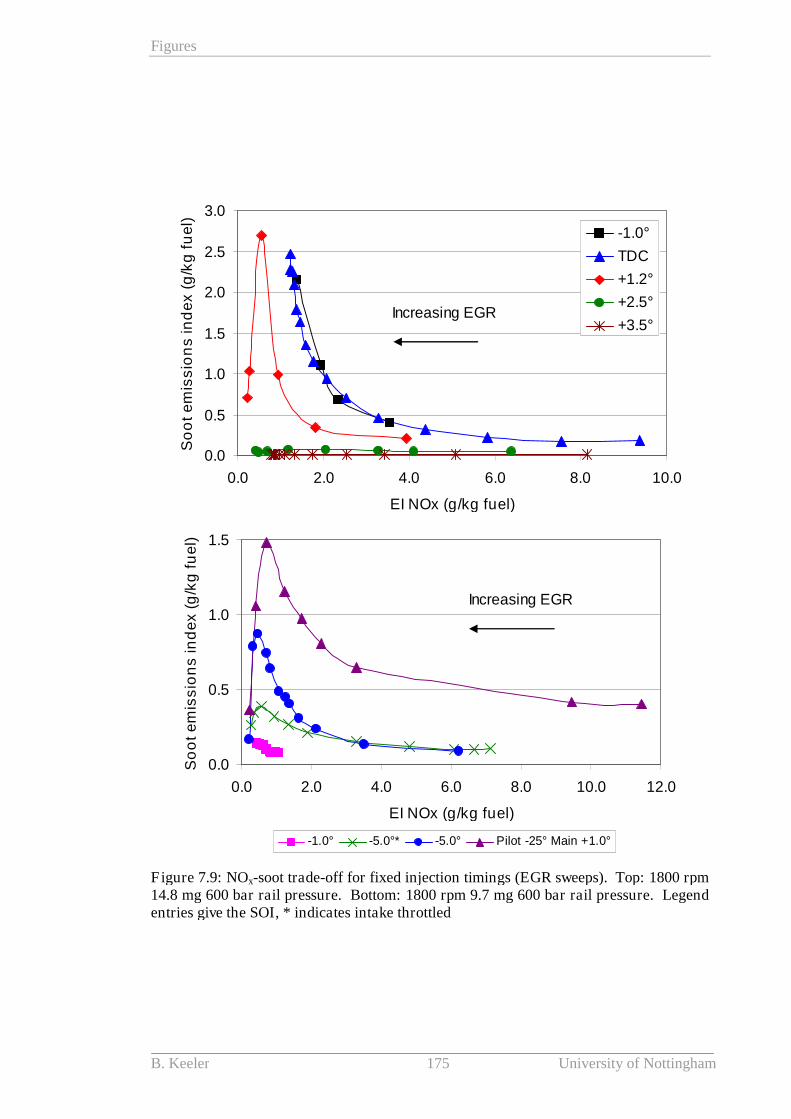
Figures
B. Keeler 175 University of Nottingham
0.0
0.5
1.0
1.5
0.0 2.0 4.0 6.0 8.0 10.0 12.0
EI NOx (g/kg fuel)
So
ot
em
iss
ion
sin
de
x(g
/kg
fue
l)
-1.0° -5.0°* -5.0° Pilot -25° Main +1.0°
Increasing EGR
0.0
0.5
1.0
1.5
2.0
2.5
3.0
0.0 2.0 4.0 6.0 8.0 10.0
EI NOx (g/kg fuel)
So
ot
em
iss
ion
sin
de
x(g
/kg
fue
l)
-1.0°
TDC
+1.2°
+2.5°
+3.5°Increasing EGR
0.0
0.5
1.0
1.5
0.0 2.0 4.0 6.0 8.0 10.0 12.0
EI NOx (g/kg fuel)
So
ot
em
iss
ion
sin
de
x(g
/kg
fue
l)
-1.0° -5.0°* -5.0° Pilot -25° Main +1.0°
Increasing EGR
0.0
0.5
1.0
1.5
2.0
2.5
3.0
0.0 2.0 4.0 6.0 8.0 10.0
EI NOx (g/kg fuel)
So
ot
em
iss
ion
sin
de
x(g
/kg
fue
l)
-1.0°
TDC
+1.2°
+2.5°
+3.5°Increasing EGR
Figure 7.9: NOx-soot trade-off for fixed injection timings (EGR sweeps). Top: 1800 rpm14.8 mg 600 bar rail pressure. Bottom: 1800 rpm 9.7 mg 600 bar rail pressure. Legendentries give the SOI, * indicates intake throttled
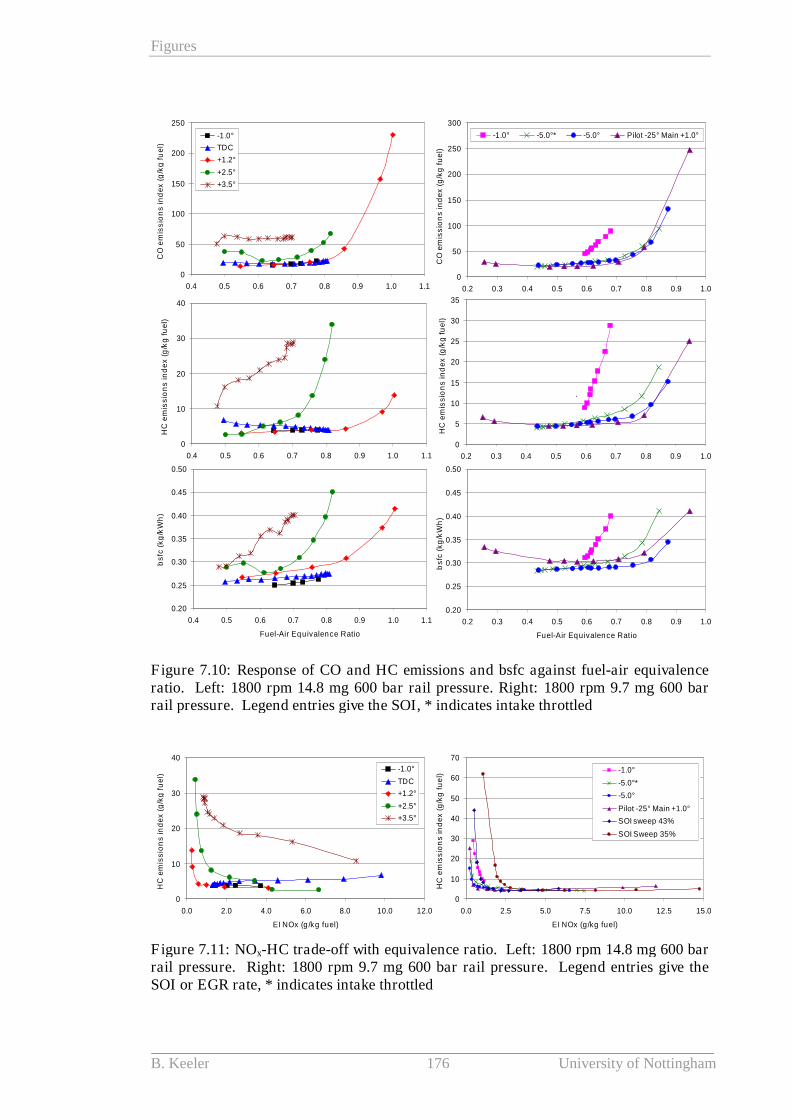
Figures
B. Keeler 176 University of Nottingham
0
50
100
150
200
250
0.4 0.5 0.6 0.7 0.8 0.9 1.0 1.1
Fuel-Air Equivalence Ratio
CO
em
iss
ion
sin
de
x(g
/kg
fue
l)
-1.0°
TDC
+1.2°
+2.5°
+3.5°
0
10
20
30
40
0.4 0.5 0.6 0.7 0.8 0.9 1.0 1.1
Fuel-Air Equivalence Ratio
HC
em
iss
ion
sin
de
x(g
/kg
fue
l)
0
50
100
150
200
250
300
0.2 0.3 0.4 0.5 0.6 0.7 0.8 0.9 1.0
Fuel-Air Equivalence Ratio
CO
em
iss
ion
sin
de
x(g
/kg
fue
l)
-1.0° -5.0°* -5.0° Pilot -25° Main +1.0°
0
5
10
15
20
25
30
35
0.2 0.3 0.4 0.5 0.6 0.7 0.8 0.9 1.0
Fuel-Air Equivalence Ratio
HC
em
iss
ion
sin
de
x(g
/kg
fue
l)
.
0.20
0.25
0.30
0.35
0.40
0.45
0.50
0.2 0.3 0.4 0.5 0.6 0.7 0.8 0.9 1.0
Fuel-Air Equivalence Ratio
bs
fc(k
g/k
Wh
)
0.20
0.25
0.30
0.35
0.40
0.45
0.50
0.4 0.5 0.6 0.7 0.8 0.9 1.0 1.1
Fuel-Air Equivalence Ratio
bs
fc(k
g/k
Wh
)
0
50
100
150
200
250
0.4 0.5 0.6 0.7 0.8 0.9 1.0 1.1
Fuel-Air Equivalence Ratio
CO
em
iss
ion
sin
de
x(g
/kg
fue
l)
-1.0°
TDC
+1.2°
+2.5°
+3.5°
0
10
20
30
40
0.4 0.5 0.6 0.7 0.8 0.9 1.0 1.1
Fuel-Air Equivalence Ratio
HC
em
iss
ion
sin
de
x(g
/kg
fue
l)
0
50
100
150
200
250
300
0.2 0.3 0.4 0.5 0.6 0.7 0.8 0.9 1.0
Fuel-Air Equivalence Ratio
CO
em
iss
ion
sin
de
x(g
/kg
fue
l)
-1.0° -5.0°* -5.0° Pilot -25° Main +1.0°
0
5
10
15
20
25
30
35
0.2 0.3 0.4 0.5 0.6 0.7 0.8 0.9 1.0
Fuel-Air Equivalence Ratio
HC
em
iss
ion
sin
de
x(g
/kg
fue
l)
.
0.20
0.25
0.30
0.35
0.40
0.45
0.50
0.2 0.3 0.4 0.5 0.6 0.7 0.8 0.9 1.0
Fuel-Air Equivalence Ratio
bs
fc(k
g/k
Wh
)
0.20
0.25
0.30
0.35
0.40
0.45
0.50
0.4 0.5 0.6 0.7 0.8 0.9 1.0 1.1
Fuel-Air Equivalence Ratio
bs
fc(k
g/k
Wh
)
Figure 7.10: Response of CO and HC emissions and bsfc against fuel-air equivalenceratio. Left: 1800 rpm 14.8 mg 600 bar rail pressure. Right: 1800 rpm 9.7 mg 600 barrail pressure. Legend entries give the SOI, * indicates intake throttled
0
10
20
30
40
0.0 2.0 4.0 6.0 8.0 10.0 12.0
EI NOx (g/kg fuel)
HC
em
iss
ion
sin
de
x(g
/kg
fue
l)
-1.0°
TDC
+1.2°
+2.5°
+3.5°
0
10
20
30
40
50
60
70
0.0 2.5 5.0 7.5 10.0 12.5 15.0
EI NOx (g/kg fuel)
HC
em
iss
ion
sin
de
x(g
/kg
fue
l)
-1.0°
-5.0°*
-5.0°
Pilot -25° Main +1.0°
SOI sweep 43%
SOI Sweep 35%
0
10
20
30
40
0.0 2.0 4.0 6.0 8.0 10.0 12.0
EI NOx (g/kg fuel)
HC
em
iss
ion
sin
de
x(g
/kg
fue
l)
-1.0°
TDC
+1.2°
+2.5°
+3.5°
0
10
20
30
40
50
60
70
0.0 2.5 5.0 7.5 10.0 12.5 15.0
EI NOx (g/kg fuel)
HC
em
iss
ion
sin
de
x(g
/kg
fue
l)
-1.0°
-5.0°*
-5.0°
Pilot -25° Main +1.0°
SOI sweep 43%
SOI Sweep 35%
Figure 7.11: NOx-HC trade-off with equivalence ratio. Left: 1800 rpm 14.8 mg 600 barrail pressure. Right: 1800 rpm 9.7 mg 600 bar rail pressure. Legend entries give theSOI or EGR rate, * indicates intake throttled
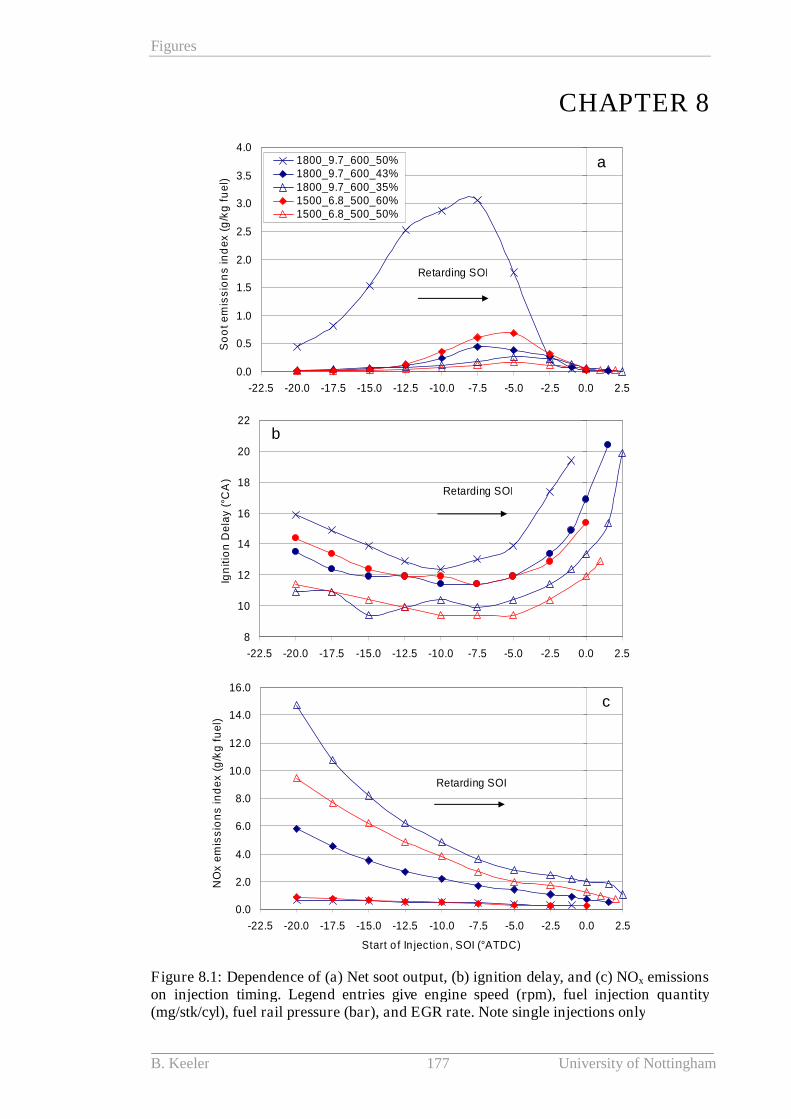
Figures
B. Keeler 177 University of Nottingham
CHAPTER 8
0.0
0.5
1.0
1.5
2.0
2.5
3.0
3.5
4.0
-22.5 -20.0 -17.5 -15.0 -12.5 -10.0 -7.5 -5.0 -2.5 0.0 2.5
Start of Injection, SOI (°ATDC)
So
ot
em
iss
ion
sin
de
x(g
/kg
fue
l)
1800_9.7_600_50%1800_9.7_600_43%1800_9.7_600_35%1500_6.8_500_60%1500_6.8_500_50%
Retarding SOI
8
10
12
14
16
18
20
22
-22.5 -20.0 -17.5 -15.0 -12.5 -10.0 -7.5 -5.0 -2.5 0.0 2.5
Start of Injection, SOI (°ATDC)
Ign
itio
nD
ela
y(°
CA
)
Retarding SOI
0.0
2.0
4.0
6.0
8.0
10.0
12.0
14.0
16.0
-22.5 -20.0 -17.5 -15.0 -12.5 -10.0 -7.5 -5.0 -2.5 0.0 2.5
Start of Injection, SOI (°ATDC)
NO
xe
mis
sio
ns
ind
ex
(g/k
gfu
el)
Retarding SOI
a
b
c
0.0
0.5
1.0
1.5
2.0
2.5
3.0
3.5
4.0
-22.5 -20.0 -17.5 -15.0 -12.5 -10.0 -7.5 -5.0 -2.5 0.0 2.5
Start of Injection, SOI (°ATDC)
So
ot
em
iss
ion
sin
de
x(g
/kg
fue
l)
1800_9.7_600_50%1800_9.7_600_43%1800_9.7_600_35%1500_6.8_500_60%1500_6.8_500_50%
Retarding SOI
8
10
12
14
16
18
20
22
-22.5 -20.0 -17.5 -15.0 -12.5 -10.0 -7.5 -5.0 -2.5 0.0 2.5
Start of Injection, SOI (°ATDC)
Ign
itio
nD
ela
y(°
CA
)
Retarding SOI
0.0
2.0
4.0
6.0
8.0
10.0
12.0
14.0
16.0
-22.5 -20.0 -17.5 -15.0 -12.5 -10.0 -7.5 -5.0 -2.5 0.0 2.5
Start of Injection, SOI (°ATDC)
NO
xe
mis
sio
ns
ind
ex
(g/k
gfu
el)
Retarding SOI
a
b
c
Figure 8.1: Dependence of (a) Net soot output, (b) ignition delay, and (c) NOx emissionson injection timing. Legend entries give engine speed (rpm), fuel injection quantity(mg/stk/cyl), fuel rail pressure (bar), and EGR rate. Note single injections only
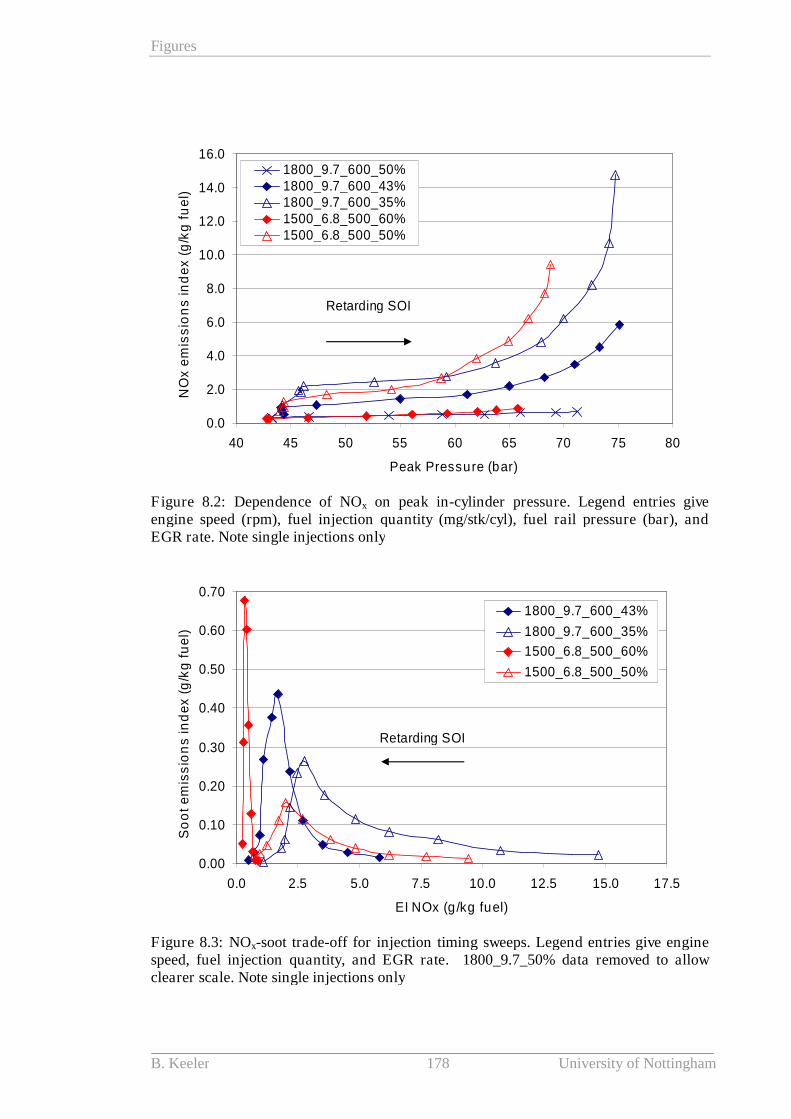
Figures
B. Keeler 178 University of Nottingham
0.0
2.0
4.0
6.0
8.0
10.0
12.0
14.0
16.0
40 45 50 55 60 65 70 75 80
Peak Pressure (bar)
NO
xe
mis
sio
ns
ind
ex
(g/k
gfu
el)
1800_9.7_600_50%1800_9.7_600_43%1800_9.7_600_35%1500_6.8_500_60%1500_6.8_500_50%
Retarding SOI
Figure 8.2: Dependence of NOx on peak in-cylinder pressure. Legend entries giveengine speed (rpm), fuel injection quantity (mg/stk/cyl), fuel rail pressure (bar), andEGR rate. Note single injections only
0.00
0.10
0.20
0.30
0.40
0.50
0.60
0.70
0.0 2.5 5.0 7.5 10.0 12.5 15.0 17.5
EI NOx (g/kg fuel)
So
ot
em
iss
ion
sin
de
x(g
/kg
fue
l)
1800_9.7_600_43%
1800_9.7_600_35%
1500_6.8_500_60%
1500_6.8_500_50%
Retarding SOI
Figure 8.3: NOx-soot trade-off for injection timing sweeps. Legend entries give enginespeed, fuel injection quantity, and EGR rate. 1800_9.7_50% data removed to allowclearer scale. Note single injections only
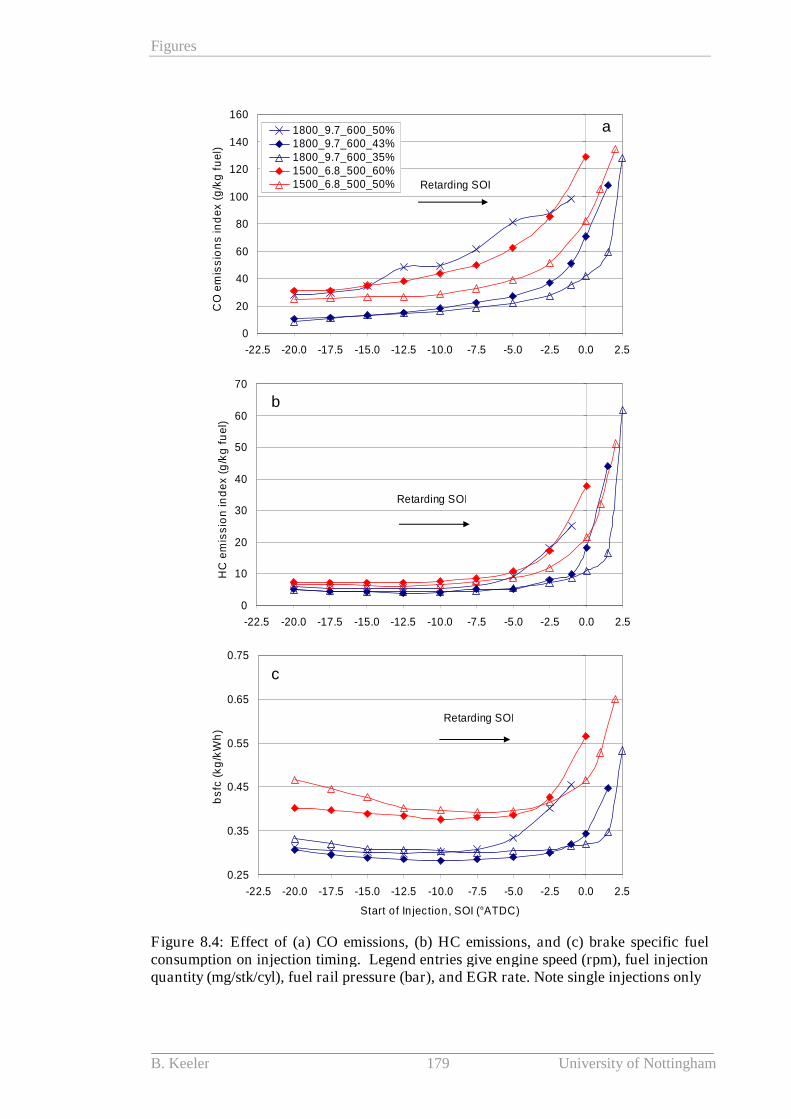
Figures
B. Keeler 179 University of Nottingham
0
20
40
60
80
100
120
140
160
-22.5 -20.0 -17.5 -15.0 -12.5 -10.0 -7.5 -5.0 -2.5 0.0 2.5
Start of Injection, SOI (°ATDC)
CO
em
iss
ion
sin
de
x(g
/kg
fue
l)
1800_9.7_600_50%1800_9.7_600_43%1800_9.7_600_35%1500_6.8_500_60%1500_6.8_500_50% Retarding SOI
0
10
20
30
40
50
60
70
-22.5 -20.0 -17.5 -15.0 -12.5 -10.0 -7.5 -5.0 -2.5 0.0 2.5
Start of Injection, SOI (°ATDC)
HC
em
iss
ion
ind
ex
(g/k
gfu
el)
Retarding SOI
0.25
0.35
0.45
0.55
0.65
0.75
-22.5 -20.0 -17.5 -15.0 -12.5 -10.0 -7.5 -5.0 -2.5 0.0 2.5
Start of Injection, SOI (°ATDC)
bs
fc(k
g/k
Wh
)
Retarding SOI
a
b
c
0
20
40
60
80
100
120
140
160
-22.5 -20.0 -17.5 -15.0 -12.5 -10.0 -7.5 -5.0 -2.5 0.0 2.5
Start of Injection, SOI (°ATDC)
CO
em
iss
ion
sin
de
x(g
/kg
fue
l)
1800_9.7_600_50%1800_9.7_600_43%1800_9.7_600_35%1500_6.8_500_60%1500_6.8_500_50% Retarding SOI
0
10
20
30
40
50
60
70
-22.5 -20.0 -17.5 -15.0 -12.5 -10.0 -7.5 -5.0 -2.5 0.0 2.5
Start of Injection, SOI (°ATDC)
HC
em
iss
ion
ind
ex
(g/k
gfu
el)
Retarding SOI
0.25
0.35
0.45
0.55
0.65
0.75
-22.5 -20.0 -17.5 -15.0 -12.5 -10.0 -7.5 -5.0 -2.5 0.0 2.5
Start of Injection, SOI (°ATDC)
bs
fc(k
g/k
Wh
)
Retarding SOI
a
b
c
Figure 8.4: Effect of (a) CO emissions, (b) HC emissions, and (c) brake specific fuelconsumption on injection timing. Legend entries give engine speed (rpm), fuel injectionquantity (mg/stk/cyl), fuel rail pressure (bar), and EGR rate. Note single injections only
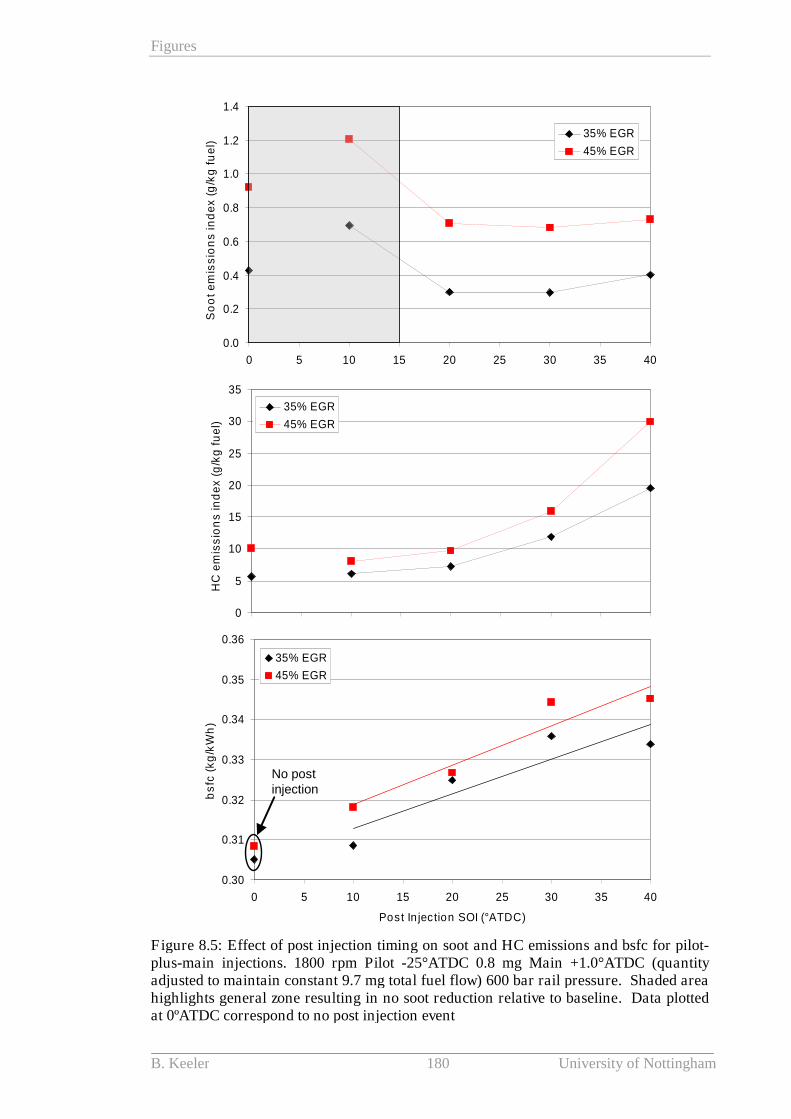
Figures
B. Keeler 180 University of Nottingham
0.0
0.2
0.4
0.6
0.8
1.0
1.2
1.4
0 5 10 15 20 25 30 35 40
Post Injection SOI (°ATDC)
So
ot
em
iss
ion
sin
de
x(g
/kg
fue
l)
35% EGR
45% EGR
0
5
10
15
20
25
30
35
0 5 10 15 20 25 30 35 40
Post Injection SOI (°ATDC)
HC
em
iss
ion
sin
de
x(g
/kg
fue
l)
35% EGR
45% EGR
0.30
0.31
0.32
0.33
0.34
0.35
0.36
0 5 10 15 20 25 30 35 40
Post Injection SOI (°ATDC)
bs
fc(k
g/k
Wh
)
35% EGR
45% EGR
No postinjection
Figure 8.5: Effect of post injection timing on soot and HC emissions and bsfc for pilot-plus-main injections. 1800 rpm Pilot -25°ATDC 0.8 mg Main +1.0°ATDC (quantityadjusted to maintain constant 9.7 mg total fuel flow) 600 bar rail pressure. Shaded areahighlights general zone resulting in no soot reduction relative to baseline. Data plottedat 0ºATDC correspond to no post injection event
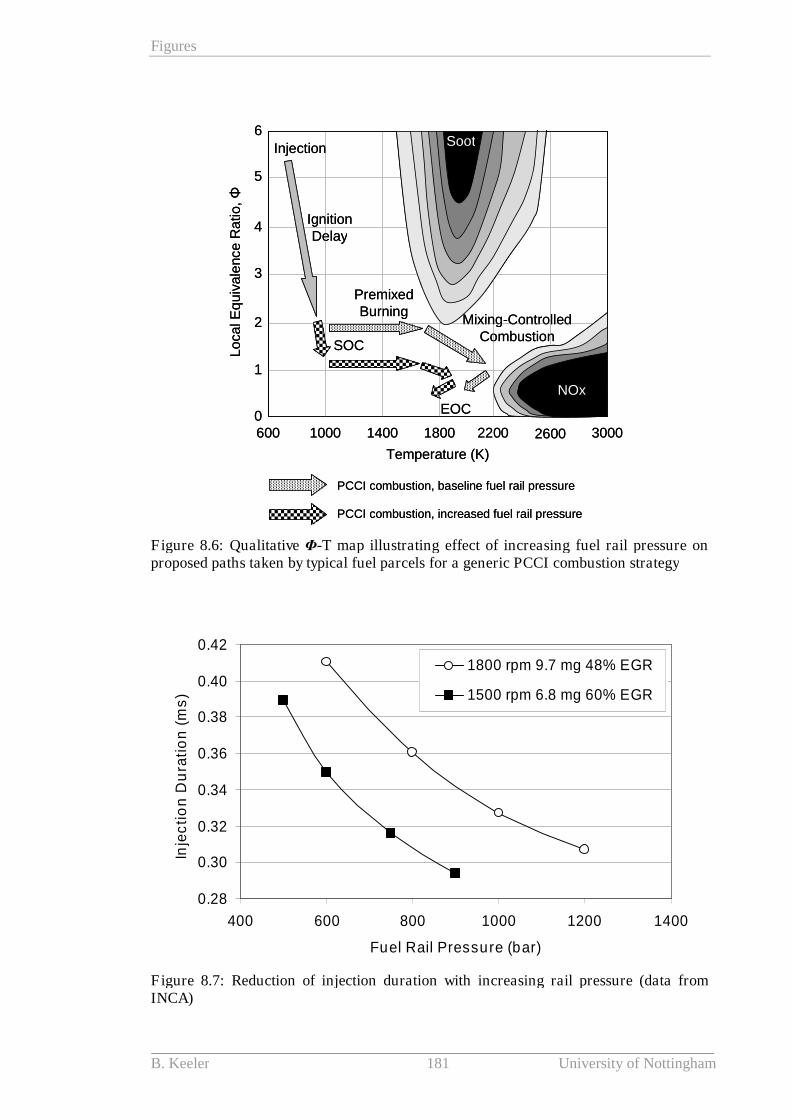
Figures
B. Keeler 181 University of Nottingham
Temperature (K)
600 1400 1800 2200 2600 300010000
1
2
3
4
5
6
LocalE
quiv
ale
nce
Ratio,Φ
NOx
SootInjection
IgnitionDelay
PremixedBurning
Mixing-ControlledCombustion
EOC
SOC
PCCI combustion, increased fuel rail pressure
PCCI combustion, baseline fuel rail pressure
Temperature (K)
600 1400 1800 2200 2600 300010000
1
2
3
4
5
6
LocalE
quiv
ale
nce
Ratio,Φ
NOx
SootInjection
IgnitionDelay
PremixedBurning
Mixing-ControlledCombustion
EOC
SOC
PCCI combustion, increased fuel rail pressure
PCCI combustion, baseline fuel rail pressure
Figure 8.6: Qualitative Φ-T map illustrating effect of increasing fuel rail pressure onproposed paths taken by typical fuel parcels for a generic PCCI combustion strategy
0.28
0.30
0.32
0.34
0.36
0.38
0.40
0.42
400 600 800 1000 1200 1400
Fuel Rail Pressure (bar)
Inje
cti
on
Du
rati
on
(ms
)
1800 rpm 9.7 mg 48% EGR
1500 rpm 6.8 mg 60% EGR
Figure 8.7: Reduction of injection duration with increasing rail pressure (data fromINCA)

Figures
B. Keeler 182 University of Nottingham
-20 -10 0 10 20 30
30
40
50
60
70
80
Crank Angle (deg)
Cylin
de
rP
ressu
re(b
ar)
600 bar
800 bar
1000 bar
1200 bar
a
-20 -10 0 10 20 30
30
40
50
60
70
80
Crank Angle (deg)
Cylin
de
rP
ressu
re(b
ar)
600 bar
800 bar
1000 bar
1200 bar
a
-20 -10 0 10 20 30
0
25
50
75
100
125
Crank Angle (deg)
Ne
tR
OH
R(J
/de
g)
Ringing
b
-20 -10 0 10 20 30
0
25
50
75
100
125
Crank Angle (deg)
Ne
tR
OH
R(J
/de
g)
Ringing
b
-20 -10 0 10 20 30
0
50
100
150
200
250
300
Crank Angle (deg)
Ne
tH
ea
tR
ele
ase
(J)
c
-20 -10 0 10 20 30
0
50
100
150
200
250
300
Crank Angle (deg)
Ne
tH
ea
tR
ele
ase
(J)
c
Figure 8.8: In-cylinder analysis at SOI of -17.5ºATDC, 1800 rpm 9.7 mg EGR 48% a)Cylinder Pressure (bar), b) Net rate of heat release (J/º), c) Cumulative net heat release(J). Arrows indicate effect on combustion characteristics with increasing rail pressure.
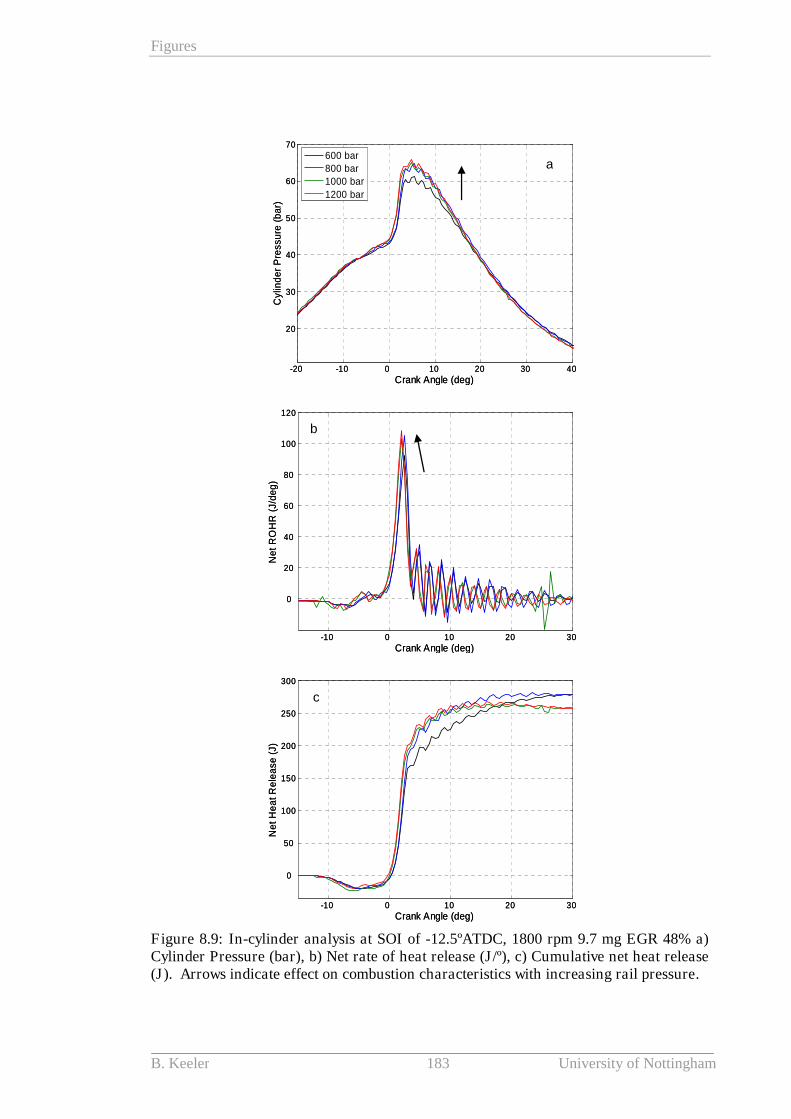
Figures
B. Keeler 183 University of Nottingham
-20 -10 0 10 20 30 40
20
30
40
50
60
70
Crank Angle (deg)
Cylin
de
rP
ressu
re(b
ar)
600 bar
800 bar
1000 bar
1200 bar
a
-20 -10 0 10 20 30 40
20
30
40
50
60
70
Crank Angle (deg)
Cylin
de
rP
ressu
re(b
ar)
600 bar
800 bar
1000 bar
1200 bar
a
-10 0 10 20 30
0
20
40
60
80
100
120
Crank Angle (deg)
Ne
tR
OH
R(J
/de
g)
b
-10 0 10 20 30
0
20
40
60
80
100
120
Crank Angle (deg)
Ne
tR
OH
R(J
/de
g)
b
-10 0 10 20 30
0
50
100
150
200
250
300
Crank Angle (deg)
Ne
tH
ea
tR
ele
ase
(J)
c
-10 0 10 20 30
0
50
100
150
200
250
300
Crank Angle (deg)
Ne
tH
ea
tR
ele
ase
(J)
c
Figure 8.9: In-cylinder analysis at SOI of -12.5ºATDC, 1800 rpm 9.7 mg EGR 48% a)Cylinder Pressure (bar), b) Net rate of heat release (J/º), c) Cumulative net heat release(J). Arrows indicate effect on combustion characteristics with increasing rail pressure.
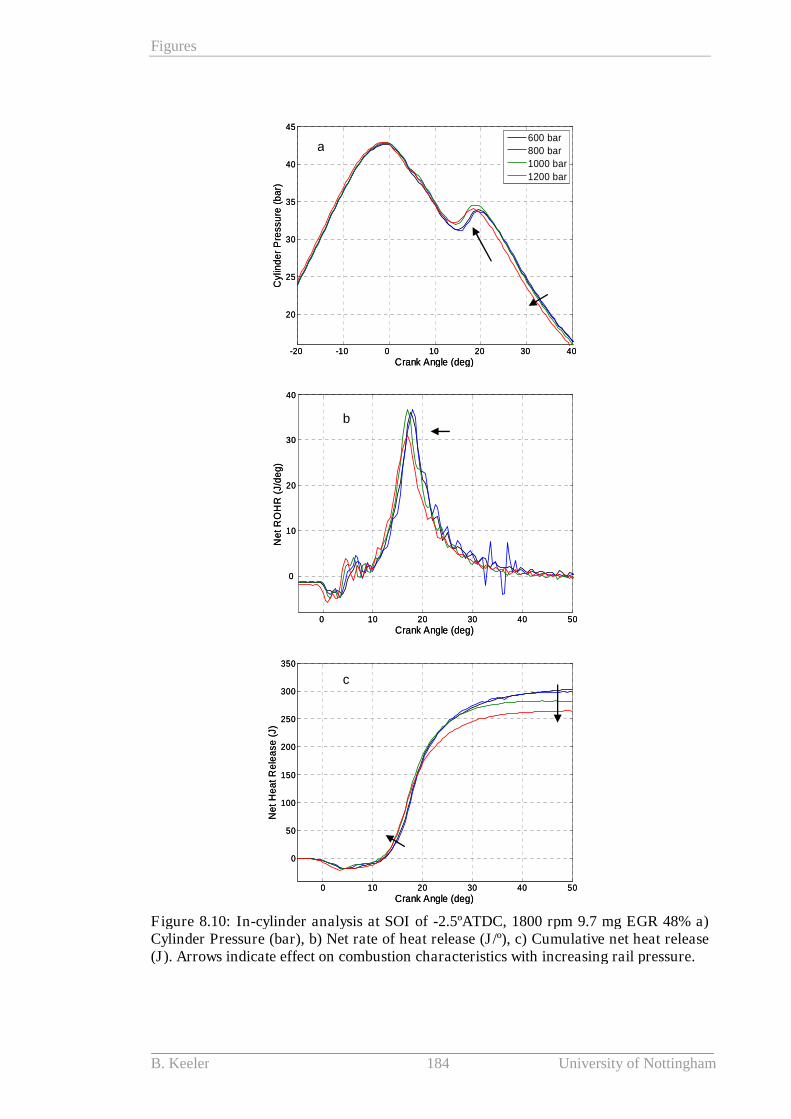
Figures
B. Keeler 184 University of Nottingham
-20 -10 0 10 20 30 40
20
25
30
35
40
45
Crank Angle (deg)
Cylin
de
rP
ressu
re(b
ar)
600 bar
800 bar
1000 bar
1200 bar
a
-20 -10 0 10 20 30 40
20
25
30
35
40
45
Crank Angle (deg)
Cylin
de
rP
ressu
re(b
ar)
600 bar
800 bar
1000 bar
1200 bar
a
0 10 20 30 40 50
0
10
20
30
40
Crank Angle (deg)
Ne
tR
OH
R(J
/de
g)
b
0 10 20 30 40 50
0
10
20
30
40
Crank Angle (deg)
Ne
tR
OH
R(J
/de
g)
b
0 10 20 30 40 50
0
50
100
150
200
250
300
350
Crank Angle (deg)
Ne
tH
ea
tR
ele
ase
(J)
c
0 10 20 30 40 50
0
50
100
150
200
250
300
350
Crank Angle (deg)
Ne
tH
ea
tR
ele
ase
(J)
c
Figure 8.10: In-cylinder analysis at SOI of -2.5ºATDC, 1800 rpm 9.7 mg EGR 48% a)Cylinder Pressure (bar), b) Net rate of heat release (J/º), c) Cumulative net heat release(J). Arrows indicate effect on combustion characteristics with increasing rail pressure.
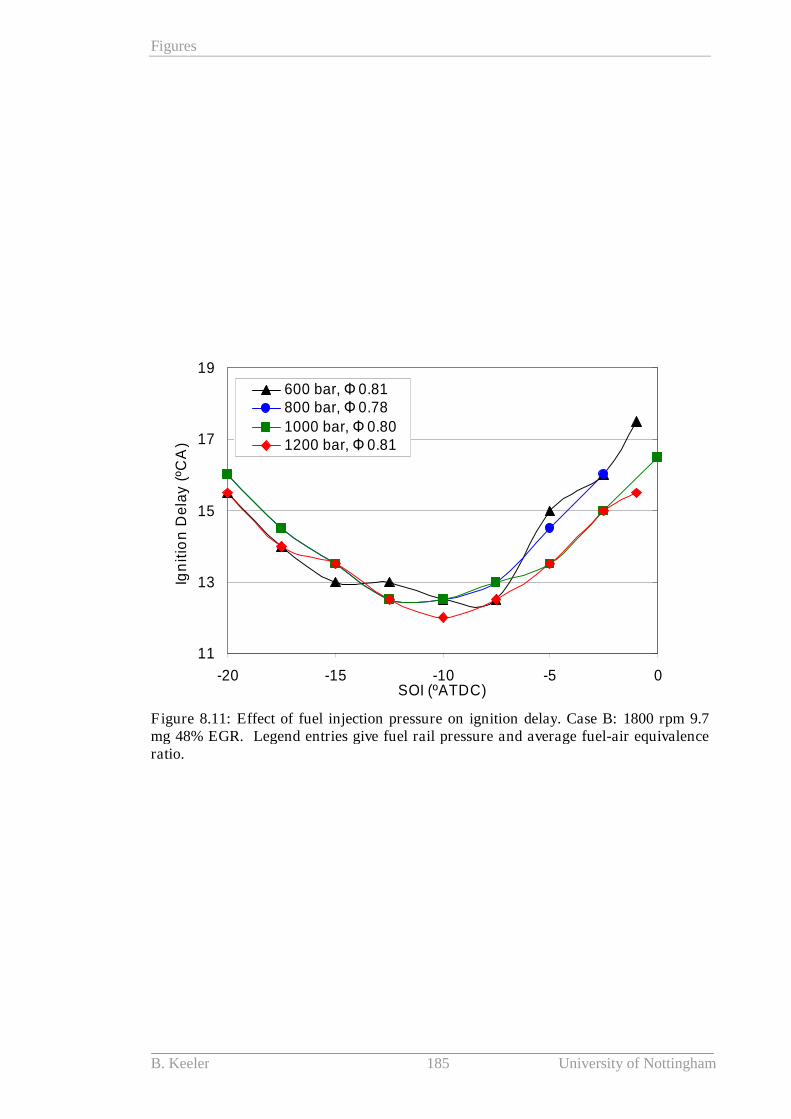
Figures
B. Keeler 185 University of Nottingham
11
13
15
17
19
-20 -15 -10 -5 0SOI (ºATDC)
Ign
itio
nD
ela
y(º
CA
)
600 bar, Φ 0.81800 bar, Φ 0.78
1000 bar, Φ 0.801200 bar, Φ 0.81
Figure 8.11: Effect of fuel injection pressure on ignition delay. Case B: 1800 rpm 9.7mg 48% EGR. Legend entries give fuel rail pressure and average fuel-air equivalenceratio.
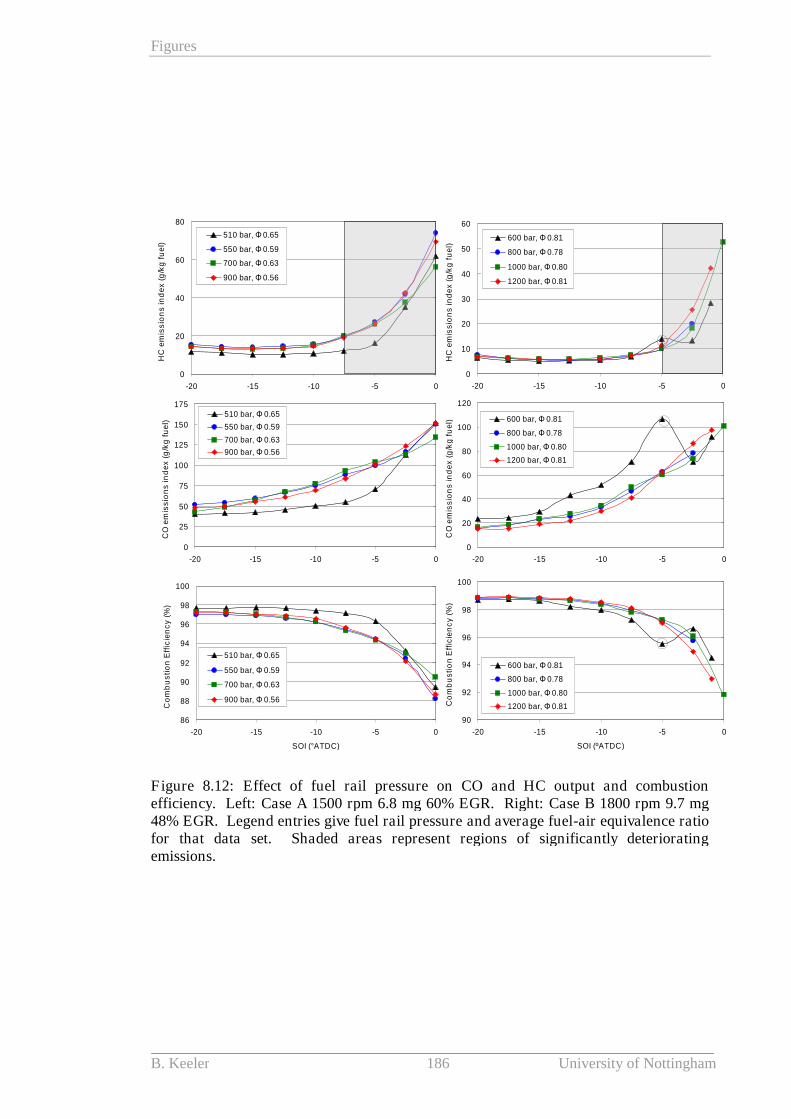
Figures
B. Keeler 186 University of Nottingham
0
10
20
30
40
50
60
-20 -15 -10 -5 0
HC
em
iss
ion
sin
de
x(g
/kg
fue
l)
600 bar, Φ 0.81
800 bar, Φ 0.78
1000 bar, Φ 0.80
1200 bar, Φ 0.81
0
20
40
60
80
100
120
-20 -15 -10 -5 0
SOI (ºATDC)
CO
em
iss
ion
sin
de
x(g
/kg
fue
l) 600 bar, Φ 0.81
800 bar, Φ 0.78
1000 bar, Φ 0.80
1200 bar, Φ 0.81
90
92
94
96
98
100
-20 -15 -10 -5 0
SOI (ºATDC)
Co
mb
us
tio
nE
ffic
ien
cy
(%)
600 bar, Φ 0.81
800 bar, Φ 0.78
1000 bar, Φ 0.80
1200 bar, Φ 0.81
0
20
40
60
80
-20 -15 -10 -5 0
HC
em
iss
ion
sin
de
x(g
/kg
fue
l)
510 bar, Φ 0.65
550 bar, Φ 0.59
700 bar, Φ 0.63
900 bar, Φ 0.56
0
25
50
75
100
125
150
175
-20 -15 -10 -5 0
SOI (°ATDC)
CO
em
iss
ion
sin
de
x(g
/kg
fue
l)
510 bar, Φ 0.65
550 bar, Φ 0.59
700 bar, Φ 0.63
900 bar, Φ 0.56
86
88
90
92
94
96
98
100
-20 -15 -10 -5 0
SOI (°ATDC)
Co
mb
us
tio
nE
ffic
ien
cy
(%)
510 bar, Φ 0.65
550 bar, Φ 0.59
700 bar, Φ 0.63
900 bar, Φ 0.56
0
10
20
30
40
50
60
-20 -15 -10 -5 0
HC
em
iss
ion
sin
de
x(g
/kg
fue
l)
600 bar, Φ 0.81
800 bar, Φ 0.78
1000 bar, Φ 0.80
1200 bar, Φ 0.81
0
20
40
60
80
100
120
-20 -15 -10 -5 0
SOI (ºATDC)
CO
em
iss
ion
sin
de
x(g
/kg
fue
l) 600 bar, Φ 0.81
800 bar, Φ 0.78
1000 bar, Φ 0.80
1200 bar, Φ 0.81
90
92
94
96
98
100
-20 -15 -10 -5 0
SOI (ºATDC)
Co
mb
us
tio
nE
ffic
ien
cy
(%)
600 bar, Φ 0.81
800 bar, Φ 0.78
1000 bar, Φ 0.80
1200 bar, Φ 0.81
0
20
40
60
80
-20 -15 -10 -5 0
HC
em
iss
ion
sin
de
x(g
/kg
fue
l)
510 bar, Φ 0.65
550 bar, Φ 0.59
700 bar, Φ 0.63
900 bar, Φ 0.56
0
25
50
75
100
125
150
175
-20 -15 -10 -5 0
SOI (°ATDC)
CO
em
iss
ion
sin
de
x(g
/kg
fue
l)
510 bar, Φ 0.65
550 bar, Φ 0.59
700 bar, Φ 0.63
900 bar, Φ 0.56
86
88
90
92
94
96
98
100
-20 -15 -10 -5 0
SOI (°ATDC)
Co
mb
us
tio
nE
ffic
ien
cy
(%)
510 bar, Φ 0.65
550 bar, Φ 0.59
700 bar, Φ 0.63
900 bar, Φ 0.56
0
20
40
60
80
-20 -15 -10 -5 0
HC
em
iss
ion
sin
de
x(g
/kg
fue
l)
510 bar, Φ 0.65
550 bar, Φ 0.59
700 bar, Φ 0.63
900 bar, Φ 0.56
0
25
50
75
100
125
150
175
-20 -15 -10 -5 0
SOI (°ATDC)
CO
em
iss
ion
sin
de
x(g
/kg
fue
l)
510 bar, Φ 0.65
550 bar, Φ 0.59
700 bar, Φ 0.63
900 bar, Φ 0.56
86
88
90
92
94
96
98
100
-20 -15 -10 -5 0
SOI (°ATDC)
Co
mb
us
tio
nE
ffic
ien
cy
(%)
510 bar, Φ 0.65
550 bar, Φ 0.59
700 bar, Φ 0.63
900 bar, Φ 0.56
Figure 8.12: Effect of fuel rail pressure on CO and HC output and combustionefficiency. Left: Case A 1500 rpm 6.8 mg 60% EGR. Right: Case B 1800 rpm 9.7 mg48% EGR. Legend entries give fuel rail pressure and average fuel-air equivalence ratiofor that data set. Shaded areas represent regions of significantly deterioratingemissions.
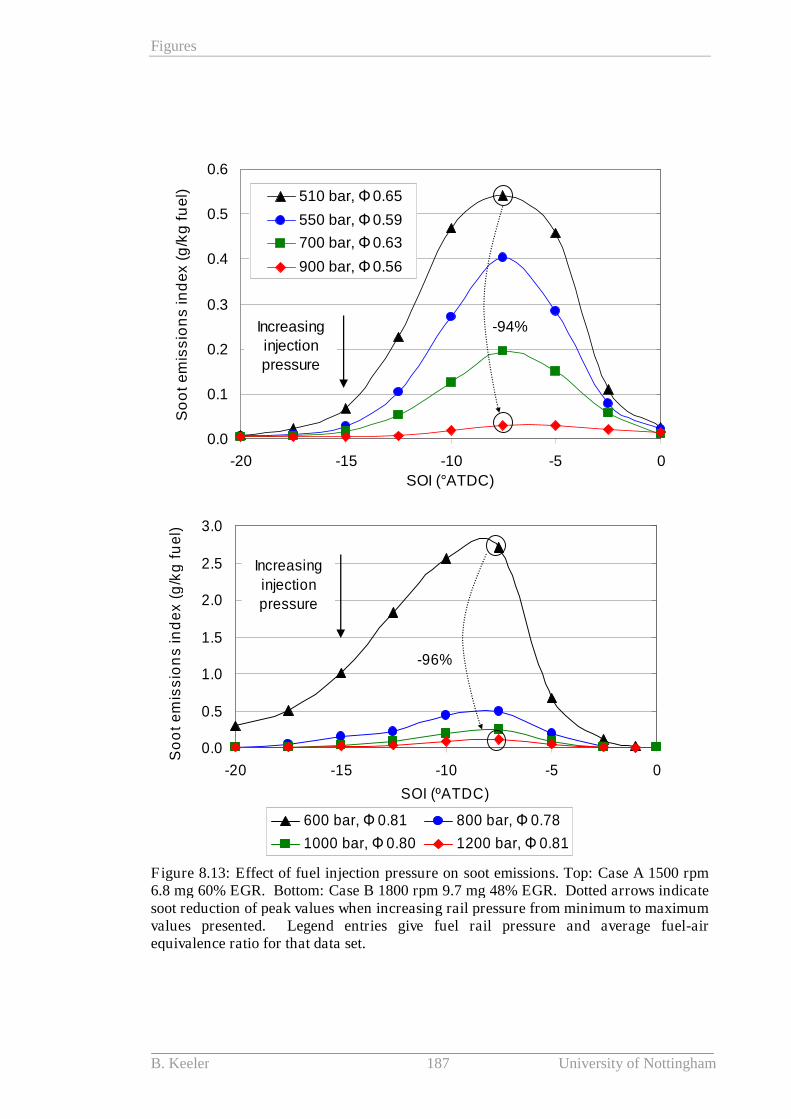
Figures
B. Keeler 187 University of Nottingham
0.0
0.1
0.2
0.3
0.4
0.5
0.6
-20 -15 -10 -5 0
SOI (°ATDC)
So
ot
em
iss
ion
sin
de
x(g
/kg
fue
l) 510 bar, Φ0.65
550 bar, Φ0.59
700 bar, Φ0.63
900 bar, Φ0.56
Increasinginjection
pressure
-94%
0.0
0.5
1.0
1.5
2.0
2.5
3.0
-20 -15 -10 -5 0
SOI (ºATDC)
So
ot
em
iss
ion
sin
de
x(g
/kg
fue
l)
600 bar, Φ 0.81 800 bar, Φ 0.78
1000 bar, Φ 0.80 1200 bar, Φ 0.81
Increasing
injectionpressure
-96%
Figure 8.13: Effect of fuel injection pressure on soot emissions. Top: Case A 1500 rpm6.8 mg 60% EGR. Bottom: Case B 1800 rpm 9.7 mg 48% EGR. Dotted arrows indicatesoot reduction of peak values when increasing rail pressure from minimum to maximumvalues presented. Legend entries give fuel rail pressure and average fuel-airequivalence ratio for that data set.
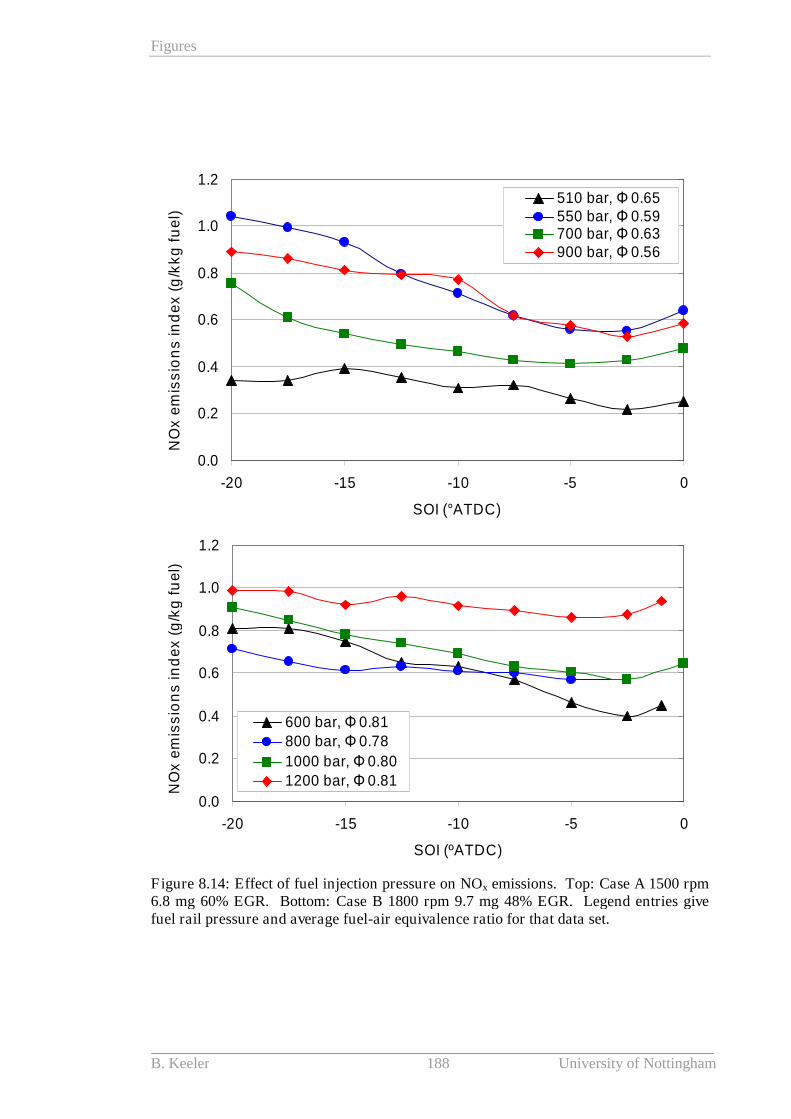
Figures
B. Keeler 188 University of Nottingham
0.0
0.2
0.4
0.6
0.8
1.0
1.2
-20 -15 -10 -5 0
SOI (ºATDC)
NO
xe
mis
sio
ns
ind
ex
(g/k
gfu
el)
600 bar, Φ 0.81800 bar, Φ 0.78
1000 bar, Φ 0.80
1200 bar, Φ 0.81
0.0
0.2
0.4
0.6
0.8
1.0
1.2
-20 -15 -10 -5 0
SOI (°ATDC)
NO
xe
mis
sio
ns
ind
ex
(g/k
kg
fue
l)
510 bar, Φ 0.65550 bar, Φ 0.59700 bar, Φ 0.63900 bar, Φ 0.56
0.0
0.2
0.4
0.6
0.8
1.0
1.2
-20 -15 -10 -5 0
SOI (ºATDC)
NO
xe
mis
sio
ns
ind
ex
(g/k
gfu
el)
600 bar, Φ 0.81800 bar, Φ 0.78
1000 bar, Φ 0.80
1200 bar, Φ 0.81
0.0
0.2
0.4
0.6
0.8
1.0
1.2
-20 -15 -10 -5 0
SOI (°ATDC)
NO
xe
mis
sio
ns
ind
ex
(g/k
kg
fue
l)
510 bar, Φ 0.65550 bar, Φ 0.59700 bar, Φ 0.63900 bar, Φ 0.56
Figure 8.14: Effect of fuel injection pressure on NOx emissions. Top: Case A 1500 rpm6.8 mg 60% EGR. Bottom: Case B 1800 rpm 9.7 mg 48% EGR. Legend entries givefuel rail pressure and average fuel-air equivalence ratio for that data set.

Figures
B. Keeler 189 University of Nottingham
0.35
0.45
0.55
0.65
0.75
0.85
-20 -15 -10 -5 0
SOI (°ATDC)
bs
fc(g
/kW
h)
510 bar, Φ0.65
550 bar, Φ0.59
700 bar, Φ0.63
900 bar, Φ0.56
+32%
0.25
0.30
0.35
0.40
0.45
0.50
0.55
-20 -15 -10 -5 0
SOI (ºATDC)
bs
fc(k
g/k
Wh
)
600 bar, Φ 0.81
800 bar, Φ 0.78
1000 bar, Φ 0.80
1200 bar, Φ 0.81
+16%
Figure 8.15: Effect of fuel injection pressure on bsfc. Top: Case A 1500 rpm 6.8 mg60% EGR. Bottom: Case B 1800 rpm 9.7 mg 48% EGR. Dotted arrows indicate bsfcincrease from minimum values when increasing rail pressure from minimum tomaximum values presented. Shaded areas represent regions of significantlydeteriorating fuel consumption. Legend entries give fuel rail pressure and average fuel-air equivalence ratio for that data set.

Figures
B. Keeler 190 University of Nottingham
0.0
0.5
1.0
1.5
2.0
2.5
3.0
0.280 0.330 0.380 0.430 0.480 0.530 0.580
bsfc (kg/kWh)
So
ot
em
iss
ion
sin
de
x(g
/kg
fue
l) 600 bar, Φ0.81
800 bar, Φ0.78
1000 bar, Φ0.80
1200 bar, Φ0.81
3.18
1
5.75 305y
x
Figure 8.16: Soot-fuel consumption trade-off with varying injection timing andpressure. Case B: 1800 rpm 9.7 mg 48% EGR. Legend entries give fuel rail pressureand average fuel-air equivalence ratio for that data set. Labelled is the non-linearregressional model fitted to the data.
0.0
0.5
1.0
1.5
2.0
-20 -15 -10 -5 0
SOI (ºATDC)
Av
era
ge
FM
EP
(ba
r)
600 bar, Φ 0.81800 bar, Φ 0.781000 bar, Φ 0.801200 bar, Φ 0.81
Increasing
injectionpressure
Figure 8.17: FMEP variation with injection pressure. Averaged values from cylinders 3and 4. Data at 1800 rpm 9.7 mg 48% EGR. Legend entries give fuel rail pressure andaverage fuel-air equivalence ratio for that data set.
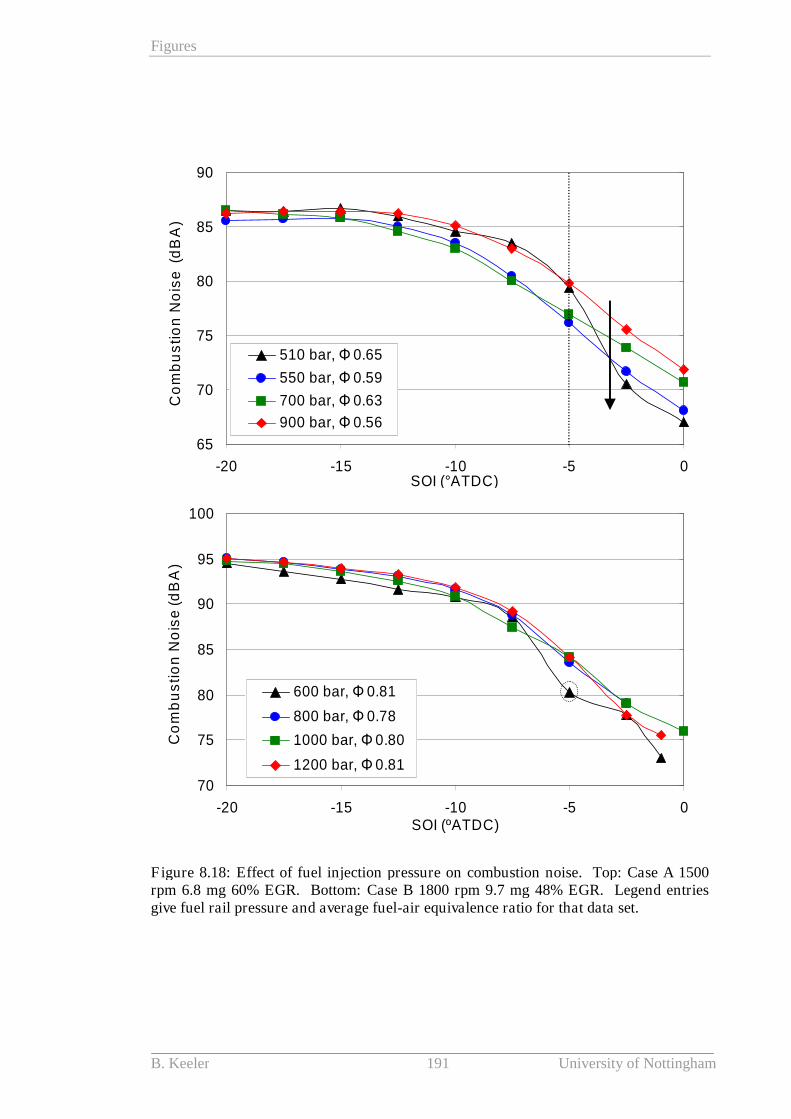
Figures
B. Keeler 191 University of Nottingham
65
70
75
80
85
90
-20 -15 -10 -5 0SOI (°ATDC)
Co
mb
us
tio
nN
ois
e(d
BA
)
510 bar, Φ 0.65
550 bar, Φ 0.59
700 bar, Φ 0.63
900 bar, Φ 0.56
70
75
80
85
90
95
100
-20 -15 -10 -5 0SOI (ºATDC)
Co
mb
us
tio
nN
ois
e(d
BA
)
600 bar, Φ 0.81
800 bar, Φ 0.78
1000 bar, Φ 0.80
1200 bar, Φ 0.81
65
70
75
80
85
90
-20 -15 -10 -5 0SOI (°ATDC)
Co
mb
us
tio
nN
ois
e(d
BA
)
510 bar, Φ 0.65
550 bar, Φ 0.59
700 bar, Φ 0.63
900 bar, Φ 0.56
70
75
80
85
90
95
100
-20 -15 -10 -5 0SOI (ºATDC)
Co
mb
us
tio
nN
ois
e(d
BA
)
600 bar, Φ 0.81
800 bar, Φ 0.78
1000 bar, Φ 0.80
1200 bar, Φ 0.81
Figure 8.18: Effect of fuel injection pressure on combustion noise. Top: Case A 1500rpm 6.8 mg 60% EGR. Bottom: Case B 1800 rpm 9.7 mg 48% EGR. Legend entriesgive fuel rail pressure and average fuel-air equivalence ratio for that data set.
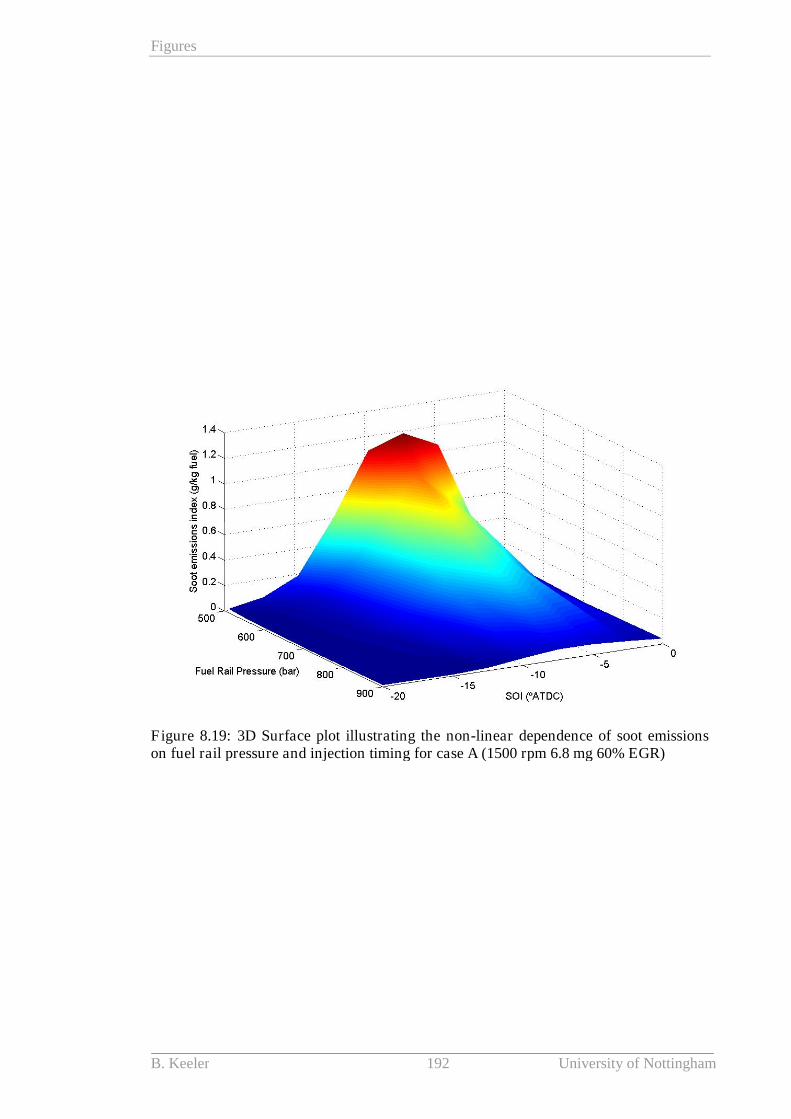
Figures
B. Keeler 192 University of Nottingham
Figure 8.19: 3D Surface plot illustrating the non-linear dependence of soot emissionson fuel rail pressure and injection timing for case A (1500 rpm 6.8 mg 60% EGR)
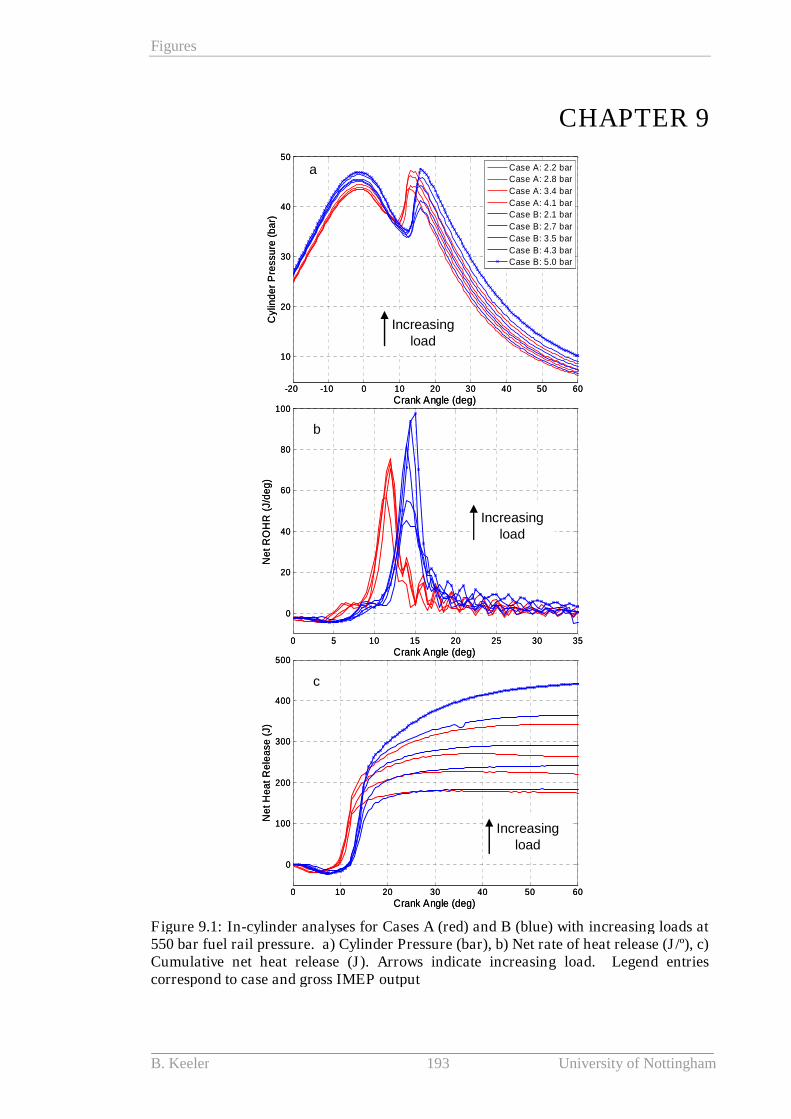
Figures
B. Keeler 193 University of Nottingham
CHAPTER 9
-20 -10 0 10 20 30 40 50 60
10
20
30
40
50
Crank Angle (deg)
Cylin
de
rP
ressu
re(b
ar)
Case A: 2.2 bar
Case A: 2.8 bar
Case A: 3.4 bar
Case A: 4.1 bar
Case B: 2.1 bar
Case B: 2.7 bar
Case B: 3.5 bar
Case B: 4.3 bar
Case B: 5.0 bar
0 10 20 30 40 50 60
0
100
200
300
400
500
Crank Angle (deg)
Ne
tH
ea
tR
ele
ase
(J)
0 5 10 15 20 25 30 35
0
20
40
60
80
100
Crank Angle (deg)
Ne
tR
OH
R(J
/de
g)
Increasingload
Increasingload
Increasingload
a
b
c
Figure 9.1: In-cylinder analyses for Cases A (red) and B (blue) with increasing loads at550 bar fuel rail pressure. a) Cylinder Pressure (bar), b) Net rate of heat release (J/º), c)Cumulative net heat release (J). Arrows indicate increasing load. Legend entriescorrespond to case and gross IMEP output

Figures
B. Keeler 194 University of Nottingham
0.0
1.0
2.0
3.0
4.0
5.0
6.0
5 6 7 8 9 10 11 12 13 14 15 16 17
Fuel Quantity Delivered (mg/stk/cyl)
Av
era
ge
IME
Pg
(ba
r)
0.15
0.35
0.55
0.75
0.95
Fu
el-
Ox
yg
en
Eq
uiv
ale
nc
eR
ati
o
45% EGR +13ºATDC
35% EGR +16ºATDC
Figure 9.2: Effect on gross IMEP load output (solid) and fuel-oxygen equivalence(hollow) with increasing fuel quantity delivered at 1500 rpm. Average IMEP fromcylinders 3 and 4. Case A (red): 45% EGR location of peak pressure +13ºATDC. CaseB (blue): 35% EGR location of peak pressure +16ºATDC.
150
200
250
300
350
400
1.5 2.5 3.5 4.5 5.5
Average IMEPg (bar)
Po
st
Tu
rbin
eT
em
pe
ratu
re(º
C) 45% EGR +13ºATDC
35% EGR +16ºATDC
Figure 9.3: Relationship between gross IMEP (averaged between cylinders 3 and 4) andexhaust gas temperature post-turbine (bank B) at 1500 rpm. Legend entries give EGRrate and constant combustion phasing location (peak pressure), Case A (red), Case B(blue)
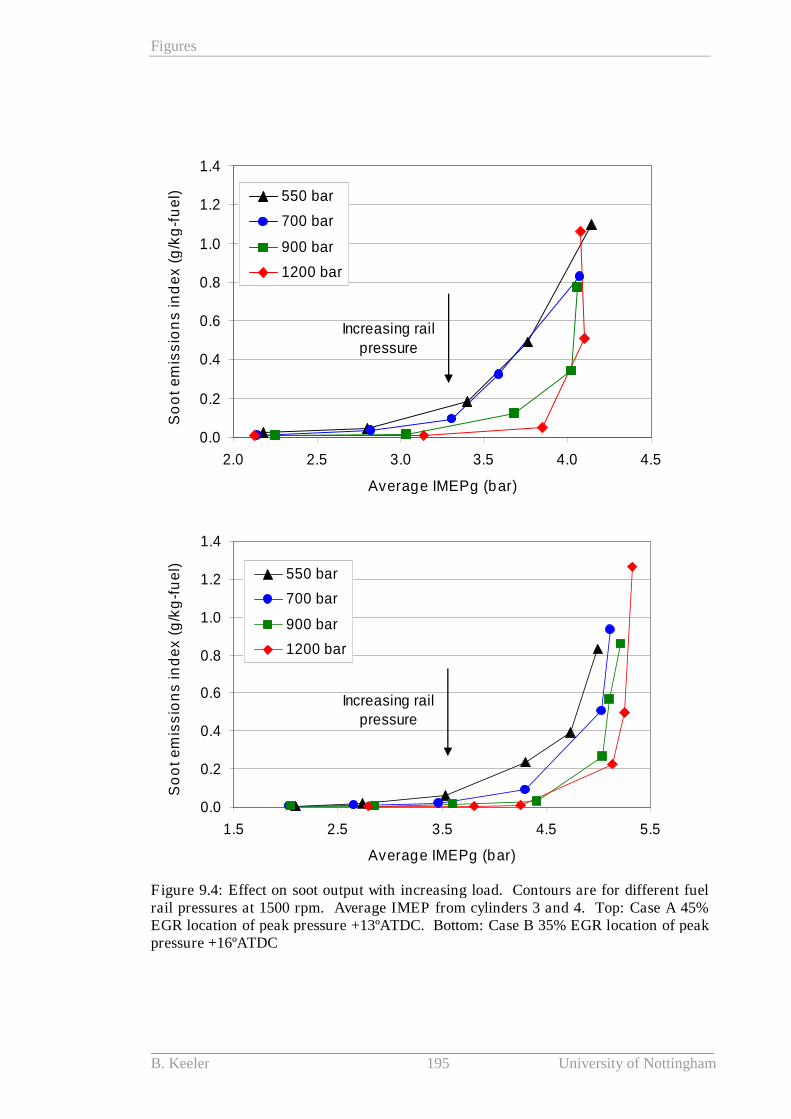
Figures
B. Keeler 195 University of Nottingham
0.0
0.2
0.4
0.6
0.8
1.0
1.2
1.4
2.0 2.5 3.0 3.5 4.0 4.5
Average IMEPg (bar)
So
ot
em
iss
ion
sin
de
x(g
/kg
-fu
el) 550 bar
700 bar
900 bar
1200 bar
Increasing rail
pressure
0.0
0.2
0.4
0.6
0.8
1.0
1.2
1.4
1.5 2.5 3.5 4.5 5.5
Average IMEPg (bar)
So
ot
em
iss
ion
sin
de
x(g
/kg
-fu
el) 550 bar
700 bar
900 bar
1200 bar
Increasing railpressure
Figure 9.4: Effect on soot output with increasing load. Contours are for different fuelrail pressures at 1500 rpm. Average IMEP from cylinders 3 and 4. Top: Case A 45%EGR location of peak pressure +13ºATDC. Bottom: Case B 35% EGR location of peakpressure +16ºATDC
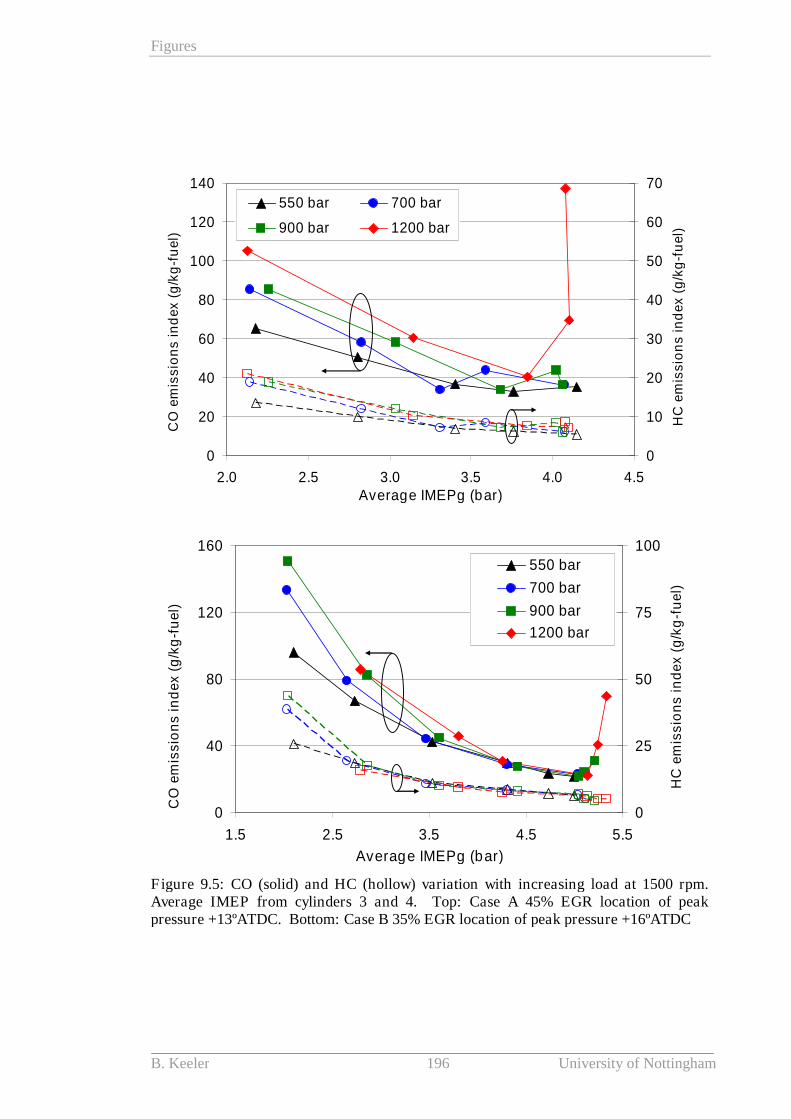
Figures
B. Keeler 196 University of Nottingham
0
20
40
60
80
100
120
140
2.0 2.5 3.0 3.5 4.0 4.5Average IMEPg (bar)
CO
em
iss
ion
sin
de
x(g
/kg
-fu
el)
0
10
20
30
40
50
60
70
HC
em
iss
ion
sin
de
x(g
/kg
-fu
el)
550 bar 700 bar
900 bar 1200 bar
0
40
80
120
160
1.5 2.5 3.5 4.5 5.5
Average IMEPg (bar)
CO
em
iss
ion
sin
de
x(g
/kg
-fu
el)
0
25
50
75
100
HC
em
iss
ion
sin
de
x(g
/kg
-fu
el)
550 bar
700 bar
900 bar
1200 bar
Figure 9.5: CO (solid) and HC (hollow) variation with increasing load at 1500 rpm.Average IMEP from cylinders 3 and 4. Top: Case A 45% EGR location of peakpressure +13ºATDC. Bottom: Case B 35% EGR location of peak pressure +16ºATDC
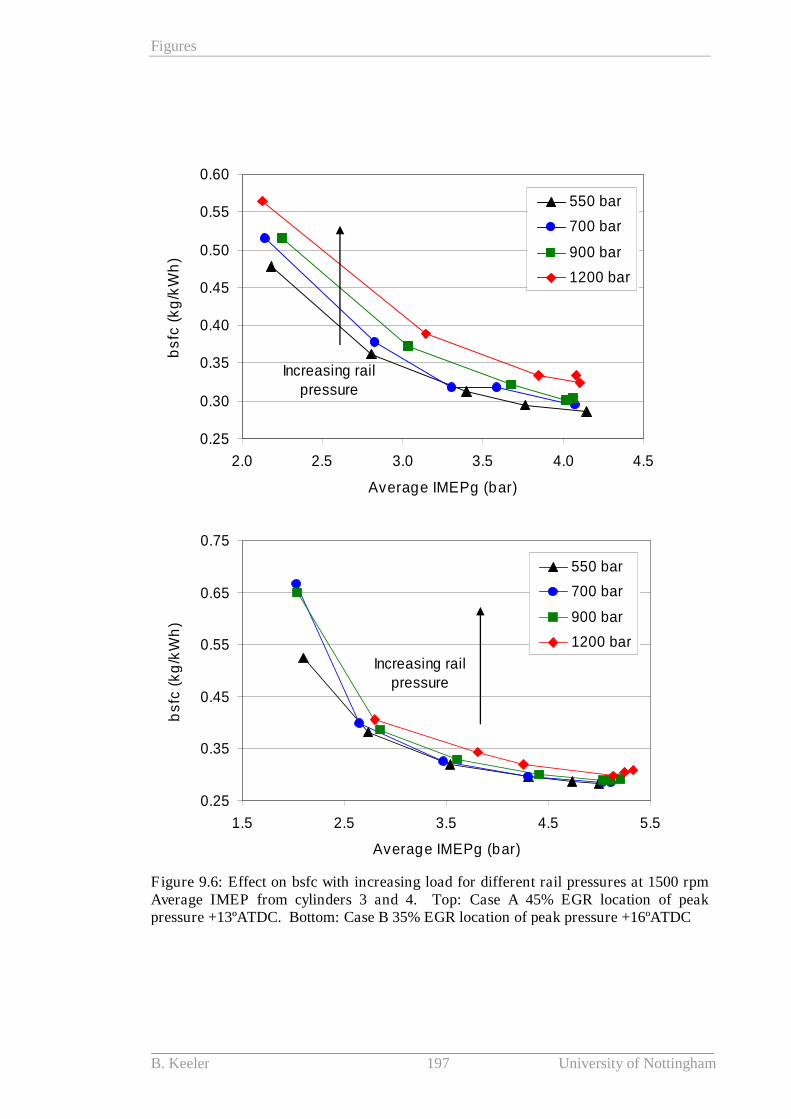
Figures
B. Keeler 197 University of Nottingham
0.25
0.30
0.35
0.40
0.45
0.50
0.55
0.60
2.0 2.5 3.0 3.5 4.0 4.5
Average IMEPg (bar)
bs
fc(k
g/k
Wh
)
550 bar
700 bar
900 bar
1200 bar
Increasing railpressure
0.25
0.35
0.45
0.55
0.65
0.75
1.5 2.5 3.5 4.5 5.5
Average IMEPg (bar)
bs
fc(k
g/k
Wh
)
550 bar
700 bar
900 bar
1200 bar
Increasing railpressure
Figure 9.6: Effect on bsfc with increasing load for different rail pressures at 1500 rpmAverage IMEP from cylinders 3 and 4. Top: Case A 45% EGR location of peakpressure +13ºATDC. Bottom: Case B 35% EGR location of peak pressure +16ºATDC
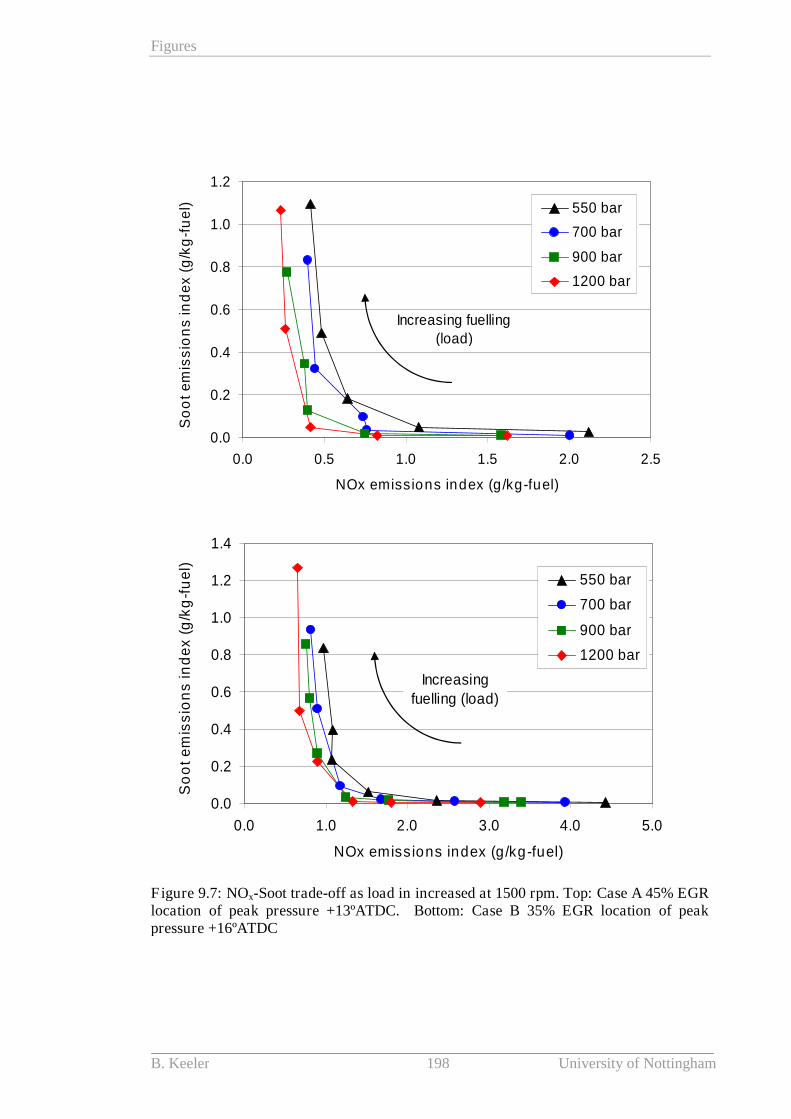
Figures
B. Keeler 198 University of Nottingham
0.0
0.2
0.4
0.6
0.8
1.0
1.2
0.0 0.5 1.0 1.5 2.0 2.5
NOx emissions index (g/kg-fuel)
So
ot
em
iss
ion
sin
de
x(g
/kg
-fu
el) 550 bar
700 bar
900 bar
1200 bar
Increasing fuelling(load)
0.0
0.2
0.4
0.6
0.8
1.0
1.2
1.4
0.0 1.0 2.0 3.0 4.0 5.0
NOx emissions index (g/kg-fuel)
So
ot
em
iss
ion
sin
de
x(g
/kg
-fu
el)
550 bar
700 bar
900 bar
1200 bar
Increasing
fuelling (load)
Figure 9.7: NOx-Soot trade-off as load in increased at 1500 rpm. Top: Case A 45% EGRlocation of peak pressure +13ºATDC. Bottom: Case B 35% EGR location of peakpressure +16ºATDC
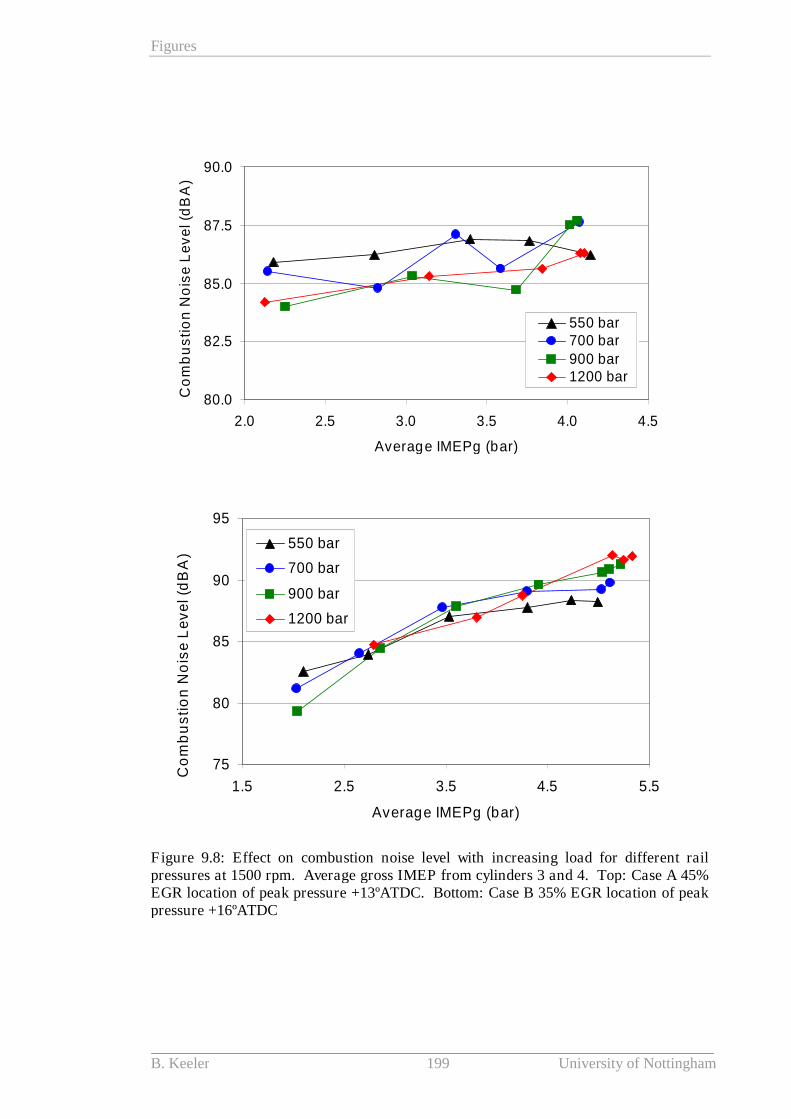
Figures
B. Keeler 199 University of Nottingham
80.0
82.5
85.0
87.5
90.0
2.0 2.5 3.0 3.5 4.0 4.5
Average IMEPg (bar)
Co
mb
us
tio
nN
ois
eL
ev
el(d
BA
)
550 bar700 bar900 bar1200 bar
75
80
85
90
95
1.5 2.5 3.5 4.5 5.5
Average IMEPg (bar)
Co
mb
us
tio
nN
ois
eL
ev
el(d
BA
)
550 bar
700 bar
900 bar
1200 bar
Figure 9.8: Effect on combustion noise level with increasing load for different railpressures at 1500 rpm. Average gross IMEP from cylinders 3 and 4. Top: Case A 45%EGR location of peak pressure +13ºATDC. Bottom: Case B 35% EGR location of peakpressure +16ºATDC
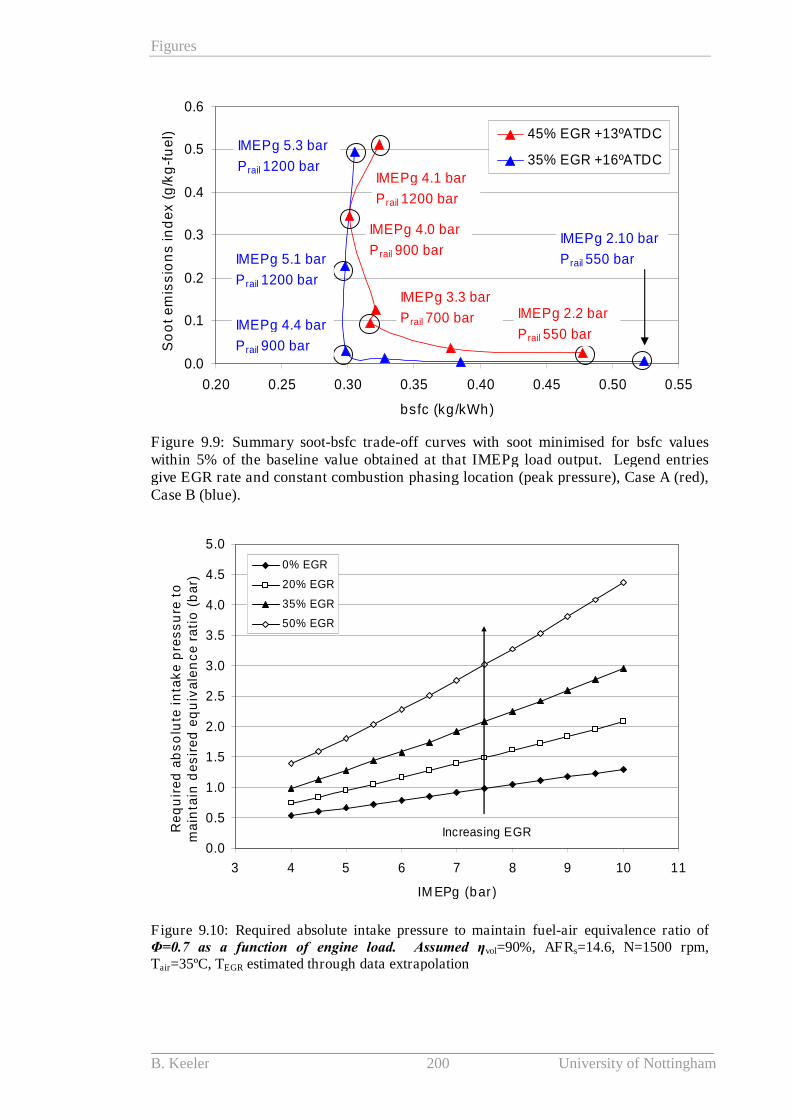
Figures
B. Keeler 200 University of Nottingham
0.0
0.1
0.2
0.3
0.4
0.5
0.6
0.20 0.25 0.30 0.35 0.40 0.45 0.50 0.55
bsfc (kg/kWh)
So
ot
em
iss
ion
sin
de
x(g
/kg
-fu
el) 45% EGR +13ºATDC
35% EGR +16ºATDCIMEPg 5.3 bar
Prail 1200 bar
IMEPg 4.4 bar
Prail 900 bar
IMEPg 2.10 bar
Prail 550 bar
IMEPg 4.0 bar
Prail 900 bar
IMEPg 3.3 bar
Prail 700 bar IMEPg 2.2 bar
Prail 550 bar
IMEPg 5.1 bar
Prail 1200 bar
IMEPg 4.1 bar
Prail 1200 bar
Figure 9.9: Summary soot-bsfc trade-off curves with soot minimised for bsfc valueswithin 5% of the baseline value obtained at that IMEPg load output. Legend entriesgive EGR rate and constant combustion phasing location (peak pressure), Case A (red),Case B (blue).
0.0
0.5
1.0
1.5
2.0
2.5
3.0
3.5
4.0
4.5
5.0
3 4 5 6 7 8 9 10 11
IM EPg (bar)
Re
qu
ire
da
bs
olu
tein
tak
ep
res
su
reto
ma
inta
ind
es
ire
de
qu
iva
len
ce
rati
o(b
ar)
0% EGR
20% EGR
35% EGR
50% EGR
Increasing EGR
Figure 9.10: Required absolute intake pressure to maintain fuel-air equivalence ratio ofΦ=0.7 as a function of engine load. Assumed ηvol=90%, AFRs=14.6, N=1500 rpm,Tair=35ºC, TEGR estimated through data extrapolation
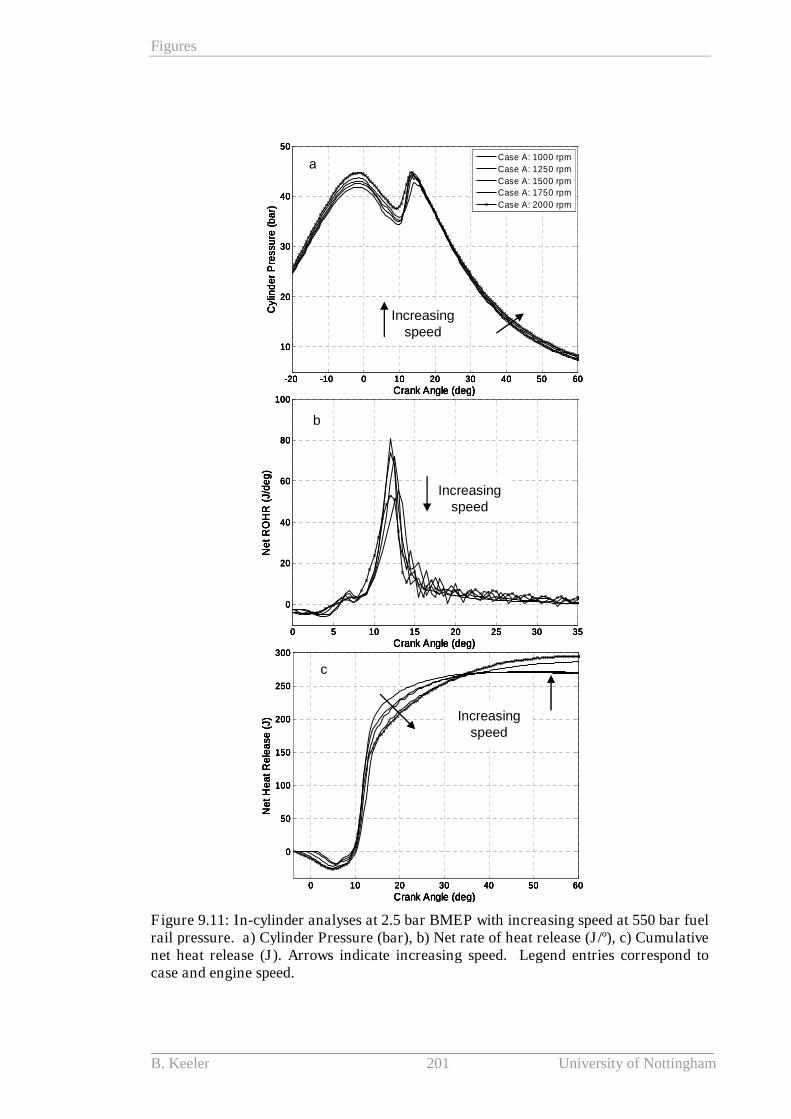
Figures
B. Keeler 201 University of Nottingham
0 10 20 30 40 50 60
0
50
100
150
200
250
300
Crank Angle (deg)
Ne
tH
ea
tR
ele
ase
(J)
0 5 10 15 20 25 30 35
0
20
40
60
80
100
Crank Angle (deg)
Ne
tR
OH
R(J
/de
g)
-20 -10 0 10 20 30 40 50 60
10
20
30
40
50
Crank Angle (deg)
Cylin
de
rP
ressu
re(b
ar)
Case A: 1000 rpm
Case A: 1250 rpm
Case A: 1500 rpm
Case A: 1750 rpm
Case A: 2000 rpm
a
b
c
Increasingspeed
Increasingspeed
Increasingspeed
0 10 20 30 40 50 60
0
50
100
150
200
250
300
Crank Angle (deg)
Ne
tH
ea
tR
ele
ase
(J)
0 5 10 15 20 25 30 35
0
20
40
60
80
100
Crank Angle (deg)
Ne
tR
OH
R(J
/de
g)
-20 -10 0 10 20 30 40 50 60
10
20
30
40
50
Crank Angle (deg)
Cylin
de
rP
ressu
re(b
ar)
Case A: 1000 rpm
Case A: 1250 rpm
Case A: 1500 rpm
Case A: 1750 rpm
Case A: 2000 rpm
a
b
c
Increasingspeed
Increasingspeed
Increasingspeed
Increasingspeed
Figure 9.11: In-cylinder analyses at 2.5 bar BMEP with increasing speed at 550 bar fuelrail pressure. a) Cylinder Pressure (bar), b) Net rate of heat release (J/º), c) Cumulativenet heat release (J). Arrows indicate increasing speed. Legend entries correspond tocase and engine speed.
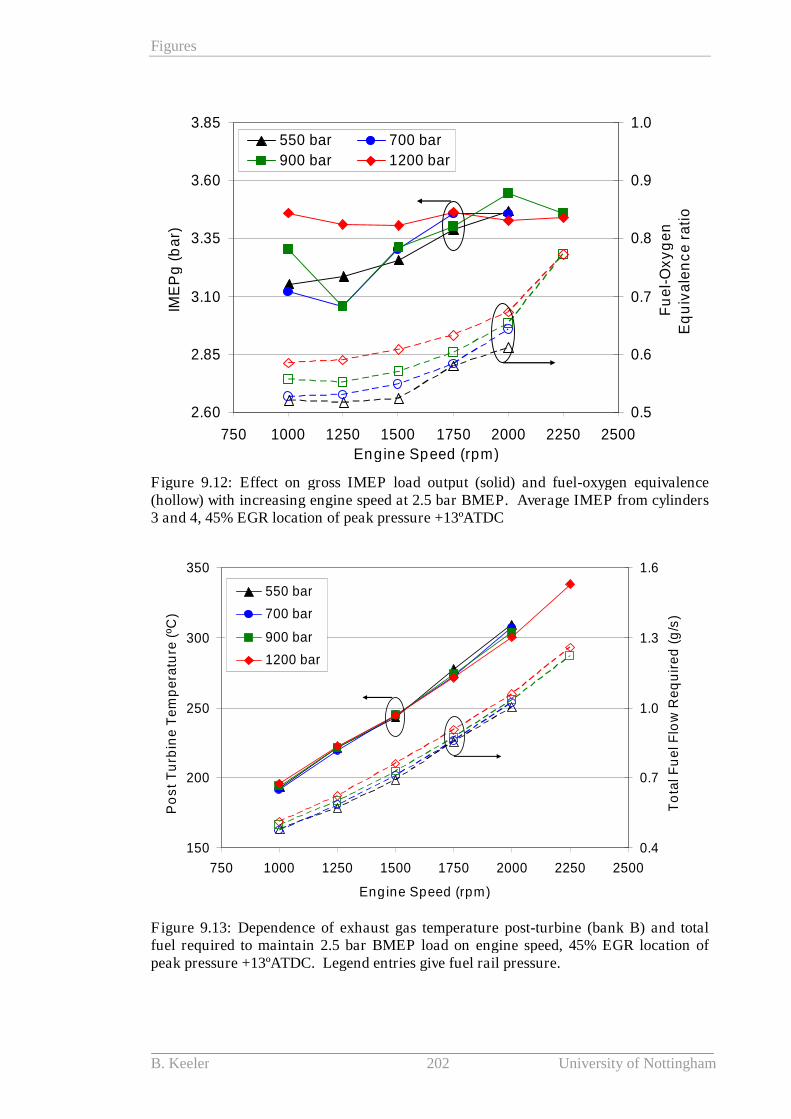
Figures
B. Keeler 202 University of Nottingham
2.60
2.85
3.10
3.35
3.60
3.85
750 1000 1250 1500 1750 2000 2250 2500
Engine Speed (rpm)
IME
Pg
(ba
r)
0.5
0.6
0.7
0.8
0.9
1.0
Fu
el-
Ox
yg
en
Eq
uiv
ale
nc
era
tio
550 bar 700 bar
900 bar 1200 bar
Figure 9.12: Effect on gross IMEP load output (solid) and fuel-oxygen equivalence(hollow) with increasing engine speed at 2.5 bar BMEP. Average IMEP from cylinders3 and 4, 45% EGR location of peak pressure +13ºATDC
150
200
250
300
350
750 1000 1250 1500 1750 2000 2250 2500
Engine Speed (rpm)
Po
st
Tu
rbin
eT
em
pe
ratu
re(º
C)
0.4
0.7
1.0
1.3
1.6
To
talF
ue
lF
low
Re
qu
ire
d(g
/s)
550 bar
700 bar
900 bar
1200 bar
Figure 9.13: Dependence of exhaust gas temperature post-turbine (bank B) and totalfuel required to maintain 2.5 bar BMEP load on engine speed, 45% EGR location ofpeak pressure +13ºATDC. Legend entries give fuel rail pressure.
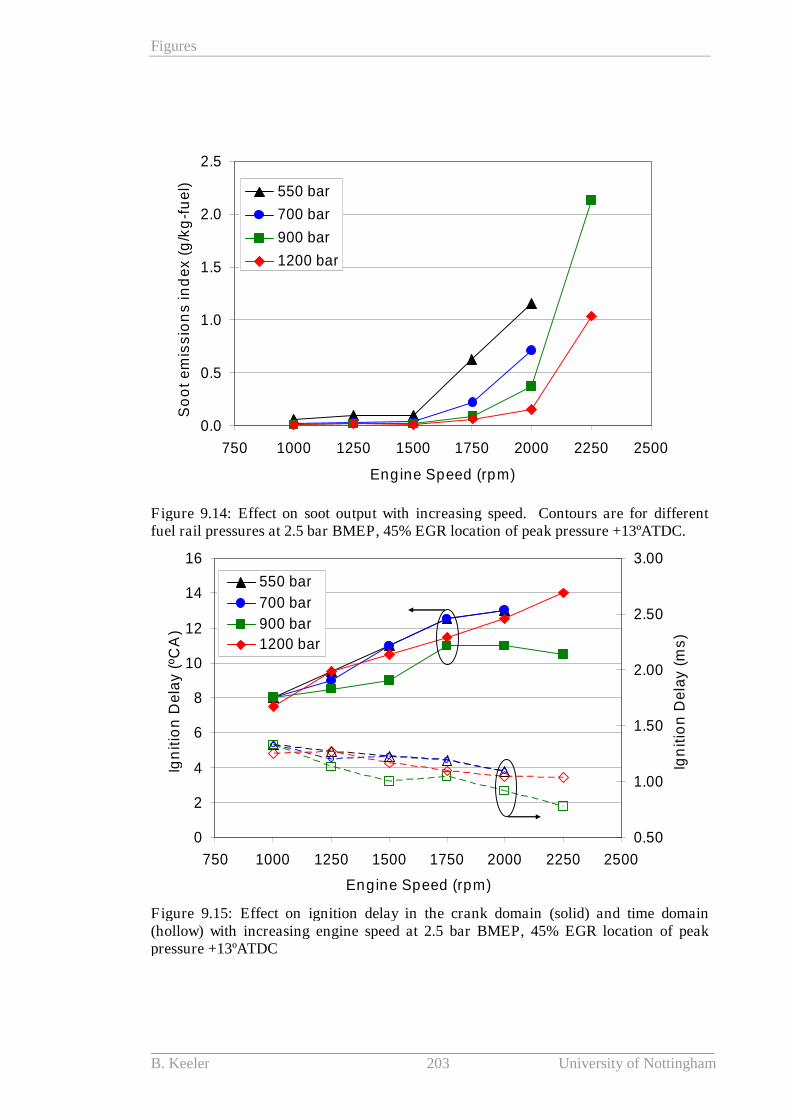
Figures
B. Keeler 203 University of Nottingham
0.0
0.5
1.0
1.5
2.0
2.5
750 1000 1250 1500 1750 2000 2250 2500
Engine Speed (rpm)
So
ot
em
iss
ion
sin
de
x(g
/kg
-fu
el) 550 bar
700 bar
900 bar
1200 bar
Figure 9.14: Effect on soot output with increasing speed. Contours are for differentfuel rail pressures at 2.5 bar BMEP, 45% EGR location of peak pressure +13ºATDC.
0
2
4
6
8
10
12
14
16
750 1000 1250 1500 1750 2000 2250 2500
Engine Speed (rpm)
Ign
itio
nD
ela
y(º
CA
)
0.50
1.00
1.50
2.00
2.50
3.00
Ign
itio
nD
ela
y(m
s)
550 bar
700 bar
900 bar
1200 bar
Figure 9.15: Effect on ignition delay in the crank domain (solid) and time domain(hollow) with increasing engine speed at 2.5 bar BMEP, 45% EGR location of peakpressure +13ºATDC
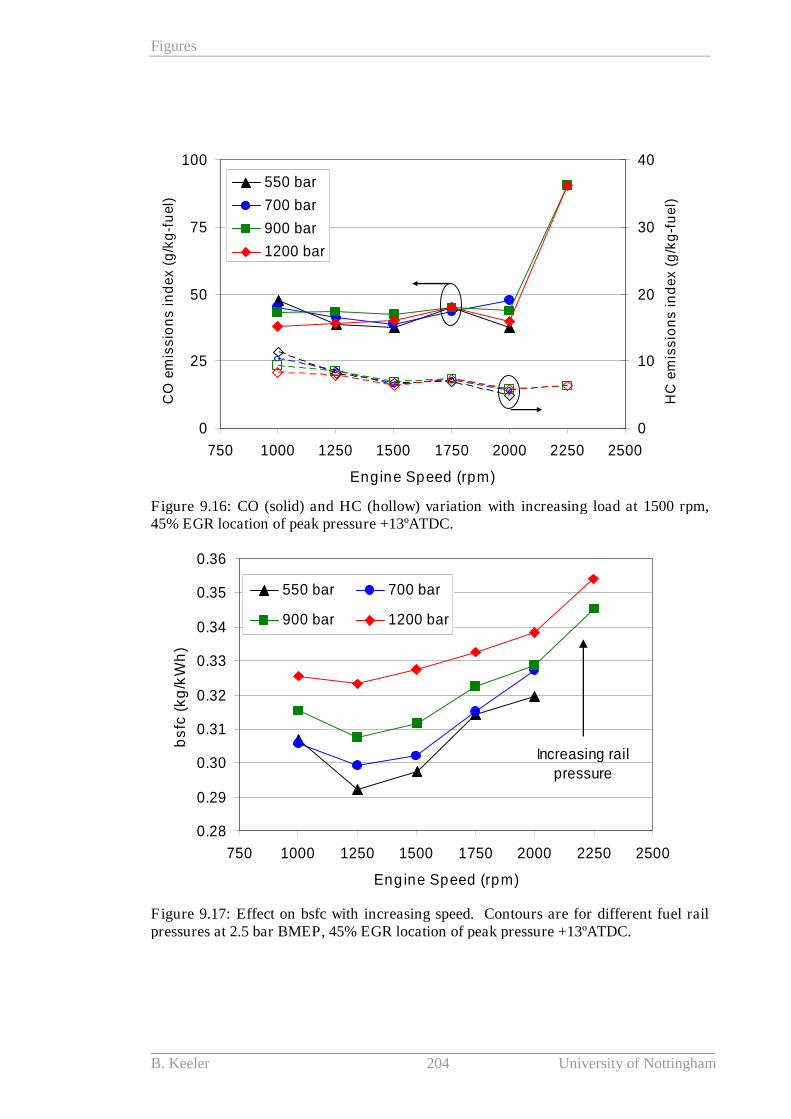
Figures
B. Keeler 204 University of Nottingham
0
25
50
75
100
750 1000 1250 1500 1750 2000 2250 2500
Engine Speed (rpm)
CO
em
iss
ion
sin
de
x(g
/kg
-fu
el)
0
10
20
30
40
HC
em
iss
ion
sin
de
x(g
/kg
-fu
el)
550 bar
700 bar
900 bar
1200 bar
Figure 9.16: CO (solid) and HC (hollow) variation with increasing load at 1500 rpm,45% EGR location of peak pressure +13ºATDC.
0.28
0.29
0.30
0.31
0.32
0.33
0.34
0.35
0.36
750 1000 1250 1500 1750 2000 2250 2500
Engine Speed (rpm)
bs
fc(k
g/k
Wh
)
550 bar 700 bar
900 bar 1200 bar
Increasing rail
pressure
Figure 9.17: Effect on bsfc with increasing speed. Contours are for different fuel railpressures at 2.5 bar BMEP, 45% EGR location of peak pressure +13ºATDC.
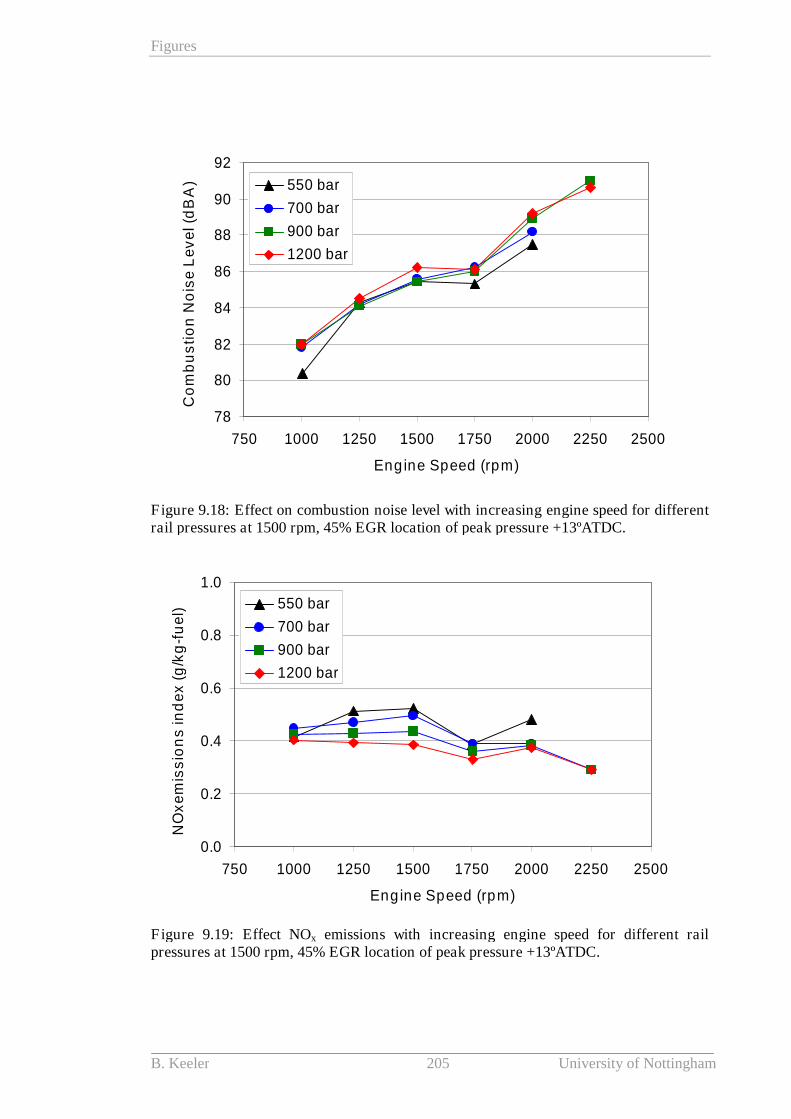
Figures
B. Keeler 205 University of Nottingham
78
80
82
84
86
88
90
92
750 1000 1250 1500 1750 2000 2250 2500
Engine Speed (rpm)
Co
mb
us
tio
nN
ois
eL
ev
el(d
BA
) 550 bar
700 bar
900 bar
1200 bar
Figure 9.18: Effect on combustion noise level with increasing engine speed for differentrail pressures at 1500 rpm, 45% EGR location of peak pressure +13ºATDC.
0.0
0.2
0.4
0.6
0.8
1.0
750 1000 1250 1500 1750 2000 2250 2500
Engine Speed (rpm)
NO
xe
mis
sio
ns
ind
ex
(g/k
g-f
ue
l) 550 bar
700 bar
900 bar
1200 bar
Figure 9.19: Effect NOx emissions with increasing engine speed for different railpressures at 1500 rpm, 45% EGR location of peak pressure +13ºATDC.
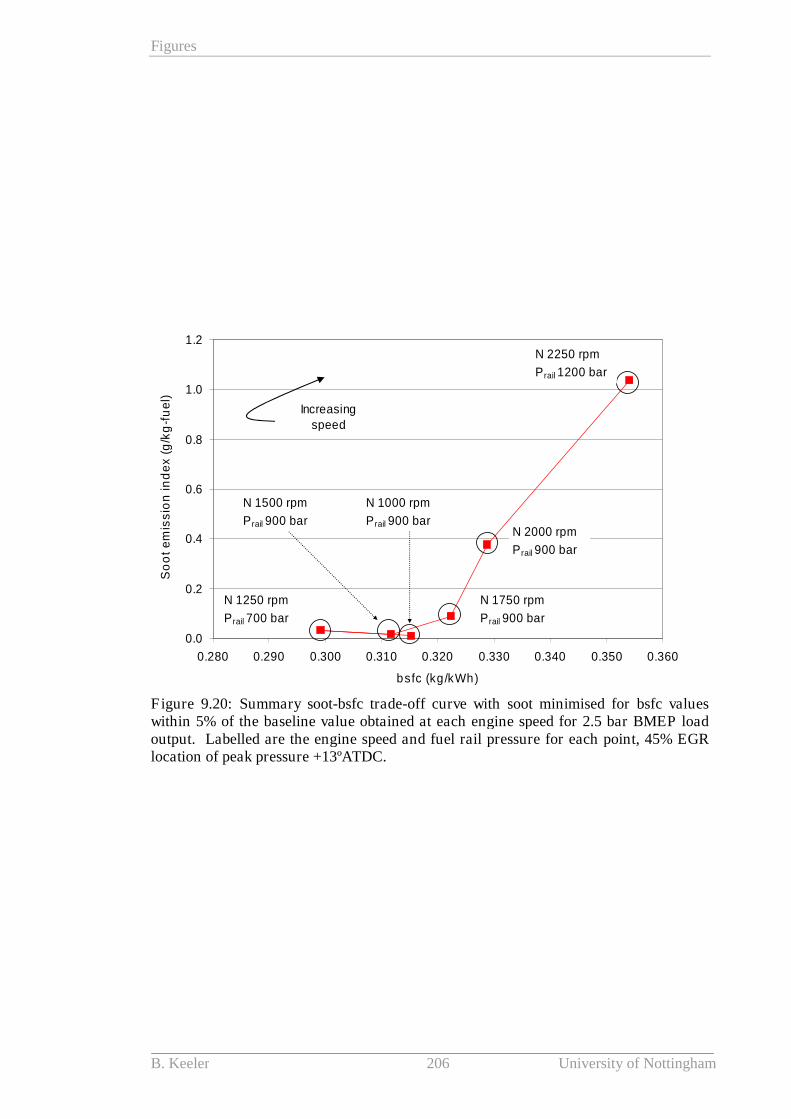
Figures
B. Keeler 206 University of Nottingham
0.0
0.2
0.4
0.6
0.8
1.0
1.2
0.280 0.290 0.300 0.310 0.320 0.330 0.340 0.350 0.360
bsfc (kg/kWh)
So
ot
em
iss
ion
ind
ex
(g/k
g-f
ue
l)
N 2250 rpm
Prail 1200 bar
N 1250 rpm
Prail 700 bar
N 2000 rpm
Prail 900 bar
N 1750 rpm
Prail 900 bar
Increasingspeed
N 1000 rpm
Prail 900 bar
N 1500 rpm
Prail 900 bar
Figure 9.20: Summary soot-bsfc trade-off curve with soot minimised for bsfc valueswithin 5% of the baseline value obtained at each engine speed for 2.5 bar BMEP loadoutput. Labelled are the engine speed and fuel rail pressure for each point, 45% EGRlocation of peak pressure +13ºATDC.
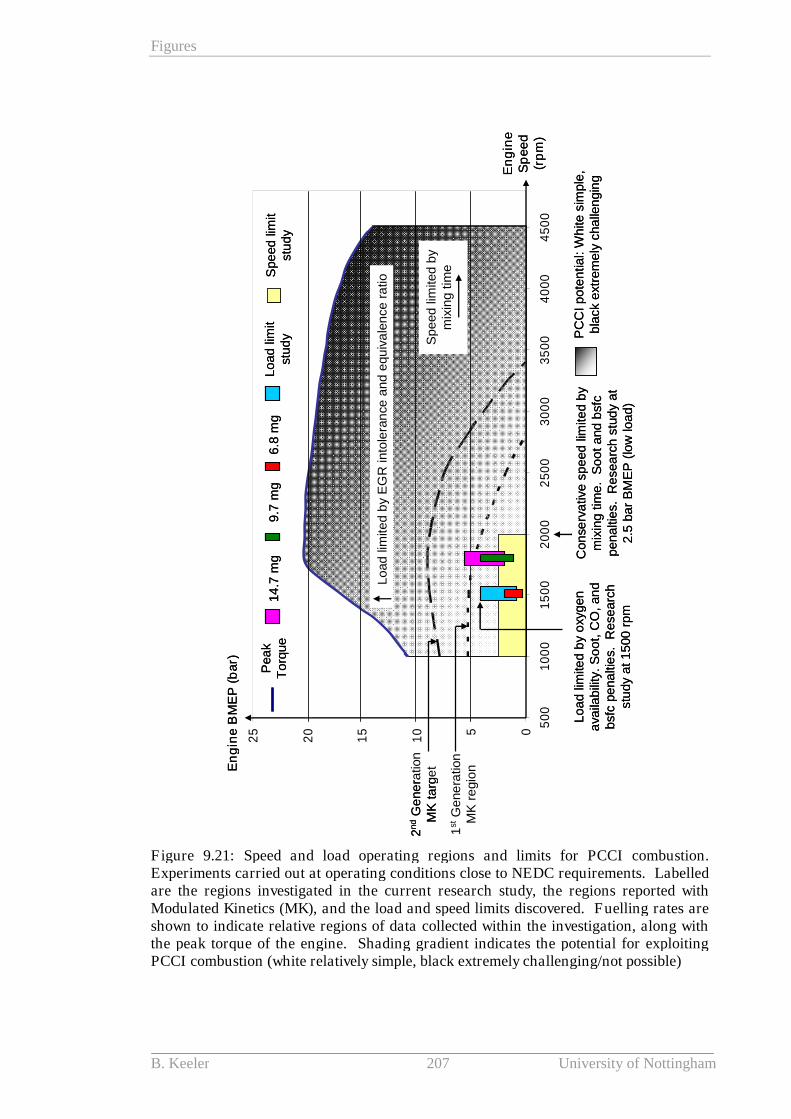
Figures
B. Keeler 207 University of Nottingham
Figure 9.21: Speed and load operating regions and limits for PCCI combustion.Experiments carried out at operating conditions close to NEDC requirements. Labelledare the regions investigated in the current research study, the regions reported withModulated Kinetics (MK), and the load and speed limits discovered. Fuelling rates areshown to indicate relative regions of data collected within the investigation, along withthe peak torque of the engine. Shading gradient indicates the potential for exploitingPCCI combustion (white relatively simple, black extremely challenging/not possible)
05
10
15
20
25
50
01
00
01
50
02
00
02
50
03
00
03
50
04
00
04
50
0E
ng
ine
Sp
ee
d(r
pm
)
EngineBMEP(bar)
Load
limite
db
yo
xygen
ava
ilabili
ty.S
oot,
CO
,an
dbsf
cpena
ltie
s.R
ese
arc
hstu
dy
at1500
rpm
1stG
ene
ratio
nM
Kre
gio
n
Con
serv
ativ
espeed
limite
db
ym
ixin
gtim
e.
So
otand
bsf
cpenaltie
s.
Resea
rch
stu
dy
at
2.5
ba
rB
ME
P(low
load)
En
gin
eS
pee
d(r
pm
)
En
gin
eB
ME
P(b
ar)
2nd
Ge
ne
ratio
nM
Kta
rge
t
Load
limite
db
yE
GR
into
lera
nce
and
equ
iva
len
cera
tio
Speed
limite
dby
mix
ing
tim
e
Pea
kT
orq
ue
14
.7m
g9
.7m
g6.8
mg
Load
limit
stud
yS
peed
limit
stu
dy
PC
CIpote
ntia
l:W
hite
sim
ple
,b
lack
ext
rem
ely
cha
llen
gin
g
05
10
15
20
25
50
01
00
01
50
02
00
02
50
03
00
03
50
04
00
04
50
0E
ng
ine
Sp
ee
d(r
pm
)
EngineBMEP(bar)
Load
limite
db
yo
xygen
ava
ilabili
ty.S
oot,
CO
,an
dbsf
cpena
ltie
s.R
ese
arc
hstu
dy
at1500
rpm
1stG
ene
ratio
nM
Kre
gio
n
Con
serv
ativ
espeed
limite
db
ym
ixin
gtim
e.
So
otand
bsf
cpenaltie
s.
Resea
rch
stu
dy
at
2.5
ba
rB
ME
P(low
load)
En
gin
eS
pee
d(r
pm
)
En
gin
eB
ME
P(b
ar)
2nd
Ge
ne
ratio
nM
Kta
rge
t
Load
limite
db
yE
GR
into
lera
nce
and
equ
iva
len
cera
tio
Speed
limite
dby
mix
ing
tim
e
Pea
kT
orq
ue
14
.7m
g9
.7m
g6.8
mg
Load
limit
stud
yS
peed
limit
stu
dy
Pea
kT
orq
ue
14
.7m
g9
.7m
g6.8
mg
Load
limit
stud
yS
peed
limit
stu
dy
PC
CIpote
ntia
l:W
hite
sim
ple
,b
lack
ext
rem
ely
cha
llen
gin
g
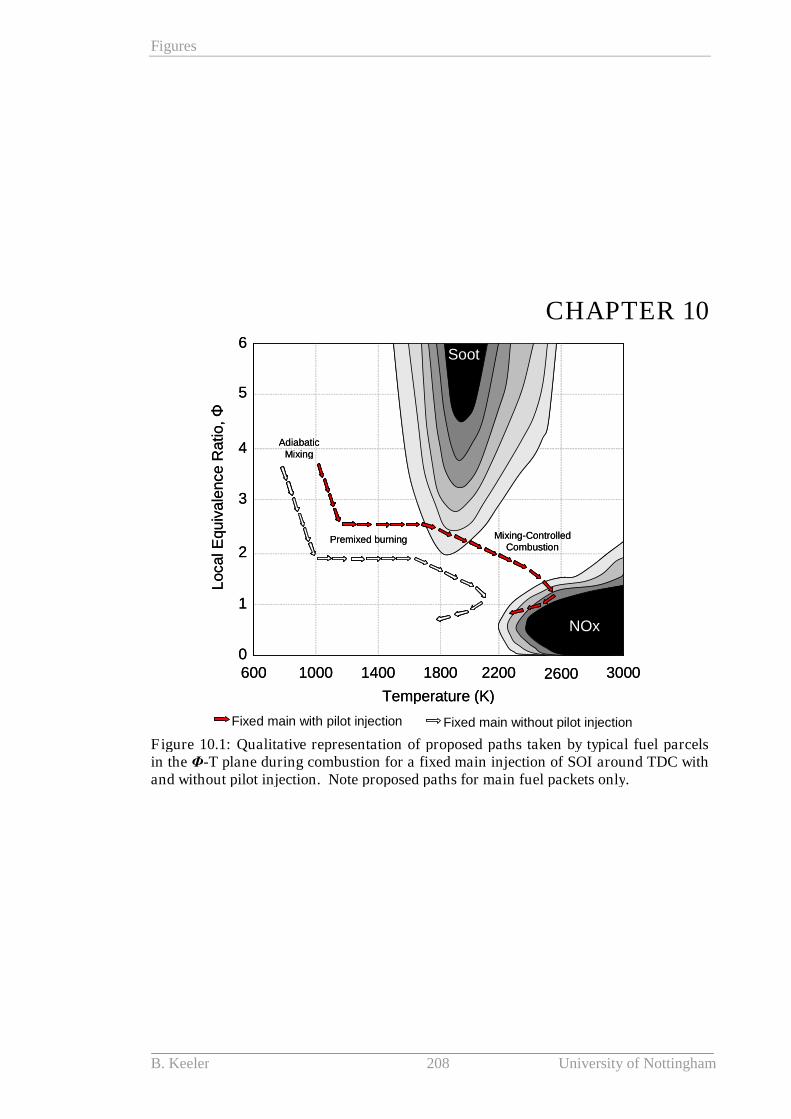
Figures
B. Keeler 208 University of Nottingham
CHAPTER 10
3000600 1400 1800 2200 260010000
1
2
3
4
5
6
Temperature (K)
LocalE
qu
ivale
nce
Ratio,Φ
NOx
Soot
Fixed main with pilot injection
AdiabaticMixing
Premixed burning Mixing-ControlledCombustion
Fixed main without pilot injection
3000600 1400 1800 2200 260010000
1
2
3
4
5
6
Temperature (K)
LocalE
qu
ivale
nce
Ratio,Φ
NOx
Soot
Fixed main with pilot injection
AdiabaticMixing
Premixed burning Mixing-ControlledCombustion
Fixed main without pilot injection
Figure 10.1: Qualitative representation of proposed paths taken by typical fuel parcelsin the Φ-T plane during combustion for a fixed main injection of SOI around TDC withand without pilot injection. Note proposed paths for main fuel packets only.
B. Keeler 209 University of Nottingham
APPENDICES
Appendix 1: Conversion from “dry” to “wet” analysis
The following derivation details how the water removed from the exhaust stream is
accounted for to calculate the true emission values. This method was originally devised by
Jones [74] from which the following work was reproduced:
The molar fraction of species i given by the analysers has the majority of the water
removed prior to analysis. The analyser outputs therefore give the “dry” fraction such:
2
* ii
exhaust H O
nx
n n
(A1.1)
The real “wet” composition, however, is given by:
ii
exhaust
nx
n (A1.2)
The mass fraction of water is calculated from the simplified combustion equation
(Equation 4.1). The mass of water lost in the chiller is then given by:
2 2
( ) 0.0055H O H O exhaustm lost x m (A1.3)
Where 0.55% is the mass of water left found from the saturation limit at 5ºC using a
psychrometric chart (example given in Figure 10.2 on page 210).
The number of moles of water removed is therefore:
2
2
2
H O lost
H O lost
H O
mn
m
(A1.4)
Rearranging Equation (A1.1) and dividing by the total number of moles in the exhaust:
2
*H O losti exhausti
exhaust exhaust
x n nn
n n
(A1.5)
Combining equations (A1.2) and (A1.5):
2
*H O losti exhaust
i
exhaust
x n nx
n
(A1.6)
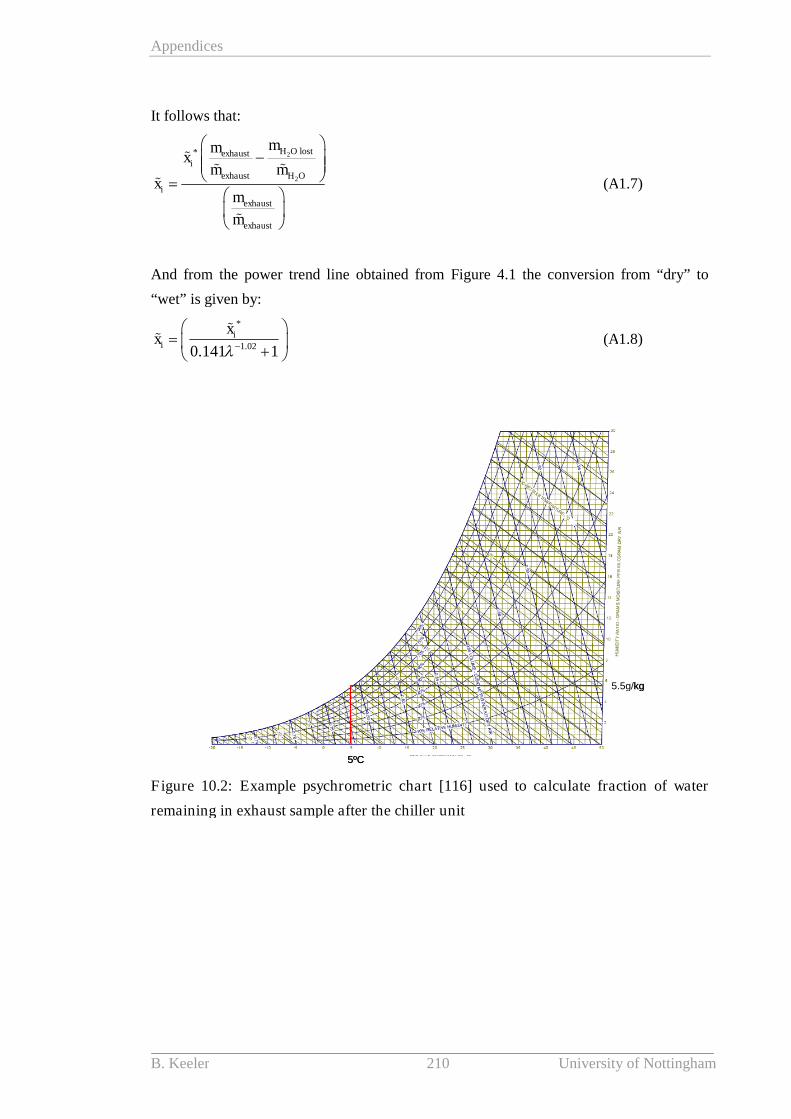
Appendices
B. Keeler 210 University of Nottingham
It follows that:
2
2
H O lost*
H O
exhausti
exhaust
i
exhaust
exhaust
mmx
m mx
m
m
(A1.7)
And from the power trend line obtained from Figure 4.1 the conversion from “dry” to
“wet” is given by:
*
1.020.141 1i
i
xx
(A1.8)
5ºC
5.5g/kg
5ºC
5.5g/kg
Figure 10.2: Example psychrometric chart [116] used to calculate fraction of water
remaining in exhaust sample after the chiller unit
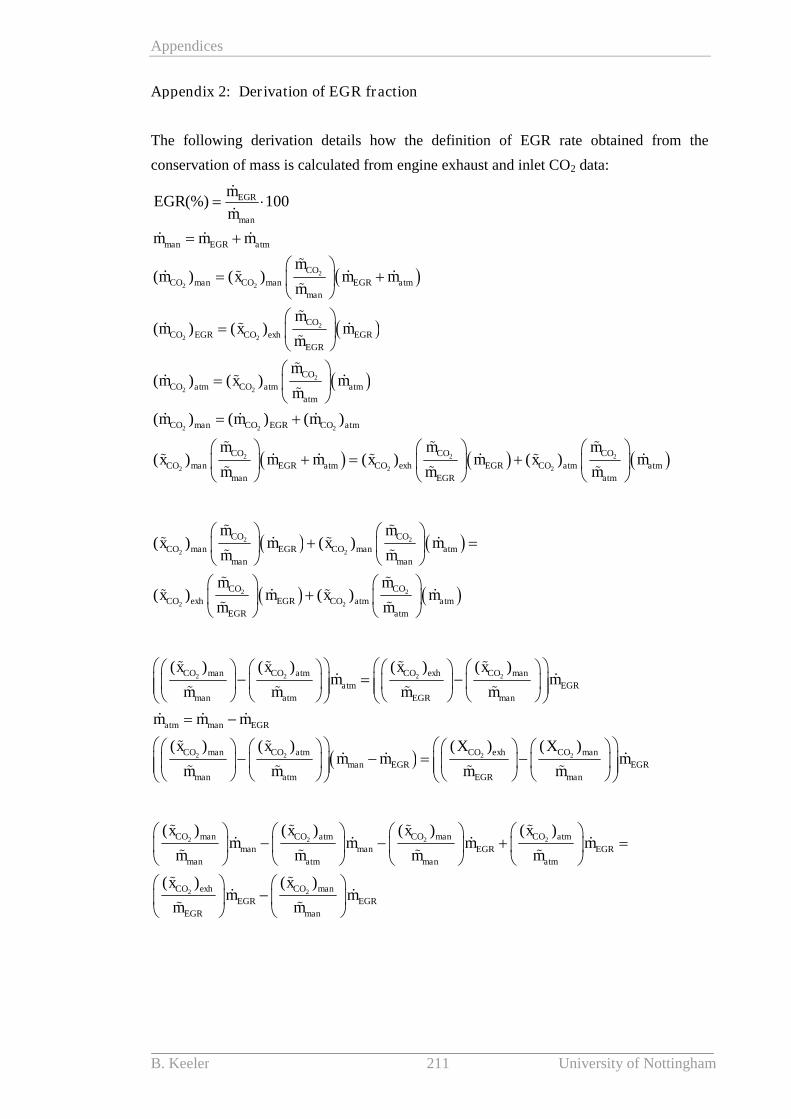
Appendices
B. Keeler 211 University of Nottingham
Appendix 2: Derivation of EGR fraction
The following derivation details how the definition of EGR rate obtained from the
conservation of mass is calculated from engine exhaust and inlet CO2 data:
2
2 2
2
2 2
2
2 2
2 2 2
(%) 100
( ) ( )
( ) ( )
( ) ( )
( ) ( ) ( )
EGR
man
man EGR atm
CO
CO man CO man EGR atm
man
CO
CO EGR CO exh EGR
EGR
CO
CO atm CO atm atm
atm
CO man CO EGR CO a
mEGR
m
m m m
mm x m m
m
mm x m
m
mm x m
m
m m m
2 2 2
2 2 2( ) ( ) ( )
tm
CO CO CO
CO man EGR atm CO exh EGR CO atm atm
man EGR atm
m m mx m m x m x m
m m m
2 2
2 2
2 2
2 2
( ) ( )
( ) ( )
CO CO
CO man EGR CO man atm
man man
CO CO
CO exh EGR CO atm atm
EGR atm
m mx m x m
m m
m mx m x m
m m
2 2 2 2
2 2 2
( ) ( ) ( ) ( )
( ) ( ) ( )
CO man CO atm CO exh CO man
atm EGR
man atm EGR man
atm man EGR
CO man CO atm CO e
man EGR
man atm
x x x xm m
m m m m
m m m
x x Xm m
m m
2
( )xh CO man
EGR
EGR man
Xm
m m
2 2 2 2
2 2
( ) ( ) ( ) ( )
( ) ( )
CO man CO atm CO man CO atm
man man EGR EGR
man atm man atm
CO exh CO man
EGR EGR
EGR man
x x x xm m m m
m m m m
x xm m
m m
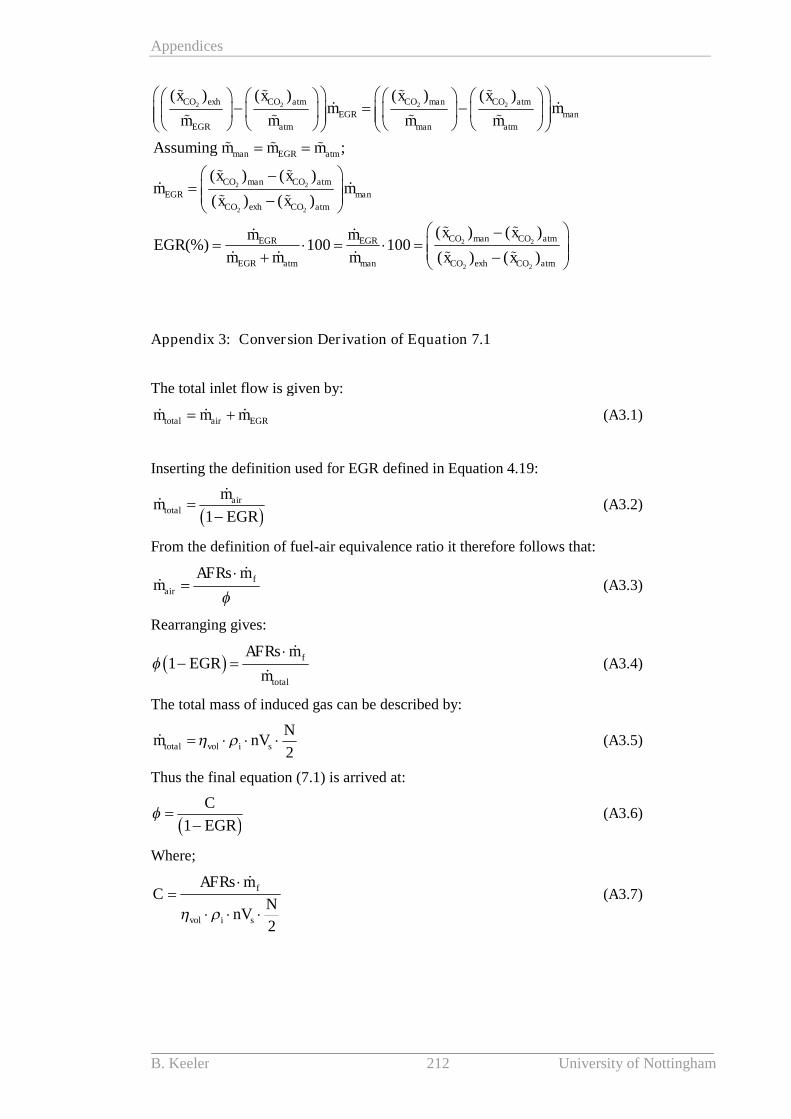
Appendices
B. Keeler 212 University of Nottingham
2 2 2 2
2 2
2 2
( ) ( ) ( ) ( )
Assuming ;
( ) ( )
( ) ( )
CO exh CO atm CO man CO atm
EGR man
EGR atm man atm
man EGR atm
CO man CO atm
EGR ma
CO exh CO atm
x x x xm m
m m m m
m m m
x xm m
x x
2 2
2 2
( ) ( )(%) 100 100
( ) ( )
n
CO man CO atmEGR EGR
EGR atm man CO exh CO atm
x xm mEGR
m m m x x
Appendix 3: Conversion Derivation of Equation 7.1
The total inlet flow is given by:
total air EGRm m m (A3.1)
Inserting the definition used for EGR defined in Equation 4.19:
1air
total
mm
EGR
(A3.2)
From the definition of fuel-air equivalence ratio it therefore follows that:
f
air
AFRs mm
(A3.3)
Rearranging gives:
1 f
total
AFRs mEGR
m
(A3.4)
The total mass of induced gas can be described by:
2total vol i s
Nm nV (A3.5)
Thus the final equation (7.1) is arrived at:
1
C
EGR
(A3.6)
Where;
2
f
vol i s
AFRs mC
NnV
(A3.7)
Appendices
B. Keeler 213 University of Nottingham
Appendix 4: Estimated required intake pressure as a function of engine load for
fixed fuel-air equivalence ratio
Assuming the air temperature downstream of the intercooler (heat exchanger) is fixed at a
temperature of 35ºC 1.005 /pc kJ kg for the intake fresh air [80].
Exhaust temperature is a function of engine load, but is also dependent on combustion
phasing and combustion efficiency. Generally it increases with increased fuelling. Using
experimental data recorded for the relatively retarded combustion phasing employed in
Chapter 9 (~+13ºATDC), a relationship between fuel quantity required (kg/s) and gross
indicated load output (bar) was obtained that could be extrapolated to higher loads:
7 2 46.24 10 2.18 10f g gm IMEP IMEP (A4.1)
Note the correlation in A4.1 is relevant for the conditions stated only. An approximation
of the temperature of the EGR gas to the intake manifold was then obtained. Here TEGR
represents the temperature (ºC) of the exhaust gas downstream of the EGR cooler
immediately upstream of the intake manifold:
20.92 50.2 44EGR g gT IMEP IMEP (A4.2)
Assuming the temperature of the compressed fresh air remains constant at 40ºC, the
mixture temperature in the intake manifold can be estimated by performing an enthalpy
balance. The enthalpy of the air is given by:
airair air p air refH m c T T
1.005 298air air airH m T (A4.3)
The enthalpy of the EGR is given by
EGREGR EGR p EGR refH m c T T
2981 EGREGR air p EGR
EGRH m c T
EGR
(A4.4)
The enthalpy of the mixture in the intake manifold is thus given by:
intakeintake intake intake
298 2981air EGR
p ref
air EGR
air p air p EGR
H m c T T
H H
EGRm c T c T
EGR
(A4.5)
Appendices
B. Keeler 214 University of Nottingham
EGRpc was calculated as a polynomial function of temperature [80] assuming the gas to be
air. Rearranging to solve for the intake temperature:
intake
intake
298 2981
298
11
air EGRp air p EGR
p
EGRc T c T
EGRT
EGRc
EGR
(A4.6)
The intake temperature can now be estimated by inputting the desired fuel flow rate or
IMEPg. The intake density is calculated from the ideal gas law:
intakeintake
intake
p
R T
(A4.7)
Rearranging equations A3.6 and A3.7 from Appendix 3 and substituting A4.7 the required
intake pressure required for a given value of equivalence ratio is given by:
intake
intake
12
s f
vol d
AFR m R Tp
NnV EGR
(A4.8)
Therefore the required intake pressure can be calculated for a desired rate of EGR and
fuel-air equivalence ratio at a specified engine speed and load.
Copyright © 2022 FDOKUMEN