Constraints on the Late Quaternary glaciations in Tibet from cosmogenic exposure age dating of...
90
1 Constraints on the late Quaternary glaciations in Tibet from cosmogenic exposure ages of moraine surfaces 2 Marie-Luce Chevalier a,b,* , George Hilley b , Paul Tapponnier c , Jérôme Van Der Woerd d , 4 Jing Liu-Zeng e , Robert C. Finkel f , Frederick J. Ryerson g , Haibing Li a , Xiaohan Liu e 6 a. Key laboratory for Continental Dynamics, Institute of Geology, CAGS, 26, Baiwanzhuang Road, 100037 Beijing, China, [email protected] , 8 [email protected] b. Department of Geological and Environmental Sciences, 450 Serra Mall, Braun Hall, 10 Stanford University, Stanford, CA 94305, USA, [email protected] c. Earth Observatory of Singapore, 50 Nanyang Ave, N2-01a-09, Singapore 639798, 12 [email protected] d. Institut de Physique du Globe de Strasbourg, UMR 7516 CNRS/ Université de 14 Strasbourg, 5 rue Descartes, 67084 Strasbourg, France, [email protected] e. Institute of Tibetan Plateau Research, Chinese Academy of Sciences, P.O. Box 2871, 16 18 Shuang Qing Road, 100085 Beijing, China, [email protected] , [email protected] f. Cerege, BP 80 Europole Méditerranéen de l'Arbois, 13545 Aix-en-Provence Cedex 4, 18 France, [email protected] g. L-231, Atmospheric, Earth and Energy Division, Physical and Life Sciences 20 directorate, Lawrence Livermore National Laboratory, Livermore, CA 94550, USA, [email protected] 22 24 Keywords: paleoclimate, moraine, glacier, glaciation, Tibet, Himalaya, timing of glaciation, cosmogenic, 10 Be, dating, proxy, geomorphology 26 28
Transcript of Constraints on the Late Quaternary glaciations in Tibet from cosmogenic exposure age dating of...

1
Constraints on the late Quaternary glaciations in Tibet from
cosmogenic exposure ages of moraine surfaces 2
Marie-Luce Chevaliera,b,*
, George Hilleyb, Paul Tapponnier
c, Jérôme Van Der Woerd
d, 4
Jing Liu-Zenge, Robert C. Finkel
f, Frederick J. Ryerson
g, Haibing Li
a, Xiaohan Liu
e
6
a. Key laboratory for Continental Dynamics, Institute of Geology, CAGS, 26,
Baiwanzhuang Road, 100037 Beijing, China, [email protected], 8
b. Department of Geological and Environmental Sciences, 450 Serra Mall, Braun Hall, 10
Stanford University, Stanford, CA 94305, USA, [email protected]
c. Earth Observatory of Singapore, 50 Nanyang Ave, N2-01a-09, Singapore 639798, 12
d. Institut de Physique du Globe de Strasbourg, UMR 7516 CNRS/ Université de 14
Strasbourg, 5 rue Descartes, 67084 Strasbourg, France, [email protected]
e. Institute of Tibetan Plateau Research, Chinese Academy of Sciences, P.O. Box 2871, 16
18 Shuang Qing Road, 100085 Beijing, China, [email protected], [email protected]
f. Cerege, BP 80 Europole Méditerranéen de l'Arbois, 13545 Aix-en-Provence Cedex 4, 18
France, [email protected]
g. L-231, Atmospheric, Earth and Energy Division, Physical and Life Sciences 20
directorate, Lawrence Livermore National Laboratory, Livermore, CA 94550, USA,
24
Keywords: paleoclimate, moraine, glacier, glaciation, Tibet, Himalaya, timing of
glaciation, cosmogenic, 10
Be, dating, proxy, geomorphology 26
28
*ManuscriptClick here to view linked References

2
Abstract:
This contribution provides new constraints on the timing of Tibetan glacial recessions 30
recorded by the abandonment of moraines. We present cosmogenic radionuclide 10
Be
inventories at 17 sites in southern and western Tibet (32 crests, 249 samples) and infer 32
the range of permissible emplacement ages based on these analyses. Individual large
embedded rock and boulder samples were collected from the crests of moraine surfaces 34
and analyzed for 10
Be abundance. We consider two scenarios to interpret the age of
glacial recession leading to the moraine surface formation from these sample exposure 36
ages: 1) Erosion of the moraine surface is insignificant and so the emplacement age of the
moraines is reflected by the mean sample age; and 2) Erosion progressively exposes large 38
boulders with little prior exposure, and so the oldest sample age records the minimum
moraine emplacement age. We found that depending on the scenario chosen, the moraine 40
emplacement age can vary by > 50% for ~100 ka-old samples. We consider two scaling
models for estimating the production rates of 10
Be in Tibet, which has an important, 42
although lesser, effect on inferred moraine ages. While the data presented herein
effectively increase the database of sample exposure ages from Tibet by ~20%, we find 44
that uncertainties related to the interpretation of the 10
Be abundance within individual
samples in terms of moraine emplacement ages are sufficient to accommodate either a 46
view in which glacial advances are associated with temperature minima or precipitation
maxima that are recorded by independent paleoclimate proxies. A reanalysis of published 48
data from moraines throughout Tibet shows that the variation we observe is not unique to
our dataset but rather is a robust feature of the Tibetan moraine age database. Thus, when 50
viewed in a similar way with other samples collected from this area, uncertainties within

3
moraine exposure ages obscure attribution of Tibetan glacial advances to temperature 52
minima or precipitation maxima. Our work suggests that more reliable chronologies of
Tibetan glaciations will come from improvements in production rate models for this 54
portion of the world, as well as a better understanding of the processes that form and
modify these geomorphic surfaces. 56
1. Introduction 58
Mountain glaciers are sensitive climatic markers that usually advance or withdraw
rapidly with changes in temperature and/or precipitation. In Tibetan and Himalayan 60
glacial valleys in particular, successions of multiple moraines that record glacial
recessions are common, providing a potential opportunity to investigate the nature of 62
climate changes in mid-latitude continental regions where climate proxies are far more
sparse than in ocean basins or polar ice-caps. Preserved embedded boulders on moraine 64
crests provide ideal targets for cosmogenic radionuclide surface-exposure dating (Gosse
and Phillips, 2001), which allows dating of features devoid of datable organic material or 66
features too old to be dated using radiocarbon.
A number of studies have recently been carried out to assess the timing of past 68
glaciations in Tibet and to infer the relative influence that precipitation and temperature
play in triggering glacial advances here (e.g. Gillespie and Molnar, 1995; Benn and 70
Owen, 1998; Owen et al., 2001, 2002, 2009; Brown et al., 2002; Schaefer et al., 2002,
2008; Van der Woerd et al., 2002; Finkel et al., 2003; Zech et al., 2005a, 2009; 72
Abramowski et al., 2006; Gayer et al., 2006; Seong et al., 2007, 2009; Zhou et al., 2007).
Such a chronology could help to inform how the high elevation and large area of the 74

4
Tibetan Plateau influences global climatic patterns, as there is some uncertainty as to
whether the winter Westerlies in the west and the summer South Asian Monsoon in the 76
east change their relative importance in response to long-period climate changes. Most
studies posit that Quaternary glaciations in Tibet and the Himalayas were asynchronous 78
with those of the Northern Hemisphere (e.g. Gillespie and Molnar, 1995; Benn and
Owen, 1998; Phillips et al., 2000; Richards et al., 2000; Owen et al., 2008b, 2009), 80
suggesting that increased precipitation during warm periods may be primarily responsible
for glacial advances. 82
While cosmogenic exposure age studies have provided important insights into the
potential controls on the timing of glacial advances, there is some question as to whether 84
the inferred ages of surface samples represent the moraine emplacement age in a
straightforward way. Typically, rock samples collected from the crest of a moraine are 86
analyzed for 10
Be concentrations (hereafter [10
Be]), which are used to infer the exposure
age of each of the surface samples. The age distribution of samples on the moraine crest 88
is then used to infer the emplacement age of the moraine (i.e. the transition between
glaciation and deglaciation, i.e. when the moraine starts to be exposed to cosmic-rays). 90
To this end, there are two main sources of uncertainty in moraine surface emplacement
ages that could be better characterized by a comprehensive dataset from across the 92
Tibetan Plateau. First, production rates of 10
Be vary strongly with atmospheric depth and
geomagnetic latitude—models of these effects are particularly poorly calibrated for the 94
Tibetan Plateau (e.g. Dunai, 2000; Stone, 2000; Gosse and Phillips, 2001; Balco et al.,
2008). Second, only a handful of samples are typically collected from a given moraine 96
surface/crest, and so the limited number of samples may introduce significant uncertainty

5
when interpreting a moraine emplacement age in terms of the rocks that are presently 98
mantling its surface. Also, while many studies assume that the mean age of surface-
mantling boulders represents the emplacement age of the moraine (e.g. Gosse et al., 1995; 100
Briner et al., 2001; Finkel et al., 2003; Meriaux et al., 2004; Chevalier et al., 2005a;
Owen et al., 2005; Barrows et al., 2007; Schaefer et al., 2009; Hedrick et al., in press), 102
others indicate that such boulders are progressively exhumed to the surface as erosion
winnows the fines from the moraine (e.g. Hallet and Putkonen, 1994; Lasserre et al., 104
2002; Putkonen and Swanson, 2003; Abramowski et al., 2004, 2006; Zech et al., 2005a,
2008, 2009; Applegate et al., 2010; Heyman et al., 2010) and erosion transports material 106
away from the crest. Thus, uncertainties in the way in which the moraine surface is
modified over time can alter the manner in which we relate the moraine emplacement age 108
to the exposure ages of the boulders mantling its surface.
In this contribution, we present new 10
Be surface exposure ages of 249 samples 110
(Table S1 in the Supplementary Information) collected in 2000-2007, on 32 lateral (and
one frontal) moraine crests (17 sites, red stars on Fig. 1) located over a region of ~1100 112
km by ~500 km in southern and western Tibet. This new dataset increases the size of the
Tibetan exposure age database by ~ 20% (compared to Heyman et al., 2010) and contains 114
enough data to allow a better understanding of the influence of the uncertainties in
moraine emplacement ages that result from the number and interpretation of samples 116
collected from the moraine surface. We found that when considering the quantifiable
uncertainties cited above, it is difficult to compellingly associate the timing of Tibetan 118
glacial advances with either temperature minima or precipitation maxima (assuming that
glacial advances during temperature maxima are driven by increased precipitation). 120

6
Indeed, the 18
O of ice varies with temperature; therefore it may be used to assess the
correlation between temperature minima and glacial expansion using this geochemical 122
proxy (Yao et al., 1996; Thompson et al., 1997). A precipitation-related glacial advance
is more difficult to constrain, but we know that an increase of precipitation (during both 124
warm and cold climate) brings snowfall at high elevation and allows glaciers to advance.
Our study suggests that the development of such chronologies would foremost benefit 126
from a better understanding of how these surfaces are denuded over time, and secondarily
from the construction of better constrained models that describe the distribution of 128
cosmogenic production rates in this area.
HERE APPROXIMATE LOCATION OF FIGURE 1 130
2. Methods 132
2.1 Sample processing and dating
Moraine crests were sampled by collecting fragments from the top surface of 134
discrete large embedded granite boulders (up to 4 m in diameter) on the crest (highest
point) of the moraine, or well-rooted cobbles (20-30 cm in diameter) in cases where 136
boulders were not present (see Table S1 for a complete description of each of the samples
collected). We sampled at least 5 different surface boulders/clasts from each moraine 138
crest, and up to 15 samples for large-size moraines with many available boulders.
Each rock sample was crushed, sieved, and cleaned to isolate quartz from the 140
sample, which is the mineral that we use to analyze the in situ-produced [10
Be]. The in-
situ produced 10
Be was isolated by progressive HF/HNO3 leaches to etch the exterior 142
portion of the quartz crystals that may contain garden-variety 10
Be that was sorbed on the

7
mineral surface (e.g. Brown et al., 1991; Kohl and Nishiizumi, 1992; Gosse and Phillips, 144
2001). The purified quartz was then digested, a 9Be carrier of known concentration was
added, and Be(OH)2 was chemically isolated using ion exchange columns. The Be(OH)2 146
was ignited to BeO, and the 10
Be/9Be ratios were measured at Lawrence Livermore
National Laboratory’s Center for Accelerator Mass Spectrometry (LLNL-CAMS, USA) 148
and the Aster Accelerator Mass Spectrometer at LN2C-Cerege, France. These ratios
were finally converted to [10
Be] using the measured total Be concentrations prior to 150
chemical separation.
The production rate of 10
Be scales with the atmospheric depth, geomagnetic 152
latitude, and geomagnetic field intensity. Thus, the history of the production rate must be
calculated at each sample location and integrated in time to find the exposure age that 154
most closely reproduces the measured 10
Be abundance. We used the CRONUS 2.2
calculator with the constant file 2.2.1 (Balco et al., 2008, http://hess.ess.washington.edu) 156
to infer each sample’s exposure age from its [10
Be].
158
2.2. Moraine dating
In this analysis, we assessed uncertainties in the measured [10
Be] of each rock 160
sample, the systematic uncertainties in the age of each sample that arise from
uncertainties in the appropriate 10
Be scaling model, and the systematic uncertainties 162
associated with the transformation of the exposure age of individual rock samples into the
emplacement age of the moraine surface. Analytical precision related to the Accelerator 164
Mass Spectrometer (AMS) measurement are reported in Table S1, and are typically on
the order of ~2-4% of the measured [10
Be]. These uncertainties are quite small relative to 166

8
the uncertainties associated with converting [10
Be] into sample exposure age and moraine
emplacement age. Therefore, we focus our attention on the uncertainties that arise from 168
(1) production rate scaling models and (2) the manner in which moraine emplacement
ages are inferred from the distribution of ages of rock samples collected from its crest. 170
There are a number of sites throughout the world where the 10
Be production rate
has been calibrated (e.g. Nishiizumi et al., 1989, 2007; Phillips et al., 2000); however, a 172
number of models have been developed to interpolate these point measurements to areas
where such measurements do not exist. The Tibetan Plateau in particular, lacks direct 174
calibration of production rates, and so we consider five different production rate scaling
models that span the range of likely production rates when inferring the exposure ages of 176
rocks (Balco et al., 2008). We regard the range in production rates spanned by these five
models (Lal (1991)/Stone (2000) time-dependent and Lal (1991)/Stone (2000) time-178
independent; Dunai, 2001; Desilets et al., 2003, 2006; and Lifton et al., 2005 models) as
capturing the uncertainties associated with our lack of direct calibration of production 180
rates in this area.
To assimilate systematic biases that exist between the production rate models into 182
the covariance of the sample ages, we would need to know the likelihood of the different
model scenarios, which is currently unavailable for samples collected from Tibet because 184
of a lack of direct measurement of cosmogenic sample ages that have been dated by
independent means. Thus, to provide some measure of uncertainty in moraine ages that 186
arises due to our lack of knowledge of the appropriate production rate model, we simply
report the range spanned by all model choices as encapsulating the range of possible ages 188
that arise due to variation between production rate models. We acknowledge that these

9
uncertainties are systematic and so will only subtly affect sample ages relative to one 190
another; nonetheless, this range provides a useful metric to evaluate the importance of
different sources of uncertainty in estimating the variations in a particular moraine's 192
absolute age when considering different production rate model scenarios.
Inferring the timing of glacial recession, which is recorded by the age of 194
abandonment of the moraine, requires a model that associates exposure ages of individual
samples on the surface of the moraine crest to an effective abandonment age (e.g. Phillips 196
et al., 1990). In the simplest model, clasts that are quarried by glacial erosion experience
little exposure to cosmogenic radiation prior to their transport and deposition, and the 198
surface of the moraine remains unmodified over time (assuming no post-glacial
shielding). Statistical analyses of published clast exposure ages suggest that the 200
percentage of surface boulders that experience exposure prior to glacial erosion may be
quite small (< 3%, Putkonen and Swanson, 2003), although this estimate may be biased 202
by a lack of reporting of exposure ages that appear unreasonably old relative to other ages
collected on the same surface (Putkonen and Swanson, 2003). In the case that the surface 204
remains stable over time, the mean age of boulders collected on the surface of the
moraine may reflect the emplacement age of the moraine surface, assuming that prior 206
exposure is as important as incomplete exposure due to post-glacial shielding (e.g. Zreda
et al., 1994; Gosse et al., 1995; Zreda and Phillips, 1995; Briner et al., 2001; Finkel et al., 208
2003; Meriaux et al., 2004; Chevalier et al., 2005a; Owen et al., 2005; Barrows et al.,
2007; Gillespie et al., 2008; Schaefer et al., 2009; Hedrick et al., in press). The small 210
fraction of rocks that may have experienced prior exposure to cosmogenic radiation
before being eroded, transported, and deposited by glacial processes may be revealed by 212

10
outlying boulder ages that are far older than the majority of the sample ages. In this case,
such outliers should be identified and discarded prior to computing the mean sample age 214
(e.g. Putkonen and Swanson, 2003; Meriaux et al., 2004; Chevalier et al., 2005a).
However, Applegate et al. (2010) recently argued that the mean is a poor estimator of 216
moraine age for data sets drawn from skewed parent distributions, and even excluding
outliers before calculating the mean does not improve this mismatch. 218
Alternatively, a second scenario can be envisioned in which the moraine surface
does not remain stable after its initial exposure. In this case, large boulders interspersed 220
throughout the deposit may be exhumed to the surface as erosion transports the fine, and
eventually, coarse material away (e.g. Hallet and Putkonen, 1994; Zreda et al., 1994; 222
Zreda and Phillips, 1995; Phillips et al., 1997; Lasserre et al., 2002; Putkonen and
Swanson, 2003; Abramowski et al., 2004, 2006; Briner et al. 2005; Zech et al., 2005a, 224
2008, 2009; Putkonen and O’Neal, 2006; Schaefer et al., 2008; Applegate et al., 2010;
Heyman et al., 2010). In this model, the exposure ages of boulders that gradually 226
accumulate on the surface of the moraine represent various stages of boulder exhumation
as the surface lowers around them and/or cryoturbation selectively brings boulders near 228
the surface. Should the prior exposure rate indeed be low (Putkonen and Swanson, 2003),
then the oldest age found on the surface should more closely represent the exposure age 230
of the moraine surface, although it is still considered a minimum exposure age (e.g.
Hallet and Putkonen, 1994; Zreda et al., 1994; Zreda and Phillips, 1995; Putkonen and 232
Swanson, 2003; Briner et al. 2005; Zech et al., 2008; Applegate et al., 2010; Heyman et
al., 2010). 234
It is not altogether clear which of these scenarios may be appropriate when

11
inferring the moraine surface emplacement age from sample exposure ages of boulders 236
on its surface. It is still an open question as to what conceptual model applies to moraine
degradation in a general sense, and to the majority of Tibetan moraines in particular. In 238
addition, especially for pre-Holocene moraines, the boulders themselves may begin to
suffer some attrition as smaller fragments are spalled from larger boulders. Processes 240
such as spallation, erosion, weathering, rolling and snow cover can all lead to apparent
young ages. The older the moraine, the more important these processes likely become. 242
Given the unknown rates of each of these processes that may be acting to modify the
Tibetan moraines, we consider both scenarios to represent the possible moraine 244
emplacement ages that may be inferred from the ages of clasts collected from their
surfaces. As with the different production rate models, this source of uncertainty, 246
hereafter referred to as that associated with the interpretive framework that relates sample
ages to moraine emplacement ages, produces a systematic variation. Because we do not 248
have prior information that sheds light on which of these two scenarios may be more
likely (and direct field observations to date do not inform the appropriateness of either of 250
these models as applied to Tibetan moraines), we report the possible moraine
emplacement ages that span these models of the interpretive framework. Finally, to 252
provide an estimate of the range of possible moraine ages that arises due to both variation
between production rate models and the interpretive framework, we use the production 254
rate scaling model of Lifton et al. (2005) with the mean age interpretive framework to
provide a minimum bound on moraine surface age, and the time-dependent production 256
rate scaling model of Lal (1991)/Stone (2000) with the oldest age interpretive framework
to provide an upper bound on moraine surface ages (which is nonetheless, still a 258

12
minimum age). Importantly, this range represents the quiver of end-member production
rate scaling scenarios that are adjusted for temporal changes in the geomagnetic intensity, 260
all of which produce ages that vary systematically with the model used.
The discussion about the correct interpretative model of moraine ages derives in 262
part from moraine age distributions obtained on individual moraine crests, which may
represent instantaneous temporal events of glacier retreat. This is particularly true when a 264
large number of samples, i.e. more than 5, are dated on a single moraine (e.g. Zreda and
Phillips, 1995; Lasserre et al., 2002; Meriaux et al., 2004; Chevalier et al., 2005a; Owen 266
et al., 2009). However, in most paleoclimatic studies involving cosmogenic dating of
Tibetan moraines, the tendency is to sample very few boulders (<5). For instance, if one 268
considers the large moraine ages database of Tibet (Owen et al., 2008b; Heyman et al.,
2010 and personal communication, hereafter referred to as Heyman et al. 2010, in 270
review) of about ~1300 boulders collected on ~320 individual moraine crests, only ~29%
of these moraines have at least 5 boulders dated per moraine and only ~2 % have at least 272
10 boulders dated per moraine. In comparison, our study, with 249 samples on 32
individual moraine crests (with >2 samples), has 88 % moraines (28 crests) with at least 5 274
samples, and 16% moraines (5 crests) with 10 or more samples.
Following Abramowski (2004) who distinguishes between the shape of different 276
age distributions when plotted from youngest to oldest on each moraine, we discuss
below the distribution of ages obtained on the 32 moraine crests after a presentation of 278
their geomorphic setting. Each moraine age distribution is shown with the results from
the two end-member production rate scaling scenarios that are adjusted for temporal 280
changes in the geomagnetic intensity (i.e. Lifton et al. (2005) and Lal (1991)/Stone

13
(2000) time-dependent). As advocated by Putkonen and Swanson (2003), we identified 282
clasts that contained prior exposure as samples whose exposure age was more than twice
that of the next oldest sample. These samples were not considered in calculating either 284
the mean or identifying the maximum rock sample exposure age for each moraine (it is
the case for two of our moraines: sample KC2-78 on #15 AQu and sample T7C-62 on #7 286
Xainza M, Table S1).
Finally, in the Discussion of this contribution, we explored scenarios in which 288
possible additional outliers were identified and excluded from the calculation of ages of
specific moraine crests at particular sites, by considering the samples whose error bars 290
(1) do not overlap with those of the other samples. As a consequence, mean and oldest
ages for these moraines are modified. We acknowledge that such outlier rejection is 292
subjective and we will therefore discuss each moraine case by case (Table 1). We then
ranked the moraine mean exposure ages into three groups based on their 1 standard 294
deviation, i.e. group 1, 2 and 3, for 1 <17%, 17% <1<32%, and 1 >32% of their
mean age, respectively (Table 1). Not surprisingly, as more outliers are rejected, more 296
moraines fit into group 1 or 2 (see Table 1). Again, we acknowledge that such quality
assessment of the age distribution is not robust, but it provides some insight into the 298
impact of different outlier rejection scenarios on the broader inferences of moraine age
distributions across Tibet. 300
HERE APPROXIMATE LOCATION OF TABLE 1 302
3. Results 304
3.1. Sampled Sites

14
Samples were collected along the Ayilari Range (Chaxikang CK and Manikala 306
moraines (Chevalier et al., 2005a)), the Kailas Range (AQu, West Xiong Se and East
Xiong Se moraines), the Pulan half-graben (Pulan Rongguo moraine), the KungCo half-308
graben (KungCo and Cho Oyu moraines), the Ama Drime Range (Dingye N and Dingye
S moraines), the Xainza graben (M4, M3, M2, M1 and M moraines), and the 310
Nyainqentanghla Range (YanBaJain, Ybj, and Gulu moraines) (locations shown in Fig.
1). Below, we describe each moraine site, from east to west. Details about the samples 312
(location, sample thickness, lithology, qualitative size, shielding factor, [10
Be], standard
used and model ages using all scaling models) are listed in Table S1 in the 314
Supplementary Information, as well as geomorphic maps and field photos of each site
and each sample collected, when available. While in the field, we focused our attention to 316
the particular geomorphic circumstances of our sites and sampled adequately (e.g.
samples collected from the crest, presenting minimum weathering, well-rooted cobbles or 318
embedded large boulders, top of boulders to limit shielding, located far from slopes or
gullies, etc.). 320
3.1.1. Nyainqentanghla Range: 322
HERE APPROXIMATE LOCATION OF FIGURE 2
HERE APPROXIMATE LOCATION OF FIGURE 3 324
YanBaJain and Gulu moraines are located on the southeastern side of the
Nyainqentanghla Range, the most prominent mountain range on the Tibetan Plateau, at 326
the edge of the monsoon-influenced Tibet region. Previous cosmogenic moraine
chronologies along the range, south of our Gulu site, have shown ages that range from 15 328

15
to 40 ka, and 50 to 110 ka (Owen et al., 2005). Initial morphotectonic mapping of these
sites was first carried out by Armijo et al. (1986) (drawing, Fig. 2). 330
The YanBaJain (Ybj) moraine is located at 30°N-90.2°E, at an elevation of
~5000-5300 m asl. It is composed of two lateral crests vertically offset by the active 332
normal fault along the range-front, and extends about 2 km southeast of the range-front
(Fig. 2, S1 and S2). The present-day glacier terminus is located about 3 km upstream 334
from the range-front. Several inset river terraces are observed along the present-day river
outwash (T on Fig. S1 and S2), located several tens of meters downslope from the range-336
front. The surface of the moraine is covered by a thin veneer of grass-topped turf with
emerging large embedded boulders (50 cm to 4 m in diameter, Fig. S2 to S4). We 338
collected 20 granite and quartzite boulders on the crest of the southern lateral moraine
(Ybj outer W #2a: T5C-25-34 and Ybj outer E #2c: T5C-35-44 on either side of the fault) 340
and 2 on the crest of the northern lateral moraine (Ybj outer N #2d: T5C-44bis-45). Five
additional samples were collected from the crest of an inset moraine, closer to the 342
present-day glacier (Ybj inner #2b: T5C-19-23) (Fig. 2, S3 and S4, Table S1).
Moraine Ybj outer W has ages that range from 15 to 41 ka, with a mean of 25±7 344
ka (using Lifton) (1~30%, group 2) (Fig. 3, Tables 1, 2 and S1). If sample T5C-30,
which seems different from all other samples at the 1 level, is considered as an outlier, 346
the mean clusters at 23±5 ka (1~22%, group 2) (Table 1). Moraine Ybj outer E has older
ages that range from 17 to 41 ka, with a mean of 34±8 ka (1~23%, group 2) (Fig. 3, 348
Tables 1 and S1). Sample T5C-35 seems different than all others at the 1 level, and if
considered as an outlier, produces a mean age of 36±5 ka (1~15%, group 1) (Table 1). 350
The five boulders of Ybj inner have ages that range from 10 to 18 ka, with a mean of

16
12±3 ka (1~26%, group 2) (Fig. 3, Tables 1 and S1). Considering sample T5C-22 as an 352
outlier results in a mean age of 11±2 ka (1~14%, group 1) (Table 1).
The Gulu moraine is located at 30.8°N-91.6°E, at an elevation of ~4800-5000 m 354
asl, at the terminus of a 4-km-long U-shaped valley, whose drainage area is headed by
Samdain Kangsang Peak (6532 m, Fig. 2, S5 and S6). The lateral moraine crests are 356
vertically offset by a series of normal faults along the range-front (Fig. S5), whose
rupture probably dates back to the M~8, 1951 Damxung earthquake (Armijo et al., 1986). 358
The moraine extends about 1 km east of the range-front and the present-day glacier
terminus is located about 4 km upstream from it. We collected 15 samples from large 360
embedded boulders located on the crest of the southern lateral moraine (Gulu W #1a:
T5C-58-64 and Gulu E #1b: T5C-66-73 on either side of the fault) (Fig. 2, S5 and S7, 362
Table S1). An inset frontal moraine located upstream (Fig. S6) was not sampled in this
study. The surface is covered by a thin veneer of grass-topped turf with emerging large 364
embedded granite boulders (up to 3 m in diameter, Fig. S6 and S7).
The ages of Gulu W (ranging from 14 to 16 ka) and Gulu E (from 15 to 18 ka) 366
average at 15±1 and 16±1 ka (using Lifton), respectively (Fig. 3, Tables 2 and S1). No
outliers are identified. Both moraines belong to group 1 (1~4-7%) (Table 1). While the 368
means are not significantly different, Gulu E is slightly older than Gulu W, as expected
for a slowly retreating glacier. These two tectonically separated ridges, while processed 370
as two different sets of samples, clearly belong to the same moraine crest, subsequently
offset by active normal faulting, and may be considered to belong to the same glacial 372
advance.
374

17
3.1.2. Xainza Range
HERE APPROXIMATE LOCATION OF FIGURE 4 376
HERE APPROXIMATE LOCATION OF FIGURE 5
The Xainza Range is located about 200 km west of the Nyainqentanghla Range, 378
south of Gyaring Co (Fig. 4 and S8). The five moraines sampled here are referred to as
M4 and M3, which are located on the eastern side of the northern range, in addition to 380
M2, M1 and M, which are located on the western side of the southern range.
The M4 moraine is located at 30.7°N-88.6°E, at an elevation of about 5200 m asl, 382
and consists of two wide lateral crests extending 4 km southeast of the range-front. The
present-day glacier terminus is located about 3 km upstream and is very restricted (Fig. 384
4). We collected 3 samples from large embedded boulders and two samples from well-
rooted cobbles (20-30 cm in diameter), all located on the crest of the southern moraine 386
(M4 # 3a (crest #1): T7C-7,11, 15, 17 and 18), and two samples from large embedded
boulders collected on two nearby crests (M4 #3b: T7C-14 and M4 #3c: T7C-12) (Fig. S9 388
and Table S1). The surface is not as sharp-crested as at Ybj or Gulu. We tried to avoid
weathered boulders as much as possible but the available boulders were typically 390
fractured. The surface is mantled by a thin veneer of turf on which only grass is growing,
with emerging boulders up to 1 m in diameter (Fig. S9 and S10). 392
The ages of moraine M4 (crest #1) range from 33 to 95 ka, with a mean of 55±26
ka (using Lifton) (1~46%, group 3) (Fig. 5, Tables 1 and S1). If samples T7C-11 and 394
T7C-17, which seem different from the others at the 1 level, are considered outliers, the
mean samples age is 38±6 ka (1~15%, group 1) (Table 1). 396
The M3 moraine is located 8 km southwest of M4 (Fig. 4 and S9), at 30.6°N-

18
88.5°E, at an elevation of about 5000-5300 m asl, and is composed of two relatively 398
sharp, lateral crests along the river outwash, 40-50 m lower (Fig. 4 and S11), as well as
an older lateral moraine ~1 km to the north that is not as sharp-crested. A smaller inset 400
moraine is present upstream from this location (Fig. S11 and S12). The frontal moraine
has been breached by the glacial outwash river, which is feeding a lake to the east. The 402
moraines extend about 3 km southeast of the range-front and were fed by glaciers coming
from 4 main valleys. Small ice patches are currently located about 4 km upstream from 404
the range-front. We collected 19 granite samples from large embedded boulders (n=16)
and well-rooted cobbles (20-30 cm in diameter, n=3) (Fig. S13 and S14) located on the 406
crests of the northern moraines: 5 (Xainza M3-old #4c: T7C-19-24) on the outer
smoother crest, 7 (Xainza M3 inner #4b: T7C-32-39) on the inner moraine upstream and 408
7 (Xainza M3 main #4a: T7C-24-30) on the main crest (Table S1). The main surfaces are
vegetation-free (Fig. S12) and are covered by ~1 m diameter boulders (Fig. S12 to S14). 410
The inset moraine is covered by huge 5-10 m fragmented boulders.
The samples on Xainza M3-old belong to the oldest surface samples ever dated in 412
Tibet and range from 132 to 448 ka, with a mean of 260±121 ka (using Lifton) (1~46%,
group 3). The oldest sample, T7C-22 seems different from the others at the 1 level and 414
considering it as an outlier allows to tighten the mean at 213±69 ka (1~32%, group 2)
(Tables 1 and S1). The samples on Xainza M3 inner have ages ranging from 10 to 14 ka, 416
with a mean of 12±1 ka (1~10%, group 1) (Fig.5, Tables 1 and 2). No outlier appears
present on that surface. The ages on Xainza M3 main range from 29 to 41 ka, with a 418
mean of 33±5 ka (1~15%, group 1) (Fig.5, Tables 1 and 2). Sample T7C-24-24bis
(same collected sample processed separately) may be different from the others at the 1 420

19
level and when considered as outliers, result in a mean age of 32±2 ka (1~5%, group 1)
(Fig. 5, Tables 1 and S1). 422
The M2 moraine is located about 60 km south of M3 (Fig. 4), at 30°N-88.4°E, at
an elevation of about 5300 m asl, and is composed of sharp lateral and frontal crests that 424
extend 3 km west of the range-front (Fig. S16). The U-shaped valley east of the range-
front is 4 km-long and is free of ice today. The large embedded boulders are up to 5 m in 426
diameter (Fig. S15 and S17) and show some signs of surficial weathering, although the
competence of the rock suggests limited attrition has taken place. We collected 11 granite 428
samples along the crest of the southern lateral moraine (Xainza M2 #5: T7C-40-51). The
surface of the moraine is vegetation-free (Fig. S15). 430
The ages on Xainza M2 range from 13 to 38 ka, with a mean of 26±8 ka (using
Lifton) (1~31%, group 2) (Tables 1 and 2). The three youngest samples do not overlap 432
with other samples at the 1 level, and when considered outliers, the mean becomes 31±5
ka (1~16%, group 1) (Fig. 5, Tables 1 and S1). 434
The M1 moraine is located 20 km south of M2 (Fig. 4), at 29.9°N-88.3°E, at an
elevation of about 5100 m asl and is composed of one sharp lateral crest on the west side 436
of the range (Fig. S16). The crest is up to 120 m higher than the river outwash (Fig. S15).
The present-day glacier terminus is located 6 km from the moraine terminus. We 438
collected samples from 9 large embedded granite boulders (up to 3 m in diameter) on the
western crest (Xainza M1 #6: T7C-63-72, Fig. S18, Table S1). The surface is slightly 440
vegetated with very short grass (Fig. S15).
The ages of Xainza M1 range from 21 to 27 ka, with a mean of 23±2 ka (using 442
Lifton) (1~7%, group 1) (Fig. 5, Tables 1, 2 and S1). No outliers can be identified.

20
The M moraine is located 15 km southwest of M1 (Fig. 4), at 29.8°N-88.2°E, at 444
an elevation of about 5300 m asl, and is composed of two sharp lateral crests. It extends >
10 km west of the range-front and the present-day glacier terminus is about 4 km 446
upstream from it (Fig. S16). The surface is mantled by a thin veneer of turf on which only
grass is growing, with large emerging embedded granite boulders (up to 6 m in diameter) 448
(Fig. S15 and S19). The river outwash has incised ~100 m-deep near the range-front, to
250 m-deep further downstream (Fig. S15). We collected 8 samples from the crest of the 450
southwestern moraine (Xainza M #7: T7C-55-62, Fig. 5 and S19, Table S1).
The ages of Xainza M range from 11 to 26 ka (sample T7C-62 already excluded 452
because it is twice the value of the next oldest sample; Putkonen and Swanson, 2003),
with a mean of 16±5 ka (using Lifton) (1~33%, group 3) (Tables 1 and 2). Sample T7C-454
59 seems different than the others at the 1 level, and when rejected, it allows to
calculate a mean of 15±4 ka (1~24%, group 2) (Fig. 5, Tables 1 and S1). 456
3.1.3. Ama Drime Range 458
HERE APPROXIMATE LOCATION OF FIGURE 6
HERE APPROXIMATE LOCATION OF FIGURE 7 460
The Ama Drime Range is located close to the Himalayan Range, south of the
Xainza graben and east of the Phung Chu-Arun river valley, which crosses the Himalaya 462
(Fig. 1). We collected samples from two sites (Dingye N and S) along its eastern front
(Fig. 6). 464
Dingye N moraine is located at 28.3°N-87.7°E, at an elevation of about 4700-
5100 m asl and is composed of two lateral crests (Fig. S20) that extend < 2 km from the 466

21
range-front. The U-shaped valley is about 3 km-long upstream from it and is free of ice
today. The surface is somewhat smooth, covered with well-rooted cobbles and lacks a 468
vegetative cover (Fig. S20). The river outwash has incised about 100 m deep. We
collected 14 samples (mostly quartzite, 20-30 cm in diameter) on the crest of the northern 470
lateral moraine (Dingye N #8: T5C-141-155, Fig. 6, 7 and S21, Table S1).
The ages of Dingye N range from 16 to 234 ka, with a mean of 73±59 ka (using 472
Lifton) (1~80%, group 3) (Tables 1 and 2). We note that the youngest ages are found
closer to the range front (samples T7C-141 to 148, with the exception of sample T7C-474
155) and that they may form a different group between 16 and 50 ka. Rejecting the
youngest sample T5C-141 from that younger population (as well as the 6 older samples), 476
because it is different than the others at the 1 level, allows to calculate a mean of 37±9
ka (1~23%, group 2) (Table 1). 478
The Dingye S moraine is located 20 km south of Dingye N, at 28.1°N-87.6°E, at
an elevation of ~5000-5300 m asl, and presents lateral moraine crests and one frontal 480
moraine that extends 3-4 km east of the range-front. The present-day glacier terminus
(and glacial lake) is located 3 km upstream. The lateral moraines are characterized by 482
well-rooted cobbles and large embedded boulders up to 4 m in diameter and are devoid of
vegetation (Fig. S22 and S23). Large truncated spurs (Fig. S22) are present at the site, 484
attesting the normal faulting activity along the range-front. We collected 7 samples (5
cobbles about 20-30 cm in diameter, and 2 boulders) on the crest of the frontal moraine 486
(Dingye S frontal #9a: T5C-133-140) and 15 samples (8 cobbles about 20-30 cm in
diameter, and 7 boulders) on the crest of the southern lateral inset moraine, far from the 488
facets (Dingye S main #9b: T5C-115-119, #9c: T5C-121-126, #9d: T5C-127-132) (Fig. 6,

22
7, S24 and S25, Table S1). 490
The ages of Dingye S main #9b (crest #1) range from 11 to 22 ka with a mean of
16±5 ka (using Lifton) (1~31%, group 2). Rejecting the oldest sample T5C-115 allows 492
to compute a mean of 13±2 ka (1~18%, group 2) (Table 1). The ages at Dingye S main
#9c (crest #2) range from 12 to 35 ka with a mean of 19±9 ka (1~44%, group 3) (Tables 494
1 and 2). Rejecting the two oldest samples brings the mean at 15±2 ka (1~16%, group 1)
(Table 1). The ages at Dingye S main #9d (crest #3) range from 13 to 35 ka with a mean 496
of 22±9 ka (1~38%, group 3). Rejecting the oldest sample T5C-130 brings the mean to
19±6 ka (1~30%, group 2) (Table 1). Finally, Dingye S frontal #9a has ages that range 498
from 15 to 22 ka with a mean of 19±2 ka (1~11%, group 1) (Tables 1 and 2). No outlier
can be identified. 500
3.1.4. KungCo half-graben 502
HERE APPROXIMATE LOCATION OF FIGURE 8
The KungCo half-graben is located ~120 km west of the Ama Drime Range, close 504
to the Himalayan Range. We collected samples from two sites: Cho Oyu and KungCo
(Fig. 8). 506
The Cho Oyu moraine is located at 28.3N-86.6E, at an elevation of about 5000 m
asl and consists of two sharp, lateral crests with no vegetation cover (Fig. 8 and S26). The 508
samples were embedded boulders of about 50 cm in diameter. We collected 4 samples on
the crest of the western moraine (Cho Oyu #10: KC2-A-E, Fig. 8, 10, Table S1). 510
The ages on Cho Oyu range from 24 to 27 ka, with a mean of 25±2ka (using
Lifton) (1~6%, group 1) (Tables 1 and 2). No outliers can be identified. 512

23
The KungCo moraine, first described by Armijo et al. (1986) (drawing, Fig. 8), is
located at 28.8°N-86.4°E, at an elevation of about 4800 m asl, and consists of two sharp, 514
lateral crests, with sparse grass cover. It is located on the western side of the range,
extending ~ 2 km west of the range-front (Fig. S26). The hanging U-shaped valley is free 516
of ice today. The moraines are vertically offset by the KungCo normal fault (Fig. S26),
whose activity has been discussed based on exhumation rate estimates in Maheo et al. 518
(2007). We collected 15 well-rooted quartzite cobbles of about 20-30 cm in diameter on
the crest of the northern moraine, far from the triangular facet (KungCo #11: KC2-266-520
280, Fig. 8, 10, Table S1).
The ages on the KungCo moraine range from 8 to 53 ka with a mean of 23±13 ka 522
(using Lifton) (1~56%, group 3) (Tables 1 and 2). Similarly to Dingye N, it is possible
to identify 5 old outliers; their exclusion results in a mean sample age of 15±4ka 524
(1~25%, group 2) (Table 1).
526
3.1.5. Rongguo moraine
HERE APPROXIMATE LOCATION OF FIGURE 9 528
HERE APPROXIMATE LOCATION OF FIGURE 10
The Pulan half-graben is located 600 km west of the KungCo half-graben, along 530
the western side of the Gurla Mandhata (7728 m), south of the Manasarovar and Raksas
lakes in the Kailas basin. 532
The Rongguo lateral moraines are located ~ 10 km north of the town of Pulan, at
an elevation of ~4500 m, at 30.3°N-81.2°E (Fig. 9), on either side of the Rongguo glacial 534
outwash. They form broad till ridges (M, M’, Fig. S27) that stand 150-250 m above the

24
outwash and extend ~ 5 km southwest of the Gurla Mandhata range front (Fig. S27). The 536
three crests we sampled were emplaced NW of the outwash, at the outlet of the deepest
and longest (> 20 km) U-shaped valley carved by the largest glacier on the south side of 538
Gurla Mandhata’s summit. The present terminus of this glacier lies ~12 km upstream.
Smaller glaciers hang from the north cliff of the Rongguo valley (photograph, Fig. S28). 540
The lower moraine M2 (Fig. 9) is broad, relatively flat-topped, and appears to extend
continuously downstream to the trunk valley to the Karnali river, which drains the Pulan 542
graben into Nepal’s Karnali river. The upper moraines M1E and M1W are much shorter,
with M1W extending < 1 km from the range-front. They have narrower sharper crests, 544
with slightly steeper inner edges that stand locally ~50 m higher than the flat surface of
the lower moraine M2, implying M1W was emplaced on top of M2. Between M1E and 546
M1W lies the range-front normal fault zone, whose trace has channeled rills born on the
facet, leading to transverse incision (Fig. 9). 548
All moraine surfaces contain large embedded granite boulders 1-2 m in diameter
with smaller well-rooted cobbles (~20-30 cm-diameter) interspersed (Fig. S28). The 550
surfaces are free of vegetation. The surfaces of M1E and M1W have a rougher, more
chaotic micro-topography. Eighteen samples were collected on the crests of the upper and 552
lower moraines, half of them from the top surface of boulders, the other half from cobbles
(20-30 cm in diameter, yellow and orange circles on Fig. 9, respectively): 3 samples on 554
the crest of M1W (#12a: KC2-39-44), 6 samples on the crest of M1E (#12c: KC2-45-50),
and 9 samples on the crest of M2 (#12b: KC2-51-59) (Fig. 9 and 10, Table S1). 556
On M1W the ages range from 17 to 21 ka with a mean of 19±2 ka (using Lifton)
(1~9%, group 1). No outlier is identified. On M1E the ages range from 18 to 40 ka with 558

25
a mean of 28±8 ka (1~29%, group 2) (Tables 1 and 2). No outlier is identified. The ages
on M2 are widely spread from 26 to 81 ka with a mean at 52±19 ka (1~37%, group 3) 560
(Tables 1 and 2). Rejecting the two youngest samples yields a mean age of 59±14 ka,
1~24%, group 2) (Fig. 10, Tables 1 and S1). Interestingly, while sample ages collected 562
from cobbles show systematically younger cosmogenic exposure ages than boulders at
sites along the San Andreas Fault (e.g. Behr et al., 2009), at this particular site, we 564
resolve no difference in exposure ages between these two populations (e.g. Briner, 2009).
For this reason, in the following analysis we include both boulder and cobble ages, 566
although the exclusion of these typically less-reliable cobble ages does not substantively
affect our results. 568
We can compare the ages we obtained on our M1W and M2 surfaces with the
ages presented in Owen et al. (2010) from M4a and M3, respectively. Our M2 ages (n=9) 570
range from 26 to 81 ka, while the ages from M3 surface (n=6) in Owen et al. (2010)
range from 25 to 52 ka (using Lifton). This might reflect that we picked more 572
representative samples from that minimum 80 ka-old surface. Concerning the younger
surface, our M1W (n=3) ages range from 17 to 21 ka, while the ages from M4a (n=6) in 574
Owen et al. (2010) range from 10 to 43 ka (using Lifton). Therefore it seems like this
surface might be at least twice as old as what we have found, implying that Owen et al. 576
(2010) may have picked more representative samples. One could wonder if our M1W and
M1E surfaces might actually be the same surface, that has been right-laterally offset by 578
the Gurla Mandhata fault. Indeed, M1E ages range from 18 to 40 ka, which is very
similar to what Owen et al. (2010) have for their M4a surface. 580

26
3.1.6. Kailas Range 582
The Kailas Range is located in western Tibet, north of the Rongguo site (Fig. 9).
The highest peak of the range is the Mt. Kailas (6714 m). We sampled three lateral 584
moraines on its southern side: AQu, West Xiong Se and East Xiong Se.
The West Xiong Se and East Xiong Se lateral moraines are located at 31°N – 586
81.2°E, at an elevation of ~4800 m asl (Fig. 9). They form part of a large, composite,
moraine ring complex abandoned by the Xiong Se glacier at the outlet of one of the 588
largest glacial valleys of the range, just west of Mount Kailas. The farthest-reaching lobes
of this moraine extend up to ~5 km south of the range-front (Fig. 9). The trunk glacier 590
that formerly covered the wide, flat-floored Xiong Se valley resulted from the confluence
of two main glaciers ~10 km north of the range-front. Hanging present-day tributary 592
glaciers remain on the north side of Mount Kailas, and much smaller ice patches are
perched ~15 km north of the range-front. Within the moraine complex, the Xiong Se 594
outwash river forms a ~90° dogleg bend along one of the innermost moraine rings (Fig. 9
and S30). Large, angular, embedded granite boulders are common along the inner ridge 596
crest of the East Xiong Se moraine (Fig. S30) where some small bushes are present at
places. Along the West Xiong Se outer moraine crest, covered by short grass, similarly 598
large embedded boulders, surrounded by smaller well-rooted ones are also found. Eight
and fourteen boulders were collected on the crests of the East and West Xiong Se lateral 600
moraines, respectively (EXS #13: KC2-66-74 and WXS #14: ZI-85-99, from south to
north, Fig. 11, Table S1). 602
The ages on EXS range from 12 to 16 ka with a mean of 14±1 ka (using Lifton)
(1~9%, group 1) (Tables 1 and 2). No outlier can be identified. On WXS the ages are 604

27
more scattered and range from 16 to 41 ka with a mean of 31±8 ka (1~24%, group 2)
(Tables 1 and 2). Separating the 3 youngest samples, which are different from all the 606
others at the 1 level allows to tighten the mean age at 35±4 ka (1~10%, group 1) (Fig.
11, Tables 1 and S1). 608
HERE APPROXIMATE LOCATION OF FIGURE 11
The AQu lateral moraines are located at about 31°N – 81.2°E, 6 km west of the 610
Xiong Se moraines, at an average elevation of 5100 m. They have well-defined shapes,
no vegetation, with sharp crests extending 5 km south of the Kailas range-front (dark pink 612
on Fig. 9; photographs, Fig. S29). The A Qu glacial valley was formed by the confluence
of two glaciers about ~3 km north of the Kailas range-front. The present-day termini lie 614
about 6 km north of the front, at 5500 m asl (Fig. 9). A younger moraine complex (light
pink on Fig. 9), which probably reflects the penultimate stages of glacial retreat, is inset 616
within and below the highest moraine crests. Seven embedded quartzite boulders, ~40 cm
in diameter (Fig. S29), were collected on the crest of the western AQu lateral moraine 618
(#15: KC2-75-83 from south to north, Fig. 9 and 11, Table S1).
The ages on AQu range from 19 to 32 ka (after sample KC2-78 was rejected as 620
being more than two times older than the next oldest sample on the moraine; Putkonen
and Swanson, 2003), with a mean of 25±5 ka (using Lifton) (1~20%, group 2) (Fig. 11, 622
Tables 1, 2 and S1). No other outlier can be identified.
624
3.1.7. Ayilari Range
HERE APPROXIMATE LOCATION OF FIGURE 12 626
HERE APPROXIMATE LOCATION OF FIGURE 13

28
The Ayilari Range is located 200 km northwest of the Kailas range in western 628
Tibet, near the disputed border between China and India. We collected samples from two
sites located north of the range: Manikala (Chevalier et al. 2005a, 2005b) and Chaxikang 630
CK (Fig. 12).
The Manikala moraine complex lies at the base of the Ayilari range-front, which 632
bounds the west side of the Gar valley, a large basin floored by marshland. It is located at
32°N-80°E and ~4600 m asl. The moraines lie northeast of the U-shaped Manikala 634
valley, a glacial trough deeply entrenched into the range (Fig. 12). They were emplaced
by the Manikala Daer glacier, whose terminus is currently ~7 km upstream. The relative 636
ages of the moraine groups can be qualitatively assessed from their surface characteristics
and from their distance to the upstream source valley (Fig. S2 in Chevalier et al., 2005a). 638
The M1 surface is rough and composed of chaotically distributed embedded blocks as
large as 3 m in diameter, which are surrounded by coarse debris, and is devoid of 640
vegetation. The smoother surface of M2 appears older, with well-rooted blocks tens of
centimeters to a meter in diameter protruding above a mantle of smaller debris and no 642
vegetation. The surface of M3 is even smoother and is probably the oldest surface of the
moraine complex, with relatively smaller well-rooted blocks and still no vegetation. The 644
youngest moraine group, M1 (Fig. 12), is the only one present on both sides of the
Manikala outwash valley and displays terminal lobes and sharply defined ridge crests. 646
We collected 9 well-rooted quartzite cobbles (20-30 cm in diameter) on the crest of M1
(#16a: WG-11-19), 18 on the crest of M2 (M2W #16c: WG-20-27, M2E #16b: WG-1-10) 648
and 7 on the crest of M3 (#16d: WG-28-34) (Fig. 12 and 13, Table S1).
The ages on the crest of Manikala moraine M1 range from 18 to 37 ka with a 650

29
mean of 30±7 ka (using Lifton) (1~23%, group 2) (Tables 1 and 2). Separating the
samples in two groups, the two youngest samples of 20 ka on one side and the older ones 652
on the other side, results in a mean sample age of 33±2 ka (1~7%, group 1) for the older
group (Table 1). The ages on the crest of Manikala M2W range from 80 to 132 ka, with a 654
mean of 106±16 ka (1~15%, group 1). No outliers are identified. The ages on the crest
of Manikala M2E range from 106 to 236 ka with a mean of 155±48 ka (1~31%, group 656
2). Considering the three oldest samples as outliers results in a mean sample age of
127±20 ka (1~15%, group 1) (Table 1). The ages on the crest of Manikala M3 range 658
from 33 to 163 ka with a mean of 96±49 ka (1~51%, group 3). Rejecting the 4 youngest
samples because they are different from the others at the 1 level and because geologic 660
relationships require M3 to be older than M2 and M1, revises the mean sample age to
144±20 ka (1~13%, group 1) (Fig. 13, Tables 1 and S1). 662
The Chaxikang moraines (CK M1, M2, M3 and M4) are located 60 km west of
Manikala, and lie between the Indus River and the Ayilari range at elevations between 664
4250 and 4530 m. These moraines are located at the outlet of a large flat-floored glacial
valley, the Miren Nongba valley (MRNB, Fig. 12). At times of larger glacial extent, the 666
glacier flowed down from the ice-cap topping the westernmost part of the Ayilari Range
(5800-5900 m asl), almost all the way to the Indus flood-plain, a distance of ~20 km. 668
Today, only small ice patches are left on top of this part of the range, in contrast to the
more extensive ice cover farther south (Fig. 12). 670
Following the work of Liu (1993), which was mostly based on Spot image
interpretation, we have mapped (on Ikonos images and 1/50 000 topographic maps) four 672
main sets of distinct moraines, emplaced downstream from the outlet of the valley (Fig.

30
12). The youngest moraine (M1, light pink, Fig. 12) extends ~1.6 km northeast of the 674
range-front. This innermost moraine is incised ~20-30 m by the present outwash.
Asymmetric patches of only one main, abandoned terrace are visible along the outwash 676
river bed (yellow patches). An older moraine complex (M2, dark pink), at the outlet of
which the present-day river has incised a narrow, 50-60 m deep canyon, extends ~3.6 km 678
from the range-front. The oldest moraine complex (M3, light purple) extends 5.2 km
from the range-front. The terminus of this complex is not preserved. It has been eroded 680
and breached by the river, as it fanned out of the canyon incised into M2 and M3.
There are other more ancient moraine complexes, whose distinctive shapes 682
indicate that significant surface modification has taken place (for example, M4, dark
purple, Fig. 12). Eighteen samples were collected at Chaxikang, along the two distinct 684
vegetation-free moraines on the south side of the Miren Nongba valley: 7 on the crest of
CK M3 (#17a: CK-40-48), 8 on the crest of CK M2 outer (#17c: CK-54-63) and 3 on the 686
crest of CK M2 inner (#17b: CK-50-53). All samples were from embedded quartzite
boulders 20 to 70 cm in diameter (Fig. S31). 688
The ages on CK M3 range from 83 to 129 ka with a mean of 104±17 ka (using
Lifton) (1~16%, group 1). The spread of ages is regular and no outliers can be 690
identified. The ages on CK M2 outer range from 21 to 58 ka with a mean of 41±14 ka
(1~33%, group 3) (Tables 1 and 2). At the 1 level, the three oldest samples might be 692
considered outliers, resulting in a mean sample age of 32±8 ka (1~24%, group 2) (Table
1). The ages on CK M2 inner range from 14 to 69 ka with a mean of 44±28 ka (1~62%, 694
group 3). Considering the youngest sample as an outlier brings the mean to 59±13 ka
(1~22%, group 2) (Fig. 13, Tables 1 and S1). 696

31
3.2. Moraine Age Distribution 698
HERE APPROXIMATE LOCATION OF FIGURE 14
The uncertainties associated with scaling models and with geomorphic 700
interpretation of the moraine emplacement age is illustrated in Fig. 14. The uncertainties
in determining moraine exposure age based on the choice of oldest or mean rock sample 702
exposure age on each moraine are shown in Fig. 14A,C versus Fig. 14B,D, respectively.
Scaling models advocated by Lifton et al. (2005) (Fig. 14C,D) yield systematically 704
younger rock sample exposure ages than a version of the Lal (1991)/Stone (2000) scaling
model that is scaled for temporal variations in geomagnetic field intensities (Fig. 14A,B). 706
On Fig.14A and 14D, we also represented the probability density function (PDF) of all
the moraine emplacement ages supposing that each age was normally distributed. The 708
summed PDF was normalized such that the integrated probability density between -∞ and
∞ was unity. We acknowledge that such a summation assumes that we have sampled 710
different moraines without bias as to their ages and location, which is certainly not
correct (e.g. Phillips et al., 1997; Putkonen and Swanson, 2003). However, such a PDF 712
illustrates the magnitude of change in the overall age distributions that is incurred when
different scenarios are considered. The Gaussian distributions produced by each moraine 714
age were then summed and presented together and according to their group, with group 1
being the most straightforwardly interpreted moraines (due to the tight clustering of 716
individual rock sample ages) and group 3 being the most problematic (due to the wide
distribution of sample ages). 718
As expected, moraine ages derived from the oldest age scenario are

32
systematically older than those derived from using the mean age scenario, regardless of 720
the scaling model used. While the magnitude of this systematic change depends on the
specific distribution of rock sample exposure ages on each moraine, it is not unusual for 722
the moraine exposure age to vary >50% between each of these two scenarios. The
moraine age distribution shows a large number of moraines between 10 and 50 ka, group 724
1 moraines showing distinctive peaks between 10 and 40 ka. The largest number of
moraines from all groups is around 25 ka when the mean age is considered, or 50 ka 726
when the oldest age is considered (Fig. 14A and 14D).
HERE APPROXIMATE LOCATION OF FIGURE 15 728
We then grouped our moraines in Tibet (solid line in Fig. 15), or within different
sub-regions within the area (solid line in Fig. 16) to assess how the different sources of 730
uncertainty impact regional interpretations of the distribution of moraine exposure ages.
This analysis does not include moraines < 20 ka with < 5 samples, and moraines > 20 ka 732
with < 6 samples per crest (** on Fig. 14 and in Table S1), nor did we include crests >
120 ka (* on Fig. 14 and in Table S1). This represents 20 crests and 170 samples (Table 734
2), from all groups 1, 2 and 3, i.e. 32 crests minus M4 #1, Dingye S main #1, Dingye S
main #3, Cho Oyu, Pulan M1W, CK M2 inner, M3-old, Dingye N, Manikala M2E, 736
Manikala M2E, Manikala M3 and CK M3. In addition to our dataset (solid line in Fig. 15
and 16), we added the results from 51 published moraine crests (or 354 samples) in the 738
same area (dashed line in Fig. 15 and 16) (Fig. 1 inset, Tables 2, S1 and S2 and text
below for more details). 740
When interpreting moraine exposure ages in terms of the mean exposure age of
samples collected from its surface for all of Tibet (dashed line, Fig. 15B), the age 742

33
distribution reaches peaks at 2, 14, 30 and (65) ka, but nonetheless shows relatively poor
definition. With just our data, there are peaks at 15 and 24-29 ka (solid line, Fig. 15B). In 744
contrast, viewing the Tibetan moraine exposure ages in terms of the oldest sample
exposure age collected from its surface fundamentally changes the age distribution of 746
moraines (Fig. 15A). Instead of a dominant peak at ~30 ka, the maximum age model
shows an age distribution that is highly variable with multiple peaks since 120 ka (at 3-5, 748
8, 10, (13), 17, (24), 31, 43-49, 66, 96 and (114) for the compilation and at 17, 20, 25, 31,
48, 66 and 95 ka for our data alone). In both cases, varying the scaling model both 750
translates and distorts the specific form of each of the PDFs.
Combining our moraine ages throughout our study area may obscure the spatial 752
pattern of the timing of glaciations, and so we divided our dataset into sub-regions of
Tibet and the Himalayas as defined by Owen et al. (2008b): Transhimalaya and western 754
Tibet, the monsoon influenced Himalaya and the monsoon-influenced Tibet (solid line on
Fig. 16) and repeated this analysis. 756
We present the two scenarios for the distribution of moraine ages in the area in
Fig. 15-16 for expediency and illustration. As before, we acknowledge that the 758
construction of such a PDF assumes that we have sampled both old and young moraines
in a representative manner. In Fig. 16A-C-E-G, we show the PDF that is produced by 760
interpreting the moraine exposure age in terms of the oldest exposure age, using the
Lal(1991)/Stone(2000) time-varying scaling model. In Fig. 16B-D-F-H, we considered 762
the mean age of the rock samples on each moraine, calculated using the Lifton et al.
(2005) scaling model, to represent each moraine surface’s emplacement age. 764
When considering the oldest exposure age of all samples collected from the

34
moraine crest (dashed line on Fig. 16 A, C, E, and G), we find peaks at 2, 5, 8, 10, 16, 766
(66), 77 and 114 ka for the westernmost orogen; peaks at (2), 7, 13, 17, 38-55, 69, 95 and
(114) ka for the Transhimalaya and western Tibet (peaks at 17, 38-42, 48 and 68 ka with 768
just our data); peaks at 3, (5), 16, 24, 42, 50, 62 and 95 ka for the monsoon-influenced
Himalaya (peaks at 25, 43 and 95 ka with just our data); and peaks at 20, 31, 49 and 65 ka 770
for the monsoon-influenced Tibet (peaks at (16), 20, 31, 49 and 65 ka with just our data).
No moraines <10 ka appear from the monsoon-influenced Tibet, most probably due to a 772
sampling bias because our study presents more moraines > 20 ka, those moraines that are
< 20 ka-old are produced from the compiled data. Older peaks in moraine ages are 774
observed at 77 and 114 ka only in the westernmost orogen region, while peaks at 95 ka
are observed in both the Transhimalayas and Monsoon-influenced Himalayan regions. 776
HERE APPROXIMATE LOCATION OF FIGURE 16
As with data from across the region, interpreting moraine exposure ages in terms 778
of the mean rock sample exposure age on each moraine's surface profoundly changes
each of the regional moraine-age PDFs. We find peaks (dashed line on Fig. 16 B, D, F 780
and H) at 2, (7), (9), 14, 33 and 66 ka for the westernmost orogen; peaks at (6-8), 13 and
32 ka for the Transhimalaya and western Tibet (peaks at 14 and 29 ka with just our data); 782
peaks at 2, 12, 20, 29 and (61) ka for the monsoon-influenced Himalaya (peaks at 19, 26
and 52 ka with just our data); and peaks at (12), 15, 24 and 28 ka for the monsoon-784
influenced Tibet (peaks at (12), 15, 24 and 28 ka with just our data). In all areas, we
observe a broad peak in the moraine age PDF between ~20-60 ka (20-40 ka in the 786
monsoon-influenced Tibet).
788

35
4. Discussion
4.1 Effects of data sampling methodology on moraine surface exposure ages 790
While in the field, we attempted to collect samples from large boulders that were
well seated along the moraine crest. Nonetheless, at some sites, these materials were not 792
available, and yet at others, the crest of the moraine was less distinct. Thus, it is important
to acknowledge that while we collected samples that we felt had the highest probability 794
of being unaffected by near-surface processes, there were certainly sites that were
geomorphically more straightforward than others and as such, some of the variation we 796
observe in sample age distributions at individual moraine sites may arise due to local site
and sampling conditions. At sites where both cobbles and boulders were analyzed, the 798
ages yielded by these two different populations were indistinguishable (Table S1 and
Briner, 2009). This consistency might be interpreted as either an indication that samples 800
from these sites record similar moraine surface processes and/or age of surface
establishment, or that our sites were so poorly selected that neither boulder nor cobble 802
ages provide a meaningful estimate of the moraine emplacement age. Below, we provide
an assessment of the relative fidelity of our dataset by viewing our results in the context 804
of the larger Tibetan moraine sample age database that spans many working groups
across this region to determine if our sampling produced anomalous exposure ages 806
relative to other work reported from this area.
First, we conducted a visual comparison of our sampling sites with those of other 808
working groups in the region (Fig. S32). For most of the moraines analyzed, the visual
characteristics of the surfaces we sampled did not appear to be substantively different 810
than those sampled by others. Second, we compiled all sample ages reported for all

36
moraines in this region, and used the CRONUS online calculator to determine sample 812
ages in a manner identical to the methods used for our dataset. We assessed the variation
within the sample age distribution by calculating the ratio of the maximum age to the 814
mean age (using the time-dependent scaling model of Lal/Stone) for each moraine
sampled by different working groups throughout Tibet (Table 2 and Fig. 17A). Not only 816
does this metric in part quantify the variation in moraine sample ages, but provides a
measure of the change in the inferred moraine surface exposure age that is incurred by 818
using the two different interpretive frameworks discussed above. Two important
conclusions can be reached by analyzing Figure 17A: all sampled moraines from Tibet 820
show a comparable range in this ratio, regardless of the group that is working there, with
our data (closed circles) falling cleanly within this pattern, and a regression analysis 822
shows that the ratio of maximum to mean age is poorly correlated with increasing mean
age. This latter point allows us to create a PDF of the maximum to mean age ratio for 824
samples collected by other working groups (dashed line, Fig. 17B) as well as samples
collected as part of this work (solid line, Fig. 17B). Both visual inspection, as well as a 826
two-sided Student's T-test shows that the means of these populations are
indistinguishable at the 95% level. Thus, while on the surface our sample ages appear 828
highly variable and as a result, might lead to the supposition that our sampling was
particularly poorly executed, this analysis shows that our data are no more (or no less) 830
variable than all other dated moraines in Tibet. Thus, either sampling has been poorly
carried out by all workers from this region (including us), or geological factors such as 832
prior exposure or post-glacial shielding may be important contributors to the observed
variation in sample ages from this region. 834

37
HERE APPROXIMATE LOCATION OF FIGURE 17
836
4.2 Regional climate correlations
The timing of glaciations in Tibet revealed by the exposure age of glacial moraine 838
surfaces has previously been used to infer the spatio-temporal distribution of temperature
and precipitation changes in the area (e.g. Finkel et al., 2003; Owen et al., 2005). These 840
types of studies are particularly relevant for testing conceptual models of changes in
atmospheric circulation in the vicinity of the high plateau as climate transitions between 842
generally warm and cold periods in Earth’s recent (< 150 ka) past (e.g. Ruddiman and
Kutzbach, 1989; Raymo and Ruddiman, 1992; Benn and Owen, 1998; Lehmkuhl and 844
Haselein, 2000; Aizen et al., 2001; Brown et al., 2003; Abramowski et al., 2006; Harris,
2006). To assess the sensitivity of such interpretations to uncertainties in the scaling 846
model used, or those associated with inferring moraine ages from the distribution of
surface sample ages, we compiled all available exposure age sample data from this region 848
and analyzed them in a manner identical to that presented above. These data include a
recent compilation of >1000 10
Be moraine ages (Owen et al., 2008b; Heyman et al., 850
2010) spread out in four climatic zones in the Himalayan-Tibetan orogen (Owen et al.,
2008b): 1) the Westernmost orogen (Tibet and Himalaya), 2) the Transhimalaya and 852
Western Tibet region, 3) the monsoon-influenced Himalaya, and 4) the monsoon-
influenced Tibet. Following Putkonen and Swanson (2003), we required that a minimum 854
number of samples (at least 5 samples for moraines < 20 ka and at least 6 samples for
moraines > 20 ka) be collected and analyzed from each moraine crest to ensure that either 856
the mean or oldest sample age was identified. This criterion eliminates [10
Be] reported

38
from samples from moraine surfaces that are presented in a number of studies (e.g. 858
Phillips et al., 2000; Owen et al., 2001, 2002, 2003b,c, 2005, 2006a,b; Brown et al., 2002;
Schaefer et al., 2002; Tschudi et al., 2003; Barnard et al., 2004a, 2006; Colgan et al., 860
2006; Gayer et al., 2006; Heimsath and McGlynn, 2008; Strasky et al., 2009, Zech et al.,
2009). The data remaining (Finkel et al., 2003; Owen et al., 2003a, 2009, 2010; 862
Abramowski et al., 2004, 2006; Barnard et al. 2004b; Meriaux et al., 2004; Chevalier et
al., 2005a; Zech et al., 2005a; Seong et al., 2007, 2009; Zhou et al., 2007; Dortch et al., 864
2010; Hedrick et al., in press) include 51 crests (354 samples) and 20 crests (170
samples) from our study (moraine ages are given in Table 2 and individual sample ages in 866
Tables S1 and S2; locations shown in Fig. 1). Note that four studies have one outlier each
and that we took the next oldest age to represent the moraine age (moraine m2 in Barnard 868
et al., 2004b: NDL29; moraine m2i in Seong et al., 2007: K2-83; moraine PM-2 in
Hedrick et al., in press: India-13; and moraine T4 in Owen et al., 2009: ron12; italic in 870
Table S2).
The moraine exposure age distribution deduced from the compilation of all 872
moraines <120 ka with a sufficient number of samples is shown as a dashed line in Fig.
15. Overall, the inclusion of additional moraine sites from others gives definition to, but 874
does not change the salient aspects of the PDF determined from our dataset (solid line in
Fig. 15). Additionally, when using the oldest sample exposure age to represent the 876
moraine exposure age, inclusion of additional sample sites generally strengthens those
peaks in the PDF calculated from only our dataset (solid line in Fig. 15A). Thus, while 878
our data are consistent with those collected by others, the choice of how the exposure age
of the moraine is related to the exposure age of samples mantling its surface, plays an 880

39
important control on determining the first-order structure of the moraine-age PDF from
this area. 882
As with only our data (Fig. 16, solid lines), we subdivided the moraine exposure
ages inferred from all samples that have been analyzed in this area according to their 884
geographic region (Fig. 16, dashed lines). As with the moraine exposure age PDF
computed from all regions (Fig. 15), the inclusion of additional data strengthens the 886
overall shape and definition of the PDFs determined from our data.
Finally, we consider moraine age distributions that result from a reanalysis of the 888
data after removing additional data outliers as discussed above. Although these results
may be less reliable because of the subjective nature of rejecting outliers in the data, it is 890
clear from Figure 18 (Table 1), that the increase in number of moraines in group 1 (n=11
to n=20) allows identification of moraine age peaks around ~17-25, ~40 and ~100-200 892
ka, regardless of the scaling model used. These peaks in the moraine age distribution may
broadly correspond to the cold periods recognized globally as MIS-2, MIS-3 and MIS-6, 894
respectively (Fig. 18, Marine Isotope Stages of Imbrie et al., 1984).
HERE APPROXIMATE LOCATION OF FIGURE 18 896
HERE APPROXIMATE LOCATION OF FIGURE 19
The 18
O composition of glacial ice varies systematically and inversely with 898
temperature (Yao et al., 1996), and this variation provides a means of assessing the
correlation between temperature minima and glacial expansion recorded in the geologic 900
record. Ice core records from Tibet have been collected at the Guliya ice cap in Tibet
(Thompson et al., 1997), which contain a record of ~400 year fluctuations in temperature 902
for this region over the last 132 ka (Fig. 19C). Such high frequency features are

40
impossible to resolve given the precision of [10
Be] of samples collected from our moraine 904
crests. To provide a rational means of comparing such high-resolution ice cores with our
relatively imprecise ages, we considered the two moraine emplacement age scenarios 906
discussed above, and determined how the uncertainties in each moraine exposure age
varied with the inferred exposure age of the moraine (Fig. 19). This uncertainty in 908
moraine exposure age sets a lower limit to the wavelength fluctuations in climate that
might be inferred using such a chronology. For each scenario, we plot the 1 910
uncertainties in the moraine exposure age versus the moraine exposure age (Fig. 19A,B).
From this plot, we used a third-order polynomial (that was required to pass through the 912
origin) to determine the uncertainties associated with moraine ages as their age varied.
Finally, we applied an adaptive low-pass filter to the 18
O time series (from Thompson et 914
al., 1997) to highlight features of the time-series that might be detectable with the
cosmogenic moraine ages, supposing that larger amplitude cold periods in climate 916
proxies are associated with increased frequency of moraine emplacements. The cut-off
frequency for the low-pass filter was thus allowed to change throughout the time series 918
such that all frequencies higher than those spanned by the 1 uncertainties in moraine
ages were filtered from the time-series (Fig. 19D,E). 920
When trying to correlate the moraine emplacement ages with the global climatic
curve of Martinson et al. (1987) or with the detailed local climatic curve at the Guliya ice 922
cap of Thompson et al. (1997) (see Fig. S33 for a comparison between the filtered
Thompson et al. (1997) and the Martinson et al. (1987) curves), we observe that the 924
correlation of moraine emplacement ages with paleoclimate proxies again changes with
both the assumed scaling model, as well as the choice of how to interpret moraine 926

41
exposure ages in terms of sample exposure ages (Fig. 20). Many peaks in the moraine age
PDFs coincide with temperature minima (maximum peaks) recorded by paleoclimate 928
proxies. That is, should the mean age of surface samples represent the moraine
emplacement age, moraines in the entire region, and within each sub-region (Fig. 21) 930
may correspond with a broad temperature minimum between ~18-35 ka revealed by the
filtered paleoclimate proxy curve (Fig. 20B and 21). However, regarding the oldest 932
sample exposure age as each moraine's age causes ages to approximately align with
temperature minima at ~40-50 ka, and to a lesser degree, 18-35 ka (Fig. 20A and 21). 934
Additionally, we find ~LGM and ~MIS-4 moraines in every region while ~MIS-3
moraines seem to be absent only from the westernmost orogen. This might be due to a 936
sampling bias or to a different climatic system (westerlies or monsoon) occurring in those
regions. However, a correlation analysis of these data shows that while these visual trends 938
suggest that such a correlation exists, there are at least as many intervals during which
moraine ages are anti-correlated with temperature minima. The net result of this is that 940
both throughout the entire region, as well as within sub-regions of this area, the
correlation of moraine exposure ages for the period 15-120 ka and paleoclimate proxies is 942
questionable because it depends on the way in which moraine exposure ages are derived
from surface sample ages. 944
HERE APPROXIMATE LOCATION OF FIGURE 20
HERE APPROXIMATE LOCATION OF FIGURE 21 946
5. Conclusions 948
We present 249 new 10
Be rock sample exposure ages from Tibetan moraines to

42
deduce the timing of moraine emplacement (for information on their extent, see Fig. 950
S34). In interpreting exposure ages of individual rock samples in terms of moraine
exposure ages, we considered two main sources of uncertainty: 1) uncertainties within, 952
and variation between, the different scaling models that may be applied to this area, and
2) uncertainties associated with our choice of how to relate these rock sample ages to the 954
emplacement age of the moraine surface. We found that our results were most strongly
affected by our choice of whether or not the moraine surface exposure age was best 956
represented by the mean, or oldest sample ages collected from each moraine. In many
cases, systematic differences in moraine ages > 50% result from this choice. Secondarily, 958
the choice of the appropriate scaling model (Lifton or Lal/Stone time-dependent)
systematically affected moraine surface exposure ages by ~10-20%. When comparing our 960
moraine exposure ages to the timing of temperature minima revealed by independent
paleoclimate proxies, we found that the correlation of the timing of moraine emplacement 962
with specific temperature changes depends strongly on these sources of uncertainty. For
any given moraine, the choice of the interpretive framework and scaling model can cause 964
the emplacement age to be correlated with a temperature minimum, maximum, or neither
of these conditions. On average, moraine emplacement ages revealed by a composite 966
moraine age PDF show some correspondence with temperature mimima, although the
changes associated with the different interpretive frameworks suggest that these visual 968
correlations may be coincidental. Furthermore, a correlation analysis suggests that there
are at least as many cases in which moraine ages are anti-correlated with temperature 970
minima than are correlated with these paleoclimates, leading to a poor overall correlation.
The consistency of our results with those of others when analyzed in a consistent 972

43
manner suggests that more samples collected from Tibet may not reveal additional
information about the relative importance of temperature mimima versus precipitation 974
maxima (assuming that glacial advances during temperature maxima are driven by
increased precipitation) on the emplacement of Tibetan moraines. The large database that 976
we have presented and compiled appears difficult to interpret because of the confounding
uncertainties associated with the process of moraine emplacement, degradation and 978
exhumation of rock samples to the moraine surface, as well as uncertainties associated
with the appropriate scaling model for this region. To this end, reconstruction of the 980
timing of Tibetan glaciations would foremost benefit from studies that clarify how the
exposure age of moraines are related to the ages of rock samples mantling its surface, and 982
secondarily by calibration of 10
Be production rates in this area where the age of
geomorphic features might be independently determined. 984

44
Acknowledgements.
This work was performed under the auspices of the European Marie Curie Outgoing 986
International Fellowship, Stanford University, the U.S Department of Energy (University
of California, Lawrence Livermore National Laboratory), the Institut National des 988
Sciences et de l’Univers (INSU), Centre National de la Recherche Scientifique (Paris,
France), as well as by the China Earthquake Administration and the Ministry of Lands 990
and Resources (Beijing, China). We thank Wen Li and Zhang Pei Quan from the Institute
of the Tibetan Plateau, Chinese Academy of Sciences (Beijing, China), for their help in 992
the field. The 10
Be measurements were performed at the ASTER AMS French national
facility (CEREGE, Aix-en-Provence), which is supported by the INSU-CNRS, the French 994
Ministry of Research and Higher Education, IRD and CEA, and at the Center for
Accelerator Mass Spectrometry at Lawrence Livermore National Laboratory, USA. 996
998

45
References
Abramowski, U., 2004. The use of 10
Be surface exposure dating of erratic boulders in the 1000
reconstruction of the Late Pleistocene glaciation history of mountainous regions, with
examples from Nepal and Central Asia. Dissertation, University of Bayreuth, Bayreuth, 1002
185pp.
1004
Abramowski, U., Bergau, A., Seebach, D., Zech, R., Glaser, B., Sosin, P., Kubik, P. W.,
Zech, W., 2006. Pleistocene glaciations of Central Asia: results from 10
Be surface 1006
exposure ages of erratic boulders from the Pamir (Tajikistan) and the Alay-Turkestan
range (Kyrgyzstan). Quaternary Science Reviews, 25: 1080–1096. 1008
Aizen, E. M., Aizen, V. B., Melack, J. M., Nakamura, T., Ohta, T., 2001. Precipitation 1010
and atmospheric circulation patterns at mid-latitudes of Asia. International Journal of
Climatology, 21: 535–556. 1012
Applegate, P. J., Urban, N. M., Laabs, B. J. C., Keller, K., Alley, R. B., 2010. Modeling 1014
the statistical distributions of cosmogenic exposure dates from moraines. Geoscientific
Model Development, 3:293-307. 1016
Armijo, R., Tapponnier, P., Mercier, J. L., Han, T., 1986. Quaternary extension in 1018
Southern Tibet: field observations and tectonic implications. Journal of Geophysical
Research, 91: 13803–13872. 1020
Balco, G., Stone, J. O., Lifton, N. A., Dunai, T. J., 2008. A complete and easily 1022
accessible means of calculating surface exposure ages or erosion rates from 10
Be and 26
Al
measurements. Quaternary Geochronology, doi:10.1016/j.quageo.2007.12.001. 1024
Barnard, P. L., Owen, L. A., Finkel, R. C., 2004a. Style and timing of glacial and 1026
paraglacial sedimentation in a monsoonal influenced high Himalayan environment, the
upper Bhagirathi Valley, Garhwal Himalaya. Sedimentary Geology, 165: 199–221. 1028
Barnard, P. L., Owen, L. A., Sharma, M. C., Finkel, R. C, 2004b. Late Quaternary 1030
landscape evolution of a monsoon-influenced high Himalayan valley, Gori Ganga, Nanda
Devi, NE Garhwal. Geomorphology, 61: 91–110. 1032
Barnard, P. L., Owen, L. A., Finkel, R. C., Asahi, K., 2006. Landscape response to 1034
deglaciation in a high relief, monsoon-influenced alpine environment, Langtang Himal,
Nepal. Quaternary Science Reviews, 25: 2162–2176. 1036
Barrows, T. T., Lehman, S. J., Fifield, L. K., De Deckker, P., 2007. Absence of Cooling 1038
in New Zealand and the Adjacent Ocean During the Younger Dryas Chronozone.
Science, 318: 86-89. 1040
Behr, W. M., Rood, D. H., Fletcher, K. E., Guzman, N., Finkel, R. C., Hanks, T. C., 1042
Hudnut, K., Kendrick, K. J., Platt, J. P., Sharp, W. D., Weldon, R. J., Yule, J. D., 2009.

46
Uncertainties in slip-rate estimates for the Mission Creek strand of the southern San 1044
Andreas fault at Biskra Palms Oasis, southern California. Geological Society of
American Bulletin, 122 (9/10): 1360-1377, doi:10.1130/B30020.1. 1046
Benn, D., Owen, L. A., 1998. The role of the Indian summer monsoon and the mid-1048
latitude Westerlies in Himalayan glaciation: review and speculative discussion.
Geological Society of London Journal, 155: 353–363. 1050
Briner, J. P., Swanson, T. W., Caffee, M. W., 2001. Late Pleistocene cosmogenic Cl-36 1052
glacial chronology of the southwestern Ahklun Mountains, Alaska. Quaternary Research,
56: 148–154. 1054
Briner, J. P., Kaufman, D. S., Manley, W. F., Finkel, R. C., 2005. Cosmogenic exposure 1056
dating of late Pleistocene moraine stabilization in Alaska. Geological Society of
American Bulletin, 117: 1108-1120. 1058
Briner, J. P., 2009. Moraine pebbles and boulders yield indistinguishable 10
Be ages: A 1060
case study from Colorado, USA. Quaternary Geochronology, 4: doi:10.1016/
j.quageo.2009.02.010. 1062
Brown, E. T., Edmond, J. M., Raisbeck, G. M., Yiou, F., Kurz, M. D., Brook, E. J., 1991. 1064
Examination of surface exposure ages of Antarctic moraines using in situ produced 10
Be
and 26
Al. Geochimica et Cosmochimica Acta, 55: 2269-2283. 1066
Brown, E. T., Bendick, R., Bourles, D. L., Gaur, V., Molnar, P., Raisbeck, G. M., Yiou, 1068
F., 2002. Slip rates of the Karakorum Fault, Ladakh, India, determined using cosmic ray
exposure dating of debris flows and moraines. Journal of Geophysical Research, 107: art. 1070
no. 2192.
1072
Brown, E. T., Bendick, R., Bourles, D. L., Gaur, V., Molnar, P., Raisbeck, G. M., Yiou,
F., 2003. Early Holocene climate recorded in geomorphological features in Western 1074
Tibet. Palaeogeography, Palaeoclimatology, Palaeoecology, 199: 141-151.
1076
Chevalier, M.-L., Ryerson, F. J., Tapponnier, P., Finkel, R. C., Van Der Woerd, J., Li
Haibing, Liu Qing, 2005a. Slip-Rate Measurements on the Karakorum Fault May Imply 1078
Secular Variations in Fault Motion. Science, 307: 411–414.
1080
Chevalier, M.-L., Ryerson, F. J., Tapponnier, P., Finkel, R. C., Van Der Woerd, J., Li
Haibing, Liu Qing, 2005b. Response to comment on ”Slip-Rate Measurements on the 1082
Karakorum Fault May Imply Secular Variations in Fault Motion”. Science, 309: 1326c,
doi:10.1126/science.1112629. 1084
Colgan, P.M., Munroe, J.S., Zhou, S., 2006. Cosmogenic radionuclide evidence for the 1086
limited extent of last glacial maximum glaciers in the Tanggula Shan of the central
Tibetan Plateau. Quaternary Research, 65: 336–339. 1088
Desilets, D., Zreda, M., 2003. Spatial and temporal distribution of secondary cosmic-ray 1090

47
nucleon intensities and applications to in-situ cosmogenic dating. Earth and Planetary
Science Letters, 206: 21–42. 1092
Desilets, D., Zreda, M., Prabu, T., 2006. Extended scaling factors for in situ cosmogenic 1094
nuclides: New measurements at low latitude. Earth and Planetary Science Letters, 246:
265–276. 1096
Dortch, J. M., Owen, L. A., Caffee, M. W., 2010. Quaternary glaciation in the Nubra and 1098
Shyok valley confluence, northernmost Ladakh, India. Quaternary Research, 74: 132-
144. 1100
Dunai, T., 2000. Scaling factors for production rates of in situ produced cosmogenic 1102
nuclides: a critical reevaluation. Earth and Planetary Science Letters, 176: 157-169.
1104
Dunai, T., 2001. Influence of secular variation of the magnetic field on production rates
of in situ produced cosmogenic nuclides. Earth and Planetary Science Letters, 193: 197–1106
212.
1108
Finkel, R. C., Owen, L. A., Barnard, P. L., Caffee, M. W., 2003. Beryllium-10 dating of
Mount Everest moraines indicates a strong monsoon influence and glacial synchroneity 1110
throughout the Himalaya. Geology, 31: 561–564.
1112
Gayer, E., Lave, J., Pik, R., France-Lanord, C., 2006. Monsoonal forcing of Holocene
glacier fluctuations in Ganesh Himal (Central Nepal) constrained by cosmogenic 3He 1114
exposure ages of garnets. Earth and Planetary Science Letters, 252: 275–288.
1116
Gillespie, A. R., Molnar, P., 1995. Asynchronous maximum advances of mountain and
continental glaciers. Review of Geophysics, 33: 311–364. 1118
Gillespie, A. R., Burke, R. M., Komatsu, G., Bayasgalan, A., 2008. Late Pleistocene 1120
glaciers in Darhad Basin, northern Mongolia. Quaternary Research, 69: 169-187. 1122 Gosse,J., Klein, J., Evenson, E. B., Lawn, B., Middleton, R., 1995. Beryllium-10 Dating
of the Duration and Retreat of the Last Pinedale Glacial Sequence. Science, 228: 1329-1124
1333.
1126
Gosse, J., Phillips, F., 2001. Terrestrial in situ cosmogenic nuclides: theory and
application. Quaternary Science Reviews, 20: 1475–1560. 1128
Hallet, B, Putkonen, J., 1994. Surface dating of dynamic landforms: Young boulders on 1130
aging moraines. Science, 265: 937–940.
1132
Harris, N., 2006. The elevation history of the Tibetan Plateau and its implications for the
Asian monsoon. Palaeogeography, Palaeoclimatology, Palaeoecology, 241: 4–15. 1134
Hedrick, K. A., Seong, Y. B., Owen, L. A., Caffee, M. W., Dietsch, C., In press. Towards 1136
defining the transition in style and timing of Quaternary glaciation between the monsoon-

48
influenced Greater Himalaya and the semi-arid Transhimalaya of Northern India. 1138
Quaternary International.
1140
Heimsath, A. M., McGlynn, R., 2008. Quantifying periglacial erosion in the Nepal high
Himalaya. Geomorphology, 97: 5-23. 1142
Heyman, J., Stroeven, A. P., Harbor, J., Caffee, M. W., 2010. Boulder cosmogenic 1144
exposure ages as constraints for glacial chronologies. Geophysical Research Abstracts
Vol. 12, EGU2010-14159-1. 1146
Heyman, J., Stroeven, A. P., Harbor, J., Caffee, M. W., in review. Boulder cosmogenic 1148
exposure ages as constraints for glacial chronologies. Earth and Planetary Science letters.
1150
Imbrie, J., J. D. Hays, D. G. Martinson, A. McIntyre, A. C. Mix, J. J. Morley, N. G.
Pisias, W. L. Prell, and N. J. Shackleton, 1984. The orbital theory of Pleistocene climate : 1152
support from a revised chronology of the marine δ18 O record, in Milankovitch and
Climate: Understanding the Response to Astronomical Forcing, pp. 269–305, A. Berger, 1154
J. Imbrie, J. Hays, G. Kukla, and B. Saltzman, Reidel, Boston.
1156
Kohl, C. P., Nishiizumi, K., 1992. Chemical isolation of quartz for measurement of in
situ-produced cosmogenic nuclides. Geochimica et Cosmochimica Acta, 56: 3583-3587. 1158
Lal, D., 1991. Cosmic ray labeling of erosion surfaces: in situ nuclide production rates 1160
and erosion models. Earth and Planetary Science Letters, 104: 424-439.
1162
Lasserre, C., Gaudemer, Y., Tapponnier, P., Mériaux, A.-S., Van der Woerd, J., Yuan D.,
Ryerson, R.J., Caffee, M.W., 2002. Journal of Geophysical Research, 107 (B11): 2276, 1164
doi:10.1029/2000JB000060.
1166
Lehmkuhl, F. and Haselein, F., 2000. Quaternary paleoenvironmental change on the
Tibetan Plateau and adjacent areas (Western China and Western Mongolia). Quaternary 1168
International, 65/66: 121-145.
1170
Lifton, N., Bieber, J., Clem, J., Duldig, M., Evenson, P., Humble, J., Pyle, R., 2005.
Addressing solar modulation and long-term uncertainties in scaling secondary cosmic 1172
rays for in situ cosmogenic nuclide applications. Earth and Planetary Science Letters,
239: 140–161. 1174
Liu, Q., 1993. Paleoclimat et contraintes chronologiques sur les mouvements recents dans 1176
l’ouest du Tibet : failles du Karakorum et de Longmu Co-Gozha Co, lacs en pull-apart de
Longmu Co et de Sumxi Co, Ph.D. thesis Paris 7. 1178
Mahéo, G., Leloup, P. H., Valli, F., Lacassin, R., Arnaud, N., Paquette, J.-L., Fernandez, 1180
A., Li Haibing, Farley, K. A., Tapponnier, P., 2007. Post 4 Ma initiation of normal
faulting in southern Tibet. Constraints from the Kung Co half graben. Earth and Planetary 1182
Science Letters, 256: 233-243.

49
1184
Martinson, D. G., Pisias, N. G., Hays, J. D., Imbrie, J., Moore, T. C., Shackleton, N. J.,
1987. Age dating and the orbital theory of the ice ages: development of a high resolution 1186
0 to 300,000-year chronostratigraphy. Quaternary Research, 27: 1–29.
1188
Meriaux, A.-S., Ryerson, F. J., Tapponnier, P., Van der Woerd, J., Finkel, R. C., Xiwei
Xu, Zhiqin Xu, Caffee, M. W., 2004. Rapid slip along the central Altyn Tagh Fault: 1190
Morphochronologic evidence from Cherchen He and Sulamu Tagh. Journal of
Geophysical Research, 109 (B18) : art. no. B06,401. 1192
Nishiizumi, K., Winterer, E. L., Kohl, C. P., Lal, D., Arnold, J. R., Klein, J., Middleton, 1194
R., 1989. Cosmic ray production rates of 10
Be and 26
Al in quartz from glacially polished
rocks. Journal of Geophysical Research, 94 (B12): 17,907-17,915. 1196
Nishiizumi, K., Imamura, M., Caffee, M., Southon, J., Finkel, R., McAnich, J., 2007. 1198
Absolute calibration of 10Be AMS standards. Nuclear Instruments and Methods in
Physics Research B, 258: 403–413. 1200
Owen, L. A., Gualtieri, L., Finkel, R. C., Caffee, M. W., Benn, D. I., Sharma, M. C., 1202
2001. Cosmogenic radionuclide dating of glacial landforms in the Lahul Himalaya,
northern India: defining the timing of Late Quaternary glaciation. Journal of Quaternary 1204
Science, 16: 555–563.
1206
Owen, L. A., Finkel, R. C., Caffee, M. W., Gualtieri, L., 2002. Timing of multiple Late
Quaternary glaciations in the Hunza Valley, Karakoram Mountains, northern Pakistan: 1208
defined by cosmogenic radionuclide dating of moraines. Geological Society of America
Bulletin, 114: 593–604. 1210
Owen, L. A., Finkel, R. C., Ma, H., Spencer, J. Q., Derbyshire, E., Barnard, P. L., Caffee, 1212
M. W., 2003a. Timing and style of Late Quaternary glaciations in NE Tibet. Geological
Society of America Bulletin, 115: 1356–1364. 1214
Owen, L. A., Ma H, Derbyshire, E., Spencer, J. Q., Barnard, P. L., Zeng YN, Finkel, R. 1216
C., Caffee, M. W., 2003b. The timing and style of Late Quaternary glaciation in the La Ji
Mountains, NE Tibet: evidence for restricted glaciation during the latter part of the Last 1218
Glacial. Zeitschrift fur Geomorphologie, 130: 263–276.
1220
Owen, L. A., Spencer, J. Q., M,a H., Barnard, P. L., Derbyshire, E., Finkel, R. C., Caffee,
M. W., Zeng YN., 2003c. Timing of Late Quaternary glaciation along the southwestern 1222
slopes of the Qilian Shan, Tibet. Boreas, 32: 281–291.
1224
Owen, L. A., Finkel, R. C., Barnard, P. L., Ma, H., Asahi, K., Caffee, M. W., Derbyshire,
E., 2005. Climatic and topographic controls on the style and timing of Late Quaternary 1226
glaciation throughout Tibet and the Himalaya defined by 10Be cosmogenic radionuclide
surface exposure dating. Quaternary Science Reviews, 24 (12-13): 1391–1411. 1228

50
Owen, L. A., Caffe, M. W., Bovard, K. R., Finkel, R. C., Sharma, M. C., 2006a. 1230
Terrestrial cosmogenic nuclide surface exposure dating of the oldest glacial successions
in the Himalayan orogen: Ladakh Range, northern India. Geological Society of 1232
American Bulletin, 118 (3/4) : 383–392.
1234
Owen, L. A., Finkel, R. C., Ma, H., Barnard, P. L., 2006b. Late Quaternary landscape
evolution in the Kunlun Mountains and Qaidam Basin, Northern Tibet: a framework for 1236
examining the links between glaciation, lake level changes and alluvial fan formation.
Quaternary International, 154/155: 73–86. 1238
Owen, L. A., Caffee, M. W., Finkel, R. C., Seong, Y. B., 2008b. Quaternary glaciation of 1240
the Himalayan–Tibetan orogen. Journal of Quaternary Sciences, 23: 513-531, ISSN0267-
8179. 1242
Owen, L. A., Robinson, R., Benn, D. I., Finkel, R. C., Davis, N. K., Chaolu Yi, Putkonen, 1244
J., Dewen Li, Murray, A. S., 2009. Quaternary glaciation of Mount Everest. Quaternary
Science Reviews, 28: 1412-1433, doi:10.1016/j.quascirev.2009.02.010. 1246
Owen, L. A., Chaolu Yi, Finkel, R. C., Davis, N. K., 2010. Quaternary glaciation of 1248
Gurla Mandhata (Naimon’anyi). Quaternary Science Reviews, 29: 1817-1830.
1250
Phillips, F. M., Zreda, M.G., Smith, S.S., Elmore, D., Kubik, P.W., Sharma, P., 1990.
Cosmogenic Chlorine-36 Chronology for glacial deposits at Bloody Canyon, eastern 1252
Sierra Nevada. Science, 248: 1529-1532.
1254
Phillips, F. M., Zreda, M. G., Gosse, J. C., Klein, J., Evenson, E. B., Hall, R. D.,
Chadwick, O. A., Sharma, P., 1997. Cosmogenic 36
Cl and 10
Be ages of Quaternary glacial 1256
and fluvial deposits of the Wind River Range,Wyoming. Geological Society of American
Bulletin, 109 (11): 1453–1463. 1258
Phillips, W. M., Sloan, V. F., Shroder, J. F., Sharma, P., Clarke, M. L., Rendell, H. M., 1260
2000. Asynchronous glaciation at Nanga Parbat, northwestern Himalaya Mountains,
Pakistan. Geology, 28: 431–434. 1262
Putkonen, J., Swanson, T., 2003. Accuracy of cosmogenic ages for moraines. Quaternary 1264
Research, 59: 255-261.
1266
Putkonen, J., O'Neal, M. A., 2006. Degradation of unconsolidated Quaternary landforms
in the western North America. Geomorphology, 75: 408–419. 1268
Raymo, M. E., Ruddiman, W. F., 1992. Tectonic forcing of late Cenozoic climate. 1270
Nature, 359: 117–124.
1272
Richards, B. W., Owen, L. A., Rhodes, E. J., 2000. Timing of late Quaternary glaciations
in the Himalayas of northern Pakistan. Journal of Quaternary Sciences, 15: 283–297. 1274

51
Ruddiman, W. F., Kutzbach, J. E., 1989. Forcing of Late Cenozoic Northern Hemisphere 1276
climate by plateau uplift in southern Asia and the America west. Journal of Geophysical
Research, 94 (18): 409–427. 1278
Schaefer, J. M., Tschudi, S., Zhao, Z., Wu, X., Ivy-Ochs, S., Wieler, R., Baur, H., Kubik, 1280
P. W., Schluchter, C., 2002. The limited influence of glaciations in Tibet on global
climate over the past 170000 yr. Earth and Planetary Science Letters, 194: 287–297. 1282
Schaefer, J. M., Oberholzer, P., Zhizhong Zhao, Ivy-Ochs, S., Wieler, R., Baur, H., 1284
Kubik, P. W., Schluchter, C., 2008. Cosmogenic beryllium-10 and neon-21 dating of late
Pleistocene glaciations in Nyalam, monsoonal Himalayas. Quaternary Science Reviews, 1286
27: 295–311.
1288
Schaefer, J. M., Denton, G. H., Kaplan, M., Putnam, A., Finkel, R. C., Barrell, D. J. A.,
Andersen, B. G., Schwartz, R., Mackintosh, A., Chinn, T., Schluchter, C., 2009. High-1290
Frequency Holocene Glacier Fluctuations in New Zealand Differ from the Northern
Signature. Science, 324: 622-625. 1292
Seong, Y. B., Owen, L. A., Bishop, M. P., Bush, A., Clendon, P., Copland, P., Finkel, R. 1294
C., Kamp, U., Shroder, J. F., 2007. Quaternary glacial history of the Central Karakoram.
Quaternary Science Reviews, 26: 3384–3405. 1296
Seong, Y. B., Owen, L. A., Yi, C., Finkel, R. C., 2009. Quaternary glaciation of Muztag 1298
Ata and Kongur Shan: evidence for glacier response to rapid climate changes throughout
the Late-glacial and Holocene in westernmost Tibet. Geological Society of American 1300
Bulletin, 121: 348-365, doi: 10.1130/B26339.1.
1302
Stone, J. O., 2000. Air pressure and cosmogenic isotope production. Journal of
Geophysical Research, 105: 23,753-23,760. 1304
Strasky, S., Graf, A. A., Zhizhong Zhao, Kubik, P. W., Baur, H., Schlüchter, C., Wieler, 1306
R., 2009. Late Glacial ice advances in southeast Tibet. Journal of Asian Earth Sciences,
34: 458-465. 1308
Thompson, L. G., Yao, T., Davis, M. E., Henderson, K. A., Mosley-Thompson, E., Lin, 1310
P.-N., Beer, J., Synal, H.-A., Cole-Dai, J., Bolzan, J. F., 1997. Tropical Climate
Instability: The Last Glacial Cycle from a Qinghai-Tibetan Ice Core. Science, 276: 1312
1821-1825.
1314
Tschudi, S., Schaefer, J. M., Zhizong Zhao, Xihao Wu, Ivy-Ochs, S., Kubik, P. W.,
Schluchter, C., 2003. Glacial advances in Tibet during the Younger Dryas? Evidence 1316
from cosmogenic 10
Be, 26
Al, and 21
Ne. Journal of Asian Earth Sciences, 22: 301-306.
1318
Van Der Woerd, J., Tapponnier, P., Ryerson, F. J., Mériaux, A. S., Meyer, B., Gaudemer,
Y., Finkel, R. C., Caffee, M. W., Guoguang, Z., Xu Zhiqin, 2002. Uniform postglacial 1320
slip-rate along the central 600km of the Kunlun Fault (Tibet), from 26
Al, 10
Be, and 14
C

52
dating of riser offsets, and climatic origin of the regional morphology. Geophysical 1322
Journal International, 148: 356–388.
1324
Yao, T., Thompson, L. G., Mosley-Thompson, E., Zhihong, Y., Xingping, Z., Lin, P.-N.,
1996. Climatological significance of δ18
O in north Tibetan ice cores. Journal of 1326
Geophysical Research, 101(D23): 29,531–29,537.
1328
Zech R., Abramowski, U., Glaser, B., Sosin, P., Kubik, P. W., Zech, W., 2005a. Late
Quaternary glacier and climate history of the Pamir Mountains derived from cosmogenic 1330 10
Be exposure ages. Quaternary Research, 64: 212–220.
1332
Zech, R., May, J. H., Kull, C., Ilgner, J., Kubik, P. W., Veit, H., 2008. Timing of the late
Quaternary glaciation in the Andes from ~15 to 40S. Journal of Quaternary Sciences, 23 1334
(6-7): 635–647.
1336
Zech, R., Zech, M., Kubik, P. W., Kharki, K., Zech, W., 2009. Deglaciation and
landscape history around Annapurna, Nepal, based on 10
Be surface exposure dating. 1338
Quaternary Science Reviews, 28: 1106-1118, doi:10.1016/j.quascirev.2008.11.013.
1340
Zhou ShangZhe, Xu LiuBing, Colgan, P. M., Mickelson, D. M., Wang XiaoLi, Wang Jie,
Zhong Wei, 2007. Cosmogenic 10
Be dating of Guxiang and Baiyu Glaciations. Chinese 1342
Science Bulletin, 52: 1387-1393.
1344
Zreda, M. G., Phillips, F. M., Elmore, D., 1994. Cosmogenic 36
Cl accumulation in
unstable landforms: 2. Simulations and observations on eroding moraines. Water 1346
Resources Research, 30 (11): 3127–3136, doi:10.1029/94WR00760.
1348
Zreda, M. G., Phillips, F. M., 1995. Insights into alpine moraine development from
cosmogenic 36
Cl buildup dating. Geomorphology, 14: 149-156, doi:10.1016/0169-1350
555X(95)00055-9.

53
Figure legends 1352
Fig. 1: A) Location of the 17 new sampled moraine sites of this study (red stars), 32
crests (with >2 samples), on a Landsat satellite image of the southern and western 1354
Tibetan Plateau, a region of about 1100 x 500 km. Numbers refer to Fig. 14 and Tables 1,
2 and S1. B) Location of the studies used in the compilation: A4=Abramowski (2004), 1356
A6=Abramowski et al. (2006), B=Barnard et al. (2004b), D=Dortch et al. (2010),
F=Finkel et al. (2003), H=Hedrick et al. (in press), M=Meriaux et al. (2004), O3=Owen 1358
et al. (2003a), O9=Owen et al. (2009), O10=Owen et al. (2010), Se7=Seong et al.
(2007), Se9=Seong et al. (2009), Z=Zech et al. (2005a), Zh=Zhou et al. (2007). 1360
Fig. 2: Landsat satellite image of the Nyainqentanghla area, with location of YanBaJain 1362
(Ybj) and Gulu sites. The numbers on each inset photo refer to sample numbers. The
drawing represents the Ybj moraine from Armijo et al. (1986). 1364
Fig. 3: 10
Be surface exposure ages for the YanBaJain and Gulu sites (in the 1366
Nyainqentanghla range) plotted from youngest to oldest, with 1 error bars. The
numbers next to each sample refer to sample numbers in Table S1. Squares show ages 1368
calculated using the Lal(1991)/Stone(2000) time-dependent scaling model (LS),
diamonds represent ages using the Lifton et al. (2005) model (Li). The oldest age (using 1370
Lal/Stone) and the mean age (using Lifton) for each crest are also shown, as well as the
number of samples on each crest. Light grey-shaded boxes represent the mean age of all 1372
samples (using Lifton) while dark grey-shaded boxes represent the mean age (using
Lifton) without the possible outliers (in white, see text for details). 1374

54
Fig. 4: Landsat satellite image of the Xainza area, where we sampled five sites: M4, M3, 1376
M2, M1 and M, from north to south. The numbers on each inset photo refer to sample
numbers. 1378
Fig. 5: 10
Be surface exposure ages for the Xainza area, plotted from youngest to oldest, 1380
with 1 error bars. The numbers next to each sample refer to the sample numbers in
Table S1. Sample T7C-62 on M is twice as old as the next oldest sample and is discarded
1382
(Putkonen and Swanson, 2003). T7C-24 and 24bis are presented as one uncertainty
weighted mean age. M3-old is not plotted on this graph, with ages ranging from ~167 to 1384
562 ka (see Table S1). The oldest age (using Lal/Stone) and the mean age (using Lifton)
for each crest are also shown, as well as the number of samples on each crest. Light grey-1386
shaded boxes represent the mean age of all samples (using Lifton) while dark grey-
shaded boxes represent the mean age (using Lifton) without the outliers (in white, see text 1388
for details).
1390
Fig. 6: Landsat satellite image of the Ama Drime area, where we sampled two sites:
Dingye north and Dingye south. The numbers on each inset photo refer to sample 1392
numbers.
1394
Fig. 7: 10
Be surface exposure ages for the Ama Drime area, plotted from youngest to
oldest, with 1 error bars. The numbers next to each sample refer to the sample numbers 1396
in Table S1. The oldest age (using Lal/Stone) and the mean age (using Lifton) for each

55
crest are also shown, as well as the number of samples on each surface. Light grey-1398
shaded boxes represent the mean age of all samples (using Lifton) while dark grey-
shaded boxes represent the mean age (using Lifton) without the outliers (in white, see text 1400
for details).
1402
Fig. 8: Landsat satellite image of the KungCo area, where we sampled two sites: KungCo
and Cho Oyu. The drawing represents the KungCo moraine from Armijo et al. (1986). 1404
The numbers and letters A-E on each inset photo refer to sample numbers.
1406
Fig. 9: Landsat satellite image of the Kailas and Pulan areas, where we sampled four
sites: A Qu, West Xiong Se, East Xiong Se, and Pulan. The numbers on each inset photo 1408
refer to sample numbers.
1410
Fig. 10: 10
Be surface exposure ages for the KungCo and Pulan areas, plotted from
youngest to oldest, with 1 error bars. The numbers next to each sample refer to the 1412
sample numbers in Table S1. The oldest age (using Lal/Stone) and the mean age (using
Lifton) for each crest are also shown, as well as the number of samples on each surface. 1414
Light grey-shaded boxes represent the mean age of all samples (using Lifton) while dark
grey-shaded boxes represent the mean age (using Lifton) without the outliers (in white, 1416
see text for details).
1418
Fig. 11: 10
Be surface exposure ages for the Kailas areas, plotted from youngest to oldest,
with 1 error bars. The numbers next to each sample refer to the sample numbers in 1420

56
Table S1. Sample KC2-78 on AQu is considered as an outlier (~203 ka). The oldest age
(using Lal/Stone) and the mean age (using Lifton) for each crest are also shown, as well 1422
as the number of samples on each surface. Light grey-shaded boxes represent the mean
age of all samples (using Lifton) while dark grey-shaded boxes represent the mean age 1424
(using Lifton) without the outliers (in white, see text for details).
1426
Fig. 12: Landsat satellite image of Manikala (Chevalier et al., 2005a, 2005b) and
Chaxikang sites. The numbers on each inset photo refer to sample numbers. 1428
Fig. 13: 10
Be surface exposure ages for Manikala and Chaxikang, plotted from youngest 1430
to oldest, with 1 error bars. The numbers next to each sample refer to the sample
numbers in Table S1. The oldest age (using Lal/Stone) and the mean age (using Lifton) 1432
for each crest are also shown, as well as the number of samples on each surface. Light
grey-shaded boxes represent the mean age of all samples (using Lifton) while dark grey-1434
shaded boxes represent the mean age (using Lifton) without the outliers (in white, see text
for details). 1436
Fig. 14: Compilation of moraine ages from this study, as a function of longitude (Tables 1438
1 and S1). Numeral refers to moraine number as listed in Table 1. n=245 because we do
not present crests with <2 samples (Ybj outer N, M4 #2 and M4 #3). A) oldest sample 1440
age per moraine crest, calculated using Lal/Stone scaling model, B) mean ages, calculated
using Lal/Stone scaling model, C) oldest sample age per moraine crest, calculated using 1442
Lifton scaling model and D) mean ages, calculated using Lifton scaling model. In A) and

57
D), probability density function (PDF) of moraine age groups 1 to 3 according to 1 1444
uncertainties ranking (Table 1).
1446
Fig. 15: Probability Density Functions (PDF) of moraine ages (<120 ka and with a
sufficient number of samples, see text for details) from this study (20 crests, 170 samples, 1448
solid line) and compiled with the published studies (51 crests, 354 samples, dashed line)
(Tables 2, S1 and S2). A) oldest ages per moraine crest, calculated using Lal/Stone 1450
scaling model and B) mean ages, calculated using Lifton scaling model.
1452
Fig. 16: PDF of moraine ages (<120 ka and with a sufficient number of samples, see text
for details) from this study (solid line), and compiled with published studies (dashed 1454
line), calculated with the two models. To the left, PDF of oldest ages per moraine crest,
using Lal/Stone scaling model, and to the right, PDF of mean ages, using Lifton scaling 1456
model. Four different climatic zones are distinguished, as defined in Owen et al. (2008b):
Westernmost orogen (panels A and B), Transhimalaya and Western Tibet (panels C and 1458
D), monsoon-influenced Himalaya (panels E and F) and monsoon-influenced Tibet
(panels G and H). 1460
Fig. 17: Compilation of all sample ages reported in Table 2, calculated as for our dataset, 1462
using the time-dependent scaling model of Lal/Stone. A) All sampled moraines from
Tibet show a comparable range in the ratio of maximum to mean age, regardless of the 1464
group that is working there, with our data (closed circles) falling cleanly within this
pattern. B) PDF of the maximum to mean age ratio for samples collected by other 1466

58
working groups (dashed line) as well as samples collected as part of this work (solid
line). Both visual inspection, as well as a two-sided Student's T-test shows that the means 1468
of these populations are indistinguishable at the 95% level.
1470
Fig. 18: Moraine ages from group 1 only (1uncertainties < 17%), for oldest age and
mean age scenario (using both Lal/Stone and Lifton scaling models), before and after 1472
rejecting outliers (Table 1), and comparison with the climatic curve (filtered Thompson et
al., 1997 curve) and Marine Isotope Stages (Imbrie et al., 1984) (see text for discussion). 1474
Fig. 19: A and B) 3rd
order polynomial (required to pass through the origin) obtained 1476
from the 20 oldest (A) or mean (B) moraine ages (<120 ka and with a sufficient number
of samples, see text for details) from this study and their 1 uncertainties. C) Original 1478
18
O climate proxy curve from the Guliya ice cap (Thompson et al., 1997). D) Filtered
climatic curve with a low-pass filter using the highest uncertainties from oldest ages 1480
scaled to model of Lifton. E) Filtered climatic curve with a low-pass filter using the
highest uncertainties from mean ages scaled to model of Lifton. 1482
Fig. 20: Same as in Fig. 15 with added filtered climatic curve (dotted-dashed line). Grey-1484
shaded sectors and associated numbers represent Marine Isotope Stages (Imbrie et al.,
1984). 1486
Fig. 21: Same as Fig. 16 with added filtered climatic curve (dotted-dashed line). Grey-1488
shaded sectors and associated numbers represent Marine Isotope Stages (Imbrie et al.,
1984). 1490

59
Table 1: 10
Be oldest and mean ages (1 uncertainties) using the scaling models of Lifton 1492
and Lal/Stone time-dependent for moraines of this study (32 crests) and ranking in groups
of confidence, before and after outlier rejection. 1494
Table 2: Compilation of moraine ages (<120 ka and with a sufficient number of samples, 1496
see text for details) from this study and published studies (total of 71 crests and 524
samples), for each climatic zone, with site and sample names, number of samples per 1498
crest, 10
Be oldest and mean ages (and 1 uncertainties) using scaling models of
Lal/Stone and Lifton, respectively. For comparison, age as published in the literature is 1500
indicated. All sample details are in Tables S1 and S2.
1502
Corresponding Author information.
1504 Dr. Marie-Luce Chevalier
†
Key Laboratory for Continental Dynamics, 1506 Institute of Geology, CAGS
26 Baiwanzhuang Rd 1508 Beijing 100037
China 1510 [email protected]
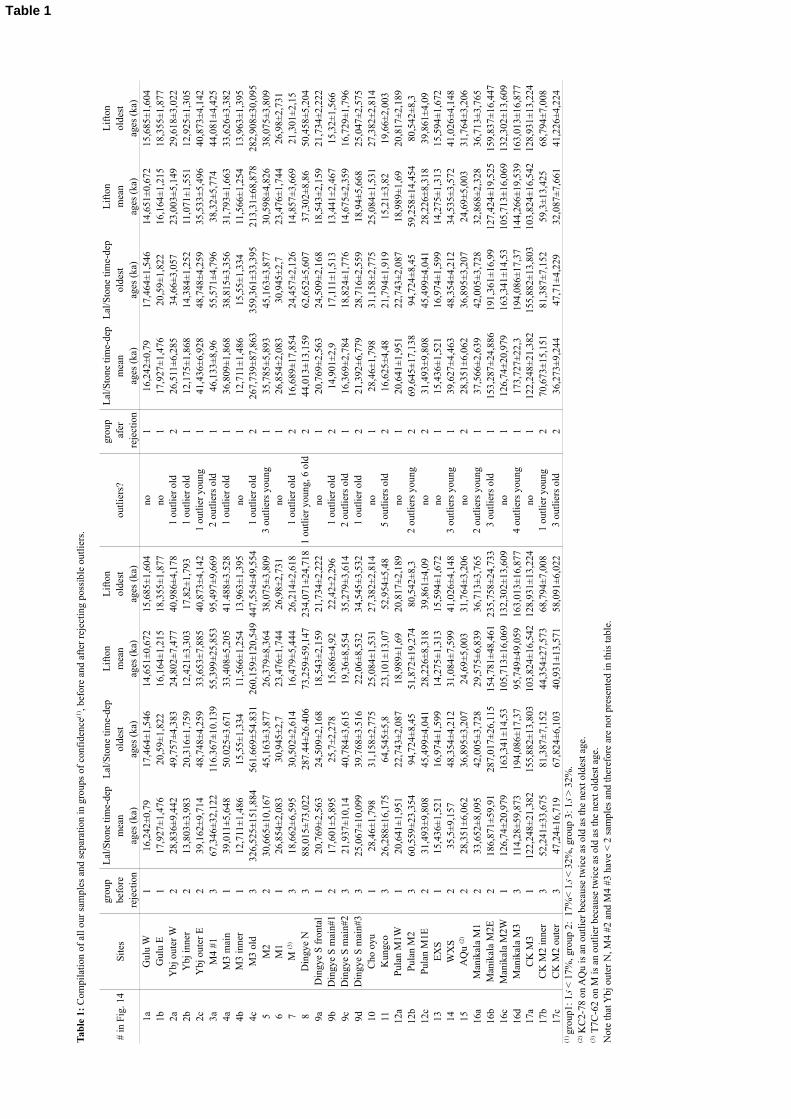
# in
Fig
. 14
Site
s
1a1
16,2
42±0
,79
17,4
64±1
,546
14,6
51±0
,672
15,6
85±1
,604
no1
16,2
42±0
,79
17,4
64±1
,546
14,6
51±0
,672
15,6
85±1
,604
1b1
17,9
27±1
,476
20,5
9±1,
822
16,1
64±1
,215
18,3
55±1
,877
no1
17,9
27±1
,476
20,5
9±1,
822
16,1
64±1
,215
18,3
55±1
,877
2a2
28,8
36±9
,442
49,7
57±4
,383
24,8
02±7
,477
40,9
86±4
,178
226
,511
±6,2
8534
,66±
3,05
723
,003
±5,1
4929
,618
±3,0
222b
213
,803
±3,9
8320
,316
±1,7
5912
,421
±3,3
0317
,82±
1,79
31
12,1
75±1
,868
14,3
84±1
,252
11,0
71±1
,551
12,9
25±1
,305
2c2
39,1
62±9
,714
48,7
48±4
,259
33,6
53±7
,885
40,8
73±4
,142
141
,436
±6,9
2848
,748
±4,2
5935
,533
±5,4
9640
,873
±4,1
423a
M4
#13
67,3
46±3
2,12
211
6.36
7±10
.139
55,3
99±2
5,85
395
,497
±9,6
691
46,1
33±8
,96
55,5
71±4
,796
38,3
2±5,
774
44,0
81±4
,425
4aM
3 m
ain
139
,011
±5,6
4850
.025
±3.6
7133
,408
±5,2
0541
.488
±3.5
281
36,8
09±1
,868
38,8
15±3
,356
31,7
93±1
,663
33,6
26±3
,382
4b1
12,7
11±1
,486
15,5
5±1,
334
11,5
66±1
,254
13,9
63±1
,395
no1
12,7
11±1
,486
15,5
5±1,
334
11,5
66±1
,254
13,9
63±1
,395
4c3
326,
525±
151,
884
561.
669±
54.8
3126
0,15
9±12
0,54
944
7,55
4±49
,554
226
7,73
9±87
,863
359,
361±
33,3
9521
3,31
±68,
878
282,
908±
30,0
955
M2
230
,665
±10,
167
45,1
63±3
,877
26,3
79±8
,364
38,0
75±3
,809
135
,785
±5,8
9345
,163
±3,8
7730
,598
±4,8
2638
,075
±3,8
096
M1
126
,854
±2,0
8330
,945
±2,7
23,4
76±1
,744
26,9
8±2,
731
no1
26,8
54±2
,083
30,9
45±2
,723
,476
±1,7
4426
,98±
2,73
17
318
,662
±6,5
9530
,502
±2,6
1416
,479
±5,4
4426
,214
±2,6
182
16,6
89±1
7,85
424
,457
±2,1
2614
,857
±3,6
6921
,301
±2,1
58
388
,015
±73,
022
287.
44±2
6.40
673
,259
±59,
147
234,
071±
24,7
182
44,0
13±1
3,15
962
,652
±5,6
0737
,302
±8,8
650
,458
±5,2
049a
120
,769
±2,5
6324
,509
±2,1
6818
,543
±2,1
5921
,734
±2,2
22no
120
,769
±2,5
6324
,509
±2,1
6818
,543
±2,1
5921
,734
±2,2
229b
217
,601
±5,8
9525
,7±2
,278
15,6
86±4
,92
22,4
2±2,
296
214
,901
±2,9
17,1
11±1
,513
13,4
41±2
,467
15,3
2±1,
566
9c3
21,9
37±1
0,14
40,7
84±3
,615
19,3
6±8,
554
35,2
79±3
,614
116
,369
±2,7
8418
,824
±1,7
7614
,675
±2,3
5916
,729
±1,7
969d
325
,067
±10,
099
39.7
68±3
.516
22,0
6±8,
532
34,5
45±3
,532
221
,392
±6,7
7928
,716
±2,5
5918
,94±
5,66
825
,047
±2,5
7510
128
,46±
1,79
831
,158
±2,7
7525
,084
±1,5
3127
,382
±2,8
14no
128
,46±
1,79
831
,158
±2,7
7525
,084
±1,5
3127
,382
±2,8
1411
326
,288
±16,
175
64,5
45±5
,823
,101
±13,
0752
,954
±5,4
82
16,6
25±4
,48
21,7
94±1
,919
15,2
1±3,
8219
,66±
2,00
312
a1
20,6
41±1
,951
22,7
43±2
,087
18,9
89±1
,69
20,8
17±2
,189
no1
20,6
41±1
,951
22,7
43±2
,087
18,9
89±1
,69
20,8
17±2
,189
12b
360
,559
±23,
354
94,7
24±8
,45
51,8
72±1
9,27
480
,542
±8,3
269
,645
±17,
138
94,7
24±8
,45
59,2
58±1
4,45
480
,542
±8,3
12c
231
,493
±9,8
0845
,499
±4,0
4128
,226
±8,3
1839
,861
±4,0
9no
231
,493
±9,8
0845
,499
±4,0
4128
,226
±8,3
1839
,861
±4,0
913
EXS
115
,436
±1,5
2116
,974
±1,5
9914
,275
±1,3
1315
,594
±1,6
72no
115
,436
±1,5
2116
,974
±1,5
9914
,275
±1,3
1315
,594
±1,6
7214
WX
S2
35,5
±9,1
5748
,354
±4,2
1231
,084
±7,5
9941
,026
±4,1
481
39,6
27±4
,463
48,3
54±4
,212
34,5
35±3
,572
41,0
26±4
,148
152
28,3
51±6
,062
36,8
95±3
,207
24,6
9±5,
003
31,7
64±3
,206
no2
28,3
51±6
,062
36,8
95±3
,207
24,6
9±5,
003
31,7
64±3
,206
16a
233
,652
±8,0
9542
,005
±3,7
2829
,575
±6,8
3936
,713
±3,7
651
37,5
66±2
,639
42,0
05±3
,728
32,8
68±2
,328
36,7
13±3
,765
16b
218
6,87
1±59
,91
287,
017±
26,1
1515
4,78
1±48
,461
235,
758±
24,7
331
153,
287±
24,8
8619
1,36
1±16
,99
127,
424±
19,5
2515
9,83
7±16
,447
16c
112
6,74
±20,
979
163,
341±
14,5
310
5,71
3±16
,069
132,
302±
13,6
09no
112
6,74
±20,
979
163,
341±
14,5
310
5,71
3±16
,069
132,
302±
13,6
0916
d3
114,
28±5
9,87
319
4,08
6±17
,37
95,7
49±4
9,05
916
3,01
3±16
,877
117
3,72
7±22
,319
4,08
6±17
,37
144,
266±
19,5
3916
3,01
3±16
,877
17a
CK
M3
112
2,24
8±21
,382
155,
882±
13,8
0310
3,82
4±16
,542
128,
931±
13,2
24no
112
2,24
8±21
,382
155,
882±
13,8
0310
3,82
4±16
,542
128,
931±
13,2
2417
b3
52,2
41±3
3,67
581
,387
±7,1
5244
,354
±27,
573
68,7
94±7
,008
270
,673
±15,
151
81,3
87±7
,152
59,3
±13,
425
68,7
94±7
,008
17c
347
,24±
16,7
1967
,824
±6,1
0340
,931
±13,
571
58,0
91±6
,022
236
,273
±9,2
4447
,71±
4,22
932
,087
±7,6
6141
,226
±4,2
24
Tabl
e 1:
Com
pila
tion
of a
ll ou
r sam
ples
and
sepa
ratio
n in
gro
ups o
f con
fiden
ce(1
) , be
fore
and
afte
r rej
ectin
g po
ssib
le o
utlie
rs.
grou
pLa
l/Sto
ne ti
me-
dep
Lal/S
tone
tim
e-de
pLi
fton
Lifto
ngr
oup
Lal/S
tone
tim
e-de
pLa
l/Sto
ne ti
me-
dep
Lifto
nLi
fton
bef
ore
mea
nol
dest
mea
nol
dest
outli
ers?
afe
rm
ean
olde
stm
ean
olde
st re
ject
ion
ages
(ka)
ages
(ka)
ages
(ka)
ages
(ka)
reje
ctio
nag
es (k
a)ag
es (k
a)ag
es (k
a)ag
es (k
a)G
ulu
WG
ulu
EY
bj o
uter
W1
outli
er o
ldY
bj in
ner
1 ou
tlier
old
Ybj
out
er E
1 ou
tlier
you
ng2
outli
ers o
ld1
outli
er o
ldM
3 in
ner
M3
old
1 ou
tlier
old
3 ou
tlier
s you
ng
M (3
)1
outli
er o
ldD
ingy
e N
1 ou
tlier
you
ng, 6
old
Din
gye
S fr
onta
lD
ingy
e S
mai
n#1
1 ou
tlier
old
Din
gye
S m
ain#
22
outli
ers o
ldD
ingy
e S
mai
n#3
1 ou
tlier
old
Cho
oyu
Kun
gco
5 ou
tlier
s old
Pula
n M
1WPu
lan
M2
2 ou
tlier
s you
ngPu
lan
M1E
3 ou
tlier
s you
ngA
Qu
(2)
Man
ikal
a M
12
outli
ers y
oung
Man
ikal
a M
2E3
outli
ers o
ldM
anik
ala
M2W
Man
ikal
a M
34
outli
ers y
oung
CK
M2
inne
r1
outli
er y
oung
CK
M2
oute
r3
outli
ers o
ld(1
) gro
up1:
1s <
17%
, gro
up 2
: 17
%<
1s <
32%
, gro
up 3
: 1s >
32%
.(2
) KC
2-78
on
AQ
u is
an
outli
er b
ecau
se tw
ice
as o
ld a
s the
nex
t old
est a
ge.
(3) T7
C-6
2 on
M is
an
outli
er b
ecau
se tw
ice
as o
ld a
s the
nex
t old
est a
ge.
Not
e th
at Y
bj o
uter
N, M
4 #2
and
M4
#3 h
ave
< 2
sam
ples
and
ther
efor
e ar
e no
t pre
sent
ed in
this
tabl
e.
Table 1

# of samples standardSite sample #
M2 M2/5 7 S555 46,9±6,1 32,619±16,96 62.278±5.602M1 M1/5 7 S555 61,2±8 65,753±2,92 79.845±7.572
GU1 GU19 6 S555 56,8±6,3 31,265±14,986 69.323±6.308m3f MUST-3 6 07KNSTD 8,9±0,3 9,639±0,151 10.083±0.908m3f' MUST-7 8 07KNSTD 8,9±0,3 9,312±0,374 9.981±0.919m5a MUST-21 6 07KNSTD 6,9±0,2 7,381±0,251 7.734±0.682m6a MUST-30 5 07KNSTD 7±0,2 7,35±0,266 7.816±0.690m7a MUST-35 7 07KNSTD 2,1±0,1 2,049±0,193 2.529±0.236m6c MUST-55 5 07KNSTD 0,6±0,1 0,431±0,184 0.684±0.092m3c MUST-61 5 07KNSTD 14,7±0,4 14,08±0,682 16.401±1.441m4c MUST-69 5 07KNSTD 14,2±0,3 14,071±0,301 15.882±1.398m4h KONG_12 6 07KNSTD 7±0,2 7,704±0,094 7.799±0.696m5h KONG_22 5 07KNSTD 4,5±0,1 3,512±1,504 5.174±0.467m6h KONG_26 6 07KNSTD 3,3±0,1 2,71±1,041 3.833±0.351m3i KONG_37 5 07KNSTD 1,5±0,1 1,15±0,501 1.703±0.217m2c MUST-65 6 07KNSTD 75,4±1,4 33,031±18,802 77.666±6.838m2b MUST-90 8 07KNSTD 112,7±1,7 48,025±26,553 113.756±10.016
M1 NNM-9 12 KNSTD 112,7±7,3 39,46±12,695 93.935±8.472M2 NNM-11A 12 KNSTD 76,3±4,9 26,289±17,606 70.423±6.209m2g K2-65 6 KNSTD 12,6±0,4 7,405±2,864 12.874±1.135m1h K2-93 7 KNSTD 2,1±0,2 1,238±0,64 2.33±0.348m1c K2-13 8 KNSTD 16,7±0,4 16,416±0,608 17.076±1.554m1g K2-59 11 KNSTD 12,3±0,3 11,577±1,095 12.604±1.122m1i K2-76 8 KNSTD 16,5±0,4 12,841±1,157 16.746±1.479m2i K2-81 6 KNSTD 15,3±0,5 13,588±1,434 15.552±1.384
NU-24 10 07KNSTD 93.9±6.3 55,512±18,924 99.099±8.93NU-7 6 KNSTD 51.6±3.4 34,997±10,444 55.411±4.879
PM-3 6 07KNSTD 1.22±0.12 0,61±0,444 1.304±0.122PM-2 7 07KNSTD 7.59±0.77 3,643±2,367 7.49±0.741KM-2 TM-9 6 07KNSTD 97.54±9.02 40,71±23,192 85.571±7.674KM-1 TM-15 6 07KNSTD 135.13±13.12 39,258±32,584 114.909±10.817
Chevalier et al. (2005a) WG-15 9 LLNL3000 45,1±3,9 29,575±6,839 42,005±3,728CK-61 8 KNSTD / 40,931±13,571 67,824±6,103
13: EXS KC2-67 8 LLNL3000 / 14,275±1,313 16,974±1,59914: WXS Zi-88 14 LLNL3000 / 31,084±7,599 48,354±4,21215: AQu KC2-76 7 LLNL3000 / 24,69±5,003 36,895±3,207
Barnard et al. (2004b) m2 NDL 30 6 LLNL3000 4,4±0,13 2,804±1,743 4.265±0.381m1 NDL 22 5 LLNL3000 16,45±0,4 7,26±5,286 16.285±1.437
E84 6 LLNL3000 91,19±1,65 47,5±22,122 85.875±7.562MK41 5 S555 4,8±0,67 3,916±1,106 5.263±0.643LT16 7 S555 1,71±0,34 0,999±0,46 1.534±0.276
T5c 9 KNSTD 2.6±0.2 1,856±0,761 2.807±0.266T4 12 KNSTD 24.6±2.2 13,666±3,051 23.019±2.028T3 11 KNSTD 28.8±2.6 20,231±2,697 26.521±2.299T2 8 KNSTD 47.8±4.4 27,074±4,195 40.433±3.646
m4c Na26 6 07KNSTD 46.1±1.6 32,434±6,158 43.15±3.958M4a Na12 6 07KNSTD 54.5±1.3 26,703±13,333 51.018±4.522M3 Na40 6 07KNSTD 64.4±1.3 39,528±11,47 61.521±5.416M2 Na42 6 07KNSTD 107.3±2.3 63,563±13,589 100.522±8.957
M10 Na52 5 07KNSTD 2.7±0.07 1,268±1,441 3.166±0.278M4 Na76 6 07KNSTD 54.3±1.3 31,469±15,684 50.867±4.509m5a Na107 7 07KNSTD 15.3±0.4 11,576±2,111 16.374±1.442
T5C-133 7 07KNSTD / 18,543±2,159 24,509±2,168T5C-126 6 07KNSTD / 19,36±8,554 40,784±3,615KC2-45 6 KNSTD / 28,226±8,318 45,499±4,041KC2-51 9 KNSTD / 51,872±19,274 94,724±8,45
N6 5 LLNL3000 20,89±0,5 17,051±2,082 20.217±1.775N17 10 LLNL3000 42,24±1,09 27,309±6,689 40.258±3.587A11 5 LLNL3000 17,81±0,38 12,536±2,889 17.844±1.565
BYG-9 b 9 KNSTD 18,5±2,2 14,189±3,64 18.98±1.723T5C-64 7 07KNSTD / 14,651±0,672 17,464±1,546T5C-66 8 07KNSTD / 16,164±1,215 20,59±1,822T5C-42 10 07KNSTD / 33,653±7,885 48,748±4,259T5C-30 10 07KNSTD / 24,802±7,477 49,757±4,383T5C-22 5 07KNSTD / 12,421±3,303 20,316±1,759T7C-32 7 07KNSTD / 11,566±1,254 15,55±1,334
4a: M3 main T7C-24-24bis 6 07KNSTD / 33,408±5,205 50.025±3.6715: M2 T7C-46 11 07KNSTD / 26,379±8,364 45,163±3,8776: M1 T7C-72 9 07KNSTD / 23,476±1,744 30,945±2,77: M T7C-59 8 07KNSTD / 16,479±5,444 30,502±2,614
KC2-268 15 KNSTD / 23,101±13,07 64,545±5,8
Table 2: Studies used in the compilation.published Lifton Lal/Stone time-dep
Study per crest used b ages (ka) mean ages (ka)ac oldest ages (ka)a
Westernmost Himalayan-Tibetan orogenS-Alichur Range (Yashikul) Zech et al. (2005a)
S-Alichur Range (Gurumdy) Abramowski et al. (2006)Mustagata and Kongur Shan Seong et al. (2009)
Transhimalaya and Western TibetSulamu Tagh Mériaux et al. (2004)
Seong et al. (2007)
Ladakh Dortch et al. (2010) NubraNubra
Hedrick et al. (in press) India-47India-10
Ayilari Range 16a: Manikala M1This study 17c: CK M2 outer
Kailas Range This study
Monsoon-influenced HimalayaGarhwal (Nanda Devi)
Khumbu Himal Finkel et al. (2003) Thyangboche INepal Abramowski (2004) Macha Khola 4
Langtang 1Rongbuk-Everest Owen et al. (2009) Ron-28
Ron-8Ron-24Ron-41
Pulan graben Owen et al. (2010)
Ama Drime Range This study 9a: Dingye S frontal9c: Dingye S main #2
Pulan Graben This study 12c: Pulan M1E12b: Pulan M2
Monsoon-influenced TibetNianbaoyeze Owen et al. (2003a) Ximencuo
JiukeheQiemuqu
Gonga Shan Zhou et al. (2007) BaiyuNyainqentanghla This study 1a: Gulu W
1b: Gulu E2c: Ybj outer E2a: Ybj outer W
2b: Ybj innerXainza Range This study 4b: M3 inner
KungCo Graben This study 11: KungcoWe used Cronus 2.2 with constant file 2.2.1a Uncertainties are reported at the 1s confidence level.b 10Be isotope ratios for KNSTD=3.11x10⁻¹²; for LLNL3000=3x10-12; for S555=95.5x10⁻¹²; for 07KNSTD=2.85x10⁻¹²
c mean age of the surfacesee Tables S1 and S2 for more details about each sample.
Table 2

quartz./ standardSample Lat (N) Long (E) (cm) granite factor T5C-58 30,81 91,56 5003 4 g b 0,99 1.227±0.024 07KNSTD 15,851±1,418 14,552±1,747 15,041±1,798 14,004±1,413 15,486±1,346 T5C-59 30,81 91,56 5003 4 g b 0,99 1.252±0.024 07KNSTD 16,167±1,446 14,809±1,777 15,283±1,826 14,244±1,437 15,768±1,371 T5C-60 30,81 91,56 4995 4 g b 1 1.297±0.023 07KNSTD 16,757±1,493 15,285±1,831 15,74±1,877 14,697±1,478 16,292±1,41 T5C-61 30,81 91,56 4988 4 g b 1 1.21±0.025 07KNSTD 15,674±1,405 14,419±1,732 14,913±1,784 13,875±1,402 15,328±1,335T5C-62 30,81 91,56 4991 4 g b 1 1.298±0.037 07KNSTD 16,803±1,545 15,325±1,868 15,779±1,916 14,736±1,52 16,333±1,462T5C-63 30,81 91,56 4991 4 g b 1 1.358±0.034 07KNSTD 17,587±1,598 15,941±1,93 16,372±1,974 15,319±1,564 17,026±1,504T5C-64 30,81 91,56 4987 4 g b 0,99 1.393±0.035 07KNSTD 18,081±1,645 16,328±1,979 16,747±2,021 15,685±1,604 17,464±1,546T5C-66 30,81 91,56 4874 4 g b 1 1.584±0.04 07KNSTD 21,603±1,966 19,186±2,326 19,537±2,358 18,355±1,877 20,59±1,822T5C-67 30,81 91,56 4874 4 g b 1 1.364±0.034 07KNSTD 18,586±1,69 16,811±2,036 17,226±2,078 16,148±1,65 17,91±1,584T5C-68 30,81 91,57 4858 4 g b 1 1.32±0.035 07KNSTD 18,124±1,657 16,461±2 16,887±2,043 15,821±1,624 17,499±1,556T5C-69 30,81 91,57 4840 4 g b 1 1.294±0.032 07KNSTD 17,908±1,627 16,307±1,975 16,738±2,018 15,676±1,601 17,308±1,53T5C-70 30,81 91,57 4860 4 g b 1 1.3±0.04 07KNSTD 17,823±1,652 16,225±1,987 16,658±2,032 15,597±1,619 17,233±1,556T5C-71 30,81 91,56 4876 4 g b 1 1.512±0.047 07KNSTD 20,616±1,914 18,404±2,256 18,779±2,293 17,628±1,832 19,717±1,782T5C-72 30,81 91,56 4869 4 g b 1 1.219±0.03 07KNSTD 16,659±1,514 15,297±1,852 15,762±1,9 14,719±1,504 16,203±1,432T5C-73 30,81 91,56 4855 4 g b 1 1.273±0.031 07KNSTD 17,515±1,588 15,987±1,933 16,427±1,978 15,373±1,567 16,96±1,495T5C-19 30,02 90,24 5305 4 q b 1 0.947±0.026 07KNSTD 11,044±1,009 10,295±1,25 10,824±1,309 9,991±1,025 10,874±0,967T5C-20 30,02 90,24 5302 4 g b 1 1.135±0.023 07KNSTD 13,252±1,188 12,22±1,468 12,745±1,525 11,763±1,189 13,044±1,137T5C-21 30,02 90,24 5302 4 g b 1 0.904±0.018 07KNSTD 10,558±0,945 9,88±1,186 10,41±1,244 9,607±0,97 10,401±0,905T5C-22 30,02 90,24 5295 4 q b 1 1.821±0.032 07KNSTD 21,373±1,905 18,664±2,236 18,999±2,267 17,82±1,793 20,316±1,759T5C-23 30,02 90,24 5287 4 g b 1 1.248±0.025 07KNSTD 14,678±1,315 13,445±1,615 13,952±1,668 12,925±1,305 14,384±1,252T5C-25 30,02 90,24 5276 4 g b 0,98 2.881±0.052 07KNSTD 34,463±3,085 28,113±3,378 28,014±3,351 26,742±2,699 31,104±2,703 T5C-26 30,02 90,24 5258 4 g b 0,98 2.344±0.042 07KNSTD 28,216±2,523 23,753±2,851 23,874±2,853 22,636±2,282 26,094±2,265 T5C-27 30,02 90,24 5248 4 q b 0,98 1.912±0.037 07KNSTD 23,085±2,067 20,021±2,405 20,32±2,43 19,09±1,927 21,797±1,896 T5C-28 30,02 90,24 5227 4 g b 0,99 2.711±0.07 07KNSTD 32,977±3,014 27,184±3,304 27,152±3,286 25,838±2,651 29,907±2,657 T5C-29 30,02 90,24 5221 4 g b 1 3.202±0.074 07KNSTD 38,979±3,54 31,212±3,781 30,929±3,73 29,618±3,022 34,66±3,057 T5C-30 30,02 90,24 5206 4 g b 1 4.812±0.103 07KNSTD 59,271±5,383 43,247±5,24 42,211±5,091 40,986±4,178 49,757±4,383 T5C-31 30,02 90,24 5200 4 g b 1 1.587±0.03 07KNSTD 19,414±1,737 17,235±2,069 17,616±2,105 16,509±1,666 18,585±1,615 T5C-32 30,02 90,24 5200 4 g b 1 1.457±0.026 07KNSTD 17,806±1,587 16,003±1,917 16,418±1,958 15,356±1,545 17,165±1,487 T5C-33 30,02 90,24 5184 4 g b 1 2.289±0.041 07KNSTD 28,254±2,526 23,862±2,865 23,992±2,867 22,746±2,293 26,123±2,268 T5C-34 30,02 90,24 5177 4 g b 1 2.987±0.053 07KNSTD 37,061±3,316 29,977±3,602 29,778±3,562 28,5±2,875 33,168±2,881 T5C-35 30,02 90,25 5034 4 g b 1 1.485±0.026 07KNSTD 19,546±1,743 17,468±2,093 17,863±2,131 16,74±1,685 18,698±1,62 T5C-36 30,02 90,25 5033 4 g b 1 3.903±0.083 07KNSTD 51,806±4,696 39,326±4,76 38,668±4,659 37,499±3,818 43,556±3,83 T5C-37 30,02 90,25 5066 4 g b 0,99 3.624±0.064 07KNSTD 47,221±4,237 36,71±4,418 36,194±4,337 34,991±3,536 40,331±3,51 T5C-38 30,02 90,25 5026 4 g b 0,99 4.35±0.075 07KNSTD 57,855±5,198 42,818±5,158 41,9±5,024 40,649±4,109 48,461±4,22T5C-39 30,02 90,25 5021 4 g b 0,99 3.081±0.054 07KNSTD 40,896±3,664 32,83±3,947 32,503±3,891 31,166±3,146 36,056±3,134 T5C-40 30,02 90,25 5014 4 q b 0,99 3.504±0.066 07KNSTD 46,725±4,202 36,518±4,401 36,027±4,322 34,795±3,522 39,996±3,489 T5C-41 30,02 90,25 5010 4 g b 0,99 3.719±0.065 07KNSTD 49,729±4,462 38,197±4,597 37,623±4,507 36,472±3,685 42,047±3,658T5C-42 30,02 90,25 4999 4 g b 0,99 4.321±0.08 07KNSTD 58,175±5,243 43,078±5,198 42,145±5,062 40,873±4,142 48,748±4,259T5C-43 30,02 90,25 4991 4 g b 1 2.163±0.031 07KNSTD 29,093±2,581 24,699±2,953 24,829±2,955 23,533±2,359 26,808±2,309T5C-44 30,02 90,25 4982 4 g b 0,99 4.112±0.108 07KNSTD 56,082±5,163 41,861±5,111 41,055±4,99 39,821±4,104 46,921±4,193
T5C-44bis 30,02 90,25 5239 4 g b 0,99 2.105±0.113 07KNSTD 25,417±2,612 21,782±2,837 22,013±2,857 20,755±2,342 23,74±2,386T5C-45 30,02 90,24 5261 4 g b 0,99 1.073±0.032 07KNSTD 12,793±1,182 11,838±1,446 12,375±1,506 11,407±1,18 12,597±1,133T7C-7 30,66 88,56 5232 4 q c 1 5.45±0.064 07KNSTD 64,707±5,765 46,929±5,627 45,391±5,416 44,081±4,425 55,571±4,796
T7C-11 30,67 88,55 5280 4 g b 1 11.85±0.09 07KNSTD 140,405±12,682 101,171±12,262 97,958±11,809 95,497±9,669 116,367±10,139T7C-15 30,65 88,56 5096 4 g b 1 4.252±0.052 07KNSTD 53,466±4,754 40,261±4,821 39,471±4,705 38,349±3,846 45,088±3,884T7C-17 30,65 88,56 5101 4 g c 1 7.523±0.091 07KNSTD 95,379±8,567 71,05±8,573 68,767±8,256 66,538±6,719 81,966±7,124T7C-18 30,65 88,56 5102 4 q b 1 3.449±0.047 07KNSTD 43,15±3,836 34,26±4,102 33,767±4,024 32,532±3,264 37,741±3,253T7C-14 30,66 88,55 5231 4 g b 1 10.217±0.091 07KNSTD 123,137±11,09 90,918±10,999 87,78±10,564 84,716±8,564 103,725±9,023T7C-12 30,67 88,55 5283 4 q b 1 7.089±0.06 07KNSTD 82,66±7,366 61,522±7,386 59,621±7,123 57,244±5,745 70,932±6,117T7C-19 30,6 88,53 4988 4 g b 1 19.64±0.25 07KNSTD 274,269±25,806 193,067±24,039 186,541±23,084 182,31±18,969 224,294±20,231T7C-20 30,6 88,53 4988 4 g c 1 30.053±0.29 07KNSTD 436,537±42,633 305,263±39,016 290,614±36,838 282,908±30,095 359,361±33,395T7C-21 30,6 88,53 4989 4 g b 1 27.252±0.244 07KNSTD 391,394±37,748 275,093±34,873 263,881±33,206 255,992±27,027 320,194±29,431T7C-22 30,6 88,53 4990 4 g b 1 44.44±0.304 07KNSTD 684,136±71,067 486,648±65,072 463,478±61,325 447,554±49,554 561,669±54,831T7C-23 30,6 88,53 4993 4 g b 1 14.691±0.153 07KNSTD 201,077±18,505 142,42±17,473 135,349±16,502 132,033±13,527 167,11±14,801
T7C-24-24bis 30,6 88,52 5036 4 g c 1 4.451±0.065 and 4.689±0.083 07KNSTD 59.157±4.476 43.788±4.441 42.728±4.311 41.488±3.528 50.025±3.671T7C-25 30,6 88,52 5041 4 g b 1 3.206±0.048 07KNSTD 41,295±3,679 33,136±3,972 32,725±3,905 31,472±3,163 36,47±3,152T7C-26 30,6 88,52 5042 4 g b 1 3.238±0.038 07KNSTD 41,69±3,693 33,399±3,991 32,974±3,922 31,72±3,174 36,741±3,156T7C-27 30,6 88,52 5051 4 g b 1 3.487±0.052 07KNSTD 44,749±3,99 35,365±4,242 34,844±4,16 33,626±3,382 38,815±3,356T7C-28 30,6 88,52 5056 4 g b 1 2.963±0.043 07KNSTD 37,872±3,367 30,781±3,685 30,505±3,636 29,262±2,937 33,943±2,928T7C-30 30,6 88,52 5086 4 g b 1 3.458±0.038 07KNSTD 43,667±3,866 34,623±4,136 34,122±4,058 32,885±3,289 38,076±3,268T7C-32 30,61 88,5 5254 4 g b 1 1.368±0.019 07KNSTD 15,934±1,408 14,526±1,731 14,973±1,777 13,963±1,395 15,55±1,334T7C-33 30,61 88,5 5238 4 g b 1 0.975±0.021 07KNSTD 11,418±1,026 10,682±1,285 11,198±1,341 10,353±1,049 11,262±0,984T7C-34 30,61 88,5 5243 4 g b 1 0.992±0.016 07KNSTD 11,593±1,028 10,831±1,293 11,345±1,349 10,49±1,051 11,433±0,985T7C-35 30,61 88,5 5209 4 g b 1 1.102±0.018 07KNSTD 13,085±1,161 12,159±1,452 12,675±1,507 11,715±1,174 12,907±1,112T7C-36 30,61 88,5 5200 4 g b 1 1.008±0.023 07KNSTD 12,008±1,083 11,211±1,351 11,738±1,409 10,845±1,101 11,85±1,039T7C-37 30,61 88,5 5207 4 g b 1 1.064±0.024 07KNSTD 12,638±1,14 11,763±1,418 12,29±1,476 11,347±1,153 12,471±1,094T7C-39 30,61 88,5 5179 4 g b 1 1.14±0.022 07KNSTD 13,715±1,225 12,721±1,525 13,231±1,58 12,253±1,235 13,509±1,173T7C-40 30,08 88,43 5337 4 g b 1 4.279±0.047 07KNSTD 49,52±4,391 37,572±4,492 36,925±4,394 35,84±3,587 41,917±3,601T7C-41 30,08 88,43 5337 4 g b 1 3.848±0.049 07KNSTD 44,478±3,949 34,693±4,151 34,158±4,068 32,903±3,297 38,483±3,313T7C-42 30,08 88,42 5334 4 g b 1 2.942±0.036 07KNSTD 33,957±3,005 27,754±3,314 27,647±3,286 26,391±2,639 30,709±2,636T7C-43 30,08 88,42 5337 4 g b 1 1.34±0.02 07KNSTD 15,381±1,362 14,048±1,676 14,499±1,723 13,489±1,35 15,028±1,293T7C-44 30,08 88,42 5341 4 g b 1 3.713±0.061 07KNSTD 42,822±3,827 33,628±4,038 33,146±3,962 31,879±3,211 37,377±3,24T7C-45 30,08 88,42 5340 4 g b 1 1.911±0.024 07KNSTD 21,942±1,937 19,11±2,277 19,406±2,303 18,234±1,821 20,819±1,784T7C-46 30,08 88,42 5322 4 g b 1 4.622±0.046 07KNSTD 53,89±4,777 40,002±4,782 39,187±4,662 38,075±3,809 45,163±3,877T7C-47 30,08 88,42 5314 4 g b 1 3.101±0.031 07KNSTD 36,127±3,188 29,208±3,482 29,007±3,442 27,789±2,773 32,443±2,777T7C-49 30,08 88,42 5291 4 g b 1 1.329±0.019 07KNSTD 15,565±1,376 14,223±1,696 14,675±1,742 13,663±1,366 15,19±1,304T7C-50 30,08 88,42 5273 4 g b 1 2.985±0.038 07KNSTD 35,383±3,134 28,772±3,437 28,615±3,403 27,385±2,741 31,849±2,737T7C-51 30,08 88,41 5253 4 g b 1 2.595±0.036 07KNSTD 30,998±2,748 25,816±3,085 25,833±3,073 24,529±2,457 28,346±2,439T7C-63 29,94 88,35 5170 4 g b 1 2.223±0.028 07KNSTD 27,637±2,443 23,494±2,803 23,636±2,807 22,405±2,239 25,595±2,195T7C-64 29,94 88,35 5161 4 g b 1 2.094±0.028 07KNSTD 26,124±2,312 22,426±2,677 22,622±2,688 21,386±2,139 24,32±2,089T7C-65 29,94 88,35 5167 4 g b 1 2.363±0.033 07KNSTD 29,424±2,608 24,782±2,961 24,869±2,959 23,59±2,363 27,075±2,33T7C-66 29,94 88,35 5161 4 g b 1 2.276±0.054 07KNSTD 28,414±2,577 24,057±2,911 24,176±2,913 22,932±2,339 26,246±2,314T7C-68 29,94 88,35 5140 4 g b 1 2.402±0.03 07KNSTD 30,283±2,678 25,442±3,036 25,508±3,031 24,193±2,419 27,759±2,382T7C-69 29,94 88,35 5130 4 g b 1 2.398±0.067 07KNSTD 30,36±2,793 25,511±3,112 25,576±3,107 24,259±2,501 27,821±2,489T7C-70 29,94 88,35 5120 4 g b 1 2.045±0.025 07KNSTD 25,982±2,295 22,366±2,667 22,572±2,68 21,333±2,131 24,199±2,075T7C-71 29,94 88,35 5110 4 g b 1 2.368±0.061 07KNSTD 30,248±2,764 25,454±3,094 25,525±3,089 24,208±2,483 27,73±2,464T7C-72 29,94 88,36 5070 4 g b 1 2.634±0.052 07KNSTD 34,287±3,081 28,324±3,411 28,251±3,387 26,98±2,731 30,945±2,7T7C-55 29,82 88,19 5340 4 g b 1 1.052±0.017 07KNSTD 12,125±1,075 11,258±1,344 11,773±1,4 10,882±1,09 11,943±1,029T7C-56 29,82 88,19 5345 4 g b 1 2.279±0.043 07KNSTD 26,287±2,353 22,36±2,686 22,533±2,695 21,301±2,15 24,457±2,126T7C-57 29,82 88,19 5350 4 g b 1 1.404±0.024 07KNSTD 16,126±1,435 14,645±1,752 15,082±1,797 14,065±1,413 15,687±1,356T7C-58 29,82 88,19 5355 4 g b 1 1.307±0.03 07KNSTD 14,97±1,352 13,704±1,653 14,174±1,703 13,165±1,338 14,651±1,286T7C-59 29,82 88,19 5360 4 g b 1 2.938±0.033 07KNSTD 33,739±2,98 27,583±3,29 27,5±3,265 26,214±2,618 30,502±2,614T7C-60 29,82 88,19 5355 4 g b 1 1.295±0.04 07KNSTD 14,837±1,373 13,592±1,663 14,069±1,714 13,061±1,354 14,529±1,309T7C-61 29,82 88,19 5350 4 g b 1 1.717±0.025 07KNSTD 19,736±1,748 17,421±2,079 17,767±2,112 16,67±1,669 18,869±1,623T7C-62 29,83 88,2 5320 4 g b 1 6.199±0.068 07KNSTD 73,115±6,521 53,395±6,409 51,204±6,115 49,1±4,93 62,709±5,415
T5C-141 28,32 87,72 5071 5 q c 0,99 1.363±0.033 07KNSTD 18,332±1,664 16,553±2,003 16,992±2,047 15,881±1,62 17,628±1,556T5C-142 28,32 87,72 5061 3 q c 0,99 3.566±0.115 07KNSTD 47,707±4,474 36,933±4,557 36,546±4,49 35,197±3,683 40,365±3,681T5C-143 28,32 87,72 5043 2 q c 0,99 2.664±0.067 07KNSTD 35,514±3,241 29,145±3,54 29,155±3,526 27,733±2,841 31,785±2,819T5C-144 28,32 87,72 5018 2 q c 0,99 2.42±0.059 07KNSTD 32,595±2,965 27,229±3,301 27,351±3,302 25,884±2,645 29,482±2,606T5C-146 28,32 87,73 4960 3 g c 0,99 5.225±0.134 07KNSTD 73,558±6,786 54,975±6,726 53,303±6,491 50,458±5,204 62,652±5,607T5C-147 28,32 87,73 4937 5 q c 0,99 3.454±0.162 07KNSTD 49,657±4,969 38,2±4,898 37,776±4,824 36,477±4,022 41,681±4,067T5C-148 28,32 87,73 4907 6 q c 0,99 4.468±0.112 07KNSTD 65,91±6,061 48,438±5,912 47,079±5,719 45,23±4,654 55,84±4,982T5C-149 28,32 87,73 4864 4 q c 0,99 10.871±0.266 07KNSTD 164,784±15,502 117,624±14,591 114,117±14,082 110,479±11,537 132,877±12,06T5C-150 28,32 87,73 4835 3 q c 0,99 9.223±0.267 07KNSTD 139,598±13,238 102,596±12,782 100,234±12,427 96,846±10,194 114,055±10,46T5C-151 28,32 87,73 4812 4 q c 0,99 8.489±0.227 07KNSTD 130,631±12,268 97,506±12,081 95,465±11,772 91,675±9,58 107,674±9,782T5C-152 28,32 87,73 4773 3 q c 0,99 13.439±0.423 07KNSTD 213,03±20,768 152,799±19,379 146,719±18,501 140,495±15,059 174,421±16,397T5C-153 28,32 87,73 4741 4 q b 0,99 21.24±0.295 07KNSTD 356,795±34,36 254,68±32,248 245,03±30,812 234,071±24,718 287,44±26,406T5C-154 28,32 87,73 4727 3 q b 0,99 6.736±0.118 07KNSTD 106,214±9,667 80,702±9,818 78,739±9,532 75,07±7,659 90,024±7,928T5C-155 28,32 87,74 4696 5 q c 0,99 3.475±0.088 07KNSTD 55,814±5,125 42,181±5,143 41,548±5,043 40,135±4,128 46,291±4,124T5C-115 28,15 87,65 5254 4 g b 0,96 2.192±0.056 07KNSTD 27,855±2,54 23,545±2,857 23,773±2,873 22,42±2,296 25,7±2,278T5C-116 28,15 87,65 5247 4 q c 0,96 1.393±0.035 07KNSTD 17,746±1,614 15,973±1,935 16,404±1,978 15,32±1,566 17,111±1,513T5C-118 28,15 87,65 5250 4 q b 0,96 0.928±0.028 07KNSTD 11,793±1,09 10,994±1,343 11,509±1,401 10,647±1,102 11,617±1,045T5C-119 28,15 87,65 5254 4 q c 0,96 1.295±0.036 07KNSTD 16,445±1,508 14,958±1,82 15,411±1,868 14,357±1,477 15,977±1,426T5C-121 28,15 87,65 5223 4 q c 0,99 1.576±0.065 07KNSTD 19,697±1,905 17,484±2,195 17,894±2,237 16,729±1,796 18,824±1,776T5C-122 28,15 87,65 5225 4 q c 0,99 2.194±0.055 07KNSTD 27,45±2,501 23,291±2,825 23,535±2,843 22,186±2,27 25,362±2,246T5C-123 28,15 87,65 5220 4 q b 0,99 1.295±0.032 07KNSTD 16,199±1,469 14,782±1,788 15,248±1,836 14,197±1,448 15,76±1,39T5C-124 28,15 87,65 5216 5 q c 0,99 1.02±0.03 07KNSTD 12,879±1,187 11,979±1,462 12,503±1,519 11,541±1,192 12,694±1,139T5C-125 28,15 87,65 5215 4 q b 0,99 1.514±0.038 07KNSTD 18,988±1,726 16,946±2,052 17,365±2,094 16,233±1,658 18,199±1,608T5C-126 28,15 87,65 5220 4 q c 0,99 3.841±0.093 07KNSTD 48,421±4,422 37,034±4,501 36,613±4,43 35,279±3,614 40,784±3,615
Table S1: Analytical results of 10Be geochronology and surface exposure ages from our study.Thick. boulder/ shielding 10Be a Lal/Stone time indep Desilets Dunai Lifton Lal/Stone time-dep
Elev (m) cobble (106 at/g) used h Ages (ka) a Ages (ka) a Ages (ka) a Ages (ka) a Ages (ka) a1a: Gulu W
1b: Gulu E
2b: ybj inner
2a: ybj outer W
2c: ybj outer E
2d**: ybj outer N
3a**: M4 #1
3b**: M4 #23c**: M4 #34c*: M3 old
4a: M3 main
4b: M3 inner
5: M2
6: M1
7: M
8*: Dingye N
9b**: Dingye S main #1
9c: Dingye S main #2
Table S1

T5C-127 28,15 87,65 5151 4 q b 0,99 1.155±0.028 07KNSTD 14,799±1,342 13,677±1,654 14,185±1,708 13,153±1,342 14,51±1,28T5C-129 28,15 87,65 5146 4 q c 0,99 2.454±0.065 07KNSTD 31,642±2,9 26,388±3,212 26,543±3,217 25,047±2,575 28,716±2,559T5C-130 28,15 87,66 5140 4 g b 0,99 3.612±0.085 07KNSTD 46,867±4,269 36,32±4,408 35,967±4,346 34,545±3,532 39,768±3,516T5C-131 28,15 87,66 5142 4 q c 0,99 2.136±0.055 07KNSTD 27,563±2,515 23,46±2,849 23,712±2,867 22,354±2,291 25,461±2,259T5C-132 28,15 87,66 5143 4 g b 0,99 1.359±0.034 07KNSTD 17,482±1,588 15,84±1,917 16,288±1,963 15,206±1,552 16,883±1,491T5C-133 28,13 87,67 5006 4 g b 1 1.939±0.048 07KNSTD 26,413±2,403 22,789±2,763 23,091±2,788 21,734±2,222 24,509±2,168
frontal T5C-134 28,13 87,67 5012 4 q c 1 1.283±0.032 07KNSTD 17,399±1,58 15,868±1,921 16,329±1,968 15,243±1,556 16,814±1,485T5C-135 28,13 87,67 5012 4 q c 1 1.435±0.035 07KNSTD 19,46±1,765 17,469±2,113 17,906±2,157 16,736±1,707 18,621±1,642T5C-137 28,13 87,67 5011 4 q c 1 1.538±0.038 07KNSTD 20,883±1,899 18,583±2,251 19,011±2,294 17,762±1,815 19,87±1,757T5C-138 28,13 87,67 5007 4 q c 1 1.753±0.045 07KNSTD 23,856±2,177 20,901±2,538 21,278±2,573 19,922±2,042 22,409±1,989T5C-139 28,13 87,67 5012 4 q b 1 1.721±0.051 07KNSTD 23,367±2,158 20,517±2,508 20,911±2,546 19,564±2,024 22,007±1,978T5C-140 28,13 87,67 5004 4 g c 1 1.642±0.064 07KNSTD 22,362±2,144 19,746±2,467 20,155±2,508 18,844±2,009 21,155±1,978KC2-A 28,35 86,63 4948 5 q b 1 2.368±0.06 KNSTD 30,091±2,745 25,552±3,103 25,755±3,114 24,295±2,489 27,533±2,442KC2-B 28,35 86,63 4948 5 q b 1 2.371±0.062 KNSTD 30,13±2,757 25,581±3,111 25,784±3,123 24,321±2,497 27,564±2,452KC2-D 28,35 86,63 4948 4 q b 1 2.751±0.073 KNSTD 34,706±3,18 28,756±3,501 28,794±3,49 27,382±2,814 31,158±2,775KC2-E 28,35 86,63 4948 4 q b 1 2.393±0.062 KNSTD 30,16±2,757 25,603±3,113 25,805±3,124 24,341±2,498 27,588±2,452
KC2-266 28,78 86,47 4882 4 q c 1 1.42±0.036 KNSTD 18,506±1,684 16,861±2,043 17,291±2,086 16,189±1,655 17,78±1,573KC2-267 28,78 86,47 4874 4 q c 1 3.356±0.083 KNSTD 44,166±4,034 35,27±4,287 34,958±4,231 33,51±3,434 38,095±3,379KC2-268 28,78 86,46 4866 7 q c 1 5.55±0.148 KNSTD 75,735±7,014 57,561±7,06 55,945±6,83 52,954±5,48 64,545±5,8KC2-269 28,78 86,46 4858 5 q c 1 4.363±0.069 KNSTD 58,529±5,245 43,562±5,24 42,694±5,112 41,283±4,164 48,715±4,23KC2-270 28,78 86,46 4849 3 q c 1 1.724±0.041 KNSTD 22,636±2,051 20,148±2,437 20,526±2,472 19,243±1,961 21,397±1,885KC2-271 28,78 86,46 4847 2 q c 1 1.621±0.038 KNSTD 21,123±1,913 18,958±2,292 19,359±2,33 18,129±1,847 20,085±1,769KC2-272 28,78 86,46 4843 5 q c 1 1.508±0.036 KNSTD 20,176±1,828 18,208±2,201 18,625±2,242 17,44±1,777 19,254±1,696KC2-273 28,78 86,46 4840 6 q c 1 1.356±0.047 KNSTD 18,314±1,722 16,744±2,068 17,179±2,113 16,083±1,688 17,612±1,614KC2-274 28,78 86,46 4835 3 q c 1 4.249±0.073 KNSTD 56,617±5,087 42,441±5,113 41,694±5 40,338±4,078 47,051±4,097KC2-275 28,78 86,46 4831 4 q c 1 1.094±0.026 KNSTD 14,579±1,32 13,728±1,658 14,24±1,713 13,228±1,347 14,301±1,259KC2-276 28,78 86,46 4827 5 q c 1 2.425±0.041 KNSTD 32,783±2,925 27,652±3,317 27,738±3,313 26,332±2,651 29,669±2,57KC2-277 28,78 86,46 4821 3 q c 1 0.625±0.016 KNSTD 8,285±0,752 8,048±0,973 8,595±1,035 7,938±0,81 8,109±0,716KC2-278 28,78 86,46 4817 7 q c 1 1.083±0.026 KNSTD 14,888±1,348 14,005±1,692 14,504±1,745 13,487±1,374 14,584±1,284KC2-279 28,78 86,46 4795 5 q c 1 0.844±0.02 KNSTD 11,522±1,044 11,025±1,332 11,559±1,391 10,705±1,091 11,339±0,999KC2-280 28,78 86,46 4777 5 q c 1 1.674±0.039 KNSTD 23,1±2,092 20,585±2,489 20,963±2,524 19,66±2,003 21,794±1,919KC2-39 30,38 81,18 4504 4 g c 1 1.334±0.039 KNSTD 19,746±1,822 18,199±2,223 18,52±2,253 17,481±1,808 18,887±1,696KC2-40 30,38 81,18 4506 7 g c 1 1.595±0.055 KNSTD 24,193±2,279 21,743±2,689 21,959±2,704 20,817±2,189 22,743±2,087KC2-44 30,38 81,18 4515 4 g b 1 1.449±0.05 KNSTD 21,337±2,005 19,474±2,404 19,763±2,43 18,669±1,959 20,293±1,858KC2-45 30,38 81,18 4530 3 g b 1 3.702±0.091 KNSTD 54,11±4,952 41,823±5,091 41,06±4,976 39,861±4,09 45,499±4,041KC2-46 30,38 81,18 4533 6 g b 1 3.12±0.115 KNSTD 46,588±4,451 37,373±4,663 36,856±4,579 35,744±3,798 40,02±3,722KC2-47 30,38 81,18 4532 5 g b 1 1.413±0.036 KNSTD 20,808±1,897 19,032±2,31 19,331±2,336 18,252±1,87 19,827±1,758KC2-48 30,38 81,18 4530 10 g c 1 2.251±0.055 KNSTD 34,69±3,159 29,421±3,57 29,27±3,536 28,094±2,874 31,338±2,773KC2-49 30,38 81,18 4530 5 g c 1 1.667±0.043 KNSTD 24,596±2,244 22,028±2,675 22,223±2,687 21,086±2,161 23,08±2,048KC2-50 30,38 81,18 4526 5 g b 1 2.163±0.054 KNSTD 32,033±2,921 27,567±3,347 27,524±3,327 26,323±2,696 29,196±2,587KC2-51 30,38 81,17 4476 5 g b 1 7.172±0.157 KNSTD 110,894±10,217 86,204±10,566 83,719±10,21 80,542±8,3 94,724±8,45KC2-52 30,38 81,17 4477 5 g b 1 3.595±0.088 KNSTD 54,794±5,014 42,374±5,158 41,579±5,038 40,356±4,141 46,049±4,089KC2-53 30,38 81,17 4471 5 g c 1 6.238±0.213 KNSTD 96,351±9,213 74,823±9,359 72,793±9,063 70,021±7,433 82,615±7,67KC2-54 30,38 81,17 4470 5 g b 1 5.957±0.131 KNSTD 91,946±8,431 71,428±8,722 69,48±8,443 67,033±6,884 78,753±6,997KC2-55 30,38 81,17 4470 5 g c 1 4.59±0.084 KNSTD 70,477±6,37 54,86±6,638 53,16±6,402 50,755±5,155 60,818±5,328KC2-56 30,38 81,17 4467 5 g b 1 5.349±0.229 KNSTD 82,486±8,161 64,544±8,232 63,091±8,012 60,719±6,629 70,618±6,8KC2-57 30,38 81,17 4466 5 g c 1 2.022±0.052 KNSTD 30,799±2,814 26,766±3,254 26,77±3,24 25,546±2,621 28,219±2,507KC2-58 30,38 81,17 4465 5 g c 1 4.116±0.088 KNSTD 63,237±5,748 48,371±5,868 46,971±5,671 45,381±4,63 53,941±4,755KC2-59 30,38 81,17 4466 5 g c 1 2.111±0.054 KNSTD 32,164±2,938 27,745±3,372 27,699±3,352 26,503±2,718 29,3±2,602KC2-66 30,99 81,26 4801 4 q b 1 1.12±0.05 LLNL3000 13,443±1,318 12,82±1,622 13,269±1,672 12,383±1,344 13,251±1,268KC2-67 30,99 81,26 4799 4 g b 1 1.458±0.06 LLNL3000 17,533±1,692 16,201±2,031 16,54±2,066 15,594±1,672 16,974±1,599KC2-69 30,99 81,26 4796 4 q b 1 1.443±0.041 LLNL3000 17,373±1,595 16,077±1,958 16,42±1,992 15,478±1,595 16,832±1,504KC2-70 30,99 81,26 4794 4 q b 1 1.211±0.031 LLNL3000 14,581±1,327 13,808±1,673 14,233±1,718 13,318±1,362 14,324±1,268KC2-71 30,99 81,26 4795 4 q b 1 1.156±0.032 LLNL3000 13,915±1,274 13,235±1,609 13,676±1,656 12,776±1,313 13,701±1,22KC2-72 30,99 81,26 4793 4 g b 1 1.42±0.042 LLNL3000 17,116±1,58 15,876±1,94 16,227±1,975 15,289±1,582 16,605±1,493KC2-73 30,99 81,26 4797 4 q b 1 1.425±0.03 LLNL3000 17,149±1,541 15,899±1,913 16,249±1,947 15,311±1,55 16,634±1,453KC2-74 30,99 81,26 4798 4 q b 1 1.29±0.04 LLNL3000 15,504±1,438 14,574±1,786 14,976±1,827 14,055±1,46 15,168±1,37
Zi-85 31,01 81,24 4800 4 g b 1 3.725±0.064 LLNL3000 45,035±4,035 36,055±4,336 35,471±4,247 34,374±3,47 39,124±3,4Zi-86 31,01 81,24 4800 4 g b 1 3.537±0.061 LLNL3000 42,744±3,828 34,604±4,161 34,081±4,079 32,927±3,323 37,55±3,262Zi-87 31,01 81,24 4800 4 g b 1 3.239±0.102 LLNL3000 39,102±3,651 32,123±3,954 31,731±3,889 30,572±3,189 34,977±3,177Zi-88 31,01 81,24 4800 4 g b 1 4.712±0.081 LLNL3000 57,138±5,134 43,188±5,203 42,19±5,059 41,026±4,148 48,354±4,212Zi-89 31,01 81,24 4800 4 g b 1 3.659±0.077 LLNL3000 44,229±3,998 35,554±4,297 34,999±4,211 33,873±3,444 38,566±3,384
31,01 81,24 4800 4 g b 1 3.123±0.107 LLNL3000 37,689±3,553 31,142±3,854 30,805±3,796 29,649±3,117 33,88±3,109Zi91 31,01 81,24 4800 4 g b 1 3.593±0.078 LLNL3000 43,42±3,933 35,048±4,241 34,499±4,156 33,358±3,397 38,007±3,342
31,01 81,24 4800 4 g b 1 3.355±0.144 LLNL3000 40,523±3,967 33,104±4,189 32,654±4,115 31,496±3,413 36,022±3,43931,01 81,24 4800 4 g b 1 1.794±0.037 KNSTD 22,56±2,027 20,168±2,428 20,392±2,444 19,302±1,954 21,431±1,87131,01 81,24 4800 4 g b 1 3.942±0.194 LLNL3000 47,692±4,821 37,595±4,85 36,972±4,751 35,951±3,998 40,965±4,041
zi95 31,01 81,24 4800 4 g b 1 4.237±0.077 KNSTD 53,703±4,831 41,097±4,954 40,277±4,833 39,172±3,965 45,438±3,96431,01 81,24 4800 4 g b 1 4.177±0.211 LLNL3000 50,565±5,148 39,262±5,088 38,541±4,974 37,495±4,194 43,019±4,27531,01 81,24 4800 4 g b 1 1.987±0.095 LLNL3000 23,897±2,388 21,21±2,716 21,393±2,729 20,285±2,237 22,573±2,20431,01 81,24 4800 4 g b 1 1.407±0.032 KNSTD 17,672±1,594 16,309±1,967 16,645±1,999 15,698±1,594 17,099±1,5
KC2-75 31,03 81,17 5093 4 q b 1 3.119±0.069 KNSTD 34,712±3,14 28,632±3,46 28,388±3,416 27,304±2,778 31,501±2,768KC2-76 31,04 81,18 5091 4 q b 1 3.949±0.069 LLNL3000 41,771±3,742 33,429±4,019 32,88±3,935 31,764±3,206 36,895±3,207KC2-77 31,04 81,18 5103 4 q b 1 2.265±0.064 LLNL3000 23,728±2,183 20,764±2,533 20,925±2,542 19,83±2,046 22,437±2,009KC2-78 31,04 81,18 5106 4 q b 1 22.385±0.261 LLNL3000 247,422±23,082 176,054±21,806 167,549±20,615 162,967±16,852 203,159±18,195KC2-80 31,04 81,18 5117 4 q b 1 3.408±0.06 LLNL3000 35,581±3,183 29,18±3,505 28,889±3,455 27,818±2,805 32,203±2,796KC2-82 31,03 81,17 5131 4 q b 1 2.457±0.06 KNSTD 26,835±2,439 23,018±2,788 23,06±2,782 21,991±2,246 25,06±2,214KC2-83 31,04 81,18 5132 4 q b 1 2.246±0.08 LLNL3000 23,223±2,195 20,347±2,521 20,518±2,531 19,436±2,049 22,012±2,027WG1-1 32,04 80,02 4490 3 q c 1 13.341±0.226 LLNL3000 187,045±17,352 138,353±17,065 132,503±16,247 129,472±13,377 157,349±14,074WG1-2 32,04 80,02 4492 3 q c 1 15.473±0.114 KNSTD 229,053±21,156 171,709±21,183 164,147±20,12 159,837±16,447 191,361±16,99WG1-3 32,04 80,02 4494 3 q c 1 23.292±0.255 LLNL3000 338,193±32,259 249,701±31,495 238,808±29,903 231,783±24,371 282,252±25,764WG1-4 32,04 80,02 4496 3 q c 1 19.057±0.321 LLNL3000 272,019±25,782 199,602±25,002 192,189±23,922 188,304±19,744 226,433±20,608WG1-5 32,04 80,02 4498 3 q c 1 13.722±0.186 LLNL3000 191,875±17,705 142,108±17,481 135,651±16,585 132,555±13,635 161,721±14,38WG1-6 32,04 80,02 4500 3 q c 1 11.18±0.291 LLNL3000 154,771±14,593 115,879±14,407 112,012±13,853 109,454±11,47 129,242±11,778WG1-7 32,04 80,02 4520 3 q c 1 22.911±0.172 KNSTD 344,185±32,743 254,004±31,999 242,584±30,335 235,758±24,733 287,017±26,115WG1-8 32,04 80,02 4540 3 q c 1 11.776±0.194 LLNL3000 160,142±14,741 119,01±14,599 114,906±14,019 112,354±11,549 133,586±11,864WG1-9 32,04 80,02 4550 3 q c 1 10.637±0.094 KNSTD 150,217±13,621 112,562±13,692 108,842±13,168 106,334±10,808 125,492±10,976
WG1-10 32,04 80,01 4555 3 q c 1 14.438±0.123 KNSTD 206,24±18,96 152,925±18,788 145,897±17,812 141,968±14,555 174,262±15,424WG1-11 32,05 80 4760 3 q c 1 3.468±0.06 LLNL3000 41,273±3,696 33,745±4,057 33,19±3,972 32,159±3,246 36,774±3,195WG1-12 32,05 80 4760 3 q c 1 3.357±0.059 LLNL3000 39,945±3,577 32,825±3,947 32,323±3,869 31,291±3,159 35,824±3,114WG1-13 32,05 80 4760 3 q c 1 3.813±0.095 LLNL3000 45,43±4,155 36,431±4,433 35,782±4,334 34,82±3,573 39,686±3,526WG1-14 32,05 80 4760 3 q c 1 1.763±0.044 LLNL3000 20,879±1,897 18,874±2,286 19,096±2,303 18,116±1,851 20,037±1,77WG1-15 32,04 80 4760 3 q c 1 4.085±0.1 LLNL3000 48,702±4,452 38,36±4,666 37,641±4,558 36,713±3,765 42,005±3,728WG1-16 32,05 80 4760 3 q c 1 1.748±0.044 LLNL3000 20,695±1,883 18,728±2,27 18,955±2,287 17,979±1,838 19,873±1,758WG1-17 32,05 80 4760 3 q c 1 3.454±0.103 LLNL3000 41,109±3,818 33,631±4,127 33,084±4,042 32,052±3,33 36,657±3,311WG1-18 32,04 80 4760 3 q c 1 3.62±0.095 LLNL3000 43,102±3,954 34,978±4,263 34,363±4,169 33,347±3,43 38,042±3,391WG1-19 32,05 80 4760 3 q c 1 3.156±0.069 LLNL3000 37,533±3,396 31,138±3,765 30,734±3,699 29,699±3,022 33,974±2,986WG1-20 32,04 80,01 4645 3 q c 1 13.225±0.167 LLNL3000 171,544±15,722 125,668±15,381 120,796±14,701 118,245±12,104 143,477±12,677WG1-21 32,05 80,01 4645 3 q c 1 11.802±0.233 LLNL3000 152,36±14,103 113,219±13,927 109,366±13,381 106,91±11,04 127,225±11,372WG1-22 32,05 80,01 4645 3 q c 1 8.657±0.152 LLNL3000 110,612±10,079 85,543±10,42 82,726±10,025 80,169±8,19 95,803±8,449WG1-23 32,05 80,01 4645 3 q c 1 11.569±0.1 KNSTD 156,383±14,199 115,784±14,093 111,772±13,53 109,301±11,116 130,513±11,427WG1-24 32,05 80,01 4640 3 q c 1 14.825±0.202 LLNL3000 193,812±17,893 141,921±17,458 135,258±16,536 132,302±13,609 163,341±14,53WG1-25 32,05 80,01 4640 3 q c 1 11.647±0.147 LLNL3000 150,649±13,735 112,174±13,683 108,383±13,149 105,932±10,811 125,825±11,069WG1-26 32,05 80,01 4640 3 q c 1 9.582±0.128 LLNL3000 123,1±11,158 94,704±11,509 91,816±11,1 89,21±9,074 104,996±9,199WG1-27 32,05 80,01 4640 3 q c 1 11.358±0.21 LLNL3000 146,773±13,526 109,695±13,459 106,056±12,943 103,637±10,668 122,745±10,924WG1-28 32,04 80,03 4393 3 q c 1 4.959±0.118 LLNL3000 70,822±6,493 56,154±6,851 54,392±6,604 52,22±5,365 61,989±5,515WG1-29 32,04 80,03 4445 3 q c 1 3.016±0.053 LLNL3000 41,698±3,735 34,648±4,167 34,127±4,086 33,074±3,339 37,08±3,223WG1-30 32,04 80,033 4445 3 q c 1 7.653±0.227 LLNL3000 107,537±10,142 84,389±10,481 81,799±10,11 79,17±8,314 93,453±8,55WG1-31 32,04 80,032 4445 3 q c 1 7.062±0.131 LLNL3000 99,032±9,02 77,669±9,455 75,293±9,12 72,987±7,457 86,263±7,61WG1-32 32,04 80,03 4467 3 q c 1 12.613±0.172 LLNL3000 178,452±16,411 132,287±16,233 127,015±15,496 124,021±12,731 149,893±13,289WG1-33 32,04 80,03 4467 3 q c 1 14.702±0.157 LLNL3000 209,613±19,339 156,595±19,285 149,934±18,351 145,764±14,99 177,202±15,741WG1-34 32,04 80,03 4467 3 q c 1 16.249±0.205 LLNL3000 233±21,69 174,969±21,684 167,675±20,649 163,013±16,877 194,086±17,37CK-40 32,49 79,67 4320 7 q b 1 8.174±0.157 KNSTD 130,941±12,039 101,797±12,477 98,948±12,066 96,703±9,95 111,382±9,903CK-43 32,48 79,66 4390 2 q b 1 8.065±0.186 KNSTD 119,411±11,061 93,856±11,547 91,078±11,149 88,537±9,165 102,645±9,206CK-44 32,48 79,66 4400 4 q b 1 11.297±0.238 KNSTD 171,431±16 128,244±15,866 123,323±15,171 120,639±12,535 144,172±12,989CK-45 32,48 79,66 4410 9 q b 1 9.201±0.18 KNSTD 143,812±13,278 109,639±13,471 106,173±12,977 103,766±10,703 121,048±10,798CK-46 32,48 79,66 4425 7 q b 1 11.972±0.144 KNSTD 184,574±16,956 137,508±16,872 131,865±16,084 128,931±13,224 155,882±13,803CK-47 32,48 79,66 4435 8 q b 1 7.373±0.107 KNSTD 112,035±10,15 88,136±10,706 85,288±10,307 82,801±8,423 97,225±8,522CK-48 32,48 79,66 4440 6 q b 1 9.765±0.277 KNSTD 146,856±13,924 111,406±13,894 107,811±13,377 105,391±11,099 123,386±11,318CK-50 32,49 79,65 4440 10 q b 1 1.041±0.028 KNSTD 15,664±1,431 14,957±1,816 15,317±1,852 14,462±1,483 15,376±1,366CK-52 32,49 79,65 4460 7 q b 1 6.286±0.11 KNSTD 93,139±8,45 73,144±8,882 70,879±8,564 68,794±7,008 81,387±7,152
9d**: Dingye S main #3
9a: Dingye S
10**: cho oyu
11: KungCo
12a**: Pulan M1W
12c: Pulan M1E
12b: Pulan M2
13: EXS
14: WXS
zi-90
zi-92zi-93zi-94
zi-96zi-98zi-99
15: A Qu
16b*: Manikala M2E
16a: Manikala M1
16c*: Manikala M2W
16d*: Manikala M3
17a*: CK M3
17b**: CK M2 inner

CK-53 32,49 79,65 4470 7 q b 1 4.655±0.092 KNSTD 68,224±6,184 53,482±6,482 51,682±6,233 49,807±5,071 59,96±5,271CK-54 32,49 79,65 4490 7 q b 1 3.841±0.091 KNSTD 55,584±5,077 43,29±5,264 42,338±5,125 41,226±4,224 47,71±4,229CK-55 32,49 79,65 4485 6 q b 1 2.706±0.054 KNSTD 38,775±3,489 32,526±3,922 32,075±3,85 31,073±3,149 35,041±3,062CK-56 32,49 79,65 4480 5 q b 1 3.352±0.08 KNSTD 47,85±4,364 38,466±4,674 37,791±4,571 36,863±3,774 41,55±3,679CK-57 32,49 79,65 4475 5 q b 1 5.209±0.106 KNSTD 75,045±6,824 59,522±7,23 57,861±6,995 55,644±5,68 65,681±5,791CK-58 32,49 79,65 4470 8 q b 1 1.655±0.045 KNSTD 24,191±2,216 21,799±2,653 21,913±2,655 20,934±2,152 22,972±2,047CK-60 32,49 79,65 4440 6 q b 1 2.567±0.094 KNSTD 37,571±3,579 31,748±3,954 31,349±3,888 30,341±3,217 34,095±3,164CK-61 32,49 79,65 4425 6 q b 1 5.214±0.14 KNSTD 77,647±7,199 61,763±7,586 60,225±7,363 58,091±6,022 67,824±6,103CK-63 32,49 79,66 4390 7 q b 1 4.709±0.183 KNSTD 71,819±6,964 57,178±7,205 55,439±6,954 53,277±5,724 63,049±5,95
17c: CK M2 outer
Sample density is 2.7 g/cm3; No erosion rate was applied.We used Cronus 2.2 with constant file 2.2.1.a Uncertainties are reported at the 1s confidence level.h 10Be isotope ratios for 07KNSTD=2.85x10⁻¹²; for KNSTD=3.11x10⁻¹²; for LLNL3000=3x10-12
* Moraines not taken into account because >120 ka.** Moraines not taken into account because their number of samples is too small, according to our criterion.Samples T7C-62 on M and KC2-78 on AQu are outliers because twice as old as the next odest age.

Thick. standard Lal/Stone time-indep Desilets Dunai Lifton Lal/Stone time-dep Site Sample Lat (N) Long (E) Elev (m) (cm)
Zech et al. (2005a) M2 M2/1 37,79 72,76 3755 3 3.766±1.593 S555 66.669±6.55 56.108±7.128 54.99±6.956 53.335±5.797 61.021±5.843M2/2 37,79 72,76 3755 4 1.254±0.522 S555 22.112±2.142 20.62±2.592 20.649±2.585 20.062±2.157 21.528±2.035M2/3 37,79 72,76 3755 4 2.095±0.723 S555 37.083±3.498 32.562±4.033 32.169±3.968 31.503±3.316 34.607±3.179M2/4 37,79 72,76 3770 5 2.681±1.003 S555 47.646±4.56 40.272±5.032 39.744±4.945 38.832±4.134 43.047±4.013M2/5 37,79 72,76 3770 1 3.942±1.072 S555 68.097±6.305 57.329±7.038 56.221±6.87 54.531±5.652 62.278±5.602M2/6 37,77 72,77 3960 5 0.965±0.591 S555 15.364±1.639 14.73±1.964 14.968±1.989 14.379±1.675 15.271±1.597M2/7 37,78 72,77 3945 5 1.058±0.480 S555 16.965±1.669 16.085±2.04 16.268±2.055 15.692±1.709 16.758±1.611
M1 M1/1 37,78 72,76 3815 2 4.478±1.626 S555 76.268±7.319 63.846±8.004 62.664±7.821 61.196±6.527 69.354±6.476M1/2 37,78 72,76 3815 5 4.821±1.697 S555 84.348±8.074 70.166±8.787 68.725±8.568 67.193±7.152 76.67±7.139M1/3 37,78 72,76 3820 3 4.813±2.033 S555 82.557±8.141 68.705±8.755 67.342±8.544 65.849±7.179 75.044±7.209M1/4 37,78 72,76 3815 3 4.549±2.283 S555 78.155±7.995 65.305±8.507 64.09±8.314 62.625±7.036 71.05±7.095M1/5 37,78 72,76 3815 3 5.098±1.999 S555 87.795±8.553 73.012±9.24 71.405±8.997 69.782±7.533 79.845±7.572M1/6 37,78 72,76 3830 2 4.971±1.900 S555 84.144±8.155 69.912±8.819 68.48±8.6 66.957±7.198 76.475±7.214M1/7 37,78 72,76 3830 2 4.948±1.739 S555 83.756±8.015 69.603±8.715 68.186±8.499 66.673±7.094 76.121±7.085
Abramowski et al. (2006) GU1 GU11 37,6 73,9 4600 2,5 4.522±0.189 S555 51.745±5.053 40.693±5.143 39.899±5.021 39.127±4.23 46.24±4.401GU12 37,6 73,9 4600 6 3.163±0.093 S555 37.09±3.433 30.69±3.758 30.177±3.679 29.627±3.07 34.49±3.105GU13 37,6 73,9 4600 5 1.656±0.059 S555 19.23±1.814 17.229±2.131 17.327±2.135 16.75±1.763 18.846±1.733GU15 37,6 73,9 4590 3 2.607±0.090 S555 29.938±2.819 25.485±3.151 25.206±3.104 24.654±2.591 28.392±2.604GU16 37,6 73,9 4600 3 2.061±0.094 S555 23.682±2.337 20.733±2.635 20.676±2.617 20.105±2.194 22.899±2.207GU19 37,6 73,9 4585 6 6.418±0.192 S555 76.628±7.176 60.274±7.444 58.694±7.215 57.332±5.991 69.323±6.308
Seong et al. (2009) m3f MUST-1 38,47 75,06 3689 5 0.501±0.013 07KNSTD 9.822±0.893 9.906±1.199 10.279±1.239 9.702±0.991 9.851±0.871MUST-2 38,47 75,06 3681 5 0.496±0.013 07KNSTD 9.766±0.888 9.86±1.194 10.234±1.234 9.657±0.987 9.796±0.867MUST-3 38,47 75,07 3700 5 0.516±0.016 07KNSTD 10.057±0.93 10.112±1.236 10.481±1.276 9.902±1.026 10.083±0.908MUST-4 38,46 75,07 3709 5 0.499±0.013 07KNSTD 9.677±0.88 9.763±1.182 10.14±1.222 9.562±0.977 9.708±0.858MUST-5 38,47 75,06 3688 5 0.490±0.013 07KNSTD 9.611±0.875 9.715±1.177 10.093±1.218 9.516±0.974 9.642±0.854MUST-6 38,47 75,06 3685 5 0.488±0.012 07KNSTD 9.587±0.868 9.695±1.171 10.073±1.211 9.497±0.967 9.619±0.847
m3f' MUST-7 38,51 75,03 3535 5 0.467±0.017 07KNSTD 9.951±0.94 10.116±1.252 10.48±1.291 9.912±1.044 9.981±0.919MUST-8 38,52 75,03 3534 5 0.457±0.012 07KNSTD 9.742±0.886 9.924±1.202 10.292±1.241 9.725±0.994 9.774±0.865MUST-9 38,52 75,03 3521 5 0.439±0.011 07KNSTD 9.424±0.854 9.64±1.165 10.014±1.205 9.446±0.963 9.458±0.834MUST-10 38,52 75,03 3517 5 0.408±0.011 07KNSTD 8.777±0.8 9.026±1.094 9.429±1.138 8.84±0.905 8.789±0.779MUST-11 38,52 75,03 3494 5 0.405±0.011 07KNSTD 8.824±0.805 9.085±1.102 9.487±1.146 8.899±0.912 8.838±0.784MUST-12 38,52 75,03 3490 5 0.424±0.011 07KNSTD 9.26±0.841 9.507±1.151 9.882±1.191 9.311±0.951 9.288±0.821MUST-13 38,51 75,04 3511 5 0.421±0.014 07KNSTD 9.089±0.847 9.33±1.146 9.718±1.188 9.138±0.953 9.111±0.827MUST-14 38,51 75,04 3521 5 0.428±0.011 07KNSTD 9.189±0.834 9.421±1.14 9.803±1.181 9.226±0.942 9.215±0.814
m5a MUST-21 38,39 75,17 3862 5 0.433±0.011 07KNSTD 7.743±0.702 7.884±0.953 8.3±0.999 7.724±0.788 7.734±0.682MUST-22 38,39 75,17 3864 5 0.405±0.011 07KNSTD 7.234±0.66 7.408±0.898 7.842±0.947 7.242±0.742 7.232±0.642MUST-23 38,39 75,17 3862 5 0.394±0.014 07KNSTD 7.045±0.662 7.215±0.89 7.672±0.943 7.053±0.74 7.049±0.646MUST-24 38,39 75,17 3862 5 0.403±0.015 07KNSTD 7.206±0.682 7.38±0.914 7.817±0.964 7.215±0.761 7.205±0.665MUST-25 38,39 75,17 3862 5 0.419±0.011 07KNSTD 7.492±0.681 7.655±0.927 8.075±0.973 7.501±0.767 7.482±0.662MUST-26 38,39 75,17 3861 5 0.422±0.011 07KNSTD 7.55±0.686 7.708±0.933 8.127±0.979 7.553±0.771 7.539±0.666
m6a MUST-27 38,36 75,17 4023 5 0.431±0.013 07KNSTD 7.16±0.66 7.257±0.885 7.711±0.936 7.089±0.732 7.159±0.642MUST-28 38,36 75,17 4024 5 0.458±0.012 07KNSTD 7.606±0.691 7.685±0.93 8.106±0.977 7.526±0.769 7.594±0.672MUST-29 38,36 75,17 4025 5 0.443±0.012 07KNSTD 7.352±0.67 7.45±0.903 7.881±0.951 7.278±0.745 7.345±0.651MUST-30 38,36 75,17 4026 5 0.467±0.012 07KNSTD 7.826±0.71 7.882±0.953 8.3±0.999 7.718±0.788 7.816±0.69MUST-31 38,36 75,17 4028 5 0.431±0.011 07KNSTD 7.214±0.654 7.309±0.883 7.757±0.934 7.14±0.728 7.211±0.636
m7a MUST-32 38,36 75,17 4082 5 0.119±0.006 07KNSTD 1.915±0.192 1.983±0.254 2.261±0.289 1.941±0.215 2.017±0.198MUST-33 38,36 75,17 4081 5 0.124±0.006 07KNSTD 1.997±0.199 2.074±0.264 2.37±0.301 2.03±0.223 2.105±0.205MUST-34 38,36 75,17 4094 5 0.129±0.006 07KNSTD 2.064±0.203 2.147±0.272 2.456±0.31 2.102±0.229 2.177±0.21MUST-35 38,36 75,17 4120 5 0.150±0.006 07KNSTD 2.392±0.229 2.511±0.313 2.807±0.348 2.461±0.262 2.529±0.236MUST-36 38,36 75,17 4167 5 0.127±0.006 07KNSTD 1.958±0.194 2.018±0.256 2.305±0.292 1.975±0.216 2.062±0.199MUST-37 38,36 75,17 4176 5 0.125±0.005 07KNSTD 1.918±0.183 1.972±0.246 2.252±0.279 1.93±0.205 2.019±0.188MUST-38 38,36 75,17 4180 5 0.124±0.009 07KNSTD 1.899±0.215 1.951±0.27 2.226±0.307 1.909±0.234 1.999±0.222
m6c MUST-52 38,29 75,02 4580 5 0.013±0.004 07KNSTD 0.162±0.052 0.177±0.058 0.172±0.057 0.174±0.056 0.184±0.059MUST-53 38,29 75,03 4568 5 0.032±0.004 07KNSTD 0.402±0.061 0.438±0.075 0.426±0.073 0.432±0.069 0.455±0.069MUST-54 38,29 75,02 4524 5 0.025±0.005 07KNSTD 0.32±0.07 0.351±0.081 0.341±0.079 0.346±0.077 0.363±0.079MUST-55 38,29 75,03 4504 5 0.048±0.005 07KNSTD 0.621±0.084 0.655±0.103 0.662±0.104 0.646±0.093 0.684±0.092MUST-56 38,29 75,03 4511 5 0.041±0.005 07KNSTD 0.529±0.079 0.568±0.096 0.563±0.095 0.561±0.088 0.59±0.087
m3c MUST-57 38,29 75,01 4357 5 1.137±0.027 07KNSTD 15.877±1.435 14.704±1.775 14.931±1.795 14.339±1.459 15.759±1.385MUST-58 38,29 75,01 4313 5 1.083±0.026 07KNSTD 15.455±1.398 14.397±1.739 14.639±1.76 14.047±1.43 15.366±1.352MUST-59 38,29 75,01 4308 5 1.074±0.034 07KNSTD 15.365±1.426 14.327±1.755 14.572±1.778 13.979±1.452 15.281±1.381MUST-60 38,29 75,01 4300 5 0.993±0.024 07KNSTD 14.259±1.29 13.403±1.619 13.686±1.646 13.077±1.331 14.234±1.252MUST-61 38,29 75,01 4284 5 1.144±0.027 07KNSTD 16.569±1.498 15.339±1.852 15.542±1.868 14.962±1.522 16.401±1.441
m4c MUST-67 38,29 75,01 4246 5 1.049±0.034 07KNSTD 15.481±1.441 14.482±1.777 14.724±1.8 14.131±1.471 15.39±1.395MUST-68 38,29 75,01 4244 5 1.027±0.025 07KNSTD 15.17±1.374 14.226±1.719 14.477±1.742 13.881±1.414 15.101±1.33MUST-69 38,29 75,01 4234 5 1.078±0.026 07KNSTD 16.008±1.449 14.931±1.804 15.155±1.823 14.565±1.483 15.882±1.398MUST-70 38,29 75,01 4244 5 1.021±0.026 07KNSTD 15.082±1.37 14.152±1.713 14.406±1.737 13.807±1.41 15.018±1.327MUST-71 38,29 75,01 4248 5 1.037±0.026 07KNSTD 15.288±1.387 14.319±1.732 14.568±1.755 13.974±1.426 15.21±1.343
m4h KONG_8 38,64 75,00 3639 5 0.371±0.011 07KNSTD 7.587±0.698 7.832±0.954 8.24±1 7.676±0.792 7.58±0.679KONG_9 38,64 75,00 3637 5 0.366±0.011 07KNSTD 7.493±0.69 7.745±0.944 8.155±0.99 7.592±0.784 7.485±0.671KONG_10 38,64 75,00 3638 5 0.374±0.011 07KNSTD 7.653±0.703 7.893±0.961 8.301±1.007 7.736±0.797 7.646±0.684KONG_11 38,64 75,00 3639 5 0.372±0.012 07KNSTD 7.607±0.706 7.851±0.962 8.259±1.007 7.694±0.799 7.6±0.687KONG_12 38,64 75,00 3641 5 0.382±0.011 07KNSTD 7.804±0.715 8.032±0.977 8.437±1.022 7.871±0.81 7.799±0.696KONG_13 38,64 75,00 3652 5 0.373±0.018 07KNSTD 7.574±0.754 7.813±0.997 8.223±1.046 7.658±0.842 7.566±0.736
m5h KONG_18 38,65 75,03 4057 5 0.247±0.008 07KNSTD 3.961±0.368 4.04±0.495 4.432±0.54 3.948±0.41 4.083±0.369KONG_19 38,65 75,03 4057 5 0.240±0.009 07KNSTD 3.849±0.364 3.923±0.486 4.297±0.53 3.836±0.405 3.973±0.367KONG_20 38,65 75,03 4060 5 0.235±0.009 07KNSTD 3.762±0.358 3.835±0.476 4.193±0.518 3.749±0.397 3.888±0.36KONG_21 38,65 75,03 4039 5 0.060±0.006 07KNSTD 0.971±0.129 1.006±0.156 1.063±0.164 0.988±0.139 1.04±0.136KONG_22 38,65 75,03 4042 5 0.314±0.010 07KNSTD 5.076±0.47 5.136±0.628 5.427±0.661 5.041±0.523 5.174±0.467
m6h KONG_23 38,64 75,03 4008 5 0.195±0.008 07KNSTD 3.207±0.308 3.302±0.413 3.593±0.447 3.239±0.346 3.345±0.314KONG_24 38,64 75,03 4005 5 0.101±0.007 07KNSTD 1.663±0.185 1.705±0.233 1.927±0.263 1.667±0.201 1.746±0.191KONG_25 38,65 75,03 3999 5 0.224±0.007 07KNSTD 3.702±0.342 3.789±0.463 4.138±0.503 3.705±0.383 3.829±0.345KONG_26 38,65 75,03 3997 5 0.22.4±0.008 07KNSTD 3.706±0.348 3.793±0.468 4.143±0.509 3.71±0.389 3.833±0.351KONG_27 38,65 75,03 4000 5 0.157±0.008 07KNSTD 2.592±0.261 2.717±0.349 3.021±0.387 2.666±0.296 2.731±0.269KONG_28 38,65 75,03 4000 5 0.077±0.006 07KNSTD 1.271±0.148 1.3±0.184 1.414±0.199 1.275±0.16 1.34±0.154
m3i KONG_35 38,71 75,28 3326 5 0.034±0.006 07KNSTD 0.867±0.171 0.945±0.201 0.985±0.209 0.931±0.188 0.935±0.183KONG_36 38,71 75,28 3328 5 0.059±0.007 07KNSTD 1.503±0.221 1.602±0.268 1.783±0.298 1.571±0.242 1.576±0.229KONG_37 38,71 75,28 3309 5 0.036±0.006 07KNSTD 1.623±0.209 1.742±0.264 1.949±0.295 1.708±0.234 1.703±0.217KONG_38 38,71 75,28 3299 5 0.039±0.007 07KNSTD 1.01±0.201 1.092±0.235 1.157±0.248 1.075±0.22 1.08±0.214KONG_41 38,74 75,27 3118 5 0.014±0.005 07KNSTD 0.402±0.148 0.474±0.178 0.46±0.173 0.469±0.174 0.454±0.167
m2c MUST-62 38,30 74,98 4005 5 1.175±0.046 07KNSTD 19.626±1.879 18.139±2.264 18.254±2.269 17.669±1.882 19.249±1.797MUST-63 38,30 74,98 4001 5 1.676±0.045 07KNSTD 28.112±2.574 24.995±3.042 24.853±3.011 24.259±2.493 26.912±2.397MUST-64 38,30 74,97 3987 5 1.547±0.037 07KNSTD 26.125±2.369 23.442±2.837 23.362±2.815 22.785±2.324 25.137±2.216MUST-65 38,30 74,98 3979 5 4.953±0.093 07KNSTD 85.233±7.738 69.887±8.492 68.454±8.278 66.938±6.83 77.666±6.838MUST-66 38,30 74,98 3995 5 3.266±0.056 07KNSTD 55.325±4.967 45.154±5.441 44.471±5.335 43.266±4.376 49.982±4.353MUST-86 38,28 74,98 3988 5 1.585±0.038 07KNSTD 26.771±2.428 23.951±2.899 23.851±2.875 23.272±2.374 25.718±2.268
m2b MUST-80 38,34 75,02 4181 5 2.963±0.079 07KNSTD 45.454±4.177 37.575±4.585 37.026±4.498 36.308±3.741 41.334±3.692MUST-81 38,34 75,02 4181 5 1.954±0.046 07KNSTD 29.858±2.707 26.045±3.152 25.834±3.113 25.247±2.575 28.408±2.504MUST-82 38,34 75,02 4168 5 5.717±0.069 07KNSTD 89.248±8.004 71.962±8.685 70.279±8.44 68.777±6.948 81.312±7.066MUST-83 38,34 75,02 4123 5 1.572±0.047 07KNSTD 24.709±2.284 22.113±2.705 22.068±2.688 21.493±2.226 23.861±2.147MUST-84 38,34 75,01 4113 5 4.290±0.075 07KNSTD 68.521±6.176 55.887±6.756 54.674±6.578 53.074±5.384 62.748±5.487MUST-90 38,34 75,02 4126 5 7.927±0.117 07KNSTD 127.635±11.612 101.645±12.391 99.195±12.031 97.552±9.963 113.756±10.016MUST-91 38,34 75,01 4117 5 1.784±0.044 07KNSTD 28.152±2.56 24.816±3.008 24.665±2.977 24.08±2.461 26.941±2.382MUST-92 38,34 75,01 4117 5 4.629±0.158 07KNSTD 73.883±7.024 60.415±7.529 59.213±7.347 57.673±6.103 67.388±6.232
Table S2: Analytical results of 10Be geochronology and surface exposure ages from the compilation.10Be a
(106 at/g) used b Ages (ka) a Ages (ka) a Ages (ka) a Ages (ka) a Ages (ka) a
Table S2

Meriaux et al. (2004) M1 NNM-1 37,80 87,40 4890 5 4.384±0.091 KNSTD 43.012±3.883 34.012±4.107 33.322±4.005 32.77±3.328 39.199±3.436NNM-2 37,80 87,40 4890 5 5.964±0.158 KNSTD 58.743±5.414 44.245±5.407 43.238±5.26 42.319±4.365 52.989±4.744NNM-4 37,80 87,40 4890 5 4.884±0.099 KNSTD 47.977±4.331 37.282±4.502 36.522±4.39 35.958±3.651 43.116±3.778NNM-3 37,80 87,40 4890 5 4.661±0.141 KNSTD 45.761±4.257 35.863±4.405 35.122±4.295 34.57±3.595 41.351±3.741NNM-8 37,80 87,40 4830 5 3.936±0.105 KNSTD 39.651±3.639 31.792±3.874 31.227±3.788 30.66±3.155 36.582±3.264NNM-9 37,80 87,40 4830 5 10.153±0.260 KNSTD 103.928±9.66 78.761±9.693 76.167±9.327 75.005±7.783 93.935±8.472
NNM-1OR 37,80 87,40 4830 5 2.704±0.070 KNSTD 27.155±2.478 22.795±2.768 22.665±2.74 22.086±2.263 26.011±2.308MF3-RR-1 37,80 87,40 4620 5 4.610±0.228 KNSTD 51.385±5.203 40.197±5.192 39.473±5.078 38.661±4.305 46.02±4.549MF3-RR-2 37,80 87,40 4620 5 5.050±0.075 KNSTD 56.359±5.037 43.514±5.228 42.674±5.103 41.684±4.198 50.66±4.391MF3-RR-3 37,80 87,40 4620 5 4.254±0.114 KNSTD 47.369±4.357 37.568±4.586 36.906±4.485 36.243±3.736 42.674±3.815MF3-RR-4 37,80 87,40 4620 5 5.435±0.136 KNSTD 60.721±5.573 46.62±5.686 45.589±5.534 44.468±4.573 55.056±4.908MF-RR-5 37,80 87,40 4620 5 4.675±0.117 KNSTD 52.119±4.773 40.677±4.953 39.944±4.842 39.106±4.016 46.67±4.151
M2 NNM-13A 37,80 87,40 4785 5 4.023±0.157 KNSTD 41.838±4.026 33.449±4.189 32.821±4.093 32.237±3.445 38.283±3.59NNM-15A 37,80 87,40 4785 5 0.398±0.028 KNSTD 4.1±0.459 3.991±0.549 4.434±0.608 3.895±0.472 4.248±0.467NNM-14A 37,80 87,40 4785 5 1.597±0.060 KNSTD 16.504±1.568 14.701±1.826 14.97±1.852 14.296±1.513 16.345±1.514NNM-16A 37,80 87,40 4785 5 0.3981±0.02 KNSTD 4.1±0.417 3.991±0.516 4.434±0.571 3.895±0.436 4.248±0.423NNM-17A 37,80 87,40 4785 5 1.682±0.051 KNSTD 17.386±1.606 15.394±1.881 15.625±1.902 14.97±1.55 17.159±1.544NNM-18A 37,80 87,40 4785 5 7.139±0.307 KNSTD 74.855±7.392 57.551±7.328 55.873±7.083 54.475±5.938 67.816±6.527NNM-11A 37,80 87,40 4900 5 7.900±0.158 KNSTD 77.824±7.073 59.321±7.201 57.58±6.956 56.3±5.743 70.423±6.209NNM-10A 37,80 87,40 4900 5 4.739±0.258 KNSTD 46.32±4.804 36.202±4.745 35.451±4.628 34.906±3.965 41.789±4.237NNM-12A 37,80 87,40 4900 5 5.160±0.146 KNSTD 50.488±4.671 38.849±4.757 38.047±4.638 37.413±3.873 45.194±4.064
NNM-5 37,80 87,40 4880 5 1.518±0.059 KNSTD 14.857±1.419 13.28±1.654 13.604±1.688 12.913±1.373 14.812±1.38NNM-6 37,80 87,40 4880 5 2.706±0.068 KNSTD 26.562±2.418 22.287±2.702 22.174±2.677 21.59±2.208 25.477±2.255NNM-7 37,80 87,40 4880 5 3.730±0.121 KNSTD 36.706±3.435 29.599±3.647 29.126±3.573 28.586±2.987 34.193±3.114
Seong et al. (2007) m2g K2-65 35,67 75,81 3113 3 0.400±0.010 KNSTD 12.911±1.171 13.412±1.622 13.703±1.65 13.113±1.338 12.874±1.135K2-66 35,67 75,81 3128 3 0.160±0.010 KNSTD 5.11±0.547 5.579±0.746 5.833±0.777 5.511±0.644 5.205±0.547K2-67 35,67 75,81 3122 5 0.170±0.010 KNSTD 5.539±0.582 6.009±0.793 6.353±0.835 5.93±0.682 5.611±0.577K2-68 35,67 75,81 3113 3 0.180±0.010 KNSTD 5.8±0.599 6.317±0.825 6.718±0.874 6.222±0.705 5.855±0.592K2-69 35,70 75,95 3109 3,5 0.210±0.010 KNSTD 6.838±0.678 7.488±0.954 7.873±0.999 7.385±0.81 6.825±0.662K2-70 35,70 75,95 3106 2 0.180±0.010 KNSTD 5.845±0.604 6.37±0.832 6.783±0.882 6.274±0.711 5.898±0.596
m1h K2-90 35,69 75,93 3095 3 0.020±0.010 KNSTD 0.538±0.273 0.643±0.33 0.645±0.331 0.641±0.327 0.604±0.306K2-91 35,70 75,93 3096 3 0.040±0.010 KNSTD 1.086±0.288 1.227±0.339 1.307±0.361 1.218±0.327 1.164±0.307K2-92 35,69 75,93 3094 3 0.030±0.010 KNSTD 0.816±0.281 0.939±0.332 0.973±0.344 0.934±0.325 0.89±0.306K2-93 35,69 75,93 3090 2 0.080±0.010 KNSTD 2.19±0.331 2.527±0.432 2.761±0.471 2.508±0.396 2.33±0.348K2-94 35,69 75,93 3096 3 0.040±0.010 KNSTD 1.086±0.288 1.227±0.339 1.308±0.361 1.218±0.327 1.164±0.307K2-95 35,29 75,66 3087 3 0.020±0.010 KNSTD 0.551±0.28 0.66±0.339 0.663±0.341 0.659±0.336 0.618±0.314K2-96 35,29 75,66 3116 3 0.050±0.010 KNSTD 1.342±0.293 1.503±0.349 1.641±0.381 1.491±0.333 1.421±0.308
m1c K2-12 35,68 75,47 2950 2 0.580±0.010 KNSTD 16.394±1.458 16.727±2.002 16.888±2.012 16.325±1.64 16.177±1.397K2-13 35,68 75,47 2952 5 0.600±0.020 KNSTD 17.37±1.623 17.601±2.166 17.734±2.174 17.162±1.793 17.076±1.554K2-14 35,68 75,48 2945 5 0.580±0.020 KNSTD 16.859±1.582 17.149±2.116 17.296±2.125 16.73±1.754 16.606±1.518K2-15 35,68 75,47 2950 4 0.580±0.020 KNSTD 16.669±1.564 16.973±2.094 17.126±2.104 16.561±1.737 16.43±1.502K2-16 35,68 75,47 2951 3 0.580±0.020 KNSTD 16.521±1.55 16.84±2.078 16.997±2.088 16.434±1.723 16.294±1.49K2-17 35,68 75,47 2950 2 0.580±0.020 KNSTD 16.394±1.538 16.727±2.064 16.888±2.075 16.326±1.712 16.177±1.479K2-18 35,68 75,47 2868 3 0.560±0.010 KNSTD 16.766±1.493 17.138±2.053 17.277±2.06 16.723±1.682 16.522±1.429K2-19 35,68 75,47 2865 2 0.500±0.020 KNSTD 14.865±1.427 15.421±1.928 15.617±1.944 15.074±1.609 14.757±1.382
m1g K2-48 35,67 75,80 3633 2 0.600±0.020 KNSTD 11.502±1.073 11.705±1.438 12.076±1.478 11.433±1.193 11.466±1.042K2-49 35,67 75,80 3631 2 0.610±0.020 KNSTD 11.707±1.09 11.903±1.461 12.265±1.499 11.622±1.211 11.673±1.059K2-50 35,67 75,80 3640 2 0.650±0.020 KNSTD 12.416±1.148 12.558±1.535 12.907±1.571 12.259±1.27 12.382±1.114K2-51 35,67 75,80 3644 2 0.600±0.020 KNSTD 11.433±1.067 11.632±1.429 12.007±1.47 11.365±1.186 11.398±1.036K2-52 35,67 75,80 3636 2 0.600±0.020 KNSTD 11.484±1.072 11.687±1.436 12.059±1.476 11.416±1.191 11.449±1.041K2-53 35,67 75,80 3643 4 0.650±0.020 KNSTD 12.606±1.165 12.732±1.556 13.077±1.592 12.427±1.287 12.569±1.131K2-54 35,67 75,80 3824 3 0.480±0.010 KNSTD 8.37±0.749 8.659±1.039 9.088±1.086 8.497±0.858 8.326±0.724K2-55 35,67 75,80 3825 5 0.710±0.020 KNSTD 12.595±1.154 12.586±1.531 12.94±1.567 12.277±1.262 12.557±1.119K2-56 35,67 75,80 3881 2 0.730±0.020 KNSTD 12.261±1.12 12.24±1.486 12.601±1.524 11.94±1.225 12.228±1.087K2-58 35,69 75,72 3879 2 0.720±0.030 KNSTD 12.093±1.168 12.086±1.516 12.449±1.555 11.788±1.265 12.063±1.138K2-59 35,69 75,72 3811 3 0.720±0.020 KNSTD 12.641±1.156 12.637±1.536 12.99±1.572 12.327±1.266 12.604±1.122
m1i K2-72 35,70 75,95 4209 2 0.910±0.020 KNSTD 12.91±1.16 12.578±1.513 12.934±1.55 12.248±1.241 12.869±1.124K2-73 35,70 75,95 4213 2 0.930±0.020 KNSTD 13.167±1.182 12.804±1.54 13.152±1.575 12.464±1.261 13.121±1.145K2-74 35,70 75,95 4212 2 0.940±0.020 KNSTD 13.317±1.195 12.938±1.555 13.28±1.59 12.592±1.274 13.266±1.157K2-75 35,70 75,95 4215 3 0.920±0.030 KNSTD 13.122±1.221 12.762±1.566 13.112±1.603 12.424±1.294 13.077±1.186K2-76 35,70 75,95 4211 3 1.190±0.030 KNSTD 17.024±1.546 16.073±1.946 16.292±1.964 15.618±1.595 16.746±1.479K2-77 35,70 75,94 4211 3 0.960±0.020 KNSTD 13.722±1.23 13.294±1.597 13.627±1.63 12.939±1.308 13.659±1.19K2-78 35,70 75,96 4225 2 0.940±0.020 KNSTD 13.233±1.187 12.854±1.545 13.2±1.58 12.512±1.266 13.184±1.15K2-79 35,69 75,96 4221 2 0.890±0.020 KNSTD 12.553±1.13 12.252±1.475 12.614±1.512 11.933±1.21 12.516±1.095
m2i K2-80 35,69 75,96 3823 3 0.710±0.020 KNSTD 15.277±1.4 14.968±1.821 15.237±1.846 14.578±1.5 15.136±1.35K2-81 35,69 75,96 3821 3 0.730±0.020 KNSTD 15.726±1.438 15.351±1.866 15.607±1.889 14.953±1.535 15.552±1.384K2-82 35,69 75,96 3818 2 0.700±0.020 KNSTD 14.976±1.374 14.711±1.791 14.995±1.818 14.332±1.476 14.854±1.327K2-83 35,69 75,96 3779 3 2.560±0.060 KNSTD 46.145±4.2 39.095±4.746 38.498±4.653 37.669±3.852 41.273±3.648K2-84 35,69 75,94 3768 2 0.680±0.020 KNSTD 12.124±1.115 12.192±1.486 12.553±1.524 11.899±1.228 12.094±1.083K2-85 35,69 75,94 3766 2 0.690±0.030 KNSTD 12.439±1.212 12.484±1.574 12.839±1.612 12.182±1.316 12.405±1.18
Dortch et al. (2010) Nubra NU-1 34,57 77,62 3237 3 3.342±0.053 KNSTD 85.492±7.712 74.094±8.981 72.366±8.728 70.541±7.168 76.227±6.663NU-2 34,57 77,63 3247 1 2.696±0.130 KNSTD 67.127±6.782 58.704±7.589 57.488±7.401 55.662±6.193 60.258±5.94NU-3 34,57 77,63 3243 2 1.909±0.073 KNSTD 47.811±4.592 41.594±5.21 40.984±5.112 40.021±4.274 42.359±3.962NU-4 34,58 77,63 3293 1,5 3.308±0.065 KNSTD 80.846±7.347 69.804±8.492 68.281±8.267 66.625±6.809 72.077±6.351NU-5 34,57 77,63 3243 1 1.943±0.108 KNSTD 48.263±5.037 41.919±5.522 41.301±5.42 40.32±4.609 42.712±4.359NU-6 34,57 77,63 3251 2 1.735±0.085 KNSTD 43.206±4.355 38.281±4.935 37.75±4.847 36.949±4.105 38.869±3.826
NU-23 34,57 77,63 3245 2 3.099±0.078 07KNSTD 87.024±8.043 75.337±9.257 73.591±8.999 71.757±7.432 77.605±6.96NU-24 34,57 77,63 3238 2 3.927±0.098 07KNSTD 112.028±10.413 96.357±11.898 94.063±11.558 92.159±9.589 99.099±8.93NU-25 34,57 77,63 3261 5 1.652±0.055 07KNSTD 46.667±4.392 40.728±5.041 40.142±4.947 39.21±4.119 41.476±3.798NU-26 34,57 77,63 3253 4 1.771±0.090 07KNSTD 50.632±5.16 43.664±5.668 42.96±5.554 41.88±4.693 44.613±4.44
Nubra NU-7 34,55 77,64 3223 2 2.441±0.051 KNSTD 62.087±5.634 53.943±6.548 52.703±6.367 51.012±5.206 55.411±4.879NU-8 34,55 77,64 3222 2 1.860±0.0450 KNSTD 47.161±4.303 41.174±5.007 40.578±4.913 39.632±4.062 41.852±3.708NU-9 34,55 77,64 3223 3 1.006±0.040 KNSTD 25.568±2.458 24.475±3.064 24.4±3.042 23.693±2.533 24.384±2.286
NU-10 34,55 77,64 3225 2 1.904±0.058 KNSTD 48.205±4.491 41.92±5.159 41.303±5.061 40.323±4.202 42.663±3.864NU-11 34,55 77,64 3221 2 1.141±0.048 KNSTD 28.815±2.801 27.2±3.429 27.025±3.393 26.3±2.837 27.223±2.582NU-12 34,55 77,64 3208 2,5 1.265±0.046 KNSTD 32.348±3.071 30.056±3.737 29.759±3.684 29.027±3.072 30.19±2.792
Hedrick et al. (in press) PM-3 India-45 33,23 78,17 5266 3 0.045±0.003 07KNSTD 0.46±0.051 0.525±0.071 0.518±0.07 0.524±0.063 0.528±0.057India-46 33,23 78,17 5263 3 0.180±0.002 07KNSTD 0.188±0.027 0.217±0.036 0.213±0.035 0.217±0.033 0.217±0.031India-47 33,23 78,17 5257 3 0.117±0.005 07KNSTD 1.218±0.117 1.256±0.157 1.348±0.167 1.245±0.133 1.304±0.122India-48 33,23 78,17 5267 2 0.102±0.005 07KNSTD 1.047±0.103 1.092±0.139 1.155±0.146 1.083±0.118 1.131±0.109India-49 33,23 78,17 5260 4 0.024±0.003 07KNSTD 0.251±0.039 0.289±0.051 0.283±0.049 0.289±0.047 0.29±0.045India-50 33,23 78,17 5265 3 0.026±0.003 07KNSTD 0.264±0.042 0.304±0.054 0.298±0.053 0.303±0.05 0.304±0.048
PM-2 India-10 33,25 78,2 4910 3 0.625±0.032 07KNSTD 7.586±0.767 7.525±0.97 7.969±1.023 7.4±0.824 7.49±0.741India-11 33,25 78,2 4905 3 0.429±0.030 07KNSTD 5.217±0.579 5.288±0.723 5.544±0.756 5.228±0.63 5.307±0.579India-12 33,25 78,2 4904 2 0.208±0.020 07KNSTD 2.51±0.322 2.68±0.405 2.928±0.442 2.658±0.363 2.695±0.341India-13 33,25 78,2 4899 2 3.075±0.076 07KNSTD 37.453±3.412 30.774±3.735 30.266±3.657 29.41±3.009 34.132±3.022India-14 33,24 78,2 4886 2 0.055±0.012 07KNSTD 0.662±0.159 0.731±0.185 0.749±0.189 0.729±0.178 0.736±0.176India-56 33,24 78,2 4924 3 0.290±0.008 07KNSTD 3.497±0.317 3.636±0.439 3.941±0.474 3.594±0.367 3.669±0.324India-57 33,25 78,2 4921 3 0.178±0.007 07KNSTD 2.141±0.204 2.275±0.283 2.521±0.312 2.254±0.239 2.299±0.214
KM-2 TM-6 32,98 78,21 4859 5 5.741±0.303 07KNSTD 74.128±7.673 56.922±7.458 54.773±7.145 52.934±5.996 65.122±6.58TM-7 32,98 78,21 4858 5 2.123±0.092 07KNSTD 27.102±2.649 23.456±2.964 23.394±2.944 22.501±2.436 25.533±2.435TM-8 32,98 78,21 4855 5 1.623±0.153 07KNSTD 20.716±2.667 18.596±2.818 18.763±2.836 17.875±2.447 19.961±2.534TM-9 32,98 78,21 4851 5 7.485±0.183 07KNSTD 97.57±9.024 74.298±9.116 71.654±8.748 69.8±7.214 85.571±7.674TM-10 32,98 78,21 4850 5 1.850±0.237 07KNSTD 23.684±3.686 20.924±3.661 20.998±3.666 20.071±3.259 22.584±3.481TM-11 32,98 78,21 4849 5 6.486±0.203 07KNSTD 84.347±7.952 64.696±8.02 62.791±7.748 61.08±6.412 73.865±6.763
KM-1 TM-12 32,98 78,21 4785 5 1.086±0.126 07KNSTD 14.297±2.083 13.53±2.248 13.911±2.306 13.083±2.001 14.132±2.037

TM-13 32,98 78,21 4785 5 4.070±0.349 07KNSTD 54.116±6.695 41.576±6.125 40.627±5.966 39.695±5.237 46.6±5.668TM-14 32,98 78,21 4782 5 0.952±0.075 07KNSTD 12.537±1.477 12.007±1.71 12.417±1.763 11.624±1.473 12.434±1.441TM-15 32,98 78,21 4781 5 9.947±0.353 07KNSTD 135.172±13.122 101.403±12.809 98.119±12.333 96.237±10.329 114.909±10.817TM-16 32,98 78,22 4768 5 5.633±0.175 07KNSTD 75.889±7.133 58.821±7.278 56.882±7.005 54.871±5.748 66.574±6.079TM-17 32,98 78,22 4762 5 1.762±0.124 07KNSTD 23.502±2.645 20.884±2.884 20.971±2.887 20.042±2.441 22.427±2.479
Barnard et al. (2004b) m2 NDL15 30,46 80,13 3720 5 0.092±0.013 LLNL3000 1.933±0.321 2.191±0.404 2.35±0.432 2.203±0.38 2.06±0.339NDL16 30,45 80,13 3817 5 0.004±0.002 LLNL3000 0.08±0.041 0.099±0.051 0.097±0.05 0.1±0.051 0.091±0.046NDL23 30,45 80,14 3968 5 0.176±0.006 LLNL3000 3.222±0.301 3.568±0.438 3.787±0.463 3.573±0.373 3.399±0.309NDL29 30,43 80,16 3497 5 0.500±0.015 LLNL3000 11.997±1.106 12.306±1.502 12.731±1.547 11.985±1.238 11.792±1.058NDL30 30,43 80,16 3476 5 0.171±0.005 LLNL3000 4.142±0.38 4.651±0.566 4.921±0.596 4.654±0.479 4.265±0.381NDL32 30,41 80,16 3397 5 0.121±0.005 LLNL3000 3.06±0.295 3.481±0.435 3.674±0.458 3.491±0.373 3.233±0.304
m1 NDL18 30,45 80,13 4051 5 0.125±0.005 LLNL3000 2.193±0.21 2.469±0.308 2.636±0.327 2.48±0.264 2.352±0.22NDL19 30,45 80,13 4069 5 0.524±0.015 LLNL3000 9.127±0.837 9.292±1.13 9.763±1.182 9.117±0.938 8.955±0.799NDL20 30,45 80,13 4068 5 0.279±0.007 LLNL3000 4.857±0.44 5.194±0.627 5.428±0.652 5.182±0.528 4.947±0.436NDL21 30,45 80,13 4069 5 0.204±0.007 LLNL3000 3.548±0.332 3.902±0.48 4.158±0.509 3.903±0.408 3.711±0.338NDL22 30,45 80,13 4075 5 0.966±0.024 LLNL3000 16.807±1.525 16.17±1.956 16.531±1.992 15.622±1.594 16.285±1.437
Finkel et al. (2003) Thyangboche I E84 27,92 86,80 4739 5 7.347±0.132 LLNL3000 101.5±9.235 76.795±9.338 75.072±9.084 71.551±7.298 85.875±7.562 E85 27,92 86,80 4725 5 6.915±0.125 LLNL3000 96.012±8.726 72.766±8.84 71.087±8.594 67.884±6.919 81.189±7.142 E86 27,92 86,80 4739 5 6.345±0.114 LLNL3000 87.35±7.919 66.355±8.047 65.108±7.859 62.278±6.338 73.783±6.477 E87 27,93 86,80 4930 5 3.691±0.094 LLNL3000 45.963±4.209 36.152±4.401 35.869±4.347 34.399±3.532 39.153±3.481 E88 27,93 86,80 5017 5 2.540±0.039 LLNL3000 30.317±2.695 25.602±3.064 25.824±3.077 24.329±2.442 27.684±2.388 E89 27,93 86,80 5021 5 2.592±0.087 LLNL3000 30.671±2.878 25.857±3.191 26.068±3.203 24.562±2.573 27.961±2.554
Abramowski (2004) Macha Khola 4 MK41 28,30 84,50 3900 4 0.249±0.022 S555 5.169±0.641 5.443±0.803 5.713±0.841 5.443±0.722 5.263±0.643MK42 28,30 84,50 3900 4 0.101±0.015 S555 2.095±0.361 2.355±0.447 2.496±0.473 2.379±0.424 2.267±0.387MK43 28,30 84,50 3900 4 0.180±0.014 S555 3.735±0.436 4.105±0.58 4.376±0.617 4.125±0.518 3.924±0.45MK44 28,30 84,50 3900 4 0.154±0.024 S555 3.195±0.571 3.531±0.691 3.735±0.729 3.553±0.656 3.409±0.604MK45 28,30 84,50 3900 4 0.178±0.034 S555 3.694±0.776 4.061±0.912 4.326±0.971 4.081±0.878 3.884±0.812
Langtang 1 LT12 28,20 85,50 2978 2 0.020±0.006 S555 0.672±0.21 0.815±0.263 0.822±0.265 0.828±0.261 0.739±0.23LT13 28,20 85,50 2978 4 0.030±0.011 S555 1.024±0.386 1.203±0.464 1.239±0.477 1.217±0.462 1.104±0.416LT14 28,20 85,50 2980 2 0.015±0.006 S555 0.503±0.206 0.628±0.262 0.624±0.26 0.638±0.263 0.564±0.231LT15 28,20 85,50 2980 1 0.013±0.004 S555 0.432±0.138 0.549±0.181 0.541±0.178 0.559±0.181 0.49±0.156LT16 28,20 85,50 3016 1,5 0.044±0.007 S555 1.44±0.261 1.665±0.33 1.744±0.345 1.682±0.315 1.534±0.276LT17 28,20 85,50 3016 4 0.038±0.011 S555 1.27±0.384 1.468±0.459 1.531±0.478 1.483±0.454 1.357±0.409LT18 28,20 85,50 3020 2 0.014±0.004 S555 0.459±0.137 0.578±0.179 0.572±0.177 0.588±0.178 0.518±0.154
Owen et al. (2009) T5c ron25 28,14 86,85 5242 2,5 0.200±0.010 KNSTD 2,221±0,223 2,351±0,301 2,481±0,317 2,357±0,261 2,44±0,239ron26 28,14 86,85 5240 3,5 0.221±0.007 KNSTD 2,477±0,229 2,626±0,321 2,762±0,336 2,632±0,273 2,716±0,245ron27 28,14 86,85 5247 5 0.080±0.006 KNSTD 0,905±0,104 0,987±0,138 1±0,139 0,995±0,123 1±0,113ron28 28,14 86,85 5244 3 0.230±0.010 KNSTD 2,562±0,249 2,715±0,341 2,855±0,358 2,72±0,293 2,807±0,266ron29 28,14 86,85 5240 1 0.197±0.011 KNSTD 2,162±0,223 2,286±0,298 2,413±0,314 2,291±0,26 2,373±0,24ron30 28,14 86,85 5245 3 0.206±0.010 KNSTD 2,294±0,228 2,432±0,31 2,562±0,326 2,439±0,268 2,522±0,245ron31 28,14 86,85 5193 4,5 0.084±0.006 KNSTD 0,999±0,112 1,08±0,149 1,104±0,152 1,088±0,132 1,096±0,121ron32 28,14 86,85 5190 0,5 0.081±0.008 KNSTD 0,932±0,123 1,016±0,156 1,033±0,159 1,024±0,143 1,028±0,133ron33 28,14 86,85 5195 1 0.094±0.005 KNSTD 1,073±0,109 1,152±0,149 1,184±0,153 1,159±0,13 1,173±0,117
T4 ron2 28,20 86,82 5041 4 1.205±0.029 KNSTD 14,975±1,355 13,913±1,68 14,41±1,733 13,382±1,362 14,67±1,291ron3 28,20 86,82 5056 1 1.255±0.051 KNSTD 15,11±1,454 14,018±1,755 14,509±1,809 13,479±1,442 14,793±1,389ron4 28,20 86,82 5064 4 1.241±0.031 KNSTD 15,268±1,385 14,142±1,711 14,631±1,762 13,599±1,387 14,937±1,318ron5 28,20 86,82 5057 2,3 1.206±0.029 KNSTD 14,523±1,314 13,516±1,632 14,032±1,687 13,012±1,324 14,257±1,254ron6 28,20 86,82 5055 3 1.197±0.030 KNSTD 14,512±1,317 13,508±1,634 14,025±1,689 13,005±1,327 14,247±1,257ron7 28,20 86,82 5045 4 1.737±0.039 KNSTD 21,365±1,927 18,946±2,285 19,352±2,324 18,094±1,837 20,289±1,779ron8 28,20 86,82 5036 3 2.007±0.048 KNSTD 24,598±2,23 21,446±2,594 21,791±2,625 20,439±2,084 23,019±2,028ron9 28,20 86,82 5031 3 1.015±0.038 KNSTD 12,43±1,179 11,689±1,45 12,232±1,512 11,298±1,195 12,253±1,134ron10 28,20 86,82 5027 2,5 1.184±0.031 KNSTD 14,62±1,331 13,618±1,65 14,131±1,706 13,109±1,341 14,346±1,271ron11 28,20 86,82 5044 2,5 0.947±0.024 KNSTD 11,717±1,063 11,047±1,336 11,574±1,394 10,711±1,093 11,538±1,018ron12 28,20 86,82 5044 3 7.614±0.121 KNSTD 97,653±8,837 72,487±8,783 70,516±8,502 67,537±6,858 82,61±7,234ron13 28,20 86,82 5057 1,5 0.900±0.022 KNSTD 11,092±1,004 10,492±1,267 11,014±1,324 10,199±1,038 10,927±0,962
T3 ron14 28,25 86,82 4959 5 2.237±0.040 KNSTD 28,287±2,526 24,204±2,904 24,453±2,921 23,069±2,324 26,078±2,262ron15 28,25 86,82 4954 2,8 1.822±0.045 KNSTD 22,64±2,056 20,028±2,425 20,424±2,462 19,115±1,952 21,393±1,889ron16 28,25 86,82 4957 2 2.197±0.067 KNSTD 27,111±2,513 23,36±2,862 23,632±2,883 22,284±2,312 25,096±2,264ron17 28,25 86,82 4958 1,5 1.819±0.045 KNSTD 22,316±2,027 19,771±2,394 20,172±2,432 18,875±1,927 21,118±1,865ron18 28,25 86,82 4962 3 1.891±0.033 KNSTD 23,458±2,09 20,655±2,475 21,038±2,51 19,7±1,982 22,084±1,911ron19a 28,25 86,82 4935 4 1.409±0.034 KNSTD 17,813±1,613 16,263±1,965 16,713±2,011 15,622±1,591 17,175±1,512ron20 28,25 86,82 4935 5 2.020±0.047 KNSTD 25,802±2,335 22,441±2,712 22,752±2,738 21,408±2,18 24,007±2,112ron21 28,25 86,82 4943 4 2.049±0.036 KNSTD 25,864±2,307 22,477±2,695 22,786±2,72 21,442±2,158 24,058±2,084ron22 28,25 86,82 4933 0,5 1.464±0.036 KNSTD 17,99±1,631 16,403±1,984 16,851±2,029 15,753±1,607 17,33±1,528ron23 28,25 86,82 4921 4 2.067±0.065 KNSTD 26,351±2,45 22,854±2,805 23,151±2,83 21,809±2,269 24,465±2,214ron24 28,25 86,82 4927 4 2.266±0.040 KNSTD 28,829±2,574 24,641±2,956 24,881±2,972 23,469±2,364 26,521±2,299
T2 ron37 28,25 86,82 5003 0,5 2.493±0.038 KNSTD 29,782±2,646 25,246±3,021 25,457±3,033 24,004±2,408 27,283±2,353ron38 28,25 86,82 5003 0,5 2.570±0.046 KNSTD 30,709±2,744 25,928±3,112 26,114±3,121 24,632±2,483 28,011±2,43ron40 28,25 86,82 5002 2 2.567±0.046 KNSTD 31,079±2,783 26,195±3,148 26,368±3,155 24,884±2,512 28,298±2,46ron41 28,25 86,82 5007 3 3.099±0.115 KNSTD 47,818±4,438 37,087±4,549 36,706±4,483 35,363±3,67 40,433±3,646ron42 28,25 86,82 5009 2 2.970±0.048 KNSTD 35,89±3,2 29,457±3,532 29,455±3,516 28,026±2,819 32,075±2,775ron43 28,25 86,82 5008 2 2.647±0.084 KNSTD 31,97±2,98 26,82±3,297 26,967±3,301 25,482±2,655 28,985±2,629ron44 28,25 86,82 5004 2 3.355±0.066 KNSTD 40,681±3,66 32,715±3,943 32,55±3,906 31,029±3,143 35,705±3,118ron45 28,25 86,82 5004 3 2.340±0.056 KNSTD 28,526±2,588 24,325±2,945 24,562±2,961 23,173±2,364 26,27±2,317
Owen et al. (2010) M4c Na24 30,38 81,18 4433 1 2.542±0.060 07KNSTD 41.777±3.799 34.574±4.193 34.174±4.126 32.932±3.364 36.738±3.244Na25 30,38 81,18 4432 0,5 2.800±0.055 07KNSTD 45.901±4.133 37.155±4.482 36.663±4.403 35.537±3.602 39.547±3.455Na26 30,38 81,18 4433 3 3.047±0.102 07KNSTD 51.041±4.815 40.204±4.979 39.557±4.878 38.38±4.035 43.15±3.958Na27 30,38 81,18 4438 1,5 1.481±0.027 07KNSTD 24.281±2.168 21.886±2.626 22.098±2.64 20.962±2.112 22.816±1.979Na28 30,38 81,18 4438 1 2.818±0.055 07KNSTD 46.254±4.166 37.35±4.506 36.852±4.426 35.735±3.623 39.791±3.477Na29 30,38 81,18 4431 2 2.349±0.041 07KNSTD 38.934±3.484 32.602±3.918 32.298±3.864 31.058±3.134 34.692±3.013
M4a Na10 30,38 81,18 4515 1,5 1.887±0.048 07KNSTD 29.843±2.722 25.991±3.156 26.025±3.147 24.794±2.54 27.457±2.435Na11 30,38 81,18 4504 2,5 1.865±0.047 07KNSTD 29.901±2.725 26.048±3.161 26.081±3.152 24.851±2.544 27.503±2.436Na12 30,38 81,18 4500 5 3.650±0.086 07KNSTD 60.323±5.512 46.004±5.596 44.858±5.431 43.449±4.451 51.018±4.522Na13 30,38 81,18 4504 1 1.176±0.031 07KNSTD 18.562±1.693 17.247±2.093 17.587±2.126 16.596±1.701 17.834±1.582Na14 30,38 81,18 4501 1 0.623±0.014 07KNSTD 9.83±0.883 9.744±1.172 10.21±1.222 9.532±0.965 9.68±0.845Na15 30,38 81,18 4505 3 3.462±0.068 07KNSTD 56.094±5.066 43.126±5.211 42.256±5.082 40.999±4.163 47.134±4.127
M3 Na35 30,38 81,17 4452 1 3.165±0.075 07KNSTD 51.666±4.711 40.534±4.924 39.869±4.821 38.683±3.958 43.617±3.859Na36 30,38 81,17 4456 3 1.852±0.044 07KNSTD 30.515±2.768 26.569±3.217 26.583±3.204 25.358±2.587 27.994±2.468Na37 30,38 81,17 4460 2 1.965±0.049 07KNSTD 32.655±2.974 28.1±3.41 28.036±3.387 26.852±2.748 29.694±2.629Na38 30,38 81,17 4460 1 4.331±0.089 07KNSTD 70.764±6.429 55.173±6.695 53.474±6.458 51.04±5.205 61.061±5.378Na39 30,38 81,17 4446 6 3.527±0.084 07KNSTD 60.32±5.516 46.177±5.62 45.026±5.455 43.601±4.47 51.02±4.527Na40 30,38 81,17 4436 1 4.314±0.088 07KNSTD 71.317±6.476 55.808±6.771 54.112±6.534 51.636±5.264 61.521±5.416
M2 Na41 30,38 81,17 4444 1,5 4.726±0.068 07KNSTD 78.289±7.03 61.594±7.431 60.19±7.227 57.603±5.822 67.149±5.84Na42 30,38 81,17 4448 1 7.155±0.151 07KNSTD 118.978±10.958 92.433±11.332 89.955±10.973 86.637±8.925 100.522±8.957Na43 30,38 81,17 4445 3 5.850±0.089 07KNSTD 98.568±8.911 76.661±9.292 74.559±8.992 71.769±7.288 84.5±7.393Na45 30,38 81,17 4453 2 4.574±0.091 07KNSTD 75.696±6.876 59.551±7.229 58.035±7.011 55.35±5.644 65.078±5.729Na46 30,38 81,17 4454 1,5 4.143±0.088 07KNSTD 68.131±6.195 52.76±6.404 51.055±6.168 48.912±4.991 58.744±5.18Na47 30,38 81,17 4456 3 4.969±0.098 07KNSTD 82.968±7.547 64.925±7.89 63.467±7.676 61.109±6.238 71.03±6.26
M10 Na48 30,46 81,22 5508 2 0.029±0.004 07KNSTD 0.309±0.051 0.362±0.067 0.351±0.064 0.365±0.063 0.358±0.059Na49 30,46 81,22 5506 1 0.230±0.007 07KNSTD 2.431±0.222 2.579±0.313 2.735±0.33 2.568±0.264 2.631±0.234Na50 30,46 81,22 5509 1,5 0.006±0.003 07KNSTD 0.079±0.029 0.093±0.035 0.09±0.034 0.094±0.035 0.092±0.034Na52 30,46 81,22 5514 1,5 0.281±0.007 07KNSTD 2.956±0.267 3.109±0.375 3.271±0.393 3.094±0.315 3.166±0.278Na53 30,46 81,22 5509 2 0.018±0.001 07KNSTD 0.188±0.021 0.22±0.03 0.213±0.029 0.222±0.026 0.218±0.024
M4 Na75 30,47 81,19 4842 3 4.319±0.057 07KNSTD 59.697±5.324 44.601±5.352 43.463±5.19 42.195±4.241 50.437±4.358Na76 30,47 81,19 4838 1 4.416±0.104 07KNSTD 60.137±5.495 44.9±5.46 43.735±5.294 42.454±4.348 50.867±4.509Na78 30,47 81,19 4838 2 3.437±0.053 07KNSTD 47.046±4.199 37.101±4.453 36.515±4.362 35.426±3.565 40.352±3.492

Na79 30,47 81,19 4821 1 2.887±0.059 07KNSTD 40.334±3.635 32.897±3.969 32.492±3.902 31.277±3.172 35.756±3.128Na80 30,48 81,19 4786 1 3.551±0.058 07KNSTD 49.385±4.42 38.525±4.631 37.882±4.533 36.816±3.713 41.967±3.642Na81 30,48 81,19 4766 2 0.040±0.003 07KNSTD 0.557±0.067 0.643±0.093 0.644±0.093 0.647±0.083 0.626±0.074
M5 Na104 30,44 81,45 5499 2 1.322±0.033 07KNSTD 13.452±1.221 12.43±1.504 12.822±1.544 11.966±1.221 13.246±1.169Na105 30,44 81,45 5501 1 0.796±0.020 07KNSTD 8.012±0.727 7.687±0.929 8.118±0.977 7.568±0.772 7.845±0.692Na106 30,44 81,45 5499 2,5 1.376±0.036 07KNSTD 14.062±1.279 12.948±1.568 13.327±1.607 12.449±1.272 13.827±1.223Na107 30,44 81,45 5500 2 1.658±0.040 07KNSTD 16.879±1.529 15.214±1.839 15.517±1.867 14.6±1.487 16.374±1.442Na108 30,44 81,45 5497 1 1.253±0.032 07KNSTD 12.792±1.16 11.863±1.435 12.265±1.477 11.426±1.166 12.608±1.112Na111 30,44 81,45 5511 2 1.193±0.020 07KNSTD 12.217±1.084 11.352±1.356 11.758±1.398 10.966±1.1 12.048±1.039Na112 30,44 81,45 5515 2 1.328±0.023 07KNSTD 13.582±1.208 12.532±1.499 12.921±1.539 12.062±1.211 13.371±1.155
Owen et al. (2003a) Ximencuo N6 33,40 101,11 4053 5 1.310±0.030 LLNL3000 20.932±1.89 19.203±2.318 19.525±2.346 18.498±1.88 20.217±1.775N7 33,40 101,11 4047 5 1.200±0.030 LLNL3000 19.225±1.746 17.787±2.154 18.156±2.189 17.165±1.753 18.669±1.649N8 33,40 101,11 4043 5 1.250±0.040 LLNL3000 20.071±1.867 18.496±2.27 18.844±2.304 17.832±1.856 19.438±1.761N9 33,40 101,10 4045 5 0.910±0.040 LLNL3000 14.577±1.424 13.887±1.754 14.402±1.812 13.442±1.456 14.437±1.377
N10 33,40 101,10 4045 5 1.290±0.030 LLNL3000 20.696±1.871 19.016±2.296 19.344±2.326 18.321±1.864 20.004±1.758Jiukehe N1 33,40 101,25 4235 5 3.090±0.120 LLNL3000 45.313±4.361 37.082±4.646 36.567±4.563 35.576±3.802 40.015±3.751
N2 33,40 101,25 4227 5 2.050±0.050 LLNL3000 30.066±2.733 26.194±3.175 26.19±3.16 25.112±2.566 28.117±2.484N3 33,40 101,25 4230 5 2.060±0.070 LLNL3000 30.167±2.835 26.266±3.244 26.259±3.23 25.182±2.642 28.2±2.581N4 33,40 101,25 4232 5 2.630±0.060 LLNL3000 38.556±3.496 32.441±3.928 32.104±3.87 31.047±3.166 35.079±3.09N5 33,40 101,25 4233 5 1.770±0.040 LLNL3000 25.854±2.335 22.925±2.768 23.074±2.774 22.046±2.242 24.522±2.153
N16 33,40 101,24 4212 5 3.010±0.070 LLNL3000 44.643±4.059 36.705±4.452 36.206±4.372 35.206±3.597 39.528±3.49 N17 33,40 101,24 4214 5 3.080±0.080 LLNL3000 45.647±4.186 37.336±4.55 36.821±4.468 35.833±3.685 40.258±3.587
N18 33,40 101,24 4217 5 1.270±0.030 LLNL3000 18.668±1.688 17.153±2.072 17.541±2.11 16.553±1.685 18.162±1.597N19 33,40 101,24 4204 5 1.860±0.060 LLNL3000 27.579±2.573 24.291±2.988 24.377±2.986 23.336±2.434 26.028±2.364N20 33,40 101,24 4216 5 1.860±0.060 LLNL3000 27.414±2.558 24.145±2.969 24.236±2.968 23.2±2.42 25.885±2.351
Qiemuqu A6 34,90 99,43 4285 5 0.790±0.040 LLNL3000 10.809±1.09 10.288±1.324 10.836±1.389 10.015±1.113 10.798±1.065A7 34,90 99,43 4275 5 1.170±0.040 LLNL3000 16.109±1.51 14.958±1.843 15.374±1.887 14.49±1.517 15.905±1.452A8 34,90 99,42 4275 5 0.730±0.020 LLNL3000 10.036±0.916 9.607±1.166 10.165±1.228 9.359±0.96 10.037±0.892A11 34,90 99,43 4270 5 1.320±0.030 LLNL3000 18.228±1.644 16.694±2.013 17.037±2.046 16.157±1.641 17.844±1.565A12 34,90 99,43 4310 5 1.030±0.020 LLNL3000 13.931±1.244 13.064±1.566 13.563±1.619 12.662±1.276 13.872±1.204
Zhou et al. (2007) Baiyu BYG-1 30,08 95,53 3009 5 0.458±0.010 KNSTD 14.92±1.379 15.115±1.848 15.517±1.889 14.667±1.519 14.582±1.312BYG-3 30,10 95,53 3031 5 0.76±0.026 KNSTD 11.884±1.323 12.223±1.676 12.705±1.736 11.903±1.437 11.671±1.276BYG-6 30,10 95,52 3049 5 0.190±0.009 KNSTD 5.984±0.593 6.301±0.802 6.767±0.858 6.268±0.687 5.958±0.577
BYG-9b 30,10 95,52 3023 5 0.614±0.020 KNSTD 19.859±1.851 19.492±2.396 19.797±2.424 18.808±1.962 18.977±1.723BYG-11 30,10 95,52 3039 5 0.535±0.026 KNSTD 16.851±1.684 16.808±2.153 17.173±2.191 16.279±1.796 16.313±1.594BYG-12 30,10 95,52 3022 5 0.508±0.021 KNSTD 16.425±1.586 16.445±2.063 16.815±2.101 15.938±1.71 15.937±1.502BYG-13 30,1 95,52 3047 5 0.480±0.025 KNSTD 15.044±1.529 15.198±1.967 15.605±2.012 14.747±1.65 14.696±1.461BYG-14 30,97 95,52 3049 5 0.397±0.021 KNSTD 12.524±1.278 12.837±1.664 13.312±1.72 12.487±1.401 12.307±1.228BYG-19 30,11 95,52 3013 5 0.534±0.015 KNSTD 17.215±1.578 17.151±2.088 17.505±2.122 16.604±1.709 16.634±1.484
We used Cronus 2.2 with constant file 2.2.1
Samples K2-83 on m2i (Seong et al. 2007), India-13 on PM-2 (Hedrick et al. In press), NDL29 on m2 (Barnard et al. 2004b) and ron12 on T4 (Owen et al. 2009) are outliers because twice as old as the next oldet age.Crests m2a (Seong et al., 2009), m1b (Seong et al., 2007), Shyok (Dortch et al., 2010), PM-0 (Hedrick et al., in press), M1c, M1b and M1a (Owen et al., 2010) are >120 ka and are therefore not in this table.
Sample density is 2.7 g/cm3; No erosion rate was applied.
a Uncertainties are reported at the 1s confidence level.b 10Be isotope ratios for KNSTD=3.11x10⁻¹²; for LLNL3000=3x10-12; for S555=95.5x10⁻¹²; for 07KNSTD=2.85x10⁻¹²

Figure 1Click here to download high resolution image

Figure 2Click here to download high resolution image

Figure 3Click here to download high resolution image

Figure 4Click here to download high resolution image

Figure 5Click here to download high resolution image

Figure 6Click here to download high resolution image

Figure 7Click here to download high resolution image

Figure 8Click here to download high resolution image

Figure 9Click here to download high resolution image

Figure 10Click here to download high resolution image

Figure 11Click here to download high resolution image

Figure 12Click here to download high resolution image

Figure 13Click here to download high resolution image

Figure 14Click here to download high resolution image

Figure 15Click here to download high resolution image

Figure 16Click here to download high resolution image

Figure 17Click here to download high resolution image

Figure 18Click here to download high resolution image

Figure 19Click here to download high resolution image

Figure 20Click here to download high resolution image

Figure 21Click here to download high resolution image

Supplementary DataClick here to download Supplementary Data: chevalier-SI.pdf