Constraints of Sea Beam data on crustal fabrics and seafloor spreading in the South China Sea
14
Earth and Planetary Science Letters, 95 (1989) 307-320 307 Elsevier Science Publishers B.V., Amsterdam - Printed in The Netherlands [5] Constraints of Sea Beam data on crustal fabrics and seafloor spreading in the South China Sea Anne Briais 1, Paul Tapponnier 1 and Guy Pautot 2 1 lnstitut de Physique du Globe de Paris, 4, Place Jussieu, 75252 Paris C~dex 05 (France) 2 IFREMER, Centre de Brest, B.P. 70, 29263 Plouzan~ (France) Received April 19, 1988; revised version accepted August 3, 1989 The South China Sea is a mid-late Tertiary marginal basin. The magnetic anomaly lineations in the eastern part of the basin trend approximately east-west [1,2], suggesting a north-south direction of spreading. In the spring of 1985, two cruises on the French research vessel "Jean Charcot" provided Sea Beam coverage, seismic reflection, magnetic and gravity profiles. The Sea Beam data exhibit two major structural trends: scarps striking N50 o E + 15 o, interpreted as normal faults, and scarps striking N140°E_+15 °, interpreted as fracture zones. This fabric implies a northwest-southeast direction of spreading, up to about 100 km north and south of the inferred spreading axis [3]. Dense Sea Beam coverage of a roughly 1 ° square area northwest of the Scarborough Seamounts chain shows that the emplacement of these seamounts was, at least in its initial stage, controlled by faulting in two orthogonal directions, N50 o E and N140 o E. Magnetic and gravimetric maps of the same area also reveal anomalies trending roughly N50 o E, which are disrupted by transform zones striking N140 o E. This detailed study indicates that the fracture zones may be closely spaced (less than 20-30 km) east of Macclesfield Bank. Furthermore, magnetic anomalies identified as 6 and 6a (20 Myr) along two north-south profiles located at both edges to the north of this detailed study area may be correlated with the N80 °E trend characteristic of such anomalies in the eastern part of the South China Sea. The east-west trend of magnetic anomalies 6 and 6a, south of Scarborough seamount chain, recognised by Taylor and Hayes (1983) [1] is incompatible With the trend of the fault scarps observed on Sea Beam data. We infer that progressive, right-lateral offsets of the ridge across closely spaced discontinuities may account for the nearly east-west average trend of some of the magnetic anomalies, and of the Scarborough seamount chain, which represents the location of the relict spreading axis, in spite of a N50 °E spreading direction. The whole central part of the basin east of 115 °E may have formed in this way, since N130-140 °E striking fracture zones are observed on the Sea Beam swaths. This model may correspond to the second of two successive spreading phases, with N-S and NW-SE directions of extension respectively, as was presented by the authors in a previous paper (Pautot et al., 1986 [3]). Alternatively, we may assume that the direction of extension did not change radically during the opening history [3], implying that oblique spreading occurred along NS0 o E trending ridge segments, creating the N80 o E trending scarps and magnetic anomalies observed to the north and to the south of the study area. Such a direction of extension is compatible with mid-late Tertiary left-lateral movements along large N130-150 °E strike-slip faults, such as the Red River and Wang Chao faults in South China and Sundaland. 1. Introduction The South China Sea basin opened between Eocene and late Miocene times [1,4,5] in a com- plex tectonic setting. Like several other marginal basins of the western Pacific (Japan Sea, Okhotsk Sea), this basin may not be the result of back-arc extension only (e.g. [6,7]). The Philippine arc- trench system, bounding the basin to its east, has an independent history, with poor constraints on the age of the onset of the present-day active, east-dipping subduction [8-11]. The southern margin, including the deep sedimentary Palawan 0012-821X/89/$03.50 © 1989 Elsevier Science Publishers B.V. trough just northwest of Borneo and Palawan islands, had been considered to be a relict conver- gent margin in various kinematic models [1,12]. New multi-channel seismic and drilling surveys suggest it may instead be a passive continental margin affected by convergence from the Sulu Sea in the south [4,13]. To the west and to the north, the history of the continental margins must be placed within the framework of that of the Asian mainland. Since no deep-sea drilling has been performed in the South China Sea, attempts to date the oceanic crust have utilized seafloor mag- netic anomalies. Taylor and Hayes [1,2] identified
Transcript of Constraints of Sea Beam data on crustal fabrics and seafloor spreading in the South China Sea
Earth and Planetary Science Letters, 95 (1989) 307-320 307 Elsevier Science Publishers B.V., Amsterdam - Printed in The Netherlands
[5]
Constraints of Sea Beam data on crustal fabrics and seafloor spreading in the South China Sea
A n n e Briais 1, Paul T a p p o n n i e r 1 and G u y P a u t o t 2
1 lnstitut de Physique du Globe de Paris, 4, Place Jussieu, 75252 Paris C~dex 05 (France) 2 IFREMER, Centre de Brest, B.P. 70, 29263 Plouzan~ (France)
Received April 19, 1988; revised version accepted August 3, 1989
The South China Sea is a mid-late Tertiary marginal basin. The magnetic anomaly lineations in the eastern part of the basin trend approximately eas t -west [1,2], suggesting a no r th - sou th direction of spreading. In the spring of 1985, two cruises on the French research vessel "Jean Charcot" provided Sea Beam coverage, seismic reflection, magnetic and gravity profiles. The Sea Beam data exhibit two major structural trends: scarps striking N50 o E + 15 o, interpreted as normal faults, and scarps striking N140° E _+15 °, interpreted as fracture zones. This fabric implies a nor thwest-southeast direction of spreading, up to about 100 km north and south of the inferred spreading axis [3]. Dense Sea Beam coverage of a roughly 1 ° square area northwest of the Scarborough Seamounts chain shows that the emplacement of these seamounts was, at least in its initial stage, controlled by faulting in two orthogonal directions, N50 o E and N140 o E. Magnetic and gravimetric maps of the same area also reveal anomalies trending roughly N50 o E, which are disrupted by transform zones striking N140 o E. This detailed study indicates that the fracture zones may be closely spaced (less than 20-30 km) east of Macclesfield Bank. Furthermore, magnetic anomalies identified as 6 and 6a (20 Myr) along two no r th - sou th profiles located at both edges to the north of this detailed study area may be correlated with the N80 ° E trend characteristic of such anomalies in the eastern part of the South China Sea. The east-west trend of magnetic anomalies 6 and 6a, south of Scarborough seamount chain, recognised by Taylor and Hayes (1983) [1] is incompatible With the trend of the fault scarps observed on Sea Beam data. We infer that progressive, right-lateral offsets of the ridge across closely spaced discontinuities may account for the nearly east-west average trend of some of the magnetic anomalies, and of the Scarborough seamount chain, which represents the location of the relict spreading axis, in spite of a N50 ° E spreading direction. The whole central part of the basin east of 115 ° E may have formed in this way, since N130-140 ° E striking fracture zones are observed on the Sea Beam swaths. This model may correspond to the second of two successive spreading phases, with N - S and N W - S E directions of extension respectively, as was presented by the authors in a previous paper (Pautot et al., 1986 [3]). Alternatively, we may assume that the direction of extension did not change radically during the opening history [3], implying that oblique spreading occurred along NS0 o E trending ridge segments, creating the N80 o E trending scarps and magnetic anomalies observed to the north and to the south of the study area. Such a direction of extension is compatible with mid-late Tertiary left-lateral movements along large N130-150 ° E strike-slip faults, such as the Red River and Wang Chao faults in South China and Sundaland.
1. Introduction
The South China Sea basin opened between Eocene and late Miocene times [1,4,5] in a com- plex tectonic setting. Like several other marginal basins of the western Pacific (Japan Sea, Okhotsk Sea), this basin may not be the result of back-arc extension only (e.g. [6,7]). The Philippine arc- trench system, bounding the basin to its east, has an independent history, with poor constraints on the age of the onset of the present-day active, east-dipping subduction [8-11]. The southern margin, including the deep sedimentary Palawan
0012-821X/89/$03.50 © 1989 Elsevier Science Publishers B.V.
trough just northwest of Borneo and Palawan islands, had been considered to be a relict conver- gent margin in various kinematic models [1,12]. New multi-channel seismic and drilling surveys suggest it may instead be a passive continental margin affected by convergence from the Sulu Sea in the south [4,13]. To the west and to the north, the history of the continental margins must be placed within the framework of that of the Asian mainland. Since no deep-sea drilling has been performed in the South China Sea, attempts to date the oceanic crust have utilized seafloor mag- netic anomalies. Taylor and Hayes [1,2] identified

Nl!
5 5’
0 ‘I?
?
E
5
10
EllO
O
N
Fig.
1.
Str
uctu
ral
obse
rvat
ions
in
the
ce
ntra
l pa
rt
of t
he
Sout
h C
hina
Se
a.
Bat
hym
etry
in
kilo
met
ers.
T
rack
s of
R/V
“J
ean
Cha
rcot
” cr
uise
N
AN
HA
I ar
e sh
own
as d
ashe
d lin
es,
thos
e of
the
M
anila
-Sin
gapo
re
tran
sit
as
solid
lin
es.
Nor
mal
fa
ults
ob
serv
ed
on
Sea
Bea
m
swat
hs
are
loca
ted
alon
g tr
acks
(b
arbe
d lin
es).
St
ruct
ural
tr
ends
no
t in
terp
reta
ble
as
norm
al
faul
ts
are
repr
esen
ted
by
dash
ed
segm
ents
. U
pper
le
ft
corn
er:
Azi
mut
hal
dist
ribu
tion
of s
carp
st
rike
s,
show
n as
per
cent
ages
of
th
e to
tal;
(a)
for
the
tran
sit,
(b)
for
both
crui
ses.
B
oxes
,4
-E
show
lo
catio
ns
of t
he
Sea
Bea
m
swat
hs
in
Fig.
2.
The
la
rge
one
repr
esen
ts
the
deta
iled
stud
y ar
ea,
depi
cted
in
Fi
g.
3.
M3
and
M6
are
mag
netic
pr
ofile
s
depi
cted
in
Fi
g.
4.
Dot
ted
lines
ar
e m
agne
tic
anom
aly
linea
tions
, an
d w
hite
lin
es
the
frac
ture
zo
nes
inte
rpre
ted
by
Tay
lor
and
Hay
es
[l].
-.

anomalies 5e to 11 in the eastern part of the sea, with magnetic lineations trending roughly E-W, thus suggesting a N - S direction of opening. New structural observations of the deep oceanic seafloor were provided by Sea Beam mapping during two cruises of the R / V "Jean Charcot" in 1985 ( N A N H A I cruise and Manila-Singapore transit) (Fig. 1). These data reveal a fabric of normal faults striking N50°E+_ 15 ° and fracture zones striking N140 ° E _+ 15 °, thus implying a N W - S E opening event [3].
In this paper we analyse the complete Sea Beam data set, both near the inferred axis and further to the northwest. We then consider a smaller area where we have conducted a detailed structural, gravimetric and magnetic study. The simplest interpretation of these complementary observations leads to a spreading model for the central part of the basin, and to larger views on the Tertiary tectonics of southeast Asia.
2. Fabric of the oceanic basin in the central region
Fig. 1 shows our interpretation of faults ob- served in the Sea Beam data of both "Jean Char- cot" cruises. The scarps observed on coupled Sea Beam swaths and seismic profiles are mostly those of normal faults trending N50 o E _+ 15 °, associ- ated with tilted blocks and half-grabens. The loca- tion of the extinct spreading axis is given by a symmetry in the tilting of the blocks [3]. We interpret scarps trending N140 °E _+ 15 ° as local vertical expressions of fracture zones.
Normal faults trending roughly N E - S W and fracture zones trending N W - S E characterize the oceanic floor, and these trends also characterize the whole northern margin of the southwestern part of the basin. Examples of prominent struc- tures observed on the northernmost Sea Beam profiles are shown in Fig. 2. The Sea Beam exam- ples A, B and C reveal ridges and scarps along the northwestern continental margin, trending, for the most prominent of them, N W - S E and NE-SW. The fracturing of the margin and the fabric of the oceanic crust in the whole southwestern part of the South China Sea imply that in this area the directions of rifting and oceanic spreading have been NW-SE.
The azimuthal distribution of scarps is shown on rose diagrams in the upper left corner of Fig. 1.
309
The upper diagram represents the observations on the Mani la-Singapore transit, which traversed the continental margin. The lower one refers to the complete data set, including the transit and the cruise in the interior of the basin. The N W - S E direction of scarps is better expressed in the upper diagram. This is probably due to the large number of N l l 0 ° E to N 1 5 0 ° E trending scarps observed on the continental margin. It can also be assumed that in some places the sediment covering has smoothed small vertical offsets on fracture zones. The actual number of fracture zones is probably greater than observed in the Sea Beam swaths.
Scarps trending N E - S W and N W - S E are also found far to the north of the inferred spreading axis (Fig. 1). Sea Beam examples D and E (Fig. 2) are situated in the eastern part of the basin. Figure 2D shows an example of the segmentation of abyssal hills into lozenge-shaped ridges bounded by scarps trending N 5 0 ° E and N80°E . Fig. 2E shows the edges of a seamount situated well north of the Scarborough seamount chain (Fig. 1). Al- though this Sea Beam swath only shows a part of the morphology of the volcano, linear bathymetric trends striking N E - S W and N W - S E clearly ap- pear on its southern side. These scarps are ob- served north of the inferred spreading axis [3], in an area where E - W magnetic lineations have been recognised [1]. In this part of the basin, the shape of the ridges and the presence of scarps of both N 5 0 ° E and N 8 0 ° E orientations may reflect a complex segmentation of the ridge axis. No struc- ture with a N - S orientation is observed here. The magnetic lineations recognized by Taylor and Hayes [1] are located mostly north and south of the study area, which we intentionally limited to the axial part of the basin (Fig. 1). North of the Scarborough seamount chain, the N80 °E orienta- tion of anomalies 6 and 6a is the same as that of the fault scarps, but the inferred N - S fracture zone is not observed. South of the seamount chain, we observe a misfit between the E - W orientation of the lineations of the magnetic anomalies 6 and 6a and the N 6 0 - 8 0 ° E bathymetric trends. We discuss this discrepancy in section 4.
In the eastern axial part of the basin, the struc- tural data (normal faults scarps associated with tilted blocks observed on the seismic lines) thus allow us to conclude that a N W - S E oceanic open- ing event, very probably the last one (after anomaly

N 1 6 ° 3 0
0 5 10km i i i
N 1 5 c
N 1 4 ° 5 0
E l 1 4 ° 2 5 ' E l 1 4 ° 3 0 ' E l 1 3 ° 3 0 '
B ~-11:
' y '
N 1 6 o 2 0 ',
E l 1 6 ~ 1 2 '
35'
310
'20'
'
D I I
E 1 1 8 o E l 1 8 ° 3 0 '
Fig. 2. Sea Beam swaths from the transit data (A, B, C, E) and N A N H A I cruise data (D) , showing scarps far from the inferred ridge axis (see locat ion in Fig. 1). Mercator projection. Contour interval 50 m, tick marks point downhi l l .
6a), took place in the area. The Scarborough seamount chain prevents us from localizing the corresponding extinct spreading axis precisely, but
the shape of the abyssal hills suggests that it was probably segmented and complex. This will also be discussed in section 4.

3. Detailed structural and geophysical analysis
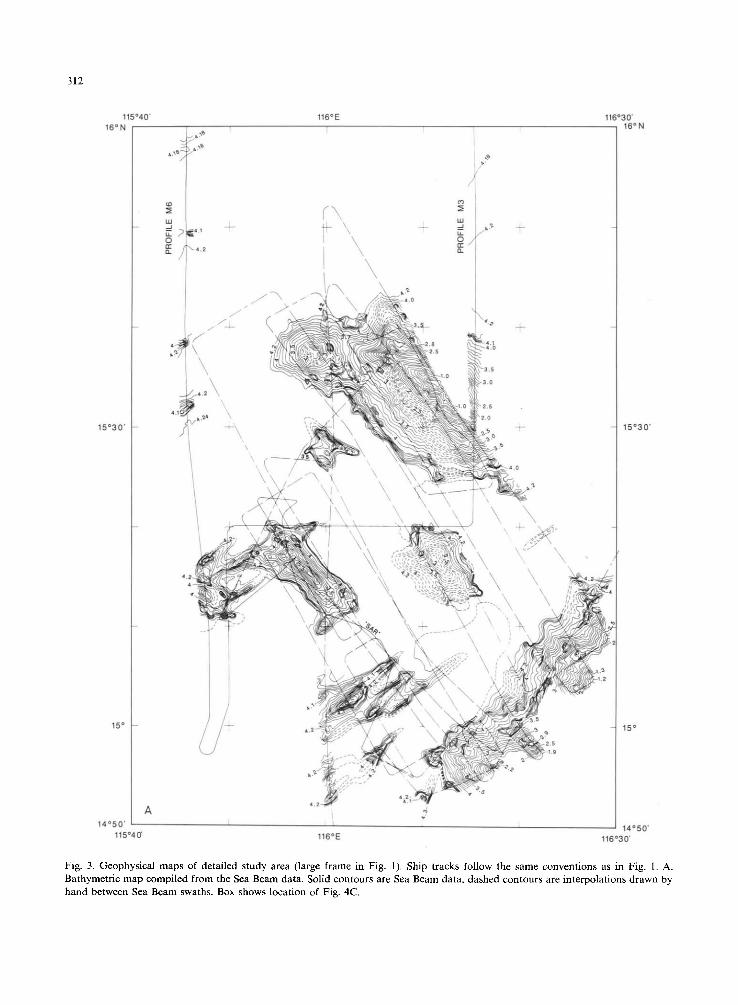
The detailed study area is the 1 ° square out- lined in Fig. 1. Bathymetric, sediment isopach, and free air gravity contour maps are given in Fig. 3.
The compiled Sea Beam map shows two large volcanic edifices in the north and in the south, and two smaller ones in the center (Fig. 3A). In the southwest and on one profile along the west- ern edge, tilted blocks of oceanic crust emerge from the flat-surfaced sedimentary blanket. The volcanoes are elongated in the directions N50 °E and N140 ° E, the same directions characteristic of the oceanic crust fabric in this area. These mor- phologic trends probably originated in the evolu- tion of the seamounts, as has been suggested by many high-resolution bathymetric surveys over volcanic areas (e.g. [14-16]). The volcanic episode in the South China Sea occurred shortly after the termination of oceanic spreading [1,17], but its generating process is not yet well understood. The volcanoes probably developed at a time when no spreading occurred, but the lavas may have prefer- entially erupted in zones of relative crustal weak- ness, for example along the relict normal faults and fracture zones. The elongation is especially clear for the small seamount near 15°15 'N, 115°55'E, which probably represents one of the first stages in the development of the volcanoes. If we assume that the observed distribution of the shapes of the seamounts in this area represents the sequence of growth of the volcanoes, then it is clear that the basalt emplacement was, at least at its beginning, controlled by the preexisting N W - S E and N E - S W fractures in the oceanic crust. The detailed Sea Beam survey of the seamounts thus reveals the presence of fracture zones trending N W - S E , although the blanket of sediments tends to smooth over vertical offsets across fracture zone scarps, leaving only evidence of small disruptions in the ridges of the tilted blocks. The "fracture zones" recognized here may only represent discontinuities in the ridge axis, with small offsets of the ridge, and the topography usually associated with transform faults and frac- ture zones may not have formed here. Since the available structural data do not constrain the fabric of the seafloor precisely, we use the terms "discon- tinuities", " t ransform faults" and "fracture zones"
311
to describe the observations and the model. Sediment isopachs were traced using both
seismic profiles and Sea Beam information (Fig. 3B). The steep edges of the seamounts and the normal faults scarps bounding the tilted blocks can be traced through the sediments down to the acoustic basement. In some places near the volcanic edifices, the thickness of the sediments reaches 1.4 seconds two-way travel time ( = 1400 m). This observation may be indicative of a flexu- ral response in the oceanic crust due to loading of the seamounts, thus thickening the sediments in subsided areas.
The free-air gravity contour map also provides useful information, especially in areas where thick sediments cover the seafloor. The signature of the seamounts dominates the map, as large positive anomalies (Fig. 3C). The other contours correlate with the fabric of the oceanic crust, and linear contours trending N E - S W confirm the presence of at least one fracture zone.
The contours of the magnetic anomalies are elongated in a similar direction, oriented roughly N50°E. This pattern is clearly disrupted along two zones oriented N 1 5 0 ° E (Fig. 4A). Since the diurnal variation of the magnetic field could not be removed from the residuals, the N W - S E elon- gated contours, implying a small variation in the data, may be due to cross-over errors. The qualita- tive appearance of a disruption, however, is robust. In the southeast, the large seamount observed on the Sea Beam data clearly determines the shape of the negative anomaly; in the following interpreta- tion and dating of the anomalies, we therefore avoid areas with large seamounts.
Most of the profiles across the detailed area are too short to provide reliably datable sequences of magnetic anomalies, but we can tentatively corre- late two N - S profiles, at the edges of the detailed study area, with a magnetic time scale model (Fig. 4A, B) [18]. The best fit is obtained with half spreading rates of 1.9-2.1 c m / y r in the N W - S E direction. Taylor and Hayes [1,2] inferred 2.2-3.0 c m / y r for a N - S spreading direction, a rate con- sistent with our results when projected along the N W - S E axis. On profile M6, we have identified anomalies 5d to 6a, dating the oceanic floor in the area 16-22 Myr. Anomalies 6 and 6a can be recognized on both profiles, and the correlation between the two profiles displayed on the mag-
312
1 1 5 o 4 0 .
1 6 ° N
1 5 o 3 0 '
1 5 °
A 1 4 o 5 0 '
115°4~
2 ./
O
/
~ 4.2
4.1
1 1 6 ° E
I , / \ • "\
,, L \
A . 2 ) ~ \ '\ ' - , \ "
L
1 1 6 ° E
I
/
n~: " i
1 1 6 ° 3 0 ' 16 ° N
1 5 o 3 0 ,
15 °
1 4 o 5 0 '
1 1 6 o 3 0 '
Fig. 3. Geophys ica l m a p s of de ta i led s tudy area ( large f rame in Fig. 1). Ship t racks fol low the same conven t ions as in Fig. 1. A. Ba thymet r ic m a p compi led f rom the Sea Beam data . Solid con tours are Sea Beam data , dashed con tours are in te rpo la t ions d rawn by h a n d be tween Sea Beam swaths. Box shows loca t ion of Fig. 4C.

313
115040’ 116’30
15”N
B
15ar-d
I@50
Fig. 3 (continued). B. Sediment isopachs. 100 m contours, assuming a sound velocity of 2000 m/s in sediments. Interpolation follows morphology as observed with Sea Beam.

314
N 16 °
N 1 5 ° 3 0 '
N 1 5 °
C
I I I I
o 3p ee
_ 2 0 /
N14 °5o ' , ~ , / ' S ,, ' , E l 1 5 ° 4 0 ' E l 1 6 ° E l 1 6 ° 3 0 '
Fig. 3 (continued). C. Free-air gravity. Contour interval 5 mgal. Inferred fracture zone is shaded.
netic field map (Fig. 4A). This correlation indi- cates magnetic lineations oriented N80°E, like most of the magnetic lineations in the eastern part of the basin [1,2]. The same map also illustrates two normal fault scarps associated with tilted blocks of oceanic crust which are prominent both
on the Sea Beam swath and on the seismic reflec- tion profile (Fig. 4C). These scarps are oriented N50 °E and N65 o E, in good agreement with the general N W - S E structural trend in the area. Our magnetic anomaly 6a lineation agrees with the interpretation of Taylor and Hayes [1] shown in

!
N 1 6 °
6 a o "
N 1 5 °
A
I E115 ° 30'
i r \
J / (
El 16 ° 30'
315
Fig. 4. A. Magnetic field for detailed study area (contour interval: 20 7, the diurnal correction was not performed), and interpretation of magnetic and Sea Beam data along profiles M3 and M6 of the transit (profiles located in Fig. 1). Barbed lines show fault scarps observed with Sea Beam (Fig. 4C). Open circles show identification of magnetic anomalies. Dots represent magnetic anomalies recognised by Taylor and Hayes [1]. Inferred fracture zones are depicted as shading.

3 1 6
AXiS - N
Profile M3 / ~ 7 ~ j / ~ , ~ ~f I I /
Profile M6 , ~ / ~ / ' ~ ~ ' ~ _
20O
- 2 0 0 5d 5e 6 6a 6b
I I I I I I I I I I I I I I I • l l l l l l H,S.R. c m / y r ,~ - - 2 . 1 - - e , < ~ 1.9 ~>
B 0 50km
N ~
~o .__~ N65OE
o , o "
, "Xf'xN 5 0 °E
~"~:~'w--'E~'-~:~--'~'4~-=z--Y=~,~i-~:~'~~ ~ ± ~ - ~ . ~ ~ , . ~ 'S~-~ ~ - ~ ~ ~ : - 2 _ ~ , ~ - ' - - ~ - ~ , . - - ~ - - ~ - = - , i ~
~ ~ ~ 7 s
C 0 5 1Okra I I i
Fig. 4 (continued). B. Identification of magnetic anomalies along profiles M3 and M6. Thick lines along profiles indicate gravity highs (seamounts). Half spreading rates were chosen for best correlations between the model and the observed anomalies. C. Sea Beam swath and seismic sections along profile M6, with same horizontal scale. Two way travel time indicated on the seismic sections, vertical exageration near 3. Top section shows raw data. Bottom section shows interpretation, indicating basaltic basement, different layers of sediments, and normal faults affecting the basement and the older sediments. Sea Beam bathymetry indicates trends of the scarps.

Fig. 4A. The simple N 8 0 ° E trending lineation indicated by our interpretation of anomaly 6 clearly does not fit with their interpretations. We offer an explanation for this in the next section.
4. A model of spreading for the eastern central South China Sea
The various types of data collected in the de- tailed area revealed several fracture zones, imply- ing that in this part of the basin, the fracture zones could be separated by as little as 10-20 kin. We extrapolate this fabric to the whole central part of the basin, and present a model of spread- ing for the axial region of the South China Sea, east of Macclesfield Bank. In our model, right lateral offsets occur along closely spaced discon- tinuities (Fig. 5). The sketch in Fig. 5 represents the magnetic characteristics of seafloor generated by such a model ridge axis. It is not an accurate representation of the data, because the discontinu- ities were only inferred from the structural and geophysical data in the detailed area, and the location of the relict spreading axis could not be determined precisely.
6 ~
\°% 6"
Fig. 5. Sketch of seafloor magnetic anomalies created by a spreading axis trending N50 ° E disrupted by fracture zones striking N140°E. This sketch explains how offsets along closely-spaced discontinuities can lead to average magnetic anomaly trend of N80 o E.
317
Since we were able to distinguish between real topographic data and artifacts when interpreting the Sea Beam data [19], these data provide reliable structural evidence that the fabric of the crust is made up of primarily normal faults trending N50 ° E, and fracture zones trending N140 o E. Considering the evolution of the seamounts sug- gested in part 3, the growth of numerous volcanoes on the fractured oceanic crust provides evidence for a large number of discontinuities. Further- more, if the large Scarborough seamounts lie on a zone of weakness formed by the extinct spreading axis, then their linearity and roughly E - W trend argue strongly for this model. So, as shown in the sketch of Fig. 5, the spreading axis may consist of a succession of 10-20 km long spreading seg- ments, right laterally offset by fracture zones. Taken together, the segments form an E - W zone of weakness which favors the development of volcanic features. Our model of a disrupted spreading axis accounts for the geophysical and structural observations in the eastern axial part of the basin. It may also explain the incompatibility between the orientation of magnetic anomaly 6 as interpreted north and south of the axis by Taylor and Hayes and the orientation of the fault scarps in this area (Figs. 1, 4A).
5. Discussion
The variable density of fracture zones and transform faults in a spreading system has not yet been fully explained. It has been suggested that thermal stresses in the cooling lithosphere may be the cause of formation of such features [20]. Fur- thermore the spreading rate seems to influence the ridge-transform pattern of a spreading system, the transform faults being closer when the spreading rate is lower [21]. In the South China Sea basin, models of the magnetic anomalies indicate that the spreading has been slow (Fig. 4B) [1,2], and the ridge axis is likely to be segmented.
A N W - S E direction of extension seems well established by the observations made in the center of the eastern basin. Thus, it may be assumed that there was a reorientation of spreading at the time of anomaly 6a, if we accept the interpretation of Taylor and Hayes [1] for the older part of the basin. Alternatively, it is possible to assume that the direction of spreading did not change during

318
L ~ ~I"S,e~OA', ::>J
SOUTH
CHINA ~r
NORTH
L
. SOUTH
I /
::,/ .~^
,¢1
BORNEO
,~,:E~::F~ SOUTH ::t
CHINA i ~ i l SEA
i i i ! i i i i i i~i! i i i i i ! i ! i i i ! i i i i i~
y / / /
A 7" yY 0
4
s° 5 0 0 k m ÷ L I r r r J
g5 o i
~ U p p e r Mesozo i c /
I I Upper Pa leozo lc I /
Middle Paleozolc J
-==--~'-= Spread ing center
. . . . . Normal fau l t
J ~ _ Fold ax i s
Upper Mesozo ic - - - Cenozo ic m a g m a t i c ~ c o n t i n e n t a l i
belt s a n d s t o n e s . . . . . Lower Mesozmc su ture Cenozo=c sea f loor or t h i nned con t inen ta l o o o o Pa leozo lc crust
l . . Thrus t fau l t
Ter t ia ry Subduc t ion Str ike slip fautt
Fig. 6. Geodynamic setting in Southeast Asia, showing age boundaries and offsets on large strike-slip faults, model from Peltzer and Tapponnier [24]. Minimum offsets (in kin) and oldest ages of offsets (in Ma) are given. Bold arrows on strike-slip faults represent sense of largest Tertiary movement, small arrows show sense of Quaternary movement.

the opening history. We presented these two hy- potheses in a previous paper [3]. The observat ions made in the southwest sub-basin, bo th on the cont inenta l margin and in the oceanic area, may be taken to support the latter hypothesis. This would imply that either the pa t te rn observed in the axial zone extends over the whole basin, or that oblique spreading occurred on the N 8 0 ° E t rending ridge segments in the eastern basin. Fur - ther analysis of recently publ ished magnet ic data [22] should help constra in the pa t te rn of spreading in the older par t of the eastern basin.
The geodynamic implicat ions of a N W - S E spreading model are in good agreement with ob- servations within the Asian cont inent . A N W - S E d i rec t ion of ex tens ion is c o m p a t i b l e with M i d / L a t e Tert iary left lateral movements along large strike-slip faults, such as the Red River fault in China and the Wang Chao and Three Pagodas faults in Sundaland. The opening of the South China Sea may have adsorbed the displacements, inferred to be of the order of hundreds of kilometers along these faults (Fig. 6) [23,24].
Acknowledgements
We thank all par t ic ipants and the crews for cooperat ion on board R / V "Jean Charcot" dur- ing the N A N H A I and M A S I N cruises. N A N H A I cruise was carried out within a cooperative pro- gram ( N A N H A I Project) between the Na t iona l Bureau of the Sea (Beijing) and I F R E M E R (Paris). We thank Phil ippine Patriat for fruitful discus- sions. We are indebted to Xavier Le Pichon and Phil ippe Huchon whose critical comments helped improve the manuscr ipt , and to Brian Taylor for his contradictory point of view. G u y Aveline drafted the figures. This is I P G P Cont r ibu t ion No.
1070.
References
1 B. Taylor and D.E. Hayes, Origin and history of the South China Basin, in: The Tectonic and Geologic Evolution of Southeast Asian Seas and Islands: Part 2, D.E. Hayes, ed., Am. Geophys. Union, Geophys. Monogr. Ser., 23-56, 1983.
2 B. Taylor and D.E. Hayes, The tectonic evolution of the South China Basin, in: The Tectonic and Geologic Evolu- tion of Southeast Asian Seas and Islands, D.E. Hayes, ed., Am. Geophys. Union, Geophys. Monogr. Ser., 89-104, 1980.
319
3 G. Pautot, C. Rangin, A. Briais, P. Tapponnier, P. Beuzart, G. Leficolais, X. Mathieu, J. Wu, S. Han, H. Li, Y. Lu and J. Zhao, Spreading direction in the Central South China Sea, Nature 321, 150-154, 1986.
4 K. Hinz and H.U. Schliiter, Geology of the Dangerous Grounds, South China Sea, and the continental margin off southwest Palawan: results of Sonne cruises SO-23 and SO-27, Energy 10, 297-315, 1985.
5 K. Ru and J.D. Pigott, Episodic rifting and subsidence in the South China Sea, Am. Assoc. Pet. Geol. Bull. 70, 1136-1155, 1986.
6 G. Kimura and K. Tamaki, Collision, rotation and back-arc spreading in the region of the Okhotsk and Japan Seas, Tectonics 5(3), 389-401, 1986.
7 L. Jolivet, America-Eurasia plate boundary in eastern Asia and the opening of marginal basins, Earth Planet. Sci. Lett. 81, 282-288, 1986.
8 D.E. Hayes and S.D. Lewis, A geophysical study of the Manila trench, Luzon, Philippines, 1. Crustal structure, gravity and regional tectonic evolution, J. Geophys. Res. 89, 9171-9195, 1984.
9 S.D. Lewis and D.E. Hayes, A geophysical study of the Manila trench, Luzon, Philippines, 2. Fore arc basin struc- tural and stratigraphic evolution, J. Geophys. Res. 89, 9196-9214, 1984.
10 J.F. Stephan, R. Blancher, C. Rangin, B. Pelletier, J. Letouzey and C. Muller, Geodynamic evolution of the Taiwan-Luzon-Mindoro belt since the late Eocene, Tectonophysics 125, 245-268, 1986.
11 G. Pantot and C. Rangin, Subduction of the South China Sea axial ridge below Luzon (Philippines), Earth Planet. Sci. Lett. 92, 57-59, 1989.
12 C. Bowin, R.S. Lu, C. Lee and H. Schouten, Plate conver- gence and accretion in the Taiwan Luzon region, Am. Assoc. Pet. Geol. Bull. 62, 1645-1672, 1978.
13 L. Fricant, Etude grologique et strncturale de la marge Nord Palawan, Thrse de 3eme cycle, Universit6 de Paris XI, 1984.
14 R. Batiza and D. Vanko, Volcanic development of small oceanic central volcanoes on the flank of the East Pacific rise inferred from narrow beam echo sounder survey, Mar. Geol. 54, 53-90, 1983.
15 D.R. Bracey, Morphological characteristics of North Atlantic and North Pacific seamounts as factors for design- ing effective survey detection strategies, U.S. Naval Oc- eanogr. Office, Tech. Rep., 1981.
16 R.C. Searle, Submarine central volcanoes on the Nazca plate--high-resolution sonar observations, Mar. Geol. 53, 77-102, 1983.
17 R. Hekinian, P. Bont6, G. Pautot, D. Jaques, L. Labeyrie, N. Mikkelsen and J.L. Reyss, Volcanics of the South China Sea ridge system, Oceanol. Acta 12(2), 101-116, 1989.
18 P. Patriat, L'rvolution crnozoique du syst~me de dorsale de l'Ocran Indien, Thrse d'Etat, Universit6 de Paris VI, 1983.
19 C. de Moustier and M. Kleinrock, Bathymetric artifacts in Seabeam data: How to recognize them and what causes them, J. Geophys. Res. 91, 3407-3424, 1986.
20 D.L. Turcotte, Are transform faults thermal contraction cracks?, J. Geophys. Res. 79, 2573-2577, 1974.

320
21 D.T. Sandwell, Thermal stress and the spacing of transform faults, J. Geophys. Res. 91, 6405-641'7, 1986.
22 Shengyuan Chen, Map of magnetic profiles, in: Atlas of Geology and Geophysics of South China Sea, 1/2,000,000, Map Publishing House of Guangdong Province, 1987.
23 P. Tapponnier, G. Peltzer and R. Armijo, On the mechanics of the collision between India and Asia, in: Collision
Tectonics, M.P. Coward and A.C. Ries, eds., Geol. Soc. London, Spec. Publ. 19, 115-157, 1986.
24 G. Peltzer and P. Tapponnier, Formation and evolution of strike-slip faults, rifts and basins during the India-Asia collision: an experimental approach, J. Geophys. Res. 93, 15095-15117, 1988.