Consolidated Plan Table of Contents - Maryland State Archives
281
Consolidated Plan Table of Contents Introduction….................................................................................................................. 1 What is Consolidated? .............................................................................................. 2 The Five Year Plan and the Annual Action Plan...................................................... 4 The Consolidated Plan Development Process ........................................................ 4 Citizen Participation Efforts ................................................................................... 5 Surveys ................................................................................................................. 5 Open Meetings ...................................................................................................... 5 Public Hearings ..................................................................................................... 6 Median Participation .............................................................................................. 7 Internet Availability ................................................................................................ 7 Housing and Homeless Needs Assessment................................................................. 8 Housing Needs ........................................................................................................... 9 Extremely Low-Income Households ...................................................................... 9 Low-Income Households ..................................................................................... 12 Moderate-Income Households ............................................................................ 14 Middle and Upper Income Households ............................................................... 16 Five Year Projections .......................................................................................... 18 Homeless Needs ...................................................................................................... 20 Sheltered Homeless ............................................................................................ 21 Race/Ethnicity ..................................................................................................... 22 Family Demographics .......................................................................................... 23 Age ...................................................................................................................... 23 Gender ................................................................................................................ 24 Subpopulations with Special Needs .................................................................... 25 Unsheltered Homeless ........................................................................................ 27 Race/Ethnicity ..................................................................................................... 27 Subpopulations with Special Needs .................................................................... 27 Persons Threatened With Homelessness ........................................................... 27 Persons with Special Needs ................................................................................... 29 Persons with Alcohol Drug Abuse ....................................................................... 30 Persons with HIV/AIDS ....................................................................................... 30 Persons with Developmental Disabilities ............................................................. 35 Persons with Mental Illness ................................................................................. 38
-
Upload
khangminh22 -
Category
Documents
-
view
3 -
download
0
Transcript of Consolidated Plan Table of Contents - Maryland State Archives

Consolidated Plan
Table of Contents Introduction….................................................................................................................. 1 What is Consolidated? .............................................................................................. 2 The Five Year Plan and the Annual Action Plan...................................................... 4 The Consolidated Plan Development Process ........................................................ 4
Citizen Participation Efforts ................................................................................... 5 Surveys ................................................................................................................. 5 Open Meetings ...................................................................................................... 5 Public Hearings ..................................................................................................... 6 Median Participation.............................................................................................. 7 Internet Availability ................................................................................................ 7
Housing and Homeless Needs Assessment................................................................. 8 Housing Needs ........................................................................................................... 9
Extremely Low-Income Households...................................................................... 9 Low-Income Households..................................................................................... 12 Moderate-Income Households ............................................................................ 14 Middle and Upper Income Households ............................................................... 16 Five Year Projections .......................................................................................... 18
Homeless Needs ...................................................................................................... 20
Sheltered Homeless ............................................................................................ 21 Race/Ethnicity ..................................................................................................... 22 Family Demographics.......................................................................................... 23 Age ...................................................................................................................... 23 Gender ................................................................................................................ 24 Subpopulations with Special Needs .................................................................... 25 Unsheltered Homeless ........................................................................................ 27 Race/Ethnicity ..................................................................................................... 27 Subpopulations with Special Needs .................................................................... 27 Persons Threatened With Homelessness ........................................................... 27
Persons with Special Needs ................................................................................... 29
Persons with Alcohol Drug Abuse ....................................................................... 30 Persons with HIV/AIDS ....................................................................................... 30 Persons with Developmental Disabilities............................................................. 35 Persons with Mental Illness................................................................................. 38

The Elderly and Frail Elderly ............................................................................... 39 Persons who do Not Require Supportive Housing .............................................. 41
Lead Paint Hazards .................................................................................................. 42 Housing Market Analysis ............................................................................................. 48 The Market ................................................................................................................ 48 Inventory Conditions ............................................................................................... 58
The Assisted Housing Inventory.......................................................................... 60 Public Housing Authorities .................................................................................. 61 DHCD Public Housing Waiting List...................................................................... 63 Minority and Low-Income Concentrations ........................................................... 63 Inventory of Facilities and Services for the Homeless and Persons Threatened with Homelessness .......................................................................................... 68 Inventory of Supportive Housing for Non-Homeless Persons with Special Needs........................................................................................... 68
Barriers to Affordable Housing.................................................................................... 77 Non-Housing Community Development Needs.......................................................... 81 Strategies Priority Needs and Objectives ................................................................... 85 Strategies .................................................................................................................... 85
Revitalizing Communities .................................................................................... 85 Encouraging Homeownership ............................................................................. 89 Expanding the Supply of Decent Affordable Housing.......................................... 90
Geographic Targeting ................................................................................................ 96 Housing Priorities ...................................................................................................... 98 Objectives ................................................................................................................. 100 Resources ................................................................................................................. 101 Accomplishments .................................................................................................... 103 Strategy to Coordinate the Tax Credit.................................................................... 106 Barrier Removal .......................................................................................................... 107 Lead Based Paint Hazard Reduction......................................................................... 110 Anti-Poverty Strategy ................................................................................................. 113 Coordination Efforts ................................................................................................... 116

Public Housing Resident Initiatives .......................................................................... 119 Helping Troubled PHAs ......................................................................................... 121 Geographic Distribution ............................................................................................. 122 Monitoring.................................................................................................................... 125 Annual Action Plan ..................................................................................................... 124 Citizen Participation................................................................................................. 131 Priorities.................................................................................................................... 133 One Year Goals ........................................................................................................ 134
One Year Housing Goals .................................................................................. 136 One Year Non Housing Goals ........................................................................... 138
Geographic Targeting .............................................................................................. 139
Leveraging...................................................................................................... 141 Anti-Poverty Strategy ..................................................................................... 143
The Continuum of Care ........................................................................................... 144
Preventing Homelessness................................................................................. 145 Emergency Shelter and Transitional Housing for the Homeless ....................... 146 Helping Homeless Persons make the Transition to Permanent Housing.......... 147
Persons With Special Needs ................................................................................... 148
The Elderly and Frail Elderly ............................................................................. 149 Persons With HIV/AIDS..................................................................................... 149 Individuals With Mental Illness .......................................................................... 149 Persons With Developmental Disabilities .......................................................... 150
Barrier Removal ....................................................................................................... 151 Coordination ............................................................................................................. 153 Other Actions ........................................................................................................... 154
Local Government Revitalization Strategies...................................................... 154 Institutional Structure......................................................................................... 155 Low-Income Housing Tax Credits ..................................................................... 155 Public Housing .................................................................................................. 155 Preservation of Affordable Housing................................................................... 156 Lead Paint Abatement....................................................................................... 157

Specific Information.................................................................................................... 157 Community Development Block Grant Program................................................... 157 HOME Investment Partnership Program................................................................ 172
American Dream Down Payment Initiative ........................................................ 179 Emergency Shelter Grants Program ...................................................................... 180 Housing Opportunities for Persons With AIDS ..................................................... 183 Public Comments ........................................................................................................ 188 Application Forms (Form 424) ................................................................................... 192 Certifications ............................................................................................................... 196 Appendices Appendix One – Housing/Homeless and Community Development Surveys Appendix Two – List of Assisted Housing Inventory Appendix Three – List of Shelters and Transitional Housing Facilities Appendix Four – List of Food Pantries and Soup Kitchens Appendix Five – List of Common Acronyms

Acronyms
ADDI – American Dream Downpayment Initiative AI – Analysis of Impediments to Fair Housing Choice CAA – Community Action Agency CDA – Community Development Administration CDBG – Community Development Block Grant Program CITC – Community Investment Tax Credit CSBG – Community Services Block Grant Program DBED – Department of Business and Economic Development DHCD – Department of Housing and Community Development DHMH – Department of Health and Mental Hygiene DHR – Department of Human Resources DNR – Division of Neighborhood Revitalization DSELP – Downpayment and Settlement Expense Loan Program EHRP – Elderly Rental Housing Program ELI – Extremely Low-Income (earning less than 30% of area median income) ESG – Emergency Shelter Grants Program FHA – Federal Housing Administration GHFP – Group Home Financing Program HMDA – Home Mortgage Disclosure Act HMIS – Homeless Management Information System HOME – HOME Investment Partnerships Program HOPWA – Housing Opportunities for Persons With AIDS HOPE (I-VI) – Housing Opportunities for Persons Everywhere Program(s) HPC – Housing Policy Commission HUD – U.S. Department of Housing and Urban Development IPP – Indoor Plumbing Program LIHTC – Low-Income Housing Tax Credit Program LI – Low-income (earning more than 50% but less than 80% of area median income) MAHT – Maryland Affordable Housing Trust MCHR – Maryland Commission on Human Relations MDE – Maryland Department of the Environment MDoA – Maryland Department of Aging MDoD – Maryland Department of Disabilities MDOT – Maryland Department of Transportation MDP – Maryland Department of Planning MF-Bond – Multi-Family Bond Program MHF – Maryland Housing Fund MHFP – Maryland Home Financing Program MHRP – Maryland Housing Rehabilitation Program

MHT – Maryland Historic Trust MMP – Maryland Mortgage Program NR – Division of Neighborhood Revitalization
PFA – Priority Funding Area PHA – Public Housing Authority PRHP – Partnership Rental Housing Program RAP – Rental Allowance Program RELAP – Residential Lead Paint Abatement Program RHPP – Rental Housing Production Program
Section 202 – Supportive Elderly Housing Program under Section 202 of the Federal Code Section 8 -- a Tenant based rental assistance program targeted toward service very low-income households Section 811 – Supportive Housing Program for persons with disabilities under Section 811 of the Federal Code SHOP – Special Housing Opportunities Program SHP – Supportive Housing Program SHPR – Supportive Housing Program Renewal SPC – Shelter Plus Care SRO – Single Room Occupancy STHGP – Shelter and Transitional Housing Facilities Grant Program STAR – Special Targeted Applicant Rehabilitation Program USDA – U.S. Department of Agriculture VLI – Very Low-income (earning more than 30% but less than 50% of area median income) WAP – Weatherization Assistance Program

1
INTRODUCTION
Maryland's Consolidated Plan The State of Maryland has undertaken a major planning initiative called the Consolidated Plan. The Consolidated Plan is a planning tool required by the U.S. Department of Housing and Urban Development (HUD) that guides the use of federal, and to a lesser extent State, housing and community development funds. HUD has established three basic goals for the Consolidated Plan. The goals are:
Goal 1. To provide decent housing Goal 2. To provide a suitable living environment, and Goal 3. To expand economic opportunities.
Goal 1 includes: Assisting homeless persons to obtain housing, retaining the affordable housing stock, increasing the availability of permanent housing that is affordable to low-income Americans without discrimination, improving access to housing credit, and increasing supportive housing that includes structural features and services to enable persons with special needs to live in dignity. Goal 2 includes: Improving the safety and livability of neighborhoods, increasing access to quality facilities and services, reducing the isolation of income groups within areas by de-concentrating housing opportunities and revitalizing deteriorating neighborhoods, restoring, enhancing and preserving natural and physical features of special value for historic, architectural, or aesthetic reasons, and conserving energy resources. Goal 3 includes: Creating jobs accessible to low-income persons, providing access to credit for community development that promotes long-term economic and social viability, and empowering low-income persons to achieve self-sufficiency in federally-assisted and public housing. Efforts to achieve each of these goals must primarily benefit low-income persons. The Consolidated Plan must be developed in accordance with the following statutory goals: Elimination of slums and blight, elimination of conditions that are detrimental to health, safety and public welfare, conservation and expansion of the nation's housing stock, expansion and improvement of the quantity and quality of community services, better utilization of land and other natural resources, reduction of the isolation of income groups within communities and geographic areas, restoration and preservation of properties of special value, alleviation of physical and economic distress, and conservation of the nation's scarce energy resources.
It should be noted that the State’s Consolidated Plan primarily focuses on the State’s non-entitlement jurisdictions. The non-entitlement jurisdictions are areas, primarily rural, which do not receive direct allocations of Community Development Block Grant (CDBG), HOME Investment Partnerships Program (HOME), Emergency Shelter Grants (ESG) and Housing Opportunities for Persons With AIDS (HOPWA) funds directly from HUD. Rather, the State administers these funds on their behalf. The State’s entitlement jurisdictions which are NOT covered by the State’s Plan – because they receive direct funding from HUD - are Anne Arundel, Baltimore, Harford, Howard, Montgomery and Prince George’s Counties, and the Cities

2
of Annapolis, Baltimore, Bowie, Cumberland, Frederick, Hagerstown and Salisbury. All other areas in the State fall under the State’s Consolidated Plan. The map below shows the State’s entitlement and non entitlement jurisdictions.
Garrett
Kent
Dorchester
Cecil
Charles
Talbot
St. Mary's
FrederickCarroll
WorcesterSomerset
Allegany
Calvert
Wicomico
Washington
Caroline
QueenAnne's
Baltimore
Harford
AnneArundel
Montgomery
Howard
PrinceGeorge's
BaltimoreCity
Bowie
Frederick
Salisbury
Hagerstown
Gaithersburg
Annapolis
Cumberland
Maryland's Non-Entitlement and Entitlement Areas by Jurisdiction2004
Non-Entitlement Area (County)
Entitlement Area (County)
Entitlement Area (City)
It should be noted, however, than because all of the State’s own housing, community development, and economic development programs are operated on a Statewide basis, and that some federal programs (such as Federal Low-Income Housing Tax Credits) are also funded on a Statewide basis, there is some discussion of these areas as well.
What is Consolidated?
The Consolidated Plan is called the Consolidated Plan because it combines all of the planning and application requirements of HUD’s four main formula programs into a single Plan. The four formula programs covered by the Plan are the:
Community Development Block Grants (CDBG) Program HOME Investments Partnership Program (HOME) Emergency Shelter Grants (ESG) Program, and the Housing Opportunities for Persons With AIDS (HOPWA) Program
The planning and application requirements that are consolidated include the Consolidated Housing Affordability Strategy (CHAS), the HOME program description, the CDBG final statement, the ESG application, the non-Housing Community Development Plan, and the HOPWA application.

3
There are also other funds under other programs covered by the Consolidated Plan. These funds are obtained through competitions, and, depending upon the program, can either be used either Statewide or only in certain jurisdictions depending upon the requirements of the program. The main competitive programs that fall under the Consolidated Plan include:
Assisted Living Conversation Program for Eligible Multifamily Projects Brownfields Economic Development Initiative Healthy Homes and Lead Hazard Control Programs HOPE I through VI Programs Housing Choice Voucher Family Self-Sufficiency (FSS) Program Coordinators Housing Counseling Programs John Heinz Neighborhood Development Program Low-Income Housing Preservation Program Public Housing Family Self Sufficiency Resident Opportunity and Self-Sufficiency (ROSS) Program Revitalization of Severely Distressed Public Housing Program Rural Housing and Economic Development Program Section 8 Moderate Rehabilitation Single Room Occupancy Housing (SRO)
Program Shelter Plus Care Program Supportive Housing for the Elderly (Section 202) Program Supportive Housing for Persons with Disabilities (Section 811) Program Supportive Housing Program and Youthbuild, among others.
This Plan covers funds received under the above programs for federal fiscal years (FFY) 2005 through 2009. Annual updates will be made each year to the Plan during this five year period to: 1) set annual goals for housing, economic, and community development activities, and 2) make any necessary adjustments to policies or objectives because of changes in federal and State programs, or because of changes in needs.
Eligible applicants vary from program to program, with some programs open to virtually any housing provider, while others are limited only to non-profit agencies, others only to public housing authorities, etc. Regardless of who applies for assistance, applications under these programs must be certified as being consistent with the Consolidated Plan at the appropriate level.
State agencies, as well as many non-profit corporations, public housing authorities and others have successfully competed for funding under these competitive programs in the past. The State strongly supports applications for any activities under these programs, or any other programs, which carry out the goals of the Consolidated Plan. In addition, it should be noted that while not directly covered by the Consolidated Plan, HUD's funding allocations for the Section 8 Voucher Program is to be made in a way that enables participating jurisdictions to carry out their own Consolidated Plans. Also, Public Housing Authorities (PHAs) must prepare their own PHA Plans which also must be consistent with the Consolidated Plan.

4
The Five Year Plan and the Annual Action Plan
This document contains two planning elements. The first element is a "big picture" five-year overall planning strategy. This "big picture" strategy was developed using surveys, public comments, public hearings, census data, information from the Governor’s Housing Policy Commission, meetings with interested parties such as homeless providers and health agencies, and information from other State agencies. It sets the State's broad goals, such as revitalizing communities or providing housing for low-income persons. The second element is called the one-year Annual Action Plan, which starts on page 131. This element is much more detailed, and covers the specific actions the State plans to take in the next year to help meet its five-year goals. For example, while the five-year Plan states we will provide homeownership opportunities, the Annual Action Plan will specify the number of units to be produced during the coming year. Because it only covers a one-year period, this document is updated annually, with new goals so that eventually we reach the overall "big picture" goals laid out in the five-year Plan.
The Consolidated Plan Development Process The Maryland Department of Housing and Community Development (DHCD) is the State’s lead agency for developing Maryland’s Consolidated Plan. DHCD conducted extensive citizen participation and out reach efforts when developing the Plan, as detailed below. Consultation With Other State Agencies While DHCD was designated the lead agency in developing the Consolidated Plan, it worked in consultation with other State agencies, local governments, non-profit organizations, profit-motivated housing sponsors, and other groups and individuals interested in housing, community development, and economic development policy in Maryland. It also followed an approved Citizen Participation Plan that was designed to involve as many citizens as possible into the plan development process. State agencies other than DHCD which provided input into the Consolidated Plan included the Department of Health and Mental Hygiene (DHMH), Department of Human Resources (DHR), Maryland Department of Aging (MDoA), Maryland Department of the Environment (MDE) Maryland Department of Planning (MDP), Maryland Department of Disabilities (MDoD) and the Maryland Commission on Human Relations (NCHR). DHMH’s AIDS Administration had primary responsibility for developing the State’s HOPWA policies, and its Alcohol and Drug Abuse, Developmental Disabilities, and Mental Hygiene Administrations helped developed strategies for the disabled. DHR has primary responsibility for helping the homeless in Maryland, and had major input into that section of the Plan, as did DHMH as many homeless persons have disabilities. MDE’s primary focus with DHCD was working on lead paint abatement issues, while MDoA focused on the needs of the elderly and frail elderly. Census materials and data were provided by MDP, and DBED primarily focused on economic issues, especially in regard to the CDBG program where it is allocated part of the State’s CDBG funds. The primary focus of the MHRC was on fair housing issues, including assisting in updating the State’s Analysis of Impediments to Fair Housing Choice, and the

5
MDoD provided information and input in assisting persons with disabilities with housing opportunities. Citizen Participation Efforts DHCD undertook numerous efforts to gain citizen participation in the preparing the Plan. These included conducting needs surveys, holding numerous public hearings, participating in open meetings (such as local continuum of care meetings, HIV/AIDS provider meetings, and qualified allocation plan hearings), mass mailings, newspaper notices and advertisements, and using information from other open forums (such as the Governor’s Housing Policy Commission) to gain public input into determine the housing, community development, and economic development needs in the State, and to develop strategies for addressing the identified needs. Surveys DHCD conducted two needs surveys when developing the Consolidated Plan. One of these surveys focused on Housing and Homeless needs, and the other focused on Community Development and Economic Development needs. These surveys were done on line, with letters sent to approximately 1,100 persons and organizations with a stake in the development of the Plan, including all chief elected officials at the County and municipal level, all the State’s Public Housing Authorities, all of the chief county housing contacts, all for-profit and non-profit developers on DHCD’s mailing lists, all of the State’s Community Action Agencies, all of the service providers and/or advocacy organizations on DHCD’s mailing lists, including organizations advocating for or providing services to persons who were homeless, persons with HIV/AIDS, persons with disabilities, or low-income persons in general, and all individuals who had contacted DHCD with an interest in the Consolidated Plan. A total of 198 people visited the Community and Economic Development Needs Survey, and 206 people visited the Housing and Homeless needs survey. Not all persons who visited the surveys filled them out, and some persons only filled them out in part. However, they provided valuable insight on what people felt were important in terms of housing and community needs. Copies of the surveys can be found in Appendix I. Open Meetings DHCD also participated in a number of open meetings, using information gathered there to help develop the Consolidated Plan. These included broad-based meetings, such as those held by the Governor’s Housing Policy Commission, as well as more “issue focused” meetings including meetings held on helping persons with HIV/AIDS or the homeless. The Governor’s Housing Policy Commission (HPC) was convened under the leadership of Governor Robert L. Ehrlich. The purpose of the Commission was to make recommendations to the Governor for specific and measurable actions that could be taken to increase and preserve quality affordable housing in all Maryland communities to meet the needs, as well as the dreams, of working families, individuals with disabilities, the homeless and the elderly. Five subcommittees assisted the Commission to accomplish the duties of the Executive Order. More than 95 at-large members, in addition to Commissioners, participated in the subcommittee meetings, which were on Affordable Housing, Senior Housing Issues, Affordable and Accessible Housing for Individuals with Disabilities, Land Use and Planning and Community Revitalization.

6
The Commission met for over a year, holding numerous public hearings, and making the minutes of its subcommittee meetings, which were also public, available on DHCD’s website. As noted above, a number of open meetings were also held regarding specific issues important to the development of the Consolidated Plan as well. One of the primary ones was all-day session on how the State would administer the HOPWA program in the rural jurisdictions. Rural service providers were brought together from all over the State to help develop policy on the use of HOPWA funds, as well as Ryan White and other HIV/AIDS funds that fell under the State HOPWA program. They reached a consensus that HOPWA funds would be focused almost exclusively on housing, while service funding would be switched to Ryan White, as shown in the discussion on the HOPWA program in the Annual Action Plan. Other open meetings focused on the homeless. These meetings were hosted by the Department of Human Resources or local continuums of care. DHR is under mandate to develop a 10-year plan to end homelessness in Maryland. That Plan is due in 2006. In the interim, DHCD staff attended these meetings to help develop policies to assist homeless persons, both in the development of that Plan, as well as in the Consolidated Plan. Public Hearings A total of 8 public hearings were held specifically on the Plan in communities located throughout the State. All of the public hearings were held in sites accessible to the handicapped. The first four hearings were held before a draft of the Plan was written, so that suggestions, comments and recommendations could be made early in the planning process. The hearings were held at the following dates, times, and places: Wednesday, February 2, 2005 at 1:30 p.m. at the Denton Community Center in Denton; Thursday, February 3, 2005 at the Fairview Branch Library in Owings; Friday, February 4, 2005 at 1:30 p.m. at the Allegany County Office Complex in Cumberland and Monday, February 7, 2005 at 7:00 p.m. at the Maryland Department of Housing and Community Development in Crownsville. The second set of hearings, held after the draft Plan had been issued, were held on the following days, time and places: Tuesday, April 19, 2005 at 7:00 p.m. at the Maryland Department of Housing and Community Development in Crownsville; Wednesday, April 20, 2005 at 1:30 p.m. at the Denton Community Center in Denton; Thursday, April 21, 2005 at 10:30 a.m. at the Fairview Branch Library in Owings, and Friday, April 22, 2005 at 1:30 p.m. at the Allegany County Office Complex in Cumberland All notices of public hearings and the comment period were published in newspapers throughout the State, including Baltimore Sun, Baltimore Afro-American, Daily Mail (Hagerstown), Capital Gazette (Annapolis), Star Democrat (Easton), Dorchester Star, Caroline Times-Record, Kent County News, Bay Times, and Record Observer. In addition, DHCD sent out a mass mailing to nonprofit and for-profit housing developers, municipal and county executives, public housing authorities, community action agencies, advocacy organizations, AIDS/HIV organizations, and local housing and community development contacts, among others, to apprise them of the upcoming hearings and encourage their participation at the hearings and in the development of the new Plan. Copies of the Consolidated Plan in all its stages were mailed to Maryland's regional libraries, including the Enoch Pratt Free Library in Baltimore, the Blackwell Library in Salisbury, the Washington County Free Library in Hagerstown, the Lewis J. Ort Library in Frostburg, the

7
Frederick Douglas Library in Princess Anne, and the Southern Maryland Regional Library in Charlotte Hall. As the State's regional lending libraries, these libraries made the Plan available to other public libraries throughout Maryland. In addition, a large print version of the Plan was provided to the Maryland Library for the Blind and Physically Handicapped. The draft Plan was also made available on DHCD’s website for downloading, and free copies of the draft Plan were also provided to persons who requested one. Media Participation In addition to the above newspaper notices, the State made additional efforts to broaden citizen participation by issuing press releases to over 200 news organizations. These organizations included newspapers, radio, and television stations. The press releases included information on the Consolidated Plan public hearings, the availability of the Plan for public comment, and the priorities for housing, economic development, and community development assistance. Internet Availability Comments on the draft five-year Plan were also taken via e-mail for those who wished to respond using that format. As noted above, DHCD posted the draft Plan, and will post the final Plan, on the Internet. In future years DHCD plans to post the draft and final Annual Updates to our website to give persons the opportunity to review and comment on the draft Plan through the Internet if they so choose.

8
HOUSING AND HOMELESS NEEDS ASSESSMENT Introduction This section of the Consolidated Plan has four parts all focusing on the State's estimated housing needs. The first part discusses the estimate of the significant current needs for housing assistance by income and family status. Information is provided separately for extremely low-income, low-income, moderate-income, and middle-income families and households by tenure type (renter/owner) and for different family categories (such as large families and single persons). It describes the extent to which cost burden and severe cost burden are being experienced by extremely low-, low-, moderate-, and middle-income renters and owners. It also describes the extent that any racial or ethnic group has disproportionately greater need for housing than any group as a whole. In the second part of this section of the Consolidated Plan, there is a discussion of the nature and extent of homelessness, broken down between the sheltered and unsheltered homeless. This discussion includes information on sub-populations of the homeless, including severely mentally ill homeless, alcohol/drug addicted homeless, homeless persons who are severely mentally ill and have an alcohol or drug addiction, homeless persons fleeing domestic violence, homeless youth, and homeless persons diagnosed with AIDS and related diseases. This section also includes information on the needs of persons threatened with homelessness. The third part of this section of the Consolidated Plan is a discussion of the special needs population, including persons who are the frail elderly and the disabled. Frail elderly persons are persons who are 85 or older with functional disabilities related to mobility or personal care. Disabled persons include those with developmental disabilities, physical disabilities, mental illness, alcohol or drug additions, or who are HIV positive or are living with AIDS. The discussion looks at both those who do not require supportive housing, and those who do. Finally, in the fourth part of this section of the Consolidated Plan, there is a discussion of lead-based paint hazards, including estimates of the number of housing units occupied by low-income and very low-income families that contain lead paint hazards.
HOUSING NEEDS The data on housing need in this part of the Consolidated Plan was provided to the State by HUD. The information was developed through special runs of the 2000 census. It is important to understand when looking at this data that HUD defined housing problems narrowly. HUD data focuses primarily on households with excessive housing costs. Some additional data is provided on housing problem is only that they are living in substandard housing, which includes housing that is overcrowded (more than one person per room) or lacks a complete kitchen or bathroom. However, if a family is, for example, paying both excessive rent and living in overcrowded conditions, their housing problem is only reported as paying excessive rent. The fact that there housing unit is also overcrowded would not be reported. Therefore, when we write "X" percent of low-income households had some sort of housing
9
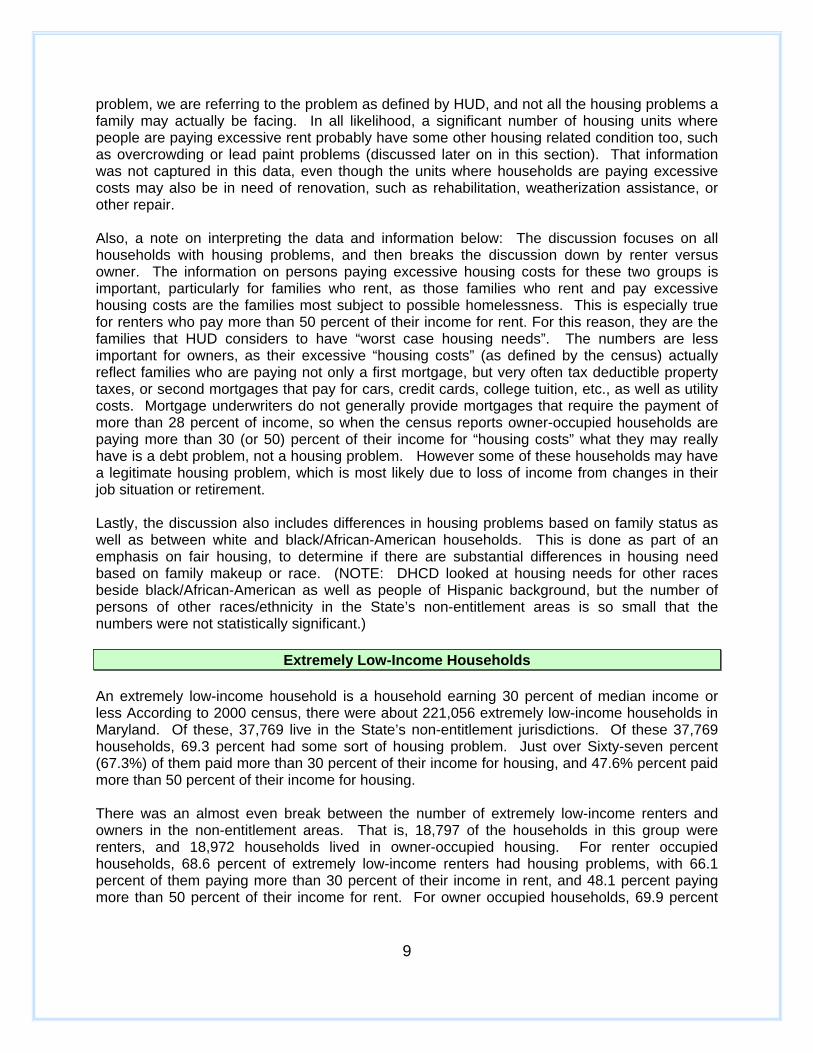
problem, we are referring to the problem as defined by HUD, and not all the housing problems a family may actually be facing. In all likelihood, a significant number of housing units where people are paying excessive rent probably have some other housing related condition too, such as overcrowding or lead paint problems (discussed later on in this section). That information was not captured in this data, even though the units where households are paying excessive costs may also be in need of renovation, such as rehabilitation, weatherization assistance, or other repair. Also, a note on interpreting the data and information below: The discussion focuses on all households with housing problems, and then breaks the discussion down by renter versus owner. The information on persons paying excessive housing costs for these two groups is important, particularly for families who rent, as those families who rent and pay excessive housing costs are the families most subject to possible homelessness. This is especially true for renters who pay more than 50 percent of their income for rent. For this reason, they are the families that HUD considers to have “worst case housing needs”. The numbers are less important for owners, as their excessive “housing costs” (as defined by the census) actually reflect families who are paying not only a first mortgage, but very often tax deductible property taxes, or second mortgages that pay for cars, credit cards, college tuition, etc., as well as utility costs. Mortgage underwriters do not generally provide mortgages that require the payment of more than 28 percent of income, so when the census reports owner-occupied households are paying more than 30 (or 50) percent of their income for “housing costs” what they may really have is a debt problem, not a housing problem. However some of these households may have a legitimate housing problem, which is most likely due to loss of income from changes in their job situation or retirement. Lastly, the discussion also includes differences in housing problems based on family status as well as between white and black/African-American households. This is done as part of an emphasis on fair housing, to determine if there are substantial differences in housing need based on family makeup or race. (NOTE: DHCD looked at housing needs for other races beside black/African-American as well as people of Hispanic background, but the number of persons of other races/ethnicity in the State’s non-entitlement areas is so small that the numbers were not statistically significant.)
Extremely Low-Income Households An extremely low-income household is a household earning 30 percent of median income or less According to 2000 census, there were about 221,056 extremely low-income households in Maryland. Of these, 37,769 live in the State’s non-entitlement jurisdictions. Of these 37,769 households, 69.3 percent had some sort of housing problem. Just over Sixty-seven percent (67.3%) of them paid more than 30 percent of their income for housing, and 47.6% percent paid more than 50 percent of their income for housing. There was an almost even break between the number of extremely low-income renters and owners in the non-entitlement areas. That is, 18,797 of the households in this group were renters, and 18,972 households lived in owner-occupied housing. For renter occupied households, 68.6 percent of extremely low-income renters had housing problems, with 66.1 percent of them paying more than 30 percent of their income in rent, and 48.1 percent paying more than 50 percent of their income for rent. For owner occupied households, 69.9 percent

10
had housing problems, with 68.5 percent paying more than 30 percent of income for housing, and 47.1 percent paying more than 50 percent of income for housing. Extremely Low-Income Renter Households Elderly Households: Maryland had about 6,000 extremely low-income elderly renter households in its non-entitlement areas in 2000. This is based on 2000 census materials and HUD's definition of elderly households, which are households which are headed by a person aged 62 or older. Just under 60 percent of the elderly renters earning less than 30 percent of median income had some sort of housing problem. About 59 percent paid more than 30 percent of their income for rent, and 39 percent paid more than 50 percent of their income for rent. As noted above, households paying more than 50 percent of their income for rent are considered to face the greatest risk of homelessness. Therefore, the elderly households paying more than 50 percent of their income for rent would be among those households with worst case needs. Small Households: Based on the 2000 census Maryland had about 6,100 extremely low-income small related renter households in the non-entitlement jurisdictions. HUD defines a small family as a household of 2-4 persons. About Seventy-four percent of these households had housing problems, with about 71 percent of these households pay more than 30 percent of their income for rent, and about 52 percent paying more than 50 percent of their income for rent. This 52 percent of small related renter households earning less than 30 percent of median income and paying more than 50 percent of their income for rent would be among those households with worst case needs.
Large Households: Maryland had about 1,286 large related renter households which have extremely low-incomes in the non-entitlement jurisdictions in the year 2000. HUD defines large families as families of 5 or more persons. Eighty-four percent had housing problems in accordance with HUD's data. About Seventy-seven percent of the State's large related households were paying more than 30 percent of their income for rent, and 51 percent paid more than 50 percent of their income for rent. These households paying more than 50 percent of their income for rent would also be among those households with worst case needs. Other Households: There are about 5,400 "other" extremely low-income renter households in Maryland. "Other" households include non-elderly single person households, and non-family households. About sixty-nine percent of these households had some sort of housing problem. About sixty-six percent of these households were paying more than 30 percent of their income for rent, and 53 percent were paying more than 50 percent of their income for rent. The 65 percent of "other" extremely low-income households earning less than 30 percent of median income and paying more than 50 percent of their income for rent would be the final group having worst case needs. Extremely-Low-income Homeowners Elderly Homeowners: There were about 10,831 extremely low-income elderly homeowner households in Maryland’s non-entitlement jurisdictions in 2000. Of these households, HUD's data indicates about 66 percent had some sort of housing problem. About 65 percent of these households were paying more than 30 percent of their income for housing costs, and about 37 percent were paying more than 50 percent of their income for housing costs.

11
Small Households: There were about 3,972 extremely low-income small homeowner households in Maryland’s non-entitlement jurisdictions in 2000. Of these, 76 percent had housing problems. About 75 percent of the households paid more than 30 percent of the income for housing costs, and about 62 percent paid more than 50 percent of their income for housing costs. Large Households; There were about 957 extremely low-income owner-occupied households in Maryland in the year 2000. About 81 percent of them had housing problems, with about 72 percent of them paying more than 30 percent of income for housing costs, and about 59 percent paying more than 50 percent of their income for housing costs. All Other Owner Households: There were about 3,212 "other" extremely low-income owner households in Maryland’s non-entitlement jurisdictions in 2000. About 74 percent of them had housing problems. About Seventy-two percent of these households paid more than 30 percent of their income in rent, and about 59 percent paid more than 50 percent of their income for housing costs. Differences by race among extremely low-income households An analysis of differences in housing problems by race between extremely low-income white and African-American households generally shows that there is not a great deal of difference in need between renters and owners or by age or family status across the State’s non-entitlement jurisdictions. This is illustrated in the table below:
Extremely Low-Income Households – Housing Problems by Race RENTERS White Renter Households Black/African-American Renter
Households Household Type
Elderly Family Other Total Elderly Family Other Total
Number of Households
4,687 4,328 4,147 13,162 1,158 2,578 980 4,716
Percent With Housing Problems
57.5 76.1 71.9 68.1 67.0 73.3 61.3 69.3
OWNERS White Owner Households Black/African-American Owner Households
Household Type
Elderly Family Other Total Elderly Family Other Total
Number of Households
9,338 3,869 2,742 15,949 1,512 828 451 2791
Percent With Housing Problems
66.2 77.3 73.6 70.2 65.4 73.7 70.5 68.7
HUD considers a difference in housing problems by race of more than 10 percent to be significant. In other words, if 40 percent of all white households had housing problems, but 51 percent of black or African-American households had housing problems, then that would be a significant difference in need by race. The one area of significant difference in need by race for

12
extremely low-income households would be “other” renters, where white renters have a need more than 10 percent greater than black/African-American households. It is unclear why this difference exists. The difference in need between elderly extremely low income renters is near 10 percent, but does not meet that threshold. (NOTE: HUD data regarding housing need by race did not distinguish between small and large families, nor did it go into detail about housing problems in terms of excessive rent.)
Low-Income Households
Maryland had about 207,310 low-income households in 2000. Low-income households are defined as those households earning more than 30 percent of median income, but less than 50 percent of median income. Of these 207.310 households, about 42,376 lived in Maryland’s non-entitlement jurisdictions. About 54 percent of these households have housing problems, with about 51 percent paying more than 30 percent of their income for housing, and about 19 percent paying more than 50 percent of their income for housing. Very Low-Income Renters Based on 2000 Census figures, Maryland had about 17,013 low-income renter households in the non-entitlement jurisdictions. HUD estimates 59 percent of these households had some sort of housing problem. About 55 percent of them paid more than 30 percent of their income for rent, and 12 percent paid more than 50 percent of their income for rent. Those households paying more than 50 percent of income for rent would be the households with worse-case needs. Below is a discussion of housing problems by family type for low-income renter households: Elderly Renters: Of the State's elderly low-income renter households (about 3,856 households in the non-entitlement jurisdictions), HUD estimates 52 percent had housing problems. About 50 percent paid more than 30 percent of their income for rent, and about 16 percent paid more than 50 percent of their income for rent. Small Related Renter Households: Maryland had about 6,852 small related low-income renter households in the State’s non-entitlement jurisdictions in 2000. About 59 percent of them had housing problems. About 56 percent of these households paid more than 30 percent of their income for rent, and about 10 percent paid more than 50 percent of their income for rent. Large Related Renter Households: Maryland’s non-entitlement jurisdictions had about 1,667 large related low-income renter households in 2000. HUD estimates about 64 percent had housing problems. About 48 percent of these households paid more than 30 percent of their income for rent, and about 6 percent paid more than 50 percent of their income for rent. Other Low-Income Renter Households: There were about 4,638 "other" low-income households in Maryland’s non-entitlement jurisdictions in 2000. About 62 two percent have some sort of housing problem. Approximately 60 percent of these households paid more than 30 percent of their income for rent, and about 15 percent paid more than 50 percent of their income for rent.

13
Low-Income Homeowners Of the State's 25,363 low-income homeowner households in the State’s non-entitlement jurisdictions in 2000, about 51 percent had some sort of housing problem. About 49 percent of these households paid more than 30 percent of their income for housing, while an estimated 24 percent paid more than 50 percent of their income for housing. Elderly Homeowners: There were about 12,421 elderly low-income owner households in Maryland in Maryland’s non-entitlement jurisdictions in 2000. About 32 percent had some sort of housing problem. Approximately 31 percent of these households were paying more than 30 percent of their income for housing costs, and 15 percent were paying more than 50 percent of their income for housing costs. Small Households: There were about 7,631 low-income small homeowner households in Maryland’s non-entitlement jurisdictions in 2000. Of these, 67 percent had housing problems. About 66 percent of the households paid more than 30 percent of the income for housing costs, and about 31 percent paid more than 50 percent of their income for housing costs. Large Households; There were about 2,361 low-income owner-occupied households in Maryland in the year 2000. About 78 percent of them had housing problems, with about 70 percent of them paying more than 30 percent of income for housing costs, and about 33 percent paying more than 50 percent of their income for housing costs. All Other Owner Households: There were about 2,950 "other" low-income owner households in Maryland in 200. About 65 percent of these households had some sort of housing problem. Approximately 63 percent paid more than 30 percent of their income for housing costs, and 37 percent paid more than 50 percent of their income for housing costs. Differences by race among extremely low-income households An analysis of differences in housing problems by race between white and African-American households shows that there is little difference in need between renters and owners, or by age or family status across the State’s non-entitlement jurisdictions. This is illustrated in the table below:
Low-Income Households – Housing Problems by Race RENTERS White Renter Households Black/African-American Renter
Households Household Type
Elderly Family Other Total Elderly Family Other Total
Number of Households
3,288 5,631 3,416 12,335 433 2,392 971 3,796
Percent With Housing Problems
51.2 59.4 61.2 57.7 57.7 61.1 64.2 61.5

14
Low-Income Households – Housing Problems by Race (continued)
OWNERS White Owner Households Black/African-American Owner Households
Household Type
Elderly Family Other Total Elderly Family Other Total
Number of Households
11,273 8,234 2,498 22,005 933 1,523 318 2,834
Percent With Housing Problems
30.7 70.1 63.0 49.1 39.0 65.5 67.3 56.4
There were no significant differences in housing needs by race for low-income households. The one area where a difference starts to become pronounced is with elderly owner-occupied households, however, the difference is less than the ten percent threshold to be considered significant.
Moderate Income Households Maryland had about 304,113 moderate-income households in 2000. Moderate-income households are defined as those households earning more than 50 percent of median income, but less than 80 percent of median income. Of these 304,113 households, about 64,017 lived in Maryland’s non-entitlement jurisdictions. About 40 percent of these households have housing problems, with about 38 percent paying more than 30 percent of their income for housing, and about 9 percent paying more than 50 percent of their income for housing. Moderate-Income Renters Based on 2000 Census figures, Maryland had about 19,612 moderate-income renter households in the non-entitlement jurisdictions. HUD estimates 25 percent of these households had some sort of housing problem. About 20 percent of them paid more than 30 percent of their income for rent, and about 2 percent paid more than 50 percent of their income for rent. Below is a discussion of housing problems by family type for moderate-income renter households: Elderly Renters: Of the State's elderly moderate-income renter households (about 2,784 households in the non-entitlement jurisdictions), HUD estimates 31 percent had housing problems. About 30 percent paid more than 30 percent of their income for rent, and about 6 percent paid more than 50 percent of their income for rent. Small Related Renter Households: Maryland had about 8,678 small related moderate-income renter households in the State’s non-entitlement jurisdictions in 2000. About 21 percent of them had housing problems. About 17 percent of these households paid more than 30 percent of their income for rent, and about 1 percent paid more than 50 percent of their income for rent. Large Related Renter Households: Maryland’s non-entitlement jurisdictions had about 1,929 large related moderate-income renter households in 2000. HUD estimates about 37 percent had housing problems. About 8 percent of these households paid more than 30 percent of their income for rent. According to HUD data, none of these households paid more than 50 percent

15
of their income for rent. Other Moderate-Income Renter Households: There were about 6,221 "other" moderate-income renter households in Maryland’s non-entitlement jurisdictions in 2000. About 26 percent have some sort of housing problem. Approximately 27 percent of these households paid more than 30 percent of their income for rent, and about 2 percent paid more than 50 percent of their income for rent. Moderate-Income Homeowners Of the State's 64,017 moderate-income homeowner households in the State’s non-entitlement jurisdictions in 2000, about 35 percent had some sort of housing problem. About 32 percent of these households paid more than 30 percent of their income for housing, while an estimated 7 percent paid more than 50 percent of their income for housing. Elderly Homeowners: There were about 14,954 elderly moderate-income owner households in Maryland in Maryland’s non-entitlement jurisdictions in 2000. About 20 percent had some sort of housing problem. Approximately 20 percent of these households were paying more than 30 percent of their income for housing costs, and 6 percent were paying more than 50 percent of their income for housing costs. Small Households: There were about 18,801 moderate-income small homeowner households in Maryland’s non-entitlement jurisdictions in 2000. Of these, 49 percent had housing problems. About 47 percent of the households paid more than 30 percent of the income for housing costs, and about 11 percent paid more than 50 percent of their income for housing costs. Large Households; There were about 4,754 moderate-income owner-occupied households in Maryland in the year 2000. About 50 percent of them had housing problems, with about 42 percent of them paying more than 30 percent of income for housing costs, and about 7 percent paying more than 50 percent of their income for housing costs. All Other Owner Households: There were about 5,896 "other" moderate-income owner households in Maryland in 200. About 52 percent of these households had some sort of housing problem. This was primarily an issue of costs, as about 52 percent paid more than 30 percent of their income for housing costs, and 13 percent paid more than 50 percent of their income for housing costs. Differences by race among moderate-income households An analysis of differences in housing problems by race between white and African-American moderate-income households shows that there is generally little difference in need between renters and owners, or by age or family status across the State’s non-entitlement jurisdictions, with the exception of elderly households. This is illustrated in the table below:

16
Moderate-Income Households – Housing Problems by Race
RENTERS White Renter Households Black/African-American Renter Households
Household Type
Elderly Family Other Total Elderly Family Other Total
Number of Households
2,457 7,973 4,892 15,322 282 2,035 1,102 3,419
Percent With Housing Problems
33.0 22.2 24.5 24.7 15.6 22.0 28.7 23.6
OWNERS White Owner Households Black/African-American Owner Households
Household Type
Elderly Family Other Total Elderly Family Other Total
Number of Households
14,125 20,375 5,285 39,785 799 2,660 533 3,992
Percent With Housing Problems
19.7 48.7 52.1 38.9 26.0 50.6 55.3 46.3
The number of moderate-income white elderly households who are renters and have housing problems is more than double that of black/African-American households. Why housing problems for white elderly rental households of moderate income is higher is unclear, but the difference is significant. Otherwise, for all other breakdowns of renter and owner moderate-income households the difference in housing need by race is quite close, within no significant differences in housing problems.
Middle and Upper Income Households Maryland had about 1,248,184 middle and upper-income households in 2000. HUD defines Middle-income households are households that earn between 81 and 95 percent of median income. Households earning more than 96 percent of median income fall into HUD’s definition of Upper-income households. Of these households, about 264,245 lived in Maryland’s non-entitlement jurisdictions. About 10 percent of these households have housing problems, with about 9 percent paying more than 30 percent of their income for housing, and about 1 percent paying more than 50 percent of their income for housing. (NOTE: HUD did not break out data separately for these two income groups in the 2000 census, so they are discussed together.) Middle and Upper Income Renters Based on 2000 Census figures, Maryland had about 30,014 middle- and upper-income renter households in the non-entitlement jurisdictions. HUD estimates about 6 percent of these households had some sort of housing problem. About 2 percent of them paid more than 30 percent of their income for rent, but less than 1 percent paid more than 50 percent of their income for rent. Below is a discussion of housing problems by family type for moderate-income renter households:

17
Elderly Renters: Of the State's elderly middle- and upper-income renter households (about 3,099 households in the non-entitlement jurisdictions), HUD estimates 8 percent had housing problems. About 7 percent paid more than 30 percent of their income for rent, and about 3 percent paid more than 50 percent of their income for rent. Small Related Renter Households: Maryland had about 17,310 small related middle- and upper-income renter households in the State’s non-entitlement jurisdictions in 2000. About 4 percent of them had housing problems. About 1.4 percent of these households paid more than 30 percent of their income for rent, and less than one tenth of 1 percent paid more than 50 percent of their income for rent. Large Related Renter Households: Maryland’s non-entitlement jurisdictions had about 3,273 large related middle- and upper-income renter households in 2000. HUD estimates about 19 percent had housing problems. About 2 percent of these households paid more than 30 percent of their income for rent, and about 1 percent paid more than 50 percent of their income for rent. This means this is the only group by HUD’s data that have problems that are primarily related to problems such as overcrowding or physically substandard units rather than rent burdens. Other Renter Households: There were about 10,332 "other" middle- and upper-income renter households in Maryland’s non-entitlement jurisdictions in 2000. About 4 percent had some sort of housing problem. Approximately 2 percent of these households paid more than 30 percent of their income for rent, but less than one tenth of 1 percent paid more than 50 percent of their income for rent. Middle- and Upper-Income Homeowners Of the State's 230,232 moderate-income homeowner households in the State’s non-entitlement jurisdictions in 2000, about 10 percent had some sort of housing problem. About 9 percent of these households paid more than 30 percent of their income for housing, while an estimated 1 percent paid more than 50 percent of their income for housing. Elderly Homeowners: There were about 36,342 elderly middle- and upper-income owner households in Maryland in Maryland’s non-entitlement jurisdictions in 2000. About 8 percent had some sort of housing problem. These problems were most related to paying excessive rent, as 7.7 percent of these households were paying more than 30 percent of their income for housing costs, and 1.4 percent were paying more than 50 percent of their income for housing costs. Small Households: There were about 145,099 middle- and upper-income small homeowner households in Maryland’s non-entitlement jurisdictions in 2000. Of these, 10.3 percent had housing problems. About 9.8 percent of the households paid more than 30 percent of the income for housing costs, and about nine tenths of one percent paid more than 50 percent of their income for housing costs. Large Households; There were about 25,371 middle- and upper-income owner-occupied households in Maryland’s non-entitlement jurisdictions in the year 2000. About 13.5 percent of them had housing problems, with about 9.2 percent of them paying more than 30 percent of
18
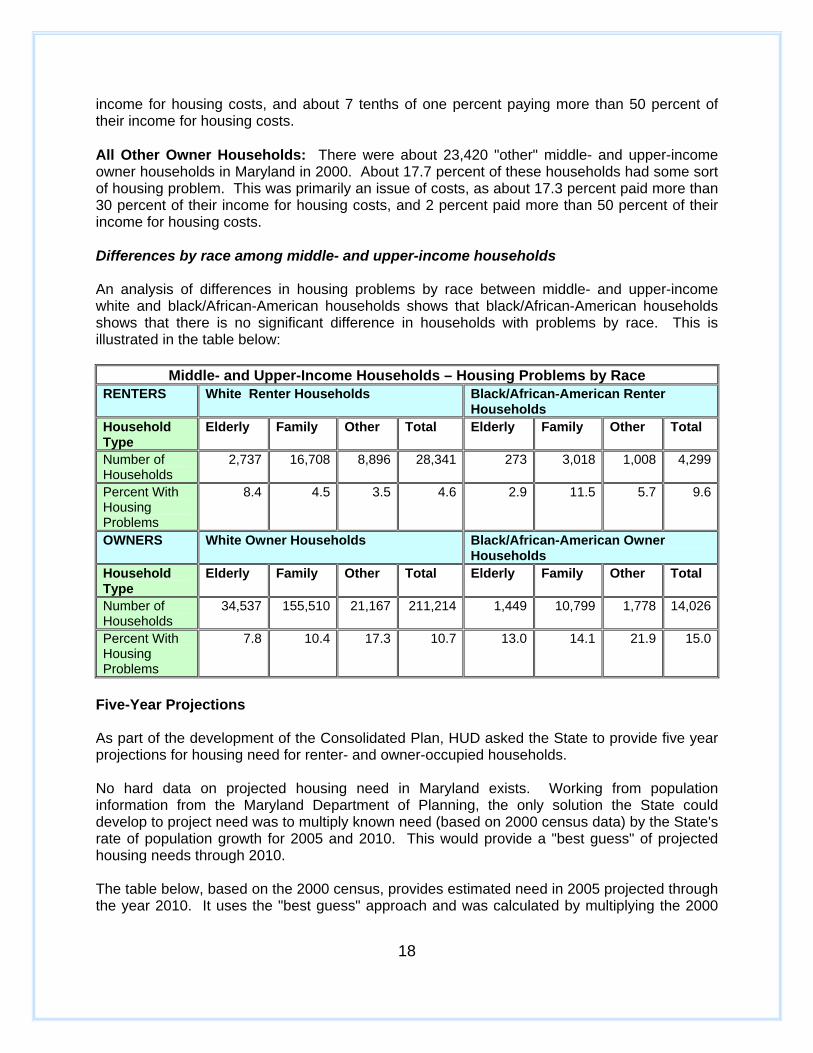
income for housing costs, and about 7 tenths of one percent paying more than 50 percent of their income for housing costs. All Other Owner Households: There were about 23,420 "other" middle- and upper-income owner households in Maryland in 2000. About 17.7 percent of these households had some sort of housing problem. This was primarily an issue of costs, as about 17.3 percent paid more than 30 percent of their income for housing costs, and 2 percent paid more than 50 percent of their income for housing costs. Differences by race among middle- and upper-income households An analysis of differences in housing problems by race between middle- and upper-income white and black/African-American households shows that black/African-American households shows that there is no significant difference in households with problems by race. This is illustrated in the table below:
Middle- and Upper-Income Households – Housing Problems by Race RENTERS White Renter Households Black/African-American Renter
Households Household Type
Elderly Family Other Total Elderly Family Other Total
Number of Households
2,737 16,708 8,896 28,341 273 3,018 1,008 4,299
Percent With Housing Problems
8.4 4.5 3.5 4.6 2.9 11.5 5.7 9.6
OWNERS White Owner Households Black/African-American Owner Households
Household Type
Elderly Family Other Total Elderly Family Other Total
Number of Households
34,537 155,510 21,167 211,214 1,449 10,799 1,778 14,026
Percent With Housing Problems
7.8 10.4 17.3 10.7 13.0 14.1 21.9 15.0
Five-Year Projections As part of the development of the Consolidated Plan, HUD asked the State to provide five year projections for housing need for renter- and owner-occupied households. No hard data on projected housing need in Maryland exists. Working from population information from the Maryland Department of Planning, the only solution the State could develop to project need was to multiply known need (based on 2000 census data) by the State's rate of population growth for 2005 and 2010. This would provide a "best guess" of projected housing needs through 2010. The table below, based on the 2000 census, provides estimated need in 2005 projected through the year 2010. It uses the "best guess" approach and was calculated by multiplying the 2000

19
Census/CHAS data provided by HUD against the State’s projected population growth of 5.93 percent between 2000 and 2005, and a projected growth rate of 10.57 percent between 2000 and 2010.
Projected Number of Households With Housing Problems In Maryland’s Non-entitlement Jurisdictions, 2000-2010
TENURE TYPE
HH TYPE HOUSING PROBLEM 2000 (Actual)
2005 (projected)
2010 (projected)
Cost Burden>30% 9,330 10,519 10,980Cost Burden>50% 3,894 4,100 4,306
Small Related
Substandard 1,012 1,073 1,119Cost Burden>30% 2,014 2,134 2,227Cost Burden>50% 791 833 875
Large Related
Substandard 1460 1546 1614Cost Burden>30% 6,487 6,872 7,173Cost Burden>50% 3,228 3,399 3,669
Elderly
Substandard 205 217 226Cost Burden>30% 7,978 8,451 8,821Cost Burden>50% 3,697 3,892 4,087
RENTERS
All Others
Substandard 665 704 735Cost Burden>30% 65,708 69,605 72,654Cost Burden>50% 21,690 22,840 23,983
OWNERS
Substandard 3,509 3,717 3,880Cost Burden >30% means households paying more than 30 percent of their income in rent. Cost Burden>50% means households paying more than 50 percent of their income in rent. Substandard housing means housing that is substandard only. Substandard housing is housing that is overcrowded (more than one person per room) or has an incomplete kitchen or bathroom.

20
NEEDS ASSESSMENT - PART II
HOMELESS NEEDS This part of the Consolidated Plan has three sub-parts dealing with homelessness. Sub-part one describes the needs of the sheltered and unsheltered homeless, the nature and extent of homelessness, the need for facilities and services for homeless individuals and homeless families with children, and to the extent available, information on homelessness by race and ethnic group. Sub-part two discusses sub-populations of the homeless, including persons who are (a) severely mentally ill only, (b) alcohol/other drug addicted only, (c) severely mentally ill and alcohol or other drug addicted, (d) fleeing domestic violence, (e) homeless youth, and (f) diagnosed with AIDS or related diseases. Sub-part three describes the needs and characters of low-income individuals and families with children, especially those with incomes below 30 percent of median income, who are currently housed but at risk of becoming homeless. Counting the number of people who are homeless is a difficult task. Sociologists and statisticians use many methods to measure homelessness. Because of the difficulty in counting the entire homeless population, the Consolidated Plan uses a combination of statistical studies and information from the Department of Human Resources (DHR), the State’s lead agency for solving homelessness, to try to obtain an understanding of homelessness in Maryland. Some of the statistical studies are old, however they are the best available. The information from the DHR is more recent. However, this information only reflects the number of persons who are homeless and were served by the shelter system. An assumption inherent in DHR's shelter survey is that duplication exists in the number of people served by shelters. If a person or family stays in more than one shelter in a year, they will be counted by each shelter. There exists no workable way to remove this duplication. However, if a person or family stays in the same shelter in January, and then returns in September, that person or family is counted only once. Based on the most recent non-duplicative study of homelessness we have in Maryland (undertaken in 1992 – a study was taken by DHR earlier this year, for which results are still being compiled for incorporation into their 10 year Plan to end homelessness), approximately 27,561 persons in Maryland were homeless for at some point during the year. This number was obtained by using a count of homeless children made by the Maryland State Department of Education (MSDE), formulas prepared by the Urban Institute, and information from a study by Johns Hopkins University. Based on the Hopkins study (and national studies), homeless children represent about 32 percent of all the homeless in Maryland. Using that ratio, there are about 22,591 sheltered homeless in Maryland. According to the Urban Institute, the unsheltered homeless account for about 22 percent of all the homeless. Therefore, multiplying the sheltered homeless by 22 percent, there are about 4,950 unsheltered homeless in Maryland, or a total of about 27,561 homeless people in Maryland. Studies by the Urban Institute allow us to make estimates of the number of homeless persons with severe mental illness (only), alcohol or other drug abuse problems (only), or who have both mental illness and alcohol or other drug abuse problems. In addition,

21
the Urban Institute has also done estimates on the number of persons who are homeless due to domestic violence, are homeless youth, or who have AIDS/HIV and related diseases. The table below provides a profile of the homeless in Maryland:
State of Maryland Estimated Homeless Population
Homeless Population Sheltered Unsheltered Total Number of Homeless Families 3,343 735 4,079Number of Persons in Homeless Families 9,262 2,038 11,300
Youth (17 years or younger) 7,234 0 7,234Adult (18 years and older) 15,357 4,970 20,327Total 22,581 4,970 27,561Sub-populations of homeless persons with severe needs related to:
Percent Sheltered
Percent Unsheltered
Severe Mental Illness (SMI) only 12% 8% Alcohol/other drug abuse only 19% 34% SMI & Alcohol/other drug abuse 8% 13% Domestic violence 13% 0% Homeless youth 1% 1% AIDS/related disease 15% 15%
More recently, the Department of Human Resources collected homeless data for State Fiscal Year (SFY) 2003 from all known providers of homeless services. Each year from 99 to 100 percent of all providers respond to DHR's data collection survey. The data results included the number of people receiving shelter, either through emergency shelter, transitional housing or motel placements. Based on that survey, 45,560 people were served in shelter programs in Maryland, which includes some duplication as homeless persons may have used multiple shelters during the course of the year. The number of people served in FY 2003 represents a 14% decrease from those served in FY 2002. However, the DHR survey also showed that 47,190 persons were turned away from shelter at some point, an increase of 14% over the previous year. Further, some shelters do not collect information on turnaways. It is also unknown how many people turned away could not find shelter at all, or found assistance at other facilities. The State has more transitional housing beds for the homeless than shelter beds. In FY 2003, the State had 2,486 shelter beds, and 2,739 transitional housing beds. (An additional 435 beds were undesignated as emergency or transitional beds). DHR reports that this represents a reduction in beds from FY 2002, as eleven shelters closed between 2002 and 2003. The average stay in an emergency shelter was 33 days, and the average stay in transitional housing was 121 days.
Sheltered Homeless The information below is from DHR’s 2003 report on homelessness in Maryland. Not all shelters provide demographic information on the complete range of demographic data

22
for homeless persons, so the numbers do not match between age, gender, ethnicity, and family status. Nonetheless, the study provides a good profile of the sheltered homeless in Maryland. Race/Ethnicity of Sheltered Homeless Overall, the majority of sheltered homeless persons were primarily African-American. In the State’s non-entitlement jurisdictions, the homeless were primarily white. Hispanics made up a relatively small number of homeless persons overall, except in Kent, Talbot and Montgomery Counties, where the Hispanic homeless population was about 14 percent of the homeless population overall. In Kent and Talbot County this is probably due to the presence of agricultural workers, while in Montgomery County it is somewhat more reflective of the changing demographics of that jurisdiction.
Department of Human Resources Ethnicity of Homeless Persons - SFY 2003
Jurisdiction White African-American Hispanic Other Unknown Allegany 372 43 7 18 0Anne Arundel 490 525 28 34 11Baltimore City 3,284 18,556 415 176 467Baltimore County 418 1,056 41 22 1Calvert 199 109 9 11 26Caroline 54 20 2 5 0Carroll 332 67 11 5 2Cecil 276 76 14 2 47Charles 312 491 18 24 0Dorchester 62 73 6 1 0Frederick 704 407 90 14 149Garrett 138 1 1 0 0Harford 323 218 25 38 7Howard 206 455 28 24 0Kent 5 5 2 0 0Montgomery 718 2,484 580 163 209Prince George's 215 1,768 84 54 0Queen Anne's 0 0 0 0 0Saint Mary's 234 316 7 7 0Somerset 11 7 0 0 0Talbot 9 15 4 0 0Washington 1,571 768 59 6 75Wicomico 191 167 28 3 0Worcester 240 182 3 4 0TOTAL 10,364 27,809 1,462 611 994Non-Entitlements Only 4,710 2,747 261 100 299

23
Family Demographics of Sheltered Homeless The Familial status of homeless persons also differs between urban areas and rural areas. Overall, about 69 percent of all homeless are individuals. However, in the non-entitlement areas, there is almost a 50-50 split between homeless individuals and persons in families.
Department of Human Resources Family Status of Homeless Persons – SFY 2003
Jurisdiction IndividualsFamily
Members % Individuals % Family Members
Allegany 233 207 52.95% 47.05%Anne Arundel 429 751 36.36% 63.64%Baltimore City 21,321 2,455 89.67% 10.33%Baltimore County 492 987 33.27% 66.73%Calvert 168 193 46.54% 53.46%Caroline 0 81 0.00% 100.00%Carroll 1,206 189 86.45% 13.55%Cecil 355 408 46.53% 53.47%Charles 214 631 25.33% 74.67%Dorchester 110 32 77.46% 22.54%Frederick 652 717 47.63% 52.37%Garrett 46 66 41.07% 58.93%Harford 672 463 59.21% 40.79%Howard 100 613 14.03% 85.97%Kent 8 4 66.67% 33.33%Montgomery 1,857 2,487 42.75% 57.25%Prince George's 776 1,081 41.79% 58.21%Queen Anne's 0 0 0.00% naSaint Mary's 204 360 36.17% 63.83%Somerset 9 9 50.00% 50.00%Talbot 43 23 65.15% 34.85%Washington 1,042 1,437 42.03% 57.97%Wicomico 499 574 46.51% 53.49%Worcester 328 101 76.46% 23.54%TOTAL 30,764 13,869 68.93% 31.07%Non-Entitlements Only 5,117 5,032 50.42% 49.58%
Age of Homeless Persons Similar to the differences found between urban and non-urban areas for ethnicity and family status, the age of persons who are homeless differs between these areas as well. When all areas of the State are examined, most homeless persons are over 31. However, when only the non-entitlement jurisdictions are examined, the majority of homeless persons are under 30. This is reflective of the fact that there are substantially

24
more homeless families in the rural areas who have children. The table below shows the age breakdown of homeless persons by county:
Department of Human Resources Age of Homeless Persons – SFY 2003
Jurisdiction 0-17 18-30 31-60 61+Allegany 124 97 202 17Anne Arundel 477 227 459 17Baltimore City 2,047 3,423 17,275 623Baltimore County 669 326 493 12Calvert 119 85 141 10Caroline 40 26 14 1Carroll 113 203 525 61Cecil 227 147 409 20Charles 394 152 298 6Dorchester 16 28 93 5Frederick 408 258 427 18Garrett 35 28 70 6Harford 213 180 217 1Howard 120 281 71 3Kent 2 2 8 0Montgomery 1,456 707 1,633 86Prince George's 962 356 799 15Queen Anne's 0 0 0 0Saint Mary's 243 70 234 17Somerset 4 6 8 0Talbot 9 18 32 7Washington 759 574 566 92Wicomico 196 89 105 5Worcester 80 90 239 20TOTAL 8,713 7,373 24,318 1,042Non-Entitlements Only 2,769 1,873 3,371 285
Gender of Homeless Persons The majority of homeless persons in Maryland are male, although the percentages vary greatly by County. This may be a reflection of whom shelters serve, rather than who is actually homeless. For example, if a county has more shelters for men than women, their shelter reports will echo who they serve. It is interesting to note, however, that if Baltimore City is taken out of the equation, there is almost an even spilt between homeless men and women, which would represent 52 and 48 percent of the homeless population respectively.

25
Department of Human Resources
Gender of Homeless Persons – SFY 2003 Jurisdiction Men Women Percent men Percent WomenAllegany 212 120 63.86% 36.14%Anne Arundel 311 392 44.24% 55.76%Baltimore City 19,578 4,440 81.51% 18.49%Baltimore County 287 581 33.06% 66.94%Calvert 92 148 38.33% 61.67%Caroline 4 37 9.76% 90.24%Carroll 1,154 125 90.23% 9.77%Cecil 271 237 53.35% 46.65%Charles 149 303 32.96% 67.04%Dorchester 95 31 75.40% 24.60%Frederick 519 435 54.40% 45.60%Garrett 59 45 56.73% 43.27%Harford 466 349 57.18% 42.82%Howard 115 240 32.39% 67.61%Kent 4 8 33.33% 66.67%Montgomery 1,437 1,467 49.48% 50.52%Prince George's 412 764 35.03% 64.97%Queen Anne's 0 0 0.00% naSaint Mary's 165 167 49.70% 50.30%Somerset 5 9 35.71% 64.29%Talbot 15 13 53.57% 46.43%Washington 1,140 820 58.16% 41.84%Wicomico 21 178 10.55% 89.45%Worcester 244 149 62.09% 37.91%TOTAL 26,755 11,058 70.76% 29.24%Non-Entitlements Only 4,149 2,825 59.49% 40.51%
Sub-populations -- Sheltered Persons With Special Needs Obtaining information on homeless persons with special needs -- mental illness, alcohol or other drug addictions, persons fleeing domestic violence, homeless youth, or persons with AIDS or related diseases is extremely difficult. The shelter providers who responded to the Hopkins' study estimated that 12 percent of the homeless population served had a mental illness. The survey also asked about drug addiction, and shelter providers responded that 19 percent of those sheltered had an alcohol or drug addiction. It also asked about domestic violence, and shelter providers responded that 13 percent of the homeless persons in shelters were fleeing domestic violence. These numbers are consistent with the Urban Institute's data on the homeless with special needs. The number of homeless youth (less than one percent) was determined by looking at the population served. The only two areas the Hopkins study did not ask information about were homeless persons with AIDS or related diseases, and persons who suffered from mental illness

26
and had a drug or alcohol addiction at the same time. The 15 percent number is based on information provided by the National Commission on AIDS, and is considered by HUD a reputable figure that can be used in Maryland. The eight percent quoted for persons who have both a mental illness and have an alcohol or drug addiction is from the Urban Institute, and is also considered a reputable figure that can be used in Maryland. More recent estimates on the homeless with special needs come from the Department of Health and Mental Hygiene. The Alcohol and Drug Abuse Administration (ADAA) of the Department of Health and Mental Hygiene provides services to individuals and their families on both an in-patient and outpatient basis. The table below shows the number of persons that were admitted to certified substance abuse programs during State fiscal year 2004 (July 1, 2003-June 30, 2004) that indicated their living situation as homeless.
Department of Health and Mental Hygiene Alcohol and Drug Abuse Administration
ASAM* Levels of Care Number of Programs Number of Clients Admitted During FY 2004 with Living Situation as
Homeless Level I (Outpatient) 238 760Level I (Medicated Assisted) 46 132Level II.I (Intensive Outpatient) 18 1142Level III.I (Halfway House) 39 493Level III.3 (Long Term) 7 243Level III.5 (Therapeutic Community)
9 66
Level III.7 (Medically Monitored Inpatient – ICF)
20 1126
Detoxification 1059 Total 377 5,021
*ASAM (American Society of Addiction Medicine) The Developmental Disabilities Administration considers individuals who do not have control over their housing situation, including those who live in supportive housing such as group homes or alternative living units are being at risk of homelessness. Given that, they indicate there are potentially 4,783 individuals receiving services through DDA who are at risk for homelessness. (See the more detailed discussion of housing needs for persons with developmental disabilities in Section III of this part of the Plan.) The Mental Hygiene Administration (MHA) of DHMH is developing Evidence Based Practice projects in the area of Assertive Community Treatment (ACT). The goal is to provide a team approach to intensive treatment and case management for individuals with severe and persistent mental illness. These individuals may be homeless or living in temporary living situations. Safe, stable and affordable housing is a key component to a successful outcome in this project. (See the more detailed discussion of housing needs for persons with mental illness in Section III of this part of the Plan.)

27
Unsheltered Homeless
Based on information developed using formulas from the Urban Institute, there are about 4,950 non-sheltered homeless people in Maryland. This is based on 1990 census statistics, and is the best available data we currently have. (The Census Bureau did not collect information on the unsheltered homeless in 2000. DHCD also reviewed the Continuums of Care of homeless services providers to get better data on the homeless, however these primarily focused on persons with chronic homelessness so only estimates for that group were available. A point in time survey conducted by DHR in January 2005 may provide more current information once compilation of the data is completed. However, DHR states compilation of the data is will not be completed before the summer of 2005 at the earliest, after the Consolidated Plan is due to be submitted to HUD.) Race/Ethnicity of Unsheltered Homeless The only data we have on ethnicity of the unsheltered homeless is from 1990 census data (again, the Census bureau did not collect this information in Census 2000). Based on the census data, about 62 percent of the unsheltered homeless were African-American. About 35 percent were White, and the remaining three percent Hispanic or "other". Special Needs of Unsheltered Homeless There is no data available to Maryland that HUD will accept, other than national data, which looks at non-sheltered homeless persons with special needs. Based on information compiled by the Urban Institute, eight percent of all non-sheltered homeless persons have a severe mental illness only, 34 percent have an alcohol or other drug addiction, and 13 percent have a severe mental illness and alcohol and drug addiction problem at the same time. The Urban Institute also estimates that less than one percent of all the homeless are runaway youth. The National Commission on AIDS is the source for the 15 percent of homeless persons with AIDS or related diseases, and no known organization keeps statistically correct information on the number of non-sheltered homeless persons who are victims of domestic violence.
Needs of Persons Threatened With Homelessness Persons threatened with homelessness are generally described as persons or households who earn 30 percent of median income or less and pay more than 50 percent of their income for rent. As noted earlier, According to the 2000 census, there were about 143,865 extremely low-income renter households in Maryland who earn between 0-30 percent of median income. Fifty-four percent of those households paid more than 50 percent of their income for rent, and 70 percent paid more than 30 percent of their income for rent. In the State’s non-entitlement areas, there were 18,797 renters in this income group, 48 percent of whom paid more than 50% of their income in rent and 66 percent who paid more than 30 percent of their income in rent.

28
Of those 18,797 households, about 7,400 are family households with children present. About 6,101 of these family households were small families (two to four people), and about 1,286 households were large families (five or more people). An estimated 51.6 percent of small family households were paying more than 50 percent of their income for rent, and about 51.2 percent of the large family households were paying more than 50 percent of their income for rent. These are the families most at risk of becoming homeless.

29
Housing Needs - Part III
PERSONS WITH SPECIAL NEEDS The special needs population consists of persons with severe mental illness, persons who are developmentally disabled, persons who are physically disabled, persons with alcohol and other drug addictions, persons with AIDS and related diseases, and the frail elderly. People with disabilities are among the poorest residents in Maryland. According to the Social Security Administration 75,443 people with disabilities in Maryland received SSI as their primary income source in 2003. People receiving SSI currently receive $6,984 annual income, which places them at 15% of median income in Maryland. According to the National Low-Income Housing Coalition’s report Priced Out, the housing wage in Maryland was $14.10 per hour in 2002. According to the report, a person would need to spend 134.5% of their SSI income to afford a one bedroom unit in Maryland. People receiving SSI do not represent the whole picture, however. Hundreds of people with disabilities receive Medicaid, but not SSI. These individuals also fall into the below poverty level income category. Finally, working people with disabilities also fall into low income groups. The Department of Health and Mental Hygiene provides a wide array of services to thousands of Marylanders with disabilities, including persons with mental illness, developmental disabilities and HIV/AIDS. Services are typically provided in institutions, nursing homes, group homes, assisted living facilities, transitional housing sites, service recipient’s homes or family homes including foster care. The need for supportive housing for this population is great. Low income people with disabilities have among the most difficult time locating housing that is affordable, which is defined at comprising no more than 30% of monthly income. In addition, people with disabilities may need affordable housing that is also accessible. Creating housing at 30% of average monthly income, combined with government subsidized rental assistance, is critical to meeting the housing needs of people with disabilities. In describing the need for affordable housing for people with disabilities in Maryland, several sources of demographic information were accessed. These sources included the Social Security Administration, the Technical Assistance Collaborative, the National Low Income Housing Coalition, and the Governor’s Commission on Housing Policy typology, which is based on 2000 Census date as well as several other sources. Maryland’s population in 2000 was 5,296,486, and 18% of the Maryland population, or 850,620 age 5 years or older, were identified as having a disability. Disability status is self-identified in the Census. Persons with disabilities fill out their census forms to report if they have physical, sensory, self-care, or mental disabilities. (Mental disabilities are not mental illnesses, rather they are typically learning disabilities such as ADD, problems remembering, etc.) Of the 850,620 persons identified with disabilities in 2000, 175,583 lived in the State’s non-entitlement jurisdictions (including those with “mental” disabilities). Of the population whose disability had a significant impact on their physical living conditions, 26,902 persons had a physical disability, 22,646 had a self-care

30
disability and 13, 658 had a sensory disability. The map below provides information by census tract on where these individuals live:
GarrettGarrett
DorchesterDorchester
KentKent
CharlesCharles
CecilCecil
TalbotTalbot
FrederickFrederick
WorcesterWorcester
CarrollCarroll
SomersetSomerset
Saint Mary'sSaint Mary's
AlleganyAllegany
CalvertCalvert
WicomicoWicomico
WashingtonWashington
CarolineCaroline
QueenQueenAnne'sAnne's
Percent of Individuals with a Disability by Census Tract1 for theTotal Civilian Noninstitutionalized Population 5 years and over
(excluding entitlement areas)
Allegany Calvert Caroline Carroll Cecil Charles Dorchester Frederick Garrett Kent Queen Anne's Saint Mary's Somerset Talbot Washington Wicomico Worcester Maryland
46,721 68,553 27,570
138,549 79,151
108,881 28,499
131,213 27,509 17,942 37,491 76,604 20,188 31,623 81,721 56,118
43,569 1,021,902
8,782 10,925 5,642
20,411 14,486 18,133 6,532
17,983 5,499 3,687 6,441
11,724 4,985 6,093
14,897 10,209
9,154 175,583
18.8 15.9 20.5 14.7 18.3 16.7 22.9 13.7 20.0 20.5 17.2 15.3 24.7 19.3 18.2 18.2
21.0 17.2
JurisdictionTotal
PopulationPop. with aDisability
Percentw/Disability
Data Source: U.S. Census Bureau, Census 2000, Summary File 3, Table PCT26 - Sex by Age by Types of Disability for the Civilian Noninstitutionalized population 5 years and over
All totals and derived calculations exclude data (i.e. disability populationvalues) located in entitlement areas.
Census tracts located in both entitlement and non-entitlement areas have been split,so that only data in non-entitlement areas were used to calculate percentages.
1
<= 17.0%, the census tract mean
17.1% - 23.4% (1 SD above mean)
23.5% - 29.8% (2 SD above mean)
29.9% - 36.2% (3 SD above mean)
>= 36.3% (4 SD above mean, 40.8% max. value)Entitlement Areas(data in entitlement areas omitted from analysis)
The Department of Health and Mental Hygiene (DHMH) provides a wide variety of services for people with disabilities in Maryland. These services are administered through the Aids Administration, the Developmental Disabilities Administration, and the Mental Hygiene Administration.
PERSONS WITH ALCOHOL AND/OR DRUG ABUSE The Alcohol and Drug Abuse Administration (ADAA) of DHMH funds and regulates programs for substance abuse research, training, prevention and rehabilitation in cooperation with federal, state and local agencies. ADAA provides ASAM Level of Care through the following levels: Level I (Outpatient), Level I (Medicated Assisted), Level II.I (Intensive Outpatient), Level III.I (Halfway House), Level III.3 (Long Term), Level III.5 (Therapeutic Community), Level III.7 (Medically Monitored Inpatient – ICF), detoxification at all levels of care and prevention. ADAA does not have information on housing needs for persons with Alcohol and/or Drug Abuse except for those who have these problems and are homeless. (That information is addressed in the previous section of the Plan on homeless needs.)
PERSONS WITH HIV/AIDS The mission of the AIDS Administration of DHMH is to decrease disability and death due to AIDS be reducing HIV and to help Marylanders already infected to live longer and

31
better lives. This is accomplished by monitoring the spread of the epidemic and its impact on populations within the State, controlling the spread of HIV infection in Maryland, and reducing morbidity and mortality associated with HIV. The Administration consults and coordinates its work with 24 local health departments of part of this effort. There were over 20,000 persons in Maryland living with HIV or AIDS in 2003. The table below shows the number of persons with HIV/AIDS in Maryland by County.
HIV/AIDS in Maryland Jurisdiction Persons with HIV Persons with AIDS HIV/AIDS Allegany 24 21 45Anne Arundel 281 326 607Baltimore City 6,583 5,425 12,008Baltimore County 760 689 1,449Calvert 34 32 66Caroline 22 17 39Carroll 85 31 116Cecil 30 41 71Charles 86 75 161Dorchester 46 46 92Frederick 88 79 167Garrett 4 3 7Harford 111 137 248Howard 100 119 219Kent 13 13 26Montgomery 695 898 1,593Prince George's 1,501 1,707 3,208Queen Anne's 12 20 32Saint Mary's 24 33 57Somerset 33 16 49Talbot 19 29 48Washington 105 79 184Wicomico 112 76 188Worcester 37 30 67Total under State Service Area
439 363 802
TOTAL 10,805 9,942 20,747 While the number of persons with HIV/AIDS is important, it is also important to know the prevalence rates based on the population. This is because while a jurisdiction has a low number of persons with HIV/AIDS, it may represent a significant proportion of the population. For example, looking at HIV Prevalence by jurisdiction, the top five counties with the highest HIV rates per population in order were Baltimore City, Prince George’s County, Dorchester County, Somerset County and Wicomico County. This demonstrates that while the disease is concentrated in urban areas, there are highly disproportionate concentrations of cases in specific urban, suburban, and rural regions of the State. In addition, underserved populations, especially women and minorities, are heavily represented in the rural AIDS cases.

32
Of the reported cases in rural Maryland, twenty-six percent are women. Sixty-five percent of the cases occur among minorities. In addition, the Eastern Shore counties and St. Mary’s County have a large seasonal migrant population. The table below shows HIV and AIDS prevalence rates by County:
HIV Prevalence Rates Based on Population Jurisdiction HIV Prevalence AIDS Prevalence HIV/AIDS PrevalenceAllegany 32.0 28.0 60.0Anne Arundel 57.3 66.5 123.9Baltimore City 1,010.9 833.1 1,844.1Baltimore County 100.7 91.3 192.1Calvert 45.5 42.9 88.5Caroline 73.8 57.1 130.9Carroll 56.3 20.5 76.8Cecil 34.9 47.7 82.6Charles 71.3 62.2 133.5Dorchester 149.9 149.9 299.9Frederick 45.0 40.4 85.5Garrett 13.4 10.0 23.4Harford 50.7 62.6 133.4Howard 40.3 48.0 88.3Kent 67.7 67.7 135.4Montgomery 79.5 102.8 182.4Prince George's 187.2 212.9 400.2Queen Anne's 29.5 49.3 78.8Saint Mary's 27.8 38.2 66.1Somerset 133.3 64.6 198.0Talbot 56.1 85.7 141.9Washington 79.5 59.8 139.4Wicomico 132.3 89.7 222.1Worcester 79.4 64.4 143.9 Housing assistance for persons with HIV/AIDS is provided based on metropolitan (and non-metropolitan) service areas through the Housing Opportunities With AIDS (HOPWA) program. In Maryland, there are four metropolitan service areas which help provide housing assistance to persons with HIV/AIDS, including the Washington, D.C., which assists persons living in Prince George’s, Charles, and Calvert Counties; Baltimore City, which helps persons living in the City as well as Anne Arundel, Baltimore, Carroll, Harford, Howard, and Queen Anne’s County’s; the City of Gaithersburg, which serves Frederick and Montgomery Counties; and Wilmington, Delaware, which serves Cecil County. The State of Maryland serves the remaining counties, including Allegany, Caroline, Dorchester, Garrett, Kent, Saint Mary’s, Somerset, Talbot, Washington, Wicomico, and Worcester. The map below shows HOPWA service areas in Maryland:

33
Dorchester HIV Cases: 46
AIDS Cases: 46________________Total Cases: 92
Saint Mary's HIV Cases: 24
AIDS Cases: 33________________Total Cases: 57
Worcester HIV Cases: 37
AIDS Cases: 30________________Total Cases: 67
Baltimore HIV Cases: 760
AIDS Cases: 689________________Total Cases: 1,449
Frederick HIV Cases: 88
AIDS Cases: 79________________Total Cases: 167
Garrett HIV Cases: 4
AIDS Cases: 3________________Total Cases: 7
Charles HIV Cases: 86
AIDS Cases: 75________________Total Cases: 161
Somerset HIV Cases: 33
AIDS Cases: 16________________Total Cases: 49
Anne Arundel HIV Cases: 281
AIDS Cases: 326________________Total Cases: 607
Harford HIV Cases: 111
AIDS Cases: 137________________Total Cases: 248
Montgomery HIV Cases: 695
AIDS Cases: 898________________Total Cases: 1,593
Queen Anne's HIV Cases: 12
AIDS Cases: 20________________Total Cases: 32
Talbot HIV Cases: 19
AIDS Cases: 29________________Total Cases: 48
Washington HIV Cases: 105AIDS Cases: 79________________Total Cases: 184
Carroll HIV Cases: 85
AIDS Cases: 31________________Total Cases: 116
Allegany HIV Cases: 24
AIDS Cases: 21________________Total Cases: 45
Prince George's HIV Cases: 1,501
AIDS Cases: 1,707________________Total Cases: 3,208
Cecil HIV Cases: 30
AIDS Cases: 41________________Total Cases: 71
Kent HIV Cases: 13
AIDS Cases: 13________________Total Cases: 26
Wicomico HIV Cases: 112AIDS Cases: 76________________Total Cases: 188
Calvert HIV Cases: 34
AIDS Cases: 32________________Total Cases: 66
Caroline HIV Cases: 22
AIDS Cases: 17________________Total Cases: 39
Howard HIV Cases: 100
AIDS Cases: 119________________Total Cases: 219
Baltimore City HIV Cases: 6,583
AIDS Cases: 5,425________________Total Cases: 12,008
HIV/AIDS Cases in 2003 by CountyCounties shown by HOPWA Region
pub. date: 04/01/2005
Data Source: HIV/AIDS data provided by the Maryland Department of Health and Mental Hygiene (DHMH) - Maryland AIDS Administration
HOPWA Region (only MD portions displayed)
BaltimoreGaithersburg
Washington
WilmingtonState of Maryland
Statewide Total
HIV
7,932
783
1,621
30439
10,805
AIDS
6,747
977
1,814
41363
9,942
TOTAL
14,679
1,760
3,435
71802
20,747
A key problem facing rural communities is the lack of affordable housing. Maryland’s Rural Housing Opportunities for People With AIDS (HOPWA) Initiative seeks to prevent housing instability in low-income persons with HIV/AIDS in eleven rural counties by combining rental assistance with supportive services, such as case management. However HOPWA formula funds suffice only for tenant-based rental assistance, with PLWHA turning to Ryan White-funded programs for case management and other supportive and medical services. In order to assess community needs and allocate HOPWA funds across the eligible areas, the program undertook a GIS mapping analysis of eleven rural counties to identify areas that may have unmet need for HIV-related housing assistance. 262 rural HOPWA program participants as of 2003 were analyzed by zip code of residence using HIV/AIDS surveillance data for 2003 and US Census data for 2000. The mapping analysis included the following independent variables, stratified by zip code:
Median Household Income Percent in Poverty Percent with Public Assistance Income Median Expenses: Mortgage Median Expenses: No Mortgage Median Rent Rent as Percent of Median Household Income Percent White Percent African-American

34
Percent Other Race/Ethnicity Percent of Housing Owner Occupied Percent of Housing Renter Occupied Percent Vacant Housing Percent of Vacant Housing up for Rent
The result of the analysis found that the models do not do a good job of predicting the ratio of HOPWA participants to HIV/AIDS cases. However, other factors can mitigate a need for housing assistance, such as availability of other housing subsidies in that county, such as Section VIII, and/or degree of family-provided housing support for persons living with HIV/AIDS. The models do a good job of predicting the number of HOPWA participants. Zip codes with higher proportions of African-American residents and/or of renter occupied housing units did have slightly higher numbers of HOPWA program participants. However, the largest predictor of HOPWA participants per county is the number of living HIV/AIDS cases. Taken together, the findings suggest that HOPWA program participation generally occurs in proportion to the number of cases of HIV/AIDS in a geographic area. Therefore HIV/AIDS prevalence in the participating counties is the best indicator for need for HOPWA services (see table below). The eleven counties served by the Rural HOPWA Program account for 46% of the State’s territory and over 11% of the population, according to the 2000 Census. The Eastern Region (Caroline, Cecil, Dorchester, Kent, Queen Anne’s, Somerset, Talbot, Wicomico, and Worcester Counties) reported 3% of all living cases. The Western Region (Allegany, Frederick, Garrett, and Washington Counties) reported 2% of all living HIV and AIDS cases and the Southern Region (Calvert, Charles, and Saint Mary’s Counties) contributed 1% of all living HIV and AIDS cases.
HOPWA Participants per HIV/AIDS Case1.01 – 2.000.51 – 1.000.26 – 0.500.00 – 0.25
HOPWA Participants per HIV/AIDS Case by County
35
Rural AIDS Program 5-Year Strategy Consistent with the three goals of the national HOPWA program, the Maryland Rural HOPWA Program goals are:
Help clients to maintain housing stability Help clients to avoid homelessness Improve access to HIV treatment and other healthcare.
Given the limited HOPWA funds, the program’s overall objective is to maintain a stable number of households in the HOPWA Program. With attrition, such as when households are successfully moved to a more long-term housing subsidy, such as Section VIII or clients’ income increases past the threshold for HOPWA eligibility, new clients will be brought into the program. There is not sufficient HOPWA funding for short-term rent, mortgage and utility assistance and supportive services. However, close collaboration with Ryan White funded HIV/AIDS programs at the local health departments ensures HOPWA clients access to case management, primary medical care and emergency financial assistance.
PERSONS WITH DEVELOPMENTAL DISABILITIES A developmental disability is a condition attributable to a mental or physical impairment that results in substantial functional limitations in major life activities and which is likely to continue indefinitely. Examples include autism, blindness, cerebral palsy, deafness epilepsy, mental retardation, and multiple sclerosis. The mission of the Developmental Disabilities Administration (DDA) is to provide leadership to assure the full participation of individuals with developmental disabilities and their families in all aspects of community life. In addition, DDA's goal is to promote their empowerment to access quality supports and services necessary to foster personal growth, independence and productivity. DDA is committed to enabling all individuals with developmental disabilities to exercise the four principles of self-determination:
Freedom to make choices Authority over services and support Responsibility for organizing resources, and Supports necessary to live in the community.
The DDA provides a coordinated service delivery system so that individuals with developmental disabilities receive appropriate services oriented toward the goal of integration into the community. These services are provided through a combination of four state residential centers (providing services to individuals with mental retardation) and a wide array of community based services delivered primarily through a network of non-profit providers.
The DDA takes the leadership role in building partnerships and trust with families, providers, local and state agencies, and advocates to assure that individuals with developmental disabilities and their families have access to the resources necessary to

36
foster growth, including those available to the general public. Because of our inherent belief in the rights and dignity of the individual, DDA is committed to:
The empowerment of all individuals with developmental disabilities and their families to choose the services and supports that meet their needs.
The integration of individuals with developmental disabilities into community life to foster participation.
The provision of quality supports, based on consumer satisfaction that maximizes individual growth and development.
The establishment of a fiscally responsible, flexible service system that makesthe best use of the resources that the citizens of Maryland have allocated for serving individuals with developmental disabilities.
An individual is eligible for a full range of services if he/she has a severe chronic disability that:
Is attributed to a physical or mental impairment, other than the sole diagnosis of mental illness, or to a combination of mental and physical impairments;
Is manifested before the individual attains the age of 22; Is likely to continue indefinitely; Results in the inability to live independently without external support or
continuing and regular assistance; Reflects the need for a combination and sequence of special, interdisciplinary, or
generic care, treatment, or other services that are planned and coordinated for that individual. (Health General 7-101[e])
An individual is eligible only for support services if he/she has a severe chronic disability that:
Is attributed to physical or mental impairment, other than the sole diagnosis of mental illness, or to a combination of mental and physical impairments.
Is likely to continue indefinitely. Services The Developmental Disabilities Administration provides a coordinated service delivery system so that individuals with developmental disabilities receive appropriate services oriented toward the goal of integration into the community. This wide array of community based services is delivered primarily through a network of non-profit providers (approximately 22,000 individuals served by more than 170 providers). Services are obtained by contacting one of the regional offices of DDA. Individuals must apply for and be determined eligible for DDA services. Types of Services: Respite: Respite services are short-term, temporary care provided to an individual in their home or outside their home designed to give the primary caregiver(s) a break from their care giving duties.

37
Family Support Services: These services are designed to help families stay together. Families with children with developmental disabilities typically experience emotional, physical and financial demands because the care and attention their children require tends to be intensive and indefinite. Family Support services are flexible and responsive to what the family needs, when they need it. Residential Services: These are designed to provide a variety of support services to adults with disabilities in their living situation. People are typically supported in a home owned by an agency that provides residential services. Some people live alone and others choose to live with other people to share expenses and/or companionship. Community Supported Living Arrangements: Community Supported Living Arrangements (CSLA) provide individuals with the support necessary to enable them to live in their own homes, apartments, family homes, or rental units. Community Supported Living Arrangements provide a full range of community based supports, and may utilize friends and neighbors for the delivery of supervision and other necessary interventions. Individual Support Services: Individual Family Services are support services (other than Residential and Day Habilitation care) for adults living with their families or on their own. Included are respite services, transportation, environmental modifications, adaptive equipment, money management and home skills. Day Services: Day Services are provided for the following: teaching skills for daily living (Day Habilitation); teaching skills necessary to enter the workforce (Day Vocational); Adult Day Care; and providing supports to individuals that allow them to work successfully in the community (Supported Employment). Day Services also includes resources to assure that consumers with a developmental disability can attend Day Habilitation and Vocational Services programs by providing transportation from their homes to the program site and back home again. Resource Coordination: Resource Coordination is provided to assist families and individuals with locating and obtaining services to meet their needs and interests. Behavioral Support: Behavioral Support Services is a set of services to provide support needed to help individuals with severely challenging and disruptive behaviors. The purpose of this service is to prevent the institutionalization of persons with a developmental disability who are already living in the community. Children’s Services; Transitioning Youth Services; Summer Programs: In addition to the above described services, DDA provides services to children, transitioning youth, and for summer programs. For more information regarding these services visit the DDA website at www.ddamaryland.org. Housing Needs In defining the need for housing for individuals with a developmental disability, it is necessary to distinguish between existing housing that is controlled by the individual and that which is not under the individual’s control. Individuals who receive services in an institution or in a home owned by an agency (Residential Services) do not have

38
control over their housing. They may not have a choice in where they live and typically need to move if they decide to receive services from a different agency. Individuals in residential services are in need of affordable housing of their own. According to the DDA, 4,783 individuals with developmental disabilities live in Residential Services facilities, while another 1,464 live in their own residence and receive supportive services from DDA at home. In addition to those individuals currently receiving services through DDA, a waiting list of individuals who are eligible and in need of services exists. As of January 1, 2005 there were 14,616 individuals waiting for one or more of three basic services (residential, day and support services). The total number of residential services being requested by these individuals is 7,666. These are individuals who are in need of affordable housing in communities of their choice. Nearly 2,500 individuals on the waiting list are in a crisis resolution or crisis prevention category and will require immediate housing assistance if their caregiver dies or becomes unable to take care of them. The Developmental Disabilities Administration also operates four (4) state residential centers (SRC) for individuals with mental retardation. These state residential centers include Rosewood Center in Owings Mills, Holly Center in Salisbury, Potomac Center in Hagerstown, and Brandenburg Center in Cumberland. The total number of individuals residing in these facilities is 380. These individuals are also potentially in need of affordable housing in communities of their choice. The DDA has worked for more than 20 years to reduce the census of its SRCs through an emphasis on community services. In FY 2004, DDA moved 25 individuals into the community from the SRCs.
PERSONS WITH MENTAL ILLNESS The Mental Hygiene Administration (MHA) of DHMH is responsible for the treatment and rehabilitation of the mental ill. The MHA plans and develops comprehensive services for the mentally ill, supervises State-run psychiatric facilities for the mentally ill, and provides consultation to State agencies concerning mental health services among other duties. Major psychiatric hospital run by MHA include Carter, Eastern Shore, Finan, Perkins, Spring Grove, Springfield, and Upper Shore. Together, these facilities operate at a capacity of 1,340 beds. This represents a steady reduction in beds over the years as MHA works to deinstitutionalize individuals and move them into the community. The Mental Hygiene Administration provides housing through Residential Rehabilitation Programs (RRP), Supportive Housing and independent housing efforts on the part of the consumer and providers. Individuals with mental illness are encouraged to access housing through a variety of community resources, to include DHCD, public housing authorities as well as non-profit housing agencies. Supportive and independent housing programs have access to flexible support services to assist eligible individuals in the community.

39
THE ELDERLY AND FRAIL ELDERLY
The Department of Aging has primary responsibility for looking after the needs of the elderly and frail elderly in Maryland. According to MDoA, in 2000 there are approximately 800,000 Marylanders aged 60 and over. This represents 15% of Maryland’s population. By 2020, the elderly are expected to comprise 23% of the State’s population. This is due to the movement of the baby boomers (persons born between 1945 and 1960) entering their senior years, when even the youngest “boomers” will be senior citizens. A large number of boomers are expected to live into their mid-80s and beyond, where they are statistically more likely to outlive their resources and suffer from multiple chronic illnesses. As part of developing the Consolidated Plan, DHCD looked at the elderly who were disabled. Based on DHCD’s analysis, there were 50,199 elderly persons in the State’s non-entitlement jurisdictions with some sort of disability in 2000. This includes persons with physical, sensory, or self care disabilities, as well as persons with “mental disabilities” which are primarily learning disabilities rather than mental illnesses or diseases such as Alzheimer’s.
GarrettGarrett
DorchesterDorchester
KentKent
CharlesCharles
CecilCecil
TalbotTalbot
FrederickFrederick
WorcesterWorcester
CarrollCarroll
SomersetSomerset
Saint Mary'sSaint Mary's
AlleganyAllegany
CalvertCalvert
WicomicoWicomico
WashingtonWashington
CarolineCaroline
QueenQueenAnne'sAnne's
Percent of Individuals with a Disability by Census Tract1 for the ElderlyCivilian Noninstitutionalized Population 65 years and over
(excluding entitlement areas)
Allegany Calvert Caroline Carroll Cecil Charles Dorchester Frederick Garrett Kent Queen Anne's Saint Mary's Somerset Talbot Washington Wicomico Worcester Maryland
8,274 6,321 3,812
15,324 8,445 9,009 5,261
12,509 4,126 3,444 5,012 7,236 3,307 6,599
12,708 7,451
9,058 127,896
3,363 2,281 1,644 6,089 3,306 3,833 2,158 4,673 1,836 1,316 1,679 2,716 1,562 2,358 5,012 3,000
3,373 50,199
40.6 36.1 43.1 39.7 39.1 42.5 41.0 37.4 44.5 38.2 33.5 37.5 47.2 35.7 39.4 40.3
37.2 39.2
Jurisdiction
TotalElderly
PopulationPop. with aDisability
Percent w/aDisability
Data Source: U.S. Census Bureau, Census 2000, Summary File 3, Table PCT26 - Sex by Age by Types of Disability for the Civilian Noninstitutionalized population 5 years and over
All totals and derived calculations exclude data (i.e. disability populationvalues) located in entitlement areas.
Census tracts located in both entitlement and non-entitlement areas have been split,so that only data in non-entitlement areas were used to calculate percentages.
1
<= 37.0%, the census tract mean
37.1% - 50.6% (1 SD above mean)
50.7% - 64.3% (2 SD above mean)
64.4% - 78.0% (3 SD above mean)
>= 78.1% (4+ SD above mean, 100% max. value)Entitlement Areas(data in entitlement areas omitted from analysis)
DHCD also broke down information on the elderly with disabilities by type where it was readily distinguishable. (In the Census, people can report whether they have one or more disability, but if they report multiple disabilities, it is not possible to tell what they are.) The most common type of disability for elderly persons (where they only reported one) are physical disabilities. Physical disabilities include difficulty walking, climbing stairs, reaching, lifting, or carrying objects. There were 12, 304 elderly persons in the non-entitlement areas who had this type of disability in 2000. The map below shows where these households live:

40
GarrettGarrett
DorchesterDorchester
KentKent
CharlesCharles
CecilCecil
TalbotTalbot
FrederickFrederick
WorcesterWorcester
CarrollCarroll
SomersetSomerset
Saint Mary'sSaint Mary's
AlleganyAllegany
CalvertCalvert
WicomicoWicomico
WashingtonWashington
CarolineCaroline
QueenQueenAnne'sAnne's
Percent of Individuals with a Physical Only Disability by Census Tract1 for theElderly Civilian Noninstitutionalized Population 65 years and over
(excluding entitlement areas)
Allegany Calvert Caroline Carroll Cecil Charles Dorchester Frederick Garrett Kent Queen Anne's Saint Mary's Somerset Talbot Washington Wicomico Worcester Maryland
8,274 6,321 3,812
15,324 8,445 9,009 5,261
12,509 4,126 3,444 5,012 7,236 3,307 6,599
12,708 7,451
9,058 127,896
711 587 472
1,375 834 997 580
1,128 393 302 462 605 338 592
1,302 861
765 12,304
8.6 9.3
12.4 9.0 9.9
11.1 11.0
9.0 9.5 8.8 9.2 8.4
10.2 9.0
10.2 11.6
8.4 9.6
Jurisdiction
TotalElderly
Population
Pop. with aPhysical Only
Disability
Percent w/aPhysical Only
Disability
Data Source: U.S. Census Bureau, Census 2000, Summary File 3, Table PCT26 - Sex by Age by Types of Disability for the Civilian Noninstitutionalized population 5 years and over
All totals and derived calculations exclude data (i.e. disability populationvalues) located in entitlement areas.
Census tracts located in both entitlement and non-entitlement areas have been split,so that only data in non-entitlement areas were used to calculate percentages.
1
<= 8.9%, the census tract mean
9.0% - 14.1% (1 SD above mean)
14.2% - 19.3% (2 SD above mean)
19.4% - 24.5% (3 SD above mean)
>= 24.6% (4+ SD above mean, 30.6% max. value)Entitlement Areas(data in entitlement areas omitted from analysis)
The second most common form of disability for the frail elderly is a self care disability. Self care disabilities are just that – persons who need assistance with basic daily life, including bathing, feeding, using the bathroom. There were 11,123 elderly households in the State’s non-entitlement jurisdictions with this type of disability in 2000.
GarrettGarrett
DorchesterDorchester
KentKent
CharlesCharles
CecilCecil
TalbotTalbot
FrederickFrederick
WorcesterWorcester
CarrollCarroll
SomersetSomerset
Saint Mary'sSaint Mary's
AlleganyAllegany
CalvertCalvert
WicomicoWicomico
WashingtonWashington
CarolineCaroline
QueenQueenAnne'sAnne's
Percent of Individuals with a Self-care Disability by Census Tract1 for theElderly Civilian Noninstitutionalized Population 65 years and over
(excluding entitlement areas)
Allegany Calvert Caroline Carroll Cecil Charles Dorchester Frederick Garrett Kent Queen Anne's Saint Mary's Somerset Talbot Washington Wicomico Worcester Maryland
8,274 6,321 3,812
15,324 8,445 9,009 5,261
12,509 4,126 3,444 5,012 7,236 3,307 6,599
12,708 7,451
9,058 127,896
819 505 331
1,445 709 929 443
1,121 423 197 275 639 427 495
1,041 643
681 11,123
9.9 8.0 8.7 9.4 8.4
10.3 8.4 9.0
10.3 5.7 5.5 8.8
12.9 7.5 8.2 8.6
7.5 8.7
Jurisdiction
TotalElderly
Population
Pop. with aSelf-careDisability
Percent w/aSelf-careDisability
Data Source: U.S. Census Bureau, Census 2000, Summary File 3, Table PCT26 - Sex by Age by Types of Disability for the Civilian Noninstitutionalized population 5 years and over
All totals and derived calculations exclude data (i.e. disability populationvalues) located in entitlement areas.
Census tracts located in both entitlement and non-entitlement areas have been split,so that only data in non-entitlement areas were used to calculate percentages.
1
<= 8.4%, the census tract mean
8.5% - 13.6% (1 SD above mean)
13.7% - 18.9% (2 SD above mean)
19.0% - 24.1% (3 SD above mean)
>= 24.2% (4+ SD above mean, 33.1% max. value)Entitlement Areas(data in entitlement areas omitted from analysis)
Last but not least, according to the 2000 Census, there were 5,093 elderly persons with sensory disabilities only in the State’s non-entitlement jurisdictions that year. Persons

41
with sensory disabilities are primarily persons who are deaf and/or hard of hearing, or blind or severely visually impaired. The map below shows where these households are distributed:
GarrettGarrett
DorchesterDorchester
KentKent
CharlesCharles
CecilCecil
TalbotTalbot
FrederickFrederick
WorcesterWorcester
CarrollCarroll
SomersetSomerset
Saint Mary'sSaint Mary's
AlleganyAllegany
CalvertCalvert
WicomicoWicomico
WashingtonWashington
CarolineCaroline
QueenQueenAnne'sAnne's
Percent of Individuals with a Sensory Only Disability by Census Tract1 for theElderly Civilian Noninstitutionalized Population 65 years and over
(excluding entitlement areas)
Allegany Calvert Caroline Carroll Cecil Charles Dorchester Frederick Garrett Kent Queen Anne's Saint Mary's Somerset Talbot Washington Wicomico Worcester Maryland
8,274 6,321 3,812
15,324 8,445 9,009 5,261
12,509 4,126 3,444 5,012 7,236 3,307 6,599
12,708 7,451
9,058 127,896
398 200 148 566 346 378 182 481 216 215 145 257 123 240 517 277
404 5,093
4.8 3.2 3.9 3.7 4.1 4.2 3.5 3.8 5.2 6.2 2.9 3.6 3.7 3.6 4.1 3.7
4.5 4.0
Jurisdiction
TotalElderly
Population
Pop. with aSensory Only
Disability
Percent w/aSensory Only
Disability
Data Source: U.S. Census Bureau, Census 2000, Summary File 3, Table PCT26 - Sex by Age by Types of Disability for the Civilian Noninstitutionalized population 5 years and over
All totals and derived calculations exclude data (i.e. disability populationvalues) located in entitlement areas.
Census tracts located in both entitlement and non-entitlement areas have been split,so that only data in non-entitlement areas were used to calculate percentages.
1
<= 3.8%, the census tract mean
3.9% - 7.1% (1 SD above mean)
7.2% - 10.5% (2 SD above mean)
10.6% - 13.8% (3 SD above mean)
>= 13.9% (4+ SD above mean, 28.6% max. value)Entitlement Areas(data in entitlement areas omitted from analysis)
The needs of the elderly and frail elderly, depending on their type of ability or disability are wide ranging. Whether disabled or not, there is a need for affordable rental and ownership housing. In addition, especially for some of those most severely disabled, there is a need for supportive housing and assisted living. Persons Who do NOT Require Supportive Housing HUD asks states, to the extent data is available, to discuss the housing needs of elderly persons and the disabled who do not require supportive services. We could find no data on this. The Census provides information on who is disabled and who is not, and, as per the maps above, we were able to determine the elderly disabled. Also, as per our discussion in Part 1 of the needs assessment, we could look at the needs of the elderly as a whole. But there is no available data that breaks this information down into subgroups.

42
Housing Needs - Part IV
LEAD-BASED PAINT HAZARDS Lead-based paint has long been recognized as a substantial health hazard both in Maryland and the nation for many years. Lead poisoning can severely affect the health of both children and adults. The ingestion of lead dust by young children is particularly damaging, and can result in learning disabilities, hearing impairments, brain damage, convulsions, seizures, mental retardation, coma and death. Maryland has a high concentration of housing with lead paint and a critical need for more resources to help deal with the removal of this hazardous substance. Maryland has a significant amount of older housing stock, with over 1,483,835 housing units built before 1978 of which 160,000 units were built before 1950. Based on calculation using the most recent studies from HUD regarding lead hazards and age of housing, it is estimated that 526,300 housing units have serious lead hazard potential.
ESTIMATED HOUSING UNITS WITH LEAD PAINT COUNTY UNITSAllegany 14,080Anne Arundel 35,897Baltimore City 144,241Baltimore County 84,037Calvert 3,478Caroline 3,296Carroll 10,485Cecil 7,439Charles 5,406Dorchester 4,866Frederick 13,960Garrett 3,780Harford 12,961Howard 8,587Kent 2,846Montgomery 64,643Prince George's 59,743Queen Anne's 3,045Saint Mary's 5,322Somerset 2,736Talbot 4,270Washington 17,074Wicomico 7,848Worcester 6,259TOTAL 526,300
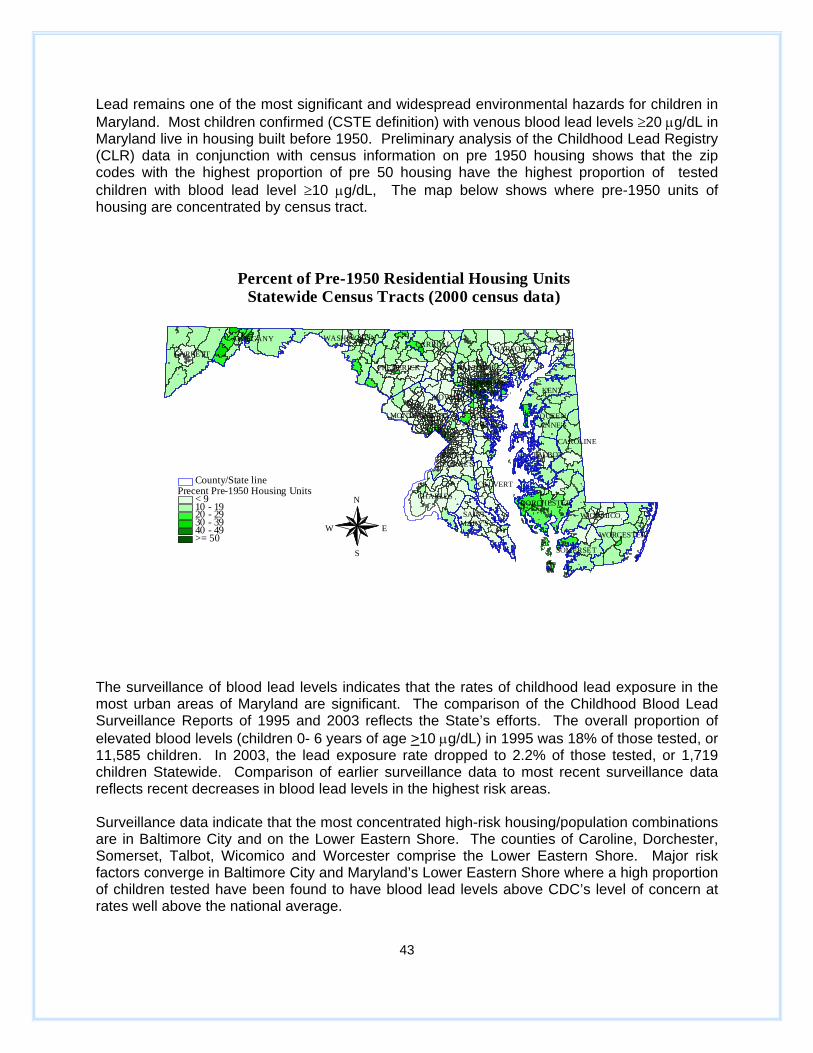
43
Lead remains one of the most significant and widespread environmental hazards for children in Maryland. Most children confirmed (CSTE definition) with venous blood lead levels ≥20 µg/dL in Maryland live in housing built before 1950. Preliminary analysis of the Childhood Lead Registry (CLR) data in conjunction with census information on pre 1950 housing shows that the zip codes with the highest proportion of pre 50 housing have the highest proportion of tested children with blood lead level ≥10 µg/dL, The map below shows where pre-1950 units of housing are concentrated by census tract.
ALLEGANY
ANNEARUNDEL
BALTIMORE
CALVERT
CAROLINE
CARROLL CECIL
CHARLESDORCHESTER
FREDERICK
GARRETTHARFORD
HOWARDKENT
MONTGOMERY
PRINCEGEORGE'S
QUEENANNE'S
SAINTMARY'S
SOMERSET
TALBOT
WASHINGTON
WICOMICO
WORCESTER
BALTIMORECITY
N
EW
S
Precent Pre-1950 Housing Units< 910 - 1920 - 2930 - 3940 - 49>= 50
County/State line
Percent of Pre-1950 Residential Housing UnitsStatewide Census Tracts (2000 census data)
The surveillance of blood lead levels indicates that the rates of childhood lead exposure in the most urban areas of Maryland are significant. The comparison of the Childhood Blood Lead Surveillance Reports of 1995 and 2003 reflects the State’s efforts. The overall proportion of elevated blood levels (children 0- 6 years of age >10 µg/dL) in 1995 was 18% of those tested, or 11,585 children. In 2003, the lead exposure rate dropped to 2.2% of those tested, or 1,719 children Statewide. Comparison of earlier surveillance data to most recent surveillance data reflects recent decreases in blood lead levels in the highest risk areas.
Surveillance data indicate that the most concentrated high-risk housing/population combinations are in Baltimore City and on the Lower Eastern Shore. The counties of Caroline, Dorchester, Somerset, Talbot, Wicomico and Worcester comprise the Lower Eastern Shore. Major risk factors converge in Baltimore City and Maryland’s Lower Eastern Shore where a high proportion of children tested have been found to have blood lead levels above CDC’s level of concern at rates well above the national average.

44
Childhood Lead Poisoning in Baltimore City and Lower Eastern Shore Counties (1) (Data from Childhood Blood Lead Surveillance in Maryland 2002 Annual Report)
0-35 Months 36-72 Months Region
Population
%Test
%EBL(2)
% Lead Poisoning(3
) Population
%Test
%EBL
% Lead Poisoning
Baltimore City 27,523 42.5 8.0 0.9 25,221 19.4 12.6 1.5Lower Eastern Shore 8,883 38.5 5.1 0.6 8,503 12.2 5.5 0.4
1. Lower Eastern Shore counties include Caroline, Dorchester, Somerset, Talbot, Wicomico, and Worcester. 2. Defined as a blood lead level ≥10 µg/dL 3. Define as a venous blood lead level ≥20 µg/d
The most current surveillance data (2003) from MDE’s CLR show that the blood lead testing rate of children 0-72 months Statewide averaged 17.5% with a low of 7.6% in a jurisdiction without an at risk area as identified by the Targeted Screening Planning to a high of 35.2 % in Baltimore City which is entirely within an at risk area. Overall testing has increased Statewide, especially in those aged 1 and 2 years. In 2003, Statewide, including Baltimore City, 22.6% of children 0-35 months and 10.7% of children 36-72 months had a blood lead test. In Baltimore City alone, 43.6% of children 0-35 months and 26.2% of children 36-72 months were tested. Most cases of childhood lead exposure > 10 µg/dL in Maryland are related to deteriorated or damaged residential lead paint. Ownership of houses identified as a primary source for lead poisoned children was 90% rental in Baltimore City in 1992, and 74% rental in 2000. In other jurisdictions, ownership was 75% rental in 1992, and 43% rental in 2000. Other sources, such as lead in drinking water, ceramics, traditional medicines, occupational “take-home” or adult hobbies, and lead-containing vinyl products contribute to general background exposure. They are occasionally identified as the primary source for an individual child’s exposure. As paint sources are controlled, and if levels at which damaging health effects are determined to occur continue to drop, these other sources may acquire more importance in Maryland’s elimination plan. According to Maryland’s Childhood Lead Registry (CLR) data analysis, most children confirmed with venous blood lead levels ≥20 µg/dL in Maryland come from lower-income families. Preliminary work to determine the most sensitive indicators of childhood lead poisoning in Maryland show that the percentage of families with children under five years of age under the poverty level (poverty as defined by the US Bureau of Census) is the next most significant risk factor after pre-1950 housing. Baltimore City and the Lower Eastern Shore are sizeable communities with significant percentages of the households living at or below the poverty level, especially in older communities. The table below shows the blood lead testing of children 0-72 months of age by jurisdiction in 2003.

45
Maryland Department of the Environment
Lead Poisoning Prevention Program: Childhood Lead Registry Blood Lead Testing of Children 0-72 months by Jurisdiction in 2002
Population of children
0-72 months
old2
Children Tested3
Children with Elevated
Blood Lead Level4
Children with Lead Poisoning5
County1 Number Percent Number Percent Number Percent Allegany 4,187 1,315 31.4 30 2.3 5 0.4Anne Arundel 40,772 5,029 12.3 20 0.4 1 0.0Baltimore 54,829 10,427 19.0 120 1.2 18 0.2Baltimore City 51,184 18,242 35.6 1,166 6.4 160 0.9Calvert 6,168 682 11.1 2 0.3 0 0.0Caroline 2,240 796 35.5 14 1.8 3 0.4Carroll 11,781 1,040 8.9 14 1.3 2 0.2Cecil 7,091 959 13.5 9 0.9 2 0.2Charles 11,145 1,391 12.5 2 0.1 0 0.0Dorchester 1,941 540 27.8 26 4.8 5 0.9Frederick 17,621 1,630 9.3 16 1.0 2 0.1Garrett 1,982 429 21.6 3 0.7 0 0.0Harford 18,298 2,674 14.6 19 0.7 2 0.1Howard 22,178 1,688 7.6 8 0.5 2 0.1Kent 1,046 157 15.0 3 1.9 0 0.0Montgomery 76,228 10,163 13.3 53 0.5 9 0.1Prince George's 72,886 12,426 17.0 77 0.6 7 0.1Queen Anne's 3,177 495 15.6 5 1.0 2 0.4Saint Mary's 7,847 903 11.5 9 1.0 0 0.0Somerset 1,411 544 38.5 18 3.3 5 0.9Talbot 2,114 449 21.2 15 3.3 1 0.2Washington 9,823 1,971 20.1 15 0.8 3 0.2Wicomico 6,524 2,031 31.1 50 2.5 7 0.3Worcester 3,027 731 24.1 24 3.3 1 0.1County Unknown
9 1 0 0.0
Statewide 435,452 76,721 17.6 1,719 2.2 237 0.31. County assignment in the order of priority was based on child’s census tract, child’s zip
code address and provider’s zip code address 2. Adapted from US Census population estimate for 2003. 3. Blood lead reports with missing or wrong date of birth were assumed to be from children
under six (6) years of age with exact age unknown. 4. Any blood level ≥10 µg/dL 5. Defined as a venous blood lead level ≥20 µg/dL

46
The “Statewide Elevated Blood Lead Levels” map below represents the distribution of children aged 0-72 months with blood lead levels >10 µg/dL. .
ALLEGANY
ANNEARUNDEL
BALTIMORE
CALVERT
CAROLINE
CARROLL CECIL
CHARLES DORCHESTER
FREDERICK
GARRETT HARFORD
HOWARDKENT
MONTGOMERY
PRINCEGEORGE'S
QUEENANNE'S
SAINTMARY'S
SOMERSET
TALBOT
WASHINGTON
WICOMICO
WORCESTER
BALTIMORECITY
N
EW
S
Percent BLL >=10 µg/dL< 22 - 45 - 910 - 19>= 20
Census tractCounty/State boundary
Statewide Elevated Blood Lead LevelsPercent of Children 0-72 Months Tested Statewide
with Blood Lead Level above 10 µg/dL 2001-2002 by Census Tracts
Notes:1. Each child is counted once (highest blood lead level) for each calendar year. Over the years a child may have been counted more than once.2. A total of 156,249 children tested for lead statewide in 2001-2002, of whom 94,454 had enough address information at the street level for census tract to be assigned and were included in this presentation.
SOURCE: Maryland Department of the Environment Lead Poisoning Prevention Progam Childhood Lead Registry
Maryland has developed a Plan to Eliminate Childhood Lead Poisoning by 2010. The plan will address lead poisoning prevention statewide, with an emphasis on highest risk areas in Baltimore City, Lower Eastern Shore, and Western Maryland. States must have an Elimination Plan to be eligible for future lead poisoning prevention funding or lead hazard reduction funding under the federal Centers for Disease Control (CDC), Housing and Urban Development (HUD), or Environmental Protection Agency (EPA) Lead grant Programs. The State has been implementing a strong primary prevention program since 1996. Maryland law focuses on pre-1950 rentals as the highest risk housing. It sets a standard for hazard reduction, confirmed by a third party inspector, to be met before each unit turnover. Other Maryland efforts require blood lead testing at ages 1 and 2 years of age for day care and school entry, support statewide outreach, integrate lead into routine housing grant and loan programs, and require compliance with state lead registration and hazard control requirements as a condition for Section 8 unit approval or use of rent courts. Maryland also has aggressive state funding and enforcement of the state standards statewide, especially in Baltimore City. The Statewide plan will be implemented by state and local agencies and non-profits. Each responsible party will do their own internal reporting and evaluation as usual, with the Lead Commission responsible for general oversight. The Lead Commission will report on overall

47
progress and needs to the Governor and Legislature. The full body of the Plan can be found on MDE’s website at www.mde.state.md.us. State law regarding case management, Environment Article (EA) §6-304 “Case Management For Children With EBLs”, requires State level assistance to local health departments to provide case management of children. This law and EA §6-8, “The Reduction of Lead Risk in Housing Law,” requires local health departments to provide “Official Notice, Report of Elevated Blood Lead Level,” commonly referred to as “Notice of EBL” to parents and rental property owners in cases where a child’s blood lead level is > 15µg/dL. The Notice of EBL triggers rental property owner responsibilities to provide appropriate interventions and treatment of the rental unit. The “Protocol for Nursing Case Management of Lead Poisoned Children” and the “Protocol for Environmental Case Management of Lead Poisoned Children” have been in place since 1991. The MDE Lead Poisoning Prevention Program (LPPP) updates and distributes both periodically. As of June 2003, there were a total of 1,182 children being case managed throughout the State. Of these cases, 930 were from Baltimore City and 252 were from all other counties (MDE STELLAR Report, 2003). The MDE LPPP, working from the laboratory reports received by the Childhood Lead Registry, notifies the appropriate local health department nurse about a child exposed to lead. Local health department nursing case management is initiated upon receipt of blood lead level >15 µg/dL. A home visit by the nurse is the preferred first intervention at this level. A lower level of response occurs at a blood lead level of 10 -14 µg/dL, such as mailing materials or telephoning the family to provide education when resources are an issue. Local Health Departments adapt case management policies and procedures recommended by MDE to fit local circumstances with MDE oversight. Environmental investigations are initiated by MDE as part of case management for most counties. Environmental Sanitarians certified as Lead Risk Assessors in Baltimore City, Baltimore County, and Prince Georges County conduct their own environmental investigation after receiving a referral from a local health department nurse case manager. Local health and environmental departments must follow MDE protocol or comply with MDE-approved local protocol. Recommendations for unit treatment and unit treatment enforcement are coordinated with MDE’s Lead Enforcement Division. Maryland’s environmental investigation and unit treatment protocols are consistent with Federal recommendations from CDC, EPA and HUD. Protocol and policies require that case management continue until discharge criteria conditions as described in the Protocols are met. Nursing case managers attempt to assure that the child receives all appropriate and necessary resources, such as appropriate medical follow-up. Medicaid regulations require managed care organizations to provide case management for their patients with lead exposure, and 3 tertiary care centers with lead specialists are available for consultation or for treatment. These are the Kennedy-Krieger Institute, Mount Washington Hospital in Baltimore City and the Children’s National Medical Center in adjacent Washington D.C. Most children receive the appropriate medical follow-up, but too many of them continue to live in environments where they are exposed to lead hazards. Relocation of the family to a safe environment and/or treatments of the hazardous unit can take many months to occur. Lead hazard reduction in the initial unit, and the availability of lead-safe housing for temporary or permanent relocation are critical.

48
HOUSING MARKET ANALYSIS General Maryland has experienced many internal and external events that have affected its economy and housing conditions. What follows is a general description of the housing market and inventory conditions in the State. Incomes in Maryland are among the highest in the nation. According to figures released in February, 2005, the median income in the State was $66,900. Median income varied widely, however, from a low of $37,500 in Allegany County, to a high of $82,800 in the Washington D.C. metropolitan statistical area, which includes Montgomery, Prince George's, Calvert, Charles, and Frederick Counties in Maryland. The Maryland Department of Planning (OP) reports that population growth in Maryland is currently growing slightly faster than the national average. Overall, Maryland's population ranks about 19th overall among States, the same ranking it has held since the 1970s
The Market The following information was prepared in housing by DHCD’s Office of Research (OR). Each month, OR prepares a monthly review of Maryland’s housing economy, which is published Statewide in Blueprint Maryland. December 2004 data was used in the Consolidated Plan as it represents the last full year for which data is available. HIGHLIGHTS
The resilience of household spending from 2000 to 2004, even in light of a 1.2 percent annual reduction in household income, is attributable primarily to the substantial growth in home equity wealth in Maryland. Statewide, the owner occupied home equity wealth grew by an estimated $157.8 billion, representing a growth of $103,918 per homeowner household.
From December 2004 to January 2005, Freddie Mac’s 30-year effective fixed mortgage rate
dropped from 5.81 percent to 5.77 percent in the U.S., and from 5.75 percent to 5.73 percent in the South region. The 30-year fixed effective mortgage rate in Maryland declined from 5.81 percent in December 2004 to 5.53 percent in January 2005.
The effective mortgage rate of the Community Development Administration (CDA), an arm
of the Maryland Department of Housing and Community Development, stands at 5.39 percent. The CDA’s effective rate is now 14 basis points below the average effective commercial mortgage rates in Maryland and 38 basis points below Freddie Mac’s national average rate.
The strength of consumer spending since 2000 has played a major role in propelling the U.S. economy forward. Despite significant shocks to the U.S. economy resulting form the stock market crash of 2000, and the onset of economic down turn and the September 11 terrorist attacks in 2001, consumption expenditures have consistently added fuel to an otherwise

49
faltering economy. The strong pace of consumer spending since 2000, as represented by an average annual growth rate of 3.3 percent, has enabled the U.S. Gross Domestic Product to grow at a healthy rate of 2.6 percent during the same period. The resilience of household spending since 2000, even in light of a 1.5 percent annual average decline in household income, is attributable primarily to the considerable strength of the housing market. Thanks to historically low mortgage rates, home sales have been on the rise, reaching a high of 8 million annualized units in 2004. Construction of new homes also exhibited an exceptional performance, reaching about 1.6 million units last year. Strong demand for housing pushed the median price of existing homes by about 8 percent nationally in 2004. The gains in home prices during the past four years have substantially increased the net wealth of homeowners through home equity accumulation. Home equity, the difference between the appraised home value and the mortgage debt, is the largest component of net wealth for many American households and contributes significantly to the overall consumption expenditures. According to the 2001 Survey of Consumer Finance, home equity accounts for about one-half of household net wealth for an estimated 50 percent of families. In 2004, the Joint Center for Housing Studies of Harvard University reported that consumers spend about five-and-a-half cents out of every dollar increase in both housing wealth and stock wealth. However, spending from housing wealth only takes about a year to reach 80 percent of its long-run effect, compared with nearly five years for stock wealth to have the same effect. Similar to the national trend, a significant boost in consumption expenditures, as evidenced by a substantial increase in retail sales tax collections, is largely responsible for Maryland’s recent upbeat economic performance. During the fiscal period 2000 to 2004, the retail sales tax collections in Maryland, our proxy for consumer spending, increased by 17.9 percent, or 4.5 percent annually. According to our projections, the Maryland economy, as measured by the Gross State Product, grew by 25.1 percent since 2000, representing a very robust annual growth rate of 6.3 percent. During the same period, however, the median household income in Maryland declined by 4.9 percent, or 1.2 percent annually. Thus, similar to the national economy, the buoyancy of household spending in Maryland since 2000 is due, primarily, to the substantial growth in housing market and the corresponding increases in home equity wealth. According to our projections, the number of owner occupied housing units in Maryland grew to about 1,590,000 in 2004, representing a growth rate of 9.6 percent since 2000. The highest growth occurred in Calvert County where the number of housing units grew by 21.7 percent reaching a high of 22,912 units in 2004. Other counties with double-digit growth rates included Charles (18.7 percent), Worcester (16.2 percent), Queen Anne’s (15.5 percent), Carroll and St. Mary’s (15.1 percent each), Frederick (14.3 percent), Cecil (14.0 percent), Howard (13.3 percent), Harford (12.1 percent), Kent (11.3 percent), Washington (10.4 percent), and Montgomery County (10.3 percent). Allegany County with a growth rate of 2.2 percent had the smallest increase in the number of owner occupied housing units in Maryland. Along with the growth in the number of owner occupied housing units, Maryland home prices have increased significantly since 2000. Statewide, the average value of existing homes increased by 74 percent, reaching a high of $283,233 in 2004. Average home prices have grown by as much as 124.2 percent in Worcester County, home to the state’s premier tourist destination Ocean City, 78.3 percent in Queen Anne’s County, 72.7 percent in Howard County,

50
72.6 percent in Western Maryland’s tourist destination of Garrett County, and 72.3 percent in Kent County. The rapid appreciation of home prices in Maryland has substantially increased the equity wealth of homeowners since 2000. From 2000 to 2004, the owner occupied home equity wealth grew by an estimated $157.8 billion in Maryland, representing a growth of $103,918 per homeowner household.
Owner Occupied Home Equity Growth in Maryland 2000-2004
Number of Units Average Value of UnitsHome Equity Growth
2000-04
Per Homeowner County
Projected 2004
% Change 2000-04 Rank
Projected 2004
% Change 2000-04 Rank
Total Value
($millions) Value RankAllegany 21,029 2.2% 24 $82,783 9.1% 24 $144 $6,852 24
Anne Arundel 147,362 9.2% 16 $335,342 62.6% 14 $18,258 $123,900 7
Baltimore 219,502 8.4% 19 $232,367 53.3% 21 $17,123 $78,010 17
Baltimore City 225,504 2.6% 23 $129,304 57.3% 17 $10,523 $46,664 22
Calvert 22,912 21.7% 1 $300,365 61.0% 15 $2,363 $103,128 11
Caroline 9,934 9.2% 17 $195,715 67.9% 9 $760 $76,519 18
Carroll 45,296 15.1% 5 $302,079 67.6% 10 $5,151 $113,710 8
Cecil 27,814 14.0% 8 $234,771 66.5% 12 $2,435 $87,553 15
Charles 34,666 18.7% 2 $268,462 69.6% 6 $3,537 $102,042 12
Dorchester 10,214 6.0% 22 $204,884 54.7% 18 $728 $71,283 19
Frederick 62,440 14.3% 7 $284,114 66.3% 13 $6,625 $106,098 10
Garrett 9,485 6.0% 21 $319,709 72.6% 4 $1,232 $129,918 6
Harford 65,879 12.1% 10 $228,782 46.9% 22 $4,587 $69,631 20
Howard 71,696 13.3% 9 $367,654 72.7% 3 $10,435 $145,548 5
Kent 5,861 11.3% 11 $283,332 72.3% 5 $660 $112,625 9
Montgomery 221,260 10.3% 13 $426,027 67.9% 8 $36,260 $163,878 3 Prince George's 260,195 9.1% 18 $236,443 69.0% 7 $24,142 $92,786 13
Queen Anne's 12,704 15.5% 4 $377,746 78.3% 2 $1,968 $154,880 4
Somerset 6,239 7.0% 20 $128,221 39.8% 23 $220 $35,332 23
St. Mary's 25,240 15.1% 6 $254,473 59.8% 16 $2,247 $89,017 14
Talbot 10,314 9.9% 14 $510,442 53.8% 20 $1,784 $172,988 2
Washington 36,499 10.4% 12 $207,610 66.6% 11 $2,894 $79,298 16
Wicomico 26,425 9.3% 15 $187,417 54.0% 19 $1,675 $63,369 21
Worcester 11,516 16.2% 3 $340,369 124.2% 1 $2,008 $174,367 1
Maryland 1,589,988 9.6% n/a $283,233 74.0% n/a $157,761 $103,918 n/a

51
Maryland Housing Completions Increased The U.S. Census Bureau reported that in December, 2004 privately owned housing completions increased sharply by 27.1 percent nationally. Across the nation, single-family and multi-family housing completions were up by 29.0 percent and 15.7 percent, respectively. In the South region, housing completions increased by 22 percent as single-family and multi-family completions were up by 15.7 percent and 72.4 percent, respectively. In Maryland, the number of housing units completed increased by 16.1 percent to 2,699 units in December. This strength was due to a 16.9 percent increase in single-family and a 13.2 percent rise in multi-family completions. Compared to the same month last year, housing completions were up by 13.4 percent in the U.S. and 2.8 percent in the South region, but down by 23.1 percent in Maryland.
RESIDENTIAL BUILDING PERMITS - ALL UNITSPercent Change from Same Month Previous Year
-40.0%
-30.0%
-20.0%
-10.0%
0.0%
10.0%
20.0%
30.0%
40.0%
50.0%
J2002
F M A M J J A S O N D J2003
F M A M J J A S O N D J2004
F M A M J J A S O N D
US South Maryland
Residential Construction Activity in Maryland Counties Across Maryland, the value of housing permits in December declined by 14 percent to $267 million. Overall, ten Maryland jurisdictions reported gains in the number and value of building permits issued, including Anne Arundel, Calvert, Carroll, Cecil, Charles, Dorchester, Frederick, Wicomico, and Worcester counties. Statewide, the value of housing starts increased by 2.6 percent to $285 million. Strong housing starts were reported in Anne Arundel, Baltimore, Calvert, Carroll, Charles, Dorchester, Washington, Wicomico, and Worcester counties and in Baltimore City. The value of housing units completed in Maryland also increased in this month by 16 percent to $353 million. Housing units completed were up in Allegany, Anne Arundel, Baltimore, Calvert, Carroll, Cecil, Charles, Dorchester, Garrett, Kent, Montgomery, Somerset, Wicomico, and Worcester counties.

52
Residential Construction in Maryland
December 2004 Permits Starts Completions
County Units Value ('000s) Units
Value ('000s) Units
Value ('000s)
Allegany 4 $487 4 $487 11 $1,855Anne Arundel 248 $30,095 222 $28,373 354 $34,178Baltimore 301 $28,003 243 $24,126 198 $21,610Baltimore City 2 $273 264 $17,628 0 $0Calvert 59 $8,064 59 $8,064 49 $7,644Caroline 11 $1,728 11 $1,728 12 $1,908Carroll 158 $14,995 58 $8,370 77 $10,466Cecil 81 $12,267 70 $11,729 136 $17,245Charles 95 $18,078 90 $17,891 100 $20,378Dorchester 23 $3,635 23 $3,635 31 $4,357Frederick 112 $15,338 112 $15,338 145 $19,748Garrett 3 $565 3 $565 51 $8,634Harford 75 $10,690 68 $10,115 138 $19,174Howard 65 $7,757 49 $6,697 554 $61,145Kent 12 $1,499 12 $1,499 45 $5,180Montgomery 211 $42,612 341 $51,223 95 $12,984Prince George's 142 $20,029 142 $20,029 218 $30,109Queen Anne's 41 $4,213 41 $4,213 29 $5,245Somerset 13 $989 12 $914 20 $1,729St. Mary's 61 $7,989 73 $8,844 111 $14,538Talbot 41 $6,816 41 $6,816 40 $16,694Washington 83 $10,025 163 $14,208 130 $19,040Wicomico 49 $6,717 49 $6,717 63 $6,517Worcester 106 $14,570 124 $15,798 92 $12,340Maryland 1,996 $267,433 2,274 $285,007 2,699 $352,718
Mortgage Rate Trends The effective 30-year fixed mortgage rates -- rates that account for variations in points – declined in January 2005. During the December 2004 to January 2005 period, Freddie Mac’s 30-year effective fixed mortgage rate dropped from 5.81 percent to 5.77 percent in the U.S., and from 5.75 percent to 5.73 percent in the South region. The 30-year fixed effective mortgage rate in Maryland declined from 5.81 percent in December 2004 to 5.53 percent in January 2005. The Maryland commercial fixed mortgage rate is now 24 basis points below the national rate. The effective mortgage rate of the Community Development Administration (CDA), an arm of the Maryland Department of Housing and Community Development, stands at 5.39 percent.

53
The CDA’s Maryland Mortgage Program (www.morehouse4less.com) provides low-interest mortgage loans to eligible homebuyers through private lending institutions throughout the State. The CDA’s effective rate is now 14 basis points below the average effective commercial mortgage rates in Maryland, and 38 basis points below Freddie Mac’s national average rate.
30-YEAR FIXED EFFECTIVE MORTGAGE RATES
4.5%4.7%4.9%5.1%5.3%5.5%5.7%5.9%6.1%6.3%6.5%6.7%6.9%
J 2004 F M A M J J A S O N D J 2005
U.S. South Maryland CDA
Home Sale in Maryland Counties In December 2004, the inventory of housing units available for sale totaled 12,410 units statewide, up 12.7 percent from November, but down 2.4 percent from the previous year. A total of 8,410 housing units were sold in Maryland, up 5.8 percent from last year, but down 0.2 percent from the previous month. The number of units sold represents 67.8 percent of Maryland’s available inventory. Complete data is not available for Somerset, Wicomico, and Worcester Counties.
Real Estate Transactions in Maryland Counties
0
500
1,000
1,500
2,000
2,500
3,000
3,500
Alleg
any
Anne Arund
el
Baltimore
Baltimore C
ity
Calvert
Carolin
e
Carroll
Cecil
Charles
Dorcheste
r
Frederick
Garrett
Harford
How
ard
Kent
Mon
tgom
ery
Prince George's
Queen Ann
e's
St. M
ary's
Somerset
Talbot
Washing
ton
Wico
mico
Worceste
r
Housing Units Sold, December 2004 Housing Units Inventory, December 2004

54
Housing Units Sold and Housing Inventory
December 2004 Housing Units Sold Housing Units Inventory
County
Current Month
% Change from Last
Year
% Change from Last
Month
Current Month
% Change from Last
Year
% Change from Last
Month Allegany 63 0.0% 5.0% 253 0.0% 23.4%Anne Arundel 772 3.3% -7.4% 1,219 -1.4% 7.2%Baltimore 1,026 7.5% -2.3% 1,350 0.6% 21.7%Baltimore City 1,020 34.9% 15.1% 1,842 -15.7% 25.7%Calvert 121 -13.6% -15.4% 329 34.3% 26.5%Caroline 36 20.0% -2.7% 186 6.9% 20.8%Carroll 206 4.0% 7.3% 396 -14.8% 8.5%Cecil 119 0.0% 6.3% 403 20.3% 18.2%Charles 248 13.2% 0.8% 293 14.5% 8.5%Dorchester 57 42.5% 14.0% 215 -1.4% -0.9%Frederick 330 -18.7% -18.1% 554 0.4% 9.1%Garrett 63 117.2% 37.0% 357 25.7% 2.6%Harford 316 4.6% -7.1% 660 27.7% 29.7%Howard 392 -2.5% -5.3% 475 18.8% 5.3%Kent 36 20.0% -12.2% 140 -6.7% 10.2%Montgomery 1,493 3.4% -1.6% 1,285 1.8% -6.8%Prince George's 1,361 2.3% 1.7% 1,016 -31.9% 8.0%Queen Anne's 74 0.0% -2.6% 325 0.3% 10.9%St. Mary's 143 -10.1% 9.2% 277 34.5% 32.5%Somerset 23 43.8% -8.0% 0 0.0% 0.0%Talbot 55 -16.7% -17.9% 363 -2.4% 11.0%Washington 156 6.8% -13.8% 472 15.7% 18.9%Wicomico 103 -5.5% 98.1% 0 0.0% 0.0%Worcester 197 8.8% 5.9% 0 0.0% 0.0%
Maryland 8,410 5.8% -0.2% 12,410 -2.4% 12.7% Homeownership Affordability Indices The Maryland Homeownership Affordability Indices for repeat and first-time homebuyers provide a framework within which housing affordability in Maryland counties and Baltimore City can be traced over time. In December 2004, the Maryland affordability index for repeat buyers was 109, signifying the ability of a typical repeat buyer to afford a house that is 9 percent more expensive than a median priced home. The December Maryland affordability index for first-time buyers
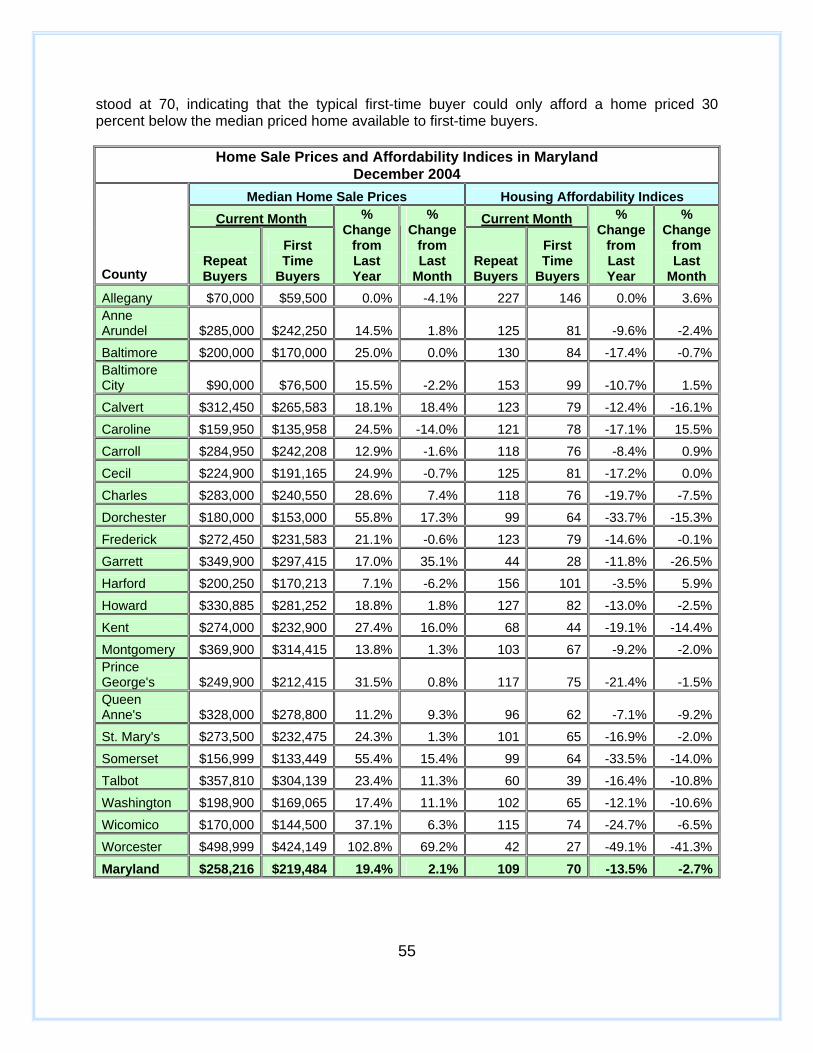
55
stood at 70, indicating that the typical first-time buyer could only afford a home priced 30 percent below the median priced home available to first-time buyers.
Home Sale Prices and Affordability Indices in Maryland December 2004
Median Home Sale Prices Housing Affordability Indices Current Month Current Month
County
Repeat Buyers
First Time
Buyers
% Change
from Last Year
% Change
from Last
Month Repeat Buyers
First Time
Buyers
% Change
from Last Year
% Change
from Last
Month Allegany $70,000 $59,500 0.0% -4.1% 227 146 0.0% 3.6%Anne Arundel $285,000 $242,250 14.5% 1.8% 125 81 -9.6% -2.4%Baltimore $200,000 $170,000 25.0% 0.0% 130 84 -17.4% -0.7%Baltimore City $90,000 $76,500 15.5% -2.2% 153 99 -10.7% 1.5%Calvert $312,450 $265,583 18.1% 18.4% 123 79 -12.4% -16.1%Caroline $159,950 $135,958 24.5% -14.0% 121 78 -17.1% 15.5%Carroll $284,950 $242,208 12.9% -1.6% 118 76 -8.4% 0.9%Cecil $224,900 $191,165 24.9% -0.7% 125 81 -17.2% 0.0%Charles $283,000 $240,550 28.6% 7.4% 118 76 -19.7% -7.5%Dorchester $180,000 $153,000 55.8% 17.3% 99 64 -33.7% -15.3%Frederick $272,450 $231,583 21.1% -0.6% 123 79 -14.6% -0.1%Garrett $349,900 $297,415 17.0% 35.1% 44 28 -11.8% -26.5%Harford $200,250 $170,213 7.1% -6.2% 156 101 -3.5% 5.9%Howard $330,885 $281,252 18.8% 1.8% 127 82 -13.0% -2.5%Kent $274,000 $232,900 27.4% 16.0% 68 44 -19.1% -14.4%Montgomery $369,900 $314,415 13.8% 1.3% 103 67 -9.2% -2.0%Prince George's $249,900 $212,415 31.5% 0.8% 117 75 -21.4% -1.5%Queen Anne's $328,000 $278,800 11.2% 9.3% 96 62 -7.1% -9.2%St. Mary's $273,500 $232,475 24.3% 1.3% 101 65 -16.9% -2.0%Somerset $156,999 $133,449 55.4% 15.4% 99 64 -33.5% -14.0%Talbot $357,810 $304,139 23.4% 11.3% 60 39 -16.4% -10.8%Washington $198,900 $169,065 17.4% 11.1% 102 65 -12.1% -10.6%Wicomico $170,000 $144,500 37.1% 6.3% 115 74 -24.7% -6.5%Worcester $498,999 $424,149 102.8% 69.2% 42 27 -49.1% -41.3%
Maryland $258,216 $219,484 19.4% 2.1% 109 70 -13.5% -2.7%

56
Workforce Affordable Rental Housing Shortage in Maryland
There is an acute shortage of workforce affordable rental housing for families, seniors and individuals with disabilities in Maryland. This shortage has become more concentrated among the low-income renter households despite improvements in income and housing conditions across a broad range of income groups in the past decade. Statewide, household income grew from an average of $36,016 in 1990 to $52,310 in 2000, an increase of 45 percent. The growth of household income was widespread throughout Maryland, ranging from a low of 25 percent for Baltimore City to a high of 47 percent for Worcester County. This impressive growth of income, however, did not significantly reduce the share of low-income renter households with housing problems.
During the 1990-2000 period, the share of Maryland households with severe rent burden declined by only 2 percent among households with 0-30 percent of the Area Median Income (AMI). The same share declined by 8 percent among households with 31-50 percent of the AMI, and by only 1 percent for households in the 51-80 percent of the AMI group. Among households with incomes below 30 percent of the AMI, 70 percent reported at least one housing problem in 2000, while 54 percent paid more than 50 percent of their income for rent and utilities. The corresponding figures for households with incomes between 31-50 percent of the AMI are 68 percent and 13 percent respectively. Finally, 32 percent of the families earning between 51-80 percent of the AMI reported at least one housing problem, while 2 percent indicated severe housing problems. In Worcester County, 54.8 percent of the low income households are cost burdened, the lowest rate, while in Montgomery County, 74.2 percent are cost burdened, the highest rate. About 34.3 percent of Garrett County's low income households are severely cost burdened, the lowest rate, compared to Montgomery County's 60.4 percent, the highest rate.
In addition to the size and variation of household income overtime, the affordability problem depends on the supply side of the rental market, i.e., higher rates of growth in median rent and the slow growth of multi-family residential structures. The rental housing supply, in turn, can be measured by units affordable and available to a specific income threshold. Data from the 2000 Census show that about 87 rental-housing units were affordable for every 100 low-income renter households in Maryland. This represents a shortage of 13 units per 100 renter households. However, many units, nominally affordable to specific income groups, are occupied by higher income households. In 1990 and in 2000 alike, about 46 percent of the affordable units, or 40 units per 100 low-income renters, were occupied by higher income renter households. As a result, there were only 47 affordable and available rental units per 100 low-income renter households in Maryland.
This study, conducted at the request of the Governor's Commission on Housing Policy, estimates the shortage of affordable and available rental housing units for households who earn less than 50 percent of the AMI and pay more than 30 percent of their income for rent. The Commission was established by Governor Robert L. Ehrlich, Jr. through an executive order in March 2003 to develop new and innovative policies to expand home ownership, to ensure an ample supply of workforce housing, to address the needs of seniors and individuals with disabilities, and to enhance community revitalization activities to create sustainable communities.
Since the median household income varies widely across the state, the use of a single statewide affordability threshold may distort the analysis as it represents a different share of the

57
local median income. For example, in 2003, the statewide median family income threshold (50 percent), as reported by the U.S. Census Bureau, was $26,155. This threshold represents only 35 percent and 37 percent of the median household income in Howard and Montgomery counties respectively. The corresponding figure for Baltimore City is 87 percent. Thus, to account for these variations, this study estimates the magnitude of the rental housing shortage in Maryland by utilizing a different income threshold for each county. These local income thresholds are equivalent to 50 percent of each county's median household income.
To estimate the shortage of affordable housing for the state's senior households, the elderly population had to be converted into elderly households. Our conversion technique is based on the Census distribution of families (ranging in size from one person to four or more persons) headed by an individual 65 years and older. According to the 2000 Census, about 68.3 percent of senior families consist of one person, 26 percent consist of two persons, and the remaining 5.7 percent consist of three or more individuals.
The disabled households are defined as families with one or more disabled individuals where disability, as defined by the 2000 Census, is a condition that makes it difficult for a person to do activities such as walking, climbing stairs, dressing, bathing, learning, or remembering. The data include non-institutionalized individuals over five years of age who live in households and group quarters such as college dormitories, military quarters, and group homes. The disabled individuals (including the elderly disabled) are converted to the disabled households using an average household size of about 2.2 persons per family.
Baseline shortage of workforce affordable rental units for 2000 are based on the number of low income families, elderly and disabled households compared to the number of workforce affordable rental units available to them. The shortage projections for 2014 are based on the forecast of population growth. On average, the number of low-income families and the disabled households will grow by about 0.8 percent a year during the projection period. The corresponding figure for senior households is 2.0 percent a year.
In 2000, Maryland had a deficit of about 125,000 affordable and available rental units. The rental housing shortage in Maryland is projected to grow by an additional 25 percent, reaching a high of 157,000 units by 2014. Our projections assume no new workforce affordable rental housing production by Maryland Department of Housing and Community Development (DHCD) beyond 2005. This allows us to estimate the impact of various production scenarios and policy options on the projected deficit. According to our analysis, low-income family units account for the bulk of the projected deficit (103,100 units or 66 percent of the total), followed by units accessible to individuals with disabilities (28,800 or 18 percent), and the elderly units (25,000 or 16 percent). Based on an estimated cost per unit of about $114,000 and incorporating future inflation, the estimated production cost of meeting the expected 157,000 shortage of units over the next ten years is approximately $19.5 billion.
Montgomery County with 36,000 units has the largest projected shortage, followed by Prince George's County (27,600 units), Baltimore County (22,400 units), Baltimore City (17,800 units), Anne Arundel County (12,600 Units), and Howard County (8,700 units). With the exception of Garrett County, jurisdictions with the smallest projected shortage are located on the Eastern Shore of Maryland and include Somerset, Caroline, Kent, Dorchester, Queen Anne's, Talbot, and Worcester counties.

58
Projected Shortage of Workforce Affordable and Available Rental Housing in Maryland Jurisdictions 2014
% of Households in 2000 Shortage of Affordable Units
Jurisdiction
50% of AMI Threshold
(2000) Cost
Burdened
Severely Cost
Burdened Families Seniors Disabled Total
Allegany $15,411 64.80% 44.20% 700 300 300 1,300
Anne Arundel $30,884 67.20% 54.70% 8,700 1,800 2,100 12,600
Baltimore $15,039 66.90% 48.80% 13,200 4,600 4,600 22,400
Baltimore City $25,334 76.70% 63.50% 10,000 3,300 4,500 17,800
Calvert $32,973 69.90% 46.10% 900 200 200 1,300
Caroline $19,416 61.40% 38.90% 300 100 100 500
Carroll $30,011 70.40% 58.40% 1,900 500 500 2,900
Cecil $25,255 67.70% 51.50% 1,300 300 400 2,000
Charles $31,100 71.20% 47.00% 1,900 300 500 2,700
Dorchester $17,039 67.70% 48.60% 300 200 100 600
Frederick $30,138 69.10% 49.90% 3,300 700 800 4,800
Garrett $16,119 55.90% 34.30% 200 100 100 400
Harford $28,617 68.60% 54.40% 3,300 700 800 4,800
Howard $37,084 66.10% 57.60% 6,700 900 1,100 8,700
Kent $19,935 64.40% 48.40% 300 100 100 500
Montgomery $35,776 74.20% 60.40% 24,700 5,700 5,600 36,000Prince George's $27,628 73.80% 58.10% 19,200 3,300 5,100 27,600
Queen Anne's $28,519 62.60% 43.40% 500 100 100 700
Somerset $14,952 73.00% 58.70% 200 100 100 400
St. Mary's $27,353 69.20% 46.30% 1,500 300 300 2,100
Talbot $21,766 71.50% 50.50% 500 200 100 800
Washington $20,309 65.80% 49.80% 1,800 600 700 3,100
Wicomico $19,518 72.50% 56.90% 1,200 400 400 2,000
Worcester $20,325 54.80% 41.00% 500 200 200 900
Maryland $26,155 70.00% 53.80% 103,100 25,000 28,800 156,900
Inventory Conditions According to the 2000 census, there are about 2,145,283 million year-round housing units in Maryland. About 1,341,592 of these units are owner-occupied units, and about 639,265 were renter occupied units. Of the remaining units, 2.3 percent were rental units available for rent, 1

59
percent were units for sale, and 7.3 percent were "other" which is comprised overwhelmingly of rental or owner-occupied units which are under rental or purchase contracts but where the household has not yet taken possession of the unit. Almost half (48.2 percent) of all owner-occupied units had three bedrooms, 27.2% had four bedrooms, and 7.3 percent had five or more bedrooms. By contrast, rental units tended to be primarily two-bedroom units, which represented 36.7 percent of the rental stock. The table below provides a profile of housing units by owner versus rental status:
Housing Stock in Maryland 2000 Census
Number of Bedrooms
Owner Occupied
Percent Renter Occupied
Percent
No Bedroom 4,685 0.3 35,431 5.5One Bedroom 31,938 2.4 197,007 30.8Two Bedrooms 196,174 14.6 234,355 36.7Three Bedrooms 646,585 48.2 134,200 21.0Four Bedrooms 364,379 27.2 30,661 4.8Five or More 97,833 7.3 7.611 1.2
Housing in Standard Condition and Substandard Condition but suitable for Rehabilitation HUD also asks grantees to define housing that is in Standard Condition, as well as Substandard condition but suitable for rehabilitation. For the purposes of the Plan, we use the following definitions:
“Standard Condition" - A housing unit in "standard condition" meets all applicable code requirements and has all of its major systems in working order.
"Substandard Condition but suitable for rehabilitation" A unit which is "substandard but
suitable for rehabilitation" is any unit which has at least one or more major systems which is not in working order and/or has health and safety problems, any of which can be remedied in a manner that is both economically feasible and meets livability code requirements.
HUD requires grantees to report on housing units it believes to be substandard. DHCD estimates there may be about 357,000 substandard units in Maryland. This estimate is based on the number of housing units lacking complete kitchens or plumbing, and units that are overcrowded, as well as housing units built in 1939 on earlier. Obviously, not all unit built prior to 1939 are substandard. However, most of these housing units would have lead paint problems. In addition, since no post 1939 housing units are identified as substandard, although some would be, we think this numbers represents a fairly good “best guess” proxy of substandard units.

60
Substandard Housing Units in Maryland
Jurisdiction Housing units: Built
1939 or earlier
Total Units Lacking
Complete Kitchens
Total Units Lacking
Complete Plumbing
Total Overcrowded
Units
Total Substandard Units
Allegany 12,706 173 162 233 13,274Anne Arundel 12,036 391 542 3,548 16,517Baltimore City 110,720 1,974 2,068 11,843 126,605Baltimore County 26,743 714 875 6,145 34,477Calvert 1,430 146 137 384 2,097Caroline 2,623 59 96 272 3,050Carroll 7,979 173 167 537 8,856Cecil 4,425 104 140 592 5,261Charles 1,701 221 338 919 3,179Dorchester 3,468 108 165 247 3,988Frederick 11,275 203 260 965 12,703Garrett 2,644 57 90 107 2,898Harford 5,741 283 401 1,159 7,584Howard 2,502 401 240 2,054 5,197Kent 2,358 47 73 110 2,588Montgomery 16,590 1,203 1,122 17,633 36,548Prince George's 13,261 881 1,268 21,247 36,657Queen Anne's 2,096 56 120 247 2,519Saint Mary's 1,745 432 251 905 3,333Somerset 2,179 52 80 188 2,499Talbot 3,181 113 93 148 3,535Washington 13,693 212 200 552 14,657Wicomico 4,484 171 79 780 5,514Worcester 2,987 49 66 379 3,481TOTAL 268,567 8,223 9,033 71,194 357,017
The Assisted Housing Inventory DHCD, HUD, the Farmer's Home Administration, the Appalachian Regional Commission, and local towns, cities and counties through Public Housing Authorities or nonprofit corporations such as the Housing Opportunities Commission all finance rental housing for low- and moderate-income households. A list of the projects in the inventory can be found in Appendix II. Beginning with its first multi-family mortgage insurance closing in 1975, both the Division of Housing Finance (CDA) and the Division of Credit Assurance (MHF) have had a substantial

61
portfolio of projects subsidized by federal Section 8 rental assistance contracts or Section 236 interest rate reduction subsidies. Forty percent of all MHF insured projects and 32 percent of all insured units receive one or both of these federal subsidies. These federal programs require that projects remain restricted for occupancy by low-income tenants, with the owner's cash flow and return on equity limited during a certain time, usually 15 years. Recently, the use restrictions on the units have begun to expire. Owners now have the ability to discontinue receipt of the federal subsidy payments and sell the properties as market rate rental housing, realizing the substantial appreciation that may have accrued over the years. If owners sell these properties, significant numbers of low-income families will be displaced and affordable rental units will be permanently lost to the State housing stock. Replacement of these units is far more expensive than finding ways to preserve their continued use as affordable housing. Another challenge to maintaining the assisted housing inventory is the potential loss of low-income housing units financed during the mid-1980s using Federal Low-Income Housing Tax Credits. Generally, those units were financed with a 15-year affordability restriction. The first projects financed with tax credits will have met their 15-year limit beginning in 2002. CDA serves as the State's clearinghouse for assisted housing preservation activities. Notices of Intent required to be filed on federal projects are catalogued here and both non-profit and for- profit developers register with the Secretary of DHCD to be notified of possible purchase opportunities. In addition, Maryland enacted the Assisted Housing Preservation Act in 1989 which is intended to preserve assisted housing for low-income renters. Public Housing Authorities There are 17 Public Housing Authorities (PHAs) located in Maryland’s non-entitlement jurisdictions, of which DHCD is one. PHAs can manage physical units, Section 8 Vouchers (which are not attached to physical units) or both. The PHAs that fall under the State Plan operate a total of 1,372 physical units and 7,232 Vouchers. As part of the Consolidated Plan, HUD asks DHCD to report on the physical assessment scores of units that have been evaluated by HUD’s Office of Public and Indian Housing. The scores, were available, are noted below. Performers with a rating of 90 or above are considered high performers. Two PHAs in the non-entitlement jurisdictions are considered substandard performers – Saint Michael’s Housing Authority and Wicomico County Housing Authority. However, this is somewhat misleading, as this designation is not necessarily a reflection of the upkeep of the housing. For example, in Saint Michael’s, the designation is because capital funds were used to help keep open an on-site day care center so low-income residents could continue to work rather than go on unemployment. In Wicomico County, the rating is being re-assessed as new management there is resolving past issues. HUD also asks DHCD if it knows of any public housing that is scheduled for demolition. DHCD is not aware of any public housing stock currently scheduled for demolition. The State has partnered with Baltimore City in the past to demolish public housing that was obsolete, however, all the demolition on that project is complete.

62
Public Housing Units in Maryland
As of March, 2005 Housing Authority Physical
Units Section 8
CertificatesTotal Assessment
Score
Allegany County Housing Authority 0 86 86 Not RatedCalvert County Housing Authority 72 314 386 94Cambridge Housing Authority 190 0 190 Not RatedCarroll County Housing & Community Development
0 549 549 Not Rated
Cecil County Housing Agency 0 539 539 Not RatedCharles County Commissioners 0 768 768 Not RatedCrisfield Housing Authority 330 23 353 84DHCD 0 2,261 2,261 Not RatedEaston Housing Authority 66 139 205 84Elkton Housing Authority 150 40 190 93Frostburg Housing Authority 100 0 100 Not RatedQueen Anne's County Housing Authority 25 136 161 87Saint Mary's County Housing Authority 57 1,263 1,320 91Saint Michaels Housing Authority 75 20 95 62Washington County Housing Authority 80 498 578 96Westminster Housing Office 0 289 289 Not RatedWicomico County Housing Authority 227 307 534 51TOTAL Non-entitlements 1,372 7,232 8,604 Annapolis Housing Authority 1,104 200 1,304 50Anne Arundel County Housing Commission 1,024 1,708 2,732 90ARC of Northern Chesapeake Region 0 75 75 Not RatedBaltimore City Housing Authority 14,554 14,945 29,499 79Baltimore County Housing Authority 0 5,837 5,837 Not RatedCollege Park Housing Authority 108 0 108 Not RatedCumberland Housing Authority 429 0 429 Not RatedFrederick Housing Authority 468 670 1,138 93Glenarden Housing Authority 60 0 60 Not RatedHagerstown Housing Authority 1,012 900 1,912 89Harford County Housing Authority 0 1,066 1,066 Not RatedHavre de Grace Housing Authority 60 28 88 72Howard County Housing Commission 50 863 913 95

63
Public Housing Units in Maryland (continued)
As of March, 2005 Montgomery County Housing Authority 1,564 5,691 7,255 91Prince George's County Housing Authority 570 4,724 5,294 78Rockville Housing Authority 170 359 529 80TOTAL Entitlements 21,173 37,066 58,239 STATE TOTAL 22,545 44,298 66,843 Source: HUD office of Public and Indian Housing DHCD Public Housing Waiting List HUD regulations ask grantees to provide information on their public housing waiting lists in this section of the Consolidated Plan. DHCD does not operate public housing, so does not have a public housing waiting list. However, DHCD does operate the Section 8 Housing Choice Voucher Program on behalf of some of Maryland's small towns and counties. Each of these jurisdictions maintains its own waiting list, some of which are open and some of which are closed due to the number of people already waiting for Section 8 assistance. The table below provides a snapshot of the total number of households on the Section 8 waiting lists of all of these cities, towns and rural counties where DHCD operates its Section 8 program:
DHCD Section 8 Waiting List for DHCD Subcontractees (As of February, 2005)
Household characteristics Number of Families
% of Total Families
Annual Turnover
Total 4,374 100% 1,330Extremely Low Income (<=30% AMI) 3,561 81% Very Low Income (>30% but <=50% AMI) 707 16% Low Income (>50% but <=80% AMI) 106 2% Families With Children 2,791 64% Elderly Families 375 9% Families with Disabilities 879 20%
NOTE: The number of Families With Children, Elderly Families, and Families with Disabilities on the waiting list does not add up to the Total Number of Families because families can fall into more than one category, for example, they could both be classified as elderly and having a disability. Minority and Low-Income Concentrations One of the items HUD asks the State to look at is concentrations of persons by race or income. The State is allowed to use its own definition of what constitutes a “concentration” and we define it as a census tract where the percentage of minority or low income households is at least 10% greater than the county average. DHCD ran statistics for all of the major ethnic groups, as well as Hispanics. No concentrations by race were found except for black or African-American households. One census tract (ID 955000) in Caroline County had a concentration of persons of Hispanic background.

64
Areas of Minority Concentration As shown on the map on the following page, of the 346 census tracts in Maryland's non-entitlement areas, 25 have minority concentrations of black or African-Americans. This represented a decrease from 38 census tracts identified in the last AI using 1990 data. Twelve of these 25 concentrations are due to institutional populations, which typically have a higher number of minorities than society as a whole. These twelve are: County Census Tract Reason for Concentration Allegany 001300 State Prison Allegany 000200 State Prison Calvert 860702 Veterans Home Dorchester 970500 Residential Hospital Center Somerset 980101 Historically Black College Somerset 980300 State Prison Somerset 980400 State Prison Washington 009000 State Prison Washington 011000 State Prison Worcester 990300 Residential Hospital Center Worcester 990900 Residential Hospital Center and State Prison Worcester 991100 Residential Hospital Center
In addition, concentrations are higher in three other census tracts due to a large military presence, as the military also tends to have a much higher percentage of minorities than the State and society as a whole. These tracts are the three census tracts in Saint Mary’s County (995900, 996001 and 996002) which are impacted by the Patuxent Naval Air Station. After subtract out these 15 census tracts where the data was skewed by special circumstances, the State had ten census tracts with high minority concentrations. Of these ten, five were located in or on the edge of small towns on the Eastern Shore – Cambridge (tracts 970500 and 970600) in Dorchester County, Easton (tract 960300) in Talbot County, Graysonville (a historically black community in tract 810700) in Queen Anne’s County, and an area outside of Salisbury (tract 010200) in Wicomico County. In primarily rural areas, towns typically have higher numbers of minorities than the surrounding farm areas, so these findings are not surprising. However, in a few census tracts, notably the tract outside Salisbury (which is more than 85% African-American in a county that is less than 20 percent African-American) and the two tracts in Cambridge, the numbers are significantly higher than their Counties as a whole. These concentrations may indicate either a past historical pattern of segregation, and/or possible discrimination in these communities. Of the remaining four tracts, one is in Kent County, and the other four are in Charles County. The Kent County tract barely qualified as a concentration, exceeding the threshold by 1 tenth of 1 percent. This area is primarily rural, and it is unclear why a concentration exists.
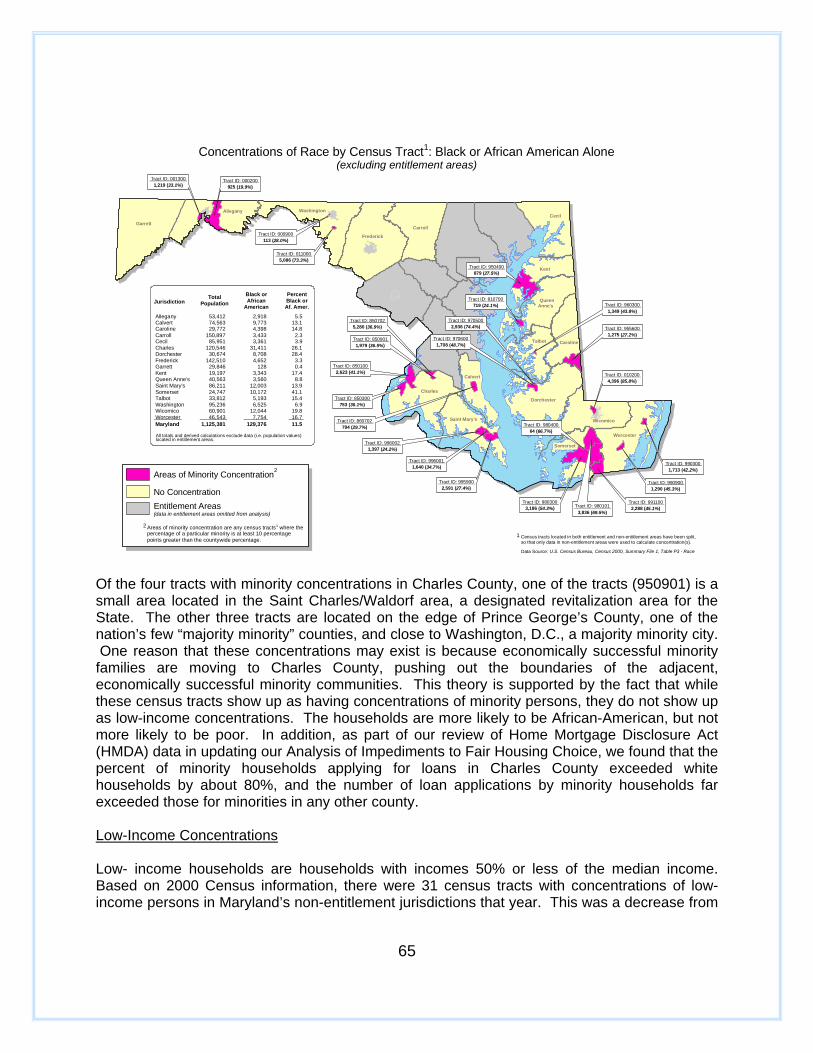
65
GarrettGarrett
DorchesterDorchester
KentKent
CharlesCharles
CecilCecil
TalbotTalbot
FrederickFrederick
WorcesterWorcester
CarrollCarroll
Saint Mary'sSaint Mary's
AlleganyAllegany
CalvertCalvert
Queen QueenAnne'sAnne's
SomersetSomerset
WicomicoWicomico
WashingtonWashington
CarolineCaroline
Tract ID: 980300 3,186 (54.3%)
Tract ID: 950400 879 (27.5%)
Tract ID: 000200 925 (19.9%)
Tract ID: 980101 3,836 (69.5%)
Tract ID: 955600 1,275 (27.2%)
Tract ID: 850100 2,623 (41.1%)
Tract ID: 995900 2,591 (27.4%)
Tract ID: 991100 2,288 (45.1%)
Tract ID: 850300 753 (36.1%)
Tract ID: 810700 719 (24.1%)
Tract ID: 996002 1,397 (24.2%)
Tract ID: 860702 794 (29.7%)
Tract ID: 970600 1,708 (48.7%)
Tract ID: 850702 5,280 (36.9%)
Tract ID: 990900 1,290 (45.3%)
Tract ID: 010200 4,396 (85.8%)
Tract ID: 990300 1,713 (42.2%)
Tract ID: 001300 1,219 (33.1%)
Tract ID: 011000 5,086 (73.3%)
Tract ID: 960300 1,349 (43.8%)
Tract ID: 996001 1,640 (34.7%)
Tract ID: 850901 1,979 (36.5%)
Tract ID: 970500 2,936 (74.4%)
Tract ID: 980400 64 (66.7%)
Tract ID: 000900 113 (28.0%)
Concentrations of Race by Census Tract1: Black or African American Alone(excluding entitlement areas)
Areas of Minority Concentration2
No ConcentrationEntitlement Areas(data in entitlement areas omitted from analysis)
Allegany Calvert Caroline Carroll Cecil Charles Dorchester Frederick Garrett Kent Queen Anne's Saint Mary's Somerset Talbot Washington Wicomico Worcester Maryland
53,412 74,563 29,772
150,897 85,951
120,546 30,674
142,510 29,846 19,197 40,563 86,211 24,747 33,812 95,236 60,901
46,543 1,125,381
2,918 9,773 4,398 3,433 3,361
31,411 8,708 4,652
128 3,343 3,560
12,003 10,172 5,193 6,525
12,044 7,754 129,376
5.5 13.1 14.8
2.3 3.9
26.1 28.4
3.3 0.4
17.4 8.8
13.9 41.1 15.4
6.9 19.8
16.7 11.5
JurisdictionTotal
PopulationBlack orAfrican
American
PercentBlack orAf. Amer.
Data Source: U.S. Census Bureau, Census 2000, Summary File 1, Table P3 - Race
Areas of minority concentration are any census tracts1 where thepercentage of a particular minority is at least 10 percentagepoints greater than the countywide percentage.
2
Census tracts located in both entitlement and non-entitlement areas have been split,so that only data in non-entitlement areas were used to calculate concentration(s).
1
All totals and derived calculations exclude data (i.e. population values)located in entitlement areas.
Of the four tracts with minority concentrations in Charles County, one of the tracts (950901) is a small area located in the Saint Charles/Waldorf area, a designated revitalization area for the State. The other three tracts are located on the edge of Prince George’s County, one of the nation’s few “majority minority” counties, and close to Washington, D.C., a majority minority city. One reason that these concentrations may exist is because economically successful minority families are moving to Charles County, pushing out the boundaries of the adjacent, economically successful minority communities. This theory is supported by the fact that while these census tracts show up as having concentrations of minority persons, they do not show up as low-income concentrations. The households are more likely to be African-American, but not more likely to be poor. In addition, as part of our review of Home Mortgage Disclosure Act (HMDA) data in updating our Analysis of Impediments to Fair Housing Choice, we found that the percent of minority households applying for loans in Charles County exceeded white households by about 80%, and the number of loan applications by minority households far exceeded those for minorities in any other county. Low-Income Concentrations Low- income households are households with incomes 50% or less of the median income. Based on 2000 Census information, there were 31 census tracts with concentrations of low-income persons in Maryland’s non-entitlement jurisdictions that year. This was a decrease from

66
41 census tracts using 1990 census information.
GarrettGarrett
DorchesterDorchester
KentKent
CharlesCharles
CecilCecil
TalbotTalbot
FrederickFrederick
WorcesterWorcester
CarrollCarroll
Saint Mary'sSaint Mary's
AlleganyAllegany
CalvertCalvert
Queen QueenAnne'sAnne's
SomersetSomerset
WicomicoWicomico
WashingtonWashington
CarolineCaroline
Tract ID: 850400 367 (28.6%)
Tract ID: 810200 269 (29.7%)
Tract ID: 980101 902 (52.1%)
Tract ID: 955600 670 (36.1%)
Tract ID: 995801 504 (49.9%)
Tract ID: 991100 675 (34.1%)
Tract ID: 980600 677 (48.7%)
Tract ID: 860703 270 (28.1%)
Tract ID: 752400 734 (27.8%)
Tract ID: 753200 429 (35.9%)
Tract ID: 860701 214 (30.1%)
Tract ID: 001700 850 (40.5%)
Tract ID: 030903 639 (36.1%)
Tract ID: 010200 700 (39.8%)
Tract ID: 990300 520 (33.1%)
Tract ID: 850202 569 (32.1%)
Tract ID: 507801 645 (28.9%)
Tract ID: 030400 910 (46.1%)
Tract ID: 960300 530 (39.3%)
Tract ID: 970500 805 (50.2%)
Tract ID: 860702 300 (34.3%)
Tract ID: 001800 705 (44.8%)
Tract ID: 996001 535 (29.9%)
Tract ID: 850901 844 (41.8%)
Tract ID: 850906 625 (32.3%)
Tract ID: 000500 74 (37.9%)
Tract ID: 000601 15 (30%)
Tract ID: 000500 4 (40%)
Tract ID: 750501 30 (60%)
Tract ID: 750502 24 (28.6%)
Tract ID: 000400 10 (50%)
Concentrations of Low Income by Census Tract1: Occupied Households, Income <=50% HAMFI2(excluding entitlement areas)
Areas of Minority Concentration3
No ConcentrationEntitlement Areas(data in entitlement areas omitted from analysis)
Allegany Calvert Caroline Carroll Cecil Charles Dorchester Frederick Garrett Kent Queen Anne's Saint Mary's Somerset Talbot Washington Wicomico Worcester Maryland
19,749 25,458 11,089 52,499 31,225 41,671 12,709 49,220 11,460 7,669
15,319 30,640 8,356
14,304 33,913 23,004
19,690 407,975
5,743 4,486 2,559 7,712 6,727 7,522 3,674 8,526 3,494 1,756 2,884 5,678 2,890 3,240 5,745 4,590
3,990 81,216
29.1 17.6 23.1 14.7 21.5 18.1 28.9 17.3 30.5 22.9 18.8 18.5 34.6 22.7 16.9 20.0
20.3 19.9
JurisdictionTotal
HouseholdsLow IncomeHouseholds
PercentLow Income
Data Source: U.S. Department of Housing and Urban Development (HUD), CHAS 2000, Table F7 - Tenure by household income in 1999
Areas of minority concentration are any census tracts1 where thepercentage of a particular minority is at least 10 percentagepoints greater than the countywide percentage.
3Occupied households include renter and owner occupied, with householdincomes <=50% of Household Adjusted Median Family Income (HAMFI).
2
All totals and derived calculations exclude data (i.e. household populationvalues) located in entitlement areas.
Census tracts located in both entitlement and non-entitlement areas have been split,so that only data in non-entitlement areas were used to calculate concentration(s).
1
Comparing the census tracts with high minority concentrations to high low-income concentrations, the data shows that only 11 of the tracts meet both criteria, a very low correlation. Of these 11, five are impacted by the same conditions that skewed the minority concentration information. That is, one of the tracts (98010 in Somerset County) had incomes affected by a Historically Black College, one was affected by the Veterans Home in Calvert County (tract 86072), and three were impacted by residential hospital centers (tract 955600 in Dorchester County and tracts 990300 and 991100 in Worcester County). Of the remaining six tracts, two are in Saint Mary’s County and may be impacted by the military base, three are outside of small towns on the Eastern Shore (Cambridge, Easton and Salisbury), and the remaining one is the tract located between Saint Charles and Waldorf in Charles County.

67
GarrettGarrett
DorchesterDorchester
KentKent
CharlesCharles
CecilCecil
TalbotTalbot
FrederickFrederick
WorcesterWorcester
CarrollCarroll
Saint Mary'sSaint Mary's
AlleganyAllegany
CalvertCalvert
Queen QueenAnne'sAnne's
SomersetSomerset
WicomicoWicomico
WashingtonWashington
CarolineCaroline
Tract ID: 980101
Tract ID: 955600
Tract ID: 995801Tract ID: 991100
Tract ID: 860702
Tract ID: 010200
Tract ID: 990300
Tract ID: 850901
Tract ID: 960300
Tract ID: 970500
Tract ID: 996001
Census Tracts1 with both Low Income2 and Minority Population Concentrations3
(excluding entitlement areas)
Areas of both Minority Concentrationand Low Income Concentration4
No occurrence of both Concentrations
Entitlement Areas(data in entitlement areas omitted from analysis)
Areas of both minority and low income concentration are anycensus tracts1 where both the percentage of minorities and thepercentage of low income households are at least 10 percentagepoints greater than their respective countywide percentages.
4
Data Source: U.S. Department of Housing and Urban Development (HUD), CHAS 2000, Table F7 - Tenure by household income in 1999; U.S. Census Bureau, Census 2000, Summary File 1, Table P3 - Race.
Includes renter and owner occupied households, with household incomes<=50% of Household Adjusted Median Family Income (HAMFI).
2
Census tracts located in both entitlement and non-entitlement areas have been split,so that only data in non-entitlement areas were used to calculate concentration(s).
1
Minority population is an aggregation of the following census fields by race: Black orAfrican American alone, American Indian alone, Asian alone, Pacific Islander alone,some other race alone, and two or more races.
3
As noted above, there was one area of Hispanic Concentration in the State’s non-entitlement jurisdictions. This concentration is due to the presence of a chicken processing plant that has recruited a large number of Hispanic workers to the area. The area is not a low-income concentration.
GarrettGarrett
DorchesterDorchester
KentKent
CharlesCharles
CecilCecil
TalbotTalbot
FrederickFrederick
WorcesterWorcester
CarrollCarroll
Saint Mary'sSaint Mary's
AlleganyAllegany
CalvertCalvert
Queen QueenAnne'sAnne's
SomersetSomerset
WicomicoWicomico
WashingtonWashington
CarolineCaroline
Tract ID: 955000 460 (15.0%)
Concentrations of Ethnicity by Census Tract1: Total Hispanic or Latino Population2
(excluding entitlement areas)
Areas of Minority Concentration3
No ConcentrationEntitlement Areas(data in entitlement areas omitted from analysis)
Allegany Calvert Caroline Carroll Cecil Charles Dorchester Frederick Garrett Kent Queen Anne's Saint Mary's Somerset Talbot Washington Wicomico Worcester Maryland
53,412 74,563 29,772
150,897 85,951
120,546 30,674
142,510 29,846 19,197 40,563 86,211 24,747 33,812 95,236 60,901
46,543 1,125,381
421 1,135
789 1,489 1,306 2,722
385 2,131
131 546 444
1,720 334 615 921
1,036 596 16,721
0.8 1.5 2.7 1.0 1.5 2.3 1.3 1.5 0.4 2.8 1.1 2.0 1.3 1.8 1.0 1.7
1.3 1.5
JurisdictionTotal
PopulationHispanic
PopulationPercentHispanic
Data Source: U.S. Census Bureau, Census 2000, Summary File 1, Table P4 - Hispanic or Latino, and not Hispanic or Latino by Race
Areas of minority concentration are any census tracts1 where thepercentage of a particular minority is at least 10 percentagepoints greater than the countywide percentage.
3
Total Hispanic or Latino population, regardless of race2
All totals and derived calculations exclude data (i.e. population values)located in entitlement areas.
Census tracts located in both entitlement and non-entitlement areas have been split,so that only data in non-entitlement areas were used to calculate concentration(s).
1

68
Inventory Of Facilities And Services For The Homeless
And Persons Threatened With Homelessness Emergency and Transitional Shelters There are numerous organizations in Maryland which help house homeless individuals and families. These organizations provided 5,170 beds in emergency or transitional shelters in SFY98. Many of the organizations which offer shelter also offer supportive services, and about 100 offer meals or food supplies. Emergency shelters serve all groups of the homeless, although all areas do not have focused shelters (e.g., shelters specifically for homeless youth, battered women, etc.). Transitional housing facilities are also available for all homeless groups, although not necessarily in all areas. In its 2003 report, DHR reported the State had 2,486 emergency beds, and 2,739 transitional housing beds. In addition, there were 435 beds which were not designated as specifically for emergency or transitional housing. Several "special needs" groups of homeless persons are assisted by these facilities. Other facilities aim their housing and supportive services towards assisting the mentally ill. In addition, some facilities assist focus on homeless youth, while others focus on homeless persons with alcohol and/or drug abuse problems. Finally, a number of programs focus on victims of domestic violence, some using shelter programs and four using "safe houses". The most recent list of homeless shelters in Maryland, who they serve, and the supportive services they provide can be found in Appendix III. In addition to shelter programs, the homeless and those threatened with homelessness in Maryland are also assisted by soup kitchens, soup kitchens which also operate food pantries, and food pantries which do not operate soup kitchens. That list may also be found in Appendix IV.
Inventory of Supportive Housing for Non-Homeless Persons with Special Needs Maryland has been a national leader in providing supportive housing assistance for persons with special needs. According to the National Council of State Housing Agencies, DHCD has been among the top ten financers of group homes or alternative living units for persons with mental illness or developmental disabilities almost every year in the past ten years. While we have been very successful in these efforts, the disability community has expressed the desire to be part of the mainstream and to reside in scattered site housing of their own choosing. While group homes remain a necessity for some persons due to the severity of their disability, the majority of persons with disabilities are capable of residing in alternative settings. This direction is enhanced by the availability of flexible off-site support services that are now provided by many service delivery agencies. This more flexible service delivery approach has assisted many persons to live more independently. In support of efforts to mainstream persons with disabilities, DHCD, in addition to its group home programs, also offers a Homeownership for Individuals With Disabilities Program, as well as a Section 8 Mainstream Voucher program. DHCD also awards higher points in its Qualified Allocation Plan (QAP) to rental projects that provide more handicapped accessible units than

69
required by law, resulting in a significant increase in the number of units being available to persons with disabilities. In addition, as part of the goals of this Plan, DHCD, working with DHMH, DHR, and MDoD, will offer a new Bridge Subsidy program that will provide rental assistance to persons with disabilities while they await permanent housing. The Developmentally Disabled The Developmental Disabilities Administration (DDA) provides a coordinated service delivery system so that individuals with developmental disabilities receive appropriate services oriented toward the goal of integration into the community. This wide array of community based services is delivered primarily through a network of more than 170 non-profit providers. Currently, approximately 22,000 individuals receive community based services. In addition, 380 individuals receive services in one of the four state residential centers operated by DDA. The Developmental Disabilities Administration also maintains a waiting list of individuals who are eligible for services and are waiting to receive one or more of three basic services (residential, day and support services). As of January 1, 2005 there were 14,616 individuals on the waiting list. Of these, nearly 2,500 individuals are in a crisis resolution or crisis prevention category and will require immediate housing assistance if their caregiver dies or becomes unable to take care of them. Approximately 4,783 Individuals currently receive residential services through DDA. An additional 380 individuals reside in institutions. Persons receiving residential services live in settings provided by the agency that delivers their services. These individuals do not have control of their housing situation. In addition, approximately 1,464 individuals receive Community Supported Living Arrangement (CSLA) services in their own home, apartment, family home or rental unit.
Department of Health and Mental Hygiene - Developmental Disabilities Administration Housing Assistance
COUNTY RESIDENTIAL CSLA Allegany 93 44Anne Arundel 370 99Baltimore 1,319 332Baltimore City 278 104Calvert 37 43Caroline 47 4Carroll 110 50Cecil 82 11Charles 126 26Dorchester 41 9Frederick 152 20Garrett 31 14Harford 107 28Howard 230 74Kent 23 9

70
Department of Health and Mental Hygiene - Developmental Disabilities Administration
Housing Assistance (continued) COUNTY RESIDENTIAL CSLA
Montgomery 677 256Prince George’s 513 134Queen Anne’s 22 8Somerset 36 13St. Mary’s 52 52Talbot 54 10Washington 243 63Wicomico 120 46Worcester 20 15TOTAL 4,783 1,464
Individuals With Mental Illness Persons with mental illness in Maryland include those individuals with are affected by mental illness or deeply rooted psychological problems. The Mental Hygiene Administration (MHA) in DHMH is the State's lead office working with mentally ill persons in Maryland. MHA currently services approximately 90,000 persons with housing and support services.
Department of Health and Mental Hygiene - Mental Hygiene Administration Supervised Housing for Persons with Mental Illness Residential Rehabilitation Beds
COUNTY BEDS Allegany 30 Anne Arundel 258 Baltimore City 353 Baltimore County 331 Calvert 18 Caroline 6 Carroll 57 Cecil 38 Charles 16 Dorchester 18 Frederick 180 Garrett 6 Harford 59 Howard 106 Kent 19 Montgomery 339 Prince George’s 376 Queen Anne’s 16
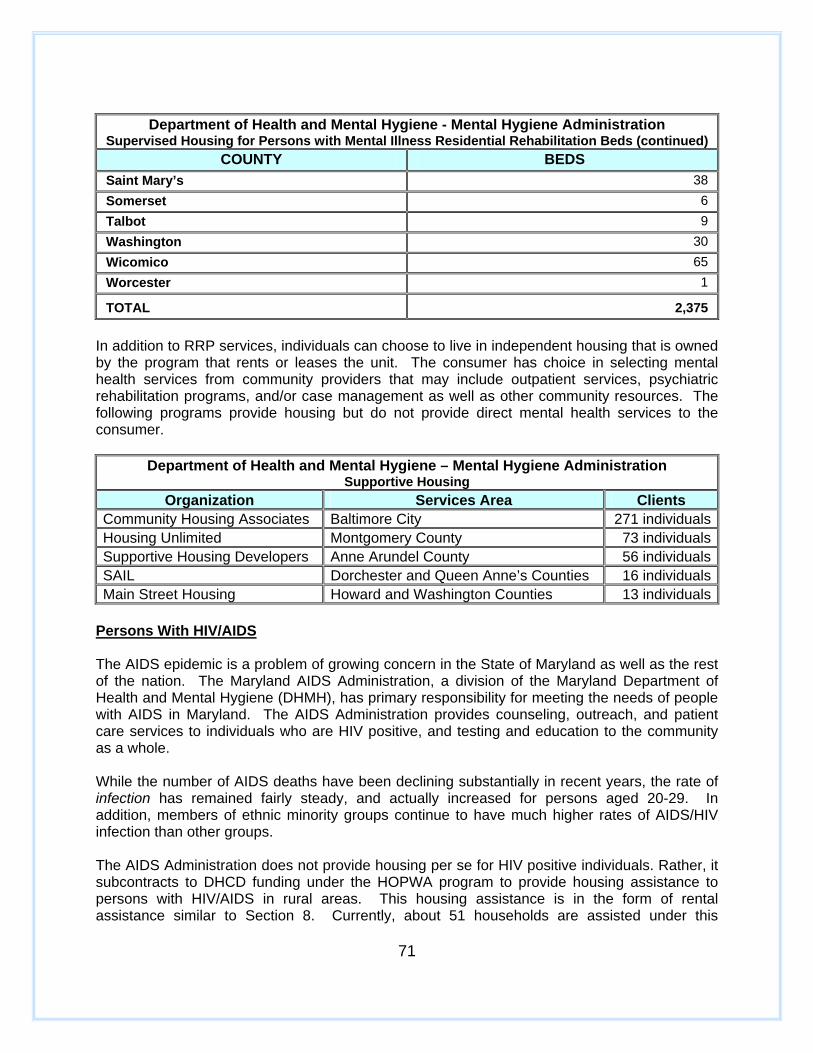
71
Department of Health and Mental Hygiene - Mental Hygiene Administration
Supervised Housing for Persons with Mental Illness Residential Rehabilitation Beds (continued) COUNTY BEDS
Saint Mary’s 38 Somerset 6 Talbot 9 Washington 30 Wicomico 65 Worcester 1 TOTAL
2,375
In addition to RRP services, individuals can choose to live in independent housing that is owned by the program that rents or leases the unit. The consumer has choice in selecting mental health services from community providers that may include outpatient services, psychiatric rehabilitation programs, and/or case management as well as other community resources. The following programs provide housing but do not provide direct mental health services to the consumer.
Department of Health and Mental Hygiene – Mental Hygiene Administration Supportive Housing
Organization Services Area Clients Community Housing Associates Baltimore City 271 individualsHousing Unlimited Montgomery County 73 individualsSupportive Housing Developers Anne Arundel County 56 individualsSAIL Dorchester and Queen Anne’s Counties 16 individualsMain Street Housing Howard and Washington Counties 13 individuals
Persons With HIV/AIDS The AIDS epidemic is a problem of growing concern in the State of Maryland as well as the rest of the nation. The Maryland AIDS Administration, a division of the Maryland Department of Health and Mental Hygiene (DHMH), has primary responsibility for meeting the needs of people with AIDS in Maryland. The AIDS Administration provides counseling, outreach, and patient care services to individuals who are HIV positive, and testing and education to the community as a whole. While the number of AIDS deaths have been declining substantially in recent years, the rate of infection has remained fairly steady, and actually increased for persons aged 20-29. In addition, members of ethnic minority groups continue to have much higher rates of AIDS/HIV infection than other groups. The AIDS Administration does not provide housing per se for HIV positive individuals. Rather, it subcontracts to DHCD funding under the HOPWA program to provide housing assistance to persons with HIV/AIDS in rural areas. This housing assistance is in the form of rental assistance similar to Section 8. Currently, about 51 households are assisted under this

72
program. The Maryland Department of Housing and Community Development offers group home programs, which have been used to provide housing for HIV positive individuals For HIV positive individuals who do not need housing, the AIDS Administration provides financial counseling to help individuals receive the financial and medical benefits they are entitled to so they may remain in their homes. HIV positive individuals may also be admitted to DHMH sponsored group homes as appropriate. Persons With Alcohol and Other Drug Addictions The Alcohol and Drug Abuse Administration (ADAA) of the Department of Health and Mental Hygiene is the State agency responsible for the planning, development, coordination and delivery of services to prevent and treat harmful involvement with alcohol and other drugs by: supporting a statewide coordinated service delivery system, determining customer needs for services, program planning and development, training addictions professionals and other health, human service and criminal justice personnel, collecting and analyzing addictions treatment and prevention data, evaluating services and customer outcomes and collaborating with local, State and federal agencies. Although most clients are helped on an outpatient basis, ADAA also certifies residential programs for persons with alcohol and drug addictions: The Level III.7 (Medically Monitored Inpatient- Intermediate Care Facilities) programs which offers residential services in a medically monitored inpatient treatment. The program provides an intensive treatment regimen of individual and group therapy as well as other activities aimed at the physical, psychological and social recovery of the addicted individual. Clients usually remain in residence for two to four weeks. The Level III.1 (Halfway House) programs are residential care facilities which provide time-limited services to clients who have received prior evaluation or treatment in a primary or intermediate care program. These clients during their stay (usually up to six months) seek employment and move to a position of personal and economic self-sufficiency. The Level III.3 and Level III.5 (Long Term Care and Therapeutic Communities) programs are residential care facilities which provide the same at Level III.I but for a longer period (usually up to a year). Listed below is the number of certified substance abuse residential programs by jurisdiction and by Level of Care during fiscal year 2005.

73
Department of Health and Mental Hygiene - Alcohol and Drug Abuse Administration
Residential Facilities Counties Level III.7
Intermediate Care Level III.I
Halfway House Level III.3 & Level III.5
Other Residential Allegany 2 1 0 Anne Arundel 1 2 3 Baltimore County 1 2 2 Calvert 0 0 1 Carroll 1 0 0 Cecil 0 1 0 Charles 0 0 0 Dorchester 1 0 1 Frederick 1 2 1 Harford 1 2 1 Howard 0 1 0 Kent 1 0 0 Montgomery 2 3 2 Prince George's 1 1 1 Queen Anne's 0 0 0 St. Mary's 1 2 0 Somerset 0 0 0 Talbot 0 0 0 Washington 0 2 1 Wicomico 2 2 0 Worcester 0 0 0 Baltimore City 3 22 5 Statewide 0 0 0 Total 18 43 18 The Elderly With Special Needs Maryland's elderly population, like that of the rest of the nation, is growing in size. Most elderly Marylanders are opting to live their entire lives in their own homes, some elderly require supportive services -- health care, housekeeping, or other assistance -- to help them in their later years. The Maryland Department on Aging (MDoA) has the primary responsibility for providing for the needs of Maryland's elderly population. As the percentage of the population over the age of 65 continues to grow, the need for supportive housing for elderly persons continues to grow. Medical advances that have resulted in increased life span also means that senior-oriented housing resources are not being vacated at the same rates as in the 1960s and 1970s. Locally, the elderly in Maryland are opting to stay

74
in Maryland rather than move to south and west; this is particularly true in Baltimore City and Baltimore County. Two items of special interest to the MDoA are the increasing number of frail elderly who require supportive services to maintain independence and the lack of decent, safe, affordable housing for the poor elderly. The MDoA currently operates 108 group homes with 864 beds to help address the needs of the frail elderly under its Group Sheltered Housing Program. Seniors in this program must be at least 62 years old, in need of assistance with one or more activities of daily living, and have incomes of no more than 60 percent of statewide median. The Maryland Department of Aging is authorized to regulate Continuing Care At Home (CCAH), a new concept in delivering services to the elderly. Similar to the Continuing Care Retirement Community (CCRC) structure, subscribers to CCAH will pay a one-time entrance fee and monthly premiums to access comprehensive, managed long term care services in their own homes. This housing option is designed for persons 60 years of age and older with moderate to higher incomes and who are living independently in the community. CCAH services include: care coordination, home inspections by occupational therapist, assistance with activities of daily living in subscriber's home, skilled nursing services in subscriber's home, routine services of an assisted living facility, routine services of a comprehensive care facility, and assistance with the maintenance of the subscriber's dwelling. CCAH providers must meet the same requirements as CCRCs, including approval of a feasibility study, and review and approval of the language contained in the CCAH contract. A copy of the regulations for Continuing Care at Home are available by individual request. The Maryland Department of Aging urges anyone who is considering entering into a Continuing Care At Home agreement to consult with an attorney and financial advisor before signing any documents. Although the Department of Aging regulates CCAH providers, it does not rate, endorse, or guarantee a CCAH provider. The MDoA also assists the frail elderly who would otherwise be placed in group homes or nursing homes through its Senior Nutrition Program which helps handicapped elderly individuals by taking them to nutrition sites or senior centers, and the Home Delivered Meals Program, which assists homebound elderly individuals who are unable to cook. The Department also keeps a list of subsidized low-income projects, both public and private, operated within the State, as part of a referral network of affordable housing for elderly individuals who are poor and in need of housing. The tables below list the Continuing Care Retirement Communities and Congregate Care Housing Services the Department on Aging provides in Maryland:

75
Maryland Department of Aging Continuing Care Retirement Communities
County Community Anne Arundel Bay Woods of Annapolis Anne Arundel Ginger Cove Baltimore City Roland Park Place, Inc. Baltimore City The Wesley Home, Inc. Baltimore County Augsburg Lutheran Homes of Maryland Baltimore County Augsburg Lutheran Village Baltimore County Blakehurst Baltimore County Broadmead Baltimore County Charlestown Community, Inc. Baltimore County Edenwald Baltimore County Glen Meadows Retirement Community Baltimore County Maryland Masonic Homes Baltimore County Mercy Ridge Baltimore County North Oaks Life Care Community Baltimore County Oak Crest Village Baltimore County Pickersgill, Inc. Baltimore County Presbyterian Home of Maryland Calvert County Asbury-Solomons Island Carroll County Carroll Lutheran Village Carroll County Fairhaven Frederick County Buckingham's Choice, Inc. Frederick County Home for the Aged Howard County Vantage House Kent County Heron Point of Chestertown Montgomery County Asbury Methodist Village, Inc. Montgomery County Bedford Court - Sunrise Montgomery County Maplewood Park Place Montgomery County National Lutheran Home for the Aged Prince George's County Collington Episcopal Life Care Prince George's County Riderwood Village Talbot County William Hill Manor Washington County Fahrney-Keedy Washington County Homewood Retirement Center

76
Maryland Department of Aging
Congregate Housing Sites County Congregate Housing Development
Allegany County Frostburg Heights Apartments Allegany County Grandview Allegany County Willow Valley Apartments Anne Arundel County Arundel Woods Senior Housing Anne Arundel County Friendship Station Senior Housing Anne Arundel County Glen Square Anne Arundel County Glenwood Highrises Anne Arundel County Pinewood Village Baltimore City Basilica Place Baltimore City Bel-Park Tower Baltimore City Belvedere Green Baltimore City Bernard E. Mason Sr. Apartments Baltimore City DePaul House/St. Joachim Baltimore City Epiphany House Baltimore City N.M. Carrol Manor, Inc. Baltimore City Rosemont Towers Baltimore City Weinburg Place Baltimore City Woodbourne Woods Baltimore City Wyman House Baltimore County Stella Maris Baltimore County St. Luke’s Place Baltimore County Timothy House Baltimore County Trinity House Montgomery County Homecrest House III Montgomery County Leafy House Montgomery County Springvale Terrace Montgomery County Takoma Tower Retirement Center Saint Mary’s County Saint Mary's Home for the Elderly Wicomico County Pine Bluff Village

77
BARRIERS TO AFFORDABLE HOUSING IN MARYLAND Barriers to affordable housing may include bureaucratic procedures, codes and standards, some land use controls, financial barriers, lack of financial resources by housing providers, lack of coordination of resources, and scattered growth which drives up infrastructure and housing costs. In addition, some families and individuals face barriers to fair housing choice because of lack of access or lack of availability to affordable housing. Building Codes and Standards While new residential and commercial development consumes agricultural land, forests, and other undeveloped land, thousands of existing buildings in our communities are not being fully utilized or are abandoned. Many existing buildings with historic architectural elements are in danger of deteriorating or being lost. These vacant and underutilized buildings pose a threat to the health, safety, and welfare of the citizens of the State. The rehabilitation of such buildings, however, is often hampered by constraints in the building construction regulatory system. Many existing codes that apply to rehabilitation are conflicting and overlapping. Also, many codes vary from jurisdiction to jurisdiction, posing a challenge to redevelopment. Standardization of such codes, and the development of consistent standards would both protect public safety and lower rehabilitation costs leading to the re-use of thousands of vacant and underutilized buildings in Maryland. Local Zoning Zoning is the primary system by which counties and municipalities maintain control over the pattern of land development within their borders. Zoning regulations allocate parcels of land to different classifications with certain uses being permitted, while others are proscribed. Zoning practices of counties and localities often have the intended or unintended effect of increasing housing costs, and effectively excluding prospective moderate-income households from locating affordable housing for purchase or rent. Zoning can be used as a positive tool in support of cost-effective and efficient design if housing affordability is considered as a part of the jurisdiction's policy. The use of techniques such as programs for moderately priced dwelling units, zero lot line housing, mixed use zones, viable basic design and performance zoning can help to produce affordable housing. Conversely, the separation of residential from non-residential uses exacerbates traffic problems since most employees cannot walk to work. Moreover, upper-income residents may bid up the price or rent of housing units that are conveniently located near to places of employment therein forcing lower-income residents to live farther from their places of employment. The State's high priority on rebuilding healthy, diverse communities and eliminating sprawl development is intended to reverse this trend. Zoning regulations prescribing minimum lot sizes minimum setbacks, and other requirements may necessitate the need for larger lots, which drive up the cost of housing and making it less affordable. In addition, zoning is occasionally used to "zone out" manufactured housing, which is an important source of housing for many low- and moderate income-citizens. Zoning regulations also may prohibit the development of ancillary dwelling units, even if such units do not impose a significant cost on other community residents. Ancillary dwelling units --

78
sometimes called in-law apartments or "granny flats" — are an important tool to increase the supply of housing for moderate-income households, particularly single people who require minimal space. This type of unit and a wide variety of other compatible mixed-use and mixed-income designs should be permitted by local land use policy and the regulations which implement it. Approval Fees Approval fees also may constitute a significant barrier to the development of affordable housing in Maryland depending on the type, size, and location of the proposed development. The fees and charges necessary for approval of a residential development include subdivision fees, building and other permit fees, and charges for access to sewers and other public infrastructure, among others. Prospective developers may be required to prepare market analyses, environmental or economic impact analyses, or infrastructure requirements analyses and engineering plans to accompany particular development proposals. In many cases the aggregate cost of these fees, charges, and required submissions can amount to a significant share of the total cost of a residential development. Permit Approval Process The length of time involved in the permit approval process itself may constitute a significant barrier. In some cases the process of obtaining all required permits and approvals may add months or even years to the development time. During this period the developer must pay the explicit costs of funds borrowed to finance the development and staff retained to design it, as well as the implicit cost of revenues foregone as a result of the approval process delay. Often such delays are due to the needs for submission revisions in accordance with permit requirements. But whether the delays are the fault of government officials or developers, they still reduce the financial return on the development of affordable housing. Lack of Adequate Financial Resources A widely recognized, yet difficult to overcome barrier to affordable housing in Maryland is the lack of adequate financial resources. Although nationally recognized for its innovative and effective housing programs, DHCD still has insufficient resources to meet the need for affordable rental and homeownership housing. Like all states, the need for increased revenue for housing has to compete with other legitimate public priorities, such as education, transportation, health and welfare. In Maryland, public (tax revenue) support for affordable housing was initiated in the early 1970s and reached a peak in the late 1980s and early 1990s. Since that period DHCD's operating budget has increased only gradually. At the same time, federal resources have been cut or shrinking, especially for programs such as HOME and CDBG which are the primary tools for constructing and/or rehabilitating affordable housing for the low-income individuals. Section 8 resources have also been reduced, making it more difficult for renters to find affordable rental housing. Housing Acquisition Finance Requirements Mortgage down payment requirements constitute perhaps the most significant barrier to the purchase of otherwise affordable housing by moderate-income households. While moderate-income households may have little difficulty in making monthly mortgage payments --

79
particularly as household incomes increase with inflation and real wage growth -- it may be difficult for such households to accumulate the total amount required for the up-front down-payment on a home purchase. High home prices have also had a negative in the effort to provide affordable housing, as prices rise out of reach of many would-be first time buyers. Rental security deposits too may constitute a significant barrier to the acquisition of otherwise affordable rental housing by moderate-income households, although security deposits are generally small compared with mortgage down payment requirements. Counties in Maryland rely heavily on transfer taxes and recordation fees as sources of county revenues. In addition to the 0.5% State transfer tax, ten jurisdictions -- Anne Arundel, Baltimore City, Baltimore County, Cecil, Howard, Kent, Montgomery, Prince George's, Saint Mary's, and Talbot -- impose county transfer taxes. All 24 jurisdictions impose recordation fees as a percentage of the mortgage value. Although it is clear that transfer taxes and related fees constitute a small share of the total cost of purchasing housing, it is equally clear that purchasers in Maryland face substantially higher transfer taxes and related fees than purchasers in most other states. Thus the reliance on transfer taxes and recordation fees constitutes a small, but significant and avoidable, barrier to the affordability of housing in Maryland by moderate-income buyers. Governmental Coordination Lack of coordination among and within State agencies creates a barrier to affordable housing. Uncoordinated government efforts cause delays in funding of affordable housing, create conflicting policy/funding priorities across government agencies, and add to administrative burdens. In addition, multiple and differing program applications in a specific agency can lead to delays in processing loan applications and drive up development costs. Similarly, environmental review procedures among State agencies result in barriers to affordable housing. Environmental regulations provide positive public benefits to all citizens and communities, however, different environmental reviews, rather than a uniform review process shared by all departments, prolong the affordable housing development process, increase costs, create confusion, reduce affordability, and impose undue administrative burdens. Fair Housing Choice One of the greatest barriers to affordable housing for many Maryland families is the lack of fair housing choice. HUD broadly defines fair housing choice as "the ability of persons with similar incomes to have the same housing choices regardless of race, color, religion, sex, age, national origin, familial status, or disability." All state and local governments, particularly those that receive federal funds from HUD, are required to promote fair housing choice and to affirmatively further fair housing. Various forms of discrimination may exist in Maryland which prevents citizens from having fair housing choice. For example, some families face racial discrimination which closes doors to affordable housing. Such discrimination includes refusing to rent or sell affordable housing to minority households, or the denial of equal credit. Lending discrimination too can have a substantive impact on Maryland's communities. Without access to capital, a community cannot build affordable housing, rehabilitate older housing, or establish a healthy residential tax base. In addition, refusal to loan to minorities, or women, or the disabled, or other protected classes undermines efforts to integrate communities.

80
Despite the continued support for affordable housing by DHCD, there still is the need for more units. Not only do minorities and the disabled need safe, sanitary, and affordable housing, many also know little or nothing about fair housing choice. In addition to discrimination based on race or ethnicity, Marylanders with disabilities may be denied access to rental housing for a variety of reasons. For example, many have resided in group homes or have been hospitalized and therefore have no credit or rental history. Some persons with disabilities are able to work on a part time basis only, while others cannot work at all. Therefore, SSI or SSDI benefits provide their major source of income. Many rental agents do not consider this a valid source of income and will not rent to persons in this situation. Even when a person has a Section 8 certificate from HUD, there are an increasing number of landlords who choose not to accept these certificates. In addition, many persons with disabilities are stigmatized for no reason other than their disability. As a result, many providers are asked to co-sign leases on behalf of persons with disabilities, further exacerbating the problem. Reasonable accommodations need to be articulated at the State level in order to remove these barriers to community integration. Persons whose disabilities which are primarily accessibility-related (persons in wheel chairs or with other physical limitations that impair mobility) also have difficulties finding affordable housing. The physically disabled often have lower than average incomes due to the difficulty of obtaining well paying jobs. Thus, their housing problems are exacerbated both by low incomes and by the inability to physically enter into many housing units, affordable or otherwise. This issue was addressed to some degree under the American's with Disabilities Act. However, confusion over the Act and lack of guidelines has meant that "accessible" units are often inaccessible to the persons who need them.

81
NON-HOUSING COMMUNITY DEVELOPMENT NEEDS Maryland receives community development, economic development, and infrastructure funds from the federal government, and uses its own funds to carry out these activities as well. Setting Non-housing Priorities The State determined its community development, economic development, infrastructure, and other non-housing priorities from a variety of inputs. First, a review of CDBG projects from Federal Fiscal Year 2000 through 2004 was undertaken. This review identified the CDBG priorities that were set by counties and municipalities across the State as well as their sub-recipients. Local governments often identify and target similar development needs. By reviewing these projects, a preliminary list of priorities was gathered. Second, a survey was taken of local governments, housing providers, advocacy organizations, human service agencies, and other groups and organizations interested in community and economic development (as well as housing) issues. They ranked more than 30 categories of need from (1) "very low need” to (5) "very high need." A copy of this survey can be found in Appendix I. Third, a working group of the Governor’s Housing Policy Commission looked at non-housing needs in Maryland’s Communities. This group identified needs for infrastructure, public facilities, and essential human services. Based on these three methods, needs were broken down into two main areas, 1) infrastructure needs and 2) public facilities and essential human service needs. These resulted in the priorities below: Infrastructure: Priorities for federally funded infrastructure are:
Water, sewer, and drainage, Streets and roads, and Planning and technical assistance.
The new construction, rehabilitation, or upgrading of infrastructure will be carried out and/or financed through programs administered by DHCD, DBED, MDOT, and the MDE, among others. Public Facilities and Essential Human Services: Priorities for public facilities and essential human services are:
Head Start , Day Care, and Family Support Centers, Youth and Senior Centers, Community Facilities, Health Centers, and ADA improvements.
Public facilities and essential human services programs will be financed through federal programs, such as the CDBG program, as well as State programs.

82
General Conditions Like their counterparts nationally, Maryland low- and moderate-income residents are struggling to find jobs which afford personal satisfaction and provide a living wage. Also like their counterparts nationally, Maryland's low-income citizens need assistance with child care, health care and job training. Often their communities also need water and sewer systems that meet health and safety requirements as well as public facilities which are accessible to the elderly and handicapped. Given these numerous community development needs, Maryland has chosen to focus on the stabilization of existing communities and the revitalization of older communities as its primary goal for all its community development, economic development, and housing activities. This focus is also consistent with the goals of programs which finance revitalization activities, especially the elimination of slums and blight. Maryland will not only use its own resources as well as federal resources to accomplish this goal, but will leverage private (business and nonprofit) and local public resources, too. Infrastructure Public infrastructure is critically needed by many of Maryland’s small towns and rural areas. Counties and municipalities face expensive requirements for basic infrastructure such as water and sewer systems. Maryland’s non-entitlement jurisdictions often apply for infrastructure grants through the CDBG program to supplement limited local funds for critically needed improvements. While local officials typically use federal and State aid for construction, funds are still needed for maintenance and operating costs. Performance of scheduled maintenance is important to Maryland’s infrastructure. Deferred maintenance can cause a facility to deteriorate, ultimately raising the cost of infrastructure. The HPC working group meetings made it clear that funds to improve public infrastructure are still needed, and governmental mandates have placed a renewed emphasis upon infrastructure. Before applying for CDBG funds, the proposed project must be included in the community development plan of the jurisdiction. Planning major infrastructure projects to revitalize or maintain downtown areas is a priority of the State, and the State will provide technical assistance to communities to plan appropriately for their needs. Without such planning, emergency situations can arise due to deteriorating water and sewer systems. Public Facilities and Essential Human Services Youth Centers, head start centers, day care centers, accessible buildings and other services and facilities are essential to healthy communities. Reducing poverty in Maryland is directly related to developing communities and neighborhoods through human and physical development. The demand for funds to construct shelters and day care centers that promote human development has been growing over the years Maryland has administered the CDBG program. The survey of local jurisdictions, organizations, associations and other agencies gave the top public facility priorities to youth services and centers. Child Care centers and neighborhood centers were also high priorities.

84
Other Priorities Two additional needs that ranked high in terms of priority were transportation assistance and job training. Job training in Maryland is the responsibility of the Maryland Department of Labor, Licensing and Regulation (DLLR). Coordination of job training is handled by the Governor's Workforce Investment Board which is preparing a job training plan for the State. DHCD has been working, and will continue to coordinate its community and economic development efforts with GWIB's job training efforts, when possible. Use of CDBG Funds Given the needs as identified by various sources, DHCD has reviewed the list of eligible activities, and set CDBG priorities for the next year, and the next five years. The priorities, which are in the accompanying table, are distinct enough to channel funds to the areas of greatest need, but allow each jurisdiction sufficient latitude to determine its own development course. Acquisition, clearance and demolition are routinely required to carry out CDBG projects, especially in the revitalization of downtown areas. Though these activities were not cited specifically by the Working Groups or in the survey, they are necessary to provide the community services that were stressed. (e.g. acquiring and clearing land to make room for a day care center.) In addition, water and sewer, and street/sidewalk improvements are high priorities which insure health and safety and support housing and economic development. Accessibility needs are also high priorities of towns and counties across the State, especially since the Americans with Disabilities Act was enacted. Over five years, the CDBG program expects to fund the following projects previously identified as the non-housing priorities of the State. Actual funding depends upon the applications received from the eligible jurisdictions.
STATE OF MARYLAND Estimated Community Development Activities (CDBG)
CDBG ELIGIBLE ACTIVITY
# of Projects
Estimated Cost Over 5 Years ($)
INFRASTRUCTURE
Water/Sewer Improvements 25 $7,500,000 Planning Studies 10 $400,000 PUBLIC FACILITIES AND ESSENTIAL HUMAN SERVICES Youth Centers/Day Care/Family Support Centers/Adult Care/Centers for the Disabled
45 $17,000,000
ECONOMIC DEVELOPMENT Acquisition/Clearance for ED 5 $5,000,000 Commercial Rehabilitation 5 $2,000,000 Capital Equipment 5 $2,000,000

85
Planning 5 $50,000
The table below provides a ranking of all priority needs by CDBG eligible activity:
CDBG ELIGIBLE ACTIVITY *
PRIORITY NEED LEVEL
# Description H, M, L, N 1 Acquisition of real property. High 2 Acquisition, construction, reconstruction, or installation of public facilities. High 3 Code Enforcement. High 4 Clearance, demolition, removal and rehabilitation of buildings and
improvements. High
5 Accessibility needs. High 6 Payments to housing owners for loss of rental income incurred in holding units
for relocated individuals and families displaced by activities under the program. No such need.
7 Disposition of real property. High 8 Provisions of public services. Medium 9 Payment of the non-Federal share required in connection with a Federal grant-
in-aid program undertaken as part of activities assisted under this title. No such need.
10 Payment of the cost of completing a project funded under Title I of the Housing Act of 1949.
No such need.
11 Relocation payments for displaced individuals and organizations. Low 12 Planning. High 13 Reasonable administrative costs. High 14 Assistance to public or private nonprofit entities, for: 1. acquisition 2.
Construction/ rehabilitation, 3. Planning High
15 Assistance to neighborhood based non-profit organizations for ED. High 16 Development of energy use strategies. Low 17 Assistance to private for profit entities to carry out an ED project. High 18 Rehabilitation or construction of housing assisted under Section 17 of the United
States Housing Act of 1937. Low
19 Reconstruction of housing owned and occupied by LMI persons. Low 20 Provision of Technical Assistance that is not planning (12) or Administrative (13). Low 21 Housing services such as housing counseling, energy auditing, preparation of
work specifications, loan processing, inspections, tenant selection, management of tenant based rental assistance.
Medium
22 Assistance to institutions of higher education to carry out eligible activities. Low 23 Provisions of Assistance to public and private organizations, agencies and other
entities to facilitate micro-enterprise development. Medium
24 Maintain habitability of housing units acquired through tax foreclosure proceedings.
Low
25 Direct assistance to facilitate and expand homeownership among LMI persons. Low

85
STRATEGIES, PRIORITY NEEDS AND OBJECTIVES The State of Maryland is committed to providing decent housing, encouraging economic growth, and undertaking community redevelopment activities over the next year and the next five years. OVERALL GOALS The State's overall housing and community development goals for the next five years are:
Revitalizing Communities Encouraging Homeownership, and Expanding the Supply of Decent Affordable Housing
Citizen participation in the Consolidated Plan assisted the Department to set forth issues that needed to be addressed to make a difference for individuals and families and the community they live in. Working groups were employed in addressing issues and areas of concern. Comments, suggestions, and recommendations from these groups provided the State with an overview of local needs and priorities and strategies to address them. Significant contributions were received from local and county governments, for profit and nonprofit developers, other State agencies, advocacy groups, public housing authorities, private citizens, and professional groups. Public hearings provided input from groups, individuals, and organizations that could not participate in the working groups because of time or distance. Surveys of the State's housing, economic development, and community development needs also helped us establish our priorities, as did data to the extent new data was available. Strategies Priority - Revitalizing Communities Revitalization efforts must address economic and social issues as well as housing needs. The “holistic” approach to revitalization will maximize federal and State dollars and help assure the success of individual programs. Housing programs must complement economic and human resource efforts while providing safe, decent, and affordable housing to those most in need. Multi-family rental programs at the State level must favor those applications from areas targeted for revitalization and located in established communities (and designated growth areas) to assure that large scale housing development both strengthens existing communities and does not negatively affect the environment.
Strategy: Revitalization - Creation of a Maryland Equity Fund - One of the greatest challenges still facing community development groups is a lack of adequate capital to carry out essential revitalization activities. Without sufficient resources, great projects often get scaled back to become good projects. Other innovative efforts slated to begin this period have to be delayed until later periods and later funding rounds.
In an effort to infuse additional capital into Maryland's community development system, the Department has taken a lead role in organizing financial resources through establishment of a statewide equity fund. The fund would serve as a funding channel to help close the equity gap common in many development projects. Capitalization of the fund, currently targeted for
86
$75 million, would come from a broad cross section of institutions including foundations, government, and the private sector. The Department has allocated state resources of $100,000 to cover 50 percent of the costs of a feasibility study to investigate the viability of the fund. The remaining 50 percent was funded through donations from foundation, private, and non-profit sectors in Maryland. The results of the study will be fully reported out later this calendar year and will help chart directions for future planning and program development.
Implementation/measures: Preliminary results from the feasibility study indicate that the
project is viable. The study will be released after minor modification and comprehensive review later this summer. It is anticipated that two funds will be established: a Workforce Housing Fund and a Commercial Revitalization Fund. The success of the Funds will be measured by the amount of new capital that is able to be generated to help meet the state’s need for additional workforce housing and commercial development. An additional outcome is the number of projects that these Funds are able to support.
Strategy – Revitalization - Usage of Bond Proceeds - Furthering our efforts to increase the availability of capital for community projects, the Department will put into place a system that will allow it to use bond proceeds to provide gap financing for small business development. This system will permit the Department to supply as much debt as demanded throughout the state. Through this approach, the Department will be able to expand its financing support of community-based small business development ventures which include pharmacies, florist shops, restaurants...it is anticipated the result will include an expansion of capital that will support more than 50 million in small business development annually.
Implementation/measures: It is anticipated that the bond program will be fully in place
in early 2006. Beginning in 2006, the program, in conjunction with its securitization potential, is expected to make available additional capital in the amount of $5 million to support small business development throughout the state. In later years (2007-2010), additional funds in the range of $5 - $10 million will be made available to meet statewide demand for small business finance. These valuations represent estimates of the potential demand for low-interest financing for business startup and expansion.
Strategy: - Revitalization - Integration of Resources for Infrastructure - As financial resources become scarcer, it becomes more important that funds, particularly grant funds, are distributed more equitably. In an effort to improve the efficiency of funding resources for infrastructure development and improvements, and increase access for clients to infrastructure resources, DHCD will improve coordination and cooperation both within programs in the Department and across state and federal agencies. Strategies for this will include a single application for infrastructure funding, development of a priority funding list and meetings with other agencies to refer applicants to the appropriate funding source.
Implementation/measures: DHCD is in the process of developing a work plan to accomplish this strategy. The work plan, to be completed during summer 2005, includes development of a working document addressing best practices for cross-agency coordination of capital financing products; and coordination of meetings of Maryland stake-holders providing opportunities for collaboration, joint funding, new process development and greater efficiencies for infrastructure finance.

87
Strategy: Revitalization -:Expansion of Participation in CDBG Program - Increase ability of CDBG non-entitlement jurisdictions to identify and implement creative responses to community based needs through technical assistance and expanded partnerships. The Department seeks to identify communities that have not participated in the CDBG Program to provide assistance in determining community needs and resources to address them, build capacity to administer a CDBG grant or identify partners who can assist. Much of this work will be performed under the heading of a newly created community development training academy known as DHCD Catalyst.
Implementation/measures: DHCD Catalyst will identify and offer assistance to targeted communities that have not previously participated in the CDBG Program. The Department will also conduct outreach including Catalyst workshops, one-on-one meetings, and other forms of technical assistance that will explain the CDBG program as well as discuss community development planning and project implementation. DHCD Catalyst will track the number of jurisdictions or persons receiving technical assistance or training to increase accessibility to resources for sustaining suitable living environments and creating economic opportunities.
Strategy: Revitalization - Participation in Priority Places – In order to foster well-planned new development, redevelopment in and around existing communities, and encourage land-use patterns that are good for the economy, quality of life and the environment, the Department will participate in the Priority Places Strategy. The goal of Priority Places is to focus state resources and activities on particular places and projects within designated Priority Funding Areas. State agencies will work together to positively impact the cost, timing and design of development.
The Interagency Coordinating Committee, which includes a representative from DHCD, will ensure the full participation and commitment of each state agency, with Coordinating Committee members serving as ombudsmen for Priority Places. The ombudsmen will have appropriate levels of authority and access to program directors to serve effectively in their dual roles of tapping internal resources and coordinating with other agencies. In addition, the State will assign a project manager to each Priority Place, and that person will serve as the primary state contact.
Implementation/measures: DHCD staff will assist with review of Priority Places
applications and implementation of approved Priority Places. Assistance provided by staff at the Division of Neighborhood Revitalization will help assure the success of local community development plans. Specific assistance provided by DHCD will vary depending on the community served, but may include:
Technical assistance identifying, applying for and securing funding from state and
non-state resources Coordination with other state, local and private entities to help implement Priority
Places strategies Assistance in refining local community development strategies such as Main Street
revitalization plans and Community Legacy plans Providing gap financing to help make projects occur make happen

88
Strategy: Revitalization - Resources. Maryland's resources will be targeted toward Priority Funding Areas (PFAs) to the greatest extent possible.
Implementation/measures: Project/activity locations will be reviewed to ensure they are
located in Priority Funding Areas to the greatest extent possible.
Strategy: Revitalization - Infrastructure. DHCD will give priority to funding infrastructure projects, in Priority Funding Areas. Such projects will help meet the critical health and safety needs of older communities.
Implementation/measures: Project/activity locations will be reviewed to ensure they are located in Priority Funding Areas to the greatest extent possible.
Strategy: Revitalization - Day Care Centers, Youth Centers, and Adult Centers. DHCD also will give priority to day care, youth, and senior center projects, with CDBG funds. Funding for these projects will help provide needed community services in PFAs.
Implementation/measures: The usage of CDBG funds for day care centers, youth centers and adult centers will be promoted. The number of households and persons with new or improved access to affordable services and facilities for the purpose of creating a suitable living environment will be tracked.
Strategy: Revitalization - Neighborhood Business Works Program. DHCD will expand the use of the Neighborhood Business Works Program, providing more opportunities for small businesses in State-approved, locally designated neighborhood revitalization areas. The creation of new businesses, or the expansion of existing businesses, will help revitalize and stabilize communities.
Implementation/measures: This strategy will be accomplished using proceeds from the Bond Program as described above.
Strategy: Revitalization – Community Investment Tax Credit Program. DHCD will work to market the Community Investment Tax Credit Program (CITI) and encourage more businesses to purchase Maryland tax credits issued under the Program. Such efforts will expand the resources for non-profits to provide services to low-income households.
Implementation/measures: DHCD is implementing a marketing plan to encourage more
businesses to purchase tax credits. The marketing plan includes provision of marketing training to non-profits and publication of advertisements and stories regarding CITC in business-related publications. At least one DHCD Catalyst training will be held annually regarding marketing tax credits; the number of business-related publications in which CITC is advertised and/or stories about the program are published will be tracked, and the number of new businesses which contributed tax credits will be tracked.
Strategy: Revitalization - Interdepartmental Cooperation. DHCD will work cooperatively with other State agencies during the next five years in its effort to not only provide quality affordable housing, but to rebuild healthy communities as well. The Department will actively participate in interdepartmental groups including the Sub-cabinet on Smart Growth, and will

89
call together interdepartmental working groups as needed to foster community revitalization activities.
Implementation/measures: In order to accomplish this strategy, DHCD will participate in the Smart Growth Sub-cabinet as well as monthly Smart Growth and Neighborhood Conservation Interagency Coordinating Committee meetings. The number of meetings attended will be tracked.
Priority - Encouraging Homeownership Homeownership is often called the American Dream. Homeownership builds wealth, stabilizes communities, and encourages people to become more involved in the life of their communities. Households living in communities with higher rates of homeownership experience less crime, have higher educational test scores, have fewer teenage pregnancies, and have a generally higher over-all level of well being. The lower level of social problems in communities with higher homeownership rates saves the government money, as less money is required to fund services.
Strategy: Homeownership - Financing. DHCD will provide financing for primarily first-time homebuyers to purchase their own home. DHCD also will provide down payment assistance primarily to first time homebuyers.
Implementation/measures: This strategy will be implemented using the Maryland
Mortgage Program, Maryland Home Financing Program, and Downpayment and Settlement Expense Loan Program. The number of units will be counted and measured against the expected five-year goal (set at 13,200 over the next five years).
Strategy: Homeownership - Fair Housing Choice. DHCD will continue to carry out its fair housing strategy in order to promote equal housing opportunity for all of Maryland's citizens. This strategy includes information and education campaigns, inspecting State-financed construction projects to ensure compliance with Americans With Disabilities Act access requirements, and working with CHRBS to train the real estate community on fair housing requirements, among other actions.
Implementation/measures: DHCD will carry out the strategy of promoting fair housing choice by contracting with fair housing organizations/CHRBS to conduct education and outreach campaigns. Compliance with ADA requirements will be made by DHCD staff. DHCD will track will report on fair housing activities undertaken by its contractor, as well as monitoring efforts taken by the department.
Strategy: Homeownership - Homeownership for Persons with Disabilities. DHCD will continue to operate its Homeownership for Persons with Disabilities Program. This program provides homeownership opportunities to persons who have disabilities and have been unable to access the private financing.
Implementation/measures: This strategy will be carried out under the Homeownership for Persons with Disabilities Program. The number of units will be counted and measured against the expected five-year goal (set at 225 over the next five years).

90
Strategy; Homeownership – Homeownership for Section 8 HCVP Participants DHCD will provide homeownership opportunities to eligible and qualified participants through its Section 8 Housing Choice Voucher Program (HCVP) Homeownership Option. This program provides voucher subsidies toward a home mortgage and other costs similar to a rent subsidy.
Implementation/measures: This strategy will be carried out by CDA and accomplished using the Section 8 Voucher program. DHCD expects that a total of 25 families, or five per year, will be assisted under this program. Families assisted will be reported.
Strategy: Homeownership - Creative Opportunities. DHCD will work to create innovative home ownership opportunities.
Implementation/measures: This strategy will be accomplished on an ad-hoc basis as these opportunities depend on federal tax law, bond proceeds, reserves, insurance requirements and State and federal financing. Three creative opportunities expected to be implemented in the coming year include establishing a 35 year mortgage product, establishing a 40 year mortgage product, and having the Maryland Housing Fund return to the practice of issuing single-family insurance. DHCD will report these types of activities to HUD when they occur.
Strategy: Homeownership - Improve and Expand Marketing. DHCD will expand marketing of its homeownership programs.
Implementation/measures: This strategy will be accomplished by the Office of Marketing, which will conduct marketing campaigns to promote the program. These marketing campaigns will be tracked and reported.
Strategy: Homeownership – Reduce Homeownership Delinquencies. DHCD will work to reduce single family delinquencies and foreclosures through proactive intervention measures.
Implementation/measures: This strategy will be accomplished by both CDA and the Maryland the Maryland Housing Fund. This will include both support of housing counseling efforts, as well as work outs and other actions for loans in DHCD’s portfolio. Success will be measured against comparable FHA delinquency and foreclosure rates.
Priority - Expand the Supply of Decent Affordable Housing Many of Maryland's most vulnerable citizens need decent affordable housing. This includes the poor, the homeless, the elderly, and frail elderly, and persons with disabilities. Renters may pay excessive rent that puts them in danger of homelessness. Homeowners may lack the finances to repair health and safety problems in their residences. Some persons may require social services to allow them to age in place, or to mainstream into the community at large. Others simply need the most basic level of shelter to get off the streets before making the transition back into society.
Expand the Supply: Strategy - Rental Housing DHCD will finance quality affordable rental housing. DHCD will do this using private, federal, local, and State resources.
91
Implementation/measures: This strategy will be accomplished using State funds, federal HOME funds, bond funds, and low-income housing tax credits, among other resources. The number of units will be counted and measured against the expected five-year goal of producing 13,500 affordable rental units in the next five years.
Expand the Supply: Special Needs Housing The State will create a Bridge Subsidy Demonstration Program for individuals with disabilities by reallocation of existing resources of funds from DHCD and other State agencies, for the purpose of providing short-term rental assistance for up to three years, while the individuals await for assistance such as a Section 8 Housing Choice Voucher.
Implementation/measures: This strategy will be accomplished using funding from DHCD, DHR, DHMH, and other state agencies. DHCD will fund the first year, and other agencies will fund the program in future years. The number of units will be counted and measured against the expected five-year goal of 350 units for this effort.
Expand the Supply: - Special Needs Housing DHCD will participate in the review process of the State’s surplus property inventory to assist with the identification of land appropriate for housing development, which includes workforce housing, senior housing and housing for individuals with disabilities, including those at Social Security (SSI) level income.
Implementation/measures: This strategy will be accomplished working with DHR, DHMH, MDoA, MDoP, and the Maryland General Services Administration. Properties used for the purpose of affordable housing will be reported.
Expanding the Supply – Special Needs Housing DHCD will participate in an inter-departmental steering committee lead by the Department of Budget and Management to address service deliver efficiencies and 1) direct a portion of any State saving and/or 2) direct existing resources for the production of affordable housing for seniors and individuals with disabilities at SSI level income, regardless of age.
Implementation/measures: This strategy will be pursued by DBM, DHCD, DHMH, DHR, MDoA and other appropriate agencies. As efficiencies are implemented they will be identified in Annual Plan updates with concurrent measures.
Expand the Supply: Strategy - Supporting Other Providers DHCD will support the applications of housing providers who provide affordable housing for which DHCD is not an eligible applicant, as well as those whose offer proposal consistent with the Consolidated Plan. This includes support for persons and organizations applying for Section 202, Section 811, Farmer's Home, and other federal funding.
Implementation/measures: This strategy will be accomplished by DHCD’s work with the Governor’s Grants office, as well as supporting applications with Certificates of Consistency with the Consolidated Plan as appropriate. Information on successful grant applications will be reported.
Expand the Supply: Strategy - Lead Paint Abatement. DHCD will work with MDE, local governments, and property owners to help abate lead paint. Abatement of lead paint will help prevent the illnesses and developmental problems caused by lead paint poisoning of

92
Maryland's children. By incorporating MDE’s rental property registration and risk reduction requirements into HUD Housing Quality Standards for approving properties under the Section 8 Housing Choice Voucher Program, DHCD will facilitate compliance with State laws covering rental properties built before 1950.
Implementation/measures: This strategy will be accomplished using both State and federal funds. Units abated will be reported.
Expand the Supply: Strategy - Homelessness Assistance. DHCD will help support Maryland's Continuum of Care for assisting the homeless. Specifically, DHCD will use the ESG program to continue to support shelters and its own Transitional Housing Grant Program to build emergency and transitional shelters for homeless persons. DHCD also will use RAP funds to provide rental assistance to families and individuals as they achieve self-sufficiency.
Implementation/measures: DHCD will report on the shelters assisted with the ESG program and the Transitional Housing Program, and the number of households assisted under RAP (expected to be 7,700 over the next five years).
Expand the Supply: Housing Rehabilitation. DHCD will use its Special Loans programs to rehabilitate owner-occupied and small rental properties. DHCD will also use federal programs like DOE's Weatherization program to make housing more energy efficient.
Implementation/measures: This strategy will be carried out by DHCD. The number of
households assisted will be reported (expected to be 7,395 over the next five years).
Expand the Supply: Tenant Assistance. DHCD will work to expand rental assistance available to low-income households. This will include applying for Section 8 Vouchers, as well as using the State's own RAP program to provide temporary rental assistance to needy households. Through a HOME Program grant, DHCD will provide security deposit assistance to certain families who, without this assistance, could not lease a unit offered by a landlord under the Section 8 voucher program.
Implementation/measures: This strategy will be carried out by DHCD. Funding will be dependant on federal resources. The number of families assisted will be reported.
Expand the Supply: Supportive Housing. DHCD will continue to work with its sister agencies and local organizations to finance group homes for persons with mental illness, developmental disabilities, or other problems that require supportive housing.
Implementation/measures: This strategy will be carried out by DHCD. Success will be measured against the five year goal of 285 beds.
Goals for Persons who are homeless or who have Special Needs In addition to the goals above, the State will carry out other efforts to assist needy families and individuals, including the homeless and persons with Special Needs. While DHCD will be providing assistance to the homeless and persons with Special Needs as noted above, primary responsibility for assisting these individuals rests with the Department of Human Resources and the Department of Health and Mental Hygiene.

93
Homeless Goals: Maryland has long been an advocate of the “Continuum of Care” approach of serving homeless persons and persons threatened with homelessness. The three principal features of Maryland’s Continuum of Care are: 1. Preventing low-income individuals and families from becoming homeless, providing
outreach to homeless persons, and addressing their individual needs; 2. Addressing the emergency shelter and transitional housing and service needs of
homeless individuals and homeless families; and 3. Helping homeless people make the transition to permanent housing and independent
living. Homeless persons to be assisted include homeless individuals, homeless families with children, the severely mentally ill homeless, homeless persons with alcohol or other drug addiction problems, homeless fleeing domestic violence, homeless youth, homeless individuals diagnosed with AIDS and other related diseases, and any other homeless individuals or persons at risk of becoming homeless. The Continuum is discussed in detail in the Annual Action Plan portion of this document. DHR has primary assistance for helping the homeless. The table below shows the estimated assistance DHR expects to offer the homeless in the next five years:
HOMELESS ASSISTANCE - DEPARMENT OF HUMAN RESOURCES
UNITS OF MEASUREMENT Five Year Estimated Assistance
EMERGENCY AND TRANSITIONAL HOUSING SERVICES Bednights in Emergency Shelters 400,000
Bednights in Transitional Facilities 325,000
Shelters and Transitional Facilities 400Emergency Services 135
HOMELESS PREVENTION Housing Counseling 2,500Eviction Prevention 60,000Service Linked Housing 10,000
EMERGENCY FOOD ASSISTANCE Occasions of Service Annually 2,250,000
Pounds of Food Distributed 22,500,000DOMESTIC VIOLENCE PROGRAM Bednights for Domestic Violence Victims and Their Children 325,000
WOMEN'S SERVICES PROGRAM Bednights for Women and Children 425,000

94
Special Needs Goals: The Department of Health and Mental Hygiene has primary responsibility for assisting persons with Special Needs, including individuals with Mental Illness, Developmental Disabilities, and Alcohol and Drug addictions. The tables below show the estimated assistance they expect to provide over the next five years. (Note that in all cases, an individual may receive assistance more than once over the five years, so there may be double counting.)
DEPARTMENT OF HEALTH AND MENTAL HYGIENE Mental Hygiene Administration
UNITS OF MEASUREMENT Five Year Estimated Assistance
Individuals Discharged from Inpatient Treatment – Adults 24,835
Individuals Discharged from Inpatient Treatment – Children
12,710
Persons with SMI receiving Employment Services 5,755
Persons with SMI receiving Residential Rehab 14,765
Number of Adults receiving psychiatric support 40,615
Number of Adults who receive public mental health 226,415
Number of Children receiving community based services 220,735
Number of Children receiving psychiatric support 45,670
DEPARTMENT OF HEALTH AND MENTAL HYGIENE
Developmental Disabilities Administration UNITS OF MEASUREMENT Five Year Estimated Assistance
Number of Individuals Served 110,100Number of Individuals receiving home based services
38,915
Number of Individuals moved out of State Centers 65Clients receiving community residential services 24,235Clients in Day programs 27,785Summer Program 9,410Family Support Services 14,310Individual Family Care 1125Individual Support Services 26,225Behavioral Support Services 6,500Community Supported Living Arrangements 5,895

95
DEPARTMENT OF HEALTH AND MENTAL HYGIENE Alcohol and Drug Abuse Administration
UNITS OF MEASUREMENT
Programs/ Facilities
Five Year Estimated Assistance
Outpatients 65 135,000Residential Clients 25 30,000
Halfway House 19 2850Methadone Maintenance 18 35,000
The table below (corresponding to HUD Table 1C) is provided at HUD’s request in an attempt to provide Performance Measures for HUD programs. HUD is currently in the process of making extensive revisions to its Performance Measurement process, so it is unlikely these measures will remain in effect. Note that the table has double counting, and that it asks for actual numbers of units produced which will not be available for at least five years. Also note that some measures reported here are repeats of measures stated elsewhere in the Plan.
Summary of Specific Homeless Needs Objectives
Specific Objectives Performance
Measure Expected
Units Over Five
Years
Actual Units
Over Five Years
Homeless Objectives
1 Preventing Homelessness 1.1 DHR - Housing Counseling Persons Counseled 2,5001 2,5004
1.2 DHR - Eviction Prevention Households Assisted 60,0001 60,0004
1.3 DHR - Service Linked Housing Households Assisted 10,0001 10,0004
1.4 DHCD – Emergency Shelter Grants Families Assisted 6,5001 6,5004
2 Emergency and Transitional Housing
2.1 DHR - Bednights in Shelters Persons Sheltered 400,0001 400,0004
2.2 DHR - Bednights in Transitional Facilities Persons Sheltered 325,0001 325,0004
2.3 DHCD – Transitional Housing Provided Beds Financed 3001 3004
2.4 DHR – Domestic Violence Program Persons Sheltered 325,0001 325,0004
2.5 DHR – Women’s Services Program Persons Sheltered 425,0001 425,0004
3 Permanent Housing 3.1 HUD – Supportive Housing Programs Households Assisted 4002 4004
NOTE: The Permanent Housing goals only include programs specifically designed to provide permanent housing for the homeless. It does not include DHCD apartment units financed that the formerly homeless may rent.

96
Summary of Specific Homeless Needs Objectives (continued)
Specific Objectives Performance
Measure Expected
Units Over Five
Years
Actual Units
Over Five Years
Special Needs Objectives 1.1 DHCD – Special Needs Units in
Apartment Complexes Financed Units in Developments 5001 5004
1.2 DHCD – Supportive Housing in Group Homes
Beds Financed 2851 2854
1.3 DHCD/DHMH/DHR – Rental Assistance through Bridge Subsidy Program
Households Assisted 3501 3504
1.4 DHCD – Homeownership for Persons with Disabilities
Homes Financed 2251 2254
1.5 DHMH – Patients with Severe Mental Illness receiving Residential Rehab
Persons Assisted 14,7651,3 14,7654
1.6 DHMH – Clients with Developmental Disabilities receiving residential services
Clients Assisted 24,2351,3 24,2354
1.7 DHMH – Persons with Alcohol or Drug Addictions receiving rehabilitation through Residential Settings
Persons Assisted 30,0001,3 30,0004
1.8 DHMH – Persons with Alcohol or Drug Addictions served through Half-way Houses
Persons Assisted 2,8501,3 2,8504
1. Includes Assistance in Both Entitlement and Non-Entitlement Jurisdictions 2. Included Assistance in Non-entitlement Jurisdictions only, and would include“double counting” as
projects are renewed. 3. May include double counting for clients assisted over multiple years 4. HUD has requested actuals, although this is impossible to determine as actual assistance will not
be known for at least five years. Therefore, projected units are used.
Geographic Targeting Data provided by HUD on housing need revealed there was a great similarity of need from jurisdiction to jurisdiction. For example, if the percentage of "small, very low-income renter families" was 65 percent statewide, virtually every jurisdiction within the State would be within a few percentage points of the Statewide average. Since need exists throughout the State, the State will not target its funds to certain jurisdictions except as established by law. For example, the State's allocation of ESG and CDBG funds may only be used in non-entitlement areas. However, since there is a major emphasis on directing resources to areas in need of revitalization, and community revitalization is one of the State's three main goals, resources will be focused to the greatest extent possible on Priority Funding Areas. The Section 8 Existing Voucher/Certificate, Section 8 Moderate Rehabilitation, Community Services Block Grant (CSBG). Federal and State Historic Tax Credits, and Federal Historic Preservation Grants are except from both federal geographic targeting and State Priority Funding

97
Area (PFA) restrictions. However, the following federal resources will be directed toward specific geographic areas as described below. Emergency Shelter Grant (ESG) Emergency Shelter Grant funds are awarded through a formula established by the federal government. The State's allocation of ESG funds may be used anywhere in Maryland except Anne Arundel, Baltimore, Montgomery, and Prince George's Counties and Baltimore City. These five jurisdictions receive their own allocations of ESG funds directly from the federal government, thus are not eligible for the State allocation. Because of the nature of homelessness, the ESG program is exempt from PFA requirements. Farmers Home Programs (All) The U.S. Department of Agriculture's Farmer's Home Administration (FmHA) Programs were established to provide safe, decent, affordable housing to the Nation's rural and farm communities. All FmHA programs (502, 515, 523, etc.) are restricted for use in "rural areas" which include open country and places with populations of 50,000 or less. FmHA loans are exempt from State PFA requirements, however FmHA is working with the State to encourage the use of their programs in PFAs. HOME Investment Partnerships Program (HOME) The HOME program was established under the Cranston-Gonzalez National Affordable Housing Act of 1990. The State's allocation of HOME funds may not be used in Anne Arundel, Baltimore, Harford, Montgomery, and Prince George's Counties and Baltimore City. These jurisdictions are HOME entitlement jurisdictions and receive their own HOME funds directly from HUD. In non-entitlement jurisdictions, HOME funds are restricted to PFAs except where the Secretary determines that the project is necessary: a) to prevent or ameliorate neighborhood blight, b) to protect public health, or c) to alleviate personal economic hardship in an emergency situation. Low-Income Housing Tax Credits Federal Low-Income Housing Tax Credits may be used within the State of Maryland's PFAs. However, in accordance with federal law, states are required to develop allocation criteria which disperse the tax credits across the State through an IRS approved competitive process. Maryland has an approved competition process which awards points based, in part, on location. This process has ensured a fair distribution of tax credit properties in all areas of the State. Areas which receive points for geographic distribution vary year by year and competition by competition depending upon the number of applications received from Maryland's various jurisdictions. As per the approved process, all tax credit projects will be located in PFAs. Maryland Appalachian Housing Fund (MAHF) Maryland Appalachian Housing Fund resources are allocated to the State through the Appalachian Regional Commission. Federal law restricts expenditure of these funds to Allegany, Garrett, and Washington Counties in Western Maryland. MAHF funds are not restricted to PFAs in these counties.

98
Community Development Block Grant (CDBG) Community Development Block Grant funds are awarded through a formula established by the federal government. The State's allocation of CDBG funds may not be Anne Arundel, Baltimore, Harford, Howard, Montgomery, and Prince George's Counties and the cities of Annapolis, Baltimore, Bowie, Cumberland, Frederick, Gaithersburg, Hagerstown and Salisbury. These jurisdictions receive their own allocations of CDBG funds directly from the federal government, and are not eligible for use of the State allocation. Use of CDBG funds in non-entitlement jurisdictions is restricted to PFAs, except where the Secretary determines that the project is necessary: a) to prevent or ameliorate neighborhood blight, b) to protect public health, or c) to alleviate personal economic hardship in an emergency situation or where an exception has been granted through the Department of Planning process. Maryland Mortgage Program
Home loans for new homes made under the State's Maryland Mortgage Program will be restricted to PFAs, except for loans financed through the "On Behalf Of" (OBO) bond issue. Loans made under the OBO bond issue are not restricted to PFAs because the State is issuing the bond on the behalf of Maryland's counties. It is the responsibility of the counties to decide on the geographic targeting they will use for their OBO funds.
Housing Priorities In addition to setting overall goals, the State also has developed specific goals for households to be assisted who are not homeless or who do not require supportive services. After careful review, the State has chosen the following housing priority populations:
1. Extremely Low-Income Renters 2. Low-Income Renters 3. Extremely Low-Income Homeowners 4. Low-Income Homeowners 5. Moderate-Income Renters 6. Moderate-Income Homeowners 7. Middle-Income Renters 8. Middle-Income Homeowners
The State of Maryland will provide numerous types of assistance for both renters and homeowners, including acquisition and substantial rehabilitation of affordable housing, moderate rehabilitation of housing, preservation of the existing housing stock, lead paint abatement, emergency and transitional housing, supportive services, new homeownership opportunities, tenant assistance, innovative projects, and new construction of affordable housing Basis For Assigning Priority Housing Needs The State priorities for assistance are based on numbers of persons with housing problems, as well as the inability of households with problems to address their own needs. For example, extremely low-income renters have both the highest needs, as well as the least ability to address

99
them on their own. Consequently, they are the State’s highest priority for federal assistance. Low-income renter households, who also have high need, are ranked second. Extremely low-income homeowners and low-income homeowners rank next, followed by moderate income renters and moderate income homeowners, who have the fewest housing needs. It is also important to distinguish between the percent of households with housing needs and the actual number of households with housing needs. While large family renter households rank at the top in terms of percent of households with housing problems, the actual number of large households with problems is smaller than any other tenure group. For example, there are almost four times as many small family households with housing problems, despite the actual percent being lower. This is also true for elderly and other households. Despite the percentages of households with problems being somewhat lower, because there are so many more small, elderly, or other households, the actual number of people with problems is much higher for these groups than for large families. Consequently, we do not make any distinctions between households of different sizes.
PRIORITY NEED LEVEL
HIGH, MEDIUM, LOW, NO SUCH NEED
PRIORITY HOUSING NEEDS
0-30% 31-50% 51-80%
CB> 30% H H M
CB>50% H H M
SUBSTND H H M
SMALLRELATED
OVRCRD H H M
CB> 30% H H M
CB>50% H H M
SUBSTND H H M
LARGE RELATED
OVRCRD H H M
CB> 30% H H M
CB>50% H H M
SUBSTND H H M
ELDERLY
OVRCRD H H M
CB> 30% H H M
CB>50% H H M
SUBSTND H H M
RENTER
ALL OTHER
OVRCRD H H M
OWNER CB> 30% H H M
CB>50% H H M
SUBSTND H H M
OVRCRD H H M
*By Definition, "other" renter households can not be overcrowded. CB means “cost burdened”

100
OBJECTIVES Because they have significantly different housing needs and problems, Maryland has established different objectives for renters and owners. Renters
Objective: The primary objective for assisting renters is to provide them with safe, decent, affordable housing.
To assist the tens of thousands of extremely low- and low-income renter families that have housing problems, DHCD will undertake the following activities over the next five years:
Substantial rehabilitation Moderate rehabilitation New construction Preservation Tenant assistance, and Lead paint abatement
DHCD also will work to move renter households into homeownership (see the homeownership objectives below.) As noted earlier in the Consolidated Plan there are many projects, which are eligible to prepay their mortgages. The Department is working to keep developments in the low-income housing stock so those very low-income households do not become homeless. Also of concern to the Department is the possibility that Congress may not renew the Section 8 contracts within these developments. If that occurs, there will be a substantial need for thousands of units of affordable rental housing. Tenant based subsidies (most Section 8) have the advantage of reducing the amount of income paid for rent, and giving mobility to low-income households to move closer to jobs, schools, transportation, etc. Mortgage based subsidies are development specific, and while they offer affordable housing, they offer less choice to the tenant because the tenant has to live in that development rather than where he or she chooses. However, the disadvantage of tenant-based subsidies is that they work only as long as funds are appropriated year after year for contract renewals. Once funding is cut, the tenant's rent is no longer subsidized and the rent is no longer affordable. The advantage of mortgage-based subsidies, unlike rental subsidies, is that they last as long as the mortgage, which is typically 30 or 40 years, and require no new applications to keep housing affordable for the life of the mortgage. DHCD's own programs, as well as the federal HOME and CDBG programs (among others), can be used to ensure the creation of affordable housing for long periods of time. For that reason, DHCD will continue to push ahead with the rehabilitation and construction of affordable rental housing using State and federal funds, while continuing to seek funds, such as Section 8, that provide tenant assistance and tenant choice.

101
In addition to paying excessive rent, extremely low-and very low-income renter households are the most likely to live in housing with lead paint problems. More than 54 percent of all persons who live in units with lead paint are in these two categories of renters. Homeowners
The first objective of the State's homeownership activities will be to provide affordable homeownership opportunities to first-time home buyers.
The second objective of the State homeownership activities will be to rehabilitate
substandard housing occupied by extremely low, very low, and low-income homeowners.
Activities to be undertaken to assist very low-income homeowners include:
home buyer's assistance to first-time home buyers acquisition assistance to first-time home buyers
moderate rehabilitation assistance for existing homeowners, and mortgage insurance
Homeownership is commonly called "The American Dream". It is difficult to estimate the number of persons who are currently renting who would like to become homeowners. However, assuming that just half of all renters would like to own their homes, that would mean about 300,000 households desire to purchase a house. Many low-income renters have enough income to purchase at least a "starter" home in most areas of the State. The needs of many low-income Maryland residents can best be met by giving them the opportunity to become first time homeowners.
Resources In order to carry out its objectives, the State will dedicate a wide array of resources toward meeting the goals of Maryland's neediest households. Federal Resources DHCD expects to receive about $8,005,956 in HOME Investment Partnerships Program (HOME) entitlement funds for housing next year. This is the only entitlement funding for housing the State receives. The amount of funds the State is expected to receive over the next five years is about $40 million. DHCD expects to receive about $8.9 million in Community Development Block Grant (CDBG) fund for housing, community development, and economic development in the next year. The State expects to receive about $45 million in CDBG over the next five years. DHCD expects to receive about $599,886 in Emergency Shelter Grants (ESG) funds in the coming year. This amount varies from year to year as the ESG allocation is based on the discretion of the Secretary of HUD. There are currently proposals in Congress to block grant

102
ESG funds with other homeless funds. Because there is so much fluctuation in funding for this program, DHCD does not have a five-year projection for funding. DHCD administers the Section 8 Voucher program on behalf of many local jurisdictions. DHCD expects to administer $60 million in Section 8 fund during the next year. The amount of funds the DHCD expects to administer over the next five years is approximately $200 million assuming the State continues to administer Section 8 for the same number of jurisdictions it does presently. Maryland receives an annual per capita allotment of Federal Low-income Housing Tax Credits every year. These numbers are based on the State's estimated population, and are updated yearly. The current allocation amount is $1.85 per capita. Based on current population projections, the State should receive $52 million in tax credits over the next five years. The Federal Mortgage Revenue Bond (MRB) program provides funding for mortgages for first time homebuyers. MRB authority is derived from the Internal Revenue Service based on State population. The federal government also caps the issuance of MRBs. DHCD expects to use about $150 million in MRBs authority over the next year for homeownership mortgages, and about $300 million in rental housing mortgages. DHCD expects to use about $2.49 billion in MRBs over the next five years. However, if DHCD and other housing organizations are successful in increasing the cap on MRBs, we will be able to issue over $300 million in additional MRBs for homeownership and rental housing over the next five years. In addition to the above programs, the State of Maryland has received funds under numerous competitive federal housing programs. In many instances DHCD cannot apply for these funds, however non-profit and profit motivated developers, community action agencies, public housing authorities and other organizations and individuals may apply for competitive funds. These numbers can vary widely from year to year. Examples of competitive funding these organizations receive include competitive Section 202 funds for supportive elderly housing, Section 8 Vouchers, HOPE funds for public housing, and Section 811 homes to help persons with disabilities, among others. Funds were also awarded under other competitive programs, and the State strongly supports and encourages applications for funding under any federal program that helps meet the State's housing, community development, and economic goals. In addition to HUD funds, the Farmer's Home Administration of the U.S. Department of Agriculture has also been a major supplier of rental housing in the past, primarily through new construction activities in rural areas. More than 4,000 rental units have been constructed in Maryland's rural counties using Farmer's Home funds. In addition, the Administration has operated a number of homeownership and rehabilitation programs that assist persons to buy their first homes and help existing homeowners rehabilitate their homes. Farmer's HOME also provides housing for migrant workers. DHCD has leveraged substantial HOME resources against Farmer's Home first time homebuyers programs to promote homeownership opportunities in rural areas where lending institutions have been unable to make homeownership loans. The State strongly supports the use of Farmer's Home funds for homeownership, rental housing, housing rehabilitation, and migrant housing. Also from a non-HUD source, DHCD expects to receive approximately $2.9 million in U.S. Department of Energy Weatherization funds during the next fiscal year. The amount of funds

103
expected over the next five years is about $14,250,000. However, the amount of funds available under this program varies considerably from year to year, so the amount may be much higher or lower. These funds are used for energy related improvements, including providing insulation, weather-stripping, new windows, installation of furnaces, and other work that makes housing more energy efficient. State Resources The State of Maryland has substantial resources of its own which can help the State address its housing needs. DHCD's Housing Development Programs finance multi-family rental housing developments of five or more units. Over the next five years, these programs expect to receive a total appropriation of about $96 million. DHCD's Homeownership Programs uses State funds to assist first time home buyers purchase their homes through help with settlement and closing costs, helps the elderly access the equity in their homes through reverse equity mortgages, and helps very low- income persons become first time home buyers. Homeownership Programs expects to receive appropriations totaling approximately $37.5 million over the next five years. DHCD's Special Loan Programs focus on two areas: rehabilitation of owner-occupied and small rental housing projects (four or fewer units) and providing group home loans for the developmentally disabled. DHCD expects to receive about $36 million in rehabilitation funds over the next five years. DHCD also operates its own Housing Subsidy Programs. The most important of these is the Rental Allowance Program, which provides rental assistance to very low-income families who are homeless or are threatened with homelessness. DHCD expects to receive about $8.5 million in RAP funding over the next five years.
Accomplishments DHCD as part of its efforts to provide more affordable housing opportunities to Maryland’s citizens plans to produce an average of 6,200 housing units a year for the next five years, for a total of 31,000 units. This would include an average of 3,600 rental units per year, for a total of 18,000 over the next five years, and 2,600 homeownership units annually, for a total of 13,000 over the next five years. This is based on the current State funding support with planned innovations and enhancements to the homeownership and rental housing programs noted above. These enhancements are innovations are largely predicated on improving DHCD’s revenue bond programs. DHCD is also required to provide information in the Consolidated Plan specifically about housing goals under the HOME program. The table below shows the number of units expected to be produced with HOME funds over the next five years:

104
HOME ASSISTED UNITS - FIVE YEAR PROJECTION TENURE TYPE
HH TYPE
HOUSING PROBLEM
0-30%
31-50%
51-80%
TOTAL
CB>30% 30 180 210Small Related CB>50% 40 205 245
CB>30% 50 30 25 105Large Related CB>50% 110 30 25 165
CB>30% 115 60 175Elderly CB>50% 205 60 265
CB>30% 195 60 255
RENTER
All Other CB>50% 280 90 370
CB>30% 135 120 65 320
CB>50% 135 120 65 320
Substandard 335 200 155 690
OWNER
Overcrowded 30 20 5 55CB is “cost burdened”
Estimated Five Year Projection – All Units Program Household Type Units Total Units
Family 7,155 Elderly 5,805
Rental Housing
Special Needs 540
13,500
Family 7,364 Rental Subsidy Special Needs 375
7,739
Family 13,200 Homeownership Special Needs 225
13,425
Family 7,395 Special Loans Special Needs 285
7,680
TOTAL 42,344NOTES: DHCD’s rental housing programs are competitive, estimates are based on past performance. Rental Subsidy, Homeownership, and Special Loans programs do not target by elderly versus family. Special Needs Units under rental housing are units produced through the QAP, under Rental Subsidy they are households assisted under the new Bridge Subsidy Program, under Homeownership they are households assisted under Homeownership for Individuals With Disabilities Program, and for Special Loans they are Group Home beds. Section 215 goals Section 215 goals are units that meet HOME program income limits for rental housing, and both HOME program income limits and HOME recapture provisions for owner-occupied housing. Because virtually all units DHCD finances under the rental housing programs have incomes

105
below 60% of median income, and all families assisted under the Rental Allowance Program earn less than 30% of median income, almost all rental units meet Section 215 goals. Most of our homeownership loans and special loans would meet the Section 215 income limits (80% of median income or less). However, because we do not recapture our funding when a homeowner’s income increases (we raise our interest rates) most units financed under these programs do not meet Section 215 requirements. Consequently, our Section 215 goals for the next five years would include 13,500 rental units, and 7,739 rental subsidy units, but for homeownership would only cover the units in the HOME table above. Obstacles to Meeting Underserved Needs The greatest obstacle to meeting underserved needs is the lack of resources available to provide affordable housing. This is especially true in light of proposed federal budget cutbacks which will further reduce funds available for affordable housing for low and moderate-income families.

106
STRATEGY TO COORDINATE THE TAX CREDIT
Nationally, Maryland has been one of the most aggressive users of the Federal Low-Income Housing Tax Credit since the program's inception in the late 1980s. The program, which is used to provide tax credits to developers to construct or rehabilitate rental units for low-income persons, has resulted in thousands of units of affordable housing in conjunction with private and State, and to a lesser extent federal, financing. The awarding of tax credits is extremely competitive, and has been subject to competition since 1991. DHCD has used all of its tax credits for the past five years and has been awarded recaptured tax credits from the federal tax credit pool. State funds for rental housing have also been used aggressively by the development community. As a result of this strong demand for State funds and the Department's desire to use the credits more effectively, all State funds and tax credits for rental housing have been awarded on a joint competitive basis since July 1, 1995. In order to reduce paperwork, bureaucracy, and multiple applications for different sources of funds, DHCD's Community Development Administration (CDA) developed a single application for all sources of rental housing funds. These include the State's Rental Housing Production, Partnership Rental Housing, Elderly Rental Housing, Maryland Housing Rehabilitation, and Nonprofit Rehabilitation Programs, HUD's HOME Investment Partnership Program, and the Federal Low-Income Housing Tax Credit Program. All of these funds are allocated on a competitive basis. Profit motivated and non-profit developers submit only one application to the Department for a specific rental housing project, and the application is ranked against all other applications. Competitions are conducted twice each year, although the Department reserves the right to have an additional competition if necessary due to the recapture of credits or other conditions. Funds are awarded to projects under whichever source the Department deems appropriate based upon the type of project the developer is proposing (elderly housing, family housing, etc.) and the financing needed to make the project viable (tax credits, HOME, State financing, or any combination thereof). The policies and procedures for awarding points under the programs is outlined in the Uniform Application and the Qualified Allocation Plan that are posted on DHCD’s website.

107
BARRIER REMOVAL As illustrated by previous discussions, the primary barrier to affordable housing in Maryland is the lack of affordable rental and homeownership units. Many low- and moderate-income persons and households, especially the very low-income households, the homeless, the physically and mentally disabled, and the frail elderly, have problems finding and obtaining affordable housing. In addition, in the section of the Plan that identified barriers to affordable housing, DHCD identified areas such as building codes and local zoning as barriers to affordable housing, as well as permit fees, although as a State, Maryland has little control over these local conditions. However, the State of Maryland is still working to address these issues, and, in response, offers these barrier removal strategies: Building Codes and Standards: Maryland has been addressing issues of building Codes and standards through two strategies. The first is the adoption of Smart Codes, which provides for appropriate rehabilitation requirements of older structures so that they can be more easily and readily reused for housing and other purposes. The second strategy is the adoption of a statewide building code that standardized code requirements through all Maryland jurisdictions. In 2004, Maryland became only the 6th State (and the first since the late 1990s) to receive certification from HUD that its building codes and standards are model codes that reduce inefficiencies and help make housing more affordable. Local Zoning: In response to concerns about zoning and its restrictions, the Maryland Office of Planning has developed a typology that examines development capacity at the municipal and county level. This typology will help localities determine if they have zoned for an adequate supply of affordable housing to support their workforce. In addition, the Governor’s Housing Policy Commission has called for State and local government agencies to utilize the Development Capacity Task Force Memorandum of Understanding, executed by the Maryland Municipal League, Maryland Association of Counties and Maryland Department of Planning as a mechanism for the development of a housing plan for each jurisdiction in Maryland. Among other items, the housing plans may address the supply of land properly zoned for residential purposes and sufficient to accommodate growth that equitably address affordability for all Maryland citizens at all incomes, includes workforce families/individuals, seniors, individuals with disabilities below Supplemental Security Income level and the homeless. Housing Acquisition Finance Requirements In response to this barrier, DHCD is offering a number of strategies in both the homeownership and rental housing areas. In terms of homeownership, DHCD will start offering new mortgage products, including new 35 year and 40 year mortgage products for first time homebuyers. In addition, the Department finances down payment assistance, and will be creating a new down payment program with local businesses (see the Annual Action Plan for more detailed

108
information.) DHCD will also operate a Section 8 Homeownership Voucher program, to help persons purchase their homes. On the rental housing side, the State will offer a new Bridge Subsidy program for individuals with disabilities. This program will provide rental assistance for up to three years while disabled persons await permanent housing assistance through the Section 8 Voucher or other programs. DHCD will also work with Public Housing Authorities to improve their housing stock. This will be done through the issuance of bonds. In addition, DHCD will pursue two recommendations by the Governor’s Housing Policy regarding rental housing. One of these will be to a Housing Trust fund at the State level. The other will be to work with other State agencies in regard to the State’s surplus properties to identify properties to be used for workforce housing, including senior housing, and housing for individuals with disabilities. Fair Housing Choice DHCD and the State of Maryland will continue to work to provide all Marylanders with fair housing choice. In addition to carrying out the goals outlined in its Analysis of Impediments to Fair Housing Choice, which focus on education activities by DHCD and enforcement activities by the Maryland Commission on Human Relations, the State will continue to operate programs that allow all of the State’s citizens to have fair housing choice. DHCD’s homeownership programs primarily assist low and moderate income first time homebuyers. Based on our loan information from 2004, about 50 percent of all of DHCD’s mortgages go to minority households, allowing those households to participate in the American Dream of homeownership. DHCD also assists persons with disabilities purchase their own homes through its Disabled Borrowers program, a program it will continue in the coming years. Fair Housing choice is also offered to Marylanders through the State’s rental housing programs. All of DHCD’s rental housing developments have affirmative marketing requirements. In addition, when financing properties, DHCD gives extra points in its rating and ranking system to developers who exceed the federal requirements for accessible housing. This has lead to a more than doubling of accessible units financed in the last two years. The State also maintains an affordable housing registry, which lets renters know where and what type of affordable rental housing is available to them. This includes information on both family and elderly projects, as well as information on unit size and accessible units. DHCD works pro-actively with advocacy organizations for the disabled to “get the word out” that accessible housing units are being constructed as well, to help reduce waiting lists for persons with disabilities in their search for affordable housing. Removing Barriers Between State Agencies DHCD’s success rate in working with other State agencies, as well as local governments, is high. However, some barriers to service delivery exist. The biggest barrier that exists is between DHCD and the agencies which assist persons with disabilities. DHCD builds affordable housing units for persons with Disabilities; however, the Disabled community sometimes has difficulty getting their clients into those units.

109
DHCD is currently participating in a working group set up between DHCD, MDoD, DHMH, and DHR to better coordinate the gap between production and client linkages. This newly formed group will develop policies and procedures to make sure persons with disabilities will utilize the housing resources made available to them. DHCD is also participating in other working groups and programs with other agencies. DHCD is working closely with MDE on developing and implementing the State’s 10-year Plan to eliminate lead paint (and which are reflected in the Consolidated Plan), and is also working with DHR on its 10-year Plan to eliminate homelessness, as well as help carry out the continuum of care. DHCD also participates in the Governor’s Sub-cabinet on Smart Growth, and the Interagency Council for the Non-Profit Sector along with DBED, DLLR, DHR, DHMH and the Secretary of State. In addition, DHCD works with all other agencies in State government to coordinate and improve delivery of housing and services through the Governor’s Grants Office.

110
LEAD BASED PAINT HAZARD REDUCTION DHCD has a long history of financing for the purpose of reducing lead hazards in owner-occupied and rental housing in Maryland. The State’s Lead Hazard Reduction Loan and Grant Program (previously know as RELAP) has been in existence since 1987. This program provides low interest and/or deferred loans and grants to assist property owners and day care centers with risk reduction work related to lead. DHCD’s primary partner in these efforts has been the Maryland Department of the Environment (MDE). MDE has been the lead agency Maryland’s Plan to Eliminate Childhood Lead Poisoning by 2010. The plan addresses lead poisoning prevention statewide, with an emphasis on highest risk areas in Baltimore City, Lower Eastern Shore, and Western Maryland. States must have an Elimination Plan to be eligible for future lead poisoning prevention funding or lead hazard reduction funding under the federal Centers for Disease Control (CDC), Housing and Urban Development (HUD), or Environmental Protection Agency (EPA) Lead grant Programs. Maryland has been implementing a strong primary prevention program since 1996. Maryland law focuses on pre-1950 rentals as the highest risk housing. It sets a standard for hazard reduction, confirmed by a third party inspector, to be met before each unit turnover. Since 1995, over 100,000 lead hazard reduction certificates have been issued statewide by accredited private sector lead inspectors, with over 55,000 of these certificates in Baltimore City. Approximately 60% of rental units built before 1950 are now registered with the Maryland Lead Rental Registry, which provides annual first-class mail updates on lead hazard reduction requirements to all registered owners. The Lead Registry and inspection certificates database are also used by MDE Lead Enforcement to increase compliance with the Maryland Lead Hazard Reduction Standard. Compliance with registration and inspection certificate standards was recently added as a requirement for access to rent court, and for approval of payment under Section 8. Other Maryland efforts require blood lead testing at ages 1 and 2 years of age for day care and school entry, support statewide outreach, and integrate lead reduction into routine housing grant and loan programs. DHCD and other State and Baltimore City agencies are coordinating with national and regional HUD efforts under the “safe and Healthy Communities”, “Operation Clean House”, and “Operation Healthy Homes” initiatives. Enforcement will be coordinated among DHCD, MDE, the Baltimore City Health Department and HUD to assure that enforcement targets highest risk areas, and is integrated with on-going State and City enforcement efforts.
MDE Lead Poisoning Prevention Program staff assembled an Elimination Plan Working Group with representatives of state and local agencies, non-profits, and community groups. The Working Group developed the first draft of the assessment, gap identification, and proposed action plan using the framework suggested by CDC. The Maryland Lead Poisoning Prevention Commission (“Lead Commission”) participated in reviews of subsequent drafts. The plan’s current version was developed through a series of reviews and edits by the whole Working Group. During FY 2005, Baltimore City Health Department will take the lead on developing a smaller Elimination Plan specifically for Baltimore City. The Statewide and City plan will be linked for coordination of services and maximizing resources. The Statewide plan will be implemented by state and local agencies and non-profits. Each responsible party will do their own internal reporting and evaluation as usual, with the Lead
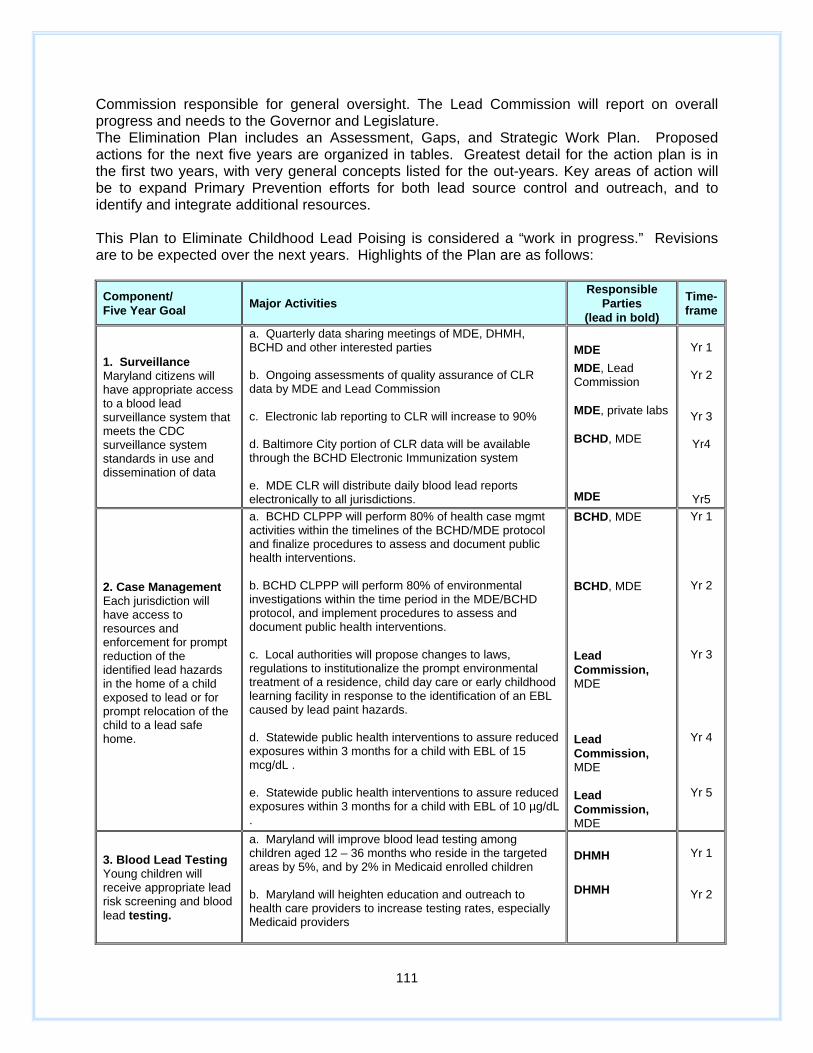
111
Commission responsible for general oversight. The Lead Commission will report on overall progress and needs to the Governor and Legislature. The Elimination Plan includes an Assessment, Gaps, and Strategic Work Plan. Proposed actions for the next five years are organized in tables. Greatest detail for the action plan is in the first two years, with very general concepts listed for the out-years. Key areas of action will be to expand Primary Prevention efforts for both lead source control and outreach, and to identify and integrate additional resources.
This Plan to Eliminate Childhood Lead Poising is considered a “work in progress.” Revisions are to be expected over the next years. Highlights of the Plan are as follows:
Component/ Five Year Goal Major Activities
Responsible Parties
(lead in bold)
Time- frame
1. Surveillance Maryland citizens will have appropriate access to a blood lead surveillance system that meets the CDC surveillance system standards in use and dissemination of data
a. Quarterly data sharing meetings of MDE, DHMH, BCHD and other interested parties b. Ongoing assessments of quality assurance of CLR data by MDE and Lead Commission c. Electronic lab reporting to CLR will increase to 90% d. Baltimore City portion of CLR data will be available through the BCHD Electronic Immunization system e. MDE CLR will distribute daily blood lead reports electronically to all jurisdictions.
MDE MDE, Lead Commission MDE, private labs BCHD, MDE
MDE
Yr 1
Yr 2
Yr 3
Yr4
Yr5
2. Case Management Each jurisdiction will have access to resources and enforcement for prompt reduction of the identified lead hazards in the home of a child exposed to lead or for prompt relocation of the child to a lead safe home.
a. BCHD CLPPP will perform 80% of health case mgmt activities within the timelines of the BCHD/MDE protocol and finalize procedures to assess and document public health interventions. b. BCHD CLPPP will perform 80% of environmental investigations within the time period in the MDE/BCHD protocol, and implement procedures to assess and document public health interventions. c. Local authorities will propose changes to laws, regulations to institutionalize the prompt environmental treatment of a residence, child day care or early childhood learning facility in response to the identification of an EBL caused by lead paint hazards. d. Statewide public health interventions to assure reduced exposures within 3 months for a child with EBL of 15 mcg/dL . e. Statewide public health interventions to assure reduced exposures within 3 months for a child with EBL of 10 µg/dL .
BCHD, MDE BCHD, MDE Lead Commission, MDE Lead Commission, MDE Lead Commission, MDE
Yr 1
Yr 2
Yr 3
Yr 4
Yr 5
3. Blood Lead Testing Young children will receive appropriate lead risk screening and blood lead testing.
a. Maryland will improve blood lead testing among children aged 12 – 36 months who reside in the targeted areas by 5%, and by 2% in Medicaid enrolled children b. Maryland will heighten education and outreach to health care providers to increase testing rates, especially Medicaid providers
DHMH
DHMH
Yr 1
Yr 2
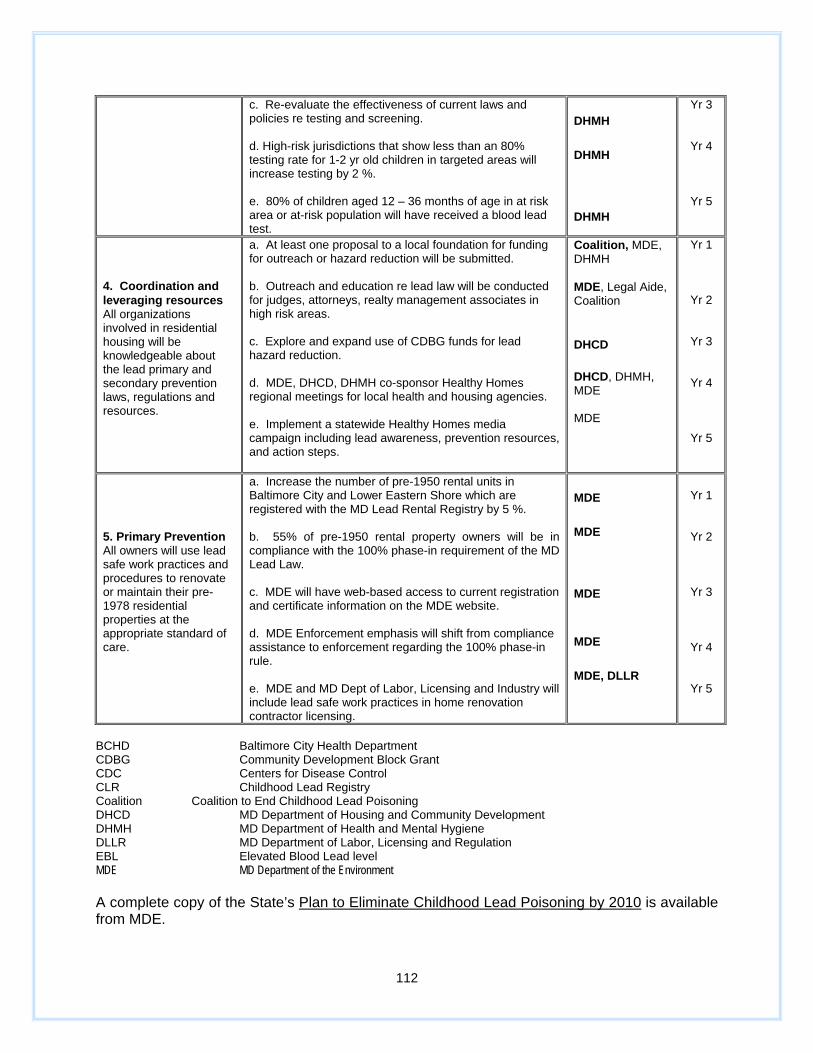
112
c. Re-evaluate the effectiveness of current laws and policies re testing and screening. d. High-risk jurisdictions that show less than an 80% testing rate for 1-2 yr old children in targeted areas will increase testing by 2 %. e. 80% of children aged 12 – 36 months of age in at risk area or at-risk population will have received a blood lead test.
DHMH
DHMH
DHMH
Yr 3
Yr 4
Yr 5
4. Coordination and leveraging resources All organizations involved in residential housing will be knowledgeable about the lead primary and secondary prevention laws, regulations and resources.
a. At least one proposal to a local foundation for funding for outreach or hazard reduction will be submitted. b. Outreach and education re lead law will be conducted for judges, attorneys, realty management associates in high risk areas. c. Explore and expand use of CDBG funds for lead hazard reduction. d. MDE, DHCD, DHMH co-sponsor Healthy Homes regional meetings for local health and housing agencies. e. Implement a statewide Healthy Homes media campaign including lead awareness, prevention resources, and action steps.
Coalition, MDE, DHMH MDE, Legal Aide, Coalition
DHCD DHCD, DHMH, MDE MDE
Yr 1
Yr 2
Yr 3
Yr 4
Yr 5
5. Primary Prevention All owners will use lead safe work practices and procedures to renovate or maintain their pre-1978 residential properties at the appropriate standard of care.
a. Increase the number of pre-1950 rental units in Baltimore City and Lower Eastern Shore which are registered with the MD Lead Rental Registry by 5 %. b. 55% of pre-1950 rental property owners will be in compliance with the 100% phase-in requirement of the MD Lead Law. c. MDE will have web-based access to current registration and certificate information on the MDE website. d. MDE Enforcement emphasis will shift from compliance assistance to enforcement regarding the 100% phase-in rule. e. MDE and MD Dept of Labor, Licensing and Industry will include lead safe work practices in home renovation contractor licensing.
MDE
MDE
MDE
MDE
MDE, DLLR
Yr 1
Yr 2
Yr 3
Yr 4
Yr 5
BCHD Baltimore City Health Department CDBG Community Development Block Grant CDC Centers for Disease Control CLR Childhood Lead Registry Coalition Coalition to End Childhood Lead Poisoning DHCD MD Department of Housing and Community Development DHMH MD Department of Health and Mental Hygiene DLLR MD Department of Labor, Licensing and Regulation EBL Elevated Blood Lead level MDE MD Department of the Environment A complete copy of the State’s Plan to Eliminate Childhood Lead Poisoning by 2010 is available from MDE.

113
ANTI-POVERTY STRATEGY Maryland is one of the country’s wealthiest states, with a median household income of $75,250 as of February, 2005. Still, about 9 percent of Marylanders lived in poverty. State programs and policies aimed at reducing poverty are driven by several factors:
A high number of children living in poverty High illiteracy rates and dropout rates among inner city students High concentrations of poverty in the State’s older, distressed neighborhoods The movement of jobs away from sites where people in poverty tend to live A job market which increasingly demands skilled workers
No single tactic will address the problem of poverty in Maryland. Thus, DHCD, in coordination with other State and local government agencies, Community Action Agencies (CAAs), other nonprofit organizations and advocacy groups has developed a broad strategy to address the complex causes of poverty and needs of low-income families and individuals. Key components of the State’s anti-poverty strategy include:
Providing quality education and job training Focusing economic growth and revitalization on areas where persons in poverty are most
likely to reside Increasing the supply of affordable housing Creating jobs Providing supportive services such as transportation, health care, and child care to assist
low-income individuals in getting and keeping jobs Education and Job Training Investing in education is essential to giving Maryland’s low-income residents the tools to lift themselves out of poverty, to support the State’s economic development, and to improve the quality of life for all Maryland citizens. Maryland residents will be unable to compete in the labor market without quality education. Similarly, Maryland needs a skilled, well-educated labor force to attract businesses and remain competitive. Recent State initiatives will mean less crowed classrooms, safer schools and improved education. Maryland’s capital budget for the current state fiscal year continues to commit resources to renovating and building schools and higher education facilities. The federally funded Head Start program which provides education to pre-schoolers and is operated by the Community Action Agencies (CAAs) is also an important element in Maryland's Anti-Poverty Strategy. It is designed to increase the ability of disadvantaged three and four year old children by providing comprehensive programs to meet their educational, social, health and nutritional needs. It also assists those families of the enrolled children with social services, educational and training. In federal fiscal year 2004, 8 of Maryland’s 17 CAAs operated Head Start programs, which helped over 2,800 children. This investment in pre-school education by the CAAs is expected to improve the children’s ability to learn and, hence, increase high school graduation rates and college enrollment. Such education, in turn, should reduce the rate of

114
crime, welfare dependency, and teenage pregnancy, while raising the participants’ lifetime earning potential. Recent strides in Maryland, and throughout the country, have dramatically reduced the welfare rolls and increased the number of former recipients who are employed. Many of these former recipients are “fragile” members of the labor force. Often they have limited skills and are unable to obtain employment that pays a “living wage.” They do not live where most of the best job opportunities are, and often have to take public transportation, if available, to get to work. Public transportation takes an excessive amount of time to get both to and from work. If they own automobiles, often the vehicles are old and not in good condition. Also, child care is difficult to find if a child is sick or odd hours are needed. Many also do not have health insurance. Finally, housing costs can be prohibitive if affordable housing is not available. The State is and will continue to assist persons living in poverty to reach self-sufficiency. Programs that are available include:
Health insurance for the children of low-income families who do not have health insurance. Benefits for day care and/or transportation assistance through DHR. Housing assistance through DHCD.
It may not be realistic to expect that people seeking to get out of poverty can go directly into a job paying a living wage. However, employment situations which enable people to acquire on the job training and skills, as well as confidence in their abilities, and which will lead to promotions to positions that do pay a living wage should be encouraged. Focusing Economic Growth and Healthy Communities The State’s efforts to reduce sprawl and encourage the revitalization of deteriorating areas are designed to benefit low-income families. This initiative encourages economic growth to occur in existing developed areas and in areas that have already been planned for development. This will result in job opportunities arising closer to where low- income workers live, reducing commuting time. Reversing the deterioration of older communities will also encourage economic development in these revitalization areas and will promote a better income mix among residents as the improvements in an area make it more attractive to higher income families. Creating healthy communities will require coordinated efforts among state agencies, such as the Departments of Housing and Community Development, Economic Development, Education, Human Resources, Juvenile Justice and Public Safety and Corrections. In addition, local government and private sector partners will be requested to help create these healthy communities. Coordination is discussed in more detail in the next section of the Plan. Programs that are directed to helping revitalize communities include:
The Department of Housing and Community Development’s Neighborhood BusinessWorks Program which provides financial assistance to new and expanding small business in Designated Revitalization areas
The Department of Housing and Community Development’s Community Investment Tax Credit Program which provides income tax credits to nonprofit organizations that can be exchanged for contributions from businesses; projects funded by these tax credits help the low income residents of designated revitalization areas.

115
The Department of Housing and Community Development’s Capital Access Program which will help fund loan guarantee accounts that will enable financial institutions to assit small business development.
The Department of Housing and Community Development’s Community Legacy Program which is designed to assist urban neighborhoods, suburban communities and small towns that are experiencing decline and disinvestment, but have the potential, with modest public and private investment, to be vibrant places to live and work.
The Department of Housing and Community development’s Main Street Maryland Program which is a comprehensive downtown revitalization program that strives to strengthen the economic potential of Maryland’s traditional main streets and neighborhoods.
Linking Services One of DHCD's major partners in the fight against poverty at the local level is its 17 Community Action Agencies. The CAAs use holistic strategies involving both physical and human development to help Maryland's low-income families become self-sufficient. They are instrumental in leveraging private and public (local, State and federal) funds in excess of $80 million dollars annually to offer comprehensive services to over 175,000 low-income citizens. The CAAs' programs can be grouped into six categories and include employment, housing, education, emergency assistance, nutrition, and linkages/referral.
LOW-INCOME MARYLANDER'S SERVED BY CAAs
SERVICES NUMBER OF PEOPLE SERVED
Employment 1,755 Housing 15,787 Education 22,804 Emergency Assistance 78,937 Nutrition 22,804 Linkages/referrals 33,329 TOTAL 175,416
These six categories include numerous programs and activities. CAAs are also providers of emergency assistance through Constant Care Community Health Centers, the Maryland Energy Assistance Program, eviction prevention assistance, emergency shelter programs, and crisis intervention. Along with the Center for Poverty Solutions, the CAAs provide food and activities centered on nutrition. These activities include summer feeding programs, commodity distribution, holiday food distribution, nutrition education, full-service food assistance and Women, Infants and Children (WIC) assistance. In the rural areas, many of the CAAs are the major providers of affordable housing and housing counseling services. Programs and services include: housing development, homeownership programs, new construction of affordable housing, Section 8 rental assistance, self-help housing programs and transitional shelters. Linkages and referrals CAAs provide include transportation to medical facilities, rural transportation, utility service cutoff protection, credit union management, and volunteer services.

116
COORDINATION EFFORTS Interagency Cooperative Efforts DHCD engages in cooperation with many of the other State agencies. Examples of such cooperation include assisting persons with HIV/AIDS with the AIDS Administration of DHMH, coordinating lead paid abatement policies and programs with the Maryland Department of the Environment, working with the Department of Human resources to address the needs of homeless persons, and providing housing assistance to persons with disabilities through the Maryland Departments of Aging, Disabilities, and Health and Mental Hygiene.. DHCD also works cooperatively with DHMH's AIDS Administration to help assist persons with HIV/AIDS. This has occurred to two ways. First, DHCD has used its allocation of HOME funds to help persons with HIV/AIDS pay their rent through a tenant assistance program. Second, DHCD and DHMH work together to administer the Housing Opportunities for Persons With AIDS (HOPWA) program funding to assist persons with HIV and their families. In this instance, DHMH provides health and medical assistance and DHCD provides housing assistance in the form of voucher payments. This holistic approach helps ensure persons with HIV/AIDS receive the health and housing assistance they need. DHCD works closely with the Maryland Department of the Environment (MDE) on lead paint abatement issues. DHCD has adopted MDE’s lead abatement guidelines, and operates all of its housing programs, including the Section 8 Voucher program, to MDE standards for lead abatement. DHCD’s work with the Department of Human Resources focuses primarily on working with the homeless. DHCD participates on the Governor’s Advisory Board on Homelessness, and operates some of its programs, such as the Emergency Shelter Grant program and the Transitional Shelter and Housing Grant Program in conjunction with the policies set forth in the State’s Continuum of Care. Another example of interagency coordination efforts carried out by DHCD with partners is the Homeownership for Persons with Disabilities Program. This effort includes DHCD, DHMH, MDoD, and the Maryland Center for Community Development. Working together, these agencies provide homeownership opportunities for persons with disabilities by providing them support services and affordable housing financing so persons with disabilities can become homeowners. State-Local Coordination Efforts In addition to working with other State agencies, DHCD also works with local partners, including local governments, for profit and non-profit developers, individuals, and businesses to help meet the State’s housing, economic, and community development needs. Capacity Building The purpose DHCD's Operating Assistance Grants Program is to help nonprofit housing developers learn how to produce and rehabilitate housing. Both nonprofit organizations engaged in the production of affordable housing, and newly formed nonprofits are eligible to receive assistance. At the beginning of each fiscal year, up to one percent (1%) of the total

117
aggregate amount of budgeted moneys in DHCD's Rental Housing Programs Fund, Homeownership Programs Fund and Special Loan Programs Fund are made available to eligible nonprofit organizations. Additional funds appropriated from any other source also may be included, such as HOME funds for CHDOs.
Planning and Technical Assistance DHCD supports its CDBG program applicants and grantees through the assistance of Community Representatives. The CDBG staff also offers technical assistance in the development of proposed projects and in the implementation of funded activities. Through coordinated efforts with other State and federal agencies, grantees are able to leverage a significant amount of other funding and develop projects that meet CDBG readiness criteria. DHCD engages in planning and technical assistance for a range of community development activities. Emphasis is placed on commercial revitalization, economic development, housing development, and community facilities/infrastructure. Planning grants are awarded to local jurisdictions competitively. Commercial Revitalization Through its Maryland Main Street Program, DHCD also assists local government officials and downtown business leaders to develop and implement long term downtown revitalization programs. Assistance covers: (a) organization and goal setting, (b) design assistance, (c) promotions, (d) economic restructuring, and (e) institutionalization of the revitalization program. Generally, the Center helps to identify the business leaders in the central business district and the revitalization needs and opportunities of a specific community. The leaders are organized as a business association or other organization, and DHCD assists the association to develop an action program. DHCD also provides technical assistance to implement the action plan. For example, DHCD provides design options for facade rehabilitation to individual business owners and helps to arrange financing. In addition, DHCD helps to organize the business association into a commercial district management authority, which effectively institutionalizes, and manages the revitalization program, if requested. DHCD Catalyst Last but not least, in order to work better with its local partners, including local governments, nonprofits, businesses, and others, DHCD routinely offers training through DHCD Catalyst. This training is customized to the individual needs of the partner, business, or nonprofit. The training is done in cooperation with many other agencies: DHCD’s partners in Catalyst include:
Enoch Pratt Free Library which offers free workshops for individuals, nonprofits, and businesses on starting and operating a nonprofit or small business,
Maryland Center for Community Development which provides training and technical assistance to organizations that are doing homeownership and housing counseling, or housing and community development including economic development,
Maryland Association of Nonprofit Organizations which provides training and technical assistance, including in depth consulting services and customized training, on all aspects of nonprofit governance and management,
Maryland Small Business Development Center which provides low cost training and no cost consulting to small businesses throughout Maryland,

118
Microenterprise Council of Maryland which provides technical assistance and resources to organizations, agencies and municipalities assisting or wanting to assist entrepreneurs starting or expanding micro businesses,
Montgomery Chamber of Commerce which offers a one-stop shop for free business plan consultations, low-cost training, access to finance, business education and access to prospective clients and customers in Montgomery County,
Morgan University's Entrepreneurial and Assistance Center which utilizes the support and participation of Morgan University sources to assist assists entrepreneurs and aspiring entrepreneurs. The target populations for the EDAC are minorities, women, and micro enterprises,
SCORE of Maryland which s a volunteer organization providing business counseling without charge,
Small Business Resource Center which provides technical assistance to microenterprises, small business and organizations who are looking for business assistance,
Neighborhood Reinvestment Corporation which provides national and regional training and capacity building for community development leaders, practitioners and professionals,
National Main Street Center which provides technical assistance and information services in the field of commercial district revitalization to housing and community development groups, University of Maryland School of Social Work which provides organizational development, community building and fundraising assistance, and the
University of Maryland Institute for Governmental Services which supports local officials by providing education and training, applied research and technical assistance to local officials and nonprofit community development organizations.

119
PUBLIC HOUSING RESIDENT INITIATIVES RESIDENT INITIATIVES HUD asks states in this part of the Plan to discuss public housing resident initiatives the state will undertake to encourage residents to become more involved in the management of public housing and to participate in homeownership. Management DHCD's Community Development Administration (CDA) occasionally serves as a Public Housing Authority (PHA) in a limited capacity, until a local jurisdiction forms a PHA. Typically, CDA helps finance a housing development, and then turns that property over to a local jurisdiction, once it receives final approval to form a PHA from HUD. Because DHCD does not maintain long-term control over public housing units, staff has not developed a plan to assist tenants in managing public housing. We do, however, encourage local PHAs to help tenants become more involved in management of their units. Further, under the Partnership Rental Housing Program, which is DHCD's primary tool for financing rental housing for PHAs, DHCD requires a Tenant Participation Plan. The statute authorizing the Partnership Program requires that tenants contribute actively to the operation or maintenance of their housing or community. All Tenant Participation Plans must include responsibility for some level of project maintenance and activity which benefits the community. The Plan must be structured to address real needs of the project, reduce operating costs and integrate the housing into the community. Each Tenant Participation Plan must include the following activities, as applicable:
a) Tenant's Association. Except for scattered site projects, all Partnership developments are required to form an active tenants association. The association is to be given responsibilities which involve tenants in the management of the project. Examples of responsibilities include evaluation of tenant complaints, participation in formulating operating policies and responsibility for organizing tenant or community activities. To the extent feasible, scattered site projects are encouraged to form tenants associations as well. If a tenant's association is not feasible for scattered site projects in which Partnership units are located, and the units are located in an area that has a homeowner's or community association, tenants of the Partnership units are encouraged to participate in those associations.
b) Project Maintenance. Each Tenant Participation Plan must include tenant
responsibilities for project maintenance that enhances the project and reduces operating costs. Maintenance responsibilities may be tailored to address the type of project occupancy and building type. Examples of acceptable forms of project maintenance are listed below. Each Tenant Plan must include at least one of the recommended forms of project maintenance. The project management may specify that certain types of tenant-performed maintenance are undertaken only under the supervision of project staff.

120
TENANT PARTICIPATION PLAN MAINTENANCE ACTIVITY
PROJECT TYPE
OCCUPANCY TYPE
Exterior Maintenance, Such as snow removal, lawn care and painting
Townhouse, Detached Scattered Sites
Family
Interior unit painting
All Types
Family
Community Room/Building activity scheduling and post activity clean up
All Types with Community Rooms
Family & Elderly
Grounds or Building Decorations such as flower gardens and lobby decoration
All Types
Family & Elderly
Tenant staffing of office phone or reception desk
Single Site
Elderly
Minor repairs such as window and screen repairs
All Types
Family
C) Community Activities. Each Tenant Participation Plan must include requirements for tenants to participate in activities that benefit the community in which the development is located. Community activities may be performed on an ongoing basis or may be periodic. Each Plan should include an activity from the following list or a comparable activity recommended by the borrower and approved by DHCD:
1) Continuing Community Activities
a) Recycling program b) Crime Watch program c) Participation in Community Association d) Foster Grandparent Program
2) Periodic Community Activities
a) Neighborhood clean up b) Fund-raising activities to benefit neighborhood charities or
nonprofit activities c) Food drives for holiday baskets
The Tenant Participation Plan also must address measures the borrower or management agent will undertake to assure tenant participation. CDA's loan documents obligate the borrower to implement the Plan, obtain CDA's approval prior to changing an approved Plan and provide an

121
annual report to CDA on tenant activities. The lease with the tenant should specify all tenant activities and inform the tenant of his obligation to comply with the Plan. Homeownership The State of Maryland is strongly committed to providing homeownership opportunities for all its low- and moderate-income residents. PHA residents may fully access all of DHCD's homeownership programs. Such programs include the Maryland Mortgage Program and the Preferred Interest Rate Program, which provide reduced interest rate mortgages to low- and moderate-income first time home buyers, and the State's down payment assistance program, which assists low-income buyers with down-payment and closing cost assistance. In addition, DHCD will continue to support federal efforts to promote homeownership, and will continue to use federal HOME funds to support homeownership through soft seconds and down payment and settlement assistance. DHCD also supports efforts by the State's local PHAs to provide homeownership opportunities not only through these programs, but through any program for which residents are eligible, including HUD's HOPE programs. DHCD also offers the Section 8 Housing Choice Voucher Home Ownership Option to eligible and qualified program participants. HELPING TROUBLED PHAS As part of the 1998 Quality Housing and Workforce Responsibility Act (QHWRA), Maryland and other States must describe how they would assist troubled PHAs with "financial or technical assistance" to help them lose their troubled status. HUD scores PHAs on their management practices and the physical quality of their units - a score under 60 results in a PHA being given "troubled" status. In the event a PHA is designated as troubled, DHCD will cooperate with HUD to provide technical assistance to help them lose their troubled status. The type of assistance offered will be based on the findings in HUD's scoring that resulted in the PHA's troubled status. Examples of technical assistance DHCD will offer include assistance with financial operations, asset management, property management, or day-to-day operations, as appropriate. In addition to technical assistance, PHAs which have units in need of rehabilitation are eligible applicants for assistance under the competitions for DHCD's rental housing programs. Currently, two PHAs in the non-entitlement jurisdictions are considered troubled. DHCD is assisting both of these PHAs with technical assistance.

122
GEOGRAPHIC DISTRIBUTION Some of the federal resources available to the State of Maryland to provide affordable housing are subject to geographic targeting. The following federal resources will be directed toward specific geographic areas as described below. Community Development Block Grant (CDBG) Community Development Block Grant funds are awarded through a formula established by the federal government. The State's allocation of CDBG funds may not be Anne Arundel, Baltimore, Harford, Howard, Montgomery, and Prince George's Counties and the cities of Annapolis, Baltimore, Bowie, Cumberland, Frederick, Gaithersburg, Hagerstown and Salisbury. These jurisdictions receive their own allocations of CDBG funds directly from the federal government, and are not eligible for use of the State allocation. Emergency Shelter Grant (ESG) Emergency Shelter Grant funds are awarded through a formula established by the federal government. The State's allocation of ESG funds may be used anywhere in Maryland except Anne Arundel, Baltimore, Montgomery, and Prince George's Counties and Baltimore City. These five jurisdictions receive their own allocations of ESG funds directly from the federal government, thus are not eligible for the State allocation. HOME Investment Partnerships Program (HOME) The HOME program was established under the Cranston-Gonzalez National Affordable Housing Act of 1990. The State's allocation of HOME funds may not be used in Anne Arundel, Baltimore, Harford, Montgomery, and Prince George's Counties and Baltimore City. These jurisdictions are HOME entitlement jurisdictions and receive their own HOME funds directly from HUD. Housing Opportunities for Persons With AIDS (HOPWA) The State’s allocation of HOPWA funds may only be used in Allegany, Caroline, Dorchester, Garrett, Kent, Somerset, Charles (as fiscal agent for St. Mary’s County), Talbot, Washington, Wicomico and Worcester Counties. All other counties in Maryland are HOPWA entitlement jurisdictions are receive funding directly from HUD. Farmers Home Programs (All) The U.S. Department of Agriculture's Farmer's Home Administration (FmHA) Programs were established to provide safe, decent, affordable housing to the Nation's rural and farm communities. All FmHA programs (502, 515, 523, etc.) are restricted for use in "rural areas" which include open country and places with populations of 50,000 or less. FmHA loans are exempt from State PFA requirements, however FmHA is working with the State to encourage the use of their programs in PFAs.

123
Low-Income Housing Tax Credits Federal Low-Income Housing Tax Credits may be used within the State of Maryland's PFAs. However, in accordance with federal law, states are required to develop allocation criteria which disperse the tax credits across the State through an IRS approved competitive process. Maryland has an approved competition process which allows points to be given to rental housing projects which serve areas previously unserved by tax credit developments. Areas which receive points for geographic distribution vary year by year and competition by competition depending upon the number of applications received from Maryland's various jurisdictions. In addition to federal requirements, the State has its own requirements regarding the targeting of programs. Since there is a major emphasis on directing resources to growth areas and areas in need of revitalization, we will generally be targeting funds to projects located in Priority Funding Areas (PFAs) as well as appropriate. The information below provides an outline of how funds will be targeted beyond the federal requirements noted above: Programs (or parts of programs) that are not required to fund projects located only in PFAs
Federal and State Lead Paint Reduction Programs Weatherization for Low Income Persons Indoor Plumbing Single Family Rehabilitation (MHRP: 1-4 units) Group Home Financing Shelter and Transitional Housing Facilities Grants HOME – for single family existing homes only Maryland Mortgage Program Local Government Infrastructure Financing Rental Allowance Emergency Shelter Grants CDBG – for single family housing rehabilitation only CSBG Maryland Appalachian Housing Accessory Shared and Shelter Housing Section 8 Voucher/Certificate Section 8 Moderate Rehabilitation Federal and State Historic Tax Credits Federal Historic Preservation Grants Museum Assistance Grants
Programs required by law to fund projects located only in Smart Growth Areas
The Smart Growth – Priority Funding Areas Act of 1997 requires that the following DHCD programs be used exclusively in Priority Funding Areas (PFAs):
Neighborhood Revitalization
Community Investment Tax Credit

124
Main Street Maryland Community Legacy Program Neighborhood BusinessWorks – in Designated Neighborhoods only Live Near Your Work – in Designated Neighborhoods for non-State employees and in PFAs
for State employees
Homeownership
Maryland Mortgage Program (MMP) – excluding O.B.O. – for new construction Maryland Home Financing Program – for new construction Preferred Interest Rate Loan Program – for new construction HOME – for new construction
Rental Housing
Elderly Rental Housing – for new construction Rental Housing Production – for new construction Multifamily Housing Revenue Bond Financing – for new construction HOME – for new construction
In addition, HUD also asks if or how funds will be specifically targeted to areas of minority concentration. In its Analysis of Impediments to Fair Housing Choice, the State defined a "high concentration" of minority households as a census tract where the percentage of minority households is at least 10% greater than the county average. Based on this definition, of the 346 census tracts in Maryland's non-entitlement areas covered by the Analysis, only 25 were areas of minority concentration, and, of those, 15 were impacted by institutions such as military centers, Historically Black Colleges, hospital centers, and prisons. Of the remaining 10, 9 are in PFAs. As noted above, DHCD targets its funds to Priority Funding Areas. Because of DHCD’s emphasis on targeting funds to PFAs, areas of minority concentration are already targeted for assistance through the State’s housing and community revitalization programs.

125
MONITORING Housing Activities (including HOME) Two offices within Maryland's Department of Housing and Community Development are responsible for monitoring housing loans and grants made by the Department with both State and federal (including HOME) funds. The Multifamily Housing Unit in the Division of Development Finance is responsible for income monitoring of tenants. The Asset Management division of the Maryland Housing Fund is responsible for monitoring the physical and financial condition of DHCD, HUD, Montgomery County Housing Opportunities Commission, Prince George's County, and Charles County financed properties. In order to ensure that DHCD's programs are carried out in furtherance of the Consolidated Plan and ensure long-range compliance with objective, the Consolidated Plan's strategies, objectives, and activities will be incorporated into the Department's work plan. Achievement of Consolidated Plan goals by DHCD will be measured by the same standards used to evaluate all programs and activities by appraising the diverse operations and controls within DHCD and determining whether: risks are identified and reduced; acceptable policies and procedures are followed; established standards are met; resources are used efficiently and economically; and ultimately, the Department's objectives are achieved. In concert with the Department's overall mission and goals, DHCD's fulfillment of its designated objectives and responsibilities, including Consolidated Plan goals, will be measured and evaluated through the Managing for Results process. Continuous reviews of programs and compliance testing to monitor activity performance under the Plan and long-term compliance and planning requirements will be conducted. Internal audits will furnish DHCD with analyses, appraisals, recommendations, counsel, and information concerning the activities reviewed and will monitor any corrective actions taken to assure that problems have been adequately identified and resolved. DHCD's activities will assist in the delivery of affordable housing units by ensuring that beneficiaries of DHCD financing are income-eligible and the provision of affordable housing follows State and federal regulations. Planning and Administration will endeavor to use the performance of projects within the portfolio as a tool during the rating and ranking process as well as during the underwriting process in an effort to minimize risks. On-Site Monitoring for HOME-Assisted Projects On-site monitoring is conducted to ensure that HOME-assisted projects are operated in compliance with the HOME regulations. On site monitoring responsibilities are conducted in accordance with the HOME regulations. Inspections of HOME-assisted rental units are scheduled as follows:

126
Number of HOME units Inspection Required
1-4 Every 3 years 5-25 Every 2 years
26 or more Annually The on-site monitoring elements include:
maintenance of appropriate records evidence that the property's written tenant selection policy has been followed acceptable lease documents evidence of affirmative marketing and conformance with fair housing policies review of rent adjustments review of treatment of rents for tenants who no longer qualify as low-income families review of corrective procedures dealing with temporary noncompliance caused by
increases in the incomes of existing tenants ensure compliance with the written agreement between the owner and DHCD physical inspections for compliance with property standards verification of accuracy of information submitted by owners on eligible tenant incomes and
HOME rents Multifamily Housing will perform annual audits and reviews of grantees in the delivery of rental subsidies, as well as annual audits for compliance with tenant income and rent restrictions of properties with HOME funding. Multifamily Housing will perform additional audits, if needed, to ensure that problems are corrected. Multifamily Housing and grantees are subject to HUD audits. Reviews and audits will ensure that all State and federal regulations are being followed. Asset Management undertakes physical inspections of DHCD-financed properties, as well as ensuring the financial stability of loans and assets management by the Department. Generally, Asset Management is responsible for conducting annual inspections on all properties for which the original loan amount was $750,000 or greater and all HUD insured and subsidized projects. Inspections are conducted every two years on properties with original loan amounts between $350,000 and $750,000. Inspections are conducted every three years on projects whose original loan amount was less than $350,000, but more than $75,000. On multifamily loans of less than $75,000, no inspection is conducted by DHCD. Some inspections may be completed by the Contract Servicer. In addition, annual physical inspections are performed on projects that do not meet all of the following criteria:
The loan is current and has not been delinquent in the prior twelve months. The debt service coverage ratio for the loan including any superior debt, if applicable is
greater than 1.0. Vacancy is less than 10%. There are no significant outstanding violations of the Regulatory Agreement or other loan or
program requirements.

127
The project does not exhibit deferred maintenance. Deferred maintenance is defined as a condition exhibiting the continued failure by a management agent or an owner to perform routine or day-to-day tasks associated with the repair or upkeep of the property.
The project received a Satisfactory or better rating on its most recent physical inspection and administrative review by Asset Management.
The surrounding market is stable or appreciating. Internal evaluations will measure goal achievement within the context of external limitations that may exist (i.e. reduced funding, shifting priorities of the Department, coordination difficulties within other governmental entities, etc.) and internal limitations (staff shortages, etc). As program/activity performance is measured and goals are adjusted, the programs will review original goal estimates and make necessary revisions. Coordination will be a part of ongoing monitoring and if delivery or coordination efforts are stymied, an immediate determination will be made as to the most effective method of resolving the problem. If additional resources are necessary to eliminate or remove barriers, steps will be taken to initiate such action. Performance measures and evaluations (periodic, annual, informal and formal) will be shared and utilized in planning for and preparing the next Consolidated Plan. Adjustments to monitoring activities will be completed as needed to address identified problems and assess corrective remedies and actions. CDBG Activities DHCD's Division of Neighborhood Revitalization staff conducts a review of the performance of every CDBG project that is brought to completion. Specialists review the projects to determine compliance with federal and State regulations. Depending upon the size and complexity of the grant, the monitoring is done either through the mail or on site. All projects are monitored at least once; most are reviewed several times. Every CDBG grant is monitored at least once during the lifetime of the project. Monitoring of planning grants is accomplished through a desk monitoring in which grantees submit a completed checklist and supporting documentation. Staff reviews the information and writes a summary report which is then mailed to the Chief Elected Official within 60 days.
All other CDBG grants are monitored through a visit to the grantee and review of the records on-site. Monitoring of a grantees’ capacity to meet compliance, project performance and national objective requirements includes an assessment of the following:
Overall CDBG management structure; Internal procedures and controls; Capacity to track projects and activities from the planning stage through applicable major
milestones (e.g., release of funds, contract bid and award, etc.) to completion; Consistency of the implemented project with the approved plan (as reflected in the grant
application, Grant Agreement, and any amendments); Capacity of the grantee (and/or its subrecipients) to ensure compliance with the relevant
programmatic and compliance requirements. 24 CFR 570.490 and 24 CFR 570.506 describe the Federal record-keeping requirements in general terms. In addition, the Grant Agreement provides additional guidance to grantees on

128
records to be maintained. At a minimum, the grantee’s records must provide a full description of each activity assisted, including its location, the amount of funds budgeted, obligated and expended, and the category of eligible activity(ies) being undertaken (pursuant to Subpart C of 24 CFR 570). The records must also be sufficient to document compliance with all other applicable State and Federal requirements. Grantees must have the capacity to provide the various reports periodically required by DHCD, particularly those specified in Exhibit D of the Grant Agreement. The CDBG project records must be maintained for a period of three years after the close-out date of the State CDBG grant from HUD; in the event of litigation, claims, or other unresolved legal or audit issues, however, the three-year period is extended. The on-site review typically will involve the following types of activities:
Interview grantee’s management, program, and administrative staff (and/or those of their
subrecipients, as relevant). Inspect project sites, both for completed and on-going CDBG activities. Conduct a general review of the project records.
DHCD staff must review the grantee’s (and/or subrecipient’s) files to determine whether adequate documentation is being maintained to show compliance with the applicable Federal and State requirements. In regard to the local record-keeping system, the Reviewer should look for the following:
The record-keeping system should be divided into categories that logically correspond to the
key components and compliance areas of the project (e.g., citizen participation, environment review, documentation of national objectives, etc.); it should be updated regularly, and maintained in an orderly manner.
Responsibility for maintaining the CDBG project files may be divided among several individuals. The Reviewer should identify those individuals who have responsibility for maintaining the CDBG files.
All CDBG files must be secure and safeguarded. The records must be easily accessible to appropriate and authorized grantee (or
subrecipient) staff, as well as State and Federal officials or their designees (e.g., the files may not be kept in someone’s home or automobile).
The files must contain adequate source documentation. As part of their review, DHCD staff complete checklists to document their review and conclusions concerning projects and activities. Projects delayed due to circumstances beyond the grantee’s control are discussed with the grantee and appropriate rescheduling is agreed upon.
Projects/activities for which little or no progress has been made, or which appear to be ineligible or inconsistent with national objectives, or which exhibit non-compliance with other pertinent State or Federal requirements result in a finding or matter of concern. DHCD monitoring staff considers and offers proposed remedies (including technical assistance) and/or required corrective actions that will remove impediments to progress or address non-compliance. A written report is completed and issued to the Chief Elected Official within 60 days of the visit. The report stipulates the required corrective actions and the time frame for completion.

129
Follow up continues until all findings and matters of concern are adequately addressed and resolved. Emergency Shelter Grants Activities DHCD will also monitor the ESG program. Monitoring Requirements shall include:
1. Grantees will be monitored at least annually. The monitoring visit will be conducted by one or more staff members of DNR's Community Services Unit.
2. The visit may occur during or after the grant period. Grantees will receive two weeks
notice of the monitoring visit; the notice will include a copy of the monitoring report form.
3. The visit will entail reviews of the fiscal and programmatic aspects of the grant as administered by both the grantee and sub-grantee. Grantees will make all records, administrative offices and personnel available upon request during the monitoring visit.
4. Within 60 days following the visit DHCD will forward a report to the grantees. The report
will summarize grant progress and may include concerns with recommendations for further action as well as findings which will require corrective action.
5. Local government grantees which contract with nonprofit organizations under this
program will also monitor the sub-recipient(s) to determine project progress and adherence to the sub-recipient grant agreement. Monitoring reports of the local government's grantee(s) will be subject to review by DHCD's Office of Community Services staff upon request.
HOPWA Monitoring and Evaluation DHMH is primarily responsible for monitoring the State HOPWA program. Monitoring activities include requiring quarterly reports that include budget expenditures, programmatic narrative and performance measures. These reports include performance measures, narrative of program successes, challenges and barriers and a budget expenditure report. Also monitored is the coordination of services between HOPWA and Ryan White-funded programs, such as attendance of HIV case management and regional CARE Consortia meetings. The AIDS Administration also conducts sub-grantee site visits on a routine basis to monitor adherence to programmatic and fiscal standards and guidelines, client confidentiality and the quality and accessibility of services. Areas identified for improvement during the monitoring process may require that agencies develop corrective action plans. The HOPWA Coordinator at the AIDS Administration carefully monitors progress implementing the corrective action plans. In order to facilitate improvement, the AIDS Administration will provide technical assistance to its sub-grantees, as needed. The purpose of the program’s evaluation plan is twofold. Firstly to examine process indicators and quality improvement measures to assess program performance. Secondly is to evaluate the outcomes and impact of HOPWA assistance on the housing stability and health status of participating consumers. The data for both evaluation purposes will come from quarterly reports by project sponsors and by targeted qualitative and quantitative data collection.

130
The outcomes to be measured include:
1. Increased supply of HIV/AIDS housing meets unmet housing needs 2. Increased client access to housing related community services and resources 3. Funded project sponsors demonstrate ability to comply with HOPWA, HUD and other
housing-related laws and regulations 4. Funded project sponsors have increased access to AIDS-related resources and
information 5. Grantee and funded project sponsors are in compliance with HOPWA and other
applicable HUD and housing-related regulations 6. HOPWA resources leverage additional AIDS-specific funding needed to address
community housing-related needs. 7. HOPWA funds are made available to eligible community-based and local sponsors in an
efficient and effective manner. 8. HOPWA grantee and local partners work together to assess housing needs, recognize
barriers and identify solutions and achievable strategies

131
STATE OF MARYLAND ACTION PLAN
INTRODUCTION Maryland’s Consolidated Plan is a joint planning document and funding application required by the U.S. Department of Housing and Urban Development (HUD) under the National Affordable Housing Act. The Plan covers a five-year period and is updated annually in order for the State to apply for HUD funding under several different HUD programs, as well as to set planning goals for the coming year. This document is the annual update (the Action Plan) for Federal Fiscal Year 2005 funding, which covers the period July 1, 2005 through June 30, 2006, AKA State Fiscal Year 2006. It contains the goals and objectives for the fifth year of the State's 5-year plan. As a planning document, the Consolidated Plan is designed to coordinate Federal (and to a lesser extent State) resources to provide all Maryland citizens with:
Decent housing, Economic opportunities, and An acceptable living environment.
Its main thrust as a planning document is to develop policies and procedures and to target resources to carry out these three main goals. As an application for funding, the Consolidated Plan must be submitted to HUD in order to receive funding for the following programs:
Community Development Block Grants (CDBG), HOME Investment Partnerships Program (HOME) Emergency Shelter Grants (ESG), and Housing Opportunities for Persons With AIDS (HOPWA)
In addition, the Plan makes it possible for State agencies, local governments, nonprofit developers, Community Action Agencies and others to apply for funding under competitive HUD programs. These include the competitive portion of the Housing Opportunities for Persons With AIDS program, as well as Lead Paint Abatement, Section 202 (Elderly Housing), Section 811 (Housing for the Disabled), McKinney Act (Homeless) and HOPE (Public Housing) funds, among others.
CITIZEN PARTICIPATION For this Action Plan update, the Maryland Department of Housing and Community Development (DHCD) undertook extensive citizen participation efforts. In order to gain public input, a total of eight public hearings were held on the Plan throughout the State. The first four hearings were held before the draft Plan was written, so that comments and recommendations could be made early in the planning process. The hearings were held at the following dates, times, and places: Wednesday, February 2, 2005 at 1:30 p.m. at the Denton Community Center in Denton; Thursday, February 3, 2005 at the Fairview Branch Library in Owings; Friday, February 4, 2005 at 1:30 p.m. at the Allegany County Office Complex in Cumberland and Monday, February 7,

132
2005 at 7:00 p.m. at the Maryland Department of Housing and Community Development in Crownsville. It should also be noted that all hearings were held in accessible locations, and that DHCD offered interpretive services for the hearing impaired and/or for persons who speak English as a second language Notice of these hearings was published in the Baltimore Sun, Baltimore Afro-American, Daily Mail (Hagerstown), Capital Gazette (Annapolis), Star Democrat (Easton), Dorchester Star, Caroline Times-Record, Kent County News, Bay Times, and Record Observer. In addition, DHCD sent out a mass mailing to nonprofit and for-profit housing developers, municipal and county executives, public housing authorities, community action agencies, advocacy organizations, AIDS/HIV organizations, and local housing and community development contacts, among others, to apprise them of the upcoming hearings and encourage their participation in the development of the new Plan. After the draft Action Plan was completed, the State published the Plan for 30 days of public comment starting on Monday, April 4, 2005, with written comments accepted through COB Wednesday, May 4, 2005. Advertisements were placed in all the newspapers listed above regarding the opening of the public comment period. These advertisements stated the Plan's goals, as well as notifying the public of four additional hearing that would be held to game further public comment and input on the draft Plan. The advertisements also let the public know that they could obtain free copies of the draft Action Plan either by calling or writing DHCD, or visiting DHCD’s website. In addition, the advertisement let people know they could obtain copies of the draft Plan through the State’s regional lending libraries, including the Enoch Pratt Free Library in Baltimore, the Blackwell Library in Salisbury, the Washington County Free Library in Hagerstown, the Lewis J. Ort Library in Frostburg, the Frederick Douglas Library in Princess Anne, and the Southern Maryland Regional Library in Charlotte Hall. The advertisements also noted that a large print version of the Action Plan was provided to the Maryland Library for the Blind and Physically Handicapped. Finally, these advertisements also informed the public that they could submit comments on the draft Plan in writing via either traditional or e-mail. DHCD posted the draft Plan on its web-site and mailed out another set of notices to all of the organizations noted above. This notice also let these groups and organizations know that they could also obtain a free copy of the Plan by simply requesting it from DHCD or downloading it from the web. Finally, several weeks into the comment period, the State held four more public hearings at the following locations, places, and times: Tuesday, April 19, 2005 at 7:00 p.m. at the Maryland Department of Housing and Community Development in Crownsville; Wednesday, April 20,2005 at 1:30 p.m. Denton Community Center in Denton; Thursday, April 21, 2005 at 10:30 a.m. at the Fairview Library in Owings; Friday, April 22, 2005 at 1:30 p.m. Allegany County Office Complex in Cumberland. Lastly, DHCD also worked with other state agencies to help identify goals, objectives, and resources the State would use during the coming year to carry out its Action Plan. These agencies included the Department of Health and Mental Hygiene (DHMH), the Department of Human Resources (DHR), the Department of Business and Economic Development (DBED), the Maryland Department of Environment (MDE) and the Maryland Department On Aging (MDOA)

133
COMMUNITY VISION
Working with partners, DHCD -
revitalizes communities, encourages home ownership, and expands the supply of decent affordable housing
As such, revitalizing communities, encouraging homeownership, and expanding the supply of decent affordable housing are the three over-arching goals of the State’s Consolidated Plan.
PRIORITIES Based on the needs identified in the five-year plan, the Governor’s Housing Policy Commission, the Analysis of Impediments to Fair Housing Choice, and by citizen participation at the hearings, DHCD's priorities for the coming year are as follows: . Housing Priorities: Priorities for federally funded housing assistance will be provided to:
Extremely Low-Income Renters, Low-Income Renters, Extremely Low-Income Homeowners, Low-Income Homeowners, Moderate-Income Renters, and Moderate-Income Homeowners,
Housing assistance to be provided will include 1) encouraging renters to become owners through use of DHCD’s homeownership programs; 2) financing the acquisition, new construction or rehabilitation of multi-family housing; and 3) direct tenant assistance through State and federal rent subsidy programs. DHCD will also assist homeowners with the rehabilitation of owner-occupied properties and assist persons with special needs to obtain supportive housing. DHCD also will work to encourage the preservation of affordable housing. Non-Housing Priorities: Priorities for State funded infrastructure are:
Water, Sewer, and drainage, Streets and roads, Street lighting, landscaping, sidewalks, and public space improvements, Electric utility improvements, Solid waste transfer, conversion and disposal facilities, Government office and meeting facilities, Police, fire, transportation, recreation, maintenance, and other facilities for the
delivery of public services, Public parking structures

134
Public Facilities and Essential Human Services Priorities: Priorities for public facilities and essential human services are:
Head Start, Day Care and Family Support Centers, Youth and Senior Centers, Community Facilities, Health Centers, ADA improvements, and Public Services.
Public facilities and essential human services programs will be financed through federal programs, such as DHCD's CDBG program, as well as State programs administered by DHCD, DHR and DHMH. The State Infrastructure Bond Financing Program often finances facilities that are other ineligible for federal funding due to statutory or regulatory program restrictions.
ONE YEAR GOALS As a result of the planning process, the following overall goals were set for the coming year: 35 Year Mortgage Product – DHCD will offer a new 35 year homeownership mortgage product to help families buy their first homes. The first five years of the loan will require interest only payments on the mortgage. The remaining 30 years of the mortgage will include payments on both principal and interest. This will support DHCD’s goal of expanding homeownership. 40 Year Mortgage Product – DHCD will offer a new 40 year homeownership mortgage product to help families buy their first homes. This product will require payment of both principal and interest during the life of the loan. This will support DHCD’s goal of expanding homeownership. Bridge Subsidy Rental Assistance – DHCD will fund a one year pilot project for $700,000 to provide a rental assistance bridge subsidy for disabled persons on local Section 8 waiting lists. Other cabinet agencies are expected to fund the project is future years. This will support the goal of expanding the supply of affordable housing. Public Housing Rehabilitation Bond – DHCD will work with the State’s public housing agencies to issue a new Capital Fund Securitization Revenue Bond. This bond will be used to rehabilitate public housing throughout the State. This will support DHCD’s goals of expanding decent affordable housing. Section 8 for Homeownership – DHCD will expand its Section 8 homeownership program. This will support DHCD’s goal of expanding homeownership. Employer Partnership Matching Grant – DHCD will work with local business to create a new Employer Partnership Program to help people become homeowners. Under this proposal, employers would contribute funds toward their employees purchasing a home. DHCD would give the employees a DSELP loan for $3,000, and would provide up to an additional $3,000 in DSELP funds on a dollar for dollar basis, for a total loan by the State of up to $6,000.

135
SHOP Program – DHCD will re-open the Special Housing Opportunities Program (SHOP). This program provides funding to build supportive housing for persons with disabilities and/or other persons who need supportive housing. The loans will be guaranteed by the Maryland Housing Fund. Community Legacy – DHCD will continue to operate the Community Legacy Program. In order to receive funding under the Community Legacy Program, communities must be in a priority funding area. In addition, communities will need to demonstrate evidence of decline, such as decreasing homeownership rates or increasing commercial vacancy, while at the same time demonstrating signs of strength such as partnerships with local banks, businesses, educational institutions, or cultural organizations. Funds under the program will be awarded competitively based on locally developed comprehensive revitalization strategies that are both ambitious and achievable. Operation of funding of this program supports DHCD’s goal of community revitalization. Federal Funds and Grants - DHCD, in collaboration with other agencies, will apply for competitive grants to increase resources available to carry out its housing, revitalization, and other goals. The Department also will support applications for grants by other agencies, including grants expanding housing opportunities for persons with disabilities. This goal supports all three of DHCD’s over-arching priorities related to housing and community development efforts. Homeownership for Persons with Disabilities – DHCD will continue to offer homeownership loans for persons with disabilities to purchase existing or new houses through the Homeownership for Persons with Disabilities Program. Eligible applicants must be disabled and have incomes below 55 percent of median income. Funding and operation of this program supports DHCD’s homeownership goal. Homeownership for Persons with Disabilities – DHCD will work with the Department of Disabilities as well as other State agencies on possibly increasing the acquisition and/or mortgage loan limits under the Homeownership for Persons with Disabilities Program. DHCD will also work with these agencies on the possibility of combining grant funds and/or soft seconds with the mortgage. This will support DHCD’s goal of increasing homeownership. Rental Housing Production – DHCD will continue to off a streamlined review option for qualifying multi-family rental projects that are financed only with tax-exempt bond funds. Under the streamlined option, CDA review time will be reduced from the current average of about 9 months to 90 days because CDBG will defer to the credit enhancer’s underwriting and construction review process. This option will make it easier for experienced developers of affordable housing to utilize the Department’s multi-family bond program, and, in turn, expand the supply of affordable rental housing. Undertaking this action supports DHCD’s goal of expanding the supply of decent affordable housing. Rental Housing Production – DHCD will continue to offer its new Rate Lock option for the Multi-family bond program. The purpose of the Rate Lock is to provide another tool for the development of affordable multi-family rental housing and increase the flexibility of the Multi-Family Bond Program. Rate Locks allow a developer to control interest rate risk by locking in the Community Development Administration (CDA) published interest rate 30-90 days prior to loan closing. The Developer must execute a Rate Lock Agreement and pay the Rate Lock Fee to

136
CDA. Undertaking this action supports DHCD’s goal of expanding the supply of decent affordable housing. Preservation of Affordable Housing – DHCD will continue its efforts to preserve affordable housing including units in projects were owners can opt out of the Section 8 project based program. We will use our existing housing finance resources including State funding, tax credits, HOME and bond authority. This activity supports DHCD’s goal of expanding the supply of decent affordable housing. DHCD Catalyst – DHCD will provide customized training to public and private organizations and individuals through DHCD Catalyst. With Catalyst’s 13 Partners, a sample of offerings offered by Catalyst includes training on CDBG funding, implementing a revitalization plan, undertaking large scale development projects, nonprofit formation, how to do project pro formas, proposal writing, rehabilitation of historic structures, responding to Requests for Proposals, small business development, marketing business tax credits and understanding State Programs 101, among others. The Catalyst program supports DHCD’s goal of revitalizing communities by increasing the capacity of individuals and organizations, the Department’s customers, to both access and then successfully utilize DHCD program resources. Historic Preservation Tax Credits - DHCD will continue to operate the State’s newly revised and reauthorized Historic Tax Credit Preservation program. The program provides Maryland income tax credits equal to 20% of the qualified capital costs expended in the rehabilitation of certified heritage structures. Operation of the Historic Tax Credit program supports DHCD’s goal of revitalizing communities. Down Payment Assistance – DHCD will continue to assist persons to become homeowners through the State’s Down Payment and Settlement Loan Program (DSELP), as well as through the federal government’s ADDI program. Operation of both the State funded and federally funded downpayment programs supports DHCD’s goal of expanding homeownership. One Year Housing Goals In addition to the overall goals stated above, DHCD also has set forth specific goals for the provision of housing and community development activities. The table on the following page shows housing activities the State plans to undertake in the next year with HOME funds.

137
HOME ASSISTED UNITS – PROJECTED FFY 2005/SFY 2006
Income Tenure Type
Household Type
Housing Problem 0-30% 31-
50% 51-80%
Total
CB>30% 5 39 - 44SMALL RELATED CB>50% 9 43 - 52
CB>30% 12 5 4 21LARGE RELATED CB>50% 24 5 4 33
CB>30% 25 12 - 37ELDERLY CB>50% 45 12 - 57CB>30% 43 12 5 60
Renter
ALL OTHER CB>50% 62 18 5 85CB>30% 30 25 15 70CB>50% 30 25 15 70SUBSTANDARD 73 44 35 152
Owner
OVERCROWDED 5 4 1 10 The following table shows housing activities DHCD plans to undertake in the next year with State Funds, Mortgage Revenue Bonds, Tax Credits, and the HOME program. It does not include approximately 45-50 units annually that will be developed or rehabilitated with CDBG funds.
One Year Housing Goals Program Household Type Units
Family 1,431 Elderly 1,161
Rental Housing
Special Needs 108
2,700
Family 1,678 Rental Subsidy Special Needs 75
1,753
Family 2,200 Homeownership Special Needs 45
2,245
Family 1,479 Special Loans Special Needs 57
1,536
Total 8,234NOTES: DHCD’s rental housing programs are competitive, estimates are based on past performance. Rental Subsidy, Homeownership, and Special Loans programs do not target by elderly versus family. Special Needs Units under rental housing are units produced through the QAP, under Rental Subsidy they are households assisted under the new Bridge Subsidy Program, under Homeownership they are households assisted under Homeownership for Individuals With Disabilities Program, and for Special Loans they are Group Home beds.

138
Section 215 Goals Section 215 goals are units that meet HOME program income limits for rental housing, and both HOME program income limits and HOME recapture provisions for owner-occupied housing. Because virtually all units DHCD finances under the rental housing programs have incomes below 60% of median income, and all families assisted under the Rental Allowance Program earn less than 30% of median income, almost all rental units will meet Section 215 goals. Most of our homeownership loans would meet the Section 215 income limits (80% of median income or less). However, because we do not recapture our funding when a homeowner’s income increases (we raise their interest rates) most units financed under the Homeownership programs do not meet the Section 215 requirements. One Year Non-housing Goals It is anticipated that the CDBG program will fund the following activities during the next year:
ESTIMATED CDBG ACTIVITIES – FFY 2005/SFY2006 CDBG ELIGIBLE ACTIVITY Number of Projects Estimated Funding INFRASTRUCTURE Water/Sewer/Streets/Parks/ Playgrounds
6 $3,775,800
Planning Studies 2 $62,000PUBLIC FACILITIES AND ESSENTIAL HUMAN SERVICES Adult Day Care/Family Support Services/Developmentally Disabled Centers/Public Services
6 $1,878,655
ECONOMIC DEVELOPMENT Acquisition/Clearance for Economic Development
2 $1,650,000
Infrastructure 1 $268,000Capital Equipment - -Planning
ESIMATED STATE/LOCAL INFRASTRUCTURE BOND PROGRAM ACTIVITIES
Type of Activity Number or Projects Estimated Funding Department of Public Works Improvements
2 $1,250,000
Electric Utility Work 1 $3,000,000Vehicle Purchases 2 $1,866,500Facility Improvements 17 $6,335,900Refinancing existing capital project debt
5 $6,435,673
Street Improvements 2 $1,626,300Sidewalk Improvements 1 $25,000TOTALS 30 $20,539,373

139
COMMUNITY LEGACY PROGRAM Commercial 2 $289,975Demolition 5 $515,000Economic Development 3 $115,000Facade Program 7 $486,875Infrastructure 6 $487,946Mixed-use 6 $646,429Operation Support 2 $65,000Planning 1 $15,000Public Safety 2 $135,625Recreational 2 $117,950Social Services 1 $14,425Redevelopment 3 $207,000
Note that these numbers are subject to change based upon actual applications received and amount of funds available. The projections are based on projects funded in the prior year, excluding housing.
GEOGRAPHIC TARGETING Housing data provided by HUD revealed a similarity of need from jurisdiction to jurisdiction in Maryland. For example, if the percentage of "small, very low-income renter families" with housing needs was 65 percent statewide, virtually every jurisdiction within the State was within a few percentage points of the statewide average. In the survey of needs completed for the five-year Plan, questions about infrastructure, community development, and economic development needs also indicated a similarity of need from jurisdiction to jurisdiction. Since similar needs exist throughout the State, the State will not target its funds to certain jurisdictions, except as established by law. For example, the State's allocation of CDBG funds may only be used in non-entitlement areas. Since there is a major emphasis on directing resources to growth areas and areas in need of revitalization, we will generally be targeting funds to projects located in Priority Funding Areas (PFAs) as well. The information below provides an outline of how funds will be targeted: Programs (or parts of programs) that are not required to fund projects located only in PFAs
Federal and State Lead Paint Reduction Programs Weatherization for Low Income Persons Indoor Plumbing Single Family Rehabilitation (MHRP: 1-4 units) Group Home Financing Shelter and Transitional Housing Facilities Grants HOME – for single family existing homes only Maryland Mortgage Program – for existing homes

140
Local Government Infrastructure Financing Rental Allowance Emergency Shelter Grants CDBG – for single family housing rehabilitation only CSBG Maryland Appalachian Housing Accessory Shared and Shelter Housing Section 8 Voucher/Certificate Section 8 Moderate Rehabilitation Federal and State Historic Tax Credits Federal Historic Preservation Grants Museum Assistance Grants
Programs required by law to fund projects located only in Smart Growth Areas The Smart Growth – Priority Funding Areas Act of 1997 requires that the following DHCD programs be used exclusively in Priority Funding Areas (PFAs): Neighborhood Revitalization
Community Investment Tax Credit Main Street Maryland Community Legacy Program Neighborhood BusinessWorks – in Designated Neighborhoods only Live Near Your Work – in Designated Neighborhoods for non-State employees and in PFAs
for State employees
Homeownership
Maryland Mortgage Program (MMP) – excluding O.B.O. – for new construction Maryland Home Financing Program – for new construction Preferred Interest Rate Loan Program – for new construction HOME – for new construction
Rental Housing
Elderly Rental Housing – for new construction Rental Housing Production – for new construction Multifamily Housing Revenue Bond Financing – for new construction HOME – for new construction
In addition, HUD also asks if or how funds will be specifically targeted to areas of minority concentration. In its Analysis of Impediments to Fair Housing Choice, the State defined a "high concentration" of minority households as a census tract where the percentage of minority households is at least 10% greater than the county average. Based on this definition, of the 346 census tracts in Maryland's non-entitlement areas in the time of the Analysis, only 25, or just over 10%, had census tracts of high minority concentration. As noted above, DHCD targets its funds to Priority Funding Areas. Of the 25 tracts with concentrations, 15 have concentrations due to institutions such as Historically Black Colleges and Universities, hospital centers, military bases, or prisons. Of the remaining 10, 9 all are located in PHAs. Because of DHCD’s

141
emphasis on targeting funds to PFAs, areas of minority concentration are already targeted for assistance through the State’s housing and community revitalization programs. (The one concentration outside of a PFA is located in Charles County and is minority, but not low-income. See the Five-Year Plan’s discussion of concentrations for more information.)
LEVERAGING The Maryland General Assembly appropriated about $37.2 million in general, special and general obligation bond funds in the coming year to provide low-income housing through the State’s homeownership, rental housing, special loan, and rental subsidy programs. This does not include public purpose bond funds that DHCD will leverage to help carry out efforts to address the priorities identified in its Five-Year Plan. The table below shows State funds appropriated for housing in SFY 2006
State Appropriations for Housing, SFY 2006 PROGRAM FUNDINGRental Housing Funds $13,000,000 Partnership Funds $6,000,000Shelter and Transitional $1,000,000Rental Allowance Program $1,700,000Homeownership Programs $7,500,000Special Loan Programs $8,000,000TOTAL $37,200,000
Additional leveraging will be provided through DHCD’s bond financing programs. DHCD will issue bonds for special needs housing, homeownership, and rental housing during the coming year. Bond funds are expected to provide approximately $300 million in resources for homeownership and approximately $150 million for rental housing during SFY 2006. In addition to bond funds, DHCD expects to receive about $2.9 million in U.S. Department of Energy (DOE) weatherization funds which will help leverage other housing funding. The weatherization funds DHCD receives from DOE will be used in conjunction with weatherization funds the Department receives from BGE and Washington Gas to carry out weatherization activities. Other leveraging will come from the State’s allocation of Federal Low-Income Housing Tax Credits. The State’s federal low-income housing tax credit allocation will be approximately $10.3 million for CY 2005 (tax credits are allocated on a calendar year basis). DHCD will also use Section 8 Vouchers, which are provided by HUD but not covered directly by the Consolidated Plan, to work in conjunction with all of the housing programs mentioned above. Another source of leveraging will be the State’s Historic Preservation Tax Credit program. Re-authorized in the spring of 2004, the program will provide $20 million in tax credits to individuals or developers who rehabilitate historic structures under the program’s guidelines. The credits can be used for both housing and community development projects. Significant community economic development leveraging is generated by Maryland’s premier small business program, Neighborhood BusinessWorks (NBW). NBW provides gap financing of

142
up to $500,000 to small businesses and microentrepreneurs located in designated revitalization areas. Historically, NBW levers $3.16 dollars for each one it invests through a loan or grant to a for profit on nonprofit business. DHCD will have $6 million available for loans and grants in SFY 2006. Another major tool of the Department for community development leveraging is the Community Legacy (CL) program, which historically leverages $3 of other private and public resources for every $1.00 that CL invested. The CL program will be funded at $5 million in SFY 2006. DHCD administers another tax credit program, the Community Investment Tax Credit (CITC) Program, which provides tax credits to nonprofits for projects located in Priority Funding Areas or which primarily serve residents of such areas. Annually, the Department awards $1 million of CITCs to nonprofits through a competition similar to that for the federal low-income housing tax credit. The nonprofits market the tax credits to businesses to raise funds to support critical community services and/or a capital project. Any business in Maryland which contributes cash or good to support any approved CITC project, earns state tax credit equal to 50 percent of the contribution. The types of activities and projects funded include: tutoring, employment services, child development, health care, adult literacy, community policing, and home health care programs, youth center, food pantry, emergency shelter, transitional shelter support, historical and cultural programs, capacity building and the renovation of single family and multi-family housing to provide new homeownership and rental housing to very low-income persons. In addition to the above, DHCD also administers a bond pooling program. The Infrastructure Financing Program issues bonds on behalf of local governments enhancing market access for small or infrequent issuers. The bonds finance every form of public infrastructure, such as roads and sidewalks, water and sewer systems and their supporting facilities, parks, storm drains, and schools, town halls, fire stations, and other public buildings. Since the inception of the program in 1987, a total of $163 million in bonds has financed or refinanced 193 projects for 52 municipalities, 4 counties, and 2 instrumentalities of counties. Leveraging to housing and community development projects is also available from sources outside of DHCD. For example, as part of its efforts to improve Maryland’s infrastructure, the State operates several programs aimed at helping local governments repair or build infrastructure. The Maryland Department of Transportation operates several programs which build roads and sidewalks. The Department of the Environment operates a number of infrastructure programs which are primarily targeted toward water and sewer system construction, repair, and replacement. The Department of Health and Mental Hygiene, the Department of Human Resources, and the Maryland Department on Aging also will provide housing assistance, typically in the form of supportive housing. Lastly, In addition to the funds the Department expects to receive itself, DHCD strongly supports and encourages applications by all eligible entities for competitive funds for which those entities are eligible. These include all of the programs currently covered by the Consolidated Plan (the HOPWA program, Section 202 housing, Section 811 housing, homeless funds, etc.) as well as any funds that may come under the plan in the future, such as the Farmer's Home programs.

143
ANTI-POVERTY STRATEGY
The State of Maryland is strongly committed to reducing the number of households in Maryland living in poverty. The citizens of Maryland recognize that persons who live in poverty need a combination of social services and economic opportunities to get back on their feet. No single tactic will address the problem of poverty in Maryland. Key components of the State's Anti-poverty Strategy include:
Providing quality education and job training, Focusing economic growth and revitalization on areas where persons in poverty are most
likely to reside, Increasing the supply of affordable housing, Providing supportive services such as transportation and childcare to assist low-income
individuals in getting and keeping a job. As part of Maryland’s anti-poverty efforts, DHCD operates the Community Services Block Grant Program (CSBG). The State was awarded $8.7 in CSBG funds for FFY 2004. In addition, the State provided an additional $86,584 in funding for CSBG core capacity programs. CSBG funds are granted to states in order to ameliorate the causes of poverty. To this end, the State allocates the CSBG funds to the 17 local Community Action Agencies (CAAs) and two Limited Purpose Agencies (LPAs) Statewide which in turn: 1. Provide a range of services and activities having a measurable and potentially major impact
on causes of poverty within a community. 2. Undertake activities that assist low-income participants to:
Secure meaningful employment, Attain an adequate education, Make better use of available income, Obtain adequate housing and a suitable living environment, Remove obstacles and solve problems which block the achievement of self-sufficiency, Achieve greater participation in the affairs of the community, and Obtain emergency assistance for urgent individual or family needs.
3. Provide the services of food pantries, soup kitchen and emergency food distribution on an
as needed basis. These services are necessary to counteract conditions of starvation and malnutrition among the poor.
4. Establish linkages between government and other social service programs to assure the effective delivery of services to low-income individuals.
5. Encourage the use of entities in the private sector to ameliorate poverty in the community. Furthermore, the State emphasizes that actions undertaken with the CSBG program: 1. Focus resources toward the most needy. 2. Provide employment opportunities for low-income persons.
144
3. Close service gaps. 4. Enable low-income persons to participate in community action programs and projects.
In addition to the above actions undertaken with the CSBG program, in June 2002, the Maryland Department of Housing and Community Development (DHCD) became a sponsoring agency for an AmeriCorps*VISTA project. The project was renewed in 2004, and we anticipate receiving a $15,000 support grant from the Corporation for National Service and Community Service (CNCS) in SFY 2006. This will allow us to continue supporting AmeriCorps*VISTA project..) Founded in 1964 as a domestic counterpart to the Peace Corps, VISTA was launched as part of the War on Poverty. AmeriCorps*VISTA members support volunteer activities of community-based organizations through volunteer recruitment, training and capacity-building. Administered by DHCD’s Division of Neighborhood Revitalization, the VISTA project compliments DHCD’s capital programs and projects by providing the “social mortar” to strengthen community-based revitalization efforts and help ensure their long-term success.
The CNCS grant DHCD received is being used to pay for service-related travel expenses for VISTA members and the DHCD staff time associated with the project. The Neighborhood Revitalization staff currently supervises 12 AmeriCorps*VISTA members at nine (9) Maryland Volunteer Centers. CNCS has also authorized a VISTA Leader for the project. The VISTA Leader is responsible for coordinating training and networking opportunities among the VISTA members and providing staff support for the newly formed Maryland Volunteer Center Association. Each VISTA member has the goal of recruiting and placing 50 volunteers at local community based organizations. The volunteers are placed in organizations addressing a broad range of critical needs including education, environment, public safety-homeland security, and unmet human needs. AmeriCorps*VISTA members recruit volunteers for human service organizations addressing the needs populations ranging from children and teens to adults, families and seniors. These volunteer efforts, tied into CSBG funding as well as funding from other sources, will help the State lift people out of poverty.
THE CONTINUUM OF CARE Maryland has long been an advocate of the “Continuum of Care” approach of serving homeless persons and persons threatened with homelessness. The three principal features of Maryland’s Continuum of Care are: 1. Preventing low-income individuals and families from becoming homeless, providing
outreach to homeless persons, and addressing their individual needs; 2. Addressing the emergency shelter and transitional housing and service needs of
homeless individuals and homeless families; and 3. Helping homeless people make the transition to permanent housing and independent
living. Since Maryland implemented this approach in the mid-1980s, it has become a national model for resolving the problems of the homeless. Homeless persons to be assisted include homeless individuals, homeless families with children, the severely mentally ill homeless, homeless

145
persons with alcohol or other drug addiction problems, homeless fleeing domestic violence, homeless youth, homeless individuals diagnosed with AIDS and other related diseases, and any other homeless individuals or persons at risk of becoming homeless. Activities to be undertaken during the coming year include undertaking new construction, substantial rehabilitation, acquisition, moderate rehabilitation, preservation, lead paint abatement, and infrastructure improvements for rental housing, providing rental (tenant) assistance, and supportive facilities and services. One of the most challenging aspects of addressing homelessness is determining the kinds of resources needed and ensuring that the diverse agencies responsible for providing those resources coordinate their response. While many State government agencies have responsibility for one or more "pieces" of the homeless puzzle, three agencies have major responsibility for assisting homeless people: DHR, DHMH, and DHCD. DHR has primary responsibility for assisting the homeless in the State of Maryland. Within DHR, the Office of Transitional Services (OTS) administers four State-funded programs that provide housing and services for homeless people. DHMH focuses on people with physical and mental disabilities and illnesses, with the AIDS Administration within DHMH having a specific focus on people with AIDS. In terms of meeting housing needs in general, DHCD has the broadest role: to support the development, acquisition and maintenance of affordable, decent housing for low-income people. DHCD provides federal and State funds for rehabilitation of buildings for use as shelters, operation of shelters, and prevention of homelessness. DHR has a similarly broad mandate in terms of services. It is responsible for assisting low-income people with income maintenance, including income supplements, food stamps, and coordinating education and employment training through Project Independence. All of DHCD’s, DHR’s, and DHMH’s homeless assistance programs can be categorized within the principles of Maryland’s “Continuum of Care.” 1. Preventing Low-Income Families (especially those with incomes below 30 percent of median) From Becoming Homeless. A central component to the DHR/OTS homelessness assistance strategy is preventing the onset of homelessness. This approach focuses on providing resources to families and individuals prior to their becoming unsheltered and in emergency situations. While funds under the Emergency and Transitional Housing and Services (ETHS) Program can be used for limited rent and mortgage assistance, and the Housing Counselor program can be used effectively to keep people in housing, the key program in OTS in this prevention effort is the Homelessness Prevention Program. DHCD operates a number of programs designed to prevent persons from becoming homeless. For example, as noted above, under the ESG a portion of the annual allocation (30 percent) may be used to support homelessness prevention activities. In addition to operating the federal Section 8 programs, DHCD also operates the State funded Rental Allowance Program which provides rent subsidies to homeless persons and families whose incomes are less than 30 percent of Statewide median. This is in addition to the Department's numerous housing production programs, all of which help prevent homelessness by financing the new construction or rehabilitation of affordable housing for lower income households. Finally, the State has committed to targeting its federal allocation of HOME funds to provide rental housing to serve persons earning 30 percent of median or less.

146
Homelessness Prevention Program This program was funded in fiscal year 1993 in partial replacement for the terminated State-funded Emergency Assistance Program (a portion of which had been used for homelessness prevention activities). OTS was designated to administer the Homelessness Prevention Program given the interrelationships between eviction prevention and that portion of the ETHS Program that can be used for the same purpose. Activities may include direct grants to families and individuals to prevent eviction, landlord-tenant mediation, and early intervention services for at-risk households and seed money for a revolving loan fund for renters. Funds may not be used to assist people who already have been evicted. The program's target populations are families and individuals in crisis who are without resources to meet an impending eviction. Local jurisdictions are required to track and evaluate their programs. Outside of the Office of Transitional Services, but within DHR, are two programs that assist in preventing homelessness: the Family Investment Program and the Temporary Cash Assistance (TCA) program. 2. Emergency Shelter and Transitional Housing Needs of Homeless Individuals and Homeless Families A key component of Maryland's Continuum of Care is meeting emergency and intermediate needs of people who have become homeless. In addition to the numerous programs operated by DHCD which may be used to finance construction of emergency shelters or transitional housing, programs are administered by both DHCD and DHR which support shelter maintenance and operating costs and fund delivery of homeless services. Homeless Services Program DHR’s Homeless Services Program (HSP) was created by the General Assembly in 1984 to provide funding for emergency and transitional shelter and services to homeless families and individuals. Eligible activities include costs associated with emergency shelter, transitional housing, motel placements and eviction prevention. Funds may assist all people who are homeless and in need of assistance. The Office of Transitional Services administers HSP funds. Throughout the program’s operation, OTS has worked to ensure interagency cooperation on project development and implementation at the State and local level. Shelter and Transitional Housing Grants Program Created in fiscal year 1991, the Shelter and Transitional Housing Grants Program has provided for the acquisition, renovation and rehabilitation of homelessness assistance facilities throughout Maryland. Originally administered by DHR, this program is now operated by DHCD. DHCD has financed 35 projects utilizing $12,374,104 in funding to provide 935 units and/or beds. Freezing Weather Plans In fiscal year 1991, the State of Maryland encouraged local governments to plan formally for the needs of homeless people during periods of freezing weather. All 23 Maryland counties and

147
Baltimore City prepare Freezing Weather Plans that outline resources, facilities and procedures for assisting homeless citizens during the coldest days of the winter months. Each local jurisdiction submits their freezing weather plan to DHR as part of its homeless services funding request. This ensures that local jurisdictions review and amend their freezing weather plans annually. OTS provides local jurisdictions with guidelines on plan preparation, model examples of freezing weather plans, and comments on completed plans. Plans submitted share a key characteristic: the formation of partnerships among a wide range of local government agencies that previously had very little involvement in homelessness. Over the years these partnerships have grown and strengthened. Domestic Violence Program DHR’s Office of Victim Services provides safe refuge and support services to victims of domestic violence and their children. Services are provided by community agencies through purchase of service contracts/agreements. There are 21 domestic violence programs serving 24 jurisdictions (15 programs directly provide shelter; 6 arrange housing through safe home networks, hotels or motels). Each program maintains a 24-hour crisis hotline. In order to prevent homelessness, the Domestic Violence Program provides crisis counseling, advocacy and court accompaniment to victims, helping them either to set up a new living situation or to get a court order to have the abuser removed from the home. Emergency Shelter Grants Program DHCD’s Emergency Shelter Grants Program (ESG) provides federally funded competitive grants to local governments to support the following costs of emergency and transitional shelters: maintenance and operations, case management and essential services, and a portion of staffing costs. A portion of the grant may be used for homelessness prevention activity, such as for one-time cash assistance to prevent eligible families from being evicted. Typically, Community Action Agencies or nonprofit organizations operate these homeless programs, although some are administered by agencies of local governments. 3. To Help Homeless Persons Make the Transition to Permanent Housing (including persons with special needs who require services to achieve and maintain independent living) A final critical component of the State's Continuum of Care is helping families and individuals transition to permanent housing. DHCD operates several programs to help homeless persons make the transition to permanent housing. One is the Rental Allowance Program which provides rent subsidies to homeless families and individuals who are homeless or are threatened with becoming homeless. In addition, the Department operates the Group Home Financing Program which can be used to help homeless persons with special needs make the transition to permanent housing. Also, the Emergency Shelter Grants Program supports transitional shelters and services, including case management services, to help people attain self-sufficiency. Housing Counselor and Aftercare Program DHR’s Housing Counselor Program also assists the homeless in moving to permanent housing. The program began in July 1989 to fund housing counselors in three Maryland counties,

148
Baltimore, Prince George's, and Washington. In 1993, the Program was broadened in scope to include serving single homeless people in Baltimore City. In 1995, it was expanded again to include Montgomery County. Housing counselors are responsible for assisting families experiencing a housing crisis to locate, obtain and maintain safe, decent affordable housing. Counselors also perform resource development activities, such as working with landlords and overseeing roommate referrals, to help expand the availability of affordable housing. Emergency and Transitional Housing and Services Program DHR’s Office of Transitional Services provides housing and supportive services to help homeless individuals and families make the transition to permanent housing. The table below provides a summary of expected activity to assist the homeless during the coming year. It does not include persons to be assisted under federal competitive grants.
HOMELESS ASSISTANCE - DEPARMENT OF HUMAN RESOURCES UNITS OF MEASUREMENT FFY 2005/SFY 2006 EST.
ASSISTANCE EMERGENCY AND TRANSITIONAL HOUSING SERVICES Bednights in Emergency Shelters 80,000Bednights in Transitional Facilities 65,000Shelters and Transitional Facilities 80Emergency Services 27HOMELESS PREVENTION Housing Counseling 500Eviction Prevention 12,000Service Linked Housing 2,000EMERGENCY FOOD ASSISTANCE Occasions of Service Annually 450,000Pounds of Food Distributed 4,500,000DOMESTIC VIOLENCE PROGRAM Bednights for Domestic Violence Victims and Their Children 65,000WOMEN'S SERVICES PROGRAM Bednights for Women and Children 85,000
*SEE THE DHR ANNUAL REPORT ON HOMELESSNESS SERVICES FOR ADDITIONAL INFORMATION.
PERSONS WITH SPECIAL NEEDS The mentally ill, physically disabled, developmentally disabled, persons with alcohol or other drug addictions, persons with AIDS and related diseases, the elderly requiring supportive services, and the frail elderly are special need groups requiring housing assistance. Activities to be undertaken to assist persons with special needs include new construction, substantial rehabilitation, acquisition, moderate rehabilitation, preservation, lead paint abatement, or related infrastructure improvements for rental housing, rental assistance, and supportive facilities and services.

149
The Elderly and Frail Elderly The Maryland Department On Aging (MDoA) supports many programs designed to meet the housing and supportive service needs of Maryland's elderly, and especially frail elderly. DHCD is seeking partnership opportunities with the MDoA, DHR and DHMH to expand affordability in the assisted living market. The table below shows the number of persons MDoA expects to serve during SFY 2006:
MARYLAND DEPARTMENT OF AGING UNITS OF MEASUREMENT ESTIMATED ASSISTANCE
FFY 2005/SFY 2006 Congregate Housing Program Participants 885Senior Assisted Living Group Home Participants 800Medicaid Waiver Participants 3,135Senior Care (in home care) Program 3,954
Persons with HIV/AIDS In order to improve housing opportunities for persons with HIV/AIDS, DHCD works with the AIDS Administration of DHMH to provide housing assistance and supportive services to persons with HIV/AIDS. The HOPWA program is carried out in Allegany, Caroline, Cecil, Dorchester, Garrett, Kent, St. Mary’s, Somerset, Talbot, Washington, Wicomico, and Worcester Counties (the State’s remaining areas receive HOPWA funding directly). DHCD uses its portion of the HOPWA grant to operate a tenant based rental assistance program. The AIDS Administration provides supportive services through the HOPWA program. Linkages formed with local social service providers support the social service needs of persons with HIV/AIDS. Activities undertaken with the grants are carried out in accordance with the guidance required of grant recipients under the Ryan White Comprehensive Emergency (CARE) Act, and the Statewide Coordinated Statement of Need (SCSN) for the State of Maryland. The activities DHCD and DHR are carrying out build on previous competitive grants the State has received to provide supportive services and short term housing assistance. In addition, DHCD will continue its existing policy of assisting persons with HIV/AIDS through its group home programs. (NOTE: See the “Specific Information” section below for a detailed write up on how the State of Maryland will operate the HOPWA entitlement program.) Individuals with Mental Illness The Mental Hygiene Administration of the Department of Health and Mental Hygiene through its public mental health system provide services to individuals with mental illness including inpatient and outpatient services. Currently the Mental Hygiene Administration funds 2,347 adult residential rehabilitation program (RRP) beds in the community. Many of these RRP sites have been financed by DHCD and HUD (811 grant). Downsizing at the state hospitals over the past five years has added to the number of persons receiving residential services throughout the state. Over the next five years at minimum, five hundred additional mental health consumers will be in need of affordable housing services in order to be discharged from state hospitals. This is based on the Statewide Needs Assessment for Mental Health Services and the Mental Hygiene Administration's Five-Year Plan for Downsizing and Consolidating of State

150
Psychiatric Hospitals. The Mental Hygiene Administration also reports that they currently have over 800 adults on the waiting list for beds, and that an additional 500 patients in the RRP program are in need of affordable housing. MHA is developing Evidence Based Practice projects in the area of Assertive Community Treatment (ACT). The goal is to provide a team approach to intensive treatment and case management for individuals with severe persistent mental illness. These individuals may be homeless or living in temporary living situations. Safe, stable and affordable housing is a key component to a successful outcome in this project. The table below shows the number of persons with mental illness that are served through the Public Mental Health System.
DEPARTMENT OF HEALTH AND MENTAL HYGIENE Mental Hygiene Administration
UNITS OF MEASUREMENT ESTIMATED ASSISTANCE FFY 2005/SFY 2006
Individuals Discharged from Inpatient Treatment – Adults 4,967Individuals Discharged from Inpatient Treatment – Children 2,542Persons with SMI receiving Employment Services 1,151Persons with SMI receiving Residential Rehab 2,953Number of Adults receiving psychiatric support 8,123Number of Adults who receive public mental health 45,283Number of Children receiving community based services 44,147Number of Children receiving psychiatric support 9,134
Persons With Developmental Disabilities The DHMH’s Developmental Disabilities Administration (DDA) plans, develops, and directs a statewide comprehensive system of services for persons with developmental disabilities and their families. Services include programs for individuals with mental retardation, cerebral palsy, spina bifida, epilepsy, and severe communicative disorders. The DDA coordinates its work with other government, voluntary, and private health, education, and welfare agencies. The DDA operates residential facilities and also provides funds for purchased care, group homes and apartments, small residential centers, and daytime programs for developmentally disabled persons. In addition, the Administration funds Family and Individual Support Services, and Supported Employment Programs. DHCD works with the DDA by financing group homes for persons with developmental disabilities. As with persons with mental illness, DHMH coordinates service delivery to persons with developmental disabilities through DHMH’s Long Term Managed Care Committee. The table on the next page shows projected activities of both housing and supportive services that the DDA expects to provide in SFY 2005:
DEPARTMENT OF HEALTH AND MENTAL HYGIENE Developmental Disabilities Administration
UNITS OF MEASUREMENT ESTIMATED ASSISTANCE FFY 2005/SFY 2006
Number of Individuals Served 22,020Number of Individuals receiving home based services 7,783

151
Number of Individuals moved out of State Centers 13Clients receiving community residential services 4,847Clients in Day programs 5,557Summer Program 1,882Family Support Services 2,862Individual Family Care 225Individual Support Services 5,251Behavioral Support Services 1,300Community Supported Living Arrangements 1,179
Persons With Alcohol and Drug Addictions The Alcohol and Drug Administration (ADA) of the Department of Health and Mental Hygiene will provide supportive services to individuals on both an in-patient and outpatient basis, and will provide housing with supportive services in residential homes and halfway houses. DHCD also finances group homes for persons with drug and alcohol addictions. Also, as with persons with developmental disabilities and mental illness, DHCD and DHR work together through DHMH’s Long Term Management Care Interagency Committee to work toward the best possible care for persons with alcohol and drug addictions. The table below shows the number of persons the ADA will assist in the next year:
DEPARTMENT OF HEALTH AND MENTAL HYGIENE Alcohol and Drug Abuse Administration
UNITS OF MEASUREMENT
PROGRAMS/ FACILITIES
ESTIMATED ASSISTANCE FFY 2005/SFY2006
Outpatients 65 27,000Residential Clients 25 6,000Halfway House 19 570Methadone Maintenance 18 7,000
BARRIER REMOVAL The State of Maryland’s barrier removal efforts will focus on a number of issues this year. This includes continuing work on building codes, continuing to carry out fair housing activities, and continuing work to help provide housing to persons with disabilities through the Olmstead Housing Task Force, the Group Home Financing Program, and the Homeownership for Persons with Disabilities programs. First, the Department through Maryland Codes Administration will continue its work on building codes to provide fair housing, to help provide housing for persons with disabilities and, to provide decent, safer, accessible and more energy efficient housing. Second, the Department will continue its work on the State's new rehabilitation code to make it easier to rehabilitate older buildings. This should help overcome some of the barriers that limit the supply of affordable housing as identified in the Five-Year Plan. This effort will also support

152
the revitalization of Maryland's older communities, another goal of the Five-Year Plan. Specifically in the coming year:
The Department will provide technical assistance to communities undertaking housing rehabilitation activity.
The Department will evaluate rehabilitation projects to determine how best to provide assistance in code compliance and permitting.
The Rehab Code Hotline (a toll free number for technical assistance on code-related issues) will continue to be used to help people determine the code requirements for their projects.
DHCD will evaluate the model rehabilitation codes recently developed on the national level by the International Code Council and the National Fire Protection Agency. Both of these codes are based in part on the Maryland Code, and may offer additional benefits to rehabilitation projects in Maryland.
In addition, in its Analysis of Impediments to Fair Housing Choice, DHCD’s (aside from offering a wide range of programs to help providing fair housing for minorities, families, persons with disabilities and other protected classes) continues to focus on fair housing education, with the MCHR carrying out enforcement actions. DHCD will implement its fair housing plan to ensure that everyone has equal access to housing without regard to race, sex, religion, national origin, handicap, sexual preference, or marital status. Specifically, DHCD has awarded a grant to the Greater Baltimore Community Housing Resource Board, Inc. (GBCHRB), to provide fair housing education and training to residents of the non-entitlement counties in Maryland. The project is aimed at increasing the awareness of residents of these communities about their rights against housing discrimination. Fair housing outreach plans in the coming year include:
Distribution of free fair housing posters and basic resource guidebook in libraries, community centers, nonprofit organizations, governmental agencies, banks, and other businesses. (Brochures and posters will be made available in English, Spanish, Korean, and Russian.)
A toll-free telephone line (800-895-6302) available statewide for fair housing counseling, information, and referral.
Development, distribution and support of an individualized Housing Curriculum (K-12) for each of the counties.
Development and distribution of individualized Self-Help Guides to Fair Housing for each county.
Developing and conducting fair housing training for real estate personnel, realtors, developers, lenders and insurers, and
Highlighting the issue of fair housing on GBCHRB’s cable-TV show Neighborhood Beat on each county’s cable system.
In addition to the above, DHCD will continue to use its Group Home Financing Program (GHFP), Special Housing Opportunities Program (SHOP), and its Homeownership for Individuals with Disabilities Programs to help integrate persons with disabilities into the community. GHFP and SHOP are specifically designed to assist the State with setting up small residential homes in the communities for special needs populations. The majority of homes financed under the program are to DHMH licensed providers who are caring for developmentally disabled or mentally ill many of whom previously resided in institutions. Very few other States provide this financing tool. The majority of homes financed under the program are for DHMH licensed providers who are caring for developmentally disabled or mentally ill, many of whom previously lived in institutions. While the Olmstead decision only addressed the right of the

153
mentally ill to live outside of institutions, GHFP encompasses a much broader definition of special needs populations ranging from the developmentally disabled, juveniles, homeless, mentally ill, etc. The Homeownership for Individuals with Disabilities program provides mortgages at 3% for disabled individuals to purchase their home. In addition, as noted above, DHCD will also implement a new bridge subsidy demonstration program to assist persons with disability with temporary housing while they await full time housing assistance. While DHCD is undertaking these efforts, the Maryland Commission on Human Relations (MCHR), which has primary responsibility for carrying out fair housing activities, will continue its work toward providing fair housing opportunities to all of Maryland’s citizens. Activities the MCHR will carry out include fair housing testing, complaint investigation, and legal action as appropriate where fair housing violations are found and not otherwise resolved.
COORDINATION During the next year, the State of Maryland will undertake a number of efforts to improve coordination among State agencies, local governments, and nonprofit organizations.
To improve the ability of non-profits to deliver housing and/or other services, DHCD will continue to set aside money from its HOME program to assist CHDOs build their capacity to better serve low-income persons. Some of these entities are also Community Action Agencies that carry out anti-poverty programs.
DHCD is working with the AIDS Administration to administer the HOPWA program. The State became a HOPWA entitlement earlier last year (see the “Specific Information” section below). The AIDS Administration is the primary operator of the grant, but subgrants a portion of the funds to DHCD to carry out housing activities. . Funds will be used in non-entitlement jurisdictions through a network of local administrators. (NOTE: The State’s HOPWA entitlement jurisdictions already receive HOPWA funding under the non-competitive portion of this program.)
DHCD will work with MDE to continue to abate lead paint, including applying for HUD lead paint abatement funds. These funds will be coordinated with the State’s own lead paint abatement programs (see below).
DHCD will continue to fund its Homeownership for Individuals with Disabilities Program, working with DHMH and other agencies to enable persons with disabilities to purchase their own home.
DHCD will work with the State's Public Housing Authorities to assess interest in the issuance of additional Grant Anticipation Revenue Vehicle (Garvee) Bonds to help them rehabilitate their properties. (See the discussion on Public Housing below.)
DHCD’s Division of Neighborhood Revitalization will collaborate with the 13 organizational partners of the Department’s Catalyst Training Academy to provide state of the art education and technical assistance on best practices and financial products to respond to clients’ changing needs.
DHCD’s Division of Neighborhood Revitalization will coordinate with the Governor’s Office of Business Advocacy and Small Business Assistance (GOBA) and the Office of Minority Affairs to increase their awareness of the Neighborhood BusinessWorks (NBW) and MD Capital Access Program (MCAP) and the gap financing and credit assurance/loan loss reserves available for start-up and expanding small and micro businesses located in revitalization areas across the State.
DHCD’s Division of Neighborhood Revitalization will continue to collaborate with the US

154
Small Business Administration on its annual Small Business Awards Breakfast and Trade Show to promote the Neighborhood BusinessWorks Program and celebrate the small businesses in the state which NBW assists.
DHCD’s Division of Neighborhood Revitalization will work with the Small Business Development Center Network and other providers of support to small and micro business (e.g., Morgan State University) in order to generate new referrals of small businesses seeking gap financing.
DHCD’s Division of Neighborhood Revitalization will coordinate with the MD Dept of Environment and the US Dept of Agriculture to cross refer infrastructure projects to the most appropriate funding source.
DHCD’s Division of Neighborhood Revitalization will continue to coordinate marketing of the Community Business Tax Credits with the MD Comptroller’s Division of Revenue Administration and with business membership organizations including the MD Bankers Association, MD Society of Accountants, MD Association of Certified Public Accountants, MD Chamber of Commerce
DHCD’s Division of Neighborhood Revitalization will continue to coordinate with the MD Departments of Natural Resources, Health and Mental Hygiene, Aging and Transportation regarding projects that can be joint funded
DHCD’s Division of Neighborhood Revitalization will continue to coordinate with the MD Department of Planning in assisting with well planned development and community revitalization across the state
DHCD’s Division of Neighborhood Revitalization will continue to coordinate with its primary customers - local governments, community development corporations, nonprofit organizations, and small businesses to provide a variety of technical and financial resources
DHCD’s Division of Neighborhood Revitalization and the State’s Office of Minority Affairs (OMA) will coordinate to increase the awareness of minority and women owned businesses and those with disabilities who contact their Office about MBE certification about nontraditional financing. This includes the loans, loan guarantees and lines of credit that Neighborhood BusinessWorks offers for both small businesses and micro entrepreneurs. OMA will add a link to NBW on its web site.
OTHER ACTIONS
The State of Maryland will undertake a number of other actions to help implement the goals of the Consolidated Plan in the coming year: Local Government Revitalization Strategies. DHCD will continue to provide technical assistance to help local governments designate their Smart Growth and revitalization areas. Institutional Structure. The State will use inter-departmental forums to coordinate resources, develop consistent policies and methods to achieve stated goals and objectives. As noted above, DHCD will enact two new policies this year to improve the ability of developers to provide affordable rental housing, through both the streamlined bond program and the interest rate lock-in program. Low Income Housing Tax Credits. DHCD has a uniform application and process for allocating tax credits that is also used in the award of rental housing funds from State and federal resources. The uniform application and allocation process was developed in 1995 to improve coordination of all programs providing funding for multifamily rental housing projects.
155
Federal Low-Income Housing Tax Credits will continue to be awarded through DHCD's uniform allocation process for multi-family housing. One or more competitive rounds are held annually and awards are based on the criteria outlined in the state's "Qualified Allocation Plan" (QAP) and in the Multifamily Rental Financing Program Guide. These plans are reviewed periodically and updated in accordance with the department's goals, industry standards and periodic revisions to Section 42 of the Internal Revenue Code. An update to the QAP and Guide will become effective in the Spring of 2005 and will guide financing and allocation decisions for the next year. In addition to maintaining the Department’s goal of financing projects with experienced development teams, high development quality, a strong market demand, and high public purpose, notable changes in the latest update include:
Mandating the installation of hard wire or wireless data transmission technology for high-speed internet access for projects
Increased maximum thresholds for construction costs Tightening criteria considered in evaluating development and management company
experience, and Encourage development of affordable housing in community revitalization areas, near transit
and metro locations, and in vibrant communities as evidenced through homeownership, employment, and education indicators.
Public Housing. DHCD does not operate public housing. However, it does work with Public Housing Agencies (PHAs) to help them construct or rehabilitate affordable rental housing through its Partnership Rental Housing Program. PHAs have also completed for State funds and tax credits to rehabilitate or develop public housing units. For the past several years, DHCD has worked with HUD, and the City of Baltimore, and private developers to repair or replace all of Baltimore City’s public housing high-rises. This effort cost an estimated $293.5 million with DHCD providing $65.3 million in Partnership Rental Housing funds, as well as other State funds, federal low-income housing tax credits, and tax-exempt bond proceeds. The federal government, the City, and the private sector paid the rest. All of the high-rises that have been scheduled for demolition have been demolished. and new, low-density units will be built either on the sites of the old high-rises or on scattered sites throughout the Baltimore area. Three of the four on-site replacement developments are complete and the other one is under construction. Construction of the scattered site projects is nearing completion. The goal of the initiative is to change not only the physical environment for residents through lower density, high quality, mixed-income housing which is architecturally integrated with surrounding communities, but also to address the personal development of individuals and families through supportive services and the promotion of self-sufficiency. A community and support services plan, a requirement of both the federal and State funds, has been developed for all projects. The focus of these plans is job training, education, and employment. The Baltimore City Housing Authority is responsible for tracking progress made toward self-sufficiency. The development of resident initiatives is also part of this program. Residents have consistently been included in the planning of the new communities, primarily through resident councils. They will continue to work with the Housing Authority and management companies to help screen residents, undertake community projects and serve as an advisory group. The annual income

156
of most of the public housing families living in the redeveloped communities will range from about $8,000 to $17,000 per year. Lastly, in recognition that welfare reform will have an impact on the majority of residents in the redeveloped properties, partnerships with the private sector and numerous training and employment programs have also been developed to assist residents become self-sufficient. In addition to the above, DHCD has been a financing partner for other PHA’s HOPE VI projects and will work with the State's PHAs to issue the State's second round of Garvee Bonds. DHCD became the first State to issue Garvee bonds in partnership with PHAs earlier this year. Garvee bonds are bonds financed against future capital appropriations. In the case of PHAs, these bonds would be issued against federal Public Housing Capital Grant funds. Funds from the bonds would be used to rehabilitate and repair local public housing units. DHCD expects that the next round of Garvee bonds will be issued in 2005. Preservation of Affordable Housing. According to HUD the average household income for residents of federally assisted private rental housing is about $7,000 a year. Because few other housing programs are capable of such deep subsidies, preservation of Maryland’s stock of project-based Section 8 housing is a major goal of DHCD. DHCD will work pro-actively with federal and other public and private partners to preserve this valuable affordable housing resource. Preservation efforts will be carried out through existing programs that finance the acquisition and rehabilitation of existing low-income properties. These programs include the Maryland Assisted Housing Preservation Act which provides for ample notice, relocation and other protections for residents of assisted housing. The notice requirements will allow DHCD time to work with local government and other stakeholders on a case-by-case basis to provide incentives for owners, who would otherwise opt-out of the Section 8 program, to keep their projects affordable. The department also expects to strengthen its existing multifamily portfolio through the use of bonds by re-capitalizing projects in order to provide capital improvement and capital reserve funds.

157
Lead Paint Abatement. The State of Maryland will be pro-active in its efforts to address the lead paint issue. DHCD received a $3 million, 3 year lead paint grant from HUD last year which will be used to abate lead hazards in both single family and multi-family housing. Actions to be taken will include:
Providing grants to property owners to abate lead paint Providing technical assistance to property owners to abate lead paint Improving the screening of children as required under Medicaid regulations Improving outreach to families and screening children through local health departments, and Stepped up enforcement of existing lead laws included increasing the properties to be
registered, enforcing risk reduction standards in registered properties and ensuring units with unacceptable lead levels are not re-occupied until the lead hazards have been abated.
SPECIFIC INFORMATION
The information below provides detailed guidance on how the State will operate the HOME, CDBG, and ESG programs during the coming year. Included is information on the application process, threshold criteria, rating and ranking, and other program requirements to be met by HOME, CDBG, or ESG program applicants. DHCD expects to receive the following FFY 2005/SFY 2006 allocation of funds from HUD for the CDBG, HOME, and ESG programs:
CDBG - $8,979,468 HOME - $7,814,492 HOME ADDI - $191,464 ESG - $599,886 HOPWA - $335,000
COMMUNITY DEVELOPMENT BLOCK GRANT PROGRAM
The Maryland Community Development Block Grant Program is a federally funded program designed to assist units of local government with activities directed toward neighborhood revitalization, housing opportunities, economic development and improved public facilities and services. Congress initiated the program in Title I of the Housing and Community Development Act of 1974 and provides funds to non-entitlement areas of the State. Non-entitlement areas are non-urban counties with populations less than 200,000 and municipalities of less than 50,000 population. The Maryland CDBG program is administered jointly by the Departments of Housing and Community Development (DHCD) and Business and Economic Development (DBED). State Fiscal Year 2006 Allocation For SFY 2006 (FFY 2005), Maryland anticipates an allocation of $8,979,468. The allocation is divided into the following categories:
STATE OF MARYLAND CDBG ALLOCATION – FFY 2005 State Administration (2% + $100,000) $279,589

158
Technical Assistance (1%) $89,795Community Development (72% - $600,000) $5,865,217Special Projects $500,000Economic Development (25%) $2,244,867TOTAL $8,979,468
In addition to the formula allocation, DHCD expects to receive about approximately $660,000 in program income for the CDBG program in the coming year. As per our discussion on CDBG program income below, program income will be used for the same purposes from which it was generated. CDBG Match Requirements The State will match the two- percent administrative allowance with State general funds. The one percent Technical Assistance funds will be used to provide technical assistance to grantees and potential CDBG recipients, aid in the development and implementation of revitalization strategies in non-entitlement areas, increase the capacity of local recipients and subrecipients to utilize CDBG funds and compile infrastructure needs within nonentitlement areas. Program Objectives The primary objectives of the Maryland CDBG program are to provide decent housing and necessary supporting infrastructure, preserve and develop viable communities through the expansion of economic opportunities, and meet the critical needs of Maryland's communities. The Maryland CDBG program provides public funds for activities that meet at least one of the following national objectives as required by Title I of the Housing and Community Development Act of 1974, as amended:
gives maximum feasible priority to activities that will benefit low and moderate (LMI) persons and households having an income equal to or less than the Section 8 lower income limits established by HUD;
aids in the prevention or elimination of slums or blight; or meets community needs that are of an urgent nature or an immediate threat to community
health and welfare. Additional Maryland CDBG program objectives include:
revitalizing older neighborhoods and established communities; leveraging CDBG funds with other public assistance programs and private resources; directing growth to existing population centers; providing essential public services to low and moderate income persons encouraging collaboration with Maryland State and local programs focused on community
development efforts

159
COMMUNITY DEVELOPMENT PROJECTS
Application Process Applications for community development projects are accepted annually on a competitive basis. The funding round is announced in advance of program opening, and applicants are given a minimum of 45 days to prepare their applications. Five hundred thousand dollars of the community development set aside are reserved for special projects. Any funds not awarded in the round will be announced to eligible jurisdictions and distributed on a first come, first served basis to projects meeting the minimum standard and approved by the Department. The maximum amount an applicant may seek in the competitive round of CDBG funds distributed by DHCD is $800,000. Applications are evaluated in a three-step process: threshold review, project evaluation, and funding recommendations. Only projects that meet threshold requirements set forth in these guidelines and have complete applications submitted by the application deadline date will be rated and ranked in any competitive round. Threshold Review Applications in the competitive process are pre-screened by Maryland CDBG program staff for compliance with minimum thresholds. At the completion of the threshold review, applicants whose proposed project applications are not complete or do not meet basic eligibility and threshold requirements will be notified by mail that project review has been terminated. Each application must meet the following minimum eligibility requirements:
The applicant is an eligible non-entitlement jurisdiction; The proposed activities are eligible under Title I of the Housing and Community
Development Act of 1974, as amended; The proposed project meets a national objective as required under 24 CFR Part 570; The project is located in a Priority Funding area, except for single family housing
rehabilitation, where the Secretary determines that the project is necessary to protect public health, alleviate personal economic hardship in an emergency situation or promote economically integrated housing, or where an exception has been approved through the Department of Planning process;
The applicant meets performance thresholds on prior CDBG grants including timely drawdown of funds, submission of Progress Reports and resolution of monitoring issues.
Performance Thresholds: Expenditure of certain minimum percentages of previous grants must be met by the last Friday of the week preceding the deadline for submission of the application in the competitive process. These percentages will be announced at the opening of each round and are more fully described in the CDBG Project Evaluation Guide. They will apply to open Maryland CDBG program grants in the Community Development category. Exceptions will be made only under extenuating circumstances, particularly where funds are targeted for recapture by the State but no formal letter has been issued.

160
Monitoring issues will be reviewed on a case by case basis, taking into consideration the significance of the finding(s) or concern(s), the corrective action(s) taken by the grantee or subrecipient to resolve the issue(s), and the timeliness of the grantee in responding. For funding of community development projects for which a Project Feasibility and Planning grant was awarded, a required portion of the study must be completed. Waivers of threshold requirements may be granted on a case by case basis when requested in writing prior to the submission deadline for the application. Resource Allocation Model (RAM) All CDBG applications are subject to a modified review under a resource allocation model to determine the economic impact of the project. All applicants will be asked to provide additional information for this review. Project Evaluation All applications that meet the threshold criteria will be rated and ranked competitively by a review committee composed of Maryland CDBG program staff and other departmental staff with participation from other government agencies when appropriate. Applicants will be given an opportunity to answer the committee’s questions either via phone or e-mail. Rating is based on a 175-point scale. Point ranges have been established for each criterion to gauge the extent to which the applicant meets the criterion. The following factors will be considered in determining the points assigned. A copy of the rating form is included with the Project Evaluation Guide.
RANKING FACTOR MAXIMUM POINTS PUBLIC PURPOSE Consistency (10) Severity of Need (30) Community Support (5)
45 Points
PROJECT IMPACT Impact on Need (10) Benefit to LMI Households (15)
25 Points
PROJECT MANAGEMENT Readiness (35) Accuracy of Costs (10) Capacity (10)
55 Points
LOCAL COMMITMENT/LEVERAGING Local Commitment (15) Leveraging (10) Financial Need (25)
50 Points

161
Public Purpose/Local Need (45 maximum points) Severity of Need (30 maximum points). Based on the information in the application, the degree of distress and examples provided will determine the number of points awarded. Distress factors considered include the quality and quantity of existing facilities, including the need for rehabilitation or replacement, condition description, age, adequacy or absence of facilities, services, housing etc. Up to twenty (20) points are awarded where there is indication of unmet need for new or additional services or facilities such as housing rehabilitation, head start centers, streets and sidewalks or developmental centers. Up to five (5) points are awarded where existing physical health and safety conditions are documented. Up to five (5) additional points are given to projects that address imminent health and safety issues such as contaminated wells, failing septic or emergency housing repairs. Community Support and Involvement (5 maximum points). Maximum points may be awarded based on evidence of community support and involvement in the project, its development and implementation. Letters of general support and participation may include local interest or neighborhood groups, local public or non-profit agencies and individuals that might directly benefit from the project. Consistency with Local Needs/Plans/Strategies (10 maximum points). Points are awarded based on the degree to which the project fills a need in the community and is specifically identified and consistent with a locally developed revitalization strategy or comprehensive plan (up to 5 points). Maximum consideration is given to projects that are consistent with local plans and most effectively re-use existing buildings and infrastructure (up to 5 additional points). Project Impact (25 maximum points) Impact on Need (10 maximum points). Points may be awarded based on the extent to which the project will address the needs and alleviate the existing problems described by the applicant. Benefit to Low and Moderate Income (LMI) Households (15 maximum points). Maximum points may be awarded to projects where there is a direct benefit to LMI households. Moderate points will be awarded to projects where there is an area wide benefit to LMI households. No points will be given for slum/blight projects where there is no benefit to LMI persons, or where benefit cannot be determined. Project Management (55 maximum points) Readiness to Proceed (35 maximum points). Points may be awarded for the extent to which the project is ready to proceed and the implementation schedule is reasonable. The assessment is based on the relative progress of elements such as site control/easements, architectural design or preliminary engineering, other project financing or the development of rehabilitation guidelines. Maximum points (30) may be awarded to applicants that have completed preliminary design and/or engineering, can document that all funding sources are committed, can complete the environmental review process within 60 days of the award date or can otherwise demonstrate an immediate readiness to proceed.

162
Twenty (20) points are awarded to applicants that can complete the environmental review process and commence the project within 90 days of the award date. Ten (10) points are awarded for projects that can complete the environmental review process within 90 days and commence the projects within 91-120 days of the award date. No points are awarded when completion of the environmental review cannot be completed within 90 days or project commencement is projected beyond 120 days of the award date. Up to five (5) points are awarded based on the reasonableness of the projected implementation schedule. Accuracy of Costs (10 maximum points). Maximum points may be awarded to projects which best document that project costs have been carefully estimated. Estimates should reflect the applicability and impact of Davis-Bacon wage rates, acquisition, relocation or replacement housing requirements. Preliminary professional studies, appraisals, tax assessments, wage rate determinations are some examples of acceptable documentation. No points will be awarded if documentation of costs is not submitted. Administrative Capacity (10 maximum points). Points may be awarded for projects based on the general stability and track record of the local government (5 points maximum) and the subrecipient where applicable, as well as the adequacy of staff to implement the project (5 points maximum). Local Commitment and Leveraging (25 points maximum) Local Commitment (15 maximum points). The Department will consider the extent to which local funds will be contributed to the project. Maximum points (15) may be awarded to applicants whose local contribution exceeds 20% of the total project costs. Local contribution of 10%-19% of total project costs receives 10 points. Where there is some local contribution but less than 10% of the total project costs, 5 points are awarded. No points will be given where there is no local contribution. Local funds include cash and any in-kind contributions which materially contribute to the project completion. In-kind contributions must be documented and may include the donation or long term lease of land or buildings, appropriation of local revenues, site improvements or installed infrastructure, deferral of real estate taxes, abatement or payment in lieu of taxes, payment of debt service (including federal and state loans to the local government) or operation and maintenance expenses, provision of public services without charge and administration. The contribution may be provided by the local government or directly by a non-profit sub-recipient. Leveraging (10 maximum points). The Department will consider the extent to which local and CDBG funds are used to leverage other public and private funds. Points will be awarded based on the documented commitment of funds specifically identified to supplement CDBG funds. Maximum points (10) will be awarded for projects where 50% or more of the project costs are from sources other than local or CDBG. If less than 50% of the project costs are from sources other than CDBG and the locality, five (5) points are awarded. The application will receive no points for leveraging if other funding sources are available but are not sought. Leveraged funds include other public or private grant funds, individual or corporate donations, or public loan funds made directly to the beneficiary.

163
Financial Need (25 maximum points). Because of the declining availability of grant resources, the Department will consider the extent to which the applicant has sufficiently documented and justified its financial need for CDBG grant funding. Points will be awarded based on the applicant’s diligence in seeking alternate funding sources and evidence that the requested grant amount is necessary and reasonable to complete the project. Up to 25 points are awarded to applicants who can provide underwriting analyses, loan/grant determinations from other funding sources, or other substantive proof of financial need by the applicant or subrecipient for grant funds. Funding Recommendations The highest rated applications are recommended for funding until the allocation for the round is exhausted or the next highest rated project requests more funds than are available and the project cannot be phased. In that case, the next highest scoring project may be funded. In case of a tie score, the application with the highest combined score on Public Purpose/Local Need and Project Management is funded first. The committee may recommend an award less than the requested amount with a recommendation to decrease the size, scope and/or costs of the project. A planning grant may be awarded in lieu of project funding where further study is deemed necessary. Those applications not funded are rejected and are not reconsidered unless the applicant reapplies in a later round or is considered for special projects at the discretion of the Secretary. The application then is competitively rated against the applications received in that round. The Maryland CDBG program has established a minimum point standard of 105 (70%). Applications that receive less than 70% of the total points are not recommended for funding. Committee recommendations (both for approval and rejection) are reviewed by the Assistant Secretary for Neighborhood Revitalization and forwarded to the Secretary of Housing and Community Development for final approval. In addition to the rating criteria, the Assistant Secretary for Neighborhood Revitalization or the Secretary of DHCD may consider other factors in making funding determinations, including:
The State’s CD objectives and priorities The availability of alternate or contributing funding sources for the total project or
some of its components A reasonable distribution of projects among regions of the State The ability to respond to a locality’s special needs, and The degree of community commitment for the project.
Awards are expected to be announced within approximately 90 days of the application submission deadline.

164
Special Projects and Planning Applications Special projects applications may be submitted anytime and are reviewed independently by Maryland CDBG program staff. Five hundred thousand dollars of the CD set-aside is reserved for special projects and planning grants.) Applications may be submitted for special projects funds based on: • high priority and emergency need; • timing of the request is out of cycle; or • the need for supplemental funding for an existing project. Planning applications also may be submitted anytime, are reviewed independently by Maryland CDBG program staff and are subject to the minimum point standard. No specific amount is allocated for planning, nor is there a limit on the amount of a planning grant. However, a twenty percent (20%) match is required, of which no more than 5% can be in-kind. (Planning grants for economic development activities can be funded from the economic development set-aside.) Special project and planning grant funding recommendations are made on a case by case basis to the Assistant Secretary for Neighborhood Revitalization to the Secretary of Housing and Community Development for final approval. ECONOMIC DEVELOPMENT PROJECTS Economic Development (ED) funding may be awarded to Maryland’s non-urban counties and municipalities for a variety of economic development activities. CDBG-ED is a financing resource to support local economic development initiatives either by direct public improvements to facilitate new industry or through loans to assist businesses. Job creation through business expansion in Maryland’s rural communities is the primary objective of the economic development category of CDBG. Additionally, economic development funds may be used by local governments to assist with commercial revitalization projects that will address downtown deterioration and that will promote economic vitality. Prior to submission of an application to DBED, a pre-application conference is required. If the project proposal is accepted for funding consideration, the conference is followed by an internal review by the Credit Committee. There is no limit to the number of applications a jurisdiction may submit each year in the ED category. There is no maximum grant amount. The economic development criteria are: a. Compatibility with the State’s overall ED strategy; contained in the Maryland Economic
Development Commission Report, “Strategic Directions for Increasing Maryland’s Competitiveness”, with emphasis upon the targeted growth industry sectors.
b. project feasibility;
c. sources and uses of funds;
d. LMI benefit - Costs per job;
e. readiness to proceed;

165
f. local commitment;
g. capacity to administer a grant; and
h. prior performance in administering grants. The following are additional areas under which prospective projects are accepted for funding consideration: a. projects that diversify the economy of the local region or community, particularly those with
defense impacted businesses and industries, to the extent that a significant percentage of jobs are saved or created;
b. projects that prevent a major plant shutdown; or c. projects that foster the development and growth of small and minority businesses including
micro-enterprises. ED applications initially are reviewed by DBED and DHCD for eligibility requirements. Additional reviews are based on criteria established for the category and on benchmarks which determine the "best" ED projects. These include: a. amount or percentage of local commitment; b. leveraging ratio of owner invested capital, private and other public funds to CDBG is 3:1 or
greater; c. CDBG cost per job is $25,000 or less; d. number of jobs created for or retained by LMI persons; e. percentage of the CDBG financing used for working capital to the total working capital need
does not exceed 25 percent; f. negotiated interest rate and terms of a loan will reflect the most appropriate amount
necessary to make the project feasible; g. quality of collateral; h. the highest degree to which ED goals are achieved by the project as it pertains to the overall
ED strategy. Deviation from the above criteria will be based on justifiable circumstances and in consideration of the merit of the project as it relates to public benefit and/or increased economic stability. If the project includes a loan to a for-profit business, the loan is underwritten for an "appropriateness" determination, which includes financial analysis and determination of public benefit. A site visit may be made to obtain additional supporting information. Recommendations are made and final approval is determined by the DBED Secretary.

166
The DBED Secretary may approve or reject a recommendation based on the following additional factors: a. degree to which the project supports the State's small businesses, especially those owned
by minorities; b. support of industry that exports goods or services outside the State; or c. increased economic vitality and physical attractiveness of downtowns and other
concentrated commercial areas. If two or more projects are evaluated equally, the higher rated project will be the one which ranks first among these priority criteria: a. creates the most jobs for LMI persons; b. business site is within an enterprise zone; or c. makes the greatest impact on the identified needs of the community. Community Legacy or Local Infrastructure Financing Program Activities Transferred to CDBG The Community Legacy Program is a State funded initiative to assist local governments and community development organizations to undertake comprehensive neighborhood revitalization strategies. The Program provides funding for both planning and capital projects. It also attempts to leverage other State and federal funds where possible. Under the Local Infrastructure Financing Program, the Maryland Department of Housing and Community Development (DHCD) issues bonds on behalf of counties, municipalities, and their instrumentalities to finance public purpose infrastructure projects. The program generates savings in the costs of borrowing by pooling the local demand and managing the bond issue. Eligible portions of approved community legacy applications or infrastructure projects from non-entitlement units of local government that meet a national objective can be funded with CDBG funds at any time. Community Development funds not obligated in a competitive round, special projects or economic development funds may be used to fund eligible community legacy or infrastructure bond activities. While submission of a separate application is not required, recipients must follow all applicable rules, regulations and statute governing the CDBG program.

167
PROGRAM POLICIES AND PROCEDURES Funds Transfer No later than eight months from the award date of the State allocation, DHCD and DBED will consult regarding the status of funds and pending projects to assess the need for transfer of unobligated funds between categories. With mutual concurrence of the Secretaries of DHCD and DBED, unobligated funds remaining in the ED category will be made available for funding CD projects. If sufficient qualifying CD applications are not then pending, the funds may be awarded to the next qualifying special project or rolled into a future competitive funding round. With concurrence of both agencies, funds also may be transferred between categories at any time during the year to meet additional demand for funds for special projects or community legacy projects. A review of the Special Projects balance will occur prior to the announcement of the annual CD competitive round. If sufficient projects have not been funded or are not expected to obligate the entire one million dollars set aside, all or a portion of the funds can be used to fund competitive projects. Administrative Costs Applicants for community development funds may request that up to 15 percent of the grant be used for general administrative costs. Applicants for economic development funds may request up to 10 percent for administrative costs. Other Policies and Requirements 1. Applicants may not submit the same project for funding to both DHCD and DBED
simultaneously. However, DHCD and DBED may decide to jointly fund an application. 2. Applications submitted on forms from one department or category may be funded from the
other without resubmitting the proposal, should DHCD or DBED transfer the application between departments. When applications are transferred from one department or category to another, projects are reviewed against the criteria for the particular category to which they are transferred.
3. DHCD and DBED reserve the right to negotiate with the applicant for elimination of certain
portions of the proposed project which do not make a strong contribution and/or for reducing the grant amount, and for the determination of payment terms and schedules when loans are involved.
4. Financial Penalty - The Environmental Review and Request for Release of Funds must be
submitted for approval by DHCD within 5 months of the award date. Failure to do so may result in a 10% financial penalty of the grant award. The penalty will be assessed initially from administrative funds awarded. If no administrative funds were awarded, then project funds may be recaptured. The exception shall be for projects with issues identified through screening letters where the CDBG Environmental Officer has been notified in writing.
168
Further delay in completing the Environmental Review and obtaining a Release of Funds could result in the termination of the grant.
Requests for Additional Funding A jurisdiction may not apply to DHCD or DBED for additional funds for a previously funded project, unless there are extenuating circumstances surrounding the shortfall. The locality must provide a written explanation of the reasons for the shortfall, including: 1. the reasons for the request for additional funds; 2. verifiable documentation of a significant increase in beneficiaries, if applicable (i.e., job
creation), tax revenues, and/or private sector leverage; 3. proof that all alternate funding sources have been exhausted; and 4. documentation of any negative impact on the community if the project is not completed. All requests for additional funds are subject to review by DHCD or DBED, in accordance with evaluation criteria applicable to the year from which additional funding, if awarded, is allocated. This does not apply to projects that are anticipated to be completed in clearly identifiable stages. Project Amendments Circumstances or conditions may develop during the course of a project's implementation which could prompt the grantee to request, in writing, an amendment to the grant. Accordingly, grantees must obtain DHCD or DBED's approval for amendments in the following instances: 1. if the addition of a new, or deletion of an existing activity or project is proposed; 2. if activities in an area other than the approved target or project area are proposed;
3. if the scope of the existing project or activities will change (i.e., number of beneficiaries);
4. if a budget revision is proposed resulting in a transfer between approved projects and
activities of a cumulative amount in excess of ten percent of the grant award;
5. in other instances where DHCD or DBED determine an amendment to be appropriate, such as where technical changes in legal or administrative terms occur.
The request for a project amendment shall provide sufficient information to explain and justify the proposed changes. An amendment to a grant agreement resulting from 1. 2., or 3., is subject to the following requirements:
1. citizen participation;
2. State clearinghouse review;
3. environmental clearance.

169
The request for a project amendment will be reviewed on the basis of eligibility and the evaluation criteria applicable at the time of the amendment request. A time extension may be granted, generally for one year, when it is determined by DHCD that as a result of unforeseen circumstances, the grantee will not complete a project by the completion date established in the grant agreement. The time extension is processed internally by DHCD and is not subject to the requirements of project amendments listed above. Funds Recapture Any funds recaptured through project cancellation, misuse, failure to expend funds in a reasonable period of time, or completion of an activity at a cost savings will be returned to the category from which they were awarded, less any amount eligible for State administration and technical assistance costs, for redistribution to an eligible project. Recapture funds may be transferred to another category or set-aside with the concurrence of the program administrator or the agency, if applicable. Program Income Program income is defined as gross income received by the recipient or a sub-recipient directly generated from the use of CDBG funds. It includes, but is not limited to, the following: 1. proceeds from the disposition by sale or long term lease of real property purchased or
improved with CDBG funds; 2. proceeds from the disposition of equipment purchased with CDBG funds; 3. gross income from the use or rental of real or personal property acquired by the recipient or
a sub-recipient with CDBG funds, less the costs incidental to the generation of the income; 4. gross income from the use or rental of real property owned by the recipient or a sub-
recipient that was constructed or improved with CDBG funds, less the costs incidental to the generation of the income;
5. payments of principal and interest on loans made using CDBG funds; 6. proceeds from the sale of loans made with CDBG funds; 7. proceeds from the sale of obligations secured by loans made with CDBG funds; 8. interest earned on funds held in a revolving loan fund account; 9. interest earned on program income pending disposition of the income; 10. funds collected through special assessments made against properties owned and occupied
by households not of LMI, where the assessments are used to recover all or part of the CDBG portion of a public improvement.
Program income may be retained by the grantee provided the grantee pledges its general funds to reimburse the State for any financial liability related to negative findings by HUD with regard

170
to the re-use of income and if: 1. the program income is targeted for an eligible CDBG activity that meets a national objective
and for which DHCD or DBED has given approval; or 2. the program income is targeted for use for the "same activity". "Same activity" is defined as
one with the same purpose and same location as the activity generating the program income; and
3. completion of the proposed activity will meet time constraints established by DHCD. A re-use plan for program income, which includes a description of the proposed method to manage the funds and the capacity of the grantee to comply with State and federal regulations, must be submitted as part of the application and approved by DHCD or DBED, depending on the category. The decision to permit retention of program income by the grantee will be made on a case-by-case basis. Upon the written instructions of DHCD or DBED, a grantee and any sub-recipient shall permit an authorized agent of DHCD to collect, distribute, or in any other manner deal with program income in accordance with such written instructions. CDBG regulations provide that program income generated by a local government in an amount of less than $25,000 per year is excluded from CDBG program requirements. The State may use two percent of any program income returned to the State or received and retained at the local level during the program year for administration. Remaining program income received by the State will be distributed in an expeditious manner for activities in the same category and/or set-aside from which it is derived unless it is transferred to another category or set-aside with the mutual concurrence of both agencies. The distribution will be in accordance with the criteria and method of distribution for the category as set forth in the Consolidated Plan. Any program income that is distributed by the State during the period beginning with the date HUD awards the annual grant to the State and ending with the following year's grant award date is considered to be covered by the current Consolidated Plan. The State is exploring, and may elect to create, a State Revolving Loan Fund in which to collect and distribute program income. CDBG Monitoring
Every CDBG grant is monitored at least once during the lifetime of the project. Monitoring of planning grants is accomplished through a desk monitoring in which grantees submit a completed checklist and supporting documentation. Staff reviews the information and writes a summary report which is then mailed to the Chief Elected Official within 60 days.
All other CDBG grants are monitored through a visit to the grantee and review of the records on-site. Monitoring of a grantees’ capacity to meet compliance, project performance and national objective requirements includes an assessment of the following:

171
Overall CDBG management structure; Internal procedures and controls; Capacity to track projects and activities from the planning stage through applicable major
milestones (e.g., release of funds, contract bid and award, etc.) to completion; Consistency of the implemented project with the approved plan (as reflected in the grant
application, Grant Agreement, and any amendments); Capacity of the grantee (and/or its subrecipients) to ensure compliance with the relevant
programmatic and compliance requirements. 24 CFR 570.490 and 24 CFR 570.506 describe the Federal record-keeping requirements in general terms. In addition, the Grant Agreement provides additional guidance to grantees on records to be maintained. At a minimum, the grantee’s records must provide a full description of each activity assisted, including its location, the amount of funds budgeted, obligated and expended, and the category of eligible activity(ies) being undertaken (pursuant to Subpart C of 24 CFR 570). The records must also be sufficient to document compliance with all other applicable State and Federal requirements. Grantees must have the capacity to provide the various reports periodically required by DHCD, particularly those specified in Exhibit D of the Grant Agreement. The CDBG project records must be maintained for a period of three years after the close-out date of the State CDBG grant from HUD; in the event of litigation, claims, or other unresolved legal or audit issues, however, the three-year period is extended. The on-site review typically will involve the following types of activities:
Interview grantee’s management, program, and administrative staff (and/or those of their
subrecipients, as relevant). Inspect project sites, both for completed and on-going CDBG activities. Conduct a general review of the project records.
DHCD staff must review the grantee’s (and/or subrecipient’s) files to determine whether adequate documentation is being maintained to show compliance with the applicable Federal and State requirements. In regard to the local record-keeping system, the Reviewer should look for the following:
The record-keeping system should be divided into categories that logically correspond to the
key components and compliance areas of the project (e.g., citizen participation, environment review, documentation of national objectives, etc.); it should be updated regularly, and maintained in an orderly manner.
Responsibility for maintaining the CDBG project files may be divided among several individuals. The Reviewer should identify those individuals who have responsibility for maintaining the CDBG files.
All CDBG files must be secure and safeguarded. The records must be easily accessible to appropriate and authorized grantee (or
subrecipient) staff, as well as State and Federal officials or their designees (e.g., the files may not be kept in someone’s home or automobile).
The files must contain adequate source documentation.

172
As part of their review, DHCD staff complete checklists to document their review and conclusions concerning projects and activities. Projects delayed due to circumstances beyond the grantee’s control are discussed with the grantee and appropriate rescheduling is agreed upon.
Projects/activities for which little or no progress has been made, or which appear to be ineligible or inconsistent with national objectives, or which exhibit non-compliance with other pertinent State or Federal requirements result in a finding or matter of concern. DHCD monitoring staff considers and offers proposed remedies (including technical assistance) and/or required corrective actions that will remove impediments to progress or address non-compliance. A written report is completed and issued to the Chief Elected Official within 60 days of the visit. The report stipulates the required corrective actions and the time frame for completion. Follow up continues until all findings and matters of concern are adequately addressed and resolved. Suspension of Method of Distribution for Presidential Disaster Declarations In the event of a Major Disaster Declaration by the President of the United States for a city, town, or unit of local government located in the State of Maryland, the Secretary of DHCD shall have the authority to waive the Method of Distribution or any other State policies for the CDBG program to address emergency needs of impacted communities. This will be done in consultation with HUD and the program will operate within the parameter of the law or laws addressing the CDBG program.
HOME INVESTMENT PARTNERSHIP PROGRAM
Maryland will use the majority of its HOME funds in conjunction with ongoing State programs to fill gaps in State funding, make projects feasible and increase the number of low-income persons to be served in State-funded projects. HOME funds will be used in conjunction with projects utilizing any combination of State appropriated and bond-issued funds, or low-income housing tax credits administered by the Community Development Administration (CDA). CDA’s Single Family Housing Programs consist of the Homeownership Programs and Special Loans Programs units; and the and the Multifamily Housing Programs consist of the Housing Development Programs, Rental Services Programs and Contract Administration Unit. HOME FUNDING ALLOCATION DHCD expects to receive a total of $8,005,956 HOME funding during the coming year. The FFY 2005 allocation includes: $7,814,492 from the HOME formula allocation and $191,464 from the FFY2005 ADDI allocation.

173
STATE OF MARYLAND HOME ALLOCATION - FFY 2005/SFY 2006
Multifamily Housing Programs $4,300,000Single Family Housing Programs $1,533,782HOME Initiatives $1,000,000CHDO Operating Assistance $390,725Administrative Fees^ $781,449TOTAL $8,005,956CHDO Set Aside* $1,172,174
*As required by federal law, a minimum of 15 percent of the State’s formula HOME allocation, or $1,172,174, will be reserved for use by Community Housing Development Organizations (CHDOs). Included within that amount, up to 10 percent, or $117,217, may be used for predevelopment costs for CHDOs. The required set aside(s) will be met within the HOME program uses as set forth in the above table. ^The amount shown for administrative fees includes 10% of the FFY2005 regular HOME allocation. The statute governing FFY2005 ADDI allocation (and all future year ADDI allocations) does not permit using 10% for administrative fees. In addition to the regular HOME allocation, DHCD expects to receive about $800,000 in HOME program income in the coming year. This estimate is based on historical amounts of program income we have received in previous years. HOME program income is required to be spent on a “first come, first served” basis. Based on our use of HOME funds, we would estimate that two-thirds of the program income would be used to construct or rehabilitate multi-family rental housing, and one third of the program income would be used for providing new homeownership opportunities and single family rehabilitation. The State will administer HOME funds allocated to State programs by directly funding projects which receive State resources and by competitively allocating funds directly to projects or programs proposed by local governments, nonprofit organizations, and housing sponsors and developers. HOME funds may also be used in conjunction with the Community Legacy Program. HOME funds may be requested by sponsors and/or local governments as part of a project application. CDA staff may also propose the use of HOME funds during project underwriting. HOME funds will be awarded to projects either as individual projects or as part of a financing package. All projects using HOME funds are presented to DHCD’s Housing Finance Review Committee (HFRC). In addition, HOME funds will be awarded where possible to stimulate new ideas and projects that meet the needs identified in the Consolidated Plan. These HOME Initiatives funds will be used for new and creative ideas worth testing, model pilot programs and projects and activities not permitted within regular State programs or for which there is no State funding. Funds for Initiatives projects will be allocated in competitions with at least one round of awards each year. Awards will be made on a priority ranking system using criteria including:
Project readiness Extent that the project addresses documented needs Preference for projects which include local government resources Local and community support

174
Demonstrated capacity General geographic distribution, with highest points for projects located in
designated growth/revitalization areas. Preference for CHDOs with CHDO eligible activities Preference for nonprofit organizations, local governments and joint venture
partnerships Preference for lowest income served, and Preference for longest term low-income occupancy
The beneficiaries to be served are very low-income renters, homeless persons, persons with special needs, low-income renters, very low-income homeowners, and low-income homeowners. Funds Transfer The HOME funds to be used in conjunction with on-going DHCD housing programs and the HOME Initiatives Program will be allocated to these uses for up to eight months. After that time, unencumbered funds may be moved to any other HOME uses to meet additional demand for funds or for special projects, including the Community Legacy Program. Geographic Areas for Use of State HOME Funds The State will primarily use its funds in HOME non-participating jurisdictions. There are six local participating jurisdictions within the State which have their own HOME funds. They are Baltimore City, and Anne Arundel, Baltimore, Harford, Howard, Montgomery and Prince George's Counties. State HOME funds for the non-participating jurisdictions are restricted to PFAs except as outlined in the geographic targeting discussion provided earlier in the Plan. Community Housing Development Organizations (CHDOs) The State of Maryland will reserve not less than 15 percent of its HOME allocation for use by CHDOs. Within the CHDO set-aside, 10 percent may be used for project specific technical assistance and pre-development costs for nonprofit organizations. Although the set-aside above the minimum requirement by law is not provided for nonprofits, nonprofits will be given additional preference in the competition for funds. In addition, up to 5 percent of the State's HOME allocation will be made available for operating expenses of CHDOs. The set-aside for use by CHDOs will be administered in the same manner as other HOME funds, that is, they will be awarded either as part of the existing program funding or through the HOME Initiatives competition process. It is anticipated that CHDOs will use funding for acquisition, moderate and substantial rehabilitation and construction of housing for low and moderate-income persons. The State does not anticipate any barriers to utilizing the CHDO set aside; however, if funding is being committed more slowly than necessary to use the required amount, extra measures will be taken to promote the use of the set-aside. The measures will include aggressive marketing for applications, expedited processing and ultimately, if need be, reservation of the balance of uncommitted HOME funds solely for projects that meet the required set-aside. The funds set-aside for project-specific technical assistance and pre-development costs will be administered by CDA. CDA will solicit participation by potential CHDOs and will certify CHDO

175
eligibility by determining that applicants meet the criteria outlined in the HOME program regulations. Certified CHDOs will be eligible for HOME Seed Money and Technical Assistance loans. A CHDO may apply to use HOME funds to pay reasonable and customary pre-construction costs of a project. All costs must be related to a specific project, which, if deemed feasible, would be eligible to receive HOME funds for development. HOME Seed Money and Technical Assistance loans will be provided to CHDOs on a first-come, first-served basis. The loans will be zero percent interest with deferred principal. Repayment will be due at settlement of the construction or permanent loan. CDA has developed loan documents consisting of a Loan Agreement and a Promissory Note, and funds will be released upon execution of loan documents with CDA. Guidelines for Homeownership Assistance The State of Maryland will use HOME funds to assist individuals and families purchasing units in approved single family housing projects. HOME funds will reduce the cost of buying affordable housing in conjunction with the State administered first mortgage programs and through projects approved under the Initiatives Program. Households with incomes at or below 55 percent of the Statewide median for a family of four will be targeted. The State has elected to recapture the HOME Investment if the property is sold within the affordability period. Definition of Modest Housing Homeownership units assisted with HOME funds must be “modest housing”. The State defines housing to be modest if the sales price (when a property is purchased) or the after-rehabilitation value (when a homeowner property is rehabilitated) does not exceed 95% of the median sales prices for housing in the area per the FHA Section 203(b) single family mortgage limits. Form of Subsidy HOME funds will be used in homeownership programs to directly assist the home buyer with down payment and closing costs or to reduce the sales price of the home by providing a deferred payment mortgage. HOME funds may be provided to developers to reduce the cost of land or development costs, the benefits of which would be passed on to the homebuyer. If HOME funds are provided in the form of development subsidies, the resale requirements pursuant to Section 92.254(a) (5) (i) must be imposed. METHOD TO ENSURE COMPLIANCE WITH RECAPTURE REQUIREMENTS Pursuant to Section 92.254(a)(4)(ii) of the regulations, the State has selected the option to recapture the full HOME investment from the net proceeds of the sale of a house which was purchased with the assistance of HOME funds. The net proceeds from the sale of a house will be distributed as follows: 1) a) To pay the balance due on any superior loan and to pay any required closing costs;
b) To pay the HOME funds, subject to (2) below;
c) To pay the balance due on any subordinate loan;
d) To repay the homeowner for the amount of any homeowner payments; and

176
e) To pay the remaining balance to the homeowner.
2) If there are insufficient proceeds from the sale of the house to repay the amount of HOME
funds and to pay the homeowner for the amount of any homeowner payments, the State will forgive a portion of the loan made with HOME funds, calculated by multiplying the amount of the HOME loan by the fraction equal to the number of years the homeowner owned and occupied the house times the affordability period, where HOME funds per unit equal:
(i) under $15,000, 1/5 per year (ii) $15,000 - $40,000, 1/10 per year; and (iii) over $40,000, 1/15 per year.
3) With respect to loans made with HOME funds to assist homebuyers, "Homeowner
Payments" means the following: a) The amount of the down payment made by the homeowner on the house;
b) The amount of any principal payments or prepayments on any loan on the property; and
c) The cost of all capital improvements to the house made by the homeowner.
Additionally, the State will consider more restrictive terms for recapture and forgiveness provided it determines such action is necessary through established underwriting criteria. HOME funds used to assist homebuyers that are recaptured according to these guidelines will be used to carry out other HOME eligible activities. Legal Method Covenants describing the recapture restrictions will be included in the recorded loan documents to ensure that the HOME funds will be recaptured at the time of transfer or refinance of the HOME-assisted unit. Tenant Based Rental Assistance The State of Maryland will use HOME funds for tenant based rental assistance on a limited basis, including using HOME funds for security deposit assistance. Rental assistance programs through the Initiatives Fund will select households to receive assistance in accordance with written tenant selection policies and criteria. In addition, if families selected are currently residing in units that are designated for rehabilitation or acquisition under the HOME program, they will not be required to meet the written tenant selection policies and criteria. Families so selected may use the tenant-based assistance in the rehabilitated or acquired unit or in other qualified housing.

177
TYPES OF INVESTMENT BY THE STATE OF MARYLAND IN THE HOME PROGRAM Maryland expects primarily to invest funds in projects through grants, as well as interest bearing and non-interest bearing loans. Depending on the circumstances of each project, the State may use other forms of subsidies including equity investments, interest subsidies consistent with the purposes of this program, and deferred payment loans with interest. HOME Matching Fund Requirements The State of Maryland is under a match waiver for FFY 2005 due to Hurricane Isabel. However, DHCD will continue to provide match during FFY2005 in order to build up its match account. Specifically, the State will provide HOME match through DHCD’s Rental Allowance Program, although other sources of State funds may be used if needed. Program Income The State may receive program income from time to time as a result of the prepayment of loans or from debt service payments. Any program income received will be used in accordance with the requirements of 24 CFR Part 92. HOME Monitoring Two offices within Maryland's Department of Housing and Community Development are responsible for monitoring housing loans and grants made by the Department with both State and federal (including HOME) funds. The office of Multifamily Housing Programs in the Division of Development Finance is responsible for income monitoring of tenants. The Asset Management unit in the Division of Credit Assurance is responsible for monitoring the physical and financial condition of DHCD–financed properties, including those assisted with HOME. Multifamily Housing performs annual audits and reviews of grantees in the delivery of rental subsidies, as well as annual audits for compliance with tenant income and rent restrictions of properties with HOME funding. Multifamily Housing will perform additional audits, if needed, to ensure that problems are corrected. Multifamily Housing and grantees are subject to HUD audits. Reviews and audits will ensure that all State and federal regulations are being followed. Asset Management undertakes physical inspections of DHCD-financed properties, as well as ensuring the financial stability of loans and assets management by the Department. Generally, Asset Management is responsible for conducting annual inspections on all properties for which the original loan amount was $750,000 or greater and all HUD insured and subsidized projects. Inspections are conducted every two years on properties with original loan amounts between $350,000 and $750,000. Inspections are conducted every three years on projects whose original loan amount was less than $350,000, but more than $75,000. On multifamily loans of less than $75,000, no inspection is conducted by DHCD. Some inspections may be completed by the Contract Servicer. In addition, annual physical inspections are performed on projects that do not meet all of the following criteria:
The loan is current and has not been delinquent in the prior twelve months.

178
The debt service coverage ratio for the loan including any superior debt, if applicable is greater than 1.0.
Vacancy is less than 10%. There are no significant outstanding violations of the Regulatory Agreement or other loan or
program requirements. The project does not exhibit deferred maintenance. Deferred maintenance is defined as a
condition exhibiting the continued failure by a management agent or an owner to perform routine or day-to-day tasks associated with the repair or upkeep of the property.
The project received a Satisfactory or better rating on its most recent physical inspection and administrative review by Asset Management.
The surrounding market is stable or appreciating. On-Site Monitoring for HOME-Assisted Projects On-site monitoring is conducted to ensure that HOME-assisted projects are operated in compliance with the HOME regulations. On site monitoring responsibilities are conducted in accordance with the HOME regulations. Inspections of HOME-assisted rental units are scheduled as follows: Number of Total Units in HOME-assisted Projects
Required Frequency of Inspections
1-4 Every 3 years 5-25 Every 2 years 26 or more Annually
The on-site monitoring elements include:
maintenance of appropriate records; evidence that the property's written tenant selection policy has been followed; acceptable lease documents; evidence of affirmative marketing and conformance with fair housing policies; review of rent adjustments; review of treatment of rents for tenants who no longer qualify as low-income families; review of corrective procedures dealing with temporary noncompliance caused by increases
in the incomes of existing tenants; ensure compliance with the written agreement between the owner and DHCD; physical inspections for compliance with property standards; and, verification of accuracy of information submitted by owners on eligible tenant incomes and
HOME rents. Suspension of Method of Distribution for Presidential Disaster Declarations In the event of a Major Disaster Declaration by the President of the United States for a city, town, or unit of local government located in the State of Maryland, the Secretary of DHCD shall have the authority to waive the Method of Distribution or any other State regulations for the HOME program to address emergency needs of impacted communities. This will be done in consultation with HUD and the program will operate within the parameter of the law or laws addressing the HOME program.
179
AMERICAN DREAM DOWNPAYMENT INTIATIVE The American Dream Downpayment Initiative (ADDI) will be administered as a part of the HOME Investment Partnerships Program. ADDI aims to increase the homeownership rate, especially among lower income and minority households, and to revitalize and stabilize communities. ADDI will help first-time homebuyers with the biggest hurdle to homeownership: downpayment and closing costs. The program was created to assist low-income first-time homebuyers in purchasing single-family homes by providing funds for downpayment, closing costs, and rehabilitation carried out in conjunction with the assisted home purchase. ADDI will provide downpayment, closing costs, and rehabilitation assistance to income-eligible individuals who are first-time homebuyers. The amount of ADDI assistance provided may not exceed $10,000 or six percent of the purchase price of the home, whichever is greater. The rehabilitation must be completed within one year of the home purchase. Rehabilitation may include, but is not limited to, the reduction of lead paint hazards and the remediation of other home health hazards. To be eligible for ADDI assistance, individuals must be first-time homebuyers interested in purchasing single family housing. A first-time homebuyer is defined as an individual and his or her spouse who have not owned a home during the three-year period prior to the purchase of a home with ADDI assistance. ADDI funds may be used to purchase one- to four- family housing, condominium unit, cooperative unit, or manufactured housing. Additionally, individuals who qualify for ADDI assistance must have incomes not exceeding 80% of area median income. ADDI funds used for rehabilitation may not exceed twenty percent of the State’s total ADDI allocation. The rehabilitation assisted with ADDI funds must be completed within one year of the home purchase. DHCD will administer ADDI in conjunction with existing DHCD housing loan programs and with the HOME Initiatives Fund. It is anticipated that DHCD’s partners in the communities, including for profit and non profit housing development organizations and public housing agencies, may apply for ADDI funds to be used in conjunction with homebuyer assistance programs. Such programs may include, but are not limited to, Section 8 Homeownership Voucher, Self-Help Homeownership, Individual Development Accounts and, general First-Time Homebuyer Programs. Applicants for funds will be asked to provide a plan for conducting targeted outreach to residents and tenants of public housing, trailer parks, and manufactured housing, as well as to other families assisted by public housing agencies and, a description of the actions to be taken to ensure the suitability of families receiving downpayment assistance under the section to undertake and maintain homeownership. The State’s Federal Fiscal Year (FFY) 2005 allocation of ADDI funds consists of $191,464. According to HUD guidance, HUD will track the use of ADDI funds, through IDIS, by crediting ADDI with all first-time homebuyer downpayment assistance completed during the grant period until a participating jurisdiction’s ADDI funds are depleted. Once all the ADDI funds are depleted, HUD will credit regular HOME funds for any subsequent downpayment assistance activities.

180
EMERGENCY SHELTER GRANTS (ESG) PROGRAM
The Emergency Shelter Grants (ESG) Program provides funds to prevent homelessness and to help improve the quality of existing emergency and transitional shelters for the homeless, to help make available additional shelters, to help meet the costs of operating such shelters and of providing certain essential, direct client services to homeless individuals. Such assistance is designed to assure that homeless persons and those at risk of homelessness have access not only to decent, safe and sanitary shelter, but also to the supportive services needed to improve their situations. For SFY 2006 (FFY 2005), Maryland’s allocation for the 19 non-entitlement counties of the State is $599,886 under the ESG program. Based on previous activity, DHCD expects that the funds will be used as follows (these numbers may change based on applications received):
STATE OF MARYLAND ESG ALLOCATION – FFY 2005 Homeless Prevention (30%) $179,965State Administration (4%) $23,996Local Administration (1%) $5,999All Other – Maintenance and Operating, Essential Services, Other Staffing, Etc. (65%)
$389,926
TOTAL $599,886 ESG Match Requirements ESG funds must be matched on a 50/50 basis (one dollar of matching funds must be provided for every dollar of ESG funds). Match may be in the form of cash as well as in-kind contributions. Cash contributions may come from private sector sources, including donations from individuals, groups, corporations or other private entities, and/or local government. In-kind contributions may include: the value of any donated material or building, the value of the lease on a building, any salary paid to staff of the applicant or nonprofit organization in carryout out the shelter or homelessness program, and the time and service contributed by volunteers to carry out the shelter or homelessness program. Due to the competitive nature of the State's ESG Program, the State is not able identify the sources of ESG match at the time that the action plan is submitted. The State acknowledges its responsibility to ensure that ESG match contributions are made to the level required by the federal program regulations. Selection Criteria To make ESG Program funds available to units of general local government, DHCD conducts an annual competitive round of funding in which eligible local governments are invited to submit applications. Applicants receiving the highest cumulative points will be recommended for funding until all ESG Program funds are exhausted. Funds may be allocated so that the awards are distributed among eligible applicants taking into consideration the level of need in the service area and the capacity of the grant recipient, and sub-recipient if applicable, to conduct the program effectively and administer the grant efficiently. Consideration may be given to the desirability of funding a variety of projects and serving as many geographic areas of the State

181
as possible. Each unit of general local government may submit only one application for up to $75,000. The application may request funding for one or more projects. All applications will be reviewed, rated and recommended for funding based on the following factors. Figures in parentheses indicate the maximum number of points that may be awarded to any given factor. Applicants receiving the highest cumulative points will be recommended for funding until all ESG Program funds are exhausted.
1. Statement of Homeless Problems This Project Addresses (10)
(a) Projected number and income level of homeless and at risk individuals to be assisted;
(b) A description of the need or problem, noting local factors and trends which
impact on the level of homelessness, and the extent to which documentation is offered in support of the need or problem; and
(c) The appropriateness of the applicant’s proposed project/activity to address the
need or problem. 2. Proposed Project Design (25)
(a) The feasibility of the project/activity in terms of financing, location and site control and neighborhood/community acceptance;
(b) The extent to which it is documented that the costs have been carefully
estimated and are reasonable;
(c) The extent to which the amount of matching funds is provided and verified;
(d) The likelihood of project/activity completion in a timely manner, and (e) The extent to which an agency participate in the local continuum of care.
3. Past Experience/Organizational Capacity (25)
(a) The extent to which the applicant has the organizational capacity and staff
expertise to undertake and administer the project/activity described in the application;
(b) The extent to which the applicant has been involved in homeless shelters,
programs or services in the past and the track record indicates these activities have been accomplished in an efficient and effective manner;
(c) The extent to which the applicant is committed on a long term basis to serving
the shelter needs of the homeless; and
(d) The extent to which the applicant will involve homeless clients in the planning, developing, constructing, renovating, maintaining and operating of homeless facilities and programs.

182
4. Supportive Services (20)
The extent to which beneficiaries are given assistance under a continuum of care, facilitating their progress to self-sufficiency. This methodology includes providing assistance in obtaining appropriate supportive services including permanent housing, medical and mental health treatment, counseling, supervision, and other services essential for achieving independent living.
5. Additional Considerations (20)
A 50/50 match is federally mandated. Funding priority will be given for applicants meeting the following additional match stipulations:
(a) At least 20 percent of the match (10 percent of total project cost) must be in cash
from private sector resources or local government, and not from State or federal resources.
(b) A cash contribution by the local government applicant is strongly encouraged and
can be counted as part of the 50/50 match.
Under federal guidelines the match requirement is waived for $100,000 of the allocation, and the State is required to pass this waiver on to those grantees least able to afford a match. Therefore, upon program startup DHCD waives all or a portion of the match requirement for those local government grantees in the jurisdictions where residents have the lowest per capita incomes.
Monitoring and Evaluation Monitoring activities include requiring 180 day reports and at least 10 percent of the Service Providers along with the cognizant oversight agency in local government will be monitored on-site annually. The visit may occur during or after the grant period. All grantees will receive at least a two week notice prior to the monitoring visit. The visit will entail reviews of the fiscal and programmatic aspects of the grant as administered by both the grantee and the subgrantee. Grantees and subgrantees will make all ESG records, administrative offices and personnel available upon request during the monitoring visit. Within approximately 60 days after the visit, DHCD will forward a report to the grantee. The report will summarize grant progress and may address concerns and recommendations for further action, as well as findings for corrective action. Local government grantees that contract with non-profit organizations who act as Service Providers shall monitor each such subgrantee to determine project progress and adherence to the sub-recipient sub-agreement. Monitoring reports of the local government’s grantees shall be subject to review by DHCD upon request.

183
Suspension of Method of Distribution for Presidential Disaster Declarations In the event of a Major Disaster Declaration by the President of the United States for a unit of local government located in the State, the Secretary of DHCD shall have the authority to waive the Method of Distribution or any other State requirements governing the ESG program to address emergency needs of affected communities. This will be done in consultation with HUD and the program will operate within the parameter of the law or laws addressing the ESG program.
HOUSING OPPORTUNITIES FOR PERSONS WITH AIDS (HOPWA) PROGRAM Background The Maryland Department of Health and Mental Hygiene is a FY05 grantee of $335,000 per year in HOPWA formula funds for a comprehensive program designed to prevent homelessness and to help low-income people with HIV/AIDS to live independently by providing permanent supportive housing in the rural counties of the state. These funds are intended to cover counties who are not recipients of HOPWA funds from another eligible metropolitan area. These include: Allegany, Caroline, Dorchester, Garrett, Kent, Somerset, Charles (as fiscal agent for St. Mary’s County), Talbot, Washington, Wicomico and Worcester. In order to address the needs of persons living with HIV/AIDS since the introduction of combination therapies, a stable and supportive housing situation is critical. The Rural HOPWA Program is part of Maryland's statewide plan to address the housing needs of low-income people with HIV/AIDS and their families. It complements the Ryan White Title II programs and State funded HIV Programs that are currently operating in the rural areas of the state. The Program combines rental assistance, short- term rent, emergency mortgage and utility payments with support services, such as case management, primary medical care, and treatment adherence to allow persons with HIV/AIDS to live independently in HUD-funded permanent supportive housing programs. This Initiative provides housing assistance and supportive services identified as priority needs of persons living with HIV/AIDS in rural Maryland. Maryland reports almost 1,500 new AIDS cases per year and at the end of 2003 had approximately 28,000 living cases of HIV and AIDS, almost 13,000 of which had AIDS. The majority of cases were between 20 and 44 years of age at diagnosis. Approximately 80% of cases were African-American, which stands in contrast with their percentage of the general population (28%). Males comprise two-thirds of the HIV and AIDS cases. The most common exposure category among the AIDS cases is injection drug use (IDU) at 45%. However, among the HIV cases, the most common category is heterosexual contact (43%). For 2003, urban Baltimore City had an HIV/AIDS prevalence rate eleven times that of the most populous jurisdiction in the State, suburban Montgomery County (2134.5 and 243 per 100,000 population, respectively). The next two most populous jurisdictions, suburban Prince George’s and Baltimore counties had prevalence rates of 535 and 254 cases per 100,000 population, respectively, while rural Dorchester County, ranked 20th in population, had a 2003 HIV/AIDS prevalence rate of 339 per 100,000 population, the third highest in the State. This demonstrates that while the disease is concentrated in urban areas, there are highly disproportionate concentrations of cases in specific urban, suburban, and rural regions of the State. In addition,

184
underserved populations, especially women and minorities, are heavily represented in the rural AIDS cases. Of the reported cases in rural Maryland, twenty-six percent are women. Sixty-five percent of the cases occur among minorities. In addition, the Eastern Shore counties and St. Mary’s County have a large seasonal migrant population. The eleven counties served by the Rural HOPWA Program account for 46% of the State’s territory and over 11% of the population, according to the 2000 Census. The Eastern Region (Caroline, Cecil, Dorchester, Kent, Queen Anne’s, Somerset, Talbot, Wicomico, and Worcester Counties) reported 3% of all living cases. The Western Region (Allegany, Frederick, Garrett, and Washington Counties) reported 2% of all living HIV and AIDS cases and the Southern Region (Calvert, Charles, and Saint Mary’s Counties) contributed 1% of all living HIV and AIDS cases. Current Network of Services As noted above, the eleven rural counties included in the Rural HOPWA Program are: Allegany, Caroline, Dorchester, Garrett, Kent, Somerset, Charles (as fiscal agent for St. Mary’s County), Talbot, Washington, Wicomico and Worcester. The Department of Housing and Community Development (DHCD) provides tenant-based rental assistance to eligible HOPWA clients. DHCD has considerable experience in providing housing opportunities to low income people and also to those with special needs such as people who are physically disabled, developmentally disabled, deaf and hard of hearing, mentally ill, and those with drug and alcohol addictions. With Ryan White Title II and state general funding, the local health departments in these counties have been providing case management, medical care, supportive services, and emergency assistance, including short-term rental assistance, to persons with HIV/AIDS for more than 12 years. The AIDS Administration monitors the performance of all grant awards to local and state government agencies. Work Plan To meet the shortage of affordable housing with available funds, the Rural HOPWA Program offers tenant-based rental assistance (TBRA) to prevent homelessness. Consumers needing housing assistance are matched with the program that best fits their individual needs. To provide housing assistance to consumers effectively throughout rural Maryland, housing assistance is provided to consumers through project sponsors statewide, regionally and locally. Tenant-based rent assistance is currently made available through DHCD. This allows eligible consumers and their families throughout the Eastern Shore and Western regions of Maryland to have equal access to these funds, regardless of their county of residence. The AIDS Administration proposes to maintain the current caseload of households being covered under the competitive grant-funded TBRA activity, by continuing its Memorandum of Understanding with DHCD with the formula HOPWA funds. The following FY05 allocations are proposed with the new formula funding:

185
AIDS Administration Administrative Cost: $10,350 DHCD for Tenant-based Rental Assistance in both the Eastern and Western regions:
$324,650 Goals and Objectives
Note: Objectives apply to HIV-positive consumers; however, HOPWA funds improve the standard of living for the families and dependents of HOPWA consumers as well so it is a much broader impact.
Goal: To assist low-income people living with HIV/AIDS to achieve housing stability by providing supportive housing in underserved rural areas of Maryland. Objective 1: To provide tenant-based rental assistance using a projected number of 42 units Key Action Steps/Activities
Timeline Benchmark Evaluation/Monitoring Method
Case managers identify and refer low-income persons living with HIV/AIDS who need tenant-based housing assistance
Year-round
# of households/rental units
Quarterly reports including review of budget expenditures and attendance at regional case managers meetings. This activity is dependent upon there being available slots due to attrition.
Objective 2: To monitor sub-grantee compliance with HOPWA regulations and the quality of services through a minimum of quarterly oversight measures Key Action Steps/Activities
Timeline Benchmark Evaluation/Monitoring Method
Conduct technical assistance and monitoring site visits
Spring and Fall
# of TA/site visits conducted
Site visit reports, technical assistance visit reports
Include in HOPWA conditions of award, requirement for HOPWA sub-grantees to attend quarterly regional HIV CARE consortia and case management meetings
Included in annual MOU and/or contract
Disseminated conditions of award with attendance clause
Signed MOU and/or contract that agrees to conditions of award
Include in HOPWA conditions of award, requirement for quarterly submission of budget expenditures, performance measures and program narrative to monitor sub-grantee activities
Included in annual MOU and/or contract
Disseminated conditions of award with reporting clause
Signed MOU and/or contract that agrees to conditions of award

186
Objective 3: Evaluate the outcomes of HOPWA assistance on the housing stability and health status of participating consumers Key Action Steps/Activities Timeline Benchmark Evaluation/Monitoring
Method Collect necessary client-level data to conduct an outcomes evaluation following the three stated goals of the HOPWA program
Quarterly # of HOPWA records abstracted; # of on-going evaluation activities
Quarterly reports, evaluation reports, summary of special analysis
Objective 4: Assessment of community housing needs, available housing and related resources to establish priorities for new or expanded housing efforts Key Action Steps/Activities Timeline Benchmark Evaluation/Monitoring
Method Conduct regional meetings to solicit input from subsidized housing providers, HIV care providers, Department of Social Services staff and other relevant partners to obtain feedback and develop approaches for FY05
On-going # of open forum/planning meetings held with housing partners in the Eastern and Western regions
Reports, summary of special analysis, content of FY06 Consolidated Plan
Method of Distribution The State’s emphasis for using the HOPWA funds it receives will focus on maintenance of existing efforts rather than expansion of the program. This is because the State received less funding this year than last, while rents increased. In the event funds become available to assist new clients, funding will be allocated on a first-come, first-served basis. Monitoring and Evaluation Monitoring activities include requiring quarterly reports that include budget expenditures, programmatic narrative and performance measures. These reports include performance measures, narrative of program successes, challenges and barriers and a budget expenditure report. Also monitored is the coordination of services between HOPWA and Ryan White-funded programs, such as attendance of HIV case management and regional CARE Consortia meetings. The AIDS Administration also conducts sub-grantee site visits on a routine basis to monitor adherence to programmatic and fiscal standards and guidelines, client confidentiality and the quality and accessibility of services. Areas identified for improvement during the monitoring process may require that agencies develop corrective action plans. The HOPWA Coordinator at the AIDS Administration carefully monitors progress implementing the corrective action plans. In order to facilitate improvement, the AIDS Administration will provide technical assistance to its sub-grantees, as needed. The purpose of the program’s evaluation plan is twofold. Firstly to examine process indicators and quality improvement measures to assess program performance. Secondly is to evaluate the

187
outcomes and impact of HOPWA assistance on the housing stability and health status of participating consumers. The data for both evaluation purposes will come from quarterly reports by project sponsors and by targeted qualitative and quantitative data collection. The outcomes to be measured include:
1. Increased supply of HIV/AIDS housing meets unmet housing needs (Workplan Objectives 1 & 3)
2. Increased client access to housing related community services and resources (Workplan Objective 1)
3. Funded project sponsors demonstrate ability to comply with HOPWA, HUD and other housing-related laws and regulations (Workplan Objectives 2 & 3)
4. Funded project sponsors have increased access to AIDS-related resources and information (Workplan Objective 2)
5. Grantee and funded project sponsors are in compliance with HOPWA and other applicable HUD and housing-related regulations (Workplan Objective 2)
6. HOPWA resources leverage additional AIDS-specific funding needed to address community housing-related needs. (Workplan Objective 4)
7. HOPWA funds are made available to eligible community-based and local sponsors in an efficient and effective manner. (Workplan Objective 4)
8. HOPWA grantee and local partners work together to assess housing needs, recognize barriers and identify solutions and achievable strategies (Workplan Objective 4)
Consumer/Community Input Consumers and providers have input into how HOPWA funds are expended through several means on a regional and local basis. Ryan White Title II sponsors regional CARE consortia in each region of the state. The consortia consist of consumers and providers and meet quarterly to discuss changing regional HIV care and services priorities and as a venue for an annual open community forum. Membership to the consortia is open to the public and funds are available for transportation and childcare to reduce consumers’ barriers to participation. Project sponsors receiving HOPWA funds are required to attend these consortia meetings each quarter. HOPWA recipients are also invited to attend as service consumers. The majority of HOPWA consumers also receive Ryan White funds. All Ryan White funded-agencies, including local health departments, conduct annual client satisfaction surveys to obtain consumers’ feedback on the services they have received at that site. The rural HOPWA program is exploring additional means of obtaining consumer input, beyond those consumers who are active members of various advisory and planning bodies. Housing-specific forums are planned to engage a greater number of housing partners and advocates to both identify untapped local resources and consolidate planning on a local level to reduce homelessness and housing instability.
PUBLIC COMMENTS
February Hearings During the public hearings in February, 2005, DHCD received a number of public comments. Most of these fell under three main areas: homeownership, rental housing and homelessness. Homeownership Comments

188
Under the Disabled borrowers program, DHCD was asked to raise the current mortgage limit of $100,000 on a loan, as this was too low a price to purchase a home. After further discussion, it was determined that there were possibly a number of issues regarding program operation. For example, the problem may not be the loan limit but the need to close the gap between what a borrower can afford for a loan and actual acquisition costs. There may be some need to raise the loan limit, but the real problem would be obtaining soft seconds or other forms of assistance to making actually acquiring a home possible. In that light, DHCD put in its one year goals that it will work with the Department of Disabilities as well as other interested parties to determine how the disabled borrowers program needs to be modified to continue being a good product for eligible households. Another homeownership issue discussed was DHCD decision to start issuing 35 year mortgages. Several people testified that DHCD needed to develop a 40 year product given the disparity between incomes and house prices. As part of our one year goals, DHCD intends to start offering 40 year mortgages on homes as well. Several people testified about the need for housing counseling. It was felt many more people could use and access our program if we paid for counseling. In addition, some people felt DHCD should explore not just funding agencies that can provide housing counseling, but also certifying individuals to do it as well. In rural areas such as the Eastern Shore, there are not many agencies that can do this. If Individuals (such as the local housing contact) was trained and/or certified to do counseling, it would help get many more people into our programs. In examining the issue, DHCD will not be changing it current policies. DHCD currently provides some funding for housing counseling, such as using HOME funds for counseling when HOME funds are used to help a low-income person buy a house. Other funds are available to counseling agencies through HUD, or through housing counseling DHCD receives on a pass through basis. Organizations who lack funds for counseling should pursue funds from HUD or other agencies to meet these needs. In regard to allowing individuals, but not agencies to provide counseling, this idea does not appear to pass legal requirements on how DHCD allocates pass through funds. Consequently, we will not be allocating funds directly to individuals to provide counseling. There was also some comment that CDA's (the Maryland Housing Funds) mortgage servicer is not following the proper procedures for foreclosure and loss forbearance when families get behind on their mortgage payments. We examined this, but did not find a problem. DHCD did consolidate operations by moving from using 14 separate servicers to a single entity. We have received complaints along the lines of “I don’t like their service book” or “I don’t like having to make a payment to “y” instead of “z”, but we found no evidence that the new servicer was not following proper foreclosure or forbearance requirements required by both DHCD and HUD. Rental Housing Comments There were a number of comments that DHCD should put more emphasis on developing mixed use rental housing. It was felt that providing more mixed use housing would help make this option more attractive to developers, as well as prevent potential stigmatization of housing developments (and their residents) who might be identified as living in “the projects”.

189
In response, we would say that DHCD used to provide incentive points to developers for mixed use housing, but no one took advantage of them. We understand that communities like mixed income but Tax Credit syndicators do not like them. Further, many times these projects don’t make sense financially as in a lot of our markets where there is not much difference between market rents and tax credit rents. That said, most of our projects do have a variety of incomes among the affordable range -- units at 30%, 40% 50% and 60% of income. We also have some developers that hold 5-10% of their units at market rents, particularly on rehabs to avoid displacement of over income tenants. In addition, we have become more flexible in our Tax Exempt bond program by allowing and encouraging projects that just meet the federal tax credit requirements of 20% at 50% AMI or 40% at 60% AMI without the additional CDA restriction for 51% of the units at 85% of AMI. Unfortunately, developers still have not been interested in undertaking this easier standard for developing mixed-income properties. Other comments we received focused on the physical look of rental developments DHCD finances. It was commented that rental housing projects are often inappropriate in rural areas as they "stick out" in rural communities, and, similar to the above, stigmatize residents who come from "the projects". With many run down and vacant single family housing units in rural communities, it was felt CDA should fund more scattered site rental housing developments that repair/rehabilitate these vacant SF homes. This would not only encourage community revitalization, but mixed communities. It would also prevent people being stigmatized since poor people would live in the same type of housing as everyone else. (Some people also said this would be cheaper than new construction.) In response, DHCD actually gives points for projects that are architecturally appropriate for the community and have for some time. Scattered site projects have always been eligible under our programs. They tend to be more costly and difficult to manage. We also give preferences for both small projects (30 units or less) and for rural projects. Consequently, small projects in rural areas generally compete very well. We are adding language to the Qualified Allocation Plan to require a developer of a scattered site project to have scattered site development experience to address one of the problems we have with scattered site. We also do give points for projects that contribute to a community revitalization plan. In our view, our developments are assets to the communities in which they are placed -- we've done quite a bit of development in rural areas in recent years and we're proud of these developments and doubt the residents are stigmatized by the size of the development. Finally for this topic, we would note that rehabilitation projects do get extra points Lastly in the area of rental housing, it was commented that DHCD should explore offering State tax incentives to developers of affordable housing. We have the federal low-income housing tax credit, but many states have State tax credit programs as well. In response, we looked at this several years ago. State credits generally are not that marketable and the legislature is anti-tax credits. Many states don't get the generous State appropriations we get for gap financing, so we will not be pursuing this option. Homelessness Comments There were some comments that DHCD routinely provides ESG funding or other funding (such as transitional housing funding) to homeless providers who are not part of the local continuum of care. This makes it more difficult for local continuums to develop plans, coordinate resources

190
and address the needs of the homeless. It was stated that DHCD should mandate that any organization who receives homeless funding through the ESG program or the transitional housing grant program should be required to be part of the local continuum of care. In response DHCD will not mandate the local providers join local continuums of care. However, we have changed the rating and ranking criteria for the ESG program to give more points to organizations who participate in local continuums of care, which should encourage participation for organizations who seek funding under the ESG program. One person commented that DHCD should allow HOME funds to be used to fund the operations of transitional housing. Some persons suggested DHCD should use CDBG funds to finance capacity building and staff positions for local governments to hire homeless/housing positions. These local staff could then carry out better and more effective housing and homeless programs. In response, DHCD does not agree with these proposals. There are several reasons for this. First, there are federal limits on the amount of funds DHCD can use for administrative costs and public service costs for programs like CDBG. DHCD is already at those limits, so funding more administrative costs at the local level for homelessness would result in cutting administrative costs elsewhere, a zero sum game for locals that would leave them no better off than when they started. Second, if DHCD were to fund more operations costs out of programs like HOME (or CDBG) it would result in fewer units of affordable housing being built. We will not be helping the homeless if we spend more for local staff and reduce the amount of affordable housing we build to pay for staff costs. Other Comments There were a number of other comments on a broad range of issues, including persons voicing support variously for STAR, NBDP (now Neighborhood BusinessWorks) and micro enterprise, DHCD is continuing all of these programs. April Hearings/public comment period No written comments were received on the Five-Year Plan during the public comment period. Only four persons showed at the second set of hearings, and they offered no substantive comments. There was some discussion at the Cumberland hearing about Section 8 payment standards by HUD, which were referred to DHCD’s Rental Housing office.
APPLICATION FORMS The forms on pages 192, 193, 194 and 195 are legal forms (HUD Form 424) which serve as the State’s applications for funding to HUD for the CDBG, HOME, and ESG programs.
CERTIFICATIONS The legal certifications stating on page 196 are certifications of programmatic activities the State promises to undertake in accordance with legal requirements for administering the HOME, CDBG, ESG and HOPWA programs.

Consolidated Plan Community and Economic Development Needs Assessment Survey
1
Do you consider yourself or your organization/agency to be:
A non-profit developer
A for-profit developer
A trade or professional organization
A Community Action Agency
A Public Housing Authority
A unit of local government
A unit of State government
An elected official
An advocacy group
Other, Please Specify
Survey Page 1
Consolidated Plan Community and Economic Development Needs Assessment Survey
2
Please identify the county or counties served by your organization. (For municipal officals, please check the county in which your municipality is located)

Statewide
Allegany
Anne Arundel
Baltimore City
Baltimore County
Calvert
Caroline
Carroll
Cecil
Charles
Dorchester
Frederick
Garrett
Harford
Howard
Kent
Montgomery
Prince George's
Queen Anne's
Saint Mary's
Somerset
Talbot

Washington
Wicomico
Survey Page 2
Consolidated Plan Community and Economic Development Needs Assessment Survey
3
Please rank the following Public Facility Needs in your community:
1 very low need
2 low need
3 moderate need
4 high need
5 very high need
Senior Centers
Youth Centers
Neighborhood Community Facilities
Child Care Centers
Parks and Recreation
Cultural Centers/Museums
Health Faciltiies

Parking Facillities
Police Stations/Substations
Fire Stations/Substations
Libraries
Survey Page 3
Consolidated Plan Community and Economic Development Needs Assessment Survey
4
Please rank the following Infrastructure Needs in your community:
1 very low need
2 low need
3 moderate need
4 high need
5 very high need
Sewer Collection and Treatment Facilities
Water Production, Treatment, Storage and Distribution Systems
Flood Drain Improvements
Street/Road Improvements

very low need low need moderate need high need very high need
Sewer Collection and Treatment Facilities
Water Production, Treatment, Storage and Distribution Systems
Flood Drain Improvements
Street/Road Improvements
Sidewalk Improvements
Asbestos Removal
Handicap Accessibility Improvements
Vehicle Purchases
Equipment Acquisition
Bridge Construction
Electric Utility Systems
Goverment Offices and Meeting Facilities

Land Acquisition
Street Lighting Improvements
Public Parking Structures
School Construction
Bulkhead, Piers, Wharves and Ramps
Survey Page 4
Consolidated Plan Community and Economic Development Needs Assessment Survey
5
Please rank the following Public Service Needs in your community:
1 very low need
2 low need
3 moderate need
4 high need
5 very high need
Senior Services
Handicapped Services
Youth Services

very low need low need moderate need high need very high need
Senior Services
Handicapped Services
Youth Services
Services for Persons with HIV/AIDS
Services for the Mentally Ill
Services for Substance Abusers
Services for the Developmentally Disabled
Transportation Services
Employment Training
Crime Prevention
Housing Counseling
Day Care Services

After School Programs
Health Services
Survey Page 5
Consolidated Plan Community and Economic Development Needs Assessment Survey
6
Please rank the following Economic Development Needs in your community:
1
Very Low Need 2
Low Need 3
Moderate Need 4
High Need 5
Very High Need
Job Development/Creation
Commerical/Industrial Infrastructure
Commercial/Industrial Finance Assistance
Micro-Business Support
Small Business Loans
Facade Improvements

Streetscape Improvements
Brownfields Redevelopment
Technical Assistance to Small Business
Banking/Lending for Commercial Redevelopment
Survey Page 6
Consolidated Plan Community and Economic Development Needs Assessment Survey
7
Please provide any comments you might have:
Survey Page 7

Consolidated Plan Housing and Homeless Needs Assessment Survey
1
Do you consider yourself or your organization/agency to be:
A non-profit developer
A for-profit developer
A trade or professional organization
A Community Action Agency
A Public Housing Authority
A unit of local government
A unit of State government
An elected official
An advocacy group
Other, Please Specify
Survey Page 1
Consolidated Plan Housing and Homeless Needs Assessment Survey
2
Please identify the county or counties served by your organization. (For municipal officals, please check the county in which your municipality is located)
Statewide
Allegany
Anne Arundel
Baltimore City
Baltimore County
Calvert
Caroline
Carroll
Cecil
Charles
Dorchester
Frederick
Garrett
Harford
Howard
Kent
Montgomery
Prince George's
Queen Anne's
Saint Mary's
Somerset
Talbot
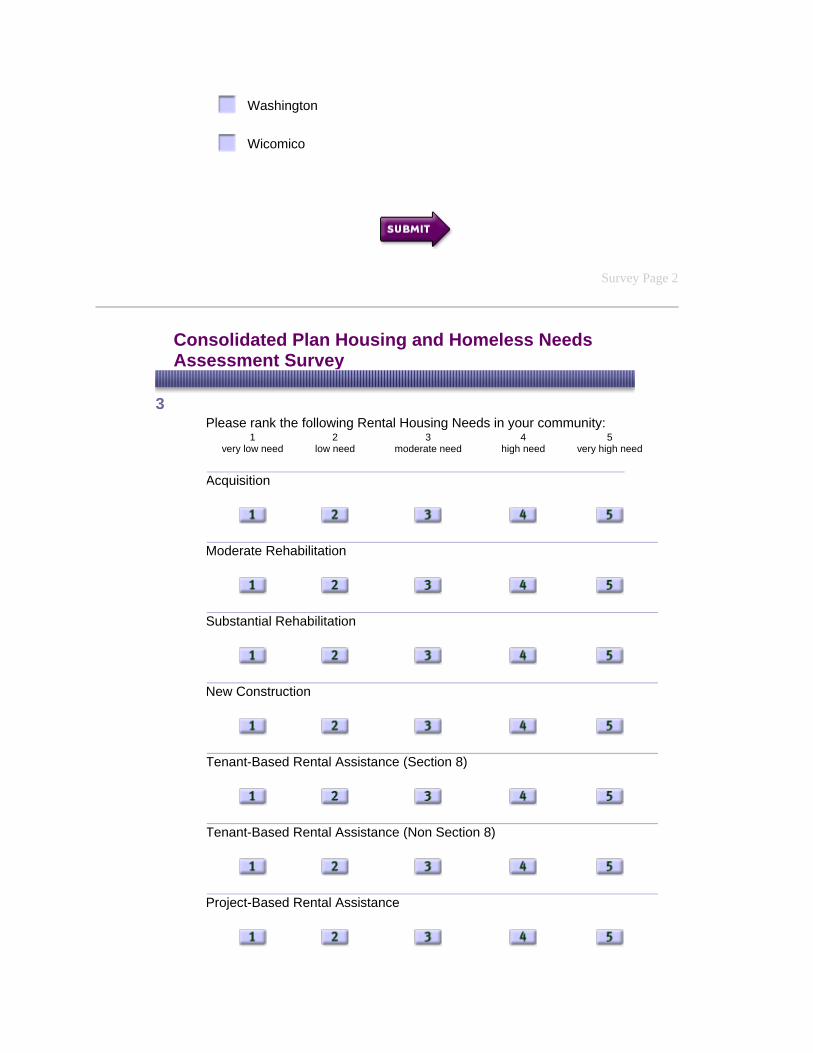
Washington
Wicomico
Survey Page 2
Consolidated Plan Housing and Homeless Needs Assessment Survey
3
Please rank the following Rental Housing Needs in your community:
1 very low need
2 low need
3 moderate need
4 high need
5 very high need
Acquisition
Moderate Rehabilitation
Substantial Rehabilitation
New Construction
Tenant-Based Rental Assistance (Section 8)
Tenant-Based Rental Assistance (Non Section 8)
Project-Based Rental Assistance

Preservation of Existing Stock
Energy Efficiency Improvements
Housing for Migrant Workers
Rental Housing for the Elderly
Rental Housing for Small Families (2 to 4 persons)
Rental Housing for Large Families (5 or more persons)
Handicapped Accessible Apartments
Rehabilitation of Public Housing Units
New Construction of Public Housing Units
Replacement of Public Housing Units
Survey Page 3

Consolidated Plan Housing and Homeless Needs Assessment Survey
4
Please rank the following Homeownership Needs in your community:
1 very low need
2 low need
3 moderate need
4 high need
5 very high need
Down Payment/Closing Cost Assistance
Affordable Mortgage Products
Moderate Rehabilitation
Substantial Rehabilitation
New Construction
Energy Efficiency Improvements
Housing Counseling
Handicapped modifications
Reverse Equity Mortgages

Survey Page 4
Consolidated Plan Housing and Homeless Needs Assessment Survey
5
Please rank the following Special Housing Needs in your community:
1 very low need
2 low need
3 moderate need
4 high need
5 very high need
Housing for the Frail Elderly
Housing for Persons with HIV/AIDS
Housing for Persons with Alcohol/Drug Addictions
Housing for Persons with Developmental Disabilities
Housing for Persons with Mental Illness
Housing for Children/Youths Graduating from Foster Care
Housing for Ex-offenders
Housing for Persons on SSI Disability

Survey Page 5
Consolidated Plan Housing and Homeless Needs Assessment Survey
6
Please rank the following homeless needs in your community:
1
Very Low Need 2
Low Need 3
Moderate Need 4
High Need 5
Very High Need
Emergency Shelters for Families
Emergency Shelters for Men
Emergency Shelters for Women
Transitional Housing for Families
Transitional Housing for Men
Transitional Housing for Women
Supportive Services for Families
Supportive Services for Men

Supportive Services for Women
Operations and Maintainence of Existing Facilities
Job Training for the Homeless
Case Management
Substance Abuse Treatment
Mental Health Care
Physical Health Care
Housing Placement
Life Skills Training
Survey Page 6
Consolidated Plan Housing and Homeless Needs Assessment Survey

7
Please provide any additional comments you might have:
Survey Page 7

Appendix II Page 1
Project Name County Units Occupancy Handicapped Accessible Units
Efficiency 1 Br 2 Br 3 Br 4+ Br
Allegany County Scattered Sites Allegany 18 Family 0 0 0 14 4 Allegany Towers Allegany 26 Family 2 18 8 0 0 Baltimore Avenue Apartments Allegany 41 Family yes 30 8 3 0 0 Bedford Street Rental Rehab Allegany 4 Family Booth Towers Allegany 114 Elderly yes Cumberland Arms Allegany 69 Elderly yes Cumberland Manor Allegany 102 Elderly yes 0 102 0 0 0 Frostburg Apts. Allegany 38 Family yes 0 8 30 0 0 Frostburg Heights Apts (FM) Allegany 110 Elderly yes 0 110 0 0 0 Hammond Heights Allegany 35 Elderly yes 0 35 0 0 0 Lana Lu Apts. Allegany 30 Elderly yes 0 30 0 0 0 Mutual Self Help Allegany 7 Family Old Town Manor Apts. Allegany 138 Family Orchard Mews Apts. Allegany 32 Family yes 0 16 16 0 0 The Cascades Allegany 71 Elderly Valley View Apts. Allegany 30 Elderly yes 0 30 0 0 0 Washington Ridge Allegany 28 Family yes 0 0 22 6 0 Washington-Allegany Residences II Allegany 1 Westernport Elderly Allegany 35 Elderly yes 0 35 0 0 0 Admiral Oaks Anne Arundel 159 Family yes 0 0 105 42 12 American Southdale Anne Arundel 506 Family yes Anchor House (Annapolis Area Ministries) Anne Arundel 1 Family no Annapolis Area Targeted Revitalization Anne Arundel 12 Family Annapolis Roads Apts Anne Arundel 282 Family yes Autumn Woods at Piney Orchard Anne Arundel 64 Family yes Bay Ridge Gardens Anne Arundel 198 Family yes 0 0 101 97 0 Bywater I/II Anne Arundel 308 Family yes 0 0 107 115 86 Claiborne Place (FM) Anne Arundel 175 Elderly yes 0 127 29 0 0 College Parkway Place Anne Arundel 170 Family no

Appendix II Page 2
Project Name County Units Occupancy Handicapped Accessible Units
Efficiency 1 Br 2 Br 3 Br 4+ Br
Forest Gardens Anne Arundel 12 Family 6 6 Glenview Garden Apts Anne Arundel 57 Family yes 15 30 12 Greentree I Anne Arundel 350 Family yes Greentree II Anne Arundel 239 Family yes Greentree III Anne Arundel 207 Family yes Groves at Piney Orchard Anne Arundel 258 Family yes 0 48 174 36 0 Harper's Mill Apts. Anne Arundel 29 Family yes 0 0 29 0 0 Homes at the Glen Anne Arundel 56 Family Hope House SRO Anne Arundel 40 Individuals yes 0 40 0 0 0 Lake Village (carriage) Anne Arundel 99 Family yes Lake Village (Disney) Anne Arundel 540 Family yes Lamplighter Ridge Apts Anne Arundel 168 Family yes Langton Green Anne Arundel 24 Elderly yes Laurel Commons Anne Arundel 38 Family yes Mill Pond Apts Anne Arundel 239 Family yes Odenton Senior Housing Anne Arundel 88 Elderly yes Orchards At Severn pioneer city III Anne Arundel 500 Family yes 250 250 Park View at Furnance Branch Anne Arundel 100 Elderly Pumphrey House Anne Arundel 14 Elderly Regatta Bay Apts Anne Arundel 245 Family yes St. Mary's Housing Anne Arundel 24 Elderly yes 0 24 0 0 0 Summerset Woods Townshomes warfield townhouses
Anne Arundel 200 Family yes 200
The New Bloomsbury Sqaure Anne Arundel 43 Family The Regency Club I Anne Arundel 196 Family yes The Regency Club II Anne Arundel 168 Family yes Timothy House & Gardens Anne Arundel 81 Elderly yes 0 81 0 0 0 Village of Marley Station Anne Arundel 757 Family yes Washington Square Apt Anne Arundel 181 Family yes Westwinds Apts Anne Arundel 168 Family yes

Appendix II Page 3
Project Name County Units Occupancy Handicapped Accessible Units
Efficiency 1 Br 2 Br 3 Br 4+ Br
Wiley H Bates Senior Housing Anne Arundel 71 Elderly Willows Apts Anne Arundel 352 Family yes Woodside Gardens Apts. Anne Arundel 144 Family no 908 Valley Baltimore City 12 Family 0 0 0 0 0 Abundant Life Towers II Baltimore City 60 Elderly yes 0 60 0 0 0 Alameda IV Baltimore City 52 Family 0 4 22 22 0 Alcott Place Baltimore City 44 Elderly yes 0 44 0 0 0 AHEPA Senior Housing Baltimore City 57 Elderly Amity Ramble Baltimore City 46 Family Apolistic Towers Baltimore City 150 Elderly yes Arbuta Arms II Baltimore City 189 Family Argonne Apartments Baltimore City 67 Family 21 40 5 0 0 Ashburton Apartments Baltimore City 78 Family 0 0 78 0 0 Baltimore Schoolhouse Apts. Baltimore City 132 Family Barclay Greenmount Baltimore City 140 Family 0 61 29 39 10 Barclay Townhouses Baltimore City 91 Family Barrister Court Apartments Baltimore City 32 Elderly yes 0 21 6 0 0 Basilica Place Baltimore City 201 Elderly yes Beaufort Crest Baltimore City 40 Family Beechfield Apts. Baltimore City 128 Family Bellevieu-Manchester Apartments Baltimore City 48 Elderly yes 0 48 0 0 0 Belvedere Green Baltimore City 94 Elderly yes 0 94 0 0 0 Bentalou Court Baltimore City 42 Family Berea Apolistic Towers Baltimore City 101 Elderly yes Bolton House Baltimore City 260 Elderly yes 0 207 12 0 0 Bolton House Baltimore City 260 Elderly yes Bolton North Baltimore City 208 Elderly yes Bon Secours Apartments West Baltimore Baltimore City 30 Family 0 2 6 22 0 Bon Secours Apartments II Baltimore City 30 Family

Appendix II Page 4
Project Name County Units Occupancy Handicapped Accessible Units
Efficiency 1 Br 2 Br 3 Br 4+ Br
Bon Secours III Baltimore City 30 Family Bon Secours Benet House Baltimore City 101 Elderly yes 25 76 0 0 0 Bon Secours Chesapeake Apartments Baltimore City 30 Family Bon Securs Smallwood Summit Baltimore City 89 Elderly Bond Street Apts. Baltimore City 81 Family Boone Manor Baltimore City 36 Family Broadway Court Baltimore City 47 Elderly yes 6 41 0 0 0 Broadway Homes Baltimore City 130 Family Broadway North Baltimore City 17 Family Bruce Street II Baltimore City 13 Family 0 7 2 4 0 Canterbury House Apts. Baltimore City 52 Family Canton Elderly Housing Project Baltimore City 17 Elderly yes 0 17 0 0 0 Centerpoint I & II Baltimore City 176 Family CHAI Multi-Purpose Center Baltimore City 17 Family/Office 0 16 0 0 0 Chapel NDP Baltimore City 175 Family Charles R. Uncles Senior Plaza Baltimore City 49 Elderly Cherry Hill Senior Housing Baltimore City 80 Elderly Cherrydale Apts. Baltimore City 186 Family Chesapeake Commons Baltimore City 95 Family 0 50 38 2 0 Christ Church Harbor Baltimore City 291 Elderly yes City Homes I (West) Baltimore City 101 Family 0 0 35 34 0 City Homes III Baltimore City 69 Family 0 0 35 34 0 Claire Court Baltimore City 30 Family Clay Courts Baltimore City 145 Family Cole-Grant-Higgs Senior Center Baltimore City 60 Elderly Coleman Manor Apts. Baltimore City 50 Elderly yes 0 50 0 0 0 Community Housing Assoc. II Baltimore City 22 Family 0 5 1 16 0 Community Housing Project I Baltimore City 24 Family 0 0 0 0 0 Concord Apts. Baltimore City 231 Elderly yes

Appendix II Page 5
Project Name County Units Occupancy Handicapped Accessible Units
Efficiency 1 Br 2 Br 3 Br 4+ Br
Crossroads Apartments Baltimore City 20 Elderly yes 0 20 0 0 0 Dayspring House Baltimore City 18 Family DePaul House Baltimore City 109 Elderly yes Dickey Hill Forest Baltimore City 204 Family 0 34 132 38 0 Division Street Baltimore City 21 Family 0 0 20 0 0 Druid Hill YMCA Family Residence Baltimore City 13 Family Edmondson Common Baltimore City 74 Family Ednor Apartments at Stadium Place Baltimore City 110 Elderly Epiphany House Baltimore City 33 Elderly yes 0 29 0 0 0 Eutaw Place Apartments Baltimore City 58 Family 0 48 9 1 0 Fairfax Gardens Baltimore City 191 Family Flag House Courts Rental Phase I Baltimore City 124 Family Flag House Courts Rental Phase II Baltimore City 58 Family Forrest Street Apts. Baltimore City 96 Family Foxwell Memorial Apts. Baltimore City 154 Family Franklin Square Baltimore City 72 Family Franklin Square/School 100 Baltimore City 65 Elderly yes 0 65 0 0 0 Gallagher Mansion Rehab. Baltimore City 41 Elderly yes Greater New Hope Baltimore City 80 Elderly yes Greenhill Housing Apts. Baltimore City 301 Family Greenwillow Manor Apts. Baltimore City 147 Family Hanover Park Apartments Baltimore City 118 Family 0 0 0 0 0 Hanover Park Apartments Baltimore City 118 Family Hanover Square Baltimore City 199 Elderly yes 0 199 0 0 0 Har Sinai House Baltimore City 186 Elderly yes 0 186 0 0 0 Har Sinai West (Elderly) Baltimore City 109 Elderly yes Harbor City Townhomes Baltimore City 195 Family 0 0 195 0 0 Harford Commons SRO Baltimore City 30 Individuals 0 30 0 0 0 Harlem Gardens Senior Apartments Baltimore City 96 Elderly

Appendix II Page 6
Project Name County Units Occupancy Handicapped Accessible Units
Efficiency 1 Br 2 Br 3 Br 4+ Br
Harlem Park Commons Baltimore City 12 Family 0 0 2 8 0 Harvey Johnson Towers Baltimore City 120 Elderly yes 0 120 0 0 0 Heritiage Crossing (Murphy Homes) Baltimore City 75 Family Heritiage Crossing (Murphy Homes) II Baltimore City 72 Family Highlandtown Cooperative Apartments Baltimore City 74 Elderly yes 0 74 0 0 0 Hillside Park Apartments Baltimore City 94 Family 0 0 0 0 0 Hillside Park Apartments Baltimore City 94 Family Holden Hall SRO Baltimore City 14 Individuals 0 14 0 0 0 Hollins Street Phoenix Baltimore City 60 Family Indecco Apartments Baltimore City 45 Elderly yes 0 33 0 0 0 Irvington Place Senior Center Baltimore City 41 Elderly yes 0 41 0 0 0 Irvington Woods (Frederick Heights) Baltimore City 71 Family Jenkins Apts. Baltimore City 90 Elderly yes 0 90 0 0 0 Johnston Square Apartments Baltimore City 44 Family 0 0 0 0 0 Johnston Square Apartments Baltimore City 217 Family Kensett House Baltimore City 24 Family Lanvale Towers-Canal Court Baltimore City 320 Family Lemko Elderly Housing Baltimore City 110 Elderly yes Lester Morton Court Baltimore City 70 Family Lexington Terrace Senior Apartments Baltimore City 88 Elderly Lexington Terrace Senior Housing Baltimore City 88 Elderly yes 0 0 0 0 0 Lexington Terrace Townhomes Baltimore City 203 Family Lorelly Apts. Baltimore City 79 Family Madison Park North Apts. Baltimore City 202 Family Manhattan Park Apts. Baltimore City 64 Elderly yes Margaret J. Bennett House Baltimore City 30 Single Adults Margaret J. Bennett House SRO Baltimore City 30 Single Adults 30 0 0 0 0 Marlborough Apartments Baltimore City 227 Elderly yes 71 158 0 0 0 Maxwell I Baltimore City 18 Family 0 0 0 12 0

Appendix II Page 7
Project Name County Units Occupancy Handicapped Accessible Units
Efficiency 1 Br 2 Br 3 Br 4+ Br
Maxwell II Baltimore City 21 Family 0 0 0 21 0 Maxwell III Baltimore City 20 Family 0 0 5 10 5 Medeso Manor Baltimore City 56 Family Memorial Apts. Baltimore City 286 Elderly yes Mid Town Churches Baltimore City 12 Family 0 0 0 0 0 Middlebranch Manor Baltimore City 549 Family 0 84 418 22 0 Midtown Apartments Baltimore City 36 Family 0 5 18 9 4 Monterey Apts. Baltimore City 15 Family 0 0 15 0 0 Montpelier Apartments Baltimore City 26 Family 0 9 15 15 0 Montpelier Apartments Baltimore City 26 Family Monumental Gardens Baltimore City 154 Family Morrell Park Baltimore City 98 Elderly yes Mosher Court Apts. Baltimore City 64 Family Mt. Clair Overlook Baltimore City 110 Elderly yes Mt. Pleasant/Arbor Oaks Baltimore City 212 Family 0 105 106 0 0 Mulberry Court Apartments Baltimore City 62 Family 13 24 24 0 0 N.M. Carroll Manor Apts. Baltimore City 100 Elderly yes New Lafayette Courts Baltimore City 98 Family 0 0 25 63 10 New Lafayette Courts Baltimore City 98 Family New Lafayette Courts Senior Apartments Baltimore City 110 Elderly Norman Lohn House Apartments Baltimore City 12 Family 0 3 9 0 0 North Avenue Terraces Baltimore City 67 Family 0 56 11 0 0 North Gilmore Street Baltimore City 18 Family 0 0 0 0 0 NRS Townhouses I Baltimore City 17 Family 0 0 12 3 2 NRS Townhouses II Baltimore City 22 Family 0 0 22 0 0 Oakland SRO/Micah House Baltimore City 33 Single Adults no 33 1 0 0 0 Oaks at Liberty, The Baltimore City 75 Elderly Ocala Apartments Baltimore City 33 Family 0 0 0 0 0 Oliver Plaza Baltimore City 45 Elderly yes 0 45 0 0 0

Appendix II Page 8
Project Name County Units Occupancy Handicapped Accessible Units
Efficiency 1 Br 2 Br 3 Br 4+ Br
Orchard Gardens Baltimore City 197 Family Orchard Mews Baltimore City 101 Family Paca House Baltimore City 106 Elderly yes 0 106 0 0 0 Pall Mall Apts. Baltimore City 46 Family 0 0 46 0 0 Panelized Housing Demonstration Project Baltimore City 14 Family 0 1 6 5 2 Park Charles Baltimore City 252 Elderly yes 0 252 0 0 0 Park Heights Apts. Baltimore City 100 Elderly yes 0 100 0 0 0 Park Heights Elderly Baltimore City 84 Elderly yes 0 83 0 0 0 Park Heights Elderly Baltimore City 84 Elderly Park Terrace Baltimore City 101 Elderly yes 0 101 0 0 0 Park View at Coldspring Baltimore City 99 Elderly Park View at Taylor Baltimore City 100 Elderly Patriots Smith Baltimore City 76 Family 0 0 0 0 0 Pedistal Gardens (Bruce Manor) Baltimore City 207 Family Pembroke Commons Baltimore City 8 Family 0 4 4 0 0 Penn North Plaza Baltimore City 66 Elderly Penrose-Payson Cooperative Housing Baltimore City 30 Family 0 0 0 28 0 Pimlico Road Apts. Baltimore City 13 Family 0 0 13 0 0 Polish National Alliance Senior Housing Baltimore City 22 Elderly yes 0 22 0 0 0 Polish National Alliance Senior Housing Baltimore City 20 Elderly Poppleton Cooperative Baltimore City 96 Family 0 7 61 7 21 Poppleton Place Baltimore City 123 Family Printers Square Apartments Baltimore City 60 Family Ready Avenue Ltd. Partnership Baltimore City 21 Family 0 0 0 0 0 Redwood Square Baltimore City 52 Family 0 50 1 0 0 Regent Apartments Baltimore City 47 Family 1 2 44 0 0 Renaissance Plaza I Baltimore City 95 Family 0 45 36 5 0 Renaissance Plaza II Baltimore City 207 Family 0 119 52 20 0 Reservoir Hill IX Baltimore City 30 Family 0 0 0 27 3

Appendix II Page 9
Project Name County Units Occupancy Handicapped Accessible Units
Efficiency 1 Br 2 Br 3 Br 4+ Br
Reservoir Hill IX Baltimore City 30 Family Reservoir Hill Limited Partnership IV Baltimore City 11 Family 0 0 3 8 0 Reservoir Hill Limited Partnership XI Baltimore City 29 Family Reservoir Hill X Baltimore City 15 Family Reservoir Hill X Baltimore City 15 Family Reservoir Hill XI Baltimore City 29 Family Reservoir Hill XII Baltimore City 15 Family Ridgely's Delight Baltimore City 46 Family 0 4 20 27 0 Rieman Block Baltimore City 27 Family Robinwood Townhomes Apts. Baltimore City 102 Family 0 0 87 15 0 Royal Oaks (Villa Ridge) Baltimore City 207 Family Royalton Arms Apts. Baltimore City 15 Family Ruscombe Gardens Baltimore City 151 Elderly yes 0 151 0 0 0 Sandtown Manor Baltimore City 11 Family 0 0 0 11 0 School 148 Apts Baltimore City 34 Family 1 24 9 0 0 School 71 Baltimore City 37 Family 0 8 16 13 0 Sharon Towers Baltimore City 12 Family 0 2 10 0 0 Sharp Leadenhall II/Henrietta Baltimore City 37 Family 0 0 30 4 3 Sharp-Leadenhall Assoc. I Baltimore City 155 Elderly yes 0 155 0 0 0 Sinclair Gate Apts. Baltimore City 125 Family Southern High School Baltimore City 49 Elderly yes 0 49 0 0 0 St. Ambrose Baltimore City 30 Family St. Elizabeth's Convent Baltimore City 20 Elderly yes 0 20 0 0 0 St. Francis Housing Baltimore City 24 Elderly yes 0 24 0 0 0 St. James Terrace Baltimore City 151 Elderly yes St. Martin's Renovation Baltimore City 28 Family 4 11 8 4 1 St. Mary's Roland View 1&2 Baltimore City 361 Elderly yes St. Philip & James Baltimore City 22 Elderly yes 0 17 1 0 0 St. Stephens Court Baltimore City 72 Family

Appendix II Page 10
Project Name County Units Occupancy Handicapped Accessible Units
Efficiency 1 Br 2 Br 3 Br 4+ Br
St. Wenceslaus School Baltimore City 26 Family 0 8 18 0 0 Stricker Street Apartments Baltimore City 25 Family 0 4 8 13 0 Stuart Hills Baltimore City 27 Family Target City Apts. Baltimore City 86 Family Telephone Apartments Baltimore City 20 Family 0 12 8 0 0 The Chateau Baltimore City 47 Family The New Lexington Terrace Baltimore City 203 Family The Munsey Building Baltimore City 146 Family Turner's Station Baltimore City 34 Family 0 12 18 4 0 Union Avenue Baltimore City 54 Family 0 18 36 0 0 Upton Courts Baltimore City 180 Family 0 0 84 77 19 Upton Druid Apts. Baltimore City 78 Family Uptown Apartments Baltimore City 38 Family 0 4 24 7 3 Virginia Bowen House Baltimore City 15 Family 14 1 0 0 0 Virginia Bowen House Baltimore City 15 Family Walker Avenue Nonprofit Baltimore City 87 Elderly yes Walker Daniels House Baltimore City 23 Elderly yes 0 23 0 0 0 Walker Mews aka walker mews Baltimore City 167 Elderly yes 0 167 0 0 0 Warwick Arms aka walker arms Baltimore City 228 Family Waters Towers Baltimore City 204 Elderly yes 0 204 0 0 0 Weinberg Park Assisted Living Facility Baltimore City 31 Elderly Weinburg Woods Baltimore City 72 Family West Hills Square aka Westover Manor Baltimore City 108 Family West Lexington Street Apartments Baltimore City 44 Family 0 0 3 41 0 Westminster House Baltimore City 304 Family 0 96 0 0 0 White Park Apartments Baltimore City 24 Family Winters Lane Townhouses Baltimore City 14 Family 0 8 9 2 0 Woodington Gardens Apts. Baltimore City 352 Family Woodland Apts. 1 Baltimore City 24 Family

Appendix II Page 11
Project Name County Units Occupancy Handicapped Accessible Units
Efficiency 1 Br 2 Br 3 Br 4+ Br
Woodland Apts. 2 Baltimore City 23 Family Woodland Apts. 3 Baltimore City 18 Family Woodland Street Apts. Baltimore City 128 Family Zion Towers Baltimore City 210 Elderly yes 0 210 0 0 0 Cove Point Apartments Baltimore Co. 100 Elderly Fairspring Senior Apartments Baltimore Co. 100 Elderly Landsdown Apartments Baltimore Co. 157 Family Morningside Heights Senior Apartments Baltimore Co. 77 Elderly Owings Mills Apartments Baltimore Co. 159 Family Park View at Taylor Baltimore Co. 100 Elderly Randallstown Terrace Baltimore Co. 102 Elderly yes 0 102 0 0 0 Salony House Phase I Baltimore Co. 30 Elderly Salony House Phase II Baltimore Co. 30 Elderly Shakespeare Park Apts. Baltimore Co. 82 Family St. Charles House Baltimore Co. 24 Elderly yes 0 24 0 0 0 St. Elizabeth Hall Baltimore Co. 200 Elderly yes St. Lukes Place Baltimore Co. 125 Elderly yes 0 125 0 0 0 St. Luke's Senior Residential Facility Baltimore Co. 15 Elderly yes 0 15 0 0 0 St. Mark's Apartments Baltimore Co. 20 Elderly yes 0 20 0 0 0 St. Martha's Housing Baltimore Co. 24 Elderly yes 0 24 0 0 0 Tabco Towers Baltimore Co. 200 Elderly yes 0 80 0 0 0 The Bethany Community Baltimore Co. 30 Elderly yes 0 30 0 0 0 Timbercorft 3 Baltimore Co. 162 Family Timbercroft 1 Baltimore Co. 122 Family Timothy House Apartments Baltimore Co. 112 Elderly yes 0 84 22 0 0 Trinity House Baltimore Co. 82 Elderly yes 0 82 0 0 0 Turner's Station Baltimore Co. 34 Family Village Home Apartments Baltimore Co. 64 Family 0 28 18 4 0 Village Oaks Baltimore Co. 180 Family 0 180 0 0 0

Appendix II Page 12
Project Name County Units Occupancy Handicapped Accessible Units
Efficiency 1 Br 2 Br 3 Br 4+ Br
Village of Carrollwood Baltimore Co. 54 Family Virginia Towers Baltimore Co. 150 Elderly yes Warren Place Baltimore Co. 120 Elderly yes 0 120 0 0 0 Weinberg Gardens Baltimore Co. 84 Elderly yes 0 84 0 0 0 Weinberg House Baltimore Co. 116 Elderly yes 0 116 0 0 0 Weinberg Terrace Baltimore Co. 87 Elderly yes 0 87 0 0 0 Weinberg Village II Baltimore Co. 85 Elderly Calvert Pines I (FM) Calvert 50 Elderly yes 0 50 1 0 0 Calvert Pines II Calvert 48 Elderly yes 0 48 0 0 0 Calvertowne Townhouses Calvert 34 Family yes 0 0 18 16 0 Chapline House II Calvert 30 Elderly Courtyards at Fishing Creek I Calvert 30 Elderly yes 0 30 0 0 0 Courtyards at Fishing Creek I Calvert 80 Elderly Courtyards at Fishing Creek II Calvert 30 Family Kellam's Marina Apartments Calvert 80 Family 0 27 43 10 0 Prince Frederick Senior Village Calvert 30 Elderly yes 0 30 0 0 0 Prince Frederick Village Calvert 26 Family yes 0 12 14 0 0 Prince Frederick Villas Calvert 25 Family yes 0 6 13 6 0 Silverwood Farms Calvert 180 Family 0 46 108 24 0 Silverwood Farms Calvert 180 Family Southern Pines Calvert 76 Elderly yes 0 76 0 0 0 Town Center Apartments Calvert 49 Elderly Yardley Hills Town Homes Phase I Calvert 28 Family 0 0 14 12 2 Yardley Hills Town Homes Phase II Calvert 76 Family Caroline Village Apts. Caroline 31 Elderly yes 0 31 0 0 0 Dayspring II Caroline 20 Family 0 0 0 24 0 Dayspring Townhomes Caroline 26 Family 0 1 1 24 0 Edenton Manor Apts. Caroline 30 Elderly yes 0 30 0 0 0 Fair Haven Manor Apts. Caroline 32 Elderly yes 0 32 0 0 0
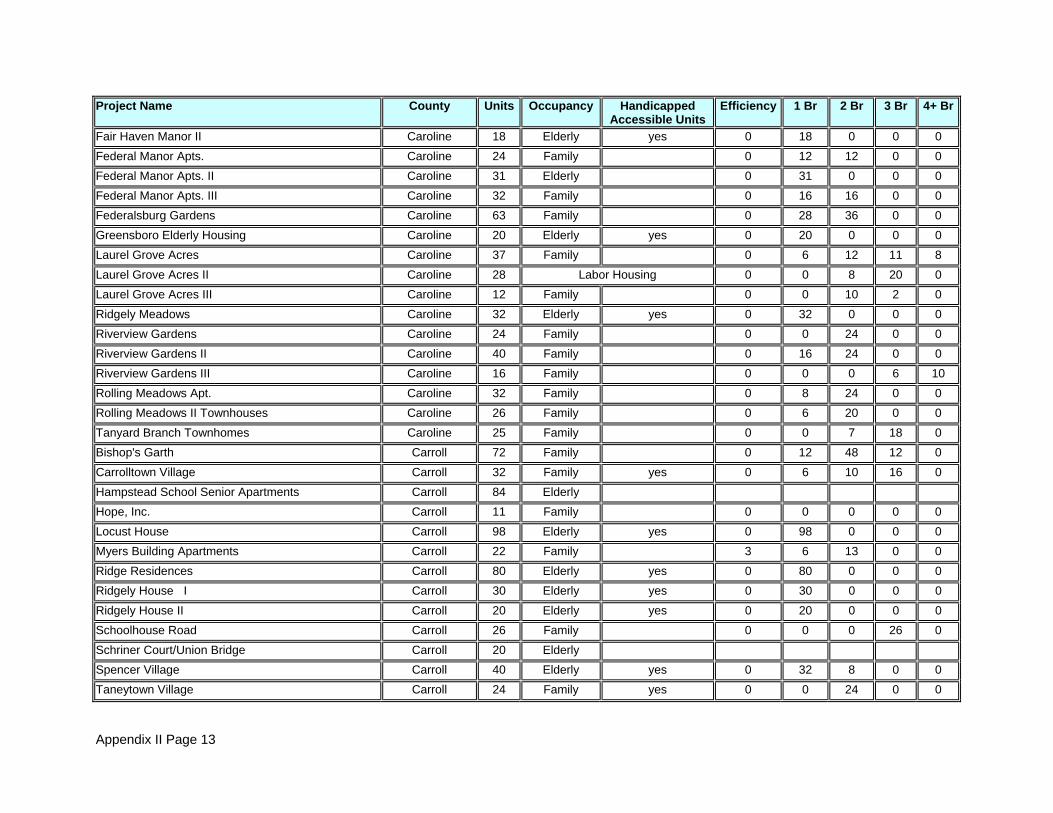
Appendix II Page 13
Project Name County Units Occupancy Handicapped Accessible Units
Efficiency 1 Br 2 Br 3 Br 4+ Br
Fair Haven Manor II Caroline 18 Elderly yes 0 18 0 0 0 Federal Manor Apts. Caroline 24 Family 0 12 12 0 0 Federal Manor Apts. II Caroline 31 Elderly 0 31 0 0 0 Federal Manor Apts. III Caroline 32 Family 0 16 16 0 0 Federalsburg Gardens Caroline 63 Family 0 28 36 0 0 Greensboro Elderly Housing Caroline 20 Elderly yes 0 20 0 0 0 Laurel Grove Acres Caroline 37 Family 0 6 12 11 8 Laurel Grove Acres II Caroline 28 Labor Housing 0 0 8 20 0 Laurel Grove Acres III Caroline 12 Family 0 0 10 2 0 Ridgely Meadows Caroline 32 Elderly yes 0 32 0 0 0 Riverview Gardens Caroline 24 Family 0 0 24 0 0 Riverview Gardens II Caroline 40 Family 0 16 24 0 0 Riverview Gardens III Caroline 16 Family 0 0 0 6 10 Rolling Meadows Apt. Caroline 32 Family 0 8 24 0 0 Rolling Meadows II Townhouses Caroline 26 Family 0 6 20 0 0 Tanyard Branch Townhomes Caroline 25 Family 0 0 7 18 0 Bishop's Garth Carroll 72 Family 0 12 48 12 0 Carrolltown Village Carroll 32 Family yes 0 6 10 16 0 Hampstead School Senior Apartments Carroll 84 Elderly Hope, Inc. Carroll 11 Family 0 0 0 0 0 Locust House Carroll 98 Elderly yes 0 98 0 0 0 Myers Building Apartments Carroll 22 Family 3 6 13 0 0 Ridge Residences Carroll 80 Elderly yes 0 80 0 0 0 Ridgely House I Carroll 30 Elderly yes 0 30 0 0 0 Ridgely House II Carroll 20 Elderly yes 0 20 0 0 0 Schoolhouse Road Carroll 26 Family 0 0 0 26 0 Schriner Court/Union Bridge Carroll 20 Elderly Spencer Village Carroll 40 Elderly yes 0 32 8 0 0 Taneytown Village Carroll 24 Family yes 0 0 24 0 0

Appendix II Page 14
Project Name County Units Occupancy Handicapped Accessible Units
Efficiency 1 Br 2 Br 3 Br 4+ Br
Timber Ridge Apts. Carroll 100 Elderly yes 0 100 0 0 0 Tremont II Carroll 30 Family 0 30 0 0 0 Tremont II Carroll 30 Family Tremont III Carroll 12 Family 0 12 0 0 0 Tremont III Carroll 12 Family Union Village Carroll 20 Family yes 0 0 10 10 0 Village House (Sykesville) Carroll 54 Elderly Westminster Bond Senior I Carroll 75 Elderly Westminster Bond Senior II Carroll 75 Elderly Willowood Garden (Washington Court) Carroll 120 Family Canal Town Village Cecil 30 Elderly yes 0 30 0 0 0 Cecilton Apts. Cecil 20 Elderly yes 0 20 0 0 0 Cedar Hill Apts. Cecil 77 Family Chesapeake Apts. Cecil 32 Elderly 0 32 0 0 0 Concord Apts. Cecil 40 Family 0 40 0 0 0 Concord II Apts. Cecil 24 Elderly 0 24 0 0 0 Concord III Apts. Cecil 24 Family 0 12 12 0 0 Concord IV Apts. Cecil 32 Family 0 16 16 0 0 Elk Chase Apartments Cecil 60 Family 0 0 40 20 0 Elk Chase II Cecil 66 Family 0 24 22 20 0 Elk River Manor Apts. Cecil 24 Family 0 12 12 0 0 Elk River Manor II Apts. Cecil 32 Family 0 16 16 0 0 Elk River Manor III Apts. Cecil 23 Elderly yes 0 23 0 0 0 Fairgreen Senior Community Cecil 92 Elderly Fairview Senior Apartments Cecil 75 Elderly Foxridge Manor Apts. Cecil 34 Family 0 18 16 0 0 Foxridge Manor II Apts. Cecil 24 Family 0 8 16 0 0 McKinley Apts. Cecil 31 Elderly yes 0 31 0 0 0 McKinley Apts. II Cecil 16 Elderly yes 0 16 0 0 0

Appendix II Page 15
Project Name County Units Occupancy Handicapped Accessible Units
Efficiency 1 Br 2 Br 3 Br 4+ Br
Meadowside Apts. Cecil 38 Family 0 15 17 6 0 Perryville House Cecil 20 Family Port Heights Apts. Cecil 31 Family Richmond Hill Manor Cecil 48 Family 0 12 36 0 0 Bannister Apts Charles 208 Family Brookmont/Wakefield Charles 104 Family Brookside Gardens Apartments Charles 56 Elderly yes 0 56 0 0 0 Carroll-Laplata Village Charles 32 Family yes 0 0 32 0 0 Charles Landing South Charles 60 Family 0 0 50 10 0 Diggs Circle Apts. Charles 20 Family yes 0 0 7 13 0 Headen House Apartments Charles 136 Family 0 120 16 0 0 Hunter's Run Charles 104 Family 0 0 104 0 0 Huntington Apartments Charles 204 Family 0 24 156 24 0 Indian Head Village Charles 40 Family yes 0 0 40 0 0 Jaycee House for the Elderly Charles 36 Elderly yes 0 28 8 0 0 La Plata Manor Charles 103 Elderly yes 0 103 0 0 0 Lakeview at Victoria Park Charles 109 Elderly LaPlata Grande (OC II) Charles 48 Family Melwood Charles Housing Charles Family Maples, The Charles 75 Elderly Palmer House Apartments Charles 152 Family 0 76 76 0 0 Victoria Park Jaycees Senior Housing Charles 60 Elderly Village Green Apts. Charles 60 Family yes 0 4 56 0 0 Village Lake Charles 122 Family yes Wakefield Terrace Charles 40 Family Amber Meadows Dorchester 32 Family 0 8 24 0 0 Bradford House Apartments Dorchester 121 Elderly 0 121 0 0 0 Cambridge Club Apartments Dorchester 75 Family Cambridge Park 1 Dorchester 100 Family

Appendix II Page 16
Project Name County Units Occupancy Handicapped Accessible Units
Efficiency 1 Br 2 Br 3 Br 4+ Br
Cambridge Park II Dorchester 50 Family Carlton Court Dorchester 40 Family yes 0 0 40 0 0 Crusader Arms II Dorchester 40 Family 0 40 0 0 0 Crusader Arms III Dorchester 32 Family 0 16 16 0 0 Crusader Arms IV Dorchester 32 Family 0 16 16 0 0 East New Market Apartments Dorchester 19 Elderly yes 0 19 0 0 0 East New Market Apartments Dorchester 19 Elderly Glenburn Garden House Dorchester 24 Elderly yes 0 0 0 0 0 Glenburn Garden House Dorchester 24 Elderly Greenwood Village II Dorchester 20 Family 0 0 0 20 0 Harrison Ferry Apts. Dorchester 32 Family 0 16 16 0 0 Hurlock Meadows Dorchester 30 Elderly yes 0 30 0 0 0 Hurlock Village Dorchester 20 Family 0 8 12 0 0 Leonard's Grove Apts. Dorchester 32 Family 0 16 16 0 0 New Horizons Dorchester 32 Elderly yes 0 32 0 0 0 Parkside Village Dorchester 30 Family 0 4 16 0 10 Prospect Heights II Dorchester 16 Family 0 0 0 12 4 Ramber Apts. Dorchester 20 Family 0 10 10 0 0 De Paul Street Partnership Frederick 20 Family 0 6 12 2 0 Frederick Villas Frederick 40 Family yes 0 16 24 0 0 Hickory Hill Frederick 162 Family 0 12 13 8 0 Hunter's Glen Frederick 108 Family Lafayette Square Frederick 35 Family 2 17 6 0 0 North Market Street Manor Frederick 12 Family Potomac Commons Frederick 150 Family 0 45 59 0 0 South Mountain View Frederick 40 Family yes 0 24 14 2 0 Taney Village Frederick 131 Elderly yes 0 130 0 0 0 Thurmont Village Apts. Frederick 22 Family yes 0 0 22 0 0 Westerleigh Apartments Frederick 28 Family 0 26 2 0 0

Appendix II Page 17
Project Name County Units Occupancy Handicapped Accessible Units
Efficiency 1 Br 2 Br 3 Br 4+ Br
Windsor Gardens Frederick 58 Family 0 11 47 0 0 Winter Place Homes Frederick 20 Elderly yes 0 20 0 0 0 Cassel Ridge East Garrett 36 Family Guardian Apts. Garrett 26 Family yes 0 9 8 9 0 Meadow View Garrett 36 Family yes 0 6 30 0 0 Meadow Woods East Garrett 29 Elderly yes 0 29 0 0 0 Meadows East Garrett 65 Family yes 0 29 36 0 0 Oakwood East Garrett 32 Elderly yes 0 28 4 0 0 Overlook North Garrett 60 Family Parkwood Village East Garrett 32 Family yes 0 9 23 0 0 Pine Wood East Garrett 36 Family yes 0 0 26 10 0 Pleasant View East Garrett 24 Family yes 0 1 1 22 0 Pysell Crosscut Road Garrett 2 Family Starner Hills Elderly Garrett 18 Elderly yes 0 18 0 0 0 Town View Village Garrett 20 Elderly yes 0 20 0 0 0 Underwood South Garrett 32 Elderly yes 0 32 0 0 0 Yough West Garrett 32 Family 0 28 4 0 0 Alice Anne Harford 12 Family 0 4 5 2 1 Baldwin Manor Harford 104 Family 0 32 72 0 0 Burton Manor/Aberdeen Eldlery Harford 80 Elderly yes 0 80 0 0 0 Corner House Apartments Harford 20 Elderly yes 0 20 0 0 0 Edgewater Village (Village of Lakeview) Harford 218 Family Edgewater Village Apartments Harford 223 Family Fairbrooke Apartments Harford 122 Elderly yes 0 114 8 0 0 Friendship Village Apts. Harford 31 Elderly yes 0 31 0 0 0 Graw, The Harford 65 Family 0 65 0 0 0 Greenbrier Apts. Harford 216 Family Harborside Village Harford 150 Family Harford Commons (Beacon Terrace) Harford 100 Family

Appendix II Page 18
Project Name County Units Occupancy Handicapped Accessible Units
Efficiency 1 Br 2 Br 3 Br 4+ Br
Harford Senior Housing 1 Harford 133 Elderly yes Harford Senior Housing II Harford 21 Elderly yes 0 21 0 0 0 Lafayette Elderly Apts. Harford 15 Elderly yes 0 15 0 0 0 Park View at Bel Air Harford 101 Elderly Park View at Box Hill Harford 100 Elderly yes 0 0 0 0 0 Park View at Box Hill Harford 100 Elderly Perrywood Gardens Apts. Harford 184 Family St. John's Towers Elderly Harford 68 Elderly yes Wakefield Manor Apts. Harford 185 Family Washington Park Apts. Harford 178 Family Windsor Valley (Meadowood 1) Harford 130 Family Windsor Valley (Meadowood II) Harford 161 Family Windsor Valley (Meadowood III) Harford 283 Family Woodbridge Commons Harford 132 Family Woodsdale Senior Housing Center Harford 130 Elderly yes 0 119 0 0 0 Beech's Farm Apts Howard 135 Family Chatam Gardens II Howard 216 Family Chimneys of Cradlerock Howard 198 Family 0 82 112 0 0 Colonial Landing Howard 101 Elderly yes 0 101 0 0 0 Columbia Commons Howard 200 Family 0 52 136 12 0 Communities Homes Howard 300 Family Courts at Guilford Howard 60 Elderly yes 0 60 0 0 0 Deep Run Mobile Hm Pk Howard 306 Family Deep Run Mobile Hm Pk II Howard 313 Family Ellicott Terrace Howard 60 Family 0 5 55 0 0 Guilford Gardens Cooperative Howard 100 Family 0 10 20 25 0 Harmony Lane Housing Howard 16 Family 0 0 0 16 0 Hickory Ridge Place Howard 108 Elderly yes 0 108 0 0 0 Howard Hills Apts Howard 134 Family

Appendix II Page 19
Project Name County Units Occupancy Handicapped Accessible Units
Efficiency 1 Br 2 Br 3 Br 4+ Br
Howard Sheltered Homes Howard 21 Elderly yes 0 21 0 0 0 Huntington Downs Howard 108 Family Lawyers Hill Howard 84 Family Longwood Elderly Howard 99 Elderly yes 0 97 3 0 0 Normandy Woods Apts Howard 348 Family Normandy Woods Apts II Howard 240 Family Orchard Club Apts Howard 196 Family 0 35 161 0 0 Orchard Crossing Apts Howard 187 Family 0 47 140 0 0 Orchard Crossing Townhomes I Howard 30 Family 0 0 0 30 0 Owen Brown II Howard 104 Elderly yes 0 98 0 0 0 Owen Brown Place Howard 188 Elderly yes 0 150 38 0 0 Park View at Ellicott City Howard 81 Elderly yes 0 0 0 0 0 Park Biew at Snowden River Howard 100 Elderly Port Capital Village Howard 84 Family St. Mathew's Housing Development Howard 16 Elderly yes Selborne House of Dorsey Hall Phase II Howard 48 Elderly Storch Woods II Howard 60 Family 0 24 36 0 0 Streamwood Apartments Howard 61 Family 0 0 0 61 0 Streamwood Apartments Howard 18 Family The Heartlands (Elderly) Howard 160 Elderly yes The Seasons Howard 1088 Family Waverly Gardens Howard 102 Elderly Briscoe Manor Apts. (I,II,III) Kent 31 Elderly yes 0 31 0 0 0 Brittany Bay Apts. Kent 40 Family 0 12 24 4 0 Brookmeadow II Kent 33 Family 0 9 24 0 0 Brookmeadow I Kent 34 Family 0 10 24 0 0 Calvert Heights Kent 22 Family 0 0 12 10 0 Chestertown Cove Kent 34 Family 0 18 12 4 0 Chestertown Housing Kent 30 Elderly yes 0 30 0 0 0

Appendix II Page 20
Project Name County Units Occupancy Handicapped Accessible Units
Efficiency 1 Br 2 Br 3 Br 4+ Br
Chestertown Landing I Kent 72 Family 0 0 0 0 0 Chestertown Landing I Kent 72 Family Chestertown Landing II Kent 60 Elderly yes 0 0 0 0 0 Chestertown Landing II Kent 72 Elderly Rock Hall Elderly/Chesapeake Manor Kent 30 Elderly yes Rock Hall Manor Kent 12 Elderly yes 0 0 12 0 0 Woods Edge Apts. Kent 36 Family 0 18 18 0 0 Woods Edge Apts. II Kent 36 Family 0 0 36 0 0 Woods Edge III Kent 20 Family 0 0 0 10 10 64 MPDU Montgomery 64 Family 0 0 1 31 0 Airpark Apartments Montgomery 106 Family Alexander House (HOC) Montgomery 311 Family 0 165 115 0 0 Ambassador Apartments SRO Montgomery 162 Individuals 0 162 0 0 0 Aspen Crossing Montgomery 192 Family Avalon Fields Montgomery 192 Family 0 80 112 0 0 Avalon Fields Montgomery 192 Family Barclay Apts Montgomery 157 Family Bauer Drive Elderly (Bauer Park Apts) Montgomery 142 Elderly yes Beall's Grant Apts Montgomery 74 Family 17 33 24 0 0 Bethany House Montgomery 128 Family Bethesda Commons Montgomery 369 Family 0 53 310 6 0 Bethesda Commons Montgomery 369 Family Blair Park Apartments Montgomery 52 Family Bucknell Apts Montgomery 40 Family Burnt Mills Crossing Montgomery 96 Family 0 0 78 18 0 Byron House Montgomery 30 Elderly Byron Manor Apt Montgomery 59 Family Camp Hill Square Montgomery 51 Family Carleton, John (Carleton East Apt.) Montgomery 24 Family 1 9 14 0 0

Appendix II Page 21
Project Name County Units Occupancy Handicapped Accessible Units
Efficiency 1 Br 2 Br 3 Br 4+ Br
Centennial House Montgomery 238 Family Charter House Montgomery 179 Family Chase Ridge (Athalon Ridge Apts) Montgomery 432 Family 0 188 188 56 0 Churchill Senior Housing Montgomery 121 Elderly Cinnamon Run I Montgomery 288 Family Cinnamon Run II Montgomery 48 Family Clopper Mill Manor Montgomery 102 Elderly Colony III Montgomery 232 Family 0 168 64 0 0 Country Club Apts Montgomery 208 Family Country Club II Montgomery 168 Family Country Place Montgomery 192 Family 0 46 115 24 0 Country Place Apts II Montgomery 120 Family Crestwood Terrace Montgomery 108 Family Croydon Manor Apartments Montgomery 97 Family 0 41 56 0 0 Damascus Gardens Montgomery 104 Family Diamond Square Montgomery 122 Family 0 122 0 0 0 Dring's Reach Montgomery 104 Family 0 27 77 0 0 Emory Grove Apts (Emory Grove Village) Montgomery 137 Family Essex House Montgomery 180 Family 0 67 45 23 0 Fairland Garland (Fairland apts) Montgomery 176 Family Fallswood Commons (Rockville) Montgomery 190 Family Family Services Montgomery Family Forest Oak Towers Montgomery 175 Elderly yes 0 175 0 0 0 Franklin Apartments Montgomery 185 Elderly yes 0 185 0 0 0 Friendly Gardens Montgomery 84 Family Friends House Montgomery 100 Family Georgian Court Apts Montgomery 147 Family Georgian Woods I Montgomery 97 Family Georgian Woods II Montgomery 371 Family

Appendix II Page 22
Project Name County Units Occupancy Handicapped Accessible Units
Efficiency 1 Br 2 Br 3 Br 4+ Br
Georgian Woods III Montgomery 102 Family The Glen Montgomery 90 Family 0 0 78 12 0 The Grand Montgomery 546 Family Goodacre Montgomery 153 Family Gramax Building Montgomery 180 Family Great Hope Homes Montgomery 103 Family Greenwich Woods III Montgomery 564 Family Greenwood Terrace Montgomery 49 Family Hampshire Towers Montgomery 449 Family Heritage House Montgomery 100 Elderly yes 0 100 0 0 0 Heritage Park Cooperative Montgomery 65 Family 0 0 55 13 0 Hewitt Gardens Apts Montgomery 143 Family Hillbrooke Towers Montgomery 55 Family Homecrest House Montgomery 136 Homecrest House III Montgomery 42 Elderly yes 0 42 0 0 0 Homecrest House North Montgomery 100 Family Hughes Neighborhd Hsg Montgomery 24 Family Inwood House Montgomery 150 Family Joncon/Mont White Oak V Montgomery 96 Family Lakeview House Montgomery 152 Elderly yes 0 152 0 0 0 Landing's Edge Apartments Montgomery 125 Family 0 0 0 0 0 Landing's Edge Apartments Montgomery 125 Family Landing's Edge Apartments Montgomery 125 Family Leafy House Montgomery 216 Family Lenox at White Flint Montgomery 552 Family Londonderry Montgomery 529 Family Londonderry Towers Montgomery 150 Family 0 126 24 0 0 Magruders Discovery Montgomery 133 Family MHLP III Montgomery 44 Family 0 4 11 25 0
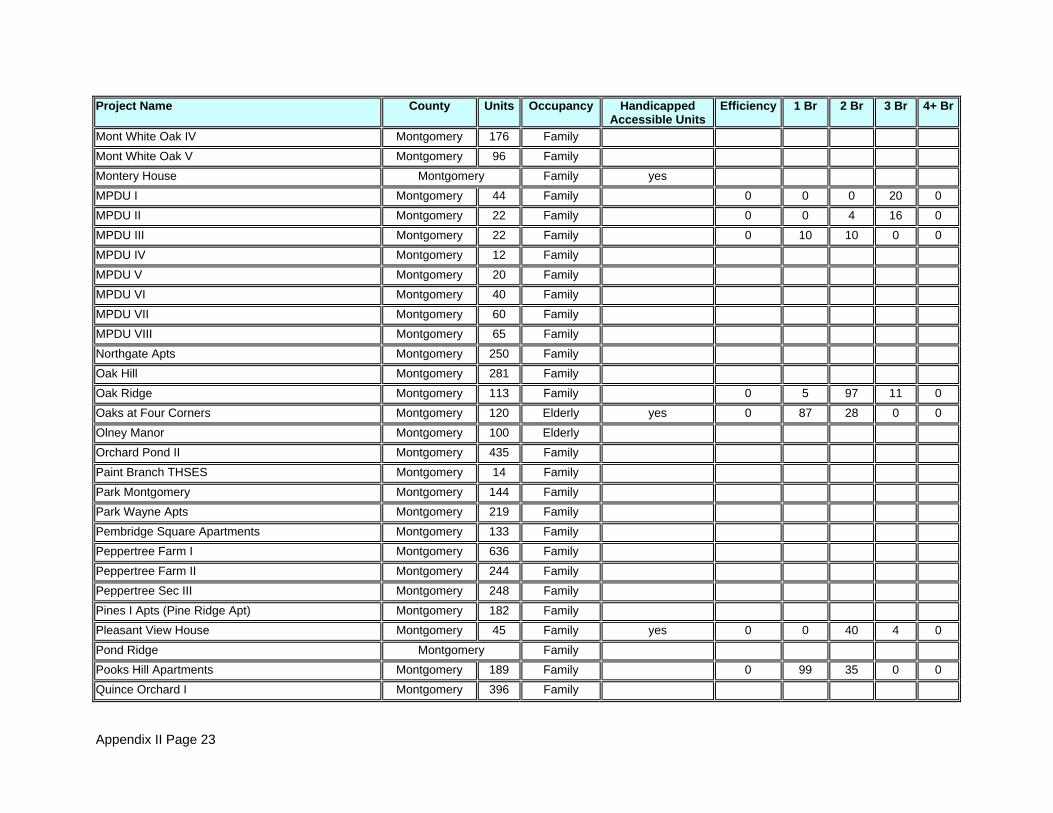
Appendix II Page 23
Project Name County Units Occupancy Handicapped Accessible Units
Efficiency 1 Br 2 Br 3 Br 4+ Br
Mont White Oak IV Montgomery 176 Family Mont White Oak V Montgomery 96 Family Montery House Montgomery Family yes MPDU I Montgomery 44 Family 0 0 0 20 0 MPDU II Montgomery 22 Family 0 0 4 16 0 MPDU III Montgomery 22 Family 0 10 10 0 0 MPDU IV Montgomery 12 Family MPDU V Montgomery 20 Family MPDU VI Montgomery 40 Family MPDU VII Montgomery 60 Family MPDU VIII Montgomery 65 Family Northgate Apts Montgomery 250 Family Oak Hill Montgomery 281 Family Oak Ridge Montgomery 113 Family 0 5 97 11 0 Oaks at Four Corners Montgomery 120 Elderly yes 0 87 28 0 0 Olney Manor Montgomery 100 Elderly Orchard Pond II Montgomery 435 Family Paint Branch THSES Montgomery 14 Family Park Montgomery Montgomery 144 Family Park Wayne Apts Montgomery 219 Family Pembridge Square Apartments Montgomery 133 Family Peppertree Farm I Montgomery 636 Family Peppertree Farm II Montgomery 244 Family Peppertree Sec III Montgomery 248 Family Pines I Apts (Pine Ridge Apt) Montgomery 182 Family Pleasant View House Montgomery 45 Family yes 0 0 40 4 0 Pond Ridge Montgomery Family Pooks Hill Apartments Montgomery 189 Family 0 99 35 0 0 Quince Orchard I Montgomery 396 Family

Appendix II Page 24
Project Name County Units Occupancy Handicapped Accessible Units
Efficiency 1 Br 2 Br 3 Br 4+ Br
Quince Orchard II Montgomery 288 Family Randolph Village Apartments Montgomery 130 Elderly yes 0 130 0 0 0 Raphael House Montgomery 30 Elderly yes 0 30 0 0 0 Rebecca Apts Montgomery 101 Elderly yes Rebecca Apts Montgomery 115 Elderly yes Revitz House Montgomery 250 Family Ring House Montgomery 248 Elderly yes 0 167 47 0 0 Rock Creek Terrace Montgomery 526 Family 0 138 256 132 0 Rockville Commons Montgomery 190 Family Rolling Hills Montgomery 468 Family Rosemary Village Montgomery 416 Family 0 111 237 68 0 Scarborough Square Montgomery 121 Family Scotland Community Montgomery 75 Family 0 0 0 0 0 Seneca Heights Montgomery 40 Family Shady Grove Apts. Montgomery 144 Family 0 45 83 16 0 Silver Spring House Montgomery 80 Family Sligo Hills (Sligo Avenue Apartments) Montgomery 50 Family Sligo House Apts Montgomery 64 Family Snowden's Ridge Montgomery 87 Family Somerset Apartments Montgomery 99 Family Spring Gardens East Montgomery 83 Elderly yes 0 61 20 0 0 Springvale Terrace Montgomery 156 Family Stewartown House Montgomery Family Suburban Park Village Montgomery 168 Family Summit Apartments (Summit Crest Apts) Montgomery 236 Family Sunrise at Kensington Park (Sunrise garden) Montgomery 165 Elderly yes 14 33 14 0 0 Takoma Towers(retirement center) Montgomery 186 Elderly yes The Colony I Montgomery 288 Family The Colony II Montgomery 248 Family

Appendix II Page 25
Project Name County Units Occupancy Handicapped Accessible Units
Efficiency 1 Br 2 Br 3 Br 4+ Br
The Gardens of Traville Senior Apartments Montgomery 230 Elderly The Oaks at Montgomery 120 Family The Overlook Montgomery 152 Family The Place Montgomery 228 Family The Point Montgomery 1119 Family The Willows Montgomery Family Timberlawn Crescent Montgomery 83 Family 0 8 61 14 0 Town Center Apartment Montgomery 110 Family University Gardens Montgomery 64 Family University Gardens Elderly Apartments Montgomery Elderly yes University Manor Apts Montgomery 136 Family Victory Terrace Montgomery 72 Elderly Village House Montgomery 147 Elderly yes 0 141 2 0 0 Waters Landing Apartments II Montgomery 143 Family Wayne Manchester Towers Montgomery 226 Family White Oak Towers Montgomery 412 Family Winter Growth (adult day care center) Montgomery 14 Elderly yes 0 14 0 0 0 Woodmont Park Montgomery 414 Family Yorkshire Apartments Montgomery 228 Family 2400 Queens Chapel Apts Prince George's 247 Family Alden Park Prince George's 24 Family 0 0 0 24 0 Arbor View Apts Prince George's 450 Family Auburn Manor Apartments Prince George's 261 Family Avalon Apts (avalon crossing apt.) Prince George's 272 Family Avondale Park Apts Prince George's 88 Family Belford Towers Prince George's 468 Family Berkley Apartments (The Berkley) Prince George's 160 Family Bowie Commons (FM) Prince George's 36 Elderly yes 0 36 0 0 0 Bradford Place Prince George's 214 Family

Appendix II Page 26
Project Name County Units Occupancy Handicapped Accessible Units
Efficiency 1 Br 2 Br 3 Br 4+ Br
Branchwood Towers Prince George's 180 Family 0 160 20 0 0 Burgundy Park Apts Prince George's 108 Family Canonbury Square Apts Prince George's 95 Family Capital Crossing Apts Prince George's 360 Family Capital View Mutual I Prince George's 60 Family Capital View Mutual II Prince George's 60 Family Central Gardens Prince George's 93 Family Central Gardens II Prince George's 106 Family 0 37 51 18 0 Cheverly Crossing Prince George's 168 Family Chillum Oaks (Adventist Apts) Prince George's 27 Family Coral Gardens Prince George's 16 Family 0 0 0 12 4 Council House Prince George's 161 Family Crest Apts Prince George's 43 Family Delta House Prince George's 30 Family 0 0 0 0 0 Drexel Park II Prince George's 168 Family 0 24 144 0 0 East Pines Terrace Prince George's 74 Family Eastdale Apartments Prince George's 70 Family Eastern Ave Prince George's Family Emerson House Apts Prince George's 220 Family Forest Creek Apts Prince George's 930 Family Forest Lake Apts Prince George's 317 Family Foxglenn Apts Prince George's 172 Family Friendship Arms Prince George's 151 Elderly yes 0 151 0 0 0 Glen Willows Prince George's 152 Family Glenmore Apartments Prince George's 409 Family Glenarden I Prince George's 340 Family Glenarden II Prince George's 237 Family Glenarden IV Prince George's Family Glenreed Apts (Glenreed housing Inc.) Prince George's 105 Family

Appendix II Page 27
Project Name County Units Occupancy Handicapped Accessible Units
Efficiency 1 Br 2 Br 3 Br 4+ Br
Greenridge House Prince George's 101 Elderly yes 0 100 0 0 0 Greenwich Wds-Mistletoe Prince George's 120 Family Heather Hills Prince George's Family Henson Creek Manor Prince George's 105 Family 0 0 43 62 0 Henson Creek Manor II Prince George's 105 Family Hillwood Manor Prince George's 96 Family Imperial Gardens Sec 2 Prince George's 188 Family Jefferson Hall Prince George's 103 Family Kenilworth Towrs Prince George's 217 Family Kirkwood Village Prince George's 667 Family Langley Gardens Apartments Prince George's 204 Family 0 0 0 0 0 Largo Center Apartments Prince George's 100 Family 0 5 89 5 0 Largo Landing Prince George's 106 Family Laurel Commons Prince George's 38 Family 0 0 0 0 0 Laurel Crossing Apts Prince George's 156 Family Laurel Square Apts Prince George's 420 Family Malta House Prince George's 30 Elderly yes 0 30 0 0 0 Manor Apartments Prince George's 62 Family Millwood Townhouses Prince George's 75 Family 0 0 43 22 10 Mt. Ranier Artist Apartments Prince George's 12 Family Mount Ranier Community Prince George's 44 Family Nalley Apts Prince George's 140 Family Park Forest Prince George's 608 Family 0 195 405 8 0 Park Seton Prince George's 102 Elderly yes 0 102 0 0 0 Park View Apartments Prince George's 152 Elderly yes 0 152 0 0 0 Parkland Village Prince George's 159 Family Parkview II Prince George's 105 Elderly yes 0 105 0 0 0 Parkview Manor Prince George's 54 Family Parkway Apartments Prince George's 159 Family

Appendix II Page 28
Project Name County Units Occupancy Handicapped Accessible Units
Efficiency 1 Br 2 Br 3 Br 4+ Br
Penn-Mar Apartments Prince George's 291 Family Pin Oak Apartments I/II Prince George's 220 Elderly Prince George's Manor Prince George's 148 Elderly Queen's Manor Apartments Prince George's 332 Family Quebec Arms Apartments Prince George's 332 Family Rainier Manor Apts Prince George's 103 Elderly yes 0 54 50 0 0 Reality, Inc. Prince George's 16 Family 0 0 0 0 0 Rolling Crest Commons Prince George's 140 Elderly yes 0 140 0 0 0 Selborne House Prince George's 126 Elderly Spellman House Prince George's 140 Elderly Sugar Hill Prince George's 11 Family 0 0 0 0 11 Sun Ridge Apartments Prince George's 372 Family Villages of Laurel Prince George's 128 Family Vistas at Lake Largo Prince George's 110 Elderly yes 0 78 31 0 0 Woodland Springs Prince George's 765 Family 0 142 287 33 44 Woods Of Marlton I Prince George's 186 Family 0 51 127 9 0 Woods of Marlton II Prince George's 104 Family 0 30 64 10 0 Woodside Village I & II Prince George's 200 Elderly Center Park Apts. Queen Anne's 37 Family 0 16 18 3 0 Kent Island Village Apts. Queen Anne's 38 Family 0 8 30 0 0 Renaissance Chase Apts. Queen Anne's 32 Family 0 12 16 4 0 Sudlersville Apts. Queen Anne's 16 Elderly yes 0 16 0 0 0 Tilghman Terrace Queen Anne's 42 Elderly yes 0 41 1 0 0 Breton Bay Gardens Saint Mary's 40 Family 0 15 25 0 0 Chancellors Run Apts. Saint Mary's 40 Family yes 0 12 28 0 0 Foxchase Village Apartments Saint Mary's 134 Family Great Mills Court Saint Mary's 44 Family yes 0 8 14 22 0 Hunting Meadows Saint Mary's 32 Family yes 0 8 24 0 0 Joe Baker Village Saint Mary's 36 Elderly yes 0 36 0 0 0

Appendix II Page 29
Project Name County Units Occupancy Handicapped Accessible Units
Efficiency 1 Br 2 Br 3 Br 4+ Br
Housing Preservation Project Saint Mary's 4 Family Leonard's Freehold Saint Mary's 34 Family yes 0 0 16 18 0 Leonardtown Village Saint Mary's 35 Family yes 0 0 35 0 0 Lex Woods Apts. Saint Mary's 78 Family yes 0 30 34 14 0 Lexington Park Senior Apartments St. Mary's 110 Elderly Lexington Village Saint Mary's 36 Family yes 0 12 22 2 0 Mayfaire Apts Saint Mary's 144 Family New Towne Village Apts Saint Mary's 35 Elderly yes 0 35 0 0 0 River Bay Townhomes Saint Mary's 173 Family St. Mary's Home for Eld I (AKA Cedar Lane Saint Mary's 129 Elderly yes St. Mary's Home for Eld II (AKA Cedar Lane) Saint Mary's 50 Elderly yes Valley Drive Est. Apts. Saint Mary's 38 Family yes 0 0 19 19 0 Fair Winds Apts. Somerset 36 Elderly yes 0 36 0 0 0 Loretta Village Somerset 32 Family 0 8 8 16 0 Princess Anne Apts. Somerset 20 Family 0 8 12 0 0 Princess Anne Townhouses Somerset 120 Family Princess Anne Villas Somerset 39 Family 0 12 27 0 0 Stewart Neck Somerset 36 Family Frederick Douglas Talbot 24 Elderly yes 0 24 0 0 0 Jowite Apts. Talbot 24 Family 0 16 8 0 0 Magnolia Meadows Talbot 98 Family Mulberry Hill Apts. I Talbot 40 Family 0 20 20 0 0 Mulberry Hill Apts. II Talbot 40 Family 0 40 0 0 0 Mulberry Hill Apts. III Talbot 32 Family 0 32 0 0 0 Mulberry Hill Apts. IV Talbot 16 Family 0 16 0 0 0 Parkview at Easton Talbot 80 Individuals Parkway Apts. Talbot 44 Family 0 10 20 14 0 Quail Meadows Talbot 32 Family 0 8 24 0 0 Quail Meadows II Talbot 20 Family 0 0 20 0 0
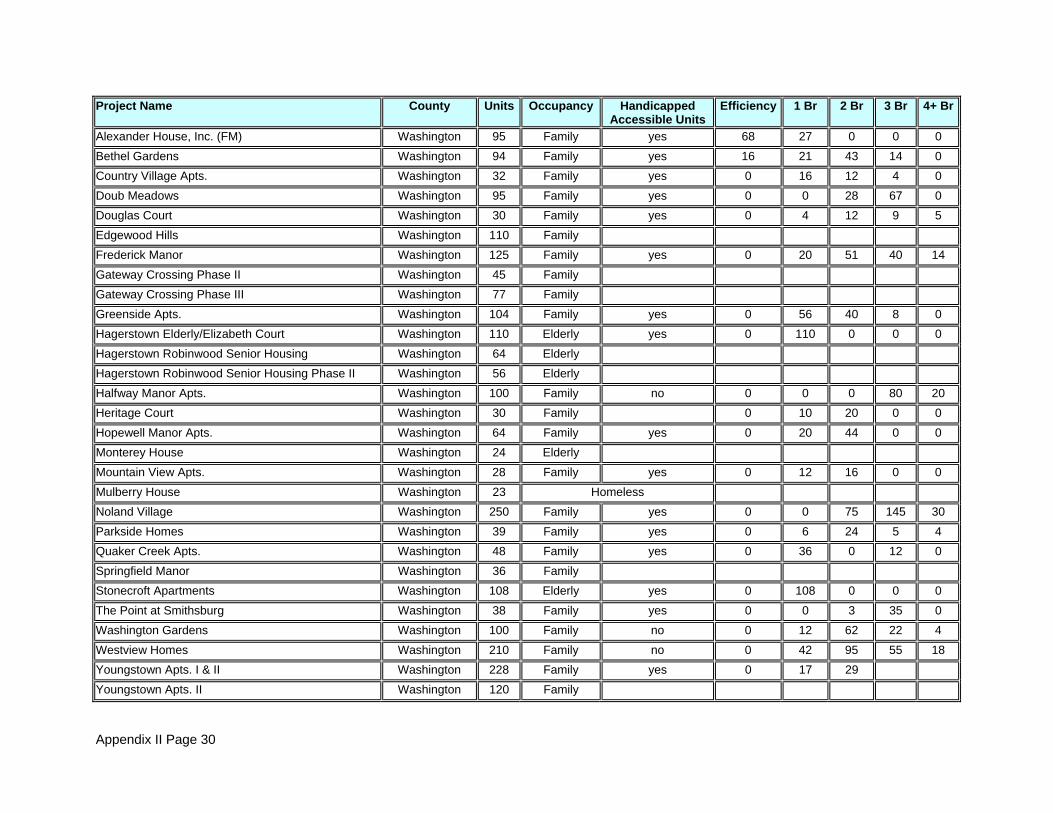
Appendix II Page 30
Project Name County Units Occupancy Handicapped Accessible Units
Efficiency 1 Br 2 Br 3 Br 4+ Br
Alexander House, Inc. (FM) Washington 95 Family yes 68 27 0 0 0 Bethel Gardens Washington 94 Family yes 16 21 43 14 0 Country Village Apts. Washington 32 Family yes 0 16 12 4 0 Doub Meadows Washington 95 Family yes 0 0 28 67 0 Douglas Court Washington 30 Family yes 0 4 12 9 5 Edgewood Hills Washington 110 Family Frederick Manor Washington 125 Family yes 0 20 51 40 14 Gateway Crossing Phase II Washington 45 Family Gateway Crossing Phase III Washington 77 Family Greenside Apts. Washington 104 Family yes 0 56 40 8 0 Hagerstown Elderly/Elizabeth Court Washington 110 Elderly yes 0 110 0 0 0 Hagerstown Robinwood Senior Housing Washington 64 Elderly Hagerstown Robinwood Senior Housing Phase II Washington 56 Elderly Halfway Manor Apts. Washington 100 Family no 0 0 0 80 20 Heritage Court Washington 30 Family 0 10 20 0 0 Hopewell Manor Apts. Washington 64 Family yes 0 20 44 0 0 Monterey House Washington 24 Elderly Mountain View Apts. Washington 28 Family yes 0 12 16 0 0 Mulberry House Washington 23 Homeless Noland Village Washington 250 Family yes 0 0 75 145 30 Parkside Homes Washington 39 Family yes 0 6 24 5 4 Quaker Creek Apts. Washington 48 Family yes 0 36 0 12 0 Springfield Manor Washington 36 Family Stonecroft Apartments Washington 108 Elderly yes 0 108 0 0 0 The Point at Smithsburg Washington 38 Family yes 0 0 3 35 0 Washington Gardens Washington 100 Family no 0 12 62 22 4 Westview Homes Washington 210 Family no 0 42 95 55 18 Youngstown Apts. I & II Washington 228 Family yes 0 17 29 Youngstown Apts. II Washington 120 Family

Appendix II Page 31
Project Name County Units Occupancy Handicapped Accessible Units
Efficiency 1 Br 2 Br 3 Br 4+ Br
Chestnut Manor Apts. Wicomico 48 Family 0 48 0 0 0 Chestnut Manor II Wicomico 40 Family 0 20 20 0 0 Fruitland Apts. Wicomico 36 Family Gateway Village II Wicomico 62 Elderly Gateway Village III Wicomico 36 Elderly Green Meadow Townhouses Wicomico 26 Family 0 10 16 0 0 Lakeview Apts. Wicomico 37 Family 0 37 0 0 0 Leonard Apts.I & II Wicomico 34 Family 0 4 10 18 2 Meadow Ridge Apts. Wicomico 34 Family 0 6 28 0 0 Moss Hill Townhouses Wicomico 200 Family Pemberton Manor Apts. Wicomico 209 Family Salisbury Commons Wicomico 96 Family The Cottages at River House Wicomico 30 Elderly Waterside Apartments Wicomico 68 Family 0 0 45 19 3 West Road Apts. Wicomico 56 Family Bay Terrace Apts. Worcester 32 Family 0 0 12 12 8 Clarke Manor Cottages Worcester 30 Elderly yes 0 30 0 0 0 Decatur Apts. Worcester 32 Family 0 16 0 16 0 Decatur II Worcester 31 Elderly yes 0 31 0 0 0 Decatur III Worcester 28 Family 0 4 24 0 0 Greebriar Court Worcester 24 Family 0 0 12 12 0 Hartley Hall Worcester 20 Elderly 0 20 0 0 0 Homes at Berlin Worcester 42 Family Isaiah Fassett Worcester 28 Family 0 16 12 0 0 Lynn Apts. Worcester 13 Family 0 6 7 0 0 Lynn Haven Acres Worcester 16 Family 0 0 16 0 0 Maple Hill Apts. Worcester 24 Elderly yes 0 22 2 0 0 Meadow Grove Worcester 20 Elderly yes 0 20 0 0 0 New Hope Village Apts. Worcester 28 Family 0 12 16 0 0

Appendix II Page 32
Project Name County Units Occupancy Handicapped Accessible Units
Efficiency 1 Br 2 Br 3 Br 4+ Br
Newtowne Apts. Worcester 58 Elderly yes 30 28 0 0 0 Pleasant Manor Worcester 30 Elderly yes 0 30 0 0 0 Pocomoke Villas Worcester 37 Family 0 10 27 0 0 Reedy Cove Apts. Worcester 32 Family 0 0 32 0 0 Snow Hill Senior Apartments Worcester 30 Family Sunshine Village Worcester 52 Family 0 4 26 14 8 The Meadows Worcester 28 Family 0 0 17 11 0 Trappe Creek Worcester 14 Family 0 0 0 14 0 Victoria Apartments Worcester 40 Family 20 20 Windy Gardens Worcester 34 Family 0 16 18 0 0
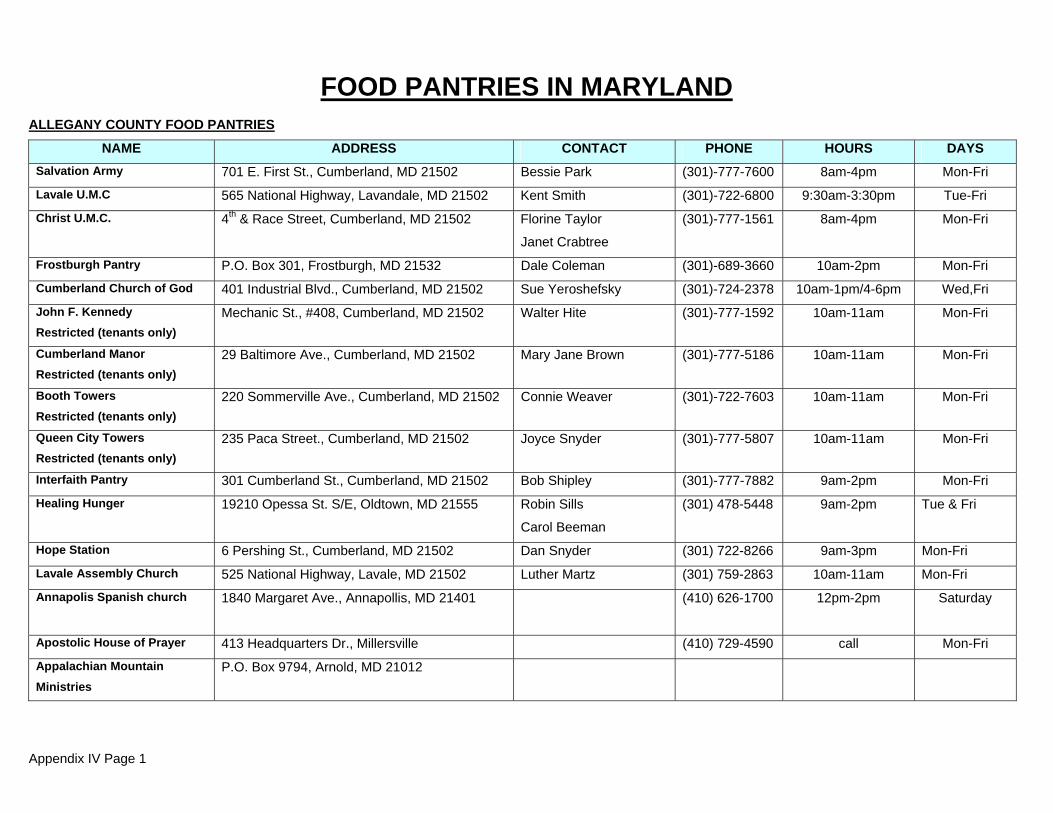
Appendix IV Page 1
FOOD PANTRIES IN MARYLAND ALLEGANY COUNTY FOOD PANTRIES
NAME ADDRESS CONTACT PHONE HOURS DAYS Salvation Army 701 E. First St., Cumberland, MD 21502 Bessie Park (301)-777-7600 8am-4pm Mon-Fri
Lavale U.M.C 565 National Highway, Lavandale, MD 21502 Kent Smith (301)-722-6800 9:30am-3:30pm Tue-Fri
Christ U.M.C. 4th & Race Street, Cumberland, MD 21502 Florine Taylor
Janet Crabtree
(301)-777-1561 8am-4pm Mon-Fri
Frostburgh Pantry P.O. Box 301, Frostburgh, MD 21532 Dale Coleman (301)-689-3660 10am-2pm Mon-Fri
Cumberland Church of God 401 Industrial Blvd., Cumberland, MD 21502 Sue Yeroshefsky (301)-724-2378 10am-1pm/4-6pm Wed,Fri
John F. Kennedy Restricted (tenants only)
Mechanic St., #408, Cumberland, MD 21502 Walter Hite (301)-777-1592 10am-11am Mon-Fri
Cumberland Manor Restricted (tenants only)
29 Baltimore Ave., Cumberland, MD 21502 Mary Jane Brown (301)-777-5186 10am-11am Mon-Fri
Booth Towers Restricted (tenants only)
220 Sommerville Ave., Cumberland, MD 21502 Connie Weaver (301)-722-7603 10am-11am Mon-Fri
Queen City Towers Restricted (tenants only)
235 Paca Street., Cumberland, MD 21502 Joyce Snyder (301)-777-5807 10am-11am Mon-Fri
Interfaith Pantry 301 Cumberland St., Cumberland, MD 21502 Bob Shipley (301)-777-7882 9am-2pm Mon-Fri
Healing Hunger 19210 Opessa St. S/E, Oldtown, MD 21555 Robin Sills
Carol Beeman
(301) 478-5448 9am-2pm Tue & Fri
Hope Station 6 Pershing St., Cumberland, MD 21502 Dan Snyder (301) 722-8266 9am-3pm Mon-Fri
Lavale Assembly Church 525 National Highway, Lavale, MD 21502 Luther Martz (301) 759-2863 10am-11am Mon-Fri
Annapolis Spanish church 1840 Margaret Ave., Annapollis, MD 21401 (410) 626-1700 12pm-2pm Saturday
Apostolic House of Prayer 413 Headquarters Dr., Millersville (410) 729-4590 call Mon-Fri
Appalachian Mountain Ministries
P.O. Box 9794, Arnold, MD 21012
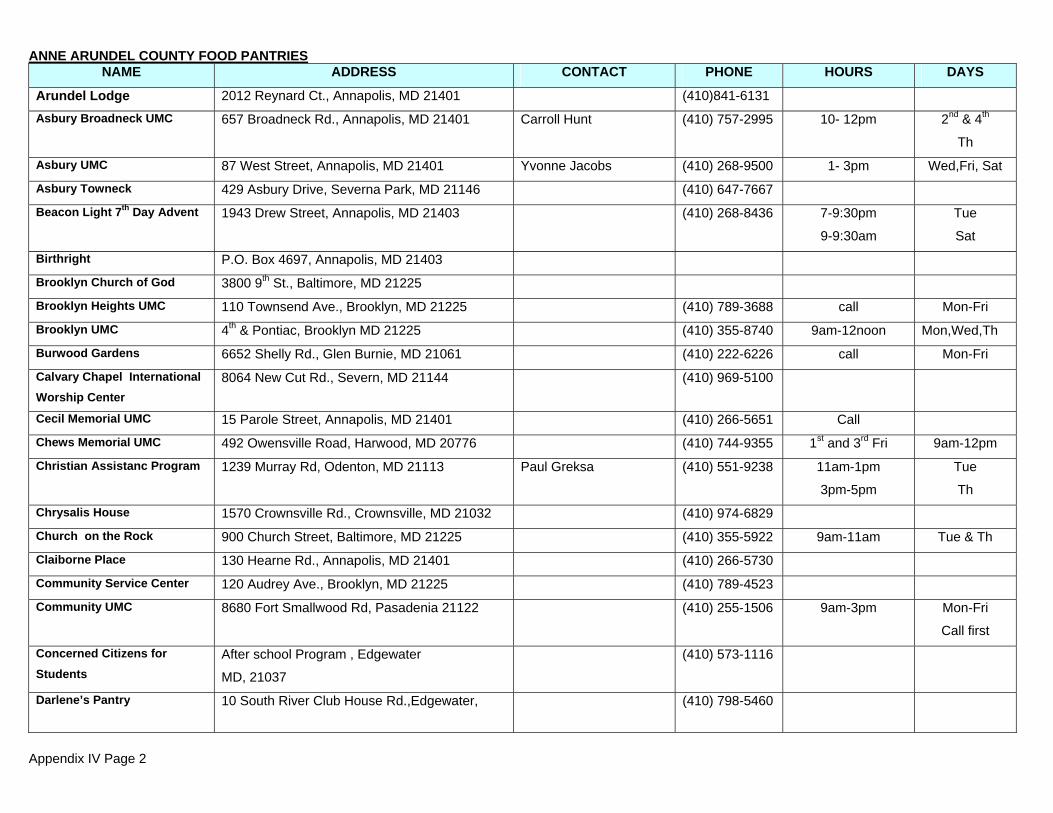
Appendix IV Page 2
ANNE ARUNDEL COUNTY FOOD PANTRIES NAME ADDRESS CONTACT PHONE HOURS DAYS
Arundel Lodge 2012 Reynard Ct., Annapolis, MD 21401 (410)841-6131
Asbury Broadneck UMC 657 Broadneck Rd., Annapolis, MD 21401 Carroll Hunt (410) 757-2995 10- 12pm 2nd & 4th
Th
Asbury UMC 87 West Street, Annapolis, MD 21401 Yvonne Jacobs (410) 268-9500 1- 3pm Wed,Fri, Sat
Asbury Towneck 429 Asbury Drive, Severna Park, MD 21146 (410) 647-7667
Beacon Light 7th Day Advent 1943 Drew Street, Annapolis, MD 21403 (410) 268-8436 7-9:30pm
9-9:30am
Tue
Sat
Birthright P.O. Box 4697, Annapolis, MD 21403
Brooklyn Church of God 3800 9th St., Baltimore, MD 21225
Brooklyn Heights UMC 110 Townsend Ave., Brooklyn, MD 21225 (410) 789-3688 call Mon-Fri
Brooklyn UMC 4th & Pontiac, Brooklyn MD 21225 (410) 355-8740 9am-12noon Mon,Wed,Th
Burwood Gardens 6652 Shelly Rd., Glen Burnie, MD 21061 (410) 222-6226 call Mon-Fri
Calvary Chapel International Worship Center
8064 New Cut Rd., Severn, MD 21144 (410) 969-5100
Cecil Memorial UMC 15 Parole Street, Annapolis, MD 21401 (410) 266-5651 Call
Chews Memorial UMC 492 Owensville Road, Harwood, MD 20776 (410) 744-9355 1st and 3rd Fri 9am-12pm
Christian Assistanc Program 1239 Murray Rd, Odenton, MD 21113 Paul Greksa (410) 551-9238 11am-1pm
3pm-5pm
Tue
Th
Chrysalis House 1570 Crownsville Rd., Crownsville, MD 21032 (410) 974-6829
Church on the Rock 900 Church Street, Baltimore, MD 21225 (410) 355-5922 9am-11am Tue & Th
Claiborne Place 130 Hearne Rd., Annapolis, MD 21401 (410) 266-5730
Community Service Center 120 Audrey Ave., Brooklyn, MD 21225 (410) 789-4523
Community UMC 8680 Fort Smallwood Rd, Pasadenia 21122 (410) 255-1506 9am-3pm Mon-Fri
Call first
Concerned Citizens for Students
After school Program , Edgewater
MD, 21037
(410) 573-1116
Darlene’s Pantry 10 South River Club House Rd.,Edgewater, (410) 798-5460

Appendix IV Page 3
ANNE ARUNDEL COUNTY FOOD PANTRIES Continued
NAME ADDRESS CONTACT PHONE HOURS DAYS Emmanuel Wesleyan Church 3716 West Bay Ave., Baltimore, MD 21225 (410) 355-6650
Faith Assembly of God 250 W. Bayfront Road, Lothian, MD 20711 (410) 257-2085 Call First
Faith Baptist Church 7857 Furnace Branch Rd Glen Burnie MD 21061 Dottie Millham (410) 761-5346 9:30am-3:30pm Mon-Fri
Faith Community 212 B Street, Lothian, MD 20711 (410) 741-0647 9:00-12:00 pm Friday
First Baptist of Eastport 206 Chesapeake Ave., Annapolis, MD 21403 (410) 268-7378 10am-12noon Tue
First Baptist of Edgewater 38 W. Central Ave., Edgewater, MD 21037 Pat Conner (410) 956-3142 9:30am-2:30am Mon-Fri
First Baptist of Annapolis 31 W. Washington St., Annapolis, MD 21401 Booker Williams (410) 268-8987 11am-1pm Sat
Food Link 2666 Riva Road 3rd Floor (410) 222-7853 9am-12pm 1st &3rd wed
every Friday
Gospel Assembly 3555 4th Street, Brooklyn, MD 21225 (410) 354-2770 1pm – 2pm
5:30- 6:45
Sun
Th
Greater Morning Star Apos Church
8069 Telegraph Rd., Severn, MD 21113 (410) 551-9000 10am-12pm Sat
Harundale Presb. 1020 Eastway, Glen Burnie, MD 21060 (410) 766-4338 1pm-2pm
5:30-6:45pm
Sun
Thurs
Heritage Baptist 1740 Forest Drive, Annapolis, MD 21401 Bill Bond (410) 263-6680 8:30am-11:30pm &
1:30-3pm
Mon-Fri
Holly Temple Cathedral 708 Bestgate Rd., Annapolis, MD 21401 (410) 266-7946 Call for hours
Housing Commission of Ann Arundel County
7477 Baltimore-Annapolis Blvd., Glen Burnie, MD
21060
(410) 222-6200
Hurting Helping People 7629 B Spencer Rd., Glen Burnie, MD 21060 (410) 766-7690 Call for Hours
Igles Hispana Alpha and Omega
16010 Annapolis Rd., Bowie, MD 20715 Roland Rosales (301) 262-6266 3pm-5pm Sunday
Inlesia Hispana Emmanuel 919 Cedar Park, Annapolis, MD 21401
John Welsley UMC 6922 N. Richie Hwy. GB , MD 21061 (410) 766-6981 Call
Lighthouse of Southern MD 300 Fairhaven Rd., Tracey’s Landing, MD 20779 (410) 257-6775 Call

Appendix IV Page 4
ANNE ARUNDEL COUNTY FOOD PANTRIES Continued
ADDRESS CONTACT PHONE HOURS DAYS Lloyd Keaser 229 Berlin Ave., Baltimore, MD 21225 (410) 7894181 10am-3:30pm Mon, Wed, Fri
Magothy UMC 3703 Mountain Rd., Pasadena, MD 21122 (410) 255-2420 Sat 11am -12pm
Mison Christiana Casa Dios 4902 Ritchie Hwy., Brooklyn Park, MD 21225 (410) 789-3991 11am-1pm
3pm-5pm
Tuesday
Thurs
Mount Olive AME Church 2 Hicks Avenue, Annapolis, MD 21401 (410) 266-5090 Call
My Brothers Pantry P.O. Box 223, Arnold, MD 21012 Barbara Lewis (410) 757-5190 Call
NCEON 304 5th St., Glen Burnie, MD 21061 (410) 766-1826 10am-3:30pm Mon, Wed, Fri
New Life Church 48 Joyce Lane, Aronld, MD 21012 (410) 320-6360
On Our Own 162 West St., Annapolis, MD 21401 (410) 295-1224 9am-4pm Mon-Fri
Our Lady of Perpetual Help 515 Loch Haven Rd., Edgewater, MD 21037 (410)798-5161 10am-12noon Wed-Fri
Our Lady of Cheasapeake 8325 Venitor Road, Pasadena, MD 21122 (410) 255-3677
Pasadena Church of God in Christ
Old Mill & Logan Rd. Pasadena, MD 21122 (410) 255-8635 Call
Payne Memorial Church 7901 Brockbridge Rd., Jessup, MD 20794 (410) 799-5150
Praise Center Full Gospel Church
2622-1 Annapolis Rd. Severn, MD 21144 (410) 551-8771
Touch Thru Me Ministries/ Praise Center Full Gospel Church
2611-1 Annapolis Rd. Severn MD 21144 (410) 551-8771
Rapture Church 1834 George Ave., Annapolis, MD 21401 (410) 263-2601 2pm-7pm Mon-Sat
Regeneration Church of Deliverance, Inc.
435 Es. Pataspaco Ave., Baltimore, MD 21225 (410) 355-8440
RESPECT Foundation 640 South River Landing, Edgewater, MD 21037 (410) 571-7992 9am-12pm Mon
Restoration Community Dev. 1812 Virginia Ave., Annapolis MD 21401 (410) 267-0609 9am-12pm Sat
Riva Trace Baptist 2990 Riva Trace Pkwy., Annapolis, MD 21401 (410) 224-2690 9am-12pm 1st Sat
S.C.A.N 5757 Sol. Island Road, Lothian, MD 20711 (410) 867-2838 Call

Appendix IV Page 5
ANNE ARUNDEL COUNTY FOOD PANTRIES Continued
NAME ADDRESS CONTACT PHONE HOURS DAYS Salvation Army 351 Hilltop Lane, Annapolis, MD 21401 Renne Powell (410) 263-4091 8am-12pm
12:30pm – 4pm
Mon-Fri
Salvation Army 511 So. Crain Hwy., Glen Burnie, MD 21061 Melaine Thompson (410) 768-0477 9am-4pm Mon-Fri
Samaritan House 2610 Green Briar Ln., Annapolis, MD 21401 (410) 269-5605 10am-12pm 2nd and 4th
Thursday
Sarah’s House 2015 20th Street, Ft. Meade MD 20755 (410) 551-7722 1pm-3pm Wed, Fri, Sat
Spanish Church in Brooklyn P.O. Box 1977, Glen Burnie, MD 21061 Call
South County Emergency Baby Pantry
220 Owensville Rd, West River, MD 20778 (410) 867-0346 Baby Pantry only
Call
SPAN 400 Benfield Rd., Severna Park, MD 21146 Cindy Berkhart (410) 647-0889 10am-2pm
5pm-7pm
Mon-Fri
Mon only
St. Bernadette’s Parish Winter Relief Program (410) 969-2787 9am-11am Tues & Thurs
St. Elizabeth Ann Seton 1800 Seton Dr., Crofton, MD 21114 (410) 721-5770 9am-4pm Mon-Fri
St. John the Evangelist 689 Ritchie Hwy., Severna Park, MD 21146 (410) 647-4884 10am-12pm
2pm-4pm
Tue & Thu
St. James Apostolic 7566 E. Howard Rd., Glen Burnie, MD21061 Irene Pitts (410) 761-9272 12pm-3pm 4th Tue
St. Marks 1440 Dorsey Rd., Hanover. MD 21076 Dennard (410) 859-5352 8am-10am last Sat
Vneyard Christian Fellowship of Central Maryland
255 Najoies Rd., Millersville, Md 21108 (410) 987-3440
Wayman Good Hope 100 Hoyle Lane, Severna Park, MD 21146 Irene Johnson (410) 647-0468 call
Woodside Garden Apartments
713-D Newtowne Dr., Annapolis, MD 21401 (410) 269-6563
YMCA of Annapolis 1517 Ritchie Hwy, Arnold, MD 21012 (410) 626-7800 2:30pm-5:30pm Tue-Thu
Wilson Memorial Church Rt. 3 North, Gambrills, MD 21054 Dorothy Geathers (410) 721-1482 9am-12pm Mon

Appendix IV Page 6
BALTIMORE CITY FOOD PANTRIES NAME ADDRESS CONTACT PHONE HOURS DAYS
Abundant life II 5110 Balto Natl. Pike apt 4, Baltimore, MD 21229 Thomas Hill (410) 947-6343 9am-12pm Mon
Adams Chapel AME 3813 Egerton Rd., Baltimore, MD 21215 Arlean Burton (410) 542-6200 11am-1pm Wed, Sat
Agape House 222 N. Carrollton Ave., Baltimore, MD 21223 Rev. Robinson (410) 728-2222 12pm-6pm Wed, Sat
AMES Memorial AME 615 Baker St., Baltimore, MD 21217 Jacqueline Johnson (410) 523-5556 11am-1pm Tue
Bernard E. Mason 2121 Windsor Gardens, Baltimore, MD 21207 Lillie Ziegler (410) 448-1311 11am-4pm Thurs
Bethany Baptist Church 2616 Ridgeley St., Baltimore, MD 21230 Sanra White (410) 539-5029 9am-12pm Mon-Fri
Bethel Church of God 301 W. 28th Street, Baltimore, MD 21211 Charletta Williams (410) 235-0160 9am-12pm
12pm- 3pm
Fri
Sun
Carter Memorial Emergency 745 West Fayette St., Baltimore, MD 21201 Vernell Lewis (410) 752-6123 10am-2pm Thu
Central Baptist Church 2035 West Baltimore St., Baltimore, MD 21223 Rev. Matthew Braxton (410) 233-8558 12pm-2pm Sat
Chase House 1027 Cathedral St., Baltimore, MD 21201 Joan Weston (410) 539-6155 10am-2pm Fri
Christ Deliverance Church 711 Walnut Ave., Baltimore, MD 21229 Rev. Martin Jacobs (410) 945-8700 12pm-6pm M, W, F, S
Christian Memorial Church 2001 West North Ave., Baltimore, MD 21217 Barbara Grimes (410) 728-0464 10am-12pm Sat
Church Of Jesus Christ 2880 Hillen Road, Baltimore, MD 21218 James Gamble (410) 366-8010 10am-3pm Mon, Thu
Claremont Homes 4312 Clareway, Baltimore, MD 21213 Anna Warren (410) 485-4836 10am-2pm Mon, Wed, Fri
Collington Square 1211 N. Chester St. Baltimore, MD 21213 Gloria Etheridge (410) 342-6740 12pm-4:30 Wed
Concord Baptist Church 5204 Liberty Heights Ave., Baltimore, MD 21207 Hazel Guin (410) 367-1117 10am-11:30am 4th Sat
Corpus Christi 703 Whitelock St., Baltimore, MD 21217 Mariano (410) 523-5822 1:30pm-3pm Thu
Deliverance Manna 3538 Old York Road, Baltimore, MD 21218 Jerry Wallace (410) 947-4536 6pm-8pm
10am-12pm
Thu
Sat
Dept. of Housing Neighborhood
22 S. Calhoun, Baltimore, MD 21223 Deinia (410) 566-6658 10am-3pm Mon
Donald Bentley Food Pantry 2405 Loch Raven Blvd., Baltimore MD 21218 Ellen Bentley (410) 662-9287 9am-12:30pm Sat
Dukeland Development 1601 Gertrude St., Baltimore, MD 21216 Hattie Rhames (410) 233-6112 12pm-8pm Mon, Fri
East Baltimore Church of God 800 South Oldham St. Baltimore, MD 21224 Welton Hunt (410) 327-0177 10am-3pm Sat, Sun

Appendix IV Page 7
BALTIMORE CITY FOOD PANTRIES Continued NAME ADDRESS CONTACT PHONE HOURS DAYS Emergency Food Relief Fund 1401 Pennsylvania Ave., Baltimore MD 21217 Leslie Wood (410) 523-7000 11:30am-1pm Wed.
First Apostolic Faith Church 27 S. Caroline St., Baltimore, MD 21231 Beatrice Bridgefort (410) 327-1181 2:30pm-4:30pm Sat
First Charity Baptist Church 611 N. Aisquith St. Baltimore, MD 21202 Rebecca Pugh (410) 732-0076 11am-3pm Fri-Sun
First Emmanuel Baptist Church
2209 Park Ave, Baltimore, MD 21217 Bertha Creighton (410) 523-6787 12pm-3pm Tue, Thu
First Philadelphia Baptist 2120 Greenmount Ave., Baltimore, MD 21218 Lucy Washington (410) 243-5625 10:30am-12:30pm Thu-Fri
Franciscan Center, Inc. 2212 Maryland Ave., Baltimore, MD 21218 Brother Finbar (410) 467-5340 10am-2pm Mon-Fri
Gillis Memorial 3939 Reisterstown Rd., Baltimore, Md 21215 Rev. Helen Samuel (410) 396-7740 9am-1pm Mon, Wed, Fri
Gospel Messenger 2610 Keyworth Ave., Baltimore, MD 21215 Rev. Geraldine S.
James
(410) 467-0113 9am-1pm Thu
Gospel Tabernacle 3100 Walbrook Ave., Baltimore, MD 21216 Lillian Royster (410) 298-6919 11am-3pm Sun, Mon, Fri
Grace Memorial 1100 N. Eden St., Baltimore, MD 21213 Rev. Irwin Pope (410) 563-2355 12pm-1:30pm Tue
Greater Zion Church 301 No. Gilmore Ave., Baltimore, MD 21223 Rev. Amos Burgess (410) 788-0547 1pm-4pm Wed, Fri
Greenhill Apts. 2501 Violet Ave, #710 N., Baltimore, MD 21215 Ethel Lee (410) 383-9171 10am-12pm Wed.
Hampden UMC 3449 Falls Rd., Baltimore, MD 21211 Elizabeth Green (410) 243-1997 9am-12pm Mon, Wed
Harford Senior Center 4920 Harford Rd., Baltimore, MD 21214 Jessie Martek (410) 426-4009 10am-2pm Mon-Fri
Harvest Christian 2601 Pennsylvania Ave., Baltimore, MD 21217 Mary Coleman (410) 523-0143 10am-12pm Wed
Harvey Johnson Towers 1510 WE. Mosher St., Baltimore, MD 21217 Juanita Leigh (410) 462-6205 9am-2pm Sat
Healthy Start 610 N. Chester St., Baltimore, MD 21205 Jacqueline Toppins (410) 675-2125 8:30am-4:30pm Mon-Fri
Healthy Start 1622 N. Carey St., Baltimore, MD 21217 Gloria Johnson (410) 728-7539 8:30am-4:30pm Mon-Fri
Helping Hands Food Pantry 1911 Belair Rd., Baltimore, MD 21213 Rosalie Branch (410) 342-1310 9am-1pm Sat
Homestead UMC 1500 Gorsuch Ave., Baltimore, MD 21218 Shirley Dean (410) 243-4419 11:30am 2pm Tue Household of Faith Missionary 4811 Belair Rd., Baltimore, MD 21206 Rev. Harrison Geter (410) 485-5375 12pm-2pm Sat
Human services Division- 4th 1133 Pennsylvania Ave., Baltimore, MD 21201 Josephine Battaglia (410) 396-0893 9am-3pm Tue-Fri
Israel Baptist Outreach 1211 N. Chester St., Baltimore, MD 21213 Shirley Eaddy (410) 732-3494 11am-2pm
5pm-7pm
Mon, Tue, Thu
Wed, Fri

Appendix IV Page 8
BALTIMORE CITY FOOD PANTRIES Continued NAME ADDRESS CONTACT PHONE HOURS DAYS JB Outreach Ministries 301 N. Stricker St., Baltimore, MD 21223 James Bivens (410) 644-5822 10am-2pm 2nd & 4th Th
Jesus Saves Ministries 1625 N. Hilton St., Baltimore, Md 21216 Barbara Davis (410) 362-1911 12pm-1pm Wed-Sat
Johnston Square Community 841 E. Chase St., Baltimore, MD 21202 Margaret Hawkes (410) 685-5950 1pm-4pm Mon-Fri
Jonah House 1301 Moreland Ave., Baltimore, MD 21216 Susan Crane 410-233-6238 7am-6pm Tuesday
Judah Worship Center 2000 Frederick Ave., Baltimore, MD 21223 Pastor Morton (410) 466-5729 10am-2pm Wed, Sat
Laurens House 1330 Laurens St., Baltimore, Md 21217 Rosalie (410) 728-5515 1pm-6pm Mon,Wed,Fri
Lexington Poe 206 N. Fremont Ave., Baltimore, MD 21201 Lorraine Ledbetter (410) 396-0936 9am-3pm Tue-Fri
Love of God 321 N. Fulton St., Baltimore, MD 21229 Bettie Williams (410) 362-2232 11am-2pm Wed.
Macedonia Baptist Church 718 W. Lafayette St., Baltimore, MD 21217 Gladys Augustus (410) 669-5776 10am-2pm Tue
Manna Ministry of Greater Gethsemane
2511 E. Preston St., Baltimore, MD 21213 Bertha Bell (410) 675-2267 10am-12pm Thu
Maryland Church of God 5100 Denmore Ave., Baltimore, MD 21215 Ethel Lee (410) 367-2768 Mon-Fri 12pm-5pm
Mason Memorial 2608 Frederick Ave., Baltimore, MD 21223 Mary Curtis (410) 947-4466 9am-12pm Wed
Metropolitan Church Pantry 4815 Eastern Ave., Baltimore, MD 21224 Grace Weber (410) 633-5516 9am-10am Sat
Mount Moriah Baptist Church 2201 Garrison Blvd., Baltimore, MD 21216 Wilhelmina Davis (410) 945-3575 8:30am-12:30pm Mon
Mt. Lebanon Baptist Church 2812 Reisterstown Rd., Baltimore, MD 21215 Roberta McKinney (410) 669-1800 10am-12pm Wed, Sat
Mt. Calvary Star Baptist Church
1725 N. Milton Ave., Baltimore, MD 21213 Alex Young (410) 276-1431 11am-2pm Sat, Sun
Mt. Pleasant Church 6000 Radecke Ave., Baltimore, MD 21206 Aretha Allen (410) 325-3080 10am-2pm Mon,Wed,Fri
Mt. Tabor Baptist 1719 E. Oliver St., Baltimore, MD 21213 Rev. Forrest (410) 327-1740 10am-2pm Tuesday
New Fellowship Christian Community
5202 Park Heights Ave., Baltimore, MD 21215 Ann Quarles (410) 367-5766 9am-12:30pm Wed.
New Gabriel Baptist Church 1041 Wilmington Ave., Baltimore, MD 21223 Rev. Dykes (410) 840-3363 8am-12pm Sun
New Hope Church of God 6601 Cleveland Ave., Baltimore, MD 21224 Cynthia (410) 282-2219 10am-6pm Mon-Fri
New Life Evangelical Baptist 2417 E. North Ave., Baltimore, MD 21213 Rev. Williams (410) 675-2178 9am-4pm Mon-Fri
New Life Fellowship 559 Robert St., Baltimore, MD 21217 Rita Yarborough (410) 466-7306 11am-1pm Thursday
New Mount Zion Baptist Church
817 N. Mount St., Baltimore, MD 21217 Peggy Mitchell (410) 523-9082 10am-12pm Wed-Sat

Appendix IV Page 9
BALTIMORE CITY FOOD PANTRIES Continued NAME ADDRESS CONTACT PHONE HOURS DAYS
New Shiloh Baptist Church 2100 N. Monroe St., Baltimore, MD 21217 Sue Wilson (410) 523-5306 1pm-2pm Sat
New Zion Hill Baptist 2432 E. North Ave., Baltimore, MD 21213 Pastor Barnes (410) 558-0950 10am-1pm Fri & Sat
North Baltimore CARES 5502 York Rd., Baltimore, MD 21212 Barbara Metz (410) 433-2442 9am-11am Mon, Thu
Oaks at Liberty 3501 Howard Park, Baltimore, Md 21207 Kimberly White (410) 466-9267 2pm-4pm Friday
Park Heights Community Center
4917 Park Heights Ave., Baltimore, MD 21215 Shirley Oliver (410) 578-1800 10am-4pm Mon-Fri
Paul’s Place Outreach Center 1118 Ward St., Baltimore, MD 21230 Bill McLennan (410) 625-0775 8:30am-11am Mon-Fri
Payne Memorial Church 1714 Madison Ave., Baltimore, MD 21216 Margaret Solomon (410) 462-3800 10am-2pm Mon, Tue, Wed,
Thu
People’s Church of Baltimore 230 N. Fulton Ave., Baltimore, MD 21223 Coretha Jones (410) 945-7923 9am-12pm Sat
Perkins Square Baptist Church
2500 Edmondson Ave., Baltimore, MD 21223 Edythe Gregory (410) 945-0445 2pm-5pm Mon-Fri
Pillar of Truth 2522 Greenmount Ave., Baltimore, MD 21218 Lonnia Perry (410) 243-1141 9am-5pm Mon-Sat
Pitts Outreach 1142 N. Fulton Ave., Baltimore, MD 21217 Rose Long (410) 728-8782 2:30pm-3pm Wed, Thu
Pleasant Grove Food 214 S. Loudon Ave., Baltimore, MD 21229 Charlotte (410) 646-1462 10am-2pm Mon, Thu
Pleasant View Gardens 201 N. Aisquith St., Baltimore, MD 21202 Darrel Roaster (410) 396-9006 10am-2pm Fri
Poppleton Co-op 838 W. Fairmont Ave., Baltimore, MD 21201 Jackie Brown (410) 532-1517 11am-3pm Mon-Fri
Prisoners Aid 204 25th Street, Baltimore, MD 21218 Michael Brown (410) 662-0359 10am-6pm Wed
Quality of Life Corp 2630 Harford Rd., Baltimore, MD 21218 Ismenda Hendrix (410) 235-3972 10am-2pm Mon, Thu
Ray of Hope 3501 Parkside Dr., Baltimore, Md 21236 George Crutchfield (410) 661-9428 10am-2pm Tuesday
Refuge Way of Cross Church 4301 Old York Rd., Baltimore, MD 21212 Frances Wellborn (410) 435-8339 12pm-2pm Wed
Royal Light Outreach 1562 N, Fulton Ave., Baltimore, MD 21217 Al Lawson (410) 566-2940 11am-1pm Tue, Thu
Salvation Army 814 Light St., Baltimore, MD 21230 Crystal White (410) 783-2920 8:30am-12pm Mon-Fri
Sharon Baptist 1373 N. Stricker St., Baltimore, MD 21217 Elaine Brown Page (410) 669-6667 10am-12pm 3rd Sat
Second Shiloh 1355 Homestead St., Baltimore, MD 21218 Wanda Hudson (410) 366-1025 11am-1pm Tues-Thurs
Solomon Temple Baptist Church
1738 Appleton Street, Baltimore, MD 21217 Rev. Thomas Sledge (410) 566-2106 10am-2pm Mon-Fri

Appendix IV Page 10
BALTIMORE CITY FOOD PANTRIES Continued NAME ADDRESS CONTACT PHONE HOURS DAYS
Southwest Emergency Food Program
31 S. Payson St., Baltimore, MD 21223 Eugene Holt (410) 396-1740 9am-3pm Tues-Thurs
South Baltimore Emergency 110 E. West St. Baltimore, MD 21230 Elizabeth Baer (410) 752-1336 10am-1pm Mon-Fri
Southeast Neighborhood Service Center
3411 Bank St., Baltimore, MD 21224 Carlene Bullard (410) 545-6515 10am-2pm Mon, Wed, Fri
St. Abraham Baptist Church 1124 W. North Ave., Baltimore, MD 21217 Rev. Clarence Yerby (410) 383-6919 9:30am-1pm 1sr& 3rd Wed.
St. Ambrose 3445 Park Heights Ave., Baltimore, MD 21215 Inez (410) 225-0870 9am-4pm Mon-Fri
St. Ann Outreach Ctr. 528 E. 22nd St., Baltimore, MD 21218 Sister Jean (410) 235-8169 9am-11am
8am-12pm
Tue
Sat
St. Bernadines’s Catholic 3812 Edmondson Ave., Baltimore, MD 21229 Deacon Phil (410) 362-8664 10am-12pm Tue, Wed, Thu
St. Cecilia 3300 Clifton Ave., Baltimore, MD 21216 Robert Viner (410) 624-3600 10am-12pm Wednesday
St. Elizabeth Food Pantry 2 N. Belnord Ave., Baltimore, MD 21224 Lucy D’Pinto (410) 675-8260 11:30am-1:30pm Tue, Fri
St. Gregory the Great 1542 N. Gilmore St., Baltimore MD 21217 Gloria Williams (410) 523-0061 10am-2pm Mon-Fri
St. Luke Temple 1821 N. Smallwood Street, Baltimore, MD 21217 Edna Evans (410) 225-9409 5pm-9pm
7pm-9pm
Tue
Fri
St. Mark’s UMC/Bread of Life 3900 Liberty Heights Ave., Baltimore, MD 21207 Richard Wright (410) 542-5338 5:30pm7pm Wed, Fri
St. Micheal Outreach 1922 E. Lombard St., Baltimore, MD 21231 Lisa Knickmeyer (410) 732-2176 9am-12pm Tue, Wed, Thu
St. Paul Baptist Church 3101 The Alameda, Baltimore, MD 21218 Thelma Gentry (410) 366-0096 10am-2pm
10-2pm/ 5pm-7pm
Mon
Thu
St. Vincent’s Emergency Services
120 N. Front St., Baltimore, MD 21202 Jeanne Cole (410) 962-5078 12:30pm-2pm Mon
St. Wenceslaus 2100 E. Madison St., Baltimore, MD 21205 Audrey Wesson (410) 675-3320 11am-1pm Wed, Thu
Temple House 812 N. Fulton Ave., Baltimore, MD 21217 Stanley Butler (410) 462-1876 10am-12pm Tue, Sat
The Tree of Life Bible Church 516 N. Schroeder St., Baltimore, MD 21223 Lassiter Basket (410) 542-1928 3pm-7pm Tue
Total Man Outreach 1116 N. Gilmore St., Baltimore, MD 21217 Willie Williams (410) 728-8151 10am-12pm Sat
Trinity AME Church 2140 E. Hoffman St., Baltimore, MD 21213 Nancy Woodhouse (410) 342-2320 11am-1pm Thu
Trinity Apostolic Faith 3600 N. Rogers Ave., Baltimore, MD 21207 Elizabeth Milburn (410) 448-1215 9:30am-12pm Sun

Appendix IV Page 11
BALTIMORE CITY FOOD PANTRIES Continued NAME ADDRESS CONTACT PHONE HOURS DAYS
Trinity Presbyterian 3200 Walbrook, Baltimore, Md 21216 Camilla Martin (410) 383-9633 1pm-3pm Wednesday
United House of Prayer 3401 Edgewood Rd., Baltimore, MD 21215 Edward Williams (410) 542-5300 9am-6pm Sat, Sun
Unity UMC Church 1433 Edmonson Ave., Baltimore, MD 21223 Clara Bowser (410) 728-4826 10am-12pm Thu, Fri
Walker Co-Op 1 Cooperative Dr., Baltimore, MD 21212 Charles Cluxton (410) 377-0200 10am-12pm Tue
Wayland Baptist Church 3200 Garrison Blvd., Baltimore, MD 21216 John Wells (410) 664-2774 10am-12pm Mon, Tue
Whitestone Baptist Church 3001 Baker St., Baltimore, MD 21216 Frank Jones (410) 947-1863 11:30am-1pm Wed
Wyman House Pantry 123 West 29th St., Baltimore, MD 21218 Ester Hall (410) 243-4676 12pm-8pm Mon-Fri
Zion Baptist Church 1700 N Caroline St., Baltimore, MD 21213 Mary James (410) 837-4181 9:30am-12pm Mon-Fri
Zion Outreach Services Inc. 1221 Argyle Ave., Baltimore, MD 21217 Rose Jones (410) 383-1825 11-1:30pm Tue, Thu

Appendix IV Page 12
BALTIMORE COUNTY NAME ADDRESS CONTACT PHONE HOURS DAYS
Alliance Inc 9201 Philadelphia Rd., Balto., MD 21237 Sabrina (410) 574-7700 8:30am-5pm Mon-Fri
Back River United Methodist 544 Back River Neck Rd., Baltimore, MD 21221 Joy Smell (410) 686-0412 By appointment
Balto. Co. Dept. of Aging/ Indiv. & Family Svcs. Div.
611 Central Ave., Towson, MD 21204 (410) 887-4141
(410) 887-2022
Restricted
Balto. Co. Health Dept. Geriatric Services
1 Investment Pl. 11th Fl., Towson, MD 21204 Pat Smith (410) 887-2754 8:30am-4:30pm Mon-Fri
Christian Fellowship 2929 Sollers Pt. Rd. Baltimore, MD 21222 Sue Brads (410)477-5664 10am-4pm Sat
Community Asst. Network Inc 7701 Dunmanway, Dundalk MD 21222 Charles Bosley (410) 285-4674 9:30am-11:30am
1:30pm-3:30pm
Mon-Fri
Community Crisis Ctr./ Reisterstown Utd. Meth. Ch.
725 Main St., Reisterstown, MD 21136
15 Woodsman Ct., Owings Mills, MD 21117
Alan Mello (410) 526-7111 10am-1pm Mon-Fri
Dundalk Church of the Brethren
2660 Yorkway Dundalk, MD 21222 Medie McLaughten (410)284-0647 12:15pm-2pm Wed
Eastern Interfaith Outreach 531 Eastern Bend, Essex, MD 21221 Merle Bolger (410) 391-6181 10am-2pm Mon,Wed,Fri
Edgemere Church of God 7414 Ellen Ave., P.O. Box 6686, Balto. MD
21219
Karen Knight (410) 686-2593 9am-5pm Sun,Wed,Th
Essex Utd. Methodist Church 524 Maryland Ave., Balto., MD 21221 Carole Krach (410) 686-2867 10:30am-12:30pm Tue,Th
First Baptist Church of Essex 911 Mace Avenue, Balto., MD 21221 Bill Ledford
Russel Purkey
(410) 679-5901
(410) 686-8499
9am-12noon Mon-Th
Friendship Baptist Church 307½ Avondale Rd., Balto., MD 21222 Zelma Strawther (410) 282-5284
(410) 284-9603
Restricted
Good Samaritan Ministry Union Bethel AME Church
8615 Church Lane, Randallstown, MD 21133 Mary Johnson (410) 922-3286
(410) 655-0948
vary by appt.
Greater St. John BC 103 Carver Road, Baltimore, MD 21222 Lillian Branch (410) 284-6048 Restricted
Helping Hands Food Pantry 7901 Bradshaw Rd., P.O. Box 192, Upper Falls,
MD 21156
Gilbert Thompson (410) 592-7676 9am-12noon Mon-Fri

Appendix IV Page 13
BALTIMORE COUNTY FOOD PANTRIESContinued NAME ADDRESS CONTACT PHONE HOURS DAYS
Hopkins Village 3 Brett Court, Balto., MD 21212 Nona Lehr (410) 391-0473 Restricted
Key Point Health Services Inc Psychiatric Rehab. Prog.
7701 Dunmanway, Baltimore, MD 21222 Erica Efterkhari (410) 282-2363
x26
Vary Vary
Ironworkers-Local #16 Union Hall
2008 Merrin Ave., Balto., MD 21222 Tony Bennett
Willard Morgan
(410) 686-5515
(410) 285-2246
7am-4pm Mon-Fri
J & C Unity Christian Church 101 Back Riverneck Rd., Balto., MD 21221 Eartha Harris (410) 686-2752 Vary Mon-Fri
Life Outreach 8334 Liberty Rd. Baltimore, MD 21244 Dr. Patricia Snow (410)385-2204 10am-2pm Wed
Liberty Assistance Ctr. 9019 Liberty Rd., Randallstown, MD 21113 Jim Rollins (410) 655-4216 10am-2pm Mon,Wed,Th,
Fri
Manna 914 Essex Rd. Essex, MD 21221 Bob Nerthling (410)687-7354 9am-5pm Everyday
Mount Olive Baptist Church 651 Mount Olive Rd., Balto., MD 21222 Wanda Barnes/A. Lewis (410) 282-0226 10am-5pm Sun-Sat
Mount Olivet UM Church 823 Edmondson Ave., Catonsville, MD 21228 Milton Gaines (410) 788-4361 Vary Tue,Th,Sat
New Horizon Baptist Church 2200 St. Luke Lane, Baltimore, MD 21207 Rev. Lambert (410) 655-2230 8am-4pm Sat
New Macedonia Bapt. Church 6930 Liberty Rd, Balto. MD 21207 (pantry)
PO Box 31861, Balto., MD 21207 (mailing)
Casandra Smith
Willie Belleflood
(410)277-9909 9am-6pm
7pm-10pm
1pm-6pm
Sun
Wed
Sat
Perry Hall United Meth. Ch. 9515 Belair Rd., Balto., MD 21236-1599 Linda Diller (410) 256-6479 9am-5pm Mon-Fri
Rising Sun Food Pantry 2211 St. Lukes Lane Joyce Nicholson call Sat,Sun
Rock of Ages Church of God 310 South Marlyn Ave., Baltimore, MD 21221 Robin Burch (410) 918-9388 9am-2pm Mon-Fri
Shining Star 111832 Eastern Ave., Baltimore, MD 21220 Yuonne Howell 10am-2pm Mon-Fri
St. Luke’s Lutheran Church 1803 Dundalk Ave., Balto., MD 21222 Jane Rossi (410) 633-5374 9am-2pm Tue,Th,Fri
St. Luke’s United Meth. Ch. 2119 Gwynn Oak Ave., Woodlawn, MD 21207 Margaret Edwards (410) 944-4111
(410) 944-5878
9am-12noon Mon-Fri
St. Peter Ev. Luth. Church 7834 Eastern Blvd., Balto., MD 21224 Namoi Flink (410) 931-6739 9am-1pm Mon-Fri
St. Stephen’s AME Church 1601 Old Eastern Ave., Baltimore, MD 21221 Sara Albright (410) 686-9392 Varies
St. Ursula 8801 Harford Rd. baltimore, MD 21234 Richard Keys (410)665-2111 9:30am-12pm Wed

Appendix IV Page 14
BALTIMORE COUNTY FOOD PANTRIESContinued NAME ADDRESS CONTACT PHONE HOURS DAYS
Southwest Emergency Svcs. 1201 Maple Ave., Balto., MD 21227 Betty Okonski (410) 247-8154
(410) 719-0722
9am-12noon
6pm-8pm
Mon-Fri
1st Wed mt only
Towson United Methodist Church-Food Pantry
501 Hampton Ln., Towson, MD 21286 Catherine Ritter (410) 823-6511
(410) 823-3689
6pm-7:30pm last Th mt.
Water’s Edge Baptist 3483 Liberty Parkway, Baltimore, 21222 Jean Lacey (410)282-1974 9am-5pm Mon-Wed
CALVERT COUNTY FOOD PANTRIES
NAME ADDRESS CONTACT PHONE HOURS DAYS Brooks United Methodist Emerg. Food Pantry
5550 Mackall Rd. St. Leonard Marguerite Johnson (410)586-1295 9am-12pm Tue &t thur
Calvert Churches Community 4132 Old Town Road, Huntingtown, MD 20639 Carl Beathy (410) 257-1342 10am-1pm Mon-Wed
Catholic Charities P.O. Box 779, Prince Frederick MD 20678 Peggy Lawrence (410) 535-0309 9am-5pm Mon-Fri
Dept. of Social Services 200 Duke St. Prince Frederick MD 20678 Wendie Walton (410) 535-8700 8am-5pm Mon-Fri
Emmanual Seventh Day Adventist
105 Kingsberry Ct. St. Leonard Catherine Tyler-King (410)535-2275 9am-2pm Tue, Thrus,
Sun
SMILE P.O. Box 1276, Solomons, MD 20688 Maarja Gandy (410) 326-0009 9am-5pm Mon-Fri
Randle Cliff Community Church Food Pantry
4311 Randle Way, Chesapeake Beach Karen Paguette (410)257-3884 10am-12pm Sat
CAROLINE COUNTY FOOD PANTRY
NAME ADDRESS CONTACT PHONE HOURS DAYS St. Martin’s Barn 14376 Benedictine Lane Ridgely, MD 21660 Sister Frances Walker (410) 634-1140 8:30am-12pm
6pm-8pm
By appointment
Tue,Fri
Wed
Mon & Th
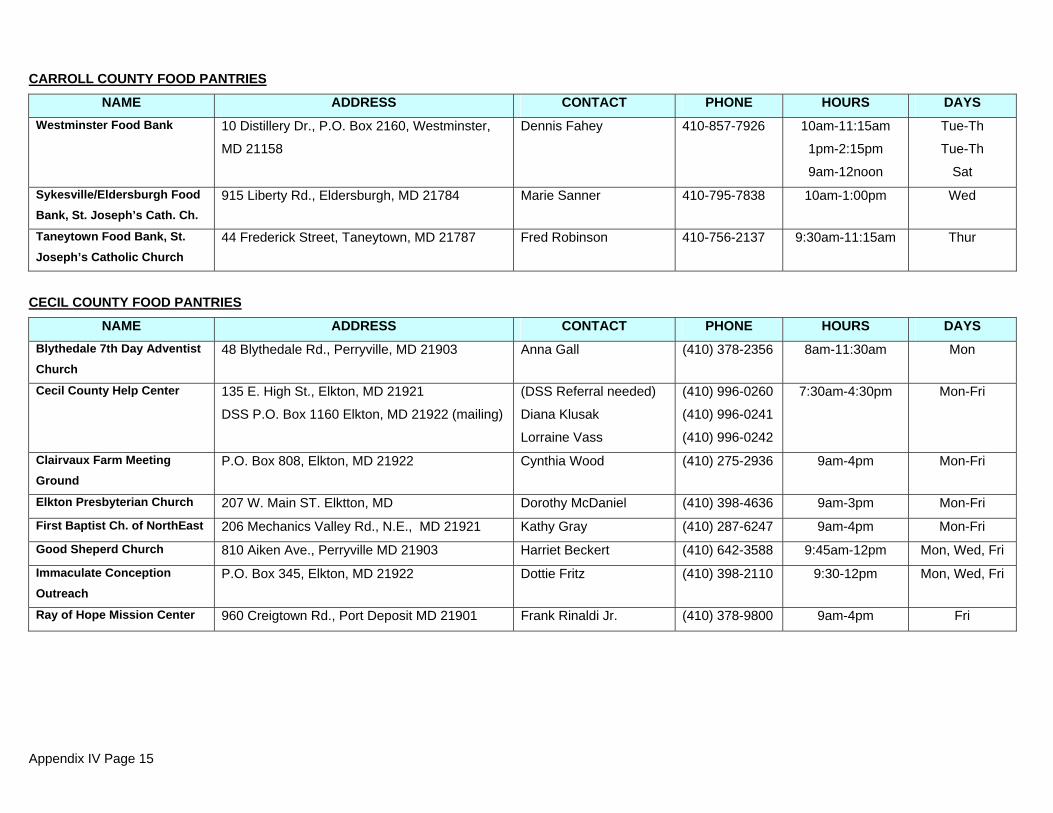
Appendix IV Page 15
CARROLL COUNTY FOOD PANTRIES
NAME ADDRESS CONTACT PHONE HOURS DAYS Westminster Food Bank 10 Distillery Dr., P.O. Box 2160, Westminster,
MD 21158
Dennis Fahey 410-857-7926 10am-11:15am
1pm-2:15pm
9am-12noon
Tue-Th
Tue-Th
Sat
Sykesville/Eldersburgh Food Bank, St. Joseph’s Cath. Ch.
915 Liberty Rd., Eldersburgh, MD 21784 Marie Sanner 410-795-7838 10am-1:00pm Wed
Taneytown Food Bank, St. Joseph’s Catholic Church
44 Frederick Street, Taneytown, MD 21787 Fred Robinson 410-756-2137 9:30am-11:15am Thur
CECIL COUNTY FOOD PANTRIES
NAME ADDRESS CONTACT PHONE HOURS DAYS Blythedale 7th Day Adventist Church
48 Blythedale Rd., Perryville, MD 21903 Anna Gall (410) 378-2356 8am-11:30am Mon
Cecil County Help Center 135 E. High St., Elkton, MD 21921
DSS P.O. Box 1160 Elkton, MD 21922 (mailing)
(DSS Referral needed)
Diana Klusak
Lorraine Vass
(410) 996-0260
(410) 996-0241
(410) 996-0242
7:30am-4:30pm Mon-Fri
Clairvaux Farm Meeting Ground
P.O. Box 808, Elkton, MD 21922 Cynthia Wood (410) 275-2936 9am-4pm Mon-Fri
Elkton Presbyterian Church 207 W. Main ST. Elktton, MD Dorothy McDaniel (410) 398-4636 9am-3pm Mon-Fri
First Baptist Ch. of NorthEast 206 Mechanics Valley Rd., N.E., MD 21921 Kathy Gray (410) 287-6247 9am-4pm Mon-Fri
Good Sheperd Church 810 Aiken Ave., Perryville MD 21903 Harriet Beckert (410) 642-3588 9:45am-12pm Mon, Wed, Fri
Immaculate Conception Outreach
P.O. Box 345, Elkton, MD 21922 Dottie Fritz (410) 398-2110 9:30-12pm Mon, Wed, Fri
Ray of Hope Mission Center 960 Creigtown Rd., Port Deposit MD 21901 Frank Rinaldi Jr. (410) 378-9800 9am-4pm Fri

Appendix IV Page 16
CHARLES COUNTY FOOD PANTRIES
NAME ADDRESS CONTACT PHONE HOURS DAYS Calvary United Methodist 3235 Leonardtown Rd., Waldorf, MD 20601 Ron Black (301) 645-5247 9:30am-12:30pm Tue & Wed
Charles County Children Aid Society
3000 Huntington Cir. Waldorf Maria Bryan (301645-1561
Forest Park Baptist 12995 Church Rd. Waldorf Joyce Breagy (301)843-8916 9am-12pm Sat
Grace Lutheran/FISH 1200 Charles St., Laplata, MD Alice Adams (301) 855-1819 9am-4pm Mon-Fri
Hughesville Baptist Church 8505 Leonardtown Rd, Hughesville Ray Allen (301)884-6163 10am-12pm Wed
St. Mary’s Star of the Sea 30 Mattingly Ave., Indian Head, MD 20640 Rev. Thomas Hill (301) 743-7175 8:30am-11am 4th Sat
Assoc. Catholic Charities 513 E. Charles St., La Plata, MD 20646 Brenda Dicario (301) 934-2582 9am-5pm Mon-Fri
St. Peter’s St. Vincent dePaul 3220 St. Peter’s Drive, Waldorf, MD 20601 Joyce Breagy (301) 843-8916 By appt.
Children’s Aid Society 3000 Huntington Circle, Waldorf, MD 20602 Barbara Madison (301) 645-1561 9am-4:30pm Mon-Fri
WM Lord Led Mission (Lord’s Supper)
2275 Oriental Pl, Nanjemoy Wayne Matthews (301)753-4615 10am-3pm Mon & Wed
Waldorf Free Will baptist Pantry
4028 Middletown Rd. Waldorf Pastor Jim Fairchild (301)645-4931 As needed
Zion Wesley Utd. Methodist Rt. 228, P.O Box 972, Waldorf, MD 20604 Emily Pender (301) 645-7340 9am-12pm Sat
DORCHESTER COUNTY FOOD PANTRY
NAME ADDRESS CONTACT PHONE HOURS DAYS Dorchester Community Development Corporation
435 High St., P.O. Box 549, Cambridge, MD
21613
Ruth Campbell (410) 228-3600 9am-4pm Mon-Fri

Appendix IV Page 17
FREDERICK COUNTY FOOD PANTRIES
NAME ADDRESS CONTACT PHONE HOURS DAYS Brunswick Food Bank 1st United Methodist Church
7S. Maryland Ave., Brunswick, MD Sandy Cox (301) 834-8802 6:30pm-8pm Th
Emmitsburg Food Bank Elias Lutheran Church
300 S. Seton Ave., Emmitsburg, MD 21727 Phyllis Kelley (717) 642-6963 7pm-8pm
10am-11am
Wed
Thur, Sat
Frederick Community Action Council
100 S. Market Street, Frederick, MD 21701 Marty Qually (301) 694-1506 2pm-4pm
7pm-9pm
M, T, Th, F
Wed
Jefferson Food Bank St. Paul’s Lutheran Church
3864 Jefferson Pike, Jefferson, MD 21755 Nancy Whitney (301) 834-7020 10am-11:30am 1st & 3rd Sat
Middletown Food Bank 301 W. Main St., Community Building
Middletown, MD 21769
Carrie Toms (301) 371-7303 1pm-3pm
9am-12pm
Wed
Sat
Thermont Food Bank
Apple United Church Apples Church Road, Thurmont, MD 21788 Emily Yingling (301) 271-7730 6pm-7:30pm
3:30-5pm
Tue
Fri
Walkersville Food Bank Town Hall
21 West Frederick St., Walkersville, MD 21231 Betsy Waugh (301) 845-0504 6:30pm-8:30pm
12pm-2pm
Mon
Th
GARRETT COUNTY FOOD PANTRY
NAME ADDRESS CONTACT PHONE HOURS DAYS No food pantries

Appendix IV Page 18
HARFORD COUNTY FOOD PANTRIES
NAME ADDRESS CONTACT PHONE HOURS DAYS AME Refuge Temple Church 116 Spesutia Rd., Aberdeen, MD 21001 Mary Green (410) 679-0178 9am-12pm 3rd Sat
Bread of life/ Abundant Grace Family Church
3716 Dublin Rd., Darlington, MD 21034 Rev. Walter Donnolly
Jerry Morrison
(410) 838-8409 3rd Sat
Community Action Agency 33 W. Courtland St., Bel Air, MD 21014 Becky Hamlin (410) 638-3241 9am-12pm// 1-4p
9-12// 1-2pm
M-Th
Fri
Fish-St. Paul’s Lutheran Ch. 428 Battery Drive, Havre de Grace, MD 21078 Joanne Bowman (410) 939-5753 On-call Daily
FISH - Holy Spirit Lutheran Church
504 Joppa Farm Rd., Joppa, MD 21085 Naomi Horn (410) 679-3891 On-call Daily
Fish-Bel Air Calvary Baptist 206 E. Courtland St., Bel Air, MD 21014 Dennis Longo (410) 836-7696 10am-3pm
6-8
Mon-Fri
Mon
FISH- St. Joan of Arc 22 Law Street, Aberdeen, MD 21001 (410) 272-4535 9:30-11:00am Mon-Fri
Grove Presbyterian Church 50 East Belair Ave., Aberdeen, MD 21001 Helen Farmer (410) 272-0585
(410) 272-0773
7pm-8pm Wed
Inner County Outreach 529 Edmund Street, Aberdeen, MD 21001 Joe Williams (410) 272-3278 9am-1pm Mon-fri
Mason Dickson 708 Highland Rd. PO Box 34, MD 21014 Cindy Esworthy (410) 452-9025 9:am-12pm Mon-Th
Manna House -Bel Air United Methodist Church
21 Linwood Ave., Bel Air, MD 21014 Ron Rivenburg (410) 838-4151 11am-2pm Wed
New Covenant Church 2530 Conowingo Rd., Bel Air, MD 21014 (410) 420-1299 9am-1pm Thursday
Salvation Army 300 Rear Seneca Ave., Havre de Grace, MD
21078
Dawn (410) 939-3535 Call
Sharing Table-Presby United Methodist Church
2600 Willoughby Beach Road, Edgewood, MD
21040
Susan Graper (410) 676-6496 11:30am-1pm Sat
St. Matthew’s Church 1200 Church Rd, Bel Air, MD 21014 Diana Tildon (410) 273-6536 9am-3pm Mon-Fri
Trinity Lutheran Church 1100 Philadelphia Rd., Joppa, MD 21085 Pat Martin (410) 515-3384 1pm-3pm
9am-11am
Thursday
Saturday

Appendix IV Page 19
HOWARD COUNTY FOOD PANTRIES
NAME ADDRESS CONTACT PHONE HOURS DAYS Bethany Lane Baptist Church 3030 Bethany Lane, Ellicott City, MD 21042 Lynn Dantmann (410) 465-0150 Call
Bridgeway Community Cupboard
6148 Cedar Wood Dr., Columbia, MD 21044 Donna Michener (410) 992-1840 Call
Celebration Church 6080 Foreland Garth, Columbia, MD 21045 Arlene Braithwaite (410) 997-2088 5:30-6pm Fri
Elkridge Food Pantry 5646 Furnance Ave, Elkridge, MD Herman Prelm (410) 796-1456 6pm-8pm 2nd & 4th Friday
Eva Johnson Foundation Food Pantry
3588 Mt. Ida Drive, Ellicott City, MD 21043 Raymond Johnson (410) 465-0886 11am-1pm
4pm-6pm
Friday
First Baptist Church of Savage
8901 Washington St. Savage, MD 20763 Jackie Waller (410) 465-7883 6:30pm7:30pm
9am-11am
Wed,
Fri, Sat
FISH P.O. Box 34, Ellicott City, MD 21041 Wendell Thompson (410) 964-8660 Call Mon-Fri
Howard County Food Bank 8920 Auite A Route 108, Columbia MD 21045 Community Action (410) 313-6440 1pm-4pm Tue & Thur
Locust United Methodist Church
8105 Martin Rd. Simpsonville, MD 21150 Roberta Kelley (410) 531-5323 Call
Mt. Pisgah AME Church 5901 Cedar Fern Court, Columbia, MD 21044 Carolyn Hatcher (410) 730-6688 11am-5pm
10am-2pm
Weekdays
Saturday
St. John Baptist Church 8910 Route 108, Columbia, MD 21045 Harold Hunt (301) 596-5571 10am-1pm 3rd Sat
KENT COUNTY FOOD PANTRY
NAME ADDRESS CONTACT PHONE HOURS DAYS Community Food Pantry Christ United Methodist Church, Chestertown,
MD
Rita Brantly (410) 778-3163 10am-12noon Tue,Fri

Appendix IV Page 20
MONTGOMERY COUNTY FOOD PANTRIES
NAME ADDRESS CONTACT PHONE HOURS DAYS Adventist Community Services
501 Silgo Ave. Silver Springs, MD 20910 Mercedes Lemos (301)585-6556 10am-4pm Mon-thur
Colesville Center 14015 New Hampshire Ave. Manna Food Center (301)424-1130 2pm-4pm Wed & Fri
Gaithersburg 602 East Diamond Ave., Suite A Manna Food Center (301)424-1130 5pm-7pm Mon-Thur
Germantown/Salvation Army Center
20021 Aircraft Dr., Manna Food Center (301)424-1130 2pm-4pm Thursday
Long Branch Community Center
8700 Piney Branch Rd. Manna Food Center (301)424-1130 2pm-4pm
5pm-7pm
Tuesday
Wednesday
Montgomery County Family Center
11160 Veirs Mill Rd. #700, Wheaton, MD 20902 Haregewoin Kefyalew (301)942-1856 Appt . only Mon-Fri
Salvation Army 20021 Aircraft Dr., Germantown, Md 20874 Maxine Goalie (301)515-5354 HOLIDAYS
Silver Spring/ St. Camillus RC Church
1600 St. Camillus Dr. Manna Food Center (301)424-1130 2pm-4pm Mon
Montgomery Ave. Women’s Shelter
12250 Wilkins Ave., Rockville, MD 20850 Norma Fegan (301) 762-2288 Women’s Shelter
Outpatient Addiction Services 751 Twimbrook Parkway 2nd Floor, Rockville,
MD 20851
Hilda Sayles (240) 777-1680 Daytime Shelter
Stepping Stones P.O. Box 712 Rockville, MD 20848 (301) 251-0567 Family Shelter
Vanguard Services Unlimited 1 Lawrence Court, Rockville, MD 20850 Sarah M. Donnem (301) 251-8920 Halfway house
Watkins Mill House 20201 Watkins Mill Rd., Gaithersburg, MD
250886
(301) 444-3355 Women’s Shelter
Wells Robertson House 1 Wells Avenue, Gaithersburg, MD 20877 (301) 258-6390 Shelter

Appendix IV Page 21
PRINCE GEORGE’S COUNTY FOOD PANTRIES
NAME ADDRESS CONTACT PHONE HOURS DAYS Adventist Community Services
501 Sligo Ave., Silver Springs, MD 20910 Wordy Nicholas (301) 585-6556 10am-12pm Mon-Thu
Ager Road Methodist 6301 Ager Rd., Hyattsville, MD 20782 Rebecca Armstrong (301) 422-2132 9:30am-11:15am Th
Central Bapitist Church “feed My Sheep”
5410 Annapolis Road, Bladensburg, MD 20712 Mrs. Corenne Labble (301) 627-0267 Call M-F
Church of the Living God 1417 Chillum Rd., Hayattsville, MD 20782
June Muna Mbulu (301) 559-8893
10am-12pm Sat
Clothing Power of Eternal Church
25 Quire Ave. Capitol Heights, MD 20743 Tracy Jenkins (301) 336-3395 6pm-8pm
10am-12pm
Wed & Fri
Sat
Community Support Systems 13500 Baden-Westwood Rd., Brandywine, MD
20613
Catherine Brooks
(301) 785-2936 9:30am-11am Wed, Fri
First Baptist Church of Suitland
5400 Silver Hill Rd., Suitland, MD 20747 Delores Callier (301) 735-6111 9am-4pm Mon-Fri
Fish of Greater Laurel, Inc. 308 Gorman Ave., Laurel MD 20724 Mary Ellen Verikious (301) 262-7106 11am-2pm Tue,Th,Sat
G.A. Fitzgerald Community 1250 Benning Rd., Capitol Hgts., MD 20743 Rev Fitzgerald (301) 736-0184 10am-2pm Mon & Wed
Galilee Baptist Church 2101 Shadyside Ave., Suitland, MD 20746 Francis Grayl (301) 420-5014 9:30am-3pm Mon-Thu
Gethsemane United Methodist
901 Addison Rd., Capitol Heights, MD 20743 Anne White (301) 336-1219
10am-1pm Mon,-Thu
Greater Refuge Food Bank 9512 Piscataway Dr., Clinton, MD 20735 Deborah Williams (301) 868-5880 6pm-7pm Fri
Harvest Temple Church of God
6608 Wilkins Place, Forestville, MD Rev Mary Campbell (301) 420-1417
12pm-2pm Tue-Thu
Help By Phone
Throughout P.G. County
6100 Westchester Park Dr., College Park, MD
20740
Lois Jones (301) 669-9009
9am-5pm
9am-12noon
Mon,Th
Fri
Hunter Memorial AME Church 4719 Silver Hill Rd., Suitland, MD 20746 Dorothy Boddie (301) 735-5761 On Call Mon-Fri
ICAC/Oxon Hill Food Pantry 4915 St. Barnabas Rd., Temple Hills, MD 20748
P.O. Box 934, Temple Hills, MD 20748 (mail)
George Wiggers (301) 899-8358 10am-1pm
Tue,Sat

Appendix IV Page 22
PRINCE GEORGE’S COUNTY FOOD PANTRIES Continued
NAME ADDRESS CONTACT PHONE HOURS DAYS Langley Park-McCormick E.S-Pantry
8201 15th Avenue, Hyattsville, MD 20783 Ms. Cabrera (301) 445-8423 2:30-3:30pm Mon-Fri
Laurel Advocacy Referral Services (LARS)
311 Laurel Ave., Laurel MD 20724 Nancy Graham (301) 776-0442
9am-2pm
6:30pm-9pm
Mon,Wed,Fri
Mon
Life in Victory Outreach Center
11171 Crain Highway Upper Marlboro, MD
20773
Cynthia Brown (301) 782-7700 By appt. M-F
Love Foundation Christian Center
13992 Baltimore Ave. Suite 300 Laurel, MD
20707
Pastor Daniel Erharbor (301) 776-5782 10am-5pm Sat
Lucille’s Pantry 6100 Jost Street, Fairmont Hgts., MD 20743 Lucille Smith (301) 925-8585 10am-2pm Wed,Fri
Mayr Harris “Mother” Jones ES
2405 Tecumseh St., Adeiphi, MD 20783 Arinette Sagastizado (301) 408-7900 2pm-3:15pm M-F
Mt Calvary Church 6706 Marlboro Pike, Forestville, MD 20747 Margeret Dougherty (301) 735-5532 9:30am-11:30am Mon & Th
New Revival Kingdom Church 7821 Parston Dr. Forestville, MD 20747 Rev. Catherine Chase (301) 736-4535 1pm-3pm Mon & Thur
Oaklands Presbyterian Church
14301 Laurel-Bowie Rd., Laurel, MD 20706 Bob Clark (301) 766-5833 9am-2pm Tue-Fri
Pregnancy Aid Center, Inc. 4809 Greenbelt Rd., College Park, MD 20740 Mary Jelacic (301) 345-9325 9am-4pm
9 am-4:30pm
9am-3pm
Mon, Wed
Tue, Thu
Fri
Regeneration Development Group
9244 E. Hampton Dr., Suite 514, Capitol Hgts.,
MD 20743
Bishop George Blair (301) 808-7455
10am-1pm Mon-Fri
Salvation Army 4825 Edmonston Rd., Hyattsville, MD 20781 Renee Dawson (301) 277-6103 9am-12noon
1pm-4pm
Mon-Fri
Shabach! Food Pantry 2101 Kent Village Dr., Landover MD 20785 Erma Norris (301) 322-9593 10am-2pm Mon-Fri
St. Joseph’s Church 2020 St. Joseph’s Dr., Landover, MD 20785 John Queen (301) 773-0102 1pm-2:30pm Wed,Sat
St. Margaret’s Catholic Church
408 Addison Rd., South Seat Pleasant, MD
20743
Deacon Samuel Minor (301) 336 3344 9:30am-12noon Tu,Fri

Appendix IV Page 23
PRINCE GEORGE’S COUNTY FOOD PANTRIES Continued
NAME ADDRESS CONTACT PHONE HOURS DAYS St. Paul United Methodist Church
6634 St. Barnabas Rd., Oxon Hill, MD 20745 Karen Dorsey (301) 567-4433 10am-12noon Mon-Fri
United Christian Mission 7808 Marlboro Pike, Forestville, MD 20747 Shernece Stephens (301) 735-6909 10am-1pm Th
United Communities Againist Poverty
1400 Doewood Lane, Capital Heights, MD
20747
Lilian Nobles (301) 322-5700 12:30-4:30
8:30-4:30
Mon-Thurs
Fri
United Methodist Church of the Redeem
1901 Iverson St., Temple Hills, MD 20748 Linda Young (301) 894-8622 9am-2pm Mon-Fri
Walker Mill Outreach Center 6974 Walker Mill Rd., Capitol Hgts., MD 20743 (301) 808-0096 10am-2pm Thu
QUEEN ANNE’S COUNTY FOOD PANTRY
NAME ADDRESS CONTACT PHONE HOURS DAYS Living Water Food Bank
204 Island Plaza, P.O. Box 212 Stevensville,
MD 21666
Marsha Johnson (410) 604-0450 1:30pm-5:30pm Tue
ST. MARY’S COUNTY FOOD PANTRIES
NAME ADDRESS CONTACT PHONE HOURS DAYS Catholic Charities 21506 Cotton Point Ave., Avenue MD 20609 Cindy Otts (301) 769-2788 9am-5pm
Mon-Fri
HOPE 2161 Great Mills Rd. Lexington Park, MD 20653 Debbie Cooper (301) 737-2870 9am-12noon Mon-Th
Helping Hands, Inc 24360 Beck Rd Hollywood MD 20650 Rose Slade (301) 373-6990 10am-2pm M,W,F
Trinity Lutheran Church 46707 Shangri-La Dr, Lexington Park Cindy Pavis (301)-394-6139 6pm-8pm Wed
Zion United Methodist 21291 Three Notch Rd,, Lexington Park, MD
20653
Janie Hunter (301) 863-5161 5:30pm-7pm Th

Appendix IV Page 24
SOMERSET COUNTY FOOD PANTRIES
NAME ADDRESS CONTACT PHONE HOURS DAYS Christ United Methodist Church
27473 Fairmont Road, Upper Fairmount, MD
21867
Chris Koons (410) 651-2375 9am-11pm Sat
1 per month
Community Relief Fund 140 Maryland Ave. Crisfield MD 21817 Charles Mc Daniel (410) 968-0284 3pm-7pm Thursday
Immanuel United Methodist Church
206 West Main Street, Crisfield, MD 21817 Beth McCullough (410) 968-2189 9:30am-12pm 2nd & 4th
Tue
Manna House 510 W. Main St., Suite C Crisfield, MD 21817 Hayes Diggs, Jr. (410) 968-3619 When Needed When Needed
St. James United Methodist Church
8370 Crisfield Highway, Westover, MD 21871 Shirley Terrell (410) 651-9580 10am-12pm 2nd & 3rd Sat
Seaton Center Catholic Charities
30632 Hampden Ave., Princess Anne, MD
21853
Sister Diane Moore (410) 651-9608 1pm- 5pm Mon-Fri
TALBOT COUNTY FOOD PANTRY
NAME ADDRESS CONTACT PHONE HOURS DAYS Neighborhood Center 126 Port St., Easton, MD 21601 Gloria Gorish (410) 822-5015 9am-3pm
9am-12noon
Mon,Th
Fri

Appendix IV Page 25
WASHINGTON COUNTY FOOD PANTRIES
NAME ADDRESS CONTACT PHONE HOURS DAYS Adventist Community Center 50 E. Franklin St., Hagerstown, MD 21740 Sandy Martin (301) 739-3854 10am-3pm Tue,Th
Bethel Assembly of God 515 W. Wilson Blud. Hagerstown, MD 21710 Ed kennedy (301) 735-1167 10AM-3PM M-F
Bountiful Harvest Outreach 14346 Maple Ridge, Hancok, MD, 21750 Barbara Sparks (301) 678-5011 10am-12pm T-TH
Community Action Council 110 Summit Ave., Hagerstown, MD 21740 Cindy Shefer (301) 797-4161 8:30am-4:30pm Mon-Fri
Faith Chapel 14 S. Potomac St., Hagerstown, MD 21740 Roger Elliott (301) 733-7748 10am-3pm Mon-Fri
Hancock Food Pantry Pa. Ave. & High St., Hancock, MD Jim Becker (301) 678-5020 9am-12noon Mon-Fri
Office of Consumer Advocacy, Inc.
265 Mill Street, Hagerstown, MD 21740 Sherry Phelps (301) 790-5054 As needed
SHIP 116 W. High Street, Hancock, MD 21750 Debbie Cahill (301) 678-6605 8am-4pm Mon-Fri
Salvation Army 524 West Franklin Street, Hagerstown, MD
21740
Laura Barger (301) 733-2440 9am-4pm Mon-Fri
South County Food Bank 645 S. Main Street, Boonsboro, MD 21713 Vivian Clipp 11:30am-3pm Thu
Trinity Food Pantry 15 Randolph Ave., Hagerstown, MD 21740 Jeff Reed (301) 733-5651 10am-2pm Tue, Wed, Thu
Willamsport Food Bank 35 W. Potomac St., Williamsport, MD 21785 Mary Ann Kline (301) 223-7136 10am-3pm Mon, Wed, Fri

Appendix IV Page 26
WICOMICO COUNTY FOOD PANTRIES
NAME ADDRESS CONTACT PHONE HOURS DAYS Cathedral of Love 423 Church St., Salisbury, MD 21803 Curley Ivey (410) 742-5386 10am-12pm Thursday
Emmanuel Wesleyan Outreach
142 Shamrock Dr., Salisbury, MD 21801 Charles Kirby
Jjimmy Layton
(410) 749-6594
(410) 614-7937
8am-9am Sat
First Baptist Food Ministry 528 Booth St.,Salisbury, MD 21801 Lelia Chester (410) 548-5486 10am-5pm Mon-Fri
First Baptist Church of Fruitland
630 Clyde Ave. Fruitland, MD 21826 Dot Hamiliton (410) 742-3396 When Needed When needed
God’s Caring & Sharing Food Bank
2671 Bank Road, Naticoke, MD 21840 Mary Ringgold
Laurence Elsey
(410) 873-2077
(410) 873-3097
10am-1pm 3rd Thursday
Greater Hebron Area Food Pantry/ ST. Paul’s United
204 East walnut St., Hebron ,MD 21830 Teresa Richards (410) 546-9750 10am-12pm Thurs or by
appointment
Helping Hands 33063 Old Ocean City Rd, Parsonsburg, Md
21849
Kimberly Monar (410) 835-2745 9am-1pm Sat
In His Service 6724 Keyes Ln., Salisbury, MD 21804 Don Keyes (410) 860-8426 8-4pm Mon-Sat
Joseph House 812 Boundary St., P.O. Box 1755 Dave Heininger (410) 543-8171 8:30am-11:30am Tue,Wed,Th
New Beginning 1611 Jersey Rd. Salisbury, MD 21804 Mamie Morris (410) 742-0456 6pm-7pm 3rd Tue
Pearl’s Pantry 411 Robinson St. Salisbury, MD 21801 Pearl Harmon (410) 572-8532 10am-4pm Mon-fri
Regis Brown Bag 507 Overlook Dr. Salisbury, MD 21801 Janet Ames (410) 860-1326 9am-5pm
9am-12pm
Mon-Fri
Sat
Riverside Homes 519 Alabama Ave., Salisbury, MD 21801 Oscar Drummond (410) 742-0060 1pm-4pm Thur
St. James AME Zion 721 Mack Ave. Salisbury, MD Lois Bunting (410) 749-5841 11am-1pm Tue, Thurs, Fri
St. Paul AME Zion Church 410 Delaware Ave., Salisbury, MD 21801 Laura D. Goslce (410) 546-5661 9am-5pm Mon-Fri
Salvation Army 407 Oak St., PO Box 3235 Salisbury, MD 21874 Shari Tracy (410) 749-3077 9am-12noon
1pm-3pm
Mon-Fri
Salisbury Urban Ministries 326 Barclay Street, Salisbury MD 21802 Angel Simpson (410) 749-1563 10am-2pm Tue, Thur
Telamon Corporation 237 Florida Ave., Salisbury, MD 21801 Jeffifer Shahan (410) 546-4604 9am-12:30pm
1pm-4:30pm
Tue, Wed, Thru
Wesley Temple 1322 West Rd., Salisbury, MD 21801 Ina Townsend (410) 749-2818 9am-12noon Mon,Wed,Fri
Vision of Mercy 423 Hammond street, Salisbury, MD 21801 Stephanie Wallace (410) 742-6206 10am-5pm Mon-Sat
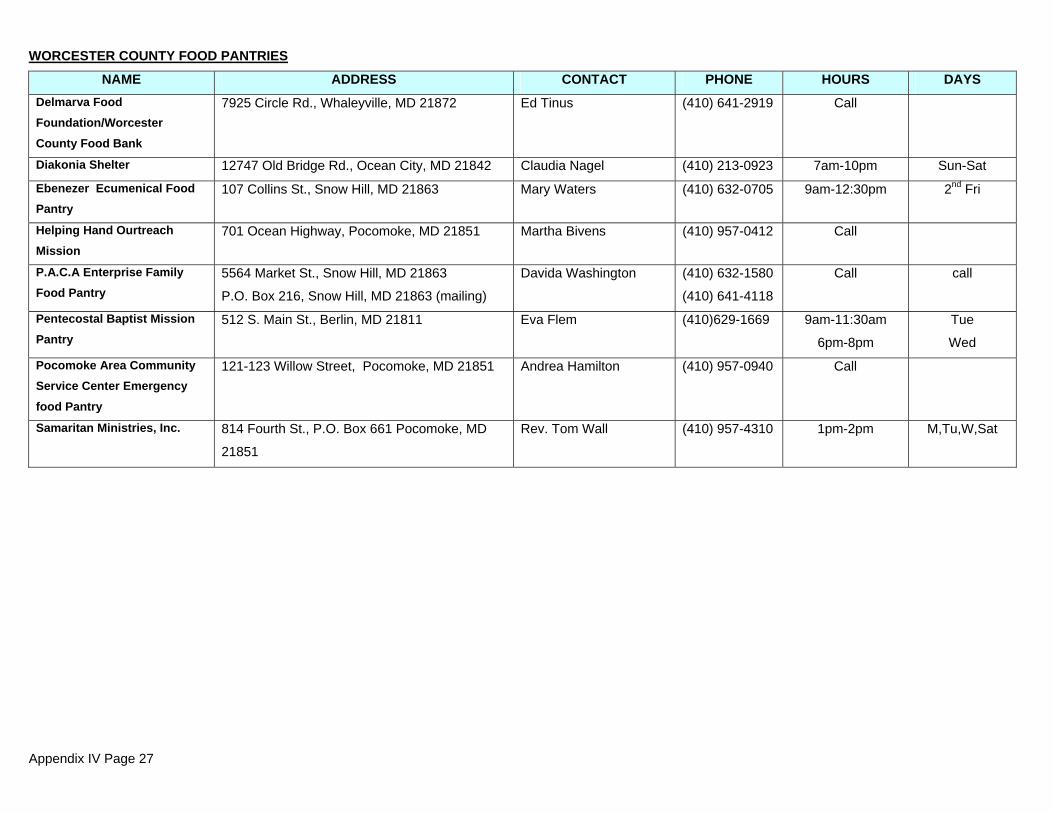
Appendix IV Page 27
WORCESTER COUNTY FOOD PANTRIES
NAME ADDRESS CONTACT PHONE HOURS DAYS Delmarva Food Foundation/Worcester County Food Bank
7925 Circle Rd., Whaleyville, MD 21872 Ed Tinus (410) 641-2919 Call
Diakonia Shelter 12747 Old Bridge Rd., Ocean City, MD 21842 Claudia Nagel (410) 213-0923 7am-10pm Sun-Sat
Ebenezer Ecumenical Food Pantry
107 Collins St., Snow Hill, MD 21863 Mary Waters (410) 632-0705 9am-12:30pm 2nd Fri
Helping Hand Ourtreach Mission
701 Ocean Highway, Pocomoke, MD 21851 Martha Bivens (410) 957-0412 Call
P.A.C.A Enterprise Family Food Pantry
5564 Market St., Snow Hill, MD 21863
P.O. Box 216, Snow Hill, MD 21863 (mailing)
Davida Washington (410) 632-1580
(410) 641-4118
Call call
Pentecostal Baptist Mission Pantry
512 S. Main St., Berlin, MD 21811 Eva Flem (410)629-1669 9am-11:30am
6pm-8pm
Tue
Wed
Pocomoke Area Community Service Center Emergency food Pantry
121-123 Willow Street, Pocomoke, MD 21851 Andrea Hamilton (410) 957-0940 Call
Samaritan Ministries, Inc. 814 Fourth St., P.O. Box 661 Pocomoke, MD
21851
Rev. Tom Wall (410) 957-4310 1pm-2pm M,Tu,W,Sat

Appendix IV Page 28
SOUP KITCHENS IN MARYLAND ANNE ARUNDEL COUNTY SOUP KITCHENS
NAME ADDRESS CONTACT PHONE HOURS DAYS Adventist Community Services
508 Aquahart Rd., Glen Burnie, MD 21061 (410) 760-9172 10am-1pm Tuesday
Church of the Rock 900 Church Street, Baltimore, MD 21225
Damascus House 4203 Ritchie Hwy, Balto., MD 21225 (410) 789-7446 Call
Fouse Center 6401 Richie Hwy., Glen Burnie, MD 21061 (410) 609-1224 9:30am-3:30pm Mon-Fri
Harundale Presb. 1020 EastWay, Glen Burnie, MD 21060 (410) 761-4338 12:30-2pm Tue
Salvation Army GB 511 So. Crain Hwy., Glen Burnie, MD 21061 (410) 768-0477 12pm-1pm Mon,Wed & Fri
Sarah’s House 2015 20th St., Fort Meade, MD 20755 (410) 551-7722 1pm-3pm Wed, Fri, Sat

Appendix IV Page 29
BALTIMORE CITY SOUP KITCHENS
NAME ADDRESS CONTACT PHONE HOURS DAYS American Rescue Workers of Maryland
11 W. Clement St., Balto., MD 21230 Rev. Michael Carr (410) 556-3300 Everyday
Antioch Shelter Home 5300 York Rd, Balto., MD 21221 Mother Allen (410) 323-9112 24hrs Shelter
Beans and Bread 402 S. Bond St., Balto., MD 21231 Sr. Eleanor (410) 732-1892 Lunch M,Tu,Th,F,Sat
Bethany Baptist 2616 Ridgely St., Balto, MD 21230 Sandra Whilte (410) 539-5029 12pm-5pm Tue, Thu
Brown’s Memorial Bapt. Ch. 3215 W. Belvedere Ave., Balto., MD 21215 Barbara Cole (410) 542-5700 Shelter Everyday
Christopher Place 709 E. Eager St., Balto., MD 21202 Vernon (410) 576-0066 Everyday
Code Blue Shelter 1400 E. Federal St. Karen Booth 410-361-9441 5pm-8am When code
blue is declared
Corpus Christi Church 703 Whitelock St., Balto., MD 21217 Mariano (410) 523-5822 5:30-6:30pm Tu,Th
East Balto. Church of God 800 South Oldham St., Balto., MD 21224 Welton Hunt (410) 327-0177
Ebenezer AME 18 W. Montgomery St., Balto., MD 21230 Gilda Williams (410) 783-0190 12noon-1pm Th
First Mount Calvary Bapt. Ch. 1142 N. Fulton Ave., Balto., MD 21217 Rose Long (410) 728-8782 11am-1pm Wed
Foremost Mentor Care 68 S. Koosuth St., Balto., MD 21229 Mamie Daughety (410) 655-9406 12noon-4pm Sun,Sat
Franciscan Center 2212 Maryland Ave., Balto., MD 21218-5625 Brother Finbar (410) 467-9045 10am-1pm Mon, Thu, Fri
Gentle Care 4924 Carmine Ave., Balto., MD 21207 Mrs. Jefferson (410) 448-0217 12pm-4pm Sat, Sun
Gospel Tabernacle 3100 Walbrook Ave., Balto., MD, 21216 Lillian Royster (410) 298-6919 11am-2pm Tue
Grace memorial 1100 N. Eden St., Balto., MD 21213 Rev. Pope (410) 563-2355 12pm-1:30pm Tue
Homestead UMC 1500 Gorsuch Ave., Balto., MD 21218 Shirley Dean (410) 889-5223 10am-1pm Tue-Sat
I CAN 2215 Greenmount Ave., Balto., MD 21218 Frank Giles (410) 467-8623 Everyday
Isreal Baptist 1211 N. Chester St., Balto., MD 21213 Bettye Brinkley (410) 668-8462 12pm-1pm
JB Outreadch 301 N. Stricker St., Balto., MD 21223 Rev. Bivens (410) 728-8731 12pm-2:30pm
Manna House 435 E 25tth St., Balto., MD 21218 Lillian Lowensen (410) 889-3001 8:30am-10:30am Mon-Fri
Mary Elizabeth Lange Center 601 E. Chase St., Balto., MD 21202 Sr. Crescentia (410) 244-8605 Everyday
Maryland Church of God 5100 Denmore Ave., Balto., MD 21215 Ethel Lee (410) 383-2853 2pm-4:30pm Sat,Sun
Maryland Community Kitchen 3242 Eastern Ave., Balto., MD 21224 Darrell Carter (410) 327-3420 Mon-Fri
Mason Memorial 2608 Frederick Ave., Balto., MD 21223 Anita Newkirk (410) 947-4466

Appendix IV Page 30
BALTIMORE CITY SOUP KITCHENS Continued
NAME ADDRESS CONTACT PHONE HOURS DAYS Mount Tabor Baptist 1719 E. Oliver St., Balto., MD 21213 Rev. Forrest (410) 215-1215 11am-1pm
My Sister’s Place Lodge 111 W. Mulberry St., Balto., MD 21201 Keisha (410) 528-9002 Shelter
New Life 2417 E. North Ave., Balto., MD 21213 Rev. Williams (410) 675-2113 6pm-7:30pm Wed
Our Daily Bread 19 W. Franklin St., Balto., MD 21201 (410) 659-4014 Everyday
Paul’s Place PO Box 27070, 1118 Ward St, Balto. MD 21230 Bill Mclennan (410) 625-0775 11am-12:30pm Mon-Fri
Pillar of Truth 2522 Greenmount Ave., Balto., MD 21218 Lonnia Perry (410) 338-0541 1pm-1:30pm Sat
Project Plase 2029 St. Paul St., Balto., MD 21218 Mary Slicher (410) 837-1400 Everyday
Salvation Army 2700 W. Patapsco Ave., Balto., MD 21230 Mary Thompson (410) 525-0530 5:30am-6:30pm Everyday
Second Shiloh 1355 Homestead St., Balto., MD 21218 Wanda Hudson (410) 366-1025 11am-1pm Wed, thu
St. Ambrose 3445 Park Heights Ave., Balto., MD 21215 Inez (410) 225-0870 8am-4pm Mon-Sat
St. Cecilia’s Kitchen 3300 Clifton Ave., Balto., MD 21216 Robert Viner (410) 362-7892 4-5:30pm
St. Gregory 1542 N. Gilmore St., Balto., MD 21217 Gloria/ Pat (410) 523-0061 12noon-2pm Th
St. James UMC 1901 W. Lexington St., Balto., MD 21223 Regina Mason (410) 685-5562 12pm-2pm Wed, Sat
Supper Club 1728 Eastern Ave., Balto., MD 21218 Lillian Lowensen (410) 732-7644 5:30pm-7pm Wed
Temple House 802 N. Fulton Ave., Balto., MD 21217 Rev. Stanley Butler (410) 462-1876 Everyday
United Brethren for Christ 2112 McCulloh St., P.O Box 16461, Balto. MD
21217
Barbara Horton (410) 462-3182 Everyday
Valley House 28 South Broadway, Balto., MD 21231 Ben Toney (410) 675-7765 Everyday
Waters AME 417 N. Aisquith St., Balto., MD 21202 Chrystall Mathews (410) 675-2640 11am-3pm Sat
Westside Assembly of God 535 S. Smallwood St., Balto., 21223 Marshall Haley (410) 947-3006 12pm-2pm M-F
Wayland Baptist 3200 Garrison Blvd., Balto., MD 21216 John Wells (410) 664-2774 12pm-3pm Wed

Appendix IV Page 31
BALTIMORE COUNTY SOUP KITCHENS
NAME ADDRESS CONTACT PHONE HOURS DAYS Hiding Place Dunwoody Road, Towson, MD Kim Poindexter (410) 882-9130 Shelter
Nehima House 8720, Philadelphia Rd., Balto., MD 21237 George Haynesworth (410) 682-6333 Shelter
Family Crisis Ctr. of Balto. Co P.O. Box 3909 Balto., MD Rebecca Foster Shelter
Sarah’s Hope 9100 Franklin Square Dr., baltimore, MD Linda Salinski (410)391-9155 Shelter
CARROLL SOUP KITCHENS
NAME ADDRESS CONTACT PHONE HOURS DAYS
Carpenter’s Table, St. Joseph’s Catholic Church
44 Frederick St., Taneytown MD 21787 (410) 767-2500 11:30am Thur
CECIL COUNTY SOUP KITCHEN
NAME ADDRESS CONTACT PHONE HOURS DAYS Meeting Ground P.O. Box 808, Elkton, MD 21921 Cynthia Wood 410-275-8990 Shelter
Chesapeake Care Resources 80 Marysville Rd. Northeast, MD 21901 Michelle Barrow (410) 287-5040 Mon-Fri
FREDERICK COUNTY SOUP KITCHEN
NAME ADDRESS CONTACT PHONE HOURS DAYS Community Action Council 100 South Market St., Frederick MD 21701 Nancy Walkes (301) 694-1506 Mon,Tue,Th,Fri
Wed
2pm-4pm
7pm-9pm
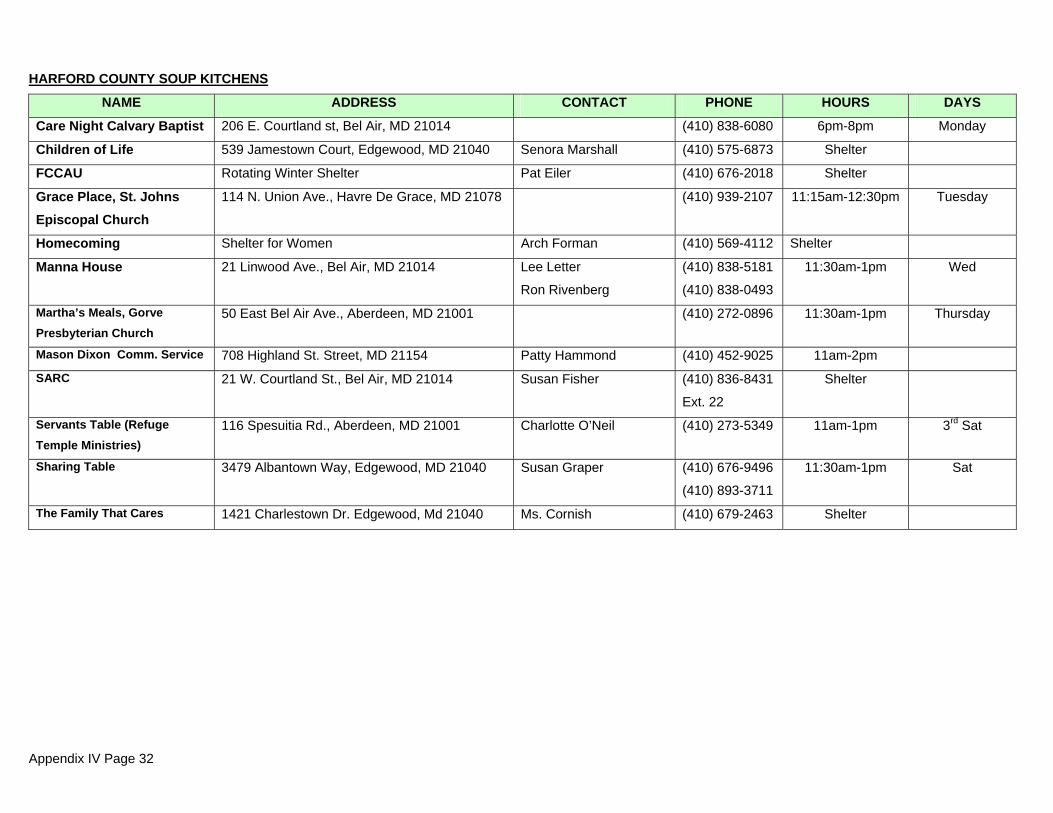
Appendix IV Page 32
HARFORD COUNTY SOUP KITCHENS
NAME ADDRESS CONTACT PHONE HOURS DAYS
Care Night Calvary Baptist 206 E. Courtland st, Bel Air, MD 21014 (410) 838-6080 6pm-8pm Monday
Children of Life 539 Jamestown Court, Edgewood, MD 21040 Senora Marshall (410) 575-6873 Shelter
FCCAU Rotating Winter Shelter Pat Eiler (410) 676-2018 Shelter
Grace Place, St. Johns Episcopal Church
114 N. Union Ave., Havre De Grace, MD 21078 (410) 939-2107 11:15am-12:30pm Tuesday
Homecoming Shelter for Women Arch Forman (410) 569-4112 Shelter
Manna House 21 Linwood Ave., Bel Air, MD 21014 Lee Letter
Ron Rivenberg
(410) 838-5181
(410) 838-0493
11:30am-1pm Wed
Martha’s Meals, Gorve Presbyterian Church
50 East Bel Air Ave., Aberdeen, MD 21001 (410) 272-0896 11:30am-1pm Thursday
Mason Dixon Comm. Service 708 Highland St. Street, MD 21154 Patty Hammond (410) 452-9025 11am-2pm
SARC 21 W. Courtland St., Bel Air, MD 21014 Susan Fisher (410) 836-8431
Ext. 22
Shelter
Servants Table (Refuge Temple Ministries)
116 Spesuitia Rd., Aberdeen, MD 21001 Charlotte O’Neil (410) 273-5349 11am-1pm 3rd Sat
Sharing Table 3479 Albantown Way, Edgewood, MD 21040 Susan Graper (410) 676-9496
(410) 893-3711
11:30am-1pm Sat
The Family That Cares 1421 Charlestown Dr. Edgewood, Md 21040 Ms. Cornish (410) 679-2463 Shelter

Appendix IV Page 33
MONTGOMERY COUNTY SOUP KITCHENS
NAME ADDRESS CONTACT PHONE HOURS DAYS ARC of Montgomery County 11600 Nebel Street, Rockville, Md 20852 Cheryl Gooden (301) 984-577 Group Home
Bethesda Cares- First Baptist Church
5033 Wilson Lane, Bethesda, MD 20814 1pm-2pm Mon-Fri
1st to the 15 of
the month
Bethesda Cares- 4924 Del Ray Ave. Bethesda, MD 20814 Lawrence Blake (301) 907-9144 12:45pm-1:45pm Mon-Fri
Bethesda House 4848 Cordell Ave., Bethesda, MD 20814 Herman Dozier (301)907-9597 Shelter
Betty Ann Krahnke Center 14810 Brossard Road, Rockville, MD 20850 (301)279-1640 Shelter
Carroll House 2699 Linden Ln., Silver Springs, MD 20910 Bobby Johnson (301)495-4900 Shelter
Community Vision 8210 Colonial Ln. Silver Springs, MD 20910 Lonnie Roister (301)585-4471 7am-5pm Mon-Fri
Crossways Community 3015 Upton Dr. Kensington MD, 20895 Missy Myers (301)929-2505 Shelter
CSAAC 751 Twinbrook Parkway, Rockville, MD 20851 Graig Pardon (240)912-2263 Group Home
Episcopal Senior Ministries 13325 Burkhart St., Silver Springs, MD 20904 Sherry Waters (301)879-4949 Group Home
Gaitherburg Community Soup Kitchen “Lord’s Table”
201 South Frederick Avenue, Gaithersburg, MD
20877
Erika Walden (301)330-5812 3:30pm-4:30pm Sept.- June
Head Injury Rehabilitation One Church Street, Rockville, MD 20850 Maggie Hunter (301)309-2228 Group Home
Helping Hands Shelter 622 N. Horner’s Ln., Rockville, MD 20850 Ann Chapman (301)340-2796 Shelter
Lawrence Court Halfway House
1 Lawrence Court, Rockville, MC 20850 Elaine Brown (301)251-8920 Shelter
Men’s Emergency Shelter 600 Gude Dr., Rockville, MD 20850 Ron Hall (301)545-5025 Shelter
Montgomery Ave. Women’s Center
12250 Wilkins ave. C Rockville, MD 20851 Norma Fagan (301)984-0901 Shelter
Nat’lCtr. For Children & Families
6301 Greentree Rd., Bethesda, MD 20817 Richard Green (301) 365-4480 Shelter
Outpatient Addction Service 451 Twinbrook Pkwy FL2, Rockville, MD 20851 Hilda Seales (240)777-1680 Breakfast & Lunch Mon-Fri
Shepherd’s Table 8210A Colonial Lane, Silver Spring, MD 20910-
5540
Thierry (301) 585-6463 Mon-Fri 6pm-7:30pm

Appendix IV Page 34
PRINCE GEORGE’S COUNTY SOUP KITCHENS
NAME ADDRESS CONTACT PHONE HOURS DAYS Deliverance Temple 3918 Alton St., Capitol Hgts., MD 20743 George Blair (301) 967-2535
(301) 336-6456
12:00pm-2pm Mon-Thu
Freedom Way 1250 Benning Rd., Capitol Heights, MD 20743 Ave. Broakiet (301) 736 0184 6pm-8pm Wed
Harvest Temple 6608 Wilkens Place, Forestville, MD 20747 Mary Campbell (301) 420-1417 12pm-4pm Tue-Thu
Transitional Center @ PG City Housing
603 Addison Rd., Capitol Heights, MD 20743 Robert Walker (301) 808-5317 Housing
Transitional Housing PG City DSS
9202 Spring Hill Drive Apt. , Greenbelt, MD
20770
Darlene Harris
Rita Harris
(301) 345-6175 Housing
Trnsitional Housing PG City 9160 Edmonston Rd, #202 Greenbelt, MD
20770
Beverly Bruce (301) 513-0279 Housing
Warriors for Christ Ministries 2420 Brook Drive Suite 322, Suitland MD 20746 Julie Adgerson (301) 735-6300 Shelter
WASHINGTON COUNTY SOUP KITCHENS
NAME ADDRESS CONTACT PHONE HOURS DAYS Salvation Army 524 West Franklin St., Hagerstown, MD Laura Berger (301) 733-2440 call call
Soul Haven 14E Franklin St., Hagerstown, MD 21740 Ethel Newark (301) 790-5054 12pm-2pm Sat
W House 549 N. Locust St. Hagerstown, MD 21740 Christina Tredon (301) 791-7826 24hr. Shelter
Wells House 324 N. Locust St., Hagerstown, MD 21740 Charles Mooneyhan (301) 739-7748 Call
Union Resue Mission P.O. Box 685 Hagerstown, MD 21741 Nancy Shank (301) 739-1165 24hr Shelter
Zion Soup Kitchen 201 N. Potomac St., Hagerstown, MD 21740 Barbara Hendershot (301) 739-7244 5pm-8pm Tue

Appendix IV Page 35
WICOMICO COUNTY SOUP KITCHEN
NAME ADDRESS CONTACT PHONE HOURS DAYS Christian Shelter, Inc. 334 Barclay St., Salisbury, MD 21804 James Barnes (410) 749-5673
Life Crisis Center P.O. Box 387, Salisbury, MD 21803-0387 Edith Saroli-Silva (410) 749-4357 Shelter
Emmanuel Wesleyan Church 142 Shamrock Dr., Salisbury, Md 21801 Charles Kirby (410) 749-6594
(410) 614-7937
8am-9am Saturday
First Bapitist Soup Kitchen 528 Booth Street Salisbury, MD 21801 Lelia Chester
Clinda Johnson
(410) 548-5486
(410) 546-8158
10-1pm Mondays
Sept-May
Hebron Community Kitchen/St. Paul’s United Methodist Church
204 East Walnut Street, Hebron, MD 21830 Terresa Richards (410) 546-9750 2pm-until 1st-3rd Saturday
Joseph House Crisis Center 812 Boundary Street, Salisbury, MD 21801 Dave Heininger (410) 749-4239 10:30am-12pm Tue, Wed, Thur