
Conservation of taxonomically difficult species: the case of the Australian orchid, Microtis angusii
13
Conservation of taxonomically difficult species: the case of the Australian orchid, Microtis angusii Nicola S. Flanagan 1,3, *, Rod Peakall 1 , Mark A. Clements 2 & J. Tupac Otero 2 1 School of Botany and Zoology, The Australian National University, Canberra, ACT 0200, Australia; 2 Centre for Plant Biodiversity Research, GPO Box 1600 Canberra, ACT 2601, Australia; 3 Present address: Biochemistry Department, University College Cork, Cork, Ireland (*Corresponding author: Phone: +353-21- 4904124; Fax: +353-21-4904259; E-mail: nicfl[email protected]) Received 18 May 2005; accepted 3 January 2006 Key words: AFLP, clonality, ITS, practical outcomes, species diagnosis Abstract As species are the common currency for conservation efforts, their accurate description is essential for efficient preservation of biological diversity. The genus Microtis (Orchidaceae) is typified by a paucity of consistent morphological characters, confounding taxonomic attempts. We report the results of a study of the conservation genetics of the recently discovered, endangered Australian orchid species M. angusii (Jones). This species was known only from one small population, with identification of further populations hampered by taxonomic difficulties. We used a combination of 122 AFLP markers and DNA sequence variation in the ribosomal ITS gene region to investigate the population genetic structure of the type population of M. angusii. Six further putative M. angusii populations were also analysed with these markers. Two of these populations showed high genetic affinity to M. angusii, bearing identical ITS sequences. Both the type and a second population were invariable across all AFLP loci. The third population, 3 km distant, showed minor genetic differentiation. These two new populations warrant immediate protection. Phylogenetic relationships between M. angusii and close relatives revealed its genetic affiliation to an unidentified, more distant pop- ulation, and to the species M. unifolia. Given the propensity in Microtis for both selfing and clonality, mechanisms that both reduce within population variability and promote divergence between isolated pop- ulations, we recommend an extended study of both the genetic structure and breeding systems in the M. angusii/M. unifolia group, in order to ensure that the protection provided is both adequate and justified. Introduction Accurate species-level taxonomic assessment is essential for the effective conservation of biological diversity. Typically, species are a natural taxonomic rank that forms the basis for both conservation assessments and management (Mace 2004). The assessment of habitats for prioritizing conservation efforts requires accurate lists of the constituent species, while effective and efficient conservation of individual threatened species requires that their taxonomic status be unambiguous. This widespread use of species as the ‘unit’ of conservation is largely a consequence of their unique status in the taxo- nomic hierarchy. Species are often seen as having an objective reality, with gene flow, and thus the evolutionary potential to generate further diversity, being mainly restricted to within species (Hey 2001). Despite considerable discussion in the literature regarding the concept of a species, practical limi- tations mean that most species are still described through the traditional assessment of morphological characters. However, it is now widely recognized that for biological diversity to persist, it is essential to Conservation Genetics (2006) 7:847–859 ȑ Springer 2006 DOI 10.1007/s10592-006-9119-8
Transcript of Conservation of taxonomically difficult species: the case of the Australian orchid, Microtis angusii
Conservation of taxonomically difficult species: the case of the Australian
orchid, Microtis angusii
Nicola S. Flanagan1,3,*, Rod Peakall1, Mark A. Clements2 & J. Tupac Otero21School of Botany and Zoology, The Australian National University, Canberra, ACT 0200, Australia; 2Centrefor Plant Biodiversity Research, GPO Box 1600 Canberra, ACT 2601, Australia; 3Present address:Biochemistry Department, University College Cork, Cork, Ireland (*Corresponding author: Phone: +353-21-4904124; Fax: +353-21-4904259; E-mail: [email protected])
Received 18 May 2005; accepted 3 January 2006
Key words: AFLP, clonality, ITS, practical outcomes, species diagnosis
Abstract
As species are the common currency for conservation efforts, their accurate description is essential forefficient preservation of biological diversity. The genus Microtis (Orchidaceae) is typified by a paucity ofconsistent morphological characters, confounding taxonomic attempts. We report the results of a study ofthe conservation genetics of the recently discovered, endangered Australian orchid speciesM. angusii (Jones).This species was known only from one small population, with identification of further populations hamperedby taxonomic difficulties. We used a combination of 122 AFLP markers and DNA sequence variation in theribosomal ITS gene region to investigate the population genetic structure of the type population ofM. angusii. Six further putativeM. angusii populations were also analysed with these markers. Two of thesepopulations showed high genetic affinity toM. angusii, bearing identical ITS sequences. Both the type and asecond population were invariable across all AFLP loci. The third population, 3 km distant, showed minorgenetic differentiation. These two new populations warrant immediate protection. Phylogenetic relationshipsbetween M. angusii and close relatives revealed its genetic affiliation to an unidentified, more distant pop-ulation, and to the species M. unifolia. Given the propensity in Microtis for both selfing and clonality,mechanisms that both reduce within population variability and promote divergence between isolated pop-ulations, we recommend an extended study of both the genetic structure and breeding systems in theM. angusii/M. unifolia group, in order to ensure that the protection provided is both adequate and justified.
Introduction
Accurate species-level taxonomic assessment isessential for the effective conservation of biologicaldiversity. Typically, species are a natural taxonomicrank that forms the basis for both conservationassessments and management (Mace 2004). Theassessment of habitats for prioritizing conservationefforts requires accurate lists of the constituentspecies, while effective and efficient conservation ofindividual threatened species requires that theirtaxonomic status be unambiguous. This widespread
use of species as the ‘unit’ of conservation is largelya consequence of their unique status in the taxo-nomic hierarchy. Species are often seen as havingan objective reality, with gene flow, and thus theevolutionary potential to generate further diversity,being mainly restricted to within species (Hey 2001).
Despite considerable discussion in the literatureregarding the concept of a species, practical limi-tations mean that most species are still describedthrough the traditional assessment of morphologicalcharacters. However, it is now widely recognizedthat for biological diversity to persist, it is essential to
Conservation Genetics (2006) 7:847–859 � Springer 2006DOI 10.1007/s10592-006-9119-8

preserve the ecological and evolutionary processesthrough which diversity is generated, rather thansimply preserving specific phenotypic variants(Frankel 1974; Crandall et al. 2000; Cowling andPressey 2001; Moritz 2002). In this context, Moritz(2002) has noted that the information regarding thedistribution of genetic diversity within a species al-lows the identification of not only historically iso-lated units, but also of the potential for selectivechange through adaptive variation. The former, so-called Evolutionary Significant Units, or ESUs(Moritz 1994), represent independently evolving lin-eages, which, once lost, are impossible to replace,while the latter is of considerable importance for thegeneration of future diversity.
While molecular genetic studies are commonlyused in conservation planning to assess levelsof genetic diversity within threatened species(Hedrick 2001; Amos and Balmford 2001; DeSalle2005), their use for higher-level systematic studieswith relevance to conservation objectives is stilllimited. Three factors should promote the in-creased use of molecular systematic studies inconservation planning (1) the current deficit ofexpert taxonomists (Mace 2004), (2) the sometimesambiguous nature of traditional taxonomicassessment (Hogbin et al. 2000), and (3) the needto incorporate an evolutionary perspective into theassessment of conservation units (Moritz 1994).Molecular genetic data have great potential toresolve taxonomic ambiguities, and to providean independent hypothesis for phylogeneticrelationships, placing species, as the units forconservation, in an evolutionary context. Fur-thermore, effective conservation also requires thatspecies identification in the field is accurate. Con-servation measures are difficult to implement ifexpert taxonomists are not available, and thespecies in question is difficult for even experiencedamateurs to identify. In this case, genetic tech-niques may provide a fast, effective means forspecies identification where field expertise is limited.
Molecular genetic studies are, however, rela-tively costly: a survey of recovery plans forendangered Australian plant species revealed thatfunds for genetic research comprised up to 7% ofthe total budget (Peakall and Sydes 1996). Due tolack of resources to fund all genetic studies, pri-ority must be given to studies that have directapplication to conservation management. In anoverview of the ability of genetic studies to result
in practical outcomes, Peakall and co-workers(Peakall and Sydes 1996; Hogbin et al. 2000)concluded that plants with uncertain taxonomicstatus, clonal plants, and plants targeted fortranslocation had the highest priority for genetic-based research.
The case of the Australian orchid, Microtisangusii (Jones), provides a good example of thepractical application of molecular systematics forconservation management. Microtis angusii, anewly described, rare terrestrial orchid species, wasonly recently discovered growing on a disturbedroadside in the northern suburbs of Sydney, Aus-tralia (Jones 1996). At the time the species wasdescribed it was known only from the type location,which consisted of approximately 100 individualplants. The site had been subject to variousthreatening processes such as road improvementsand encroachment by invasive plants. Microtis an-gusii was listed as a nationally endangered specieson Schedule 1 of the Australian CommonwealthEndangered Species Protection Act 1992 in 1997. Inaccordance with the New South Wales (NSW)Threatened Species Conservation Act, a recoveryplan for the species was prepared, with the long-term objective of maintaining self-sustaining pop-ulations in the wild. There were two main obstaclesto the implementation of this plan. Firstly,Microtisspecies commonly exhibit clonal growth (Peakalland Beattie 1989, 1991), and it was highly likelythat the plants present at the type location wereindividual ramets of a small number of clones.Secondly, the type population was found growingon foreign soil not from the immediate vicinity.This prompted the question of whether the popu-lation might be artificial, having arisen by inten-tional or accidental human-assisted dispersal from alocation where the species may be more common.In order to address these issues and facilitate theachievement of the conservation objectives, it washighly desirable that further populations of thespecies, if any, were identified. This, however, wascomplicated by the difficulties in accurately distin-guishing M. angusii from its close relatives usingonly morphological characters.
The genus Microtis has been relativelyneglected taxonomically. These orchids are smallherbaceous plants, with underground tubersthrough which vegetative reproduction is possible,forming extensive colonies. The inflorescenceemerges from a single leaf, with flowers typically
848
no more than 5 mm across, and of greenish col-oration. Taxonomic efforts have been confoundedas many of the floral characters used to differentiatespecies, such as shape and size of inflorescence orflowers, position of the segments, size and shape oflabellum, apical and basal calli, vary greatly withinand between populations, and even on the sameplant at different points along the inflorescence. Theconspecifics Microtis angusii, M. parviflora (R.Br.)and M. unifolia (Rchb.f.) are easily confused, evenby experienced naturalists.
Given the obstacles to the implementation ofthe species recovery plan, the conservation agen-cies requested the current molecular genetic studyin order to: (1) assess the genetic diversity of thetype population of M. angusii, and (2) determinethe genetic relationships between the type popu-lation and further putative populations of thespecies.
Materials and methods
Sampling strategy
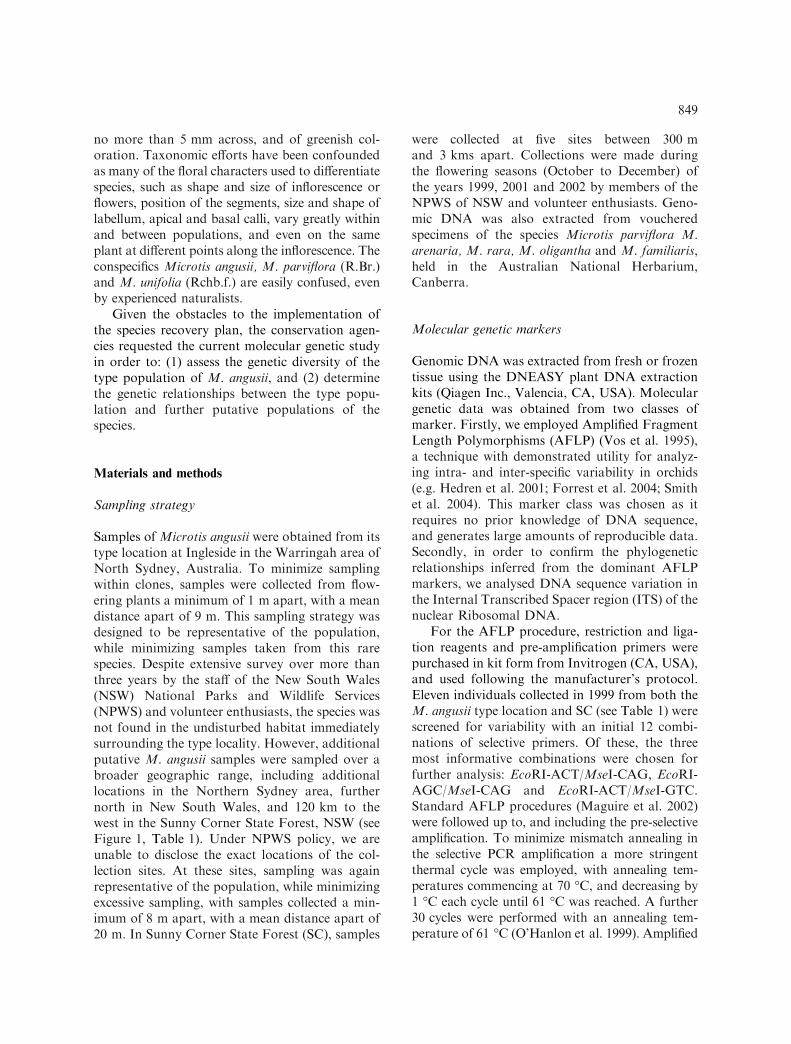
Samples of Microtis angusii were obtained from itstype location at Ingleside in the Warringah area ofNorth Sydney, Australia. To minimize samplingwithin clones, samples were collected from flow-ering plants a minimum of 1 m apart, with a meandistance apart of 9 m. This sampling strategy wasdesigned to be representative of the population,while minimizing samples taken from this rarespecies. Despite extensive survey over more thanthree years by the staff of the New South Wales(NSW) National Parks and Wildlife Services(NPWS) and volunteer enthusiasts, the species wasnot found in the undisturbed habitat immediatelysurrounding the type locality. However, additionalputative M. angusii samples were sampled over abroader geographic range, including additionallocations in the Northern Sydney area, furthernorth in New South Wales, and 120 km to thewest in the Sunny Corner State Forest, NSW (seeFigure 1, Table 1). Under NPWS policy, we areunable to disclose the exact locations of the col-lection sites. At these sites, sampling was againrepresentative of the population, while minimizingexcessive sampling, with samples collected a min-imum of 8 m apart, with a mean distance apart of20 m. In Sunny Corner State Forest (SC), samples
were collected at five sites between 300 mand 3 kms apart. Collections were made duringthe flowering seasons (October to December) ofthe years 1999, 2001 and 2002 by members of theNPWS of NSW and volunteer enthusiasts. Geno-mic DNA was also extracted from voucheredspecimens of the species Microtis parviflora M.arenaria, M. rara, M. oligantha and M. familiaris,held in the Australian National Herbarium,Canberra.
Molecular genetic markers
Genomic DNA was extracted from fresh or frozentissue using the DNEASY plant DNA extractionkits (Qiagen Inc., Valencia, CA, USA). Moleculargenetic data was obtained from two classes ofmarker. Firstly, we employed Amplified FragmentLength Polymorphisms (AFLP) (Vos et al. 1995),a technique with demonstrated utility for analyz-ing intra- and inter-specific variability in orchids(e.g. Hedren et al. 2001; Forrest et al. 2004; Smithet al. 2004). This marker class was chosen as itrequires no prior knowledge of DNA sequence,and generates large amounts of reproducible data.Secondly, in order to confirm the phylogeneticrelationships inferred from the dominant AFLPmarkers, we analysed DNA sequence variation inthe Internal Transcribed Spacer region (ITS) of thenuclear Ribosomal DNA.
For the AFLP procedure, restriction and liga-tion reagents and pre-amplification primers werepurchased in kit form from Invitrogen (CA, USA),and used following the manufacturer’s protocol.Eleven individuals collected in 1999 from both theM. angusii type location and SC (see Table 1) werescreened for variability with an initial 12 combi-nations of selective primers. Of these, the threemost informative combinations were chosen forfurther analysis: EcoRI-ACT/MseI-CAG, EcoRI-AGC/MseI-CAG and EcoRI-ACT/MseI-GTC.Standard AFLP procedures (Maguire et al. 2002)were followed up to, and including the pre-selectiveamplification. To minimize mismatch annealing inthe selective PCR amplification a more stringentthermal cycle was employed, with annealing tem-peratures commencing at 70 �C, and decreasing by1 �C each cycle until 61 �C was reached. A further30 cycles were performed with an annealing tem-perature of 61 �C (O’Hanlon et al. 1999). Amplified
849
fragment profiles were electrophoresed on the 3100Genetic Analyzer (Applied Biosystems, Foster City,CA, USA) with the internal size standard, ‘LIZ’, ineach capillary. Several steps were taken to ensurehighly reproducible data (Peakall et al. 2003). Anegative control was processed through all steps ofthe AFLP procedure, and reproducibility of frag-ment profiles was assessed by the inclusion of rep-licate extractions and amplifications for a subset ofsamples. Due to the incidence of clonality in Mic-rotis spp., polymorphism within a population isexpected to be low. Where such polymorphismswere found, a subset of loci and samples were re-evaluated by repeating the two PCR amplificationstages of the AFLP process.
Automated scoring of AFLP profiles was per-formed using the software Genotyper 2.5. (ABI).Firstly, a subset of all populations, including re-peated samples, was used to identify unambigu-ous, repeatable bands. The multilocus AFLPDNA profiles were scored with the presence ofeach AFLP band as a ‘1’, and the absence of theband as ‘0’. The following statistical analyses wereperformed in GenAlEx 6 (Peakall and Smouse2005). A pairwise individual-by-individual geneticdistance matrix was generated using the Binarydistance option, where the resultant genetic dis-tance amounts to a tally of band differences
between samples (Huff et al. 1993; Maguire et al.2002). This distance matrix was used as input foran Analysis of Molecular Variance (AMOVA)following the methods of Peakall et al. (1995) andMaguire et al. (2002). Congruence between theselective primer sets was assessed through aMantel test of matrix correspondence.
Using the AMOVA framework we imple-mented a hierarchical analysis of the partitioningof genetic variation. The total genetic variationwas partitioned into three levels: within popula-tions, among populations within taxa (defined aposteriori to the phylogenetic analysis, and as de-scribed in Table 2), and among taxa. For thisanalysis, individual ambiguous samples (MA36,MA37 &MA41: see results section) were excluded.Variation was summarized both as the proportionof the total variance and as /-Statistics or F-Statisticanalogues, /PT;/PR and /RT. We retain thenomenclature for the /-Statistics output by GenAl-Ex 6 (Peakall and Smouse 2005), but note that theterm ‘regions’ is taken to mean taxon. Therefore, thestatistic /RT represents the correlation of individualswithin a taxon relative to the total, /PR is the cor-relation of individuals within populations relative tothe taxon, while /PT is the correlation of individualswithin populations relative to the total. Tests forsignificant departure from the null hypothesis of no
Figure 1. Map of collecting localities for M. angusii and further putative populations.
850

Table 1. List of samples used in this study
Sample Code Pop. Code Population Date Species ITS Genbank Accession No.
MA02 SC1 Sunny Corner SF, Site 1 Oct. 1999 M. parviflora DQ104549
MA03 SC3 Sunny Corner SF, Site 3 Oct. 1999 SC-A DQ104541
MA04 SC4 Sunny Corner SF, Site 4 Oct. 1999 SC-A
MA05 SC5 Sunny Corner SF, Site 5 Oct. 1999 SC-A DQ104544
MA06 IN Ingleside Oct. 1999 M. angusii DQ104535
MA07 IN Ingleside Oct. 1999 M. angusii
MA08 IN Ingleside Oct. 1999 M. angusii
MA09 IN Ingleside Oct. 1999 M. angusii
MA10 IN Ingleside Oct. 1999 M. angusii
MA11 IN Ingleside Oct. 1999 M. angusii
MA13 SC1 Sunny Corner SF, Site 1 Dec. 2001 SC-A DQ104539
MA15 SC1 Sunny Corner SF, Site 1 Dec. 2001 SC-A
MA17 SC1 Sunny Corner SF, Site 1 Dec. 2001 SC-A
MA19 SC1 Sunny Corner SF, Site 1 Dec. 2001 SC-A
MA21 SC1 Sunny Corner SF, Site 1 Dec. 2001 M. parviflora DQ104550
MA23 SC1 Sunny Corner SF, Site 1 Dec. 2001 M. parviflora DQ104551
MA24 SC1 Sunny Corner SF, Site 1 Dec. 2001 M. parviflora
MA26 SC2 Sunny Corner SF, Site 2 Dec. 2001 SC-A DQ104540
MA28 SC2 Sunny Corner SF, Site 2 Dec. 2001 SC-A
MA32 SC3 Sunny Corner SF, Site 3 Dec. 2001 SC-A DQ104542
MA34 SC3 Sunny Corner SF, Site 3 Dec. 2001 SC-A
MA36 SC4 Sunny Corner SF, Site 4 Dec. 2001 Hybrid DQ104545
MA37 SC4 Sunny Corner SF, Site 4 Dec. 2001 Hybrid DQ104548
MA39 SC4 Sunny Corner SF, Site 4 Dec. 2001 SC-A DQ104543
MA41 SC4 Sunny Corner SF, Site 4 Dec. 2001 Microtis sp. DQ104557
MA44 IN Ingleside Oct. 2002 M. angusii DQ104536
MA45 MV Monavale Rd. Oct. 2002 M. angusii DQ104537
MA46 MV Monavale Rd. Oct. 2002 M. angusii
MA47 MV Monavale Rd. Oct. 2002 M. angusii
MA48 SF Seaforth Oct. 2002 M. angusii DQ104538
MA49 SF Seaforth Oct. 2002 M. angusii
MA51 SF Seaforth Oct. 2002 M. angusii
MA52 SF Seaforth Oct. 2002 M. angusii
MA53 PH Pennant Hills Park Oct. 2002 M. rara DQ104556
MA54 PH Pennant Hills Park Oct. 2002 M. rara
MA55 PH Pennant Hills Park Oct. 2002 M. rara
MA56 PH Pennant Hills Park Oct. 2002 M. rara
MA57 PH Pennant Hills Park Oct. 2002 M. rara
MA58 HB Hornsby Oct. 2002 M. parviflora DQ104552
MA59 HB Hornsby Oct. 2002 M. parviflora
MA60 HB Hornsby Oct. 2002 M. parviflora
MA61 HB Hornsby Oct. 2002 M. parviflora
MA62 KN Kulnura Oct. 2002 M. parviflora DQ104553
MA63 KN Kulnura Oct. 2002 M. parviflora
MA64 KN Kulnura Oct. 2002 M. parviflora
VOUCHER SPECIMENS
MAClements 9730 Nowra, NSW M. rara AF348045
BPJMolloy 066/98 Christchurch, New Zealand M. unifolia AF348046
BPJMolloy 129/99 Northland, New Zealand M. parviflora DQ104554
BPJMolloy 211/00 Northland, New Zealand M. arenaria DQ104547
851
genetic structure at the respective hierarchical levels(/PT ¼ 0;/RT ¼ 0 etc.) were performed by randompermutation, with the number of permutations set to1000. Statistical significance was declared when thevalue of the /-Statistic was greater than that gener-ated by random permutation at least 95% of thetime.
In order to determine the genetic relationshipsamongst the samples, and infer sample identity,both phenetic and cladistic analyses were per-formed on the AFLP data. For a phenetic analysis,the individual pairwise genetic distances generatedin GenAlEx 6 (see above) were used as input for aNeighbor-Joining (NJ) analysis in PAUP* 4.0b2(Swofford 2000). Branch supports were evaluatedthrough a Bootstrap analysis (branch-and-boundsearch for the MP), with 1000 replicates, with theconsensus tree for NJ bootstraps rooted at aninternal node with basal polytomy. Cladisticanalysis was performed on the presence/absencedata also using PAUP* 4.0b2. Maximum Parsi-mony (MP) analysis was conducted using theheuristic search option, with TBR (tree bisection/reconnection) branch swapping, and multipleparsimonious trees saved at each step (MUL-PARS).
DNA sequence data was obtained for approx750 base pairs encompassing the whole of both theITS-1 and the ITS-2 from representatives of theclades identified through the AFLP analysis.
Where a clade comprised individuals from multi-ple sampling sites, at least one individual from allsites was sequenced. DNA sequence informationwas also obtained for vouchered specimens of thespecies Microtis parviflora M. arenaria, M. oli-gantha and M. familiaris. Additionally, we usedITS sequence data for M. unifolia and M. raraobtained in a previous study (Clements et al.2002). The same primers were used for both PCRand sequencing: ITS5 (5¢-GGAAGTAAAAGTCGTAACAAGG-3¢), located in the 18S ribosomalsubunit, and ITS4 (5¢-TCCTCCGCTTATTGA-TATGC-3¢), in the 28S ribosomal subunit. PCRamplifications followed a standard protocol (Cle-ments et al. 2002). The PCR products werecleaned using Qiaquick columns (Qiagen Inc.), andsequenced in both directions using ABI PRISMBigDye Terminator Cycle Sequencing ReadyReaction Mix (Applied Biosystems). Thesequencing product was precipitated in 60% iso-propanol, and sequenced on the 3100 GeneticAnalyzer (Applied Biosystems). Both strands ofthe sequences were edited using the Sequencher 4.0program (Gene Codes Corp., Ann Arbor, MI,USA), and the resulting consensus sequencesaligned manually.
Phylogenetic relationships between the se-quences were estimated using both MaximumParsimony and Neighbor Joining procedures inPAUP* 4.0b2. For the MP analysis gaps were
Table 1. (continued)
Sample Code Pop. Code Population Date Species ITS Genbank Accession No.
BPJMolloy 063/98 Craigieburn, New Zealand M. oligantha DQ104558
CJFrench 3287 Two Peoples Bay Rd,
Western Australia
M. familiaris DQ104559
Table 2. Patterns of AFLP band distributions within populations and within the species M. angusii and M. parviflora. Aggregation ofpopulations into species was performed a posteriori to the phylogenetic analyses. The Sunny Corner samples do not include thegenetically distinct specimens, MA36, MA37 and MA41
By Populations By Species
M. angusii M. parviflora M. rara M. angusii M. parviflora
IN MV SF SC-A SC-B KN HB PH (IN, MV & SF) (SC-B, KN & HB)
N 7 3 4 12 4 3 4 5 14 11
No. Bands 38 38 38 55 52 51 51 46 39 55
No. Private Bands 0 0 1 5 1 0 0 18 3 21
\% P 0.00 0.00 0.82 0.00 12.30 7.38 9.02 4.92 2.46 16.39
852
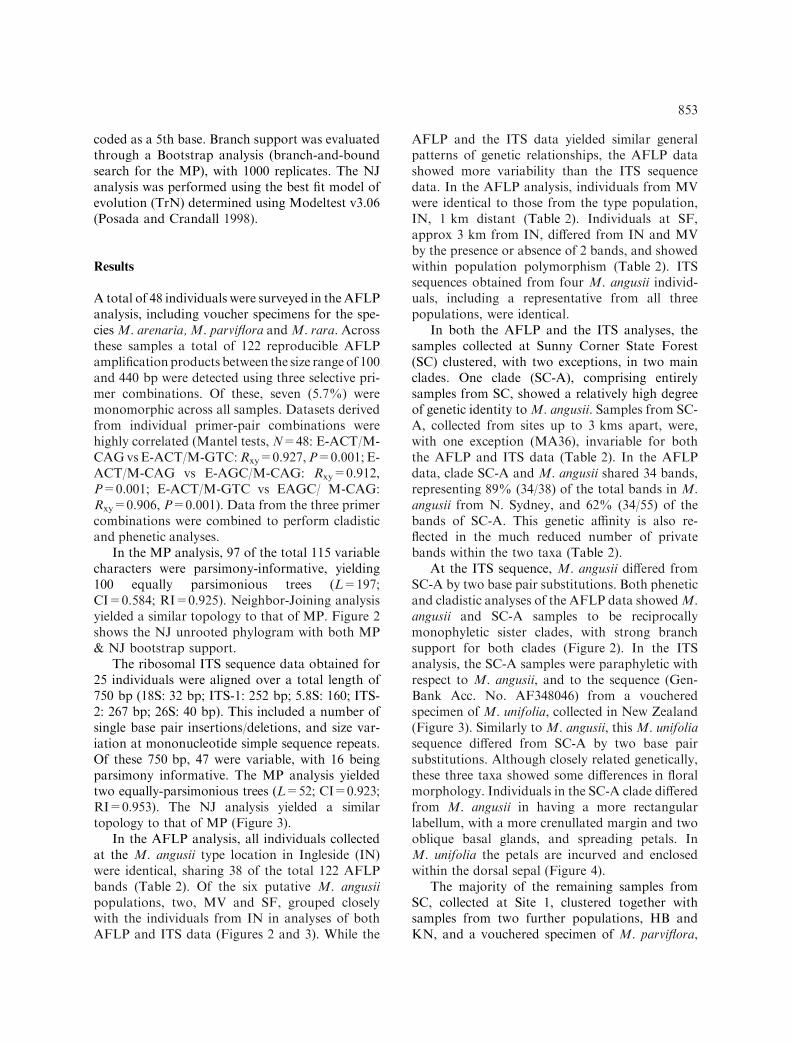
coded as a 5th base. Branch support was evaluatedthrough a Bootstrap analysis (branch-and-boundsearch for the MP), with 1000 replicates. The NJanalysis was performed using the best fit model ofevolution (TrN) determined using Modeltest v3.06(Posada and Crandall 1998).
Results
A total of 48 individuals were surveyed in the AFLPanalysis, including voucher specimens for the spe-ciesM. arenaria, M. parviflora andM. rara. Acrossthese samples a total of 122 reproducible AFLPamplification products between the size range of 100and 440 bp were detected using three selective pri-mer combinations. Of these, seven (5.7%) weremonomorphic across all samples. Datasets derivedfrom individual primer-pair combinations werehighly correlated (Mantel tests, N=48: E-ACT/M-CAGvsE-ACT/M-GTC:Rxy=0.927,P=0.001; E-ACT/M-CAG vs E-AGC/M-CAG: Rxy=0.912,P=0.001; E-ACT/M-GTC vs EAGC/ M-CAG:Rxy=0.906, P=0.001). Data from the three primercombinations were combined to perform cladisticand phenetic analyses.
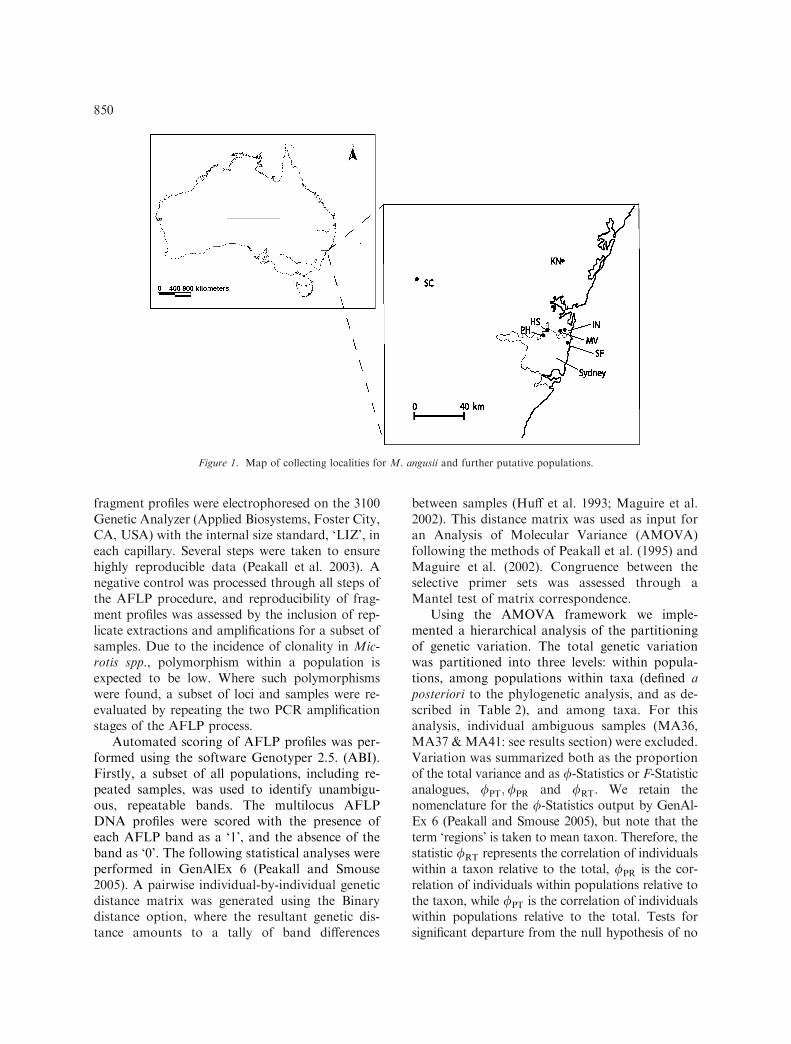
In the MP analysis, 97 of the total 115 variablecharacters were parsimony-informative, yielding100 equally parsimonious trees (L=197;CI=0.584; RI=0.925). Neighbor-Joining analysisyielded a similar topology to that of MP. Figure 2shows the NJ unrooted phylogram with both MP& NJ bootstrap support.
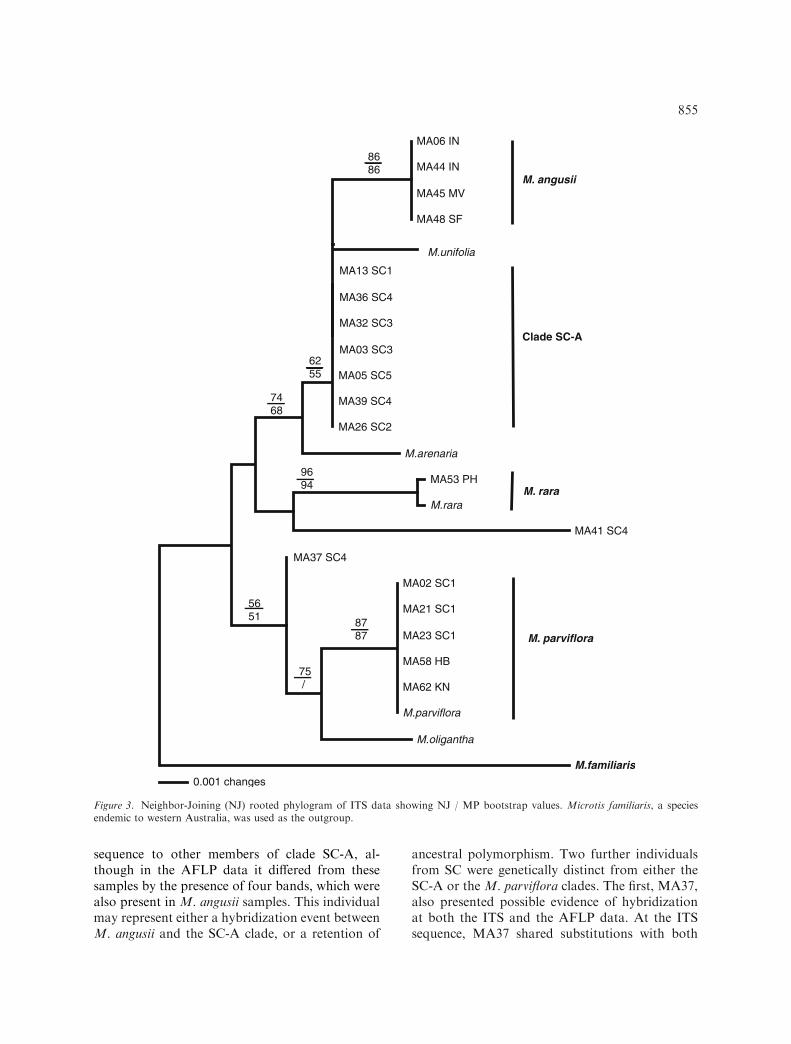
The ribosomal ITS sequence data obtained for25 individuals were aligned over a total length of750 bp (18S: 32 bp; ITS-1: 252 bp; 5.8S: 160; ITS-2: 267 bp; 26S: 40 bp). This included a number ofsingle base pair insertions/deletions, and size var-iation at mononucleotide simple sequence repeats.Of these 750 bp, 47 were variable, with 16 beingparsimony informative. The MP analysis yieldedtwo equally-parsimonious trees (L=52; CI=0.923;RI=0.953). The NJ analysis yielded a similartopology to that of MP (Figure 3).
In the AFLP analysis, all individuals collectedat the M. angusii type location in Ingleside (IN)were identical, sharing 38 of the total 122 AFLPbands (Table 2). Of the six putative M. angusiipopulations, two, MV and SF, grouped closelywith the individuals from IN in analyses of bothAFLP and ITS data (Figures 2 and 3). While the
AFLP and the ITS data yielded similar generalpatterns of genetic relationships, the AFLP datashowed more variability than the ITS sequencedata. In the AFLP analysis, individuals from MVwere identical to those from the type population,IN, 1 km distant (Table 2). Individuals at SF,approx 3 km from IN, differed from IN and MVby the presence or absence of 2 bands, and showedwithin population polymorphism (Table 2). ITSsequences obtained from four M. angusii individ-uals, including a representative from all threepopulations, were identical.
In both the AFLP and the ITS analyses, thesamples collected at Sunny Corner State Forest(SC) clustered, with two exceptions, in two mainclades. One clade (SC-A), comprising entirelysamples from SC, showed a relatively high degreeof genetic identity toM. angusii. Samples from SC-A, collected from sites up to 3 kms apart, were,with one exception (MA36), invariable for boththe AFLP and ITS data (Table 2). In the AFLPdata, clade SC-A and M. angusii shared 34 bands,representing 89% (34/38) of the total bands in M.angusii from N. Sydney, and 62% (34/55) of thebands of SC-A. This genetic affinity is also re-flected in the much reduced number of privatebands within the two taxa (Table 2).
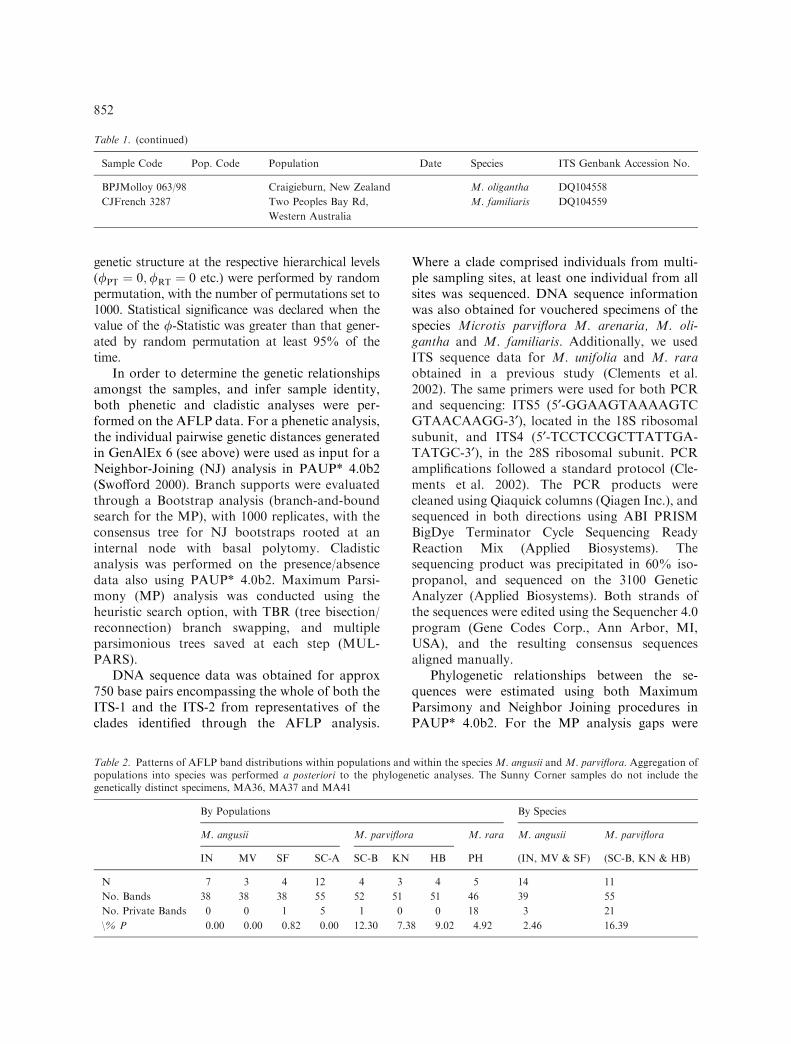
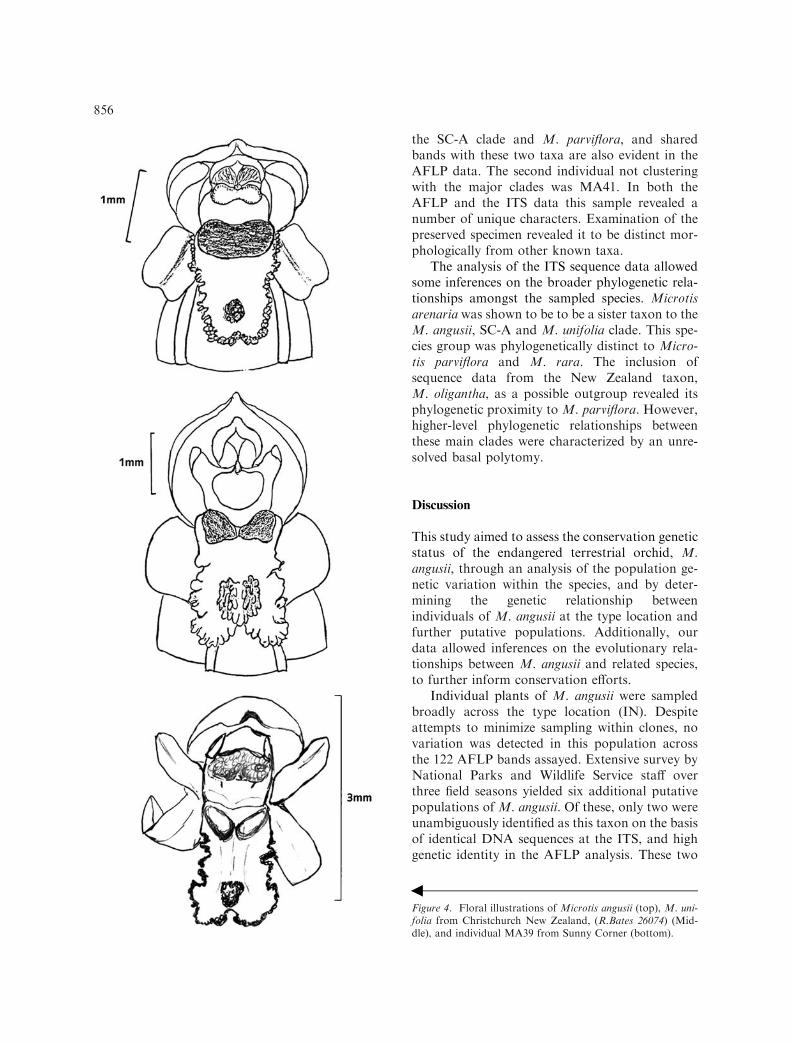
At the ITS sequence, M. angusii differed fromSC-A by two base pair substitutions. Both pheneticand cladistic analyses of the AFLP data showedM.angusii and SC-A samples to be reciprocallymonophyletic sister clades, with strong branchsupport for both clades (Figure 2). In the ITSanalysis, the SC-A samples were paraphyletic withrespect to M. angusii, and to the sequence (Gen-Bank Acc. No. AF348046) from a voucheredspecimen of M. unifolia, collected in New Zealand(Figure 3). Similarly to M. angusii, this M. unifoliasequence differed from SC-A by two base pairsubstitutions. Although closely related genetically,these three taxa showed some differences in floralmorphology. Individuals in the SC-A clade differedfrom M. angusii in having a more rectangularlabellum, with a more crenullated margin and twooblique basal glands, and spreading petals. InM. unifolia the petals are incurved and enclosedwithin the dorsal sepal (Figure 4).
The majority of the remaining samples fromSC, collected at Site 1, clustered together withsamples from two further populations, HB andKN, and a vouchered specimen of M. parviflora,
853

collected in New Zealand in the AFLP analysis.Individuals from these populations had an iden-tical ITS sequence to that of the voucheredM. parviflora, confirming their identity. The finalpopulation, PH, clustered with the M. rara vou-chered specimen in the AFLP analysis and alsohad an identical ITS sequence to M. rara. Allthese apparent M. parviflora and M. rara popu-lations showed within-population variability(Table 2).
Analysis of Molecular Variance (AMOVA)across all populations revealed that only 4% of thetotal genetic variation was distributed amongindividuals within populations, and only 3%among populations within each taxa, and a sub-stantial 93% was distributed among the taxa(/PT ¼ 0:955;/PR ¼ 0:386;/RT ¼ 0:927, respec-tively).
Three of the 48 samples were distinct. Theindividual MA36, yielded an identical ITS
M.arenaria
MA41 SC4
MA59 HB
MA02 SC1MA63 KN
MA21 SC1
MA23 SC1
MA62 KNMA58 HB
M.parviflora
MA64 KNMA61 HBMA60 HB
MA24 SC1
MA37 SC4
M.raraMA56 PH
MA54 PHMA53 PH
MA55 PH
MA57 PH
MA52 SF
MA48 SF
MA51 SFMA49 SF
MA08 IN
MA10 IN
MA44 IN
MA47 MVMA46 MVMA45 MV
MA11 IN
MA09 IN
MA07 INMA06 IN
MA36 SC4
MA34 SC3
MA28 SC2
MA19 SC1
MA15 SC1
MA05 SC5
MA03 SC3MA04 SC4
MA13 SC1
MA17 SC1
MA26 SC2
MA32 SC3
MA39 SC4
0.01 changes
100 96
9891
98 /
/57
6370
100100 78
74
100100
Clade SC-A
M. angusii
M. rara
M. parviflora,includingsamples SC-B
Figure 2. Neighbor-Joining (NJ) unrooted phylogram of AFLP data showing support for the major groups through both NJ/MPbootstrap values.
854
sequence to other members of clade SC-A, al-though in the AFLP data it differed from thesesamples by the presence of four bands, which werealso present in M. angusii samples. This individualmay represent either a hybridization event betweenM. angusii and the SC-A clade, or a retention of
ancestral polymorphism. Two further individualsfrom SC were genetically distinct from either theSC-A or the M. parviflora clades. The first, MA37,also presented possible evidence of hybridizationat both the ITS and the AFLP data. At the ITSsequence, MA37 shared substitutions with both
MA06 IN
MA44 IN
MA45 MV
MA48 SF
MA03 SC3
MA13 SC1
MA36 SC4
MA32 SC3
M.unifolia
MA05 SC5
MA39 SC4
MA26 SC2
M.arenaria
MA53 PH
M.rara
MA41 SC4
MA37 SC4
MA02 SC1
MA21 SC1
MA23 SC1
MA58 HB
MA62 KN
M.parviflora
M.oligantha
M.familiaris
0.001 changes
8686
6255
7468
9694
5651
75 /
8787
M. angusii
Clade SC-A
M. parviflora
M. rara
Figure 3. Neighbor-Joining (NJ) rooted phylogram of ITS data showing NJ / MP bootstrap values. Microtis familiaris, a speciesendemic to western Australia, was used as the outgroup.
855
the SC-A clade and M. parviflora, and sharedbands with these two taxa are also evident in theAFLP data. The second individual not clusteringwith the major clades was MA41. In both theAFLP and the ITS data this sample revealed anumber of unique characters. Examination of thepreserved specimen revealed it to be distinct mor-phologically from other known taxa.
The analysis of the ITS sequence data allowedsome inferences on the broader phylogenetic rela-tionships amongst the sampled species. Microtisarenaria was shown to be to be a sister taxon to theM. angusii, SC-A and M. unifolia clade. This spe-cies group was phylogenetically distinct to Micro-tis parviflora and M. rara. The inclusion ofsequence data from the New Zealand taxon,M. oligantha, as a possible outgroup revealed itsphylogenetic proximity to M. parviflora. However,higher-level phylogenetic relationships betweenthese main clades were characterized by an unre-solved basal polytomy.
Discussion
This study aimed to assess the conservation geneticstatus of the endangered terrestrial orchid, M.angusii, through an analysis of the population ge-netic variation within the species, and by deter-mining the genetic relationship betweenindividuals of M. angusii at the type location andfurther putative populations. Additionally, ourdata allowed inferences on the evolutionary rela-tionships between M. angusii and related species,to further inform conservation efforts.
Individual plants of M. angusii were sampledbroadly across the type location (IN). Despiteattempts to minimize sampling within clones, novariation was detected in this population acrossthe 122 AFLP bands assayed. Extensive survey byNational Parks and Wildlife Service staff overthree field seasons yielded six additional putativepopulations of M. angusii. Of these, only two wereunambiguously identified as this taxon on the basisof identical DNA sequences at the ITS, and highgenetic identity in the AFLP analysis. These two
Figure 4. Floral illustrations of Microtis angusii (top), M. uni-folia from Christchurch New Zealand, (R.Bates 26074) (Mid-dle), and individual MA39 from Sunny Corner (bottom).
m
856
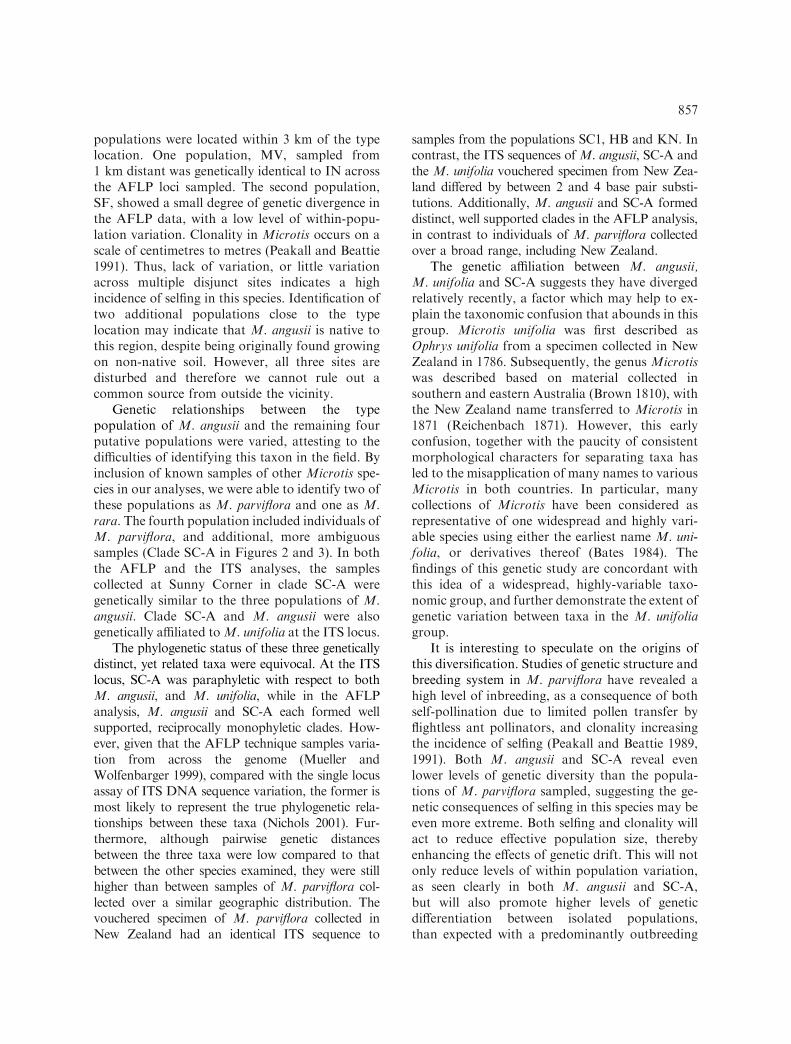
populations were located within 3 km of the typelocation. One population, MV, sampled from1 km distant was genetically identical to IN acrossthe AFLP loci sampled. The second population,SF, showed a small degree of genetic divergence inthe AFLP data, with a low level of within-popu-lation variation. Clonality in Microtis occurs on ascale of centimetres to metres (Peakall and Beattie1991). Thus, lack of variation, or little variationacross multiple disjunct sites indicates a highincidence of selfing in this species. Identification oftwo additional populations close to the typelocation may indicate that M. angusii is native tothis region, despite being originally found growingon non-native soil. However, all three sites aredisturbed and therefore we cannot rule out acommon source from outside the vicinity.
Genetic relationships between the typepopulation of M. angusii and the remaining fourputative populations were varied, attesting to thedifficulties of identifying this taxon in the field. Byinclusion of known samples of other Microtis spe-cies in our analyses, we were able to identify two ofthese populations as M. parviflora and one as M.rara. The fourth population included individuals ofM. parviflora, and additional, more ambiguoussamples (Clade SC-A in Figures 2 and 3). In boththe AFLP and the ITS analyses, the samplescollected at Sunny Corner in clade SC-A weregenetically similar to the three populations of M.angusii. Clade SC-A and M. angusii were alsogenetically affiliated toM. unifolia at the ITS locus.
The phylogenetic status of these three geneticallydistinct, yet related taxa were equivocal. At the ITSlocus, SC-A was paraphyletic with respect to bothM. angusii, and M. unifolia, while in the AFLPanalysis, M. angusii and SC-A each formed wellsupported, reciprocally monophyletic clades. How-ever, given that the AFLP technique samples varia-tion from across the genome (Mueller andWolfenbarger 1999), compared with the single locusassay of ITS DNA sequence variation, the former ismost likely to represent the true phylogenetic rela-tionships between these taxa (Nichols 2001). Fur-thermore, although pairwise genetic distancesbetween the three taxa were low compared to thatbetween the other species examined, they were stillhigher than between samples of M. parviflora col-lected over a similar geographic distribution. Thevouchered specimen of M. parviflora collected inNew Zealand had an identical ITS sequence to
samples from the populations SC1, HB and KN. Incontrast, the ITS sequences of M. angusii, SC-A andthe M. unifolia vouchered specimen from New Zea-land differed by between 2 and 4 base pair substi-tutions. Additionally, M. angusii and SC-A formeddistinct, well supported clades in the AFLP analysis,in contrast to individuals of M. parviflora collectedover a broad range, including New Zealand.
The genetic affiliation between M. angusii,M. unifolia and SC-A suggests they have divergedrelatively recently, a factor which may help to ex-plain the taxonomic confusion that abounds in thisgroup. Microtis unifolia was first described asOphrys unifolia from a specimen collected in NewZealand in 1786. Subsequently, the genus Microtiswas described based on material collected insouthern and eastern Australia (Brown 1810), withthe New Zealand name transferred to Microtis in1871 (Reichenbach 1871). However, this earlyconfusion, together with the paucity of consistentmorphological characters for separating taxa hasled to the misapplication of many names to variousMicrotis in both countries. In particular, manycollections of Microtis have been considered asrepresentative of one widespread and highly vari-able species using either the earliest name M. uni-folia, or derivatives thereof (Bates 1984). Thefindings of this genetic study are concordant withthis idea of a widespread, highly-variable taxo-nomic group, and further demonstrate the extent ofgenetic variation between taxa in the M. unifoliagroup.
It is interesting to speculate on the origins ofthis diversification. Studies of genetic structure andbreeding system in M. parviflora have revealed ahigh level of inbreeding, as a consequence of bothself-pollination due to limited pollen transfer byflightless ant pollinators, and clonality increasingthe incidence of selfing (Peakall and Beattie 1989,1991). Both M. angusii and SC-A reveal evenlower levels of genetic diversity than the popula-tions of M. parviflora sampled, suggesting the ge-netic consequences of selfing in this species may beeven more extreme. Both selfing and clonality willact to reduce effective population size, therebyenhancing the effects of genetic drift. This will notonly reduce levels of within population variation,as seen clearly in both M. angusii and SC-A,but will also promote higher levels of geneticdifferentiation between isolated populations,than expected with a predominantly outbreeding
857

species. These characteristics are not unique toMicrotis, and may be an important determinant ofthe high levels of genetic differentiation seen insome other orchid species (Tremblay et al. 2005),for example, some Australian Chiloglottis species(Mant et al. 2005a), although not in all species(e.g. Mant et al. 2005b). Additionally,Microtis sppare generally weedy plants, and are well adaptedfor the colonization of new sites, as the occurrenceof M. angusii on disturbed soil aptly demonstrates.Such colonization events will also tend to increasethe genetic divergence between populationsthrough the random sampling of founder individ-uals.
This study was initiated as an investigation intothe conservation genetics of M. angusii, howeverthe findings clearly indicate the need for furthergenetic investigation with more widespreadsampling in order to fully resolve the nature of theM. angusii/M. unifolia taxonomic group. Such astudy will have important conservation ramifica-tions as it may identify further taxonomic entities,such as the SC-A clade, which if recognized asspecies, will merit protection equivalent to thatenjoyed by M. angusii. On the other hand, al-though these taxa clearly represent historicallyisolated units, if they are predominantly clonalentities, with little within population diversity,they may have limited adaptive potential. With theobjective to conserve both existing diversity andthe potential to generate future diversity, in theface of limited resources, it is important that theevolutionary dynamics of taxonomic groups suchas this M. angusii/SC-A/M. unifolia clade be morethoroughly understood. Given that the breedingsystem traits of selfing and clonality will tend toincrease population differentiation, a more com-prehensive sampling may reveal that, in fact, theclades identified here represent just two geneticallydiverged populations in a much more widespreadspecies. The detection, in the individual MA36, ofpossible evidence for gene flow between M. angusiiand SC-A suggests this may be a very real possi-bility.
Practical outcomes for conservation management
This study has yielded two important findings thathave clear short and longer term conservationimplications. Firstly, our genetic data have iden-tified two further populations of the endangered
species Microtis angusii, expanding the range andnumber of sites represented by this species. Thisfinding should lead to an immediate practicaloutcome in management, with measures taken asquickly as possible to extend protection to thesepopulations. Secondly, the genetic affiliationbetween M. angusii, M. unifolia and the samples inclade SC-A indicates that this taxonomic groupingrequires further investigation through studies ofboth genetic structure and breeding systems. Suchstudies will ensure that we conserve the full rangeof biological diversity represented by this group.
Acknowledgements
This study was funded by the National Parks andWildlife Service, New South Wales, Australia, theAustralian National University and the GatsbyFoundation. We thank T. Duratovic, P. Eygel-shoven, M. Price, J. Riley and K. Tuckey formaking collections; David L. Jones for his expertadvice; Dan Ebert and Ish Sharma for technicalassistance; and Lyn Cook for helpful discussion.
References
Amos W, Balmford A (2001) When does conservation genetics
matter? Heredity, 87, 257–265.
Bates R (1984) The genus Microtis R.Br. (Orchidaceae): a
taxonomic revision with notes on biology. J. Adelaide
Botanical Garden, 7, 45–89.
Brown R (1810) Prodomus Florae Novae Hollandiae. J. Johnson
& Co., London.
Clements MA, Jones DL, Sharma IK, Nightingale ME, Garratt
MJ, Fitzgerald KJ, Mackenzie AM, Molloy BPJ (2002)
Phylogenetic systematics of the Diurideae (Orchidaceae)
based on the ITS and 5.8S coding region of nuclear ribo-
somal DNA. Lindleyana, 17, 135–171.
Cowling RM, Pressey RL (2001) Rapid plant diversification:
planning for an evolutionary future. Proc. Natl. Acad. Sci.
USA, 98, 5452–5457.
Crandall KA, Bininda-Edmonds ORP, Mace GM, Wayne RK
(2000) Considering evolutionary processes in conservation
biology. Trends Ecol. Evol., 15, 290–295.
DeSalle R (2005) Conservation Genetics – Genetics at the brink
of extinction. Heredity, 94, 386–387.
Forrest AD, Hollingsworth ML, Hollingsworth PM, Sydes C,
Bateman RM (2004) Population genetic structure in Euro-
pean populations of Spiranthes romanzoffiana set in the
context of other genetic studies on orchids. Heredity, 92,
218–227.
Frankel OH (1974) Genetic conservation: our evolutionary
responsibility. Genetics, 78, 53–65.
858
HedrenM,FayMF,ChaseMW(2001)Amplifiedfragment length
polymorphisms (AFLP) reveal details of polyploid evolution
inDactylorhiza (Orchidaceae).Am. J. Bot., 88, 1868–1880.
Hedrick PW (2001) Conservation genetics: where are we now?
Trends Ecol. Evol., 16, 629–636.
Hey J (2001) The mind of the species problem. Trends Ecol.
Evol., 16, 326–329.
Hogbin PM, Peakall R, Sydes MA (2000) Achieving practical
outcomes from genetic studies of rare Australian plants.
Aust. J. Bot., 48, 375–382.
Huff DR, Peakall R, Smouse PE (1993) RAPD variation within
and among matural populations of outcrossing buffalograss
(Buchloe dactyloides (Nutt.) Engelm). Theor. Appl. Genet.,
86, 927–934.
Jones DL (1996) Microtis angusii, a new species of Orchidaceae
from Australia. The Orchadian, 12, 10–12.
Mace GM (2004) The role of taxonomy in species conservation.
Philos. Trans. R. Soc. London B, 359, 711–719.
Maguire TL, Peakall R, Saenger P (2002) Comparative analysis
of genetic diversity in the mangrove species Avicennia mar-
ina (Forsk.) Vierh. (Avicenniaceae) detected by AFLPs and
SSRs. Theor. Appl. Genet., 104, 388–398.
Mant J, Bower CC, Weston PH, Peakall R (2005a) Phyloge-
ography of pollinator-specific sexually deceptive Chiloglottis
taxa (Orchidaceae): evidence for sympatric divergence. Mol.
Ecol., in press.
MantJ,PeakallR,SchiestlFP(2005b)Doesselectiononfloralodor
promote differentiation among populations and species of the
sexuallydeceptiveorchidgenus,Ophrys?Evolution, inpress.
Moritz C (1994) Defining ‘‘Evolutionary Significant Units’’ for
conservation. Trends Ecol. Evol., 9, 373–375.
Moritz C (2002) Strategies to protect biological diversity and
the evolutionary processes that sustain it. Syst. Biol., 51,
238–254.
Mueller UG, Wolfenbarger LL (1999) AFLP genotyping and
fingerprinting. Trends Ecol. Evol., 14, 389–394.
Nichols R (2001) Gene trees and species trees are not the same.
Trends Ecol. Evol., 16, 358–364.
O’Hanlon PC, Peakall R, Briese DT (1999) Amplified fragment
length polymorphism (AFLP) reveals introgression in weedy
Onopordum thistles: hybridization and invasion. Mol. Ecol.,
8, 1239–1246.
Peakall R, Beattie AJ (1989) Pollination of the orchid Microtis
parviflora R.Br. by flightless worker ants. Funct. Ecol., 3,
515–522.
Peakall R, Beattie AJ (1991) The genetic consequences of
worker ant pollination on a selfcompatible, clonal orchid.
Evolution, 45, 1837–1848.
Peakall R, Smouse PE, Huff DR (1995) Evolutionary implica-
tions of allozyme and RAPD variation in diploid popula-
tions of dioecious buffalograss (Buchloe dactyloides (Nutt.)
Engelm.). Mol. Ecol., 4, 135–147.
Peakall R, Sydes MA (1996) Defining priorities for achieving
practical outcomes from the genetic studies of rare plants. In:
Back from the Brink: Refining the Threatened Species
Recovery Process (eds. Stephens S, Maxwell S), pp. 119–129.
Beatty & Sons, Surrey.
Peakall R, Ebert D, Scott LJ, Meagher PF, Offord CA (2003)
Comparative genetic study confirms exceptionally low
genetic variation in the ancient and endangered relictual
conifer, Wollemia nobilis (Araucariaceae). Mol. Ecol., 12,
2331–2343.
Peakall R, Smouse PE (2005) GenAlEx 6: Genetic Analysis in
Excel. Population Genetic Software for Teaching and Re-
search, The Australian National University, Canberra,
Australiahttp://www.anu.edu.au/BoZo/GenAlEx/
Posada D, Crandall KA (1998) MODELTEST: testing the
model of DNA substitution. Bioinformatics, 14, 817–818.
Reichenbach HG (1871) Beitrage zur Systematischen Pflan-
zenkunde. Hamburg.
Smith SD, Cowan RS, Gregg KB, Chase MW, Maxted N, Fay
MF (2004) Genetic discontinuities among populations of
Cleistes (Orchidaceae, Vanilloideae) in North America. Bot.
J. Linn. Soc., 145, 87–95.
Swofford DL (2000) PAUP*. Phylogenetic analysis using par-
simony (*and other methods), Sunderland, MA.
Tremblay RL, Ackerman JD, Zimmerman JK, Calvo RN
(2005) Variation in sexual reproduction in orchids and its
evolutiony consaequences: a spasmodic journey to diversifi-
cation. Biol. J. Linn. Soc., 84, 1–54.
Vos P, Hogers R, Bleeker M, Reijans M, Vandelee T, Hornes
M, Frijters A, Pot J, Peleman J, Kuiper M, Zabeau M (1995)
AFLP – a new technique for DNA-fingerprinting. Nucleic
Acids Res., 23, 4407–4414.
859