Connecting solar flare hard X-ray spectra to in situ electron ...
16
Astronomy & Astrophysics manuscript no. main ©ESO 2021 August 23, 2021 Connecting solar flare hard X-ray spectra to in situ electron spectra A comparison of RHESSI and STEREO/SEPT observations N. Dresing 1, 7 , A. Warmuth 2 , F. Effenberger 3, 4 , K.-L. Klein 5 , S. Musset 6, 7 , L. Glesener 6 , and M. Brüdern 8 1 Department of Physics and Astronomy, University of Turku, Finland e-mail: [email protected] 2 Leibniz-Institut für Astrophysik Potsdam (AIP), An der Sternwarte 16, 14482 Potsdam, Germany e-mail: [email protected] 3 Institut für Theoretische Physik, IV, Ruhr-Universität Bochum, 44780 Bochum, Germany e-mail: [email protected] 4 Bay Area Environmental Research Institute, NASA Research Park, Moffett Field, CA, USA 5 LESIA – Observatoire de Paris, Univ. PSL, CNRS, Sorbonne Univ., Univ. de Paris, 5 place Jules Janssen, F- 92190 Meudon, France 6 University of Minnesota, Minneapolis, MN, USA 7 European Space Agency (ESA), European Space Research and Technology Centre (ESTEC), Keplerlaan 1, 2201 AZ, Noordwijk, The Netherlands 8 Institut für Experimentelle und Angewandte Physik, Universität Kiel, 24118, Kiel, Germany ABSTRACT Aims. We aim to constrain the acceleration, injection, and transport processes of flare-accelerated energetic electrons by comparing their characteristics at the Sun with those injected into interplanetary space. Methods. We have identified 17 energetic electron events well-observed with the SEPT instrument aboard STEREO which show a clear association with a hard X-ray (HXR) flare observed with the RHESSI spacecraft. We compare the spectral indices of the RHESSI HXR spectra with those of the interplanetary electrons. Because of the frequent double-power-law shape of the in situ electron spectra, we paid special attention to the choice of the spectral index used for comparison. Results. The time difference between the electron onsets and the associated type III and microwave bursts suggests that the electron events are detected at 1 AU with apparent delays ranging from 9 to 41 minutes. While the parent solar activity is clearly impulsive, also showing a high correlation with extreme ultraviolet jets, most of the studied events occur in temporal coincidence with coronal mass ejections (CMEs). In spite of the observed onset delays and presence of CMEs in the low corona, we find a significant correlation of about 0.8 between the spectral indices of the HXR flare and the in situ electrons. The correlations increase if only events with significant anisotropy are considered. This suggests that transport effects can alter the injected spectra leading to a strongly reduced imprint of the flare acceleration. Conclusions. We conclude that interplanetary transport effects must be taken into account when inferring the initial acceleration of solar energetic electron events. Although our results suggest a clear imprint of flare acceleration for the analyzed event sample, a secondary acceleration might be present which could account for the observed delays. However, the limited and variable pitch-angle coverage of SEPT could also be the reason for the observed delays. Key words. – Sun – 1. Introduction In solar flares, energy that is stored in nonpotential coronal magnetic fields is released impulsively, presumably triggered by magnetic reconnection. In response, the solar atmosphere emits electromagnetic radiation over the whole wavelength range from radio to gamma rays (e.g., Fletcher et al. 2011). Analyses of this emission recorded by remote-sensing instruments have re- vealed key insights into the physics of solar flares. In particular, the observation of nonthermal bremsstrahlung in the hard X-ray (HXR) range has shown that electrons are efficiently accelerated in flares and carry a significant fraction of the energy released (cf. Holman et al. 2011; Warmuth & Mann 2020). While non- thermal HXRs are primarily produced by electrons that precip- itate into deeper layers of the solar atmosphere, electrons can also propagate upward through the corona and into interplane- tary space. This is revealed by type III radio bursts, which are rapidly drifting structures observed in dynamic radio spectra (cf. White et al. 2011; Reid & Ratcliffe 2014). They are generated by escaping electron beams that excite Langmuir turbulence in the ambient plasma, which is subsequently converted to electro- magnetic radiation. Such interplanetary electron beams can be detected in situ by particle instruments on spacecraft. However, one common feature of solar electron events has challenged our understand- ing of the parent acceleration process for decades, which is a frequently observed delay of 10-20 minutes between the occur- rence of the solar counterpart, for example flare or radio type III burst, and the inferred injection time of the electrons based on their observed onset times at the spacecraft (e.g., Haggerty & Roelof 2002; Kahler et al. 2007). These delays were often in- terpreted as an indication of a different acceleration process, for instance a coronal or CME-driven shock (e.g., Haggerty et al. Article number, page 1 of 16 arXiv:2108.09045v1 [astro-ph.SR] 20 Aug 2021
-
Upload
khangminh22 -
Category
Documents
-
view
1 -
download
0
Transcript of Connecting solar flare hard X-ray spectra to in situ electron ...

Astronomy & Astrophysics manuscript no. main ©ESO 2021August 23, 2021
Connecting solar flare hard X-ray spectra to in situ electron spectra
A comparison of RHESSI and STEREO/SEPT observations
N. Dresing1, 7, A. Warmuth2, F. Effenberger3, 4, K.-L. Klein5, S. Musset6, 7, L. Glesener6, and M. Brüdern8
1 Department of Physics and Astronomy, University of Turku, Finlande-mail: [email protected]
2 Leibniz-Institut für Astrophysik Potsdam (AIP), An der Sternwarte 16, 14482 Potsdam, Germanye-mail: [email protected]
3 Institut für Theoretische Physik, IV, Ruhr-Universität Bochum, 44780 Bochum, Germanye-mail: [email protected]
4 Bay Area Environmental Research Institute, NASA Research Park, Moffett Field, CA, USA5 LESIA – Observatoire de Paris, Univ. PSL, CNRS, Sorbonne Univ., Univ. de Paris, 5 place Jules Janssen, F- 92190 Meudon, France6 University of Minnesota, Minneapolis, MN, USA7 European Space Agency (ESA), European Space Research and Technology Centre (ESTEC), Keplerlaan 1, 2201 AZ, Noordwijk,
The Netherlands8 Institut für Experimentelle und Angewandte Physik, Universität Kiel, 24118, Kiel, Germany
ABSTRACT
Aims. We aim to constrain the acceleration, injection, and transport processes of flare-accelerated energetic electrons by comparingtheir characteristics at the Sun with those injected into interplanetary space.Methods. We have identified 17 energetic electron events well-observed with the SEPT instrument aboard STEREO which show aclear association with a hard X-ray (HXR) flare observed with the RHESSI spacecraft. We compare the spectral indices of the RHESSIHXR spectra with those of the interplanetary electrons. Because of the frequent double-power-law shape of the in situ electron spectra,we paid special attention to the choice of the spectral index used for comparison.Results. The time difference between the electron onsets and the associated type III and microwave bursts suggests that the electronevents are detected at 1 AU with apparent delays ranging from 9 to 41 minutes. While the parent solar activity is clearly impulsive, alsoshowing a high correlation with extreme ultraviolet jets, most of the studied events occur in temporal coincidence with coronal massejections (CMEs). In spite of the observed onset delays and presence of CMEs in the low corona, we find a significant correlationof about 0.8 between the spectral indices of the HXR flare and the in situ electrons. The correlations increase if only events withsignificant anisotropy are considered. This suggests that transport effects can alter the injected spectra leading to a strongly reducedimprint of the flare acceleration.Conclusions. We conclude that interplanetary transport effects must be taken into account when inferring the initial acceleration ofsolar energetic electron events. Although our results suggest a clear imprint of flare acceleration for the analyzed event sample, asecondary acceleration might be present which could account for the observed delays. However, the limited and variable pitch-anglecoverage of SEPT could also be the reason for the observed delays.
Key words. – Sun –
1. Introduction
In solar flares, energy that is stored in nonpotential coronalmagnetic fields is released impulsively, presumably triggered bymagnetic reconnection. In response, the solar atmosphere emitselectromagnetic radiation over the whole wavelength range fromradio to gamma rays (e.g., Fletcher et al. 2011). Analyses ofthis emission recorded by remote-sensing instruments have re-vealed key insights into the physics of solar flares. In particular,the observation of nonthermal bremsstrahlung in the hard X-ray(HXR) range has shown that electrons are efficiently acceleratedin flares and carry a significant fraction of the energy released(cf. Holman et al. 2011; Warmuth & Mann 2020). While non-thermal HXRs are primarily produced by electrons that precip-itate into deeper layers of the solar atmosphere, electrons canalso propagate upward through the corona and into interplane-tary space. This is revealed by type III radio bursts, which are
rapidly drifting structures observed in dynamic radio spectra (cf.White et al. 2011; Reid & Ratcliffe 2014). They are generatedby escaping electron beams that excite Langmuir turbulence inthe ambient plasma, which is subsequently converted to electro-magnetic radiation.
Such interplanetary electron beams can be detected in situby particle instruments on spacecraft. However, one commonfeature of solar electron events has challenged our understand-ing of the parent acceleration process for decades, which is afrequently observed delay of 10-20 minutes between the occur-rence of the solar counterpart, for example flare or radio typeIII burst, and the inferred injection time of the electrons basedon their observed onset times at the spacecraft (e.g., Haggerty& Roelof 2002; Kahler et al. 2007). These delays were often in-terpreted as an indication of a different acceleration process, forinstance a coronal or CME-driven shock (e.g., Haggerty et al.
Article number, page 1 of 16
arX
iv:2
108.
0904
5v1
[as
tro-
ph.S
R]
20
Aug
202
1

A&A proofs: manuscript no. main
2003; Kahler et al. 2007). However, also scenarios where flare-accelerated electrons are re-accelerated or energized by ongoingreconnection in the solar corona, possibly driven by the upliftingCME, are under discussion (Maia & Pick 2004). Furthermore,magnetic trapping might also be involved in delayed onsets andfor the acceleration of electrons to higher energies (e.g., Dresinget al. 2018; Li et al. 2020).
However, not all solar energetic electron events show sucha delay and some case studies even reported different behaviorat different energies, that is a prompt and a delayed component,within a single event (Krucker et al. 1999; Wang et al. 2006a;Li et al. 2020). This suggests that some electron events detectedin situ may indeed be of the same particle distribution as theHXR producing electrons, or at least still carry imprints of theflare acceleration. It is therefore tempting to compare the en-ergy spectra of the HXR flare with the one of the in situ elec-trons. Depending on which approximation is used to invert thenonthermal HXR spectrum, the expected relation of the photonspectral index γ with the in situ electron spectral index δ is eitherδ = γthick+1 for the thick-target model or δ = γthin−1 for the thin-target model (cf. Brown 1971; Holman et al. 2011). When ana-lyzing 16 impulsive and non-delayed electron events observedby Wind/3DP (Lin et al. 1995) and their HXR counterpart de-tected by the RHESSI spacecraft (Lin et al. 2002), Krucker et al.(2007) found a good linear correlation between the spectral in-dices of 0.83. However, the value pairs were neither consistentwith the thin nor with the thick-target model but were all lying inbetween. Another sample of 15 events studied by Krucker et al.(2007), which was characterized by larger onset delays of > 8minutes, showed no clear correlation and a shift of the points to-ward the thin-target solution, which led Petrosian (2016) to con-clude that the electrons of these events may have experienced afurther acceleration after their initial energization in the flare. Anadditional argument for the close association of HXR-producingand escaping electrons has recently been provided by Xia et al.(2021) who reported on two events showing consistent energycutoffs in the two populations.
The spectra of electrons observed in situ can often showspectral breaks or transitions that can relate to transport pro-cesses both near the original acceleration site and in interplan-etary space (e.g., Kontar & Reid 2009; Strauss et al. 2020).Dresing et al. (2020) studied the spectra of 781 electron eventsobserved with the Solar Electron and Proton Telescope (SEPT,Müller-Mellin et al. 2008) aboard the two STEREO spacecraftand found double power-law shapes in 56% of the events. In thispaper, we use this electron event list as a starting point and in-vestigate the relation between the energetic electron populationprecipitating onto the Sun as constrained by RHESSI, and the in-terplanetary electrons detected in situ with the SEPT instrumentson board of the two STEREO spacecraft. We put a particular fo-cus on the timing and spectral relation between both populations.
2. Observations and data selection
Event selection started with a list of Solar Energetic Electron(SEE) events observed with the SEPT instruments on board ofthe two STEREO spacecraft compiled by Dresing et al. (2020)and available online1. The version of the list used in this studycovers the time from 2007 to 2018 and includes in total 925 SEEevents, 557 at STEREO A and 368 at STEREO B. In the next
1 http://www2.physik.uni-kiel.de/stereo/downloads/sept_electron_events.pdf
16:50 17:00 17:10 17:20 17:30Universal time [hours] on 2011 Mar 24 (DOY 83)
10-6
10-5
Flu
x [W
m-2]
020
40
60
80
Cou
nt r
ate
[s-1 D
etec
tor-1
]
1.001.051.101.151.201.251.30
Nor
mal
ised
flux
dens
ity
Fre
quen
cy [M
Hz]
100
30
100
30
10
Fre
quen
cy [M
Hz]
10
Fig. 1. Time evolution of the X-ray and radio emission associated withthe electron event on 2011 Mar 24. From bottom to top: time profilesof the GOES soft X-ray flux, of the RHESSI 25–50 keV count rates(corrected for instrumental effects), and of the radio flux at microwavefrequencies, and dynamic spectra in the meter-wave and decameter-hectometer-wave radio range. The interval used for the computation ofthe RHESSI spectrum shown in Fig. 3 is indicated by the pair of redlines in the two bottom panels.
step, the RHESSI flare list2 was searched for solar flares thathad a start time within a one-hour window before the observedonset of the SEE event at the STEREO spacecraft. This yielded64 SEE event candidates covered by SEPT as well as RHESSI.The low percentage of SEPT events recorded by RHESSI resultsfrom the fact that the STEREO spacecraft were magneticallynot well-connected to the Earth-facing side of the Sun duringthe years of solar maximum, when the majority of interplane-tary electron events was observed. This was especially the casefor STEREO A flying ahead of Earth leading its magnetic con-nection quickly to the backside of the Sun as seen from Earth.Therefore, all except the first two events in 2007 were detectedby STEREO B only.
In the next step, the association between the selectedRHESSI flares and the SEPT events was ascertained by the ge-ometric consideration of whether the flare was occurring at thecorrect hemisphere so that a magnetic connection was at least
2 https://hesperia.gsfc.nasa.gov/rhessi3/data-access/rhessi-data/flare-list/index.html
Article number, page 2 of 16

N. Dresing et al.: Connecting solar flare hard X-ray spectra to in situ electron spectra
Fig. 2. Solar energetic electron observations by SEPT aboardSTEREO B on 2011 Mar 24. The top panel shows the electron intensityin all available energy channels of one viewing direction with pre-eventbackground subtraction, the second panel shows the 65-75 keV inten-sity in the four viewing directions of SEPT, and the third panel displaysthe corresponding pitch-angles based in the central pointing directionof the four telescopes.
remotely possible, followed by the inspection of radio spectro-grams provided by the WAVES instrument on the Wind satel-lite (Bougeret et al. 1995) and the SWAVES instruments on thetwo STEREO spacecraft (Bougeret et al. 2008). Type III burstsshowing close temporal association with the RHESSI flare weretaken as strong evidence for an actual association. Some eventshad to be discarded due to issues with the RHESSI data, forexample missing observations of the impulsive flare peak dueto RHESSI nighttime. In this manner, we finally obtained 17events, for which we then compared the spectral characteris-tics of the in situ electrons with the HXR photon spectra. Twoevents on 2007 Jan 24 were observed by both STEREO space-craft, which at that time were separated by only 0.5 degrees.However, because the lowest energy channels were corrupted inearly 2007 for STEREO B data we only use the observationsof STEREO A for these two events in our correlation. SectionA.1 in the appendix discusses the spectral variation between theclosely spaced spacecraft for these two events and its implicationfor our study.
3. Analysis
Figures 1 and 2 show remote-sensing and in situ observations ofan example event in the analyzed sample occurring on 24 Mar2011. We present the analysis of both types of spectra in thefollowing.
3.1. X-ray and radio observations
The time histories of X-ray and radio emission in Fig. 1 show aC9-class flare preceded and followed by distinct minor events.During the rise phase of the soft X-ray flux, bursts producedby nonthermal electrons are observed in hard X-rays and mi-crowaves (second and third panels from bottom). The hard X-ray emission is bremsstrahlung produced by electrons of severaltens of keV, the microwave emission is gyrosynchrotron radi-ation from electrons of several tens to hundreds of keV. Themicrowave data are from the Sagamore Hill (SGMR) Station
(USA) of the Radio Solar Telescope Network (RSTN)3. The twotop panels display dynamic spectrograms in the (180-25) MHzrange (SGMR4) and the (13.6-1) MHz range5 (Wind/WAVES;Bougeret et al. 1995). They show several groups of type IIIbursts, produced by electron beams at a few tens of keV prop-agating outward from the low corona along open magnetic fieldlines. The hard X-ray and microwave bursts in the low solar at-mosphere occur at the times of well-identified and rather strongtype III bursts. Besides at times of the main HXR and microwaveemission there are tiny events, which accompany the other typeIII bursts. But the event clearly has one main episode of energeticelectron acceleration in the low corona, lasting a few minutes,and the type III bursts demonstrate that simultaneously electronsescape along open field lines to the high corona and the inter-planetary space.
The event is in many respects representative of our data set.Firstly, the electron events are accompanied by hard X-ray andmicrowave bursts and by metric-to-hectometric type III bursts.Secondly, the microwave bursts of 14 out of 17 events showtime profiles and flux density spectra typical of gyrosynchrotronemission6, which suggests that electrons are accelerated to en-ergies above 100 keV. In two other events the nonthermal mi-crowave emission seems to be plasma emission, in one eventonly thermal bremsstrahlung is observed. A third general featureis the gyrosynchrotron emission that lasts from 10 s to 5 min, andthe nonthermal HXR emission lasting from 30 s to 2 min, in tem-poral coincidence with type III emission at m-λ. Finally, in mostevents (13/17) several groups of type III bursts are observed, andonly one is accompanied by a clear HXR and microwave burst.
3.2. In situ observations of electrons
The top panel of Fig. 2 displays the intensity measured by SEPTin all energy channels and the circles at the intensity maximamark the peak intensities used to construct the background-subtracted peak intensity spectrum, which is shown in Fig. 3(right). The second panel from top shows the intensity of 65-75 keV electrons in all four viewing directions of SEPT with thecorresponding pitch angles of the telescope center axes plottedbelow. We note, that in case of anisotropic events (like shownin Fig. 2), we always use the spectrum observed in the view-ing direction measuring the highest intensity. In case of isotropy,the Sun-facing telescope was used. A poor pitch-angle coveragedue to non-nominal magnetic field configurations can seeminglyreduce or even hide the real anisotropy of a particle beam. Asin such cases the center of the particle beam with the highestelectron intensities is not well observed, this can potentially also
3 https://www.ngdc.noaa.gov/stp/space-weather/solar-data/solar-features/solar-radio/rstn-1-second/4 Data from https://www.ngdc.noaa.gov/stp/space-weather/solar-data/solar-features/solar-radio/rstn-spectral/5 https://cdaweb.gsfc.nasa.gov/pub/data/wind/waves/6 We note that while it is in principle possible to constrain the electronspectrum from the optically thin gyrosynchrotron spectrum, a simplerelationship between the two indices exists only in the extremely rela-tivistic case, which generally does not apply to solar microwave bursts.In the case of the analyzed events, the microwave bursts are weak (a fewtens of sfu at most), only a few percent of the quiet-Sun background. Al-though the nonthermal part can be identified, it is likely superposed ona thermal bremsstrahlung component. Under these circumstances, themicrowave emission does not offer a valuable quantitative constraint ofthe electron spectral index.
Article number, page 3 of 16
A&A proofs: manuscript no. main
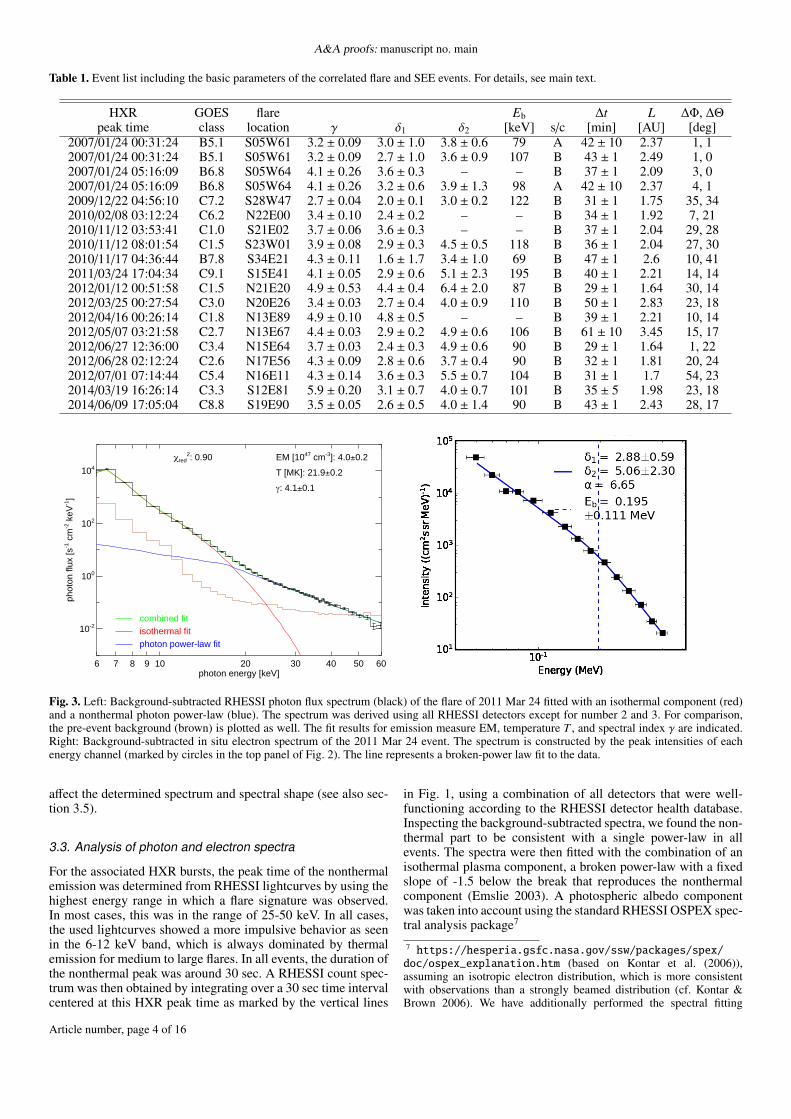
Table 1. Event list including the basic parameters of the correlated flare and SEE events. For details, see main text.
HXR GOES flare Eb ∆t L ∆Φ, ∆Θpeak time class location γ δ1 δ2 [keV] s/c [min] [AU] [deg]
2007/01/24 00:31:24 B5.1 S05W61 3.2 ± 0.09 3.0 ± 1.0 3.8 ± 0.6 79 A 42 ± 10 2.37 1, 12007/01/24 00:31:24 B5.1 S05W61 3.2 ± 0.09 2.7 ± 1.0 3.6 ± 0.9 107 B 43 ± 1 2.49 1, 02007/01/24 05:16:09 B6.8 S05W64 4.1 ± 0.26 3.6 ± 0.3 – – B 37 ± 1 2.09 3, 02007/01/24 05:16:09 B6.8 S05W64 4.1 ± 0.26 3.2 ± 0.6 3.9 ± 1.3 98 A 42 ± 10 2.37 4, 12009/12/22 04:56:10 C7.2 S28W47 2.7 ± 0.04 2.0 ± 0.1 3.0 ± 0.2 122 B 31 ± 1 1.75 35, 342010/02/08 03:12:24 C6.2 N22E00 3.4 ± 0.10 2.4 ± 0.2 – – B 34 ± 1 1.92 7, 212010/11/12 03:53:41 C1.0 S21E02 3.7 ± 0.06 3.6 ± 0.3 – – B 37 ± 1 2.04 29, 282010/11/12 08:01:54 C1.5 S23W01 3.9 ± 0.08 2.9 ± 0.3 4.5 ± 0.5 118 B 36 ± 1 2.04 27, 302010/11/17 04:36:44 B7.8 S34E21 4.3 ± 0.11 1.6 ± 1.7 3.4 ± 1.0 69 B 47 ± 1 2.6 10, 412011/03/24 17:04:34 C9.1 S15E41 4.1 ± 0.05 2.9 ± 0.6 5.1 ± 2.3 195 B 40 ± 1 2.21 14, 142012/01/12 00:51:58 C1.5 N21E20 4.9 ± 0.53 4.4 ± 0.4 6.4 ± 2.0 87 B 29 ± 1 1.64 30, 142012/03/25 00:27:54 C3.0 N20E26 3.4 ± 0.03 2.7 ± 0.4 4.0 ± 0.9 110 B 50 ± 1 2.83 23, 182012/04/16 00:26:14 C1.8 N13E89 4.9 ± 0.10 4.8 ± 0.5 – – B 39 ± 1 2.21 10, 142012/05/07 03:21:58 C2.7 N13E67 4.4 ± 0.03 2.9 ± 0.2 4.9 ± 0.6 106 B 61 ± 10 3.45 15, 172012/06/27 12:36:00 C3.4 N15E64 3.7 ± 0.03 2.4 ± 0.3 4.9 ± 0.6 90 B 29 ± 1 1.64 1, 222012/06/28 02:12:24 C2.6 N17E56 4.3 ± 0.09 2.8 ± 0.6 3.7 ± 0.4 90 B 32 ± 1 1.81 20, 242012/07/01 07:14:44 C5.4 N16E11 4.3 ± 0.14 3.6 ± 0.3 5.5 ± 0.7 104 B 31 ± 1 1.7 54, 232014/03/19 16:26:14 C3.3 S12E81 5.9 ± 0.20 3.1 ± 0.7 4.0 ± 0.7 101 B 35 ± 5 1.98 23, 182014/06/09 17:05:04 C8.8 S19E90 3.5 ± 0.05 2.6 ± 0.5 4.0 ± 1.4 90 B 43 ± 1 2.43 28, 17
6 7 8 9 10 20 30 40 50 60photon energy [keV]
10-2
100
102
104
phot
on fl
ux [s
-1 c
m-2 k
eV-1]
combined fitisothermal fitphoton power-law fit
χred2: 0.90 EM [1047 cm-3]: 4.0±0.2
T [MK]: 21.9±0.2
γ: 4.1±0.1
Fig. 3. Left: Background-subtracted RHESSI photon flux spectrum (black) of the flare of 2011 Mar 24 fitted with an isothermal component (red)and a nonthermal photon power-law (blue). The spectrum was derived using all RHESSI detectors except for number 2 and 3. For comparison,the pre-event background (brown) is plotted as well. The fit results for emission measure EM, temperature T , and spectral index γ are indicated.Right: Background-subtracted in situ electron spectrum of the 2011 Mar 24 event. The spectrum is constructed by the peak intensities of eachenergy channel (marked by circles in the top panel of Fig. 2). The line represents a broken-power law fit to the data.
affect the determined spectrum and spectral shape (see also sec-tion 3.5).
3.3. Analysis of photon and electron spectra
For the associated HXR bursts, the peak time of the nonthermalemission was determined from RHESSI lightcurves by using thehighest energy range in which a flare signature was observed.In most cases, this was in the range of 25-50 keV. In all cases,the used lightcurves showed a more impulsive behavior as seenin the 6-12 keV band, which is always dominated by thermalemission for medium to large flares. In all events, the duration ofthe nonthermal peak was around 30 sec. A RHESSI count spec-trum was then obtained by integrating over a 30 sec time intervalcentered at this HXR peak time as marked by the vertical lines
in Fig. 1, using a combination of all detectors that were well-functioning according to the RHESSI detector health database.Inspecting the background-subtracted spectra, we found the non-thermal part to be consistent with a single power-law in allevents. The spectra were then fitted with the combination of anisothermal plasma component, a broken power-law with a fixedslope of -1.5 below the break that reproduces the nonthermalcomponent (Emslie 2003). A photospheric albedo componentwas taken into account using the standard RHESSI OSPEX spec-tral analysis package7
7 https://hesperia.gsfc.nasa.gov/ssw/packages/spex/doc/ospex_explanation.htm (based on Kontar et al. (2006)),assuming an isotropic electron distribution, which is more consistentwith observations than a strongly beamed distribution (cf. Kontar &Brown 2006). We have additionally performed the spectral fitting
Article number, page 4 of 16

N. Dresing et al.: Connecting solar flare hard X-ray spectra to in situ electron spectra
The nonthermal emission is thus characterized by the spec-tral index γ above the break. The upper energy limit of the fitrange was determined by the counting statistics, which impliedthat several events could only be fitted up to 30 keV (the limitwas 60 keV on average). Since photons of a given energy aremainly produced by electrons of about twice this energy, we dohave an energy overlap with SEPT even in these cases. The re-sulting spectrum and corresponding fits for the example eventon 24 Mar 2011 are shown in Fig. 3 (left). Additionally, we alsoperformed thick-target fits to the spectra, which we use to deter-mine the number of accelerated electrons (see Sect. 3.6). Usingthe resulting spectral indices from these thick-target fits in ourcorrelation analysis (not shown) does not change the correlationbut as it involves extra model assumptions, we decided not to usethese values. We furthermore refrained from using fits applyingthe thin-target model since we see no evidence for thin-targetemission, as discussed in Section 3.5.
The right-hand side shows the corresponding spectrum ofthe in situ electron event and a broken-power law fit. For eachevent, the electron observations of SEPT were corrected frompotential contamination due to ions or higher energy electronsas described in Dresing et al. (2020). To determine the spectrumof the event we use the peak intensities observed individuallyin each available energy channel (marked by the circles in thetop panel of Fig. 2) after a pre-event background subtraction hasbeen applied. We then fit each spectrum with single- and double-power law functions and chose the better fit based on the reducedchi square of the fits. The fits take into account the uncertaintiesof the peak intensities caused by counting statistics as well asthe energy bin widths representing an uncertainty in energy. Theuncertainties of the fit parameters were determined using 95%-confidence intervals. For details see Dresing et al. (2020) andStrauss et al. (2020). We note that determining electron fluencespectra with STEREO/SEPT data is complicated due to the is-sue of ion contamination that is usually more dominant duringthe later phase of the events. Determining reliable fluence val-ues and, especially, uncertainties, which are required by the fit,is difficult. We therefore decided not to present an analysis of thein situ fluence spectra here but comment on potential differencesbetween the peak flux and the fluence spectra in Section 4.2.
Table 1 shows the basic parameters for all 19 flare and SEEevents, including the HXR peak time (as detected at the space-craft), GOES class, flare location, HXR photon spectral index γ,in situ electron spectral indices δ1 and δ2
8, spectral break energyEb, which STEREO spacecraft detected the SEE event, the timedelay ∆t between the nonthermal HXR flare peak (corrected forlight travel time) and the onset of the SEE event at STEREO,propagation path length L of 55-85 keV electrons correspondingto ∆t (see section 3.4), and the longitude and latitudinal separa-tions ∆Φ and ∆Θ between the flare location and the ballisticallyextrapolated footpoint of the magnetic field line connecting thespacecraft to the Sun.
3.4. Timing and magnetic connectivity
The onset times of the SEPT electron events were determinedusing the 3σ method, which can only be considered as an upperlimit for the real onset time. An earlier onset could be maskedby the background noise of the detector (Laitinen et al. 2010).
without an albedo component and found only small differences ofthe spectral indices (smaller than 0.1) and conclude that the albedocomponent does not influence our results.8 If δ2 and Eb are missing, a single power law fit was used
Furthermore, especially in the case of more gradual intensityincreases, which can also be caused by non-nominal magneticfield orientations resulting in a poor pitch-angle coverage at theSEPT instrument, the 3σ method can yield onset times that aretoo late. Larger time averaging is often used to overcome theseissues, and the time averaging applied for each event has beenused as a measure for the uncertainty of the onset time (Dresinget al. 2020). This uncertainty has been propagated to ∆t in ta-ble 1 in cases when higher averaging was used. Otherwise, theuncertainty represents the time resolution of the STEREO/SEPTdata of 1 minute. The time delays ∆t in our sample, which rangefrom 29 to 61 minutes, with a median of ∆t = 37 minutes, arethe delays between the HXR peak time at the Sun and the detec-tion of the 55 − 85 keV electron onset. Assuming that the in situmeasured electrons were injected at the time of the HXR peak,∆t represents the propagation time of the first arriving particles.A scatter-free propagation along a nominal Parker spiral wouldtake about 20 minutes at these energies. Comparing ∆t with thisnominal and scatter-free propagation time we find that all eventsin our sample arrive delayed.
The events with medium to large anisotropy at their onset(see Table A.1), where the spacecraft was likely well-connectedto the electron source, have delays between 29 and 40 minutes.While these delays are among the shorter ones in our sample,they still exceed expectation for scatter-free propagation by 9-20minutes.
Therefore, our event sample does not seems to contain anytrue prompt events as defined by Krucker et al. (2007) with a de-lay between the flare and the inferred injection time of the in situmeasured electrons of < 8 minutes. There can be several rea-sons for the observed delays. On the one hand, it could be due toinstrumental effects leading to a delayed onset determination asdescribed above. Furthermore, we note, that the pitch-angle cov-erage was not ideal in the majority of the events, which couldcause apparent onset delays especially if the electron beam wasvery narrow during the early phase of the event. In this case, thedelay would not represent a physical process related to the accel-eration, injection, or transport of the particles. On the other hand,the actual propagation path of the electrons could be longer thanthe nominal Parker spiral, either due to large-scale distortions ofthe field or due to pitch-angle scattering. Field-line random walkcaused by footpoint motion tied to the solar convection or by theturbulent solar wind evolution can cause significant lengtheningof the actual path that particles need to follow along the mag-netic field. Recent studies find that the effective field line lengthcan be up to twice as long as the nominal Parker connection (see,e.g., Laitinen et al. 2016; Laitinen & Dalla 2019; Chhiber et al.2020), which can cause equivalent delays in the observed par-ticle onsets. Assuming that such effects or scattering cause thedelays, i.e. the electrons were injected at the flare peak time, thecolumn L in the table provides the path lengths corresponding to∆t for 55-85 keV electrons. Finally, an actually delayed injectionof the electrons at the Sun can not be ruled out a priori. Differenteffects or a mixture of them being dominant for different eventsin our sample are, of course, also possible.
Figure 4 shows histograms of ∆t and the longitudinal sepa-rations ∆Φ. Despite the partially significant delays, the major-ity of the events is magnetically well-connected in longitude toSTEREO, with ∆Φ between 0.5 and 54 degrees (median: 15 de-grees). There is no correlation between onset delay and longitudeseparation (see Fig. 4 right). We also do not find any correlationwith the latitudinal separation ∆Θ (listed in Table 1). Further-more, the degree of anisotropy (marked by the color in the rightpanel) does not correlate with the onset delays suggesting that
Article number, page 5 of 16

A&A proofs: manuscript no. main
0 10 20 30 40 50 60 700
1
2
3
4
5
6
0 10 20 30 40 50 60 70time delay [min]
0
1
2
3
4
5
6
num
ber
0 10 20 30 40 50 60 70time delay [min]
0 10 20 30 40 50 60 70longitude separation [deg]
0
1
2
3
4
5
6
7
num
ber
0 10 20 30 40 50 60 70longitude separation [deg]
0 10 20 30 40 50 60 70time delay [min]
0
10
20
30
40
50
60
70
long
itude
sep
arat
ion
[deg
] C: -0.29±0.20 anisotropy:small
middlelarge
Fig. 4. Left: Histogram of the time delay ∆t between the nonthermal HXR flare peak and the onset of the SEE event at STEREO. The blackhistogram refers to all events, while the green one shows the distribution for the events that are potentially associated with CMEs. The dottedlines indicate the median of the distributions. Middle: Histogram of the longitude separation ∆Φ between the flare location and the extrapolatedfootpoint of the magnetic field line connecting STEREO to the Sun. Right: Correlation plot of the time delay ∆t and the longitude separation ∆Φ.The colors denote the degree of anisotropy of the in situ electrons. C indicates the linear correlation coefficient.
interplanetary pitch-angle scattering is not the main reason forthe observed delays. The green histograms in Fig. 4 denote thoseevents associated with CMEs that are located close to the flaringregion and have heights below one solar radius at the time of theflare (see appendix A). They may therefore potentially influencethe injection and coronal propagation of the electrons. While theevents associated with these CMEs are not outstanding in otherparameters of our analysis they seem to be among those eventsshowing larger separation angles (middle panel of Fig. 4) sug-gesting that the CME may be involved in enlarging the injectionregion. The fact that many of the analyzed events are observedin different magnetic polarity sectors than that of the flaring ac-tive region at the Sun (see Table A.1) could furthermore suggestan injection that covers a wider angular range even across theneutral line. Such a scenario was also suggested by Kallenrode(1993) who, however, reported that a current sheet crossing canalso lead to a decrease in SEP intensities. On the other hand,pitch-angle scattering in the IP medium may also be involvedin filling both sides of the heliospheric current sheet with theelectron population. The majority of our events are also accom-panied by coronal EUV jets (see appendix A) but no particularconnection with the time delay or separation angle was found.
3.5. Spectral correlations
The results of correlating the spectral indices of the HXR pho-tons and the in situ electron measurements are shown in Figures5 and 6. As discussed above several energy-dependent effectsmay alter the spectrum observed in situ eventually leading tospectral breaks, which requires to make a choice between thetwo different spectral indices. For the events in our sample thischoice is often not straightforward as breaks are often found be-low or around 100 keV, which is in between the mean locationsof the two different spectral breaks (60 keV and 120 keV) asreported for instance by, Krucker et al. (2007); Dresing et al.(2020). We therefore start by using always the lower (δ1) or theupper spectral index (δ2) as observed by SEPT in case of brokenpower-laws and compare these with the HXR spectral index γ.The corresponding correlation plots are shown in figures 5 and6. Note that in case of single power-law shapes the same in situspectral index has been used in both plots. The panels on the leftof the figures include all 17 events, while the ones on the rightconsider only the nine events that showed a distinct anisotropy(medium to large; see appendix A and last column of table A.1).
Three events appear to behave differently as their spectralindices δ1 and δ2 lie systematically below the rest of the distri-butions (marked by colored points in figures 5 and 6). We sus-pect that these three cases represent events showing a spectralbreak caused by Langmuir-wave generation (expected to occurat lower energies than the break due to pitch-angle scattering)while the rest of the broken-power-law events corresponds tobreaks caused by pitch-angle scattering (see appendix A.2 formore discussion on these events). Fig. 7 helps to illustrate this. Itshows a broken power-law spectrum containing two breaks andtherefore three different spectral indices δ0, δ1 and δ2. The firstbreak, marked by Eb_L is assumed to correspond to Langmuir-wave generation and the second break ( Eb_trans) to pitch-anglescattering during interplanetary transport, respectively. Accord-ing to the description above, the three special events would coverthe spectral part of δ0 and δ1 while the other events correspond toδ1 and δ2 in this sketch. To correctly handle the spectral indicesof these three events we therefore have to treat their δ2 valuesas δ1 values. Their δ1 would correspond to δ0 in the sketch (notcovered by the other events) and the δ2 range of the other eventsis not covered by these three events. We therefore have to usethe blue points instead of red points in Fig. 5 and remove the δ2values (red points) from the correlation in Fig. 6.
Figure 5 shows that γ and δ1 are correlated. For the threeevents discussed above, both spectral indices δ1 (red, suspectedwrong values) and δ2 (blue, suspected correct values) are in-cluded. The differently colored legends represent the Pearsoncorrelation coefficient and linear fit results using either δ1 (red)or δ2 (blue) of these three events. Similarly, for Fig. 6 the corre-lation in red corresponds to using all δ2 values in the sample, andthe one in black excludes the three red points as discussed aboveassuming that these events do not provide a corresponding δ2observation. The correlations in both plots improve significantlywhen treating the three events as discussed. Although the cor-relations with the lower and higher in situ spectral indices arevery similar, the implications for the relation between the pho-ton and in situ spectral indices are very different: The value pairsin Fig. 5 clearly align along the thin-target approximation, whilethe points in Fig. 6 shift to the range between thick and thin-target lines with some points even lying above the thick targetmodel.
Taking the correlation of γ and δ1 at face value, one couldconclude that the nonthermal photon spectrum is actually gen-erated by thin-target emission, and that indeed both the remote-
Article number, page 6 of 16

N. Dresing et al.: Connecting solar flare hard X-ray spectra to in situ electron spectra
all events
1 2 3 4 5 6 7 8photon spectral index γ
1
2
3
4
5
6
7
8in
-situ
ele
ctro
n sp
ectr
al in
dex δ
(low
)
thick
targ
et
thin
targ
et
δ = (0.74±0.11) γ + (0.04±0.38)
C: 0.50±0.19
δ = (0.83±0.11) γ + (-0.24±0.38)
C: 0.80±0.08
events with distinct anisotropy
1 2 3 4 5 6 7 8photon spectral index γ
1
2
3
4
5
6
7
8
in-s
itu e
lect
ron
spec
tral
inde
x δ
(low
)
thick
targ
et
thin
targ
et
δ = (0.55±0.12) γ + (0.58±0.42)
C: 0.69±0.20
δ = (0.67±0.12) γ + (0.22±0.42)
C: 0.86±0.09
Fig. 5. Correlation plots of the HXR photon spectral index γ observed by RHESSI and the electron spectral index δ obtained from STEREO/SEPT,plotted for all events (left) and only the events with distinct anisotropy of the in situ electron flux (right). In the case of events with broken power-laws, we use here the spectral index below the break, δ1. For three events, we consider either δ1 (red), or δ2 (blue). The dotted lines indicate linearfits to the data. The dashed lines indicate the relationships between γ and δ expected for thick and thin-target bremsstrahlung, respectively. The fitparameters are indicated, as well as the linear correlation coefficients C.
all events
1 2 3 4 5 6 7 8photon spectral index γ
1
2
3
4
5
6
7
8
in-s
itu e
lect
ron
spec
tral
inde
x δ
(hig
h)
thick
targ
et
thin
targ
et
δ = (0.77±0.15) γ + (0.71±0.55)
C: 0.49±0.19
δ = (1.04±0.19) γ + (-0.16±0.66)
C: 0.79±0.09
events with distinct anisotropy
1 2 3 4 5 6 7 8photon spectral index γ
1
2
3
4
5
6
7
8
in-s
itu e
lect
ron
spec
tral
inde
x δ
(hig
h)
thick
targ
et
thin
targ
et
δ = (0.71±0.17) γ + (1.20±0.61)
C: 0.27±0.44
δ = (1.38±0.26) γ + (-0.74±0.82)
C: 0.88±0.18
Fig. 6. As in Fig. 5, but showing the correlation of the HXR photon spectral index γ with the electron spectral index δ2 (characterizing the high-energy part of the SEE spectrum) instead of δ1 in the cases of a broken power-law. We consider either all events including the three special cases(red), or we omit these events (black).
sensing and the in situ observations detect the same particle pop-ulation. However, thin-target emission is generally believed todominate nonthermal flare spectra only in those cases where theHXR footpoints are occulted by the solar limb (cf. Krucker et al.2008). The footpoints are the locations where accelerated elec-trons are stopped collisionally in the denser chromosphere, andconsequently they emit thick-target radiation, which will usu-ally dominate any thin-target contribution from the corona. We
have performed HXR imaging with RHESSI for all flares in or-der to ascertain whether HXR footpoints are present or couldbe potentially obscured. In 7 flares, footpoint pairs could be un-ambiguously detected, while in another 7 events, only possibleindications for footpoints could be found due to the limited im-age fidelity caused by the small number of nonthermal counts.In the rest of the events, nonthermal and thermal sources werefound to be contiguous. Only one flare was located so close to the
Article number, page 7 of 16

A&A proofs: manuscript no. main
Table 2. Pearson correlation coefficients C between photon spectral in-dex γ and in situ electron spectral index δ. Also given are the uncertain-ties on C based on a bootstrapping approach.
all medium & large largeevents anisotropy anisotropy
no. of events 17 9 4γ vs. δ1 0.50 ± 0.19 0.69 ± 0.20 0.61 ± 0.55γ vs. δ2 0.49 ± 0.19 0.27 ± 0.44 0.28 ± 0.77γ vs. δ1
1 0.80 ± 0.08 0.86 ± 0.09 0.96 ± 0.06γ vs. δ2
2 0.79 ± 0.09 0.88 ± 0.18 1.0 ± 10−4
Notes. (1) I n situ electron spectral index δ2 has been used for the threespecial events (see text). (2) I n situ electron spectral index δ2 has beenexcluded for the three special events (see text).
Eb_L Eb_trans
𝜹0
𝜹1
𝜹2
Fig. 7. Sketch illustrating a broken-power law spectrum with two breaksEb_L and Eb_trans forming three spectral indices δ0, δ1 and δ2.
limb that an occultation of the footpoints is possible. We find nosystematic differences in the spectral correlations for the eventswith clearly visible footpoints as compared to the other flares.We thus conclude that the HXR spectrum is actually dominatedby thick-target emission.
Table 2 summarizes the determined correlation coefficientsbetween the photon spectral index γ and the two electron spec-tral indices δ1 and δ2, also including further subsamples based ona rough anisotropy classification of the events (see appendix Aand last column of table A.1). The correlations clearly improve ifonly anisotropic events are taken into account, however the num-ber of events with large anisotropies is unfortunately very low.We also investigated the quality of the correlations with respectto the onset delay, the longitudinal, and latitudinal separation an-gles between flare and spacecraft magnetic footpoint at the Sunas well as the presence of CMEs or EUV jets but did not find anydependence on these parameters.
3.6. Total number of escaping electrons
Figure 8 shows the total number of escaping electrons inferredfrom the in situ observations (> 45 keV and < 425 keV) as afunction of the number of electrons > 45 keV accelerated in
the flare assuming thick-target emission and integrating the de-rived peak flux over 30 seconds. The number of in situ electronshas been determined by integrating the fluence spectrum of theevents observed in the telescope showing the highest intensityincrease, which was also used to construct the peak intensityspectrum. The fluence is the integrated flux over the durationof the event, with the duration being defined by the onset of theevent and an individual end time. This end time was determinedfor each energy channel individually by the time when the fluxdecreased to 1/e of the peak flux. In the same manner as forthe peak intensity spectra, analyzed in this work, the pre-eventbackground was subtracted from the flux before calculating thefluence and the contamination correction was applied (c.f. Sec-tion 3.3) assuming a constant contamination over the duration ofthe event.
Following Krucker et al. (2007) we assume an electron beamthat is emitted into a cone with a width of 30◦ to derive the totalnumber of in situ electrons, and we use cones of 15◦ and 60◦to estimate the uncertainties shown in Fig. 8. Propagating thiscone along the nominal Parker spiral to a distance of 1 AU re-sults in a spherical cap over which the electrons are spread atthe spacecraft position. To infer the total number of electrons ofthe event, the number of electrons detected in the small SEPT in-strument are therefore scaled to the area of this spherical surface.We note, that this approach assumes a constant energetic electrondensity over the cone angle, which is only a first-order approx-imation. Secondly, the sectored measurements by SEPT showthat the observed particle distribution at the spacecraft is muchmore isotropic compared to the assumed cone, which is expectedin case of non-negligible particle scattering during interplan-etary transport. However, without proper transport simulationsand multi-spacecraft observations a more accurate approach de-manding fewer assumptions to determine the total number of insitu electrons is not feasible.
The left hand plot of Fig. 8 shows all events in our sample,while the right hand figure shows only events with significantanisotropy. The legends provide the results of linear fits and thePearson correlation coefficients. A reasonable correlation of 0.75is found for all events, and a slightly lower correlation of 0.6for the anisotropic events. Although one would rather expect alarger correlation for anisotropic events, i.e. in the case of lesspitch-angle scattering, an effect that can reduce the determinednumber of escaping electrons, the anisotropic sample does in-deed contain on average higher numbers of escaping in situ elec-trons. In contrast to results by James et al. (2017), who useddata by ACE/EPAM (Gold et al. 1998) and determined a frac-tion of 6 to 148% of escaping electrons compared to the HXR-producing electrons our results confirm the findings by Kruckeret al. (2007). We find very small fractions of escaping electronswith mean ratios of only 0.18% for all events and 0.24% for theanisotropic events. For comparison, Krucker et al. (2007) founda ratio of 0.2%.
4. Discussion
4.1. Modification of electron spectra between theacceleration region and the spacecraft
Transport processes in the flare and in interplanetary space canalter the initial spectral distribution of nonthermal electrons. Onesuch process that causes energy loss is due to Coulomb collisions(cf. Brown 1971) when energetic electrons propagate througha background plasma. For the escaping electrons, this effect isnegligible in interplanetary space, but it can play a role near the
Article number, page 8 of 16

N. Dresing et al.: Connecting solar flare hard X-ray spectra to in situ electron spectra
all events
1029 1030 1031 1032 1033 1034 1035
number of electrons in flare (> 45 keV)
1029
1030
1031
1032
1033
1034
1035
num
ber
of e
scap
ing
elec
tron
s (>
45
keV
) log(y) = (0.98±0.22) log(x) + (-2.24±7.46)
C: 0.75±0.14
events with distinct anisotropy
1029 1030 1031 1032 1033 1034 1035
number of electrons in flare (> 45 keV)
1029
1030
1031
1032
1033
1034
1035
num
ber
of e
scap
ing
elec
tron
s (>
45
keV
) log(y) = (0.66±0.27) log(x) + (8.73±9.38)
C: 0.60±0.25
Fig. 8. Correlation plots of the number of nonthermal electrons above 45 keV in the flares derived from thick-target fits of HXR spectra andthe number of electrons escaping into interplanetary space, plotted for all events (left) and only the events with distinct anisotropy of the in situelectron flux (right).
acceleration site. Reid & Kontar (2013) concluded that coulombcollisions are negligible as an energy-loss process above an en-ergy near 40 keV, which is in the relevant range for our analysis.However, because collisional energy loss will lead to a progres-sive flattening of the electron flux spectrum toward lower ener-gies, it could thus potentially account for the fact that the in situspectra are harder than the ones inferred from HXR observations(see Fig. 5). We have, therefore, considered a model of the am-bient electron density consisting of a 2.5-fold Newkirk model(Newkirk 1961) in the lower corona, which then transitions tothe Mann model (Mann et al. 1999) that is more appropriate forthe upper corona and IP space. We inferred the electron den-sity in the corona above the acceleration region from the startingfrequency of the type III bursts, as observed by the worldwidee-Callisto network (www.e-callisto.org). We found the me-dian start frequency near 330 MHz. Under the usual assump-tion of harmonic plasma emission this corresponds to an ambientelectron density of 3.4 · 108 cm−3 and an acceleration region be-low 0.1 R� above the photosphere. Taking this value, integratingfrom this height to 1 AU, and computing the effect of the spectralflattening according to Brown (1971), we find that Coulomb col-lisions have indeed a negligible effect on the spectral index in theenergy range we have considered here, and thus cannot accountfor the spectral differences between precipitating and escapingelectrons.
While Coulomb collisions may be neglected in our analy-sis, other processes such as the generation of Langmuir wavesor pitch-angle scattering may cause spectral changes both in theflare and in the interplanetary medium (as discussed in Section3.5). Kontar et al. (2014) showed for example that strong pitch-angle scattering in coronal loops can potentially cause a flatten-ing of the HXR spectrum and lead to spectral breaks. However,several previous studies have found significant correlations be-tween the HXR and in situ electron spectral index (e.g., Kallen-rode et al. 1987; Dröge 1996; Krucker et al. 2007) and it was sug-gested that 1) both spectra belong to the same accelerated pop-ulation and 2) that transport effects do only play a minor role in
altering the spectra. Many of such past studies, which analyzedsolar energetic electron spectra have used instruments, whichcovered only energies & 100 keV and which lacked a fine energyresolution in the lower energy part that is needed to resolve spec-tral breaks caused by interplanetary transport processes, i.e. thegeneration of Langmuir turbulence and pitch-angle scattering, asdiscussed in this manuscript. Furthermore, both of the mentionedtransport processes are dominant at lower or near-relativistic en-ergies (Dröge 2003; Agueda et al. 2014) making it difficult todetect these with instrumentation covering mainly & 100 keV.Instruments such as the Wind/3DP and STEREO/SEPT mainlymeasure near-relativistic electrons where these spectral breaksoccur. However, because of the slightly different energy cover-age and resolution of the Wind/3DP and STEREO/SEPT instru-ments they are likely sensitive to different spectral breaks with3DP usually detecting the break caused by Langmuir-wave gen-eration and SEPT the one by pitch-angle scattering (see Kruckeret al. 2009; Kontar & Reid 2009; Dresing et al. 2020; Strausset al. 2020) so that the spectral index above the break δ2 detectedby 3DP is likely covered by the spectral index below the break δ1as seen in SEPT data. However, an unambiguous identificationof the type of the spectral break in a single event can be difficultbecause of the overlapping energy ranges of these effects. Threeevents in our sample showed a systematic shift with respect tothe spectral indices of the rest of the events suggesting that thesewere indeed events covering the Langmuir wave-related spectralbreak different to the other events. Therefore, these events havebeen re-categorized accordingly (see section 3.5 and figures 5and 6) leading to significantly improved correlations.
4.2. The spectral correlation of HXR-producing and in situelectrons
We find correlations between the HXR spectral index and the oneof the in situ electron spectrum of about 0.8 for both sets of valuepairs either using the spectral index below or above the break(see Table 2), however when using δ1 the points align along
Article number, page 9 of 16

A&A proofs: manuscript no. main
the thin-target solution (Fig. 5), while they are shifted more to-ward the thick-target line (lying between thick and thin-targetlines) when using δ2 (Fig. 6). A preliminary analysis of the cor-responding SEPT fluence spectra showed overall no change forthe δ1 values, but the δ2 values showed a trend of shifting towardsofter spectral indices causing the data points to align more alongthe thick-target solution or lying even above it in the correlationplot (not shown). However, due to the issue of ion contamina-tion these fluence spectra suffer large uncertainties and are lessreliable.
We assume that our value pairs using δ1 should be com-pared to the values shown by Krucker et al. (2007) who com-pared HXR spectra observed by RHESSI with Wind/3DP elec-tron spectra above the break (δ2). They found a similar correla-tion of about 0.8, however, their value pairs were lying betweenthe thick and thin target solutions. The alignment of our valuepairs using δ1 along the thin-target model is not expected sinceimaging of nonthermal footpoints shows that in most eventsthick-target emission has to be dominant. After excluding alsothe role of energy loss due to Coulomb collisions (see Section4.1) we therefore suspect that another systematic effect causesthis shift. Krucker et al. (2007) found only a good correlationfor non-delayed events suggesting that the delays, frequently ob-served during solar energetic electron events (e.g., Haggerty &Roelof 2002; Kahler et al. 2007), may be caused by another oran additional acceleration process. This is different for the eventsstudied in this work: all of our events show delays of at least 9minutes with respect to the flare. However, as discussed in Sec-tion 3.4 instrumental effects and especially nonideal pitch-anglecoverage could often be the cause for apparent delays.
Although Krucker et al. (2007) found only a low correla-tion of 0.43 for their delayed event sample, those value pairs didalso show a shift toward the thin-target line, i.e. toward harderin situ electron spectra like our γ − δ1-value pairs. Petrosian(2016) suggested that a further acceleration process acting onthe flare-accelerated electron distribution could be the reason forthis shift. However, given the still significant correlation coef-ficient for our value pairs we note that such a further accelera-tion should either only be of minor importance or scale with theflare itself, so that only a systematic shift of the spectral indexis caused, and the overall correlation is preserved. We note thatKrucker et al. (2007) also suggested the possibility of furtheracceleration in the flare due to trapping in closed and shrinkingfield lines. This would, however, only affect the downward mov-ing electrons, which produce the HXR spectrum.
4.3. Anisotropic electron events and the number of escapingelectrons
We find a clear improvement of our correlations when only tak-ing into account anisotropic events suggesting that pitch-anglescattering can lead to a vanishing imprint of the acceleration.We note that the lack of anisotropy can either be caused bystrong scattering during interplanetary transport but also dueto poor pitch-angle coverage of SEPT caused by non-nominalmagnetic field configurations. See table A.1, which lists thestrength of the anisotropy for each event and marks if poor pitch-angle coverage was present. Consequently, even in the case oflow scattering conditions, the limitations of the measurementcan lead to vanishing correlations, i.e. to a change of the ob-served spectral indices. We note, that Wind/3DP does not sufferfrom such a limitation because of its unique directional obser-vations covering the complete 4π space, which is for examplenot the case for the ACE/EPAM instrument (Gold et al. 1998).
Although EPAM/LEMS provides eight different sectors deter-mined through the spacecraft’s spin, there exist magnetic fielddirections that are perpendicular to the measurement plane ofEPAM/LEMS reducing the pitch-angle coverage to only onepoint in pitch-angle space for all sectors.
The anisotropy is also expected to influence the correlationbetween the number of escaping electrons with the number offlare electrons as shown in Fig. 8 because larger anisotropiesimply weaker interplanetary scattering conditions and thereforeless dispersal of the injected population. However, we do notfind an improvement of the correlations when only taking intoaccount the anisotropic events. But poor pitch-angle coverage,which can lead to the underestimation of the anisotropy as wellas to an underestimation of the total number of electrons, mayagain affect the results. Furthermore, the strong assumptions,which have to be made to determine the number of escapingelectrons likely play an even larger role for the weak correla-tion. These assumptions are i) the same size of the cone (30◦)filled with electrons for each event, which is very likely not truedue to varying injection cone sizes, i.e. the angular width of openmagnetic field lines. ii) A constant distribution of electrons overthe 30◦ cone, which is only a first-order approximation becauseof the observed presence of weak or missing anisotropies de-picting the presence of interplanetary scattering. Furthermore,an angular-dependent injection function is possible. iii) A nom-inal Parker field with a fixed Parker spiral length for all events,not taking into account large-scale structures or field line me-andering, which will further introduce event to event variationsleading to a vanishing correlation. Nevertheless, our results con-firm the findings by Krucker et al. (2007) that only a very smallfraction (∼ 0.2%) of accelerated electrons are finally injectedinto interplanetary space when compared to the number of theHXR producing electrons.
4.4. The timing of electron release in the corona
A simple picture of the relationship between electrons detectedat 1 AU and radio or X-ray emitting electrons in the solar at-mosphere is a common short acceleration and the release intomagnetic structures in the corona and onto open field lines to theheliosphere. This picture is supported by a number of detailedtiming studies of the start times of impulsive electron events(see the discussion of the 2000/05/01 case in Klein 2021). But inother events the first electrons were reported to arrive later at thespacecraft than expected. Instruments with limited pitch-anglecoverage, such as the STEREO detectors, might just miss thefirst arriving electrons, creating an apparent delay. Linhua Wangand coworkers (Wang et al. 2006a, 2016) exploited the excellentpitch-angle coverage of the Wind/3DP instrument in systematicanalyses of the onset time and the duration of release of elec-trons across the energy range between a few keV and some tensor hundreds of keV. They found that electrons detected with en-ergies below 20 keV at the spacecraft were released since earliertimes and over longer durations than the electrons above about30 keV. Kontar & Reid (2009) ascribe such inferred earlier re-leases to the energy loss of the Langmuir-wave generating (low-energy) electrons. As an alternative, or an addition, our observa-tions suggest a scenario where electron beams are accelerated todifferent energies in several successive episodes: we find that thesolar counterparts of the electron events are in general groupsof type III bursts, discernible at frequencies above ∼1 MHz. Asillustrated in Fig. 1, the hard X-ray and microwave emissions,which are produced by electrons at tens to hundreds of keV, ac-company one of these groups of type III bursts, but other groups
Article number, page 10 of 16

N. Dresing et al.: Connecting solar flare hard X-ray spectra to in situ electron spectra
occur before and afterward. Such additional type III bursts with-out prominent microwave counterpart are observed in 13/17 ofour events. This is also shown by the timing of the microwavebursts and the DH type III bursts (Table A.1, cols. 2 and 4).Since type III bursts at 1 AU are produced by electrons with en-ergies below 20 keV (e.g., Ergun et al. 1998), this timing impliesthat repeated episodes of impulsive electron acceleration to rela-tively low energies (a few tens of keV) occur in the corona, andthat one such episode is also accompanied by the acceleration ofnear-relativistic electrons. The low-energy electrons are henceaccelerated over longer times than those of higher energies thatare seen through their hard X-ray and microwave emission, con-sistent with Wang and coworkers. But the higher time resolutionoffered by the radio and HXR analysis shows that the observa-tions cannot be ascribed to a single, time-extended accelerationepisode of low-energy electrons, and a different, shorter and de-layed, episode at the higher energies. The electron fluxes at 1 AUrather result from multiple injections of electrons in the corona.Each release produces electrons up to a few tens of keV that areable to emit type III bursts, but the near-relativistic electrons areonly accelerated during part of these acceleration episodes. Thisparticular interval actually consists of several successive events,too, as seen by the multiple microwave peaks. Vlahos & Raoult(1995) argued indeed that apparently individual type III burstsactually result from multiple energy releases, and Chen et al.(2013) confirmed this idea by the Karl G. Jansky Very LargeArray (VLA) observations with high temporal and spectral reso-lution.
4.5. Association with jets and CMEs
The association of the electron events in the present study withvarious types of EUV activities, including jets and large-scalemass motions, is in line with earlier studies on 3He-rich SEPevents (Wang et al. 2006b; Pick et al. 2006; Nitta et al. 2006,2015). However, we do not find a unique association with EUVjets. Y-M Wang and coworkers (Wang et al. 2006b; Pick et al.2006) used SoHO observations to identify EUV jets associatedwith 3He-rich SEP events (13/21 events with suitable observa-tions). They suggested that EUV imaging with higher cadencewould reveal more jets, and proposed a model where the EUVjet was the signature of magnetic reconnection between closedand open coronal magnetic field lines, which also led to the par-ticle acceleration of electrons and ions. But high-cadence EUVimaging from STEREO and especially SDO used in the presentwork, as in Nitta et al. (2015), does not confirm the expectedsystematic association between impulsive SEP events and coro-nal plasma jets. In some events the eruptive coronal activity mayhide the plasma jet, but in some others jets are definitely notdetected with SDO/AIA. However, there are also events with aclear timing correspondence, within a few minutes, of the elec-tron acceleration in the corona revealed by hard X-ray and mi-crowave emission, and the plasma jet. There is no a priori rea-son to exclude magnetic reconnection on the sole reason that noEUV jet is observed. The association with type III bursts andthe PFSS extrapolations show the existence of open field lines inthe parent active region. The scenario of interchange reconnec-tion (e.g., Shibata et al. 1994) as the origin of impulsive electronevents therefore remains attractive, although the observations donot provide a unique simple picture where impulsive electronevents would be exclusively associated with EUV jets, ratherthan with eruptive activity on larger scales.
The association of electron events with CMEs gives anotherhint to a more diversified picture of the origin of impulsive par-
ticle events than the historic two-class picture of either impul-sive (flare-associated) or gradual (CME-associated) SEP-events(Reames 1999). CMEs are not an occasional counterpart of theimpulsive electron events studied here, but some white-light sig-nature is observed with virtually all our electron events. In theonly case where we did not identify a CME in the vicinity of theposition angle of the parent flare, 2007 Jan 24, a faint signaturemight be hidden by a broad CME from a distinct active region. Inthe other events CMEs are seen in the corona. Their morpholo-gies range from jet-like, which on occasion (2010 Nov 17) areclearly the extension of an EUV jet to the higher corona, to ex-tended, as already reported by Wang et al. (2006b). The combi-nation of coronographic observations from SoHO and STEREOoffered us the possibility to have in most events one spacecraft,which saw the parent activity close to the solar limb, so thatthe identification of a CME was much easier than in the ear-lier SoHO observations. The enhanced cadence of the STEREOcoronagraphs also allows for a better timing identifications. Inthree out of 14 events where adequate coronographic observa-tions were available, the CME came from previous erupting ac-tivity. They show that the CME is not a necessary condition forthe electrons to achieve near-relativistic energies. But in ninecases the extrapolated height of the CME at the time of the hardX-ray and microwave burst, i.e. at the time of acceleration ofnear-relativistic electrons, was a few fractions of a solar radiusabove the photosphere. The presence of these low-altitude CMEsseems to be associated with those events at larger longitudinalseparation angles (see Fig. 4). These CMEs might hence play arole in widening the injection region, for example due to field-line spreading or deflection in the corona, or to electron accel-eration on open field lines remote from the parent active region(e.g., Salas-Matamoros et al. 2016).
5. Summary and conclusions
For 17 different solar flare events we correlated the HXR spec-tral characteristics measured by RHESSI with the correspondingspectra of electron events observed in situ with STEREO/SEPT.Most of the in situ electron events show broken power-law spec-tra presumably caused by transport effects. At least two pro-cesses during interplanetary transport have been identified thatare capable of causing such spectral breaks: i) the generationof Langmuir turbulence and ii) pitch-angle scattering (see dis-cussion above). However, the range of the potential positions ofthese different breaks overlap at ∼100 keV. This and the limitedenergy range and resolution of energetic particle instruments arelikely the reasons why usually only a single break is identifiedin solar energetic electron spectra (e.g., Lin et al. 1982; Reameset al. 1985; Krucker et al. 2009; Dresing et al. 2020). It can there-fore be not straightforward to identify which part of the spectrumis least influenced by the above effects and best suited to infer theacceleration spectrum.
We investigated the correlation of the HXR spectral indexwith both spectral indices (in case of broken-power-law shapes)observed in the in situ spectra. We find a good correlation of∼ 0.8 for both sets of value pairs with an alignment along thethin-target solution, i.e. a shift toward harder in situ electronspectral indices, when using the spectral index below the breakδ1 or a shift toward the thick-target solution when using δ2. Allof our events would fall into the class of delayed events as de-fined by Krucker et al. (2007) who found only a low correla-tion of ∼ 0.4 for these events. Although it cannot be ruled outthat many of the observed onset delays are only apparent delayscaused by instrumental effects, such as occasional poor pitch-
Article number, page 11 of 16

A&A proofs: manuscript no. main
angle coverage of STEREO/SEPT, the majority of our events areaccompanied not only by EUV jets but also by CMEs. While thejets are likely a sign of interchange reconnection providing theflare-accelerated electrons with a connection to open field lines,a potential role of the CMEs in the acceleration process as sug-gested by Petrosian (2016), which could also cause the observeddelays, cannot be ruled out. However, we do not find an effectof the CMEs on the correlation of the spectral indices. Never-theless, the CMEs could have perturbed the transport of elec-trons through the lower corona, which might occasionally havecaused a wider or shifted injection into interplanetary space assuggested by the correlation of CMEs with events observed atlarger longitudinal separation angles.
We find clearly improving correlations when only consid-ering events, which show significant anisotropies in the in situelectron observations. This suggests that transport effects suchas pitch-angle scattering can reduce the spectral imprint of theacceleration and need to be taken into account when inferring theaccelerated electron spectrum from spacecraft measurements.
Analysis of the starting frequencies of the associated type IIIradio bursts suggests that the acceleration height of most of ourevents was below 0.1 R� above the photosphere. Furthermore,a detailed inspection of radio and microwave observations sug-gests that the electron fluxes at 1 AU could result from multipleinjections of electrons in the corona as the majority of our eventsis accompanied by groups of type III bursts. However, higherenergy, i.e. near-relativistic electrons are only accelerated duringpart of these acceleration episodes as an indicated by the shorterhard X-ray and microwave emission.
in situ measurements of solar energetic electrons will remaina key observable to study acceleration, injection, and transportprocesses of SEP events. Furthermore, as their propagation timefrom the Sun to Earth is significantly shorter than that of as-sociated solar energetic ions, one main application of solar en-ergetic electrons is space weather forecast as used for examplein the Relativistic Electron Alert System for Exploration (RE-leASE, Posner et al. 2009). Electron event observations duringthe upcoming solar cycle taken by new space missions such asParker Solar Probe or Solar Orbiter open up new opportunitiesto understand solar energetic electrons events. Much advanta-geous over the study presented here, Solar Orbiter will allowto detect the HXR flare and the in situ electrons at the samespacecraft, with the Spectrometer/Telescope for Imaging X-rays(STIX; Krucker et al. 2020) and the Energetic Particle Detector(EPD; Rodríguez-Pacheco et al. 2020). Furthermore, both newspace missions will take measurements at much smaller radialdistance than 1 AU allowing to tackle the effect of interplanetarytransport especially when combined with 1 AU baseline obser-vations provided for instance by, STEREO A, SOHO, ACE, andWind. The new state-of-the art instruments also provide ener-getic electron measurements over a wider energy range with veryfine energy resolution, which might finally allow to separate theimprints of acceleration and transport in the energy spectra.
Acknowledgements. The work of A. W. was supported by DLR under grantNo. 50 QL 1701. F.E. and N.D. acknowledge support from NASA grantNNX17AK25G and F.E. from DFG grant EF 98/4-1. N.D. acknowledges finan-cial support by DLR under grant 50OC1702. We thank the International SpaceScience Institute (ISSI) for hosting our team on “Solar flare acceleration signa-tures and their connection to solar energetic particles.” L.G. acknowledges theNASA DRIVE SolFER Science Center grant 80NSSC20K0627. This study hasreceived funding from the European Union’s Horizon 2020 research and innova-tion program under grant agreement No. 101004159 (SERPENTINE).
ReferencesAcuña, M. H., Curtis, D., Scheifele, J. L., et al. 2008, Space Sci. Rev., 136, 203Agueda, N., Klein, K.-L., Vilmer, N., et al. 2014, A&A, 570, A5Bougeret, J. L., Goetz, K., Kaiser, M. L., et al. 2008, Space Sci. Rev., 136, 487Bougeret, J. L., Kaiser, M. L., Kellogg, P. J., et al. 1995, Space Sci. Rev., 71, 231Brown, J. C. 1971, Sol. Phys., 18, 489Brüdern, M., Dresing, N., Heber, B., et al. 2018, Central European Astrophysical
Bulletin, 42, 2Brueckner, G. E., Howard, R. A., Koomen, M. J., et al. 1995, Sol. Phys., 162,
357Chen, B., Bastian, T. S., White, S. M., et al. 2013, ApJ, 763, L21Chhiber, R., Matthaeus, W. H., Cohen, C. M. S., et al. 2020, arXiv e-prints,
arXiv:2011.08329Dresing, N., Effenberger, F., Gómez-Herrero, R., et al. 2020, ApJ, 889, 143Dresing, N., Gómez-Herrero, R., Heber, B., et al. 2018, A&A, 613, A21Dröge, W. 1996, in American Institute of Physics Conference Series, Vol. 374,
High energy solar Physics, ed. R. Ramaty, N. Mandzhavidze, & X.-M. Hua,78–85
Dröge, W. 2003, ApJ, 589, 1027Emslie, A. G. 2003, ApJ, 595, L119Ergun, R. E., Larson, D., Lin, R. P., et al. 1998, ApJ, 503, 435Fletcher, L., Dennis, B. R., Hudson, H. S., et al. 2011, Space Sci. Rev., 159, 19Gold, R. E., Krimigis, S. M., Hawkins, I. I. I. . S. E., et al. 1998, Space Sci. Rev.,
86, 541Haggerty, D. K. & Roelof, E. C. 2002, ApJ, 579, 841Haggerty, D. K., Roelof, E. C., & Simnett, G. M. 2003, Advances in Space Re-
search, 32, 2673Holman, G. D., Aschwanden, M. J., Aurass, H., et al. 2011, Space Sci. Rev., 159,
107Howard, R. A., Moses, J. D., Vourlidas, A., et al. 2008, Space Sci. Rev., 136, 67James, T., Subramanian, P., & Kontar, E. P. 2017, MNRAS, 471, 89Kahler, S. W., Aurass, H., Mann, G., & Klassen, A. 2007, ApJ, 656, 567Kallenrode, M.-B. 1993, J. Geophys. Res., 98, 5573Kallenrode, M. B., Rieger, E., Wibberenz, G., & Forrest, D. J. 1987, in Interna-
tional Cosmic Ray Conference, Vol. 3, International Cosmic Ray Conference,70
Klein, K.-L. 2021, Frontiers in Astronomy and Space Sciences, 7, 105Kontar, E. P., Bian, N. H., Emslie, A. G., & Vilmer, N. 2014, ApJ, 780, 176Kontar, E. P. & Brown, J. C. 2006, ApJ, 653, L149Kontar, E. P., MacKinnon, A. L., Schwartz, R. A., & Brown, J. C. 2006, A&A,
446, 1157Kontar, E. P. & Reid, H. A. S. 2009, ApJ, 695, L140Krucker, S., Battaglia, M., Cargill, P. J., et al. 2008, A&A Rev., 16, 155Krucker, S., Hurford, G. J., Grimm, O., et al. 2020, A&A, 642, A15Krucker, S., Kontar, E. P., Christe, S., & Lin, R. P. 2007, ApJ, 663, L109Krucker, S., Larson, D. E., Lin, R. P., & Thompson, B. J. 1999, ApJ, 519, 864Krucker, S., Oakley, P. H., & Lin, R. P. 2009, ApJ, 691, 806Laitinen, T. & Dalla, S. 2019, ApJ, 887, 222Laitinen, T., Huttunen-Heikinmaa, K., & Valtonen, E. 2010, in American In-
stitute of Physics Conference Series, Vol. 1216, Twelfth International So-lar Wind Conference, ed. M. Maksimovic, K. Issautier, N. Meyer-Vernet,M. Moncuquet, & F. Pantellini, 249–252
Laitinen, T., Kopp, A., Effenberger, F., Dalla, S., & Marsh, M. S. 2016, A&A,591, A18
Lemen, J. R., Title, A. M., Akin, D. J., et al. 2012, Sol. Phys., 275, 17Li, G., Zhao, L., Wang, L., Liu, W., & Wu, X. 2020, ApJ, 900, L16Lin, R. P., Anderson, K. A., Ashford, S., et al. 1995, Space Sci. Rev., 71, 125Lin, R. P., Dennis, B. R., Hurford, G. J., et al. 2002, Sol. Phys., 210, 3Lin, R. P., Mewaldt, R. A., & Van Hollebeke, M. A. I. 1982, ApJ, 253, 949Maia, D. J. F. & Pick, M. 2004, ApJ, 609, 1082Mann, G., Aurass, H., Klassen, A., Estel, C., & Thompson, B. J. 1999, in ESA
Special Publication, Vol. 446, 8th SOHO Workshop: Plasma Dynamics andDiagnostics in the Solar Transition Region and Corona, ed. J.-C. Vial &B. Kaldeich-Schü, 477
Müller-Mellin, R., Böttcher, S., Falenski, J., et al. 2008, Space Sci. Rev., 136,363
Newkirk, Gordon, J. 1961, ApJ, 133, 983Nitta, N. V., Mason, G. M., Wang, L., Cohen, C. M. S., & Wiedenbeck, M. E.
2015, ApJ, 806, 235Nitta, N. V., Reames, D. V., DeRosa, M. L., et al. 2006, ApJ, 650, 438Pesnell, W. D., Thompson, B. J., & Chamberlin, P. C. 2012, Sol. Phys., 275, 3Petrosian, V. 2016, ApJ, 830, 28Pick, M., Mason, G. M., Wang, Y.-M., Tan, C., & Wang, L. 2006, ApJ, 648, 1247Posner, A., Guetersloh, S., Heber, B., & Rother, O. 2009, Space Weather, 7,
S05001Reames, D. V. 1999, Space Sci. Rev., 90, 413Reames, D. V., von Rosenvinge, T. T., & Lin, R. P. 1985, ApJ, 292, 716Reid, H. A. S. & Kontar, E. P. 2013, Sol. Phys., 285, 217
Article number, page 12 of 16

N. Dresing et al.: Connecting solar flare hard X-ray spectra to in situ electron spectra
Reid, H. A. S. & Ratcliffe, H. 2014, Research in Astronomy and Astrophysics,14, 773
Rodríguez-Pacheco, J., Wimmer-Schweingruber, R. F., Mason, G. M., et al.2020, A&A, 642, A7
Salas-Matamoros, C., Klein, K.-L., & Rouillard, A. P. 2016, A&A, 590, A135Schrijver, C. J. & DeRosa, M. L. 2003, Sol. Phys., 212, 165Shibata, K., Nitta, N., Strong, K. T., et al. 1994, ApJ, 431, L51Strauss, R. D., Dresing, N., Kollhoff, A., & Brüdern, M. 2020, ApJ, 897, 24Vlahos, L. & Raoult, A. 1995, A&A, 296, 844Wang, L., Krucker, S., Mason, G. M., Lin, R. P., & Li, G. 2016, A&A, 585, A119Wang, L., Lin, R. P., Krucker, S., & Gosling, J. T. 2006a, Geophys. Res. Lett.,
33, L03106Wang, Y.-M., Pick, M., & Mason, G. M. 2006b, ApJ, 639, 495Warmuth, A. & Mann, G. 2020, A&A, 644, A172White, S. M., Benz, A. O., Christe, S., et al. 2011, Space Sci. Rev., 159, 225Wuelser, J.-P. 2004, in Proceedings of SPIE, Vol. 5171 (SPIE), 111–122Xia, F., Su, Y., Wang, W., et al. 2021, ApJ, 908, 111
Article number, page 13 of 16

A&A proofs: manuscript no. main
Appendix A: Additional information on the analyzedevents
Table A.1 provides additional information on the events understudy. Column one lists the HXR date and peak time. Columns 2and 3 list the characteristics of the associated microwave bursts:the start and end time, the highest frequency where the non-thermal microwave signature was observed, and the type of thepredominant microwave emission, thermal (th), gyrosynchrotron(gs) or plasma emission (p). Column 4 lists the start and end timeof the decametric type III burst, read from the dynamic spectraobserved by Wind or STEREO near 10 MHz, using data with1 min integration. Column 5 indicates if the event was asso-ciated with a type II radio burst and provides its start and endtime. Columns 6 and 7 provide the magnetic polarity of the as-sociated active region in the corona and locally at the spacecraft(indicated by column 8) during the SEE event. The last columnprovides a rough classification for the strength of the observedelectron anisotropy during the early phase of the electron events.The polarity of the magnetic field in the corona was inferredfrom the potential field source surface (PFSS) extrapolation ofthe SoHO/MDI measurements in the photosphere. The methodof Schrijver & DeRosa (2003) implemented in the PFSS tool ofthe Solarsoft package was used. The polarity in the Table is theone of the open field lines rooted in the flaring active region.The in situ magnetic field polarity was determined by separat-ing between inward our outward pointing magnetic field vectorsas measured by STEREO/MAG (Acuña et al. 2008) during thetime of each electron event. The table shows, that the in situ elec-tron events were often observed in opposite polarity sectors thancoronal polarity of the corresponding flare. We do, however, notsee any influence of the polarity on other parameters such as theonset delays or the quality of the spectral correlations.In two events (2009 Dec 22 and 2012 Apr 16) type II burstswere observed at meter wavelengths, without counterpart in theWind/WAVES spectrum below 14 MHz. Only the first was re-ported by NOAA/SWPC. On 2009 Dec 22 the type II burststarted with the intense microwave emission and HXR burst,and it lasted a few minutes longer. DH type III bursts were ob-served by Wind/WAVES during its entire duration. On 2012 Apr16 the type II emission occurred during the decay of the mi-crowave and HXR burst. DH type III bursts accompanied themicrowave/HXR burst, but not the type II burst. No clear dif-ference of the energy spectra of the electrons was found whencompared to the rest of the events.For the anisotropy classification, presented in the last column oftable A.1, we first determined the anisotropies using the methoddescribed by Brüdern et al. (2018), and categorized anisotropiesA < 1 as small, 1 > A > 2 as medium, and A > 2 as large. Mixedclassifications are provided for events with anisotropies closeto the limiting values of 1 or 2. The asterisks in the anisotropycolumn mark events with limited or poor pitch-angle coverage,which can lead to an underestimation of the anisotropy.
Many of the analyzed flares were accompanied by coronaljets seen in EUV. Table A.2 summarizes the observations of thesejets using EUV images. For the first 4 events, EUV observationsfrom the STEREO-A EUVI (Wuelser 2004) at 195 Å were used,because they provide the best available time cadence for thesedates, which are before the launch of the Solar Dynamic Obser-vatory (SDO, Pesnell et al. 2012) mission in 2010. However, thetime cadence (5 minutes in average) and spatial resolution arenot sufficient to clearly confirm the absence of jets, for instanceduring the first event. Despite these instrumental limitations, jetsand eruptions are still clearly found for the other three events.
For the later events, data from the Atmospheric Imaging Assem-bly (AIA, Lemen et al. 2012) on board SDO was available. AIAhas a cadence of 12 second and provides images of the Sun in 7EUV filters. The 304 Å filter was used to look for coronal jetswithin one hour of the X-ray peak time of the flare, as jets aretypically bright in this wavelength. In the 13 events observed inthe SDO era, only two events are not associated with a coronaljet. Most of the observed jets are observed at the time and lo-cation of the flare, as reported in the third column of table A.2.The events for which no jet was found, or with a jet delayed orat a different location in the active region than a flare, are notparticularly associated with delayed SEP electron events.
Most of the analyzed flares were accompanied by coronalmass ejections (CMEs). Table A.2 summarizes the observationsusing the coronagraphs aboard SoHO (LASCO/C2, Brueckneret al. 1995) or STEREO (SECCHI/COR1, Howard et al. 2008).In order to avoid spurious associations due to projection effects,we restricted the sample to events where the parent active re-gion was within 30◦ of the limb. The third column displays thecentral meridian distance (CMD) for the chosen spacecraft. Thefifth column gives the time of first appearance in the field of viewof the coronograph, together with the estimated heliocentric dis-tance as identified in the images9. Whenever possible a roughestimate of the speed in the plane of the sky is also provided,as well as the height of the CME front at the time of the HXRpeak, which is inferred from linear back projection. Column sixprovides comments for specific events.
CMEs are found during all events where adequate corono-graphic observations are available. The relationship with theflare and electron events is not always clear, however. The 2007Jan 24 events are not related with the partial halo CME observedat the time of the flare. Since the CME appeared in LASCO im-ages at the east limb before the west limb, it likely originatedfrom a region in the eastern solar hemisphere. No active regionwas on the eastern solar disk this day, but a candidate crossed theeast limb three days later. We therefore conclude that the partialhalo CME was a backside event. In three cases the CME wasalready high above the solar limb at the time of the flare (2012Apr 16 and Jun 27, 2014 Mar 19). The starting frequencies of thetype III bursts associated with these events show that the electronacceleration must have occurred at lower height. In nine eventsthe extrapolated height of the CME front at the time of the HXRburst is within 1 R� above the photosphere, so that its early risemay have been related with the electron acceleration as tracedby the HXR and radio emissions. The CMEs are in general notlarge, and some are reminiscent of jets.
Appendix A.1: Implications of the spectral variation in the twomulti-spacecraft events of 24 Jan 2007
Two events on 24 Jan 2007 were observed by both STEREOspacecraft when they were still separated by less than one de-gree in longitude and latitude. As expected the peak intensitiesand onset times are very similar as detected by the two observers.However, both events were observed during changing magneticfield conditions leading to variable and partly nonoptimal pitch-angle coverage of the SEPT instruments. The pitch-angle cover-age was always better at STEREO A, which might be the rea-son for the slightly larger anisotropies compared to STEREO B.For the first event, the determined spectral indices of the peakspectra are similar at the two spacecraft but for the second event
9 Movies provided by JHelioviewer or https://cdaw.gsfc.nasa.gov/stereo/daily_movies/
Article number, page 14 of 16

N. Dresing et al.: Connecting solar flare hard X-ray spectra to in situ electron spectra
Table A.1. Complementary radio, magnetic polarity and anisotropy information of the analyzed event
HXR Microwave burst νmax DH III II Magnetic polaritypeak time start - end [GHz]/ start-end corona in situ s/c anisotropy
type2007/01/24 00:31:24 00:31:10-00:32:00 9/gs 00:29-00:33 – neg mixed A small/medium2007/01/24 00:31:24 – – – – neg mixed B small2007/01/24 05:16:09 05:15:50-05:16:30 5/gs 05:12-05:19 – neg mixed B small*
2007/01/24 05:16:09 – – – – neg mixed A small/medium2009/12/22 04:56:10 04:53:00-04:57:00 17/gs 04:52-05:04 04:57-05:03 pos pos B large2010/02/08 03:12:24 03:12:20–03:14:00 17/gs 03:13-03:16 – neg neg B small2010/11/12 03:53:41 03:53:25–03:56:00 1/p 03:45-03:54 – neg neg B small/medium*
2010/11/12 08:01:54 08:01:00–08:04:50 15/gs 07:55-08:11 – neg neg B medium/large*
2010/11/17 04:36:44 04:36:30-04:37:10 3/gs 04:31-04:37 – pos neg B small/medium*
2011/03/24 17:04:34 17:03:00-17:06:50 15/gs 16:53-17:16 – pos neg B large2012/01/12 00:51:58 ∼00:49–00:53 5/gs 00:49-00:53 – neg pos B small*
2012/03/25 00:27:54 00:27:05–00:28:30 9/gs 00:22-00:28 – neg neg B small*
2012/04/16 00:26:14 ∼00:25-00:28 4/gs 00:24-00:30 00:29-00:40 uncertain neg B small/medium*
2012/05/07 03:21:58 03:21:00–03:26 17/gs 03:20-03:29 – neg neg B medium*
2012/06/27 12:36:00 12:36:00–12:36:30 9/gs 12:34-12:40 – neg neg B medium/large2012/06/28 02:12:24 02:12:00–02:13:30 2/p 02:10-02:14 – neg pos B medium*
2012/07/01 07:14:44 07:14:40–07:14:50 9/gs 07:09-07:25 – neg pos B large2014/03/19 16:26:14 16:29:00–16:32 15/th 16:24-16:30 – uncertain pos B large2014/06/09 17:05:04 17:04:30–17:06:20 15/gs 17:03-17:07 – uncertain pos B medium*
Notes. (*) L imited or poor pitch-angle coverage in SEPT measurements due to non-nominal magnetic field configuration.
Table A.2. Jets and CMEs possibly related with the electron events and flares.
EUV jet Coronal mass ejectionHXR peak time Instr First/ Instrument/ Height-time evolution Comment
Distance CMD [deg] (first/r0/V/r(HXR))(1) (2) (3) (4) (5) (6)2007/01/24 00:31 STA -/- [1] [2] SoHO W61 01:32/2.3 R�/-/- E backside2007/01/24 05:16 STA 05:15/< 5′′ SoHO W64 06:06/2.5 R�/ -/- E backside2009/12/22 04:56 STA 04:55/< 5′′ STB W114 05:11/1.7 R�/470/1.0 R�2010/02/08 03:12 STA 03:20/< 5′′ [3] STB W71 03:41/1.6 R�/200/1.1 R� jet2010/11/12 03:53 AIA 04:05/< 5′′ [4] STA W86 03:55/1.7 R�/580/1.6 R� faint diffuse2010/11/12 08:02 AIA 08:55/10′′ STA W83 08:05/? R�/700/1.4 R� faint diffuse2010/11/17 04:37 AIA flare/< 5′′ STA E105 04:45/1.8 R�/930/1.2 R� jet2011/03/24 17:05 AIA flare/< 5′′ CMD > 30◦
2012/01/12 00:52 AIA 01:12/< 5′′ [3] [4] STB W92 01:01/1.7R�/520/1.3 R�2012/03/25 00:28 AIA -/- [1] STB W93 00:26/1.9R�/860/1.7 R�2012/04/16 00:26 AIA -/- [1] SoHO E89 00:36/3.5 R�/∼ 490/3.1 R� narrow2012/05/07 03:22 AIA -/< 5′′ [2] [4] CMD > 30◦2012/06/27 12:36 AIA flare/20′′ SoHO E64 12:10/3.2 R�/∼ 760/4.3 R� pre-existing2012/06/28 03:22 AIA flare/< 5′′ [2] CMD > 30◦2012/07/01 07:15 AIA flare/< 5′′ STB W105 07:25/2.2R� /700/1.6 R�2014/03/19 16:26 AIA flare/15′′ SoHO E81 15:24/4 R�/- /- pre-existing2014/06/09 17:05 AIA 17:20/50′′ SoHO E90 17:24/2.8 R�/∼ 680/1.7 R�
Notes. Columns: (1) Date (see Table 1), (2)-(3): EUV jet (instrument (2), start time/distance from HXR emission site (3), ); (4)-(6): CME (in-strument and central meridian distance of the flare (4), first detection/heliocentric distance/ speed in the plane of the sky (km s−1)/extrapolatedheliocentric distance at the HXR peak) (5), comment (6)Comments in column (3): [1] jet not detected in the data; [2] numerous jets in this active regions over a few hours; [3] possible filament eruption;[4] faint ejection.
STEREO B only observes a single power law while STEREO Adetects a broken power law. Although the spectral values ob-served at the two spacecraft agree within their uncertainties forthe two events this illustrates how the magnetic field configura-tion and variation can not only influence onset determinationsbut also the determined spectra. It is expected that the most reli-able spectra are those where the instruments detect the electronpopulation propagating anti-sunward along the magnetic field,
i.e. at pitch angle 0 or 180 (depending on the magnetic field po-larity). If these directions are not covered by the instrument orif strong scattering has led to a vanished anisotropy, the deter-mined spectra may carry systematic changes. Unfortunately, pe-riods of non-ideal pitch-angle coverage occur regularly in SEPTmeasurements so that several of the analyzed events may be sub-ject to this limitation.
Article number, page 15 of 16

A&A proofs: manuscript no. main
Appendix A.2: The events on 17 Nov 2010, 28 June 2012,and 19 Mar 2014
An important issue discussed in this manuscript is that it is notstraightforward to choose the appropriate spectral index out ofthe usually observed double power law spectrum for a compari-son with its solar counterpart. Observations of near-relativisticelectrons usually show only one spectral break or transition(e.g., using Wind/3DP (Krucker et al. 2007) or STEREO/SEPT(Dresing et al. 2020)). However, due to the limited overall energyrange and energy resolution of these instruments their ability toresolve which of the different effects caused the spectral breakor if an overlap of effects determines the spectral shape is alsolimited. The correlation with the solar counterpart spectral indexmay even help here: When correlating the photon spectral indexγ with both the lower δ1 and upper δ1 spectral indices of the insitu electron spectra (Fig. 5 & 6) we find that three events (17Nov 2010, 28 June 2012, and 19 Mar 2014) do not fit the restof the distributions. As described in section 3 we suspect thatthese three events show a spectral transition, which can rather beattributed to Langmuir-wave generation while the spectral tran-sitions of the rest of the events are likely caused by pitch-anglescattering (Dresing et al. 2020; Strauss et al. 2020). Indeed, whentreating these three events accordingly in the correlation plots(Fig. 5 & 6) the overall correlations increase significantly. Oneof these three events (17 Nov 2010) is indeed the event withthe lowest break energy in our whole sample (Eb = 69 keV),which supports the assumption that this break can be attributedto Langmuir-wave generation, which is expected to yield a breakaround 60 keV (Krucker et al. 2009). The break energies of theother two special events (90 and 101 keV) are rather low withrespect to the mean spectral break value of 120 keV found byDresing et al. (2020), which was attributed to pitch-angle scatter-ing, however many other events analyzed here show similar lowbreak energies. The two latter events are both anisotropic. Whilethe pitch-angle coverage during the 28 June 2012 event is notoptimal, likely leading to an underestimation of the anisotropy,the pitch-angle coverage during the 19 Mar 2014 event is idealand shows a very strong anisotropy (not shown). Consultationof the STEREO level3 Interplanetary Coronal Mass Ejection(ICME) list10 reveals that STEREO B was embedded inside anICME when the 19 Mar event occurred. The usually very quietmagnetic field conditions inside ICMEs may have contributedto very weak scattering conditions during this event and conse-quently high anisotropy. The pitch-angle distribution during the28 June event is peculiar as the highest intensities are observedin SEPT’s north and ani-sun sectors, suggesting that also duringthis event, the spacecraft was embedded inside a non-nominalmagnetic field configuration. However, an ICME passage is onlyreported for about six hours after the event onset. The solar ori-gin of this electron event is, however, not doubted given the goodtemporal correlation with the flare and the associated type III ra-dio burst, and the notable anisotropy. In spite of the peculiari-ties of these two latter events, they are otherwise not outstandingwhen comparing their characteristics such as peak intensities orenergies, strength of the anisotropy, onset delays or radio fea-tures with the rest of our sample. The reason why the spectralbreak due to Langmuir-wave generation is dominant in the spec-tra of these events, is therefore not conclusively understood.
10 https://stereo-ssc.nascom.nasa.gov/data/ins_data/impact/level3/STEREO_Level3_ICME.pdf
Article number, page 16 of 16