A wind-powered seawater reverse-osmosis system without batteries

Concentration of ammonium and nitrate from mine waterby reverse osmosis and nanofiltration
Katri H€ayrynena,b*, Eva Pongr�acza, Virpi V€ais€anena, Nora Papa, Mika M€antt€aric,J€org Langwaldtd, Riitta Liisa Keiskia
aMass and Heat Transfer Process Laboratory, Department of Process and Environmental Engineering,University of Oulu, P.O. Box 4300, FIN 90014 Oulu, Finland
bRovaniemi Research Station, Finnish Forest Research Institute, Etel€aranta 55, 96300 Rovaniemi, FinlandTel. +358 8 553 7662; Fax +358 8 553 2369; email: [email protected]
cLaboratory of Membrane Technology and Technical Polymer Chemistry, Department of Chemical Technology,Lappeenranta University of Technology, Skinnarilankatu 34, 53850 Lappeenranta, Finland
dMineral Processing, Geological Survey of Finland, Tutkijankatu 1, 83500 Outokumpu, Finland
Received 20 September 2007; revised 30 January 2008; accepted 6 February 2008
Abstract
The mining industry uses large amounts of explosives and a part of them remains undetonated. Since mostcommercial blasting agents contain ammonium nitrate, there is a direct relationship between explosives use andthe ammonium and nitrate levels in mine effluents. Water contamination with nitrogenous compounds canpromote corrosion and eutrophication in receiving water bodies and be detrimental to fish.
Four commercial thin film composite reverse osmosis (RO) membranes and one nanofiltration (NF) membranewere studied in retaining ammonium and nitrate form mine water. The aim of the filtrations was to produce cleanpermeate and a concentrate suitable for downstream treatment in nitrifying�denitrifying bioreactors. Selection ofmembranes and operational pressure was performed with a plate and frame module. The membranes were thentested for continuous concentration with different volumetric reduction factors.
RO yielded good quality permeate and concentrate for bioreactor treatment. NF showed poor separationperformance.With the selected RO-membrane, the retention of ammonium and nitrate was more than 82% and 90%,respectively, during the concentration. As membrane fouling can be a limiting factor a prefiltration step isrecommended before the RO unit.
Keywords: Mine water; Ammonium; Nitrate; Reverse osmosis; Nanofiltration
Presented at the Third Membrane Science and Technology Conference of Visegrad Countries (PERMEA), Siofok,Hungary, 2–6 September 2007.
*Corresponding author.
Desalination 240 (2009) 280�289
0011-9164/09/$– See front matter # 2009 Elsevier B.V. All rights reserved.doi: 10.1016/j.desal.0000.00.000

1. Introduction
The mining industry uses extensive amountsof explosives, parts of which remain undeto-nated. In Finland, the annual explosive con-sumption is estimated to be 6000 tons [1].Forsberg and Åkerlund estimated that 15�19%of all loaded explosives will remain on extractedbarren rock and ore [2]. Most commercialblasting agents contain ammonium and nitrate,resulting in discharge of these nitrogenouscompounds to the aquatic environment nearbythe mines. The fate of ammonium-nitrate fuel oilexplosives in the mining operation and circuitshas not yet been studied in detail. Ammoniumand nitrate can promote corrosion and causeundesirable algal growths in the receiving waterbodies [3]. Furthermore, already a relativelysmall concentration of ammonia in water canbe detrimental to fish. Ammonia can exist asammonium ion (/NHþ
4 ) or as free ammonia(NH3) in aqueous solutions [4]. The generatedmine effluent usually contains also suspendedsolids, heavy metals, reducing agents, oxidants,and salts [5]. Considering the amount of sus-pended solids is particularly important, sincethey can block and foul the membranes.
Most of the undetonated explosives aredissolved in water in wet processes and aredischarged from the mine. Nitrogenous com-pounds can also be rinsed from piled up wasterock. During the detonation of explosives, NOX
is formed. NOX can also dissolve in water [2].Other nitrogen sources in mine effluents can beflotation chemicals, effluents from cyanidedestruction, and pH regulation chemicals [1].In Finland, the discharge of nutrients frommining sites is supervised on a case by casebasis by the environmental authorities, sincelegislation on discharge limits is lacking [1].The European Union Directive 2000/60/EC forthe protection of aquatic environment onlydemands a good state of aquatic environmentsto be attained. The European Commission’s
“Best Available Techniques for Management ofTailings and Waste-Rock in Mining Activities”reference document addresses only to a limitedextent the discharge of inorganic nitrogen com-pounds from mining activities into the environ-ment and does not provide a best availabletechnique to minimize the amount of nutrientsreleased or removal of nitrogen from mineeffluents. Although attempts have been madeto develop a process for the removal of dissolvednitrogen compounds from mine waters, nocommercial process for ammonia nitrate removalis currently available [6]. Apart from biologicaltreatment, the most common ways for removalof nitrogenous compounds have been ion ex-change and catalytic oxidation [7]. The removalof total nitrogen from mine water by biologicalnitrification�denitrification has been reportedearlier [6�10]. During this process, ammoniumis converted to gaseous nitrogen species vianitrite/nitrate [11].
However, since the annual total volume ofmine water discharged can be several millioncubic meters, a concentration step for nitrogen-ous compounds prior to biological total-nitrogenremoval is necessary. Nanofiltration (NF) andreverse osmosis (RO) are viable options as theysimultaneously separate and concentrate allpollutants without modifying their molecularstructure [12]. In addition, membrane separationrequires less energy than many other alternativessince no phase change occurs, the equipment arecompact, modular and capable for continuousoperation [13,14]. When using RO or NF forseparation prior to bioreactor, the aim is a cleanpermeate that could be discharged directly to thenature and only the nitrogenous compounds richconcentrate would be biologically treated.
The literature on the application of RO andNF for the separation of nitrogenous compoundsfrom mine effluents is scarce. Malaiyandi andSastri reported less than 30% retention ofammonium and nitrate by RO cellulose acetate
K. H€ayrynen et al. / Desalination 240 (2009) 280�289 281

membrane [15]. The Permasep Technical datareported for the about 80% rejection of ammo-nium and 85% of nitrate ions using hollow finefiber B-9 [16]. Awadalla et al. tested fourdifferent RO membranes and two NF mem-branes for the removal of ammonium and nitrateions from mining effluents. The separation washighest with SU RO membrane, for ammonium>99% and for nitrate about 97% but NFmembranes could not be considered for furthertests [13].
This paper reports on a study exploring theapplicability of RO and NF for the concentrationof ammonium and nitrate from mine watercollected from a gold mine. The aim of theinvestigation was to produce a clean permeateand a concentrate suitable for downstreamtreatment in nitrifying-denitrifying bioreactors.
2. Experimental
The experiments were conducted on actualmine water from Pahtavaara gold mine. ThePahtavaara mine is situated in Central Lapland.The amount of formed water in the mine isapproximately 250 000m3/a. The composition ofthe mine water is presented in Table 1. The waterquality is monitored on-site and the valuesreported in Table 1 are representative to thevalues measured on-site. The electric conductiv-ity of the effluent was 460 ms/cm and pH 7.9.
For the experiments, a DSS Labstak M20laboratory equipment, manufactured by DanishSeparation Systems AS was used. The maximum
operating pressure of the equipment is 80 bar,and it can be equipped with flat sheet mem-branes. The effective membrane area is0.036m2. It is possible to put a maximum of20 membranes to the packing, thus increasingthe total membrane area to 0.72m2. In the M20-filter membranes are in series. However, as thetotal flow rate of the permeates was muchsmaller than the retentate flow, the membraneswere practically in parallel and feed flowcomposition on each membrane can be consid-ered similar. Incoming and outgoing pressuresare shown at the indicators. The feed amount tothe membrane can be adjusted by changing therecirculation flow rate. The original mine waterwas filtered without any pre-treatment at atemperature between 12.6 and 158C, in orderto simulate the conditions in the mine.
Five different commercial membranes weretested. The characteristics of these membranesare presented in Table 2.
The experiments were performed in twostages: first a membrane selection stage and latera concentration stage. The first stage of theexperiment was carried out in a batch mode, boththe permeate and concentrate were returned tothe feedtank. The membranes were packed infive membrane pair bundles with a control platebetween each membrane pair and also below andabove the package. Permeate was collected fromeach membrane pair. The concentrate from allmembranes came out from the same tube. Thisdesign made it possible to test different types ofmembranes at the same time. The recirculating
Table 1Composition of the tested mine water, concentrations in mg/L
NO3�N NH4�N Cl Li Na Mg Al P S K Ca Mn
15.5 9.53 14.03 B/0.01 28.1 15.9 B/0.01 B/0.01 14.6 15.0 32.2 0.04B Co Fe Ni Cu Zn As Cd Sr Ba Pb Cr0.10 0.01 0.01 B/0.01 0.02 0.08 B/0.01 B/0.01 0.28 0.12 B/0.01 B/0.01
282 K. H€ayrynen et al. / Desalination 240 (2009) 280�289

flow rate was kept at 80% all the time. With thisrecirculating flow rate, the concentrate flow ratewas approximately 490 L/h. This corresponds tocross-flow velocity of approximately 1.2m/s atthe surface of the membrane. The operatingpressure was raised stepwise from 6 to 35 bar.The tested pressures were 6, 10, 15, 20, and25 bar for Espa2, TFC ULP, RO1 and NFmembranes. Because of the small permeateflux from SW30 HR, the samples were takenonly at 15, 20, 25, 30, and 35 bar. After raisingthe pressure, samples were taken only after halfan hour, when the conditions and flow rateswould stabilize. The samples were taken fromthe permeate tubes and refrigerated and stored incool if not tested immediately. The optimumpressure was chosen based on the measuredfluxes and calculated retentions of electric con-ductivities. After the most suitable membraneand pressure value were selected, the effluentwas concentrated using the selected membraneby circulating the concentrate back to the feedvessel and by removing the permeate to aseparate vessel. The pressure was maintained at15 bar. Due to the large amount of the feed waterand small permeate flow, the second concentra-tion stage was carried on as a continuous process
for approximately 30 h. Samples were collectedfrom the feed and permeate vessels at fivedifferent volumetric reduction factors (VRFs)which were calculated according to followingequation:
VRF
¼ Total feedwater amount
Total feedwater amount� The amount of permeate
ð1ÞThe retention of electric conductivity with
different VRFs was calculated according toEq. (2):
Rðelectric conductivityÞ ¼ 1Cpa
Cc
� 100% ð2Þ
where Cpa is the concentration in accumulatedpermeate at a specific VRF (mg/L) and Cc is theconcentration in residual concentrate (feed) at aspecific VRF (mg/L).
The amount of ammonium, nitrate, andchloride was measured with Hach LangeDR2800 spectrophotometer. The analysismethod of nitrate is equivalent to the ISO 7150-1 method and the analysis of nitrate to ISO 7890-1-2-1986 method. The metal ion content wasanalyzed by using ICP-AES. The retention for
Table 2Technical data for membranes used in the experiments (data from manufacturers’ homepages)
Membrane identification Supplier manufacturer Membrane type and material Retention (%) Operating pH range
SW30 HR Filmtec Corp. RO, thin film composite 99.6a 2�11Espa2 Hydranautics RO, thin film composite 99.5b 3�10TFC ULP KOCH Membrane
SystemsRO, thin film composite 98.0c 4�11
RO1 Sepro RO, thin film composite 98.0d 3�10NF Filmtec Corp. NF, thin film composite � �
aTested with 32 000mg/L NaCl, 55 bar and at 258C.bTested with 1500 ppm NaCl feed water solution.cNominal rejection conductivity percent.dTested with 2000 ppm NaCl feed water, with 8.6 bar pressure at 258C.
K. H€ayrynen et al. / Desalination 240 (2009) 280�289 283
ammonium, nitrate, chloride, and metal ions wascalculated according to Eq. (3):
R ¼ 1Cpa
Cf
� 100% ð3Þ
where Cpa is the concentration in accumulatedpermeate (mg/L) and Cf is the concentration infeed at the beginning (mg/L).
Membrane fouling was calculated by com-paring the pure water permeability before andafter the filtration as shown:
Fouling ¼ 1� PWPa
PWPb
!� 100% ð4Þ
where PWPa is pure water permeability aftereffluent filtration (L/m2 h bar)] and PWPb is purewater permeability before effluent filtration (L/m2 h bar).
3. Results and discussion
3.1. Selection of the most suitable membrane
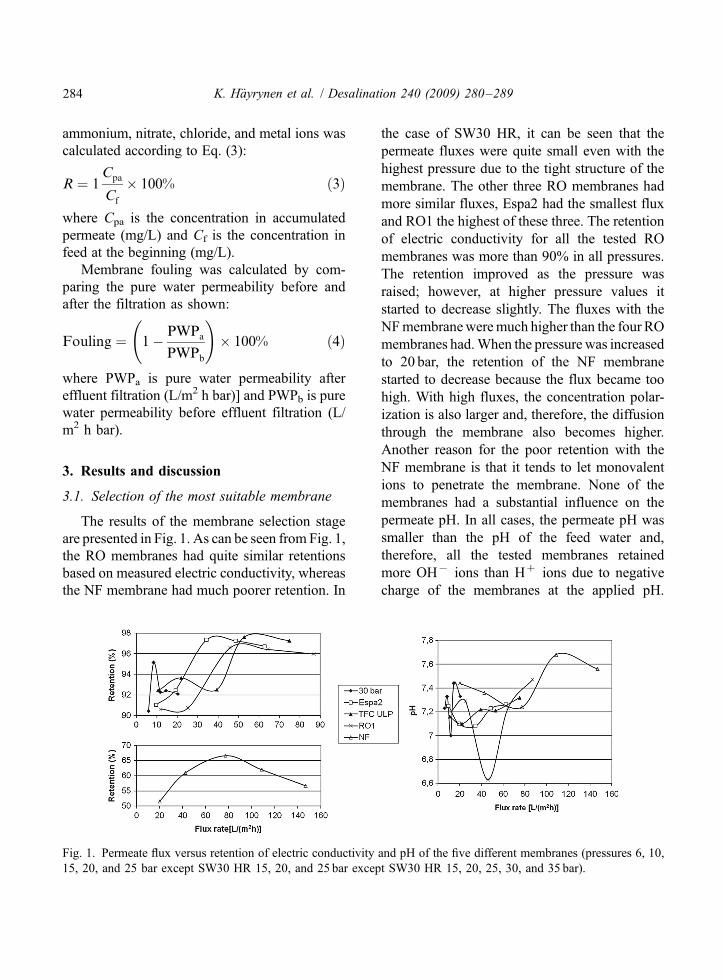
The results of the membrane selection stageare presented in Fig. 1. As can be seen from Fig. 1,the RO membranes had quite similar retentionsbased on measured electric conductivity, whereasthe NF membrane had much poorer retention. In
the case of SW30 HR, it can be seen that thepermeate fluxes were quite small even with thehighest pressure due to the tight structure of themembrane. The other three RO membranes hadmore similar fluxes, Espa2 had the smallest fluxand RO1 the highest of these three. The retentionof electric conductivity for all the tested ROmembranes was more than 90% in all pressures.The retention improved as the pressure wasraised; however, at higher pressure values itstarted to decrease slightly. The fluxes with theNFmembraneweremuch higher than the four ROmembranes had.When the pressure was increasedto 20 bar, the retention of the NF membranestarted to decrease because the flux became toohigh. With high fluxes, the concentration polar-ization is also larger and, therefore, the diffusionthrough the membrane also becomes higher.Another reason for the poor retention with theNF membrane is that it tends to let monovalentions to penetrate the membrane. None of themembranes had a substantial influence on thepermeate pH. In all cases, the permeate pH wassmaller than the pH of the feed water and,therefore, all the tested membranes retainedmore OH� ions than H� ions due to negativecharge of the membranes at the applied pH.
Fig. 1. Permeate flux versus retention of electric conductivity and pH of the five different membranes (pressures 6, 10,15, 20, and 25 bar except SW30 HR 15, 20, and 25 bar except SW30 HR 15, 20, 25, 30, and 35 bar).
284 K. H€ayrynen et al. / Desalination 240 (2009) 280�289

No direct relationship between the fluxes and pHwas observed.
Based on the fluxes and retentions of theconductivity, samples from 15 bar were chosenfor further analysis with Espa2, TFC ULP, RO1,and NF. The pressure chosen for the SW30 HRwas 25 bar, because of the smaller permeate flux.
The results from nitrate, ammonium, andchloride analyses are presented in Table 3. TheTFC ULP membrane had the best retention toNO3�N and Espa2 to NH4�N. Out of these two
membranes, TFC ULP had a slightly betterpermeate flux.
The results from the permeate ICP-AES �analyses are presented in Table 3. There wereno substantial differences in the ion retentions ofthe membranes. The NF membrane removedsome of the ions similarly as the RO membranesdid; however, the ions separated were multi-valent. One exception was zinc (Zn2+) which hada deficient retention. Poor retention can be partlydue to the small size of the ion. The only
Table 3The results from the permeate analyses for the five tested membranes
Feed SW30 HR Espa2 TFC ULP RO1 NF
NO3�N mg/L 15.6 0.94 0.40 0.36 0.61 11.5Retention (%) 93.9 97.4 97.7 96.0 24.9
Cl mg/L 14.0 2.86 B/1.30 B/1.02 B/1.16 5.07Retention (%) 79.6 �/90.8 �/92.7 �/91.8 63.9
NH4�N mg/L 9.53 1.64 0.54 0.81 0.80 4.17Retention (%) 82.8 94.3 91.5 91.6 56.2
S mg/L 14.6 0.83 0.07 0.07 0.24 0.17Retention (%) 94.3 99.5 99.5 98.4 98.8
Na mg/L 28.1 1.96 1.60 0.67 1.85 13.7Retention (%) 92.0 93.3 96.6 92.4 50.7
Mg mg/L 15.9 0.85 0.09 0.06 0.15 2.89Retention (%) 94.7 99.4 99.6 99.1 81.8
K mg/L 15.0 2.50 2.13 1.77 2.21 7.04Retention (%) 83.3 85.8 88.2 85.3 53.1
Ca mg/L 32.2 1.37 0.11 B/0.01 0.17 7.24Retention (%) 95.8 99.7 99.9 99.5 77.5
Sr mg/L 0.28 0.01 B/0.01 B/0.01 B/0.01 0.06Retention (%) 95.4 �/96.4 �/96.4 �/96.4 79.1
B mg/L 0.10 0.02 0.04 0.03 0.04 0.09Retention (%) 81.4 60.8 71.1 55.7 4.1
Zn mg/L 0.08 0.03 B/0.01 B/0.01 B/0.01 0.07Retention (%) 67.5 �/87.5 �/87.5 �/87.5 7.8
Ba mg/L 0.12 B/0.01 B/0.01 B/0.01 B/0.01 0.02Retention (%) �/91.4 �/91.4 �/91.4 �/91.4 80.8
Mn mg/L 0.04 B/0.01 B/0.01 B/0.01 B/0.01 B/0.01Retention (%) �/75.0 �/75.0 �/75.0 �/75.0 �/75.0
Cu mg/L 0.02 B/0.01 B/0.01 0.06 B/0.01 0.07Retention (%) �/50.0 �/50.0 0 �/50.0 0
As mg/L B/0.01 0.02 0.02 B/0.01 0.13 0.04Pb mg/L B/0.01 B/0.01 0.07 B/0.01 0.01 B/0.01
K. H€ayrynen et al. / Desalination 240 (2009) 280�289 285

considerable difference between the four ROmembranes was in their ability to remove boron,which was retained best by SW30 HR and TFCULP. The amount of arsenic was higher inpermeate than it was in the feed water with allthe other membranes except for TFC ULP. Theamount of lead was also higher in the Espa2permeate than it was in the feed water. Themembrane permeation rate for these elementswas higher than that of water in these cases.
The fouling percentages to Espa2 membranewas 0.4%, TFC ULP 5.3%, RO1 4.6%, and toNF 11.7%. With SW30 HR, no fouling hadoccurred. All of these percentages are accepta-ble. The selected membrane for the concentra-tion was TFC ULP due to the membrane’srejection of NO3�N and NH4�N and the highpermeate flux.
3.2. Concentration of mine water
In the mine water concentration stage, thefeed water temperature was kept between 13.6and 13.98C. The effective membrane area of theused TFC ULP membrane was 0.144m2, whichwas gained by using four membrane pairs. The
feed water was re-analyzed before filtrations.The five VRFs in which the samples were takenwere 8.9, 10.1, 12.7, 15.5, and 20.4. With 15-barpressure, the permeate fluxes were 49.1, 42.9,42.3, and 44.5 L/m2 h starting from the lowestmembrane. The flux range is under 15% and,therefore, normal.
The retention calculated based on electricalconductivity was 99.0% or more with all thetested VRFs. Retention improved slightly as thefeed became more concentrated and it was99.2% with the highest VRF. Hence, the reten-tion percentages improved compared to themembrane selection stage with the same mem-brane. In the permeate pH value, there weresignificant differences between different VRFs.
The concentration of nitrate and ammoniumin permeate increased when VRF was increased(Table 4). According to these figures, the dete-rioration in permeate quality was only small.When the non-concentrated water was comparedto the smallest tested VRF, the difference in thepermeate content of NO3�N was only about1mg/L and for NH4�N slightly more than0.5mg/L. As the increase in the amount of
Table 4The results from the TFC ULP membrane permeate analyses and electric conductivity measurements from theconcentration stage
Feed VRF
8.9 10.1 12.7 15.5 20.4
EC Permeate (ms/cm) 460 30.2 29.7 31.2 31.7 33.2Concentrate (ms/cm) 3080 3260 3680 3940 4380
NO3�N Permeate (mg/L) 15.3 1.33 1.38 1.48 1.47 1.54Separation (%) 91.3 91.0 90.3 90.4 89.9Concentrate (mg/L) 135 173 139 163 203
Cl Permeate (mg/L) 15.7 2.00 B/1.18 B/1.03 B/1.25 2.4Separation (%) 87.3 92.5 93.4 92.0 84.7Concentrate (mg/L) 105 119 138 150 161
NH4�N Permeate (mg/L) 9.48 1.53 1.54 1.6 1.63 1.69Separation (%) 83.9 83.8 83.1 82.8 82.2Concentrate (mg/L) 74.3 86.3 83.6 98.2 104
286 K. H€ayrynen et al. / Desalination 240 (2009) 280�289
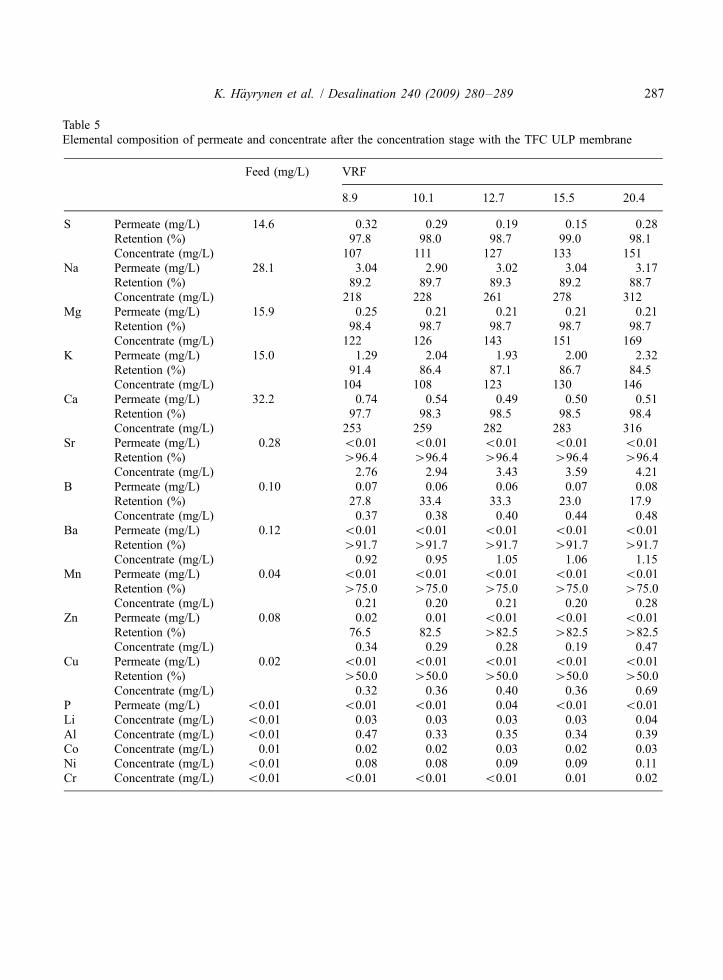
Table 5Elemental composition of permeate and concentrate after the concentration stage with the TFC ULP membrane
Feed (mg/L) VRF
8.9 10.1 12.7 15.5 20.4
S Permeate (mg/L) 14.6 0.32 0.29 0.19 0.15 0.28Retention (%) 97.8 98.0 98.7 99.0 98.1Concentrate (mg/L) 107 111 127 133 151
Na Permeate (mg/L) 28.1 3.04 2.90 3.02 3.04 3.17Retention (%) 89.2 89.7 89.3 89.2 88.7Concentrate (mg/L) 218 228 261 278 312
Mg Permeate (mg/L) 15.9 0.25 0.21 0.21 0.21 0.21Retention (%) 98.4 98.7 98.7 98.7 98.7Concentrate (mg/L) 122 126 143 151 169
K Permeate (mg/L) 15.0 1.29 2.04 1.93 2.00 2.32Retention (%) 91.4 86.4 87.1 86.7 84.5Concentrate (mg/L) 104 108 123 130 146
Ca Permeate (mg/L) 32.2 0.74 0.54 0.49 0.50 0.51Retention (%) 97.7 98.3 98.5 98.5 98.4Concentrate (mg/L) 253 259 282 283 316
Sr Permeate (mg/L) 0.28 B/0.01 B/0.01 B/0.01 B/0.01 B/0.01Retention (%) �/96.4 �/96.4 �/96.4 �/96.4 �/96.4Concentrate (mg/L) 2.76 2.94 3.43 3.59 4.21
B Permeate (mg/L) 0.10 0.07 0.06 0.06 0.07 0.08Retention (%) 27.8 33.4 33.3 23.0 17.9Concentrate (mg/L) 0.37 0.38 0.40 0.44 0.48
Ba Permeate (mg/L) 0.12 B/0.01 B/0.01 B/0.01 B/0.01 B/0.01Retention (%) �/91.7 �/91.7 �/91.7 �/91.7 �/91.7Concentrate (mg/L) 0.92 0.95 1.05 1.06 1.15
Mn Permeate (mg/L) 0.04 B/0.01 B/0.01 B/0.01 B/0.01 B/0.01Retention (%) �/75.0 �/75.0 �/75.0 �/75.0 �/75.0Concentrate (mg/L) 0.21 0.20 0.21 0.20 0.28
Zn Permeate (mg/L) 0.08 0.02 0.01 B/0.01 B/0.01 B/0.01Retention (%) 76.5 82.5 �/82.5 �/82.5 �/82.5Concentrate (mg/L) 0.34 0.29 0.28 0.19 0.47
Cu Permeate (mg/L) 0.02 B/0.01 B/0.01 B/0.01 B/0.01 B/0.01Retention (%) �/50.0 �/50.0 �/50.0 �/50.0 �/50.0Concentrate (mg/L) 0.32 0.36 0.40 0.36 0.69
P Permeate (mg/L) B/0.01 B/0.01 B/0.01 0.04 B/0.01 B/0.01Li Concentrate (mg/L) B/0.01 0.03 0.03 0.03 0.03 0.04Al Concentrate (mg/L) B/0.01 0.47 0.33 0.35 0.34 0.39Co Concentrate (mg/L) 0.01 0.02 0.02 0.03 0.02 0.03Ni Concentrate (mg/L) B/0.01 0.08 0.08 0.09 0.09 0.11Cr Concentrate (mg/L) B/0.01 B/0.01 B/0.01 B/0.01 0.01 0.02
K. H€ayrynen et al. / Desalination 240 (2009) 280�289 287

ammonium and nitrate in permeate was notsubstantial, even higher VRFs could have beengained without a substantial deterioration of thepermeate quality.
The increase in VRF affected only slightlythe retention of most elements (Table 5). Onlyboron passed the membrane considerably betterin the concentration stage as compared with themembrane selection stage. The results show thatonly copper and aluminium were enriched to theconcentrate. However, the Al and Cu concentra-tions are far below reported values for a 50%inhibition of nitrification by cadmium, copper,and zinc, i.e. 15, 30, and 10mg/L [17]. There-fore, heavy metals in the formed concentrateshould not hinder the actions of the bacteria inthe bioreactor.
Membrane fouling percentages varied from0.4 to 4.2%, depending on the membrane’s placein the package. The membrane in which thepermeate flux was highest had fouled the most,and the membranes that had the lowest permeateflux rates had fouled the least. Notwithstanding,due to low fouling percentages, fouling is ofminor significance.
Finally, it was observed that the salinities ofthe concentrates were from 2.7 to 4.0 g/L. Ingeneral, nitrifying bacteria have shown to toler-ate the NaCl concentrate of 17.5�23.4 g/L [18]and denitrification bacteria the NaCl concentrateof 28�30 g/L [19]. Consequently, the formedconcentrate was concluded to be suitable forbiological treatment.
4. Conclusions
Membrane technology was tested for theconcentration of nitrogenous compounds inmine water prior to treatment in a bioreactor.Four RO and one NF membranes were tested.All the tested RO membranes removed ammo-nium and nitrate adequately from the tested minewater. Of the RO membranes, Espa2, TFC ULP,
and RO1 had the best performance. Espa2 gavea retention of >97.4% for NO3�N and >94.3%for NH4�N, TFC ULP >97.7% for NO3�N and>91.5% for NH4�N, and RO1 >96.0% forNO3�N and >91.6% for NH4�N. The NFmembrane had a poor retention to ammonium,nitrate, and chloride; therefore, it is not applicableas a pretreatment process prior to a nitrification�denitrification process in a bioreactor.
In the concentration stage, the TFC ULPmembrane was used. Retention of 82.2% forammonium and 89.9% for nitrate were achieved,which are very satisfying. Heavy metals, exceptfor aluminium and copper, did not enrich intoconcentrate, thus minimizing the risk of metaltoxicity to microorganisms in bioreactors. There-fore, it can be concluded that RO is suitable forthe concentration of mine water by VRFs higherthan 20, without a considerable deterioration ofthe permeate quality.
Acknowledgements
This study was part of the KAIRA-projectfunded by the European Regional DevelopmentFund, the Finnish Funding Agency for Technol-ogy and Innovation TEKES and industrialpartners.
Nomenclature
Cc concentration in residual concentrate(feed) (mg/L)
Cf concentration in feed at thebeginning (mg/L)
Cpa concentration in accumulatedpermeate (mg/L)
PWPa pure water permeability afterfiltration (L/m2 h bar)
PWPb pure water permeability beforefiltration (L/m2 h bar)
R retention of electric conductivityVRF volumetric reduction factor
288 K. H€ayrynen et al. / Desalination 240 (2009) 280�289

References
[1] J. Langwaldt, K. Mattila and G. Zaitsev, Materia,63 (2006) 47�49.
[2] H. Forsberg, H. Åkerlund, Kv€ave ochspr€ang€amnesrester i LKAB:s malm-gråbergs-ochproductfl€oden, Diploma work, Luleå University ofTechnology, 1999.
[3] S.E. Jørgensen, B. Halling-Sørensen, in: B. Halling-Sørensen, S.E. Jørgensen (Eds.), The Removal ofNitrogen Compounds from Wastewater, ElsevierSciencePublishersB.V.,Amsterdam,1993, pp. 3�40.
[4] G.F. Revey, Mining Engin., 48 (1996) 61�65.[5] F.T. Awadalla and A. Kumar, Sep. Sci. Technol.,
29 (1994) 1231�1249.[6] S. Lee and R.M. Lueptow, Environ. Sci. Technol.,
35 (2001) 3008�3018.[7] K. Mattila, G. Zaitsev, J. Langwaldt, Biological
removal of nutrients from mine waters, Final reportof the KAIRA project, Finnish Forest ResearchInstitute, Rovaniemi, B/http://www.metla.fi/hanke/7207/kaira-loppuraportti.pdf�/, 2007.
[8] B. Given, S. Meyer, in: Proc. 22nd Annual BritishColumbia Mine Reclamation Symposium, Pentic-ton, British Columbia, 1998, pp. 157�171.
[9] B. Given, B. Dixon, G. Douglas, R. Mihoc,T. Mudder, Combined Aerobic and AnaerobicBiological Treatment of Tailings Solution at the
Nickel Plate Mine. The Cyanide Monograph,Mining Journal Books, London, 1998.
[10] J. Langwaldt, K. Mattila, T. Mett€anen, G. Zaitsev,in: Proc. European Symposium on EnvironmentalBiotechnology ISEB/ESEB/JSEB, Leipzig,Germany, July 9�13, 2006, p. 338.
[11] B. Halling-Sørensen, in: B. Halling-Sørensen, S.E.Jørgensen (Eds.), The Removal of NitrogenCompounds from Wastewater, Elsevier SciencePublishers B.V., Amsterdam, 1993, pp. 119�152.
[12] S. Shrimali and K.P. Singh, Environ. Pollution, 112(2001) 351�359.
[13] F.T. Awadalla, C. Striez and K. Lamb, Sep. Sci.and Technol., 29 (1994) 483�495.
[14] L. Chang, Environ. Progress, 15 (1996) 28�36.[15] M. Malaiyandi and S.V. Sastri, Sep. Sci. Technol.,
14 (1981) 371�376.[16] Permasep Technical data, Technical Bulletin 403,
Du Pont Permasep Permeators, 1972.[17] D.J.B. Dalzell, S. Alte, E. Aspichueta, A. de la
Sota, J. Etxebarria, M. Gutierrez, C.C. Hoffmann,D. Sales, U. Obst and N. Christofi, Chemosphere,47 (2002) 535�545.
[18] H.-P. Koops, B. B€ottcher, U.C. M€oller, A. Pommer-ening-R€oser and G. Stehr, J. General Microbial.,137 (1991) 1689�1699.
[19] M. Dupla, Y. Comeau, S. Parent, R. Villemur andM. Jolicoeur, Water Res., 40 (2006) 249�258.
K. H€ayrynen et al. / Desalination 240 (2009) 280�289 289
Copyright © 2022 FDOKUMEN