Concentration in the International Construction Market - HKU ...
29
1 Concentration in the International Construction Market Kunhui YE 1 , Weisheng LU 2 and Weiyan JIANG 1 Abstract With the involvement of an increasing number of contractors in the international construction market, venturing overseas has been fraught with fierce competition and considerable uncertainties. This underscores the importance of examining the extent to which the intensity of competition (IoC) for international construction business is moderate. Concentration is a conventional IoC measure. By synthesising four major concentration methods including concentration ratio, entropy, Gini coefficient and Herfindahl index, a new model for measuring moderate IoC is thus proposed. Using the 28 years ENR-based data of the top 225 international contractors (TIC 225) into the proposed model, the IoC for international construction business is found moderate, if the magnitude of the market shares occupied by the top four international contractors is 0.2735. The finding does revise a popular view that international construction competition has been intensifying only since 2002. It is implied that the proposed model favours a better understanding of competition characteristics in the international construction market and provides new insights into the theories about concentration. Keywords International construction market, Business concentration, Intensity of competition, Moderate competition 1 Faculty of Construction Management and Real Estate, Chongqing University, P.R. China 2 Department of Real Estate and Construction, The University of Hong Kong, Pokfulam, Hong Kong
-
Upload
khangminh22 -
Category
Documents
-
view
0 -
download
0
Transcript of Concentration in the International Construction Market - HKU ...

1
Concentration in the International Construction Market
Kunhui YE1, Weisheng LU2 and Weiyan JIANG1
Abstract
With the involvement of an increasing number of contractors in the international
construction market, venturing overseas has been fraught with fierce competition and
considerable uncertainties. This underscores the importance of examining the extent to
which the intensity of competition (IoC) for international construction business is
moderate. Concentration is a conventional IoC measure. By synthesising four major
concentration methods including concentration ratio, entropy, Gini coefficient and
Herfindahl index, a new model for measuring moderate IoC is thus proposed. Using the
28 years ENR-based data of the top 225 international contractors (TIC 225) into the
proposed model, the IoC for international construction business is found moderate, if the
magnitude of the market shares occupied by the top four international contractors is
0.2735. The finding does revise a popular view that international construction
competition has been intensifying only since 2002. It is implied that the proposed model
favours a better understanding of competition characteristics in the international
construction market and provides new insights into the theories about concentration.
Keywords
International construction market, Business concentration, Intensity of competition,
Moderate competition
1 Faculty of Construction Management and Real Estate, Chongqing University, P.R. China 2 Department of Real Estate and Construction, The University of Hong Kong, Pokfulam, Hong Kong

2
INTRODUCTION
The 21st century is characterised by advanced technology, fast transportation, convenient
communication, integrated market, and trade liberalisation. These new characteristics
have accelerated the internationalisation of construction businesses, and few contactors
find that they can be exempt from this trend (Raftery et al. 1998; Loosemore 1999;
Korkmaz and Messener 2007). On the one hand, many construction firms adopt
venturing overseas as a major strategy to ensure continued growth. They make due
response to business competition in cross-border markets. On the other hand, they have
to struggle against foreign rivals in their domestic markets. The construction business is
nowadays both a local and an international practice.
With the increasing internationalisation of construction market, there is a popular view
that the intensity of competition (IoC) has been ascending and the international market
has consequently much volatility. For instance, Ofori (2003) opined that involving
contractors from China, South America, South-East Asia and Africa, the international
market will be more competitive. Low et al. (2004) disclosed that as a result of intense
competition, the international involvement of top British contractors has declined from a
peak in 1996, whilst there has been an increasing presence of Chinese contractors in the
international arena. Although competition in construction market worldwide has been an
all-pervading phenomenon, it is considered that a moderate IoC deserves attention. This
is because little or no competition is not good to the effectiveness and efficiency of the
deployment of construction resources, whilst over competition can result in serious
market failure (Ball et al. 2000; Akintoye and Skitmore 1991).
The IoC has been measured in a number of ways typically including concentration,

3
market mobility and market instability (Bajo and Salas 2002; Barla 1999). Among the
existing approaches, concentration is a conventional instrument that measures
competition intensity by quantifying the extent to which market shares are distributed
among incumbent (Egghe 2005; Bajo and Salas 2002). The rationale behind the
concentration-based measurement is that a high degree of concentration in an industry
conveys an image of weak competition, whilst those industries wherein numerous
businesses have parallel market shares are deemed as highly competitive (Boone 2001).
Concentration is thus an indirect measure of competition intensity.
Employing concentration approaches to measure competition intensity is prevalent in the
area of construction management and economics. Chiang et al. (2001) found that
construction business in the building sector was less concentrated than that in the civil
engineering sector in Hong Kong. McCloughan (2004) illustrated little concentration
phenomenon in the British construction market. There are still other related studies
addressing parallel findings that construction firms appear to have equivalent market
powers, construction business is unconcentrated, and construction market is of fierce
competition (Langford and Male 2001; Wang 2004). Notwithstanding considerable
research devoted to the subject of competition intensity, few efforts have been put in
researching moderate IoC in the international construction market. As assumed earlier,
little competition or over competition can both bring about market failure, while a
moderate IoC is good for the long-run development of the international construction
market.
The purpose of this study is therefore to examine what moderate IoC is in the
international construction market from the perspective of market concentration. The
study offers new insights into international construction competition. Through such an

4
examination, it is possible for international contractors to gauge competition pressure,
and thus appropriate competitive strategies can be devised to address this competition.
The paper decomposes into four parts. First, previous theories about market
concentration are reviewed critically. In the following “methods” section, a new
concentration approach is proposed based on the critical review. Data collection methods
are introduced. Then it moves on to the data analyses and discussions of IoC in the
international construction arena. Lastly, conclusions are drawn.
MEASURES OF CONCENTRATION
Theories on concentration
Concentration theories are an important part of the structure-conduct-performance
paradigm in the discipline of industrial economics (Bird 1999; McCloughan 2004). The
concern about concentration can be traced back as early as to the development of the
theories of imperfect and monopolistic competition in the 1930s (Utton 1970). Since that,
substantial research has been conducted to investigate the application of concentration
theories in different industrial sectors.
Research has pinpointed the impact of concentration on various aspects of the structure-
conduct-performance paradigm, e.g. industrial profitability (Bonardi 2001), advertising
(Shepherd and Shepherd 2004), innovation (Shrieves 1978; Boone 2001), pricing
(Bonanno and Haworth 1998), differentiation (Shepherd and Shepherd 2004),
specialisation (George 1972), diversification (Carlton and Perloff 2005), market entry
barriers (Lipczynski and Wilson 2001), industrial wage (Haworth and Reuther 1978), and
competition policies (Wang 2004). The measurement of concentration supports
governmental decision-making on deterring any collusive or anticompetitive behaviours

5
(Bird 1999).
On the other hand, concentration is determined by multiple factors including business
diversity (Miller 1969), market entry barriers (Wenders 1971), market growth (Shepherd
1964) and market size (Neumann et al. 2001). It seems that the term concentration has
become multidimensional, referred to the concentration of economic power, market
power, oligopoly power, competition intensity and market efficiency. The
multidimensional nature complicates the measurement of concentration.
Concentration measures
There are four dominant approaches to measuring concentration, namely, concentration
ratio (CRn), Herfindahl Index (HIn), entropy (EN), and Gini coefficient (GINI). More
introduction about these four concentration measures is summarised in Table 1. It can be
seen from the column “model” of Table 1 that the calculation of the four concentration
indexes is mainly based on firm i's market share (Si) and firm number (n).
<<Insert Table 1 here>>
Concentration ratio (CRn) can be calculated as the percentage of the outputs occupied by
the n largest firms in relation to a given market. The extremes of CRn values are zero and
one, representing perfect competition and little competition (monopoly) respectively. For
example, van Kranenburg (2002) employed the measure CR4 to address the status of
market competition, and suggested that the industry is highly competitive if CR4 is close
to 0. On the contrary, it means that the market is close to a monopoly when CR4 is near to
1. It is one of the most commonly used concentration measures because of the relatively
6
easier collection of data in terms of the largest n (normally 4 or 8) companies and their
market shares.
Although CRn has many applications, criticism on CRn is largely focused on its two
major inadequacies. First, the measure only accounts for the market powers owned by a
few largest firms without account of the other firms in the market. Second, the equal-
weight setting in the CRn construct oversimplifies the substantial difference in market
powers of the investigated n largest firms. As an alternative, Herfindahl index (HI)
envisages the presence of all firms by weighting each according to their relative market
shares. As can be seen from Table 1, HI ranges from zero (perfect competition) to one
(little competition). An increase in HI value equals a decrease in competition intensity.
Entropy (EN) measures the uncertainty/probability of a random variable in information
theory (Yu 2000). The process of business competition is so interactive, complex and
dynamic that not all competitors can always outperform their counterparts (Bengtsson
1998). Therefore, concentration of market shares as a consequence of business
competition appears to be an accident. Many researchers have thus used EN to reflect the
process of business rivalry, the distribution of marker powers among incumbent and the
corresponding status of market competition (Horowitz and Horowitz 1968). The higher
the IoC level, the lower the probability that firms can outdo their competitors. Entropy
and industrial concentration are inversely related.
Gini coefficient (GINI) is directly linked to the well-known Lorenz curve that is defined
as a ratio with values varying between zero and one in describing the extent to which the
distribution of income, wealth and business. GINI can be derived by quantifying the
deviation of the distribution of market shares held by all firms from a current status to the

7
equal situation where each firm has identical market share (Egghe 2005; Baldwin and
Gorecki 1994). As a general rule, the decrease in GINI indicates the approach of the
market to the equal situation and a higher intensity of competition, whilst a larger
coefficient mirrors a more unequal distribution and a lower IoC accordingly.
The merits and demerits of concentration measures have long been debated in previous
studies. For instance, Davies (1979) developed an Iso-concentration approach to unveil
the close similarities between the above four measures. Kwoka (1981) illustrated that the
choice of concentration measures does matter to a large extent. Bailey and Boyle (1971)
claimed that few concentration indexes are superior to others, while Hall and Tideman
(1967) asserted that the measure HI is more effective. The debate on concentration
measures has not pinpointed a good way for understanding moderate IoC, but it does
suggest using an individual measure for the investigation of market concentration may
not be robust. There is a need for a new model with greater robustness to measure market
concentration and in turn to inform moderate IoC.
RESEARCH METHODS
Proposing a new model for measuring moderate IoC
The inadequacy of single measure (e.g. CRn, HIn, EN, and GINI) for the investigation of
market concentration necessitates the exploration of an improved concentration measure,
which ideally could eliminate the demerits of previous studies while keep their merits.
Moreover, the new model should inform moderate IoC in the international construction
market as concerned in this study. According to the definitions shown in Table 1, the
decrease in EN value suggests that the incumbent are able to win business competition
with higher probabilities, thus the market is more attractive to potential competitors.
8
Meanwhile, the decrease in EN value presents an increase in the dominance of a few
largest firms as well as the level of market inequality that can be measured by GINI. This
further enables greater market entry barriers posed by the largest firms to impede the
entrance of potential competitors. Researchers have pointed out that the occurrence of
greater entry barriers can force the market away from its contestable status (Bain 1956;
Bengtsson 1998). Therefore, the lower the market entry barriers are, the better the market
is, and thus the lower the GINI should be. This interactive process signals the potential
intersection of EN and GINI where the desirable IoC (or concentration status) can be
recorded as shown in Figure 1.
<<Insert Figure 1 here>>
As discussed above, the measure HI is better than CRn in reflecting competition intensity,
but the difficulty of collecting data for HI undermines the applicability to construction
market. While on the other hand CRn is an acceptable measure for concentration and it is
an easy-to-calculate indicator of concentration with statistics usually available in many
governmental periodical compilations. It is therefore the intent of this research to use
CRn to construct EN, GINI, and HI. This is possible because the above discussion on the
four concentration measures favours the recognition of conceptual relationships between
EN, HI, GINI and CRn as shown in Table 2. In order for them to join in the calculation,
different concentration measures with different ranges need to be normalized. Formula (1)
to (3) serve this purpose. GINI index needs no normalisation as its range is (0, 1) already.
Normalised Herfindahl index (HI):
NHI = (HI – 1/n) / (1 – 1 / n) = (HI – 1/225) / (1-1/225) (1)
9
Normalised concentration ratio (CR4):
NCR4 = (CR4 – 4/n) / (1 - 4 / n) = (CR4 – 4/225) / (1-4/225) (2)
Normalised entropy index (EN):
NEN = (EN – 0) / log n = EN / log 225 (3)
<<Insert Table 2 here>>
Therefore, a function is proposed as shown in Formula (4), although at this stage, specific
relationships between the four concentration measures are still awaiting further
exploration:
NHI = f (NCRn) indicates the moderate IoC of a market
where NCRn is subject to functions
GINI = f (NCRn); (4)
NEN = f (NCRn); and
GINI = NEN
Data collection for investigating moderate IoC in the international construction
market
International construction is usually referred to the construction works undertaken by
companies outside their home countries. Many international construction companies have
a diversity of businesses in terms of architecture, engineering, and construction. They are
also able to simultaneously compete for project contracts in various countries. It is quite

10
difficult, if not completely impossible, to collect data per business competition and to
identify those contractors who have international businesses. Hence, data on construction
activities are usually poor and erratic whatever domestic or international (Ruddock 2002).
Alternatively, the statistical data of the top 225 international contractors (TIC 225)
complied by Engineering News-Record (ENR) were collected for this study owing to
four major considerations. Firstly, contractors other than the TIC 225 have negligible
market powers as their market shares are relatively very small. The TIC 225 are
representative of the majority of overseas works undertaken by international contractors.
Secondly, much of the strongest direct competition encountered by a large firm is apt to
originate from competitors who are or to be in similar firm sizes (Kaplan 1980).
Accordingly, competition for international construction occurs mostly among the TIC
225 themselves. Thirdly, despite some limitations in terms of country coverage, the TIC-
225 data have been demonstrated useful for examining the subject of international
construction (Low et al. 2004; Ofori 2003). In addition, the enduring effort from ENR to
publish statistical data of the TIC 225 provides a consistent series of longitude data for
the present research which aims to identify the moderate IoC in the international
construction market.
Each year, ENR deploys an individual issue to report the presence of TIC 225 in the
international construction market. Using the year 2007 as an example, a typical structure
of the data as reported includes ranks of the present year and past year, international
revenue, total revenue and new contracts of each firm. The report also analyses market
by sub-sector (e.g. buildings, waster supply project, etc.) of individual firms. The
international revenue (IR) is of concern in this research. The authors tabulated the IR of
the TIC 225 into the Statistics Package for Social Science (SPSS). The data in the past 28

11
years from 1981 to 2008 were collected and fed into SPSS. It is mainly from the
University library but Issues in years from 1981 to 1989 were collected with the kind
help from colleagues in Singapore and Taiwan. From year 2001 onwards, electronic
versions are available, which greatly facilitated the data collection.
DATA ANALYSIS
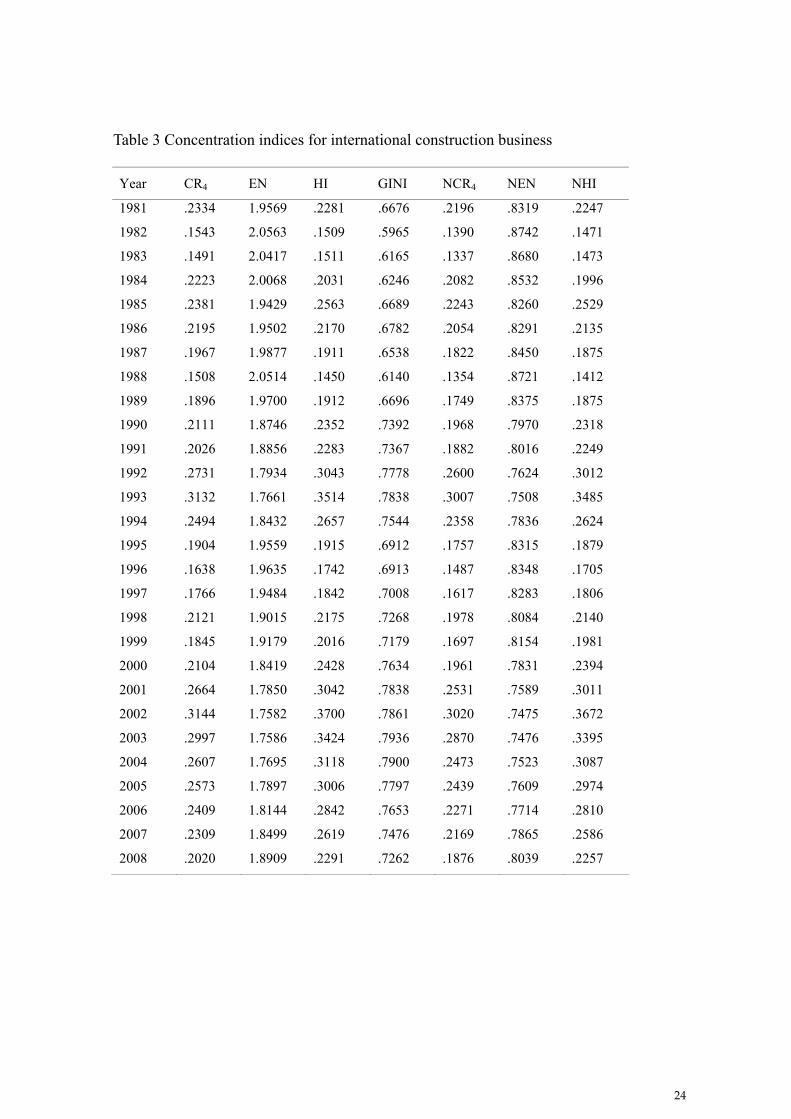
Annual IRs of the TIC 225 spanning from 1981 to 2008 are transferred into relative
market shares to derive the indices of CR4, EN, HI, and GINI. The derived indices are
then normalised by using Formula 1 to 3 as shown above. Results of the calculation are
presented in Table 3.
<<Insert Table 3 here>>
The curve regression embedded in SPSS is applied to determine the most suitable
functions NHI = f (NCR4), GINI = f (NCR4), and NEN = f (NCR4) as pursued in Formula
4. The functional relationships between the four concentration measures are shown in
Figure 2. The resultant model parameters are described separately in Table 4.
<<Insert Figure 2 here>>
<<Insert Table 4 here>>

12
Using the parameters in Table 4 and Formula 2 functions NHI, GINI and NEN can be
rewritten as follows and described graphically in Figure 3. It can be seen that NEN and
GINI intersect at a point where NCR4 is 0.2603. According to the description as shown in
Figure 1, this is the point indicating the moderate IoC in the international construction
market. As shown in Figure 3, at this point where NCR4 is 0.2603, a moderate IoC
expressed in NHI is 0.3052.
004.0/41
/4030.1
/41
/4607.0 4
2
4
n
nCR
n
nCRNHI (5)
nCR
nGINI
/4
/41040.0921.0
4
(6)
189.0
4
/41
/4595.0
n
nCRNEN (7)
<<Insert Figure 3 here>>
Considerable researchers have pointed out the weakness of concentration measures
especially in terms of data availability (McCloughan 2004; Adelman 1951; Parker 1991).
Many concentration ratios are not made available in official publications, which typically
include information on the size distribution of firms, as it is not permitted to disclose
commercial data for individual firms (McCloughan and Abounoori 2003). Thus,
researchers commonly opt for the most readily available measure, CR4 (Wang 2004;
Boyes and Smyth 1979). Compared with the equations shown in Table 1, equations 5-7
are more applicable as they are built on CR4 rather than commercial data for all
individual firms. Furthermore, using these equations, it is expected to be able to detect
the level of moderate concentration if only GINI equals to NEN.

13
FINDINGS AND DISCUSSION
Understanding international construction market by using the Moderate IoC Model
Based on the above analysis, it can be seen that the new model can inform a moderate
intensity of competition (IoC) in a given market. By synthesising existing concentration
measures, the Moderate IoC Model suggests that the intersection between GINI and EN
indicates that the competition within a market is moderate; the market is contestable from
the perspectives of market entry barriers and winning business competition. The
Moderate IoC Model also avoids the demerits of existing concentration measures. CRn is
a rough measure of market concentration but calculating CRn is relatively easier in terms
of data availability. HI is a better measure than HI in reflecting competition intensity, but
the difficulty of collecting data for HI undermines its wider applicability. The
shortcomings are overcome in this research by using CRn to construct EN, GINI and HI.
By applying 28 years’ data from ENR to the Moderate IoC Model, it is found that the
intensity of competition in the international construction market is moderate when
normalised CR4 (NCR4) is 0.2603 and the indices of NHI, GINI, and NEN are 0.3052,
0.7673, and 0.7673 respectively. By applying the normalised indices into Formula (1) to
(3), the values of CR4, HI, and EN are derived, namely, 0.2735, 0.3083, and 1.8049
respectively. In other words, the IoC in the international market construction market is
moderate when CR4 is 0.2735 and HI is 0.3083. This gives a reference point against
which the IoC level in the international construction market can be compared. The closer
the NHI value to the point (where HI is 0.3083) indicated by the intersection of NEN and
GINI, the more appropriate the concentration status as well as the IoC level.

14
IoC as expressed in NHI over the study period 1981 to 2008 is calculated and shown in
Figure 4. It can be seen that the international construction competition was relatively
moderate in three years, namely 1992, 2001 and 2004. A significant variation in IoC over
the study period 1981 to 2008 is also noted; the competition intensity in the international
construction market during the period has exhibited a wavy trend. This does revise a
view presented earlier in this paper that the competition for international construction
business has been intensifying only since 2002. Actually, from 2002 to 2008, sometimes
the IoC is close to the moderate level, while others it is deviate from the level.
<<Insert Figure 4 here>>
Comparing the Moderate IoC Model with previous concentration studies
To some extent, the research findings contradict previous concentration studies
conducted in contexts (e.g. domestic economy) other than the international construction
market. Baldwin and Gorecki (1994) claimed that an industry with CR4 above 75% is
more conducive to have a “competition problem” that undermines the role of market in
resource allocation. As such, it appears that the international construction market has
been good since 1981, for all the CR4 values (Table 3) are fairly lower than this alert
level. However, according to Oster (1999), competition statuses can be classified into
four groups in accordance with CR4 values, namely, highly concentrated oligopoly (1.00-
0.75), moderately concentrated oligopoly (0.50-0.749), oligopoly (0.25-0.499), and
atomism (0.00-0.249). The competition for international construction in the past twenty-
eight years satisfies Oster’s definition of atomism, thus, the market has been over-
competitive for long time.

15
Herfindahl index (HI) can be used to gauge potential adverse competitive effects
imposed by a merger and market efficiency. For instance, in the United States, a post-
merger HI below 0.1000 in a market is deemed as unconcentrated and above 0.1800 is
regarded to be highly concentrated (DJFTC 1997). The larger the extent to which HI
exceeds 0.1800, the less the competition will be in the market. Therefore, it is widely
accepted that those industries with HI values over 0.1800 are of insufficient competition
(Oster 1999). However, this is not the case in the context of international construction; as
suggested by the Moderate IoC model, a moderate IoC is recorded when HI is 0.3083,
other than 0.1800.
The IoC in the international construction market can also be interpreted in GINI level. As
suggested previously, an IoC is moderate when GINI is 0.7673. The closer the Gini
coefficient (GINI) to 1, the less equal the distribution of firm sizes in a market, and the
lower the IoC. According to this GINI rule, the moderate concentration in the
international construction market should refer to a relatively unequal distribution of firm
sizes, thus the competition therein is not fierce. In addition, as presented above,
concentration decreases as entropy (EN) values increase. The moderate concentration of
the international construction market has an entropy value of 1.8049, 76.73 percent
relative to the maximum entropy (log 225). This EN level signifies a relatively low level
of concentration and high level of intensity of competition.
To summarise, by comparing the Moderate IoC Model with previous concentration
studies, it is apparent that the study of concentration in the international construction
market necessitates a particular examination. Research findings developed in other
sectors or in the area of domestic economy cannot be applied to this particular market.

16
This in turn verifies the inefficiency of the existing concentration measures in
investigating IoC in the international construction context.
Using the Moderate IoC Model
It has been found in this study that the Moderate IoC Model is applicable to indicate a
moderate concentration (or IoC) in the international construction market. By mapping the
evidence against the derived moderate concentration, it will be possible to provide
contractors with advice on how they could have a better understanding of concentration
situations in the international construction market. For example, it might not be good for
contractors to perform international construction businesses when NHI index has been
away from the moderate level, which implies that the competition in the market is too
fierce.
Although the Moderate IoC Model is able to indicate a moderate concentration for
international contractors, there is limited an individual company can do to change the
competition. This is particularly true in the international construction market which is
actually formulated by many individual regional parts, for example, U.S. market,
Western European market, the Middle East market. Except for the market force, there is
no organisation to regulate and develop a moderately concentrated international
construction market. This is contrasting with the situation in some domestic economies
(e.g. China) where governmental departments tend to maintain a moderate IoC by
introducing some measures such as qualification system, increasing/decreasing
government spending, etc.
CONCLUSIONS

17
A moderate concentration of market shares contributes to the efficiency of market
resources allocation. By synthesising four major concentration methods, namely,
concentration ratio (CRn), Herfindahl index (HI), entropy, and Gini coefficient, a
Moderate IoC Model is developed in this study for identifying moderate concentration in
the international construction market. The model is superior to the existing concentration
measures in several aspects. The model balances the merits and demerits of the existing
concentration measures, elaborates a way for approaching moderate concentration, and is
easily computable by using the market shares of the top four construction contractors.
By applying 28 years’ data from ENR to the Moderate IoC Model, it is found that the
IoC in the international construction market is moderate when CR4 is 0.2735 and HI is
0.3083 respectively. This gives a reference point against which the IoC level can be
compared. The closer the HI value to the point where HI is 0.3083, the more appropriate
the concentration status as well as the IoC level. Based on this, the international
construction competition was found to be relatively moderate in 1992, 2001 and 2004.
The competition intensity in the international construction market during the period has
exhibited a wavy trend. This revises a popular view that the international construction
competition has been increasingly intensifying only since 2002.
By comparing the Moderate IoC Model with previous concentration studies, it is found
that the study of concentration in the international construction market necessitates a new
examination with new approaches. Research findings developed in other sectors cannot
be applied to this particular market. The Moderate IoC Model complements the existing
concentration measures in investigating IoC in the international construction context. The
identified moderate IoC can be a valuable reference for practitioners to understand
characteristics of the international construction market; it is implied that it is good for

18
contractors to compete for international construction business when the market is
approaching its moderate status.
It is claimed that the HI 0.3083 can be a cut-off concentration level for the international
construction market. A concentration status can be acceptable, referred to the buffer zone
of concentration, even though it does not reach the ideal concentration situation.
Although this study does not exactly provide the buffer zone of concentration, the HI
0.3083 is constructive and informative, as it lays a theoretical foundation for the future
studies.
REFERENCES
Adelman, M.A. (1951). "The Measurement of Industrial Concentration." Review of
Economics and Statistics 33(4): 269-296.
Akintoye, A. and M. Skitmore (1991). "Profitability of UK Construction Contractors."
Construction Management and Economics 9(4): 311-325.
Bailey, D. and S.E. Boyle (1971). "The Optimal Measure of Concentration." Journal of
the American Statistical Association 66(336): 702-706.
Bain, J.S. (1956). Barriers to New Competition, Their Character and Consequences in
Manufacturing Industries. Cambridge, Harvard University Press.
Bajo, O. and R. Salas (2002). "Inequality Foundations of Concentration Measures: An
Application to the Hannah-Kay Indices." Spanish Economic Review 4(4): 311-
316.
Baldwin, R.J. and P.K. Gorecki (1994). "Concentration and Mobility Statistics in
Canada's Manufacturing Sector." Journal of Industrial Economics 42(1): 93-103.

19
Ball, M., M. Farshchi and M. Grilli (2000). "Competition and the Persistence of Profits in
the UK Construction Industry." Construction Management and Economics 18(7):
733-745.
Barla, P. (1999). "Market Share Instability in the US Airline Industry." Journal of
Applied Business Research 15(4): 67-79.
Bengtsson, M. (1998). Climates of Competition, Harwood Academic Publishers.
Bird, K. (1999). "Concentration in Indonesian Manufacturing, 1975-93." Bulletin of
Indonesian Economic Studies 35(1): 43-73.
Bonanno, G. and B. Haworth (1998). "Intensity of Competition and the Choice between
Product and Process Innovation." International Journal of Industrial
Organization 16(4): 495-510.
Bonardi, L. (2001). Analysis of the Relationship between Advertising, Concentration and
Profitability in the U.S. Manufacturing Industry. New York, Fordham University.
Boone, J. (2001). "Intensity of Competition and the Incentive to Innovate." International
Journal of Industrial Organization 19(5): 705-726.
Boyes, J.W. and J.D. Smyth (1979). "The Optimal Concentration Measure: Theory and
Evidence for Canadian Manufacturing Industries." Applied Economics 11(3):
289-302.
Carlton, D.W. and J.M. Perloff (2005). Modern Industrial Organisation. New York,
Pearson Addison Wesley.
Chiang, Y.H., B.S. Tang and W.Y. Leung (2001). "Market Structure of the Construction
Industry in Hong Kong." Construction Management and Economics 19(7): 675-
687.
Davies, S.W. (1979). "Choosing between Concentration Indices: The Iso-concentration
Curve." Economica 46(181): 67-75.

20
DJFTC (1997). Horizontal Merger Guidelines, U.S. Department of Justice and the
Federal Trade Commission.
Egghe, L. (2005). "Zipfian and Lotkaian Continuous Concentration Theory." Journal of
the American Society for Information Science & Technology 56(9): 9325-9345.
George, K.D. (1972). "Concentration and Specialization in Industry." Journal of
Industrial Economics 20(2): 107-123.
Ghosh, A. (1975). "Concentration and Growth of Indian Industries, 1948- 68." Journal of
Industrial Economics 23(3): 203-222.
Guth, L.A. (1971). "Advertising and Market Structure Revisited." Journal of Industrial
Economics 19(2): 179-198.
Hall, M. and N. Tideman (1967). "Measures of Concentration." Journal of American
Statistical Association 62(317): 162-168.
Haworth, T.C. and J.C. Reuther (1978). "Industrial Concentration and Interindustry
Wage Determination." Review of Economics and Statistics 60(1): 85-95.
Horowitz, A. and I. Horowitz (1968). "Entropy, Markov Process and Competition in the
Brewing Industry." Journal of Industrial Economics 16(3): 196-211.
Kaplan, A.D.H. (1980). Big Enterprise in a Competitive System, Greenwood Press.
Korkmaz, S. and J.I. Messener (2007). "Competitive Positioning and Continuity of
Construction Firms in International Markets." Journal of Management in
Engineering 24(4): 207-216.
Kwoka, J.E. (1981). "Does the Choice of Concentration Measure Really Matter." Journal
of Industrial Economics 29(4): 445-453.
Langford, D. and S. Male (2001). Strategic Management in Construction. Blackwell
Science Ltd, Berlin, Germany.
Lipczynski, J. and J. Wilson (2001). Industrial Organisation: An Analysis of Competitive
Markets. Harlow, England, Pearson Education Limited.

21
Loosemore, M. (1999). "International Construction Management Research: Cultural
Sensitivity in Methodological Design." Construction Management and
Economics 17(5): 553-561.
Low, S.P., H. Jiang and C.H.Y. Leong (2004). "A Comparative Study of Top British and
Chinese International Contractors in the Global Market." Construction
Management and Economics 22(7): 717-731.
McCloughan, P. (2004). "Construction Sector Concentration: Evidence from Britain."
Construction Management and Economics 22(9): 979-999.
McCloughan, P. and E. Abounoori (2003). "How to Estimate Market Concentration
Given Grouped Data." Applied Economics 35(8): 973-983.
Miller, R.A. (1969). "Market Structure and Industrial Performance: Relation of Profit
Rates to Concentration, Advertising Intensity, and Diversity." Journal of
Industrial Economics 17(2): 104-118.
Neumann, M., J. Weigand, A. Gross and M.T. Munter (2001). "Market Size, Fixed Costs
and Horizontal Concentration." International Journal of Industrial Organisation
19(5): 823-840.
Ofori, G. (2003). "Frameworks for Analysing International Construction." Construction
Management and Economics 21(4): 379-391.
Oster, S.M. (1999). Modern Competitive Analysis. New York, Oxford University Press.
Parker, S.C. (1991). "Significantly Concentrated Markets Theory and Evidence for the
U.K." International Journal of Industrial Organization 9(4): 585-590.
Raftery, J., B. Pasadilla, Y.H. Chiang, E.C.M. Hui and B.S. Tang (1998). "Globalization
and Construction Industry Development: Implications of Recent Developments in
the Construction Sectors in Asia." Construction Management and Economics
16(6): 729-737.
22
Ruddock, L. (2002). "Measuring the Global Construction Industry: Improving the
Quality of Data." Construction Management and Economics 20(7): 553-556.
Sawyer, C.M. (1985). The Economics of Industries and Firms. London, Croom Helm.
Shepherd, W.G. (1964). "Trends of Concentration in American Manufacturing
Industries." Review of Economics and Statistics 46(2): 200-212.
Shepherd, W.G. and J.M. Shepherd (2004). The Economics of Industrial Organisation.
Long Grove, Illinois, Waveland Press Inc.
Shrieves, R.E. (1978). "Market Structure and Innovation: A New Perspective." Journal
of Industrial Economics 26(4): 329-347.
Utton, M.A. (1970). Industrial Concentration. Harmondsworth, Middlesex, England,
Penguin Books Ltd.
van Kranenburg, H. (2002). "Mobility and Market Structure in the Dutch Daily
Newspaper Market Segments." Journal of Media Economics 15(2): 107-123.
Wang, D. (2004). The Chinese Construction Industry from the Perspective of Industrial
Organization, North-western University.
Wenders, J.T. (1971). "Excess Capacity as a Barrier to Entry." Journal of Industrial
Economics 20(1): 14-19.
White, K.R. (1976). "On the Choice of a Concentration Measure." American Business
Law Journal 14(2): 235-241.
Yu, F.T.S. (2000). Entropy and Information Optics, CRC Press.

23
Table 1 Models of concentration measures
Method Description Model Range(a) Reference
CRn Aggregating the market
shares of the n largest firms,
where n is usually 4
n
iin SCR
1
(4/n, 1)(b) (Baldwin and Gorecki
1994; Wang 2004)
HI Accumulating the market
shares of all the firms by
weighting the corresponding
market sales
n
iiSHI
1
2
(1/n, 1)(b) (Davies 1979; Ghosh
1975)
EN Measuring the degree of
disorder, uncertainty, or
randomness to reflect
competition intensity
)/1log(1
i
n
ii SSEN
(0, logn) (Sawyer 1985; Davies
1979)
GINI Measuring the extent to
which businesses in a market
are unequal in firm size
distribution
)()1(
2
1
11
n
i ii SNnnn
nGC
(0, 1) (Ghosh 1975; Guth
1971; White 1976)
Note: Si, firm i's market share; n, firm number; Ni, the rank of firm i; μ, mean market share of all firms. (a) When n is very large, the ranges of both CRn and HI will be (0, 1).
Table 2 Interrelationships between the four concentration measures
Competition Intensity
CRn
Direction
HIn ↑ ↓ ↑
GINI ↑ ↓ ↑
EN ↑ ↑ ↓
24
Table 3 Concentration indices for international construction business
Year CR4 EN HI GINI NCR4 NEN NHI
1981 .2334 1.9569 .2281 .6676 .2196 .8319 .2247
1982 .1543 2.0563 .1509 .5965 .1390 .8742 .1471
1983 .1491 2.0417 .1511 .6165 .1337 .8680 .1473
1984 .2223 2.0068 .2031 .6246 .2082 .8532 .1996
1985 .2381 1.9429 .2563 .6689 .2243 .8260 .2529
1986 .2195 1.9502 .2170 .6782 .2054 .8291 .2135
1987 .1967 1.9877 .1911 .6538 .1822 .8450 .1875
1988 .1508 2.0514 .1450 .6140 .1354 .8721 .1412
1989 .1896 1.9700 .1912 .6696 .1749 .8375 .1875
1990 .2111 1.8746 .2352 .7392 .1968 .7970 .2318
1991 .2026 1.8856 .2283 .7367 .1882 .8016 .2249
1992 .2731 1.7934 .3043 .7778 .2600 .7624 .3012
1993 .3132 1.7661 .3514 .7838 .3007 .7508 .3485
1994 .2494 1.8432 .2657 .7544 .2358 .7836 .2624
1995 .1904 1.9559 .1915 .6912 .1757 .8315 .1879
1996 .1638 1.9635 .1742 .6913 .1487 .8348 .1705
1997 .1766 1.9484 .1842 .7008 .1617 .8283 .1806
1998 .2121 1.9015 .2175 .7268 .1978 .8084 .2140
1999 .1845 1.9179 .2016 .7179 .1697 .8154 .1981
2000 .2104 1.8419 .2428 .7634 .1961 .7831 .2394
2001 .2664 1.7850 .3042 .7838 .2531 .7589 .3011
2002 .3144 1.7582 .3700 .7861 .3020 .7475 .3672
2003 .2997 1.7586 .3424 .7936 .2870 .7476 .3395
2004 .2607 1.7695 .3118 .7900 .2473 .7523 .3087
2005 .2573 1.7897 .3006 .7797 .2439 .7609 .2974
2006 .2409 1.8144 .2842 .7653 .2271 .7714 .2810
2007 .2309 1.8499 .2619 .7476 .2169 .7865 .2586
2008 .2020 1.8909 .2291 .7262 .1876 .8039 .2257

25
Table 4 Model summary and parameter estimates
Model Summary Parameter Estimates
Expression
R Square
Std. Errors of
the Estimate F df1 Df2 Sig. Const. b1 b2
NHI = f (NCR4) Quadratic .948 0.015 227.059 2 25 .000 -.004 1.030 .607
GINI = f (NCR4) Inverse .616 0.038 41.795 1 26 .000 .921 -.040
NEN = f (NCR4) Power .759 0.021 81.970 1 26 .000 .595 -.189
The independent variable is NCR4.

26
Model
IoC
low highEN
low
high
Indications
GINI/EN
low
high
low high
IoC The intersection indicates the
market is contestable from the
perspectives of market entry
barriers and winning business
competition
An increase in GINI level
suggests the dominance of a few
largest firms in the market and
larger market entry barriers to
potential competitors.
IoC
low highGINI
low
high
An increase in EN level suggests
larger uncertainty of winning
business competition among the
incumbent.
EN
GINI
Figure 1 Moderate level of IoC

27
NCR40.30000.25000.20000.1500
0.8750
0.8500
0.8250
0.8000
0.7750
0.7500
NEN
LogisticExponentialGrowthSPowerCompoundCubicQuadraticInverseLogarithmicLinearObserved
NCR4
0.30000.25000.20000.1500
0.8000
0.7500
0.7000
0.6500
0.6000
0.5500
GINI
LogisticExponentialGrowthSPowerCompoundCubicQuadraticInverseLogarithmicLinearObserved
NCR4
0.30000.25000.20000.1500
0.4000
0.3000
0.2000
0.1000
NHI
LogisticExponentialGrowthSPowerCompoundCubicQuadraticInverseLogarithmicLinearObserved
(a) NEN vs. NCR4 (b) GINI vs. NCR4 (c) NHI vs. NCR4
Figure 2 Functional relationships between the four concentration measures
Note: Linear, logarithmic, inverse, quadratic, cubic, compound, power, S, growth, exponential, and logistic models are compared for the choice of the best function forms.

28
Figure 3 Moderate IoC in the international construction market

29
Figure 4 Annual NHI in the international construction market (1981-2008)