Yang_Yan_EngGeo.pdf - HKU
11
Factors affecting site response to multi-directional earthquake loading J. Yang ⁎, X.R. Yan Department of Civil Engineering, The University of Hong Kong, Hong Kong abstract article info Article history: Received 26 November 2008 Received in revised form 9 April 2009 Accepted 26 April 2009 Available online 3 May 2009 Keywords: Earthquakes Ground motion Site response Soil damping Soil nonlinearity This paper presents an investigation into various factors that may affect the ground response to multi- directional earthquake loading, focusing mainly on the behavior of vertical ground motion and its relation with the horizontal counterpart. The factors investigated herein include the intensity of input motion and the associated soil nonlinearity, the location of input motion (rock outcrop versus bedrock), the variation of water table, and the damping property of soil. Influence of these factors is studied on the characteristics of site amplification in both vertical and horizontal directions, the response spectra of vertical and horizontal ground surface motions, the spectral ratio between the two components (V/H) at the ground surface, and the distributions of stresses and strains in the ground. One of the main results is that varying water table can bring about a significant impact on vertical motion and the relationship between vertical and horizontal motions. The surface response spectral ratio (V/H) can largely exceed the rule-of-thumb value of 2/3 at low periods with lowering the water table, but does not appear to be substantially affected at long periods. © 2009 Elsevier B.V. All rights reserved. 1. Introduction Evaluation of site response to earthquakes plays an important role in seismic design of engineering structures. Most site response analyses have concentrated on horizontal ground motion, in which site response is regarded as the consequence of the vertical propagation of shear waves in a horizontally layered system. Although it has long been recognized that the ground is simultaneously subjected to shaking in both horizontal and vertical directions during a real earthquake, vertical ground motion, as compared with its horizontal counterpart, has received less attention. As a result, knowledge with regard to the characteristics of vertical ground motion and, particularly, with regard to relating vertical and horizontal ground motions is rather limited. The common procedure for generating vertical design spectra, as documented in many seismic provisions and codes (e.g., UBC, 1997), is to simply multiply a factor (typically a value of 2/3) to the horizontal design spectra (Fig. 1). In other words, it is assumed that the response spectral ratio between vertical and horizontal motions is a constant less than 1 over the entire period of interest and for all site conditions. However, several studies on ground motion records obtained in recent earthquakes have shown that the constant (V/H) ratio is not a good descriptor (e.g., Yang and Sato, 2000; Elgamal and He, 2004; Yang and Lee, 2007). The response spectral ratio (V/H) depends on a number of factors (e.g., site-to-source distance and source mechan- ism), and can be significantly greater than 2/3 at short periods in moderate and large earthquakes. In the most recent Wenchuan, China earthquake of May 12, 2008, vertical ground acceleration as large as 0.633 g (g is the gravity) was recorded in the epicenter zone. From a geotechnical engineering perspective, it is of particular interest to identify the influence of such factors as the intensity of earthquake motion, the location of input motion (or control motion), the depth of water table, and the damping property of soil on the behavior of vertical motion as well as its relation with the horizontal motion. This is precisely the purpose of the present study. In an earlier study by Yang and Yan (2009), a simple procedure was proposed for the analysis of the ground response under both vertical and horizontal earthquake loading; validation of the analytical procedure against the downhole array records at the Turkey Flat test site in California showed reasonably good agreement between predictions and mea- surements. By using this newly developed procedure, a series of analyses have been carried out for a hypothesized site with the aim to explore several potential influencing factors. The main results derived from these analyses are presented in this paper. 2. Hypothesized site and input motion The hypothetical soil site is shown in Fig. 2. The soil profile is 30 m deep comprising a surface of sandy clay layer of 10 m and an underlying sand layer of 20 m. The water table is located at the depth of 5 m below the ground level. The mass density of the clay is assumed to be 1800 kg/m 3 and the density of the sand is 2000 kg/m 3 . The shear wave velocity, V s , varies from 170 m/s in the clay layer to 350 m/s in the sand layer. Using the UBC site classification system, the site can be categorized to be a stiff-soil site. On the other hand, the compressional Engineering Geology 107 (2009) 77–87 ⁎ Corresponding author. E-mail address: [email protected] (J. Yang). 0013-7952/$ – see front matter © 2009 Elsevier B.V. All rights reserved. doi:10.1016/j.enggeo.2009.04.002 Contents lists available at ScienceDirect Engineering Geology journal homepage: www.elsevier.com/locate/enggeo
-
Upload
khangminh22 -
Category
Documents
-
view
0 -
download
0
Transcript of Yang_Yan_EngGeo.pdf - HKU

Engineering Geology 107 (2009) 77–87
Contents lists available at ScienceDirect
Engineering Geology
j ourna l homepage: www.e lsev ie r.com/ locate /enggeo
Factors affecting site response to multi-directional earthquake loading
J. Yang ⁎, X.R. YanDepartment of Civil Engineering, The University of Hong Kong, Hong Kong
⁎ Corresponding author.E-mail address: [email protected] (J. Yang).
0013-7952/$ – see front matter © 2009 Elsevier B.V. Adoi:10.1016/j.enggeo.2009.04.002
a b s t r a c t
a r t i c l e i n f oArticle history:Received 26 November 2008Received in revised form 9 April 2009Accepted 26 April 2009Available online 3 May 2009
Keywords:EarthquakesGround motionSite responseSoil dampingSoil nonlinearity
This paper presents an investigation into various factors that may affect the ground response to multi-directional earthquake loading, focusing mainly on the behavior of vertical ground motion and its relationwith the horizontal counterpart. The factors investigated herein include the intensity of input motion and theassociated soil nonlinearity, the location of input motion (rock outcrop versus bedrock), the variation ofwater table, and the damping property of soil. Influence of these factors is studied on the characteristics ofsite amplification in both vertical and horizontal directions, the response spectra of vertical and horizontalground surface motions, the spectral ratio between the two components (V/H) at the ground surface, and thedistributions of stresses and strains in the ground. One of the main results is that varying water table canbring about a significant impact on vertical motion and the relationship between vertical and horizontalmotions. The surface response spectral ratio (V/H) can largely exceed the rule-of-thumb value of 2/3 at lowperiods with lowering the water table, but does not appear to be substantially affected at long periods.
© 2009 Elsevier B.V. All rights reserved.
1. Introduction
Evaluation of site response to earthquakes plays an important rolein seismic design of engineering structures. Most site responseanalyses have concentrated on horizontal ground motion, in whichsite response is regarded as the consequence of the verticalpropagation of shear waves in a horizontally layered system. Althoughit has long been recognized that the ground is simultaneouslysubjected to shaking in both horizontal and vertical directions duringa real earthquake, vertical ground motion, as compared with itshorizontal counterpart, has received less attention. As a result,knowledge with regard to the characteristics of vertical groundmotion and, particularly, with regard to relating vertical andhorizontal ground motions is rather limited. The common procedurefor generating vertical design spectra, as documented in many seismicprovisions and codes (e.g., UBC, 1997), is to simply multiply a factor(typically a value of 2/3) to the horizontal design spectra (Fig. 1). Inother words, it is assumed that the response spectral ratio betweenvertical and horizontal motions is a constant less than 1 over theentire period of interest and for all site conditions.
However, several studies on ground motion records obtained inrecent earthquakes have shown that the constant (V/H) ratio is not agood descriptor (e.g., Yang and Sato, 2000; Elgamal and He, 2004;Yang and Lee, 2007). The response spectral ratio (V/H) depends on anumber of factors (e.g., site-to-source distance and source mechan-ism), and can be significantly greater than 2/3 at short periods in
ll rights reserved.
moderate and large earthquakes. In the most recent Wenchuan, Chinaearthquake of May 12, 2008, vertical ground acceleration as large as0.633 g (g is the gravity) was recorded in the epicenter zone.
From a geotechnical engineering perspective, it is of particularinterest to identify the influence of such factors as the intensity ofearthquake motion, the location of input motion (or control motion),the depth of water table, and the damping property of soil on thebehavior of vertical motion as well as its relation with the horizontalmotion. This is precisely the purpose of the present study. In an earlierstudy by Yang and Yan (2009), a simple procedure was proposed forthe analysis of the ground response under both vertical and horizontalearthquake loading; validation of the analytical procedure against thedownhole array records at the Turkey Flat test site in Californiashowed reasonably good agreement between predictions and mea-surements. By using this newly developed procedure, a series ofanalyses have been carried out for a hypothesized site with the aim toexplore several potential influencing factors. The main results derivedfrom these analyses are presented in this paper.
2. Hypothesized site and input motion
The hypothetical soil site is shown in Fig. 2. The soil profile is 30 mdeep comprising a surface of sandy clay layer of 10 m and anunderlying sand layer of 20 m. The water table is located at the depthof 5m below the ground level. The mass density of the clay is assumedto be 1800 kg/m3 and the density of the sand is 2000 kg/m3. The shearwave velocity, Vs, varies from 170 m/s in the clay layer to 350 m/s inthe sand layer. Using the UBC site classification system, the site can becategorized to be a stiff-soil site. On the other hand, the compressional
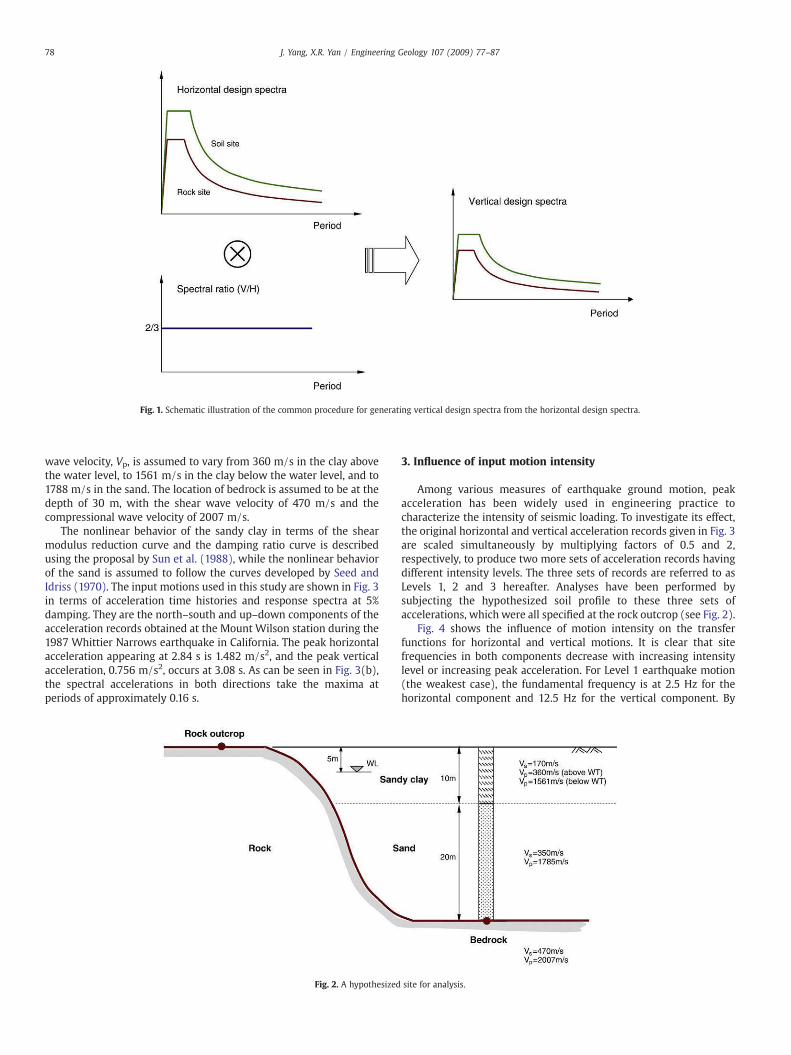
Fig. 1. Schematic illustration of the common procedure for generating vertical design spectra from the horizontal design spectra.
78 J. Yang, X.R. Yan / Engineering Geology 107 (2009) 77–87
wave velocity, Vp, is assumed to vary from 360 m/s in the clay abovethe water level, to 1561 m/s in the clay below the water level, and to1788 m/s in the sand. The location of bedrock is assumed to be at thedepth of 30 m, with the shear wave velocity of 470 m/s and thecompressional wave velocity of 2007 m/s.
The nonlinear behavior of the sandy clay in terms of the shearmodulus reduction curve and the damping ratio curve is describedusing the proposal by Sun et al. (1988), while the nonlinear behaviorof the sand is assumed to follow the curves developed by Seed andIdriss (1970). The input motions used in this study are shown in Fig. 3in terms of acceleration time histories and response spectra at 5%damping. They are the north–south and up–down components of theacceleration records obtained at the Mount Wilson station during the1987 Whittier Narrows earthquake in California. The peak horizontalacceleration appearing at 2.84 s is 1.482 m/s2, and the peak verticalacceleration, 0.756 m/s2, occurs at 3.08 s. As can be seen in Fig. 3(b),the spectral accelerations in both directions take the maxima atperiods of approximately 0.16 s.
Fig. 2. A hypothesized
3. Influence of input motion intensity
Among various measures of earthquake ground motion, peakacceleration has been widely used in engineering practice tocharacterize the intensity of seismic loading. To investigate its effect,the original horizontal and vertical acceleration records given in Fig. 3are scaled simultaneously by multiplying factors of 0.5 and 2,respectively, to produce two more sets of acceleration records havingdifferent intensity levels. The three sets of records are referred to asLevels 1, 2 and 3 hereafter. Analyses have been performed bysubjecting the hypothesized soil profile to these three sets ofaccelerations, which were all specified at the rock outcrop (see Fig. 2).
Fig. 4 shows the influence of motion intensity on the transferfunctions for horizontal and vertical motions. It is clear that sitefrequencies in both components decrease with increasing intensitylevel or increasing peak acceleration. For Level 1 earthquake motion(the weakest case), the fundamental frequency is at 2.5 Hz for thehorizontal component and 12.5 Hz for the vertical component. By
site for analysis.

Fig. 4. Transfer functions (surface-to-base) under various levels of motion intensity: (a) horizontal component; (b) vertical component.
Table 1Peak accelerations at the surface and base of the soil deposit under various levels ofmotion intensity.
Level 1 Level 2 Level 3
H V V/H H V V/H H V V/H
Surface 1.09 0.52 0.48 2.06 1.03 0.50 3.65 2.12 0.58Base 0.44 0.29 0.66 0.92 0.56 0.61 1.88 1.03 0.55Surface/base 2.48 1.79 0.73 2.24 1.84 0.82 1.94 2.06 1.05
Note 1: H = horizontal component; V = vertical component; V/H = vertical-to-horizontal ratio.Note 2: Input motion is at rock outcropping.Note 3: Units of acceleration: m/s/s.
Fig. 3. Input motions used: (a) time histories; (b) response spectra.
79J. Yang, X.R. Yan / Engineering Geology 107 (2009) 77–87
comparison, they are reduced to be 2.2 and 11 Hz in the case of a Level3 earthquake motion. In the meantime, peak values of the spectralratios in both components are reduced substantially when theintensity of input motion increases. For example, the verticalamplification at the fundamental frequency drops from approximately25 at Level 1 motion to about 13 at Level 3; the horizontalamplification at the fundamental frequency varies from approxi-mately 17 at Level 1 to less than 10 at a Level 3 input motion.
The above observations are mainly attributed, as will be shownlater, to the following two effects. First, higher peak accelerationcauses a higher hysteretic damping and therefore a larger reduction ofsite amplification. Second, higher peak acceleration results in largerstrains and reduced moduli and thus lower frequency response.
Site amplification has sometimes been simply examined in practiceby a factor which is defined as the ratio between the peak accelerationat the ground surface and the peak acceleration at the base of soildeposit (e.g., Idriss, 1990) Following this practice, the amplificationfactors for both horizontal and vertical motions are calculated for thethree cases of intensity levels and summarized in Table 1. It is notedthat the amplification factor for horizontal motion decreases with
increasing intensity level. The amplification factor for vertical motion,however, is found to be an increasing function of the intensity level.This implies that the so-defined amplification factor, as comparedwith the transfer function given in Fig. 4, is not an appropriateindicator for soil nonlinearity involved with vertical motion.

Fig. 5. Response spectra of ground surface motions under various levels of motion intensity: (a) horizontal component; (b) vertical component.
80 J. Yang, X.R. Yan / Engineering Geology 107 (2009) 77–87
As far as the ratio betweenpeak vertical and horizontal accelerations(V/H) is concerned, it is interesting to note that the ratio increaseswith increasing intensity at the ground surface but decreases withincreasing intensity at the base of the soil deposit. Consequently, thesurface-to-base (V/H) ratio is an increasing function of the intensity ofinput motion.
The influence of the intensity of input motion on surface responsespectra is shown in Fig. 5 for both horizontal and vertical motions.Again, the influence is observed to be significant on both components.In the case of Level 1 input motion, the peak spectral acceleration inthe horizontal direction is approximately 1/3 of that under the Level 3input motion. Similarly, the peak spectral acceleration in verticaldirection at Level 3 is about 5 times the peak value at Level 1 inputmotion. It is worth noting from Fig. 6 that, while the intensity of inputmotion has a profound influence on both individual components, itsimpact on the response spectral ratio between the vertical andhorizontal motions (V/H) appears to be less significant. Withincreasing the motion intensity, a slight increase in the (V/H) spectralratio occurs for periods lower than 0.2 s; for longer periods theinfluence becomes negligible and the (V/H) ratio is generally less than2/3. In the period range of 0.05–0.2 s, the (V/H) ratio substantiallyexceeds 2/3 regardless of the intensity of input motion.
Shown in Fig. 7 are the variations with depth of peak accelerationsin horizontal and vertical directions for the three intensity levels. The
Fig. 6. Influence of the intensity of input motion on the response spectral ratio betweenvertical and horizontal surface motions (V/H).
influence of the motion intensity on the profiles of peak stresses andpeak strains is presented in Fig. 8. Generally, higher intensity levelcauses larger response in both components. It is to be noted that thereis a dramatic variation in peak horizontal acceleration occurring at adepth of 5 to 10 m, while a high gradient of peak vertical accelerationappears at a depth of about 5 m. Significant variations in shear andnormal strains are observed in similar zones. Recalling the soil profilesgiven in Fig. 2, the observed variations are considered reasonable.
Fig. 9 presents the profiles of the degraded shear and constrainedmoduli and the shear-strain compatible damping ratio (ζh) underdifferent intensity levels of inputmotion. It can be seen that the higherthe input motion intensity, the smaller the moduli and the larger thedamping ratio. With respect to the shear modulus, the influence ofintensity tends to be appreciable in the sand layer below the depth of10 m. The influence on the constraint modulus, however, becomesnotable for soils below the depth of 5 m. This is consistent with the
Fig. 7. Influence of the intensity of input motion on distributions of peak accelerationswith depth: (a) horizontal component; (b) vertical component.
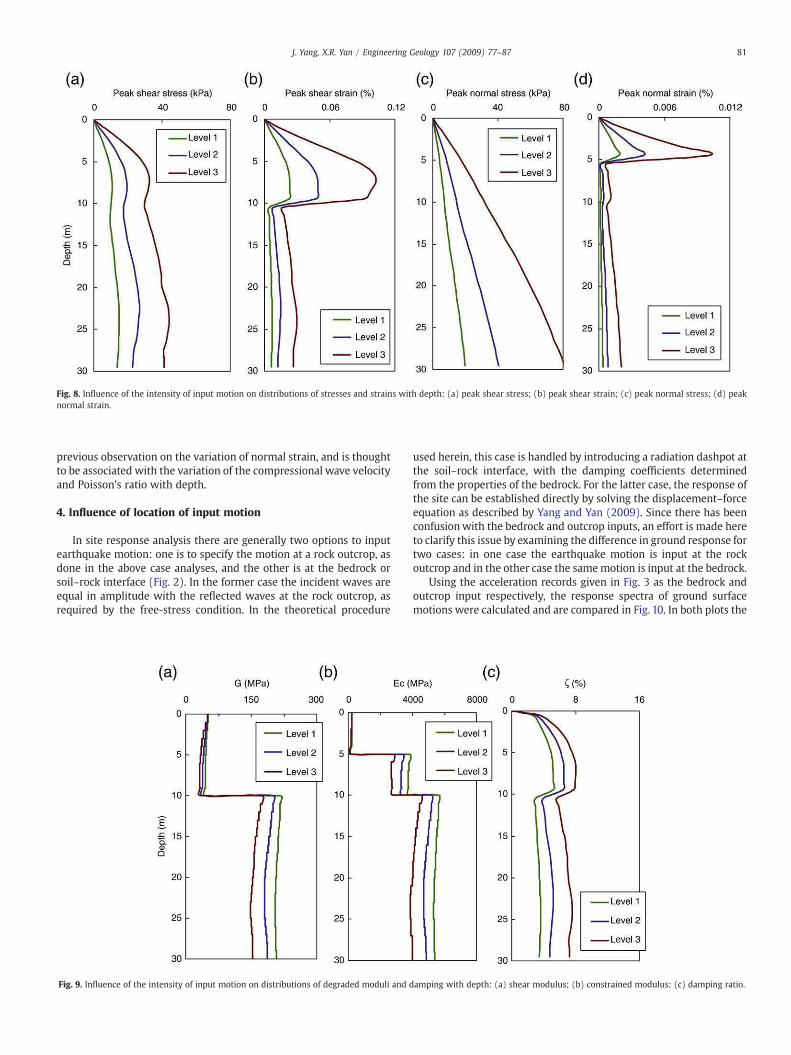
Fig. 8. Influence of the intensity of input motion on distributions of stresses and strains with depth: (a) peak shear stress; (b) peak shear strain; (c) peak normal stress; (d) peaknormal strain.
81J. Yang, X.R. Yan / Engineering Geology 107 (2009) 77–87
previous observation on the variation of normal strain, and is thoughtto be associated with the variation of the compressional wave velocityand Poisson's ratio with depth.
4. Influence of location of input motion
In site response analysis there are generally two options to inputearthquake motion: one is to specify the motion at a rock outcrop, asdone in the above case analyses, and the other is at the bedrock orsoil–rock interface (Fig. 2). In the former case the incident waves areequal in amplitude with the reflected waves at the rock outcrop, asrequired by the free-stress condition. In the theoretical procedure
Fig. 9. Influence of the intensity of input motion on distributions of degraded moduli and d
used herein, this case is handled by introducing a radiation dashpot atthe soil–rock interface, with the damping coefficients determinedfrom the properties of the bedrock. For the latter case, the response ofthe site can be established directly by solving the displacement–forceequation as described by Yang and Yan (2009). Since there has beenconfusionwith the bedrock and outcrop inputs, an effort is made hereto clarify this issue by examining the difference in ground response fortwo cases: in one case the earthquake motion is input at the rockoutcrop and in the other case the samemotion is input at the bedrock.
Using the acceleration records given in Fig. 3 as the bedrock andoutcrop input respectively, the response spectra of ground surfacemotions were calculated and are compared in Fig. 10. In both plots the
amping with depth: (a) shear modulus; (b) constrained modulus; (c) damping ratio.

Fig. 10. Influence of input motion position on the response spectra of ground surface motions: (a) horizontal component; (b) vertical component.
82 J. Yang, X.R. Yan / Engineering Geology 107 (2009) 77–87
curves for the case of outcropping input are denoted as “outcropping”while the curves generated from the case of bedrock input are labeledas “bedrock”. Shown in Fig. 11 are the profiles of peak accelerations inboth directions for the two cases. The results for stresses and strains inthe two cases are presented in Fig. 12.
The overall observation on these figures is that, compared with thecase of outcropping input, the response of the site to the sameearthquakemotion but input at the bedrock is stronger in both verticaland horizontal directions. Accordingly, in the case of bedrock inputmore significant modulus reduction and higher damping are observed(Fig. 13). These observations are reasonable because in the out-cropping case, perfect reflection occurs due to the free-stressconditions (i.e. reflected waves are equal to incident waves), whereasin the bedrock case part of the incident waves are transmitted into thesoils resulting in the reflected waves of being less than the incidentwaves. More detailed discussion on the relation between bedrock
Fig. 11. Influence of input motion position on distributions of peak accelerations withdepth: (a) horizontal component; (b) vertical component.
motion and outcropping motion can be referred to Yang and Yan(2009).
Moreover, the difference in the modulus reduction and dampingratio will bring about changes in site frequencies in both horizontaland vertical components. For example, the fundamental frequency ofthe vertical motion in the case of bedrock input is about 94% of that inthe case of outcropping input. It should be noted that the change ofinput motion position will not cause a difference in the transferfunction for either component if the nonlinear behavior of the soil isnot taken into account.
With respect to the response spectral ratio (V/H) at the groundlevel, Fig. 14 shows that the ratio is substantially increased at shorterperiods (less than 0.2 s) but slightly decreased at periods longer than0.2 s when the location of input motion changes from rock outcrop tothe base of the soil deposit.
Table 2 gives peak values of the horizontal and vertical surfaceaccelerations in the two cases of input motion position. Note that theinfluence of input motion position is more significant for verticalmotion than for horizontal motion; this is also observed on Fig. 10. Asfor the ratio between peak vertical and peak horizontal accelerationsat the ground surface, the results show that it increases from 0.5 foroutcropping input to 0.98 for bedrock input.
5. Influence of water level
The analysis of Yang and Sato (2000) on the downhole arrayrecords at a reclaimed site in Kobe, Japan has indicated that thevariation of water table plays an important role in the amplification ofvertical groundmotion. To further investigate this effect, three cases ofwater levels are examined in parallel in this section (Fig. 15): the firstcase is for water level at the surface (i.e. WL=0m), the second case isfor water level at 5 m below the surface (i.e. the case discussedpreviously), and in the third case the depth of water table is at 10 m.Note that in the three cases the profiles of the shear wave velocity (Vs)are assumed to be identical but the profiles of the compressional wavevelocity (Vp) vary with the change of water table. In the case ofWL=0 m, Vp is assumed to vary from 1561 m/s in the clay layer to1785 m/s in the underlying sand, whereas in the case of WL=10 m, itis assumed to vary from 360 m/s in the clay to 1785 m/s in the sandlayer.
The above assumption for the variations of Vp and Vs is based onthe results of the studies by Yang and Sato (2000) and Yang et al.(2004), which indicate that the presence of ground water has asignificant influence on the compressional wave velocity but little

Fig. 12. Influence of input motion position on distributions of stresses and strains with depth: (a) peak shear stress; (b) peak shear strain; (c) peak normal stress; (d) peak normalstrain.
83J. Yang, X.R. Yan / Engineering Geology 107 (2009) 77–87
influence on the shear wave velocity and that a dramatic change in thecompressional wave velocity may occur at the location of water table.
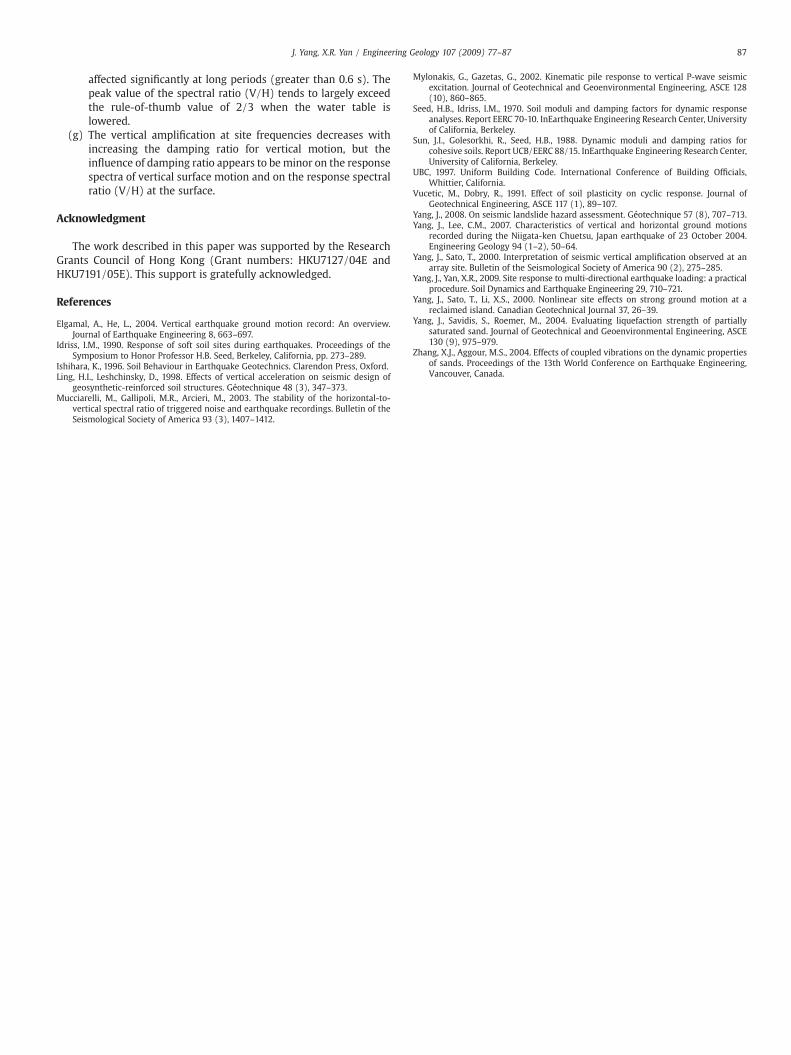
Fig. 16 compares vertical ground surface motions computed for thethreewater levels in terms of the acceleration time histories. Shown inFig. 17 is the influence of water level on the surface response spectraand the transfer function for vertical motion. Clearly, the variation ofwater table brings about a profound effect on the behavior of verticalmotion. The transfer function will be shifted to the low frequency endwhen the water table is lowered. For example, the fundamental
Fig. 13. Influence of input motion position on distributions of (a) shear modulusreduction and (b) damping ratio.
frequency is found to be at 13.4 Hz when the water table is at theground surface, but it drops to 7.4 Hz when the depth of water tablebecomes 10 m. In the meantime, lowering water table brings about amuch stronger amplification of vertical motion, as can be seen fromFig. 17(a). The peak spectral acceleration in the case of WL=10 m isabout 3 times that in the case of WL=0 m.
With respect to the relation between vertical and horizontalmotions, Fig. 18 shows that the variation of water table can alsosignificantly affect the response spectral ratio (V/H) at the groundsurface. For water level at the surface, the (V/H) spectral ratio isgenerally below the value of 2/3 in the whole range of period. If thewater level is lowered to the depth of 10 m, the ratio will increasesharply for periods shorter than about 0.2 s, with the peak value of aslarge as 2.3. On the other hand, the influence of varying water table isfound to be slight for the spectral ratio (V/H) at periods longer than0.6 s.
Fig. 14. Influence of input motion position on the response spectral ratio betweenvertical and horizontal surface motions (V/H).

Table 2Influence of the location of input motions on peak accelerations at ground surface.
Peakacceleration
Peakacceleration
Peak acceleration ratio
H V V/H
Bedrock input 3.05 3.00 0.98Rock outcropping input 2.06 1.03 0.50
Note 1: H = horizontal component; V = vertical component; V/H = vertical-to-horizontal ratio.Note 2: Units of acceleration: m/s/s.
Fig. 16. Vertical ground surface accelerations under various water levels: (a) WL=0m;(b) WL=5 m; (c) WL=10 m.
84 J. Yang, X.R. Yan / Engineering Geology 107 (2009) 77–87
Shown in Fig. 19 are distributions with depth of the peak verticalacceleration and vertical velocity under different water levels. Highgradients are found to occur at the depth that is close to the watertable. Taking the case of WL=10 m as an example, peak verticalacceleration is increased only by 26% when seismic waves travel fromthe base to the depth of 10 m; but it is increased by 200% when thewaves further propagate from the depth of 10m to the ground surface.This result highlights the importance of varying water table in verticalsite amplification, and is in agreement with the observation on thedownhole array records in the Kobe earthquake (Yang and Sato,2000).
For ease of reference, Table 3 summarizes the peak values ofvertical surface accelerations under different water levels. It is worthnoting that the peak vertical acceleration at WL=10 m is about 2.6times that at WL=0m. The peak acceleration ratio (V/H) accordinglyincreases from 0.37 in the case of WL=0 m to 0.96 at WL=10 m.
6. Influence of damping ratio
The damping property of soils associated with shear wavepropagation has been studied extensively (e.g., Sun et al., 1988;Vucetic and Dobry, 1991; Ishihara, 1996). Current knowledge of soildamping with respect to the propagation of compressional waves ishowever very limited, although several attempts have been made todiscuss the combined loading effect (e.g., Zhang and Aggour, 2004). Inthe previous case studies, the damping ratio for vertical motion (ζv)was assumed to be identical with the damping ratio for horizontalmotion (ζh), which was derived from the horizontal site response
Fig. 15. Three cases of water levels under investigatio
analysis through iterations. It is necessary to examine the potentialeffect of damping ratio, ζv, on the vertical site response. For thispurpose, two more cases of vertical damping, ζv=0.5ζh and ζv=s2ζh,are assumed for the reference soil profile given in Fig. 2.
The surface response spectra of vertical motion under threedamping ratios are presented in Fig. 20(a). The transfer functionsfor vertical motion under the three damping ratios are presented inFig. 20(b). As expected, an increase in damping ratio (ζv) results in a
n: (a) WL=0 m; (b) WL=5 m; (c) WL=10 m.
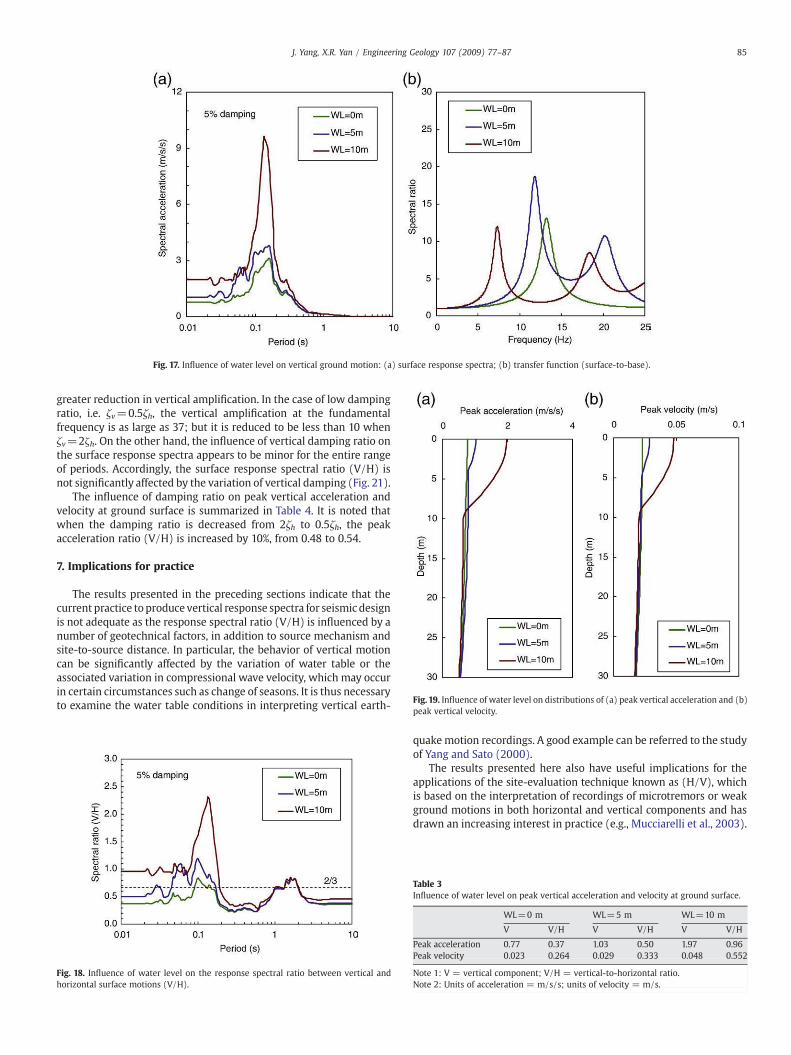
Fig. 17. Influence of water level on vertical ground motion: (a) surface response spectra; (b) transfer function (surface-to-base).
Fig. 19. Influence of water level on distributions of (a) peak vertical acceleration and (b)peak vertical velocity.
85J. Yang, X.R. Yan / Engineering Geology 107 (2009) 77–87
greater reduction in vertical amplification. In the case of low dampingratio, i.e. ζv=0.5ζh, the vertical amplification at the fundamentalfrequency is as large as 37; but it is reduced to be less than 10 whenζv=2ζh. On the other hand, the influence of vertical damping ratio onthe surface response spectra appears to be minor for the entire rangeof periods. Accordingly, the surface response spectral ratio (V/H) isnot significantly affected by the variation of vertical damping (Fig. 21).
The influence of damping ratio on peak vertical acceleration andvelocity at ground surface is summarized in Table 4. It is noted thatwhen the damping ratio is decreased from 2ζh to 0.5ζh, the peakacceleration ratio (V/H) is increased by 10%, from 0.48 to 0.54.
7. Implications for practice
The results presented in the preceding sections indicate that thecurrent practice toproduce vertical response spectra for seismic designis not adequate as the response spectral ratio (V/H) is influenced by anumber of geotechnical factors, in addition to source mechanism andsite-to-source distance. In particular, the behavior of vertical motioncan be significantly affected by the variation of water table or theassociated variation in compressional wave velocity, which may occurin certain circumstances such as change of seasons. It is thus necessaryto examine the water table conditions in interpreting vertical earth-
Fig. 18. Influence of water level on the response spectral ratio between vertical andhorizontal surface motions (V/H).
quakemotion recordings. A good example can be referred to the studyof Yang and Sato (2000).
The results presented here also have useful implications for theapplications of the site-evaluation technique known as (H/V), whichis based on the interpretation of recordings of microtremors or weakground motions in both horizontal and vertical components and hasdrawn an increasing interest in practice (e.g., Mucciarelli et al., 2003).
Table 3Influence of water level on peak vertical acceleration and velocity at ground surface.
WL=0 m WL=5 m WL=10 m
V V/H V V/H V V/H
Peak acceleration 0.77 0.37 1.03 0.50 1.97 0.96Peak velocity 0.023 0.264 0.029 0.333 0.048 0.552
Note 1: V = vertical component; V/H = vertical-to-horizontal ratio.Note 2: Units of acceleration = m/s/s; units of velocity = m/s.

Fig. 20. Influence of damping ratio on vertical ground motion: (a) surface response spectra; (b) transfer function (surface-to-base).
86 J. Yang, X.R. Yan / Engineering Geology 107 (2009) 77–87
Since there is a possibility that vertical motion at the groundsurface can become comparable to or even larger than its horizontalcounterpart in magnitude, it is necessary to take into account a widerrange of magnitudes of vertical motion in seismic analysis and designof engineering structures. Several recent studies have shown that theeffect of vertical motion should not be simply disregarded (Ling andLeshchinsky, 1998; Mylonakis and Gazetas, 2002; Yang, 2008).
Owing to the simplifications introduced in the present modelingprocedure, the effects on groundmotions due to very strong nonlinearsoil response, in particular that associated with soil liquefaction (e.g.,Yang et al., 2000), may not be well accounted for. In these situationsmore sophisticated procedures such as fully-coupled, elasto-plastic,2D or 3D finite element programs can be sought to investigate theground motion characteristics. However, it is to be recognized thatthese analyses are usually involved with great difficulty anduncertainty in the determination of the parameters of constitutivemodels for soils, rendering them unsuitable for routine engineeringpractice.
8. Conclusions
An attempt has been made in this study, by using a simpleanalytical procedure developed by Yang and Yan (2009), to investigatepotential factors that may influence ground response to vertical and
Fig. 21. Influence of damping ratio on the response spectral ratio between vertical andhorizontal surface motions (V/H).
horizontal earthquake loading. Particular attention has been paid tothe behavior of vertical ground motion and its relation with thehorizontal counterpart, on which current understanding is verylimited. The main results of the present study can be summarized asfollows.
(a) Site frequencies for bothvertical andhorizontalmotionsdecreasewith increasing the intensity of input motion, accompanied by asignificant reduction of site amplification at these frequencies.This is due primarily to high hysteretic damping and reducedmoduli associated with strong earthquake motion.
(b) While the intensity of inputmotion has a profound influence onthe characteristics of individual components of groundmotions,its impact is however less significant on the response spectralratio between the vertical and horizontal motions (V/H) at thesurface.
(c) The amplification factor, simply defined as the ratio betweenpeak accelerations at the surface and at the base of soil deposit,is not an appropriate indicator for soil nonlinearity involvedwith vertical ground motion.
(d) Comparedwith the case of rock outcropping input, the responseof the site to the same earthquake motion specified at thebedrock is stronger in both vertical and horizontal directions.Vertical ground response appears to be affected more signifi-cantly by the location of input motion than the horizontal one.
(e) The variation of water table can bring about a significant impacton vertical ground response. When the water table is lowered,site frequencies for vertical motion will be shifted to the lowfrequency end and the surface response spectra will exhibithigher peak values.
(f) The surface response spectral ratio (V/H) increases substan-tially at low periods with lowering the water table, but is not
Table 4Influence of damping ratio on peak vertical acceleration and velocity at ground surface.
ζv=0.5ζh ζv=ζh ζv=2ζh
V V/H V V/H V V/H
Peak acceleration 1.11 0.54 1.03 0.50 0.99 0.48Peak velocity 0.030 0.345 0.029 0.333 0.027 0.310
Note 1: V = vertical component; V/H = vertical-to-horizontal ratio.Note 2: ζv = damping ratio for vertical motion; ζh = damping ratio for horizontalmotion.Note 3: Units of acceleration = m/s/s; units of velocity = m/s.
87J. Yang, X.R. Yan / Engineering Geology 107 (2009) 77–87
affected significantly at long periods (greater than 0.6 s). Thepeak value of the spectral ratio (V/H) tends to largely exceedthe rule-of-thumb value of 2/3 when the water table islowered.
(g) The vertical amplification at site frequencies decreases withincreasing the damping ratio for vertical motion, but theinfluence of damping ratio appears to be minor on the responsespectra of vertical surface motion and on the response spectralratio (V/H) at the surface.
Acknowledgment
The work described in this paper was supported by the ResearchGrants Council of Hong Kong (Grant numbers: HKU7127/04E andHKU7191/05E). This support is gratefully acknowledged.
References
Elgamal, A., He, L., 2004. Vertical earthquake ground motion record: An overview.Journal of Earthquake Engineering 8, 663–697.
Idriss, I.M., 1990. Response of soft soil sites during earthquakes. Proceedings of theSymposium to Honor Professor H.B. Seed, Berkeley, California, pp. 273–289.
Ishihara, K., 1996. Soil Behaviour in Earthquake Geotechnics. Clarendon Press, Oxford.Ling, H.I., Leshchinsky, D., 1998. Effects of vertical acceleration on seismic design of
geosynthetic-reinforced soil structures. Géotechnique 48 (3), 347–373.Mucciarelli, M., Gallipoli, M.R., Arcieri, M., 2003. The stability of the horizontal-to-
vertical spectral ratio of triggered noise and earthquake recordings. Bulletin of theSeismological Society of America 93 (3), 1407–1412.
Mylonakis, G., Gazetas, G., 2002. Kinematic pile response to vertical P-wave seismicexcitation. Journal of Geotechnical and Geoenvironmental Engineering, ASCE 128(10), 860–865.
Seed, H.B., Idriss, I.M., 1970. Soil moduli and damping factors for dynamic responseanalyses. Report EERC 70-10. InEarthquake Engineering Research Center, Universityof California, Berkeley.
Sun, J.I., Golesorkhi, R., Seed, H.B., 1988. Dynamic moduli and damping ratios forcohesive soils. Report UCB/EERC 88/15. InEarthquake Engineering Research Center,University of California, Berkeley.
UBC, 1997. Uniform Building Code. International Conference of Building Officials,Whittier, California.
Vucetic, M., Dobry, R., 1991. Effect of soil plasticity on cyclic response. Journal ofGeotechnical Engineering, ASCE 117 (1), 89–107.
Yang, J., 2008. On seismic landslide hazard assessment. Géotechnique 57 (8), 707–713.Yang, J., Lee, C.M., 2007. Characteristics of vertical and horizontal ground motions
recorded during the Niigata-ken Chuetsu, Japan earthquake of 23 October 2004.Engineering Geology 94 (1–2), 50–64.
Yang, J., Sato, T., 2000. Interpretation of seismic vertical amplification observed at anarray site. Bulletin of the Seismological Society of America 90 (2), 275–285.
Yang, J., Yan, X.R., 2009. Site response to multi-directional earthquake loading: a practicalprocedure. Soil Dynamics and Earthquake Engineering 29, 710–721.
Yang, J., Sato, T., Li, X.S., 2000. Nonlinear site effects on strong ground motion at areclaimed island. Canadian Geotechnical Journal 37, 26–39.
Yang, J., Savidis, S., Roemer, M., 2004. Evaluating liquefaction strength of partiallysaturated sand. Journal of Geotechnical and Geoenvironmental Engineering, ASCE130 (9), 975–979.
Zhang, X.J., Aggour, M.S., 2004. Effects of coupled vibrations on the dynamic propertiesof sands. Proceedings of the 13th World Conference on Earthquake Engineering,Vancouver, Canada.