
Computational fluid dynamics modelling and optimal configuring of a channelled optical fibre...
29
promoting access to White Rose research papers White Rose Research Online [email protected] Universities of Leeds, Sheffield and York http://eprints.whiterose.ac.uk/ This is an author produced version of a paper accepted for publication in Indoor and Built Environment. White Rose Research Online URL for this paper: http://eprints.whiterose.ac.uk/78929/ Paper: Gilkeson, CA, Noakes, CJ and Khan, MAI (2014) CFD Modelling and Optimisation of an Upper-Room UVGI System in a Naturally Ventilated Hospital Ward. Indoor and Built Environment. (in press).
Transcript of Computational fluid dynamics modelling and optimal configuring of a channelled optical fibre...
promoting access to White Rose research papers
White Rose Research Online [email protected]
Universities of Leeds, Sheffield and York http://eprints.whiterose.ac.uk/
This is an author produced version of a paper accepted for publication in Indoor and Built Environment. White Rose Research Online URL for this paper: http://eprints.whiterose.ac.uk/78929/
Paper: Gilkeson, CA, Noakes, CJ and Khan, MAI (2014) CFD Modelling and Optimisation of an Upper-Room UVGI System in a Naturally Ventilated Hospital Ward. Indoor and Built Environment. (in press).
CFD Modelling and Optimisation of an Upper-Room UVGI System in a Naturally
Ventilated Hospital Ward
C. A. Gilkeson1*, C. J. Noakes2, M. A. I. Khan2
1Institute of Engineering Thermofluids Surfaces and Interfaces, School of Mechanical Engineering,
University of Leeds, Leeds, United Kingdom, LS2 9JT
2Pathogen Control Engineering Institute, School of Civil Engineering, University of Leeds, Leeds, United
Kingdom, LS2 9JT
*Corresponding author: [email protected]

Abstract
Ultraviolet Germicidal Irradiation (UVGI) has been shown to be an effective technology for reducing the
airborne bioburden in indoor environments and is already advocated as a potential infection control
measure for healthcare settings. However, much of the understanding of UVGI performance is based on
experimental studies or numerical simulation in mechanically ventilated environments. This study considers
the application of an upper-room UVGI system in a naturally ventilated multi-bed hospital ward. A CFD
model is used to simulate a Nightingale-type hospital ward with wind-driven cross-ventilation and three
wall-mounted UVGI fixtures. A parametric study considering fifty different fixture configurations and three
ventilation rates was carried out using a Design of Experiments (DoE) approach. Each configuration was
assessed by calculating the UV dose distribution over the ward and at each bed. Results show that dose is
influenced by the location of the fixtures and the ventilation regime. Thermal effects are likely to be
important at low ventilation rates and may reduce UV effectiveness. A metamodel-based numerical
optimisation was applied at a ventilation rate of 6 air changes per hour (ACH). In this case the optimum
result is achieved when UVGI fixtures are mounted on the leeward wall at their lowest mounting height.
Keywords – CFD; UVGI; airborne infection; hospital ward; natural ventilation; numerical optimisation

Introduction
The airborne transmission of pathogens including tuberculosis and influenza poses a significant threat to
human health [1,2]. This is a particular risk in healthcare settings such as hospital wards, where both
infectious individuals and patients with weakened immune systems may be in close proximity; airborne
transmission has been associated with a number of hospital outbreaks [3-5]. Conventionally, environmental
control of airborne infection is accomplished through increasing ventilation rates to dilute and extract
airborne pathogens and setting up ventilation systems to deliver appropriate pressure relationships between
spaces [6]. However there is increasing awareness of the relationship between ventilation rate and energy
consumption; up to 44% of energy in UK hospitals is thought to be consumed by ventilation and space
heating [7]. Studies have suggested that air cleaning technologies may offer the potential to reduce airborne
infection risk without the energy costs associated with higher ventilation rates [8,9].
One such strategy, upper-room Ultraviolet Germicidal Irradiation (UVGI) was developed for use in
healthcare facilities long before antibiotics gained widespread use [10,11]. These systems use ceiling or wall
mounted lamps to produce an irradiance field which is limited to the upper air zone in the room, above the
heads of occupants. Airborne microorganisms from the occupied zone can be transported to the upper-zone
by ventilation flows and convention currents, passing the microorganisms through the UV field. Exposure of
microorganisms to UV-C light at a wavelength close to 254 nm, damages the microorganism DNA; at a
sufficient dose this can be lethal, effectively killing the microorganism [12]. Several experimental studies
have verified the disinfection performance of UVGI for a range of microorganisms in various settings [13-
16], and a recent study conducted in clinical setting demonstrated a 70% reduction in TB transmission risk
following the installation of an upper-room UVGI system [17]
One of the major difficulties of implementing upper-room UVGI systems is that the disinfection performance
relies on the room airflow patterns which are responsible for transporting the microorganisms through the UV
field. It therefore follows that the position of the UVGI fixtures and their interaction with the room ventilation
is the dominant factor for maximising disinfection. Computational Fluid Dynamics (CFD) modelling has
been shown in recent years to be a valuable tool for understanding the interaction between airflows and
upper-room UVGI devices. Studies have simulated microorganism inactivation through scalar transport [16,
18, 19, 20] and particle-tracking [21] methods as well as considering the UV dose delivered by upper-room
devices [22, 23]. Studies have also shown relationships with a ventilation system [19-22] potential to reduce
cross-infection between patients [18] and the benefits of utilizing a mixing fan in conjunction with UV lamps
[15, 24]. While these studies all yield insight into the factors influencing performance of UV systems, they
simulate relatively small rooms which are mechanically ventilated. Upper room UVGI systems are often
implemented in naturally ventilated environments, where the interactions between the UV field and the
airflow patterns are largely unknown. The aim of this investigation is to simulate an upper-room UVGI
system within a multi-bed naturally ventilated hospital ward and investigate how combining CFD analysis
with numerical optimisation tools can aid the design of such a system. The study focuses on a Nightingale-
style ward with wind-driven cross-ventilation supplied via opening windows [25]. A CFD approach is used to
simulate the wind-driven airflow patterns and to predict the UV dose arising from the placement of upper-
room devices. The study also considers how a design of experiment technique can be used to efficiently
conduct a parametric study considering device placement and ventilation rate, and how metamodel-based
numerical optimisation methodology can be applied to evaluate the most suitable design option. Results are
also presented to illustrate the potential impact of heat sources on the mixing and hence UV effectiveness
under different ventilation conditions.
Methodology
Geometry, Mesh and Boundary Conditions
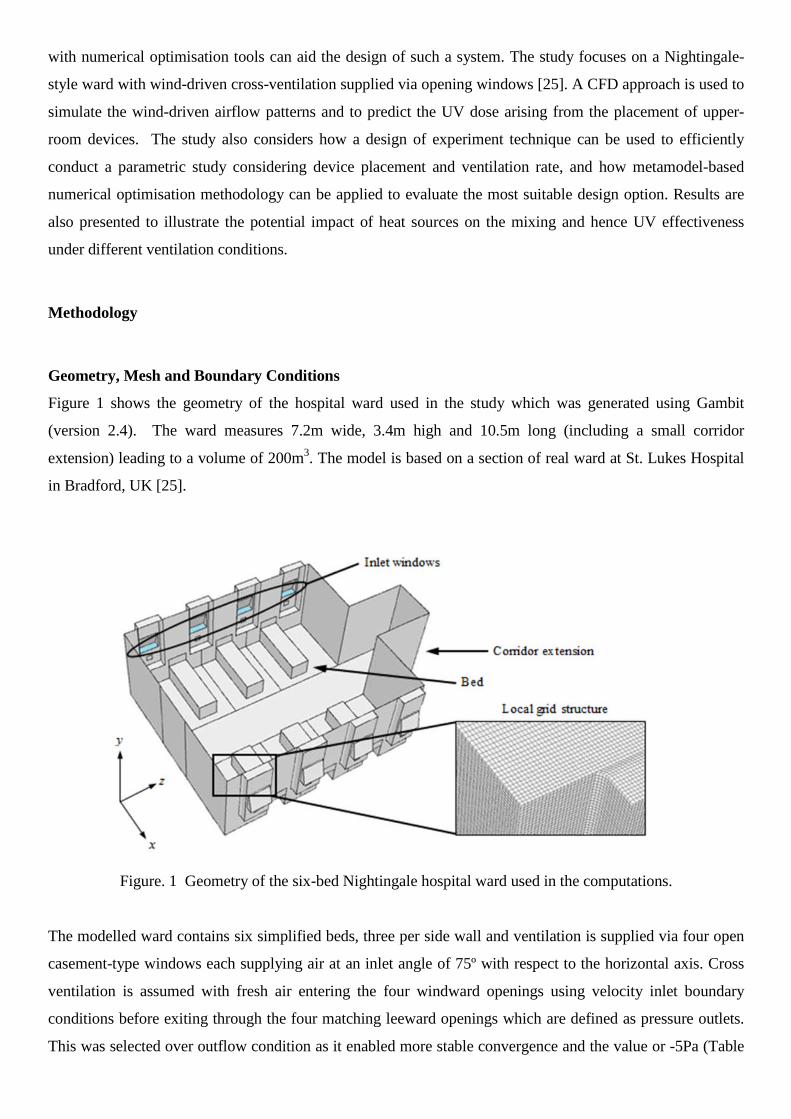
Figure 1 shows the geometry of the hospital ward used in the study which was generated using Gambit
(version 2.4). The ward measures 7.2m wide, 3.4m high and 10.5m long (including a small corridor
extension) leading to a volume of 200m3. The model is based on a section of real ward at St. Lukes Hospital
in Bradford, UK [25].
Figure. 1 Geometry of the six-bed Nightingale hospital ward used in the computations.
The modelled ward contains six simplified beds, three per side wall and ventilation is supplied via four open
casement-type windows each supplying air at an inlet angle of 75º with respect to the horizontal axis. Cross
ventilation is assumed with fresh air entering the four windward openings using velocity inlet boundary
conditions before exiting through the four matching leeward openings which are defined as pressure outlets.
This was selected over outflow condition as it enabled more stable convergence and the value or -5Pa (Table

1) was based on measured data [25]. The flow direction through each 0.8m x 0.2m inlet matches the angle of
the windows; this behaviour was verified during an experimental study [25] and is shown in Figure 6.
Simulations were carried out for three ventilation rates of 2, 6 and 12 ACH by applying corresponding
velocity inlet conditions of 0.146 m/s, 0.438 m/s and 0.876 m/s respectively. These rates were selected to
explore a range of realistic ventilation conditions that could be achievable in naturally ventilated wards. UK
hospital design guidance recommends 6 ACH for ward areas [6], and by selecting substantially lower and
higher rates, the influence of ventilation can be evaluated. Our experimental measurements reported in [25]
show rates between 3.4-6.5 ACH with three windows per side open, depending on external wind conditions.
Other studies in large naturally ventilated wards have shown higher rates over 12 ACH [26,27]. Turbulence
intensity was based on a best estimate from anemometry measurements [25]. The simulation parameters and
boundary conditions used in the study are summarised in Table 1.
Simulation setting/parameter Details
Cell count 9416764
Turbulence model RSM
Wall functions Standard
Discretisation 2nd order
Gradient method Green-gauss cell based
Inlet boundary condition (2ACH) Velocity inlet, 0.146 m/s; Turbulence intensity = 10%;
Hydraulic diameter = 0.3745 m
Inlet boundary condition (6ACH) Velocity inlet, 0.438 m/s; Turbulence intensity = 10%;
Hydraulic diameter = 0.3745 m
Inlet boundary condition (12ACH) Velocity inlet, 0.876 m/s; Turbulence intensity = 10%;
Hydraulic diameter = 0.3745 m
Outlet boundary condition Pressure outlet, pressure = -5 pa
Table 1. Simulation parameters and boundary conditions
A recent computational study on a very similar geometry showed that grid independent solutions for the
airflow patterns could be obtained using structured hexahedral cell sizes of 0.035m with span-wise grid
stretching and local refinement around the window openings [28]. The results from this study showed that the
discretisation error in the velocity magnitude varied between 0.38% and 3.40%, with the higher errors on the
windward side of the ward. These errors were determined using the Grid Convergence Index (GCI) which
accounts for changes in solution values, the order of discretization used and the local grid spacing [29]. To
further minimise discretisation error, the present study employs an even smaller local grid spacing of 0.025m
which leads to a global cell count of 9.4 million.
Airflow Simulation
Initial simulations used in the optimization study were all steady-state and isothermal and conducted using
Fluent (Version 13.0Sp2). Further steady-state simulations were conducted at 2 and 12 ACH with heat
sources on patient beds to explore the potential influence of thermal plumes. Double-precision real number
representation was employed in conjunction with second order discretization for all governing flow equations

(i.e. mass, momentum and turbulence). Turbulence was simulated using the Reynolds Stress Model (RSM)
which accounts for anisotropic turbulent structures in contrast to simpler Reynolds Averaged Navier-Stokes
(RANS)-based models [30]. Previous studies have shown that the RSM model yields similar flow structures
to the RANS k-e model for UV simulation [25] and better prediction of bioaerosol dispersion [31] in a
mechanically ventilated room. Standard wall functions were employed giving solutions with average and
maximum wall y+ values of 15 and 38 respectively, for the 6ACH case. However, the focus of the study is on
the bulk airflow and the flow in near-wall regions is far less important.
UVGI Modelling
UVGI performance depends on the irradiance field generated by UV lamps (E, W/m2), the duration of
exposure of a microorganism to the field (t, s) and the susceptibility of the microorganism to UV-C
irradiance. The irradiance and exposure time are determined by the system design and airflow patterns. The
product of these two variables defines the UV dose, D (J/m2) received by airborne microorganisms, namely:
txEtxD )(),( (1)
where x is the position at time, t. The parameter D is cumulative and depends on the 3D UV field present
within the space as well as the path taken by a given microorganism. For a known pathogen, the dose
received by a microorganism can be used, together with the microorganism susceptibility [12], to calculate
the expected microorganism survival fraction, and hence the reduction in airborne concentrations. For many
hospital environments the actual pathogens present are unknown, so the dose is a good parameter to represent
the effectiveness of a UVGI system without requiring knowledge of microorganism species.
The influence of the UVGI system is modelled here by evaluating the UV dose received by the air supplied to
the ward, following the approach in Noakes et al [22]. While this method does not yield the same value of
dose that would be delivered to a pathogen released by a patient [23], it is an approach that enables
comparison of design scenarios when the infectious source location is not known. The method is
implemented by treating the UV dose as a cumulative parameter; as air containing microorganisms passes
through the UV field the dose received accumulates depending on the residence time and the irradiance.
Considering equation (1), the rate of increase of dose in the UV field is given by:
)(),(
xEdt
txdD
(2)
Within the CFD model, the accumulation of UV dose is modelled using a non-diffusive passive scalar with
equation (2) implemented as a source term. For a steady state scenario this yields
0)( xEDU (3)
where the first term represents the distribution of dose by the velocity vector field, U and the second term is
the user defined source term. D is set to zero on the air inlet boundaries and accumulates with time depending
on the local value of irradiance and the velocity field. The approach is comparable to calculating the age of
air or residence time where a non-diffusive scalar can be used to calculate the age of a fluid using a source
term of 1.0 s/s throughout a domain [32].
The UV field was based on that emitted from commercially available Lumalier WM236 wall mounted UVGI
units (Lumalier Corporation, Memphis, Tennesse). It was assumed that there were three units in the ward
each one located on either the windward or leeward wall of the ward, depending on the ward zone number.
Each 0.92m wide UV unit has a series of stacked louvers that produce a 0.075m high collimated UV field. A
previous investigation [19] included detailed radiometry measurements of the 3D irradiance field produced
by this particular fixture. This field was then used in conjunction with CFD simulations of airflow in a small
mechanically-ventilated room to predict the dose distribution using equation (3). Although the actual
irradiance field was shown to vary in three dimensions with peak intensity occurring at the mid height of the
collimated UV beam, previous simulations show that the device effectiveness can be accurately simulated
using an equivalent 2D field (i.e. constant in the vertical direction) [19]. The 2D field is significantly easier to
apply in a CFD model as the 3D field requires much greater vertical grid refinement in the vicinity of the
lamps. For this reason the 2D field is employed throughout this investigation, with the planar UV field for
each device stored as a fixed-value data set in the location of interest.
In order to model the effect of a UV device in multiple different locations, only the UV field was simulated
and the physical device geometry was excluded from the model. This meant that multiple simulations could
be run on the same mesh by simply redefining the UV field in a different location. To facilitate defining the
UV field, the upper air region of the ward geometry was separated into single layers of cells, each 0.025m
thick. For a particular device position, the resulting field was stored in three vertically-stacked layers of cells
giving a total band thickness of 0.075m. Above and below this band the UV field is assumed to be zero. This
is shown in Figure 2(a).
Figure 2(b) shows the resulting irradiance field in the horizontal plane with three co-planar fixtures active and
located on the same wall. Taking the geometry of the space into consideration, it is logical to position each of
the three devices above a bed and in between windows so that there is one fixture per zone, as shown in
Figure 2(c). It is assumed that each fixture can be located at a minimum height from the floor of 2.185m up to
a maximum of 2.810m in steps of 0.025m, giving 25 possible vertical positions. The minimum vertical
location is based on the manufacturer recommended minimum mounting height for safety. Furthermore,
each device can be located on either the windward or the leeward wall, extending the number of possible
locations to 50 for each fixture. This can be controlled conveniently within the simulations using a single,
normalized, location parameter, di, for the ith zone. For 0.0 ≤ di < 0.5 the fixture is mounted within the
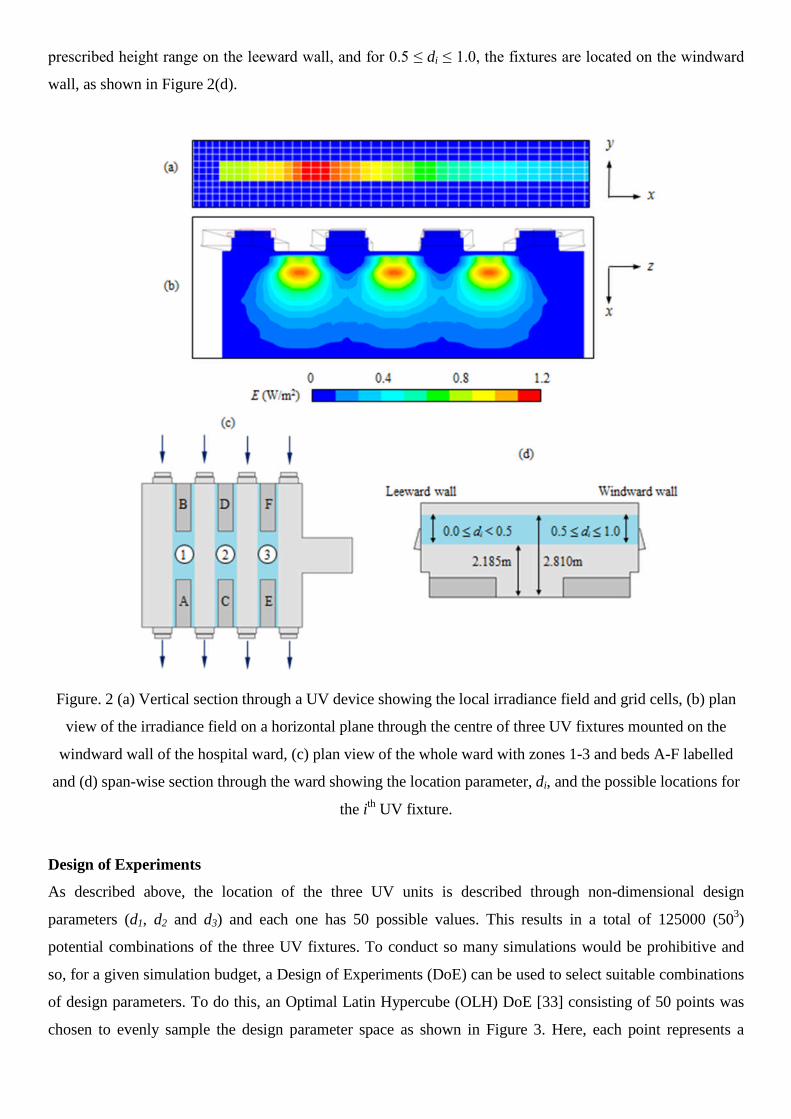
prescribed height range on the leeward wall, and for 0.5 ≤ di ≤ 1.0, the fixtures are located on the windward
wall, as shown in Figure 2(d).
Figure. 2 (a) Vertical section through a UV device showing the local irradiance field and grid cells, (b) plan
view of the irradiance field on a horizontal plane through the centre of three UV fixtures mounted on the
windward wall of the hospital ward, (c) plan view of the whole ward with zones 1-3 and beds A-F labelled
and (d) span-wise section through the ward showing the location parameter, di, and the possible locations for
the ith UV fixture.
Design of Experiments
As described above, the location of the three UV units is described through non-dimensional design
parameters (d1, d2 and d3) and each one has 50 possible values. This results in a total of 125000 (503)
potential combinations of the three UV fixtures. To conduct so many simulations would be prohibitive and
so, for a given simulation budget, a Design of Experiments (DoE) can be used to select suitable combinations
of design parameters. To do this, an Optimal Latin Hypercube (OLH) DoE [33] consisting of 50 points was
chosen to evenly sample the design parameter space as shown in Figure 3. Here, each point represents a
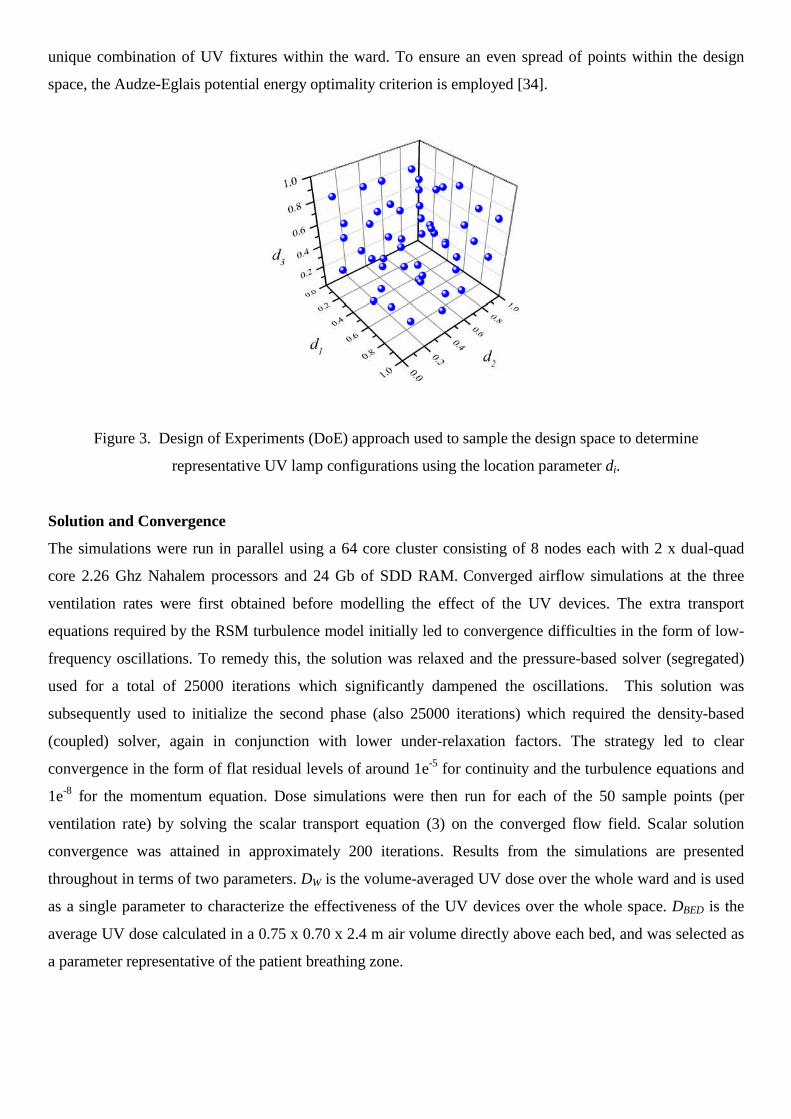
unique combination of UV fixtures within the ward. To ensure an even spread of points within the design
space, the Audze-Eglais potential energy optimality criterion is employed [34].
Figure 3. Design of Experiments (DoE) approach used to sample the design space to determine
representative UV lamp configurations using the location parameter di.
Solution and Convergence
The simulations were run in parallel using a 64 core cluster consisting of 8 nodes each with 2 x dual-quad
core 2.26 Ghz Nahalem processors and 24 Gb of SDD RAM. Converged airflow simulations at the three
ventilation rates were first obtained before modelling the effect of the UV devices. The extra transport
equations required by the RSM turbulence model initially led to convergence difficulties in the form of low-
frequency oscillations. To remedy this, the solution was relaxed and the pressure-based solver (segregated)
used for a total of 25000 iterations which significantly dampened the oscillations. This solution was
subsequently used to initialize the second phase (also 25000 iterations) which required the density-based
(coupled) solver, again in conjunction with lower under-relaxation factors. The strategy led to clear
convergence in the form of flat residual levels of around 1e-5 for continuity and the turbulence equations and
1e-8 for the momentum equation. Dose simulations were then run for each of the 50 sample points (per
ventilation rate) by solving the scalar transport equation (3) on the converged flow field. Scalar solution
convergence was attained in approximately 200 iterations. Results from the simulations are presented
throughout in terms of two parameters. DW is the volume-averaged UV dose over the whole ward and is used
as a single parameter to characterize the effectiveness of the UV devices over the whole space. DBED is the
average UV dose calculated in a 0.75 x 0.70 x 2.4 m air volume directly above each bed, and was selected as
a parameter representative of the patient breathing zone.
Numerical Optimisation
To demonstrate the potential of numerical optimisation, a problem was formulated as a means of determining
the best combination of UV fixture locations for this particular Nightingale ward layout, for the 6ACH results
only. Recent studies have demonstrated the feasibility of optimising indoor ventilation systems using
numerical models [35,36] however, to the authors’ knowledge, optimisation of the operation of passive UVGI
systems has never been done before. Many different forms of numerical optimisation exist but metamodel-
based techniques offer many benefits from an engineering stance [36,37]. As well as identifying the optimum
design for a given system, metamodels also provide engineering insight because they typically require many
data points by assessing multiple design variations. In the present study a moving least squares (MLS) [38,39]
metamodelling approach is adopted because it allows for numerical noise which is prevalent in CFD
responses [37,40,41]. The MLS approach requires CFD solutions (known as response values) for a range of
designs so that an approximation can be built (the metamodel, also known as the response surface) and the
best design found by searching the metamodel using formal numerical optimisation methods. The MLS
differs from most commonly applied metamodelling techniques because it is based on approximations which
allows for errors in the responses [37]. Other popular techniques such as kriging [42] utilize interpolations
which go through the CFD responses and can be prone to ‘over-fitting’ and other undesirable behaviour [37].
In the present study a Gaussian weight decay function, wi, is employed in conjunction with a closeness of fit
parameter, θ, which is given by the following relation:
2exp ii rw (4)
where ri is the Eclidean distance of the metamodel prediction location from the ith point (i.e. each CFD
response value). The metamodel can then be tuned using θ to give the best metamodel for the given
application. This method has been verified in other engineering studies [36,37] and it is suitable for the
present investigation. The purpose of the overall optimisation strategy (shown in Figure 4) is to identify
UVGI fixture configurations which maximises the UV dose in (i) the whole ward (DW) and (ii) in the vicinity
of each bed, DBED. Both DW and DBED are therefore the objective functions which are to be optimized,
namely:
)(max dD (5)
Where D is the dose quantity (i.e. DW or DBED depending on the objective function being optimised) and the
vector d denotes design variables d1, d2 and d3 which are the UVGI fixture location parameters defined in the
earlier section. Note that the convention in numerical optimisation is to minimise objective functions and so
the criteria used was to minimise the reciprocal of DW and DBED respectively, however, for clarity maximising
dose represented by equation (5) and this is the terminology used for the remainder of this paper. Having
defined the optimisation problem, the strategy shown below summarises the approach which consists of the
aforementioned DoE, the CFD responses, the MLS metamodel and the numerical optimization methodology.
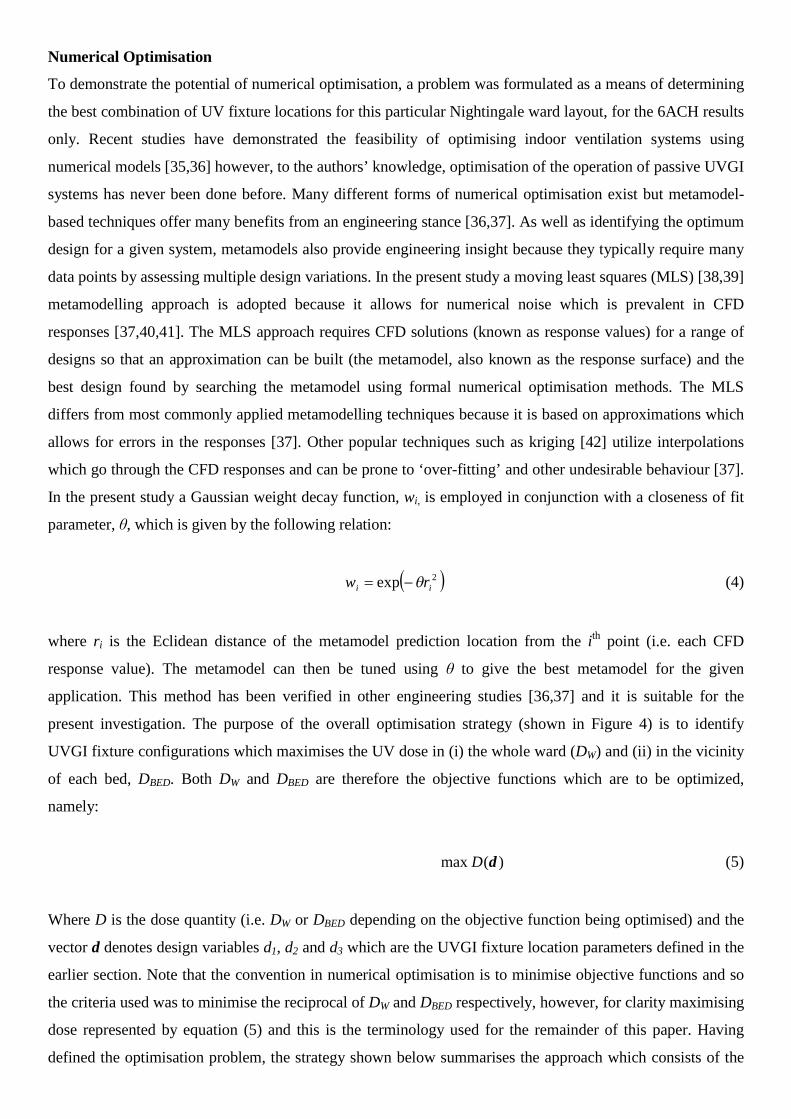
These are summarised in the following list and Figure 4..
1. Obtain DW and DBED from the CFD simulations for each of the 50 UVGI fixture configurations.
2. Construct MLS metamodels (one per objective function) using the dose data.
3. Use a combination of global (Genetic Algorithm, GA) and local (Sequential Quadratic Programming,
SQP) optimisation techniques to search each metamodel for a candidate for the maximum dose.
4. Carry out a further CFD simulation on each candidate and update the metamodel.
5. Continue steps 3 and 4 iteratively until an optimum UVGI fixture configuration is converged upon for
each metamodel.
Figure 4. Flow chart showing the optimization strategy used to find the optimum UVGI fixture
combination for maximising dose in the ward.
Results
Airflow Distribution
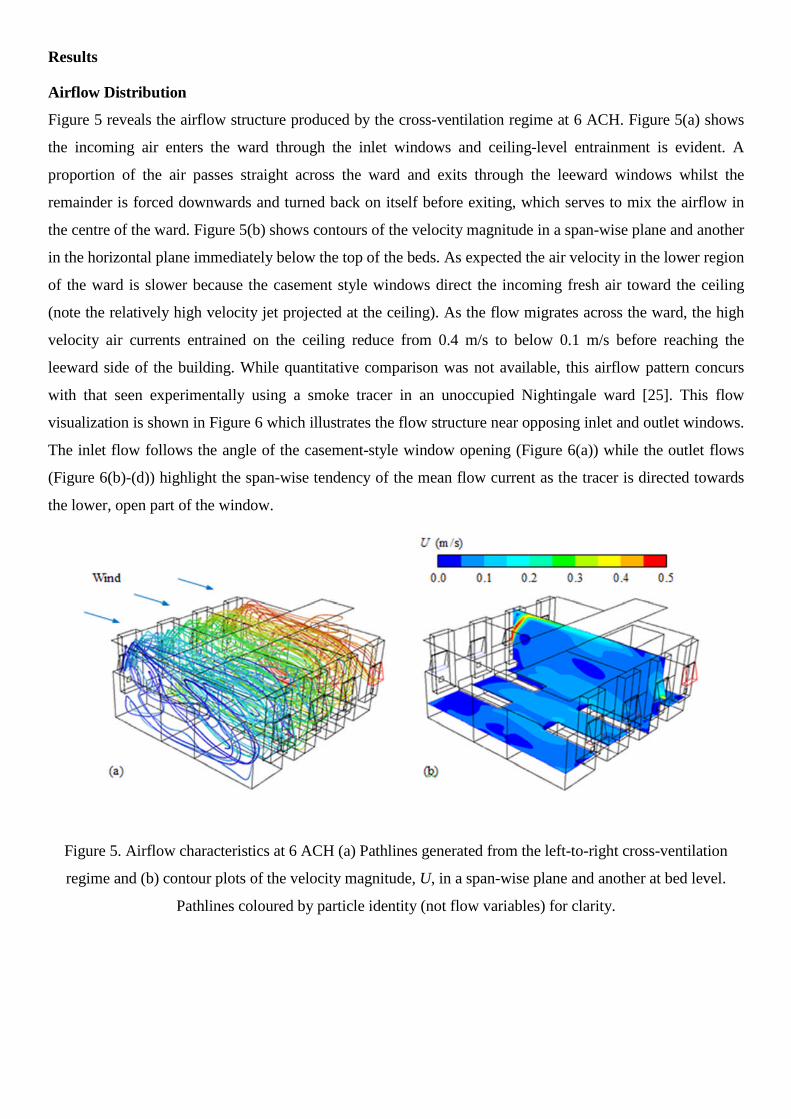
Figure 5 reveals the airflow structure produced by the cross-ventilation regime at 6 ACH. Figure 5(a) shows
the incoming air enters the ward through the inlet windows and ceiling-level entrainment is evident. A
proportion of the air passes straight across the ward and exits through the leeward windows whilst the
remainder is forced downwards and turned back on itself before exiting, which serves to mix the airflow in
the centre of the ward. Figure 5(b) shows contours of the velocity magnitude in a span-wise plane and another
in the horizontal plane immediately below the top of the beds. As expected the air velocity in the lower region
of the ward is slower because the casement style windows direct the incoming fresh air toward the ceiling
(note the relatively high velocity jet projected at the ceiling). As the flow migrates across the ward, the high
velocity air currents entrained on the ceiling reduce from 0.4 m/s to below 0.1 m/s before reaching the
leeward side of the building. While quantitative comparison was not available, this airflow pattern concurs
with that seen experimentally using a smoke tracer in an unoccupied Nightingale ward [25]. This flow
visualization is shown in Figure 6 which illustrates the flow structure near opposing inlet and outlet windows.
The inlet flow follows the angle of the casement-style window opening (Figure 6(a)) while the outlet flows
(Figure 6(b)-(d)) highlight the span-wise tendency of the mean flow current as the tracer is directed towards
the lower, open part of the window.
Figure 5. Airflow characteristics at 6 ACH (a) Pathlines generated from the left-to-right cross-ventilation
regime and (b) contour plots of the velocity magnitude, U, in a span-wise plane and another at bed level.
Pathlines coloured by particle identity (not flow variables) for clarity.
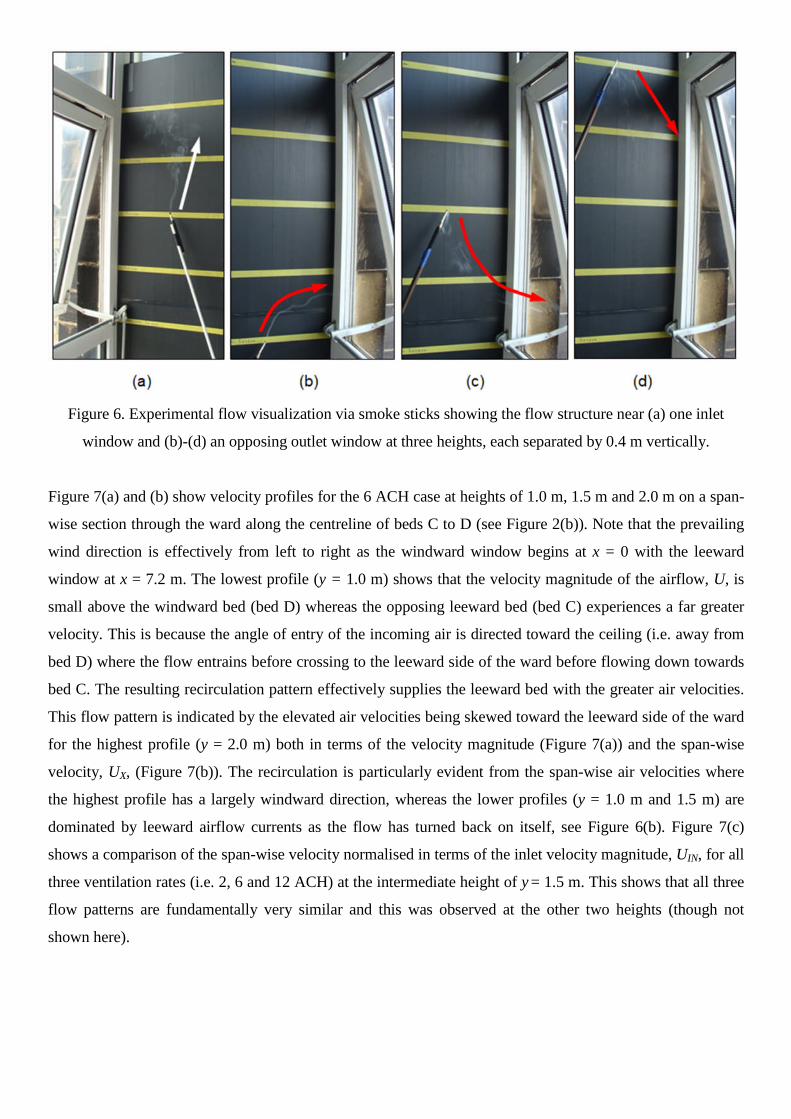
Figure 6. Experimental flow visualization via smoke sticks showing the flow structure near (a) one inlet
window and (b)-(d) an opposing outlet window at three heights, each separated by 0.4 m vertically.
Figure 7(a) and (b) show velocity profiles for the 6 ACH case at heights of 1.0 m, 1.5 m and 2.0 m on a span-
wise section through the ward along the centreline of beds C to D (see Figure 2(b)). Note that the prevailing
wind direction is effectively from left to right as the windward window begins at x = 0 with the leeward
window at x = 7.2 m. The lowest profile (y = 1.0 m) shows that the velocity magnitude of the airflow, U, is
small above the windward bed (bed D) whereas the opposing leeward bed (bed C) experiences a far greater
velocity. This is because the angle of entry of the incoming air is directed toward the ceiling (i.e. away from
bed D) where the flow entrains before crossing to the leeward side of the ward before flowing down towards
bed C. The resulting recirculation pattern effectively supplies the leeward bed with the greater air velocities.
This flow pattern is indicated by the elevated air velocities being skewed toward the leeward side of the ward
for the highest profile (y = 2.0 m) both in terms of the velocity magnitude (Figure 7(a)) and the span-wise
velocity, UX, (Figure 7(b)). The recirculation is particularly evident from the span-wise air velocities where
the highest profile has a largely windward direction, whereas the lower profiles (y = 1.0 m and 1.5 m) are
dominated by leeward airflow currents as the flow has turned back on itself, see Figure 6(b). Figure 7(c)
shows a comparison of the span-wise velocity normalised in terms of the inlet velocity magnitude, UIN, for all
three ventilation rates (i.e. 2, 6 and 12 ACH) at the intermediate height of y = 1.5 m. This shows that all three
flow patterns are fundamentally very similar and this was observed at the other two heights (though not
shown here).
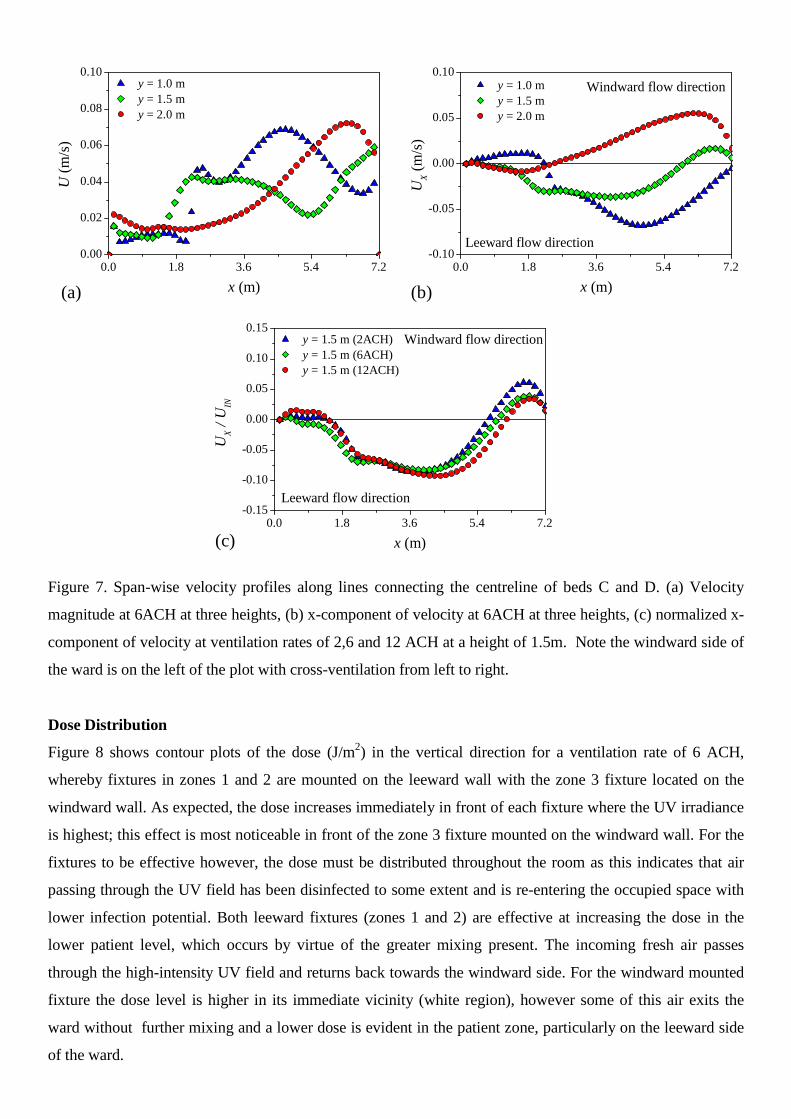
Figure 7. Span-wise velocity profiles along lines connecting the centreline of beds C and D. (a) Velocity
magnitude at 6ACH at three heights, (b) x-component of velocity at 6ACH at three heights, (c) normalized x-
component of velocity at ventilation rates of 2,6 and 12 ACH at a height of 1.5m. Note the windward side of
the ward is on the left of the plot with cross-ventilation from left to right.
Dose Distribution
Figure 8 shows contour plots of the dose (J/m2) in the vertical direction for a ventilation rate of 6 ACH,
whereby fixtures in zones 1 and 2 are mounted on the leeward wall with the zone 3 fixture located on the
windward wall. As expected, the dose increases immediately in front of each fixture where the UV irradiance
is highest; this effect is most noticeable in front of the zone 3 fixture mounted on the windward wall. For the
fixtures to be effective however, the dose must be distributed throughout the room as this indicates that air
passing through the UV field has been disinfected to some extent and is re-entering the occupied space with
lower infection potential. Both leeward fixtures (zones 1 and 2) are effective at increasing the dose in the
lower patient level, which occurs by virtue of the greater mixing present. The incoming fresh air passes
through the high-intensity UV field and returns back towards the windward side. For the windward mounted
fixture the dose level is higher in its immediate vicinity (white region), however some of this air exits the
ward without further mixing and a lower dose is evident in the patient zone, particularly on the leeward side
of the ward.
0.0 1.8 3.6 5.4 7.20.00
0.02
0.04
0.06
0.08
0.10
0.0 1.8 3.6 5.4 7.2-0.10
-0.05
0.00
0.05
0.10
0.0 1.8 3.6 5.4 7.2-0.15
-0.10
-0.05
0.00
0.05
0.10
0.15Windward flow direction
Windward flow directiony = 1.0 m
y = 1.5 m
y = 2.0 m
U(m
/s)
x (m)
Leeward flow direction
Leeward flow direction
y = 1.0 m
y = 1.5 my = 2.0 m
UX
(m/s
)
x (m)
(c)
y = 1.5 m (2ACH)
y = 1.5 m (6ACH)y = 1.5 m (12ACH)
UX
/U
IN
x (m)
(a) (b)

Figure. 8 Contour plot of the dose distribution at 6 ACH resulting from one combination of UV fixtures with
two mounted on the leeward wall (zones 1 and 2) and the remaining one on the windward size (zone 3).
To assess the performance of the UVGI fixtures within the ward, results from the 50 combinations (per
ventilation rate) are compared against each other. As discussed, two parameters are of interest. Firstly the
volume-averaged ward dose, DW, considers how the dose varies as a function of the location parameter per
fixture (i.e. d1, d2 and d3) at a whole ward level. Secondly, DBED, represents the average dose at bed level over
the whole ward and is used to consider the impact of the fixtures at the patient locations. Figure 9 considers
the ward and bed average dose at a ventilation rate of 6 ACH. Each point represents a particular set of fixture
combinations and the same data is presented in three separate plots to explore the influence of each fixture
location. In all cases the three UV devices are treated as a system to treat the whole ward and the focus is on
influence of positioning on the system level performance; as dose is a parameter that is transported by the
airflow it cannot be assumed that the dose in a particular zone is only influenced by the lamp in that zone.
The three fixtures lead to a ward level dose in the range DW = 1.04 J/m2 to DW = 1.63 J/m2, while bed level
dose is more variable with a range DBED = 0.97 J/m2 to DBED = 1.93 J/m2. Whilst there is a good deal of
scatter in the data the results do suggest that some fixture positions lead to better results than others. For the
leeward fixture positions (0.0 ≤ di < 0.5), the dose is generally higher when the fixture is mounted at the
lower end of the prescribed height range (i.e. di is close to 0.0). This trend is particularly noticeable in zone 2
where the dose decreases with increasing fixture height; at the ward and bed level the lowest doses occur with
the zone 2 leeward fixture mounted high, see Figure 9(c). For the windward fixtures (0.5 ≤ di ≤ 1.0) there is
no clear relationship with fixture location and significant scatter in the data is evident in these cases, Figures
9(b), (d) and (f).

Figure. 9 Relationship between the UV fixture position parameters (d1, d2 and d3) and the ward-averaged
(DW) and bed-average (DBED) dose in the ward, at a ventilation rate of 6 ACH.
Figure 10 shows bed-level dose values only, for the three fixture zones at ventilation rates of 2 and 12 ACH.
As expected, dose values at 2 ACH are higher (2.35 J/m2 <DBED < 6.13 J/m2) than those seen at 6 ACH, while
dose values at 12 ACH are lower (0.47 J/m2 <DBED < 0.99 J/m2). In both cases there is a noticeable
dependence on the location of the central fixture position, d2, which is extremely prominent in the results at 2
ACH, see Figure 10(c). Here the dose values seen with the central fixture located in a leeward position are
substantially lower with a marked decrease with increasing height compared to location on the windward side
of the ward. This trend highlights the importance of the position of the central fixture which is apparent at all
three air change rates and suggests that this fixture may be the most sensitive to airflow patterns within the
ward.
0.0 0.2 0.4 0.6 0.8 1.0
0.0
0.4
0.8
1.2
1.6
2.0
0.0 0.2 0.4 0.6 0.8 1.0
0.0
0.4
0.8
1.2
1.6
2.0
0.0 0.2 0.4 0.6 0.8 1.0
0.0
0.4
0.8
1.2
1.6
2.0
0.0 0.2 0.4 0.6 0.8 1.0
0.0
0.4
0.8
1.2
1.6
2.0
0.0 0.2 0.4 0.6 0.8 1.0
0.0
0.4
0.8
1.2
1.6
2.0
0.0 0.2 0.4 0.6 0.8 1.0
0.0
0.4
0.8
1.2
1.6
2.0
Leeward fixtures Windward fixtures
DW
d1
Leeward fixtures Windward fixtures
Leeward fixtures Windward fixtures Leeward fixtures Windward fixtures
Leeward fixtures Windward fixtures Leeward fixtures Windward fixtures
DB
ED
d1
DW
d2
DW
d3
DB
ED
d2
(e) (f)
(c) (d)
DB
ED
d3
(a) (b)
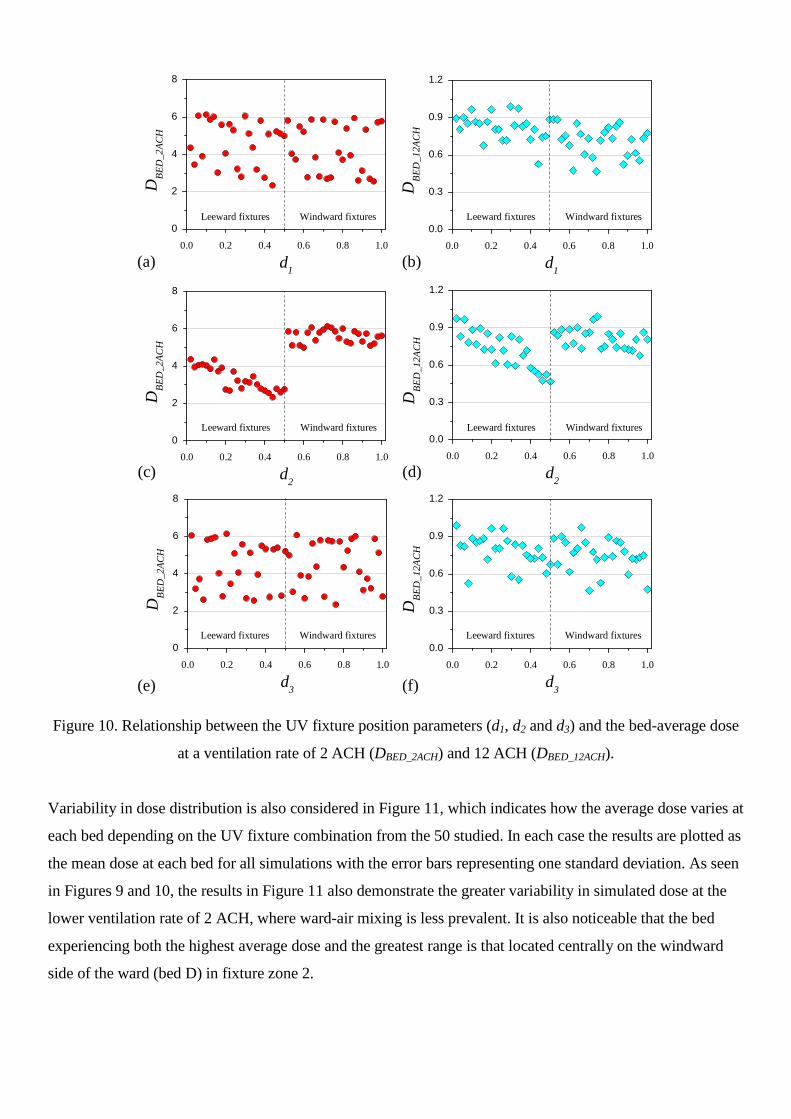
Figure 10. Relationship between the UV fixture position parameters (d1, d2 and d3) and the bed-average dose
at a ventilation rate of 2 ACH (DBED_2ACH) and 12 ACH (DBED_12ACH).
Variability in dose distribution is also considered in Figure 11, which indicates how the average dose varies at
each bed depending on the UV fixture combination from the 50 studied. In each case the results are plotted as
the mean dose at each bed for all simulations with the error bars representing one standard deviation. As seen
in Figures 9 and 10, the results in Figure 11 also demonstrate the greater variability in simulated dose at the
lower ventilation rate of 2 ACH, where ward-air mixing is less prevalent. It is also noticeable that the bed
experiencing both the highest average dose and the greatest range is that located centrally on the windward
side of the ward (bed D) in fixture zone 2.
0.0 0.2 0.4 0.6 0.8 1.0
0
2
4
6
8
0.0 0.2 0.4 0.6 0.8 1.0
0.0
0.3
0.6
0.9
1.2
0.0 0.2 0.4 0.6 0.8 1.0
0
2
4
6
8
0.0 0.2 0.4 0.6 0.8 1.0
0
2
4
6
8
0.0 0.2 0.4 0.6 0.8 1.0
0.0
0.3
0.6
0.9
1.2
0.0 0.2 0.4 0.6 0.8 1.0
0.0
0.3
0.6
0.9
1.2
Leeward fixtures Windward fixtures
DB
ED
_2A
CH
d1
Leeward fixtures Windward fixtures
Leeward fixtures Windward fixtures Leeward fixtures Windward fixtures
Leeward fixtures Windward fixtures Leeward fixtures Windward fixtures
DB
ED
_12A
CH
d1
DB
ED
_2A
CH
d2
DB
ED
_2A
CH
d3
DB
ED
_12A
CH
d2
(e) (f)
(c) (d)
DB
ED
_12A
CH
d3
(a) (b)

Figure 11. Variability in local bed dose at a ventilation rate of 2 and 6 ACH
Optimisation results
While the results in Figures 9 and 10 demonstrate the potential dose range achievable under different
ventilation rates, it is difficult to draw firm conclusions about the best combination of fixture locations. In
order to explore this further, the numerical optimisation strategy discussed in section 2.6 was applied to the
data set at 6 ACH, using the commercial optimisation package Hyperstudy (version 11). Initial metamodels
of (i) the ward dose, DW, and (ii) the bed-average dose, DBED were constructed using the data from each of the
50 UVGI fixture combinations. Global optimisation on the metamodels was done using a genetic algorithm
(GA) followed by local optimisation via the sequential quadratic programming (SQP) technique, the latter
ensuring that the optimum had been located by the GA on the metamodel. A candidate for maximum dose
was identified for each metamodel and the corresponding UVGI fixture layouts assessed with new CFD
simulations. Metamodel rebuilding with the additional CFD responses for dose did not yield an optimum
result in the first iteration. The process was repeated (as per steps 3 and 4 in section 2.6) until optimum results
were found for both objective functions (i.e. DW and DBED). In total this required a further 12 CFD
simulations and the results are shown in Figure 12. It should be noted that 50 initial designs were used via the
DoE to train the initial metamodel prior to optimization. This number is a practical balance between having
sufficient data without requiring a prohibitively large number of simulations. Given that there are three design
variables, d, the total number of initial simulations run was 16.7d which corresponds to another recent design
optimization study [37] This number is significantly more than the general recommendation of 10d suggested
by Loeppky et al [43].
0
2
4
6
8
10
Bed Location
DB
ED
(J/m
2)
6 ACH
2 ACH
A B C D E F
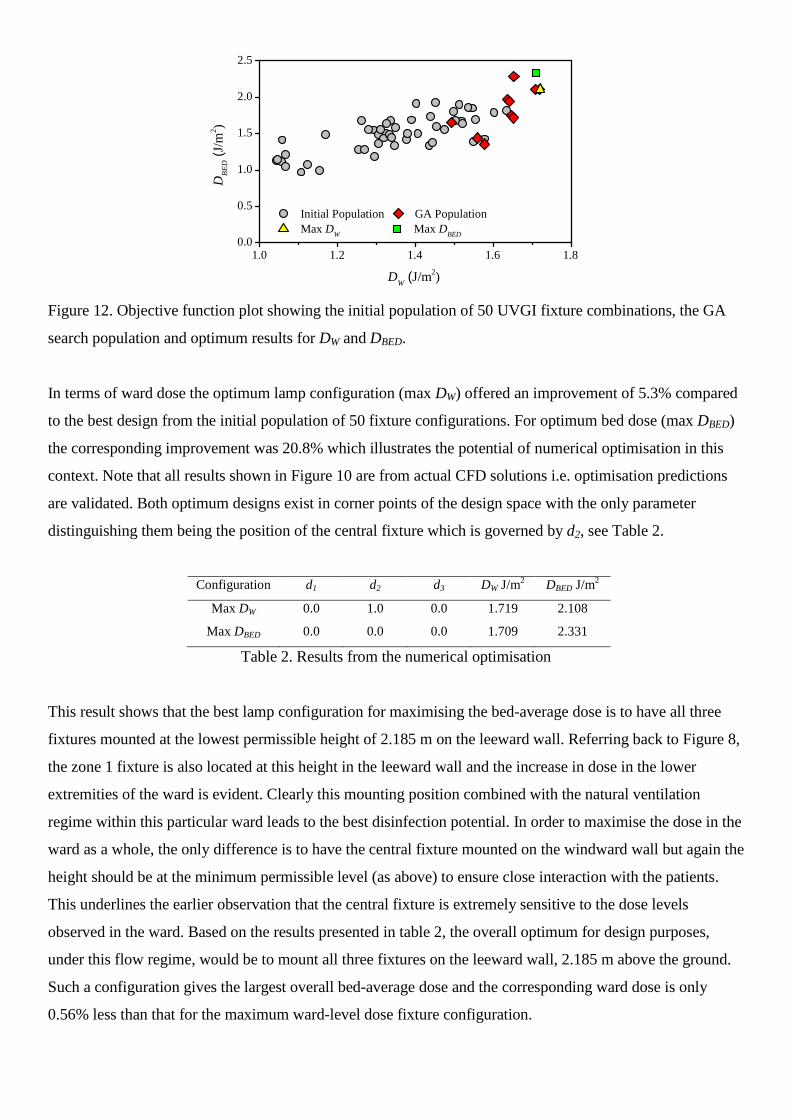
Figure 12. Objective function plot showing the initial population of 50 UVGI fixture combinations, the GA
search population and optimum results for DW and DBED.
In terms of ward dose the optimum lamp configuration (max DW) offered an improvement of 5.3% compared
to the best design from the initial population of 50 fixture configurations. For optimum bed dose (max DBED)
the corresponding improvement was 20.8% which illustrates the potential of numerical optimisation in this
context. Note that all results shown in Figure 10 are from actual CFD solutions i.e. optimisation predictions
are validated. Both optimum designs exist in corner points of the design space with the only parameter
distinguishing them being the position of the central fixture which is governed by d2, see Table 2.
Configuration d1 d2 d3 DW J/m2 DBED J/m2
Max DW 0.0 1.0 0.0 1.719 2.108
Max DBED 0.0 0.0 0.0 1.709 2.331
Table 2. Results from the numerical optimisation
This result shows that the best lamp configuration for maximising the bed-average dose is to have all three
fixtures mounted at the lowest permissible height of 2.185 m on the leeward wall. Referring back to Figure 8,
the zone 1 fixture is also located at this height in the leeward wall and the increase in dose in the lower
extremities of the ward is evident. Clearly this mounting position combined with the natural ventilation
regime within this particular ward leads to the best disinfection potential. In order to maximise the dose in the
ward as a whole, the only difference is to have the central fixture mounted on the windward wall but again the
height should be at the minimum permissible level (as above) to ensure close interaction with the patients.
This underlines the earlier observation that the central fixture is extremely sensitive to the dose levels
observed in the ward. Based on the results presented in table 2, the overall optimum for design purposes,
under this flow regime, would be to mount all three fixtures on the leeward wall, 2.185 m above the ground.
Such a configuration gives the largest overall bed-average dose and the corresponding ward dose is only
0.56% less than that for the maximum ward-level dose fixture configuration.
1.0 1.2 1.4 1.6 1.80.0
0.5
1.0
1.5
2.0
2.5
DB
ED
(J/m
2)
Initial Population GA Population
Max DW
Max DBED
DW
(J/m2)
Thermal Effects
While the results above illustrate that the UV dose and airflow interaction can be modelled and an
optimization approach applied, the airflows are based on a previous experimental scenario and do not include
heat sources. To gain an initial understanding of the influence of heat sources on the flow, additional
simulations were conducted at 2 and 12 ACH with a constant temperature of 35 degrees C applied on the
surface of each of the patient beds to represent the patient heat load. Simulations were conducted for the
optimum configuration determined, i.e. all UV fixtures on the leeward wall at the minimum permissible level.
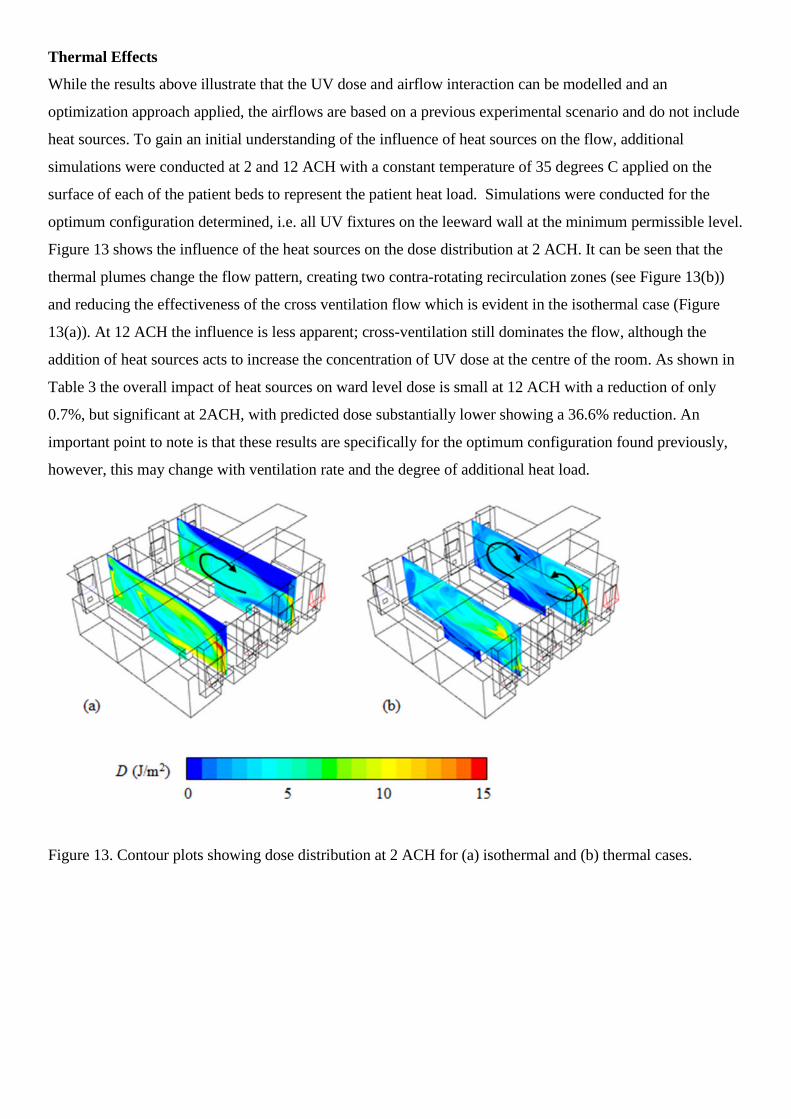
Figure 13 shows the influence of the heat sources on the dose distribution at 2 ACH. It can be seen that the
thermal plumes change the flow pattern, creating two contra-rotating recirculation zones (see Figure 13(b))
and reducing the effectiveness of the cross ventilation flow which is evident in the isothermal case (Figure
13(a)). At 12 ACH the influence is less apparent; cross-ventilation still dominates the flow, although the
addition of heat sources acts to increase the concentration of UV dose at the centre of the room. As shown in
Table 3 the overall impact of heat sources on ward level dose is small at 12 ACH with a reduction of only
0.7%, but significant at 2ACH, with predicted dose substantially lower showing a 36.6% reduction. An
important point to note is that these results are specifically for the optimum configuration found previously,
however, this may change with ventilation rate and the degree of additional heat load.
Figure 13. Contour plots showing dose distribution at 2 ACH for (a) isothermal and (b) thermal cases.
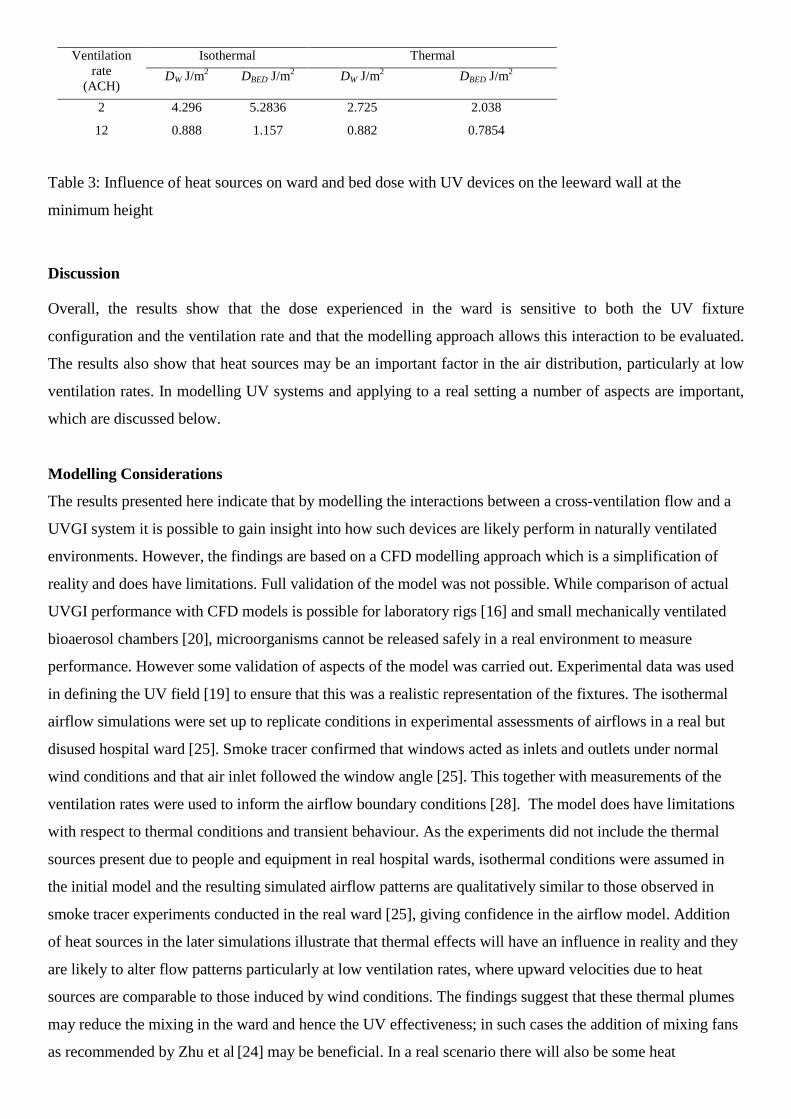
Ventilationrate
(ACH)
Isothermal Thermal
DW J/m2 DBED J/m2 DW J/m2 DBED J/m2
2 4.296 5.2836 2.725 2.038
12 0.888 1.157 0.882 0.7854
Table 3: Influence of heat sources on ward and bed dose with UV devices on the leeward wall at the
minimum height
Discussion
Overall, the results show that the dose experienced in the ward is sensitive to both the UV fixture
configuration and the ventilation rate and that the modelling approach allows this interaction to be evaluated.
The results also show that heat sources may be an important factor in the air distribution, particularly at low
ventilation rates. In modelling UV systems and applying to a real setting a number of aspects are important,
which are discussed below.
Modelling Considerations
The results presented here indicate that by modelling the interactions between a cross-ventilation flow and a
UVGI system it is possible to gain insight into how such devices are likely perform in naturally ventilated
environments. However, the findings are based on a CFD modelling approach which is a simplification of
reality and does have limitations. Full validation of the model was not possible. While comparison of actual
UVGI performance with CFD models is possible for laboratory rigs [16] and small mechanically ventilated
bioaerosol chambers [20], microorganisms cannot be released safely in a real environment to measure
performance. However some validation of aspects of the model was carried out. Experimental data was used
in defining the UV field [19] to ensure that this was a realistic representation of the fixtures. The isothermal
airflow simulations were set up to replicate conditions in experimental assessments of airflows in a real but
disused hospital ward [25]. Smoke tracer confirmed that windows acted as inlets and outlets under normal
wind conditions and that air inlet followed the window angle [25]. This together with measurements of the
ventilation rates were used to inform the airflow boundary conditions [28]. The model does have limitations
with respect to thermal conditions and transient behaviour. As the experiments did not include the thermal
sources present due to people and equipment in real hospital wards, isothermal conditions were assumed in
the initial model and the resulting simulated airflow patterns are qualitatively similar to those observed in
smoke tracer experiments conducted in the real ward [25], giving confidence in the airflow model. Addition
of heat sources in the later simulations illustrate that thermal effects will have an influence in reality and they
are likely to alter flow patterns particularly at low ventilation rates, where upward velocities due to heat
sources are comparable to those induced by wind conditions. The findings suggest that these thermal plumes
may reduce the mixing in the ward and hence the UV effectiveness; in such cases the addition of mixing fans
as recommended by Zhu et al [24] may be beneficial. In a real scenario there will also be some heat
generation due to the UV devices, which will also have an impact on the flow. However this is likely to be
small compared to the thermal effects of people and heating systems. The simulations are based on Lumalier
fixtures with a manufacturer stated electrical power consumption of 72W and a UV output of 24W. The
difference between these two values (48W) will be emitted as heat and visible light, and as such the heat
generation is comparable to many conventional visible light fixtures. Similarly movement of people in a real
environment will also alter the flow patterns. Simulating this realistically in a CFD study presents a
significant challenge, however it is possible that movement will lead to increased air mixing in the ward,
which has been shown to be beneficial for the performance of upper room UV [24]. The results also only
apply to steady state cross ventilation wind conditions. In naturally ventilated spaces the flow patterns seen in
reality are driven by the fluctuating external conditions and can be very different from one moment to the
next.
In addition to the airflow modelling, the study demonstrates that numerical optimisation can be used to
determine the best UVGI fixture combination. As the fixture parameter design space is three dimensional
(Figure 3) it is not possible to view how these influence the objective functions in one single plot. Figures 9-
11 were useful in identifying trends, however, the use of metamodels was essential in determining optimum
fixture combinations. Both objective functions were optimised with an additional 12 UVGI fixture
assessments required to achieve this. The results are perfectly logical which demonstrates that the metamodel-
based optimization employed successfully captured the flow physics; this is a direct result of the initial
population of fifty UVGI fixture assessments which effectively trained the metamodel. Although the
optimum results are logical and sensible, this was not apparent from the outset and this highlights the
potential for numerical optimisation to aid hospital ward design.
Infection Control Implications
The CFD study carried out here focused on modelling the dose distribution, a parameter that depends on
physical attributes (the UV field and the airflow patterns) but has no dependence on any infectious agents
present. The dose required to inactivate a given microorganism depends on its susceptibility, which in turn
depends on species, strain and environmental factors such the temperature and humidity [14,15]. The
relationship between airborne microorganism concentration, C(t) and UV dose can be represented using an
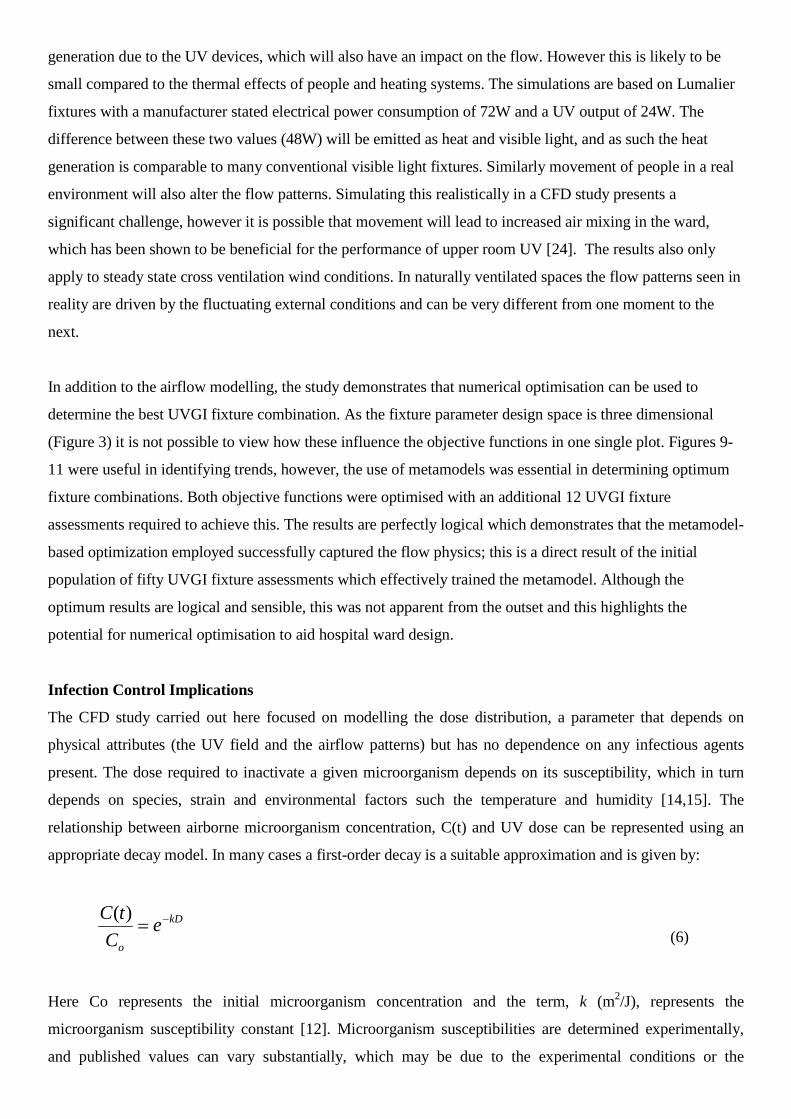
appropriate decay model. In many cases a first-order decay is a suitable approximation and is given by:
kD
o
eC
tC )(
(6)
Here Co represents the initial microorganism concentration and the term, k (m2/J), represents the
microorganism susceptibility constant [12]. Microorganism susceptibilities are determined experimentally,
and published values can vary substantially, which may be due to the experimental conditions or the
particular strain of microorganism used. However, such values are necessary to determine the potential risk
reduction that may be achieved through installation of UVGI devices.
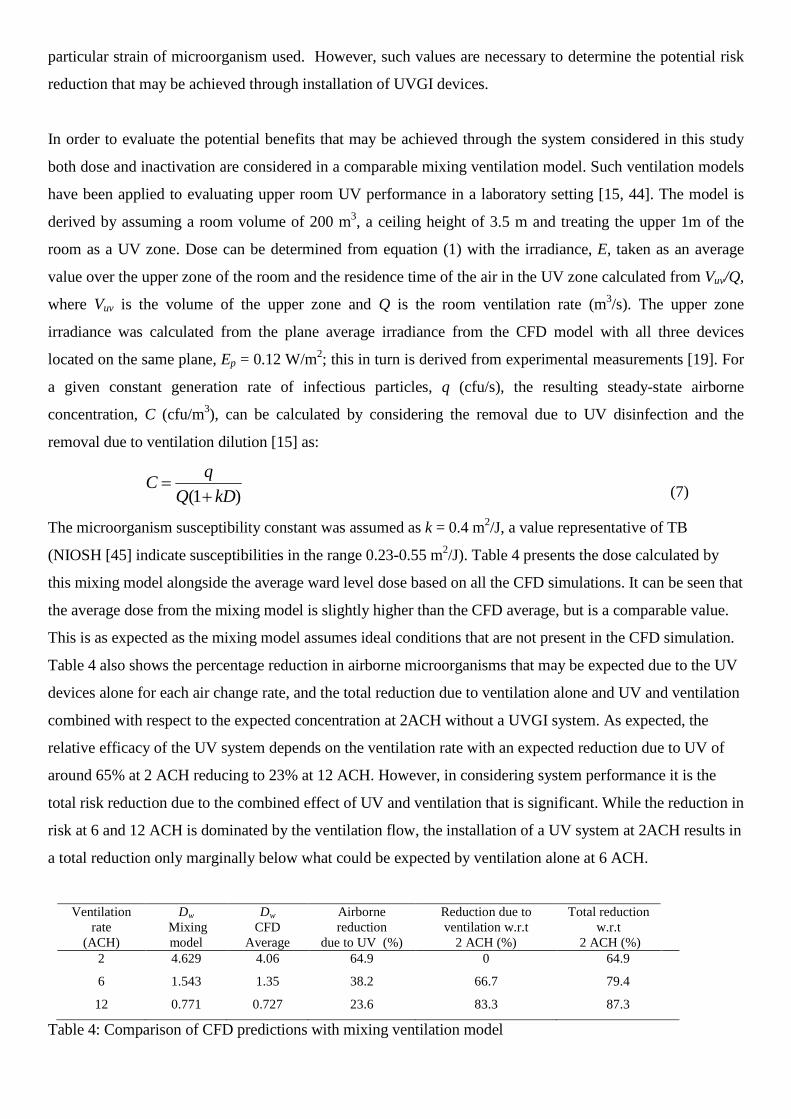
In order to evaluate the potential benefits that may be achieved through the system considered in this study
both dose and inactivation are considered in a comparable mixing ventilation model. Such ventilation models
have been applied to evaluating upper room UV performance in a laboratory setting [15, 44]. The model is
derived by assuming a room volume of 200 m3, a ceiling height of 3.5 m and treating the upper 1m of the
room as a UV zone. Dose can be determined from equation (1) with the irradiance, E, taken as an average
value over the upper zone of the room and the residence time of the air in the UV zone calculated from Vuv/Q,
where Vuv is the volume of the upper zone and Q is the room ventilation rate (m3/s). The upper zone
irradiance was calculated from the plane average irradiance from the CFD model with all three devices
located on the same plane, Ep = 0.12 W/m2; this in turn is derived from experimental measurements [19]. For
a given constant generation rate of infectious particles, q (cfu/s), the resulting steady-state airborne
concentration, C (cfu/m3), can be calculated by considering the removal due to UV disinfection and the
removal due to ventilation dilution [15] as:
)1( kDQ
qC
(7)
The microorganism susceptibility constant was assumed as k = 0.4 m2/J, a value representative of TB
(NIOSH [45] indicate susceptibilities in the range 0.23-0.55 m2/J). Table 4 presents the dose calculated by
this mixing model alongside the average ward level dose based on all the CFD simulations. It can be seen that
the average dose from the mixing model is slightly higher than the CFD average, but is a comparable value.
This is as expected as the mixing model assumes ideal conditions that are not present in the CFD simulation.
Table 4 also shows the percentage reduction in airborne microorganisms that may be expected due to the UV
devices alone for each air change rate, and the total reduction due to ventilation alone and UV and ventilation
combined with respect to the expected concentration at 2ACH without a UVGI system. As expected, the
relative efficacy of the UV system depends on the ventilation rate with an expected reduction due to UV of
around 65% at 2 ACH reducing to 23% at 12 ACH. However, in considering system performance it is the
total risk reduction due to the combined effect of UV and ventilation that is significant. While the reduction in
risk at 6 and 12 ACH is dominated by the ventilation flow, the installation of a UV system at 2ACH results in
a total reduction only marginally below what could be expected by ventilation alone at 6 ACH.
Ventilationrate
(ACH)
Dw
Mixingmodel
Dw
CFDAverage
Airbornereduction
due to UV (%)
Reduction due toventilation w.r.t
2 ACH (%)
Total reductionw.r.t
2 ACH (%)2 4.629 4.06 64.9 0 64.9
6 1.543 1.35 38.2 66.7 79.4
12 0.771 0.727 23.6 83.3 87.3
Table 4: Comparison of CFD predictions with mixing ventilation model
Design Issues
The study presented here considered installation of three wall mounted devices in a relatively large space.
The model was constrained by practical aspects to some extent in that we identified six realistic wall locations
where fixtures could be mounted. Although the results indicate that the best configurations tend to be
achieved with the fixtures mounted at the lowest mounting height, the practical and safety aspects to this
would have to be considered in any design; the irradiance field produced by UVGI fixtures is harmful to the
occupants if they are directly exposed. Manufacturers generally recommend minimum mounting heights of at
least 2m to overcome safety issues and hence in reality fixtures may have to be mounted higher to overcome
any risks. The results also focused on two parameters, the overall average dose DW and the dose in patient
zones DBED. While the results were largely consistent between these two parameters suggesting they are
representative of effectiveness, there are other parameters that may be of more relevance in some cases. For
example, if a UV installation is design to protect healthcare workers from patients with respiratory infections
basing design decisions on the maximum dose at healthcare worker breathing height may be a more
appropriate measure.
The results presented will of course depend on the particular pathogen concerned and other factors such as the
location of the source and susceptible patients, however they do suggest that upper-room UV could be
beneficial in naturally ventilated wards. In particular there could be good benefits from operating a UVGI
system when the conditions are such that the wind-driven ventilation rate is low, providing there is a
sufficient level of mixing in the ward. It is also worth commenting that the installed planar UV field in this
model (around 0.12 W/m2) is below that recommended by NIOSH [45] who suggest a plane average
irradiance of 0.3-0.5 W/m2. Increasing the fixture output to achieve this level would further increase any
benefits; this could be achieved through installing extra fixtures or fixtures with a higher output.
Installation of a UVGI system may also be an energy efficient solution to improving infection control,
particularly in climates where increased ventilation may lead to high heat losses or gains. As shown in Table
2, at low ventilation rates installation of a UV system may be able to produce an improvement in microbial
air quality comparable to doubling or tripling the ventilation rate. Energy data on UV systems is limited, but a
small number of studies have carried out calculations to explore benefits. Ko et al [8] consider the
effectiveness of UV against TB transmission in a waiting room and calculate that UV may be less expensive
than increased ventilation by between 3 and 13 times [46]. We recently conducted a modelling study [9] that
suggested that installation of UV can achieve reductions in airborne risk comparable to or better than
increasing the ventilation rate from 3 to 6 ACH at 11-55% of the energy cost, depending on the scenario.
These studies suggest that the energy requirement may well be considerably lower than increasing ventilation
rates.

Conclusions
A numerical study of natural cross-ventilation applied to a six-bed Nightingale ward was conducted. A series
of simulations were carried out to investigate how the placement of upper-room UV disinfection fixtures
influences the air disinfection potential. Results show that both the fixture height and choice of wall to mount
each one have a marked effect on the performance under isothermal conditions. While all installations will be
beneficial, mounting the fixtures at low levels on the leeward side of the ward appears to yield the best
coverage as it allows for close interaction between patients and disinfected air currents which emanate from
the front of the UVGI fixtures. However, the results are specific to the ward layout and the ventilation rate
and regime studied. In particular, initial simulations carried out with patient heat sources included indicate
that thermal effects may be significant at low ventilation rates, reducing mixing and hence UV effectiveness.
This influence will be case specific, depending on the ventilation flow and location of heat sources in a
particular environment. Application of the numerical optimisation approach at 6 ACH is successful and
demonstrates how this approach can be used for selection of the best design location for the UV devices.
Work is on-going to apply numerical optimisation to a range of ventilation rates to identify optimum design
configurations which are effective across a range of conditions.
Acknowledgments
The authors would like to thank the UK Engineering and Physical Sciences Research Council (EPSRC) for
funding this research and to the estates staff of Bradford NHS Foundation Trust for their collaboration.
Dr C.J. Noakes was the lead investigator, Dr C.A. Gilkeson conducted the CFD modelling and analysis of
results, Dr M.A.I Khan contributed to the optimization study, all authors contributed to the preparation of the
manuscript. The authors have no conflicts of interest to declare.
References
1. Eames I, Tang JW, Li Y and Wilson P. Airborne transmission of disease in hospitals. Journal of the
Royal Society Interface 2009; 6: S697-S702.
2. Nielsen PV. Control of airborne infectious diseases. Journal of the Royal Society Interface 2009; 6:
S747-S755.
3. Gustafson TL, Lavely GB, Brawner ER Jr, Hutcheson RH Jr, Wright PF and Schaffner W. An
Outbreak of Airborne Nosocomial Varicella. Pediatrics 1982;70;550-556
4. Kumari DNP, Haji TC, Keer V, Hawkey PM, Duncanson V and Flower E. Ventilation grilles as a
potential source of methicillin-resistant Staphylococcus aureus causing an outbreak in an orthopaedic
ward at a district general hospital. Journal of Hospital Infection 1998; 39: 127-133
5. Qian H, Li YG, Nielsen PV and Huang XH. Spatial distribution of infection risk of SARS
transmission in a hospital ward. Building and Environment 2009; 44:1651-1658
6. HTM 03-01. Heating and ventilation systems, Health Technical Memorandum: 03-01: Specialised
ventilation for healthcare premises. Department of Health, Leeds, UK, 2007.
7. NHS Sustainable Development Unit. Saving Carbon, Improving Health. NHS Carbon Reduction
Strategy for England, Cambridge, 2009
8. Ko G, Burge HA, Nardell EA and Thompson KM. Estimation of Tuberculosis Risk and Incidence
under Upper Room Ultraviolet Germicidal Irradiation in a Waiting Room in a Hypothetical Scenario.
Risk Analysis 2001; 21(4): 657-673
9. Noakes CJ, Khan A, Gilkeson CA. Optimizing Upper-Room UVGI Systems for Infection Risk and
Energy. In ASHRAE IAQ 2013: Environmental Health in Low Energy Buildings, the proceedings of
17th ASHRAE IAQ Conference, Vancouver, 15-18th October 2013; Paper 53, 385-394
10. Sharp G. The Effects of Ultraviolet Light on Bacteria Suspended in Air. Journal of Bacteriology
1940; 38: 535-547.
11. Sommer HE and Stokes J. Studies on Air-Borne Infection in a Hospital Ward: I. The Effect of
Ultraviolet Light on Cross-Infection in an Infants Ward. The Journal of Pediatrics 1942; 21(5): 569-
576.
12. Kowalski W. Ultraviolet Germicidal Irradiation Handbook. Springer, Heidelberg, 2009. ISBN 978-3-
642-01998-2.
13. Riley RL and Permutt S. Room air disinfection by ultraviolet irradiation of upper air. Archives of
Environmental Health 1971; 22: 208-219.
14. Peccia J, Werth HM, Miller SL and Hernandez MT. Effects of relative humidity on the ultraviolet
induced inactivation of airborne bacteria. Aerosol Science and Technology 2001; 35: 728-740.
15. Xu PJ, Peccia J, Fabian P, Martyny JW, Fennelly KP, Hernandez M and Miller SL. Efficacy of
ultraviolet germicidal irradiation of upper-room air in inactivating airborne bacterial spores and
mycobacteria in full-scale studies. Atmospheric Environment 2003; 37: 405-419.
16. Noakes CJ, Fletcher LA, Beggs CB, Sleigh PA, and Kerr KG. Development of a numerical Model to
Simulate the Biological Inactivation of Airborne Microorganisms in the Presence of Ultraviolet
Light. Journal of Aerosol Science 2004; 35: 489-507.
17. Escombe AR, Moore DAJ, Gilman RH, Navincopa M, Ticona E, Mitchell B, Noakes CJ, Martínez
C, Sheen P, Ramirez R, QuinoW, Gonzalez A, Friedland JS and Evans CA. Upper-room ultraviolet
light and negative air ionization to prevent tuberculosis transmission, PLOS medicine 2009; 6(3):
e1000043
18. Sung M and Kato S. Estimating the germicidal effect of upper-room UVGI system on exhaled air of
patients based on ventilation efficiency. Building and Environment 2011; 46: 2326-2332.
19. Gilkeson CA and Noakes CJ. Application of CFD Simulation to Predicting Upper-Room UVGI
Effectiveness. Photochemistry and Photobiology 2013; 89(4):799-810
20. Noakes CJ, Beggs CB and Sleigh PA. Modelling the Performance of Upper Room Ultraviolet
Germicidal Irradiation Devices in Ventilated Rooms: Comparison of Analytical and CFD Methods.
Indoor and Built Environment 2004; 13(6): 477-488

21. Alani A, Barton IE, Seymour MJ and Wrobel LC. Application of Lagrangian particle transport
model to tuberculosis TB bacteria UV dosing in a ventilated isolation room. International Journal of
Environmental Health Research 2001; 11: 219-228.
22. Noakes CJ, Sleigh PA, Fletcher LA and Beggs CB. Use of CFD Modelling to Optimise the Design of
Upper-Room UVGI Disinfection Systems for Ventilated Rooms. Indoor and Built Environment.
2006; 15(4): 347-356.
23. Sung M and Kato S. Method to Evaluate UV Dose of Upper-Room UVGI System Using the Concept
of Ventilation Efficiency. Building and Environment 2010; 45: 1626-1631.
24. Zhu S, Srebric J, Rudnick SN, Vincent RL and Nardell EA. Numerical Investigation of Upper-
Room UVGI Disinfection Efficacy in an Environmental Chamber with a Ceiling Fan.
Photochemistry and Photobiology 2013; 89(4):782–791
25. Gilkeson CA, Camargo-Valero MA, Pickin LE, Noakes CJ Measurement of Ventilation and
Airborne Infection Risk in Large Naturally Ventilated Hospital Wards. Building and Environment
2013; 65:35-48
26. Escombe, AR, Oeser CC, Gilman RH, Navincopa M, Ticona E, Pan W, Martinez C, Chacaltana J,
Rodrigues R, Moore DAJ, Friedland JS, Evans CA. Natural ventilation for the prevention of airborne
contagion. Plos Medicine 2007;4(2):309-317.
27. Qian H, Li Y, Seto WH, Ching P, Ching WH, Sun HG. Natural ventilation for reducing airborne
infection in hospitals. Building and Environment 2010;45(3):559-565.
28. Gilkeson CA, Noakes CJ, Sleigh PA, Khan MAI and Camargo-Valero MA. Simulating pathogen
transport within a naturally ventilated hospital ward. World Academy of Science, Engineering and
Technology 2011;79: 119-125.
29. Roache PJ. Perspective: A Method for Uniform Reporting of Grid Refinement Studies. Journal of
Fluids Engineering 1994; 116:405-413.
30. Launder BE, Reece GJ and Rodi W. Progress in the Development of a Reynolds-Stress Turbulence
Closure. Journal of Fluid Mechanics 1975; 68(3): 537-566.
31. King M-F, Noakes CJ, Sleigh PA, Camargo-Valero MA Bioaerosol deposition in single and two-bed
hospital rooms: A numerical and experimental study. Building and Environment 2013; 59:436-447
32. Wright NG, Hargreaves DM. The use of CFD in the evaluation of UV treatment systems. Journal of
Hydroinformatics 2001; 3: 59-70
33. Narayanan A, Toropov VV, Wood AS and Campean IF. Simultaneous Model Building and
Validation with Uniform Designs of Experiments. Engineering Optimization 2007; 39(5): 497-512.
34. Audze P, Eglais V. New Approach to Planning Out of Experiments. Problems of Dynamics and
Strength. Zinatne 1977; 35:104-107.
35. Zhou L and Haghighat F Optimization of ventilation system design and operation in office
environment, Part I: Methodology. Building and Environment 2009; 44: 651-656.

36. Khan MAI, Noakes CJ, Toropov VV. Development of a numerical optimization approach to
ventilation system design to control airborne contaminant dispersion and occupant
comfort. Building Simulation: An International Journal 2012; 5(1): 39-50
37. Gilkeson CA, Toropov VV, Thompson HM, Wilson MCT, Foxley NA and Gaskell PH. Multi-
Objective Aerodynamic Shape Optimization of Small Livestock Trailers. Engineering Optimization
2013; 45(11): 1309-1330.
38. Choi KK, Youn BS, Yang RJ. Moving Least Square Method for Reliability-Based Design
Optimization. In Proceedings of 4th World Congress of Structural and Multidisciplinary
Optimization, 4–8 June 2001, Dalian, China.CD-ROM proceedings (WCSMO-4). Dalian: Liaoning
Electronic Press, 1–6.
39. ToropovVV, Schramm A, Sahai A, Jones R, Zeguer T. Design Optimization and Stochastic Analysis
Based on the Moving Least Squares Method. In Proceedings of the 6thWorld Congress of Structural
and Multidisciplinary Optimization, 30 May–3 June 2005, Rio de Janeiro, Brazil, edited by J.
Herskovits, S. Mazorche, and A. Canelas. Rio de Janeiro: COPPE Publications, (CD-ROM).
40. Madsen JI, Shyy W and Haftka RT. Response surface techniques for diffuser shape optimization.
American Institute of Aeronautics and Astronautics Journal 2000; 38(9): 1512:1518.
41. Burman J and Gebart BR. Influence from numerical noise in the objective function for flow design
optimisation. International Journal of Numerical Methods for Heat & Fluid Flow 2001; 11(1): 6-19.
42. PressWH, Teukolsky SA, Vetterling WT and Flannery BP. Numerical Recipes in C++ : The Art of
Scientific Computing. 3rd ed. Cambridge: Cambridge University Press, 2007.
43. Loeppky J, Sacks J and Welch WJ. Choosing the sample size of a computer experiment: a practical
guide. Technometrics 2009; 51: 366-376.
44. Beggs CB, Noakes CJ, Sleigh PA, Fletcher LA and Kerr KG. Methodology for determining the
susceptibility of airborne microorganisms to irradiation by an upper-room UVGI system. Journal of
Aerosol Science 2006; 37(7): 885-902.
45. NIOSH. Environmental Control for Tuberculosis: Basic Upper-Room Ultraviolet Germicidal
Irradiation Guidelines for Healthcare Settings. Centers for Disease Control and Prevention,
National Institute for Occupational Safety and Health, Washington DC, 2009.
46. ASHRAE Handbook: HVAC Applications. Chapter 60, Ultraviolet Air and Surface Treatment.
American Society of Heating, Refrigeration and Air Conditioning Engineers, Atlanta, 2011.