Computational design, synthesis, and biological evaluation of ...
219
Computational design, synthesis, and biological evaluation of small molecule anti-cancer therapeutics Matthew Ernest Welsch Submitted in partial fulfillment of the requirements for the degree of Doctor of Philosophy in the Graduate School of Arts and Sciences Columbia University 2015
-
Upload
khangminh22 -
Category
Documents
-
view
3 -
download
0
Transcript of Computational design, synthesis, and biological evaluation of ...
Computational design, synthesis, and biological evaluation of small molecule anti-cancer
therapeutics
Matthew Ernest Welsch
Submitted in partial fulfillment of the requirements for the degree of
Doctor of Philosophy in the Graduate School of Arts and Sciences
Columbia University
2015

© 2015
Matthew Ernest Welsch
All Rights Reserved
Abstract
Computational design, synthesis, and biological evaluation of small molecule anti-cancer
therapeutics
Matthew Ernest Welsch
It’s estimated that as many as 80% of the existing potential cancer targets are considered
to be ‘undruggable’ [1]. The vast majority of these targets engage in protein-protein interactions
(PPIs) [1]. Within this class are the RAS GTPases (HRAS, KRAS (4A and 4B), NRAS), which
are the most frequently mutated oncoproteins in human cancer- present in 30% of all
malignancies [11]. Despite efforts to target RAS spanning over 30 years, there still exists no
direct therapeutic agent. The focus of this work has been using in silico tools to develop general
approachs for designing inhibitors of PPIs and applying them to the RAS family of GTPases.
Two parallel approaches are described. The first uses pharmacophore screening with a model
derived from the residues on the effector proteins that have been established through
mutagenesis studies to be functionally important for binding affinity to RAS. The second is a
process we have termed PAINT- Process for Assembling ligands for Intractable Targets. This
approach first entails the docking of fragments into multiple sites on a target engaging in protein-
protein interactions. The fragment docking results are analyzed for enriched molecular
architectures and are then used for the basis of combinatorial in silico libraries. A library is
designed in one site and then the top scoring compounds are selected and used to extend into
adjacent sites in iterative docking and design process. The design, organic synthesis, biochemical
evaluation, evaluation in cells, and in vivo testing are described herein.

The second portion of this thesis describes the structure-activity relationship studies and
optimization of two experimental cancer therapeutics discovered in the Stockwell lab. The first is
the small molecule erastin, which elicits a novel, iron dependent form of cell death in cancer
cells called ferroptosis. The ability to study ferroptosis in vivo has been limited by the suboptimal
physiochemical properties and potency of erastin. Described in this work is the systematic
synthetic modification of the erastin structure that resulted in the improvement of its
physiochemical properties, selectivity, potency, and metabolic stability. The second molecule,
J9, reverses resistance to glucocorticoid therapy in T-cell acute lymphoblastic leukemia (T-
ALL). The improvement of both the potency and selectivity of this compound was achieved
using this process.
The hope of this work is that the strategies implemented can be applied to other small
molecules and challenging targets, and used for the design of new therapeutics.
i
Table of contents
List of figures……………………………………………………………………………………..vi
List of tables………………………………………………………………………………………ix
List of schemes…………………………………………………………………………………...ix
List of abbreviations………………………………………………………………………………x
Acknowledgments...…………………………………………………………………………….xiii
Dedication….……………………………………………………………………………………xiv
Chapter 1: Introduction…………………………………………………………………………1
I. The “druggable” genome.…………………………………………………………………1
II. RAS family of GTPases.......................................................................................................2
a. Prototypical members.…………………………………………………….............2
b. Other RAS family members……………………………………………………….3
III. Post-translational processing of RAS…………………………………………….............4
IV. Upstream signaling of RAS……………………………………………………………...5
a. Receptor tyrosine kinases (RTKs)………………………………………………...5
b. Son of sevenless (SOS)……………………………………………………………6
c. GTPase activating proteins (GAPs)……………………………………….............6
V. Signaling downstream of RAS…………………………………………………………….6
a. Rapidly accelerated fibrosarcoma (RAF) kinase pathway………………………...7
b. Phosphatidylinositol 3-kinase pathway……………………………………………7
c. RAL dissociation stimulator (RALGDS) pathway………………………………..8
VI. Early stage drug discovery strategies and applications towards targeting RAS and RAS
signaling pathways………………………………………………………………………...9
ii
a. Target selection……………………………………………………………………9
i. Oncogene addiction……………………………………………….............9
ii. Synthetic lethal screening…………………………………………………9
b. Helix stapling…………………………………………………………………….10
iii. Overview…………………………………………………………………10
iv. Application to of helix stapling to disrupting the RAS-SOS
interaction………………………………………………………………..11
c. High-throughput screening and chemical genetics………………………………11
d. Strategies for designing a chemical library for a screen: focused library vs.
diversity oriented library…………………………………………………………12
v. Privileged structures as a focused library approach………………...........13
vi. Application of privileged purine library for targeting proteins downstream
of RAS…………………………………………………………………...13
vii. Application of focused library around GDP……………………………..13
viii. Diversity oriented synthesis……………………….……………………..14
e. Fragment based screening………………………………….…………………….15
ix. Overview………………………………………………….……………...16
x. Application to finding RAS-SOS inhibitors……………………………..16
xi. Application to finding KRASG12C selective inhibitors……………...........17
f. In silico screening………………………………………………………………..17
xii. Molecular docking……………………………………………………….18
xiii. Application of molecular docking to disrupting the RAS-effector
interactions……………………………………………….………………20
iii
xiv. Ligand based in silico screening………………………….……………...20
g. ADMET property optimization…………………………………………………..20
xv. Physiochemical properties of successful drugs…………………………..21
xvi. Drug metabolism………………………………………………………....23
xvii. Drug toxicity……………………………………………………………..24
h. Mouse models for studying cancer drugs………………………………………..25
xviii. Tumor xenograft models…………………………………………………25
xix. Targeting posttranslational modifications of RAS as an example of the
limitations of xenograft model…………………………………………...26
xx. Patient derived xenograft models………………………………………...26
xxi. Genetically engineered mouse models……………………………...........27
xxii. Cre-lox system for tissue specific models……………………………….27
xxiii. Inducible gene expression for temporal control……………………….....28
xxiv. Essentially of KRAS in PDAC demonstrated using genetically engineered
mouse models…………………………………………………….………28
VII. Perspectives…………………..…………………………………………………….29
Chapter 2: Computational design, synthesis and biochemical evaluation of RAS
inhibitors………………………………………………………………………………………...31
I. Introduction………………………………………………………………………...31
II. Analysis of RAS protein-protein interactions……………………………………...32
III. Effector inspired pharmacophore strategy…………………………………………34
a. Pharmaophore model design………………………………………...……...35
b. Pharmacophore screen and in silico library design………….……..……….36
iv
c. Pharmacophore results summary and strategy for improving affinity……...38
IV. PAINT – Process for Assembling ligands for Intractable Targets…………...........39
a. In silico fragment library screen…………………………………………….39
b. Molecular library design…………………………………………...……….41
c. Synthesis of two-site and three-site compounds……………………………45
V. Biochemical evaluation…………………………………………….………………48
a. RAS pull-down………………………………….…………………………..48
b. Quantification of binding…………………………….……………………..48
c. Binding site characterization………………………….…………………….51
d. GTPase selectivity………………………………….……………………….54
VI. Discussion………………………………………………….………………………55
VII. Methods…………………………………………………….………………………57
Chapter 3: Cell-based and in vivo evaluation of 31MEW44…………………………...........80
I. Introduction…………………………………………………………….………….80
II. Cell based evaluation………………………………………………………...........80
a. Evaluation in a panel of cancer cell lines…………………………………...80
b. Prevention of anchorage independent growth………………………………82
c. Induction of apoptosis………………………………………………………83
d. Overexpression of mutant RAS and effectors………………………………84
e. Disruption of RAS signaling pathways……………………………………..85
f. Transcriptional analysis of RAS activation…………………………………87
III. In vivo evaluation…………………………………………………………………..89
a. Metabolic stability and in vivo pharmacokinetics…………..….…………...89
v
b. Evaluation in a tumor xenograft model……………………………………..90
c. Evaluation in a patient derived T-ALL model……………………………...91
d. Evaluation in the KPf/fC mouse model…………………………….…..........93
IV. Discussion………………………………………………………….………………95
V. Methods………………………………………………………………….…………98
Chapter 4: Structure-activity relationship studies and optimization of experimental cancer
therapeutics……………………………………………………………………………………114
I. Erastin background……………………………………………………………….114
II. Erastin chemistry and biological evaluation……………………………………...115
III. J9 background…………………………………………………………………….128
IV. J9 chemistry and biological evaluation…………………………………….….….128
V. Discussion………………………………………………………………………...131
VI. Methods…………………………………………………………………………...133
Chapter 5: Conclusions and future directions………………………………………………177
I. Pharmacophore approach…………………………………………………….…...177
a. Summary………………………………………………………………..…..177
b. Significance………………………………………………...……………….178
II. PAINT approach………………………………………………………..…….......178
a. Summary………………………………...………………………………….178
b. Significance…………………………………………………………………179
c. Future directions……………………………………...…………………….179
III. Medicinal chemistry of erastin and J9…………………………………..………..180
a. Summary……………………………………………...…………………….180
vi
b. Significance and future directions……………………………….................181
Appendix I. Synthesis and biochemical evaluation of the hits identified in the
pharmacophore screen…………………………………………………………..……………182
References……………………………………………………………………………................188
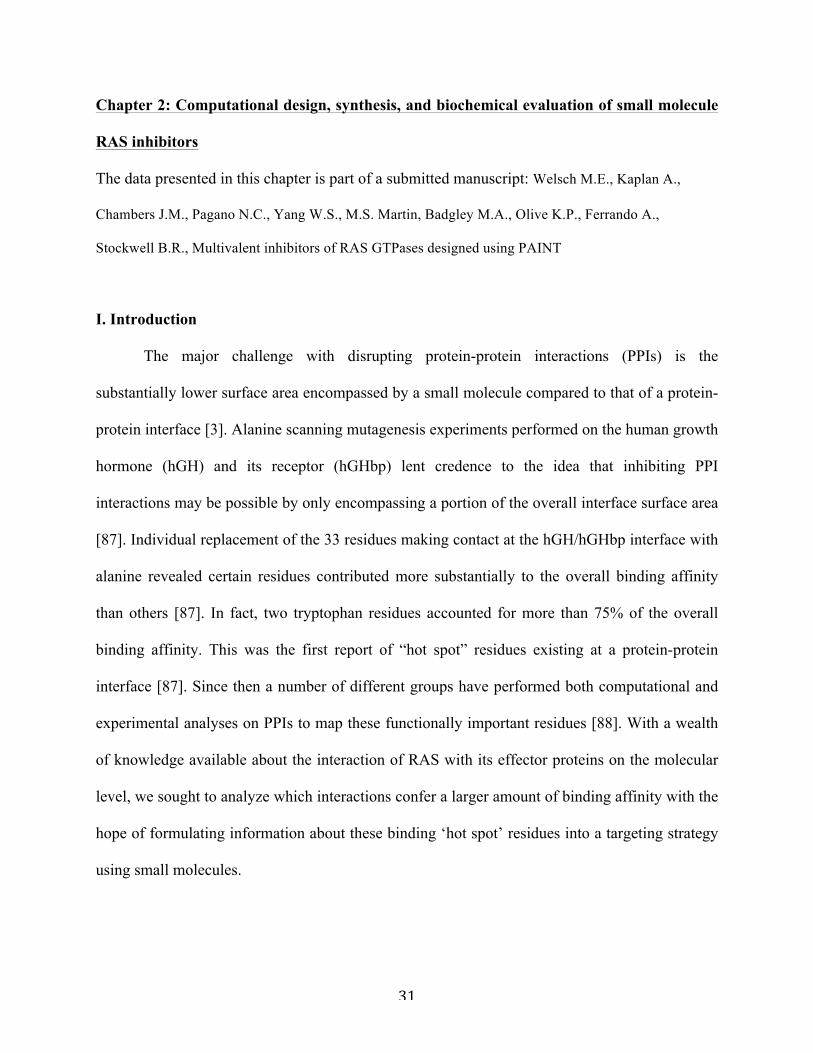
Figures Figure 2.1| Interaction of CRAF with residues I36-S39 of HRAS………………………………32
Figure 2.2 | Interaction of residue S39 of HRAS with residues T229 and S230 of PI3Kγ………33
Figure 2.3 | Conformational change of I36 as RAS transitions from the GDP to GTP-bound
state.……………………………………………………………………………………………...33
Figure 2.4| Pharmacophore model construction from key effector interactions with
RAS………………………………………………………………………………………………36
Figure 2.5 | In silico library design and the structure of two of the top hits……………………..37
Figure 2.6 | Three sites targeted on KRASG12D…………………………………………………..39
Figure 2.7 | Examples of top scoring D38 and A59 site compounds…………………………….40
Figure 2.8 | Library of D38 site compounds……………………………………………………..41
Figure 2.9 | Examples of different docked in silico libraries with indole scaffolds……………..42
Figure 2.10 | Examples of compounds from the two-site library docked and analysis to extend
into the third site…………………………………………………………………………………42
Figure 2.11 | Example of a docked three-site compound and schematic of the three-site
compound design…………………………………………………………………………...........44
vii
Figure 2.12 | Comparison of drug-like properties of the two-and three-site compounds to ABT-
263…………………………………………………………………………………......................45
Figure 2.13 | Disruption of RAS-RAF and RAS-RALGDS interactions by 31MEW44 and
34MEW43…………………………………………………………………………….………….48
Figure 2.14 | Docking scores and dissociation constants of two- and three-site
compounds……………………………………………………………..………………….……..50
Figure 2.15 | Isothermal titration calorimetery on 31MEW44………………………….…..........51
Figure 2.16| Binding site specificity of 31MEW44 by microscale thermophoresis……………..52
Figure 2.17 | Binding site characterization of 31MEW44 by 1H-15N HSQC NMR……………53
Figure 2.18 | GTPase selectivity of 31MEW44 by microscale thermophoresis…………………55
Figure 3.1 | Effect of 31MEW44 on the viability of a panel of cancer cell lines and correlation to
RAS dependency…………………………………………………………………………………81
Figure 3.2 | Inhibitors prevent anchorage independent growth………………………………….83
Figure 3.3 | Induction of caspase 3/7 activation by inhibitors…………………………………...84
Figure 3.4 | Effect of KRAS and effector overexpression on 31MEW44 sensitivity……………85
Figure 3.5 | Disruption of RAS-effector signaling pathways by inhibitors……………………...86
Figure 3.6 | Analysis of genes linked to RAS activation………………………………………...88
Figure 3.7 | Expression levels of mutant RAS with 31MEW44…………………………………89
Figure 3.8 | Site of metabolism calculations on 31MEW44……………………………………..90
Figure 3.9 | Metabolic stability and pharmacokinetics of 31MEW44…………………………...90
Figure 3.10 | Effect of 31MEW44 in a MBA-MB-231 mouse tumor xenograft………………...91
Figure 3.11 | Effect of 31MEW44 on the viability of patient derived T-ALL cells……………..92
Figure 3.12 | Effect of 31MEW44 on a patient derived T-ALL xenograft………………………93
viii
Figure 3.13 | Effect of 31MEW44 on RAS signaling pathways in the KPf/f C mouse
model………………………………………………………………………………………..……94
Figure 4.1| Structure of erastin, erastin-A8 (inactive erastin analogs) and dierastin………..….115
Figure 4.2 | Structure-activity relationship of initial analog set………………………………...120
Figure 4.3 | Activity of analogs designed to improve aqueous solubility………………………123
Figure 4.4 | Effect of the movement of the methylmorpholino substituent on activity……...…124
Figure 4.5 | Effect of the addition of an amino group to 11MEW75 on activity………….........125
Figure 4.6 | Confirmation that 11MEW75 acts through the same mechanism as
erastin….......................................................................................................................................126
Figure 4.7 | Aqueous solubility and metabolic stability of selected analogs…………………...127
Figure 4.8 | Activity of PE in an HT-1080 mouse tumor xenograft……………………………127
Figure 4.9 | Activity and structure of J9………………………………………………………..128
Figure 4.10 | Structure-activity relationship of J9……………………………………………...130
Figure 4.11 | Growth inhibition of J9A and J9B………………………………………………..131
Figure A1.1 | Disruption of RAS-RAF and RAS-RALGDS interactions by 31MEW78 and
31MEW79……………………………………………………………………………................182
Figure A1.2 | Microscale thermophoresis of 31MEW79 and 31MEW78……………………...183
Figure A1.3 | Binding site characterization of 31MEW79……………………………………..183
Tables
Table 2.1 | Calculated physiochemical properties of 31MEW78 and 31MEW79……………….38
Table 2.2 | Docking scores of 31MEW44, 34MEW43, and 34MEW95 against a panel of
GTPases………………………………………………………………………………………….54
ix
Table 3.1 | Table of growth inhibition EC50 values for 31MEW44, 34MEW43, and 34MEW95 in
a panel of RAS mutated cancer cells…………………………………………………………….82
Schemes
Scheme 2.1 | Synthesis of 31MEW44 and 43MEW63…………………………………………..47
Scheme 4.1 | General analog synthetic route…………………………………………………...116
Scheme 4.2 | Synthesis of quinoline dierastin…………………………………………….........117
Scheme 4.3 | Synthesis of indole dierastin……………………………………………………..118
Scheme 4.4 | Synthesis of analogs with methylamino groups on the 5-position of the aniline
ring……………………………………………………………………………………………...122
Scheme 4.5 | Synthesis of 4-substituted anilines………………………………………….........122
Scheme 4.6 | General J9 analog synthetic route………………………………………………..129
Appendix scheme 1 | Synthesis of 31MEW79..………………………………………………..182
x
List of Abbreviations
AE = aldehyde erastin
BOC = tert-butyloxycarbonyl
DCE = 1,2-dichloroethane
DCM = dichloromethane
DIPEA = diisopropylethyl amine
DMSO = dimethylsulfoxide
DOS = diversity oriented synthesis
EC50 = half maximal effective concentration
EtOAc = ethyl acetate
FBS = fetal bovine serum
FTI = farnesyltransferase inhibitors
GC = glucocorticoid
GEM = genetically engineered mice
HBTU = O-(Benzotriazol-1-yl)-N,N,N′,N′-tetramethyluronium hexafluorophosphate
HCl = hydrochloric acid
HSQC = heteronuclear single quantum coherence
HTS = high-throughput screening
IP = intraperitoneal
ITC = isothermal titration calorimetry
IV = intravenously
NaHCO3 = sodium bicarbonate
Na2SO4 = sodium sulfate
xi
NH4Cl = ammonium chloride
NMP = N-methyl-2-pyrrolidone
MeOH = methanol
MgSO4= magnesium sulfate
MOE = molecular operating environment
MST = microscale thermophoresis
NBS = N-bromosuccinimide
PBS = phosphorous buffered saline
Pd(PPh3)4 = Tetrakis(triphenylphosphine)palladium(0)
PE = piperazine erastin
PEG = polyethylene glycol
PK = pharmacokinetics
PO = per os (by mouth, referring to oral drug delivery)
PPI = protein-protein interaction
qPCR = quantitative polymerase chain reaction
RBD = RAS binding domain
RNAi = ribonucleic acid interference
ROCS = rapid overlay of chemical structures
rt = room temperature
SAR = structure-activity relationship
SC = subcutaneously
shRNA = small hairpin RNA
siRNA = small interfering RNA
xii
TBAF = tetra-n-butylammonium fluoride
TBS = tert-butyldimethylsilyl
TFA = trifluoroacetic acid
THF = tetrahydrofuran
TLC = thinlayer chromatography
wt = wild-type

xiii
Acknowledgments
First and foremost I would like to thank Professor Brent Stockwell for the incredible amount of
creative freedom and support he has given me throughout my entire graduate student career.
Writing this has really made me realize the unbelievable amount that I’ve learned with him as
my mentor. It’s been extremely rewarding to take my primary project from in silico design, to
organic synthesis, biochemical evaluation, evaluation in cell culture, and testing in a mouse
xenograft model. I can’t thank him enough for allowing me to learn such a diverse array of
techniques. I’ve also had the pleasure of being his teaching assistant in his biochemistry course
for four semesters as well as taking his graduate course. I’ve learned a lot from him not just as a
scientist but also as a teaching instructor.
Thank you to all of the Stockwell lab members that I’ve gotten to work with directly on
the RAS project: Anna Kaplan, Nen Pagano, Wan Yang and Jennifer Chambers. Anna performed
all of the protein NMR and ITC experiments. She has been incredibly helpful with teaching me
how to optimize protein purification and setting up biochemical assays. Nen performed the RAS
knockdown experiments in the panel of cell lines 31MEW44 was evaluated in as well as
performed the viability testing with me. Wan taught me how to perform a mouse xenograft study
and he has evaluated several of the erastin analogs I’ve synthesized in a xenograft. I’ve learned a
tremendous amount from him and he’s been great colleague my entire time in graduate school.
Jenny helped with optimizing the 31MEW44 synthesis and I’d like to thank her for critically
reading and editing my thesis.
I’d like to thank Dr. Marta Sanchez-Martin and Professor Adolfo Ferrando for evaluating
31MEW44 in their patient-derived T-ALL samples and mouse model; and also for the work they
have done with the J9 project. I’d also like to thank Michael Badgely and Professor Kenneth
xiv
Olive for all of their suggestions, for testing 31MEW44 in their KPf/fC mouse model, and for
their work with piperazine erastin. The incredible work done by the Ferrando and Olive labs has
really added a lot to the RAS manuscript and I can’t thank them enough for all of their time,
suggestions, and expertise.
I’m grateful to Dr. Andras Bauer for introducing me to structure-based drug design. He
helped teach me the fundamentals of using molecular operating environment (MOE) and was
very patient with me when I decided to start the RAS and my first question was, ‘what is
docking, exactly?’
I’d like to thank Alexandra Cantley for including me in the J9 project and for testing all
of the analogs I synthesized.
Thank you to Michael Gaschler and Meehan Crist for critically reading and editing
portions of my thesis.
For the erastin project I would like to thank Dr. Kathryn Lemberg for testing the initial
erastin analogs I was synthesizing and taking the time to teach me how to run my first cell
viability assays. I’d like to thank Professor Scott Dixon for countless suggestions and stimulating
conversations, and also for testing all of the erastin analogs in HT-1080 cells. Thank you to Dr.
Ajit Thomas and Professor Barbra Slusher for running the glutamate release assay on the erastin
analogs.
I’m extraordinarily grateful to have been a part of the Stockwell lab, and I’d like to thank
all past and present members for being unbelievable colleagues and friends. I don't think I can
find a nicer group of talented scientists.
I would of course like to thank my thesis committee: Kenneth Olive, Adolfo Fernando,
Jack Norton and Richard Freisner for serving on my committee. I feel privileged to have such a

xv
diverse amount of expertise on my committee and I greatly appreciate all of their comments and
insights.

xvi
To my parents for all of their love and support
1
Chapter 1: Introduction
I. The ‘druggable’ genome and protein-protein interactions as drug targets
The ‘druggable genome’ is a concept used to describe the segment of the total human
genome that is amenable to modulation by exogenous small molecule drugs [1]. The advent of
technologies, such as high throughput protein crystallography, have facilitated the delineation of
a large repertoire of protein structures and insight into the forces that govern receptor-ligand
interactions [2]. According to analyses performed the on structures in the protein data bank, it is
estimated that only about 12% of proteins in the human proteome fall within this ‘druggable’
category [3]. Moreover, the quantity of existing drugs is focused on a small subset of targets. For
example, G protein coupled receptors constitute an astonishing 19% of the established druggable
genome [4]. The primary difficulty in targeting the vast remaining portion of human proteome is
due to the absence of cavities with sufficient properties for the tight binding of small molecules
[1,3-4].
The majority of these perceived “undruggable” targets participate in protein-protein
interactions (PPIs) [1,3]. PPIs play an integral role in biological processes and genome-wide
computational methods estimate more than 300,000 potential protein interaction pairs exist [4,6].
Small molecule inhibitors for this largely untapped reservoir of challenging targets could treat
innumerable diseases and be used as tools to help illuminate biological signaling networks. Such
tools would provide a wealth of information about human biology and the molecular
underpinnings of disease. PPIs are considered by many to be the final frontier of drug discovery
[5].
The chemical modulation of PPIs was historically thought to be an intractable problem
because the contact surface area of a small molecule-protein interaction is approximately one
2
fifth to one tenth that of a typical PPI [3,5]. While a small molecule attaining higher binding
affinity than a protein while making less surface contacts seems implausible, emerging
technologies and innovative strategies have led to a number of PPI modulators progressing to
clinical development [4-5,7]. This more tractable subset of PPIs is comprised of those that
consist of a short α-helical domain that can be inserted into a hydrophobic grove of an
interacting partner [7]. Successful attempts at inhibiting interactions of this type include the p53-
MDM2 interaction by nutlins, the BCL2 family inhibitor obatoclax, the ARF-SEC7 inhibitor
BFA, among others [4,7]. A much more challenging class of PPIs are those that are mediated
though β-strands [8]. Interactions of this type gain a substantial portion of their binding affinity
by forming an extended β-sheet between the two interacting proteins. The interface of these
interactions typically lacks cavities conducive to the binding of a small molecule inhibitor [8]. A
protein family that enables a number of a different cellular signaling modules through
interactions of this type are the RAS family of GTPases, considered by many to be the most
highly sought after target in the history of cancer biology [9].
II. The RAS family of GTPases
IIa. Prototypical members
The canonical members of the RAS GTPases (HRAS, NRAS, and KRAS (4A and 4B))
play a central role in a number of signal transduction pathways [10-11]. They function as binary
switches, transitioning from their active GTP-bound state to their inactive GDP-bound state, a
transition that is reciprocally regulated by guanine exchange factors (GEFs) and GTPase
activating proteins (GAPs) [10-11]. GTP binding causes RAS to undergo a conformational
change that enables it to interact with a number of proteins involved in signaling pathways
3
related to cell growth and proliferation. Mutations resulting in impairment of the GTPase
catalytic activity or the prevention of GAP binding result in the constitutive activation of RAS
and lead to the malignant phenotype [11]. Mutations of this type are found in 20-30% of all
human cancers [11], with particularly high rates occurring in three of the top four lethal
malignancies in the United States—pancreatic (90%), colon (45%), and lung (35%) [10].
IIb. Other RAS family members
The RAS superfamily can be divided into five major subfamilies: RAB, ARF, RAN,
RHO, and RAS [17]. These subfamilies facilitate a number of processes within the cell: signal
transduction (RAS), gene expression (RAS, RHO), cytoskeletal organization and cell motility
(RHO), vesicle trafficking/budding (RAB, ARF), microtubule reorganization and
nucelocytoplasmic transport (RAN) [17,18]. The RAS subfamily can be further divided into
groups consisting of: RAP (RAP1A, RAP1B, RAP2A, RAP2B and RAP2C), RHEB, RAL
(RALA and RALB), RRAS (RRAS, TC21 and MRAS), and the canonical members of RAS
(HRAS, NRAS, KRAS 4A and KRAS 4B) [17]. RHEB (RAS homology enriched in the brain)
elicits its effect primarily through TORC1, which causes enhanced growth and translation.
RRAS, a less understood member, is known to enhance integrin mediated adhesion and signaling
though PLCε [19]. In contrast to the majority of GTPases effector proteins, RAP1 and RAP2
have domains that discriminate between these two isoforms [20]. RAP is known to regulate
functions such as cell-cell junction formation, cell adhesion, exocytosis as well as establishing
cell polarity [17,20].
4
III. Post-translational processing of RAS
The prototypical members of the RAS family (HRAS, NRAS, KRAS 4A and KRAS 4B)
are ubiquitously expressed in all cells with the exception of KRAS 4A, which is found only in
the lung, liver, and kidney [22]. They exhibit high degree of sequence homology between
isoforms (~90%) [23]. The variability is primarily in the C-terminal hypervariable region,
possessing only 10-15% conservation, and the differences dictate posttranslational modification
through both palmitylation and prenylation [23].
This area contains a CAAX motif (C=cysteine, A=aliphatic residue, and X=serine or
methionine) that is prenylated after translation. All the RAS isoforms can be farnesylated at the
cysteine of the CAAX motif, while NRAS and KRAS (4A and 4B) can also undergo
geranylgeranylation [23, 24]. Addition of the prenyl moiety localizes RAS to the ER where the
AAX portion is cleaved by RAS converting enzyme 1 (RCE1) and the cysteine undergoes
methyl esterification by isoprenylcysteine carboxymethyltransferase (ICMT). Once methylated,
palmitoylation occurs at an additional cysteine on NRAS and HRAS that subsequently directs
these enzymes to the golgi apparatus [23]. They are then depalmitoylated at the golgi and the
delta subunit of phosphodiesterase 6 (PDE6) binds to the hydrophobic farnesyl moiety and
enables localization to the plasma membrane [25]. KRAS 4B, the more ubiquitous spliced form
of KRAS, does not undergo palmitoylation. Instead, following methylation at ER, the farnesyl
moiety is bound by PDE6 and is localized to the plasma membrane, where it associates to the
cytoplasmic face via its farnesyl group and a poly-lysine sequence near the C-terminus [25]. This
alternative localization mechanism is the basis of the different signaling modalities of the RAS
isoforms [23-25].
5
The idea of non-redundant functions of these isoforms was proposed based on the
observation that certain isoforms are exclusively mutated in cancers of different tissue types [26].
Moreover, studies involving RAS knockout mice resulted in embryonic lethality with a
homozygous KRAS 4B isoform knockout in contrast to the normal growth and viability
observed with the HRAS and NRAS homozygous knockouts [26].
IV. Upstream signaling of RAS
The wild-type RAS proteins are activated through guanine exchange factors (GEFs) [21,
30-31]. There are four subfamilies of GEF proteins currently known: SOS, RASGRP, and
CNRASGEF [21]. SOS is ubiquitously expressed, while RASGRP and CNRASGEF are
predominately expressed in the haematopoietic cells and the central nervous system, respectively
[21]. The SOS facilitated activation of RAS is mediated through signaling at receptor tyrosine
kinases (RTKs) [21, 30].
IVa. Receptor tyrosine kinases (RTKs)
Signals transmitted to the cell surface are detected at receptor tyrosine kinases (RTKs),
such as EGFR or PDGFR. These signals result in autophosphorylation at their tyrosine residues
[30]. The SRC homology 3 (SH3) domain of the adaptor protein GRB2 then binds to the
phosphorylated tyrosines, and son of sevenless (SOS) is then brought in close proximity to
membrane-tethered RAS via its association to the proline-rich carboxyl terminus of GRB2 [30].
6
IVb. Son of sevenless (SOS)
SOS is a guanine exchange factor that is responsible for catalyzing the exchange of GDP
to GTP in RAS GTPases [30, 31]. The two isoforms of SOS, SOS1 and SOS2, are ubiquitously
expressed in mammalian cells. Both consist of the CDC25 and RAS exchanger motif (REM),
which are required for their activity [30]. The interaction of RAS with SOS occurs primarily at
the CDC25 domain, with an α-helix from SOS inducing a conformational shift of the switch I
region of RAS and expansion of the nucleotide-binding pocket [31]. The side chain of L938 of
SOS is inserted into the pocket and blocks the magnesium from interacting with the phosphates.
In addition, E942 of SOS blocks the critical hydrogen bond between S17 of RAS and the alpha
phosphate of GDP [31]. The net effect of these events is an alteration of the chemical
environment of the nucleotide-binding site that dramatically reduces affinity of GDP, causing it
to diffuse out and allowing for the binding of GTP [31]. In its GTP-bound state RAS is able to
interact with a number of ‘effector’ proteins and cause the activation of several signaling
cascades [31].
IVc. GTPase activating proteins (GAPs)
The inactivation of RAS proceeds through two mechanisms: intrinsic GTP hydrolysis and
by GTPase activating protein (GAP) mediated hydrolysis. GAPs inactivate RAS via accelerating
the otherwise slow intrinsic rate of GTP hydrolysis. A GAP arginine residue is positioned into
the GTP binding site and acts to neutralize the negative charge of the GTP phosphates [32]. The
hydrolysis is further catalyzed by the stabilization of Q61 of RAS, which lowers the pKa of a
water molecule situated in the p-loop [32]. This water molecule then engages in a nucleophilic
attack on the beta phosphate, expelling the gamma phosphate and yielding GDP [32]. Mutations
7
in the RAS proteins, particularly at amino acids G12 and G13, prevent GAPs from binding and
results in its constitutive activation [32].
V. Signaling downstream of RAS
Va. Rapidly accelerated fibrosarcoma (RAF) kinase pathway
The first RAS effector to be discovered, and also the best studied, are the RAF kinases
(CRAF, ARAF and BRAF) [40]. BRAF is the most frequently mutated RAF isoform and is
found altered in approximately 70% of human melanomas [40]. RAF isoforms associate with the
switch I region of RAS via their n-terminal RAS-binding domain (RBD) and with the switch II
region of RAS through their c-terminal cysteine rich domain (CRD) [41,42]. This binding event
to GTP-bound RAS disrupts the N-terminal auto-inhibition segment of RAF and localizes it to
the plasma membrane for further phosphorylation and dephosphorylation events that lead to its
optimal active state [42].
Following RAS mediated activation; RAF phosphorylates the two isoforms of MEK
(MEK1 and MEK2), whose only known substrates are ERK1 and ERK2 [41]. ERK has as vast
array of substrates, which affect cell differentiation and proliferation. Of particular importance is
the activation of the transcription factors ETS-1, ETS-2, and CMYC; whose overexpression
contributes to the oncogenic transformation of cells [43].
Vb. Phosphatidylinositol 3-kinase pathway
Another well-studied RAS effector is phosphatidylinositol 3-kinase (PI3K), which is also
mutated in a number of different cancers including glioblastoma, breast, colorectal, gastric, acute
leukemia, hepatocellular and lung [44, 46]. It consists of two domains - p85 and p110 [44]. In the
8
inactive state the p85 regulatory domain inhibits the catalytic activity of the p110 kinase domain
[44]. Upon association of the p85 domain with RAS, the p110 unit becomes active and PI3K can
phosphorylate the 3’-hydroxyl group of phosphatidylinositol-(4,5)-bisphosphate (PIP2) to
produce phosphatidylinositol-(3,4,5)-triphosphate (PIP3) [45]. This product then binds to the PH
domain of PDK1, PDK2 and AKT. The binding of PIP3 recruits these cytosolic proteins to the
plasma membrane where AKT is phosphorylated at T308 and S473 by PDK1 and PDK2,
respectively [46]. While phosphorylation of T308 is sufficient for catalytic activation of AKT,
the second phosphorylation at S473 allows for maximal activity [46]. In a similar manner to
ERK, AKT has a number of different substrates. Mutations of AKT1, such as E17K, have also
been found in a number of cancers and result in constitutive localization to the plasma
membrane, which promotes hyperphosphorylation [46]. Additionally, amplification of AKT1 has
been found in some gastric carcinomas [46].
Vc. RAL dissociation stimulator (RALGDS)
RAS-like (RAL) GTPases were identified from a screen for genes related to RAS.
Guanine exchange factors for RAL were discovered shortly after from a screen of a library of
mouse cDNA [47]. Further investigation of this library also identified that RALGDS has
sequence homology to the REM and CDC25 domains, characteristic of REF-GEFs [47]. In a
manner similar to RAS, GTP-bound RAL interacts with a number of downstream effector
proteins. The best-characterized interaction is SEC5 and EXO84, two components of the
octameric exocyst complex. This complex regulates exocytosis through tethering post-golgi
secretory vesicles to the plasma membrane prior to exocytic fusion [48]. This process plays a
functional role in tumor cell invasion [48].
9
VI. Early stage drug discovery and applications towards targeting RAS and RAS signaling
pathways
VIa. Target selection
The analysis of differences between normal and abnormal cells is the initial step in
selecting a suitable target for pharmacological inhibition. In the case of cancer, targets are
selected on the basis of their ability to induce selective lethality over normal cells.
i. Oncogene addiction
The concept of oncogene addiction is the situation in which the survival of the cell
becomes dependent on a single altered gene [12]. Inhibition of the protein product of these
mutated genes has been shown not only to lead to a reversal of the malignant phenotype but also
to tumor regression, making it desirable for pharmacological inhibition [13]. The addiction to
mutated RAS is a prototypical example of this phenomenon. The high prevalence of mutations
and frequent essentiality in a number of different malignancies has made RAS a highly sought
after cancer target [9,10].
ii. Synthetic lethal screening
The difficulty in discovering a direct inhibitor for RAS, and other challenging targets, has
motivated a number of creative alternative approaches, such as synthetic lethal screening [14].
Synthetic lethality arises when the presence of two altered proteins results in cell death, in
contrast to cells consisting of the individual alterations where no deleterious phenotype is
observed [14]. A major utility of this approach is finding a more druggable target for the
10
treatment of a particular disease when the desired target is not amenable to pharmacological
inhibition [14]. A number of different screens using RNAi in RAS mutated cells have been
performed to find a gene that exhibits a synthetic lethal interaction with RAS [9]. One notable
example is STK33, a much more druggable kinase that was identified from an shRNA screen of
KRAS mutated cells compared to wild-type (wt) [15]. Unfortunately, inhibition of STK33 by a
small molecule did not reproduce this synthetic lethal interaction [16]. Moreover, this result was
not reproducible with small interfering RNA (siRNA), highlighting the limitation of this
approach [16].
VIb. Helix stapling
i. Overview
The most common type secondary structure at protein-protein interfaces is the α-helix
[33]. It was discovered that the binding affinity of short α-helical segments engaging in PPIs
could be improved through the use of chemical braces [33]. These “helix staples” encompass one
or two turns of the helix (i, i+4 and i+7), and typically consist of 8 and 11 hydrocarbon chains,
respectively. Stapling increases helicity and improves affinity by decreasing the entropic cost of
binding [33]. This technique as also been shown to reduce degradation by proteases and increase
the blood half-life of a peptide from 30- to 60-fold [33, 34]. Stapled helices have been shown to
out-compete the endogenous protein in a number of different cases, however the issue of cell
permeability and high cost associated with their production still remains a challenge [34].
11
ii. Application of helix stapling to disrupting the RAS-SOS interaction
In an effort to disrupt SOS mediated RAS activation a cell permeable synthetic α-helix
based on the interacting portion of SOS was developed [35]. The helix was based on the stretch
of amino acids (residues 929-944) interacting with the switch I of RAS and included a synthetic
hydrogen bond surrogate installed to improve helicity and stability. Substitutions of non-
interfacial residues were made with amino acids that had a higher helical forming propensity.
The synthetic helix bound to nucleotide-free RAS with a KD of 28 µM and to GDP-bound RAS
at 158 µM [35]. It also successfully abrogated RAS signaling in EGF-stimulated HeLa cells [35].
While this constituted a major advancement towards inhibiting RAS proteins, it would be
primarily applicable only to cancers in which proteins upstream of RAS are mutated/activated.
Further improvement of affinity is also warranted before therapeutic translation.
VIc. High-throughput screening and chemical genetics
The practice of discovering a small molecule with the ability to modulate a desired
biological process remains a slow, expensive, and largely serendipitous undertaking [49]. The
most widely implemented approach involves physically screening large libraries of small
molecules to elicit a particular biological response. An assay is first designed such that it can be
executed in high throughput, and molecular libraries are then screened for their ability to
provoke the desired effect. Initial identified “hits” undergo iterative cycles of medicinal
chemistry in order to improve their potency, as well as a number of important physiochemical
properties to maximize the chance of a successful clinical candidate.
These types of screens can be classified into two general types: forward and reverse
chemical genetics [49]. In forward chemical genetics compounds are screened for a particular
12
phenotypic response. Once a “hit” eliciting the desired effect is found, the target is then
elucidated using a variety of different methods. The most widely used approach for target
identification is affinity chromatography, where the small molecule “hit” is attached to a solid
phase and cell lysate incubate with this immobilized molecule in order to isolate the target.
Target identification is considered the “bottle neck” of forward chemical genetics [49] and its
labor-intensive nature has caused this approach to decrease in popularity, particularly in the
pharmaceutical industry.
In contrast, reverse chemical genetic screens are performed against a target with an
established role in a particular biological process [49], such as RAS. Compounds are typically
screened initially for their ability to bind to the purified target. Subsequent validation and
medicinal chemistry on the initial hits then warrant the advancement of the molecule to cell and
in vivo assays.
VId. Strategies for designing a chemical library for a screen: focused library vs. diversity
oriented library
Two orthogonal synthetic approaches for designing compounds for screening purposes
are: target-oriented synthesis and diversity-oriented synthesis [50]. The former, also called
focused library synthesis, has been more widely used in drug discovery. This involves using
retrosynthetic analysis to devise how to construct a chemical library against a preselected set of
target molecules [50].
13
i. Privileged structures as a focused library approach
Certain scaffolds are enriched within different classes of biological targets. Evans coined
the term “privileged structure” in the late 1980s to describe structures of this type when he
observed enrichment of the benzodiazepine nucleus [51]. Since then, in both academia and
industry, numerous libraries have been synthesized around these types of structures and have
yielded a number of bioactive ligands and marketed drugs. One example of the implementation
of “privileged structures” has been towards the discovery of kinase inhibitors [52]. All kinases
use ATP as their substrate and designing libraries based on the purine scaffold have yielded
numerous hits against various kinases, among other desirable targets [52]. While a number of
therapeutically useful compounds have been discovered using this approach, complete specificity
for one target has not been achieved in the case of kinase inhibitors due to their highly
homologous ATP binding sites.
ii. Application of privileged purine library for targeting proteins downstream of RAS
A number of downstream proteins of RAS function as kinases. Laufer et al. reported the
synthesis of a 2,6,9 -6,8,9 substituted purine library that they used in a screen against a panel of
kinases [53]. Among hits with several different kinases, the screen yielded an inhibitor against
the RAS effector CRAF and its downstream protein MEK. An additional hit was discovered
using this library against AKT, a part of the RAS-PI3K signaling axis [53].
iii. Application of a focused library around GDP
Hunter et al. [54] reported a KRASG12C selective inhibitor by focusing their design
around the endogenous binder GDP. Their strategy exploited the reactivity of the cysteine
14
residue in the mutant, and they targeted the nucleotide-binding site directly. A chloroacetamide
moiety was attached to the beta phosphate of GDP, which positioned it for nucelophilic attack by
the cysteine and displacement of the chlorine through an SN2 reaction [54]. Crystallographic
data with the inhibitor bound confirmed the mode of binding, along with showing that switch I
and II had adopted their inactive conformations. To see if it would be possible for the inhibitor to
out compete GDP and GTP under more physiological conditions, labeling efficiency was
measured with the nucleotides at the typical cellular concentration of 1.5 mM (200 fold excess to
the analog). Selective labeling of KRASG12C was achieved in fewer than 36 h. While this analog
was ineffective in live cells due to its inability to permeate the cell membrane, labeling was
observed by mass spectrometry performed MiaPaca-2 (KRASG12C) cell lysates [54]. This study
demonstrated that a guanine nucleotide competitive inhibitor is possible, however a much more
drug-like molecule would be required for therapeutic applications.
Focused library synthesis has been an extremely effective approach for discovering new
hits against targets with known ligands. However, it will be difficult to discover new drugs with
efficacy against new, more challenging targets using these existing libraries.
iv. Diversity oriented synthesis (DOS)
With an average small molecule consisting of 30 atoms, chemical space is estimated to
contain roughly 1060 stable configurations [55]. It is possible that the current libraries simply do
not posses the requisite structures for the binding of these more challenging targets. Screening
libraries based on the same small set of privileged scaffolds probes the depth of chemical space
while ignoring its breadth. Development of libraries with a diverse set of less-explored core
structures offers a first step into the nearly incomprehensible vastness of chemical space. Though
15
such exploration will certainly yield many molecules with no biological significance, it also
represents one of the most promising methods for medicinal chemists to discover molecules with
new properties that make them active against targets previously deemed intractable [50]. Further
exploration into chemical space could unveil molecules with the properties necessary to bind to
previously unattained target types [50].
Diversity-oriented synthesis (DOS) entails the efficient construction of as many
structurally distinct molecular architectures as possible [50, 55]. In contrast to the focused library
synthesis, the goal is not to synthetize one particular target type, thus standard retrosynthetic
analysis cannot be applied [50,55]. The logic behind this approach is that as such a library will
be used for general screening purposes in a diverse array of biological assays, and maximizing
molecular diversity would increase the hit rate. A typical synthetic route for DOS uses
sequential, complexity-generating reactions where distinct branching points (common starting
material that can undergo reactions with different reagents) are used to maximize the number of
possible structural outcomes [50, 56]. While complexity is not essential for diversity, it is
thought to confer a higher degree of target specificity. Using DOS to access new areas of
chemical space could be one possible direction for discovering drugs against previously
unattainable targets.
VIe. Fragment-based screening
Fragment-based screening is a method that exploits the idea of using a larger degree of
chemical diversity. As the name implies, this approach involves smaller compounds than what
would typically be a marketed drug (molecular weight less than 300 g/mol, compared to 500
g/mol) [36]. The goal is to identify low affinity binders that could than be further elaborated into
16
a more potent molecule specific to the desired target. The library size is substantially lower
(~103) than conventional high-throughput screening (~106-107) as a result of less enumerable
combinations of atoms in small molecules [36]. Thus, fragments are applicable in more assays,
less time consuming to screen, and thus more cost effective [36]. By using smaller molecules,
there is a higher probability of obtaining compounds with ideal physiochemical properties, as
typical HTS generally produces larger, more lipophilic molecules that are difficult to optimize
for clinical studies. Moreover, the vast majority of commercial HTS collections are filled with
compounds that have been optimized for conventional targets (i.e. kinases, GPCRs, ect.) [36].
The fragment-based approach has resulted in several compounds in clinical trials [36]. Abbott
and co-workers implemented a notable example of this in a series of inhibitors they designed
against the BCl-2 family of anti-apoptotic proteins [36]. These were the result of synthetically
stitching together three fragments that eventually yielded ABT-737, a high-molecular weight
(975 Da) inhibitor in phase II clinical trials [36].
i. Application of fragment screening to finding RAS-SOS inhibitors
Two reports of small molecule RAS-SOS inhibitors were published in 2012 using an
NMR-based fragment screen as an initial assay to find molecules capable of binding to RAS
[37,38]. These papers report hits containing indole scaffolds binding in the same site on RAS
located near L56. The lead compound described by Maurer et al., DCAI (KD of 1.5 mM), was the
only fragment that exhibited activity in cells. It was shown to attenuate the amount of RAS-GTP
in EGF-stimulated HEK-293T cells [37]. Efforts to further elaborate these fragments to a more
potent inhibitor were unsuccessful.
17
ii. Application of fragment screening to finding a KRAS mutant selective inhibitor
Later that year, a paper describing a mutant specific compound was published [39]. This
strategy exploited a nucelophilic cysteine residue present only in the KRASG12C mutant, located
in a shallow pocket between switch I and switch II. Ostrem et al. implemented a tethered screen
of 480 disulfide-containing fragments against GDP-bound KRASG12C [39]. Changing
electrophiles from disulfides to carbon-based acylamides and vinyl sulphonamides conferred a
substantial increase in binding affinity. GTP and GDP titration experiments in the presence of
the inhibitor indicated a shift in nucleotide preference of inhibitor bound KRASG12C to favor
GDP by roughly 4-fold. Crystallographic data revealed that the inhibitor occupied the area
required for G60 to make a hydrogen bond with the gamma phosphate of GTP, which is critical
for the preferential GTP affinity of the mutant. Ostrem et al. then demonstrated the ability of
their most potent inhibitor to prevent the RAS-RAF interaction selectively at 100 µM in H1792
cells (KRASG12C) as compared to H358 (wt KRAS). The lethality in a panel of KRASG12C vs.
non-KRASG12C mutant cancer cell lines did not show a very strong degree of selectivity. For
example H23 (KRAS G12C) did not have any statistically significant difference compared to any
of the non-KRASG12C mutant lines [39]. This can be attributed, in part, to possible off-target
effects of the reactive electrophilic groups. While their most effective compound warrants further
optimization prior to clinical translation, this constitutes a substantial advancement towards a
RAS therapeutic.
VIf. In silico screening
The idea of computationally simulating protein structures and the chemical interactions
that mediate their affinity for a small molecule drug was conceptualized as early as the mid-
18
1970s [57]. The hope was that drugs can eventually be designed de novo, based solely on
receptor structure, and that would free the pharmaceutical industry from random small molecule
screening and tedious medicinal chemistry. While this notion has yet to be fully attained,
substantial advances in the field of computationally driven drug design have been made since the
1970s and are widely used in the pharmaceutical industry and academia.
i. Molecular docking
Molecular docking entails the computational screening of in silico libraries of molecules
against a target macromolecule [58]. Each compound is positioned in a defined area of the
receptor and the binding orientation or “docking pose” is predicted along with the structures
being ranked by their binding affinity or “docking score”. Scoring functions can be classified
into three major categories: empirical, force field based, and knowledge-based [58].
The most widely used scoring function is empirical, which relies on the assumption that
the affinity can be estimated as the sum of relatively simple individual energetic parameters:
hydrogen bonds, electrostatics, hydrophobic, and Van der Waals interactions [58]. A common
empirical scoring function is Chemscore which takes into account all of the aforementioned
types of binding energy [58, 59]. Chemscore has been used as a starting point for other, more
advanced algorithms, such as glide [60].
In force field based scoring functions, the sum of two energies is quantified: internal
ligand energy upon binding and ligand-receptor energy [58]. These are described by the Lenard-
Jones potential energy function and by a Coulombic formulation, which accounts for Van der
Waals and electrostatics, respectively [58].
19
As the name implies, knowledge-based scoring functions rely on analyses performed on
known ligand-receptor structures [58]. Interactions between the ligand and the receptor are
broken down to individual atom interactions, with the overall docking score amounting to the
sum of each ligand atom-receptor atom interaction [58]. The major limitation of this approach is
that less common interactions in crystal structures, such as cation-π interactions, are poorly
predicted with this scoring function [61]. Each docking algorithm can be more or less accurate
depending on the receptor and the ligand. A common way to account for these discrepancies is
utilizing consensus scoring, where ligands are selected that score well with multiple algorithms
[62]
Binding affinity in an aqueous environment is an extremely important parameter that
plays a key role in affinity, which most programs don’t take into account [61]. The WaterMap
application (Schrödinger, Inc.) for example, calculates the energetic favorability of the
displacement of water molecules in a given site on a protein [63]. WaterMap has shown to be
particularly effective when used with Schrödinger docking algorithm glide SP [63]. This
application has been applied to the A2A receptor and was successfully able to rationalize the
observed structure-activity relationship (SAR) of its tiazolylpurine ligands [64]. While programs
such are WaterMap are extremely useful tools for drug discovery, they’re expensive, resource
intensive, and not widely implemented as a result.
Another major consideration is that proteins do not exist as static structures [61]. A
strategy that takes into account that proteins adopt multiple conformations in solution is
ensemble docking [65]. In this approach a molecular dynamics simulation is run and frames of
protein confirmations are extracted. The ligand library is then docked into the various frames of
20
the simulation and the top scoring ligands from each of the potential conformations are used
[65].
As the induced fit model of enzyme function suggests receptors frequently change
structure upon ligand binding. These changes can be very ligand specific, and the uniform,
ridged treatment of a receptor with a given ligand library does not accurately represent actual
binding events. Sampling protein conformations is a major obstacle of in silico screening due to
receptor size and complexity [61]. Strategies, such as induced fit docking, exist that allow for a
degree of receptor flexibility when docking a set of ligands [66]
The prediction of covalent interactions of ligand with the receptor is another major
limitation. With the recent renewed interest in covalent drugs [67], a high throughput way of
predicting both reversible and irreversible covalent ligand-receptor interactions would be a
useful tool. Recently there has been progress in producing a more high-throughput method with a
program called DOCKovalent [68]. This uses the non-covalent program DOCK3.6 to
exhaustively search for poses of the ligand with respect to the covalent bond that will be formed,
and second screen is done to each for rotamers of the nucleophile [68].
With the ever-increasing number of published high-resolution macromolecule structures
and improved accuracy of in silico tools, this technology is poised to change drug discovery in
the coming years.
ii. Disrupting the RAS-effector interaction using molecular docking
The first reported small molecule RAS binder that inhibits its interactions with its
downstream effector proteins was by Shima et al. [71]. They implemented an in silico screen of
GTP bound MRASP40D against 40,882 commercially available compounds. This form was found
21
to have a previously unknown confirmation that possesses a more druggable, potential ligand-
binding site than those of the previously established conformations. The top 97 scoring
compounds were evaluated in a RAS-RAF binding assay. The top hit, Kobe0065, bound to RAS
with a KD of 46 µM. This compound displayed the ability to disrupt the RAS-RAF and RAS-
PI3K signaling pathways in HRASG12V transfected NIH3T3 cells, as well as demonstrated
moderate activity in an SW480 mouse xenograft [71].
iii. Ligand-based in silico screening
A pharmacophore is the spatial orientation of chemical features (hydrophobic regions,
hydrogen bond donors, hydrogen bond acceptors, and charges) that confer a molecule its
bioactivity [69]. A pharmacophore model is constructed using knowledge of a ligand’s
bioactivity, derived from its SAR profile that is obtained from testing a series of similar analogs.
A pharmacophore screen of commercially available or synthetically accessible molecules can
then be performed in order to discover molecules that match the desired features to improve
affinity [69]. It can be applied as a pre-docking filter if there are desired interactions to be made
with the receptor, as it is much less computationally resource intensive [70].
VIg. ADMET property optimization
The major bottleneck of drug development isn’t finding a compound with high enough
binding affinity to a target, but rather optimizing its absorption, distribution, metabolism,
excretion, and toxicity (ADMET) characteristics [72]. It was estimated that the development of a
new drug costs on average more than 800 million dollars, 75% of which is accumulated in the
process of initial development of failed lead compounds [72]. A molecule’s ADMET profile is
22
due to a combination of various physiochemical properties that a molecule possesses. While
these properties can be measured experimentally, the process is time consuming; instead,
computational predictions are much more widely used [72].
i. Physicochemical properties of successful drugs
Potential screening collections and synthetically feasible library candidates are typically
filtered to fall within ideal ranges of the properties in order to maximize the chance of finding a
successful clinical contender [72]. The mostly widely applied set of physiochemical parameters
for selecting compounds for screening is “Lipinski’s rule of five” [73]. Upon analyzing the
properties of marketed drugs, Christopher Lipinski observed that the vast majority of orally
available drugs posses the following characteristics: logP<5, hydrogen bond donors ≤ 5,
hydrogen bond acceptors ≤ 10, and molecular weight <500. This set of parameters was coined
“Lipinski’s rule of five”, as they all occurred in multiples of five [73].
Since the observations made by Lipinski a number of other physicochemical parameters
have been applied more frequently as library filters. The entropic barrier of drug binding is
associated with the number of rotatable bonds, and has been found to be less than 10 in the
majority of successful drug candidates [74]. Lower polar surface area increases the
bioavailability of drugs [74]. Molecules with more polar surface area have more trouble crossing
the cell membrane, especially the epithelium of the intestines, in the case of oral administration.
A common method to determine the oral bioavailability of drugs is the caco-2 permeability assay
[75]. The caco-2 cell line is derived from human colon carcinoma and resembles intestinal
epithelial cells in that they form a polarized monolayer [75]. The ability of a compound to cross
the epithelium of the intestines, and therefore its oral bioavailability, can be estimated by
23
assessing transport across the monolayer [75]. Compounds that are too lipophilic have problems
with aqueous solubility. This can greatly limit the type of biological assays that can be performed
to characterize a potential hit compound [76, 77]. This can often be difficult to optimize, as
hydrophobic interactions are usually the primary force that drives the binding of small molecule
drugs to their targets [76].
ii. Drug metabolism
Another problem that arises from poor aqueous solubility is the issue of drug metabolism
[77, 78]. Drug metabolizing enzymes act particularly strongly on hydrophobic compounds in
order to make them more polar and to help facilitate excretion [78]. Cytochrome P450 isoforms,
for example, have a hydrophobic binding pocket that enables the relatively non-specific binding
of drugs, which can then be oxidized through their heme prosthetic group [79]. This can lead to
drug hydroxylation, which can be sufficient to inactivate the drug, accelerate its excretion, or be
used a chemical handle for a secondary modification by phase II drug metabolizing enzymes
[79]. Phase II enzymes attach a highly hydrophilic group, such as glucoronic acid or a sulfate, to
further enhance the rate of excretion. Metabolic transformations can also lead to the production
of a reactive metabolite that can cause toxicity [80].
Computational methods also exist for predicting the susceptibility of a small molecule to
metabolic transformations, such as P450 Site of Metabolism (Schrödinger, Inc.). This program
calculates the intrinsic reactivity of a molecule and indicates sites that are prone to CYP450
oxidation. Next, it performs induced fit docking into isoforms of CYP450 and predicts the
accessibility of different portions of the molecule to the reactive heme group that catalyzes the
24
oxidation [81]. The net result is a summary of potential reactive sites and their susceptibility to
CYP450 mediated metabolism.
iii. Drug toxicity
Filtering for toxicity prior to experimental testing can be challenging. One approach is to
filter for chemically reactive groups that have been linked to the toxicity of hits discovered in
previous screens [72]. These so-called ‘toxicophores’ include chloroacetamides, Michael
acceptors, and epoxides among others. Moieties with a high degree of electrophilicity become
covalently bound to proteins by reacting with nucelophilic residues such as cysteine or lysine
and, primarily in proteases, serine and threonine [67]. Additionally electrophilic groups can react
with the thiol of glutathione, present in millimolar concentrations in the cell [79]. Despite these
potential issues there has recently been resurgence in the interest in covalent drugs, with the
thought that the toxicity would be minimal if enough target specificity is attained by the rest of
the molecule [67].
The human ether-a-go-go related gene (hERG) encodes a potassium channel that
regulates cardiac action potential [81]. hERG is a particularly promiscuous binder and is
commonly associated with drug toxicity [81]. A common computational approach to address this
is utilizing pharmacophore modeling of known binders to predict the propensity of a molecule to
inhibit the channel [81].
25
VIh. Mouse models for studying cancer drugs
i. Mouse tumor xenograft models
A number of different types of animal models exist for studying cancer and the efficacy
of cancer drugs [84, 85]. The most widely used type for the initial assessment of a molecule’s in
vivo activity is a mouse xenograft model [84]. In this model cell lines are cultured in vitro and
injected into a mouse to develop into a tumor. To prevent the rejection of these foreign cells by
the mouse’s immune system nude or NOD/SCID mice are typically used. Once a tumor reaches
the desired size, therapeutic efficacy of a drug is assessed throughout the dosage period, usually
by measuring tumor size [84].
While xenografts provide a good initial gauge of the in vivo activity of a cancer drug,
they have several disadvantages [84]. Cells cultured in vitro are exposed to vastly different
conditions than cancer forming in the body. For instance, they have much greater exposure to
oxygen and the nutrient content of the media is very different to nutrients circulating in the blood
stream. These cells have been adapted to grow outside an endogenous tumor microenvironment,
which results in genetic changes that are not reflective of the stress that growth in a normal
tumor environment would produce [84]. Several factors of the malignant phenotype, such as
metastasis and angiogenesis, are impossible to reproduce in a simple xenograft model [84]. The
use of immunocompromised mice also neglects the influence of lymphatic circulation and
immune cells on cancer progression, and precludes the use of testing immunomodulators [84].
As a result, there have been instances where a drug shows promise in a xenograft, but is much
less effective in a more sophisticated model.
26
ii. Targeting post-translational processing of RAS as an example of the limitations of a xenograft
model
Farnesylation and palmitoylation have been rigorously pursed as drug targets for RAS
and other GTPases [9, 10, 27, 28]. Farnesyltransferase inhibitors (FTI) have been developed as
both farnesyl pyrophosphate (FPP) analogs and mimics of the CAAX motif on RAS [27, 28].
Two such inhibitors, tipifarnib and lonafarnib, progressed to phase II clinical trials [27, 28].
While targeting farneseylation was effective with HRAS- KRAS (the most frequently mutated
isoform) and NRAS were found to undergo geranylgernanylation (through GGTase I) as a means
to compensate for the farnesyl transferase inhibition [28]. Combination treatment for both
pathways was found to be too cytotoxic to be a viable strategy [28].
Following the disappointing outcome of the FTIs, targeting enzymes involved in RAS
localization post-prenylation was then explored. Given the sizeable amount of farnesylated and
gernylgernaylated proteins, targeting PDE6δ would appear to allow for a larger therapeutic
window. A high throughput screen (HTS) was performed with biotinylated and farnesylated
KRAS4B against a His-tagged PDEδ to find molecules that disrupt this interaction [29]. Several
hits containing a benzimidazole scaffold were identified and optimized to bind in the low
nanomolar range [29]. Preliminary evidence of their therapeutic utility was then demonstrated in
a mouse xenograft of Panc-Tu-I cells [29]. Hopefully further evaluation in more sophisticated
models will reveal that this is a viable target for RAS mutated cancers.
iii. Patient-derived xenografts
An alternative to using standard cell lines is a patient-derived tumor xenograft. This
methodology entails the surgical isolation of a fresh sample from a patient. Cells are then
27
cultured in vitro and implanted into a mouse. This model is thought to maintain the genetic and
histological heterogeneity of a tumor and, as a result, more accurately predict the clinical
efficacy of anticancer agents [84].
iv. Genetically engineered mouse models
The lack of pre-clinical models that recapitulate the heterogeneity of tumors in patients is
one of the most frequently cited reasons for the failure of new anticancer agents [84]. Genetically
engineered models (GEMs) exist to overcome these significant limitations and more accurately
mimic the molecular and pathophysiological features of cancer.
GEMs can be classified into two general categories: endogenous or transgenic [85].
While endogenous GEMs entail the expression or loss of expression of a gene on its endogenous
promoter, transgenic involves the less specific insertion of the construct into the genome. Both
cases are most commonly accomplished by either a direct injection or lentiviral transduction of a
desired altered mouse embryonic stem cells. Following selection of stem cells containing the
construct, they are subsequently injected into the blastocyst of a female mouse [85]. Mice are
raised and bred until the desired genotype is achieved.
v. CRE-lox system for tissue specific models
CRE is a recombinase that excises a portion of DNA that is flanked by the short
palindromic lox-P sequences [85]. This method is widely used to either inactivate or activate a
particular gene in a GEM. In the case of inactivation, the gene of interest is flanked by lox
sequences and is subsequently removed by CRE. In the case of gene activation, a stop codon
flanked by lox sequences is situated between the gene of interest and the promoter [85]. CRE
28
expression removes the stop codon allowing for gene expression. Tissue specific activation or
inactivation can be achieved through the linking of CRE to the promoter of a gene only
expressed in a particular tissue type [85].
vi. Inducible gene expression for temporal control
Temporal regulation of gene expression is typically accomplished via an inducible target
gene expression system under the control of an exogenous ligand [85]. The most common
example of this is using the tetracycline operon where tetracycline (or the less toxic doxycycline)
promotes or inhibits target gene expression [85, 86]. This can also be linked to the CRE-lox
system to achieve both spatial and temporal control of a particular gene. A model of this type
can be very useful in studying the dependency of a gene in a particular cancer type, where tissue-
specific expression is turned on and off, and features of the malignancy are monitored.
vii. Essentiality of KRAS in PDAC using genetically engineered mouse models
The essentially of KRAS in the maintenance of pancreatic ductal adenocarcinoma
(PDAC) was strongly supported through the use of genetically engineered mouse models with
inducible oncogenic RAS [86]. In this series of experiments, temporal control of KRASG12D
expression was accomplished using a tet-operator with a lox-stop-lox cassette between the
promoter and the start codon. Pancreatic specific expression occurred through p48 linked CPE.
To best recapitulate full malignant progression these mice were crossed with conditional p53
knockout mice. All mice succumbed to PDAC between 8 and 22 weeks of doxycycline treatment
at 3 weeks of age. To investigate the essentiality of oncogenic KRAS in PDAC progression
following 9 weeks of induction, doxycycline treatment was abrogated. Extinction of KRASG12D
29
led to rapid tumor regression. MRI and PET/CT analyses of the tumor following one week of
withdrawal resulted in a 50% reduction in tumor mass and complete loss of fluorodeoxyglucose
uptake, respectively [86]; thus demonstrating a crucial role of RAS in PDAC.
VII. Perspectives
30 years after the discovery of the RAS family of GTPases they still remain elusive to
pharmacological inhibition. Over the past three years several groups have identified compounds
that bind to RAS proteins. Mauer et al. [37] described compounds that bind to RAS-GDP and
prevent SOS-mediated nucleotide exchange. Treatment with an inhibitor of this type would be
applicable in cancers that require activation of wild-type RAS through SOS for proliferation;
mutated RAS remains unaffected by this class of compounds. Shima et al. [71] described
compounds that inhibit the interaction of RAS with its effector proteins, and showed modest
activity in a mouse tumor xenograft. Ostrem et al. [39] reported covalent inhibitors from a
fragment screening approach, tethering, which selectively target KRASG12C by exploiting the
reactive cysteine present in the mutant. While this represents an important advance for
addressing some RAS malignancies it is only applicable to this specific mutant, present in only
about one in eight KRAS mutated samples [82]. In the panel of cell lines tested with this
compound, the selective inhibition of growth in KRASG12C cells ranged from three-fold
inhibition in the most sensitive cell line, to no selectivity in the least. This narrow window may
be attributable to the reactive electrophile present in the inhibitors.
The definition of ‘druggability’ has been changing as a result of new and innovative
approaches, particularly with targets engaging in protein-protein interactions [83]. While
enormous progress has been made towards tackling α-helix mediated interactions [7], there are

30
few published instances of small molecule inhibitors of the more exigent β-strand mediated
interactions [8]. This necessitates the development of new, generalizable approaches for
pharmacological inhibition such as those described in this work.
31
Chapter 2: Computational design, synthesis, and biochemical evaluation of small molecule
RAS inhibitors
The data presented in this chapter is part of a submitted manuscript: Welsch M.E., Kaplan A.,
Chambers J.M., Pagano N.C., Yang W.S., M.S. Martin, Badgley M.A., Olive K.P., Ferrando A.,
Stockwell B.R., Multivalent inhibitors of RAS GTPases designed using PAINT
I. Introduction
The major challenge with disrupting protein-protein interactions (PPIs) is the
substantially lower surface area encompassed by a small molecule compared to that of a protein-
protein interface [3]. Alanine scanning mutagenesis experiments performed on the human growth
hormone (hGH) and its receptor (hGHbp) lent credence to the idea that inhibiting PPI
interactions may be possible by only encompassing a portion of the overall interface surface area
[87]. Individual replacement of the 33 residues making contact at the hGH/hGHbp interface with
alanine revealed certain residues contributed more substantially to the overall binding affinity
than others [87]. In fact, two tryptophan residues accounted for more than 75% of the overall
binding affinity. This was the first report of “hot spot” residues existing at a protein-protein
interface [87]. Since then a number of different groups have performed both computational and
experimental analyses on PPIs to map these functionally important residues [88]. With a wealth
of knowledge available about the interaction of RAS with its effector proteins on the molecular
level, we sought to analyze which interactions confer a larger amount of binding affinity with the
hope of formulating information about these binding ‘hot spot’ residues into a targeting strategy
using small molecules.
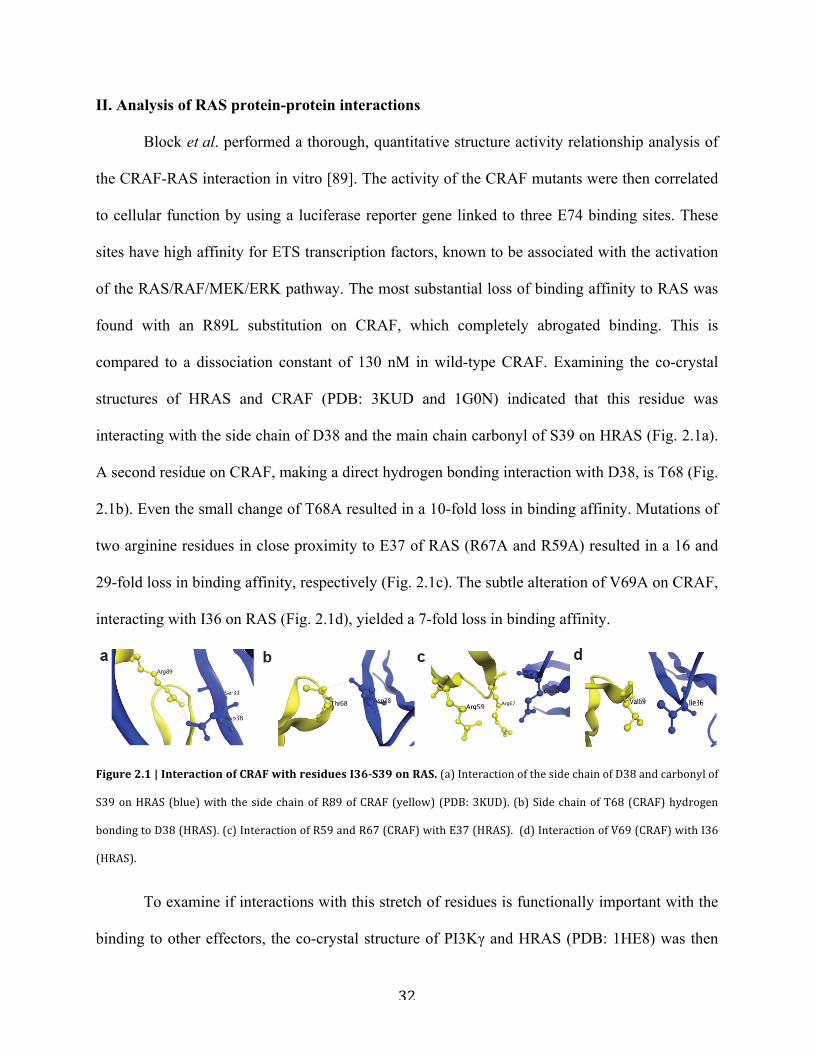
32
II. Analysis of RAS protein-protein interactions
Block et al. performed a thorough, quantitative structure activity relationship analysis of
the CRAF-RAS interaction in vitro [89]. The activity of the CRAF mutants were then correlated
to cellular function by using a luciferase reporter gene linked to three E74 binding sites. These
sites have high affinity for ETS transcription factors, known to be associated with the activation
of the RAS/RAF/MEK/ERK pathway. The most substantial loss of binding affinity to RAS was
found with an R89L substitution on CRAF, which completely abrogated binding. This is
compared to a dissociation constant of 130 nM in wild-type CRAF. Examining the co-crystal
structures of HRAS and CRAF (PDB: 3KUD and 1G0N) indicated that this residue was
interacting with the side chain of D38 and the main chain carbonyl of S39 on HRAS (Fig. 2.1a).
A second residue on CRAF, making a direct hydrogen bonding interaction with D38, is T68 (Fig.
2.1b). Even the small change of T68A resulted in a 10-fold loss in binding affinity. Mutations of
two arginine residues in close proximity to E37 of RAS (R67A and R59A) resulted in a 16 and
29-fold loss in binding affinity, respectively (Fig. 2.1c). The subtle alteration of V69A on CRAF,
interacting with I36 on RAS (Fig. 2.1d), yielded a 7-fold loss in binding affinity.
Figure 2.1 | Interaction of CRAF with residues I36-‐S39 on RAS. (a) Interaction of the side chain of D38 and carbonyl of
S39 on HRAS (blue) with the side chain of R89 of CRAF (yellow) (PDB: 3KUD). (b) Side chain of T68 (CRAF) hydrogen
bonding to D38 (HRAS). (c) Interaction of R59 and R67 (CRAF) with E37 (HRAS). (d) Interaction of V69 (CRAF) with I36
(HRAS).
To examine if interactions with this stretch of residues is functionally important with the
binding to other effectors, the co-crystal structure of PI3Kγ and HRAS (PDB: 1HE8) was then
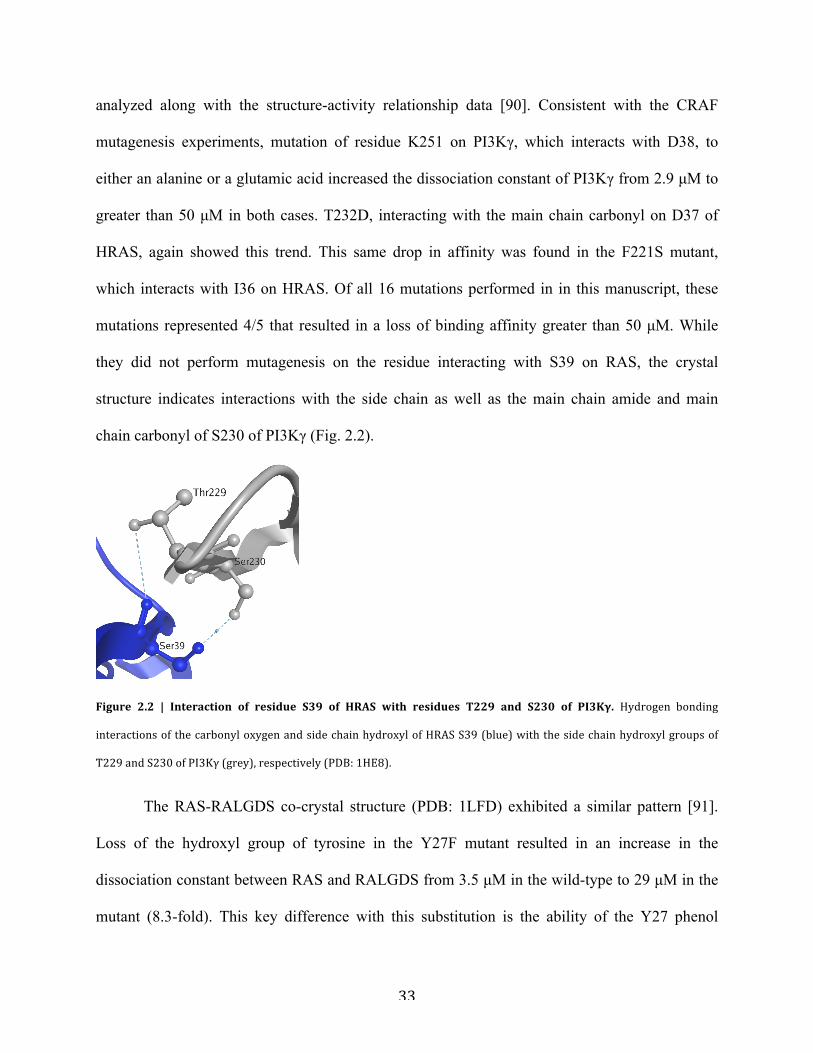
33
analyzed along with the structure-activity relationship data [90]. Consistent with the CRAF
mutagenesis experiments, mutation of residue K251 on PI3Kγ, which interacts with D38, to
either an alanine or a glutamic acid increased the dissociation constant of PI3Kγ from 2.9 µM to
greater than 50 µM in both cases. T232D, interacting with the main chain carbonyl on D37 of
HRAS, again showed this trend. This same drop in affinity was found in the F221S mutant,
which interacts with I36 on HRAS. Of all 16 mutations performed in in this manuscript, these
mutations represented 4/5 that resulted in a loss of binding affinity greater than 50 µM. While
they did not perform mutagenesis on the residue interacting with S39 on RAS, the crystal
structure indicates interactions with the side chain as well as the main chain amide and main
chain carbonyl of S230 of PI3Kγ (Fig. 2.2).
Figure 2.2 | Interaction of residue S39 of HRAS with residues T229 and S230 of PI3Kγ. Hydrogen bonding
interactions of the carbonyl oxygen and side chain hydroxyl of HRAS S39 (blue) with the side chain hydroxyl groups of
T229 and S230 of PI3Kγ (grey), respectively (PDB: 1HE8).
The RAS-RALGDS co-crystal structure (PDB: 1LFD) exhibited a similar pattern [91].
Loss of the hydroxyl group of tyrosine in the Y27F mutant resulted in an increase in the
dissociation constant between RAS and RALGDS from 3.5 µM in the wild-type to 29 µM in the
mutant (8.3-fold). This key difference with this substitution is the ability of the Y27 phenol
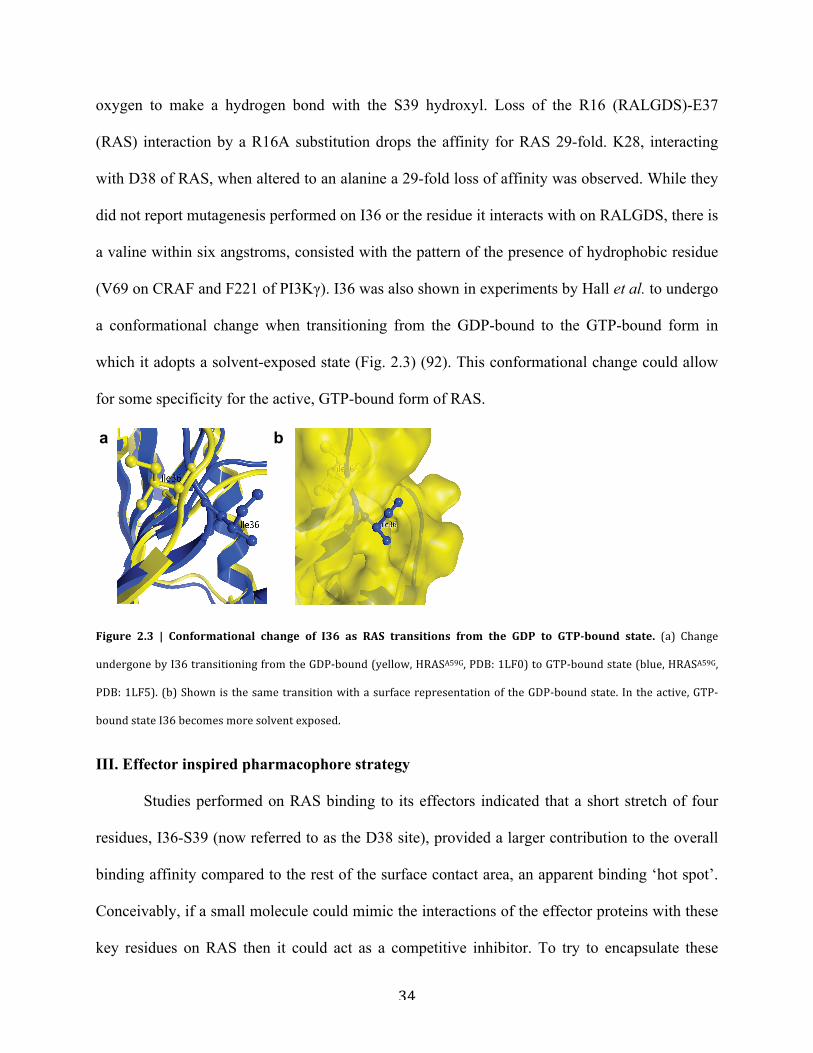
34
oxygen to make a hydrogen bond with the S39 hydroxyl. Loss of the R16 (RALGDS)-E37
(RAS) interaction by a R16A substitution drops the affinity for RAS 29-fold. K28, interacting
with D38 of RAS, when altered to an alanine a 29-fold loss of affinity was observed. While they
did not report mutagenesis performed on I36 or the residue it interacts with on RALGDS, there is
a valine within six angstroms, consisted with the pattern of the presence of hydrophobic residue
(V69 on CRAF and F221 of PI3Kγ). I36 was also shown in experiments by Hall et al. to undergo
a conformational change when transitioning from the GDP-bound to the GTP-bound form in
which it adopts a solvent-exposed state (Fig. 2.3) (92). This conformational change could allow
for some specificity for the active, GTP-bound form of RAS.
Figure 2.3 | Conformational change of I36 as RAS transitions from the GDP to GTP-‐bound state. (a) Change
undergone by I36 transitioning from the GDP-‐bound (yellow, HRASA59G, PDB: 1LF0) to GTP-‐bound state (blue, HRASA59G,
PDB: 1LF5). (b) Shown is the same transition with a surface representation of the GDP-‐bound state. In the active, GTP-‐
bound state I36 becomes more solvent exposed.
III. Effector inspired pharmacophore strategy
Studies performed on RAS binding to its effectors indicated that a short stretch of four
residues, I36-S39 (now referred to as the D38 site), provided a larger contribution to the overall
binding affinity compared to the rest of the surface contact area, an apparent binding ‘hot spot’.
Conceivably, if a small molecule could mimic the interactions of the effector proteins with these
key residues on RAS then it could act as a competitive inhibitor. To try to encapsulate these
a b
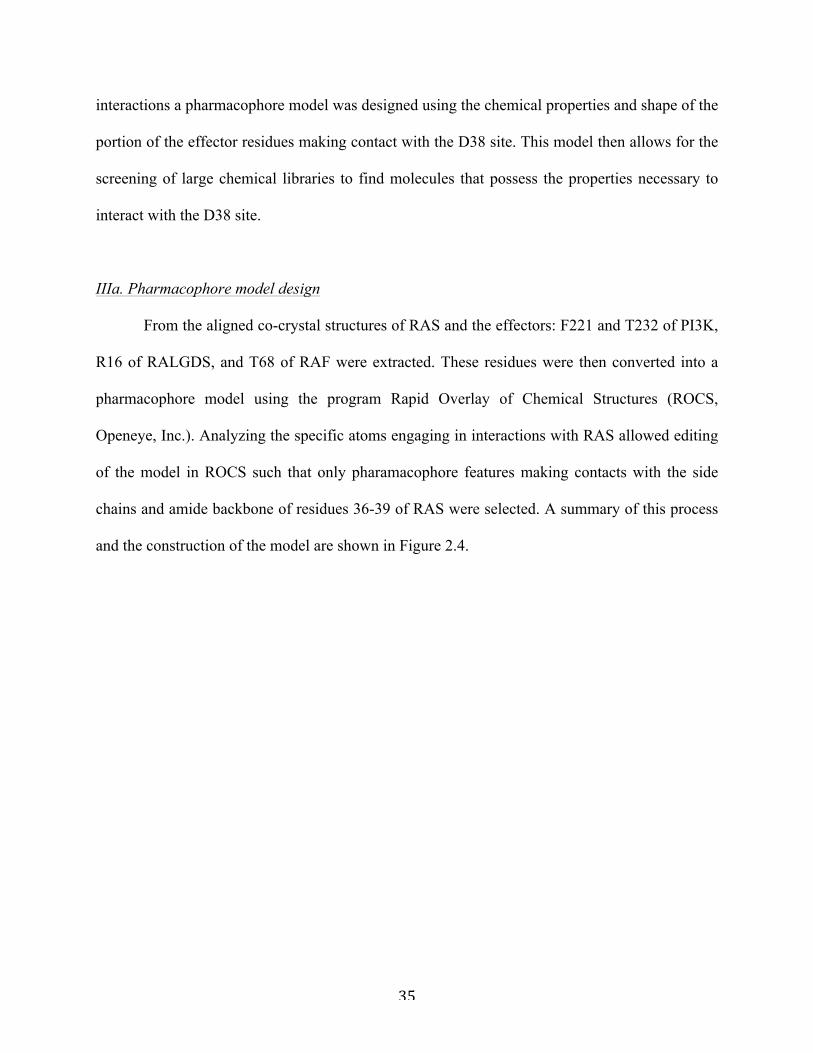
35
interactions a pharmacophore model was designed using the chemical properties and shape of the
portion of the effector residues making contact with the D38 site. This model then allows for the
screening of large chemical libraries to find molecules that possess the properties necessary to
interact with the D38 site.
IIIa. Pharmacophore model design
From the aligned co-crystal structures of RAS and the effectors: F221 and T232 of PI3K,
R16 of RALGDS, and T68 of RAF were extracted. These residues were then converted into a
pharmacophore model using the program Rapid Overlay of Chemical Structures (ROCS,
Openeye, Inc.). Analyzing the specific atoms engaging in interactions with RAS allowed editing
of the model in ROCS such that only pharamacophore features making contacts with the side
chains and amide backbone of residues 36-39 of RAS were selected. A summary of this process
and the construction of the model are shown in Figure 2.4.
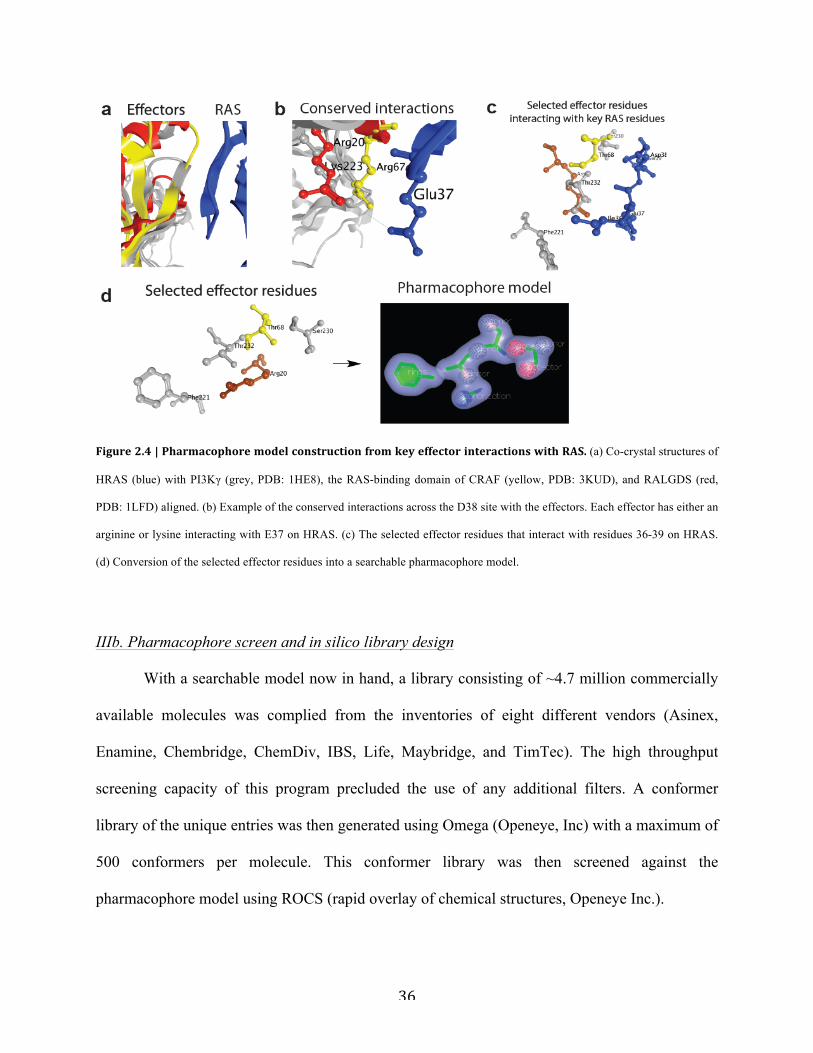
36
Figure 2.4 | Pharmacophore model construction from key effector interactions with RAS. (a) Co-crystal structures of
HRAS (blue) with PI3Kγ (grey, PDB: 1HE8), the RAS-binding domain of CRAF (yellow, PDB: 3KUD), and RALGDS (red,
PDB: 1LFD) aligned. (b) Example of the conserved interactions across the D38 site with the effectors. Each effector has either an
arginine or lysine interacting with E37 on HRAS. (c) The selected effector residues that interact with residues 36-39 on HRAS.
(d) Conversion of the selected effector residues into a searchable pharmacophore model.
IIIb. Pharmacophore screen and in silico library design
With a searchable model now in hand, a library consisting of ~4.7 million commercially
available molecules was complied from the inventories of eight different vendors (Asinex,
Enamine, Chembridge, ChemDiv, IBS, Life, Maybridge, and TimTec). The high throughput
screening capacity of this program precluded the use of any additional filters. A conformer
library of the unique entries was then generated using Omega (Openeye, Inc) with a maximum of
500 conformers per molecule. This conformer library was then screened against the
pharmacophore model using ROCS (rapid overlay of chemical structures, Openeye Inc.).
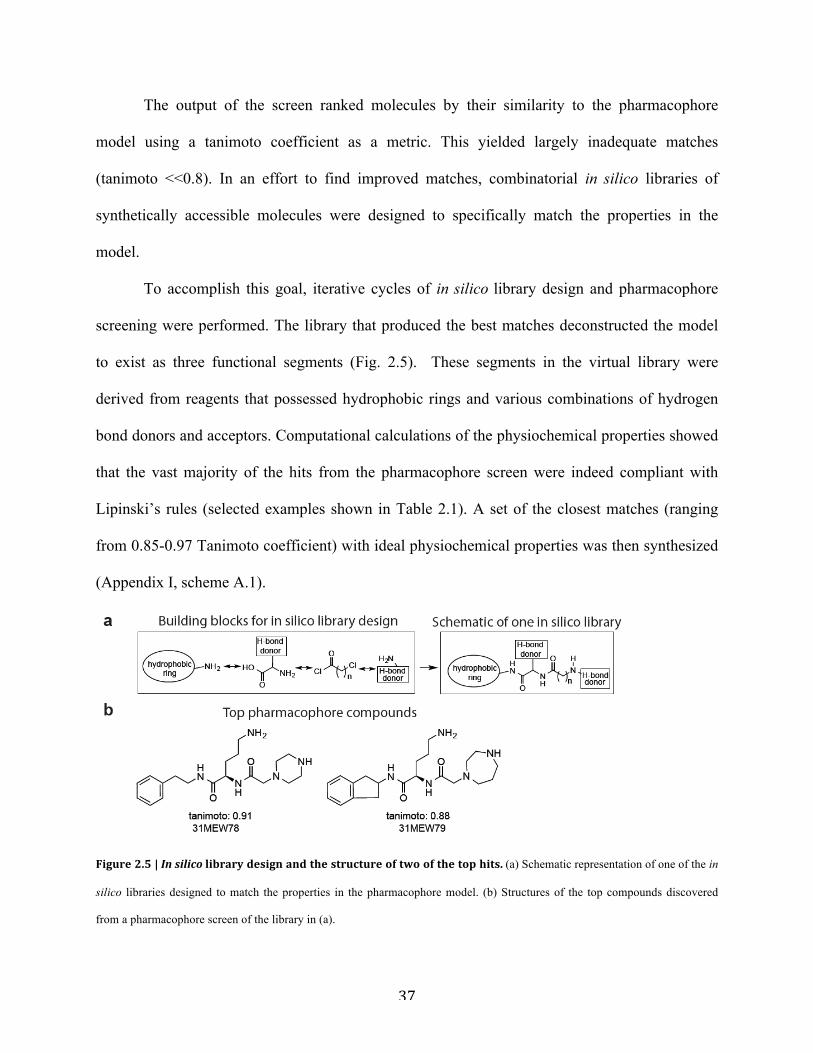
37
The output of the screen ranked molecules by their similarity to the pharmacophore
model using a tanimoto coefficient as a metric. This yielded largely inadequate matches
(tanimoto <<0.8). In an effort to find improved matches, combinatorial in silico libraries of
synthetically accessible molecules were designed to specifically match the properties in the
model.
To accomplish this goal, iterative cycles of in silico library design and pharmacophore
screening were performed. The library that produced the best matches deconstructed the model
to exist as three functional segments (Fig. 2.5). These segments in the virtual library were
derived from reagents that possessed hydrophobic rings and various combinations of hydrogen
bond donors and acceptors. Computational calculations of the physiochemical properties showed
that the vast majority of the hits from the pharmacophore screen were indeed compliant with
Lipinski’s rules (selected examples shown in Table 2.1). A set of the closest matches (ranging
from 0.85-0.97 Tanimoto coefficient) with ideal physiochemical properties was then synthesized
(Appendix I, scheme A.1).
Figure 2.5 | In silico library design and the structure of two of the top hits. (a) Schematic representation of one of the in
silico libraries designed to match the properties in the pharmacophore model. (b) Structures of the top compounds discovered
from a pharmacophore screen of the library in (a).
38
Table 2.1 | Calculated physiochemical properties of 31MEW78 and 31MEW79. Each of these properties was
calculated using MOE (chemical computing group inc.).
IIIc. Pharmacophore results summary and strategy for improving affinity
The biochemical evaluation of the synthesized hits indicated that they bound to RAS and
prevented it from interacting with CRAF and RALGDS at millimolar concentrations (see
Appendix I). Unfortunately, the compounds were inactive when evaluated in RAS mutated
cancer cell lines (data not shown). While the activity of the pharamcophore compounds was very
modest, it was encouraging that they possessed any PPI inhibitory activity with the low
molecular weight of the compounds and lack of druggable characteristics of the site targeted. It
appears that this is an ideal region of the protein to target, but more contacts with the surface of
the RAS protein are needed to confer enough binding affinity and specificity for further testing
in cell culture and in vivo.
Reanalysis of the RAS structure revealed that directly adjacent to the D38 site there exists
two shallow pockets (Fig 2.6a-b). One site, situated between the switch I and switch II regions, is
centered at A59 (A59 site). Towards the c-terminal end of the D38 site is another shallow cavity,
which exists only in the active form of RAS. In transitioning from the inactive GDP-bound form
to the active GTP-bound form, Y32 undergoes a conformational change where the side chain
flips over to the other end of the GTP binding site and the hydroxyl groups makes a hydrogen
388.5434
0.11-2.04
361.4945
-0.36-1.67
Molecular weightH-bond donorsH-bond acceptorslog(P)
Lipinski's rule of 5MW< 500H-bond donors </= 5H-bond acceptors </= 10log(P)<5
log(solubility in water)
31MEW78 31MEW79
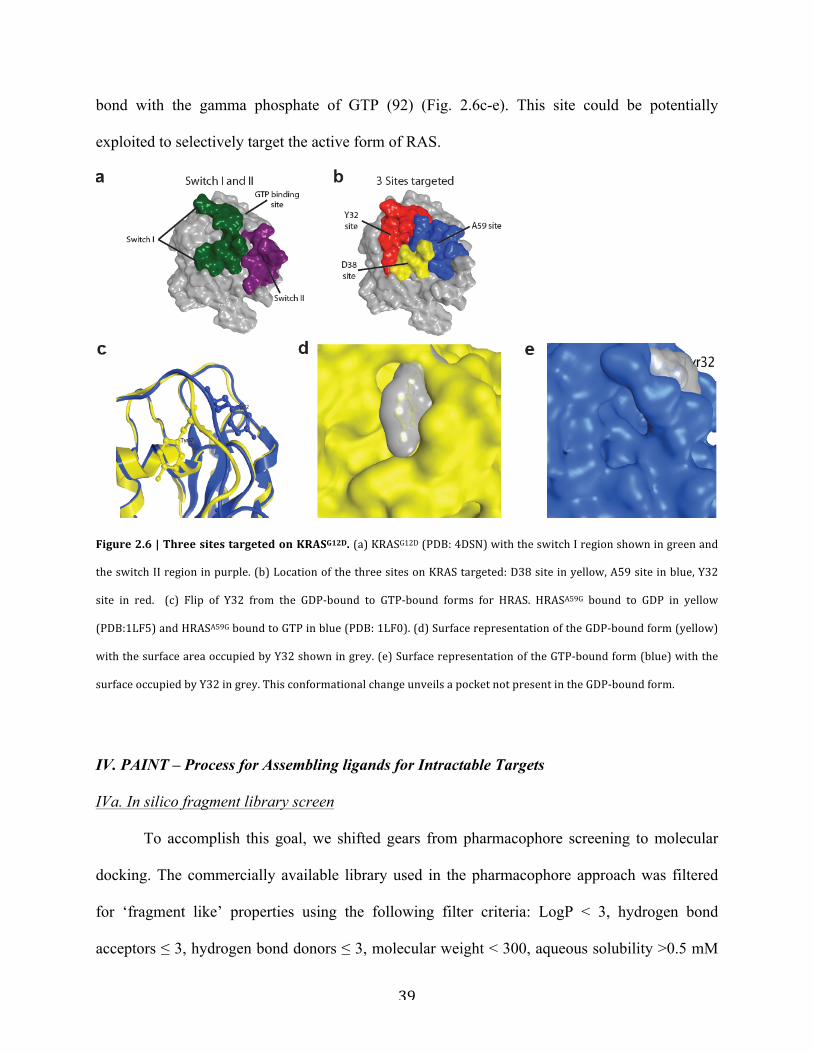
39
bond with the gamma phosphate of GTP (92) (Fig. 2.6c-e). This site could be potentially
exploited to selectively target the active form of RAS.
Figure 2.6 | Three sites targeted on KRASG12D. (a) KRASG12D (PDB: 4DSN) with the switch I region shown in green and
the switch II region in purple. (b) Location of the three sites on KRAS targeted: D38 site in yellow, A59 site in blue, Y32
site in red. (c) Flip of Y32 from the GDP-‐bound to GTP-‐bound forms for HRAS. HRASA59G bound to GDP in yellow
(PDB:1LF5) and HRASA59G bound to GTP in blue (PDB: 1LF0). (d) Surface representation of the GDP-‐bound form (yellow)
with the surface area occupied by Y32 shown in grey. (e) Surface representation of the GTP-‐bound form (blue) with the
surface occupied by Y32 in grey. This conformational change unveils a pocket not present in the GDP-‐bound form.
IV. PAINT – Process for Assembling ligands for Intractable Targets
IVa. In silico fragment library screen
To accomplish this goal, we shifted gears from pharmacophore screening to molecular
docking. The commercially available library used in the pharmacophore approach was filtered
for ‘fragment like’ properties using the following filter criteria: LogP < 3, hydrogen bond
acceptors ≤ 3, hydrogen bond donors ≤ 3, molecular weight < 300, aqueous solubility >0.5 mM
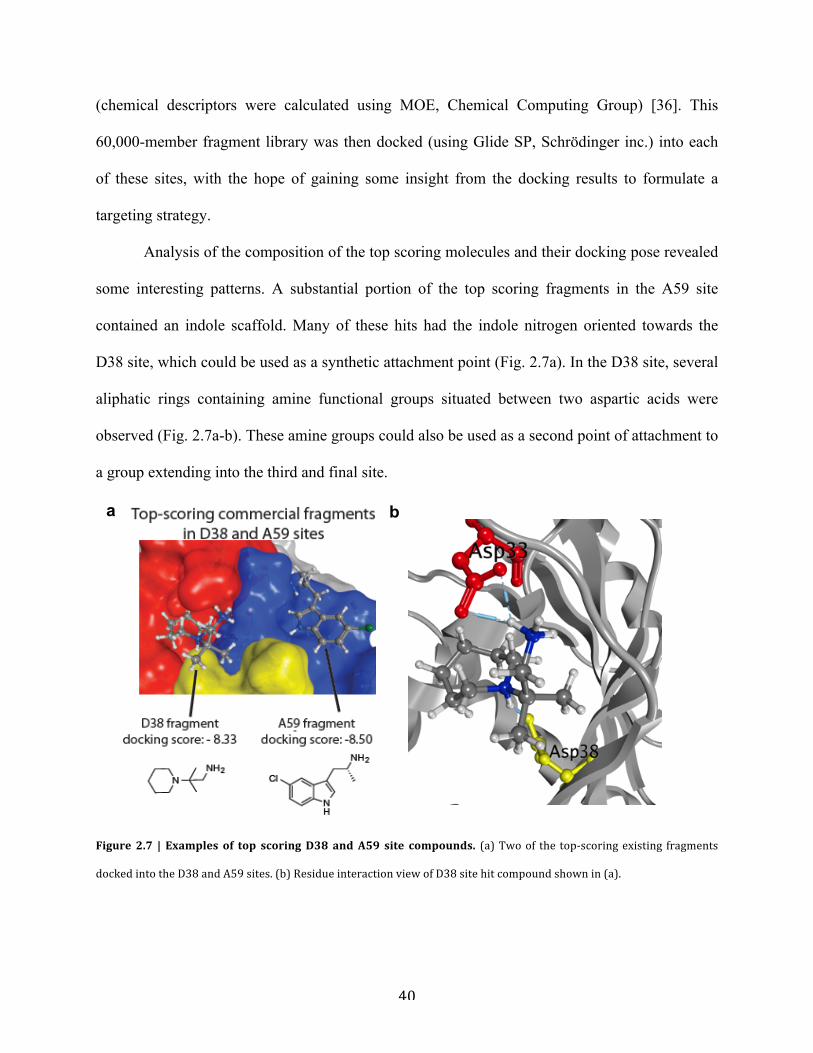
40
(chemical descriptors were calculated using MOE, Chemical Computing Group) [36]. This
60,000-member fragment library was then docked (using Glide SP, Schrödinger inc.) into each
of these sites, with the hope of gaining some insight from the docking results to formulate a
targeting strategy.
Analysis of the composition of the top scoring molecules and their docking pose revealed
some interesting patterns. A substantial portion of the top scoring fragments in the A59 site
contained an indole scaffold. Many of these hits had the indole nitrogen oriented towards the
D38 site, which could be used as a synthetic attachment point (Fig. 2.7a). In the D38 site, several
aliphatic rings containing amine functional groups situated between two aspartic acids were
observed (Fig. 2.7a-b). These amine groups could also be used as a second point of attachment to
a group extending into the third and final site.
Figure 2.7 | Examples of top scoring D38 and A59 site compounds. (a) Two of the top-‐scoring existing fragments
docked into the D38 and A59 sites. (b) Residue interaction view of D38 site hit compound shown in (a).
a b
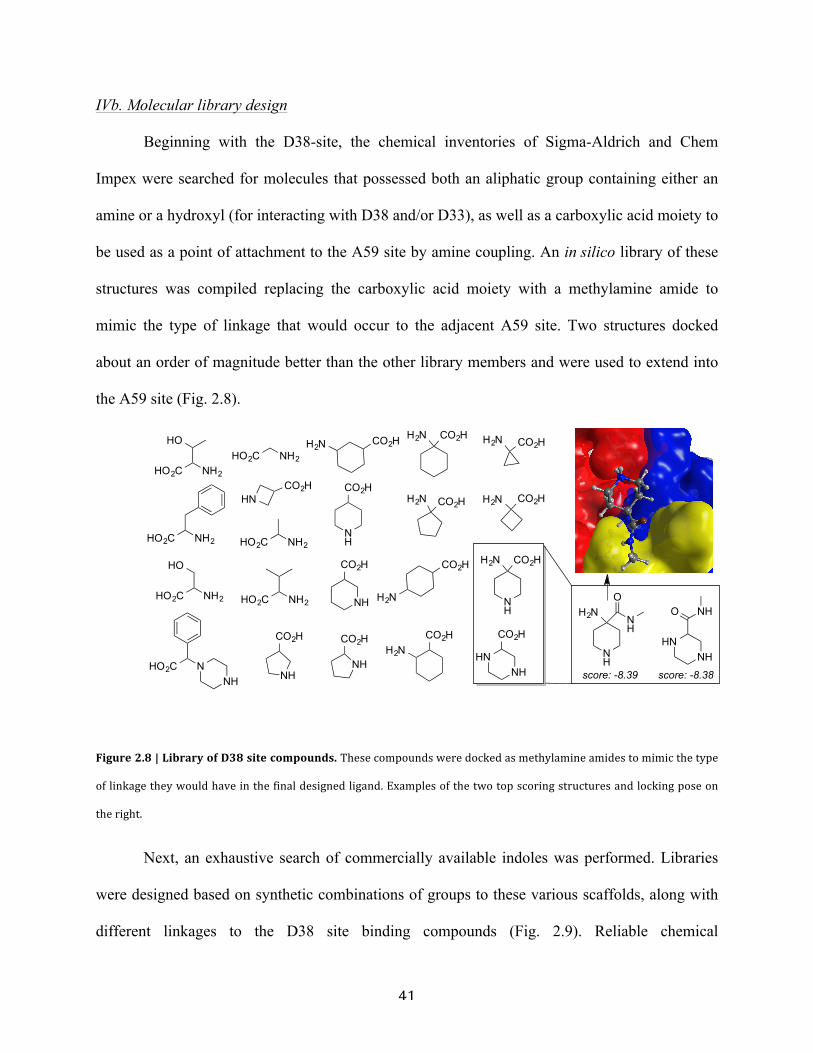
41
IVb. Molecular library design
Beginning with the D38-site, the chemical inventories of Sigma-Aldrich and Chem
Impex were searched for molecules that possessed both an aliphatic group containing either an
amine or a hydroxyl (for interacting with D38 and/or D33), as well as a carboxylic acid moiety to
be used as a point of attachment to the A59 site by amine coupling. An in silico library of these
structures was compiled replacing the carboxylic acid moiety with a methylamine amide to
mimic the type of linkage that would occur to the adjacent A59 site. Two structures docked
about an order of magnitude better than the other library members and were used to extend into
the A59 site (Fig. 2.8).
Figure 2.8 | Library of D38 site compounds. These compounds were docked as methylamine amides to mimic the type
of linkage they would have in the final designed ligand. Examples of the two top scoring structures and locking pose on
the right.
Next, an exhaustive search of commercially available indoles was performed. Libraries
were designed based on synthetic combinations of groups to these various scaffolds, along with
different linkages to the D38 site binding compounds (Fig. 2.9). Reliable chemical
H2N CO2H
CO2HH2NH2N CO2H
CO2HH2N
CO2HH2N
CO2H
H2N
H2N CO2H
NH
H2N CO2H
HNNH
CO2H
NH
CO2H
NH
CO2H
HO2C NH2
HO2C NH2
HO2C NH2HO2C NH2
HO
NH
CO2H
HO2C NH2
HO
HO2C NH2
NH
CO2H
HO2C NNH
HNCO2H
NH
H2NO
NH
score: -8.39 score: -8.38
HNNH
O NH
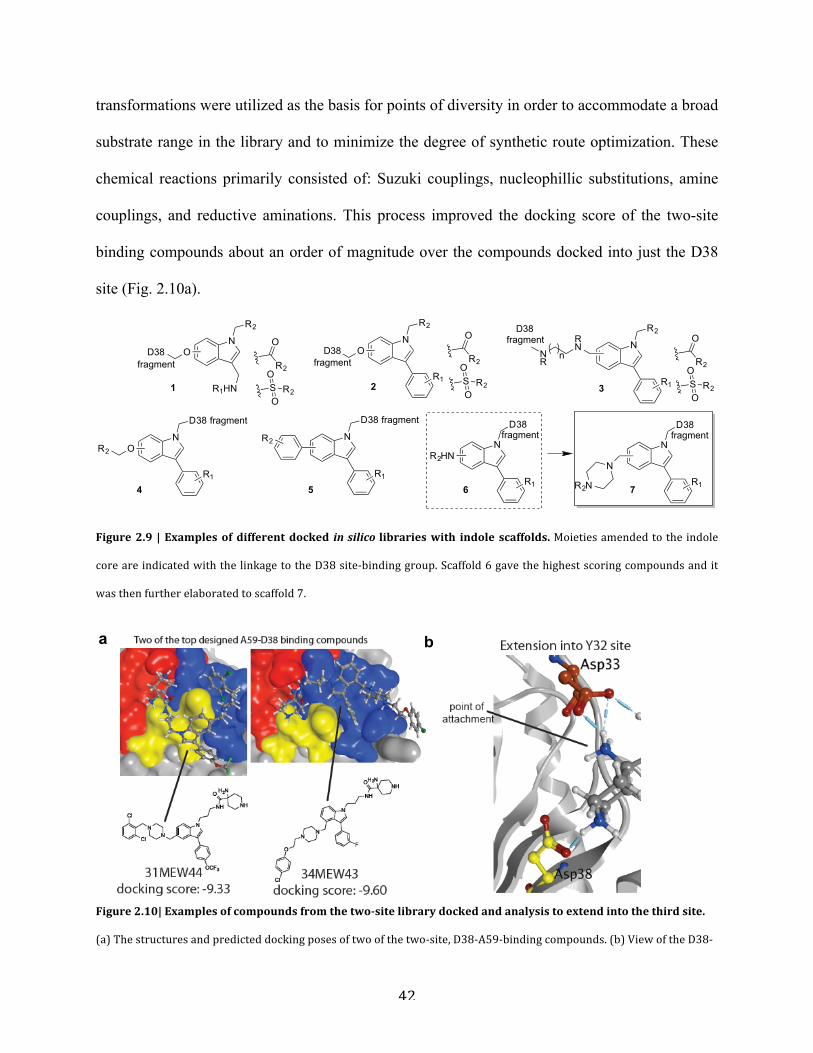
42
transformations were utilized as the basis for points of diversity in order to accommodate a broad
substrate range in the library and to minimize the degree of synthetic route optimization. These
chemical reactions primarily consisted of: Suzuki couplings, nucleophillic substitutions, amine
couplings, and reductive aminations. This process improved the docking score of the two-site
binding compounds about an order of magnitude over the compounds docked into just the D38
site (Fig. 2.10a).
Figure 2.9 | Examples of different docked in silico libraries with indole scaffolds. Moieties amended to the indole
core are indicated with the linkage to the D38 site-‐binding group. Scaffold 6 gave the highest scoring compounds and it
was then further elaborated to scaffold 7.
Figure 2.10| Examples of compounds from the two-‐site library docked and analysis to extend into the third site.
(a) The structures and predicted docking poses of two of the two-‐site, D38-‐A59-‐binding compounds. (b) View of the D38-‐
NR2HN
R1
D38
NO
R2
D38N
O
R1
R2
D38 fragment fragment
fragment
R1HN
N
R1
D38fragment
N
R2N
1 2
4 7
NO
R1
D38 fragment
R2
5
N
R1
D38 fragment
R2
6
N
R1
R2
3
RN
NR
n
D38fragmentO
R2
S R2
O
O
O
R2
S R2
O
O
O
R2
S R2
O
O
a b
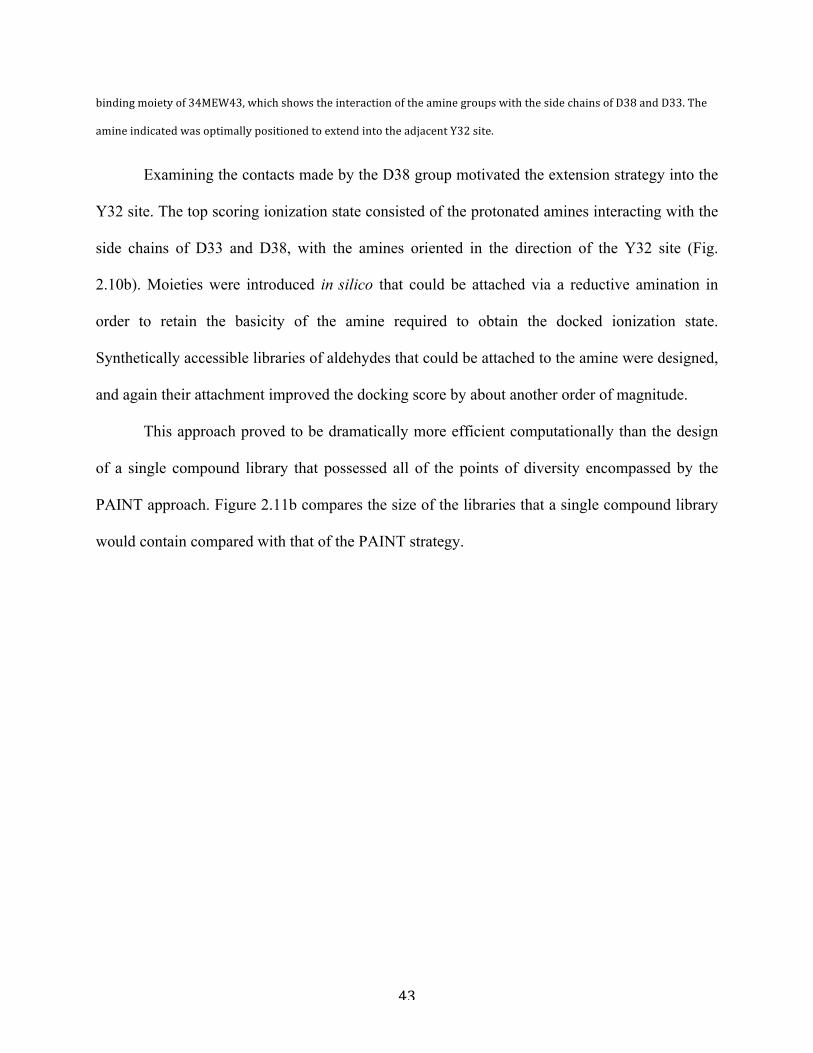
43
binding moiety of 34MEW43, which shows the interaction of the amine groups with the side chains of D38 and D33. The
amine indicated was optimally positioned to extend into the adjacent Y32 site.
Examining the contacts made by the D38 group motivated the extension strategy into the
Y32 site. The top scoring ionization state consisted of the protonated amines interacting with the
side chains of D33 and D38, with the amines oriented in the direction of the Y32 site (Fig.
2.10b). Moieties were introduced in silico that could be attached via a reductive amination in
order to retain the basicity of the amine required to obtain the docked ionization state.
Synthetically accessible libraries of aldehydes that could be attached to the amine were designed,
and again their attachment improved the docking score by about another order of magnitude.
This approach proved to be dramatically more efficient computationally than the design
of a single compound library that possessed all of the points of diversity encompassed by the
PAINT approach. Figure 2.11b compares the size of the libraries that a single compound library
would contain compared with that of the PAINT strategy.
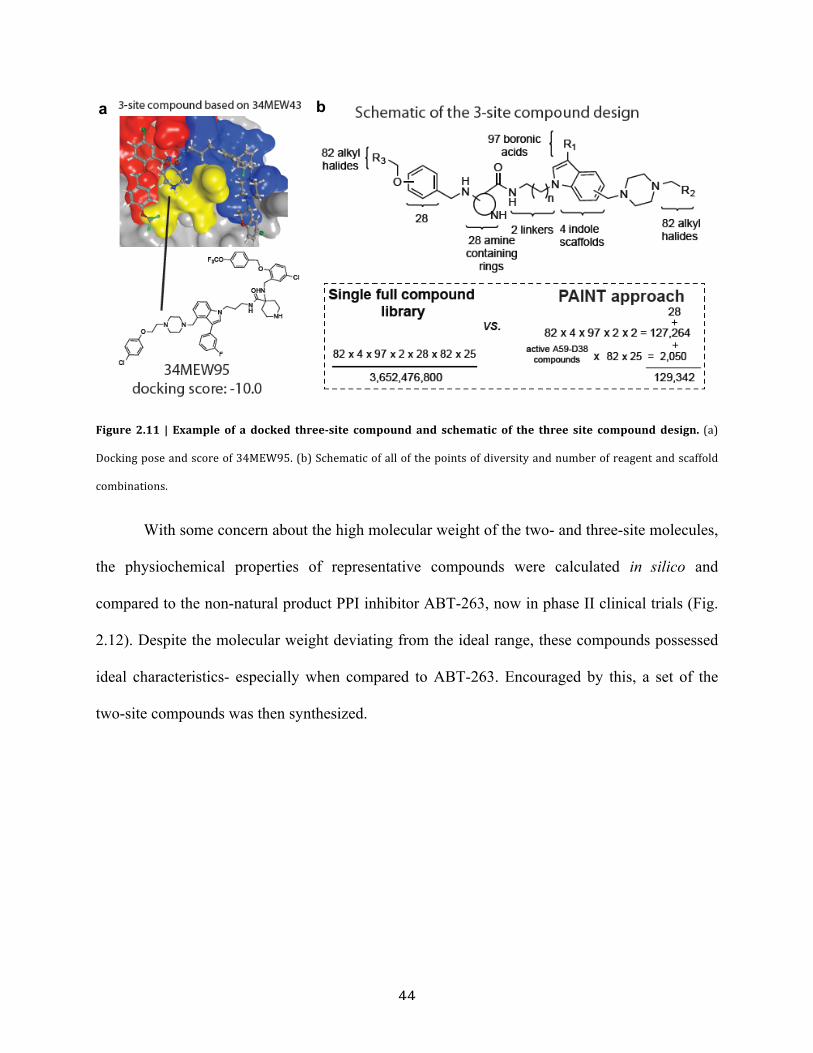
44
Figure 2.11 | Example of a docked three-‐site compound and schematic of the three site compound design. (a)
Docking pose and score of 34MEW95. (b) Schematic of all of the points of diversity and number of reagent and scaffold
combinations.
With some concern about the high molecular weight of the two- and three-site molecules,
the physiochemical properties of representative compounds were calculated in silico and
compared to the non-natural product PPI inhibitor ABT-263, now in phase II clinical trials (Fig.
2.12). Despite the molecular weight deviating from the ideal range, these compounds possessed
ideal characteristics- especially when compared to ABT-263. Encouraged by this, a set of the
two-site compounds was then synthesized.
a b
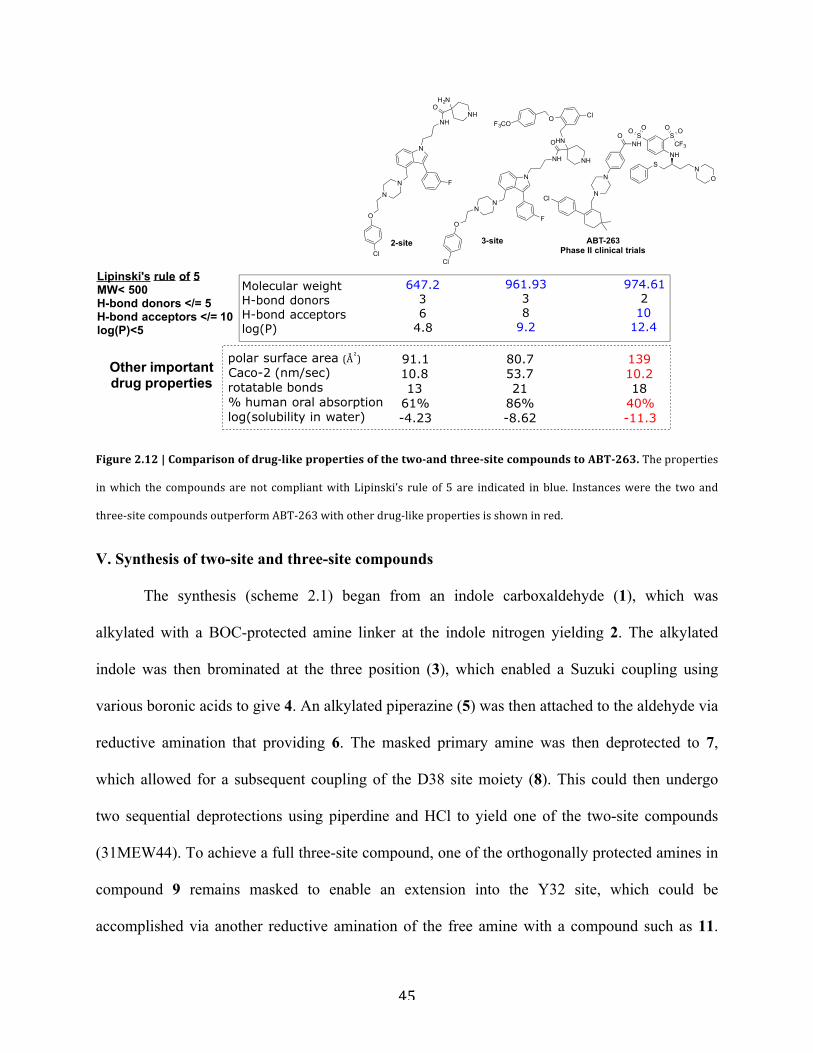
45
Figure 2.12 | Comparison of drug-‐like properties of the two-‐and three-‐site compounds to ABT-‐263. The properties
in which the compounds are not compliant with Lipinski’s rule of 5 are indicated in blue. Instances were the two and
three-‐site compounds outperform ABT-‐263 with other drug-‐like properties is shown in red.
V. Synthesis of two-site and three-site compounds
The synthesis (scheme 2.1) began from an indole carboxaldehyde (1), which was
alkylated with a BOC-protected amine linker at the indole nitrogen yielding 2. The alkylated
indole was then brominated at the three position (3), which enabled a Suzuki coupling using
various boronic acids to give 4. An alkylated piperazine (5) was then attached to the aldehyde via
reductive amination that providing 6. The masked primary amine was then deprotected to 7,
which allowed for a subsequent coupling of the D38 site moiety (8). This could then undergo
two sequential deprotections using piperdine and HCl to yield one of the two-site compounds
(31MEW44). To achieve a full three-site compound, one of the orthogonally protected amines in
compound 9 remains masked to enable an extension into the Y32 site, which could be
accomplished via another reductive amination of the free amine with a compound such as 11.
N
NH
NN
O
NH
HN
FO
Cl
ClOF3CO
961.9338
9.2
N
NH
N
N
ONH
H2N
F
O
Cl
647.236
4.8
Molecular weightH-bond donorsH-bond acceptorslog(P)
974.612
1012.4
Lipinski's rule of 5MW< 500H-bond donors </= 5H-bond acceptors </= 10log(P)<5
2-site 3-site
SSNH CF3
NH
OOOOO
N
N
SN
O
Cl
ABT-263Phase II clinical trials
Other importantdrug properties
polar surface area (A# ²)Caco-2 (nm/sec)rotatable bonds% human oral absorptionlog(solubility in water)
91.110.813
61%-4.23
80.753.721
86%-8.62
13910.218
40%-11.3

46
Deprotection with HCl (or piperdine if the other free amine was used) then provides the full three
site-binding molecule (43MEW63).
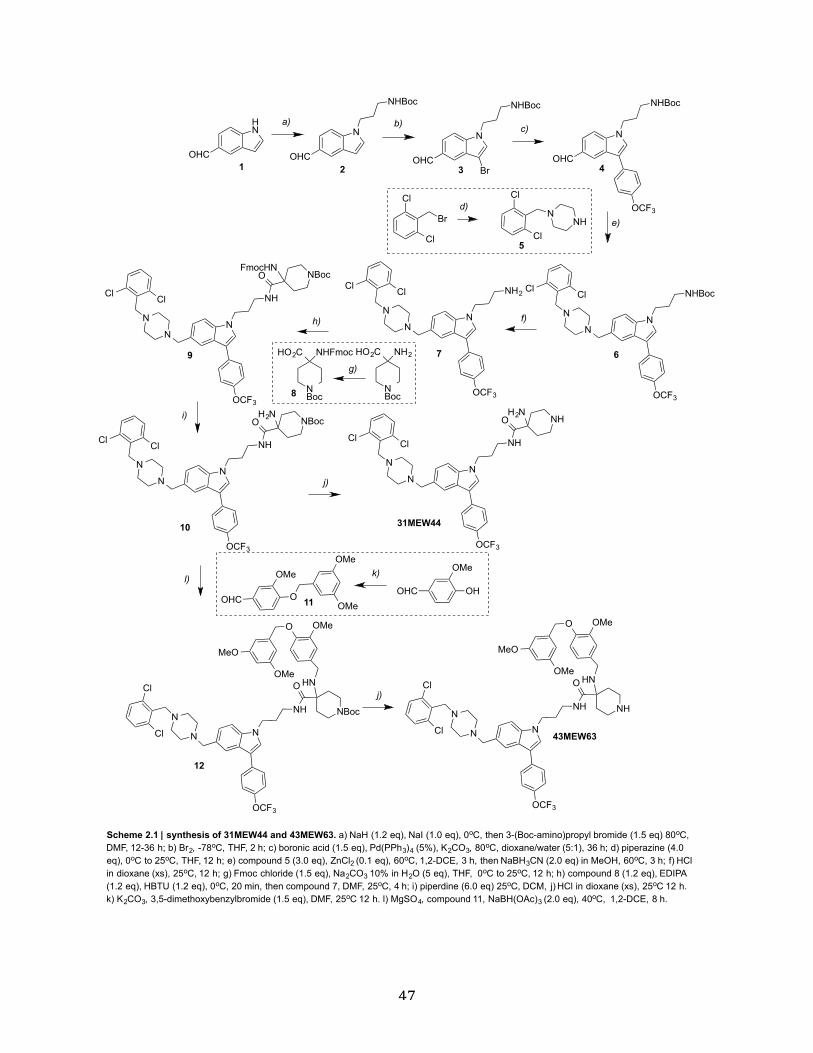
47
HN
OHC
N
OHC
NHBoc
N
OHC
NHBoc
Br
N
OHC
NHBoc
N
NHBoc
N
NN
NH2
N
NN
NH
N
N
O NBoc
NNH
FmocHN
NBoc
NHFmocHO2C
Scheme 2.1 | synthesis of 31MEW44 and 43MEW63. a) NaH (1.2 eq), NaI (1.0 eq), 0oC, then 3-(Boc-amino)propyl bromide (1.5 eq) 80oC, DMF, 12-36 h; b) Br2, -78oC, THF, 2 h; c) boronic acid (1.5 eq), Pd(PPh3)4 (5%), K2CO3, 80oC, dioxane/water (5:1), 36 h; d) piperazine (4.0 eq), 0oC to 25oC, THF, 12 h; e) compound 5 (3.0 eq), ZnCl2 (0.1 eq), 60oC, 1,2-DCE, 3 h, then NaBH3CN (2.0 eq) in MeOH, 60oC, 3 h; f) HCl in dioxane (xs), 25oC, 12 h; g) Fmoc chloride (1.5 eq), Na2CO3 10% in H2O (5 eq), THF, 0oC to 25oC, 12 h; h) compound 8 (1.2 eq), EDIPA (1.2 eq), HBTU (1.2 eq), 0oC, 20 min, then compound 7, DMF, 25oC, 4 h; i) piperdine (6.0 eq) 25oC, DCM, j) HCl in dioxane (xs), 25oC 12 h.k) K2CO3, 3,5-dimethoxybenzylbromide (1.5 eq), DMF, 25oC 12 h. l) MgSO4, compound 11, NaBH(OAc)3 (2.0 eq), 40oC, 1,2-DCE, 8 h.
a) b) c)
d)
e)
f)
g)
h)
1 2 3 4
5
67
8
9
NBoc
NH2HO2C
N
NH
N
N
O NBocH2N
N
NH
N
N
O NHH2Ni)
j)
10 31MEW44
BrOCF3
Cl
Cl
Cl Cl
OCF3OCF3
Cl Cl
OCF3
Cl Cl
Cl Cl
OCF3
Cl Cl
OCF3
Cl
Cl
k)
OHC O
OMe
OMeOHC OH
l) OMeOMe
N
NN
NH
O
NBoc
Cl
Cl
OCF3
HN
O
MeO
OMe
OMe
43MEW63N
NN
NH
O
NH
Cl
Cl
OCF3
HN
O
MeO
OMe
OMe
j)
11
12
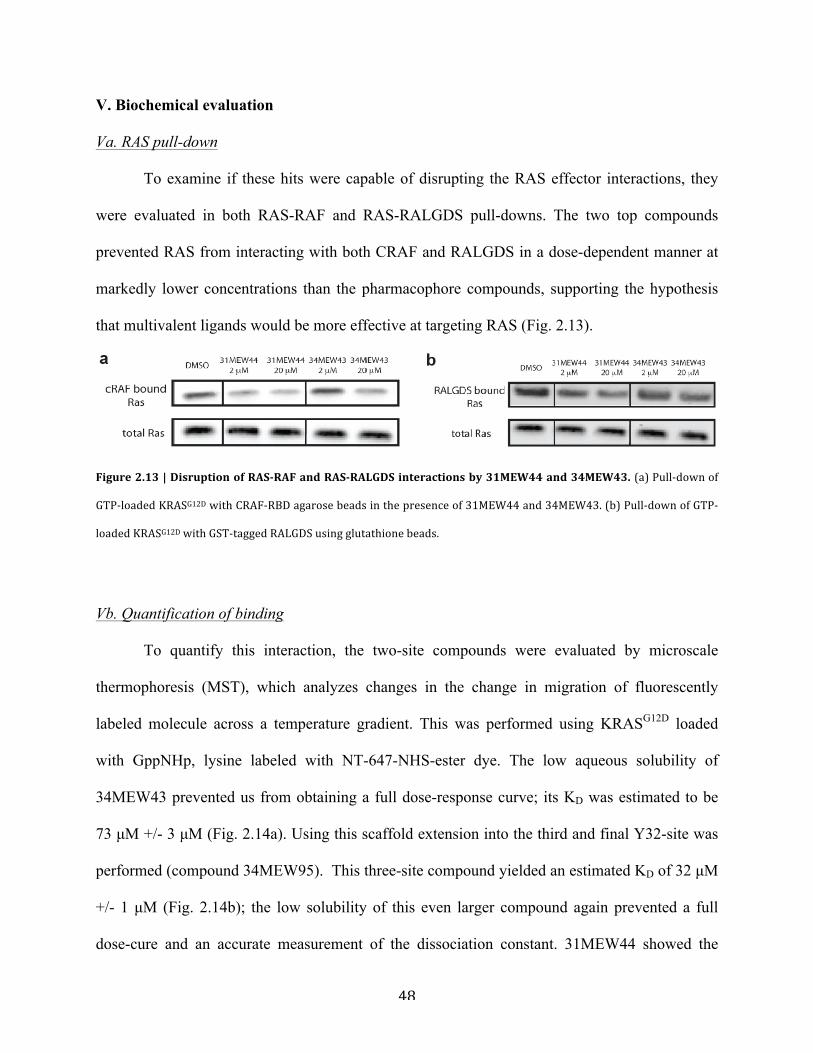
48
V. Biochemical evaluation
Va. RAS pull-down
To examine if these hits were capable of disrupting the RAS effector interactions, they
were evaluated in both RAS-RAF and RAS-RALGDS pull-downs. The two top compounds
prevented RAS from interacting with both CRAF and RALGDS in a dose-dependent manner at
markedly lower concentrations than the pharmacophore compounds, supporting the hypothesis
that multivalent ligands would be more effective at targeting RAS (Fig. 2.13).
Figure 2.13 | Disruption of RAS-‐RAF and RAS-‐RALGDS interactions by 31MEW44 and 34MEW43. (a) Pull-‐down of
GTP-‐loaded KRASG12D with CRAF-‐RBD agarose beads in the presence of 31MEW44 and 34MEW43. (b) Pull-‐down of GTP-‐
loaded KRASG12D with GST-‐tagged RALGDS using glutathione beads.
Vb. Quantification of binding
To quantify this interaction, the two-site compounds were evaluated by microscale
thermophoresis (MST), which analyzes changes in the change in migration of fluorescently
labeled molecule across a temperature gradient. This was performed using KRASG12D loaded
with GppNHp, lysine labeled with NT-647-NHS-ester dye. The low aqueous solubility of
34MEW43 prevented us from obtaining a full dose-response curve; its KD was estimated to be
73 µM +/- 3 µM (Fig. 2.14a). Using this scaffold extension into the third and final Y32-site was
performed (compound 34MEW95). This three-site compound yielded an estimated KD of 32 µM
+/- 1 µM (Fig. 2.14b); the low solubility of this even larger compound again prevented a full
dose-cure and an accurate measurement of the dissociation constant. 31MEW44 showed the
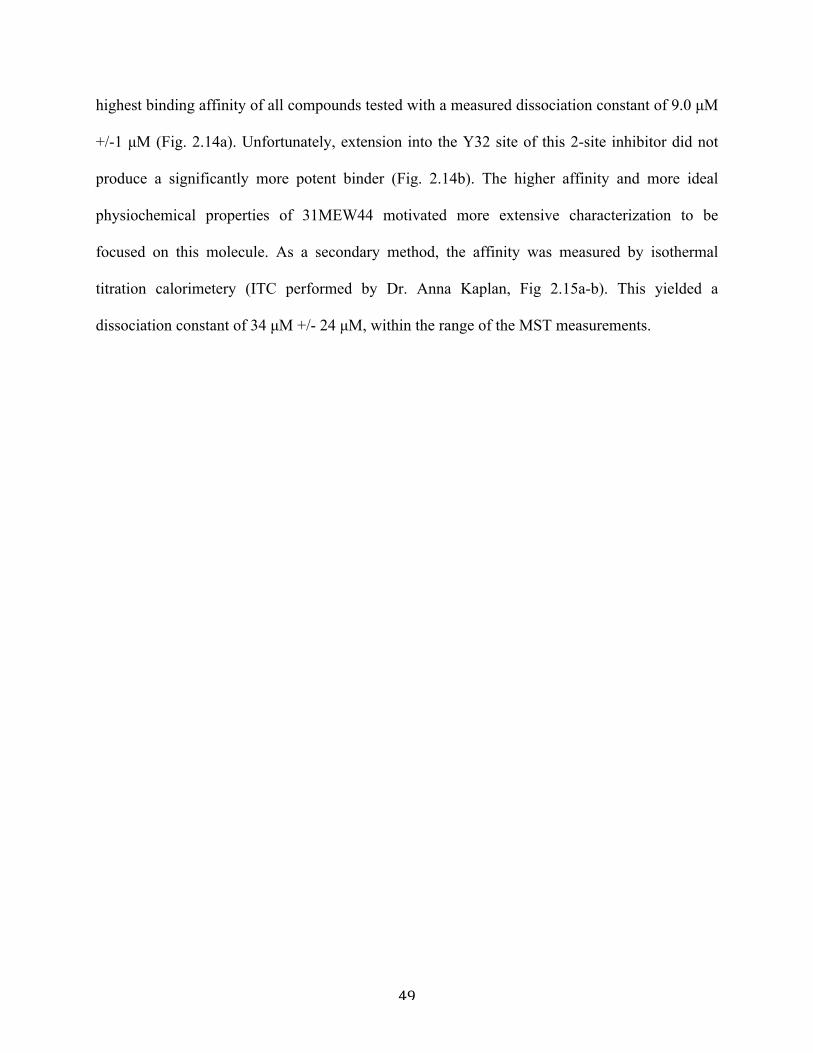
49
highest binding affinity of all compounds tested with a measured dissociation constant of 9.0 µM
+/-1 µM (Fig. 2.14a). Unfortunately, extension into the Y32 site of this 2-site inhibitor did not
produce a significantly more potent binder (Fig. 2.14b). The higher affinity and more ideal
physiochemical properties of 31MEW44 motivated more extensive characterization to be
focused on this molecule. As a secondary method, the affinity was measured by isothermal
titration calorimetery (ITC performed by Dr. Anna Kaplan, Fig 2.15a-b). This yielded a
dissociation constant of 34 µM +/- 24 µM, within the range of the MST measurements.
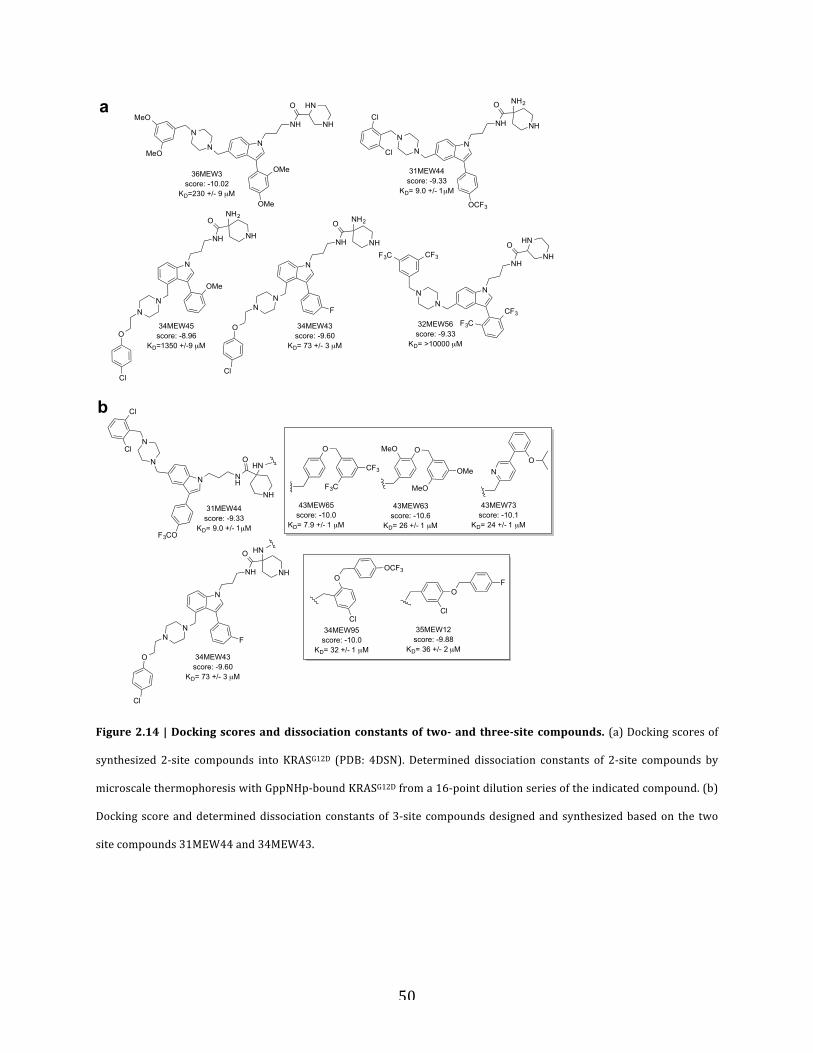
50
Figure 2.14 | Docking scores and dissociation constants of two-‐ and three-‐site compounds. (a) Docking scores of
synthesized 2-‐site compounds into KRASG12D (PDB: 4DSN). Determined dissociation constants of 2-‐site compounds by
microscale thermophoresis with GppNHp-‐bound KRASG12D from a 16-‐point dilution series of the indicated compound. (b)
Docking score and determined dissociation constants of 3-‐site compounds designed and synthesized based on the two
site compounds 31MEW44 and 34MEW43.
N
NN
NH
O
NH
HNMeO
MeO
OMe
OMe36MEW3score: -10.02
KD=230 +/- 9 µM
N
NH
NN
O
NH
NH2
O
Cl
OMe
34MEW45score: -8.96
KD=1350 +/-9 µM
N
NH
NN
ONH
HN
CF3
F3C CF3
F3C32MEW56score: -9.33
KD= >10000 µM
N
NH
NN
O
NH
NH2
F
O
Cl
34MEW43score: -9.60
KD= 73 +/- 3 µM
N
N
Cl
ClN
NH
OCF3
O NH2
NH
31MEW44score: -9.33
KD= 9.0 +/- 1µM
N
N
Cl
Cl
N NH
F3CO
OHN
NH
N
NH
NN
O
NH
HN
F
O
Cl
34MEW43score: -9.60
KD= 73 +/- 3 µM
31MEW44score: -9.33
KD= 9.0 +/- 1µM
Cl
OOCF3
O
Cl
F
34MEW95score: -10.0
KD= 32 +/- 1 µM
35MEW12score: -9.88
KD= 36 +/- 2 µM
O
CF3
F3C
O
OMe
MeO
MeO
NO
43MEW65score: -10.0
KD= 7.9 +/- 1 µM
43MEW63score: -10.6
KD= 26 +/- 1 µM
43MEW73score: -10.1
KD= 24 +/- 1 µM
a
b
51
Figure 2.15 | Isothermal titration calorimetery on 31MEW44. (a) Isothermal calorimetery titration of KRASG12D-‐
GppNHp into 31MEW44. (b) Thermodynamic parameters of 31MEW44 binding. *This experiment was performed by Dr.
Anna Kaplan (Columbia University)
Vc. Binding site characterization
To examine the selectivity of 31MEW44 for the active GTP-bound form of RAS,
KRASG12D was loaded with GDP and measured by MST. This resulted in a five-fold loss in
affinity (KD= 45 µM +/- 3 µM, Fig. 2.16a), consistent with the idea that it’s selective for the
active form. To support that 31MEW44 was binding in the predicted area; the mutants evaluated
in the pharmacophore approach were used. They showed 3.5 to 21-fold loss of affinity
(KRASG12D D38A KD= 33 +/- 2 µM and KRASG12D I36N KD = 200 µM +/- 20 µM, Fig. 2.16b),
indicating a much greater degree of specificity than the pharmacophore compounds.
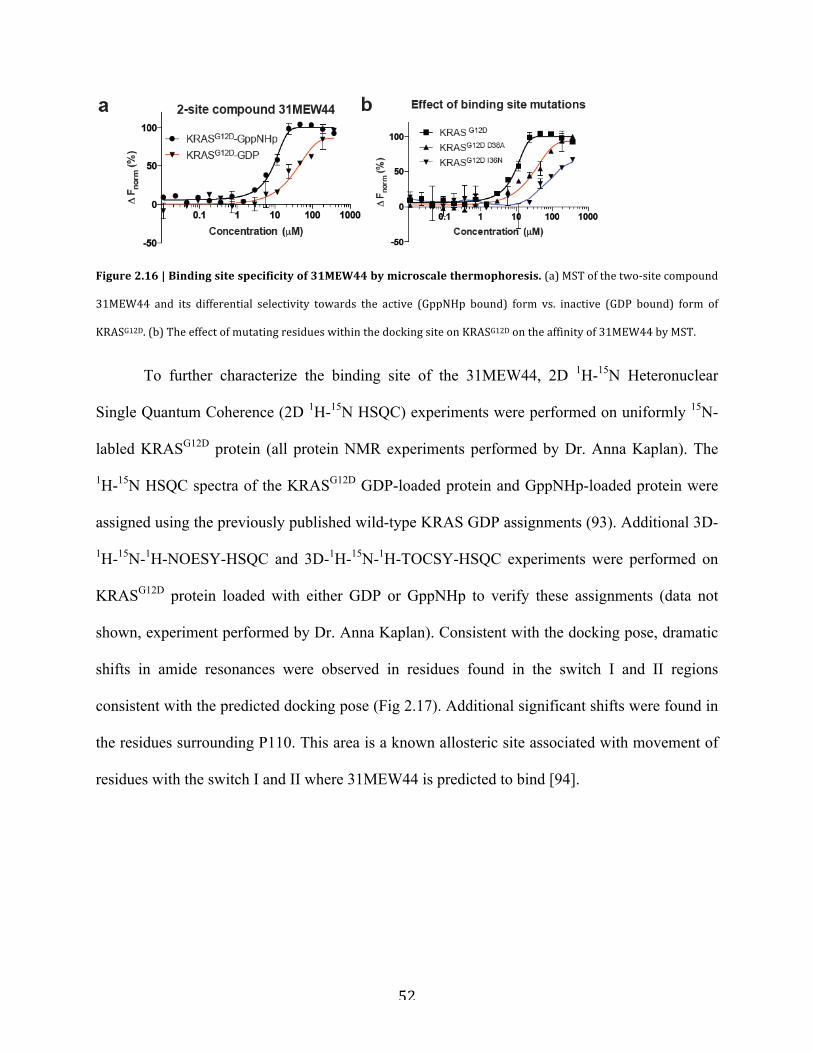
52
Figure 2.16 | Binding site specificity of 31MEW44 by microscale thermophoresis. (a) MST of the two-‐site compound
31MEW44 and its differential selectivity towards the active (GppNHp bound) form vs. inactive (GDP bound) form of
KRASG12D. (b) The effect of mutating residues within the docking site on KRASG12D on the affinity of 31MEW44 by MST.
To further characterize the binding site of the 31MEW44, 2D 1H-15N Heteronuclear
Single Quantum Coherence (2D 1H-15N HSQC) experiments were performed on uniformly 15N-
labled KRASG12D protein (all protein NMR experiments performed by Dr. Anna Kaplan). The
1H-15N HSQC spectra of the KRASG12D GDP-loaded protein and GppNHp-loaded protein were
assigned using the previously published wild-type KRAS GDP assignments (93). Additional 3D-
1H-15N-1H-NOESY-HSQC and 3D-1H-15N-1H-TOCSY-HSQC experiments were performed on
KRASG12D protein loaded with either GDP or GppNHp to verify these assignments (data not
shown, experiment performed by Dr. Anna Kaplan). Consistent with the docking pose, dramatic
shifts in amide resonances were observed in residues found in the switch I and II regions
consistent with the predicted docking pose (Fig 2.17). Additional significant shifts were found in
the residues surrounding P110. This area is a known allosteric site associated with movement of
residues with the switch I and II where 31MEW44 is predicted to bind [94].
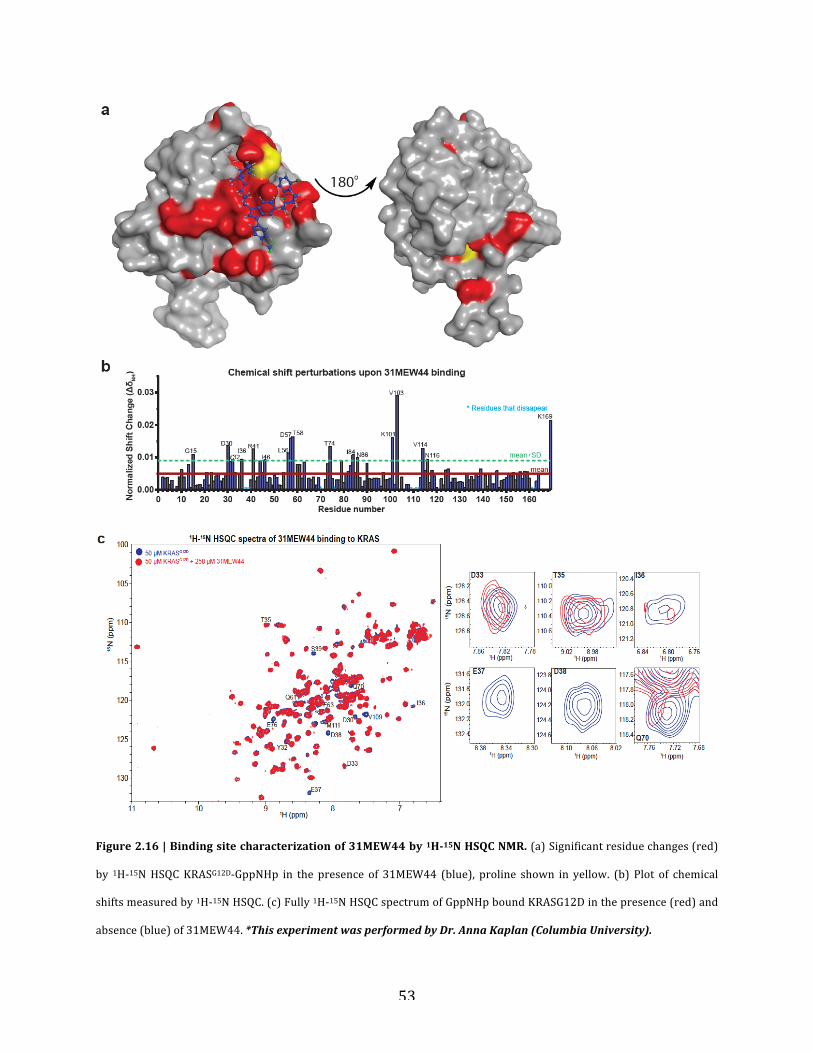
53
Figure 2.16 | Binding site characterization of 31MEW44 by 1H-‐15N HSQC NMR. (a) Significant residue changes (red)
by 1H-‐15N HSQC KRASG12D-‐GppNHp in the presence of 31MEW44 (blue), proline shown in yellow. (b) Plot of chemical
shifts measured by 1H-‐15N HSQC. (c) Fully 1H-‐15N HSQC spectrum of GppNHp bound KRASG12D in the presence (red) and
absence (blue) of 31MEW44. *This experiment was performed by Dr. Anna Kaplan (Columbia University).
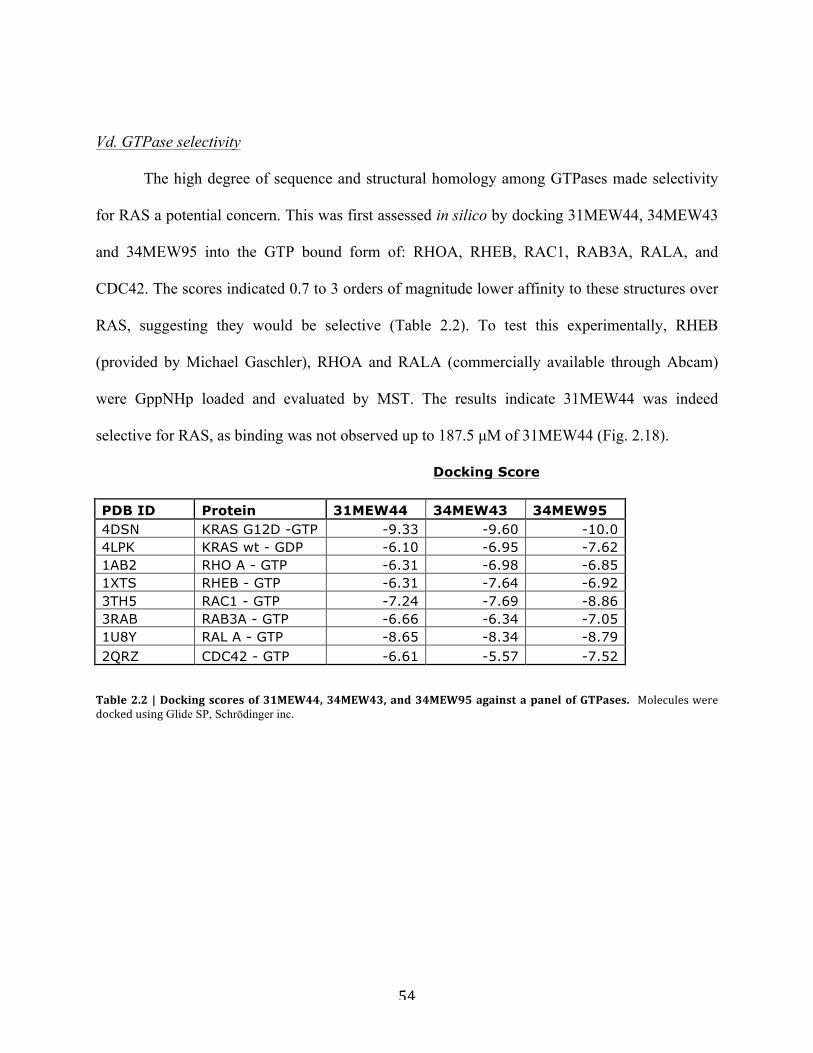
54
Vd. GTPase selectivity
The high degree of sequence and structural homology among GTPases made selectivity
for RAS a potential concern. This was first assessed in silico by docking 31MEW44, 34MEW43
and 34MEW95 into the GTP bound form of: RHOA, RHEB, RAC1, RAB3A, RALA, and
CDC42. The scores indicated 0.7 to 3 orders of magnitude lower affinity to these structures over
RAS, suggesting they would be selective (Table 2.2). To test this experimentally, RHEB
(provided by Michael Gaschler), RHOA and RALA (commercially available through Abcam)
were GppNHp loaded and evaluated by MST. The results indicate 31MEW44 was indeed
selective for RAS, as binding was not observed up to 187.5 µM of 31MEW44 (Fig. 2.18).
Docking Score
PDB ID Protein 31MEW44 34MEW43 34MEW95 4DSN KRAS G12D -GTP -9.33 -9.60 -10.0 4LPK KRAS wt - GDP -6.10 -6.95 -7.62 1AB2 RHO A - GTP -6.31 -6.98 -6.85 1XTS RHEB - GTP -6.31 -7.64 -6.92 3TH5 RAC1 - GTP -7.24 -7.69 -8.86 3RAB RAB3A - GTP -6.66 -6.34 -7.05 1U8Y RAL A - GTP -8.65 -8.34 -8.79 2QRZ CDC42 - GTP -6.61 -5.57 -7.52
Table 2.2 | Docking scores of 31MEW44, 34MEW43, and 34MEW95 against a panel of GTPases. Molecules were docked using Glide SP, Schrödinger inc.
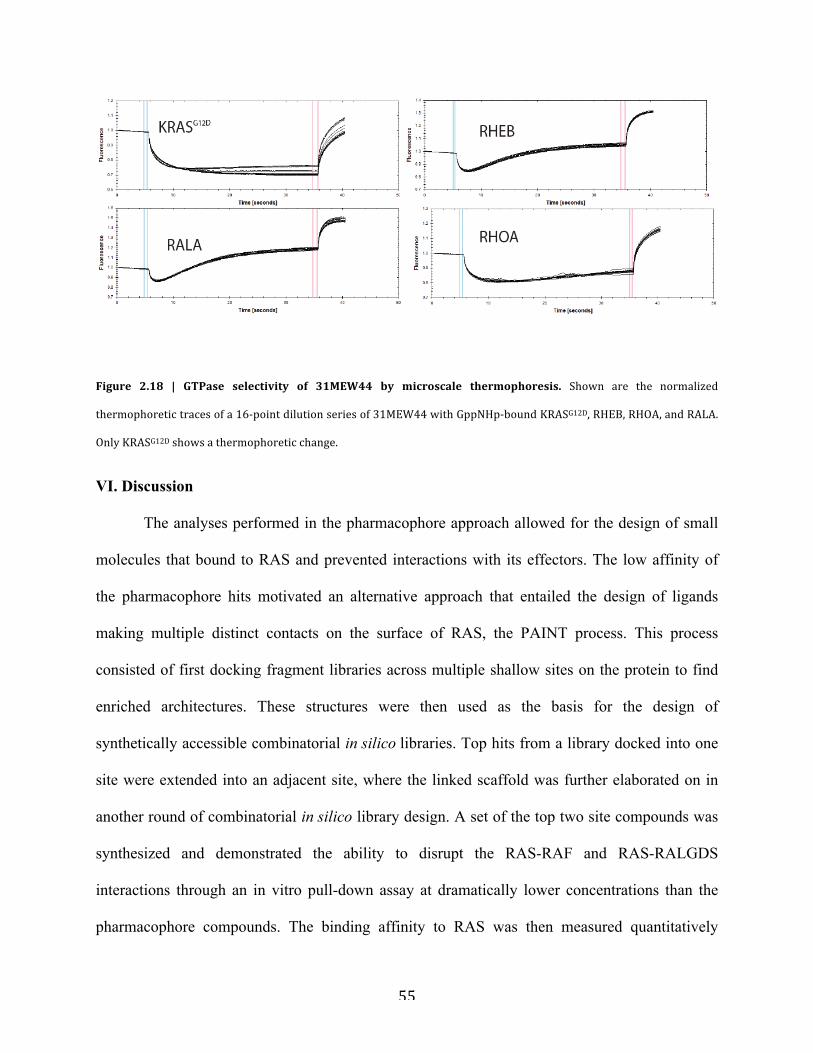
55
Figure 2.18 | GTPase selectivity of 31MEW44 by microscale thermophoresis. Shown are the normalized
thermophoretic traces of a 16-‐point dilution series of 31MEW44 with GppNHp-‐bound KRASG12D, RHEB, RHOA, and RALA.
Only KRASG12D shows a thermophoretic change.
VI. Discussion
The analyses performed in the pharmacophore approach allowed for the design of small
molecules that bound to RAS and prevented interactions with its effectors. The low affinity of
the pharmacophore hits motivated an alternative approach that entailed the design of ligands
making multiple distinct contacts on the surface of RAS, the PAINT process. This process
consisted of first docking fragment libraries across multiple shallow sites on the protein to find
enriched architectures. These structures were then used as the basis for the design of
synthetically accessible combinatorial in silico libraries. Top hits from a library docked into one
site were extended into an adjacent site, where the linked scaffold was further elaborated on in
another round of combinatorial in silico library design. A set of the top two site compounds was
synthesized and demonstrated the ability to disrupt the RAS-RAF and RAS-RALGDS
interactions through an in vitro pull-down assay at dramatically lower concentrations than the
pharmacophore compounds. The binding affinity to RAS was then measured quantitatively
56
through microscale thermophoresis. Attempts at extending into the third, Y32 site, yielded an
improvement in affinity for the hit compound 34MEW43; however, an accurate dissociation
constant determination could not be achieved due to the aqueous solubility limits of the
34MEW43 and the 3-site compound 34MEW95. The two-site compound 31MEW44 had the
highest affinity of the potential inhibitors tested, as well as the most ideal physiochemical
properties. More extensive characterization of this compound showed selectivity for the active
form of KRASG12D as well as a loss of affinity when measured against mutants of residues in its
predicted binding site. Comparing to the low molecular weight pharmacophore compounds, it
appeared to have dramatically improved binding site specificity as the mutations resulted in a
larger decrease in affinity despite the compound being roughly 2.5 times the molecular weight of
pharmacophore compounds. Further confirmation of binding was shown by 2D 1H-15N HSQC
NMR, where substantial changes in chemical shifts were observed in the area 31MEW44 was
docked and functionally associated residues. When tested by MST against other GTPases,
31MEW44 also showed selectivity towards RAS despite highly homologous structures and
sequences. Thus, the PAINT approach constituted a dramatic improvement over the initial
pharmacophore strategy and yielded a selective compound with low micromolar affinity against
RAS.

57
VII. Methods
Software
Molecular docking was performed using GLIDE (version 2012, Schrodinger, Inc). Modeling of
proteins and ligands were performed using Molecular Operating Environment [MOE] (Chemical
Computing Group). All chemical structures were drawn using ChemDraw Ultra version 10.0.
(Perkin Elmer). All statistical analyses, EC50 determinations, and viability curves were produced
using Prism 5.0c (GraphPad Software).
In silico libraries
Libraries of commercially available compounds were compiled from the inventories of Asinex,
Enamine, Chembridge, ChemDiv, IBS, Life, Maybridge and TimTec.
A fragment subset of ~60,000 compounds of the unfiltered library was selected using the
following filter criteria: LogP <3, hydrogen bond acceptors ≤ 3, hydrogen bond donors ≤ 3,
molecular weight <300, aqueous solubility > 0.5 mM. Chemical descriptors were calculated
using MOE (Chemical Computing Group)
Designed libraries of synthetically accessible compounds were compiled using selected
commercially available reagents from the inventory of Sigma-Aldrich and Chem-Impex using
the Combigen application in MOE (Chemical Computing Group).
Molecular cloning, protein expression, and purification
58
Human KRAS4B sequence containing the oncogenic Q61H mutation in pENTR221 vector
was purchased from Invitrogen (Ultimate ORF Clone IOH9852). To generate the wild-‐type
KRAS sequence, H61Q back mutation was introduced using QuickChange II site-‐directed
mutagenesis (Agilent Technologies) and confirmed by DNA sequencing (GeneWiz, Inc.).
Wild-‐type KRAS4B sequence encoding the catalytic domain (amino acids 1-‐169 in KRAS)
was amplified by PCR and cloned into Nde I-‐BamH I sites of pET-‐15b vector (Novagen)
containing the N-‐terminal His6 tag. G12D point mutation was introduced using
QuickChange II site-‐directed mutagenesis (Agilent Technologies). DNA sequencing was
performed to confirm the correct amino acid sequence of the construct (GeneWiz, Inc.).
Mutagenesis of the KRASG12D plasmid was performed using a QuikChange XL site-‐directed
mutagenesis kit from Agilent technologies, according to the manufacturer’s protocol.
Primers were designed using the Agilent QuikChange Primer Design application and
purchased from Integrated DNA Technologies. KRASG12D D38A forward primer 5’ ATA TGA
TCC AAC AAT AGA GGC TTC CTA CAG GAA GCA AGT AG 3’, KRASG12D D38A reverse primer 5’
CTA CTT GCT TCC TGT AGG AAG CCT CTA TTG TTG GAT CAT AT 3’, KRASG12D I36N forward
primer 5’ CAT TTT GTG GAC GAA TAT GAT CCA ACA AAT GAG GAT TCC TAC AGG 3’,
KRASG12D I36N reverse primer 5’ CCT GTA GGA ATC CTC ATT TGT TGG ATC ATA TTC GTC CAC
AAA ATG 3’. DNA sequencing was performed to confirm the correct amino acid sequence of
the construct (GeneWiz, Inc.).
Protein NMR (this protocol was developed by Anna Kaplan)
59
For NMR studies, uniformly 15N-‐labeled KRASG12D protein with N-‐terminal His6 tag was
prepared. The KRASG12D construct was expressed in Escherichia coli BL21-‐Gold (DE3) cells
(Stratagene) growing at 37 °C in M9 minimal medium supplemented with 100 µg/mL
ampicillin, metals, 30 mg nicotinic acid, 3 mg p-‐aminobenzoic acid, 0.3 mg biotin, 0.5 mg
thiamine hydrochloride, and 0.6 g 15NH4Cl as the sole nitrogen source. When the OD600nm
reached 0.9, protein expression was induced with 1 mM isopropyl β-‐D-‐thiogalactoside at
15 °C overnight. Cells were pelleted and lysed by sonication in buffer containing 10 mM
Tris-‐HCl, 500 mM NaCl, 5 mM imidazole, 5 mM MgCl2, pH 7.5, 0.5 % CHAPS (w/v), 1 mM
PMSF, and 1 mM TCEP. Cell lysate was then centrifuged at 15,000 x g for 45 min at 4 °C.
KRASG12D was first purified from cell lysate using Ni Sepharose 6 Fast Flow beads (GE Life
Sciences) and then using gel filtration Superdex 100 column. The fractions containing
KRASG12D were pooled together and verified by SDS-‐PAGE. Protein concentration was
determined using absorbance at 280 nm with extinction coefficient of 11,920 M-‐1 cm-‐1
(calculated using MOE). Thrombin was added at 5 U/mg protein to cleave the N-‐terminal
His6 tag. The reaction was allowed to proceed overnight at 4 °C. The next day, protein
solution was passed over Ni-‐Sepharose 6 Fast Flow beads (GE Life Sciences) and
flowthrough containing the 15N-‐labled KRASG12D protein without histadine tag was
concentrated and flash frozen. Purity was checked by SDS-‐PAGE gel.
To load a specific nucleotide onto 15N-‐labeled KRASG12D, the protein was first incubated
with 10 molar excess of EDTA for 1 h at rt, then buffer exchanged into HEPES NMR buffer
60
(50 mM HEPES pH 7.4, 50 mM NaCl), and lastly supplemented with 2 mM MgCl2, 2 mM
TCEP, and 10 molar excess of GDP or GppNHp nucleotide.
For biochemical studies, KRASG12D construct was expressed in Escherichia coli BL21-‐Gold
(DE3) cells (Stratagene) growing at 37 °C in LB media with 100 µg/mL ampicillin and
induced when the OD600nm reached 1.0, with 1 mM isopropyl β-‐D-‐thiogalactoside at 15°C
overnight. Protein purification was the same as for the 15N-‐labeled protein, except the N-‐
terminal His6 tag was not removed.
In vitro RAS pulldown
A 20 µM solution of KRASG12D in 50 mM HEPES, 200 mM sodium chloride, 2 mM TCEP with
1 mM EDTA and 1 mM GTP was gently rotated at 25 oC to remove the endogenous
nucleotide. Magnesium chloride was then added to 5 mM and the resulting solution was
rotated at 4 oC for 4 h. The GTP-‐loaded KRASG12D was then diluted to 20 nM and incubated
with the inhibitors and 10 µL of RAF1-‐RBD agarose beads (EMD Millipore, CN: 14-‐278) or
100 nM RALGDS (Abcam, CN: ab132590) with 20 µL of glutathione beads for 2 h. The beads
were separated from solution by centrifuging at 1,500 x g. They were then washed 2 X with
PBS before the addition of 1X SDS. The quantity of RAS in the samples was then analyzed
using the western blotting procedure.
Western blots
Samples were separated using SDS-‐polyacrylamide gel electrophoresis and transferred to a
polyvinylidene difluoride membrane. Transfer was performed using the iBlot system
(Invitrogen). Membranes were treated with Li-‐COR odyssey blocking buffer for 1 h at 25 oC,
61
then incubated with a pan-‐RAS antibody (cell signaling, CN: 3965S) (1:1,000) in a 1:1
solution of PBS-‐T and Li-‐COR odyssey blocking buffer overnight at 4 °C. Following 3x5 min
washes in PBS-‐T, the membrane was incubated with a goat anti-‐rabbit IgG antibody
conjugated to an IRdye at 800CW (Li-‐COR biosciences) (1:2000) in a 1:1 solution of PBS-‐T
and Li-‐COR Odyssey blocking buffer for 45 min at 25 oC. Following three 5 min washes in
PBS-‐T, the membrane was scanned using the Li-‐COR Odyssey Imaging System.
Microscale thermophoresis
KRASG12D (250 µM) in 25 mM HEPES, 100 mM sodium chloride, 2 mM TCEP with 20 mM
EDTA and 1 mM GppNHp was shaken at 220 rpm at 30 oC to remove the endogenous
nucleotide. The solution was placed on ice for 2 min prior to the addition of 65 mM MgCl2. After
an additional 10 min incubation on ice, 200 uL of a 10 uM solution of KRASG12D was combined
with 200 uL of a 20 uM solution of NT-647-NHS-ester dye (from a 652.4 µM stock). The
protein/dye mixture was rotated at 4 oC for 30 min, before being separated from the separated
from the excess dye and buffer exchanged into 25 mM Tris, 100 mM sodium chloride, 2 mM
TCEP, and 5 mM MgCl2 via a nap-5 column. The Compounds were arrayed across a 16-point
dilution series consisting of 1.5% DMSO with 25 mM Tris, 100 mM NaCl, 2 mM TCEP, 5 mM
MgCl2 and 0.05% tween-20. Thermophoretic movement of the fluorescently labeled protein with
the inhibitors was performed using a Monolith NT.115 (Nanotemper Technologies). RALA and
RHOA were purchased commercially from Abcam (RALA CN:ab102555, RHOA
CN:ab101594).
Isothermal titration calorimeter (this protocol was developed by Dr. Anna Kaplan)
62
ITC experiments were carried out at 25 ° C on MicoCal Auto-ITC200 system (GE Healthcare).
Due to low solubility of 31MEW44 in aqueous buffers, for all ITC experiments the compound
was loaded into the cell and the KRASG12D•GppNHp protein was loaded into the syringe.
Working stocks of compound 31MEW44 were prepared in 100% DMSO at 20 mM. 450 µL of
the compound solution was loaded into cell at 250 µM in ITC buffer (25 mM Tris pH 7.4, 1 mM
TCEP, 100 mM NaCl, 5 mM MgCl2, 0.05% Tween-20) with final DMSO concentration at
1.25% (v/v). KRASG12D•GppNHp was buffer exchanged into same ITC buffer using Amicon
Ultra 10 kDa size exclusion filter spin columns (buffer replaced with ITC buffer four times).
Prior to loading 130 µL of KRASG12D•GppNHp into the syringe at 2.5 mM, DMSO was added to
match the amount DMSO present in the cell. ITC titration experiments were carried out at 25°
C with 19 injections, 2 µl per injection, and 180 seconds between each injection. Reference cell
power was set to 5 µcal/sec. Control experiment was performed where ITC buffer was titrated
into compound 31MEW44 alone to account for heat released due to dilution. This background
was subtracted from test data before final dissociation constant was obtained. Data were
analyzed using one-site binding model in Origin 7.1 software. The dissociation constant, Kd, was
calculated according to equation Kd = 1/Ka. Gibbs free energy, ∆G, was calculated from
equation ∆G = -RTlnKa . -T∆S was calculated from equation ∆G = ∆H-T∆S. All other
parameters, Ka, n, ∆H, were determined directly from the titration data.
Synthesis of chemical materials
General information. All reactions were carried out under a nitrogen atmosphere under
anhydrous conditions unless indicated otherwise. Anhydrous methylene chloride (DCM),
tetrahydrofuran (THF) and N,N-dimethylformamide (DMF) were purchased from Sigma-
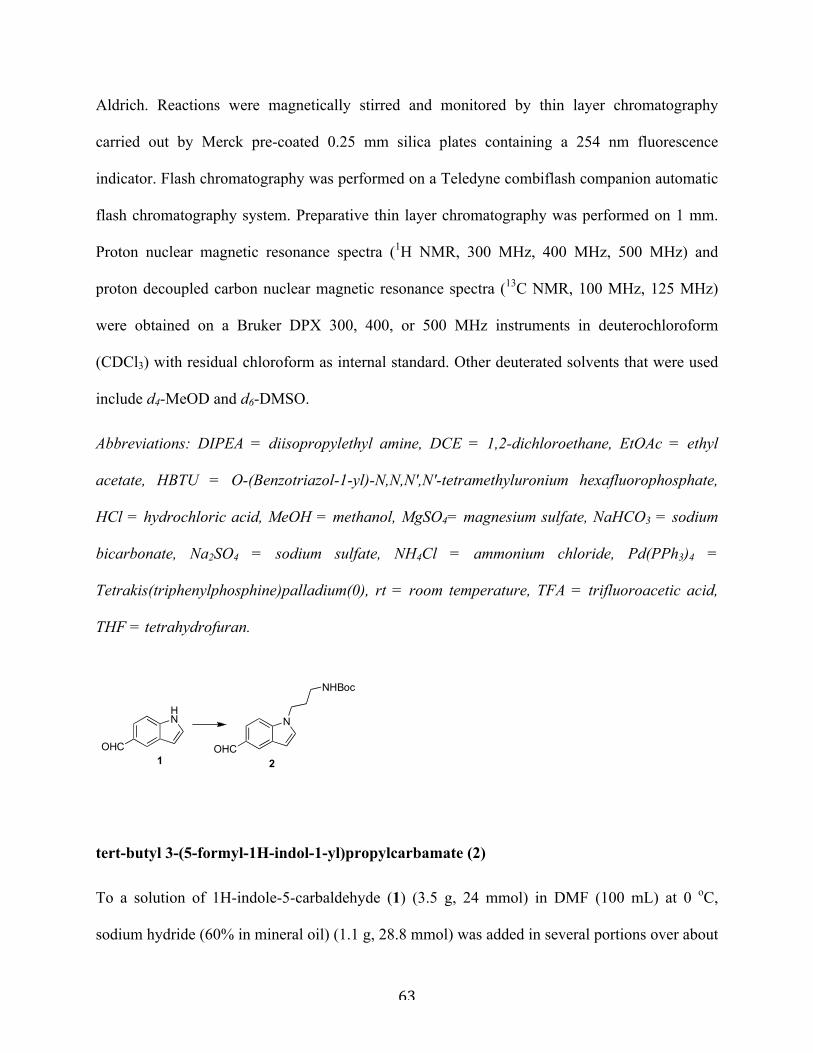
63
Aldrich. Reactions were magnetically stirred and monitored by thin layer chromatography
carried out by Merck pre-coated 0.25 mm silica plates containing a 254 nm fluorescence
indicator. Flash chromatography was performed on a Teledyne combiflash companion automatic
flash chromatography system. Preparative thin layer chromatography was performed on 1 mm.
Proton nuclear magnetic resonance spectra (1H NMR, 300 MHz, 400 MHz, 500 MHz) and
proton decoupled carbon nuclear magnetic resonance spectra (13C NMR, 100 MHz, 125 MHz)
were obtained on a Bruker DPX 300, 400, or 500 MHz instruments in deuterochloroform
(CDCl3) with residual chloroform as internal standard. Other deuterated solvents that were used
include d4-MeOD and d6-DMSO.
Abbreviations: DIPEA = diisopropylethyl amine, DCE = 1,2-dichloroethane, EtOAc = ethyl
acetate, HBTU = O-(Benzotriazol-1-yl)-N,N,N′,N′-tetramethyluronium hexafluorophosphate,
HCl = hydrochloric acid, MeOH = methanol, MgSO4= magnesium sulfate, NaHCO3 = sodium
bicarbonate, Na2SO4 = sodium sulfate, NH4Cl = ammonium chloride, Pd(PPh3)4 =
Tetrakis(triphenylphosphine)palladium(0), rt = room temperature, TFA = trifluoroacetic acid,
THF = tetrahydrofuran.
tert-butyl 3-(5-formyl-1H-indol-1-yl)propylcarbamate (2)
To a solution of 1H-indole-5-carbaldehyde (1) (3.5 g, 24 mmol) in DMF (100 mL) at 0 oC,
sodium hydride (60% in mineral oil) (1.1 g, 28.8 mmol) was added in several portions over about
HN
OHC
N
OHC
NHBoc
1 2
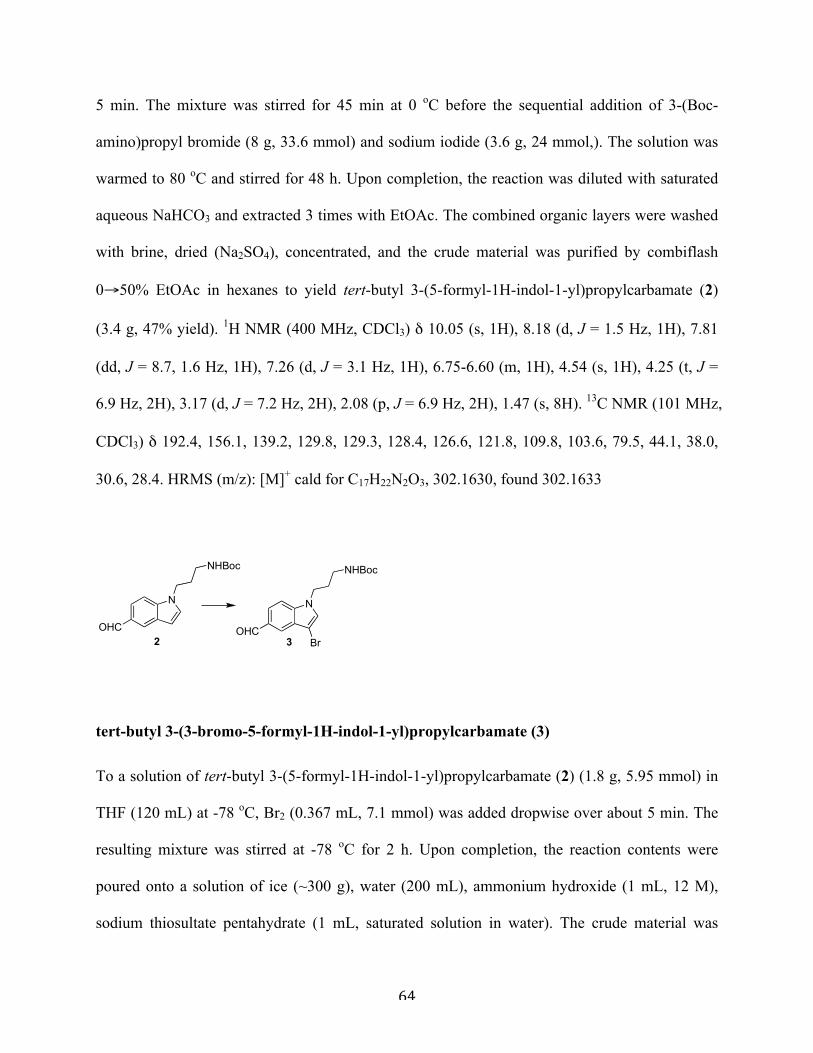
64
5 min. The mixture was stirred for 45 min at 0 oC before the sequential addition of 3-(Boc-
amino)propyl bromide (8 g, 33.6 mmol) and sodium iodide (3.6 g, 24 mmol,). The solution was
warmed to 80 oC and stirred for 48 h. Upon completion, the reaction was diluted with saturated
aqueous NaHCO3 and extracted 3 times with EtOAc. The combined organic layers were washed
with brine, dried (Na2SO4), concentrated, and the crude material was purified by combiflash
0→50% EtOAc in hexanes to yield tert-butyl 3-(5-formyl-1H-indol-1-yl)propylcarbamate (2)
(3.4 g, 47% yield). 1H NMR (400 MHz, CDCl3) δ 10.05 (s, 1H), 8.18 (d, J = 1.5 Hz, 1H), 7.81
(dd, J = 8.7, 1.6 Hz, 1H), 7.26 (d, J = 3.1 Hz, 1H), 6.75-6.60 (m, 1H), 4.54 (s, 1H), 4.25 (t, J =
6.9 Hz, 2H), 3.17 (d, J = 7.2 Hz, 2H), 2.08 (p, J = 6.9 Hz, 2H), 1.47 (s, 8H). 13C NMR (101 MHz,
CDCl3) δ 192.4, 156.1, 139.2, 129.8, 129.3, 128.4, 126.6, 121.8, 109.8, 103.6, 79.5, 44.1, 38.0,
30.6, 28.4. HRMS (m/z): [M]+ cald for C17H22N2O3, 302.1630, found 302.1633
tert-butyl 3-(3-bromo-5-formyl-1H-indol-1-yl)propylcarbamate (3)
To a solution of tert-butyl 3-(5-formyl-1H-indol-1-yl)propylcarbamate (2) (1.8 g, 5.95 mmol) in
THF (120 mL) at -78 oC, Br2 (0.367 mL, 7.1 mmol) was added dropwise over about 5 min. The
resulting mixture was stirred at -78 oC for 2 h. Upon completion, the reaction contents were
poured onto a solution of ice (~300 g), water (200 mL), ammonium hydroxide (1 mL, 12 M),
sodium thiosultate pentahydrate (1 mL, saturated solution in water). The crude material was
N
OHC
NHBoc
Br
N
OHC
NHBoc
2 3
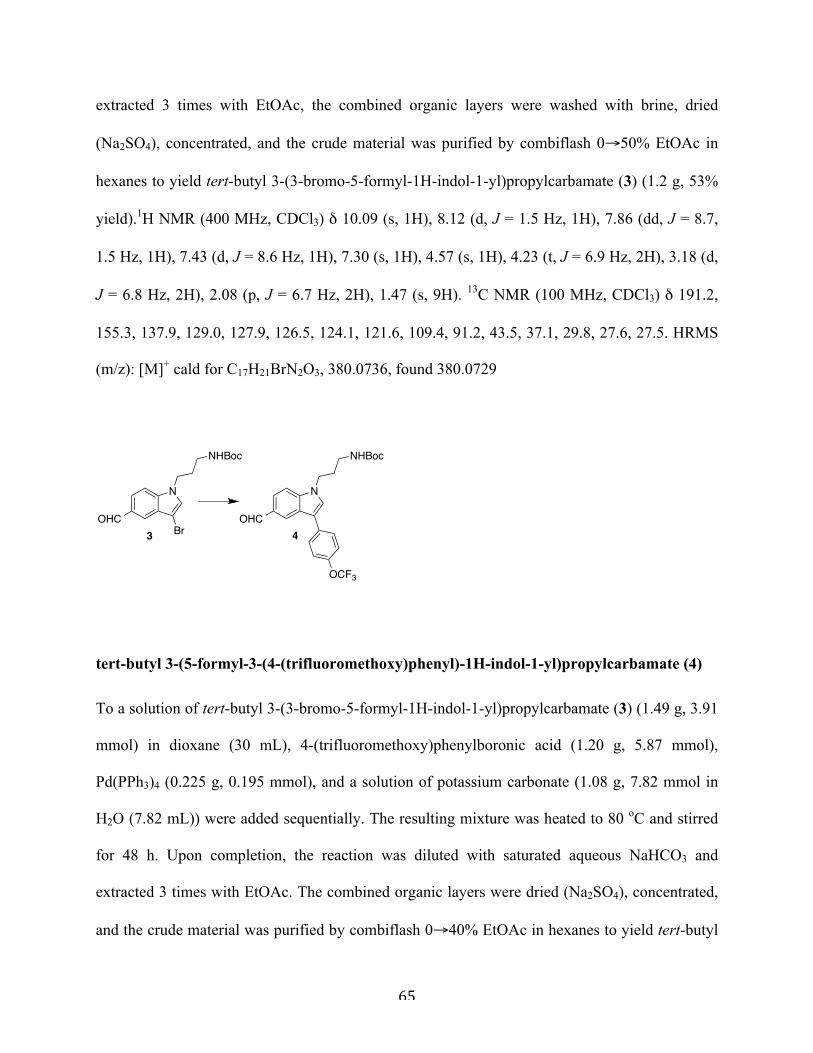
65
extracted 3 times with EtOAc, the combined organic layers were washed with brine, dried
(Na2SO4), concentrated, and the crude material was purified by combiflash 0→50% EtOAc in
hexanes to yield tert-butyl 3-(3-bromo-5-formyl-1H-indol-1-yl)propylcarbamate (3) (1.2 g, 53%
yield).1H NMR (400 MHz, CDCl3) δ 10.09 (s, 1H), 8.12 (d, J = 1.5 Hz, 1H), 7.86 (dd, J = 8.7,
1.5 Hz, 1H), 7.43 (d, J = 8.6 Hz, 1H), 7.30 (s, 1H), 4.57 (s, 1H), 4.23 (t, J = 6.9 Hz, 2H), 3.18 (d,
J = 6.8 Hz, 2H), 2.08 (p, J = 6.7 Hz, 2H), 1.47 (s, 9H). 13C NMR (100 MHz, CDCl3) δ 191.2,
155.3, 137.9, 129.0, 127.9, 126.5, 124.1, 121.6, 109.4, 91.2, 43.5, 37.1, 29.8, 27.6, 27.5. HRMS
(m/z): [M]+ cald for C17H21BrN2O3, 380.0736, found 380.0729
tert-butyl 3-(5-formyl-3-(4-(trifluoromethoxy)phenyl)-1H-indol-1-yl)propylcarbamate (4)
To a solution of tert-butyl 3-(3-bromo-5-formyl-1H-indol-1-yl)propylcarbamate (3) (1.49 g, 3.91
mmol) in dioxane (30 mL), 4-(trifluoromethoxy)phenylboronic acid (1.20 g, 5.87 mmol),
Pd(PPh3)4 (0.225 g, 0.195 mmol), and a solution of potassium carbonate (1.08 g, 7.82 mmol in
H2O (7.82 mL)) were added sequentially. The resulting mixture was heated to 80 oC and stirred
for 48 h. Upon completion, the reaction was diluted with saturated aqueous NaHCO3 and
extracted 3 times with EtOAc. The combined organic layers were dried (Na2SO4), concentrated,
and the crude material was purified by combiflash 0→40% EtOAc in hexanes to yield tert-butyl
N
OHC
NHBoc
3 Br
N
OHC
NHBoc
4
OCF3
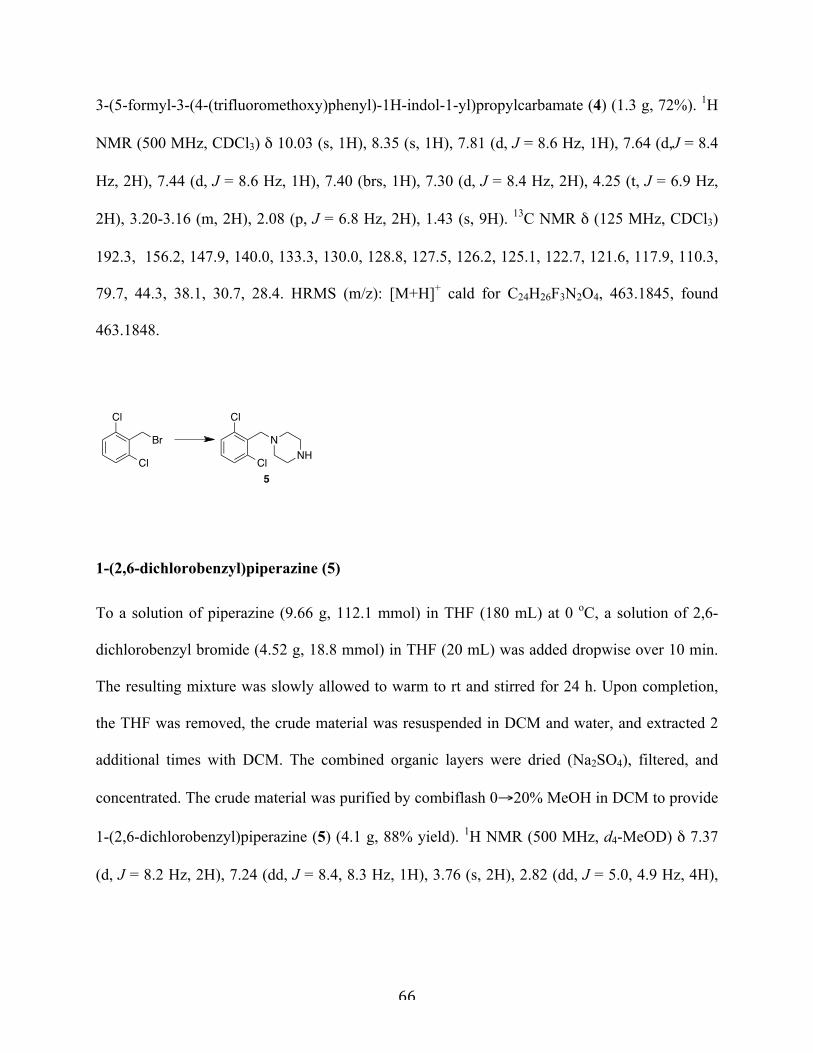
66
3-(5-formyl-3-(4-(trifluoromethoxy)phenyl)-1H-indol-1-yl)propylcarbamate (4) (1.3 g, 72%). 1H
NMR (500 MHz, CDCl3) δ 10.03 (s, 1H), 8.35 (s, 1H), 7.81 (d, J = 8.6 Hz, 1H), 7.64 (d,J = 8.4
Hz, 2H), 7.44 (d, J = 8.6 Hz, 1H), 7.40 (brs, 1H), 7.30 (d, J = 8.4 Hz, 2H), 4.25 (t, J = 6.9 Hz,
2H), 3.20-3.16 (m, 2H), 2.08 (p, J = 6.8 Hz, 2H), 1.43 (s, 9H). 13C NMR δ (125 MHz, CDCl3)
192.3, 156.2, 147.9, 140.0, 133.3, 130.0, 128.8, 127.5, 126.2, 125.1, 122.7, 121.6, 117.9, 110.3,
79.7, 44.3, 38.1, 30.7, 28.4. HRMS (m/z): [M+H]+ cald for C24H26F3N2O4, 463.1845, found
463.1848.
1-(2,6-dichlorobenzyl)piperazine (5)
To a solution of piperazine (9.66 g, 112.1 mmol) in THF (180 mL) at 0 oC, a solution of 2,6-
dichlorobenzyl bromide (4.52 g, 18.8 mmol) in THF (20 mL) was added dropwise over 10 min.
The resulting mixture was slowly allowed to warm to rt and stirred for 24 h. Upon completion,
the THF was removed, the crude material was resuspended in DCM and water, and extracted 2
additional times with DCM. The combined organic layers were dried (Na2SO4), filtered, and
concentrated. The crude material was purified by combiflash 0→20% MeOH in DCM to provide
1-(2,6-dichlorobenzyl)piperazine (5) (4.1 g, 88% yield). 1H NMR (500 MHz, d4-MeOD) δ 7.37
(d, J = 8.2 Hz, 2H), 7.24 (dd, J = 8.4, 8.3 Hz, 1H), 3.76 (s, 2H), 2.82 (dd, J = 5.0, 4.9 Hz, 4H),
Cl
Cl
NNH
Cl
Cl
Br
5
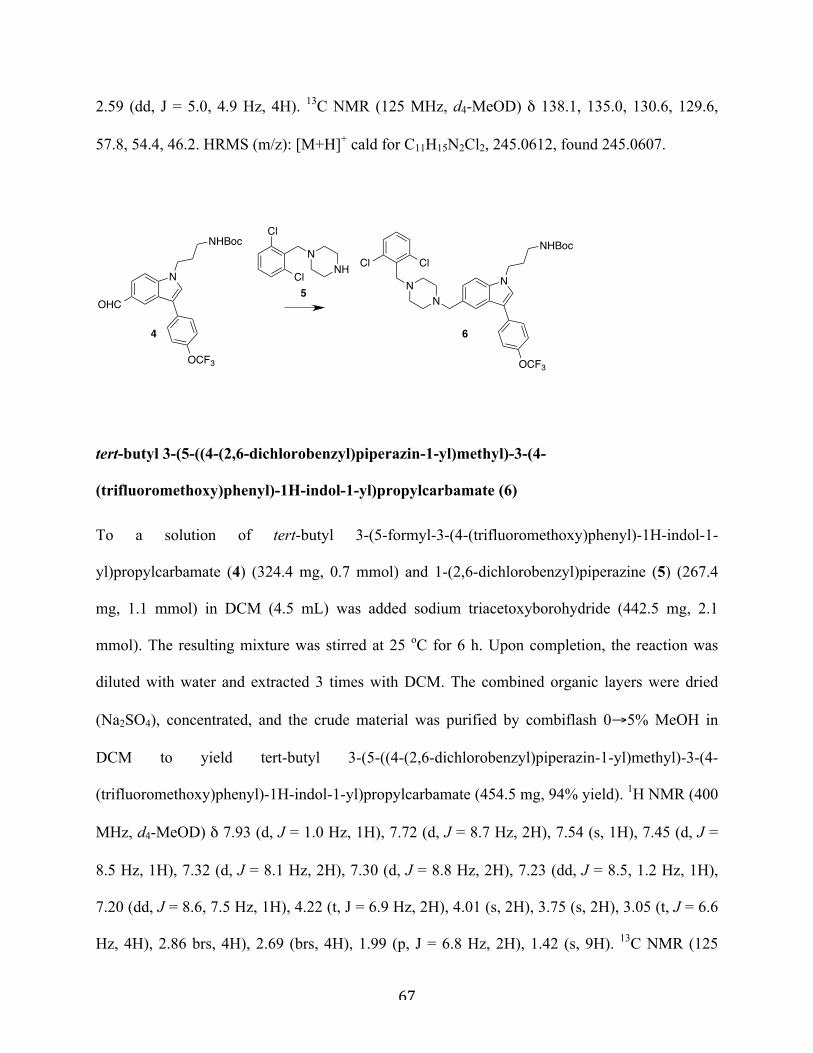
67
2.59 (dd, J = 5.0, 4.9 Hz, 4H). 13C NMR (125 MHz, d4-MeOD) δ 138.1, 135.0, 130.6, 129.6,
57.8, 54.4, 46.2. HRMS (m/z): [M+H]+ cald for C11H15N2Cl2, 245.0612, found 245.0607.
tert-butyl 3-(5-((4-(2,6-dichlorobenzyl)piperazin-1-yl)methyl)-3-(4-
(trifluoromethoxy)phenyl)-1H-indol-1-yl)propylcarbamate (6)
To a solution of tert-butyl 3-(5-formyl-3-(4-(trifluoromethoxy)phenyl)-1H-indol-1-
yl)propylcarbamate (4) (324.4 mg, 0.7 mmol) and 1-(2,6-dichlorobenzyl)piperazine (5) (267.4
mg, 1.1 mmol) in DCM (4.5 mL) was added sodium triacetoxyborohydride (442.5 mg, 2.1
mmol). The resulting mixture was stirred at 25 oC for 6 h. Upon completion, the reaction was
diluted with water and extracted 3 times with DCM. The combined organic layers were dried
(Na2SO4), concentrated, and the crude material was purified by combiflash 0→5% MeOH in
DCM to yield tert-butyl 3-(5-((4-(2,6-dichlorobenzyl)piperazin-1-yl)methyl)-3-(4-
(trifluoromethoxy)phenyl)-1H-indol-1-yl)propylcarbamate (454.5 mg, 94% yield). 1H NMR (400
MHz, d4-MeOD) δ 7.93 (d, J = 1.0 Hz, 1H), 7.72 (d, J = 8.7 Hz, 2H), 7.54 (s, 1H), 7.45 (d, J =
8.5 Hz, 1H), 7.32 (d, J = 8.1 Hz, 2H), 7.30 (d, J = 8.8 Hz, 2H), 7.23 (dd, J = 8.5, 1.2 Hz, 1H),
7.20 (dd, J = 8.6, 7.5 Hz, 1H), 4.22 (t, J = 6.9 Hz, 2H), 4.01 (s, 2H), 3.75 (s, 2H), 3.05 (t, J = 6.6
Hz, 4H), 2.86 brs, 4H), 2.69 (brs, 4H), 1.99 (p, J = 6.8 Hz, 2H), 1.42 (s, 9H). 13C NMR (125
N
OHC
NHBoc
4
OCF3
Cl
Cl
NNH
5N
NHBoc
OCF3
NN
Cl Cl
6
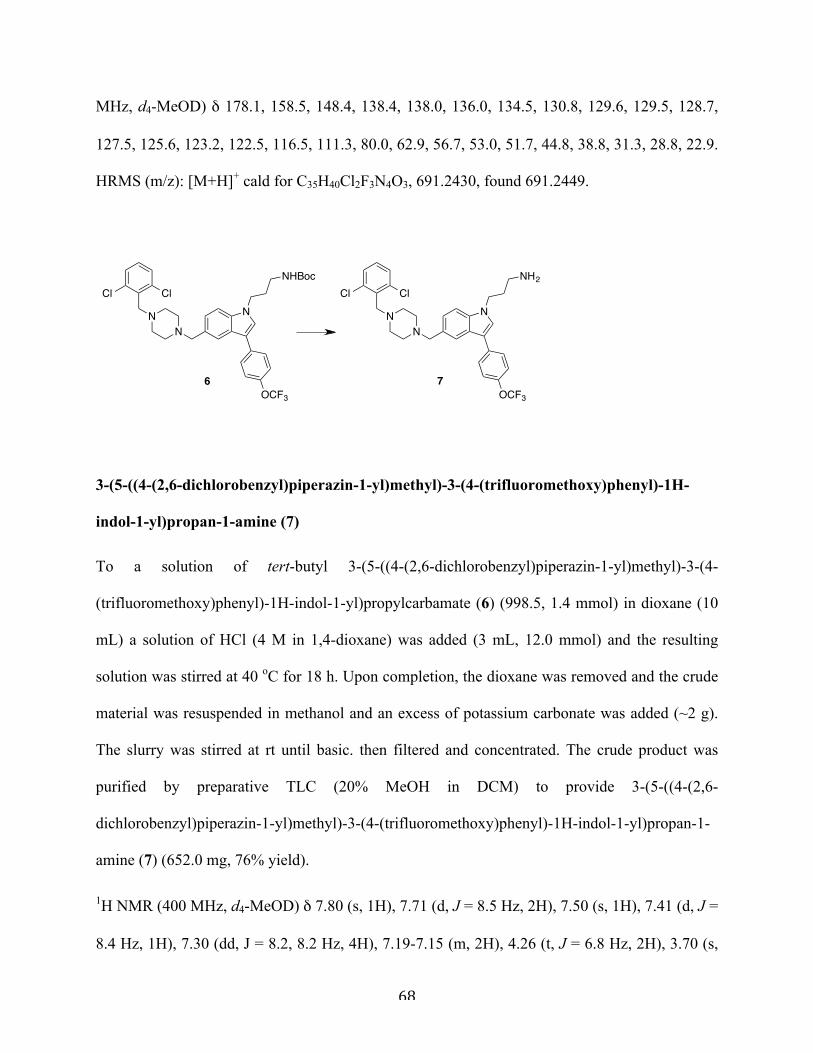
68
MHz, d4-MeOD) δ 178.1, 158.5, 148.4, 138.4, 138.0, 136.0, 134.5, 130.8, 129.6, 129.5, 128.7,
127.5, 125.6, 123.2, 122.5, 116.5, 111.3, 80.0, 62.9, 56.7, 53.0, 51.7, 44.8, 38.8, 31.3, 28.8, 22.9.
HRMS (m/z): [M+H]+ cald for C35H40Cl2F3N4O3, 691.2430, found 691.2449.
3-(5-((4-(2,6-dichlorobenzyl)piperazin-1-yl)methyl)-3-(4-(trifluoromethoxy)phenyl)-1H-
indol-1-yl)propan-1-amine (7)
To a solution of tert-butyl 3-(5-((4-(2,6-dichlorobenzyl)piperazin-1-yl)methyl)-3-(4-
(trifluoromethoxy)phenyl)-1H-indol-1-yl)propylcarbamate (6) (998.5, 1.4 mmol) in dioxane (10
mL) a solution of HCl (4 M in 1,4-dioxane) was added (3 mL, 12.0 mmol) and the resulting
solution was stirred at 40 oC for 18 h. Upon completion, the dioxane was removed and the crude
material was resuspended in methanol and an excess of potassium carbonate was added (~2 g).
The slurry was stirred at rt until basic. then filtered and concentrated. The crude product was
purified by preparative TLC (20% MeOH in DCM) to provide 3-(5-((4-(2,6-
dichlorobenzyl)piperazin-1-yl)methyl)-3-(4-(trifluoromethoxy)phenyl)-1H-indol-1-yl)propan-1-
amine (7) (652.0 mg, 76% yield).
1H NMR (400 MHz, d4-MeOD) δ 7.80 (s, 1H), 7.71 (d, J = 8.5 Hz, 2H), 7.50 (s, 1H), 7.41 (d, J =
8.4 Hz, 1H), 7.30 (dd, J = 8.2, 8.2 Hz, 4H), 7.19-7.15 (m, 2H), 4.26 (t, J = 6.8 Hz, 2H), 3.70 (s,
N
NHBoc
OCF3
NN
Cl Cl
6
N
NH2
OCF3
NN
Cl Cl
7
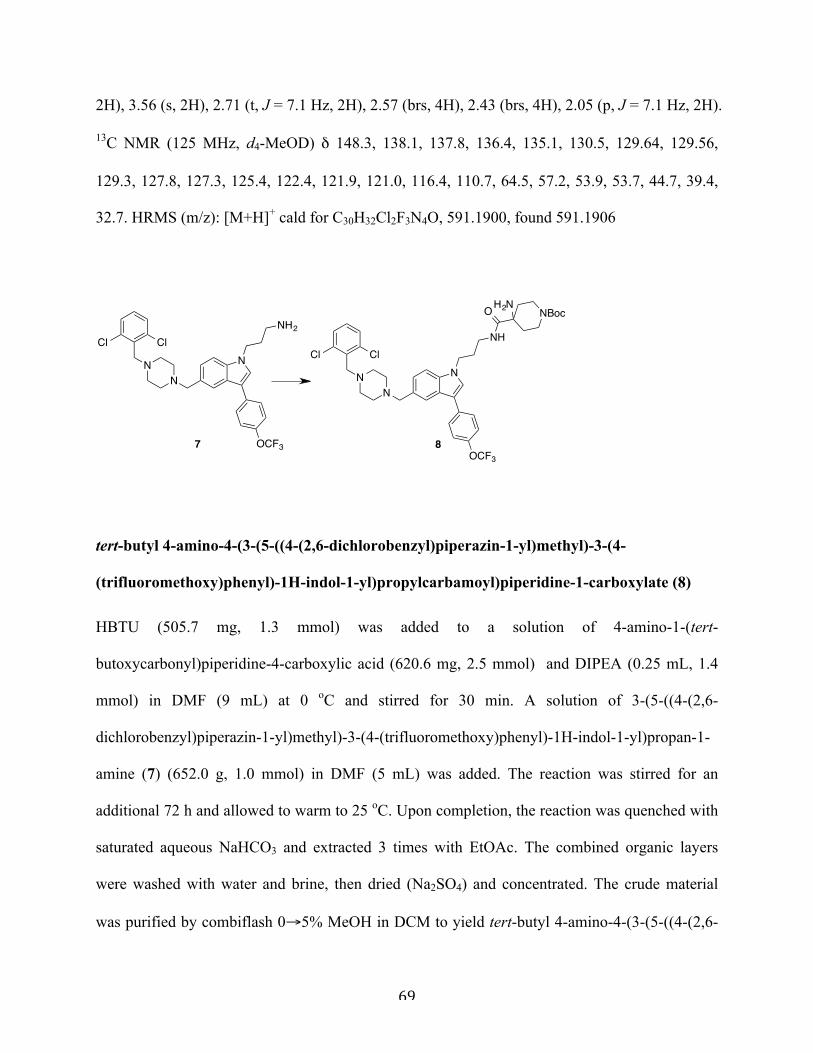
69
2H), 3.56 (s, 2H), 2.71 (t, J = 7.1 Hz, 2H), 2.57 (brs, 4H), 2.43 (brs, 4H), 2.05 (p, J = 7.1 Hz, 2H).
13C NMR (125 MHz, d4-MeOD) δ 148.3, 138.1, 137.8, 136.4, 135.1, 130.5, 129.64, 129.56,
129.3, 127.8, 127.3, 125.4, 122.4, 121.9, 121.0, 116.4, 110.7, 64.5, 57.2, 53.9, 53.7, 44.7, 39.4,
32.7. HRMS (m/z): [M+H]+ cald for C30H32Cl2F3N4O, 591.1900, found 591.1906
tert-butyl 4-amino-4-(3-(5-((4-(2,6-dichlorobenzyl)piperazin-1-yl)methyl)-3-(4-
(trifluoromethoxy)phenyl)-1H-indol-1-yl)propylcarbamoyl)piperidine-1-carboxylate (8)
HBTU (505.7 mg, 1.3 mmol) was added to a solution of 4-amino-1-(tert-
butoxycarbonyl)piperidine-4-carboxylic acid (620.6 mg, 2.5 mmol) and DIPEA (0.25 mL, 1.4
mmol) in DMF (9 mL) at 0 oC and stirred for 30 min. A solution of 3-(5-((4-(2,6-
dichlorobenzyl)piperazin-1-yl)methyl)-3-(4-(trifluoromethoxy)phenyl)-1H-indol-1-yl)propan-1-
amine (7) (652.0 g, 1.0 mmol) in DMF (5 mL) was added. The reaction was stirred for an
additional 72 h and allowed to warm to 25 oC. Upon completion, the reaction was quenched with
saturated aqueous NaHCO3 and extracted 3 times with EtOAc. The combined organic layers
were washed with water and brine, then dried (Na2SO4) and concentrated. The crude material
was purified by combiflash 0→5% MeOH in DCM to yield tert-butyl 4-amino-4-(3-(5-((4-(2,6-
N
NH2
OCF3
NN
Cl Cl
7
N
NH
OCF3
NN
Cl Cl
O NBocH2N
8
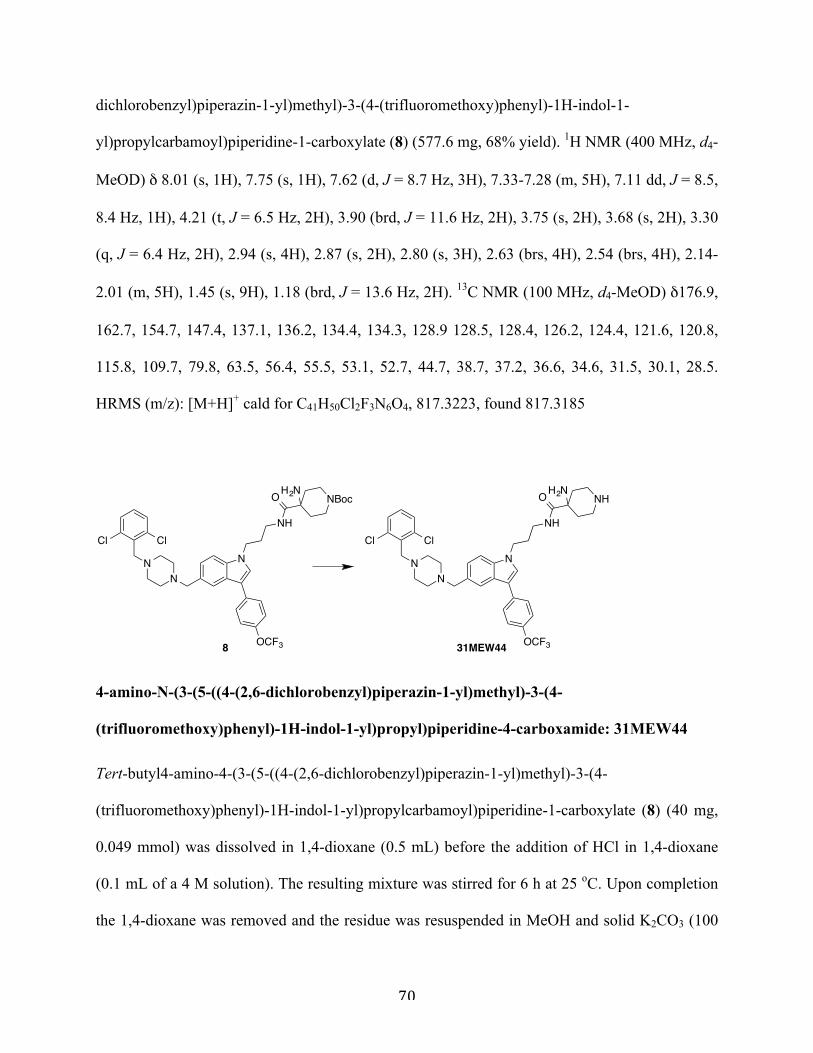
70
dichlorobenzyl)piperazin-1-yl)methyl)-3-(4-(trifluoromethoxy)phenyl)-1H-indol-1-
yl)propylcarbamoyl)piperidine-1-carboxylate (8) (577.6 mg, 68% yield). 1H NMR (400 MHz, d4-
MeOD) δ 8.01 (s, 1H), 7.75 (s, 1H), 7.62 (d, J = 8.7 Hz, 3H), 7.33-7.28 (m, 5H), 7.11 dd, J = 8.5,
8.4 Hz, 1H), 4.21 (t, J = 6.5 Hz, 2H), 3.90 (brd, J = 11.6 Hz, 2H), 3.75 (s, 2H), 3.68 (s, 2H), 3.30
(q, J = 6.4 Hz, 2H), 2.94 (s, 4H), 2.87 (s, 2H), 2.80 (s, 3H), 2.63 (brs, 4H), 2.54 (brs, 4H), 2.14-
2.01 (m, 5H), 1.45 (s, 9H), 1.18 (brd, J = 13.6 Hz, 2H). 13C NMR (100 MHz, d4-MeOD) δ176.9,
162.7, 154.7, 147.4, 137.1, 136.2, 134.4, 134.3, 128.9 128.5, 128.4, 126.2, 124.4, 121.6, 120.8,
115.8, 109.7, 79.8, 63.5, 56.4, 55.5, 53.1, 52.7, 44.7, 38.7, 37.2, 36.6, 34.6, 31.5, 30.1, 28.5.
HRMS (m/z): [M+H]+ cald for C41H50Cl2F3N6O4, 817.3223, found 817.3185
4-amino-N-(3-(5-((4-(2,6-dichlorobenzyl)piperazin-1-yl)methyl)-3-(4-
(trifluoromethoxy)phenyl)-1H-indol-1-yl)propyl)piperidine-4-carboxamide: 31MEW44
Tert-butyl4-amino-4-(3-(5-((4-(2,6-dichlorobenzyl)piperazin-1-yl)methyl)-3-(4-
(trifluoromethoxy)phenyl)-1H-indol-1-yl)propylcarbamoyl)piperidine-1-carboxylate (8) (40 mg,
0.049 mmol) was dissolved in 1,4-dioxane (0.5 mL) before the addition of HCl in 1,4-dioxane
(0.1 mL of a 4 M solution). The resulting mixture was stirred for 6 h at 25 oC. Upon completion
the 1,4-dioxane was removed and the residue was resuspended in MeOH and solid K2CO3 (100
N
NH
OCF3
NN
Cl Cl
O NBocH2N
N
NH
OCF3
NN
Cl Cl
O NHH2N
31MEW448
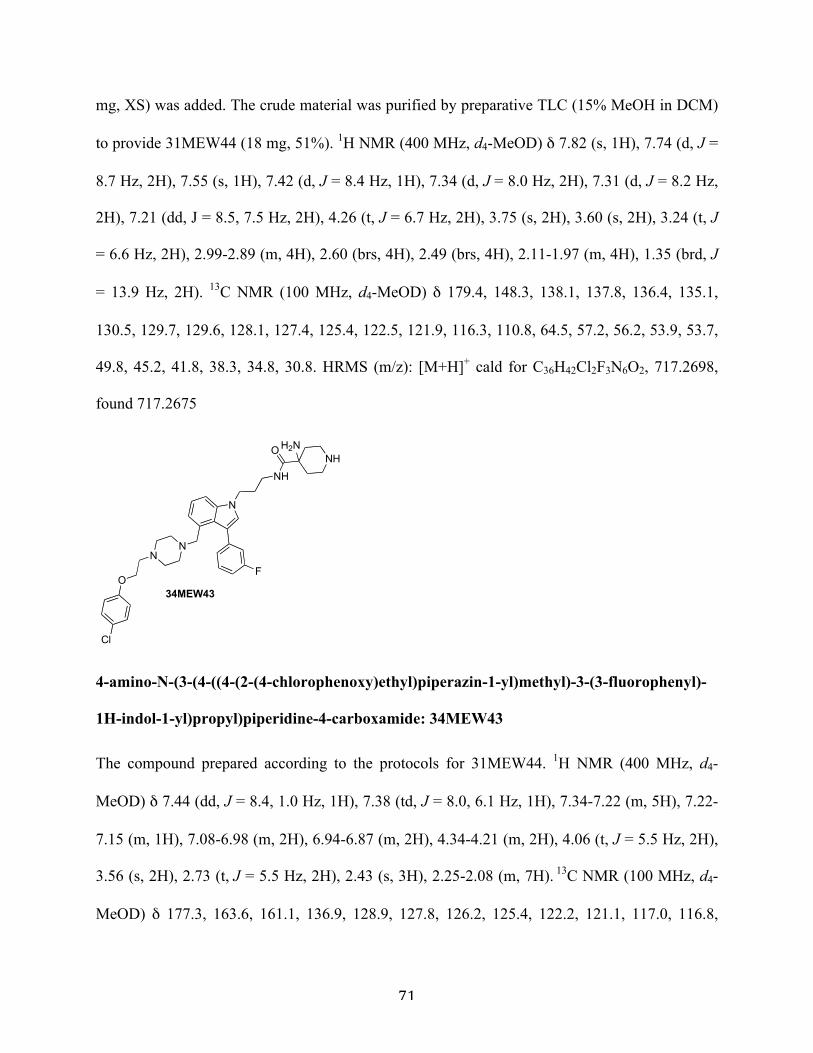
71
mg, XS) was added. The crude material was purified by preparative TLC (15% MeOH in DCM)
to provide 31MEW44 (18 mg, 51%). 1H NMR (400 MHz, d4-MeOD) δ 7.82 (s, 1H), 7.74 (d, J =
8.7 Hz, 2H), 7.55 (s, 1H), 7.42 (d, J = 8.4 Hz, 1H), 7.34 (d, J = 8.0 Hz, 2H), 7.31 (d, J = 8.2 Hz,
2H), 7.21 (dd, J = 8.5, 7.5 Hz, 2H), 4.26 (t, J = 6.7 Hz, 2H), 3.75 (s, 2H), 3.60 (s, 2H), 3.24 (t, J
= 6.6 Hz, 2H), 2.99-2.89 (m, 4H), 2.60 (brs, 4H), 2.49 (brs, 4H), 2.11-1.97 (m, 4H), 1.35 (brd, J
= 13.9 Hz, 2H). 13C NMR (100 MHz, d4-MeOD) δ 179.4, 148.3, 138.1, 137.8, 136.4, 135.1,
130.5, 129.7, 129.6, 128.1, 127.4, 125.4, 122.5, 121.9, 116.3, 110.8, 64.5, 57.2, 56.2, 53.9, 53.7,
49.8, 45.2, 41.8, 38.3, 34.8, 30.8. HRMS (m/z): [M+H]+ cald for C36H42Cl2F3N6O2, 717.2698,
found 717.2675
4-amino-N-(3-(4-((4-(2-(4-chlorophenoxy)ethyl)piperazin-1-yl)methyl)-3-(3-fluorophenyl)-
1H-indol-1-yl)propyl)piperidine-4-carboxamide: 34MEW43
The compound prepared according to the protocols for 31MEW44. 1H NMR (400 MHz, d4-
MeOD) δ 7.44 (dd, J = 8.4, 1.0 Hz, 1H), 7.38 (td, J = 8.0, 6.1 Hz, 1H), 7.34-7.22 (m, 5H), 7.22-
7.15 (m, 1H), 7.08-6.98 (m, 2H), 6.94-6.87 (m, 2H), 4.34-4.21 (m, 2H), 4.06 (t, J = 5.5 Hz, 2H),
3.56 (s, 2H), 2.73 (t, J = 5.5 Hz, 2H), 2.43 (s, 3H), 2.25-2.08 (m, 7H). 13C NMR (100 MHz, d4-
MeOD) δ 177.3, 163.6, 161.1, 136.9, 128.9, 127.8, 126.2, 125.4, 122.2, 121.1, 117.0, 116.8,
N
NH
NN
ONH
H2N
FO
Cl
34MEW43
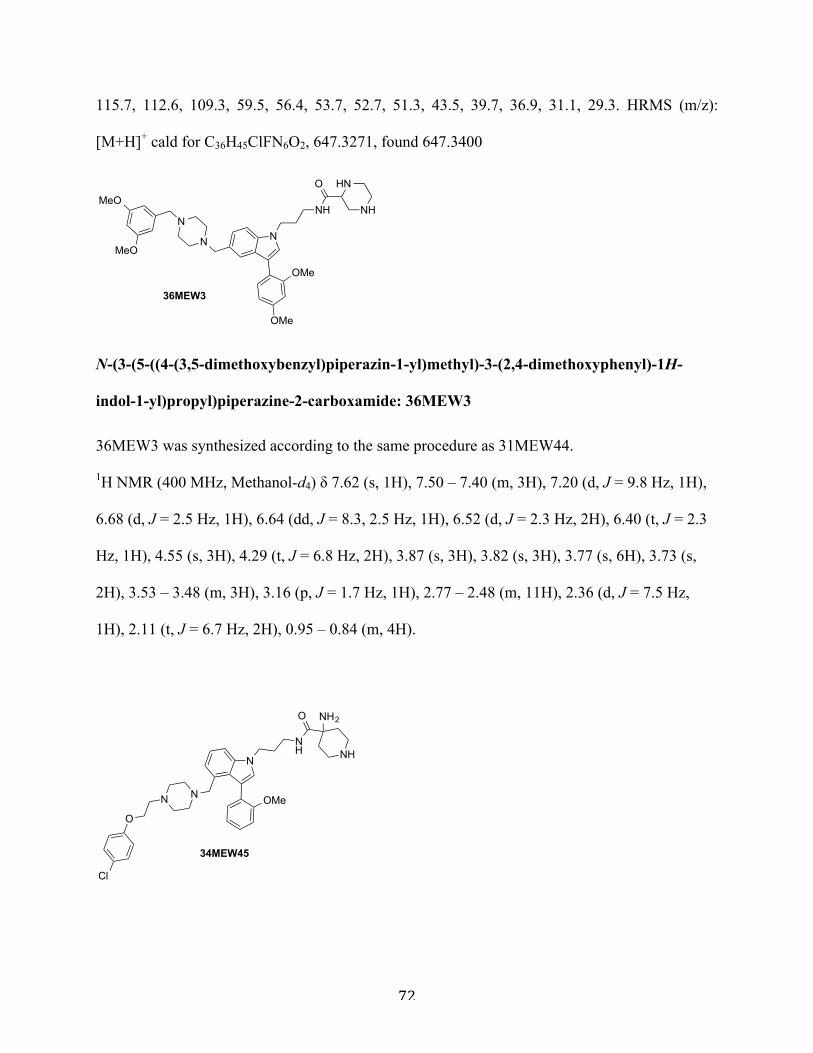
72
115.7, 112.6, 109.3, 59.5, 56.4, 53.7, 52.7, 51.3, 43.5, 39.7, 36.9, 31.1, 29.3. HRMS (m/z):
[M+H]+ cald for C36H45ClFN6O2, 647.3271, found 647.3400
N-(3-(5-((4-(3,5-dimethoxybenzyl)piperazin-1-yl)methyl)-3-(2,4-dimethoxyphenyl)-1H-
indol-1-yl)propyl)piperazine-2-carboxamide: 36MEW3
36MEW3 was synthesized according to the same procedure as 31MEW44.
1H NMR (400 MHz, Methanol-d4) δ 7.62 (s, 1H), 7.50 – 7.40 (m, 3H), 7.20 (d, J = 9.8 Hz, 1H),
6.68 (d, J = 2.5 Hz, 1H), 6.64 (dd, J = 8.3, 2.5 Hz, 1H), 6.52 (d, J = 2.3 Hz, 2H), 6.40 (t, J = 2.3
Hz, 1H), 4.55 (s, 3H), 4.29 (t, J = 6.8 Hz, 2H), 3.87 (s, 3H), 3.82 (s, 3H), 3.77 (s, 6H), 3.73 (s,
2H), 3.53 – 3.48 (m, 3H), 3.16 (p, J = 1.7 Hz, 1H), 2.77 – 2.48 (m, 11H), 2.36 (d, J = 7.5 Hz,
1H), 2.11 (t, J = 6.7 Hz, 2H), 0.95 – 0.84 (m, 4H).
N
NN
NH
O
NH
HNMeO
MeO
OMe
OMe
36MEW3
N
NH
NN
O
NH
NH2
O
Cl
OMe
34MEW45
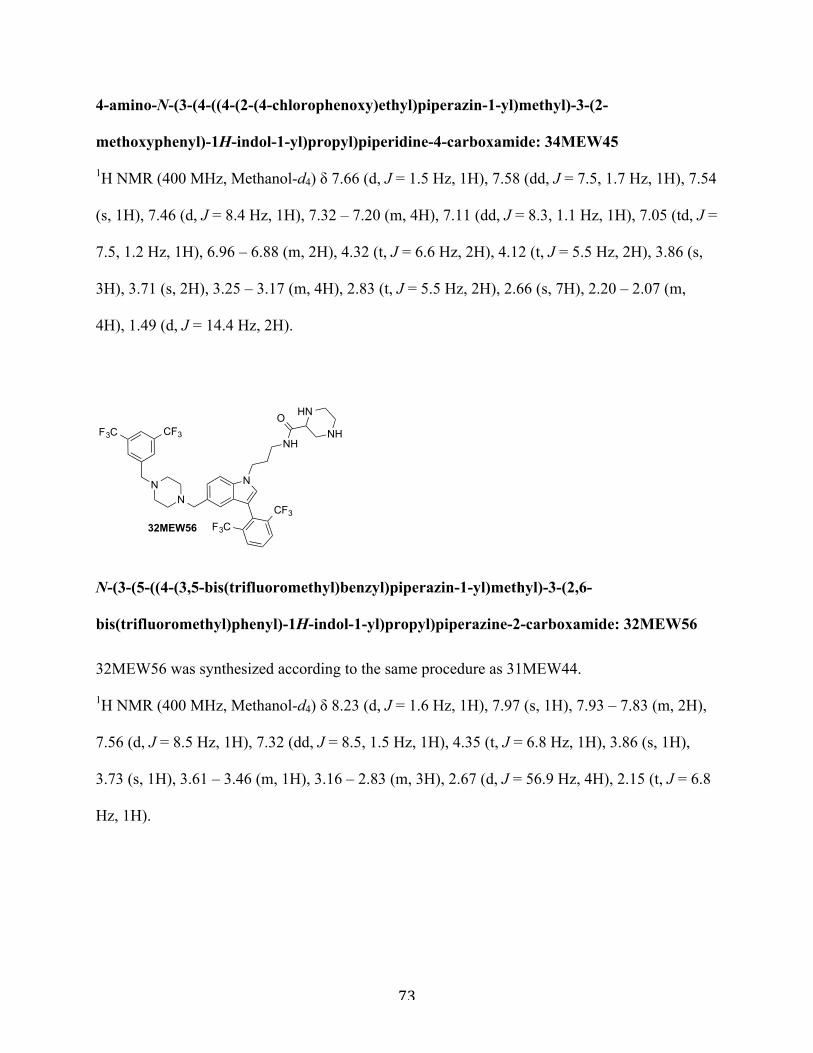
73
4-amino-N-(3-(4-((4-(2-(4-chlorophenoxy)ethyl)piperazin-1-yl)methyl)-3-(2-
methoxyphenyl)-1H-indol-1-yl)propyl)piperidine-4-carboxamide: 34MEW45
1H NMR (400 MHz, Methanol-d4) δ 7.66 (d, J = 1.5 Hz, 1H), 7.58 (dd, J = 7.5, 1.7 Hz, 1H), 7.54
(s, 1H), 7.46 (d, J = 8.4 Hz, 1H), 7.32 – 7.20 (m, 4H), 7.11 (dd, J = 8.3, 1.1 Hz, 1H), 7.05 (td, J =
7.5, 1.2 Hz, 1H), 6.96 – 6.88 (m, 2H), 4.32 (t, J = 6.6 Hz, 2H), 4.12 (t, J = 5.5 Hz, 2H), 3.86 (s,
3H), 3.71 (s, 2H), 3.25 – 3.17 (m, 4H), 2.83 (t, J = 5.5 Hz, 2H), 2.66 (s, 7H), 2.20 – 2.07 (m,
4H), 1.49 (d, J = 14.4 Hz, 2H).
N-(3-(5-((4-(3,5-bis(trifluoromethyl)benzyl)piperazin-1-yl)methyl)-3-(2,6-
bis(trifluoromethyl)phenyl)-1H-indol-1-yl)propyl)piperazine-2-carboxamide: 32MEW56
32MEW56 was synthesized according to the same procedure as 31MEW44.
1H NMR (400 MHz, Methanol-d4) δ 8.23 (d, J = 1.6 Hz, 1H), 7.97 (s, 1H), 7.93 – 7.83 (m, 2H),
7.56 (d, J = 8.5 Hz, 1H), 7.32 (dd, J = 8.5, 1.5 Hz, 1H), 4.35 (t, J = 6.8 Hz, 1H), 3.86 (s, 1H),
3.73 (s, 1H), 3.61 – 3.46 (m, 1H), 3.16 – 2.83 (m, 3H), 2.67 (d, J = 56.9 Hz, 4H), 2.15 (t, J = 6.8
Hz, 1H).
N
NH
NN
ONH
HN
CF3
F3C CF3
F3C32MEW56
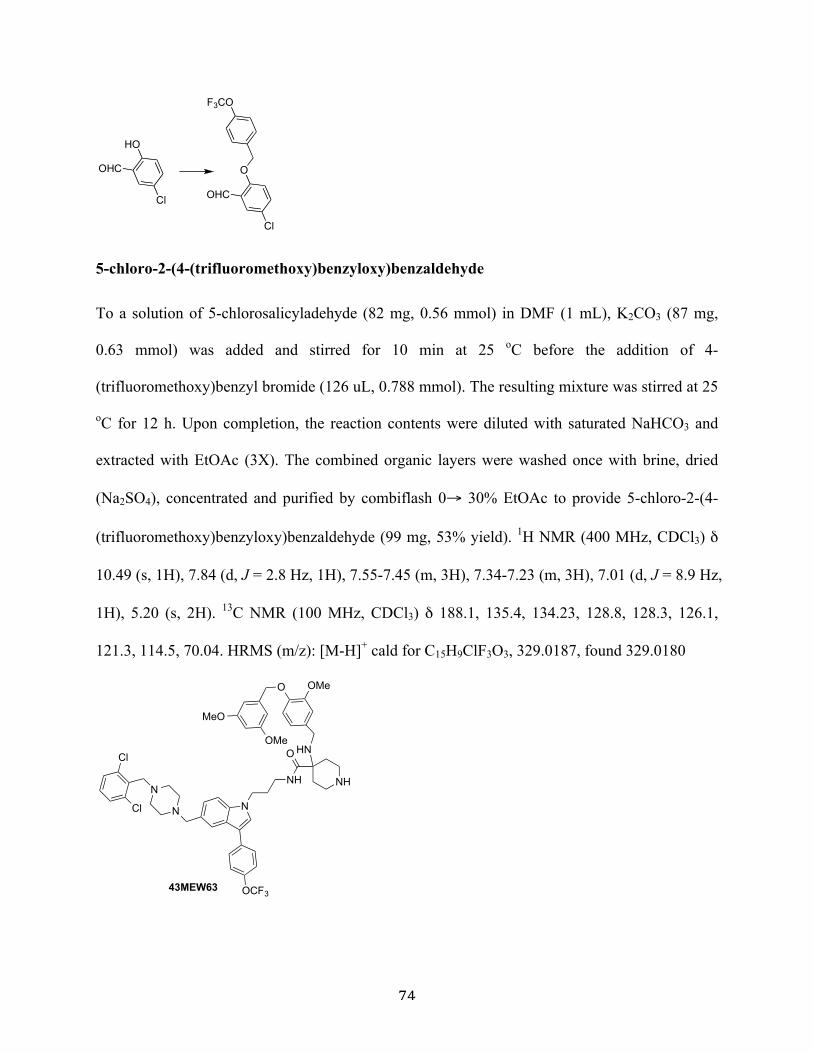
74
5-chloro-2-(4-(trifluoromethoxy)benzyloxy)benzaldehyde
To a solution of 5-chlorosalicyladehyde (82 mg, 0.56 mmol) in DMF (1 mL), K2CO3 (87 mg,
0.63 mmol) was added and stirred for 10 min at 25 oC before the addition of 4-
(trifluoromethoxy)benzyl bromide (126 uL, 0.788 mmol). The resulting mixture was stirred at 25
oC for 12 h. Upon completion, the reaction contents were diluted with saturated NaHCO3 and
extracted with EtOAc (3X). The combined organic layers were washed once with brine, dried
(Na2SO4), concentrated and purified by combiflash 0→ 30% EtOAc to provide 5-chloro-2-(4-
(trifluoromethoxy)benzyloxy)benzaldehyde (99 mg, 53% yield). 1H NMR (400 MHz, CDCl3) δ
10.49 (s, 1H), 7.84 (d, J = 2.8 Hz, 1H), 7.55-7.45 (m, 3H), 7.34-7.23 (m, 3H), 7.01 (d, J = 8.9 Hz,
1H), 5.20 (s, 2H). 13C NMR (100 MHz, CDCl3) δ 188.1, 135.4, 134.23, 128.8, 128.3, 126.1,
121.3, 114.5, 70.04. HRMS (m/z): [M-H]+ cald for C15H9ClF3O3, 329.0187, found 329.0180
OHC
Cl
O
F3CO
OHC
Cl
HO
N
NN
NH
O
NH
Cl
Cl
OCF3
HN
O
MeO
OMe
OMe
43MEW63
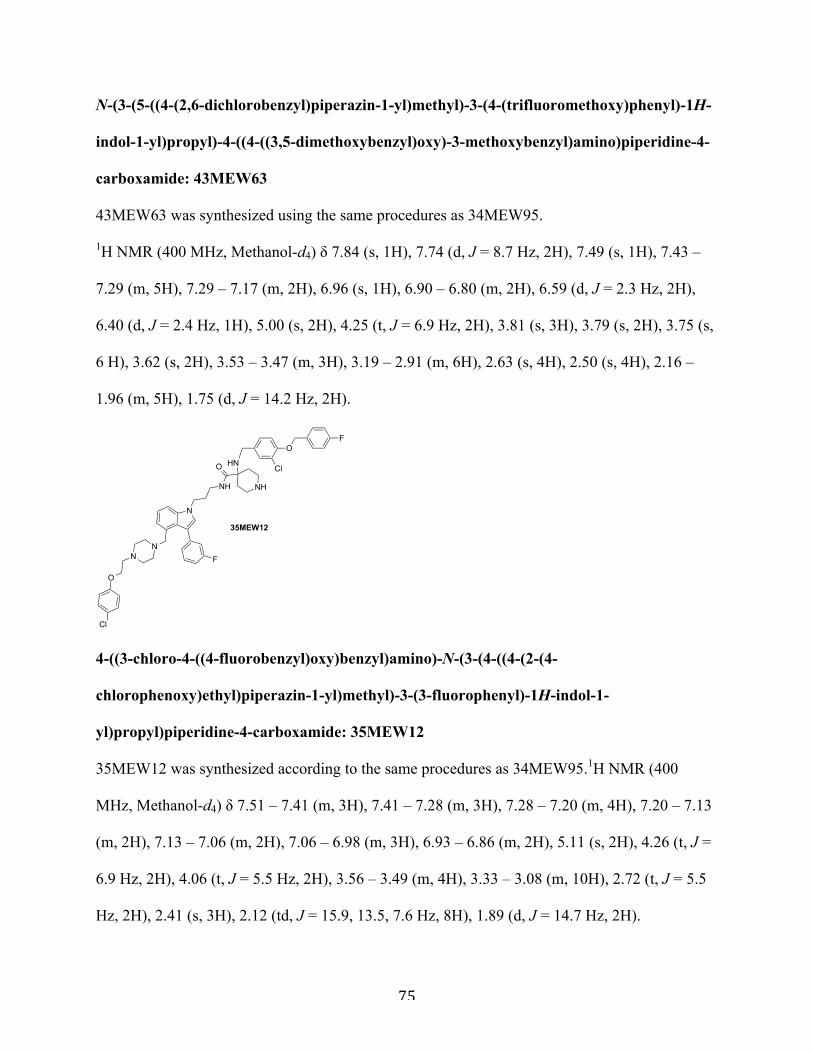
75
N-(3-(5-((4-(2,6-dichlorobenzyl)piperazin-1-yl)methyl)-3-(4-(trifluoromethoxy)phenyl)-1H-
indol-1-yl)propyl)-4-((4-((3,5-dimethoxybenzyl)oxy)-3-methoxybenzyl)amino)piperidine-4-
carboxamide: 43MEW63
43MEW63 was synthesized using the same procedures as 34MEW95.
1H NMR (400 MHz, Methanol-d4) δ 7.84 (s, 1H), 7.74 (d, J = 8.7 Hz, 2H), 7.49 (s, 1H), 7.43 –
7.29 (m, 5H), 7.29 – 7.17 (m, 2H), 6.96 (s, 1H), 6.90 – 6.80 (m, 2H), 6.59 (d, J = 2.3 Hz, 2H),
6.40 (d, J = 2.4 Hz, 1H), 5.00 (s, 2H), 4.25 (t, J = 6.9 Hz, 2H), 3.81 (s, 3H), 3.79 (s, 2H), 3.75 (s,
6 H), 3.62 (s, 2H), 3.53 – 3.47 (m, 3H), 3.19 – 2.91 (m, 6H), 2.63 (s, 4H), 2.50 (s, 4H), 2.16 –
1.96 (m, 5H), 1.75 (d, J = 14.2 Hz, 2H).
4-((3-chloro-4-((4-fluorobenzyl)oxy)benzyl)amino)-N-(3-(4-((4-(2-(4-
chlorophenoxy)ethyl)piperazin-1-yl)methyl)-3-(3-fluorophenyl)-1H-indol-1-
yl)propyl)piperidine-4-carboxamide: 35MEW12
35MEW12 was synthesized according to the same procedures as 34MEW95.1H NMR (400
MHz, Methanol-d4) δ 7.51 – 7.41 (m, 3H), 7.41 – 7.28 (m, 3H), 7.28 – 7.20 (m, 4H), 7.20 – 7.13
(m, 2H), 7.13 – 7.06 (m, 2H), 7.06 – 6.98 (m, 3H), 6.93 – 6.86 (m, 2H), 5.11 (s, 2H), 4.26 (t, J =
6.9 Hz, 2H), 4.06 (t, J = 5.5 Hz, 2H), 3.56 – 3.49 (m, 4H), 3.33 – 3.08 (m, 10H), 2.72 (t, J = 5.5
Hz, 2H), 2.41 (s, 3H), 2.12 (td, J = 15.9, 13.5, 7.6 Hz, 8H), 1.89 (d, J = 14.7 Hz, 2H).
N
NH
NN
O
NH
HN
F
O
Cl
O
Cl
F
35MEW12
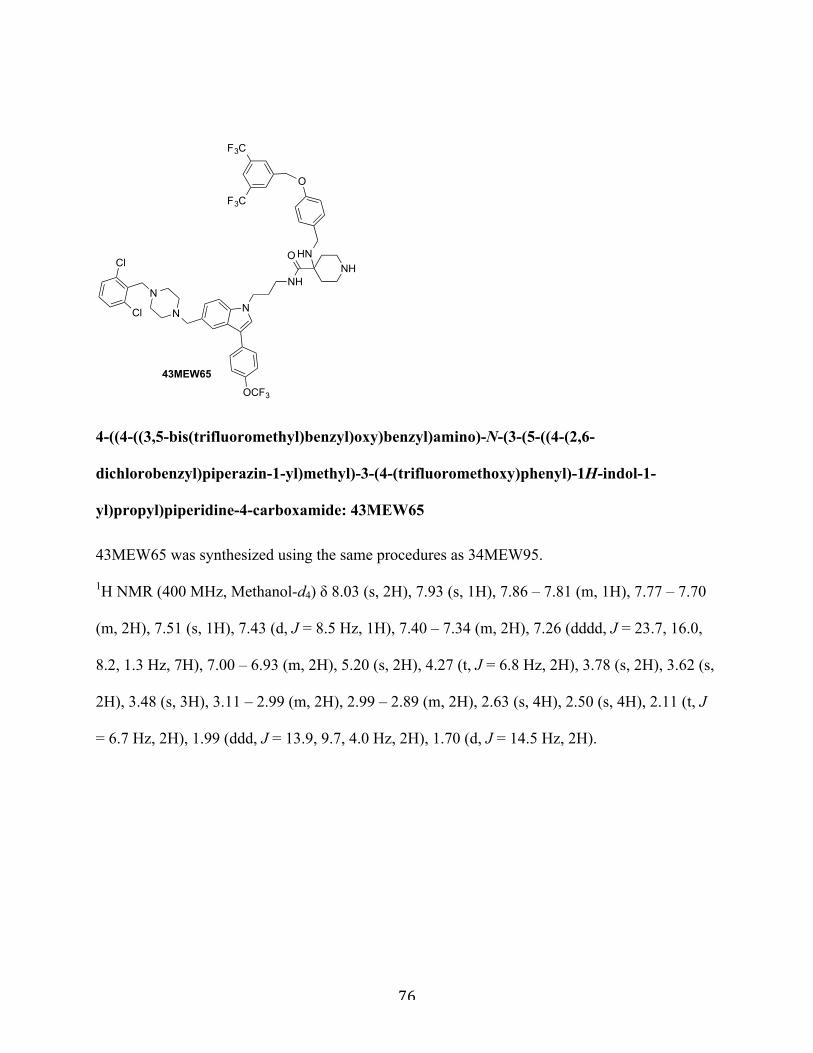
76
4-((4-((3,5-bis(trifluoromethyl)benzyl)oxy)benzyl)amino)-N-(3-(5-((4-(2,6-
dichlorobenzyl)piperazin-1-yl)methyl)-3-(4-(trifluoromethoxy)phenyl)-1H-indol-1-
yl)propyl)piperidine-4-carboxamide: 43MEW65
43MEW65 was synthesized using the same procedures as 34MEW95.
1H NMR (400 MHz, Methanol-d4) δ 8.03 (s, 2H), 7.93 (s, 1H), 7.86 – 7.81 (m, 1H), 7.77 – 7.70
(m, 2H), 7.51 (s, 1H), 7.43 (d, J = 8.5 Hz, 1H), 7.40 – 7.34 (m, 2H), 7.26 (dddd, J = 23.7, 16.0,
8.2, 1.3 Hz, 7H), 7.00 – 6.93 (m, 2H), 5.20 (s, 2H), 4.27 (t, J = 6.8 Hz, 2H), 3.78 (s, 2H), 3.62 (s,
2H), 3.48 (s, 3H), 3.11 – 2.99 (m, 2H), 2.99 – 2.89 (m, 2H), 2.63 (s, 4H), 2.50 (s, 4H), 2.11 (t, J
= 6.7 Hz, 2H), 1.99 (ddd, J = 13.9, 9.7, 4.0 Hz, 2H), 1.70 (d, J = 14.5 Hz, 2H).
N
NN
NH
ONHCl
Cl
OCF3
HN
O
F3C
F3C
43MEW65
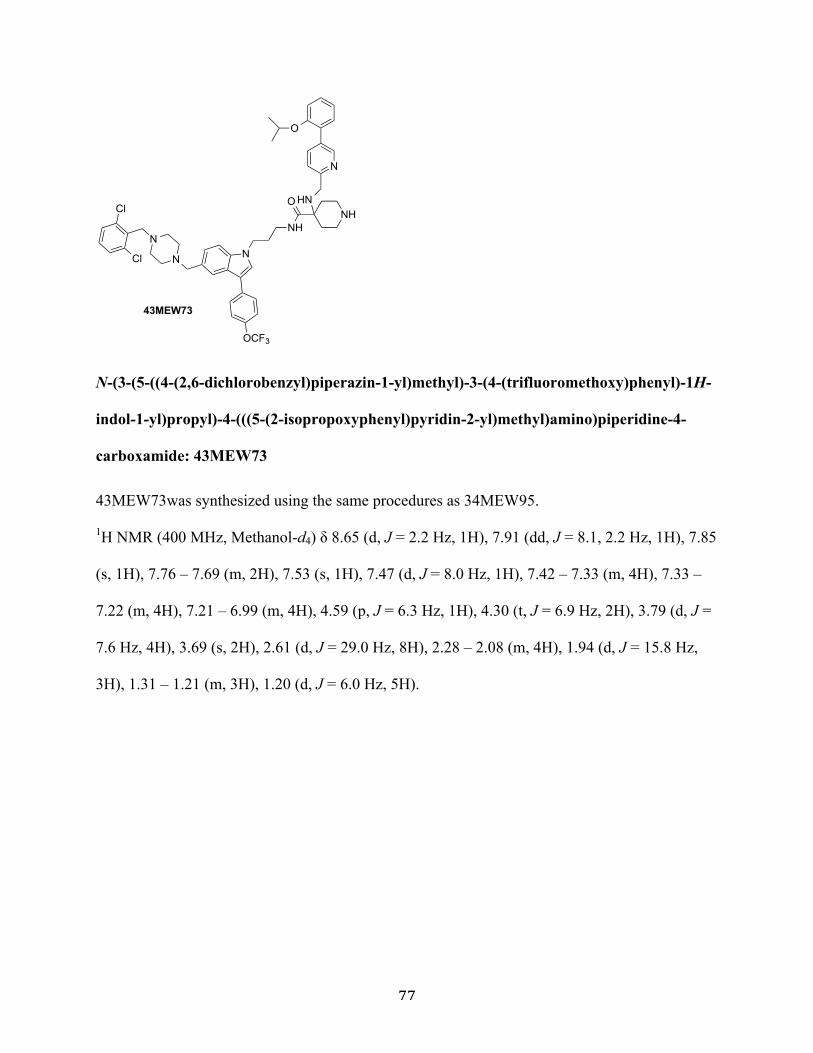
77
N-(3-(5-((4-(2,6-dichlorobenzyl)piperazin-1-yl)methyl)-3-(4-(trifluoromethoxy)phenyl)-1H-
indol-1-yl)propyl)-4-(((5-(2-isopropoxyphenyl)pyridin-2-yl)methyl)amino)piperidine-4-
carboxamide: 43MEW73
43MEW73was synthesized using the same procedures as 34MEW95.
1H NMR (400 MHz, Methanol-d4) δ 8.65 (d, J = 2.2 Hz, 1H), 7.91 (dd, J = 8.1, 2.2 Hz, 1H), 7.85
(s, 1H), 7.76 – 7.69 (m, 2H), 7.53 (s, 1H), 7.47 (d, J = 8.0 Hz, 1H), 7.42 – 7.33 (m, 4H), 7.33 –
7.22 (m, 4H), 7.21 – 6.99 (m, 4H), 4.59 (p, J = 6.3 Hz, 1H), 4.30 (t, J = 6.9 Hz, 2H), 3.79 (d, J =
7.6 Hz, 4H), 3.69 (s, 2H), 2.61 (d, J = 29.0 Hz, 8H), 2.28 – 2.08 (m, 4H), 1.94 (d, J = 15.8 Hz,
3H), 1.31 – 1.21 (m, 3H), 1.20 (d, J = 6.0 Hz, 5H).
N
NN
NH
ONHCl
Cl
OCF3
HN
N
O
43MEW73
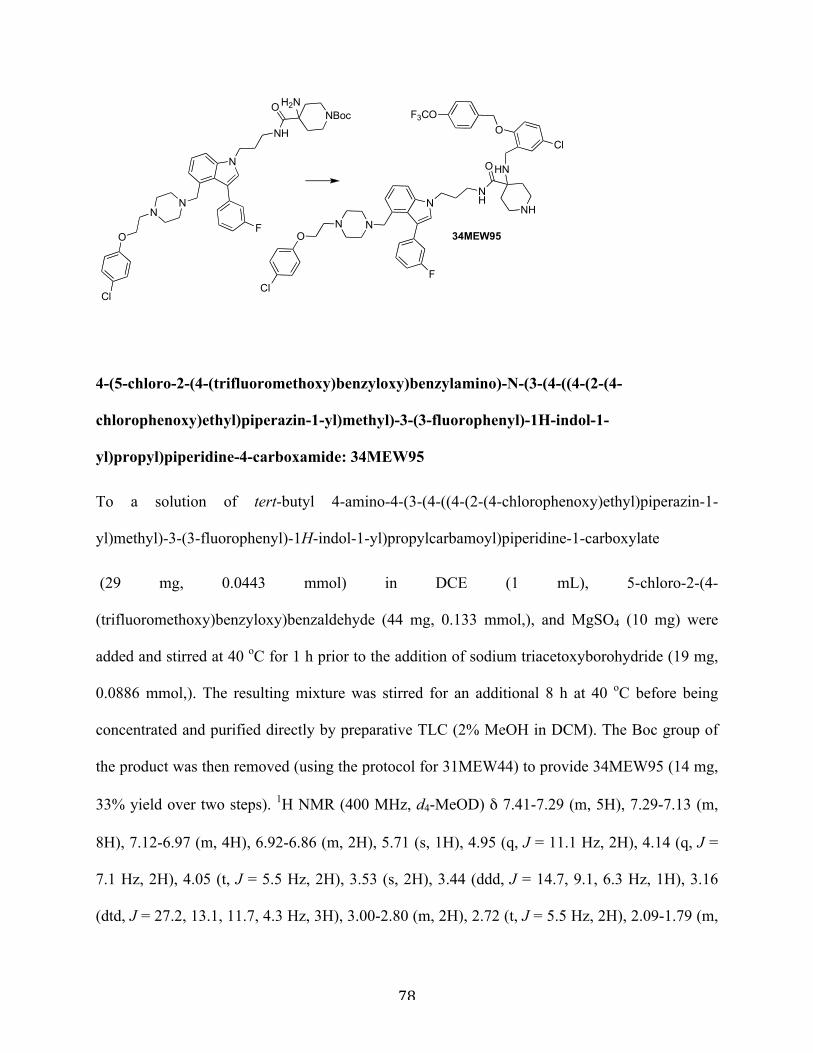
78
4-(5-chloro-2-(4-(trifluoromethoxy)benzyloxy)benzylamino)-N-(3-(4-((4-(2-(4-
chlorophenoxy)ethyl)piperazin-1-yl)methyl)-3-(3-fluorophenyl)-1H-indol-1-
yl)propyl)piperidine-4-carboxamide: 34MEW95
To a solution of tert-butyl 4-amino-4-(3-(4-((4-(2-(4-chlorophenoxy)ethyl)piperazin-1-
yl)methyl)-3-(3-fluorophenyl)-1H-indol-1-yl)propylcarbamoyl)piperidine-1-carboxylate
(29 mg, 0.0443 mmol) in DCE (1 mL), 5-chloro-2-(4-
(trifluoromethoxy)benzyloxy)benzaldehyde (44 mg, 0.133 mmol,), and MgSO4 (10 mg) were
added and stirred at 40 oC for 1 h prior to the addition of sodium triacetoxyborohydride (19 mg,
0.0886 mmol,). The resulting mixture was stirred for an additional 8 h at 40 oC before being
concentrated and purified directly by preparative TLC (2% MeOH in DCM). The Boc group of
the product was then removed (using the protocol for 31MEW44) to provide 34MEW95 (14 mg,
33% yield over two steps). 1H NMR (400 MHz, d4-MeOD) δ 7.41-7.29 (m, 5H), 7.29-7.13 (m,
8H), 7.12-6.97 (m, 4H), 6.92-6.86 (m, 2H), 5.71 (s, 1H), 4.95 (q, J = 11.1 Hz, 2H), 4.14 (q, J =
7.1 Hz, 2H), 4.05 (t, J = 5.5 Hz, 2H), 3.53 (s, 2H), 3.44 (ddd, J = 14.7, 9.1, 6.3 Hz, 1H), 3.16
(dtd, J = 27.2, 13.1, 11.7, 4.3 Hz, 3H), 3.00-2.80 (m, 2H), 2.72 (t, J = 5.5 Hz, 2H), 2.09-1.79 (m,
NNH
NN
O
NH
HN
F
O
Cl
ClO
F3CO
N
NH
NN
ONBoc
H2N
FO
Cl
34MEW95
79
5H), 1.71 (d, J = 14.1 Hz, 1H). 13C NMR (100 MHz, d4-MeOD) δ 175.6, 157.5, 155.8, 136.8,
135.2, 130.4, 130.2, 129.7, 129.3, 128.9, 128.8, 128.7, 127.5, 126.2, 126.1, 126.0, 125.4, 125.3,
122.2, 121.1, 120.8, 117.0, 116.9, 116.7, 115.6, 114.0, 112.4, 112.2, 108.9, 69.5, 65.2, 59.7, 58.8,
56.7, 53.0, 51.8, 43.3, 40.5, 40.4, 38.4, 31.2, 29.7, 27.3. HRMS (m/z): [M+H]+ cald for
C51H55Cl2F4N6O4, 961.3592, found 961.3020
80
Chapter 3: Cell-based and in vivo evaluation of 31MEW44
The data presented in this chapter is part of a submitted manuscript: Welsch M.E., Kaplan A.,
Chambers J.M., Pagano N.C., Yang W.S., M.S. Martin, Badgley M.A., Olive K.P., Ferrando A.,
Stockwell B.R., Multivalent inhibitors of RAS GTPases designed using PAINT
I. Introduction
Based on the near identical sequences within the D38 and A59 sites among the different
RAS isoforms, we speculated that 31MEW44 would function as a pan-RAS inhibitor. Ample
evidence exists that tumors with mutated RAS proteins are addicted to these oncogenic isoforms
[12, 86]. Thus, a pan-RAS inhibitor such as 31MEW44 might have an acceptable therapeutic
window in vivo to be used as a pharmacological agent against RAS mutant cancers. This chapter
describes the characterization of 31MEW44 to inhibit RAS signaling pathways in cell culture by
examining a variety of different cellular markers of RAS modulation, ranging from levels of
downstream phosphorylated proteins to altering the transcriptional effects of RAS activation.
With evidence of in vitro RAS inhibition and anticancer activity, 31MEW44 was then evaluated
in three different murine models for its ability to attenuate cancer progression.
II. Cell-based evaluation
IIa. Evaluation in a panel of cancer cell lines
To see 31MEW44 would be selectively lethal to mutant RAS-dependent cancers it was
evaluated in a panel of 10 mutant RAS cell lines and 4 wild-type cell lines (testing in the mutant
RAS lines performed by Nen Pagano, Fig. 3.1a). As one would expect, two most resistant lines
(SW982 and SW872) both possessed wild-type RAS and mutant BRAFV600E: a downstream RAS
effector. In the mutant RAS lines there was a very wide range in sensitivity observed. We
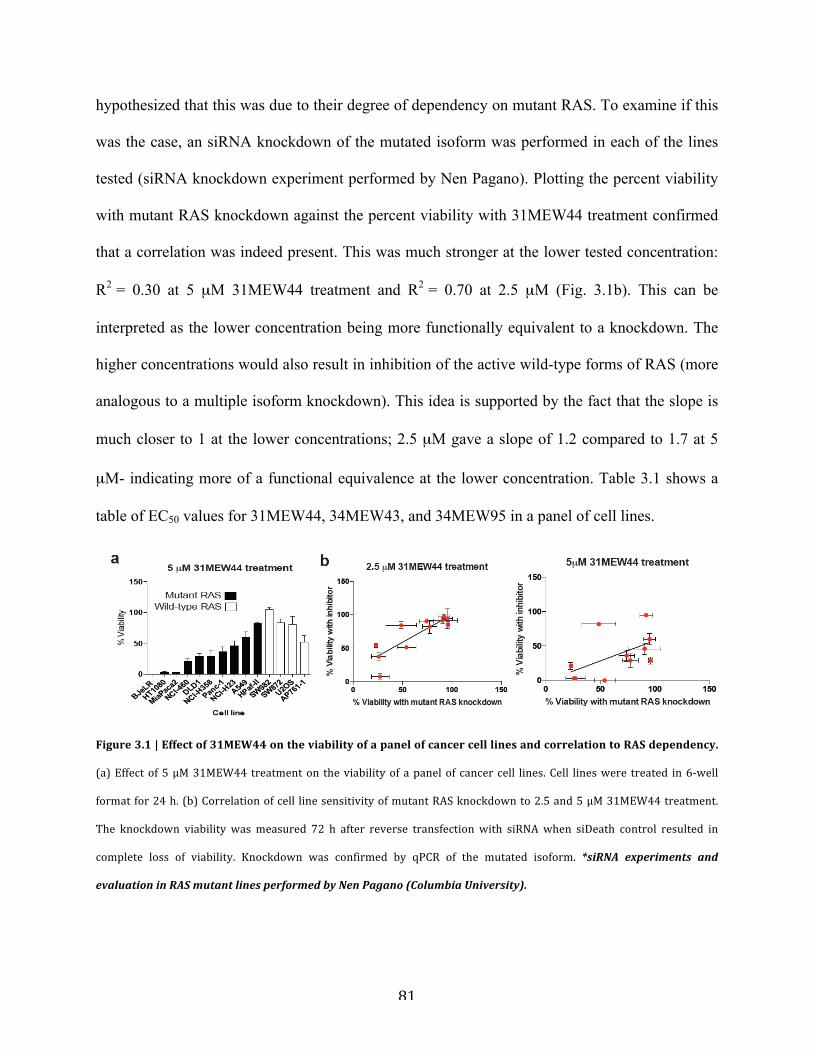
81
hypothesized that this was due to their degree of dependency on mutant RAS. To examine if this
was the case, an siRNA knockdown of the mutated isoform was performed in each of the lines
tested (siRNA knockdown experiment performed by Nen Pagano). Plotting the percent viability
with mutant RAS knockdown against the percent viability with 31MEW44 treatment confirmed
that a correlation was indeed present. This was much stronger at the lower tested concentration:
R2 = 0.30 at 5 µM 31MEW44 treatment and R2 = 0.70 at 2.5 µM (Fig. 3.1b). This can be
interpreted as the lower concentration being more functionally equivalent to a knockdown. The
higher concentrations would also result in inhibition of the active wild-type forms of RAS (more
analogous to a multiple isoform knockdown). This idea is supported by the fact that the slope is
much closer to 1 at the lower concentrations; 2.5 µM gave a slope of 1.2 compared to 1.7 at 5
µM- indicating more of a functional equivalence at the lower concentration. Table 3.1 shows a
table of EC50 values for 31MEW44, 34MEW43, and 34MEW95 in a panel of cell lines.
Figure 3.1 | Effect of 31MEW44 on the viability of a panel of cancer cell lines and correlation to RAS dependency.
(a) Effect of 5 μM 31MEW44 treatment on the viability of a panel of cancer cell lines. Cell lines were treated in 6-‐well
format for 24 h. (b) Correlation of cell line sensitivity of mutant RAS knockdown to 2.5 and 5 μM 31MEW44 treatment.
The knockdown viability was measured 72 h after reverse transfection with siRNA when siDeath control resulted in
complete loss of viability. Knockdown was confirmed by qPCR of the mutated isoform. *siRNA experiments and
evaluation in RAS mutant lines performed by Nen Pagano (Columbia University).
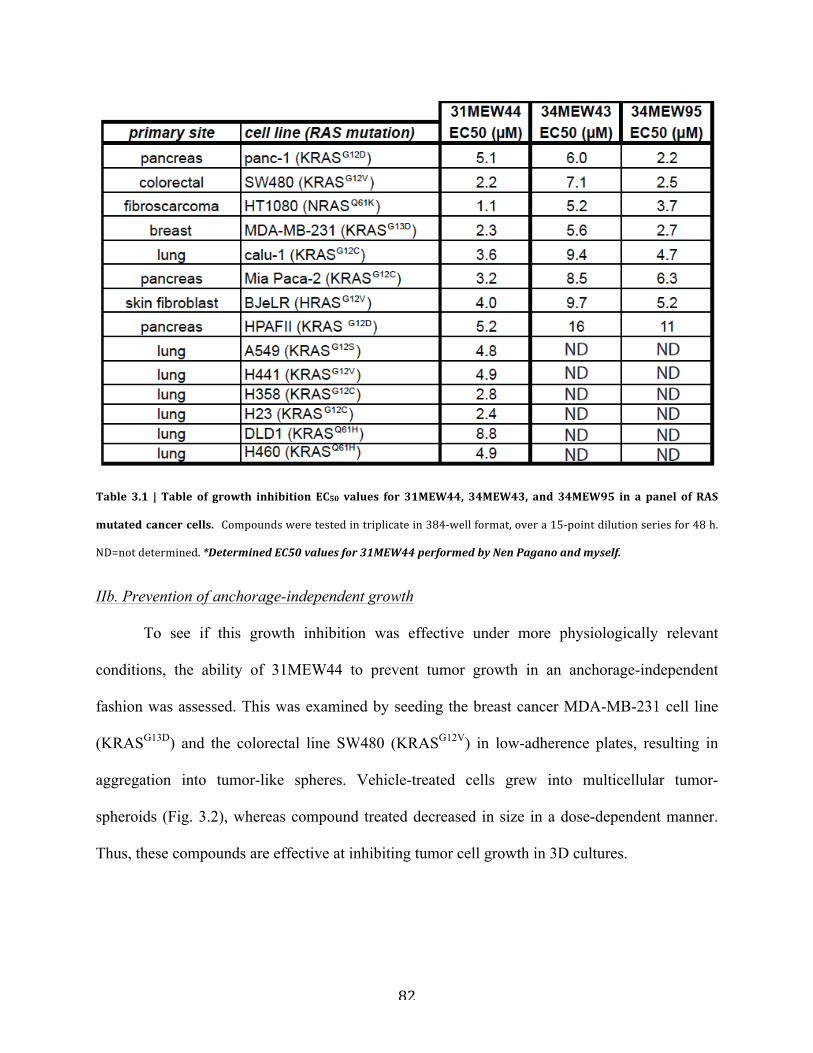
82
Table 3.1 | Table of growth inhibition EC50 values for 31MEW44, 34MEW43, and 34MEW95 in a panel of RAS
mutated cancer cells. Compounds were tested in triplicate in 384-‐well format, over a 15-‐point dilution series for 48 h.
ND=not determined. *Determined EC50 values for 31MEW44 performed by Nen Pagano and myself.
IIb. Prevention of anchorage-independent growth
To see if this growth inhibition was effective under more physiologically relevant
conditions, the ability of 31MEW44 to prevent tumor growth in an anchorage-independent
fashion was assessed. This was examined by seeding the breast cancer MDA-MB-231 cell line
(KRASG13D) and the colorectal line SW480 (KRASG12V) in low-adherence plates, resulting in
aggregation into tumor-like spheres. Vehicle-treated cells grew into multicellular tumor-
spheroids (Fig. 3.2), whereas compound treated decreased in size in a dose-dependent manner.
Thus, these compounds are effective at inhibiting tumor cell growth in 3D cultures.
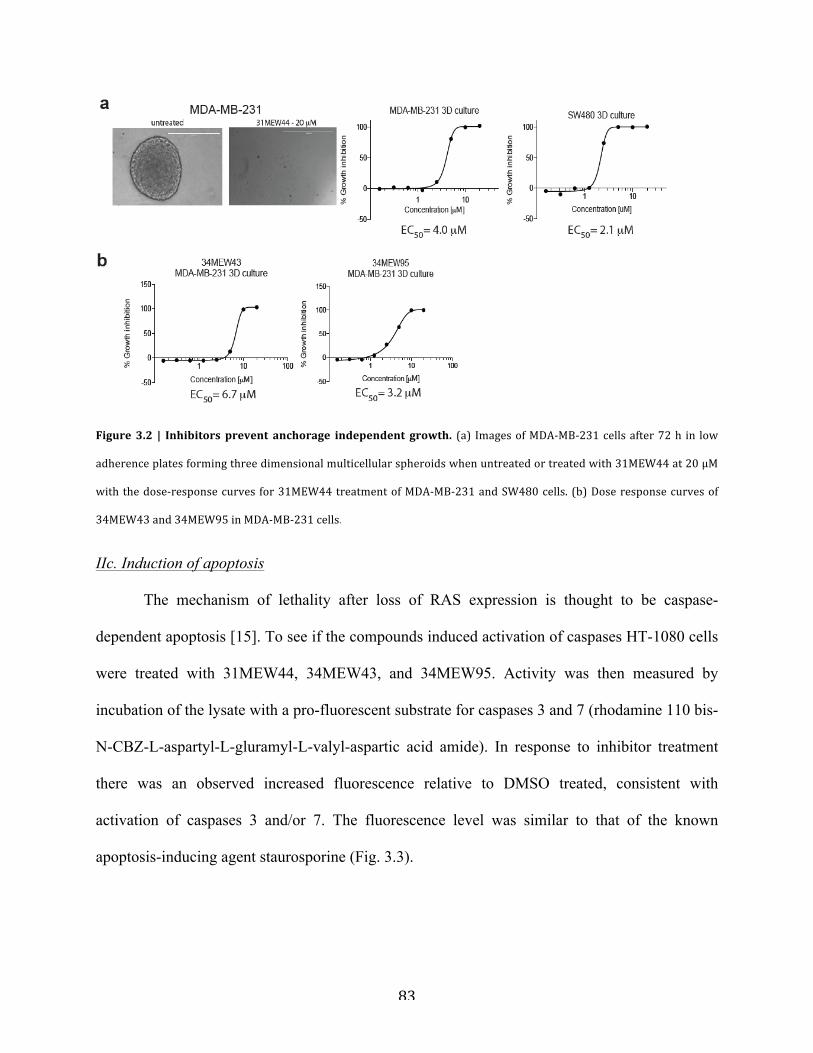
83
Figure 3.2 | Inhibitors prevent anchorage independent growth. (a) Images of MDA-‐MB-‐231 cells after 72 h in low
adherence plates forming three dimensional multicellular spheroids when untreated or treated with 31MEW44 at 20 μM
with the dose-‐response curves for 31MEW44 treatment of MDA-‐MB-‐231 and SW480 cells. (b) Dose response curves of
34MEW43 and 34MEW95 in MDA-‐MB-‐231 cells.
IIc. Induction of apoptosis
The mechanism of lethality after loss of RAS expression is thought to be caspase-
dependent apoptosis [15]. To see if the compounds induced activation of caspases HT-1080 cells
were treated with 31MEW44, 34MEW43, and 34MEW95. Activity was then measured by
incubation of the lysate with a pro-fluorescent substrate for caspases 3 and 7 (rhodamine 110 bis-
N-CBZ-L-aspartyl-L-gluramyl-L-valyl-aspartic acid amide). In response to inhibitor treatment
there was an observed increased fluorescence relative to DMSO treated, consistent with
activation of caspases 3 and/or 7. The fluorescence level was similar to that of the known
apoptosis-inducing agent staurosporine (Fig. 3.3).
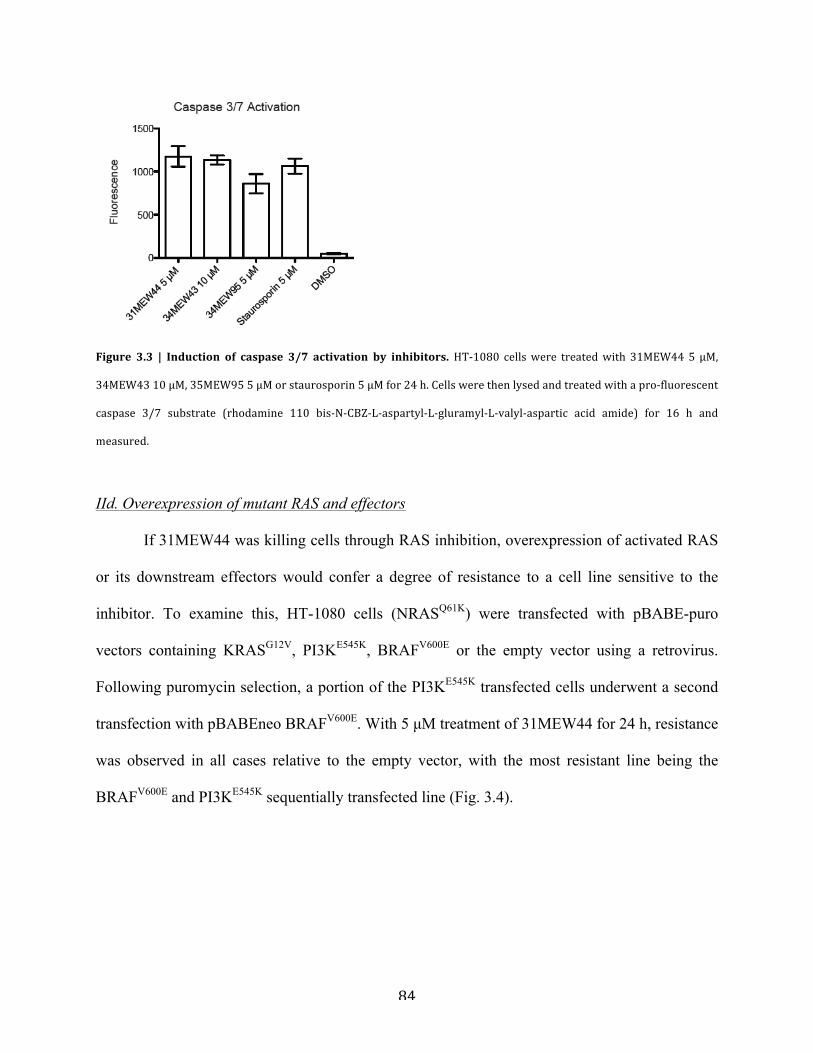
84
Figure 3.3 | Induction of caspase 3/7 activation by inhibitors. HT-‐1080 cells were treated with 31MEW44 5 μM,
34MEW43 10 μM, 35MEW95 5 μM or staurosporin 5 μM for 24 h. Cells were then lysed and treated with a pro-‐fluorescent
caspase 3/7 substrate (rhodamine 110 bis-‐N-‐CBZ-‐L-‐aspartyl-‐L-‐gluramyl-‐L-‐valyl-‐aspartic acid amide) for 16 h and
measured.
IId. Overexpression of mutant RAS and effectors
If 31MEW44 was killing cells through RAS inhibition, overexpression of activated RAS
or its downstream effectors would confer a degree of resistance to a cell line sensitive to the
inhibitor. To examine this, HT-1080 cells (NRASQ61K) were transfected with pBABE-puro
vectors containing KRASG12V, PI3KE545K, BRAFV600E or the empty vector using a retrovirus.
Following puromycin selection, a portion of the PI3KE545K transfected cells underwent a second
transfection with pBABEneo BRAFV600E. With 5 µM treatment of 31MEW44 for 24 h, resistance
was observed in all cases relative to the empty vector, with the most resistant line being the
BRAFV600E and PI3KE545K sequentially transfected line (Fig. 3.4).
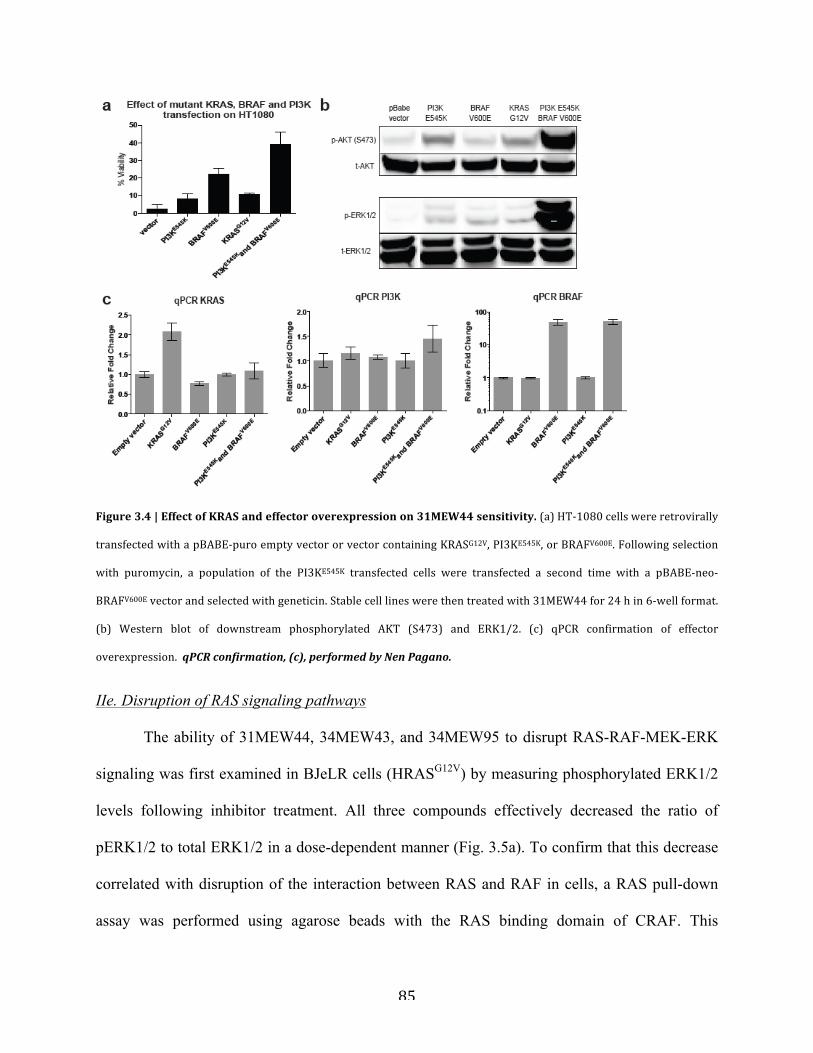
85
Figure 3.4 | Effect of KRAS and effector overexpression on 31MEW44 sensitivity. (a) HT-‐1080 cells were retrovirally
transfected with a pBABE-‐puro empty vector or vector containing KRASG12V, PI3KE545K, or BRAFV600E. Following selection
with puromycin, a population of the PI3KE545K transfected cells were transfected a second time with a pBABE-‐neo-‐
BRAFV600E vector and selected with geneticin. Stable cell lines were then treated with 31MEW44 for 24 h in 6-‐well format.
(b) Western blot of downstream phosphorylated AKT (S473) and ERK1/2. (c) qPCR confirmation of effector
overexpression. qPCR confirmation, (c), performed by Nen Pagano.
IIe. Disruption of RAS signaling pathways
The ability of 31MEW44, 34MEW43, and 34MEW95 to disrupt RAS-RAF-MEK-ERK
signaling was first examined in BJeLR cells (HRASG12V) by measuring phosphorylated ERK1/2
levels following inhibitor treatment. All three compounds effectively decreased the ratio of
pERK1/2 to total ERK1/2 in a dose-dependent manner (Fig. 3.5a). To confirm that this decrease
correlated with disruption of the interaction between RAS and RAF in cells, a RAS pull-down
assay was performed using agarose beads with the RAS binding domain of CRAF. This
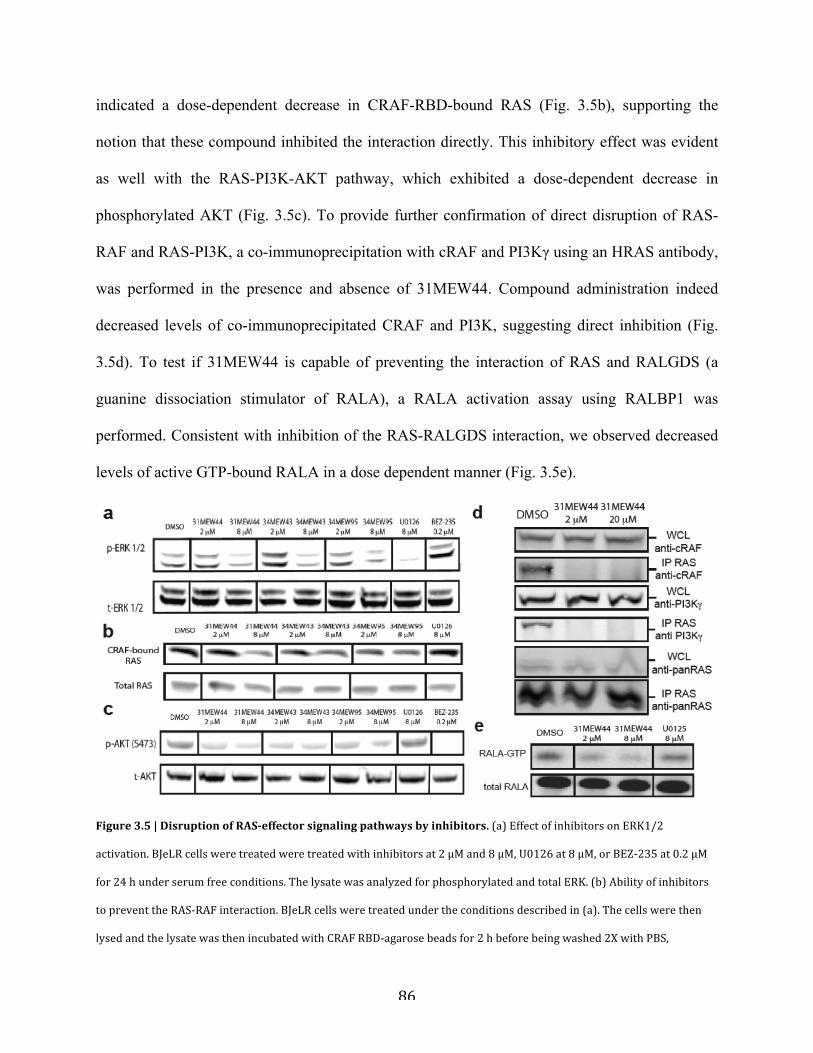
86
indicated a dose-dependent decrease in CRAF-RBD-bound RAS (Fig. 3.5b), supporting the
notion that these compound inhibited the interaction directly. This inhibitory effect was evident
as well with the RAS-PI3K-AKT pathway, which exhibited a dose-dependent decrease in
phosphorylated AKT (Fig. 3.5c). To provide further confirmation of direct disruption of RAS-
RAF and RAS-PI3K, a co-immunoprecipitation with cRAF and PI3Kγ using an HRAS antibody,
was performed in the presence and absence of 31MEW44. Compound administration indeed
decreased levels of co-immunoprecipitated CRAF and PI3K, suggesting direct inhibition (Fig.
3.5d). To test if 31MEW44 is capable of preventing the interaction of RAS and RALGDS (a
guanine dissociation stimulator of RALA), a RALA activation assay using RALBP1 was
performed. Consistent with inhibition of the RAS-RALGDS interaction, we observed decreased
levels of active GTP-bound RALA in a dose dependent manner (Fig. 3.5e).
Figure 3.5 | Disruption of RAS-‐effector signaling pathways by inhibitors. (a) Effect of inhibitors on ERK1/2
activation. BJeLR cells were treated were treated with inhibitors at 2 μM and 8 μM, U0126 at 8 μM, or BEZ-‐235 at 0.2 μM
for 24 h under serum free conditions. The lysate was analyzed for phosphorylated and total ERK. (b) Ability of inhibitors
to prevent the RAS-‐RAF interaction. BJeLR cells were treated under the conditions described in (a). The cells were then
lysed and the lysate was then incubated with CRAF RBD-‐agarose beads for 2 h before being washed 2X with PBS,
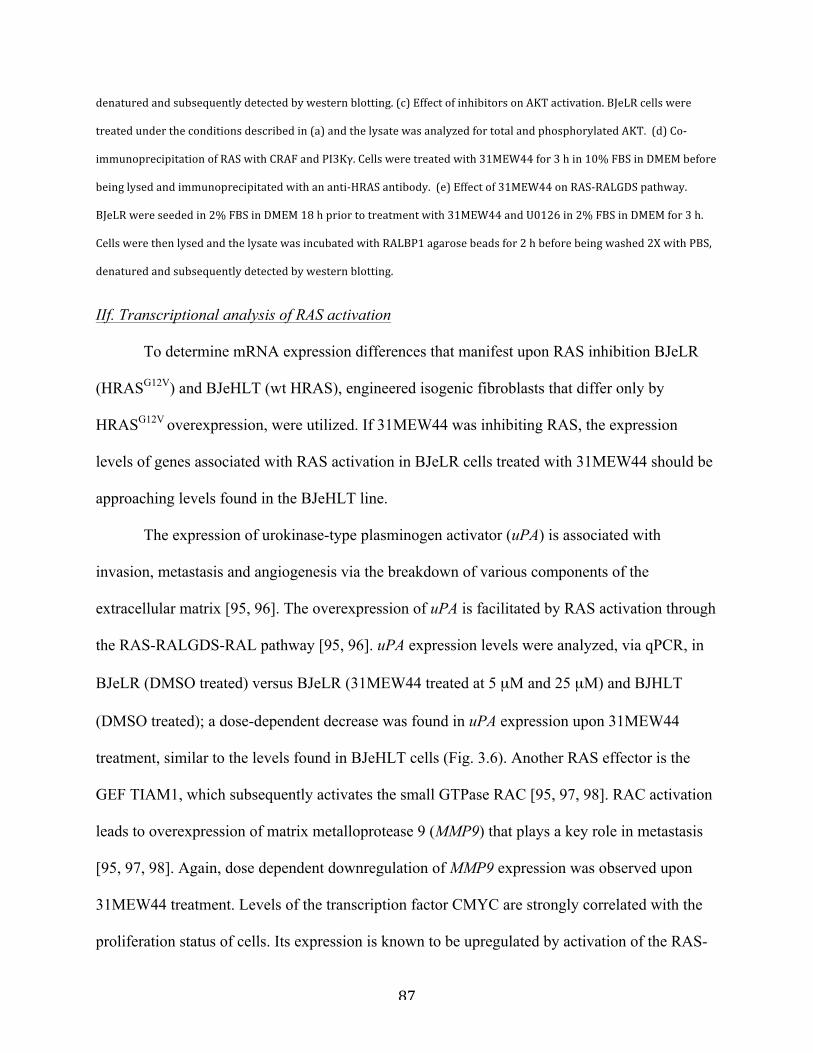
87
denatured and subsequently detected by western blotting. (c) Effect of inhibitors on AKT activation. BJeLR cells were
treated under the conditions described in (a) and the lysate was analyzed for total and phosphorylated AKT. (d) Co-‐
immunoprecipitation of RAS with CRAF and PI3Kγ. Cells were treated with 31MEW44 for 3 h in 10% FBS in DMEM before
being lysed and immunoprecipitated with an anti-‐HRAS antibody. (e) Effect of 31MEW44 on RAS-‐RALGDS pathway.
BJeLR were seeded in 2% FBS in DMEM 18 h prior to treatment with 31MEW44 and U0126 in 2% FBS in DMEM for 3 h.
Cells were then lysed and the lysate was incubated with RALBP1 agarose beads for 2 h before being washed 2X with PBS,
denatured and subsequently detected by western blotting.
IIf. Transcriptional analysis of RAS activation
To determine mRNA expression differences that manifest upon RAS inhibition BJeLR
(HRASG12V) and BJeHLT (wt HRAS), engineered isogenic fibroblasts that differ only by
HRASG12V overexpression, were utilized. If 31MEW44 was inhibiting RAS, the expression
levels of genes associated with RAS activation in BJeLR cells treated with 31MEW44 should be
approaching levels found in the BJeHLT line.
The expression of urokinase-type plasminogen activator (uPA) is associated with
invasion, metastasis and angiogenesis via the breakdown of various components of the
extracellular matrix [95, 96]. The overexpression of uPA is facilitated by RAS activation through
the RAS-RALGDS-RAL pathway [95, 96]. uPA expression levels were analyzed, via qPCR, in
BJeLR (DMSO treated) versus BJeLR (31MEW44 treated at 5 µM and 25 µM) and BJHLT
(DMSO treated); a dose-dependent decrease was found in uPA expression upon 31MEW44
treatment, similar to the levels found in BJeHLT cells (Fig. 3.6). Another RAS effector is the
GEF TIAM1, which subsequently activates the small GTPase RAC [95, 97, 98]. RAC activation
leads to overexpression of matrix metalloprotease 9 (MMP9) that plays a key role in metastasis
[95, 97, 98]. Again, dose dependent downregulation of MMP9 expression was observed upon
31MEW44 treatment. Levels of the transcription factor CMYC are strongly correlated with the
proliferation status of cells. Its expression is known to be upregulated by activation of the RAS-
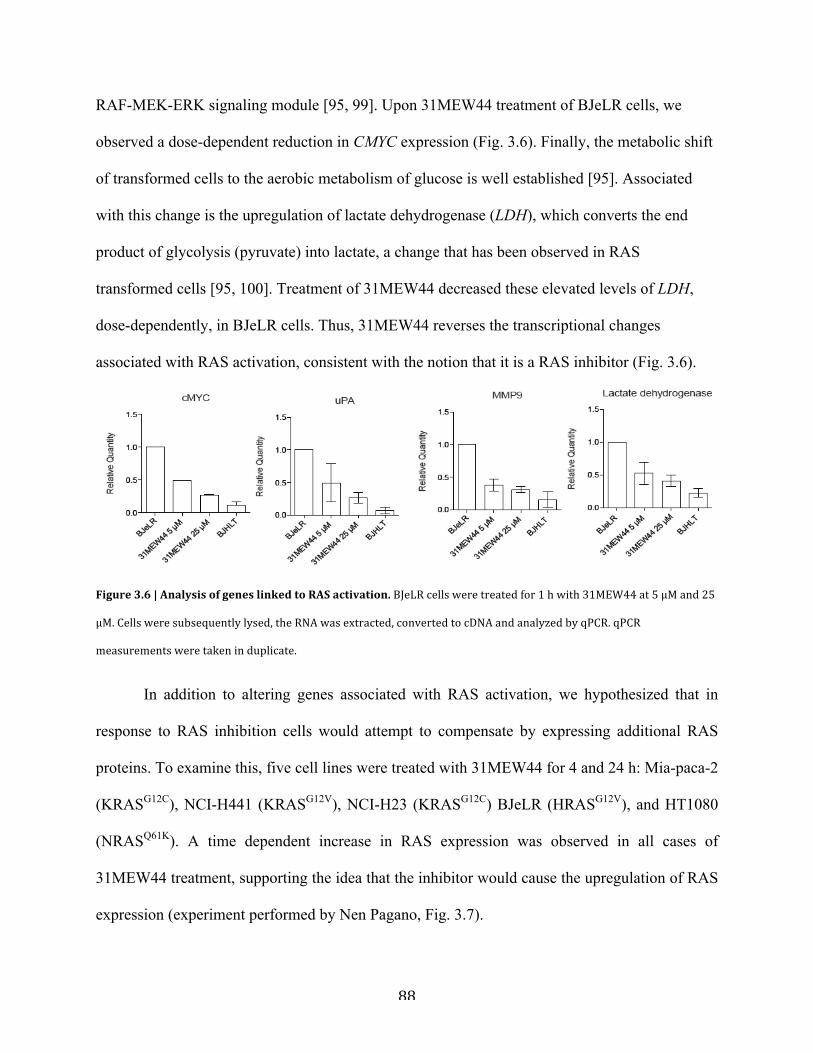
88
RAF-MEK-ERK signaling module [95, 99]. Upon 31MEW44 treatment of BJeLR cells, we
observed a dose-dependent reduction in CMYC expression (Fig. 3.6). Finally, the metabolic shift
of transformed cells to the aerobic metabolism of glucose is well established [95]. Associated
with this change is the upregulation of lactate dehydrogenase (LDH), which converts the end
product of glycolysis (pyruvate) into lactate, a change that has been observed in RAS
transformed cells [95, 100]. Treatment of 31MEW44 decreased these elevated levels of LDH,
dose-dependently, in BJeLR cells. Thus, 31MEW44 reverses the transcriptional changes
associated with RAS activation, consistent with the notion that it is a RAS inhibitor (Fig. 3.6).
Figure 3.6 | Analysis of genes linked to RAS activation. BJeLR cells were treated for 1 h with 31MEW44 at 5 μM and 25
μM. Cells were subsequently lysed, the RNA was extracted, converted to cDNA and analyzed by qPCR. qPCR
measurements were taken in duplicate.
In addition to altering genes associated with RAS activation, we hypothesized that in
response to RAS inhibition cells would attempt to compensate by expressing additional RAS
proteins. To examine this, five cell lines were treated with 31MEW44 for 4 and 24 h: Mia-paca-2
(KRASG12C), NCI-H441 (KRASG12V), NCI-H23 (KRASG12C) BJeLR (HRASG12V), and HT1080
(NRASQ61K). A time dependent increase in RAS expression was observed in all cases of
31MEW44 treatment, supporting the idea that the inhibitor would cause the upregulation of RAS
expression (experiment performed by Nen Pagano, Fig. 3.7).
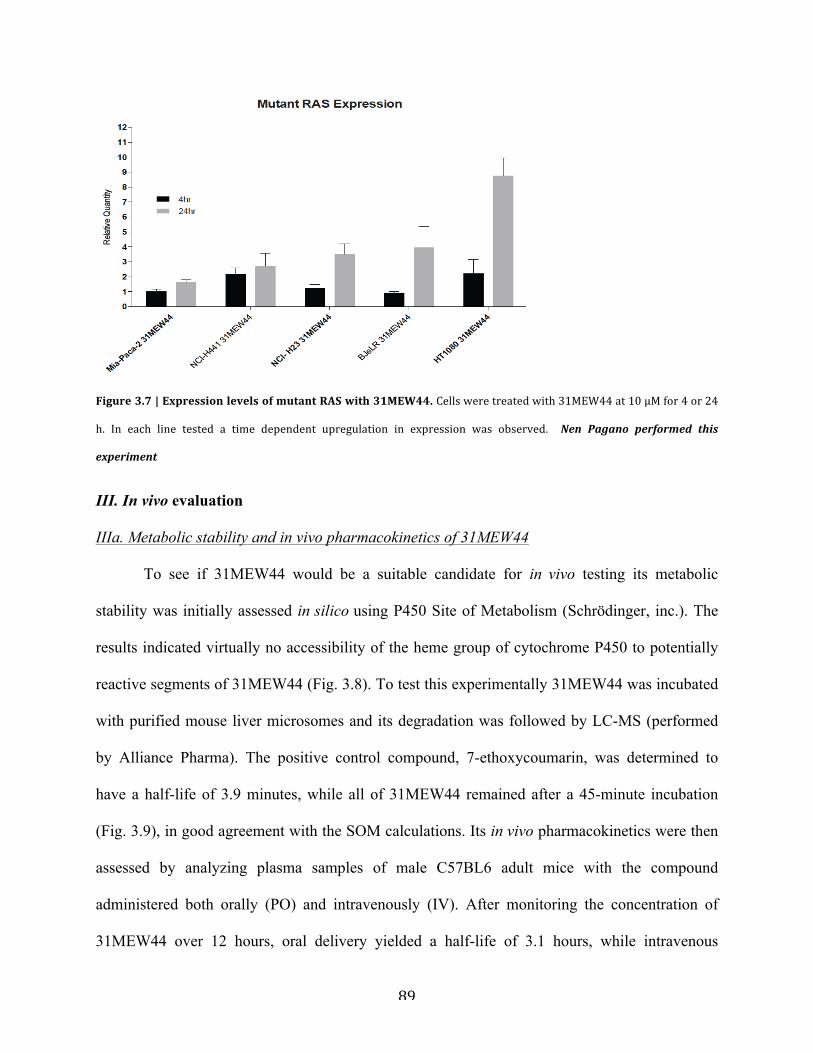
89
Figure 3.7 | Expression levels of mutant RAS with 31MEW44. Cells were treated with 31MEW44 at 10 μM for 4 or 24
h. In each line tested a time dependent upregulation in expression was observed. Nen Pagano performed this
experiment
III. In vivo evaluation
IIIa. Metabolic stability and in vivo pharmacokinetics of 31MEW44
To see if 31MEW44 would be a suitable candidate for in vivo testing its metabolic
stability was initially assessed in silico using P450 Site of Metabolism (Schrödinger, inc.). The
results indicated virtually no accessibility of the heme group of cytochrome P450 to potentially
reactive segments of 31MEW44 (Fig. 3.8). To test this experimentally 31MEW44 was incubated
with purified mouse liver microsomes and its degradation was followed by LC-MS (performed
by Alliance Pharma). The positive control compound, 7-ethoxycoumarin, was determined to
have a half-life of 3.9 minutes, while all of 31MEW44 remained after a 45-minute incubation
(Fig. 3.9), in good agreement with the SOM calculations. Its in vivo pharmacokinetics were then
assessed by analyzing plasma samples of male C57BL6 adult mice with the compound
administered both orally (PO) and intravenously (IV). After monitoring the concentration of
31MEW44 over 12 hours, oral delivery yielded a half-life of 3.1 hours, while intravenous
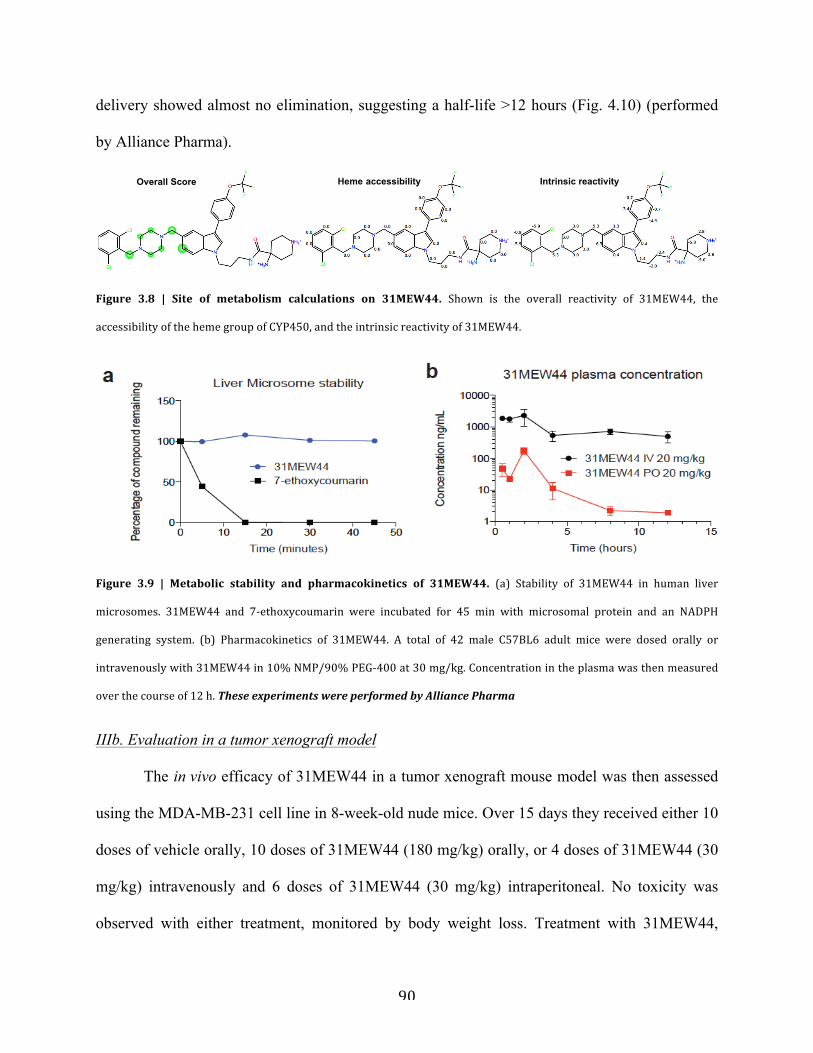
90
delivery showed almost no elimination, suggesting a half-life >12 hours (Fig. 4.10) (performed
by Alliance Pharma).
Figure 3.8 | Site of metabolism calculations on 31MEW44. Shown is the overall reactivity of 31MEW44, the
accessibility of the heme group of CYP450, and the intrinsic reactivity of 31MEW44.
Figure 3.9 | Metabolic stability and pharmacokinetics of 31MEW44. (a) Stability of 31MEW44 in human liver
microsomes. 31MEW44 and 7-‐ethoxycoumarin were incubated for 45 min with microsomal protein and an NADPH
generating system. (b) Pharmacokinetics of 31MEW44. A total of 42 male C57BL6 adult mice were dosed orally or
intravenously with 31MEW44 in 10% NMP/90% PEG-‐400 at 30 mg/kg. Concentration in the plasma was then measured
over the course of 12 h. These experiments were performed by Alliance Pharma
IIIb. Evaluation in a tumor xenograft model
The in vivo efficacy of 31MEW44 in a tumor xenograft mouse model was then assessed
using the MDA-MB-231 cell line in 8-week-old nude mice. Over 15 days they received either 10
doses of vehicle orally, 10 doses of 31MEW44 (180 mg/kg) orally, or 4 doses of 31MEW44 (30
mg/kg) intravenously and 6 doses of 31MEW44 (30 mg/kg) intraperitoneal. No toxicity was
observed with either treatment, monitored by body weight loss. Treatment with 31MEW44,
Overall Score Heme accessibility Intrinsic reactivity
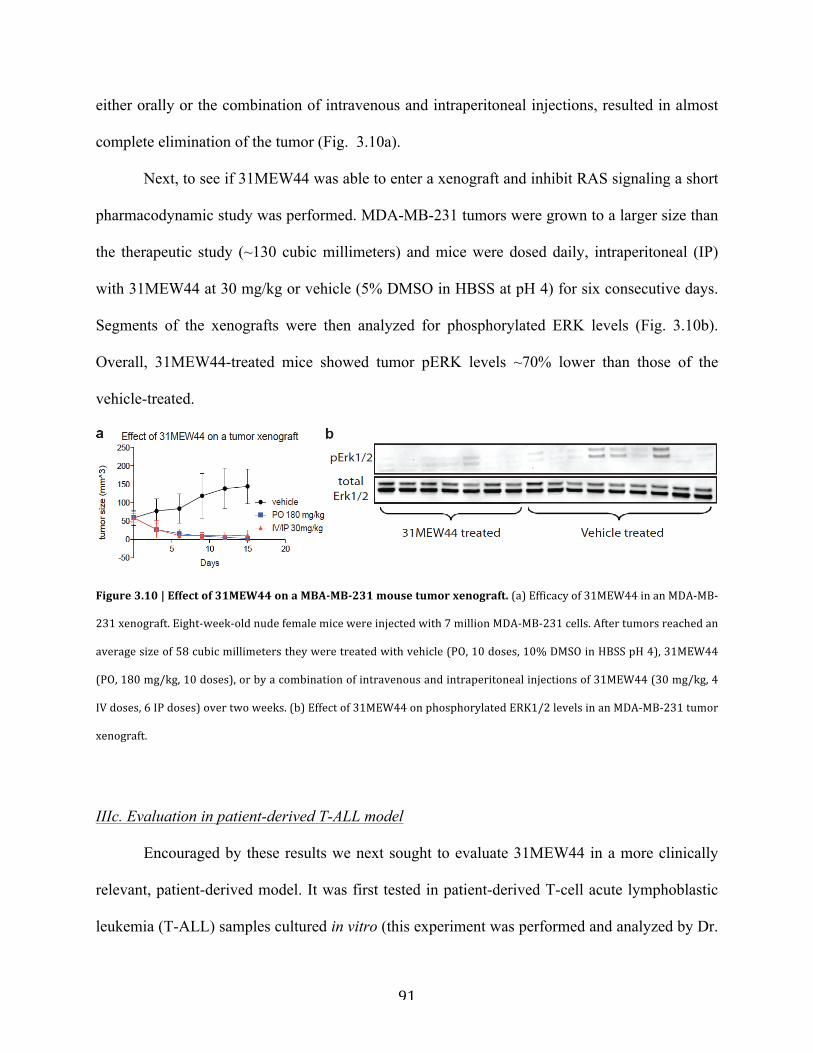
91
either orally or the combination of intravenous and intraperitoneal injections, resulted in almost
complete elimination of the tumor (Fig. 3.10a).
Next, to see if 31MEW44 was able to enter a xenograft and inhibit RAS signaling a short
pharmacodynamic study was performed. MDA-MB-231 tumors were grown to a larger size than
the therapeutic study (~130 cubic millimeters) and mice were dosed daily, intraperitoneal (IP)
with 31MEW44 at 30 mg/kg or vehicle (5% DMSO in HBSS at pH 4) for six consecutive days.
Segments of the xenografts were then analyzed for phosphorylated ERK levels (Fig. 3.10b).
Overall, 31MEW44-treated mice showed tumor pERK levels ~70% lower than those of the
vehicle-treated.
Figure 3.10 | Effect of 31MEW44 on a MBA-‐MB-‐231 mouse tumor xenograft. (a) Efficacy of 31MEW44 in an MDA-‐MB-‐
231 xenograft. Eight-‐week-‐old nude female mice were injected with 7 million MDA-‐MB-‐231 cells. After tumors reached an
average size of 58 cubic millimeters they were treated with vehicle (PO, 10 doses, 10% DMSO in HBSS pH 4), 31MEW44
(PO, 180 mg/kg, 10 doses), or by a combination of intravenous and intraperitoneal injections of 31MEW44 (30 mg/kg, 4
IV doses, 6 IP doses) over two weeks. (b) Effect of 31MEW44 on phosphorylated ERK1/2 levels in an MDA-‐MB-‐231 tumor
xenograft.
IIIc. Evaluation in patient-derived T-ALL model
Encouraged by these results we next sought to evaluate 31MEW44 in a more clinically
relevant, patient-derived model. It was first tested in patient-derived T-cell acute lymphoblastic
leukemia (T-ALL) samples cultured in vitro (this experiment was performed and analyzed by Dr.
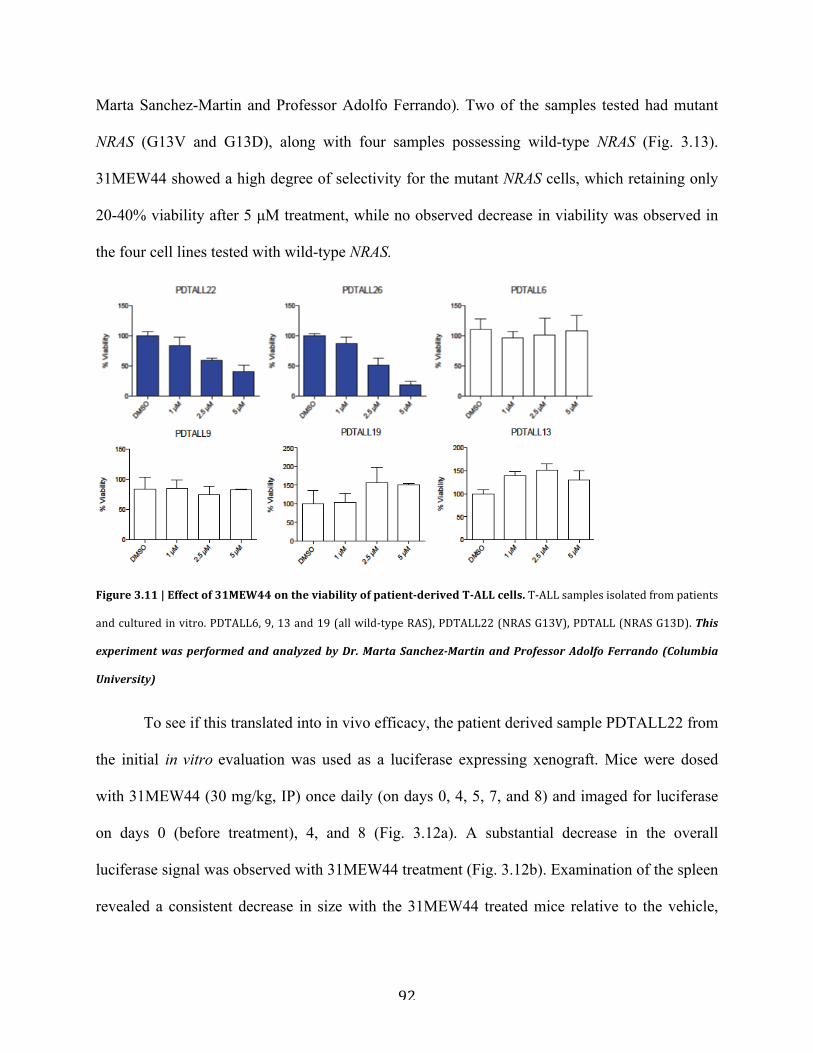
92
Marta Sanchez-Martin and Professor Adolfo Ferrando). Two of the samples tested had mutant
NRAS (G13V and G13D), along with four samples possessing wild-type NRAS (Fig. 3.13).
31MEW44 showed a high degree of selectivity for the mutant NRAS cells, which retaining only
20-40% viability after 5 µM treatment, while no observed decrease in viability was observed in
the four cell lines tested with wild-type NRAS.
Figure 3.11 | Effect of 31MEW44 on the viability of patient-‐derived T-‐ALL cells. T-‐ALL samples isolated from patients
and cultured in vitro. PDTALL6, 9, 13 and 19 (all wild-‐type RAS), PDTALL22 (NRAS G13V), PDTALL (NRAS G13D). This
experiment was performed and analyzed by Dr. Marta Sanchez-‐Martin and Professor Adolfo Ferrando (Columbia
University)
To see if this translated into in vivo efficacy, the patient derived sample PDTALL22 from
the initial in vitro evaluation was used as a luciferase expressing xenograft. Mice were dosed
with 31MEW44 (30 mg/kg, IP) once daily (on days 0, 4, 5, 7, and 8) and imaged for luciferase
on days 0 (before treatment), 4, and 8 (Fig. 3.12a). A substantial decrease in the overall
luciferase signal was observed with 31MEW44 treatment (Fig. 3.12b). Examination of the spleen
revealed a consistent decrease in size with the 31MEW44 treated mice relative to the vehicle,
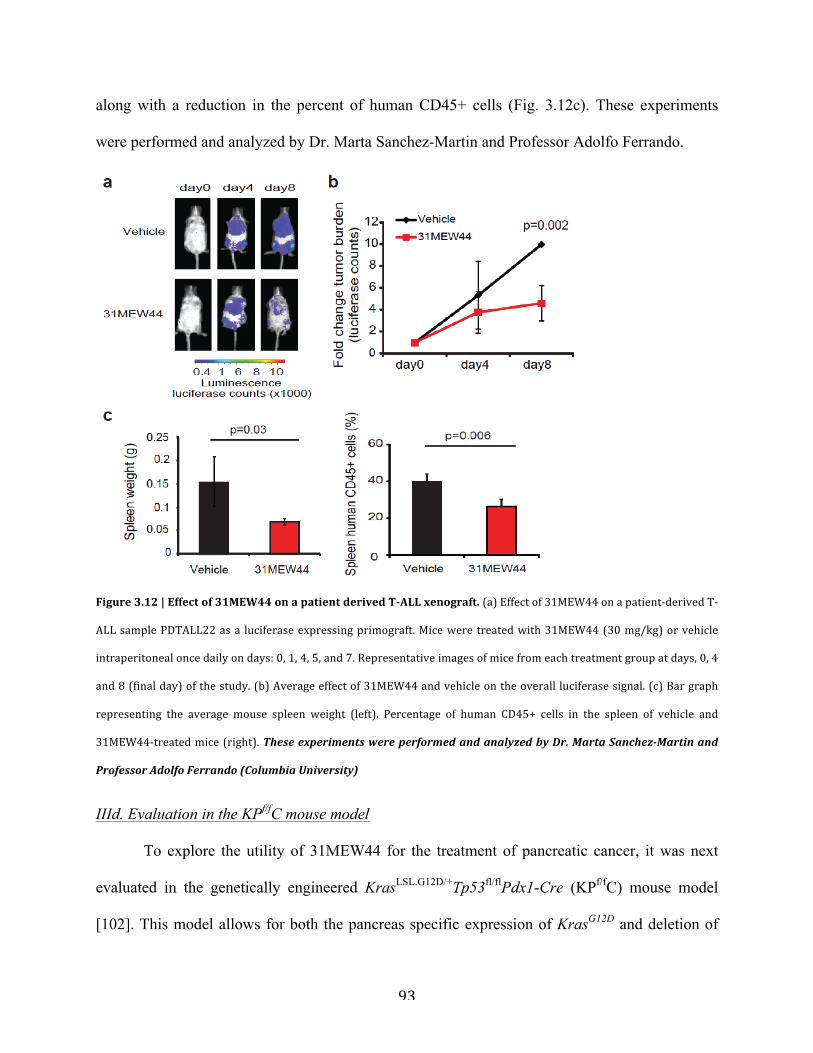
93
along with a reduction in the percent of human CD45+ cells (Fig. 3.12c). These experiments
were performed and analyzed by Dr. Marta Sanchez-Martin and Professor Adolfo Ferrando.
Figure 3.12 | Effect of 31MEW44 on a patient derived T-‐ALL xenograft. (a) Effect of 31MEW44 on a patient-‐derived T-‐
ALL sample PDTALL22 as a luciferase expressing primograft. Mice were treated with 31MEW44 (30 mg/kg) or vehicle
intraperitoneal once daily on days: 0, 1, 4, 5, and 7. Representative images of mice from each treatment group at days, 0, 4
and 8 (final day) of the study. (b) Average effect of 31MEW44 and vehicle on the overall luciferase signal. (c) Bar graph
representing the average mouse spleen weight (left). Percentage of human CD45+ cells in the spleen of vehicle and
31MEW44-‐treated mice (right). These experiments were performed and analyzed by Dr. Marta Sanchez-‐Martin and
Professor Adolfo Ferrando (Columbia University)
IIId. Evaluation in the KPf/fC mouse model
To explore the utility of 31MEW44 for the treatment of pancreatic cancer, it was next
evaluated in the genetically engineered KrasLSL.G12D/+Tp53fl/flPdx1-Cre (KPf/fC) mouse model
[102]. This model allows for both the pancreas specific expression of KrasG12D and deletion of
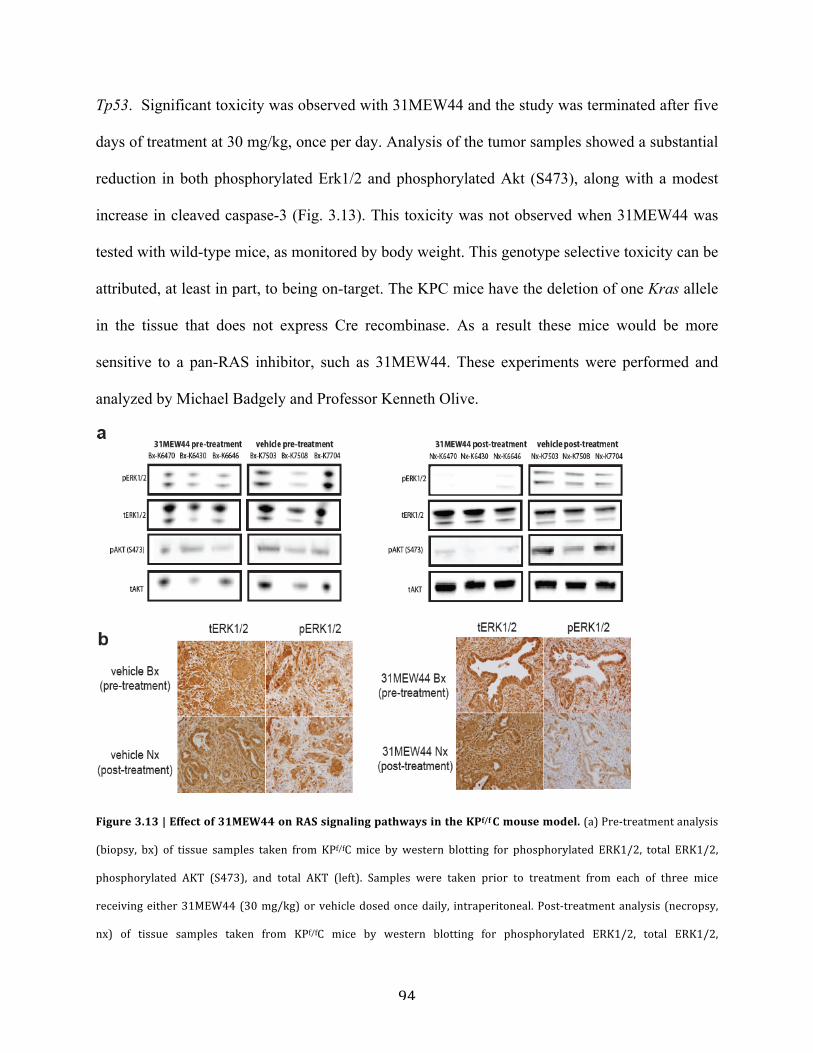
94
Tp53. Significant toxicity was observed with 31MEW44 and the study was terminated after five
days of treatment at 30 mg/kg, once per day. Analysis of the tumor samples showed a substantial
reduction in both phosphorylated Erk1/2 and phosphorylated Akt (S473), along with a modest
increase in cleaved caspase-3 (Fig. 3.13). This toxicity was not observed when 31MEW44 was
tested with wild-type mice, as monitored by body weight. This genotype selective toxicity can be
attributed, at least in part, to being on-target. The KPC mice have the deletion of one Kras allele
in the tissue that does not express Cre recombinase. As a result these mice would be more
sensitive to a pan-RAS inhibitor, such as 31MEW44. These experiments were performed and
analyzed by Michael Badgely and Professor Kenneth Olive.
Figure 3.13 | Effect of 31MEW44 on RAS signaling pathways in the KPf/f C mouse model. (a) Pre-‐treatment analysis
(biopsy, bx) of tissue samples taken from KPf/fC mice by western blotting for phosphorylated ERK1/2, total ERK1/2,
phosphorylated AKT (S473), and total AKT (left). Samples were taken prior to treatment from each of three mice
receiving either 31MEW44 (30 mg/kg) or vehicle dosed once daily, intraperitoneal. Post-‐treatment analysis (necropsy,
nx) of tissue samples taken from KPf/fC mice by western blotting for phosphorylated ERK1/2, total ERK1/2,
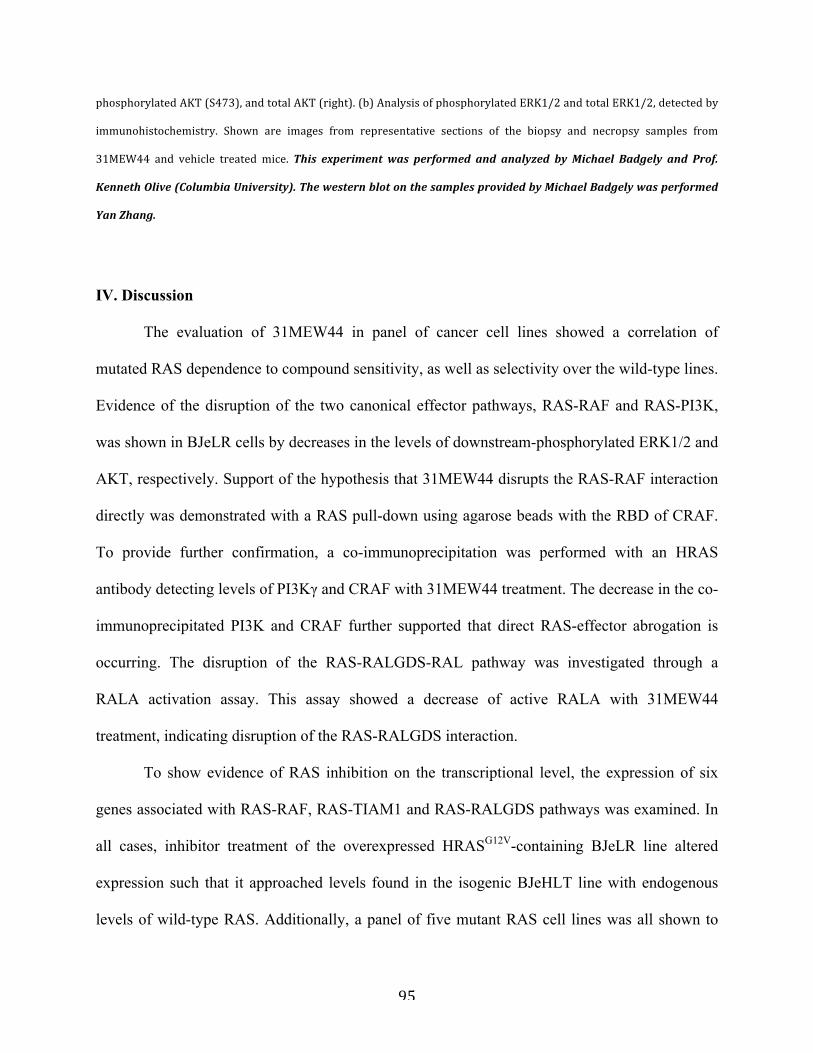
95
phosphorylated AKT (S473), and total AKT (right). (b) Analysis of phosphorylated ERK1/2 and total ERK1/2, detected by
immunohistochemistry. Shown are images from representative sections of the biopsy and necropsy samples from
31MEW44 and vehicle treated mice. This experiment was performed and analyzed by Michael Badgely and Prof.
Kenneth Olive (Columbia University). The western blot on the samples provided by Michael Badgely was performed
Yan Zhang.
IV. Discussion
The evaluation of 31MEW44 in panel of cancer cell lines showed a correlation of
mutated RAS dependence to compound sensitivity, as well as selectivity over the wild-type lines.
Evidence of the disruption of the two canonical effector pathways, RAS-RAF and RAS-PI3K,
was shown in BJeLR cells by decreases in the levels of downstream-phosphorylated ERK1/2 and
AKT, respectively. Support of the hypothesis that 31MEW44 disrupts the RAS-RAF interaction
directly was demonstrated with a RAS pull-down using agarose beads with the RBD of CRAF.
To provide further confirmation, a co-immunoprecipitation was performed with an HRAS
antibody detecting levels of PI3Kγ and CRAF with 31MEW44 treatment. The decrease in the co-
immunoprecipitated PI3K and CRAF further supported that direct RAS-effector abrogation is
occurring. The disruption of the RAS-RALGDS-RAL pathway was investigated through a
RALA activation assay. This assay showed a decrease of active RALA with 31MEW44
treatment, indicating disruption of the RAS-RALGDS interaction.
To show evidence of RAS inhibition on the transcriptional level, the expression of six
genes associated with RAS-RAF, RAS-TIAM1 and RAS-RALGDS pathways was examined. In
all cases, inhibitor treatment of the overexpressed HRASG12V-containing BJeLR line altered
expression such that it approached levels found in the isogenic BJeHLT line with endogenous
levels of wild-type RAS. Additionally, a panel of five mutant RAS cell lines was all shown to
96
have increased levels of mutant RAS expression with inhibitor treatment in a time dependent
manner. Our hypothesis is that this consistent upregulation of RAS expression could be a
response of the cell to compensate for less functional RAS due to its inhibition by 31MEW44.
To determine if 31MEW44 would be a suitable in vivo candidate, its metabolic stability
was first assessed in silico using site of metabolism. It was predicted to be highly metabolically
stable and these results were supported experimentally through incubation with drug
metabolizing enzyme rich, liver microsomes. The in vivo pharmacokinetics showed suitable
clearance of the compound for in vivo studies both through oral delivery and intravenously.
Encouraged by the results of the metabolic stability and pharmacokinetics, 31MEW44 was tested
in an MDA-MDA-231 xenograft that resulted in an almost complete elimination of the tumors in
the 31MEW44 treated mice. In a separate study, 31MEW44 showed evidence of inhibiting RAS
signaling by decreasing phosphorylated ERK1/2. To examine how 31MEW44 would perform in
a more clinically relevant model it was evaluated in patient derived T-ALL samples. An even
higher degree of selectivity for the RAS mutant samples was observed compared to the standard
cell lines previously tested. This motivated the testing of 31MEW44 in a xenograft of one of the
patient derived samples. After only an 8-day study it demonstrated an overall decrease in tumor
burden and of human CD45+ cells invading the spleen, further demonstrating the therapeutic
utility of 31MEW44.
KRAS mutations are found in an astonishing 90% of pancreatic cancer [10].
Chemotherapeutic agents are also known to have difficulty entering pancreatic tissue, as it is
poorly vascularized [103]. To see if 31MEW44 would be useful in the treatment of pancreatic
cancer, it was evaluated in the genetically engineered KPf/fC mouse model. Toxicity was
observed with 31MEW44 treatment and the study was terminated after five days. We
97
hypothesize that a portion of the toxicity is due to on-target RAS inhibition. The KrasG12D allele
is preceded by a lox-stop-lox sequence, which prevents it from being expressed in tissue that
does not have Cre protein present (non-pancreatic tissue). Thus, these mice would be more
sensitive to pan-RAS inhibition. This was supported by lack of toxicity observed when wild type
mice were tested with 31MEW44. Analysis of the tissue samples of the treated mice showed
decreases in downstream-phosphorylated ERK1/2 and AKT (S473), indicating abrogation of the
RAS-RAF and RAS-PI3K pathways, respectively. The abrogation of RAS signaling by
31MEW44 suggests that it could be used as a potential therapeutic agent. Further evaluation in a
model that doesn’t require the loss of a functional RAS allele is necessary to further explore the
pharmacological utility of 31MEW44.
98
V. Methods
Cell viability assays
All cell culture assays were incubated at 37°C with 5% CO2, using media recipes specified on
www.atcc.org.
384-well format viability assays
Cells were trypsinized, counted, and seeded into 384-well plates at 1,000 cells/well. After 16 h,
compounds (from 10 mM stocks in DMSO) were arrayed in an 8- or 16-point dilution series in
384-well polypropylene plates. Compound solutions were transferred at a 1:5 dilution into the
assay plates. After 48 h, a 50% Alamar blue solution was added to a final concentration of 10%
Alamar blue. After 6 h of incubation, fluorescence intensity was determined using a Victor3
plate reader (Perkin Elmer) with a 535 nm excitation filter and a 590 nm emission filter. All
compound measurements were performed in triplicate.
6-well format viability assays
Cells were trypsinized, counted, and seeded into 6-well plates at 200,000 cells per well 16 h prior
to use. Media was then aspirated and replaced with 2 mL of media containing compounds at the
indicated concentrations (from 10 mM stocks in DMSO). After 24 h, cells were trypsinized and
viability was determined using Trypan Blue exclusion assay.
Western blots
99
BJeLR cells were seeded in DMEM and 10% FBS with 1% penicillin and streptomycin (PS) or
DMEM and 2% FBS with 1% penicillin and streptomycin (PS), 16 h prior to use. The medium
was then aspirated and compounds added as solutions in serum free medium (DMEM with 1%
PS) or DMEM and 2% FBS with 1% penicillin and streptomycin (PS) to the dishes and treated at
the indicated time points. Following treatment, the medium was aspirated from each dish and
cells were washed twice with PBS. Cells were lysed with 60 µl buffer (50 mM HEPES, 40 mM
NaCl, 2 mM EDTA, 0.5% Triton-X, 1.5 mM sodium orthovanadate, 50 mM NaF, 10 mM
sodium pyrophosphate, 10 mM sodium β-glycerophosphate and protease inhibitor tablet
(Roche), pH 7.4). Unlysed cells and debris were pelleted for 12 min at 12,000 rpm at 4 oC.
Samples were separated using SDS-polyacrylamide gel electrophoresis and transferred to a
polyvinylidene difluoride membrane. Transfer was performed using the iBlot system
(Invitrogen). Membranes were treated with Li-COR odyssey blocking buffer for 1 h at 25 oC,
then incubated with primary antibody (1:1000) in a 1:1 solution of PBS-T and Li-COR odyssey
blocking buffer overnight at 4 °C. Following 3x5 min washes in PBS-T, the membrane was
incubated with secondary antibodies (1:2000) in a 1:1 solution of PBS-T and Li-COR Odyssey
blocking buffer for 45 min at 25 oC. Following three 5 min washes in PBS-T, the membrane was
scanned using the Li-COR Odyssey Imaging System. Antibodies for pERK1/2, ERK1/2, pAKT
ser473, AKT, pan-RAS, RALA, PI3Kgamma (Cell Signaling), and RAF-1 (Santa Cruz) were
detected using a goat anti-rabbit or goat anti-mouse IgG antibody conjugated to an IRdye at
800CW and 680CW conjugated, respectively (Li-COR biosciences).
Multicellular tumor spheroids
100
Multicellular tumor spheroids (MCTSs) were grown in 96-well Corningware Ultra Low
Attachment (ULA) Plates (CLS 3474). 100 µL of cell suspension containing 2 X 10⁴ cells/ml
were added to each well of the ULA plate containing 100 µL of a 2X solution of the desired
concentration of compounds. Cells were incubated at 37 °C, 5% CO2 for 72 h to allow for MCTS
formation. After 72 h, 50 uL of a 50% solution of alamar blue and medium was added and
incubated for 12 h prior to measurements on a Victor3 plate reader as previously described.
Caspase 3/7 activation assay
HT-1080 cells were seeded into 384-well plates at 1,000 cells/well. After 16 h, compounds (as
50 mM stocks in DMSO) were arrayed in a dilution series in 384-well polypropylene plates.
Compound solutions were transferred at a 1:5 dilution into the assay plates for a total volume of
40 µL. After 24 h, 8 µL of a 1:100 solution of rhodamine 110 bis-(N-CBZ-l-aspartyl-l-glutamyl-
l-valyl-aspartic acid amide) to lysis buffer (APO-1, Promega) was added and the plate was
wrapped in aluminum foil and incubated at room temperature for 16 h. Fluorescence intensity
was then determined using a Victor3 plate reader (Perkin Elmer) with a 490 nm excitation filter
and a 535 nm emission filter.
Cell-based RAS pulldown
BJeLR cells were seeded 16 h prior to use in 10% FBS in DMEM. The medium was then
aspirated and replaced with serum-free media containing the inhibitors (from 10 mM DMSO
stocks) and cells were incubated for 24 h. The medium was removed, washed with cold PBS,
lysed and spun down at 13,000 rpm at 4 °C to remove unlysed cells and debris. The lysate was
101
incubated with Raf-1 RBD agarose beads (EMD milipore) for 2 h with rotation at 4 °C. The
solution was then spun down at 1500g and the supernatant removed. The beads were washed 2X
with PBS, resuspended in 2.5 X SDS, and then analyzed by western blotting procedure.
Determining RAS dependency using siRNAs targeting RAS isoforms (this protocol was
developed by Nen Pagano)
Small interfering RNAs (siRNAs) targeting each RAS isoform were purchased from Dharmacon
Technologies.
siRNA Catalog numbers
siDEATH: AllStars Hs Cell Death Control siRNA; Cat # 1027299 from QIAGEN
siHRAS: ON-TARGETplus SMARTpool human HRAS siRNA; Cat # L-004142-00-0005 from
GE Dharmacon
siKRAS: ON-TARGETplus SMARTpool human KRAS siRNA; Cat # L-005069-00-
0010 from GE Dharmacon
siNRAS: ON-TARGETplus SMARTpool human NRAS siRNA; Cat # L-003919-00-0005 from
GE Dharmacon
siNon-Targetting: ON-TARGETplus Non-targetting Pool siRNA; Cat # D-001810-10-20 from
GE Dharmacon
102
Reverse transfection was performed by preparing a solutions of 1 mL of Opti-MEM (Invitrogen)
with 6 µL of lipo-RNAiMAX (Invitrogen) and 5 µL of RNAi solution (10 µM stock), and by
incubating the mixture (1 mL/well) in a 6-well plate for 30 min at 37 °C. While the siRNA
complex was forming, 0.2 million cells were suspended in 1 mL of 2X serum-containing media.
The cell solution (1mL) was transferred to the each well of the 6-well plate containing siRNA
complex (1mL), and the 6-well plate was returned to the culture incubator. At 24, 48, 72 and 96
h post transfection cells were trypsinized and viability was determined using trypan blue
exclusion assay.
Confirming RAS knockdown using RT-qPCR experiment
Cells were detached from the 6-well plate, and 0.5 million cells were collected as a pellet by
centrifuging 1,000 rpm for 5 min. Total cellular RNA sample was prepared using RNAeasy
extraction kits (QIAgen) according to manufacturer’s instruction. The resulting RNA sample was
reverse-transcribed using a High Capacity cDNA Reverse Transcription kit (Life Technologies).
The cDNA samples were mixed with TaqMan® probes for each RAS isoform gene, and arrayed
on 96-well plate in triplicates. The plate was loaded onto ViiA7 Real-Time PCR system (Life
Technologies) for qPCR reaction. Comparative analysis (ΔΔCt analysis) was performed with
ACTB (human actin b), an internal reference gene.
Immunoprecipitations
BJeLR cells were seeded 16 h prior to use in 10% FBS in DMEM. Media was aspirated and
replaced with media containing 31MEW44 (from a 10 mM DMSO stock). After 6 h cells were
103
washed 2X with ice cold buffer (25 mM tris, 100 mM NaCl, 1 mM TCEP, 5 mM MgCl2, 0.1%
tween-20 and 1 protease inhibitor/25 mL). Cells were scrapped, pelleted at 13,000 rpm for 10
min at 4 oC, then passed through a 26 gauge needle several times. The solution was spun down a
second time at 13,000 rpm for 15 min at 4 oC, to remove unlysed cells and debris. HRAS
antibody (Santa cruz, SC-520) was then added to the lysate (1:100) and the solution was rocked
at 4 oC for 16 h. Protein A agrose beads were then added and the solution was rotated at 4 oC for
an additional 6 h. The solutions were spun down at 1500xg for 2 min and the supernatant was
removed by syringe. The beads were washed 2X by this process with buffer, then resuspended in
2.5X SDS.
RALA activation assay
BJeLR cells were seeded 16 h prior to use in 2% FBS in DMEM. Media was aspirated and
replaced with media containing 31MEW44 (from a 10 mM DMSO stock). After 6 h cells were
washed 2X with ice cold buffer (25 mM tris, 100 mM NaCl, 1 mM TCEP, 5 mM MgCl2, 0.1%
tween-20 and 1 protease inhibitor/25 mL). Cells were scrapped, pelleted at 13,000 rpm for 10
min at 4 oC, then passed through a 26 gauge needle several times. The solution was spun down a
second time at 13,000 rpm for 15 min at 4 oC, to remove unlysed cell and debris. RALBP1
agarose beads (EMD Millipore) were then added to the lysate and the solution was rotated at 4
oC for 2 h. The solutions were spun down at 1500 xg for 2 min and the supernatant was removed
by syringe. The beads were washed 2x by this process with buffer, then resuspended in 2.5X
SDS.
Gene expression analysis by RT-qPCR
104
Cells from six-well plates were trypsinized and centrifuged at 3,000 rpm for 3 min. The cell
pellet was then lysed and the RNA was extracted using the QIAshreader and RNAeasy extraction
kits (QIAGEN) according to the manufacturer’s protocol. 2 µg of RNA from each sample was
then converted to cDNA using the TaqMan RT Kit (Applied Biosystems). Primers for
Quantitative PCR (qPCR) were designed with Primer Express. qPCR was performed using
Power SYBR Green Master Mix (Applied Biosystems) in a 96-well format, in triplicate, using an
Applied Biosystems 7300 Cycler set to absolute quantification. Expression changes were
computed using the DDCt method with GAPDH as an internal reference gene. Urokinase-type
plasminogen activator (uPA) Forward 5’ GGATGTGCCCTGAAGGACAA 3’, reverse 5’
TGCGGATCCAGGGTAAGAAG 3’; matrix metalloprotease 9 (MMP9) forward 5’
GAGTGGCAGGGGGAAGATGC 3’, reverse 5’ CCTCAGGGCACTGCAGGATG 3’; lactate
dehydrogenase (LDH) forward 5’ GCCCGACGTGCATTCCCGATTCCTT 3’, reverse 5’
GACGGCTTTCTCCCTCTTGCTGACG 3’; CMYC forward 5’
TCAAGAGGTGCCACGTCTCC 3’, reverse 5’ TCTTGGCAGCAGGATAGTCCTT 3’.
RAS, PI3K and BRAF overexpression.
Phoenix-AMPHO (ATCC: CRL-3213) cells were seeded in a 6-well plate at 600,000 cells/well 24
h prior to use 10% FBS and 1% PS in DMEM. A solution of lipofectamine 2000 (6 µL) in 100
µL opti-mem media (reduced serum media) and the plasmid (2.5 µg) in 100 µL opti-mem media
were combined and incubated 5 min at 25 oC, then added to 1.8 mL of opti-mem in each well.
After 12 h, the media was replaced with 10% FBS and 1% PS in DMEM. The next day the
supernatant was collected three times spaced 4 h apart and polybrene was added (1/1000). The
supernatant was filtered (0.45 µm) and added to HT1080 cells seeded at 100,000 cells per well
105
(6-well dish) in 2 mL portions spaced 4 h apart. After 48 h, the cells were trypsinized and re-
seeded in medium containing puromycin (2 µg/mL). After 6 d of selection the cells were
analyzed for expression using the aforementioned qPCR procedure. 2 mL solutions of the
inhibitors were added to a 6-well plate of the transfected HT-1080 cells (100,000 cells/well) and
treated for 24 h. The cells were then trypsinized, re-suspended in 1 mL of medium and viability
was measured by VI-CELL (Beckman Coulter) through mixing with trypan blue.
pBABE-puro was a gift from Hartmut Land & Jay Morgenstern & Bob Weinberg (Addgene
plasmid # 1764)
Ref: Advanced mammalian gene transfer: high titre retroviral vectors with multiple drug
selection markers and a complementary helper-free packaging cell line. Morgenstern JP, Land
H. Nucleic Acids Res. 1990 Jun 25;18(12):3587-96
pBABE puro KRAS V12 was a gift from William Hahn (Addgene plasmid # 9052)
Ref: unpublished viral vectors
pBabe-Puro-BRAF-V600E was a gift from William Hahn (Addgene plasmid # 15269)
Ref: Integrative Genomic Approaches Identify IKBKE as a Breast Cancer Oncogene. Boehm JS,
Zhao JJ, Yao J, Kim SY, Firestein R, Dunn IF, Sjostrom SK, Garraway LA, Weremowicz S,
Richardson AL, Greulich H, Stewart CJ, Mulvey LA, Shen RR, Ambrogio L, Hirozane-
Kishikawa T, Hill DE, Vidal M, Meyerson M, Grenier JK, Hinkle G, Root DE, Roberts TM,
Lander ES, Polyak K, Hahn WC. Cell. 2007 Jun 15.
106
pBabe puro HA PIK3CA E545K was a gift from Jean Zhao (Addgene plasmid # 12525)
Ref: The oncogenic properties of mutant p110alpha and p110beta phosphatidylinositol 3-kinases
in human mammary epithelial cells. Zhao JJ, Liu Z, Wang L, Shin E, Loda MF, Roberts
TM. Proc Natl Acad Sci U S A. 2005 Dec 20. 102(51):18443-8.
pBABEbleo-Flag-BRAFV600E was a gift from Christopher Counter (Addgene plasmid # 53156)
Ref: Copper is required for oncogenic BRAF signalling and tumorigenesis. Brady DC, Crowe
MS, Turski ML, Hobbs GA, Yao X, Chaikuad A, Knapp S, Xiao K, Campbell SL, Thiele DJ,
Counter CM. Nature. 2014 Apr 9. doi: 10.1038/nature13180.
Microsomal stability (this protocol was developed by Alliance Pharma)
Test compounds (0.5 µM) were incubated at 37 ºC for up to 45 min in 50 mM of potassium
phosphate buffer (pH 7.4) containing microsomal protein (0.5 mg/mL) and an NADPH
generating system (0.34 mg/mL β-nicotinamide adenine dinucleotide phosphate (NADP), 1.56
mg/mL glucose-6-phosphate, 1.2 units/mL glucose-6-phosphate dehydrogenase). At 0, 5, 15, 30
and 45 min intervals an aliquot was taken and quenched with acetonitrile (ACN) containing
internal standard. No-cofactor controls at 45 min were prepared. Following completion of the
experimentation, the samples were analyzed by LC-MS/MS using a Shimadzu HPLC and an
Applied Biosystem API4000.
In vivo pharmacokinetic analysis (this protocol was developed by Alliance Pharma)
107
27 mg of 31MEW44, was dissolved in 5.4 mL of 10% NMP/90% PEG-400 to yield a dosing
solution with a final concentration of 5 mg/mL. The dose formulation was prepared freshly in the
morning of dosing day. A total of 42 male C57 adult mice, approximately 25 grams of body
weight, were administered at 20 mg/kg dose level via a single IV bolus injection or a single oral
gavage. Blood samples (approximately 400 µL) were collected from three mice per time point
via terminal brachial bleed at pre-dose and 30 min, 1h, 2 h, 4h, 8h and 12 h post-dose. Blood
samples were placed into tubes containing K2 EDTA anti-coagulant, and centrifuged at ~2,100 g
(rcf) for 10 min at 4 oC to separate plasma. Following centrifugation, the resulting plasma was
transferred to clean tubes and stored frozen at -80 °C. The mouse plasma samples (50 µL) were
aliquoted, spiked with internal standard (250 ng/mL tolbutamide), and then extracted with
protein precipitation. The supernatant of each sample was diluted and injected into LC-MS/MS
system. The data acquisition and processing were performed using Sciex API 5500 mass
spectrometer with Analyst 1.6.2 software. The standard curve range for the plasma samples
were analyzed using a calibration curve of 0.5-5000 ng/mL. The pharmacokinetic (PK) analysis
and interpretation of the results were conducted using Winnonlin Phoenix Software.
Mouse xenograft
Therapeutic study
Athymic nude mice (eight weeks; Charles River Laboratories) were injected with 7 million
MDA-MB-231 cells subcutaneously. After 3 d, mice were separated into treatment groups of
roughly equal tumor size (58 mm3) and dosed with 180 mg/kg 31MEW44 orally (12 mg/mL,
10% DMSO, pH 4), vehicle orally, or by a combination of intraperitoneal and intravenous
injections at 30 mg/kg (4 mg/mL, 5% DMSO in HBSS at pH 4). Over 14 d mice received a total
108
of 10 doses of 31MEW44 or vehicle orally, or six intraperitoneal injections and 4 intravenous
injections. Tumor size was measured by electronic caliper every 2 d and calculated using the
formula: 0.523 X Length X width^2.
Pharmacodynamic study
Athymic nude mice (eight weeks; Charles River Laboratories) were injected with 8 million
MDA-MB-231 cells subcutaneously. After 4 d, mice were separated into treatment groups of
roughly equal tumor size (128 mm3) and population, and dosed with 30 mg/kg 31MEW44 in 5%
DMSO HBSS at pH 4 or vehicle (5% DMSO HBSS at pH 4) intraperitoneal, once per day for 6
d. Tumor size was measured by electronic caliper every 2 d and calculated using the formula:
0.523 X Length X width2.
Mice were euthanized using a CO2 gas chamber before xenograft dissection. Tumors were then
weighed, frozen and stored at -80 oC. Segments of the tumor were taken (~60 mg) and suspended
in 120 uL lysis buffer. Xengrafts were then lysed by sonication (40 amp for 10-15 seconds) and
samples were centrifuged at 14,000 rpm at 4 oC for 30 min to remove unlysed cells and debris.
The supernatant was then analyzed by western blotting using the aforementioned protocol.
Culture conditions and viability measurements in patient derived T-ALL samples (this
protocol was developed by Dr. Marta Sanchez-Martin)
Patient Samples
109
T-ALL samples were provided by Columbia Presbyterian Hospital, the Eastern Cooperative
Oncology Group (ECOG), University of Padova, and Hospital Central de Asturias with informed
consent and analyzed under the supervision of the Columbia University Medical Center
Institutional Review Board committee.
Primary cell co-culture and in vitro cell viability assays.
For the analysis of 31MEW44 on primary T-ALL patient samples, we cultured cells in MEMa
medium supplemented with 10% FBS, 10% human heat-inactivated serum, 1%
penicillin/streptomycin, 1% GlutaMAX, human IL-7 (10 ng/mL), human SCF (50
ng/mL),human FLT3-ligand (20 ng/mL), and insulin (20 nmol/L) on a feeder layer of MS5
stromal cells overexpressing the NOTCH ligand Delta-like 1 as described by Amstrong et al.
(25). In these experiments, T-ALL lymphoblasts were cultured in triplicate and treated with
either vehicle, DMSO, or 31MEW44 (doses raging from 1 to 5 µM). We harvested the cells 72 h
after treatment and analyzed cell viability using the BD cell viability kit with liquid counting
beads (BD Bioscience) gating out stroma cells (GFP+), dead cells and particles (PI +). We
acquired data using a FACSCanto II flowcytometer (BD Bioscience) and analyzed it using
FlowJo software (Tree Star, Inc.). Viability data is represented as % relative to vehicle treatment.
Sequencing
A region of 124bp from coding exon1 of the human NRAS gene, including G12-G13 mutation
hotspot, was amplified from the genomic DNA of six primary T-ALL samples by polymerase
chain reaction and was analyzed by direct dideoxynucleotide sequencing using primers FW: 5’-
GCTGGTGTGAAATGACT-3’ and. RV: 5’-GCTACCACTGGGCCTCACCT-3’.
110
COSMIC
PDTALL 22 synonymus variants GCA/GCT (A); GGT/GTT (G13) (G13V).
PDTALL26 missense variant GGT/GAT (G13) (G13D).
Patient-derived xenograft (this protocol was developed by Dr. Marta Sanchez-Martin)
Animals were maintained in the animal facility at the Irving Cancer Center at Columbia
University Medical Campus; and all animal procedures were approved by the Columbia
University IACUC. To generate primary xenografts, cells from T-ALL sample PD22, harboring
a mutated allele of NRAS, were transplanted via intravenous injection into lethally irradiated
primary recipients as previously described (Chiang et al., 2008). Upon detection of human
lymphoblasts (human CD45+ cells) in peripheral blood, mice were sacrificed; lymphoblasts
isolated from the spleens were transduced with retroviral particles expressing a fusion protein
between the red cherry fluorescent protein and luciferase (MigR1 CherryLUC), and re-injected
in sublethally irradiated mice (Piovan et al., 2013).
Mice transplanted with retrovirally transduced cells were imaged regularly until luciferase
activity was detected. Tumor cells were harvested from the spleens of these mice, and injected
into secondary recipients. Secondary recipients were randomized into two groups of 5 mice with
equal load of luciferase. Animals were treated I.P. with vehicle or 31MEW44 30 mg/kg in 5%
DMSO in HBSS at pH 4., once daily on days 0; 1; 4; 5; 7 and 8, and imaged at day 0 (before
treatment), at day 4 and at day 8. Mice were sacrificed at day 8; spleen weight and presence of
human CD45 + cells in the spleen (lymphoblasts) were documented together with changes in
luciferase signal over treatment.
111
Chiang, M.Y., Xu, L., Shestova, O., Histen, G., L'Heureux, S., Romany, C., Childs, M.E.,
Gimotty, P.A., Aster, J.C., and Pear, W.S. (2008). Leukemia-associated NOTCH1 alleles are
weak tumor initiators but accelerate K-ras-initiated leukemia. The Journal of clinical
investigation 118, 3181-3194.
Piovan, E., Yu, J., Tosello, V., Herranz, D., Ambesi-Impiombato, A., Da Silva, A.C., Sanchez-
Martin, M., Perez-Garcia, A., Rigo, I., Castillo, M., et al. (2013). Direct reversal of
glucocorticoid resistance by AKT inhibition in acute lymphoblastic leukemia. Cancer cell 24,
766-776.
KPf/fC mouse study (this protocol was developed by Michael Badgely)
KRASLSLG12D; p53fl/fl; Pdx1-Cre (KPF/FC) mice have been previously described [1]. Animals
were housed in a barrier facility and monitored daily prior to enrollment on studies. All
experiments were carried out in compliance with established IACUC guidelines of Columbia
University.
Animal surgery
KPF/FC were palpated twice weekly to assess for tumor formation. Upon discovery of a palpable
mass deemed amenable to surgery, tumors were accessed by abdominal laparotomy as
previously described for biopsy procedures [2]. In short, mice were anesthetized with
isofluorane, prepared for aseptic surgery, and injected with buprenorphine intra-operatively to
initiate post-operative analgesia. Following visual identification, tumors were held in place with
a pair of biopsy forceps while a small-diameter biopsy punch (2-mm diameter, Zivic Instruments
112
PUN2000) was used to cleanly remove a tissue sample. The resultant wound was filled with an
absorbable, gelatin compressed sponge to staunch possible bleeding. Incisions were sutured
closed and the mouse was allowed to recover from 24-48 hours prior to study initiation.
Sample processing and storage
Biopsy samples derived from small animal surgery were divided in two specimens. The first was
stored in 10% buffered formalin phosphate overnight at 4ºC and then placed in 70% ethanol for
extended storage prior to processing and embedding in paraffin wax blocks. The second was
embedded in O.C.T. compound and subsequently frozen atop a bath of LN2 prior to long-term
storage at -80ºC. Tumor samples taken at necropsy were processed and stored identically to those
described above.
Immunohistochemistry
Paraffin embedded samples were sectioned at 5µM thickness and mounted on positively charged
sample slides. These slides were heated at 60ºC for 15-30 minutes and subsequently rehydrated
by standard protocols. Unmasking was performed in 10 mM citrate buffer, pH 6 for 5 minutes in
a pressure cooker at high temperature, followed by peroxidase quench in 3% hydrogen peroxide
for 20 minutes. Blocking was carried out using 1.5% horse serum and 2% animal free blocker
(Vector Labs) in TBS-T for 1 hour at room temperature. Slides were incubated with primary
antibody (cleaved caspase-3, catalog no. 9664; ERK, catalog no. 4695; pERK, catalog no. 4376.
All antibodies from Cell Signaling) overnight at 4ºC. Slides were then allowed to equilibrate to
room temperature prior to washing with TBS-T and incubation with secondary antibody
(ImmPress polymer reagent, Vector Labs). Signal was developed with ImmPACT DAB
113
Peroxidase Substrate (Vector Labs). Slides were counterstained with hematoxylin for 30
seconds. For quantification of cleaved-caspase 3 staining, all available 40x fields on three
separate sections of biopsy samples and twenty total 40x fields from two separate sections of
necropsy samples were analyzed for each study mouse.
Drug studies
Mice were dosed once daily with 30mg/kg of 31MEW44 by way of intraperitoneal injection.
Mice were monitored closely for changes in health status and were sacrificed after 5 days on
study or once they met endpoint criteria in keeping with IACUC standards.
114
Chapter 4: Structure-activity relationship studies and optimization of experimental cancer
therapeutics
Medicinal chemistry in the absence of target binding site information is a time-
consuming and challenging endeavor, as innumerable synthetic modifications could be
potentially made to a given structure. The approach described in this chapter first entails
breaking down a given molecule into segments based on synthetic disconnection points. Subtle
changes are introduced initially and coupled with iterative rounds of biological evaluation to
obtain a structure-activity relationship (SAR). This preliminary information is then used as the
basis for the design of more elaborate modifications that can then be made to the molecule.
Prioritization of these possibilities is based on synthetic difficulty, reagent cost, and likelihood of
a favorable improvement of the activity and/or the ADMET properties of the molecule. This is
approach has been implemented in the optimization of two experimental cancer therapeutics,
erastin and J9, discovered in the Stockwell lab.
I. Erastin background
The small molecule erastin was discovered from a high-throughput screen for compounds
that exhibit mutant RAS-selective lethality [104]. A library of 23,550 molecules was screened
using isogenic, engineered mutant and wild type RAS expressing cell lines [104]. Investigation
into the mechanism of action of erastin showed that it elicits a novel, non-apoptotic, iron
dependent form of cell death in cancer cells that has been coined ferroptosis [105]. This has been
found to occur through the inhibition of the antiporter system xc-, which exchanges extracellular
cystine for intracellular glutamate [105-107]. The ability to study ferroptosis in vivo has been
limited by erastin’s metabolic stability, aqueous solubility, and potency. The goal of this study
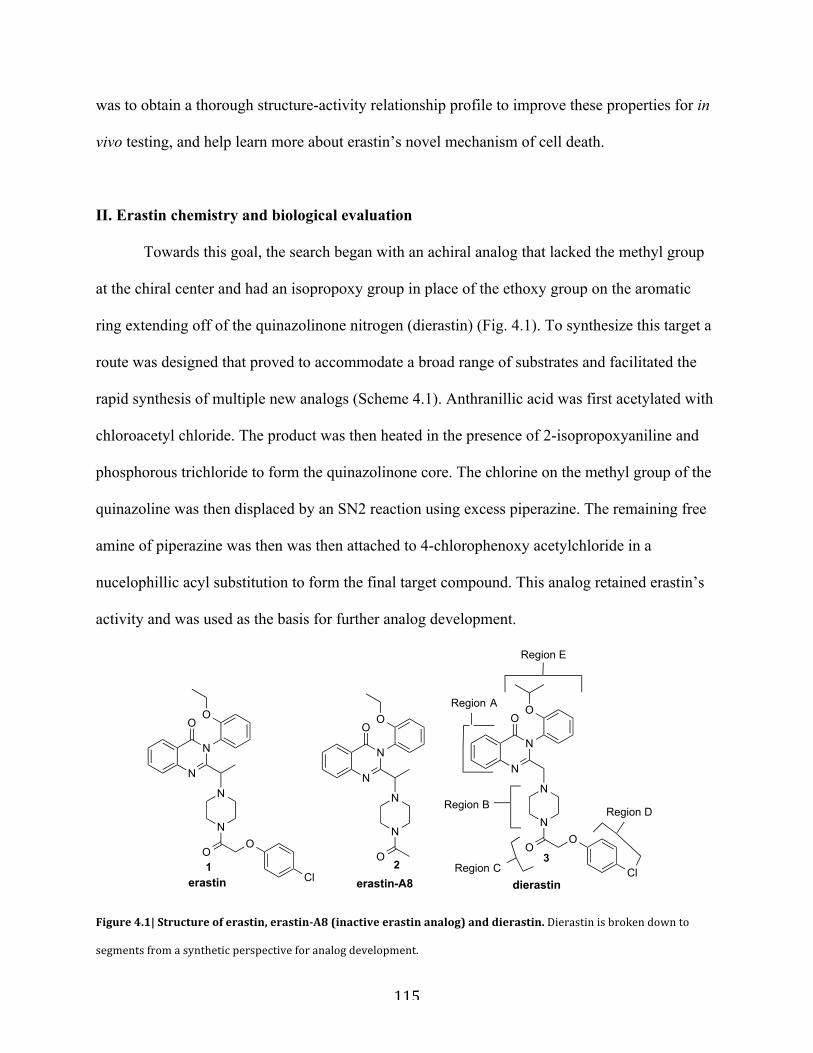
115
was to obtain a thorough structure-activity relationship profile to improve these properties for in
vivo testing, and help learn more about erastin’s novel mechanism of cell death.
II. Erastin chemistry and biological evaluation
Towards this goal, the search began with an achiral analog that lacked the methyl group
at the chiral center and had an isopropoxy group in place of the ethoxy group on the aromatic
ring extending off of the quinazolinone nitrogen (dierastin) (Fig. 4.1). To synthesize this target a
route was designed that proved to accommodate a broad range of substrates and facilitated the
rapid synthesis of multiple new analogs (Scheme 4.1). Anthranillic acid was first acetylated with
chloroacetyl chloride. The product was then heated in the presence of 2-isopropoxyaniline and
phosphorous trichloride to form the quinazolinone core. The chlorine on the methyl group of the
quinazoline was then displaced by an SN2 reaction using excess piperazine. The remaining free
amine of piperazine was then was then attached to 4-chlorophenoxy acetylchloride in a
nucelophillic acyl substitution to form the final target compound. This analog retained erastin’s
activity and was used as the basis for further analog development.
Figure 4.1| Structure of erastin, erastin-‐A8 (inactive erastin analog) and dierastin. Dierastin is broken down to
segments from a synthetic perspective for analog development.
N
N
N
NO
Cl
O
OO
Region B
Region A
3Region C
Region E
Region D
N
N
N
NO
Cl
O
OO
N
N
N
N
O
OO
erastin erastin-A8 dierastin
21
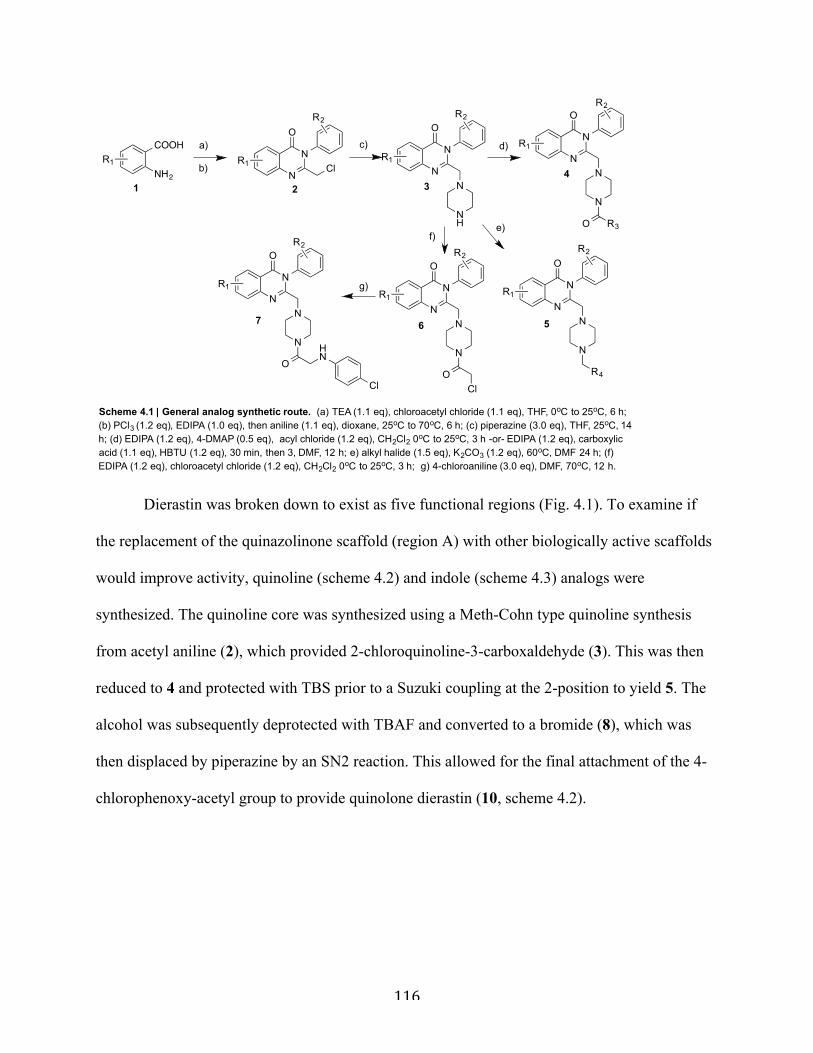
116
Dierastin was broken down to exist as five functional regions (Fig. 4.1). To examine if
the replacement of the quinazolinone scaffold (region A) with other biologically active scaffolds
would improve activity, quinoline (scheme 4.2) and indole (scheme 4.3) analogs were
synthesized. The quinoline core was synthesized using a Meth-Cohn type quinoline synthesis
from acetyl aniline (2), which provided 2-chloroquinoline-3-carboxaldehyde (3). This was then
reduced to 4 and protected with TBS prior to a Suzuki coupling at the 2-position to yield 5. The
alcohol was subsequently deprotected with TBAF and converted to a bromide (8), which was
then displaced by piperazine by an SN2 reaction. This allowed for the final attachment of the 4-
chlorophenoxy-acetyl group to provide quinolone dierastin (10, scheme 4.2).
Scheme 4.1 | General analog synthetic route. (a) TEA (1.1 eq), chloroacetyl chloride (1.1 eq), THF, 0oC to 25oC, 6 h; (b) PCl3 (1.2 eq), EDIPA (1.0 eq), then aniline (1.1 eq), dioxane, 25oC to 70oC, 6 h; (c) piperazine (3.0 eq), THF, 25oC, 14 h; (d) EDIPA (1.2 eq), 4-DMAP (0.5 eq), acyl chloride (1.2 eq), CH2Cl2 0oC to 25oC, 3 h -or- EDIPA (1.2 eq), carboxylic acid (1.1 eq), HBTU (1.2 eq), 30 min, then 3, DMF, 12 h; e) alkyl halide (1.5 eq), K2CO3 (1.2 eq), 60oC, DMF 24 h; (f) EDIPA (1.2 eq), chloroacetyl chloride (1.2 eq), CH2Cl2 0oC to 25oC, 3 h; g) 4-chloroaniline (3.0 eq), DMF, 70oC, 12 h.
N
N
O
Cl
COOH
NH2 N
N
O
N
N
N
N
N
R3O
O
a)
b)
c) d)
NH
R1R1R1
R2
R1
N
N
N
N
R4
O
R1
e)
N
N
N
N
O
O
R1
Cl
f)R2
R2R2
R2
g)N
N
N
N
O
O
R1
HN
R2
Cl
1 2 34
567
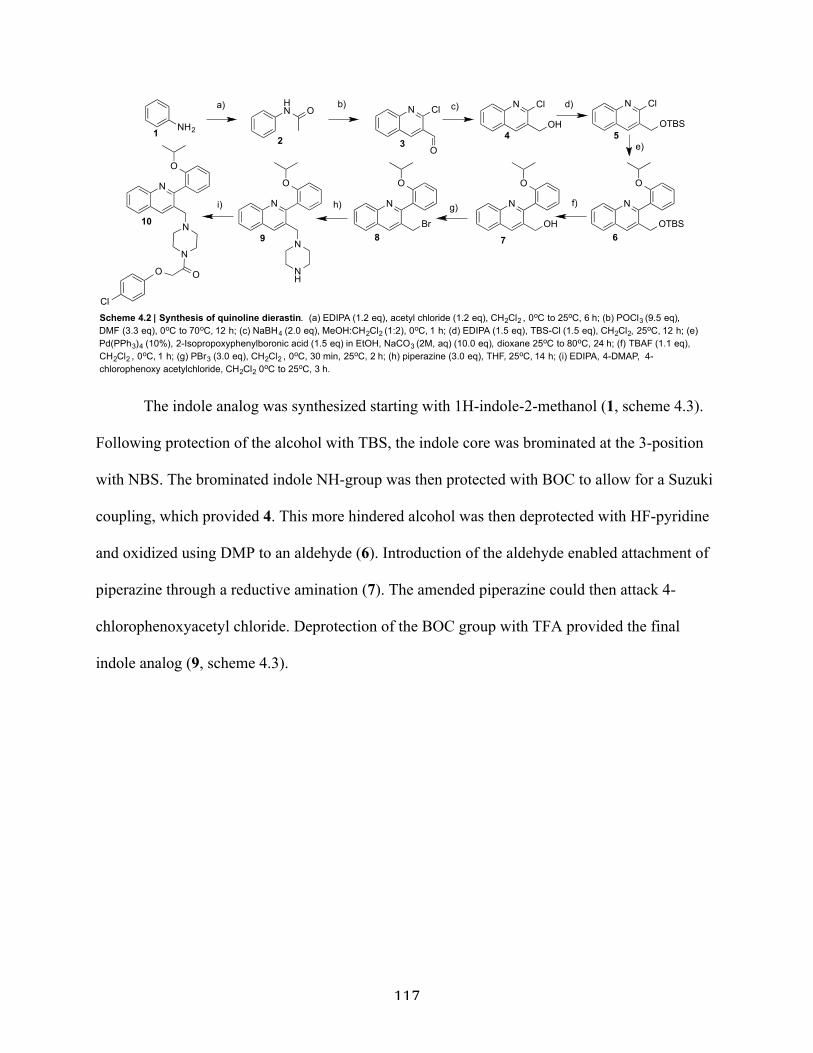
117
The indole analog was synthesized starting with 1H-indole-2-methanol (1, scheme 4.3).
Following protection of the alcohol with TBS, the indole core was brominated at the 3-position
with NBS. The brominated indole NH-group was then protected with BOC to allow for a Suzuki
coupling, which provided 4. This more hindered alcohol was then deprotected with HF-pyridine
and oxidized using DMP to an aldehyde (6). Introduction of the aldehyde enabled attachment of
piperazine through a reductive amination (7). The amended piperazine could then attack 4-
chlorophenoxyacetyl chloride. Deprotection of the BOC group with TFA provided the final
indole analog (9, scheme 4.3).
NH2
HN O N Cl
O
N Cl
OH
N
OTBS
O
N
Br
O
N
N
O
NH
N
N
O
N
OO
Cl
N Cl
OTBS
N
OH
O
Scheme 4.2 | Synthesis of quinoline dierastin. (a) EDIPA (1.2 eq), acetyl chloride (1.2 eq), CH2Cl2 , 0oC to 25oC, 6 h; (b) POCl3 (9.5 eq), DMF (3.3 eq), 0oC to 70oC, 12 h; (c) NaBH4 (2.0 eq), MeOH:CH2Cl2 (1:2), 0oC, 1 h; (d) EDIPA (1.5 eq), TBS-Cl (1.5 eq), CH2Cl2, 25oC, 12 h; (e) Pd(PPh3)4 (10%), 2-Isopropoxyphenylboronic acid (1.5 eq) in EtOH, NaCO3 (2M, aq) (10.0 eq), dioxane 25oC to 80oC, 24 h; (f) TBAF (1.1 eq), CH2Cl2 , 0oC, 1 h; (g) PBr3 (3.0 eq), CH2Cl2 , 0oC, 30 min, 25oC, 2 h; (h) piperazine (3.0 eq), THF, 25oC, 14 h; (i) EDIPA, 4-DMAP, 4-chlorophenoxy acetylchloride, CH2Cl2 0oC to 25oC, 3 h.
a) b) c) d)
e)
f)g)h)i)
12 3
4 5
6789
10
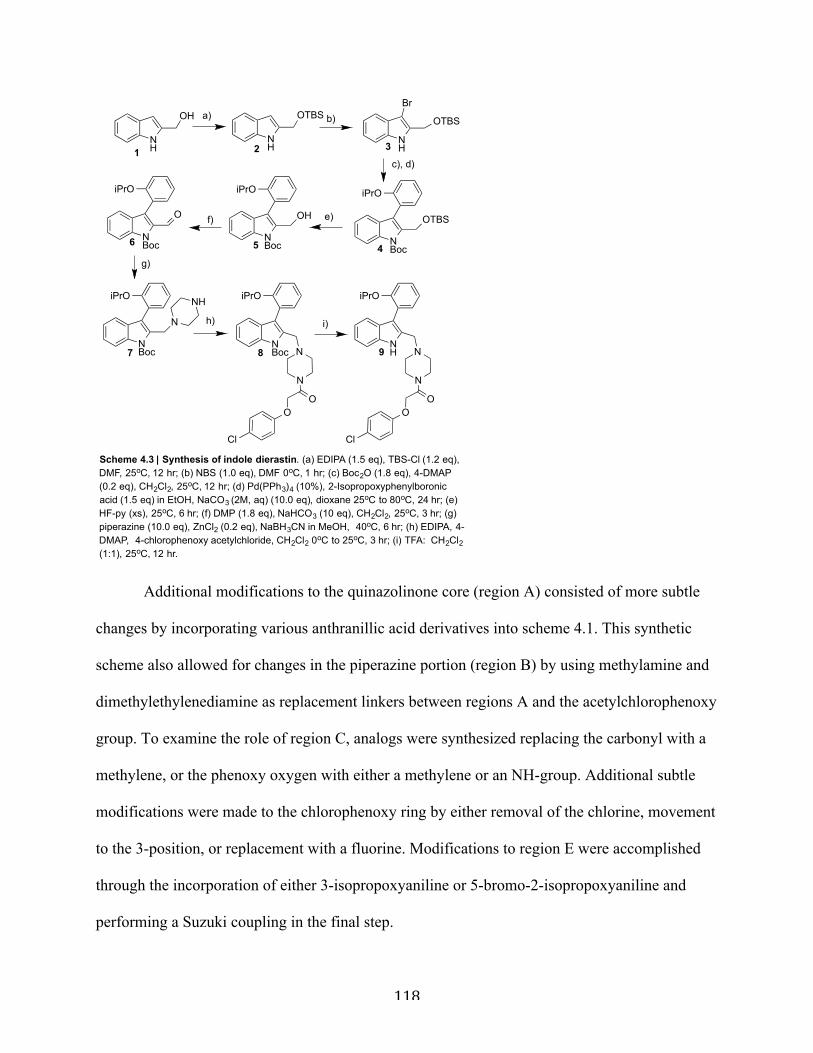
118
Additional modifications to the quinazolinone core (region A) consisted of more subtle
changes by incorporating various anthranillic acid derivatives into scheme 4.1. This synthetic
scheme also allowed for changes in the piperazine portion (region B) by using methylamine and
dimethylethylenediamine as replacement linkers between regions A and the acetylchlorophenoxy
group. To examine the role of region C, analogs were synthesized replacing the carbonyl with a
methylene, or the phenoxy oxygen with either a methylene or an NH-group. Additional subtle
modifications were made to the chlorophenoxy ring by either removal of the chlorine, movement
to the 3-position, or replacement with a fluorine. Modifications to region E were accomplished
through the incorporation of either 3-isopropoxyaniline or 5-bromo-2-isopropoxyaniline and
performing a Suzuki coupling in the final step.
NH
NBoc
iPrO
Br
NH
OH OTBS
OTBS
NBoc
iPrO
N
NH
NH N
OO
Cl
NH
OTBS
NBoc
iPrO
OH
NBoc
iPrO
O
N
iPrO
NBoc N
OO
Cl
N
iPrO
Scheme 4.3 | Synthesis of indole dierastin. (a) EDIPA (1.5 eq), TBS-Cl (1.2 eq), DMF, 25oC, 12 hr; (b) NBS (1.0 eq), DMF 0oC, 1 hr; (c) Boc2O (1.8 eq), 4-DMAP (0.2 eq), CH2Cl2, 25oC, 12 hr; (d) Pd(PPh3)4 (10%), 2-Isopropoxyphenylboronic acid (1.5 eq) in EtOH, NaCO3 (2M, aq) (10.0 eq), dioxane 25oC to 80oC, 24 hr; (e) HF-py (xs), 25oC, 6 hr; (f) DMP (1.8 eq), NaHCO3 (10 eq), CH2Cl2, 25oC, 3 hr; (g) piperazine (10.0 eq), ZnCl2 (0.2 eq), NaBH3CN in MeOH, 40oC, 6 hr; (h) EDIPA, 4-DMAP, 4-chlorophenoxy acetylchloride, CH2Cl2 0oC to 25oC, 3 hr; (i) TFA: CH2Cl2 (1:1), 25oC, 12 hr.
a) b)
c), d)
e)f)
g)
h) i)
1 2 3
456
7 8 9
119
This set of analogs was evaluated in HT1080 cells +/- betamercaptoethanol (BME) to see
whether lethality involved inhibition of system xc- [106] (These experiments were performed by
Professor Scott Dixon). BME has been found to rescue the cells from the inhibition of system xc-
by erastin through forming a mixed disulfide with cystine [105, 108]. This facilitates cysteine
transport into the cell by an alternative mechanism [108]. Glutamate release was also assessed in
parallel using an aplex red assay system in human CCF-STTG1 astrocytoma cells, as an
additional indicator of system xc- inhibition [106] (This experiment was perfomed by Dr. Ajit
Thomas and Professor Barbra Slusher). Overall the lethality in HT-1080 cells correlated
substantially with glutamate release in CCF-STTG1 cells (R2 = 0.86), supporting the hypothesis
that system xc- inhibition is quantitatively linked to ferroptosis [106].
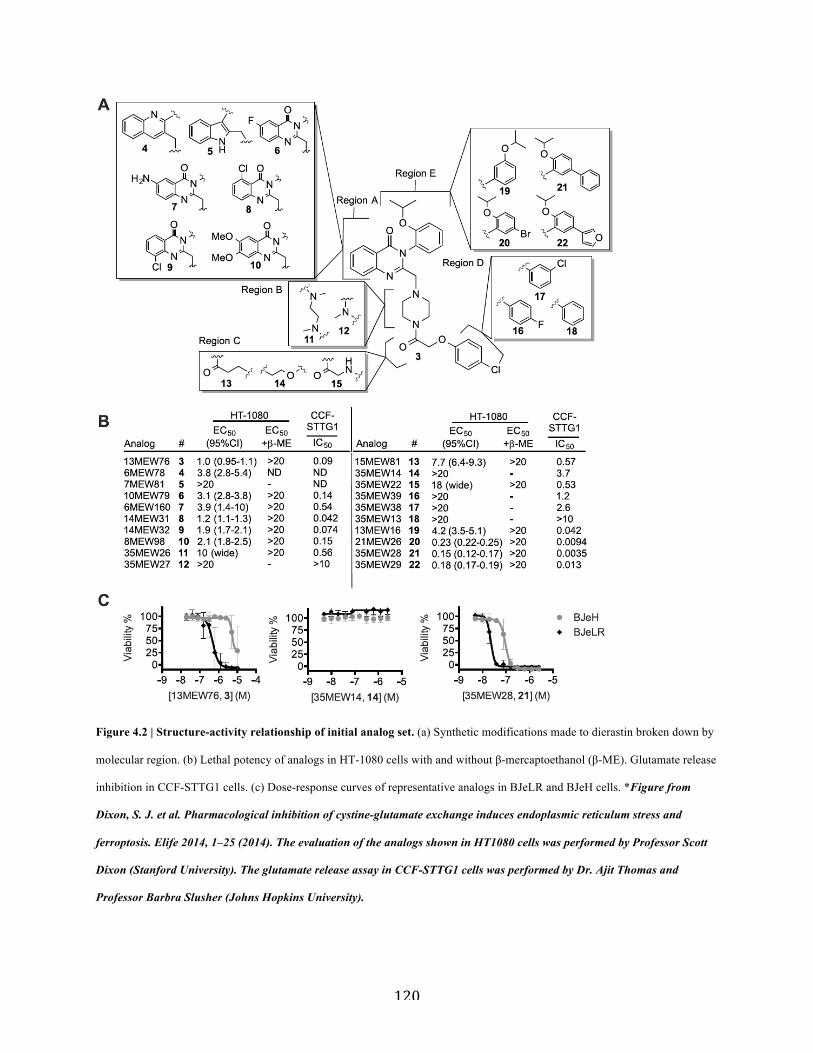
120
Figure 4.2 | Structure-activity relationship of initial analog set. (a) Synthetic modifications made to dierastin broken down by
molecular region. (b) Lethal potency of analogs in HT-1080 cells with and without β-mercaptoethanol (β-ME). Glutamate release
inhibition in CCF-STTG1 cells. (c) Dose-response curves of representative analogs in BJeLR and BJeH cells. *Figure from
Dixon, S. J. et al. Pharmacological inhibition of cystine-glutamate exchange induces endoplasmic reticulum stress and
ferroptosis. Elife 2014, 1–25 (2014). The evaluation of the analogs shown in HT1080 cells was performed by Professor Scott
Dixon (Stanford University). The glutamate release assay in CCF-STTG1 cells was performed by Dr. Ajit Thomas and
Professor Barbra Slusher (Johns Hopkins University).
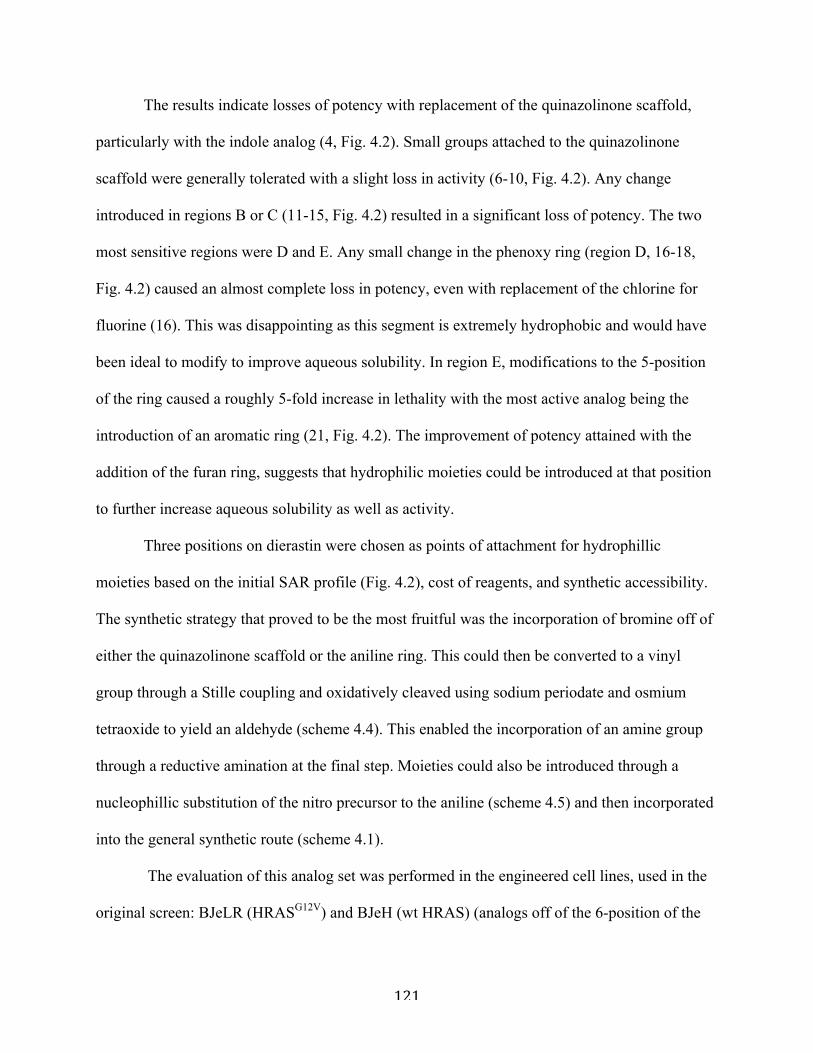
121
The results indicate losses of potency with replacement of the quinazolinone scaffold,
particularly with the indole analog (4, Fig. 4.2). Small groups attached to the quinazolinone
scaffold were generally tolerated with a slight loss in activity (6-10, Fig. 4.2). Any change
introduced in regions B or C (11-15, Fig. 4.2) resulted in a significant loss of potency. The two
most sensitive regions were D and E. Any small change in the phenoxy ring (region D, 16-18,
Fig. 4.2) caused an almost complete loss in potency, even with replacement of the chlorine for
fluorine (16). This was disappointing as this segment is extremely hydrophobic and would have
been ideal to modify to improve aqueous solubility. In region E, modifications to the 5-position
of the ring caused a roughly 5-fold increase in lethality with the most active analog being the
introduction of an aromatic ring (21, Fig. 4.2). The improvement of potency attained with the
addition of the furan ring, suggests that hydrophilic moieties could be introduced at that position
to further increase aqueous solubility as well as activity.
Three positions on dierastin were chosen as points of attachment for hydrophillic
moieties based on the initial SAR profile (Fig. 4.2), cost of reagents, and synthetic accessibility.
The synthetic strategy that proved to be the most fruitful was the incorporation of bromine off of
either the quinazolinone scaffold or the aniline ring. This could then be converted to a vinyl
group through a Stille coupling and oxidatively cleaved using sodium periodate and osmium
tetraoxide to yield an aldehyde (scheme 4.4). This enabled the incorporation of an amine group
through a reductive amination at the final step. Moieties could also be introduced through a
nucleophillic substitution of the nitro precursor to the aniline (scheme 4.5) and then incorporated
into the general synthetic route (scheme 4.1).
The evaluation of this analog set was performed in the engineered cell lines, used in the
original screen: BJeLR (HRASG12V) and BJeH (wt HRAS) (analogs off of the 6-position of the
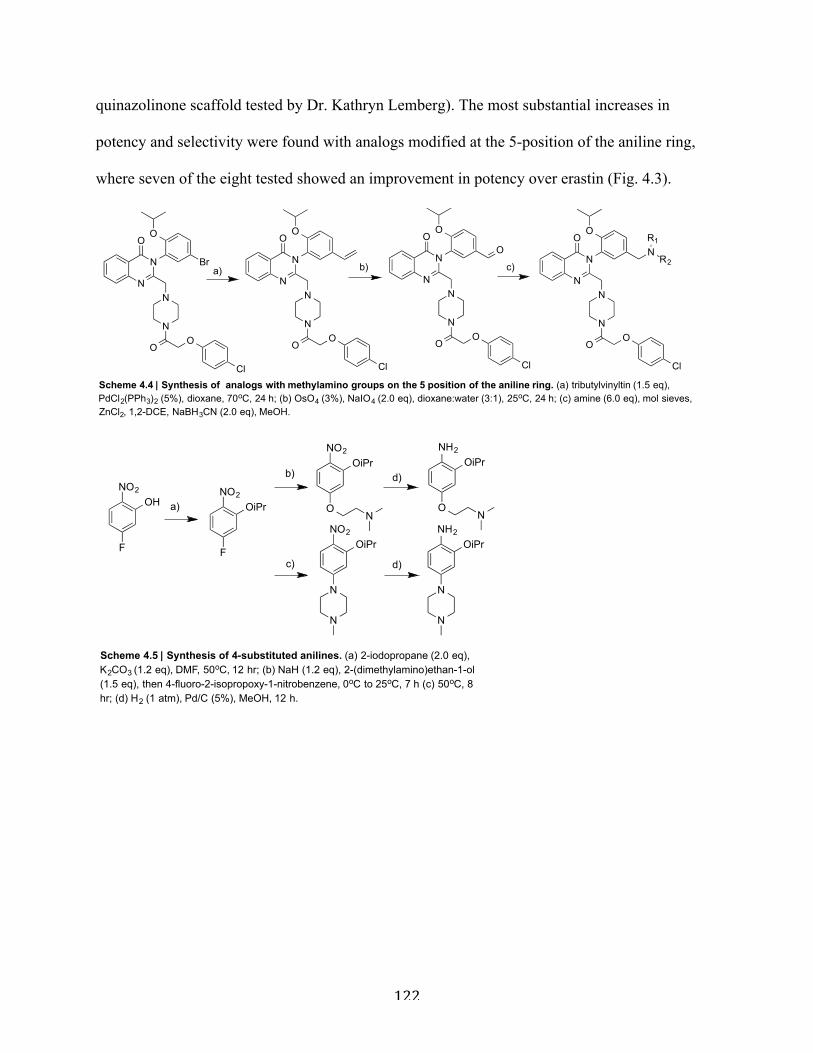
122
quinazolinone scaffold tested by Dr. Kathryn Lemberg). The most substantial increases in
potency and selectivity were found with analogs modified at the 5-position of the aniline ring,
where seven of the eight tested showed an improvement in potency over erastin (Fig. 4.3).
Scheme 4.4 | Synthesis of analogs with methylamino groups on the 5 position of the aniline ring. (a) tributylvinyltin (1.5 eq), PdCl2(PPh3)2 (5%), dioxane, 70oC, 24 h; (b) OsO4 (3%), NaIO4 (2.0 eq), dioxane:water (3:1), 25oC, 24 h; (c) amine (6.0 eq), mol sieves, ZnCl2, 1,2-DCE, NaBH3CN (2.0 eq), MeOH.
N
N
N
NO
Cl
O
OO
N
N
N
NO
Cl
O
OO
NR1
R2
N
N
N
NO
Cl
O
OO
Br
N
N
N
NO
Cl
O
OO
O
a) b) c)
NO2
OiPr
ON
NH2
OiPr
O
NH2
OiPr
N
N
Na)
b)
c)
NO2
OH
F
d)
d)
Scheme 4.5 | Synthesis of 4-substituted anilines. (a) 2-iodopropane (2.0 eq), K2CO3 (1.2 eq), DMF, 50oC, 12 hr; (b) NaH (1.2 eq), 2-(dimethylamino)ethan-1-ol (1.5 eq), then 4-fluoro-2-isopropoxy-1-nitrobenzene, 0oC to 25oC, 7 h (c) 50oC, 8 hr; (d) H2 (1 atm), Pd/C (5%), MeOH, 12 h.
NO2
OiPr
N
N
NO2
OiPr
F
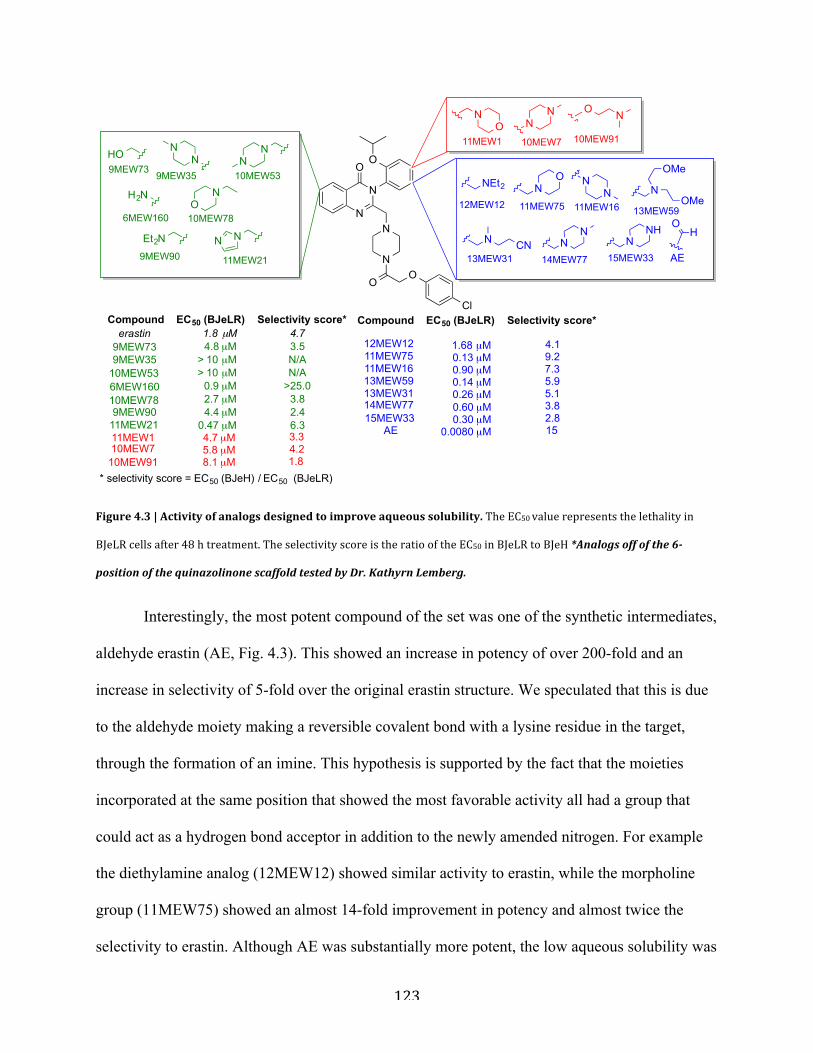
123
Figure 4.3 | Activity of analogs designed to improve aqueous solubility. The EC50 value represents the lethality in
BJeLR cells after 48 h treatment. The selectivity score is the ratio of the EC50 in BJeLR to BJeH *Analogs off of the 6-‐
position of the quinazolinone scaffold tested by Dr. Kathyrn Lemberg.
Interestingly, the most potent compound of the set was one of the synthetic intermediates,
aldehyde erastin (AE, Fig. 4.3). This showed an increase in potency of over 200-fold and an
increase in selectivity of 5-fold over the original erastin structure. We speculated that this is due
to the aldehyde moiety making a reversible covalent bond with a lysine residue in the target,
through the formation of an imine. This hypothesis is supported by the fact that the moieties
incorporated at the same position that showed the most favorable activity all had a group that
could act as a hydrogen bond acceptor in addition to the newly amended nitrogen. For example
the diethylamine analog (12MEW12) showed similar activity to erastin, while the morpholine
group (11MEW75) showed an almost 14-fold improvement in potency and almost twice the
selectivity to erastin. Although AE was substantially more potent, the low aqueous solubility was
N
N
N
NO
Cl
O
OO
HO
H2N
NN
NN N
N
ON
Et2N
Compound EC50 (BJeLR) Selectivity score*1.8 µM4.8 µM
> 10 µM> 10 µM
0.9 µM2.7 µM4.4 µM
0.47 µM
4.73.5N/AN/A
>25.03.82.46.3
* selectivity score = EC50 (BJeH) / EC50 (BJeLR)
1.68 µM0.13 µM0.90 µM0.14 µM0.26 µM
4.19.27.35.95.13.82.815
4.7 µM5.8 µM8.1 µM
3.34.2 1.8
0.60 µM0.30 µM
0.0080 µM
13MEW5913MEW31
12MEW1211MEW75
11MEW21
11MEW16
10MEW710MEW91
11MEW1
9MEW35
15MEW33AE
14MEW779MEW90
9MEW73
10MEW78
10MEW536MEW160
11MEW21
9MEW35
9MEW90
9MEW73
10MEW78
10MEW53
6MEW160
erastin
NNO
N NO
10MEW7 10MEW9111MEW1
NNO
NNEt2 NOMe
OMe
N CN NN
NNH
15MEW3314MEW77
13MEW59
13MEW31
12MEW12 11MEW75 11MEW16
OH
AE
Compound EC50 (BJeLR) Selectivity score*
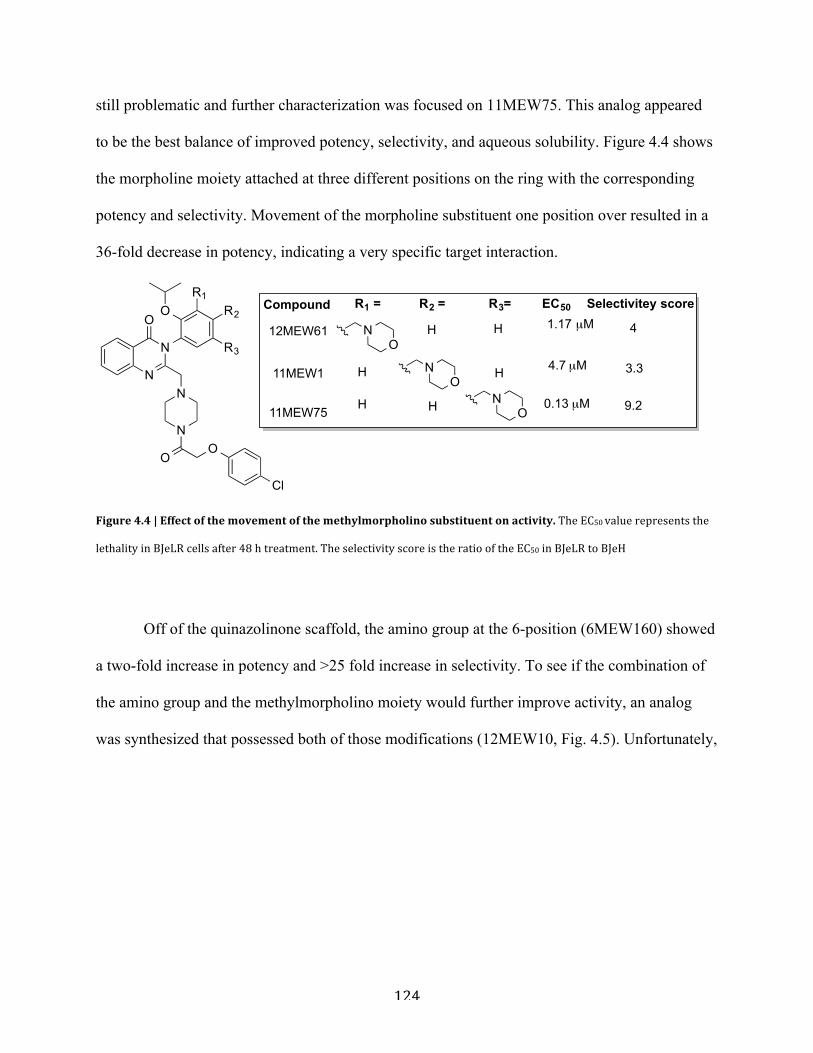
124
still problematic and further characterization was focused on 11MEW75. This analog appeared
to be the best balance of improved potency, selectivity, and aqueous solubility. Figure 4.4 shows
the morpholine moiety attached at three different positions on the ring with the corresponding
potency and selectivity. Movement of the morpholine substituent one position over resulted in a
36-fold decrease in potency, indicating a very specific target interaction.
Figure 4.4 | Effect of the movement of the methylmorpholino substituent on activity. The EC50 value represents the
lethality in BJeLR cells after 48 h treatment. The selectivity score is the ratio of the EC50 in BJeLR to BJeH
Off of the quinazolinone scaffold, the amino group at the 6-position (6MEW160) showed
a two-fold increase in potency and >25 fold increase in selectivity. To see if the combination of
the amino group and the methylmorpholino moiety would further improve activity, an analog
was synthesized that possessed both of those modifications (12MEW10, Fig. 4.5). Unfortunately,
N
N
N
NO
Cl
O
OO
R3
R2
R1R1 = R2 = R3= EC50 Selectivitey score
ON H
H H
H H
ON
ON
H
0.13 µM 9.2
4.7 µM 3.3
1.17 µM 412MEW61
11MEW1
11MEW75
Compound
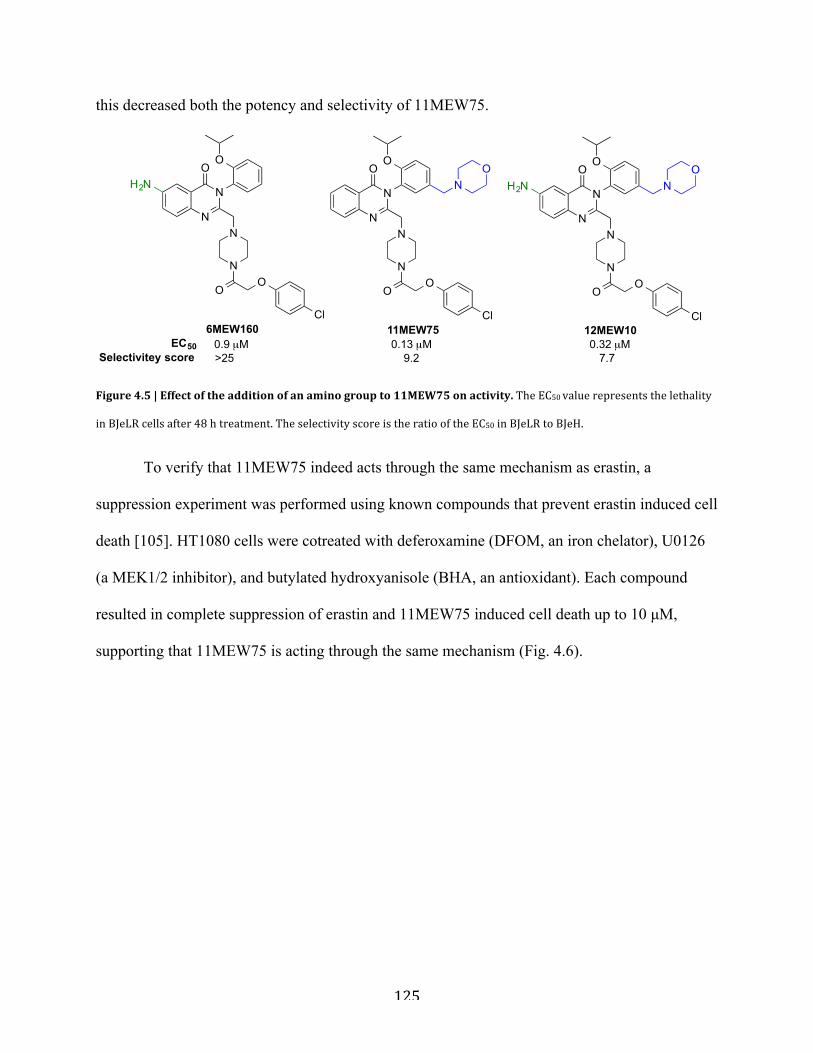
125
this decreased both the potency and selectivity of 11MEW75.
Figure 4.5 | Effect of the addition of an amino group to 11MEW75 on activity. The EC50 value represents the lethality
in BJeLR cells after 48 h treatment. The selectivity score is the ratio of the EC50 in BJeLR to BJeH.
To verify that 11MEW75 indeed acts through the same mechanism as erastin, a
suppression experiment was performed using known compounds that prevent erastin induced cell
death [105]. HT1080 cells were cotreated with deferoxamine (DFOM, an iron chelator), U0126
(a MEK1/2 inhibitor), and butylated hydroxyanisole (BHA, an antioxidant). Each compound
resulted in complete suppression of erastin and 11MEW75 induced cell death up to 10 µM,
supporting that 11MEW75 is acting through the same mechanism (Fig. 4.6).
N
N
N
NO
Cl
O
OO
H2N NO
12MEW10
N
N
N
NO
Cl
O
OO
H2N
N
N
N
NO
Cl
O
OO
NO
11MEW756MEW160EC50
Selectivitey score0.9 µM>25
0.13 µM9.2
0.32 µM7.7
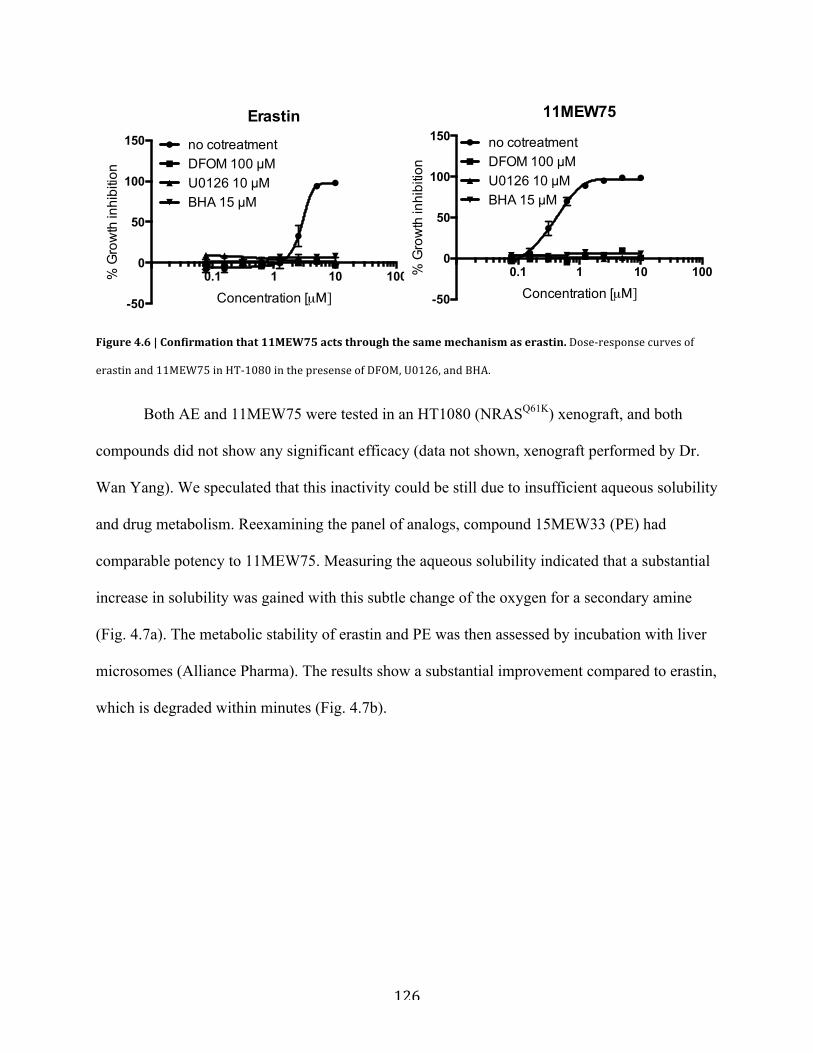
126
Figure 4.6 | Confirmation that 11MEW75 acts through the same mechanism as erastin. Dose-‐response curves of
erastin and 11MEW75 in HT-‐1080 in the presense of DFOM, U0126, and BHA.
Both AE and 11MEW75 were tested in an HT1080 (NRASQ61K) xenograft, and both
compounds did not show any significant efficacy (data not shown, xenograft performed by Dr.
Wan Yang). We speculated that this inactivity could be still due to insufficient aqueous solubility
and drug metabolism. Reexamining the panel of analogs, compound 15MEW33 (PE) had
comparable potency to 11MEW75. Measuring the aqueous solubility indicated that a substantial
increase in solubility was gained with this subtle change of the oxygen for a secondary amine
(Fig. 4.7a). The metabolic stability of erastin and PE was then assessed by incubation with liver
microsomes (Alliance Pharma). The results show a substantial improvement compared to erastin,
which is degraded within minutes (Fig. 4.7b).
0.1 1 10 100
-50
0
50
100
150
Concentration [µM]
% G
row
th in
hibi
tion
Erastinno cotreatmentDFOM 100 µMU0126 10 µMBHA 15 µM
0.1 1 10 100
-50
0
50
100
150
Concentration [µM]
% G
row
th in
hibi
tion
11MEW75
no cotreatmentDFOM 100 µMU0126 10 µMBHA 15 µM
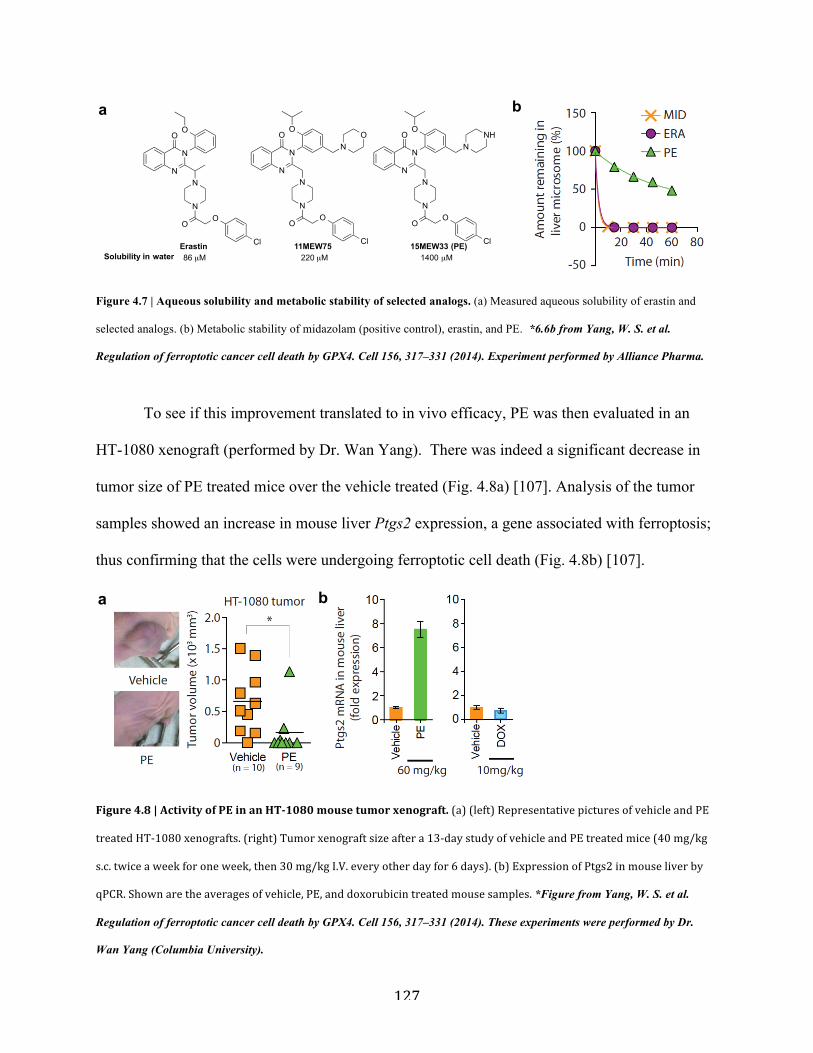
127
Figure 4.7 | Aqueous solubility and metabolic stability of selected analogs. (a) Measured aqueous solubility of erastin and
selected analogs. (b) Metabolic stability of midazolam (positive control), erastin, and PE. *6.6b from Yang, W. S. et al.
Regulation of ferroptotic cancer cell death by GPX4. Cell 156, 317–331 (2014). Experiment performed by Alliance Pharma.
To see if this improvement translated to in vivo efficacy, PE was then evaluated in an
HT-1080 xenograft (performed by Dr. Wan Yang). There was indeed a significant decrease in
tumor size of PE treated mice over the vehicle treated (Fig. 4.8a) [107]. Analysis of the tumor
samples showed an increase in mouse liver Ptgs2 expression, a gene associated with ferroptosis;
thus confirming that the cells were undergoing ferroptotic cell death (Fig. 4.8b) [107].
Figure 4.8 | Activity of PE in an HT-‐1080 mouse tumor xenograft. (a) (left) Representative pictures of vehicle and PE
treated HT-‐1080 xenografts. (right) Tumor xenograft size after a 13-‐day study of vehicle and PE treated mice (40 mg/kg
s.c. twice a week for one week, then 30 mg/kg I.V. every other day for 6 days). (b) Expression of Ptgs2 in mouse liver by
qPCR. Shown are the averages of vehicle, PE, and doxorubicin treated mouse samples. *Figure from Yang, W. S. et al.
Regulation of ferroptotic cancer cell death by GPX4. Cell 156, 317–331 (2014). These experiments were performed by Dr.
Wan Yang (Columbia University).
N
N
N
NO
Cl
O
OO
Solubility in water 86 µMErastin
N
N
N
NO
Cl
O
OO
NO
220 µM11MEW75
N
N
N
NO
Cl
O
OO
NNH
1400 µM15MEW33 (PE)
a b
a b
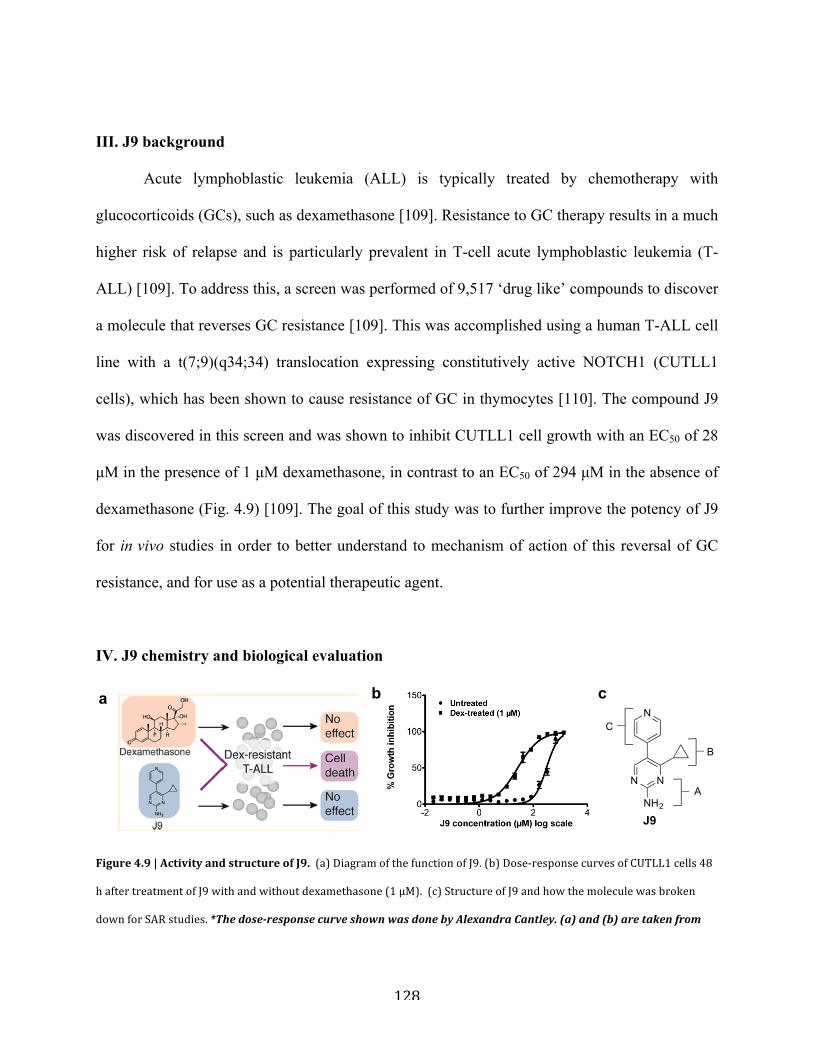
128
III. J9 background
Acute lymphoblastic leukemia (ALL) is typically treated by chemotherapy with
glucocorticoids (GCs), such as dexamethasone [109]. Resistance to GC therapy results in a much
higher risk of relapse and is particularly prevalent in T-cell acute lymphoblastic leukemia (T-
ALL) [109]. To address this, a screen was performed of 9,517 ‘drug like’ compounds to discover
a molecule that reverses GC resistance [109]. This was accomplished using a human T-ALL cell
line with a t(7;9)(q34;34) translocation expressing constitutively active NOTCH1 (CUTLL1
cells), which has been shown to cause resistance of GC in thymocytes [110]. The compound J9
was discovered in this screen and was shown to inhibit CUTLL1 cell growth with an EC50 of 28
µM in the presence of 1 µM dexamethasone, in contrast to an EC50 of 294 µM in the absence of
dexamethasone (Fig. 4.9) [109]. The goal of this study was to further improve the potency of J9
for in vivo studies in order to better understand to mechanism of action of this reversal of GC
resistance, and for use as a potential therapeutic agent.
IV. J9 chemistry and biological evaluation
Figure 4.9 | Activity and structure of J9. (a) Diagram of the function of J9. (b) Dose-‐response curves of CUTLL1 cells 48
h after treatment of J9 with and without dexamethasone (1 μM). (c) Structure of J9 and how the molecule was broken
down for SAR studies. *The dose-‐response curve shown was done by Alexandra Cantley. (a) and (b) are taken from
N N
NH2
NC
B
A
a b c
J9
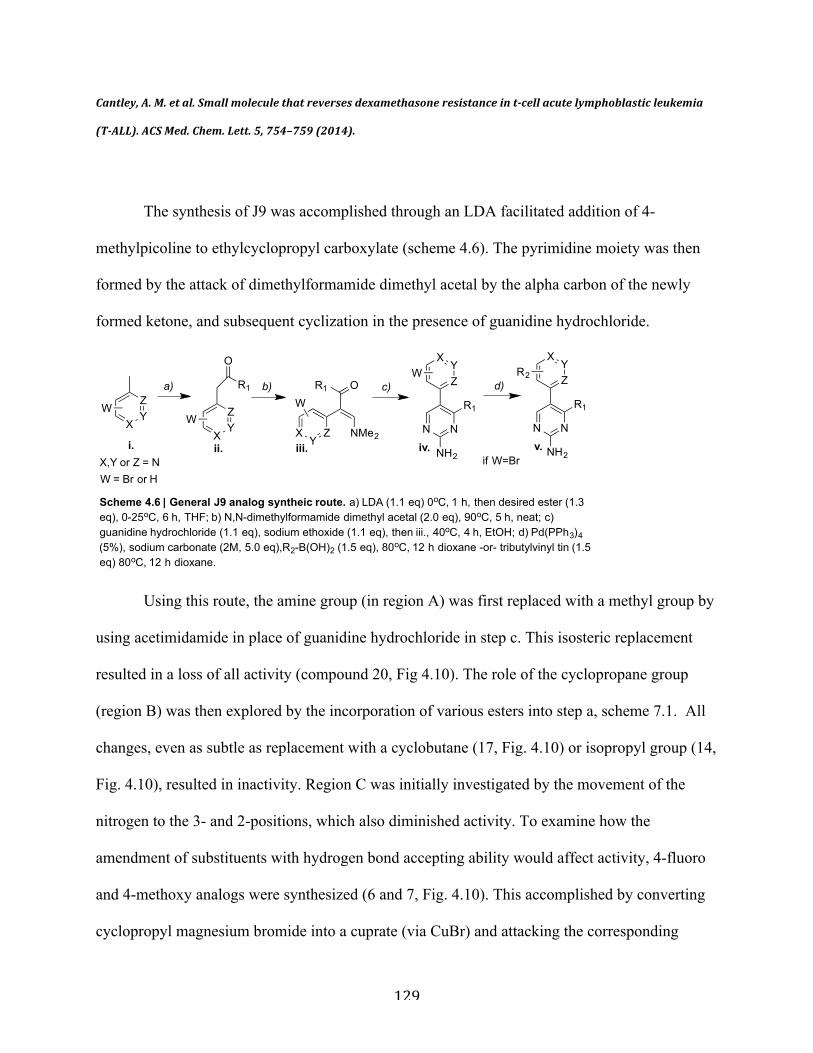
129
Cantley, A. M. et al. Small molecule that reverses dexamethasone resistance in t-‐cell acute lymphoblastic leukemia
(T-‐ALL). ACS Med. Chem. Lett. 5, 754–759 (2014).
The synthesis of J9 was accomplished through an LDA facilitated addition of 4-
methylpicoline to ethylcyclopropyl carboxylate (scheme 4.6). The pyrimidine moiety was then
formed by the attack of dimethylformamide dimethyl acetal by the alpha carbon of the newly
formed ketone, and subsequent cyclization in the presence of guanidine hydrochloride.
Using this route, the amine group (in region A) was first replaced with a methyl group by
using acetimidamide in place of guanidine hydrochloride in step c. This isosteric replacement
resulted in a loss of all activity (compound 20, Fig 4.10). The role of the cyclopropane group
(region B) was then explored by the incorporation of various esters into step a, scheme 7.1. All
changes, even as subtle as replacement with a cyclobutane (17, Fig. 4.10) or isopropyl group (14,
Fig. 4.10), resulted in inactivity. Region C was initially investigated by the movement of the
nitrogen to the 3- and 2-positions, which also diminished activity. To examine how the
amendment of substituents with hydrogen bond accepting ability would affect activity, 4-fluoro
and 4-methoxy analogs were synthesized (6 and 7, Fig. 4.10). This accomplished by converting
cyclopropyl magnesium bromide into a cuprate (via CuBr) and attacking the corresponding
N N
NH2
R1
ZY
X
XYZ
XYZ
O
R1 R1 O
NMe2XY
Z
W
WW
W
X,Y or Z = NW = Br or H
N N
NH2
R1
ZY
XR2
Scheme 4.6 | General J9 analog syntheic route. a) LDA (1.1 eq) 0oC, 1 h, then desired ester (1.3 eq), 0-25oC, 6 h, THF; b) N,N-dimethylformamide dimethyl acetal (2.0 eq), 90oC, 5 h, neat; c) guanidine hydrochloride (1.1 eq), sodium ethoxide (1.1 eq), then iii., 40oC, 4 h, EtOH; d) Pd(PPh3)4 (5%), sodium carbonate (2M, 5.0 eq),R2-B(OH)2 (1.5 eq), 80oC, 12 h dioxane -or- tributylvinyl tin (1.5 eq) 80oC, 12 h dioxane.
if W=Br
a) b) c) d)
i. ii. iii. iv. v.
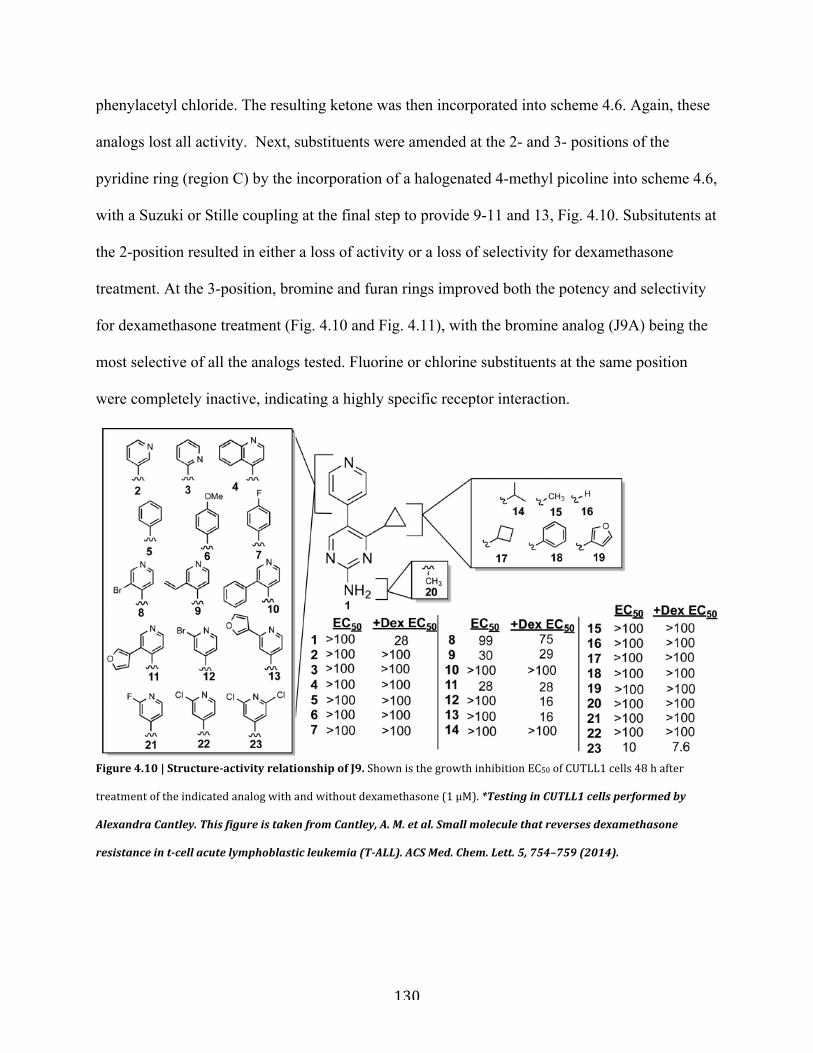
130
phenylacetyl chloride. The resulting ketone was then incorporated into scheme 4.6. Again, these
analogs lost all activity. Next, substituents were amended at the 2- and 3- positions of the
pyridine ring (region C) by the incorporation of a halogenated 4-methyl picoline into scheme 4.6,
with a Suzuki or Stille coupling at the final step to provide 9-11 and 13, Fig. 4.10. Subsitutents at
the 2-position resulted in either a loss of activity or a loss of selectivity for dexamethasone
treatment. At the 3-position, bromine and furan rings improved both the potency and selectivity
for dexamethasone treatment (Fig. 4.10 and Fig. 4.11), with the bromine analog (J9A) being the
most selective of all the analogs tested. Fluorine or chlorine substituents at the same position
were completely inactive, indicating a highly specific receptor interaction.
Figure 4.10 | Structure-‐activity relationship of J9. Shown is the growth inhibition EC50 of CUTLL1 cells 48 h after
treatment of the indicated analog with and without dexamethasone (1 μM). *Testing in CUTLL1 cells performed by
Alexandra Cantley. This figure is taken from Cantley, A. M. et al. Small molecule that reverses dexamethasone
resistance in t-‐cell acute lymphoblastic leukemia (T-‐ALL). ACS Med. Chem. Lett. 5, 754–759 (2014).
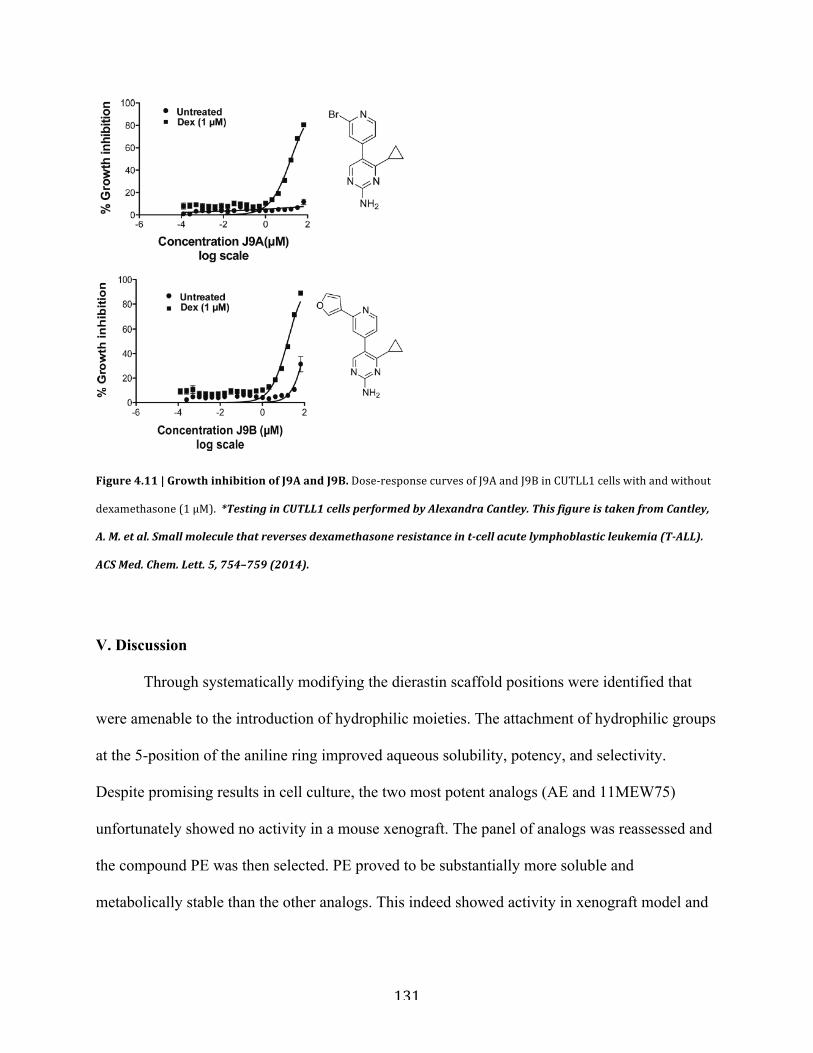
131
Figure 4.11 | Growth inhibition of J9A and J9B. Dose-‐response curves of J9A and J9B in CUTLL1 cells with and without
dexamethasone (1 μM). *Testing in CUTLL1 cells performed by Alexandra Cantley. This figure is taken from Cantley,
A. M. et al. Small molecule that reverses dexamethasone resistance in t-‐cell acute lymphoblastic leukemia (T-‐ALL).
ACS Med. Chem. Lett. 5, 754–759 (2014).
V. Discussion
Through systematically modifying the dierastin scaffold positions were identified that
were amenable to the introduction of hydrophilic moieties. The attachment of hydrophilic groups
at the 5-position of the aniline ring improved aqueous solubility, potency, and selectivity.
Despite promising results in cell culture, the two most potent analogs (AE and 11MEW75)
unfortunately showed no activity in a mouse xenograft. The panel of analogs was reassessed and
the compound PE was then selected. PE proved to be substantially more soluble and
metabolically stable than the other analogs. This indeed showed activity in xenograft model and
132
an upregulation in expression of the ferroptosis marker Ptgs2, highlighting the importance of
ADME property optimization.
J9 proved to be highly sensitive to the majority of the synthetic modifications made,
indicating a very specific target interaction. Introduction of bromine at the 3-position of the
pyridine ring was found to improve both the potency and selectivity. This position was also
found to be highly sensitive, as replacement with other halogens eliminated activity.
Interestingly, a furan ring at this position also improved the potency of the compound, suggesting
perhaps larger substituents would also be tolerated. This could position could be potentially used
as point of attachment for groups to be used for target identification to help understand the
mechanism of action of the glucocorticoid resistance reversal. Identification of this target could
lead to improved T-ALL treatment and prognosis.
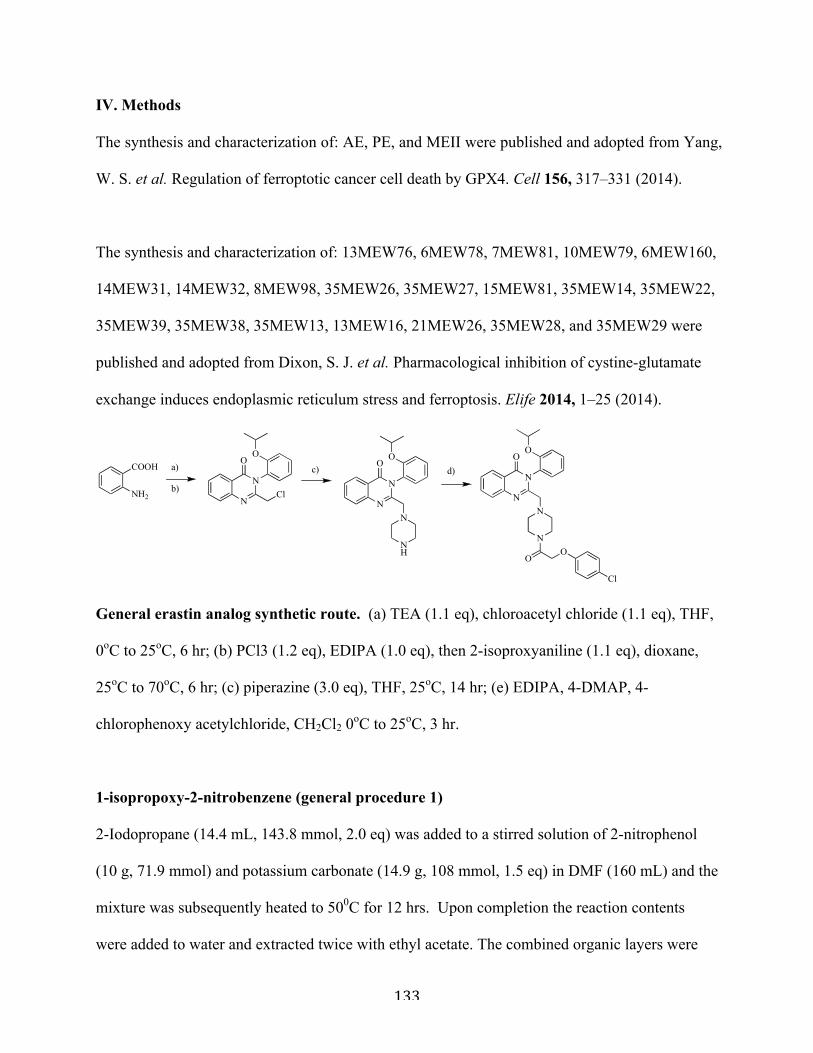
133
IV. Methods
The synthesis and characterization of: AE, PE, and MEII were published and adopted from Yang,
W. S. et al. Regulation of ferroptotic cancer cell death by GPX4. Cell 156, 317–331 (2014).
The synthesis and characterization of: 13MEW76, 6MEW78, 7MEW81, 10MEW79, 6MEW160,
14MEW31, 14MEW32, 8MEW98, 35MEW26, 35MEW27, 15MEW81, 35MEW14, 35MEW22,
35MEW39, 35MEW38, 35MEW13, 13MEW16, 21MEW26, 35MEW28, and 35MEW29 were
published and adopted from Dixon, S. J. et al. Pharmacological inhibition of cystine-glutamate
exchange induces endoplasmic reticulum stress and ferroptosis. Elife 2014, 1–25 (2014).
General erastin analog synthetic route. (a) TEA (1.1 eq), chloroacetyl chloride (1.1 eq), THF,
0oC to 25oC, 6 hr; (b) PCl3 (1.2 eq), EDIPA (1.0 eq), then 2-isoproxyaniline (1.1 eq), dioxane,
25oC to 70oC, 6 hr; (c) piperazine (3.0 eq), THF, 25oC, 14 hr; (e) EDIPA, 4-DMAP, 4-
chlorophenoxy acetylchloride, CH2Cl2 0oC to 25oC, 3 hr.
1-isopropoxy-2-nitrobenzene (general procedure 1)
2-Iodopropane (14.4 mL, 143.8 mmol, 2.0 eq) was added to a stirred solution of 2-nitrophenol
(10 g, 71.9 mmol) and potassium carbonate (14.9 g, 108 mmol, 1.5 eq) in DMF (160 mL) and the
mixture was subsequently heated to 500C for 12 hrs. Upon completion the reaction contents
were added to water and extracted twice with ethyl acetate. The combined organic layers were
N
N
OO
Cl
COOH
NH2N
N
OO
N
a)
b)
c) d)
NH
N
N
N
N
O
Cl
O
OO
134
dried (Na2SO4), concentrated and purified by combiflash 0-20% EtOAc to afford 1-isopropoxy-
2-nitrobenzene (11.7 g, 90% yield). 1H NMR (400 MHz, CDCl3): δ 7.71 p.p.m. (d app, J= 8.4
Hz, 1H), 7.46 (t app, J=8 Hz, 1H), 7.07 (d app, J=8.4 Hz, 1H), 6.97-6.93 (m, 1H), 4.66 (h, J=1.5
Hz, 1H), 1.35-1.33 (m, 6H); 13C NMR (125 MHz): δ 141.0, 133.7, 125.2, 120.0, 116.1, 72.5,
HRMS (m/z): [M+] cald for C9H11NO3 181.19, found 182.08
2-isopropoxyaniline (general procedure 2)
To a solution of 1-isopropoxy-2-nitrobenzene (11.7 g, 64.6 mmol) in methanol (300 mL) Pd/C
(10%) (5% wt, 0.585 g) was added and stirred under hydrogen (1 atm) for 72 hr. Upon
completion the reaction was filtered over celite, concentrated, and purified by combiflash 0-
>30% EtOAc to afford 2-isopropoxyaniline (7.88 g, 81% yield). 1H NMR (400 MHz, CDCl3): δ
6.80-6.79 p.p.m. (m, 2H), 6.78-6.75 (m, 2H), 4.59 (h, 1.5 Hz, 1H), 3.85 (s, 1H), 1.42 (d, J=6 Hz,
2H); 13C NMR (125 MHz): δ 145.4, 137.4, 121.1, 118.4, 115.4, 113.7, 70.6 HRMS (m/z): [M+]
cald for C9H13NO 151.21, found 151.47
Bromo-isopropoxy amine (general procedure 3)
To a solution of 4-bromo-1-isopropoxy-2-nitrobenzene (prepared using general procedure 1,
84%, 17.54 g, 67.4 mmol) in THF (270 mL), HCl (1 M aq, 270 mL, 270 mmol, 4.0 eq), and
stannous chloride (38 g, 282 mmol, 3.0 eq) were added and heated to 500C for 24 hr. Upon
completion the mixture was quenched with saturated aqueous sodium bicarbonate, filtered over
celite and the crude product was extracted twice with ethyl acetate. The combined organic layers
were dried (Na2SO4), concentrated and purified by combiflash 0->30% EtOAc to yield bromo-
isopropoxy amine (9.93 g, 64% yield) 1H NMR (400 MHz, CDCl3): δ 6.82 p.p.m. (d, J=2.4 Hz,
135
1H), 6.77 (dd, J1=8.5 Hz, J2=2.4 Hz, 1H), 6.63 (d, J=8.6 Hz, 1H), 4.46 (hept, J=1.5 Hz, 1H),
1.33 (d, J=6.0, 6H), 13C NMR (125 MHz): δ 114.4, 138.9, 120.6, 117.6, 114.8, 113.2, 71.0
HRMS (m/z): [M+] cald for C9H13NOBr 230.1, found 229.01
2-(2-chloroethanamido)benzoic acid (general procedure 4)
A solution of chloroacetyl chloride (2.09 mL, 26.25 mmol, 1.2 eq) in THF (40 mL) was added
dropwise, over about 1 hr, to a solution of triethyl amine (3.05 mL, 21.9 mmol, 1.0 eq) and
anthranillic acid (3.00 g, 21.9 mmol) in THF (120 mL) at 00C. The mixture was slowly warmed
250C and stirred for an additional 4 hr. Upon completion, the reaction contents were diluted with
EtOAc and washed with 1 M HCl and water. The organic layer was dried (Na2SO4), the solvent
was removed, and the crude solid was triturated with dichloromethane to afford 2-(2-
chloroethanamido)benzoic acid (3.20 g, 68% yield). 1H NMR (400 MHz, C6D6OS): δ 11.81
p.p.m. (s, 1H), 8.53 (d, J=8.4 Hz, 1H), 8.02 (dd, J1= 7.9, J2=1.5 ), 7.63 (m, 1H), 7.21 (m, 1H),
4.45 (s, 2H). 13C NMR (125 MHz): δ 169.8, 165.7, 140.4, 134.6, 131.6, 123.9, 120.3, 117.3,
43.9; HRMS (m/z): [M+] cald for C9H8ClNO3 213.62, found 213.02
2-(chloromethyl)-3-(2-isopropoxyphenyl)quinazolin-4(3H)-one (general procedure 5)
EDIPA (0.326 mL, 1.87 mmol, 1.0 eq) was added to a solution of 2-(2-
chloroethanamido)benzoic acid (0.400 g, 1.87 mmol) at 250C in dioxane (10 mL) and stirred for
2 minutes before the dropwise addition of phosphorous trichloride (0.309 mL, 2.25 mmol, 1.2
eq). After 5 minutes of stirring, O-isopropoxyaniline (0.311 g, 2.06 mmol, 1.1 eq) was added and
the resulting mixture was heated to 700C and stirred for an additional 6 hr. Upon completion the
reaction was carefully quenched with saturated aqueous NaHCO3, diluted with water, and
136
extracted 3 times with EtOAc. The combined organic layers were dried (Na2SO4), concentrated,
and the crude material was purified by combi flash 0->50% EtOAc in hexanes to provide 2-
(chloromethyl)-3-(2-isopropoxyphenyl)quinazolin-4(3H)-one (333 mg, 54% yield). 1H NMR
(400 MHz, CDCl3): δ 8.32 p.p.m. (m, 1H), 7.89 (m, 1H), 7.54 (m, 1H), 7.38 (dd, J1=7.7, J2=1.6,
1H), 7.11 (m, 1H), 4.58 (hept, J= 1.5 Hz, 1H), 4.38 (d, J=12 Hz, 1H), 4.19 (d, J=12 Hz, 1H),
1.26 (d, J=6.1, 3H), 1.17 (d, J=6.1, 1H), 13C NMR (125 MHz): δ 161.6, 153.0, 152.4, 147.2,
134.5, 131.1, 130.8, 127.6, 127.5, 127.3, 125.3, 121.4, 121.0, 114.3, 71.2, 43.7, 22.2, 21.8;
HRMS (m/z): [M+] cald for C18H17ClN2O2 328.79, found 329.1
3-(2-isopropoxyphenyl)-2-(piperazin-1-ylmethyl)quinazolin-4(3H)-one (general procedure
6)
Piperazine (263 mg, 3.06 mmol, 3.0 eq) was added to a solution of 2-(chloromethyl)-3-(2-
isopropoxyphenyl)quinazolin-4(3H)-one (0.335 g, 1.01 mmol) in THF (5 mL) and the resulting
mixture was stirred at 250C for an additional 14 hr. The reaction mixture was then concentrated
and purified directly by combiflash 0->20% MeOH in DCM to provide 3-(2-isopropoxyphenyl)-
2-(piperazin-1-ylmethyl)quinazolin-4(3H)-one (0.301 g, 77% yield). 1H NMR (400 MHz,
CDCl3): δ 8.30 p.p.m. (m, 1H), 7.78 (m, 2H), 7.49 (m, 1H), 7.42 (m, 1H), 7.30 (m, 1H), 7.07 (m,
2H), 4.56 (h, J=1.5 Hz, 1H), 3.26 (s, 1H), 2.85 (m, 3 H), 2.65 (s, 3H), 2.52 (m, 2H), 2.37 (m,
1H), 2.23 (m, 2H). 13C NMR (125 MHz): δ 162.1, 153.7, 153.0, 147.2, 134.2, 132.1, 131.1,
130.9, 130.4, 127.4, 127.1, 126.8, 126.4, 121.3, 120.5, 120.4, 114.3, 71.1, 71.0, 61.5, 53.3, 51.3,
45.3, 22.2, 21.8; HRMS (m/z): [M+] cald for C22H26N4O2 378.47; found, 379.21
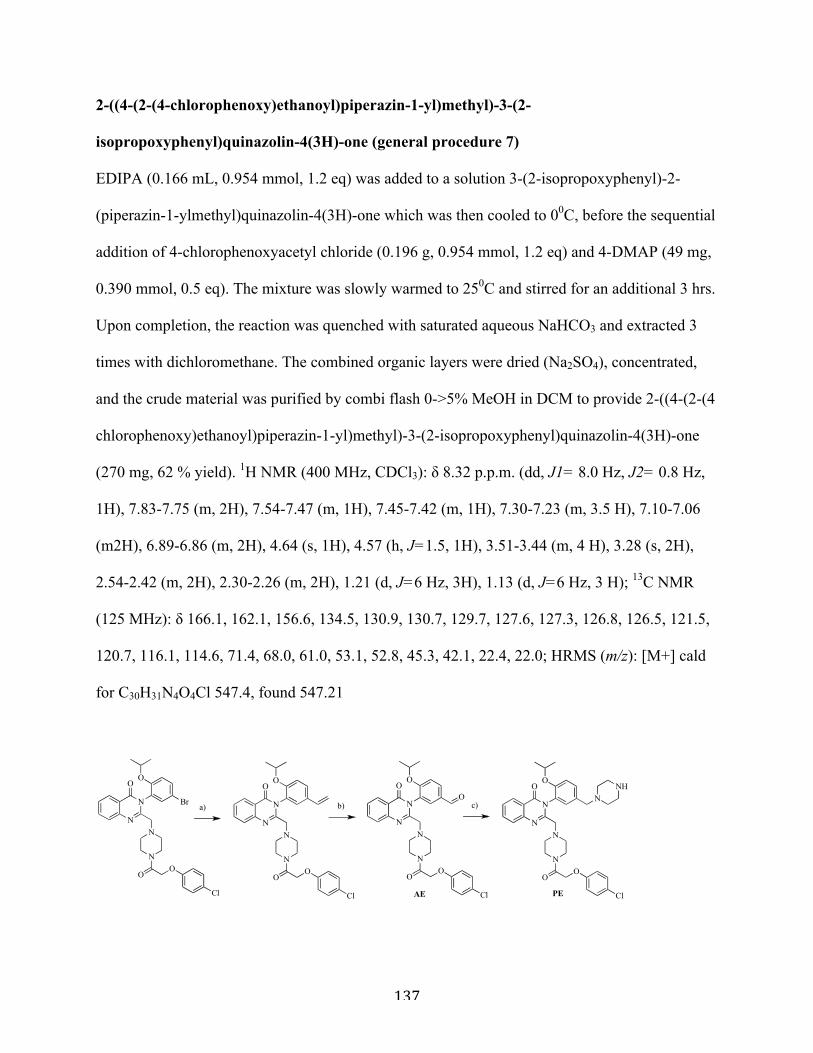
137
2-((4-(2-(4-chlorophenoxy)ethanoyl)piperazin-1-yl)methyl)-3-(2-
isopropoxyphenyl)quinazolin-4(3H)-one (general procedure 7)
EDIPA (0.166 mL, 0.954 mmol, 1.2 eq) was added to a solution 3-(2-isopropoxyphenyl)-2-
(piperazin-1-ylmethyl)quinazolin-4(3H)-one which was then cooled to 00C, before the sequential
addition of 4-chlorophenoxyacetyl chloride (0.196 g, 0.954 mmol, 1.2 eq) and 4-DMAP (49 mg,
0.390 mmol, 0.5 eq). The mixture was slowly warmed to 250C and stirred for an additional 3 hrs.
Upon completion, the reaction was quenched with saturated aqueous NaHCO3 and extracted 3
times with dichloromethane. The combined organic layers were dried (Na2SO4), concentrated,
and the crude material was purified by combi flash 0->5% MeOH in DCM to provide 2-((4-(2-(4
chlorophenoxy)ethanoyl)piperazin-1-yl)methyl)-3-(2-isopropoxyphenyl)quinazolin-4(3H)-one
(270 mg, 62 % yield). 1H NMR (400 MHz, CDCl3): δ 8.32 p.p.m. (dd, J1= 8.0 Hz, J2= 0.8 Hz,
1H), 7.83-7.75 (m, 2H), 7.54-7.47 (m, 1H), 7.45-7.42 (m, 1H), 7.30-7.23 (m, 3.5 H), 7.10-7.06
(m2H), 6.89-6.86 (m, 2H), 4.64 (s, 1H), 4.57 (h, J=1.5, 1H), 3.51-3.44 (m, 4 H), 3.28 (s, 2H),
2.54-2.42 (m, 2H), 2.30-2.26 (m, 2H), 1.21 (d, J=6 Hz, 3H), 1.13 (d, J=6 Hz, 3 H); 13C NMR
(125 MHz): δ 166.1, 162.1, 156.6, 134.5, 130.9, 130.7, 129.7, 127.6, 127.3, 126.8, 126.5, 121.5,
120.7, 116.1, 114.6, 71.4, 68.0, 61.0, 53.1, 52.8, 45.3, 42.1, 22.4, 22.0; HRMS (m/z): [M+] cald
for C30H31N4O4Cl 547.4, found 547.21
N
N
N
N
O
Cl
O
OO
N
N
N
N
O
Cl
O
OO
O
N
N
N
N
O
Cl
O
OO
N
NH
N
N
N
N
O
Cl
O
OO
Bra) b) c)
AE PE
138
AE and PE synthesis. (a) tributylvinyl tin (1.5 eq), PdCl2(PPh3)2 (5%), dioxane, 70oC; (c)
piperazine (6.0 eq), ZnCl2 (0.1 eq), 1,2-dichloroethane, 25oC, 3 hr, then NaBH3CN in MeOH,
40oC, 4 hr.
2-((4-(2-(4-chlorophenoxy)ethanoyl)piperazin-1-yl)methyl)-3-(2-isopropoxy-5-
vinylphenyl)quinazolin-4(3H)-one
To a degassed solution of 3-(5-bromo-2-isopropoxyphenyl)-2-((4-(2-(4-
chlorophenoxy)ethanoyl)piperazin-1-yl)methyl)quinazolin-4(3H)-one (Synthesized using the
procedures described in scheme 2 using bromo-isopropoxy amine), (6.67 g, 10.8 mmol) in
dioxane (100 mmol) PdCl2(PPh3)2 (5%, 0.378 g, 0.539 mmol) was added and the resulting
mixture was stirred for 10 min before the addition of tributylvinyl tin (4.73 mL, 16.2 mmol, 1.5
eq). The reaction was heated to 700C and stirred for 24 hr, cooled to room temp and a solution of
KF (2 M, 16.2 mmol, 8.1 mL, 1.5 eq) was added and then stirred for an additional 12 hr. Upon
completion the reaction was filtered and filtrate was diluted with saturated aqueous NaHCO3 and
extracted 3 times with EtOAc. The combined organic layers were dried (Na2SO4), concentrated,
and the crude material was purified by combi flash 0->5% DCM in methanol to provide 2-((4-(2-
(4-chlorophenoxy)ethanoyl)piperazin-1-yl)methyl)-3-(2-isopropoxy-5-vinylphenyl)quinazolin-
4(3H)-one (4.47g, 72% yield). 1H NMR (400 MHz, CDCl3): δ 8.25 p.p.m. (d, J=2.0 Hz, 1H),
7.86 (dd, J1= 8.5 Hz, J2= 3.0 Hz, 1H), 7.68 (d, J=8.5, 1H), 7.38 (dd, J1= 8.4 Hz, J2= 2 Hz,
1H), 7.22 (m, 3 H), 7.00 (d, J= 8.6 Hz, 1 H), 6.85 (d, J=4.8 Hz, 2H), 6.81 (d, J=11 Hz, 1H), 5.88
(d, 17.5 Hz, 1H), 5.36 (d, 11 Hz, 1H)4.62 (s, 2H), 4.52 (m, 1H), 3.70 (m, 4.5 H), 3.49 (m, 7H),
2.46 (m, 7 H) 2.32 (m, 1H), 2.22 (m, 1H), 1.21 (d, J=6 Hz, 3H), 1.13 (d, J=6 Hz, 3 H). 13C NMR
(125 MHz): δ 166.0, 161.9, 156.4, 153.1, 152.2, 146.7, 136.4, 135.7, 131.8, 131.0, 130.9, 130.3,
139
129.5, 127.7, 126.7, 126.2, 124.7, 121.3, 115.9, 115.5, 114.3, 112.4, 71.4, 67.9, 67.0, 62.4, 60.8,
53.6, 52.9, 52.7, 45.2, 42.0, 22.3, 21.8; HRMS (m/z): [M+] cald for C32H33ClN4O4 573.08;
found, 573.27
3-(2-((4-(2-(4-chlorophenoxy)ethanoyl)piperazin-1-yl)methyl)-4-oxoquinazolin-3(4H)-yl)-4-
isopropoxybenzaldehyde (AE)
To a solution of 2-((4-(2-(4-chlorophenoxy)ethanoyl)piperazin-1-yl)methyl)-3-(2-isopropoxy-5-
vinylphenyl)quinazolin-4(3H)-one (0.625 g, 1.09 mmol) in dioxane:water (3:1, 20 mL) OsO4
(3%, 0.0327 mmol) was added dropwise and the mixture was stirred for 10 min before the
addition of NaIO4 (0.332 g, 2.18 mmol, 2.0 eq) in several portions over 30 min. The reaction
was stirred for 24 hr and then diluted with saturated aqueous NaHCO3 and extracted 3 times
with EtOAc. The combined organic layers were dried (Na2SO4), concentrated, and the crude
material was purified by combi flash 0->5% DCM in methanol to provide 3-(2-((4-(2-(4-
chlorophenoxy)ethanoyl)piperazin-1-yl)methyl)-4-oxoquinazolin-3(4H)-yl)-4-
isopropoxybenzaldehyde (0.4 g, 64% yield). 1H NMR (400 MHz, CDCl3): δ 9.92 p.p.m. (s, 1H),
8.28 (dd, J1=7.9, J2=1.0 Hz, 1H), 7.96 (dd, J1=8.6, J2=2.0 Hz, 2H), 7.89 (m, 1H), 7.80 (m,
1H), 7.78 (m, 1H), 7.51 (m, 1H) 7.22 (m, 3H), 7.16 (d, J= 8.4, 1H), 6.84 (d, J=8.4, 2H), 4.69 (m,
1H), 4.60 (s, 2H), 3.69 (s, 4H), 3.58 (s, 1H), 3.42 (s, 4H), 2.22 (m, 2H), 2.42 (m, 2H), 2.145 (m,
2H), 1.26 (d, J=6, 3H), 1.22 (d, J=6, 3H), 13C NMR (125 MHz): δ 189.6, 165.9, 161.7, 158.4,
156.4, 152.6, 146.9, 134.6, 133.3, 133.2, 131.9, 129.7, 129.5, 129.4, 127.5, 127.3, 127.1, 127,
126.7, 121.1, 115.9, 121.0, 115.9, 113.5, 72.8, 72.2, 67.8, 67.1, 61.1, 52.9, 52.5, 45.11, 41.9
HRMS (m/z): [M+] cald for C31H31ClN4O5; found, 575.20
140
2-((4-(2-(4-chlorophenoxy)ethanoyl)piperazin-1-yl)methyl)-3-(2-isopropoxy-5-(piperazin-1-
ylmethyl)phenyl)quinazolin-4(3H)-one (15MEW33, PE)
To a solution of 3-(2-((4-(2-(4-chlorophenoxy)ethanoyl)piperazin-1-yl)methyl)-4-oxoquinazolin-
3(4H)-yl)-4-isopropoxybenzaldehyde (70 mg, 0.122 mmol) in 1,2-dichloroethane (1 mL) and
molecular sieves (50 mg), zinc chloride (0.1 eq, 1.7 mg 0.0122 mmol) and piperazine (63 mg,
0.732 mmol 6.0 eq) were added sequentially. The resulting mixture was stirred at room temp for
3 hr before the addition of a solution of sodium cyanoborohydride (16 mg, 0.244 mmol, 2.0 eq)
in methanol (0.5 mL) which was stirred for an additional 1 hr at 250C before being heated to
400C for 3 hr. Upon completion the reaction was filtered, concentrated and purified directly by
combiflash 0->20% MeOH in DCM to provide 2-((4-(2-(4-chlorophenoxy)ethanoyl)piperazin-1-
yl)methyl)-3-(2-isopropoxy-5-(piperazin-1-ylmethyl)phenyl)quinazolin-4(3H)-one (36 mg, 46%
yield). 1H NMR (400 MHz, CDCl3): δ 8.25 p.p.m. (d, J= 8.0 Hz, 1H), 7.76 (m, 2H), 7.49 (m
1H), 7.35 (m, 1H), 7.22 (m, 3H), 7.03 (d, J=8.4 Hz, 2H), 4.68 (s, 2H), 4.54 (m, 1H), 3.59 (m,
3H), 3.44 (m, 3H), 3.27 (s, 2 H), 3.12 (m, 5 H), 2.62 (m, 6 H) 2.36 (s, 3H), 2.25 (s, 1H), 1.21 (d,
J=6 Hz, 3H), 1.13 (d, J=6 Hz, 3 H), 13C NMR (125 MHz): δ 162.2, 156.4, 153.1, 152.3, 147.1,
134.5, 131.2, 131.1, 129.6, 128.9, 127.5, 127.1, 127.0, 126.0, 121.1, 116.3, 114.4, 77.2, 71.3,
67.4, 61.3, 60.8, 52.7, 49.5, 44.9, 44.2, 42.1, 22.2, 21.8; HRMS (m/z): [M+] cald for
C35H41ClN6O4 645.19; found, 645.29
2-((4-(2-(4-chlorophenoxy)ethanoyl)piperazin-1-yl)methyl)-3-(2-isopropoxy-5-
(morpholinomethyl)phenyl)quinazolin-4(3H)-one (11MEW75, MEII)
Prepared from AE according to the procedure described for PE, 50% yield. 1H NMR (400 MHz,
CDCl3): δ 8.28 p.p.m. (dd, J1= 8 Hz, J2= 1 Hz, 1H), 7.77 (m, 2H) 7.49 (m, 1H), 7.38 (dd, J1=
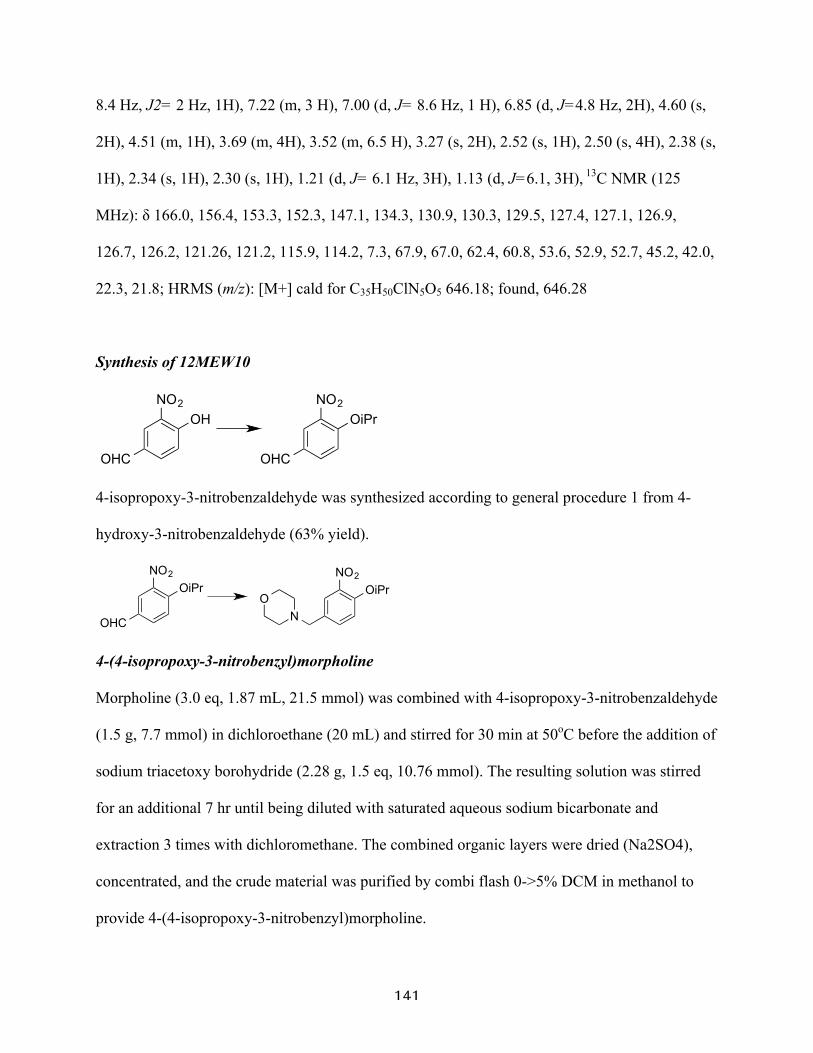
141
8.4 Hz, J2= 2 Hz, 1H), 7.22 (m, 3 H), 7.00 (d, J= 8.6 Hz, 1 H), 6.85 (d, J=4.8 Hz, 2H), 4.60 (s,
2H), 4.51 (m, 1H), 3.69 (m, 4H), 3.52 (m, 6.5 H), 3.27 (s, 2H), 2.52 (s, 1H), 2.50 (s, 4H), 2.38 (s,
1H), 2.34 (s, 1H), 2.30 (s, 1H), 1.21 (d, J= 6.1 Hz, 3H), 1.13 (d, J=6.1, 3H), 13C NMR (125
MHz): δ 166.0, 156.4, 153.3, 152.3, 147.1, 134.3, 130.9, 130.3, 129.5, 127.4, 127.1, 126.9,
126.7, 126.2, 121.26, 121.2, 115.9, 114.2, 7.3, 67.9, 67.0, 62.4, 60.8, 53.6, 52.9, 52.7, 45.2, 42.0,
22.3, 21.8; HRMS (m/z): [M+] cald for C35H50ClN5O5 646.18; found, 646.28
Synthesis of 12MEW10
4-isopropoxy-3-nitrobenzaldehyde was synthesized according to general procedure 1 from 4-
hydroxy-3-nitrobenzaldehyde (63% yield).
4-(4-isopropoxy-3-nitrobenzyl)morpholine
Morpholine (3.0 eq, 1.87 mL, 21.5 mmol) was combined with 4-isopropoxy-3-nitrobenzaldehyde
(1.5 g, 7.7 mmol) in dichloroethane (20 mL) and stirred for 30 min at 50oC before the addition of
sodium triacetoxy borohydride (2.28 g, 1.5 eq, 10.76 mmol). The resulting solution was stirred
for an additional 7 hr until being diluted with saturated aqueous sodium bicarbonate and
extraction 3 times with dichloromethane. The combined organic layers were dried (Na2SO4),
concentrated, and the crude material was purified by combi flash 0->5% DCM in methanol to
provide 4-(4-isopropoxy-3-nitrobenzyl)morpholine.
NO2OiPr
OHC
NO2OH
OHC
NO2OiPr
OHC
NO2OiPr
NO
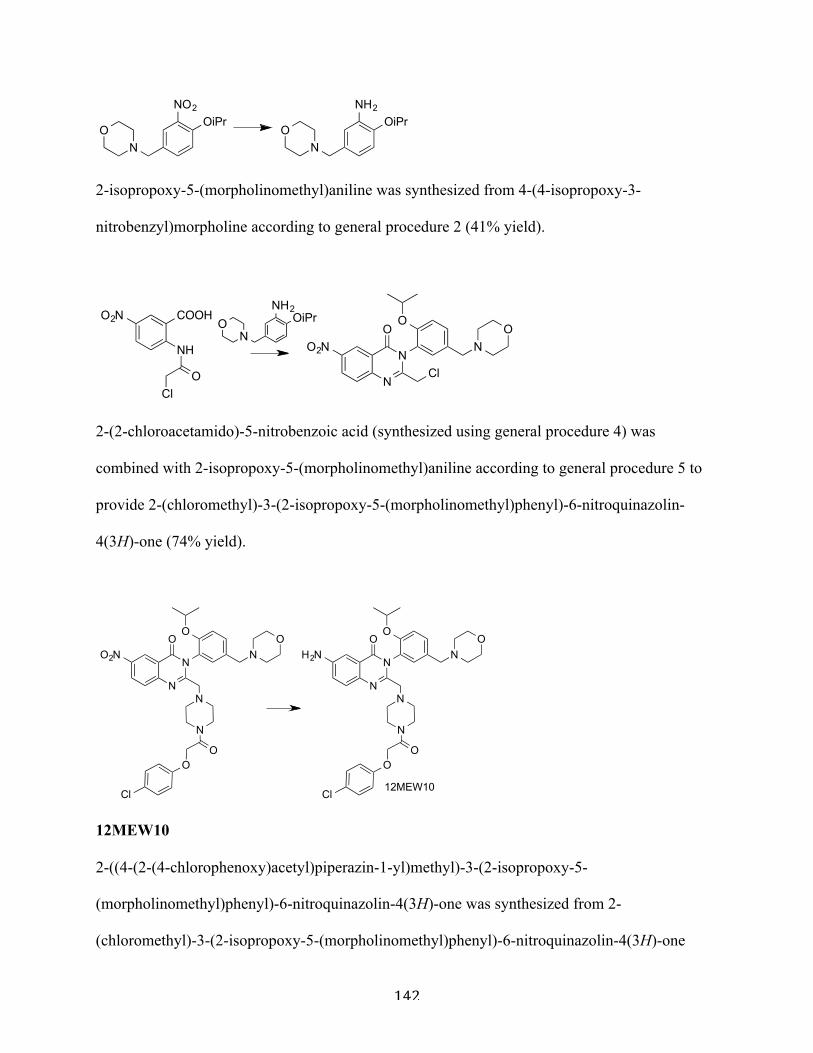
142
2-isopropoxy-5-(morpholinomethyl)aniline was synthesized from 4-(4-isopropoxy-3-
nitrobenzyl)morpholine according to general procedure 2 (41% yield).
2-(2-chloroacetamido)-5-nitrobenzoic acid (synthesized using general procedure 4) was
combined with 2-isopropoxy-5-(morpholinomethyl)aniline according to general procedure 5 to
provide 2-(chloromethyl)-3-(2-isopropoxy-5-(morpholinomethyl)phenyl)-6-nitroquinazolin-
4(3H)-one (74% yield).
12MEW10
2-((4-(2-(4-chlorophenoxy)acetyl)piperazin-1-yl)methyl)-3-(2-isopropoxy-5-
(morpholinomethyl)phenyl)-6-nitroquinazolin-4(3H)-one was synthesized from 2-
(chloromethyl)-3-(2-isopropoxy-5-(morpholinomethyl)phenyl)-6-nitroquinazolin-4(3H)-one
NO2OiPr
NO
NH2OiPr
NO
NH2OiPr
NO
COOH
NH
OCl
O2N
N
N
O
Cl
O
NO
O2N
N
OO
Cl
N
N
N
OO
NO
O2N
N
OO
Cl
N
N
N
OO
NO
H2N
12MEW10
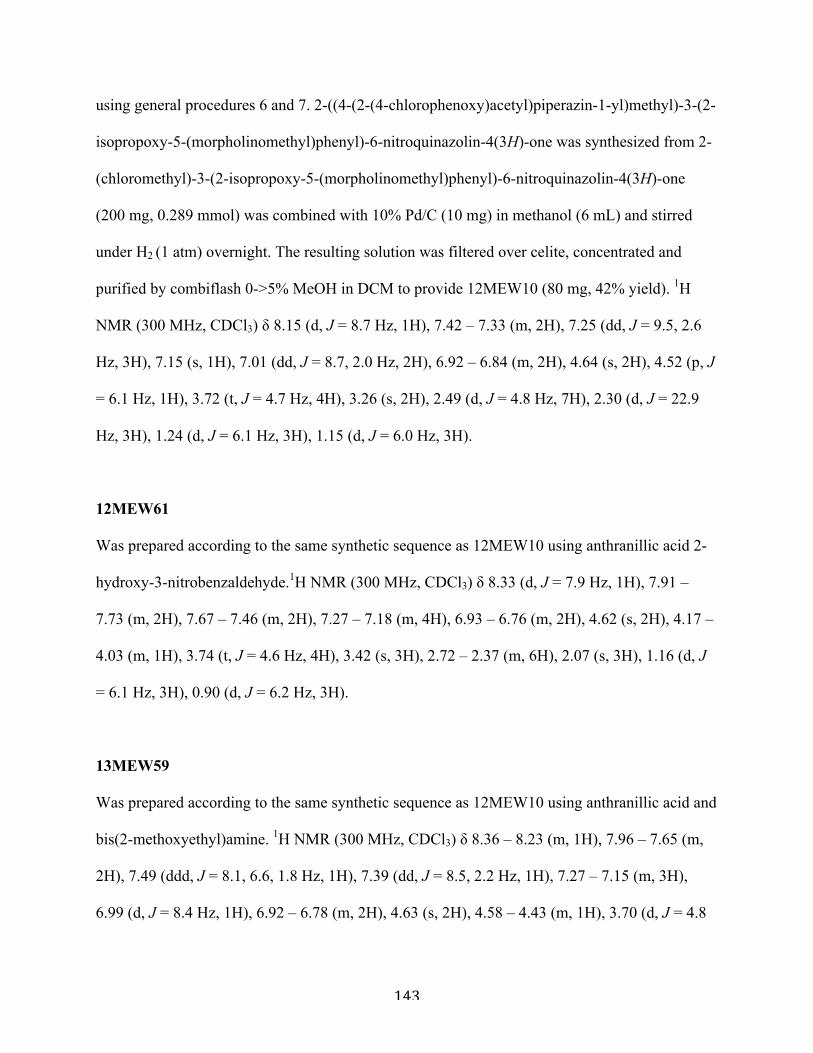
143
using general procedures 6 and 7. 2-((4-(2-(4-chlorophenoxy)acetyl)piperazin-1-yl)methyl)-3-(2-
isopropoxy-5-(morpholinomethyl)phenyl)-6-nitroquinazolin-4(3H)-one was synthesized from 2-
(chloromethyl)-3-(2-isopropoxy-5-(morpholinomethyl)phenyl)-6-nitroquinazolin-4(3H)-one
(200 mg, 0.289 mmol) was combined with 10% Pd/C (10 mg) in methanol (6 mL) and stirred
under H2 (1 atm) overnight. The resulting solution was filtered over celite, concentrated and
purified by combiflash 0->5% MeOH in DCM to provide 12MEW10 (80 mg, 42% yield). 1H
NMR (300 MHz, CDCl3) δ 8.15 (d, J = 8.7 Hz, 1H), 7.42 – 7.33 (m, 2H), 7.25 (dd, J = 9.5, 2.6
Hz, 3H), 7.15 (s, 1H), 7.01 (dd, J = 8.7, 2.0 Hz, 2H), 6.92 – 6.84 (m, 2H), 4.64 (s, 2H), 4.52 (p, J
= 6.1 Hz, 1H), 3.72 (t, J = 4.7 Hz, 4H), 3.26 (s, 2H), 2.49 (d, J = 4.8 Hz, 7H), 2.30 (d, J = 22.9
Hz, 3H), 1.24 (d, J = 6.1 Hz, 3H), 1.15 (d, J = 6.0 Hz, 3H).
12MEW61
Was prepared according to the same synthetic sequence as 12MEW10 using anthranillic acid 2-
hydroxy-3-nitrobenzaldehyde.1H NMR (300 MHz, CDCl3) δ 8.33 (d, J = 7.9 Hz, 1H), 7.91 –
7.73 (m, 2H), 7.67 – 7.46 (m, 2H), 7.27 – 7.18 (m, 4H), 6.93 – 6.76 (m, 2H), 4.62 (s, 2H), 4.17 –
4.03 (m, 1H), 3.74 (t, J = 4.6 Hz, 4H), 3.42 (s, 3H), 2.72 – 2.37 (m, 6H), 2.07 (s, 3H), 1.16 (d, J
= 6.1 Hz, 3H), 0.90 (d, J = 6.2 Hz, 3H).
13MEW59
Was prepared according to the same synthetic sequence as 12MEW10 using anthranillic acid and
bis(2-methoxyethyl)amine. 1H NMR (300 MHz, CDCl3) δ 8.36 – 8.23 (m, 1H), 7.96 – 7.65 (m,
2H), 7.49 (ddd, J = 8.1, 6.6, 1.8 Hz, 1H), 7.39 (dd, J = 8.5, 2.2 Hz, 1H), 7.27 – 7.15 (m, 3H),
6.99 (d, J = 8.4 Hz, 1H), 6.92 – 6.78 (m, 2H), 4.63 (s, 2H), 4.58 – 4.43 (m, 1H), 3.70 (d, J = 4.8
144
Hz, 2H), 3.31 (d, J = 1.5 Hz, 8H), 2.75 (td, J = 5.9, 1.5 Hz, 4H), 2.39 (ddt, J = 26.7, 20.4, 5.4 Hz,
4H), 1.22 (d, J = 6.1 Hz, 3H), 1.14 (d, J = 6.0 Hz, 3H).
13MEW31
Was prepared according to the same synthetic sequence as piperazine erastin using 3-
(methylamino)propanenitrile.1H NMR (300 MHz, CDCl3) δ 8.30 (dd, J = 8.0, 1.4 Hz, 1H), 7.94
– 7.71 (m, 2H), 7.60 – 7.35 (m, 2H), 7.27 – 7.16 (m, 2H), 7.03 (d, J = 8.6 Hz, 1H), 6.99 – 6.80
(m, 2H), 4.65 (s, 2H), 4.60 – 4.47 (m, 1H), 3.31 (s, 2H), 2.76 (td, J = 6.6, 3.4 Hz, 2H), 2.61 –
2.20 (m, 9H), 1.24 (d, J = 6.0 Hz, 3H), 1.15 (d, J = 6.0 Hz, 3H).
14MEW77
Was prepared using the same sequence as piperazine erastin using 1-methylpiperazine. 1H NMR
(300 MHz, CDCl3) δ 8.30 (d, J = 7.1 Hz, 1H), 7.89 – 7.69 (m, 2H), 7.51 (t, J = 7.4 Hz, 1H), 7.42
– 7.33 (m, 1H), 7.26 – 7.20 (m, 3H), 7.01 (d, J = 8.6 Hz, 1H), 6.94 – 6.80 (m, 2H), 4.65 (s, 2H),
4.53 (p, J = 6.0 Hz, 1H), 3.67 – 3.41 (m, 8H), 3.29 (s, 2H), 2.48 (d, J = 21.6 Hz, 10H), 1.23 (d, J
= 6.0 Hz, 3H), 1.15 (d, J = 6.0 Hz, 3H).
12MEW12
Was prepared according to the same synthetic sequence as 12MEW10 using anthranillic acid and
bis(2-methoxyethyl)amine.1H NMR (300 MHz, CDCl3) δ 8.29 (ddd, J = 8.0, 1.5, 0.7 Hz, 1H),
7.90 – 7.65 (m, 2H), 7.49 (ddd, J = 8.1, 6.6, 1.7 Hz, 1H), 7.37 (dd, J = 8.5, 2.2 Hz, 1H), 7.27 –
7.17 (m, 3H), 6.99 (d, J = 8.5 Hz, 1H), 6.90 – 6.81 (m, 2H), 4.63 (s, 2H), 4.59 – 4.45 (m, 1H),
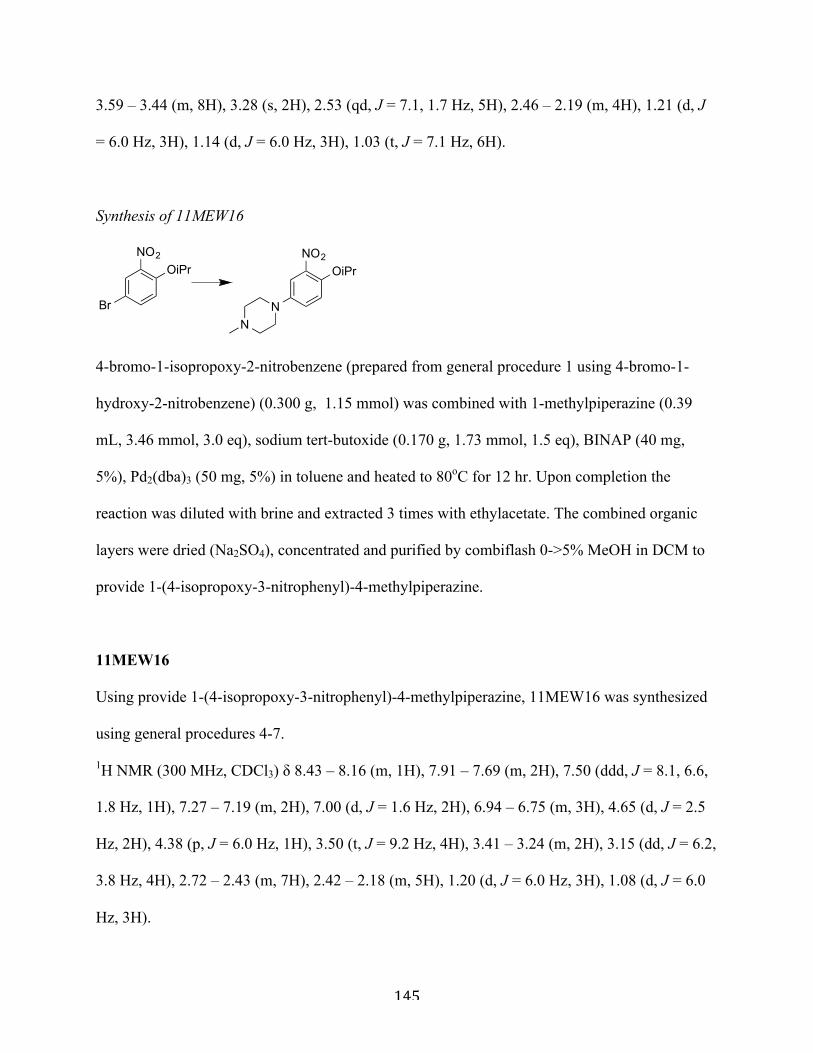
145
3.59 – 3.44 (m, 8H), 3.28 (s, 2H), 2.53 (qd, J = 7.1, 1.7 Hz, 5H), 2.46 – 2.19 (m, 4H), 1.21 (d, J
= 6.0 Hz, 3H), 1.14 (d, J = 6.0 Hz, 3H), 1.03 (t, J = 7.1 Hz, 6H).
Synthesis of 11MEW16
4-bromo-1-isopropoxy-2-nitrobenzene (prepared from general procedure 1 using 4-bromo-1-
hydroxy-2-nitrobenzene) (0.300 g, 1.15 mmol) was combined with 1-methylpiperazine (0.39
mL, 3.46 mmol, 3.0 eq), sodium tert-butoxide (0.170 g, 1.73 mmol, 1.5 eq), BINAP (40 mg,
5%), Pd2(dba)3 (50 mg, 5%) in toluene and heated to 80oC for 12 hr. Upon completion the
reaction was diluted with brine and extracted 3 times with ethylacetate. The combined organic
layers were dried (Na2SO4), concentrated and purified by combiflash 0->5% MeOH in DCM to
provide 1-(4-isopropoxy-3-nitrophenyl)-4-methylpiperazine.
11MEW16
Using provide 1-(4-isopropoxy-3-nitrophenyl)-4-methylpiperazine, 11MEW16 was synthesized
using general procedures 4-7.
1H NMR (300 MHz, CDCl3) δ 8.43 – 8.16 (m, 1H), 7.91 – 7.69 (m, 2H), 7.50 (ddd, J = 8.1, 6.6,
1.8 Hz, 1H), 7.27 – 7.19 (m, 2H), 7.00 (d, J = 1.6 Hz, 2H), 6.94 – 6.75 (m, 3H), 4.65 (d, J = 2.5
Hz, 2H), 4.38 (p, J = 6.0 Hz, 1H), 3.50 (t, J = 9.2 Hz, 4H), 3.41 – 3.24 (m, 2H), 3.15 (dd, J = 6.2,
3.8 Hz, 4H), 2.72 – 2.43 (m, 7H), 2.42 – 2.18 (m, 5H), 1.20 (d, J = 6.0 Hz, 3H), 1.08 (d, J = 6.0
Hz, 3H).
NO2OiPr
Br
NO2OiPr
NN
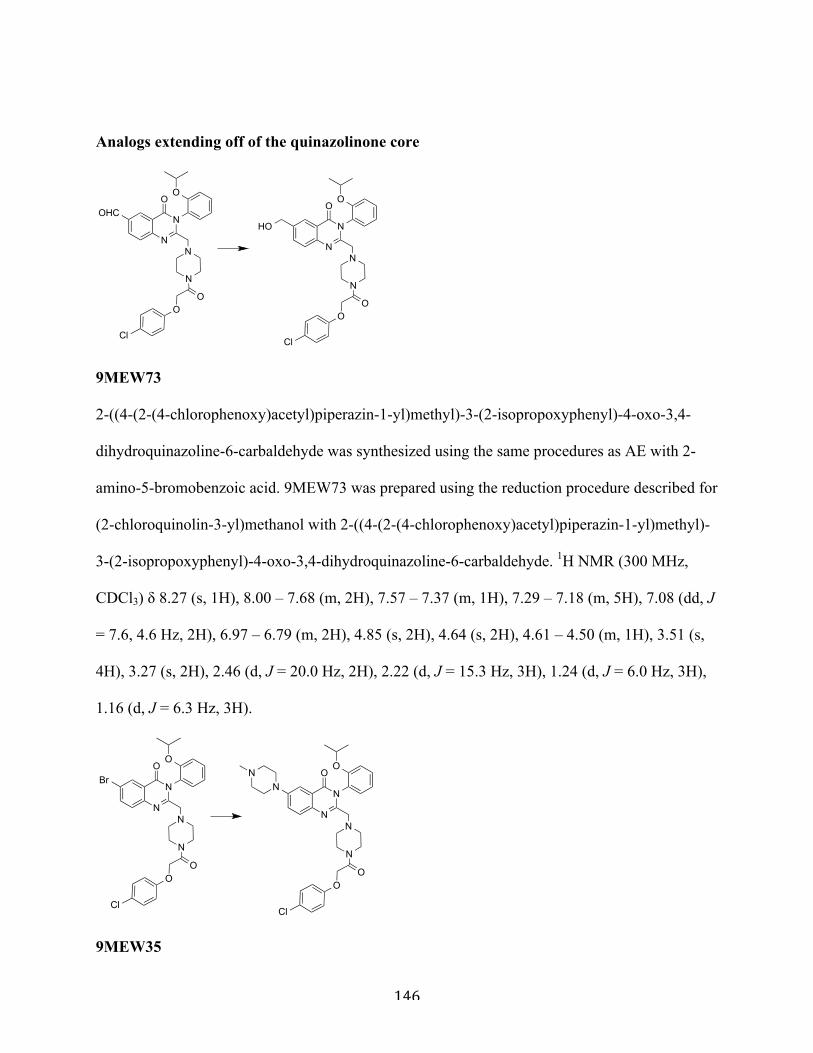
146
Analogs extending off of the quinazolinone core
9MEW73
2-((4-(2-(4-chlorophenoxy)acetyl)piperazin-1-yl)methyl)-3-(2-isopropoxyphenyl)-4-oxo-3,4-
dihydroquinazoline-6-carbaldehyde was synthesized using the same procedures as AE with 2-
amino-5-bromobenzoic acid. 9MEW73 was prepared using the reduction procedure described for
(2-chloroquinolin-3-yl)methanol with 2-((4-(2-(4-chlorophenoxy)acetyl)piperazin-1-yl)methyl)-
3-(2-isopropoxyphenyl)-4-oxo-3,4-dihydroquinazoline-6-carbaldehyde. 1H NMR (300 MHz,
CDCl3) δ 8.27 (s, 1H), 8.00 – 7.68 (m, 2H), 7.57 – 7.37 (m, 1H), 7.29 – 7.18 (m, 5H), 7.08 (dd, J
= 7.6, 4.6 Hz, 2H), 6.97 – 6.79 (m, 2H), 4.85 (s, 2H), 4.64 (s, 2H), 4.61 – 4.50 (m, 1H), 3.51 (s,
4H), 3.27 (s, 2H), 2.46 (d, J = 20.0 Hz, 2H), 2.22 (d, J = 15.3 Hz, 3H), 1.24 (d, J = 6.0 Hz, 3H),
1.16 (d, J = 6.3 Hz, 3H).
9MEW35
N
OO
Cl
N
N
N
OO
N
OO
Cl
N
N
N
OO
OHCHO
N
OO
Cl
N
N
N
OO
N
OO
Cl
N
N
N
OO
NBr
N
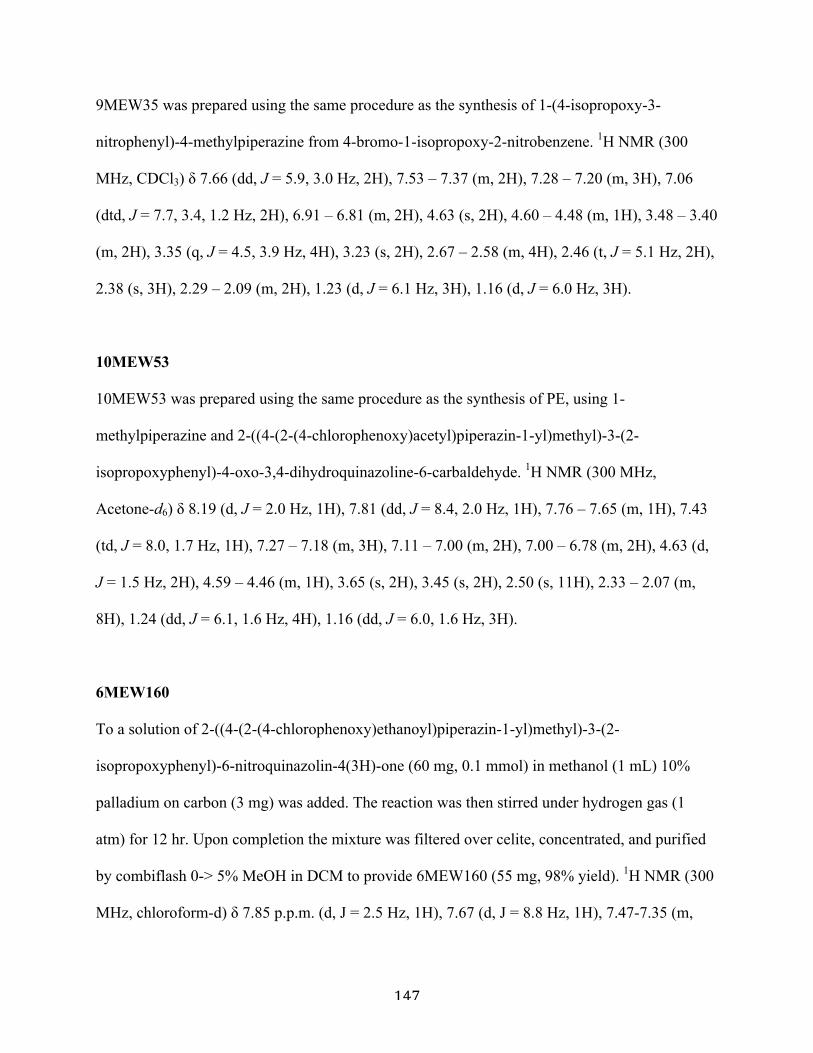
147
9MEW35 was prepared using the same procedure as the synthesis of 1-(4-isopropoxy-3-
nitrophenyl)-4-methylpiperazine from 4-bromo-1-isopropoxy-2-nitrobenzene. 1H NMR (300
MHz, CDCl3) δ 7.66 (dd, J = 5.9, 3.0 Hz, 2H), 7.53 – 7.37 (m, 2H), 7.28 – 7.20 (m, 3H), 7.06
(dtd, J = 7.7, 3.4, 1.2 Hz, 2H), 6.91 – 6.81 (m, 2H), 4.63 (s, 2H), 4.60 – 4.48 (m, 1H), 3.48 – 3.40
(m, 2H), 3.35 (q, J = 4.5, 3.9 Hz, 4H), 3.23 (s, 2H), 2.67 – 2.58 (m, 4H), 2.46 (t, J = 5.1 Hz, 2H),
2.38 (s, 3H), 2.29 – 2.09 (m, 2H), 1.23 (d, J = 6.1 Hz, 3H), 1.16 (d, J = 6.0 Hz, 3H).
10MEW53
10MEW53 was prepared using the same procedure as the synthesis of PE, using 1-
methylpiperazine and 2-((4-(2-(4-chlorophenoxy)acetyl)piperazin-1-yl)methyl)-3-(2-
isopropoxyphenyl)-4-oxo-3,4-dihydroquinazoline-6-carbaldehyde. 1H NMR (300 MHz,
Acetone-d6) δ 8.19 (d, J = 2.0 Hz, 1H), 7.81 (dd, J = 8.4, 2.0 Hz, 1H), 7.76 – 7.65 (m, 1H), 7.43
(td, J = 8.0, 1.7 Hz, 1H), 7.27 – 7.18 (m, 3H), 7.11 – 7.00 (m, 2H), 7.00 – 6.78 (m, 2H), 4.63 (d,
J = 1.5 Hz, 2H), 4.59 – 4.46 (m, 1H), 3.65 (s, 2H), 3.45 (s, 2H), 2.50 (s, 11H), 2.33 – 2.07 (m,
8H), 1.24 (dd, J = 6.1, 1.6 Hz, 4H), 1.16 (dd, J = 6.0, 1.6 Hz, 3H).
6MEW160
To a solution of 2-((4-(2-(4-chlorophenoxy)ethanoyl)piperazin-1-yl)methyl)-3-(2-
isopropoxyphenyl)-6-nitroquinazolin-4(3H)-one (60 mg, 0.1 mmol) in methanol (1 mL) 10%
palladium on carbon (3 mg) was added. The reaction was then stirred under hydrogen gas (1
atm) for 12 hr. Upon completion the mixture was filtered over celite, concentrated, and purified
by combiflash 0-> 5% MeOH in DCM to provide 6MEW160 (55 mg, 98% yield). 1H NMR (300
MHz, chloroform-d) δ 7.85 p.p.m. (d, J = 2.5 Hz, 1H), 7.67 (d, J = 8.8 Hz, 1H), 7.47-7.35 (m,
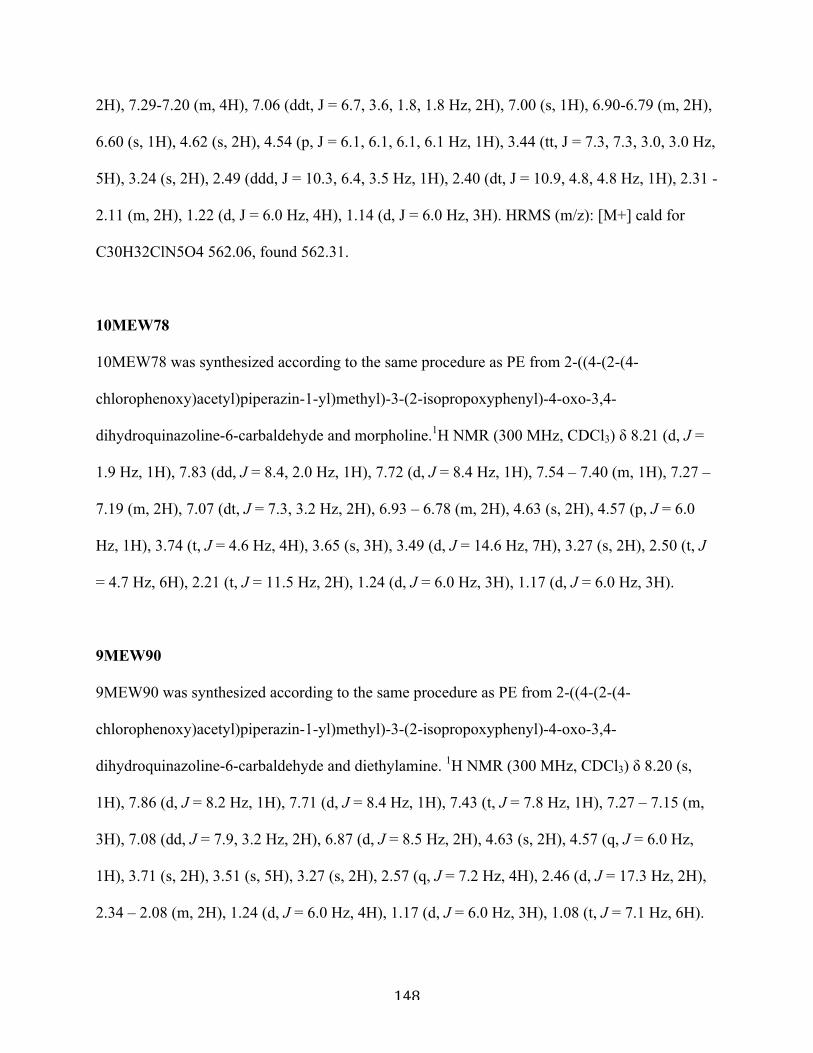
148
2H), 7.29-7.20 (m, 4H), 7.06 (ddt, J = 6.7, 3.6, 1.8, 1.8 Hz, 2H), 7.00 (s, 1H), 6.90-6.79 (m, 2H),
6.60 (s, 1H), 4.62 (s, 2H), 4.54 (p, J = 6.1, 6.1, 6.1, 6.1 Hz, 1H), 3.44 (tt, J = 7.3, 7.3, 3.0, 3.0 Hz,
5H), 3.24 (s, 2H), 2.49 (ddd, J = 10.3, 6.4, 3.5 Hz, 1H), 2.40 (dt, J = 10.9, 4.8, 4.8 Hz, 1H), 2.31 -
2.11 (m, 2H), 1.22 (d, J = 6.0 Hz, 4H), 1.14 (d, J = 6.0 Hz, 3H). HRMS (m/z): [M+] cald for
C30H32ClN5O4 562.06, found 562.31.
10MEW78
10MEW78 was synthesized according to the same procedure as PE from 2-((4-(2-(4-
chlorophenoxy)acetyl)piperazin-1-yl)methyl)-3-(2-isopropoxyphenyl)-4-oxo-3,4-
dihydroquinazoline-6-carbaldehyde and morpholine.1H NMR (300 MHz, CDCl3) δ 8.21 (d, J =
1.9 Hz, 1H), 7.83 (dd, J = 8.4, 2.0 Hz, 1H), 7.72 (d, J = 8.4 Hz, 1H), 7.54 – 7.40 (m, 1H), 7.27 –
7.19 (m, 2H), 7.07 (dt, J = 7.3, 3.2 Hz, 2H), 6.93 – 6.78 (m, 2H), 4.63 (s, 2H), 4.57 (p, J = 6.0
Hz, 1H), 3.74 (t, J = 4.6 Hz, 4H), 3.65 (s, 3H), 3.49 (d, J = 14.6 Hz, 7H), 3.27 (s, 2H), 2.50 (t, J
= 4.7 Hz, 6H), 2.21 (t, J = 11.5 Hz, 2H), 1.24 (d, J = 6.0 Hz, 3H), 1.17 (d, J = 6.0 Hz, 3H).
9MEW90
9MEW90 was synthesized according to the same procedure as PE from 2-((4-(2-(4-
chlorophenoxy)acetyl)piperazin-1-yl)methyl)-3-(2-isopropoxyphenyl)-4-oxo-3,4-
dihydroquinazoline-6-carbaldehyde and diethylamine. 1H NMR (300 MHz, CDCl3) δ 8.20 (s,
1H), 7.86 (d, J = 8.2 Hz, 1H), 7.71 (d, J = 8.4 Hz, 1H), 7.43 (t, J = 7.8 Hz, 1H), 7.27 – 7.15 (m,
3H), 7.08 (dd, J = 7.9, 3.2 Hz, 2H), 6.87 (d, J = 8.5 Hz, 2H), 4.63 (s, 2H), 4.57 (q, J = 6.0 Hz,
1H), 3.71 (s, 2H), 3.51 (s, 5H), 3.27 (s, 2H), 2.57 (q, J = 7.2 Hz, 4H), 2.46 (d, J = 17.3 Hz, 2H),
2.34 – 2.08 (m, 2H), 1.24 (d, J = 6.0 Hz, 4H), 1.17 (d, J = 6.0 Hz, 3H), 1.08 (t, J = 7.1 Hz, 6H).
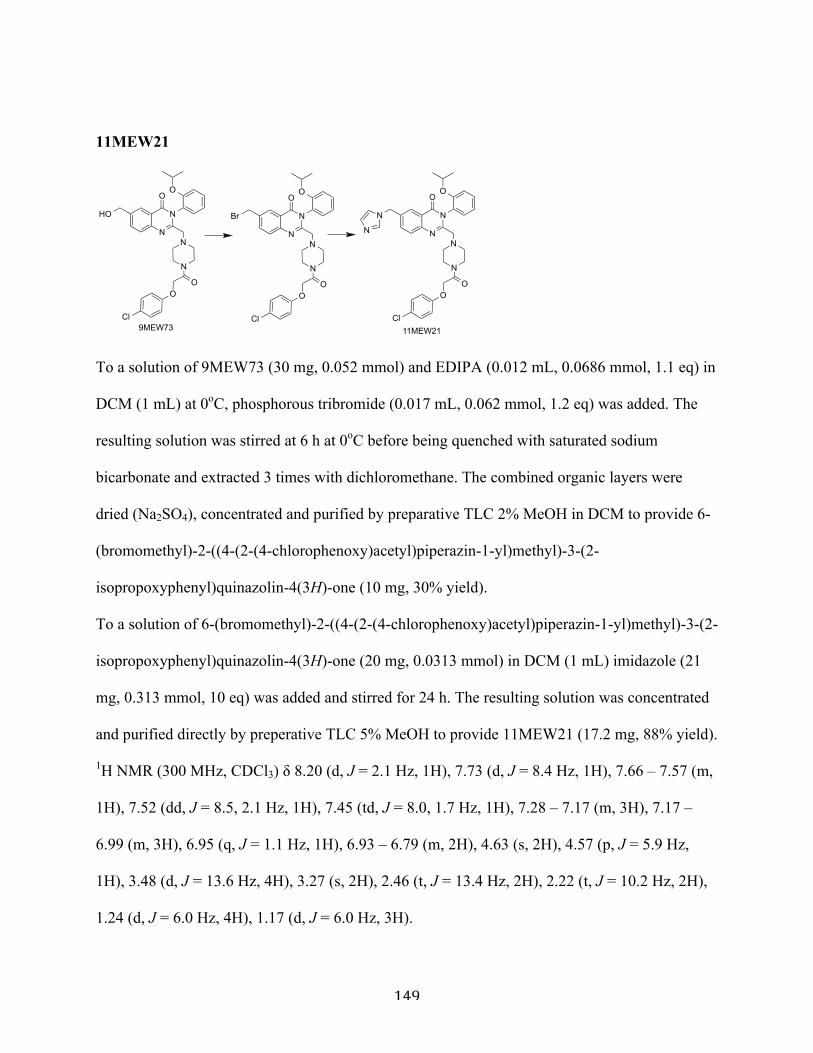
149
11MEW21
To a solution of 9MEW73 (30 mg, 0.052 mmol) and EDIPA (0.012 mL, 0.0686 mmol, 1.1 eq) in
DCM (1 mL) at 0oC, phosphorous tribromide (0.017 mL, 0.062 mmol, 1.2 eq) was added. The
resulting solution was stirred at 6 h at 0oC before being quenched with saturated sodium
bicarbonate and extracted 3 times with dichloromethane. The combined organic layers were
dried (Na2SO4), concentrated and purified by preparative TLC 2% MeOH in DCM to provide 6-
(bromomethyl)-2-((4-(2-(4-chlorophenoxy)acetyl)piperazin-1-yl)methyl)-3-(2-
isopropoxyphenyl)quinazolin-4(3H)-one (10 mg, 30% yield).
To a solution of 6-(bromomethyl)-2-((4-(2-(4-chlorophenoxy)acetyl)piperazin-1-yl)methyl)-3-(2-
isopropoxyphenyl)quinazolin-4(3H)-one (20 mg, 0.0313 mmol) in DCM (1 mL) imidazole (21
mg, 0.313 mmol, 10 eq) was added and stirred for 24 h. The resulting solution was concentrated
and purified directly by preperative TLC 5% MeOH to provide 11MEW21 (17.2 mg, 88% yield).
1H NMR (300 MHz, CDCl3) δ 8.20 (d, J = 2.1 Hz, 1H), 7.73 (d, J = 8.4 Hz, 1H), 7.66 – 7.57 (m,
1H), 7.52 (dd, J = 8.5, 2.1 Hz, 1H), 7.45 (td, J = 8.0, 1.7 Hz, 1H), 7.28 – 7.17 (m, 3H), 7.17 –
6.99 (m, 3H), 6.95 (q, J = 1.1 Hz, 1H), 6.93 – 6.79 (m, 2H), 4.63 (s, 2H), 4.57 (p, J = 5.9 Hz,
1H), 3.48 (d, J = 13.6 Hz, 4H), 3.27 (s, 2H), 2.46 (t, J = 13.4 Hz, 2H), 2.22 (t, J = 10.2 Hz, 2H),
1.24 (d, J = 6.0 Hz, 4H), 1.17 (d, J = 6.0 Hz, 3H).
N
OO
Cl
N
N
N
OO
HO
N
OO
Cl
N
N
N
OO
Br
N
OO
Cl
N
N
N
OO
N
N
9MEW73 11MEW21
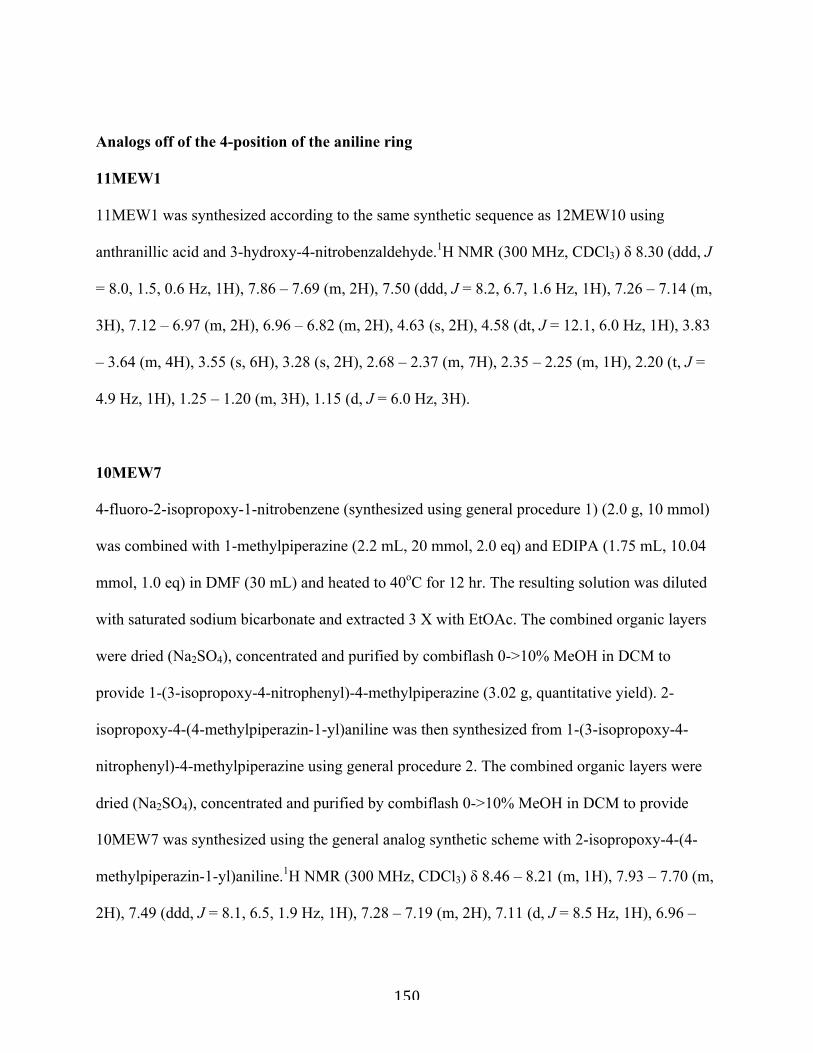
150
Analogs off of the 4-position of the aniline ring
11MEW1
11MEW1 was synthesized according to the same synthetic sequence as 12MEW10 using
anthranillic acid and 3-hydroxy-4-nitrobenzaldehyde.1H NMR (300 MHz, CDCl3) δ 8.30 (ddd, J
= 8.0, 1.5, 0.6 Hz, 1H), 7.86 – 7.69 (m, 2H), 7.50 (ddd, J = 8.2, 6.7, 1.6 Hz, 1H), 7.26 – 7.14 (m,
3H), 7.12 – 6.97 (m, 2H), 6.96 – 6.82 (m, 2H), 4.63 (s, 2H), 4.58 (dt, J = 12.1, 6.0 Hz, 1H), 3.83
– 3.64 (m, 4H), 3.55 (s, 6H), 3.28 (s, 2H), 2.68 – 2.37 (m, 7H), 2.35 – 2.25 (m, 1H), 2.20 (t, J =
4.9 Hz, 1H), 1.25 – 1.20 (m, 3H), 1.15 (d, J = 6.0 Hz, 3H).
10MEW7
4-fluoro-2-isopropoxy-1-nitrobenzene (synthesized using general procedure 1) (2.0 g, 10 mmol)
was combined with 1-methylpiperazine (2.2 mL, 20 mmol, 2.0 eq) and EDIPA (1.75 mL, 10.04
mmol, 1.0 eq) in DMF (30 mL) and heated to 40oC for 12 hr. The resulting solution was diluted
with saturated sodium bicarbonate and extracted 3 X with EtOAc. The combined organic layers
were dried (Na2SO4), concentrated and purified by combiflash 0->10% MeOH in DCM to
provide 1-(3-isopropoxy-4-nitrophenyl)-4-methylpiperazine (3.02 g, quantitative yield). 2-
isopropoxy-4-(4-methylpiperazin-1-yl)aniline was then synthesized from 1-(3-isopropoxy-4-
nitrophenyl)-4-methylpiperazine using general procedure 2. The combined organic layers were
dried (Na2SO4), concentrated and purified by combiflash 0->10% MeOH in DCM to provide
10MEW7 was synthesized using the general analog synthetic scheme with 2-isopropoxy-4-(4-
methylpiperazin-1-yl)aniline.1H NMR (300 MHz, CDCl3) δ 8.46 – 8.21 (m, 1H), 7.93 – 7.70 (m,
2H), 7.49 (ddd, J = 8.1, 6.5, 1.9 Hz, 1H), 7.28 – 7.19 (m, 2H), 7.11 (d, J = 8.5 Hz, 1H), 6.96 –
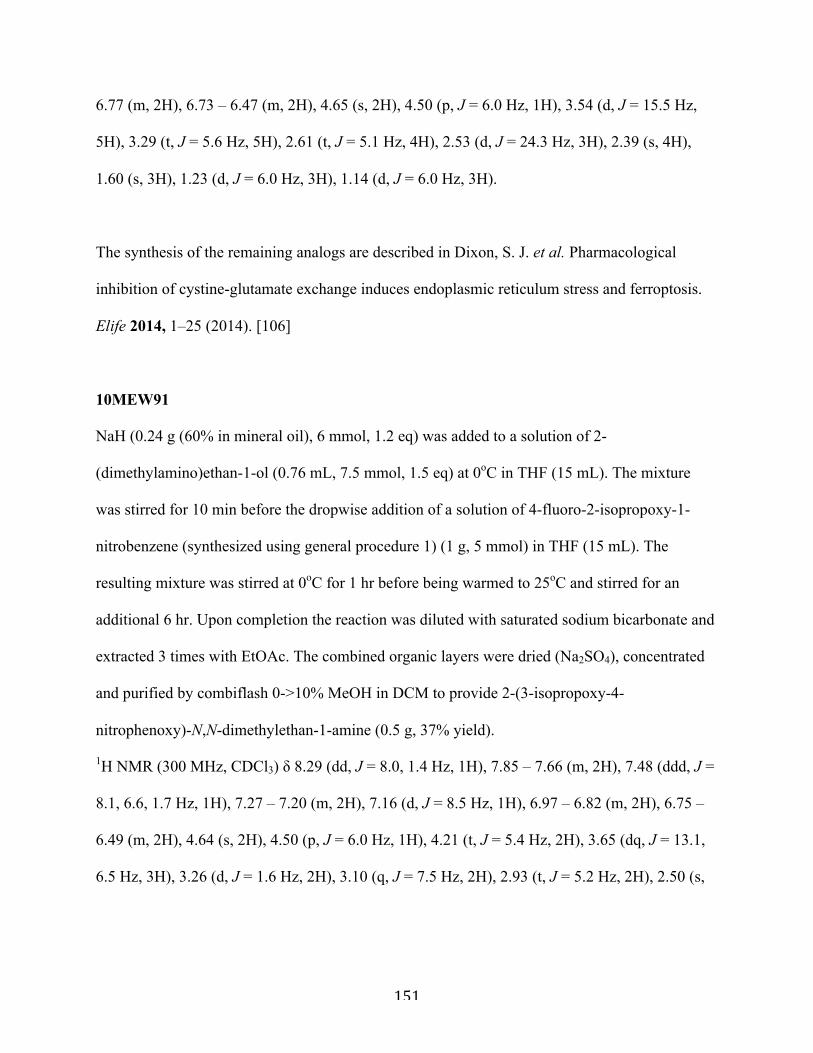
151
6.77 (m, 2H), 6.73 – 6.47 (m, 2H), 4.65 (s, 2H), 4.50 (p, J = 6.0 Hz, 1H), 3.54 (d, J = 15.5 Hz,
5H), 3.29 (t, J = 5.6 Hz, 5H), 2.61 (t, J = 5.1 Hz, 4H), 2.53 (d, J = 24.3 Hz, 3H), 2.39 (s, 4H),
1.60 (s, 3H), 1.23 (d, J = 6.0 Hz, 3H), 1.14 (d, J = 6.0 Hz, 3H).
The synthesis of the remaining analogs are described in Dixon, S. J. et al. Pharmacological
inhibition of cystine-glutamate exchange induces endoplasmic reticulum stress and ferroptosis.
Elife 2014, 1–25 (2014). [106]
10MEW91
NaH (0.24 g (60% in mineral oil), 6 mmol, 1.2 eq) was added to a solution of 2-
(dimethylamino)ethan-1-ol (0.76 mL, 7.5 mmol, 1.5 eq) at 0oC in THF (15 mL). The mixture
was stirred for 10 min before the dropwise addition of a solution of 4-fluoro-2-isopropoxy-1-
nitrobenzene (synthesized using general procedure 1) (1 g, 5 mmol) in THF (15 mL). The
resulting mixture was stirred at 0oC for 1 hr before being warmed to 25oC and stirred for an
additional 6 hr. Upon completion the reaction was diluted with saturated sodium bicarbonate and
extracted 3 times with EtOAc. The combined organic layers were dried (Na2SO4), concentrated
and purified by combiflash 0->10% MeOH in DCM to provide 2-(3-isopropoxy-4-
nitrophenoxy)-N,N-dimethylethan-1-amine (0.5 g, 37% yield).
1H NMR (300 MHz, CDCl3) δ 8.29 (dd, J = 8.0, 1.4 Hz, 1H), 7.85 – 7.66 (m, 2H), 7.48 (ddd, J =
8.1, 6.6, 1.7 Hz, 1H), 7.27 – 7.20 (m, 2H), 7.16 (d, J = 8.5 Hz, 1H), 6.97 – 6.82 (m, 2H), 6.75 –
6.49 (m, 2H), 4.64 (s, 2H), 4.50 (p, J = 6.0 Hz, 1H), 4.21 (t, J = 5.4 Hz, 2H), 3.65 (dq, J = 13.1,
6.5 Hz, 3H), 3.26 (d, J = 1.6 Hz, 2H), 3.10 (q, J = 7.5 Hz, 2H), 2.93 (t, J = 5.2 Hz, 2H), 2.50 (s,
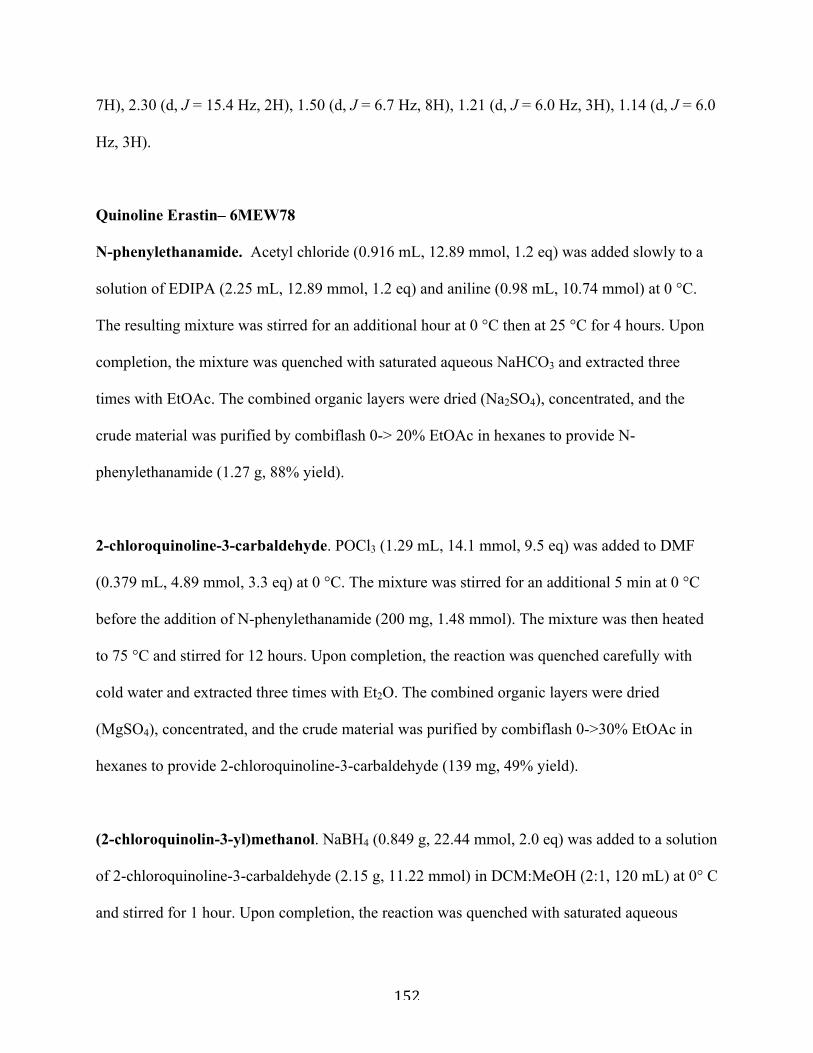
152
7H), 2.30 (d, J = 15.4 Hz, 2H), 1.50 (d, J = 6.7 Hz, 8H), 1.21 (d, J = 6.0 Hz, 3H), 1.14 (d, J = 6.0
Hz, 3H).
Quinoline Erastin– 6MEW78
N-phenylethanamide. Acetyl chloride (0.916 mL, 12.89 mmol, 1.2 eq) was added slowly to a
solution of EDIPA (2.25 mL, 12.89 mmol, 1.2 eq) and aniline (0.98 mL, 10.74 mmol) at 0 °C.
The resulting mixture was stirred for an additional hour at 0 °C then at 25 °C for 4 hours. Upon
completion, the mixture was quenched with saturated aqueous NaHCO3 and extracted three
times with EtOAc. The combined organic layers were dried (Na2SO4), concentrated, and the
crude material was purified by combiflash 0-> 20% EtOAc in hexanes to provide N-
phenylethanamide (1.27 g, 88% yield).
2-chloroquinoline-3-carbaldehyde. POCl3 (1.29 mL, 14.1 mmol, 9.5 eq) was added to DMF
(0.379 mL, 4.89 mmol, 3.3 eq) at 0 °C. The mixture was stirred for an additional 5 min at 0 °C
before the addition of N-phenylethanamide (200 mg, 1.48 mmol). The mixture was then heated
to 75 °C and stirred for 12 hours. Upon completion, the reaction was quenched carefully with
cold water and extracted three times with Et2O. The combined organic layers were dried
(MgSO4), concentrated, and the crude material was purified by combiflash 0->30% EtOAc in
hexanes to provide 2-chloroquinoline-3-carbaldehyde (139 mg, 49% yield).
(2-chloroquinolin-3-yl)methanol. NaBH4 (0.849 g, 22.44 mmol, 2.0 eq) was added to a solution
of 2-chloroquinoline-3-carbaldehyde (2.15 g, 11.22 mmol) in DCM:MeOH (2:1, 120 mL) at 0° C
and stirred for 1 hour. Upon completion, the reaction was quenched with saturated aqueous
153
NH4Cl and extracted three times with dichloromethane. The combined organic layers were dried
(Na2SO4), concentrated, and the crude material was purified by combiflash 0->50% EtOAc in
hexanes to provide (2-chloroquinolin-3-yl)methanol (2.1 g, 97%).
3-((tert-butyldimethylsilyloxy)methyl)-2-chloroquinoline was prepared according to the
general TBS protection procedure (1.2 g, 29%)
3-((tert-butyldimethylsilyloxy)methyl)-2-(2-isopropoxyphenyl)quinoline (Suzuki coupling
procedure). Pd(PPh3)4 (187 mg, 0.162 mmol, 10%) was added to a solution of 3-((tert-
butyldimethylsilyloxy)methyl)-2-chloroquinoline (0.5 g, 1.62 mmol) in dioxane (10 mL) and
stirred for 10 min at 25° C. To the resulting mixture, a solution of 2-isopropoxyphenylboronic
acid (0.438 g, 2.43 mmol, 1.5 eq) in EtOH (4 mL) was added and the resulting mixture was
stirred at 25 °C for 10 min before the addition of a 2 M aqueous solution of sodium carbonate
(8.1 mL, 16.2 mmol, 10 eq). The resulting mixture was stirred at 25 °C for an additional 5 min,
then heated to 80 °C for 24 hours. Upon completion, the mixture was diluted with water and
extracted three times with EtOAc. The combined organic layers were dried (Na2SO4),
concentrated, and the crude material was purified by combiflash 0->20% EtOAc in hexanes to
provide 3-((tert-butyldimethylsilyloxy)methyl)-2-(2-isopropoxyphenyl)quinoline (0.57 g, 86%
yield)
(2-(2-isopropoxyphenyl)quinolin-3-yl)methanol. TBAF (1 M, 0.67 mL, 0.67 mmol, 1.1 eq)
was added to a solution of (2-(2-isopropoxyphenyl)quinolin-3-yl)methanol in THF (6 mL) at 0
°C. The resulting mixture was stirred at 0 °C for 1 hour. Upon completion, saturated aqueous
154
NH4Cl was added and extracted 3 times with EtOAc. The combined organic layers were dried
(Na2SO4), concentrated, and the crude material was purified by combiflash 0->40% EtOAc in
hexanes to provide (2-(2-isopropoxyphenyl)quinolin-3-yl)methanol (135 mg, 75%).
3-(bromomethyl)-2-(2-isopropoxyphenyl)quinolone. PBr3 (0.130 mL, 1.38 mmol, 3 eq) was
added to a solution of (2-(2-isopropoxyphenyl)quinolin-3-yl)methanol (135 mg, 0.45 mmol) in
DCM (5 mL) at 0 °C. The resulting mixture was stirred at 0 °C for an additional 30 min, then at
25 °C for 2 hr. Upon completion, the reaction was quenched with saturated aqueous NaHCO3
and extracted 3 times with EtOAc. The combined organic layers were dried (Na2SO4),
concentrated, and the crude material was purified by combiflash 0-20% EtOAc in hexanes to
provide 3-(bromomethyl)-2-(2-isopropoxyphenyl)quinoline (57 mg, 35%).
2-(2-isopropoxyphenyl)-3-(piperazin-1-ylmethyl)quinoline (amine addition procedure). To a
solution of 3-(bromomethyl)-2-(2-isopropoxyphenyl)quinoline (57 mg, 0.160 mmol) in THF, 2
mL at 0 °C, piperzine (138 mg, 1.6 mmol, 10 eq) was added and stirred for 12 hours. The
reaction mixture was then concentrated and purified directly by combiflash 0-20% MeOH in
DCM to afford 2-(2-isopropoxyphenyl)-3-(piperazin-1-ylmethyl)quinoline (51 mg, 88% yield).
6MEW78 - 2-(2-isopropoxyphenyl)-3-(piperazin-1-ylmethyl)quinoline (acyl chloride addition
procedure). To a solution of 2-(2-isopropoxyphenyl)-3-(piperazin-1-ylmethyl)quinoline (51 mg,
0.141 mmol), EDIPA (30 uL, 0.169 mmol, 1.2 eq) and 4-DMAP (3 mg, 0.0282 mmol, 0.2 eq) in
DCM (2 mL) at 0 °C, a solution of 4-chlorophenoxy acetyl chloride (32 mg, 0.155 mmol, 1.1 eq)
in DCM (1 mL) was added dropwise. The reaction slowly warmed to 25 °C and was stirred for 4
155
hours. Upon completion, the reaction was quenched with saturated aqueous NaHCO3 and
extracted three times with DCM. The combined organic layers were dried (Na2SO4),
concentrated, and the crude material was purified by preparative TLC 5% MeOH in DCM (34
mg, 45% yield) 1H NMR (300 MHz, chloroform-d) δ 8.29 p.p.m. (s, 1H), 8.23-8.04 (m, 1H),
7.88 (dd, J = 8.0, 1.5 Hz, 1H), 7.71 (ddd, J = 8.4, 6.9, 1.5 Hz, 1H), 7.57 (ddd, J = 8.1, 6.9, 1.2 Hz,
1H), 7.47-7.31 (m, 2H), 7.27-7.19 (m, 2H), 7.09 (td, J = 7.5, 7.4, 1.0 Hz, 1H), 6.99 (d, J = 8.3
Hz, 1H), 6.91 ? 6.82 (m, 2H), 4.64 (s, 2H), 4.43 (p, J = 6.0, 6.0, 6.0, 6.0 Hz, 1H), 3.85-3.37 (m,
6H), 2.34 (m, 4H), 1.22 (d, J = 6.0 Hz, 3H), 1.03 (d, J = 6.0 Hz, 3H). HRMS (m/z): [M+] cald for
C31H32ClN3O3 530.06, found 530.22.
Synthesis of indole erastin
7MEW81 - 2-((tert-butyldimethylsilyloxy)methyl)-1H-indole (TBS protection procedure).
TBS-Cl (1.66 g, 11.04 mmol, 1.2 eq) was added to a solution of (1H-indol-2-yl)methanol (1.335
g, 9.2 mmol) and EDIPA (2.4 mL, 13.8 mmol, 1.5 eq) in DMF (30 mL) at 25 °C. The mixture
was stirred for an additional 5 hours at 25 °C. Upon completion, the reaction contents were
diluted with water and extracted three times with Et2O. The combined organic layers were dried
(MgSO4), concentrated, and the crude material was purified by combiflash 0-20% EtOAc in
hexanes to provide 2-((tert-butyldimethylsilyloxy)methyl)-1H-indole (2.04 g, 85%)
3-bromo-2-((tert-butyldimethylsilyloxy)methyl)-1H-indole. NBS (0.34 g, 1.91 mmol) was
added to a stirred solution of 2-((tert-butyldimethylsilyloxy)methyl)-1H-indole (0.5 g, 1.91
mmol) in DMF at 0 °C. The mixture was stirred an additional 1 hour at 0 °C. Upon completion,
the reaction contents were diluted with water and extracted 3 times with Et2O. The combined
156
organic layers were dried (MgSO4), concentrated, and the crude material was purified by
combiflash 0->10% EtOAc in hexanes to provide 3-bromo-2-((tert-
butyldimethylsilyloxy)methyl)-1H-indole (0.514 g, 79%)
Tert-butyl 3-bromo-2-((tert-butyldimethylsilyloxy)methyl)-1H-indole-1-carboxylate. Di-
tert-butyl dicarbonate (2.08 g, 9.52 mmol,1.8 eq) and 4-DMAP (0.129 g, 1.06 mmol, 0.2 eq)
were added sequentially to a stirred solution of 3-bromo-2-((tert-butyldimethylsilyloxy)methyl)-
1H-indole (1.8 g, 5.29 mmol) in DCM (20 mL) at 25 °C. The mixture was stirred for an
additional 12 hours. Upon completion, the reaction contents were diluted with DCM, poured into
water, and extracted 2 times with DCM. The crude material was pushed forward to the next step
without additional purification (1.72 g, 74% yield)
tert-butyl 2-((tert-butyldimethylsilyloxy)methyl)-3-(2-isopropoxyphenyl)-1H-indole-1-
carboxylate was prepared according to general Suzuki coupling procedure (0.883 g, 79%).
Tert-butyl 2-(hydroxymethyl)-3-(2-isopropoxyphenyl)-1H-indole-1-carboxylate. Hydrogen
fluoride pyridine (0.66 mL, 70% as HF, 30% as py) was added to a solution of tert-butyl 2-((tert-
butyldimethylsilyloxy)methyl)-3-(2-isopropoxyphenyl)-1H-indole-1-carboxylate (0.3 g, 1.01
mmol) in THF:pyridine (5:1, 10 mL) at 0 °C. The resulting mixture was then brought to room
temperature and stirred for an additional 6 hours. Upon completion, the reaction was quenched
with saturated NH4Cl and extracted three times with EtOAc. The combined organic layers were
dried (Na2SO4), concentrated, and the crude material was purified by combiflash 0-30% EtOAc
157
in hexanes to provide tert-butyl 2-(hydroxymethyl)-3-(2-isopropoxyphenyl)-1H-indole-1-
carboxylate (0.279 g, 73%).
Tert-butyl 2-formyl-3-(2-isopropoxyphenyl)-1H-indole-1-carboxylate. Dess-Martin
periodinane (230 mg, 0.543 mmol, 1.8 eq) was added to a stirred suspension of sodium
bicarbonate (242 mg, 2.88 mmol, 10.0 eq) and tert-butyl 2-(hydroxymethyl)-3-(2-
isopropoxyphenyl)-1H-indole-1-carboxylate (110 mg, 0.288 mmol) in DCM (3 mL). The
mixture was stirred at 25 °C for 2 hours, and upon completion, a saturated aqueous solution of
sodium sulfite (1 mL) was added and the mixture was stirred for an additional 5 min. This was
followed subsequently by the addition of water and extraction with DCM three times. The
combined organic layers were dried (Na2SO4), concentrated, and the crude material was purified
by combiflash 0-40% EtOAc in hexanes to give tert-butyl 2-formyl-3-(2-isopropoxyphenyl)-1H-
indole-1-carboxylate (quantitative yield).
Tert-butyl 3-(2-isopropoxyphenyl)-2-(piperazin-1-ylmethyl)-1H-indole-1-carboxylate. A
solution of tert-butyl 2-formyl-3-(2-isopropoxyphenyl)-1H-indole-1-carboxylate (0.140 g, 0.369
mmol) in DCM (1.5 mL)was added to a stirred solution of piperazine (0.318 g, 3.69 mmol, 10
eq) in MeOH (1.5 mL) at 25 °C. After an additional 15 min of stirring a solution of ZnCl2 (10
mg, 0.0738 mmol, 0.2 eq) and sodium cyanoborohydride (70 mg, 1.11 mmol, 3.0 eq) in MeOH
(1.5 eq) was added. The resulting mixture was heated to 40 °C and stirred for 6 hours. Upon
completion, the reaction was diluted with water and extracted three times with EtOAc. The
combined organic layers were dried (Na2SO4), concentrated, and the crude material was purified
158
by combiflash 0->20% MeOH in DCM to provide tert-butyl 3-(2-isopropoxyphenyl)-2-
(piperazin-1-ylmethyl)-1H-indole-1-carboxylate (73 mg, 44% yield).
Tert-butyl 2-((4-(2-(4-chlorophenoxy)ethanoyl)piperazin-1-yl)methyl)-3-(2-
isopropoxyphenyl)-1H-indole-1-carboxylate was prepared according to the general acyl
chloride addition procedure (89 mg, 90%).
7MEW81- 2-(4-chlorophenoxy)-1-(4-((3-(2-isopropoxyphenyl)-1H-indol-2-
yl)methyl)piperazin-1-yl)ethanone. TFA (1 mL) was added to a solution of tert-butyl 2-((4-(2-
(4-chlorophenoxy)ethanoyl)piperazin-1-yl)methyl)-3-(2-isopropoxyphenyl)-1H-indole-1-
carboxylate (85 mg, 0.138 mmol) in DCM (1 mL) and the resulting solution was stirred at 25 °C
for 24 hours. Upon completion, the reaction was quenched with saturated aqueous NaHCO3 and
extracted three times with EtOAc. The combined organic layers were dried (Na2SO4),
concentrated, and the crude material was purified by combiflash 0->5% MeOH in DCM to
provide 2-(4-chlorophenoxy)-1-(4-((3-(2-isopropoxyphenyl)-1H-indol-2-yl)methyl)piperazin-1-
yl)ethanone (50 mg, 70% yield). 1H NMR (300 MHz, chloroform-d) δ 8.61 p.p.m. (s, 1H), 7.52
(d, J = 7.9 Hz, 1H), 7.40 (ddd, J = 7.3, 5.8, 1.5 Hz, 2H), 7.39-7.27 (m, 1H), 7.30-7.15 (m, 3H),
7.17-6.99 (m, 3H), 6.94-6.81 (m, 2H), 4.66 (s, 2H), 4.35 (p, J = 6.1, 6.1, 6.1, 6.1 Hz, 1H), 3.93-
3.40 (m, 7H), 2.43 (d, J = 9.7 Hz, 4H), 1.24-1.00 (m, 6H). HRMS (m/z): [M+] cald for
C30H32ClN3O3 518.05, found 517.21.
General analogs
159
2-((4-(2-chloroethanoyl)piperazin-1-yl)methyl)-3-(2-isopropoxyphenyl)quinazolin-4(3H)-
one. To a solution of a solution of 3-(2-isopropoxyphenyl)-2-(piperazin-1-ylmethyl)quinazolin-
4(3H)-one (200 mg, 0.53 mmol) and EDIPA (82 uL, 0.635 mmol, 1.2 eq) in DCM (5 mL) at 0
°C, a solution of chloroacetyl chloride (50 uL, 0.635 mmol, 1.2 eq) was added and the resulting
mixture was stirred at 25 °C for 4 hours. Upon completion, the reaction was quenched with
saturated aqueous NaHCO3 and extracted three times with DCM. The combined organic layers
were dried (Na2SO4), concentrated, and the crude material was purified by combiflash 0->5%
MeOH in DCM to provide 2-((4-(2-chloroethanoyl)piperazin-1-yl)methyl)-3-(2-
isopropoxyphenyl)quinazolin-4(3H)-one (210 mg, 73% yield)
35MEW22 - 2-((4-(2-(4-chlorophenylamino)ethanoyl)piperazin-1-yl)methyl)-3-(2-
isopropoxyphenyl)quinazolin-4(3H)-one. 4-chloroaniline (29 mg, 0.230 mmol, 5.0 eq) was
added to a solution of 2-((4-(2-chloroethanoyl)piperazin-1-yl)methyl)-3-(2-
isopropoxyphenyl)quinazolin-4(3H)-one (21 mg, 0.0462 mmol) in DMF (0.5 mL) and the
resulting mixture was stirred at 60 °C for 12 hours. Upon completion, the mixture was diluted
with water and extracted three times with diethyl ether. The combined organic layers were dried
(MgSO4), concentrated, and the crude material was purified by preparative TLC 5% MeOH in
DCM to provide 2-((4-(2-(4-chlorophenylamino)ethanoyl)piperazin-1-yl)methyl)-3-(2-
isopropoxyphenyl)quinazolin-4(3H)-one (8 mg, 32% yield). 1H NMR (400 MHz, Chloroform-d)
δ 8.32 p.p.m. (dq, J = 8.0, 1.6, 1.6, 1.5 Hz, 1H), 7.87-7.71 (m, 2H), 7.64-7.39 (m, 2H), 7.31 (s,
1H), 7.19-6.96 (m, 5H), 6.56-6.46 (m, 2H), 4.91 (d, J = 6.0 Hz, 1H), 4.57 (dtd, J = 8.1, 6.3, 5.8,
4.2 Hz, 1H), 3.80 (dt, J = 3.9, 1.8, 1.8 Hz, 2H), 3.58 (d, J = 5.6 Hz, 2H), 3.41-3.26 (m, 4H), 2.66-
160
2.43 (m, 2H), 2.28 (dt, J = 16.2, 7.1, 7.1 Hz, 2H), 1.26 (dt, J = 6.1, 1.8, 1.8 Hz, 4H), 1.17 (dt, J =
6.2, 1.7, 1.7 Hz, 3H). HRMS (m/z): [M+] cald for C30H32ClN5O3 546.06, found 546.23
3-(2-isopropoxyphenyl)-2-((methyl(2(methylamino)ethyl)amino)methyl)quinazolin-4(3H)-one
was prepared according to the general amine addition procedure using N,N-dimethylethylene
diamine in place of piperazine (27 mg, 56% yield).
35MEW26 was prepared from 3-(2-isopropoxyphenyl)-2-
((methyl(2(methylamino)ethyl)amino)methyl)quinazolin-4(3H)-one (20 mg, 22% yield). 1H
NMR (400 MHz, chloroform-d) δ 8.36-8.26 p.p.m. (m, 1H), 7.81-7.70 (m, 2H), 7.54-7.39 (m,
2H), 7.27-7.16 (m, 3H), 7.09 (td, J = 7.9, 7.4, 4.1 Hz, 2H), 6.92-6.80 (m, 2H), 4.73 (s, 1H), 4.61
(s, 1H), 4.57 (ddt, J = 9.2, 6.1, 3.1, 3.1 Hz, 1H), 3.49-3.30 (m, 4H), 3.01 (s, 1H), 2.90 (s, 2H),
2.82-2.44 (m, 2H), 2.29 (d, J = 15.6 Hz, 3H), 1.25 (d, J = 3.7 Hz, 3H), 1.16 (dd, J = 6.3, 1.3 Hz,
3H). HRMS (m/z): [M+] cald for C30H33ClN4O4 549.04, found 549.22
3-(2-isopropoxyphenyl)-2-((methylamino)methyl)quinazolin-4(3H)-one.
A 33% (wt) solution (EtOH) of methyl amine (0.15 mL) was added to a solution of 2-
(chloromethyl)-3-(2-isopropoxyphenyl)quinazolin-4(3H)-one (80 mg, 0.243 mmol) in THF (3
mL) and the resulting mixture was stirred at 25 °C for 12 hr. Upon completion, the mixture was
diluted with water and extracted 3 times with EtOAc. The combined organic layers were dried
(Na2SO4), concentrated, and the crude material was purified by combi flash 0->10% MeOH in
161
DCM to provide 3-(2-isopropoxyphenyl)-2-((methylamino)methyl)quinazolin-4(3H)-one (43
mg, 55% yield).
35MEW27 was prepared from 3-(2-isopropoxyphenyl)-2-((methylamino)methyl)quinazolin-
4(3H)-one using general acyl chloride addition procedure (71 mg, 72% yield) Mixture of
atropisomers 1H NMR (400 MHz, chloroform-d) δ 8.31 p.p.m. (d, J = 7.9 Hz, 2H), 7.80 (dddd, J
= 12.6, 8.5, 7.2, 1.5 Hz, 2H), 7.64 (dd, J = 8.3, 1.1 Hz, 1H), 7.59-7.41 (m, 5H), 7.25 (dd, J = 8.2,
6.1 Hz, 3H), 7.20-7.07 (m, 6H), 7.00-6.94 (m, 2H), 6.86-6.75 (m, 2H), 4.82 (s, 2H), 4.60 (d, J =
7.6 Hz, 5H), 4.25 (s, 2H), 3.98 (d, J = 17.0 Hz, 1H), 3.22 (s, 3H), 3.06 (s, 3H), 1.30 (dd, J = 18.1,
6.1 Hz, 7H), 1.18 (dd, J = 16.3, 6.0 Hz, 6H). HRMS (m/z): [M+] cald for C27H26ClN3O4
491.97, found 492.13.
35MEW14. To a solution of 3-(2-isopropoxyphenyl)-2-(piperazin-1-ylmethyl)quinazolin-
4(3H)-one (30 mg, 0.079 mmol) and potassium carbonate (13 mg, 0.094 mmol, 1.2 eq) in DMF
(1 mL), 4-chlorophenyl 2-bromoethyl ether (28 mg, 0.118 mmol, 1.5 eq) was added. The
resulting mixture was stirred at 60 °C for 24 hours. Upon completion, the mixture was diluted
with saturated aqueous NaHCO3 and extracted three times with EtOAc. The combined organic
layers were dried (Na2SO4), concentrated, and the crude material was purified preparative TLC,
10% MeOH in DCM to provide 35MEW14 (11.8 mg, 28% yield). 1H NMR (400 MHz,
chloroform-d) δ 8.32 p.p.m. (dd, J = 7.9, 1.1 Hz, 1H), 7.88-7.75 (m, 2H), 7.50 (dt, J = 8.1, 4.1,
4.1 Hz, 1H), 7.43 (td, J = 8.1, 7.9, 1.7 Hz, 1H), 7.31 (dd, J = 7.7, 1.7 Hz, 1H), 7.27-7.20 (m, 2H),
7.12-7.00 (m, 2H), 6.90-6.76 (m, 2H), 4.56 (p, J = 6.0, 6.0, 6.0, 6.0 Hz, 1H), 4.06 (t, J = 5.8, 5.8
Hz, 2H), 3.26 (d, J = 1.4 Hz, 2H), 2.78 (t, J = 5.8, 5.8 Hz, 2H), 2.51 (s, 6H), 2.35-2.22 (m, 2H),
162
1.25 (d, J = 6.0 Hz, 3H), 1.17 (d, J = 6.0 Hz, 3H). HRMS (m/z): [M+] cald for C30H33ClN4O3
533.06, found 533.23.
35MEW38 (amine coupling procedure). HBTU (147 mg, 0.38 mmol, 1.5 eq) was added to a
solution of 3-chlorophenoxy acetic acid (69 mg, 0.336 mmol, 1.3 eq) and EDIPA (67 uL, 0.38
mmol, 1.5 eq) in DCM (3 mL) and stirred for 30 min at 25 °C. A solution of 3-(2-
isopropoxyphenyl)-2-(piperazin-1-ylmethyl)quinazolin-4(3H)-one (100 mg, 0.258 mmol) in
DCM (1 mL) was added and stirred for an additional 4 hours. Upon completion, the reaction was
quenched with saturated aqueous NaHCO3 and extracted three times with DCM. The combined
organic layers were dried (Na2SO4), concentrated, and the crude material was purified by combi
flash 0->5% MeOH in DCM to provide 35MEW38 (120 mg, 85% yield). 1H NMR (400 MHz,
chloroform-d) δ 8.38-8.27 p.p.m. (m, 1H), 7.87-7.68 (m, 2H), 7.51 (ddd, J = 8.2, 6.6, 1.7 Hz,
1H), 7.43 (ddd, J = 8.3, 7.5, 1.7 Hz, 1H), 7.33-7.26 (m, 1H), 7.21 (t, J = 8.1, 8.1 Hz, 1H), 7.12-
7.04 (m, 2H), 6.97 (ddd, J = 8.0, 1.9, 0.9 Hz, 1H), 6.92 (t, J = 2.2, 2.2 Hz, 1H), 6.83 (ddd, J = 8.5,
2.5, 0.9 Hz, 1H), 4.64 (s, 2H), 4.56 (p, J = 6.1, 6.1, 6.0, 6.0 Hz, 1H), 3.68-3.36 (m, 4H), 3.29 (s,
2H), 2.49 (dddd, J = 26.4, 11.1, 6.1, 3.2 Hz, 2H), 2.32-2.12 (m, 2H), 1.24 (d, J = 6.1 Hz, 3H),
1.16 (d, J = 6.0 Hz, 3H). HRMS (m/z): [M+] cald for C36H35ClN4O4 547.04, found 547.21
35MEW39. Prepared using the general amine coupling procedure from 3-(2-
isopropoxyphenyl)-2-(piperazin-1-ylmethyl)quinazolin-4(3H)-one, (132 mg, 96% yield). 1H
NMR (400 MHz, chloroform-d) δ 8.36-8.25 p.p.m. (m, 1H), 7.83 ? 7.72 (m, 2H), 7.50 (ddd, J =
8.1, 6.8, 1.5 Hz, 1H), 7.47-7.38 (m, 1H), 7.29-7.22 (m, 1H), 7.11-7.02 (m, 2H), 7.01-6.91 (m,
2H), 6.91-6.80 (m, 2H), 4.62 (s, 2H), 4.56 (p, J = 6.1, 6.1, 6.1, 6.1 Hz, 1H), 3.58 -3.39 (m, 5H),
163
3.27 (s, 2H), 2.47 (dddd, J = 29.4, 10.8, 6.2, 3.5 Hz, 2H), 2.35-2.13 (m, 2H), 1.23 (d, J = 6.0 Hz,
3H), 1.15 (d, J = 6.0 Hz, 3H). HRMS (m/z): [M+] cald for C30H31FN4O4 530.59, found 531.24
35MEW13. Prepared using the general amine coupling procedure from 3-(2-
isopropoxyphenyl)-2-(piperazin-1-ylmethyl)quinazolin-4(3H)-one (18 mg, 44% yield). 1H NMR
(400 MHz, chloroform-d) δ 8.32 p.p.m. (ddd, J = 8.0, 1.4, 0.7 Hz, 1H), 7.84-7.74 (m, 2H), 7.52
(ddd, J = 8.2, 6.7, 1.7 Hz, 1H), 7.44 (ddd, J = 8.4, 7.5, 1.7 Hz, 1H), 7.31 (dd, J = 7.1, 1.9 Hz,
2H), 7.29-7.27 (m, 1H), 7.12-7.06 (m, 2H), 7.00 (td, J = 7.3, 7.3, 1.1 Hz, 1H), 6.97-6.87 (m, 2H),
4.66 (s, 2H), 4.57 (p, J = 6.1, 6.1, 6.1, 6.1 Hz, 1H), 3.52 (ddt, J = 10.6, 7.6, 3.2, 3.2 Hz, 4H), 3.28
(s, 2H), 2.56-2.40 (m, 2H), 2.32-2.15 (m, 2H), 1.25 (d, J = 6.1 Hz, 3H), 1.17 (d, J = 6.0 Hz, 3H).
HRMS (m/z): [M+] cald for C30H32N4O4 512.6, found 513.25
15MEW81. Prepared using the general amine coupling procedure 3-(2-isopropoxyphenyl)-2-
(piperazin-1-ylmethyl)quinazolin-4(3H)-one (226 mg, 58% yield).1H NMR (400 MHz,
chloroform-d) δ 8.36-8.30 p.p.m. (m, 1H), 7.86-7.74 (m, 2H), 7.52 (ddd, J = 8.2, 6.5, 1.8 Hz,
1H), 7.47-7.38 (m, 1H), 7.29-7.22 (m, 3H), 7.18-7.11 (m, 2H), 7.11-6.98 (m, 2H), 4.57 (p, J =
6.0 Hz, 1H), 3.52 (dt, J = 9.7, 4.6 Hz, 2H), 3.28 (s, 4H), 2.98-2.89 (m, 2H), 2.56 (t, J = 7.7 Hz,
2H), 2.41 (t, J = 5.7 Hz, 2H), 2.25 -2.10 (m, 2H), 1.25 (d, J = 6.0 Hz, 3H), 1.17 (d, J = 6.0 Hz,
3H). HRMS (m/z): [M+] cald for C31H33ClN4O3 545.07, found 545.23.
35MEW28. Prepared using general Suzuki coupling procedure from 21MEW26 (30 mg, 77%
yield). 1H NMR (400 MHz, chloroform-d) δ 8.38-8.32 p.p.m. (m, 1H), 7.85-7.76 (m, 2H), 7.74-
7.67 (m, 2H), 7.60-7.53 (m, 4H), 7.53-7.47 (m, 2H), 7.44 (t, J = 7.6, 7.6 Hz, 2H), 7.36 (d, J = 7.1
164
Hz, 1H), 7.26-7.20 (m, 2H), 7.15 (d, J = 8.6 Hz, 1H), 6.87-6.78 (m, 2H), 4.68-4.62 (m, 1H), 4.60
(s, 2H), 3.63-3.23 (m, 7H), 2.49 (ddt, J = 14.5, 10.6, 4.8, 4.8 Hz, 2H), 2.23 (ddd, J = 18.4, 11.4,
5.5 Hz, 2H), 1.28 (d, J = 6.0 Hz, 3H), 1.21 (d, J = 6.1 Hz, 3H). HRMS (m/z): [M+] cald for
C36H35ClN4O4 623.14, found 623.24.
35MEW29. Prepared using general Suzuki coupling procedure from 21MEW26 (65 mg, 54%).
1H NMR (300 MHz, chloroform-d) δ 8.33 p.p.m. (ddd, J = 8.0, 1.5, 0.7 Hz, 1H), 7.85-7.72 (m,
2H), 7.68 (dd, J = 1.5, 0.9 Hz, 1H), 7.57-7.48 (m, 2H), 7.47 (t, J = 1.7, 1.7 Hz, 1H), 7.42 (d, J =
2.2 Hz, 1H), 7.27-7.20 (m, 2H), 7.08 (d, J = 8.6 Hz, 1H), 6.95-6.76 (m, 2H), 6.63 (dd, J = 1.9,
0.9 Hz, 1H), 4.61 (s, 2H), 4.56 (q, J = 6.1, 6.1, 6.1 Hz, 1H), 3.51 -3.35 (m, 4H), 3.29 (d, J = 2.2
Hz, 2H), 2.48 (dt, J = 11.0, 5.1, 5.1 Hz, 2H), 2.20 (tt, J = 10.8, 10.8, 5.1, 5.1 Hz, 2H), 1.25 (d, J =
6.0 Hz, 3H), 1.18 (d, J = 6.0 Hz, 3H). HRMS (m/z): [M+] cald for C34H33ClN4O5 613.1, found
613.22.
14MEW31. Prepared from 5-chloro-3-(2-isopropoxyphenyl)-2-(piperazin-1-
ylmethyl)quinazolin-4(3H)-one using general acyl chloride addition procedure (122 mg, 87%
yield).1H NMR (300 MHz, chloroform-d) δ 7.70-7.59 p.p.m. (m, 2H), 7.50 (dd, J = 5.5, 3.6 Hz,
1H), 7.47-7.39 (m, 1H), 7.28-7.23 (m, 2H), 7.13-7.03 (m, 2H), 6.92-6.82 (m, 2H), 4.64 (s, 2H),
4.57 (p, J = 6.1, 6.1, 6.1, 6.1 Hz, 1H), 3.51 (d, J = 14.4 Hz, 4H), 3.25 (s, 2H), 2.48 (s, 2H), 2.25
(s, 2H), 1.26 (d, J = 6.0 Hz, 3H), 1.19 (d, J = 6.0 Hz, 3H). HRMS (m/z): [M+] cald for
C30H30Cl2N4O4 581.49, found 581.17
165
14MEW32. Prepared from 8-chloro-3-(2-isopropoxyphenyl)-2-(piperazin-1-
ylmethyl)quinazolin-4(3H)-one using general acyl chloride addition procedure (77 mg, 55%
yield). 1H NMR (300 MHz, chloroform-d) δ 8.23 p.p.m. (dd, J = 8.0, 1.5 Hz, 1H), 7.87 (dd, J =
7.8, 1.5 Hz, 1H), 7.52-7.38 (m, 2H), 7.28-7.21 (m, 4H), 7.13-7.01 (m, 2H), 6.93-6.81 (m, 2H),
4.66 (s, 2H), 4.64-4.47 (m, 1H), 3.54 (s, 4H), 3.33 (d, J = 3.0 Hz, 2H), 2.64 (s, 1H), 2.54 (s, 1H),
2.44 (s, 1H), 2.33 (s, 1H), 1.26 (d, J = 6.1 Hz, 3H), 1.18 (d, J = 6.0 Hz, 3H). HRMS (m/z): [M+]
cald for C30H30Cl2N4O4 581.49, found 581.17
13MEW16. Prepared from 3-(3-isopropoxyphenyl)-2-(piperazin-1-ylmethyl)quinazolin-4(3H)-
one using general acyl chloride addition procedure (100 mg, 54%). 1H NMR (400 MHz,
chloroform-d) δ 8.37-8.27 p.p.m. (m, 1H), 7.82 (ddd, J = 8.4, 6.9, 1.5 Hz, 1H), 7.76 (d, J = 8.4
Hz, 1H), 7.54 (ddd, J = 8.2, 7.0, 1.4 Hz, 1H), 7.43 (t, J = 8.0, 8.0 Hz, 1H), 7.28- 7.18 (m, 2H),
7.10-6.94 (m, 1H), 6.88 (dd, J = 9.3, 2.1 Hz, 4H), 4.65 (s, 2H), 4.58 (p, J = 6.1, 6.1, 6.0, 6.0 Hz,
1H), 3.53 (dt, J = 22.0, 5.0, 5.0 Hz, 4H), 3.32 (s, 2H), 2.40 (ddt, J = 27.6, 9.7, 5.0, 5.0 Hz, 4H),
1.38 (dd, J = 6.3, 1.5 Hz, 6H). HRMS (m/z): [M+] cald for C30H31ClN4O4 547.04, found
547.21.
13MEW76. Prepared from 3-(2-isopropoxyphenyl)-2-(piperazin-1-ylmethyl)quinazolin-4(3H)-
one using general acyl chloride addition procedure (270 mg, 62% yield). 1H NMR (300 MHz,
chloroform-d) δ 8.32 p.p.m. (dd, J = 8.0, 1.4 Hz, 1H), 7.87-7.71 (m, 2H), 7.57-7.40 (m, 2H),
7.28-7.21 (m, 3H), 7.13-7.00 (m, 2H), 6.91-6.84 (m, 2H), 4.64 (s, 2H), 4.61-4.48 (m, 1H), 3.50
(s, 4H), 3.28 (s, 2H), 2.44 (s, 2H), 2.23 (s, 2H), 1.24 (d, J = 6.0 Hz, 3H), 1.16 (d, J = 6.0 Hz, 3H).
HRMS (m/z): [M+] cald for C30H31ClN4O4 547.04, found 547.21.
166
21MEW26. Prepared from 3-(5-bromo-2-isopropoxyphenyl)-2-(piperazin-1-
ylmethyl)quinazolin-4(3H)-one (1.87 g, 70% yield). 1H NMR (400 MHz, chloroform-d) δ 8.36-
8.26 p.p.m. (m, 1H), 7.81-7.70 (m, 2H), 7.54-7.39 (m, 2H), 7.27-7.16 (m, 3H), 7.09 (td, J = 7.9,
7.4, 4.1 Hz, 2H), 6.92-6.80 (m, 2H), 4.73 (s, 1H), 4.61 (s, 1H), 4.57 (ddt, J = 9.2, 6.1, 3.1, 3.1
Hz, 1H), 3.49-3.30 (m, 4H), 3.01 (s, 1H), 2.90 (s, 2H), 2.82-2.44 (m, 2H), 2.29 (d, J = 15.6 Hz,
3H), 1.25 (d, J = 3.7 Hz, 3H), 1.16 (dd, J = 6.3, 1.3 Hz, 3H). HRMS (m/z): [M+] cald for
C30H33ClN4O4 549.04, found 549.22
10MEW79. Prepared from 6-fluoro-3-(2-isopropoxyphenyl)-2-(piperazin-1-
ylmethyl)quinazolin-4(3H)-one using general acyl chloride addition procedure (0.296 mg, 69%
yield). 1H NMR (400 MHz, chloroform-d) δ 7.95 p.p.m. (dd, J = 8.4, 3.0 Hz, 1H), 7.76 (dd, J =
9.0, 4.8 Hz, 1H), 7.52 (td, J = 8.6, 8.5, 2.8 Hz, 1H), 7.48-7.41 (m, 1H), 7.28-7.17 (m, 3H), 7.16-
7.02 (m, 2H), 6.91-6.81 (m, 2H), 4.64 (s, 2H), 4.57 (p, J = 6.1, 6.1, 6.0, 6.0 Hz, 1H), 3.61-3.39
(m, 4H), 3.27 (s, 2H), 2.46 (dq, J = 22.1, 7.0, 7.0, 4.7 Hz, 2H), 2.24 (ddt, J = 30.1, 10.7, 4.3, 4.3
Hz, 2H), 1.25 (d, J = 6.1 Hz, 3H), 1.17 (d, J = 6.0 Hz, 3H). HRMS (m/z): [M+] cald for
C30H30ClFN4O4 565.04, found 565.2.
8MEW98. Prepared from 3-(2-isopropoxyphenyl)-6,7-dimethoxy-2-(piperazin-1-
ylmethyl)quinazolin-4(3H)-one using the general acyl chloride addition procedure (54 mg, 53%
yield). 1H NMR (300 MHz, chloroform-d) δ 7.64 p.p.m. (s, 1H), 7.50 - 7.39 (m, 1H), 7.28 - 7.16
(m, 5H), 7.13-7.02 (m, 2H), 6.92 - 6.82 (m, 2H), 4.64 (s, 2H), 4.57 (q, J = 6.1, 6.1, 6.0 Hz, 1H),
167
4.03 (d, J = 9.2 Hz, 5H), 3.50 (d, J = 17.6 Hz, 4H), 3.24 (d, J = 1.8 Hz, 2H), 2.46 (s, 2H), 2.20 (s,
2H), 1.24 (d, J = 6.1 Hz, 3H), 1.17 (d, J = 6.0 Hz, 3H). HRMS (m/z): [M+] cald for
C32H35ClN4O6 607.1, found 607.23.
Methods for analog synthesis and testing are described in: Cantley, A. M. et al. Small molecule
that reverses dexamethasone resistance in t-cell acute lymphoblastic leukemia (T-ALL). ACS
Med. Chem. Lett. 5, 754–759 (2014).
1-cyclopropyl-2-(pyridin-4-yl)ethanone
To a solution of 4-picoline (1.57 mL, 16.1 mmol) in THF at 0° C LDA (2 M, 8.86 mL, 17.7
mmol, 1.1 mol equiv) was added dropwise over 5 minutes. After 1 h a solution of ethyl
cyclopropyl carboxylate (2.49 mL, 20.9 mmol, 1.3 mol equiv) was added and stirred at 0 °C for
30 min before being warmed to 25 °C and stirred for an additional 6 h. Upon completion, the
reaction was quenched with water and the product was extracted with EtOAc (3 X). The
combined organic layers were dried (sodium sulfate), concentrated, and the crude material was
purified by combiflash 0-> 80% EtOAc in hexanes to provide
1-cyclopropyl-2-(pyridin-4-yl)ethanone (0.505 g, 19.5 % yield). 1H NMR (400 MHz,
Chloroform-d) δ 8.64-8.47 p.p.m. (m, 2H), 7.22-7.03 (m, 2H), 3.87 (s, 2H), 1.99 (tt, J = 7.8, 4.5
Hz, 1H), 1.16-1.01 (m, 2H), 0.94 (dt, J = 8.1, 3.5 Hz, 2H). HRMS (m/z): [M+] cald for
C10H11NO, 161.20, found 161.89
168
(E)-1-cyclopropyl-3-(dimethylamino)-2-(pyridin-4-yl)prop-2-en-1-one
N,N-dimethylformamide dimethyl acetal (0.43 mL, 3.24 mmol, 2.0 mol equiv) was added
2 (261 mg, 1.62 mmol) and heated to 90 °C, neat for 6 h. Upon completion excess reagent was
evaporated and the residue was dissolved in water and extracted with DCM (3 X). The combined
organic layers were dried (sodium sulfate), concentrated and the crude material was pushed
forward to the next step.
4-cyclopropyl-5-(pyridin-4-yl)pyrimidin-2-amine (1)
To a solution of sodium ethoxide (242 mg, 3.51 mmol, 1.1 mol equiv) in ethanol 8 mL,
guanidine hydrochloride (335 mg, 3.51 mmol, 1.1 mol equiv) was added and stirred for 30 min
before the addition of a solution of (E)-1-cyclopropyl-3-(dimethylamino)-2-(pyridin-4-yl)prop-2-
en-1-one (0.7 g, 3.24 mmol) in ethanol (2 mL) at 25 °C. The reaction was stirred at 40 °C for 4
h. Upon completion, the reaction was diluted with water and extracted 3 times with ethyl acetate.
The combined organic layers were dried (sodium sulfate), concentrated and purifed by
combiflash 0->2% MeOH in DCM to provide 4-cyclopropyl-5-(pyridin-4-yl)pyrimidin-2-amine
(360 mg, 16% yield). H1 NMR (400 MHz, Chloroform-d) δ 8.78 -8.59 p.p.m. (m, 2H), 8.08 (s,
1H), 7.43-7.33 (m, 2H), 5.11 (s, 2H), 1.97 (tt, J = 8.0, 4.7 Hz, 1H), 1.30-1.18 (m, 2H), 0.96 (dq, J
= 8.2, 3.6 Hz, 2H). 13C NMR (101 MHz, CDCl3) δ 169.75, 162.56, 156.86, 149.96, 145.04,
124.33, 14.09, 11.32. HRMS (m/z): [M+] cald for C12H12N4, 212.25, found 212.4
1-cyclopropyl-2-(4-methoxyphenyl)ethanone
169
To a stirred solution of 4-methoxyphenacetyl chloride (0.5 g, 2.71 mmol) and copper
bromide (0.389 g, 1.0 mol equiv) in THF at 0 °C, cyclopropylmagnesium bromide solution (0.5
M in THF, 6 mL, 2.98 mmol, 1.1 mol equiv) was added over 20 minutes. The resulting mixture
was slowly warmed to room temp and stirred for an additional 4 h. Upon completion, the
reaction was quenched with a saturated solution of ammonium chloride and the crude material
was extracted three times with ethyl acetate. The combined organic layers were dried (sodium
sulfate), concentrated, and purified by combiflash 0->50% EtOAc in hexanes to yield 1-
cyclopropyl-2-(4-methoxyphenyl)ethanone (136 mg, 26% yield). 1H NMR (400 MHz,
Chloroform-d) δ 7.20-7.08 p.p.m. (m, 2H), 6.97- 6.83 (m, 2H), 3.83 (s, 4H), 3.79 (s, 2H), 2.01-
1.94 (m, 1H), 1.08-0.99 (m, 2H), 0.87 (dt, J = 8.1, 3.4 Hz, 2H). HRMS (m/z): [M+] cald for
C12H14O2, 190.24, found 212.4.
4-cyclopropyl-5-(pyridin-3-yl)pyrimidin-2-amine (2)
Prepared according to scheme 1 using 3-picoline in place of 4-picoline in step (a). 1H NMR (400
MHz, Chloroform-d) δ 8.69 p.p.m. (dd, J = 2.3, 0.9 Hz, 1H), 8.63 (dd, J = 4.8, 1.7 Hz, 1H), 8.07
(s, 1H), 7.74 (dt, J = 7.8, 2.0 Hz, 1H), 7.39 (ddd, J = 7.8, 4.8, 0.9 Hz, 1H), 5.10 (s, 2H), 1.90 (tt, J
= 8.0, 4.7 Hz, 1H), 1.25-1.18 (m, 2H), 0.99-0.90 (m, 2H). HRMS (m/z): [M+] cald for
C12H12N4, 212.25, found 212.4.
4-cyclopropyl-5-(pyridin-2-yl)pyrimidin-2-amine (3)
170
Prepared according to scheme 1 using 2-picoline in place of 4-picoline in step (a). 1H NMR (400
MHz, Chloroform-d) δ 8.72 p.p.m. (ddd, J = 4.9, 1.9, 0.9 Hz, 1H), 8.29 (s, 1H), 7.75 (td, J = 7.7,
1.9 Hz, 1H), 7.49 (dt, J = 7.9, 1.1 Hz, 1H), 7.29- 7.16 (m, 1H), 5.20 (s, 2H), 2.25 (tt, J = 8.0, 4.7
Hz, 1H), 1.21 (dq, J = 4.7, 3.6 Hz, 2H), 0.94 (dq, J = 8.1, 3.6 Hz, 2H). HRMS (m/z): [M+] cald
for C12H12N4, 212.25, found 213.11.
4-cyclopropyl-5-(quinolin-4-yl)pyrimidin-2-amine (4)
Prepared according to scheme 1 using lepidine in place of 4-picoline in step (a). 1H NMR
(400 MHz, Chloroform-d) δ 9.01 p.p.m. (d, J = 4.3 Hz, 1H), 8.21 (dt, J = 8.5, 1.0 Hz, 1H), 8.11
(s, 1H), 7.84-7.71 (m, 2H), 7.57 (ddd, J = 8.3, 6.8, 1.2 Hz, 1H), 7.38 (d, J = 4.3 Hz, 5 H), 5.02
(s, 2H), 1.50 (tt, J = 8.0, 4.6 Hz, 1H), 1.27-1.09 (m, 2H), 0.83 (dddd, J = 6.8, 5.7, 4.3, 1.9 Hz,
2H). HRMS (m/z): [M+] cald for C16H14N4, 262.31, found 262.12.
4-cyclopropyl-5-phenylpyrimidin-2-amine (5)
Prepared according to scheme 1, using 1-cyclopropyl-2-phenylethanone (prepared using the
procedure for 1-cyclopropyl-2-(4-methoxyphenyl)ethanone) for step (b) in place of 1-
cyclopropyl-2-(pyridin-4-yl)ethanone. 1H NMR (300 MHz, Chloroform-d) δ 8.08 p.p.m. (s, 1H),
7.55-7.30 (m, 6H), 4.90 (s, 2H), 2.01 (ddd, J = 8.1, 4.8, 3.3 Hz, 1H), 1.25-1.13 (m, 2H), 0.99-
0.82 (m, 2H). HRMS (m/z): [M+] cald for C13H13N3, 211.26, found 212.14.
4-cyclopropyl-5-(4-methoxyphenyl)pyrimidin-2-amine (6)
171
Prepared according to scheme 1, using 1-cyclopropyl-2-(4-methoxyphenyl)ethanone for step (b)
in place of 1-cyclopropyl-2-(pyridin-4-yl)ethanone. 1H NMR (400 MHz, Chloroform-d) δ 8.03
p.p.m. (s, 1H), 7.33-7.26 (m, 2H), 6.97 (d, J = 8.7 Hz, 2H), 4.93 (s, 2H), 3.84 (s, 3H), 1.98 (tt, J =
8.0, 4.7 Hz, 2H), 1.24-1.06 (m, 2H), 0.88 (dq, J = 8.1, 3.5 Hz, 2H). HRMS (m/z): [M+] cald for
C14H15N3O, 241.29, found 242.13.
4-cyclopropyl-5-(4-fluorophenyl)pyrimidin-2-amine (7)
Prepared according to scheme 1, using 1-cyclopropyl-2-(4-fluorophenyl)ethanone (prepared
using the procedure for 1-cyclopropyl-2-(4-methoxyphenyl)ethanone) for step
(b) in place of 1-cyclopropyl-2-(pyridin-4-yl)ethanone. 1H NMR (400 MHz, Chloroform-d) δ
8.04 p.p.m. (s, 1H), 7.42-7.32 (m, 2H), 7.14 (t, J = 8.7 Hz, 2H), 5.06 (s, 2H), 1.94 (tt, J = 8.0, 4.7
Hz, 1H), 1.23-1.14 (m, 2H), 0.97-0.80 (m, 2H). HRMS (m/z): [M+] cald for C13H12FN3,
229.25, found 229.10.
5-(3-bromopyridin-4-yl)-4-cyclopropylpyrimidin-2-amine (8)
Prepared according to scheme 1, starting from 3-bromo-4-methylpyridine for step (a) in place of
4-picoline. 1H NMR (300 MHz, Chloroform-d) δ 8.86 p.p.m. (d, J = 0.6 Hz, 1H), 8.60 (d, J = 4.9
Hz, 1H), 7.99 (s, 1H), 7.28 (d, J = 1.5 Hz, 2H), 5.01 (s, 2H), 1.59-1.47 (m, 1H), 1.36-1.06 (m,
3H), 0.94 (d, J = 21.4 Hz, 2H). HRMS (m/z): [M+] cald for C12H11BrN4, 291.15, found 290.50.
4-cyclopropyl-5-(3-vinylpyridin-4-yl)pyrimidin-2-amine (9)
To a solution of 5-(3-bromopyridin-4-yl)-4-cyclopropylpyrimidin-2-amine (60 mg, 0.206 mmol)
and tetrakis(triphenylphosphine)palladium(0) (0.0103 mmol, 5%), tributylvinyl tin (0.309 mmol,
172
1.5 mol equiv) was added and heated to 80 °C for 24 h. Upon completion, a 1 M solution of KF
(0.309 mL, 0.309 mmol, 1.5 mol equiv) was added and stirred for 12 h at 25 °C. The mixture
was then filtered over celite, diluted with water and extracted 3X with ethyl acetate. The
combined organic layers were dried (sodium sulfate), concentrated, and purified by preparative
TLC 2% MeOH in DCM to provide 4-cyclopropyl-5-(3-vinylpyridin-4-yl)pyrimidin-2-amine (15
mg, 31% yield). 1H NMR (300 MHz, Chloroform-d) δ 8.87 p.p.m. (s, 1H), 8.54 (dd, J = 5.0, 1.3
Hz, 1H), 7.94 (d, J = 1.3 Hz, 1H), 7.17 (dd, J = 5.0, 0.8 Hz, 1H), 6.57 (dd, J = 17.7, 11.2 Hz, 1H),
5.78 (dd, J = 17.7, 1.0 Hz, 1H), 5.33 (dd, J = 11.2, 1.0 Hz, 1H), 5.21-4.88 (m, 2H), 1.56 (ddd, J =
9.2, 4.6, 3.2 Hz, 1H), 1.22-1.03 (m, 2H), 0.99- 0.76 (m, 2H). HRMS (m/z): [M+] cald for
C14H14N4, 238.29, found 238.12.
4-cyclopropyl-5-(3-phenylpyridin-4-yl)pyrimidin-2-amine (10)
To a stirred solution of 5-(3-bromopyridin-4-yl)-4-cyclopropylpyrimidin-2-amine (60 mg, 0.206
mmol), phenyboronic acid (38 mg, 0.309 mmol, 1.5 mol equiv),
Tetrakis(triphenylphosphine)palladium(0) (0.0103 mmol, 5%), a 2M solution of sodium
carbonate (0.525 mL, 1.03 mmol, 5.0 mol equiv) was added. The resulting mixture was heated to
80 °C for 24 h. Upon completion, the reaction was diluted with water and extracted with ethyl
acetate 3X. The combined organic layers were dried (sodium sulfate), concentrated and purified
by preparative TLC, 1:1 ethylacetate in hexanes to yield 4-cyclopropyl-5-(3-phenylpyridin-4-
yl)pyrimidin-2-amine (35 mg, 58% yield). 1H NMR (300 MHz, Chloroform-d) δ 8.74-8.62
p.p.m. (m, 2H), 7.85 (d, J = 1.2 Hz, 1H), 7.35-7.23 (m, 4H), 7.23 -7.11 (m, 2H), 4.99 (s, 2H),
3.52-3.43 (m, 1H), 2.05 (d, J = 9.1 Hz, 1H), 1.43-0.45 (m, 5H). HRMS (m/z): [M+] cald for
C18H16N4, 288.35, found 289.10.
173
4-cyclopropyl-5-(3-(furan-3-yl)pyridin-4-yl)pyrimidin-2-amine (11)
Prepared from compound 8, according to the conditions described for compound 10. 1H NMR
(300 MHz, Chloroform-d) δ 8.74 p.p.m. (d, J = 0.8 Hz, 1H), 8.58 (d, J = 5.0 Hz, 1H), 7.93 (s,
1H), 7.38 (t, J = 1.7 Hz, 1H), 7.33-7.15 (m, 3H), 6.26 (dd, J = 1.9, 0.9 Hz, 1H), 5.01 (s, 2H), 1.50
(td, J = 8.0, 3.9 Hz, 1H), 0.87 (dd, J = 84.0, 44.1 Hz, 5H). HRMS (m/z): [M+] cald for
C16H14N4O, 278.31, found 279.10.
5-(2-bromopyridin-4-yl)-4-cyclopropylpyrimidin-2-amine (12)
Prepared according to scheme 1, starting from 2-bromo-4-methylpyridine for step (a) in
place of 4-picoline. 1H NMR (300 MHz, Chloroform-d) δ 8.42 p.p.m. (dd, J = 5.1, 0.7 Hz, 1H),
8.29 (d, J = 5.0 Hz, 1H), 8.05 (s, 1H), 7.56 (dd, J = 1.6, 0.7 Hz, 1H), 7.45-7.35 (m,
1H), 7.37-7.27 (m, 1H), 7.17 (dd, J = 5.1, 1.5 Hz, 1H), 5.11 (d, J = 9.2 Hz, 2H), 1.91 (tt, J
= 8.0, 4.7 Hz, 1H), 1.24 (ddt, J = 6.5, 4.6, 2.5 Hz, 3H), 1.10- 0.86 (m, 2H). 13C NMR (101 MHz,
CDCl3) 169.80, 162.76, 156.87, 150.05, 148.01, 142.58, 128.25, 123.44, 121.20, 14.15, 11.46.
HRMS (m/z): [M+] cald for C13H12FN3, 229.25, found 229.91.
4-cyclopropyl-5-(2-(furan-3-yl)pyridin-4-yl)pyrimidin-2-amine (13)
Prepared from compound 12, using the conditions described for compound 10. 1H NMR (400
MHz, Chloroform-d) δ 8.65 p.p.m. (dd, J = 5.1, 0.9 Hz, 1H), 8.14-8.06 (m, 2H), 7.57-7.50 (m,
2H), 7.23 (dd, J = 5.1, 1.7 Hz, 1H), 6.94 (dd, J = 1.8, 0.9 Hz, 1H), 5.00 (s, 2H), 2.00 (tt, J = 8.0,
174
4.7 Hz, 1H), 1.30-1.15 (m, 3H), 1.07-0.94 (m, 2H). 13C NMR (101 MHz, CDCl3) 169.34,
162.17, 156.89,150.63, 134.93, 131.03, 130.52, 130.36, 128.46, 123.45, 121.80, 14.01, 11.11.
HRMS (m/z): [M+] cald for C16H14N4O, 278.31, found 278.01.
4-isopropyl-5-(pyridin-4-yl)pyrimidin-2-amine (14)
Prepared according to scheme 1, using ethyl isobutyrate for step (a) in place of ethyl cyclopropyl
carboxylate. 1H NMR (400 MHz, Chloroform-d) δ 8.70-8.58 (m, 2H), 8.09 (s, 1H), 7.23-7.18
(m, 2H), 5.06 (s, 2H), 3.03 (hept, J = 6.7 Hz, 1H), 1.18 (d, J = 6.7 Hz, 6H). HRMS (m/z): [M+]
cald for C12H14N4, 214.27, found 214.12.
4-methyl-5-(pyridin-4-yl)pyrimidin-2-amine (15)
Prepared according to scheme 1, using ethyl acetate for step (a) in place of ethyl cyclopropyl
carboxylate.1H NMR (300 MHz, Chloroform-d) δ 8.71- 8.58 p.p.m. (m, 2H), 8.14 (s, 1H), 7.24-
7.18 (m, 2H), 5.07 (s, 2H), 2.37 (s, 3H). HRMS (m/z): [M+] cald for C10H10N4, 186.21, found
187.10.
5-(pyridin-4-yl)pyrimidin-2-amine (16)
Prepared from 2-amino 5-bromopyrimidine and 4-pyridinyl boronic acid, using the conditions
described for compound 10. 1H NMR (400 MHz, Chloroform-d) δ 8.75-8.66 p.p.m. (m, 2H),
8.63 (s, 2H), 7.47-7.38 (m, 2H), 5.37 (s, 2H). HRMS (m/z): [M+] cald for C9H8N4, 172.19,
found 173.08.
4-cyclobutyl-5-(pyridin-4-yl)pyrimidin-2-amine (17)
175
Prepared according to scheme 1, using ethyl cyclobutanecarboxylate for step (a) in place of ethyl
cyclopropyl carboxylate. 1H NMR (400 MHz, Chloroform-d) δ 8.70-8.60 p.p.m. (m, 2H), 8.08
(s, 1H), 7.19- 7.11 (m, 2H), 5.11 (s, 2H), 3.70 -3.50 (m, 1H), 2.57-2.35 (m, 2H), 2.16-1.99 (m,
2H), 1.99-1.83 (m, 2H). HRMS (m/z): [M+] cald for C13H14N4, 226.28, found 226.12.
4-phenyl-5-(pyridin-4-yl)pyrimidin-2-amine (18)
Prepared according to scheme 1, using ethyl benzoate for step (c) in place of ethyl cyclopropyl
carboxylate. 1H NMR (400 MHz, Chloroform-d) δ 8.57- 8.48 p.p.m. (m, 2H), 8.37 (s, 1H), 7.43-
7.30 (m, 5H), 7.10- 7.04 (m, 2H), 5.38 (s, 2H). HRMS (m/z): [M+] cald for C15H12N4, 248.28,
found 247.10.
4-(furan-2-yl)-5-(pyridin-4-yl)pyrimidin-2-amine (19)
Prepared according to scheme 1, using ethyl 3-furoate for step (a) in place of ethyl cyclopropyl
carboxylate. 1H NMR (400 MHz, chloroform-d) δ 8.74-8.64 p.p.m. (m, 2H), 8.21 (s, 1H), 7.45
(dd, J = 1.8, 0.8 Hz, 1H), 7.27- 7.20 (m, 2H), 6.57 (dd, J = 3.6, 0.8 Hz, 1H), 6.41 (dd, J = 3.5, 1.7
Hz, 1H). HRMS (m/z): [M+] cald for C13H10N4O, 238.24, found 239.1.
4-cyclopropyl-2-methyl-5-(pyridin-4-yl)pyrimidine (20)
Prepared according to scheme 1, using acetamidine hydrochloride for step (c) in place of
guanidine hydrochloride. 1H NMR (300 MHz, Chloroform-d) δ 8.77- 8.67 p.p.m. (m, 2H),
8.34 (s, 1H), 7.40- 7.35 (m, 2H), 2.66 (s, 3H), 1.97 (tt, J = 8.0, 4.7 Hz, 1H), 1.35-1.23 (m,
176
2H), 1.07- 0.94 (m, 2H). HRMS (m/z): [M+] cald for C13H13N3, 211.22, found 212.12.
4-cyclopropyl-5-(2-fluoropyridin-4-yl)pyrimidin-2-amine (21)
Prepared according to scheme 1 using 2-fluoro-4-methylpyridine for step (a). 1H NMR
(400 MHz, Chloroform-d) δ 8.29 (d, J = 5.2 Hz, 1H), 8.09 (s, 1H), 7.38-7.19 (m, 1H),
7.01 (t, J = 1.6 Hz, 1H), 5.38-4.92 (m, 2H), 1.94 (td, J = 8.0, 4.0 Hz, 1H), 1.31-1.13 (m,
2H), 1.07 ? 0.94 (m, 2H). HRMS (m/z): [M+] cald for C12H11FN4, 230.25, found 231.1.
5-(2-chloropyridin-4-yl)-4-cyclopropylpyrimidin-2-amine (22)
Prepared according to scheme 1 using 2-chloro-4-methylpyridine for step (a). 1H NMR (400
MHz, Chloroform-d) δ 8.45 (dd, J = 5.2, 0.7 Hz, 1H), 8.07 (s, 1H), 7.41 (dd, J = 1.5, 0.7 Hz, 1H),
7.33-7.25 (m, 1H), 5.12 (s, 2H), 1.92 (tt, J = 8.0, 4.7 Hz, 1H), 1.34-1.16 (m, 2H), 1.00 (dt, J =
8.0, 3.3 Hz, 2H). HRMS (m/z): [M+] cald for C12H11ClN4, 246.70, found 247.07.
4-cyclopropyl-5-(2,6-dichloropyridin-4-yl)pyrimidin-2-amine (23)
Prepared according to scheme 1 using 2,6-dichloro-4-methylpyridine for step (a). 1H NMR (400
MHz, Chloroform-d) δ 8.06 (s, 1H), 7.34 (s, 2H), 5.16 (s, 2H), 1.89 (td, J = 8.0, 4.0 Hz, 1H),
1.33-1.19 (m, 2H), 1.03 (dt, J = 8.0, 3.4 Hz, 2H). HRMS (m/z): [M+] cald for C12H10Cl2N4,
281.14, found 281.04.
177
Chapter 5: Conclusions and future directions
This thesis presents the development of two approaches for targeting protein-protein
interactions and their application towards inhibiting RAS GTPases. The first utilizes a
pharmacophore screen and focused in silico library design to find compounds that are capable of
interacting with ‘hot spot’ residues at the protein-protein interface. The second entails the design
of ligands making multiple contacts on a target using iterative cycles of in silico library design
and molecular docking. The other portion of this thesis is focused on medicinal chemistry and
strategies for the optimization of two anticancer agents.
I. Pharmacophore strategy
Ia. Summary
At the interface of two interacting proteins certain residues confer a larger portion of the
overall binding affinity [87]. The pharmacophore approach described in this work attempts to
encapsulate those interactions in the form of a searchable model to discover competitive
inhibitors to the desired target.
This model was designed based on key interactions of RAS with its three canonical
effector proteins: RAF, PI3K, and RALGDS. The screening of existing chemical libraries was
unsuccessful in yielding adequate matches to these properties, which motivated the rational
design of molecular libraries to match target specific features. This yielded much closer matches
and led to the discovery of compounds that were capable of binding to RAS as well as
preventing the RAS-RAF and RAS-RALGDS interactions, albeit at millimolar concentrations.
178
Ib. Significance
The inhibition of protein-protein interactions has been historically challenging with β-
strand mediated interactions, such as those that RAS engages in, being particularly difficult [8].
This method can be applied to other protein-protein interactions if co-crystallographic and
mutagenesis data is available. This approach could also be used in combination with molecular
docking to yield compounds with higher affinity than the described pharmacophore hits in this
work.
II. PAINT strategy
IIa. Summary
The pharmacophore approach motivated an alternative strategy in which multiple
contacts are made on the surface of RAS- PAINT. The design process first entails the docking of
ligands into sites on a desired target that typically lack the properties of a conventional drug
binding site, with the idea being that multiple contact points would confer enough binding
affinity to be in the ideal drug range. This initial screen is used to find enriched molecular
architectures in the top scoring molecules. Once identified, in silico libraries are designed in a
given site using the underlying structure but with ‘linkage mimics’ to an adjacent site and
additional points of diversity based on synthetic modifications that can be made. This library is
then docked and top scoring compounds are selected, and subsequently amended to the
underlying enriched structure in the next site. The resulting two-site spanning library undergoes
the same process of in silico design introducing points of diversity based on possible synthetic
modifications. This process led to the discovery of the compound 31MEW44, which binds to
179
RAS with low micromolar affinity and has showed RAS inhibiting activity in cell culture as well
as activity in three different murine cancer models.
IIb. Significance
The hope of this work is that the PAINT process can be used as an inhibitor design
platform and be applied to other challenging targets. With the improving accuracy of docking
algorithms and ever increasing number of published protein structures, strategies such as PAINT
could prove to be valuable methods for the discovery of new biological tools and therapeutic
agents.
This is the first reported instance of a direct RAS inhibitor showing efficacy in a patient
derived mouse xenograft model and evidence of the inhibition of RAS signaling in a genetically
engineered mouse model. This molecule can be used as a tool for studying RAS function both in
vitro and in vivo, and may lead to a new cancer drug.
IIc. Future directions
The improvement of the potency of 31MEW44 through more extensive medicinal
chemistry efforts is warranted before therapeutic translation. This would be aided greatly by
additional characterization of the mode of binding of 31MEW44, such as a crystal structure
bound to RAS. Attempts at extending into the Y32 site were unsuccessful at significantly
improving binding affinity. With more knowledge of the precise mode of binding, additional
ways of amending groups into the Y32 site or another adjacent site could be accomplished and
the potency further improved.
180
Another direction of this project is further studies in murine cancer models. The toxicity
observed in the KPf/fC model suggests that 31MEW44 would be more effective in a model that
doesn’t utilize the Cre-lox system to obtain tissue specific expression. Recent advances in mouse
models using crisper-cas have been successful in achieving tissue specific expression, as well as
the simultaneous editing of multiple genes with only a single transfection of embryonic stem
cells [83]. Using a mouse model with this system would be ideal for further studies of the
pharmacological utility of 31MEW44 or an improved analog.
Most importantly, the hope of this work is that the strategies implemented can be applied
to other challenging targets. Current efforts in the Stockwell lab by Michael Gaschler are
towards the development of an inhibitor to RHEB GTPase using this approach. Some exciting
preliminary data suggests that the PAINT approach is indeed applicable to RHEB and hopefully
to other target types.
III. Medicinal chemistry of erastin and J9
IIIa. Summary
Described in this work is the systematic modification of two anti-cancer agents with
novel mechanisms of action. Each molecule was broken down into regions based on synthetic
disconnection points and underwent iterative cycles of analog synthesis and biological
evaluation. The potency and selectivity of both molecules was improved and an analog of erastin
was discovered that showed activity in a mouse xenograft.
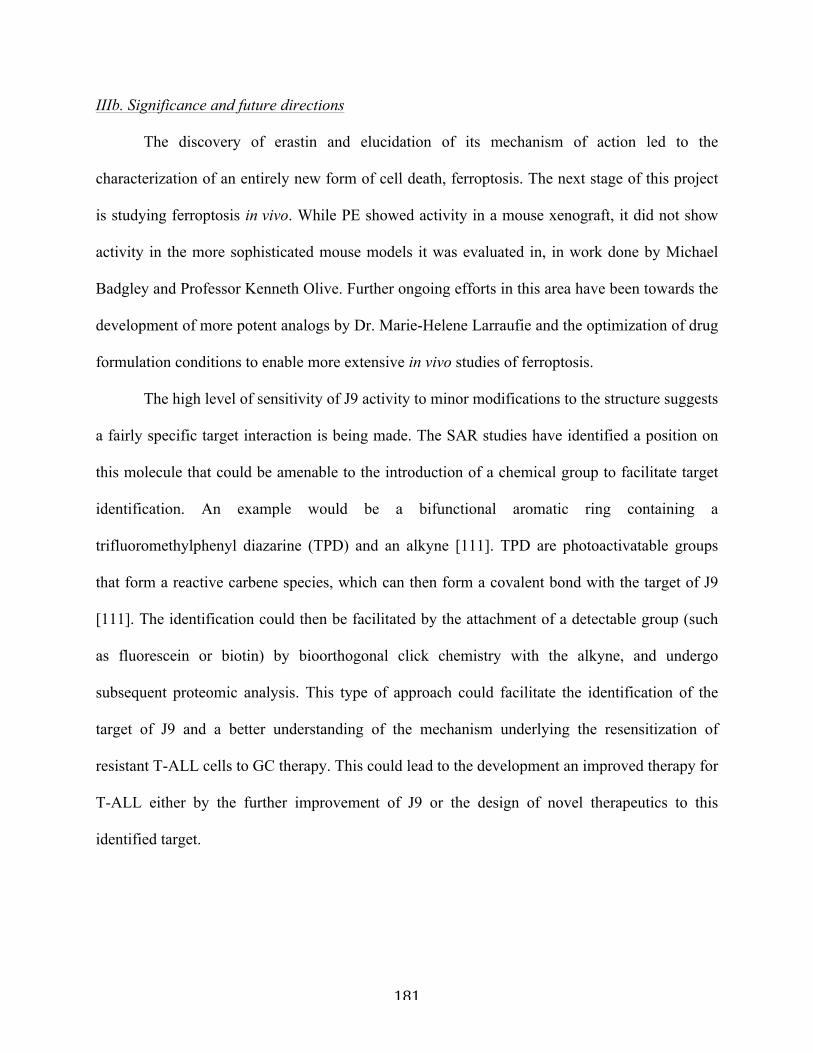
181
IIIb. Significance and future directions
The discovery of erastin and elucidation of its mechanism of action led to the
characterization of an entirely new form of cell death, ferroptosis. The next stage of this project
is studying ferroptosis in vivo. While PE showed activity in a mouse xenograft, it did not show
activity in the more sophisticated mouse models it was evaluated in, in work done by Michael
Badgley and Professor Kenneth Olive. Further ongoing efforts in this area have been towards the
development of more potent analogs by Dr. Marie-Helene Larraufie and the optimization of drug
formulation conditions to enable more extensive in vivo studies of ferroptosis.
The high level of sensitivity of J9 activity to minor modifications to the structure suggests
a fairly specific target interaction is being made. The SAR studies have identified a position on
this molecule that could be amenable to the introduction of a chemical group to facilitate target
identification. An example would be a bifunctional aromatic ring containing a
trifluoromethylphenyl diazarine (TPD) and an alkyne [111]. TPD are photoactivatable groups
that form a reactive carbene species, which can then form a covalent bond with the target of J9
[111]. The identification could then be facilitated by the attachment of a detectable group (such
as fluorescein or biotin) by bioorthogonal click chemistry with the alkyne, and undergo
subsequent proteomic analysis. This type of approach could facilitate the identification of the
target of J9 and a better understanding of the mechanism underlying the resensitization of
resistant T-ALL cells to GC therapy. This could lead to the development an improved therapy for
T-ALL either by the further improvement of J9 or the design of novel therapeutics to this
identified target.
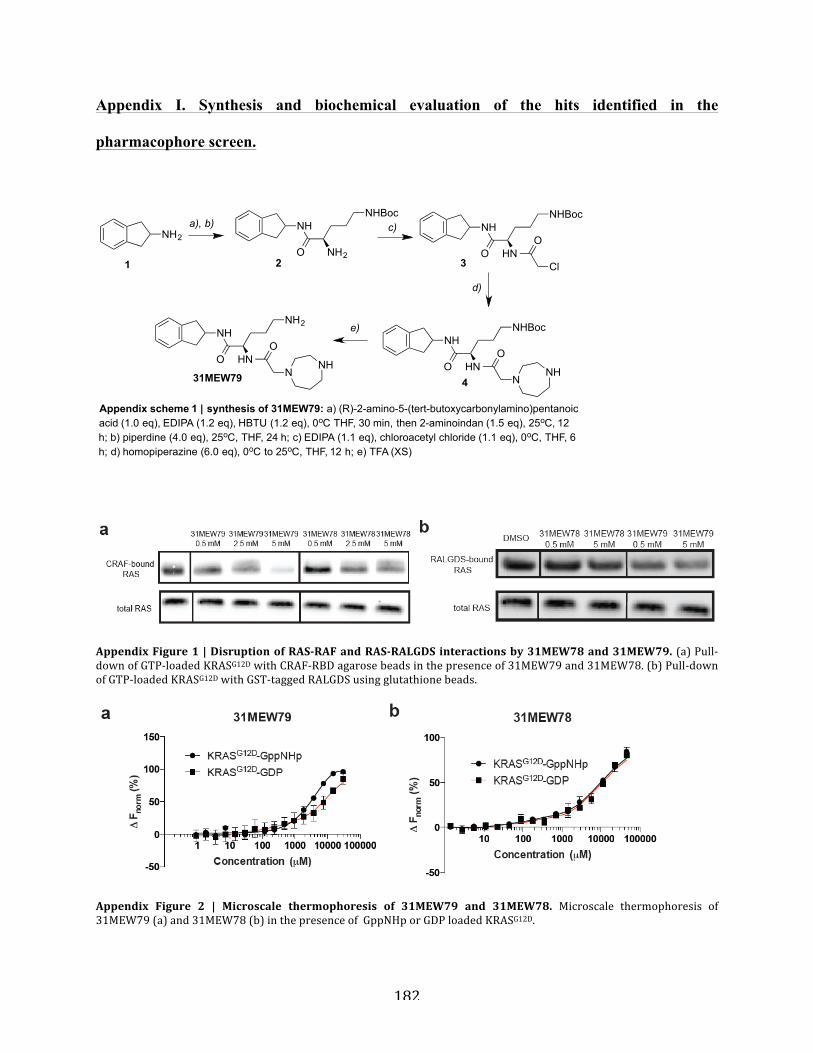
182
Appendix I. Synthesis and biochemical evaluation of the hits identified in the
pharmacophore screen.
Appendix Figure 1 | Disruption of RAS-‐RAF and RAS-‐RALGDS interactions by 31MEW78 and 31MEW79. (a) Pull-‐down of GTP-‐loaded KRASG12D with CRAF-‐RBD agarose beads in the presence of 31MEW79 and 31MEW78. (b) Pull-‐down of GTP-‐loaded KRASG12D with GST-‐tagged RALGDS using glutathione beads.
Appendix Figure 2 | Microscale thermophoresis of 31MEW79 and 31MEW78. Microscale thermophoresis of 31MEW79 (a) and 31MEW78 (b) in the presence of GppNHp or GDP loaded KRASG12D.
NH2
O NH2
NHBocNH
O HN
NHBocNH
O
Cl
O HN
NHBocNH
O
NNH
O HN
NH2NH
O
NNH
a), b) c)
d)
e)
Appendix scheme 1 | synthesis of 31MEW79: a) (R)-2-amino-5-(tert-butoxycarbonylamino)pentanoic acid (1.0 eq), EDIPA (1.2 eq), HBTU (1.2 eq), 0oC THF, 30 min, then 2-aminoindan (1.5 eq), 25oC, 12 h; b) piperdine (4.0 eq), 25oC, THF, 24 h; c) EDIPA (1.1 eq), chloroacetyl chloride (1.1 eq), 0oC, THF, 6 h; d) homopiperazine (6.0 eq), 0oC to 25oC, THF, 12 h; e) TFA (XS)
1 2 3
431MEW79
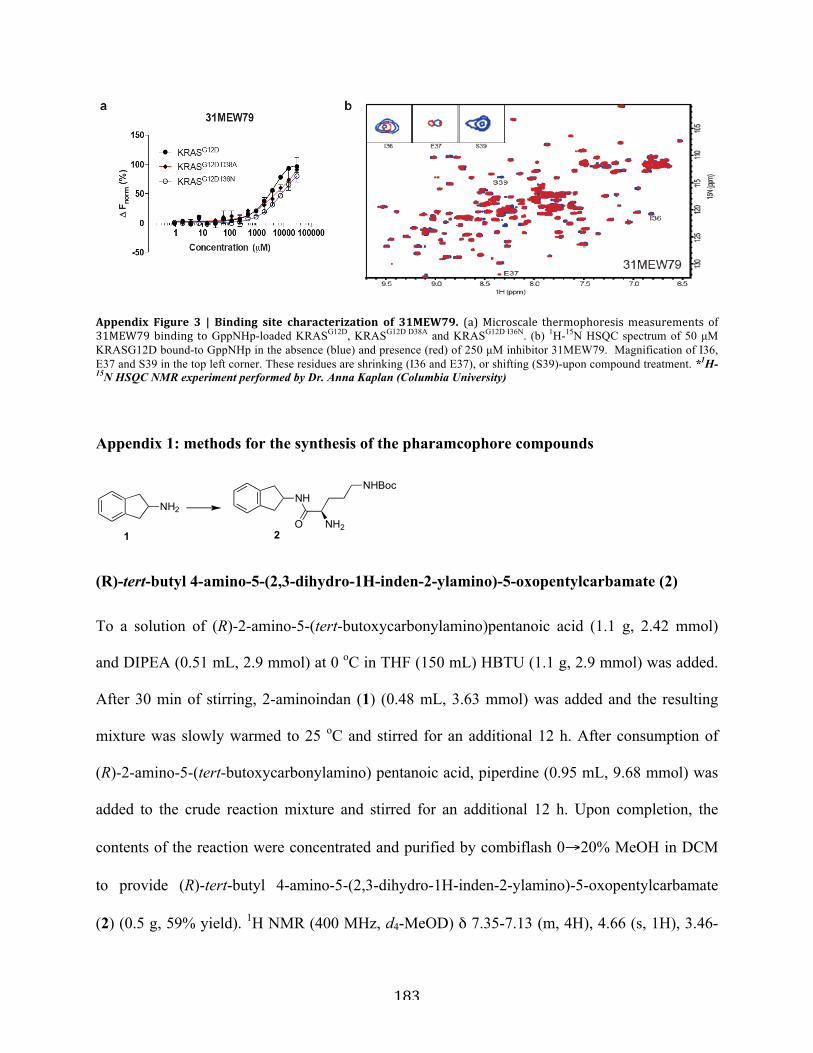
183
Appendix Figure 3 | Binding site characterization of 31MEW79. (a) Microscale thermophoresis measurements of 31MEW79 binding to GppNHp-loaded KRASG12D, KRASG12D D38A and KRASG12D I36N. (b) 1H-15N HSQC spectrum of 50 µM KRASG12D bound-to GppNHp in the absence (blue) and presence (red) of 250 µM inhibitor 31MEW79. Magnification of I36, E37 and S39 in the top left corner. These residues are shrinking (I36 and E37), or shifting (S39)-upon compound treatment. *1H-15N HSQC NMR experiment performed by Dr. Anna Kaplan (Columbia University)
Appendix 1: methods for the synthesis of the pharamcophore compounds
(R)-tert-butyl 4-amino-5-(2,3-dihydro-1H-inden-2-ylamino)-5-oxopentylcarbamate (2)
To a solution of (R)-2-amino-5-(tert-butoxycarbonylamino)pentanoic acid (1.1 g, 2.42 mmol)
and DIPEA (0.51 mL, 2.9 mmol) at 0 oC in THF (150 mL) HBTU (1.1 g, 2.9 mmol) was added.
After 30 min of stirring, 2-aminoindan (1) (0.48 mL, 3.63 mmol) was added and the resulting
mixture was slowly warmed to 25 oC and stirred for an additional 12 h. After consumption of
(R)-2-amino-5-(tert-butoxycarbonylamino) pentanoic acid, piperdine (0.95 mL, 9.68 mmol) was
added to the crude reaction mixture and stirred for an additional 12 h. Upon completion, the
contents of the reaction were concentrated and purified by combiflash 0→20% MeOH in DCM
to provide (R)-tert-butyl 4-amino-5-(2,3-dihydro-1H-inden-2-ylamino)-5-oxopentylcarbamate
(2) (0.5 g, 59% yield). 1H NMR (400 MHz, d4-MeOD) δ 7.35-7.13 (m, 4H), 4.66 (s, 1H), 3.46-
NH2O NH2
NHBocNH
1 2
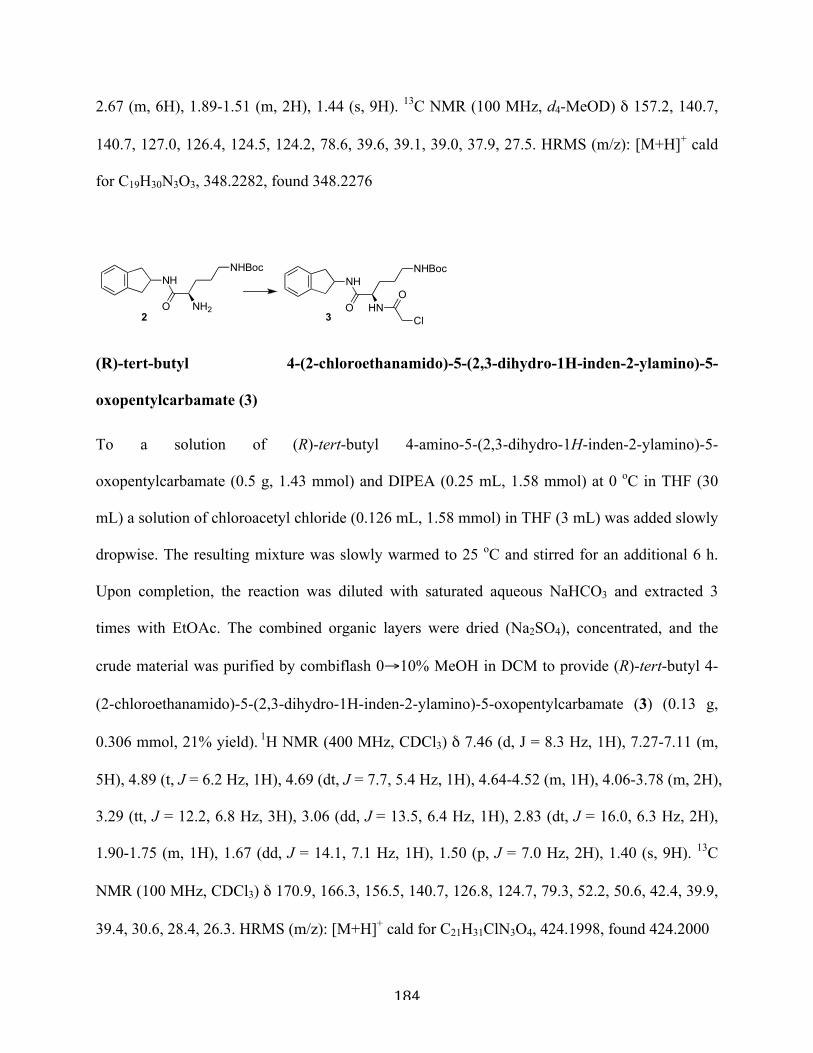
184
2.67 (m, 6H), 1.89-1.51 (m, 2H), 1.44 (s, 9H). 13C NMR (100 MHz, d4-MeOD) δ 157.2, 140.7,
140.7, 127.0, 126.4, 124.5, 124.2, 78.6, 39.6, 39.1, 39.0, 37.9, 27.5. HRMS (m/z): [M+H]+ cald
for C19H30N3O3, 348.2282, found 348.2276
(R)-tert-butyl 4-(2-chloroethanamido)-5-(2,3-dihydro-1H-inden-2-ylamino)-5-
oxopentylcarbamate (3)
To a solution of (R)-tert-butyl 4-amino-5-(2,3-dihydro-1H-inden-2-ylamino)-5-
oxopentylcarbamate (0.5 g, 1.43 mmol) and DIPEA (0.25 mL, 1.58 mmol) at 0 oC in THF (30
mL) a solution of chloroacetyl chloride (0.126 mL, 1.58 mmol) in THF (3 mL) was added slowly
dropwise. The resulting mixture was slowly warmed to 25 oC and stirred for an additional 6 h.
Upon completion, the reaction was diluted with saturated aqueous NaHCO3 and extracted 3
times with EtOAc. The combined organic layers were dried (Na2SO4), concentrated, and the
crude material was purified by combiflash 0→10% MeOH in DCM to provide (R)-tert-butyl 4-
(2-chloroethanamido)-5-(2,3-dihydro-1H-inden-2-ylamino)-5-oxopentylcarbamate (3) (0.13 g,
0.306 mmol, 21% yield). 1H NMR (400 MHz, CDCl3) δ 7.46 (d, J = 8.3 Hz, 1H), 7.27-7.11 (m,
5H), 4.89 (t, J = 6.2 Hz, 1H), 4.69 (dt, J = 7.7, 5.4 Hz, 1H), 4.64-4.52 (m, 1H), 4.06-3.78 (m, 2H),
3.29 (tt, J = 12.2, 6.8 Hz, 3H), 3.06 (dd, J = 13.5, 6.4 Hz, 1H), 2.83 (dt, J = 16.0, 6.3 Hz, 2H),
1.90-1.75 (m, 1H), 1.67 (dd, J = 14.1, 7.1 Hz, 1H), 1.50 (p, J = 7.0 Hz, 2H), 1.40 (s, 9H). 13C
NMR (100 MHz, CDCl3) δ 170.9, 166.3, 156.5, 140.7, 126.8, 124.7, 79.3, 52.2, 50.6, 42.4, 39.9,
39.4, 30.6, 28.4, 26.3. HRMS (m/z): [M+H]+ cald for C21H31ClN3O4, 424.1998, found 424.2000
O NH2
NHBocNH
O HN
NHBocNH
O
Cl2 3
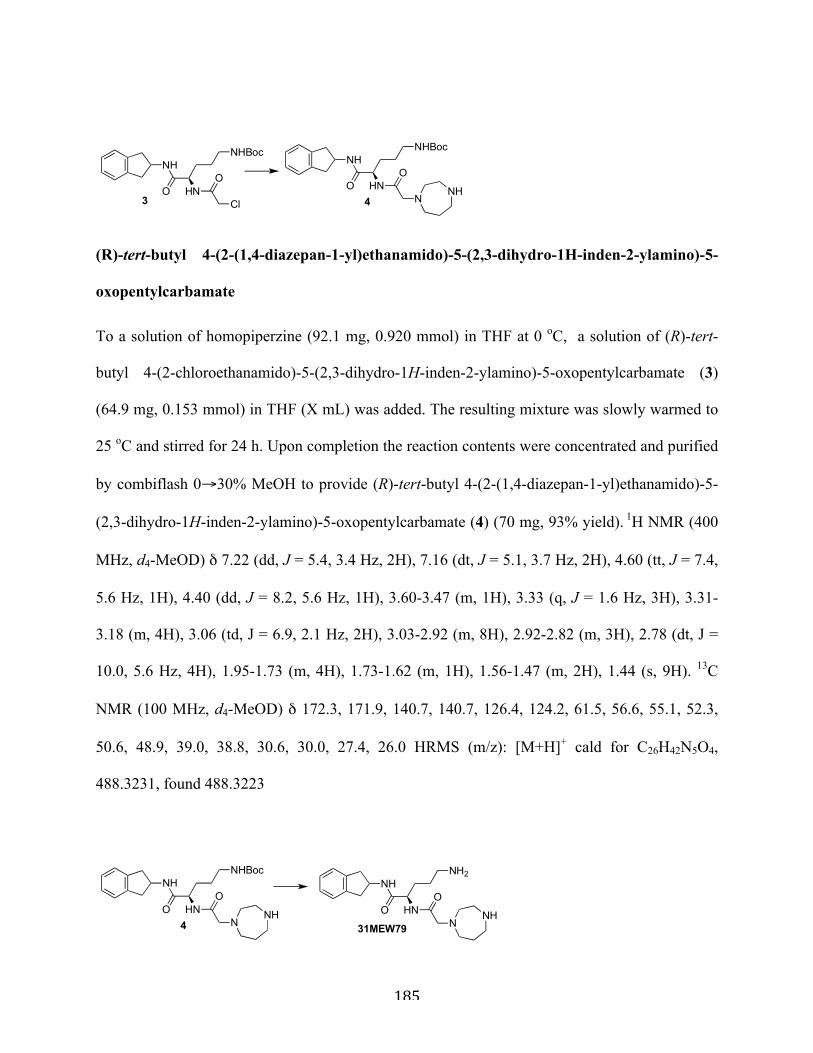
185
(R)-tert-butyl 4-(2-(1,4-diazepan-1-yl)ethanamido)-5-(2,3-dihydro-1H-inden-2-ylamino)-5-
oxopentylcarbamate
To a solution of homopiperzine (92.1 mg, 0.920 mmol) in THF at 0 oC, a solution of (R)-tert-
butyl 4-(2-chloroethanamido)-5-(2,3-dihydro-1H-inden-2-ylamino)-5-oxopentylcarbamate (3)
(64.9 mg, 0.153 mmol) in THF (X mL) was added. The resulting mixture was slowly warmed to
25 oC and stirred for 24 h. Upon completion the reaction contents were concentrated and purified
by combiflash 0→30% MeOH to provide (R)-tert-butyl 4-(2-(1,4-diazepan-1-yl)ethanamido)-5-
(2,3-dihydro-1H-inden-2-ylamino)-5-oxopentylcarbamate (4) (70 mg, 93% yield). 1H NMR (400
MHz, d4-MeOD) δ 7.22 (dd, J = 5.4, 3.4 Hz, 2H), 7.16 (dt, J = 5.1, 3.7 Hz, 2H), 4.60 (tt, J = 7.4,
5.6 Hz, 1H), 4.40 (dd, J = 8.2, 5.6 Hz, 1H), 3.60-3.47 (m, 1H), 3.33 (q, J = 1.6 Hz, 3H), 3.31-
3.18 (m, 4H), 3.06 (td, J = 6.9, 2.1 Hz, 2H), 3.03-2.92 (m, 8H), 2.92-2.82 (m, 3H), 2.78 (dt, J =
10.0, 5.6 Hz, 4H), 1.95-1.73 (m, 4H), 1.73-1.62 (m, 1H), 1.56-1.47 (m, 2H), 1.44 (s, 9H). 13C
NMR (100 MHz, d4-MeOD) δ 172.3, 171.9, 140.7, 140.7, 126.4, 124.2, 61.5, 56.6, 55.1, 52.3,
50.6, 48.9, 39.0, 38.8, 30.6, 30.0, 27.4, 26.0 HRMS (m/z): [M+H]+ cald for C26H42N5O4,
488.3231, found 488.3223
O HN
NHBocNH
O
Cl3O HN
NHBocNH
O
NNH
4
O HN
NH2NH
O
NNH
31MEW79
O HN
NHBocNH
O
NNH
4
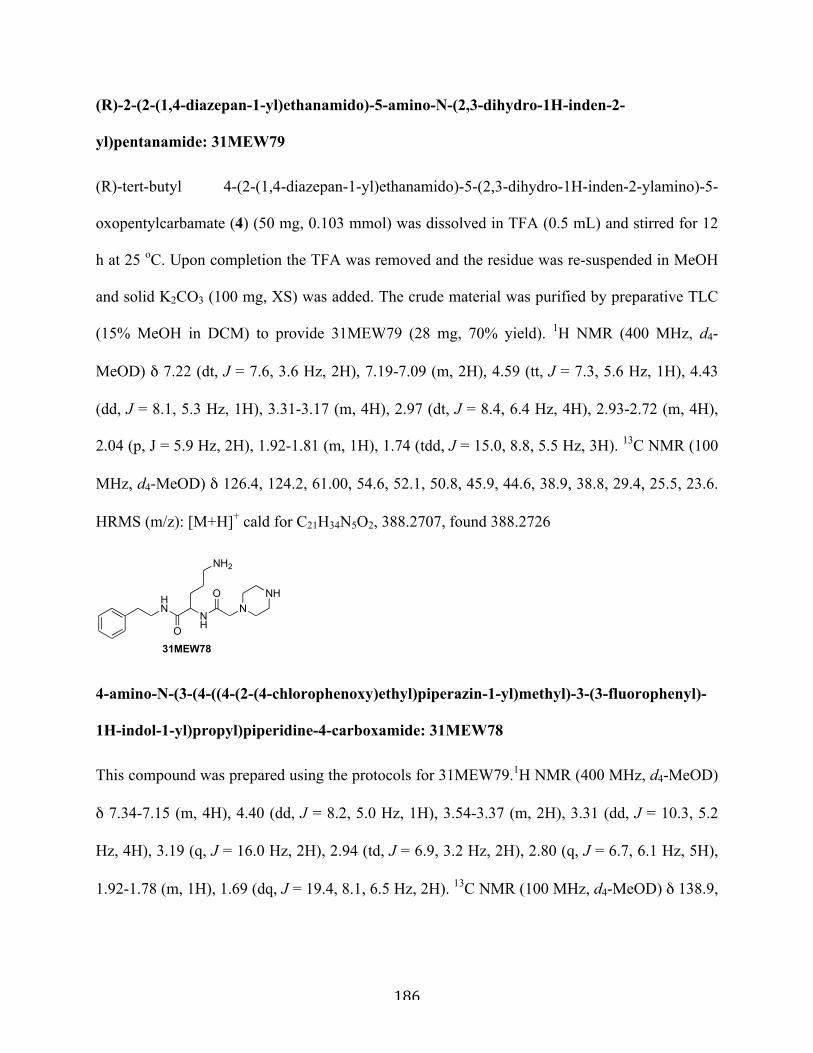
186
(R)-2-(2-(1,4-diazepan-1-yl)ethanamido)-5-amino-N-(2,3-dihydro-1H-inden-2-
yl)pentanamide: 31MEW79
(R)-tert-butyl 4-(2-(1,4-diazepan-1-yl)ethanamido)-5-(2,3-dihydro-1H-inden-2-ylamino)-5-
oxopentylcarbamate (4) (50 mg, 0.103 mmol) was dissolved in TFA (0.5 mL) and stirred for 12
h at 25 oC. Upon completion the TFA was removed and the residue was re-suspended in MeOH
and solid K2CO3 (100 mg, XS) was added. The crude material was purified by preparative TLC
(15% MeOH in DCM) to provide 31MEW79 (28 mg, 70% yield). 1H NMR (400 MHz, d4-
MeOD) δ 7.22 (dt, J = 7.6, 3.6 Hz, 2H), 7.19-7.09 (m, 2H), 4.59 (tt, J = 7.3, 5.6 Hz, 1H), 4.43
(dd, J = 8.1, 5.3 Hz, 1H), 3.31-3.17 (m, 4H), 2.97 (dt, J = 8.4, 6.4 Hz, 4H), 2.93-2.72 (m, 4H),
2.04 (p, J = 5.9 Hz, 2H), 1.92-1.81 (m, 1H), 1.74 (tdd, J = 15.0, 8.8, 5.5 Hz, 3H). 13C NMR (100
MHz, d4-MeOD) δ 126.4, 124.2, 61.00, 54.6, 52.1, 50.8, 45.9, 44.6, 38.9, 38.8, 29.4, 25.5, 23.6.
HRMS (m/z): [M+H]+ cald for C21H34N5O2, 388.2707, found 388.2726
4-amino-N-(3-(4-((4-(2-(4-chlorophenoxy)ethyl)piperazin-1-yl)methyl)-3-(3-fluorophenyl)-
1H-indol-1-yl)propyl)piperidine-4-carboxamide: 31MEW78
This compound was prepared using the protocols for 31MEW79.1H NMR (400 MHz, d4-MeOD)
δ 7.34-7.15 (m, 4H), 4.40 (dd, J = 8.2, 5.0 Hz, 1H), 3.54-3.37 (m, 2H), 3.31 (dd, J = 10.3, 5.2
Hz, 4H), 3.19 (q, J = 16.0 Hz, 2H), 2.94 (td, J = 6.9, 3.2 Hz, 2H), 2.80 (q, J = 6.7, 6.1 Hz, 5H),
1.92-1.78 (m, 1H), 1.69 (dq, J = 19.4, 8.1, 6.5 Hz, 2H). 13C NMR (100 MHz, d4-MeOD) δ 138.9,
HN
O
NH2
NH
ON
NH
31MEW78

187
128.5, 128.1, 126.0, 60.1, 52.3, 49.5, 43.2, 40.5, 38.8, 34.9, 29.0, 23.5. HRMS (m/z): [M+H]+
cald for C19H32N5O2, 362.2551, found 362.2565
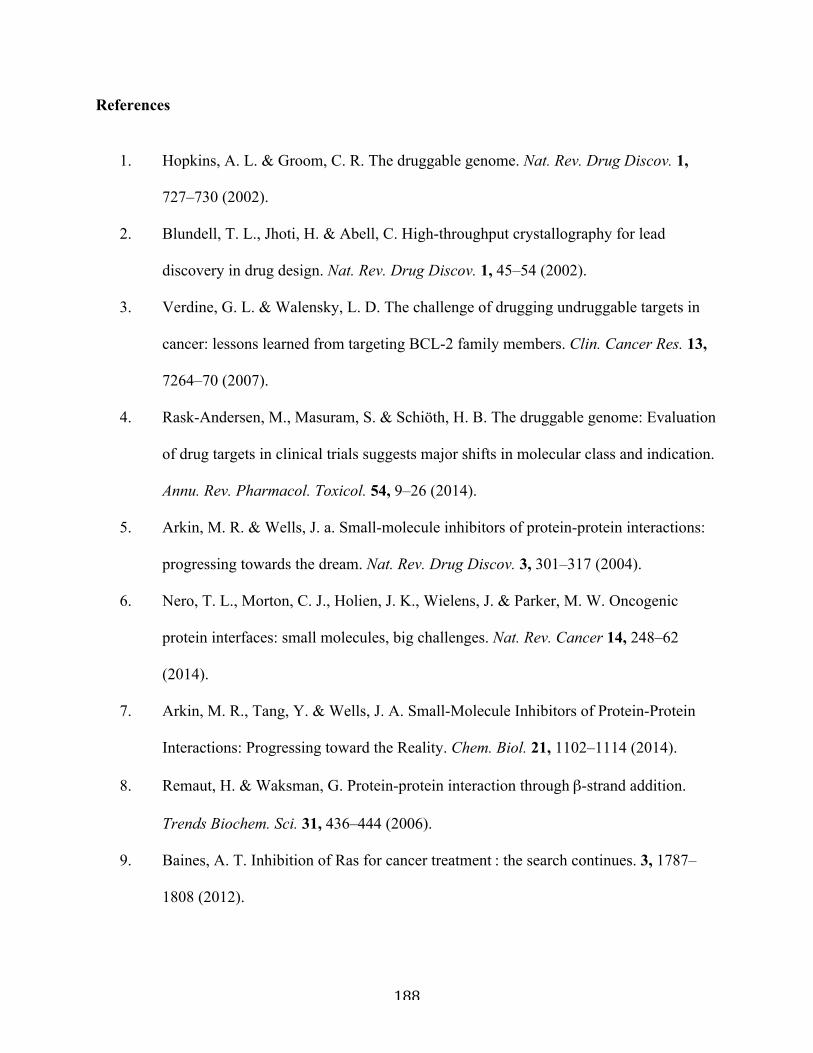
188
References
1. Hopkins, A. L. & Groom, C. R. The druggable genome. Nat. Rev. Drug Discov. 1,
727–730 (2002).
2. Blundell, T. L., Jhoti, H. & Abell, C. High-throughput crystallography for lead
discovery in drug design. Nat. Rev. Drug Discov. 1, 45–54 (2002).
3. Verdine, G. L. & Walensky, L. D. The challenge of drugging undruggable targets in
cancer: lessons learned from targeting BCL-2 family members. Clin. Cancer Res. 13,
7264–70 (2007).
4. Rask-Andersen, M., Masuram, S. & Schiöth, H. B. The druggable genome: Evaluation
of drug targets in clinical trials suggests major shifts in molecular class and indication.
Annu. Rev. Pharmacol. Toxicol. 54, 9–26 (2014).
5. Arkin, M. R. & Wells, J. a. Small-molecule inhibitors of protein-protein interactions:
progressing towards the dream. Nat. Rev. Drug Discov. 3, 301–317 (2004).
6. Nero, T. L., Morton, C. J., Holien, J. K., Wielens, J. & Parker, M. W. Oncogenic
protein interfaces: small molecules, big challenges. Nat. Rev. Cancer 14, 248–62
(2014).
7. Arkin, M. R., Tang, Y. & Wells, J. A. Small-Molecule Inhibitors of Protein-Protein
Interactions: Progressing toward the Reality. Chem. Biol. 21, 1102–1114 (2014).
8. Remaut, H. & Waksman, G. Protein-protein interaction through β-strand addition.
Trends Biochem. Sci. 31, 436–444 (2006).
9. Baines, A. T. Inhibition of Ras for cancer treatment : the search continues. 3, 1787–
1808 (2012).
189
10. Downward, J. Targeting RAS signaling pathways in cancer therapy. Nat. Rev. Cancer
3, 11–22 (2003).
11. Pylayeva-Gupta, Y., Grabocka, E. & Bar-Sagi, D. RAS oncogenes: weaving a
tumorigenic web. Nat. Rev. Cancer 11, 761–74 (2011).
12. Weinstein, I. B. & Joe, A. Oncogene addiction. Cancer Res. 68, 3077–80; discussion
3080 (2008).
13. Chin, L. et al. Essential role for oncogenic Ras in tumour maintenance. Nature 400,
468–472 (1999).
14. Kaelin, W. G. The concept of synthetic lethality in the context of anticancer therapy.
Nat. Rev. Cancer 5, 689–698 (2005).
15. Scholl, C. et al. Synthetic Lethal Interaction between Oncogenic KRAS Dependency
and STK33 Suppression in Human Cancer Cells. Cell 137, 821–834 (2009).
16. Babij, C. et al. STK33 kinase activity is nonessential in KRAS-dependent cancer cells.
Cancer Res. 71, 5818–5826 (2011).
17. Wennerberg, K., Rossman, K. L. & Der, C. J. The Ras superfamily at a glance. J. Cell
Sci. 118, 843–846 (2005).
18. Bar-Sagi, D. & Hall, a. Ras and Rho GTPases: a family reunion. Cell 103, 227–238
(2000).
19. Ada-Nguema, A. S. et al. The small GTPase R-Ras regulates organization of actin and
drives membrane protrusions through the activity of PLCepsilon. J. Cell Sci. 119,
1307–1319 (2006).
20. Bos, J. L., de Rooij, J. & Reedquist, K. a. Rap1 signalling: adhering to new models.
Nat. Rev. Mol. Cell Biol. 2, 369–377 (2001).
190
21. Buday, L. & Downward, J. Many faces of Ras activation. Biochim. Biophys. Acta
1786, 178–87 (2008).
22. Pells, S. et al. Developmentally-regulated expression of murine K-ras isoforms.
Oncogene 15, 1781–1786 (1997).
23. Prior, I. & Hancock, J. F. Compartmentalization of Ras proteins. J. Cell Sci. 114,
1603–1608 (2001).
24. Whyte, D. B. et al. K- and N-Ras are geranylgeranylated in cells treated with farnesyl
protein transferase inhibitors. J. Biol. Chem. 272, 14459–14464 (1997).
25. Chandra, A. et al. The GDI-like solubilizing factor PDEδ sustains the spatial
organization and signalling of Ras family proteins. Nat. Cell Biol. 14, 329–329 (2012).
26. Esteban, L. M. et al. Targeted Genomic Disruption of H- ras and N- ras , Individually
or in Combination , Reveals the Dispensability of Both Loci for Mouse Growth and
Development Targeted Genomic Disruption of H- ras and N- ras , Individually or in
Combination , Reveals the Di. 21, 1444–1452 (2001).
27. Wang, W., Fang, G. & Rudolph, J. Bioorganic & Medicinal Chemistry Letters Ras
inhibition via direct Ras binding — is there a path forward ? (2012).
28. Konstantinopoulos, P. a, Karamouzis, M. V & Papavassiliou, A. G. Post-translational
modifications and regulation of the RAS superfamily of GTPases as anticancer targets.
Nat. Rev. Drug Discov. 6, 541–555 (2007).
29. Zimmermann, G. et al. Small molecule inhibition of the KRAS-PDEδ interaction
impairs oncogenic KRAS signalling. Nature 497, 638–42 (2013).
30. Schlessinger, J. Cell Signaling by Receptor Tyrosine Kinases A large group of genes
in all eukaryotes encode for. October 103, 211–225 (2000).
191
31. Boriack-sjodin, P. A., Margarit, S. M., Bar-sagi, D. & Kuriyan, J. The structural basis
of the activation of Ras by Sos. 394, 337–343 (1998).
32. Scheffzek, K. et al. The Ras-RasGAP complex: structural basis for GTPase activation
and its loss in oncogenic Ras mutants. Science 277, 333–8 (1997).
33. Baek, S. et al. Structure of the stapled p53 peptide bound to Mdm2. J. Am. Chem. Soc.
134, 103–106 (2012).
34. Bird, G. H. et al. Hydrocarbon double-stapling remedies the proteolytic instability of a
lengthy peptide therapeutic. Proc. Natl. Acad. Sci. U. S. A. 107, 14093–14098 (2010).
35. Patgiri, A., Yadav, K. K., Arora, P. S. & Bar-Sagi, D. An orthosteric inhibitor of the
Ras-Sos interaction. Nat. Chem. Biol. 7, 585–7 (2011).
36. Hajduk, P. J. & Greer, J. A decade of fragment-based drug design: strategic advances
and lessons learned. Nat. Rev. Drug Discov. 6, 211–219 (2007).
37. Maurer, T. et al. Small-molecule ligands bind to a distinct pocket in Ras and inhibit
SOS-mediated nucleotide exchange activity. Proc. Natl. Acad. Sci. U. S. A. 109, 5299–
304 (2012).
38. Sun, Q. et al. Discovery of small molecules that bind to K-Ras and inhibit Sos-
mediated activation. Angew. Chem. Int. Ed. Engl. 51, 6140–3 (2012).
39. Ostrem, J. M., Peters, U., Sos, M. L., Wells, J. a & Shokat, K. M. K-Ras(G12C)
inhibitors allosterically control GTP affinity and effector interactions. Nature 503,
548–51 (2013).
40. Wellbrock, C., Karasarides, M. & Marais, R. The RAF proteins take centre stage. Nat.
Rev. Mol. Cell Biol. 5, 875–885 (2004).
192
41. Kolch, W. Meaningful relationships: the regulation of the Ras/Raf/MEK/ERK
pathway by protein interactions. Biochem. J. 351 Pt 2, 289–305 (2000).
42. Fetics, S. K. et al. Allosteric Effects of the Oncogenic RasQ61L Mutant on Raf-RBD.
Structure 23, 505–516 (2015).
43. Chang, F. et al. Signal transduction mediated by the Ras/Raf/MEK/ERK pathway
from cytokine receptors to transcription factors: potential targeting for therapeutic
intervention. Leuk. Off. J. Leuk. Soc. Am. Leuk. Res. Fund, U.K 17, 1263–1293 (2003).
44. Yuan, T. L. & Cantley, L. C. PI3K pathway alterations in cancer: variations on a
theme. Oncogene 27, 5497–510 (2008).
45. Pacold, M. E. et al. Crystal structure and functional analysis of Ras binding to its
effector phosphoinositide 3-kinase gamma. Cell 103, 931–943 (2000).
46. Martini, M., De Santis, M. C., Braccini, L., Gulluni, F. & Hirsch, E. PI3K/AKT
signaling pathway and cancer: an updated review. Ann. Med. 34, 1–12 (2014).
47. Neel, N. F. et al. The RalGEF-Ral Effector Signaling Network: The Road Less
Traveled for Anti-Ras Drug Discovery. Genes Cancer 2, 275–287 (2011).
48. Jin, R. et al. Exo84 and Sec5 are competitive regulatory Sec6/8 effectors to the RalA
GTPase. EMBO J. 24, 2064–2074 (2005).
49. Stockwell, B. R. Chemical genetics: ligand-based discovery of gene function. Nat. Rev.
Genet. 1, 116–125 (2000).
50. Schreiber, S. L. Target-oriented and diversity-oriented organic synthesis in drug
discovery. Science 287, 1964–1969 (2000).
193
51. Evans, B. E., Rittle, K. E. & Bock, M. G. Methods for drug discovery: development of
potent, selective, orally effective cholecystokinin antagonists. J. Med. Chem. 31,
2235–2246 (1988).
52. Legraverend, M. & Grierson, D. S. The purines: Potent and versatile small molecule
inhibitors and modulators of key biological targets. Bioorganic Med. Chem. 14, 3987–
4006 (2006).
53. Laufer, S. a., Domeyer, D. M., Scior, T. R. F., Albrecht, W. & Hauser, D. R. J.
Synthesis and biological testing of purine derivatives as potential ATP-competitive
kinase inhibitors. J. Med. Chem. 48, 710–722 (2005).
54. Hunter, J. C. et al. In situ selectivity profiling and crystal structure of SML-8-73-1, an
active site inhibitor of oncogenic K-Ras G12C. Proc. Natl. Acad. Sci. U. S. A. 111,
8895–900 (2014).
55. Spandl, R. J., Díaz-Gavilán, M., O’Connell, K. M. G., Thomas, G. L. & Spring, D. R.
Diversity-oriented synthesis. Chem. Rec. 8, 129–142 (2008).
56. Bon, R. S. & Waldmann, H. Bioactivity-guided navigation of chemical space. Acc.
Chem. Res. 43, 1103–1114 (2010).
57. Kapetanovic, I. M. Computer-aided drug discovery and development (CADDD): In
silico-chemical-biological approach. Chem. Biol. Interact. 171, 165–176 (2008).
58. Kitchen, D. B., Decornez, H., Furr, J. R. & Bajorath, J. Docking and scoring in virtual
screening for drug discovery: methods and applications. Nat. Rev. Drug Discov. 3,
935–949 (2004).
59. Eldridge, M. D., Murray, C. W., Auton, T. R., Paolini, G. V & Mee, R. P. Empirical
scoring functions: I. The development of a fast empirical scoring function to estimate
194
the binding affinity of ligands in receptor complexes. J. Comput. Aided. Mol. Des. 11,
425–445 (1997).
60. Friesner, R. a. et al. Glide: A New Approach for Rapid, Accurate Docking and
Scoring. 1. Method and Assessment of Docking Accuracy. J. Med. Chem. 47, 1739–
1749 (2004).
61. Scior, T. et al. Recognizing pitfalls in virtual screening: A critical review. J. Chem. Inf.
Model. 52, 867–881 (2012).
62. Feher, M. Consensus scoring for protein – ligand interactions. Drug Discov. Today 11,
421–428 (2006).
63. Repasky, M. P. et al. Docking performance of the glide program as evaluated on the
Astex and DUD datasets: A complete set of glide SP results and selected results for a
new scoring function integrating WaterMap and glide. J. Comput. Aided. Mol. Des. 26,
787–799 (2012).
64. Higgs, C., Beuming, T. & Sherman, W. Hydration site thermodynamics explain SARs
for triazolylpurines analogues binding to the A2A receptor. ACS Med. Chem. Lett. 1,
160–164 (2010).
65. Ellingson, S. R., Miao, Y., Baudry, J. & Smith, J. C. Multi-Conformer Ensemble
Docking to Difficult Protein Targets. J. Phys. Chem. B. 119, 1026–1034 (2015).
66. Sherman, W., Beard, H. S. & Farid, R. Use of an induced fit receptor structure in
virtual screening. Chem. Biol. Drug Des. 67, 83–84 (2006).
67. Singh, J., Petter, R. C., Baillie, T. a & Whitty, A. The resurgence of covalent drugs.
Nat. Rev. Drug Discov. 10, 307–317 (2011).
195
68. London, N. et al. Covalent Docking of Large Libraries for the Discovery of Chemical
Probes. Biophys. J. 106, (2014).
69. Sun, H. Pharmacophore based virtual screening. Curr. Med. Chem. 15, 1018-1024
(2008).
70. De Luca, L. et al. Pharmacophore-based discovery of small-molecule inhibitors of
protein-protein interactions between HIV-1 integrase and cellular cofactor
LEDGF/p75. ChemMedChem 4, 1311–1316 (2009).
71. Shima, F. et al. In silico discovery of small-molecule Ras inhibitors that display
antitumor activity by blocking the Ras-effector interaction. Proc. Natl. Acad. Sci. U. S.
A. 110, 8182–7 (2013).
72. Yu, H. & Adedoyin, A. ADME-Tox in drug discovery: Integration of experimental
and computational technologies. Drug Discov. Today 8, 852–861 (2003).
73. Lipinski, C. a., Lombardo, F., Dominy, B. W. & Feeney, P. J. Experimental and
computational approaches to estimate solubility and permeability in drug discovery
and development settings. Adv. Drug Deliv. Rev. 64, 4–17 (2012).
74. Lipinski, C. a. Lead- and drug-like compounds: The rule-of-five revolution. Drug
Discov. Today Technol. 1, 337–341 (2004).
75. Kerns, E. H. et al. Combined application of parallel artificial membrane permeability
assay and Caco-2 permeability assays in drug discovery. J. Pharm. Sci. 93, 1440–1453
(2004).
76. Davis, A. M. & Teague, S. J. Hydrogen bonding, hydrophobic interactions, and failure
of the rigid receptor hypothesis. Angew. Chemie - Int. Ed. 38, 736–749 (1999).
196
77. Lipinski, C. a. Drug-like properties and the causes of poor solubility and poor
permeability. J. Pharmacol. Toxicol. Methods 44, 235–249 (2000).
78. Lewis, D. F. V, Jacobs, M. N. & Dickins, M. Compound lipophilicity for substrate
binding to human P450s in drug metabolism. Drug Discov. Today 9, 530–537 (2004).
79. Xu, C., Li, C. Y.-T. & Kong, A.-N. T. Induction of phase I, II and III drug
metabolism/transport by xenobiotics. Arch. Pharm. Res. 28, 249–268 (2005).
80. Guengerich, F. P. Cytochrome P450s and other enzymes in drug metabolism and
toxicity. AAPS J. 8, E101–E111 (2006).
81. Ekins, S. Predicting undesirable drug interactions with promiscuous proteins in silico.
Drug Discov. Today 9, 276–285 (2004).
82. Downward, J. RAS’s cloak of invincibility splits at last? Cancer Cell 25, 5-6 (2014)
83. Yang, H., Wang, H. & Jaenisch, R. Generating genetically modified mice using
CRISPR/Cas-mediated genome engineering. Nat. Protoc. 9, 1956–1968 (2014).
84. Cheon, D.-J. & Orsulic, S. Mouse models of cancer. Annu. Rev. Pathol. 6, 95–119
(2011).
85. Sharpless, N. E. & Depinho, R. a. The mighty mouse: genetically engineered mouse
models in cancer drug development. Nat. Rev. Drug Discov. 5, 741–754 (2006).
86. Ying, H. et al. Oncogenic KRAS maintains pancreatic tumors through regulation of
anabolic glucose metabolism. Cell 149, 656–670 (2012).
87. Clackson, T. & Wells, J. a. A hot spot of binding energy in a hormone-receptor
interface. Science 267, 383–386 (1995).
197
88. Massova, I. & Kollman, P. a. Computational alanine scanning to probe protein-protein
interactions: A novel approach to evaluate binding free energies. J. Am. Chem. Soc.
121, 8133–8143 (1999).
89. Block, C., Janknecht, R., Herrmann, C., Nassar, N. & Wittinghofer, A. Quantitative
structure-activity analysis correlating Ras/Raf interaction in vitro to Raf activation in
vivo. Nat. Struct. Biol. 3, 244–251 (1996).
90. Pacold, M. E. et al. Crystal structure and functional analysis of Ras binding to its
effector phosphoinositide 3-kinase gamma. Cell 103, 931–43 (2000).
91. Huang et al. Structural basis for the interaction of RAS with RALGDS Nat. Lett. 5,
422-426 (1998)
92. Hall, B. E., Bar-Sagi, D. & Nassar, N. The structural basis for the transition from Ras-
GTP to Ras-GDP. Proc. Natl. Acad. Sci. U. S. A. 99, 12138–12142 (2002).
93. Vo, U. et al. 1H 13C and 15N resonance assignments for the human KRAS at
physiological pH. Biomol. NMR Assign. 7, 215-219 (2013)
94. Rosnizeck, I.C. et al. Stabilizing a weak binding state for effectors in the human Ras
protein by cyclen complexes. Angew. Chem. Int. Ed. Engl. 49, 3830–3833 (2010).
95. Pulayeva-Gupta, Y., Grabocka, E., Bar-Sagi D. RAS oncogenes: weaving a
tumoigenic web. Nat. Rev. Cancer 11, 761-774 (2011)
96. Strumane, K. et al. The RAC activator TIAM1 and RAS induced oncogenesis. Meth.
Enzym. 407, 269-281 (2006)
97. Strumane, K. et al. The RAC activator TIAM1 and RAS induced oncogenesis. Meth.
Enzym. 407, 269-281 (2006)
198
98. Shin, I. et al. HRAS specific activation of RAC-MMK3/6-p38 pathway: it’s critical
role in invasion and migration of breast cancer epithelial cells. J. Bio. Chem. 280,
14675-14683 (2005)
99. Kerkhoff, E. et al. Cell cycle targets of RAS/RAF signaling. Oncogene 16, 211-216
(1998)
100. Chiaradonna, F. et al. RAS dependent carbon metabolism and transformation in mouse
fibroblasts. Oncogene 25, 5391-5404 (2006)
101. Joseph, E.W. et al. The RAF inhibitor PLX4032 inhibits ERK signaling and tumor cell
proliferation in a V600E BRAF-selective manner. PNAS 103, 14903-14908 (2010)
102. Bardeesy N. et al. Both p16(lnk4a) and the p19(Arf)-p53 pathway constrain
progression of pancreatic adenocarcinoma in the mouse PNAS 103, 5947-5952 (2006)
103. Oberstein P.E., Olive K.P. Pancreatic cancer: why is it so hard to treat? Therapeutic
Advances in Gastroenterology 6, 321-3337 (2013)
104. Dolma, S. et al. Identi cation of genotype-selective antitumor agents using synthetic
lethal chemical screening in engineered human tumor cells. Cancer Cell 3, 285–296
(2003).
105. Dixon, S. J. et al. Ferroptosis: An iron-dependent form of nonapoptotic cell death. Cell
149, 1060–1072 (2012).
106. Dixon, S. J. et al. Pharmacological inhibition of cystine-glutamate exchange induces
endoplasmic reticulum stress and ferroptosis. Elife 2014, 1–25 (2014).
107. Yang, W. S. et al. Regulation of ferroptotic cancer cell death by GPX4. Cell 156, 317–
331 (2014).
199
108. Ishii, T. & Bannai, S. Mechanism of Growth Stimulation of L1210 Cells by 2-
Mercaptoethanol in Vitro. 256, 12387–12392 (1981).
109. Cantley, A. M. et al. Small molecule that reverses dexamethasone resistance in t-cell
acute lymphoblastic leukemia (T-ALL). ACS Med. Chem. Lett. 5, 754–759 (2014).
110. Deftos, M. L., He, Y. W., Ojala, E. W. & Bevan, M. J. Correlating notch signaling
with thymocyte maturation. Immunity 9, 777–786 (1998).
111. Mackinnon, A. L. & Taunton, J. Target Identification by Diazirine Photo-Cross-
linking and Click Chemistry. Curr. Protoc. Chem. Biol. 1, 55–73 (2009).