![Synthesis of oncological [11C]radiopharmaceuticals for clinical PET](https://static.fdokumen.com/doc/165x107/633497dee9e768a27a101d8b/synthesis-of-oncological-11cradiopharmaceuticals-for-clinical-pet.jpg)
Synthesis of oncological [11C]radiopharmaceuticals for clinical PET
Upload
independentCategory
view
1download
0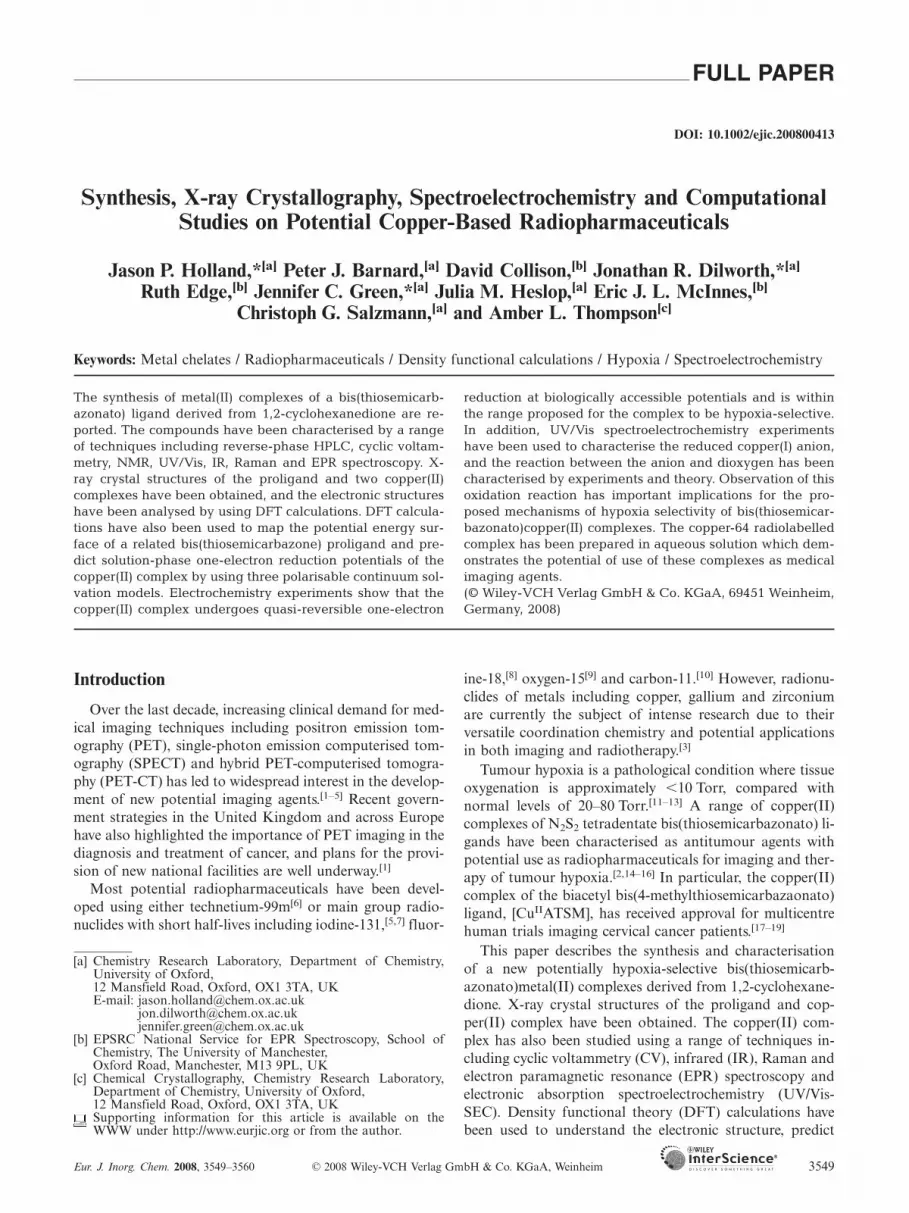
FULL PAPER
DOI: 10.1002/ejic.200800413
Synthesis, X-ray Crystallography, Spectroelectrochemistry and ComputationalStudies on Potential Copper-Based Radiopharmaceuticals
Jason P. Holland,*[a] Peter J. Barnard,[a] David Collison,[b] Jonathan R. Dilworth,*[a]
Ruth Edge,[b] Jennifer C. Green,*[a] Julia M. Heslop,[a] Eric J. L. McInnes,[b]
Christoph G. Salzmann,[a] and Amber L. Thompson[c]
Keywords: Metal chelates / Radiopharmaceuticals / Density functional calculations / Hypoxia / Spectroelectrochemistry
The synthesis of metal(II) complexes of a bis(thiosemicarb-azonato) ligand derived from 1,2-cyclohexanedione are re-ported. The compounds have been characterised by a rangeof techniques including reverse-phase HPLC, cyclic voltam-metry, NMR, UV/Vis, IR, Raman and EPR spectroscopy. X-ray crystal structures of the proligand and two copper(II)complexes have been obtained, and the electronic structureshave been analysed by using DFT calculations. DFT calcula-tions have also been used to map the potential energy sur-face of a related bis(thiosemicarbazone) proligand and pre-dict solution-phase one-electron reduction potentials of thecopper(II) complex by using three polarisable continuum sol-vation models. Electrochemistry experiments show that thecopper(II) complex undergoes quasi-reversible one-electron
Introduction
Over the last decade, increasing clinical demand for med-ical imaging techniques including positron emission tom-ography (PET), single-photon emission computerised tom-ography (SPECT) and hybrid PET-computerised tomogra-phy (PET-CT) has led to widespread interest in the develop-ment of new potential imaging agents.[1–5] Recent govern-ment strategies in the United Kingdom and across Europehave also highlighted the importance of PET imaging in thediagnosis and treatment of cancer, and plans for the provi-sion of new national facilities are well underway.[1]
Most potential radiopharmaceuticals have been devel-oped using either technetium-99m[6] or main group radio-nuclides with short half-lives including iodine-131,[5,7] fluor-
[a] Chemistry Research Laboratory, Department of Chemistry,University of Oxford,12 Mansfield Road, Oxford, OX1 3TA, UKE-mail: [email protected]
[email protected]@chem.ox.ac.uk
[b] EPSRC National Service for EPR Spectroscopy, School ofChemistry, The University of Manchester,Oxford Road, Manchester, M13 9PL, UK
[c] Chemical Crystallography, Chemistry Research Laboratory,Department of Chemistry, University of Oxford,12 Mansfield Road, Oxford, OX1 3TA, UKSupporting information for this article is available on theWWW under http://www.eurjic.org or from the author.
Eur. J. Inorg. Chem. 2008, 3549–3560 © 2008 Wiley-VCH Verlag GmbH & Co. KGaA, Weinheim 3549
reduction at biologically accessible potentials and is withinthe range proposed for the complex to be hypoxia-selective.In addition, UV/Vis spectroelectrochemistry experimentshave been used to characterise the reduced copper(I) anion,and the reaction between the anion and dioxygen has beencharacterised by experiments and theory. Observation of thisoxidation reaction has important implications for the pro-posed mechanisms of hypoxia selectivity of bis(thiosemicar-bazonato)copper(II) complexes. The copper-64 radiolabelledcomplex has been prepared in aqueous solution which dem-onstrates the potential of use of these complexes as medicalimaging agents.(© Wiley-VCH Verlag GmbH & Co. KGaA, 69451 Weinheim,Germany, 2008)
ine-18,[8] oxygen-15[9] and carbon-11.[10] However, radionu-clides of metals including copper, gallium and zirconiumare currently the subject of intense research due to theirversatile coordination chemistry and potential applicationsin both imaging and radiotherapy.[3]
Tumour hypoxia is a pathological condition where tissueoxygenation is approximately �10 Torr, compared withnormal levels of 20–80 Torr.[11–13] A range of copper(II)complexes of N2S2 tetradentate bis(thiosemicarbazonato) li-gands have been characterised as antitumour agents withpotential use as radiopharmaceuticals for imaging and ther-apy of tumour hypoxia.[2,14–16] In particular, the copper(II)complex of the biacetyl bis(4-methylthiosemicarbazaonato)ligand, [CuIIATSM], has received approval for multicentrehuman trials imaging cervical cancer patients.[17–19]
This paper describes the synthesis and characterisationof a new potentially hypoxia-selective bis(thiosemicarb-azonato)metal(II) complexes derived from 1,2-cyclohexane-dione. X-ray crystal structures of the proligand and cop-per(II) complex have been obtained. The copper(II) com-plex has also been studied using a range of techniques in-cluding cyclic voltammetry (CV), infrared (IR), Raman andelectron paramagnetic resonance (EPR) spectroscopy andelectronic absorption spectroelectrochemistry (UV/Vis-SEC). Density functional theory (DFT) calculations havebeen used to understand the electronic structure, predict

J. P. Holland, J. R. Dilworth, J. C. Green et al.FULL PAPERsolution-phase redox potentials and, for the first time, as-sign the IR and Raman vibrational modes in the spectra ofthe copper(II) complex. In addition, the copper-64 radio-labelled complex has been prepared in aqueous solution.
Results and Discussion
Synthesis and X-ray Crystallography
Structures of the symmetrical 1,2-cyclohexanedionebis(4-methylthiosemicarbazone) [H2HTSM (1)] proligand,and metal(II) complexes 2–6, are shown in Scheme 1. De-tails of the nomenclature of acronyms used have been de-scribed elsewhere.[20] Proligand 1 was synthesised from 1,2-cyclohexanedione and 4-methylthiosemicarbazide using asimilar procedure described by Mohan et al.[21] and was iso-lated in low yield (26%) as yellow crystals. The correspond-ing neutral metal(II) complexes 2–4 were isolated in goodyields as microcrystalline powders following a procedurebased on that described by Rodriguez-Argüelles et al.[22] Allcompounds have been fully characterised using techniquesincluding elemental analysis, mass spectrometry, reverse-phase gradient high performance liquid chromatography
Scheme 1. Synthesis of the H2HTSM proligand 1 and complex-ation reactions to form the metal(II) complexes 2–6. The labels,“a” and “b” refer to the methylene (CH2) groups of the cyclo-hexane ring as described in the Experimental Section.
www.eurjic.org © 2008 Wiley-VCH Verlag GmbH & Co. KGaA, Weinheim Eur. J. Inorg. Chem. 2008, 3549–35603550
(HPLC), UV/Vis spectroscopy, X-band EPR spectroscopyand CV. In addition, density functional theory (DFT) cal-culations have been used to investigate the electronic andvibrational structure of the proligand 1 and copper complex2.
Selected experimental and DFT-calculated geometric pa-rameters for compound 1 and copper(II) complex 2 aregiven in Table 1. The X-ray crystal structure of proligand 1is shown in Figure 1. In the solid state, the cyclohexane ringlies in an envelope (half-chair) conformation with the fournitrogen atoms N1–N4 and the four carbon atoms C2, C3,C6 and C9 lying coplanar. Carbon atom C7 is displacedabove the plane with the dihedral angle d(N2–C2–C6–C7)of 157.4°. The carbon–carbon bond length between C2 andC3 is 1.480(2) Å, which is the shortest bond within the cy-
Table 1. Selected experimental (X-ray) and calculated (DFT) geo-metric parameters for the proligand 1 and copper(II) complex 2.X-ray crystal structure values with estimated standard deviations(esd values) are presented first followed by the calculated valuesfrom DFT geometry optimisations.
Parameter[a] H2HTSM proligand, 1 [CuIIHTSM], 2Exp. (esd) Calcd. Exp. (esd) Calcd.
r(C1–N1) 1.370(2) 1.376 1.319(5) 1.331r(N1–N2) 1.3580(19) 1.347 1.378(4) 1.350r(N2–C2) 1.294(2) 1.302 1.309(5) 1.304r(C1–N5)[b] 1.325(2) 1.342 1.346(5) 1.352r(C1–S1) 1.6780(17) 1.686 1.754(4) 1.768r(Cu–S1) – – 2.249(1)[c] 2.290r(Cu–S2) – – 2.249(1)[c] 2.290r(M–N2) – – 1.954(3)[c] 2.005r(M–N3) – – 1.954(3)[c] 2.005a(C1–N1–N2) 119.06(14) 122.3 110.1(3) 111.8a(S1–C1–N1) 119.13(13) 118.6 126.7(3) 126.6a(M–S1–C1) – – 94.25(12) 93.8a(N2–Cu–S1) – – 84.73(9)[c] 84.4a(N2–Cu–N3) – – 80.63(17) 80.1a(N3–Cu–S2) – – 84.73(9)[c] 84.4a(S1–Cu–S2) – – 110.42(5) 111.1RMSD[d] 0.202 0.069
[a] Bond lengths and distances are given in Å, and bond angles indegrees [°]. [b] Equivalent to r(C1–N3)/Å for complex 2. [c] Relatedby twofold rotation. [d] Weighted root-mean-square deviation(RMSD) in Å, calculated by using all non-hydrogen atoms betweenthe X-ray crystal structure and the DFT-optimised gas-phase ge-ometry.
Figure 1. ORTEP[24] representation of the X-ray crystal structureof proligand 1. Thermal ellipsoids are shown at 50% probability.
Potential Copper-Based Radiopharmaceuticals
clohexane ring and is the same as the average bond lengthexpected for a single bond between two sp2-hybridised car-bon atoms.[23] Each of the six nitrogen atoms have trigonal-planar geometry, indicating sp2 hybridisation, and all r(C–N), r(C=S), and r(N–N) bonds are intermediate in lengthbetween average distances expected for single and doublebonds.[23] This structure is consistent with the extensive de-localisation of electron density expected for conjugated bis-(thiosemicarbazonato) systems. In contrast with reportedcrystal structures of other bis(thiosemicarbazone) proli-gands including H2ATSM,[20] lack of free rotation aboutthe C2–C3 bond forces the two thiosemicarbazone branchesto adopt a cis conformation. The cis geometry means thatthe proligand is pre-organised for metal complexation.
The 1H NMR spectrum of proligand 1 (300 MHz inCDCl3 at 295 K) exhibits two unresolved multiplets at δ =2.50 and 1.75 ppm assigned to the a-CH2 and b-CH2 groupsof the cyclohexane ring system, respectively. Two overlap-ping doublets occur at δ = 3.18 and 3.23 ppm (3JHH =4.8 Hz) corresponding to the NHCH3 groups which coupleto the two broad NHCH3 resonances at δ = 7.30 and7.51 ppm, respectively. The N1–H and N4–H resonances oc-cur at δ = 12.92 and 8.79 ppm, respectively. The signal ofthe hydrogen atom bonded to N1 is shifted downfield byintramolecular hydrogen bonding with the lone pair of elec-trons on N3. The 13C{1H} NMR spectrum shows two reso-nances assigned to the a-CH2 groups at δ = 25.8 and33.4 ppm, and two resonances due to the b-CH2 groups atδ = 21.3 and 22.5 ppm, highlighting the asymmetry withinthe cyclohexane ring system. The signals of the twoNHCH3 terminal methyl groups are observed at δ = 30.9and 31.9 ppm. Four quaternary carbon resonances are ob-served and assigned to the two C=N imine groups at δ =137.2 and 144.3 ppm and two overlapping C=S resonancesat δ = 178.2 and 178.4 ppm. The NMR spectra confirmthat the most favourable conformation of proligand 1 inchloroform at room temperature has two inequivalent 4-methylthiosemicarbazone groups with four inequivalent N–H groups, and is consistent with the solid-state structure(Figure 1).
DFT calculations are in excellent agreement with the ex-perimental structure of proligand 1. The weighted root-mean-square deviation (RMSD) calculated for all non-hy-drogen atoms, between the X-ray crystal structure and theDFT-optimised gas-phase geometry of proligand 1 is only0.202 Å (Table 1).
The neutral metal(II) complexes 2–4 were isolated fromthe reaction of proligand 1 with copper, zinc or nickel ace-tates in hot ethanol. The X-ray crystal structure of red/brown complex 2 is shown in Figure 2. The complex is situ-ated on a crystallographic twofold axis of rotation. Withthe exception of the sulfur atom, S1, and the methylenecarbon atom C6, all non-hydrogen atoms are approximatelycoplanar. The sulfur atom S1, deviates from the plane-of-best-fit by 0.16 Å, and the carbon atom C6 is displaced by0.38 Å. The backbone carbon–carbon r(C2–C3) decreasesslightly on complexation with copper(II) ions to 1.477(7) Å.The weighted RMSD between the experimental and DFT-
Eur. J. Inorg. Chem. 2008, 3549–3560 © 2008 Wiley-VCH Verlag GmbH & Co. KGaA, Weinheim www.eurjic.org 3551
optimised structure is 0.069 Å, which demonstrates the highlevel of structural accuracy that can be achieved using mod-ern quantum chemistry programs. Crystal structures of re-lated zinc(II) complexes have been reported previously.[22]
Figure 2. ORTEP[24] representation of the X-ray crystal structureof complex 2. Thermal ellipsoids are shown at 50% probability,and hydrogen atoms have been omitted for clarity.
In contrast to the complexation reactions with metal(II)acetates, reaction of proligand 1 with copper dichloride di-hydrate in ethanol afforded the cationic dark green complex5 in 50% yield (Scheme 1). This pseudo-square-pyramidalcoordination complex remains diprotonated with a boundchlorido ligand in the apical site and a chloride counterion.
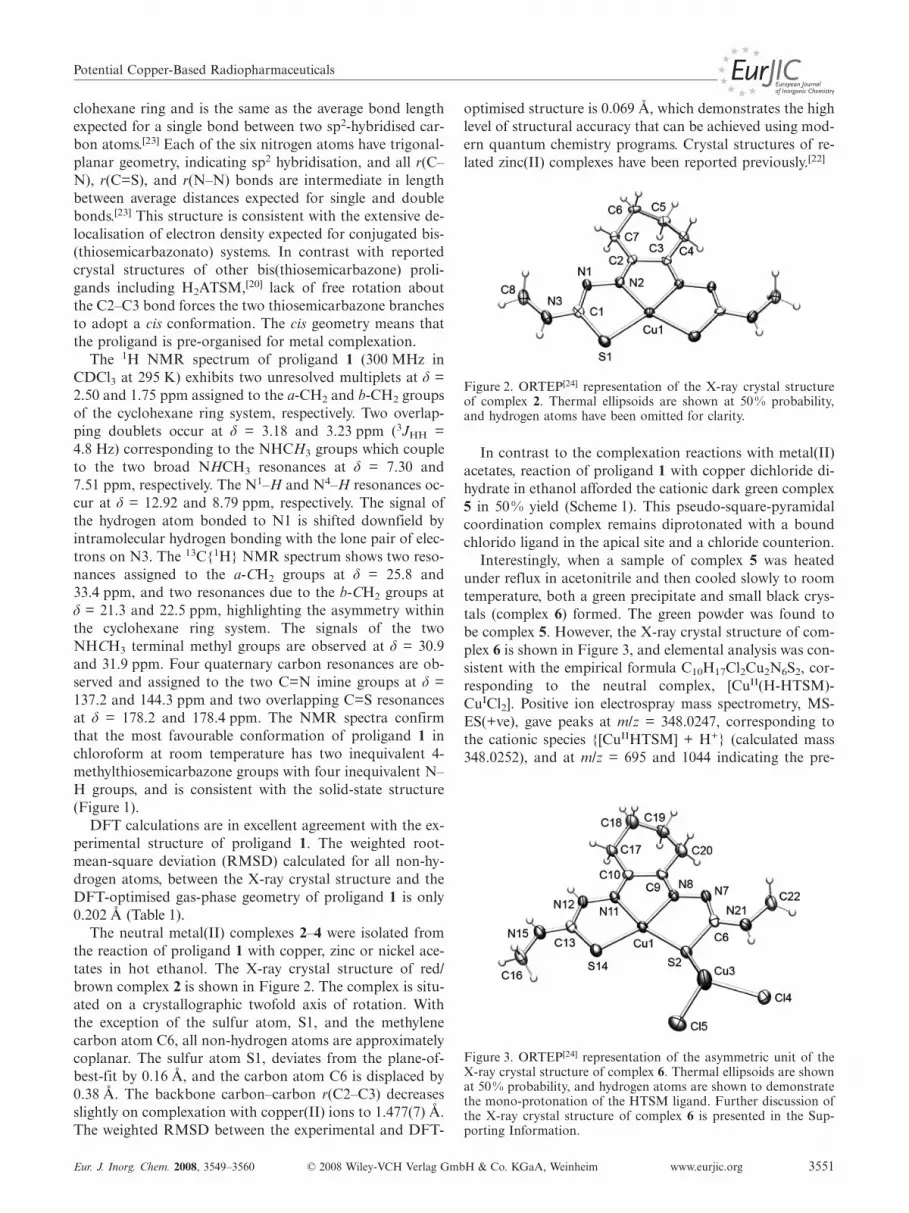
Interestingly, when a sample of complex 5 was heatedunder reflux in acetonitrile and then cooled slowly to roomtemperature, both a green precipitate and small black crys-tals (complex 6) formed. The green powder was found tobe complex 5. However, the X-ray crystal structure of com-plex 6 is shown in Figure 3, and elemental analysis was con-sistent with the empirical formula C10H17Cl2Cu2N6S2, cor-responding to the neutral complex, [CuII(H-HTSM)-CuICl2]. Positive ion electrospray mass spectrometry, MS-ES(+ve), gave peaks at m/z = 348.0247, corresponding tothe cationic species {[CuIIHTSM] + H+} (calculated mass348.0252), and at m/z = 695 and 1044 indicating the pre-
Figure 3. ORTEP[24] representation of the asymmetric unit of theX-ray crystal structure of complex 6. Thermal ellipsoids are shownat 50% probability, and hydrogen atoms are shown to demonstratethe mono-protonation of the HTSM ligand. Further discussion ofthe X-ray crystal structure of complex 6 is presented in the Sup-porting Information.

J. P. Holland, J. R. Dilworth, J. C. Green et al.FULL PAPERsence of the protonated dimer {[CuIIHTSM]2 + H+} andprotonated trimer {[CuIIHTSM]3 + H+}. Complex 6 wasalso synthesised as a black powder from the reaction ofcomplex 5 with 1 equiv. of [tetrakis(acetonitrile)copper(I)hexafluorophosphate, [CuI(CH3CN)4]+[PF6]–, under nitro-gen in refluxing, deoxygenated acetonitrile for 1 h.
Copper-64 Radiolabelling
In order to demonstrate the potential use of complex 2as a radiopharmaceutical, the copper-64 radiolabelled com-plex, 64Cu-2 was prepared in aqueous solution by the reac-tion of proligand 1 with 64Cu(CH3CO2)2(aq.). A solutionof the proligand 1 (50 µL taken from a stock solution of1 mg in 1 mL of DMSO) was stirred at room temperaturewith 200 µL of 64Cu(CH3CO2)2(aq.) in 400 µL of deionisedwater. After a reaction time of 10 min, a single peak wasobserved in the reverse phase radio-HPLC (retention timeRt = 14.42 min; logPc = 2.00�0.35), and the radiochemicalyield of 64Cu-2 was found to be �98%. Further in vitroand in vivo radiochemical studies are underway to assessthe hypoxia selectivity of complex 2.
Density Functional Theory Calculations
After observing the difference in geometry between theX-ray crystal structure of proligand 1 and other bis(thiose-micarbazones), such as the proligand H2ATSM, it was ofinterest to investigate the relative stabilities of different con-formations using DFT.[25] The structures of five conformers(I–V) of the proligand H2ATSM were optimised usingGaussian03 with the restricted B3LYP exchange-correlationfunctionals and the double-ζ 6-31++G(d,p) all-electron ba-sis set.[26] Table 2 shows the optimised geometries and rela-tive energies of conformers I–V. Conformer V was identifiedas the global minimum on the gas-phase potential energysurface and has the same geometry as proligand 1 (Fig-ure 1). The increased stability of conformer V is mainly dueto intramolecular hydrogen bonding. However, the smallenergy difference between conformers I–V, and the in-creased conformational flexibility due to free rotation aboutthe carbon–carbon backbone means unlike proligand 1,H2ATSM is likely to exist as a mixture of conformers atroom temperature in solution.
Electrochemistry
Dearling et al. demonstrated that the hypoxia selectivityof bis(thiosemicarbazonato)copper(II) complexes appearsto correlate with the one-electron half-wave, E1/2/V, re-duction potentials.[27,28] Complexes with electron-donatingalkyl substituents on the ligand backbone were found tohave more negative reduction potentials, and structure–ac-tivity relationship studies suggest that complexes with E1/2
� –0.58 V are likely to be hypoxia-selective. Recent DFTcalculations of solution-phase reduction potentials and ab-solute acidities support this conclusion and showed that
www.eurjic.org © 2008 Wiley-VCH Verlag GmbH & Co. KGaA, Weinheim Eur. J. Inorg. Chem. 2008, 3549–35603552
Table 2. DFT-optimised structures and relative gas-phase energiesof five conformers I–V of the proligand, H2ATSM.
electron-donating substituents reduce the stability of thecopper(I) anion with respect to protonation and liganddissociation.[28,29]
A key step in the proposed mechanisms of hypoxia selec-tivity is the reversibility of the one-electron reduction reac-tion.[15,16,27,28,30] However, the nature of copper(I) complexand its reaction with dioxygen is not well understood.Therefore, the electrochemistry of complex 2 has beenstudied by using CV and UV/Vis-SEC experiments. All po-tentials are reported relative to the saturated calomel elec-trode (SCE) and were corrected using the reversible one-electron oxidation of ferrocene as an internal reference.[31]
The full sweep width CV of a 1.0 m solution of complex2 recorded in anhydrous, deoxygenated dimethylformamide(DMF) at room temperature, and the scan-rate dependence

Potential Copper-Based Radiopharmaceuticals
of the reduction couple are presented in Figure 4(a) and (b),respectively. Complex 2 undergoes a quasi-reversible metal-centred one-electron reduction at E1/2(SCE) = –0.654 V,with a peak current ratio of |ipa|/|ipc| = 0.995 and a peakseparation of ∆Ep = 0.087 V. In the same experimentalsetup, [CuIIATSM] was found to have a half-wave potentialof –0.646 V, which suggests that on the basis of redox po-tential, complex 2 is potentially hypoxia-selective. The dif-fusion coefficients of the oxidised and reduced species in-volved in the reduction couple were calculated using theRandles-Sevcik equation and were found to be DO =6.5�10–6 cm2 s–1 and DR = 7.6�10–6 cm2 s–1, respectively[Equation (1)].
ip = 0.4463nF (nF/RT)1/2 AD1/2Cv1/2 (1)
Figure 4. (a) Full sweep width CV of a 1.0 m solution of complex2 in anhydrous deoxygenated DMF at room temp. (b) Scan-ratedependence of the metal-centred one-electron reduction couple at(A) 50, (B) 75, (C) 100, (D) 150, (E) 250, (F) 400, (G) 600 and (H)800 mVs–1.
DFT calculations on the copper(II) complex 2 and thecorresponding reduced copper(I) anion, [CuIHTSM]– havebeen conducted to predict the solution-phase reduction po-tential. Redox potentials were calculated using dimethylsulfoxide (DMSO, ε = 46.7, Rsolv = 2.455 Å), water (ε =78.39, Rsolv = 1.385 Å) and DMF (ε = 36.7, Rsolv = 2.67 Å)polarisable continuum solvation models (PCM), where ε isthe solvent dielectric constant and Rsolv is the solvent probesphere radius. Full details of the calculation methods usedhave been reported previously.[32] DFT-calculated reduction
Eur. J. Inorg. Chem. 2008, 3549–3560 © 2008 Wiley-VCH Verlag GmbH & Co. KGaA, Weinheim www.eurjic.org 3553
potentials using the DMSO, water and DMF models werefound to be –0.693, –0.531 and –0.594 V, respectively. Thecalculated values are in reasonably good agreement with theexperimental value determined from the CV. However, thecalculation of redox potentials appears to be highly sensi-tive to both the solvent probe size and polarisability.
Figure 5 shows the spatial distributions of the β-spinlowest unoccupied molecular orbital (LUMO) of the op-timised neutral copper(II) complex 2 which accepts the elec-tron on reduction and becomes the highest occupied molec-ular orbital (HOMO) of the reduced copper(I) anion,[CuIHTSM]–. The coordination geometry of the copper ionchanges from square-planar in the neutral copper(II) com-plex to pseudo-tetrahedral in the copper(I) anion, which isconsistent with the quasi-reversible behaviour observed inthe CV.
Figure 5. Molecular-orbital isosurfaces showing the spatial distri-bution of the neutral [CuIIHTSM] (2) βLUMO and the anionic[CuIHTSM]– βHOMO. On reduction the coordination geometry ispredicted to change from square-planar to pseudo-tetrahedral andthe dihedral angle d(N=C–C=N) opens from 0.0° in the copper(II)species to 23.0° in the copper(I) anion.
Although not thought to be involved in the mechanismof hypoxia selectivity, the quasi-reversible one-electron oxi-dation potential of complex 2 occurs at E1/2(SCE) =+0.721 V, with a peak current ratio of |ipc|/|ipa| = 0.839 anda peak separation of ∆Ep = 0.068 V. The oxidative couplehas previously been assigned as a metal-centred CuII/CuIII
process. However, unlike the reduction couple, the oxi-dation potentials of a range of bis(thiosemicarbazonato)-copper(II) complexes are less sensitive to variations in therelative electron-donating/withdrawing ability of the ligandsubstituents.[28] DFT calculations indicate that in solutionphase using a DMF polarisable continuum solvationmodel, ligand-based ππ* oxidation of complex 2 to formthe oxidised triplet-2+ species is thermodynamically morefavourable than metal-based oxidation to give the formallycopper(III) singlet-2+ species by change in electron attach-ment free energy, ∆∆GEA = –26.1 kJmol–1 at 298 K.[32]
UV/Vis Spectroelectrochemistry
Changes in the electronic absorption spectrum of com-plex 2 were measured during in situ electrochemical re-duction of a 1.0 m solution in anhydrous, deoxygenatedDMF at room temperature, by using an optically trans-parent thin-layer electrode (OTTLE) cell.
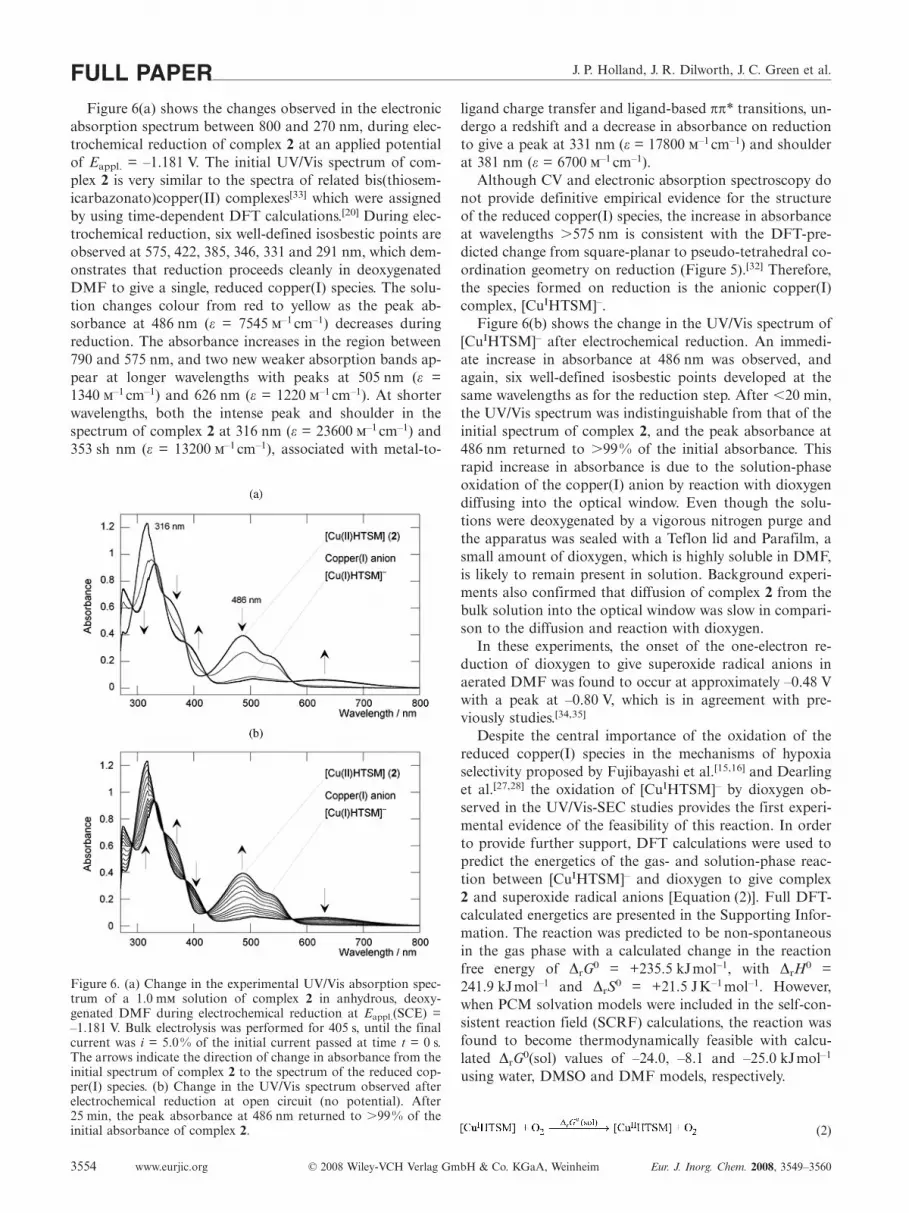
J. P. Holland, J. R. Dilworth, J. C. Green et al.FULL PAPERFigure 6(a) shows the changes observed in the electronic
absorption spectrum between 800 and 270 nm, during elec-trochemical reduction of complex 2 at an applied potentialof Eappl. = –1.181 V. The initial UV/Vis spectrum of com-plex 2 is very similar to the spectra of related bis(thiosem-icarbazonato)copper(II) complexes[33] which were assignedby using time-dependent DFT calculations.[20] During elec-trochemical reduction, six well-defined isosbestic points areobserved at 575, 422, 385, 346, 331 and 291 nm, which dem-onstrates that reduction proceeds cleanly in deoxygenatedDMF to give a single, reduced copper(I) species. The solu-tion changes colour from red to yellow as the peak ab-sorbance at 486 nm (ε = 7545 –1 cm–1) decreases duringreduction. The absorbance increases in the region between790 and 575 nm, and two new weaker absorption bands ap-pear at longer wavelengths with peaks at 505 nm (ε =1340 –1 cm–1) and 626 nm (ε = 1220 –1 cm–1). At shorterwavelengths, both the intense peak and shoulder in thespectrum of complex 2 at 316 nm (ε = 23600 –1 cm–1) and353 sh nm (ε = 13200 –1 cm–1), associated with metal-to-
Figure 6. (a) Change in the experimental UV/Vis absorption spec-trum of a 1.0 m solution of complex 2 in anhydrous, deoxy-genated DMF during electrochemical reduction at Eappl.(SCE) =–1.181 V. Bulk electrolysis was performed for 405 s, until the finalcurrent was i = 5.0% of the initial current passed at time t = 0 s.The arrows indicate the direction of change in absorbance from theinitial spectrum of complex 2 to the spectrum of the reduced cop-per(I) species. (b) Change in the UV/Vis spectrum observed afterelectrochemical reduction at open circuit (no potential). After25 min, the peak absorbance at 486 nm returned to �99% of theinitial absorbance of complex 2.
www.eurjic.org © 2008 Wiley-VCH Verlag GmbH & Co. KGaA, Weinheim Eur. J. Inorg. Chem. 2008, 3549–35603554
ligand charge transfer and ligand-based ππ* transitions, un-dergo a redshift and a decrease in absorbance on reductionto give a peak at 331 nm (ε = 17800 –1 cm–1) and shoulderat 381 nm (ε = 6700 –1 cm–1).
Although CV and electronic absorption spectroscopy donot provide definitive empirical evidence for the structureof the reduced copper(I) species, the increase in absorbanceat wavelengths �575 nm is consistent with the DFT-pre-dicted change from square-planar to pseudo-tetrahedral co-ordination geometry on reduction (Figure 5).[32] Therefore,the species formed on reduction is the anionic copper(I)complex, [CuIHTSM]–.
Figure 6(b) shows the change in the UV/Vis spectrum of[CuIHTSM]– after electrochemical reduction. An immedi-ate increase in absorbance at 486 nm was observed, andagain, six well-defined isosbestic points developed at thesame wavelengths as for the reduction step. After �20 min,the UV/Vis spectrum was indistinguishable from that of theinitial spectrum of complex 2, and the peak absorbance at486 nm returned to �99% of the initial absorbance. Thisrapid increase in absorbance is due to the solution-phaseoxidation of the copper(I) anion by reaction with dioxygendiffusing into the optical window. Even though the solu-tions were deoxygenated by a vigorous nitrogen purge andthe apparatus was sealed with a Teflon lid and Parafilm, asmall amount of dioxygen, which is highly soluble in DMF,is likely to remain present in solution. Background experi-ments also confirmed that diffusion of complex 2 from thebulk solution into the optical window was slow in compari-son to the diffusion and reaction with dioxygen.
In these experiments, the onset of the one-electron re-duction of dioxygen to give superoxide radical anions inaerated DMF was found to occur at approximately –0.48 Vwith a peak at –0.80 V, which is in agreement with pre-viously studies.[34,35]
Despite the central importance of the oxidation of thereduced copper(I) species in the mechanisms of hypoxiaselectivity proposed by Fujibayashi et al.[15,16] and Dearlinget al.[27,28] the oxidation of [CuIHTSM]– by dioxygen ob-served in the UV/Vis-SEC studies provides the first experi-mental evidence of the feasibility of this reaction. In orderto provide further support, DFT calculations were used topredict the energetics of the gas- and solution-phase reac-tion between [CuIHTSM]– and dioxygen to give complex2 and superoxide radical anions [Equation (2)]. Full DFT-calculated energetics are presented in the Supporting Infor-mation. The reaction was predicted to be non-spontaneousin the gas phase with a calculated change in the reactionfree energy of ∆rG0 = +235.5 kJmol–1, with ∆rH0 =241.9 kJmol–1 and ∆rS0 = +21.5 JK–1 mol–1. However,when PCM solvation models were included in the self-con-sistent reaction field (SCRF) calculations, the reaction wasfound to become thermodynamically feasible with calcu-lated ∆rG0(sol) values of –24.0, –8.1 and –25.0 kJmol–1
using water, DMSO and DMF models, respectively.
(2)
Potential Copper-Based Radiopharmaceuticals
Electron Paramagnetic Resonance Spectroscopy
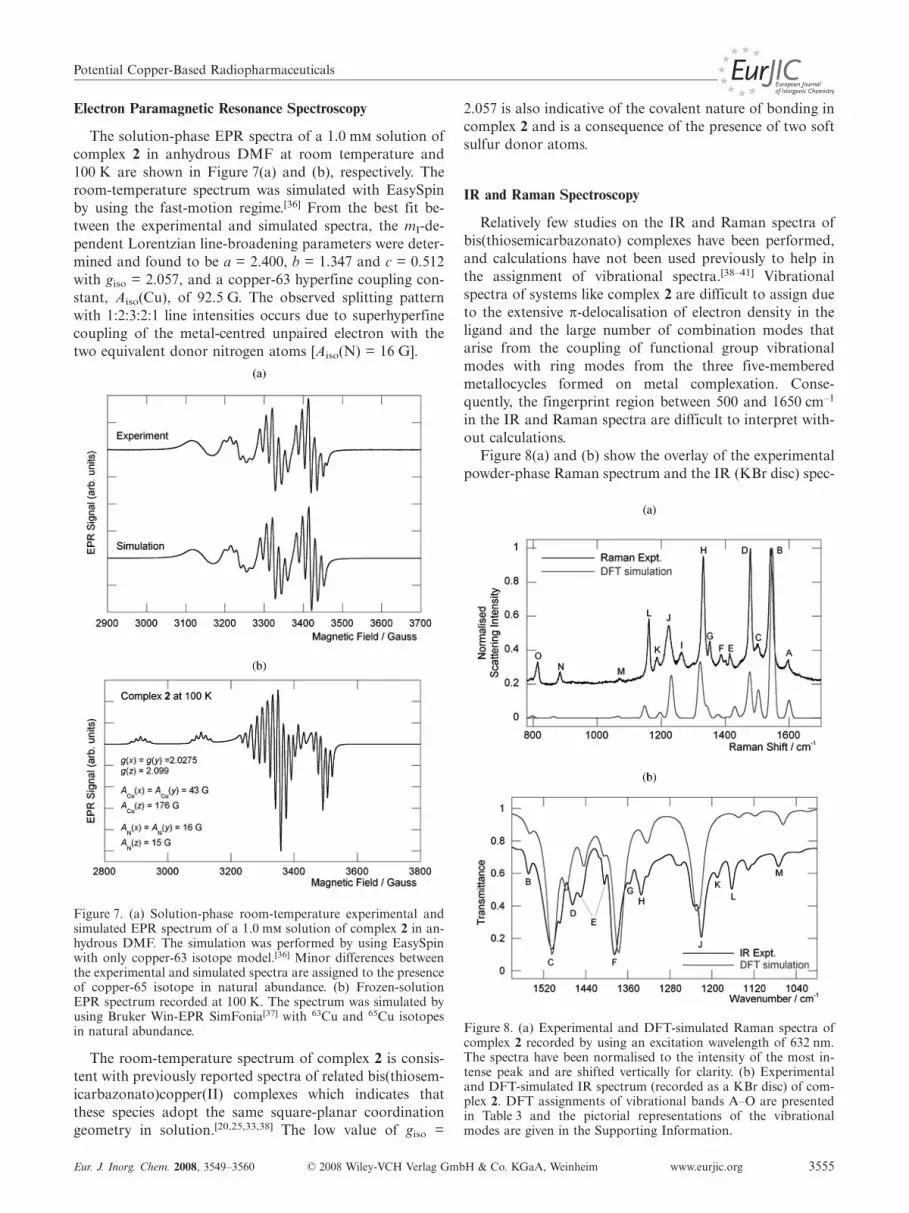
The solution-phase EPR spectra of a 1.0 m solution ofcomplex 2 in anhydrous DMF at room temperature and100 K are shown in Figure 7(a) and (b), respectively. Theroom-temperature spectrum was simulated with EasySpinby using the fast-motion regime.[36] From the best fit be-tween the experimental and simulated spectra, the mI-de-pendent Lorentzian line-broadening parameters were deter-mined and found to be a = 2.400, b = 1.347 and c = 0.512with giso = 2.057, and a copper-63 hyperfine coupling con-stant, Aiso(Cu), of 92.5 G. The observed splitting patternwith 1:2:3:2:1 line intensities occurs due to superhyperfinecoupling of the metal-centred unpaired electron with thetwo equivalent donor nitrogen atoms [Aiso(N) = 16 G].
Figure 7. (a) Solution-phase room-temperature experimental andsimulated EPR spectrum of a 1.0 m solution of complex 2 in an-hydrous DMF. The simulation was performed by using EasySpinwith only copper-63 isotope model.[36] Minor differences betweenthe experimental and simulated spectra are assigned to the presenceof copper-65 isotope in natural abundance. (b) Frozen-solutionEPR spectrum recorded at 100 K. The spectrum was simulated byusing Bruker Win-EPR SimFonia[37] with 63Cu and 65Cu isotopesin natural abundance.
The room-temperature spectrum of complex 2 is consis-tent with previously reported spectra of related bis(thiosem-icarbazonato)copper(II) complexes which indicates thatthese species adopt the same square-planar coordinationgeometry in solution.[20,25,33,38] The low value of giso =
Eur. J. Inorg. Chem. 2008, 3549–3560 © 2008 Wiley-VCH Verlag GmbH & Co. KGaA, Weinheim www.eurjic.org 3555
2.057 is also indicative of the covalent nature of bonding incomplex 2 and is a consequence of the presence of two softsulfur donor atoms.
IR and Raman Spectroscopy
Relatively few studies on the IR and Raman spectra ofbis(thiosemicarbazonato) complexes have been performed,and calculations have not been used previously to help inthe assignment of vibrational spectra.[38–41] Vibrationalspectra of systems like complex 2 are difficult to assign dueto the extensive π-delocalisation of electron density in theligand and the large number of combination modes thatarise from the coupling of functional group vibrationalmodes with ring modes from the three five-memberedmetallocycles formed on metal complexation. Conse-quently, the fingerprint region between 500 and 1650 cm–1
in the IR and Raman spectra are difficult to interpret with-out calculations.
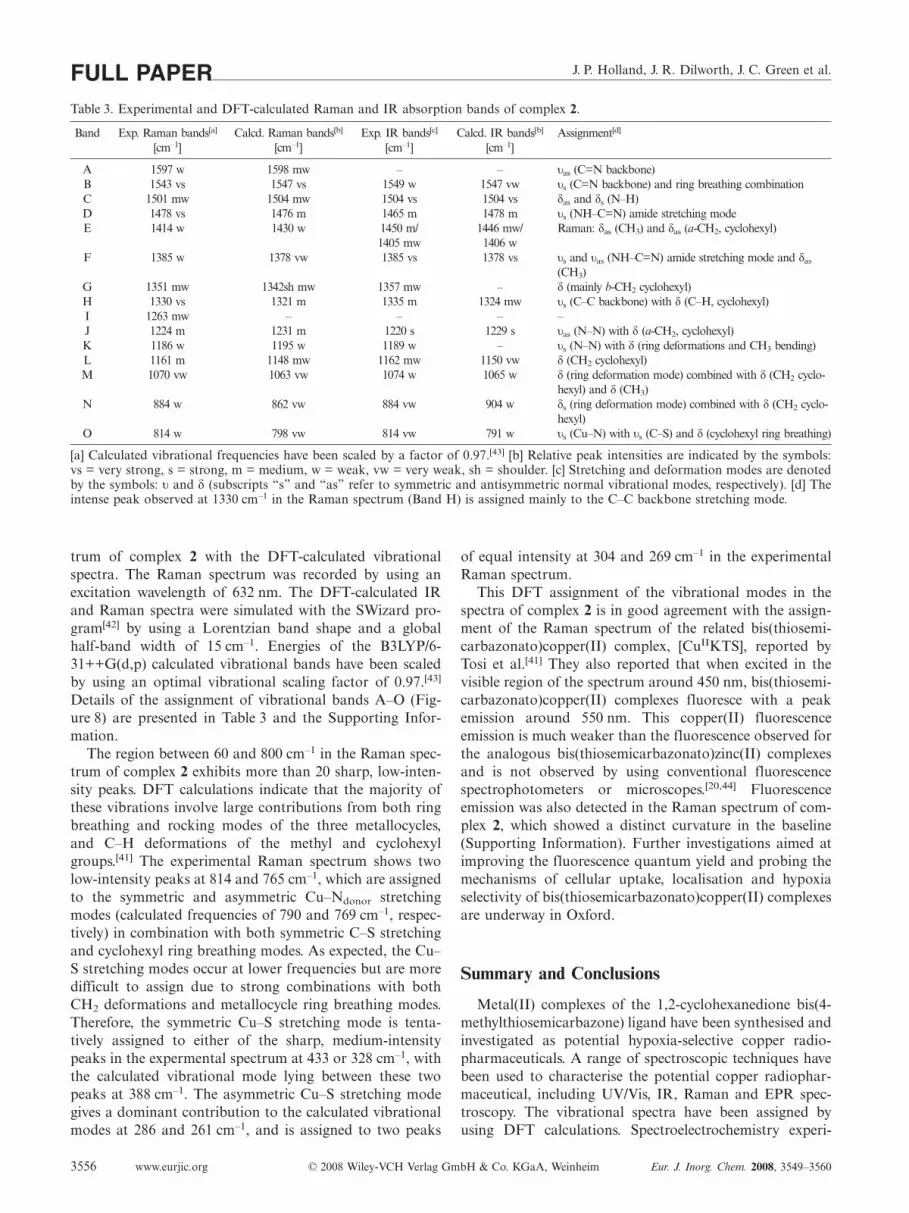
Figure 8(a) and (b) show the overlay of the experimentalpowder-phase Raman spectrum and the IR (KBr disc) spec-
Figure 8. (a) Experimental and DFT-simulated Raman spectra ofcomplex 2 recorded by using an excitation wavelength of 632 nm.The spectra have been normalised to the intensity of the most in-tense peak and are shifted vertically for clarity. (b) Experimentaland DFT-simulated IR spectrum (recorded as a KBr disc) of com-plex 2. DFT assignments of vibrational bands A–O are presentedin Table 3 and the pictorial representations of the vibrationalmodes are given in the Supporting Information.
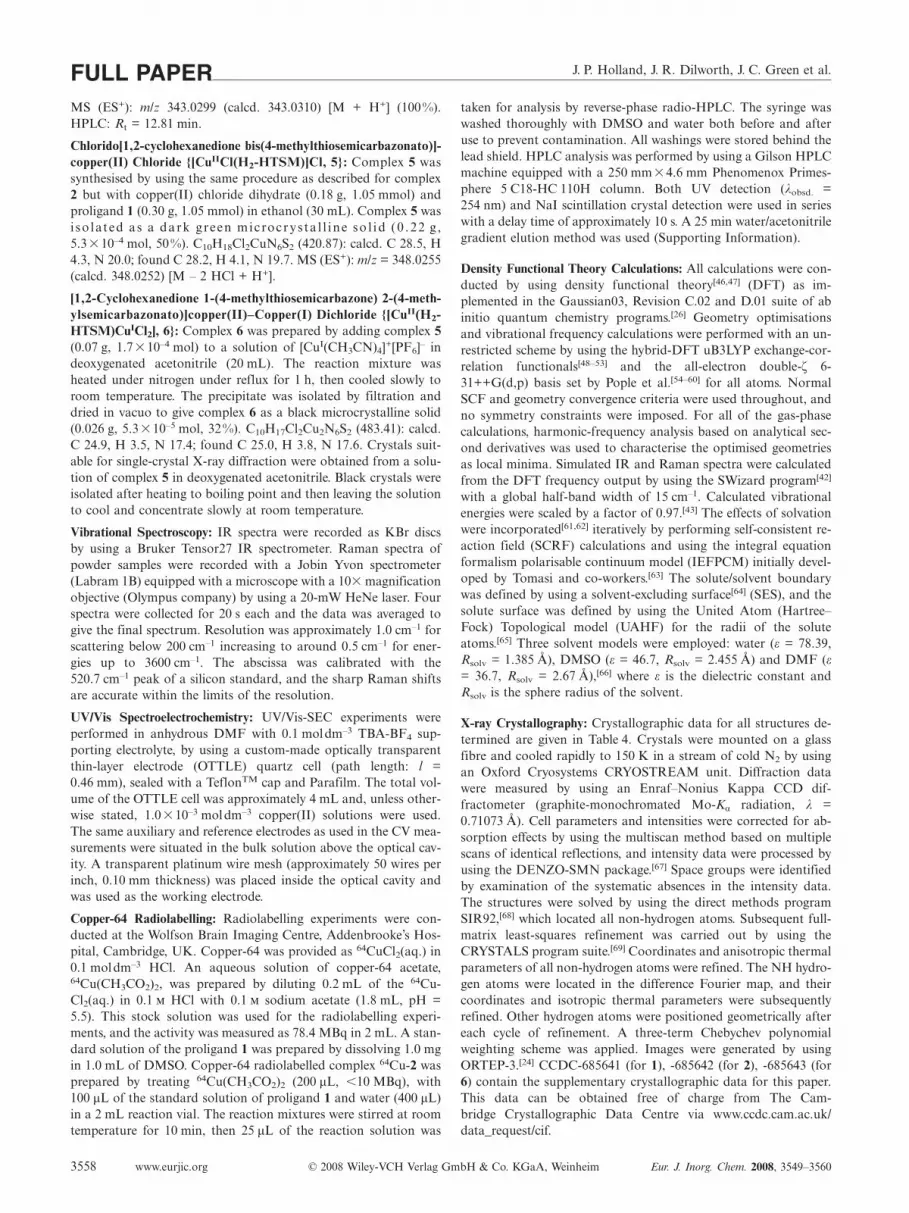
J. P. Holland, J. R. Dilworth, J. C. Green et al.FULL PAPERTable 3. Experimental and DFT-calculated Raman and IR absorption bands of complex 2.
Band Exp. Raman bands[a] Calcd. Raman bands[b] Exp. IR bands[c] Calcd. IR bands[b] Assignment[d]
[cm–1] [cm–1] [cm–1] [cm–1]
A 1597 w 1598 mw – – υas (C=N backbone)B 1543 vs 1547 vs 1549 w 1547 vw υs (C=N backbone) and ring breathing combinationC 1501 mw 1504 mw 1504 vs 1504 vs δas and δs (N–H)D 1478 vs 1476 m 1465 m 1478 m υs (NH–C=N) amide stretching modeE 1414 w 1430 w 1450 m/ 1446 mw/ Raman: δas (CH3) and δas (a-CH2, cyclohexyl)
1405 mw 1406 wF 1385 w 1378 vw 1385 vs 1378 vs υs and υas (NH–C=N) amide stretching mode and δas
(CH3)G 1351 mw 1342sh mw 1357 mw – δ (mainly b-CH2 cyclohexyl)H 1330 vs 1321 m 1335 m 1324 mw υs (C–C backbone) with δ (C–H, cyclohexyl)I 1263 mw – – – –J 1224 m 1231 m 1220 s 1229 s υas (N–N) with δ (a-CH2, cyclohexyl)K 1186 w 1195 w 1189 w – υs (N–N) with δ (ring deformations and CH3 bending)L 1161 m 1148 mw 1162 mw 1150 vw δ (CH2 cyclohexyl)M 1070 vw 1063 vw 1074 w 1065 w δ (ring deformation mode) combined with δ (CH2 cyclo-
hexyl) and δ (CH3)N 884 w 862 vw 884 vw 904 w δs (ring deformation mode) combined with δ (CH2 cyclo-
hexyl)O 814 w 798 vw 814 vw 791 w υs (Cu–N) with υs (C–S) and δ (cyclohexyl ring breathing)
[a] Calculated vibrational frequencies have been scaled by a factor of 0.97.[43] [b] Relative peak intensities are indicated by the symbols:vs = very strong, s = strong, m = medium, w = weak, vw = very weak, sh = shoulder. [c] Stretching and deformation modes are denotedby the symbols: υ and δ (subscripts “s” and “as” refer to symmetric and antisymmetric normal vibrational modes, respectively). [d] Theintense peak observed at 1330 cm–1 in the Raman spectrum (Band H) is assigned mainly to the C–C backbone stretching mode.
trum of complex 2 with the DFT-calculated vibrationalspectra. The Raman spectrum was recorded by using anexcitation wavelength of 632 nm. The DFT-calculated IRand Raman spectra were simulated with the SWizard pro-gram[42] by using a Lorentzian band shape and a globalhalf-band width of 15 cm–1. Energies of the B3LYP/6-31++G(d,p) calculated vibrational bands have been scaledby using an optimal vibrational scaling factor of 0.97.[43]
Details of the assignment of vibrational bands A–O (Fig-ure 8) are presented in Table 3 and the Supporting Infor-mation.
The region between 60 and 800 cm–1 in the Raman spec-trum of complex 2 exhibits more than 20 sharp, low-inten-sity peaks. DFT calculations indicate that the majority ofthese vibrations involve large contributions from both ringbreathing and rocking modes of the three metallocycles,and C–H deformations of the methyl and cyclohexylgroups.[41] The experimental Raman spectrum shows twolow-intensity peaks at 814 and 765 cm–1, which are assignedto the symmetric and asymmetric Cu–Ndonor stretchingmodes (calculated frequencies of 790 and 769 cm–1, respec-tively) in combination with both symmetric C–S stretchingand cyclohexyl ring breathing modes. As expected, the Cu–S stretching modes occur at lower frequencies but are moredifficult to assign due to strong combinations with bothCH2 deformations and metallocycle ring breathing modes.Therefore, the symmetric Cu–S stretching mode is tenta-tively assigned to either of the sharp, medium-intensitypeaks in the expermental spectrum at 433 or 328 cm–1, withthe calculated vibrational mode lying between these twopeaks at 388 cm–1. The asymmetric Cu–S stretching modegives a dominant contribution to the calculated vibrationalmodes at 286 and 261 cm–1, and is assigned to two peaks
www.eurjic.org © 2008 Wiley-VCH Verlag GmbH & Co. KGaA, Weinheim Eur. J. Inorg. Chem. 2008, 3549–35603556
of equal intensity at 304 and 269 cm–1 in the experimentalRaman spectrum.
This DFT assignment of the vibrational modes in thespectra of complex 2 is in good agreement with the assign-ment of the Raman spectrum of the related bis(thiosemi-carbazonato)copper(II) complex, [CuIIKTS], reported byTosi et al.[41] They also reported that when excited in thevisible region of the spectrum around 450 nm, bis(thiosemi-carbazonato)copper(II) complexes fluoresce with a peakemission around 550 nm. This copper(II) fluorescenceemission is much weaker than the fluorescence observed forthe analogous bis(thiosemicarbazonato)zinc(II) complexesand is not observed by using conventional fluorescencespectrophotometers or microscopes.[20,44] Fluorescenceemission was also detected in the Raman spectrum of com-plex 2, which showed a distinct curvature in the baseline(Supporting Information). Further investigations aimed atimproving the fluorescence quantum yield and probing themechanisms of cellular uptake, localisation and hypoxiaselectivity of bis(thiosemicarbazonato)copper(II) complexesare underway in Oxford.
Summary and Conclusions
Metal(II) complexes of the 1,2-cyclohexanedione bis(4-methylthiosemicarbazone) ligand have been synthesised andinvestigated as potential hypoxia-selective copper radio-pharmaceuticals. A range of spectroscopic techniques havebeen used to characterise the potential copper radiophar-maceutical, including UV/Vis, IR, Raman and EPR spec-troscopy. The vibrational spectra have been assigned byusing DFT calculations. Spectroelectrochemistry experi-

Potential Copper-Based Radiopharmaceuticals
ments have shown that metal-centred one-electron re-duction gives the anionic copper(I) species, [CuIHTSM]–,which is stable in the absence of a proton source. The oxi-dation of the copper(I) anion by dioxygen has been ob-served, which provides new evidence in support of the pro-posed mechanisms of hypoxia selectivity.[15,27,28,45] Densityfunctional theory calculations have also been used to studythe potential energy surface of bis(thiosemicarbazone) pro-ligands and the electronic structures of the copper(II) andcopper(I) species. These results also demonstrate that de-spite large variations in the ligand backbone structure, theelectronic and spectroscopic properties of complex 2 remainvery similar to those of the hypoxia-selective radiopharma-ceutical, [CuIIATSM].
The copper(II) complex, [CuIIHTSM], has a one-electronreduction potential which lies within the range expected toconfer hypoxia-selective tumour uptake, and the high radio-chemical yield of the copper-64 radiolabelled complex me-ans that complex 2 has high potential to be used as a PETimaging agent. Further in vitro cellular studies and in vivobiodistribution studies are underway.
Experimental SectionGeneral: All reagents and solvents were obtained from commercialsources (SigmaAldrich and Lancaster) and, unless otherwise stated,were used as received. Elemental analyses were performed by themicroanalysis service of the department at the University of Ox-ford. NMR spectra were recorded with a Varian Mercury VX300spectrometer, [1H at 300 MHz, 13C{1H} at 75.5 MHz] by using theresidual solvent signal as an internal reference. Mass spectra wererecorded with a Micromass LCT Time of Flight Mass Spectrome-ter by using positive ion electrospray (ES+). Where possible, accu-rate masses are reported to four decimal places by using tetraoc-tylammonium bromide (466.5352 Da) as an internal reference. UV/Vis spectra were recorded with a Perkin–Elmer Lambda 19 UV/Vis/NIR spectrometer. EPR spectra were recorded by using quartzcylindrical cells with a Bruker EMX-micro X-band spectrometer atthe EPSRC National EPR Service, at the University of Manchester.High performance liquid chromatography (HPLC) was conductedby using a Gilson HPLC machine equipped with a Hamilton PRP-1 reverse-phase column and UV/Vis detection at 254 nm. Retentiontimes, Rt/min, by using a water/acetonitrile gradient elution method(1.0 mL/min), shown in the Supporting Information, are presentedfor all compounds. CVs of approximately 1.0 m solutions of zin-c(II) and copper(II) complexes in 5.0 mL of anhydrous dimethyl-formamide (DMF) were recorded with a CH Instruments Electro-chemical Analyser by using a platinum working electrode, a plati-num wire counter/auxiliary electrode and a silver/silver ion refer-ence electrode. Ferrocene was used as an internal reference forwhich the one-electron redox process occurs at E1/2 = 0.53 V(DMF) vs. SCE.
Synthesis
1,2-Cyclohexanedione Bis(4-methylthiosemicarbazone) Proligand(H2HTSM, 1): This compound was synthesised by using a pro-cedure described by Mohan et al.[21] 4-Methylthiosemicarbazide(4.69 g, 44.6 mmol) was added to methanol (60 mL) containing gla-cial acetic acid (4 mL) and heated for 5 min. This solution was thenadded to a hot solution of 1,2-cyclohexanedione (2.50 g,22.3 mmol) in methanol (50 mL). The mixture was heated under
Eur. J. Inorg. Chem. 2008, 3549–3560 © 2008 Wiley-VCH Verlag GmbH & Co. KGaA, Weinheim www.eurjic.org 3557
reflux for 15 min until a clear yellow solution was produced andwas then cooled to room temperature. A yellow crystalline solidformed which was collected by filtration, washed with a 1:1 mixtureof methanol/water and dried in vacuo. The product was recrystal-lised from methanol/water (1:1) and dried in vacuo to give com-pound 1 as yellow crystals (1.69 g, 5.9 mmol, 26%). C10H18N6S2
(286.42): calcd. C 41.9, H 6.3, N 29.3; found C 42.0, H 6.4, N 29.4.Solution-phase 1H and 13C{1H} NMR spectra of proligand 1 wereassigned by using two-dimensional COSY, HMQC and HMBCNMR experiments recorded in CDCl3. 1H NMR (300 MHz,CDCl3): δ = 12.92 [s, 1 H, NHC(=S)N(1)HN=], 8.79 [s, 1 H,NHC(=S)N(4)HN=], 7.51 and 7.20 (2 br. s, 2 � 1 H, NHCH3),3.23 and 3.18 (2 overlapping d, 3JHH = 4.8 Hz, 6 H, NHCH3), 2.50(br. m, 4 H, a-CH2), 1.75 (br. m, 4 H, b-CH2) ppm. 13C{1H} NMR(75.5 MHz, CDCl3): δ = 178.4 and 178.2 (C=S), 144.3 and 137.2(C=N), 33.4 (a-CH2), 31.9 and 30.9 (NHCH3), 25.8 (a-CH2), 22.5and 21.3 (b-CH2) ppm. MS (ES+): m/z = 287.1102 (calcd. 287.1113)[M + H+]. Crystals suitable for single-crystal X-ray diffraction wereisolated from the recrystallised product.
[1,2-Cyclohexanedione bis(4-methylthiosemicarbazonato)]copper(II)([CuIIHTSM], 2): Synthesised by using a procedure based on thatdescribed by Rodriguez-Argüelles et al.[22] Proligand 1 (0.30 g,1.05 mmol) in ethanol (30 mL) was added to a hot solution of cop-per(II) acetate monohydrate (0.21 g, 1.05 mmol, 1.0 equiv.) in etha-nol (20 mL), and the solution was heated under nitrogen underreflux for 2 h. The reaction mixture was then concentrated underreduced pressure and cooled to room temperature. The precipitatewas collected by filtration, washed with hexane (2 � 5 mL) anddiethyl ether (2 � 10 mL) and then dried in vacuo to give complex2 as a red/brown microcrystalline solid (0.26 g, 7.5�10–4 mol,71%). C10H16CuN6S2 (347.95): calcd. C 34.5, H 4.6, N 24.1; foundC 34.5, H 4.6, N 24.1. MS (ES+): m/z = 348.0247 (calcd. 348.0252)[M + H+]. UV/Vis (DMF): λmax/nm (ε/mol–1 dm3 m–1) = 532 sh(4742�83), 486 (7545�133), 353 sh (13200�241), 316(23600�465). HPLC: Rt = 14.42 min. Calcd. logPc = 2.00�0.35.Crystals suitable for single-crystal X-ray diffraction were grown byslow concentration of a methanol solution.
[1,2-Cyclohexanedione bis(4-methylthiosemicarbazonato)]zinc(II),([ZnIIHTSM], 3): Synthesised by using the same procedure as de-scribed for complex 2.[22] Zinc diacetate dihydrate (0.23 g,1.05 mmol) was added to a solution of proligand 1 (0.30 g,1.05 mmol) in ethanol (30 mL). Complex 3 was isolated as aorange/yellow microcrystalline solid (0.22 g, 6.3�10–4 mol, 59%).C10H16N6NiS2 (343.09): calcd. C 35.0, H 4.7, N 24.5; found C 34.9,H 4.7, N 24.4. 1H NMR (300 MHz, [D6]DMSO): δ = 7.24 (br. s, 2H, 2 � CH3NH), 2.82 and 2.80 (2 overlapping br. s, 6 H, 2 �
CH3NH), 2.61 (m, 4 H, a-CH2), 1.66 (m, 4 H, b-CH2) ppm.13C{1H} NMR (75.5 MHz, [D6]DMSO): δ = 176.2 (br., 2 � C=S),145.0 (br., 2 � C=N), 29.3 (2 � CH3), 26.4 (2 � a-CH2), 21.3 (2 �
a-CH2) ppm. MS (ES+): m/z = 349.0262 (calcd. 349.0248) [M +H+] (100%). HPLC: Rt = 12.15 min.
[1,2-Cyclohexanedione bis(4-methylthiosemicarbazonato)]nickel(II),([NiIIHTSM], 4): Synthesised by using the same procedure as de-scribed for complex 2.[22] Nickel diacetate tetrahydrate (0.26 g,1.05 mmol) was added to a solution of proligand 1 (0.30 g,1.05 mmol) in ethanol (30 mL). Complex 4 was isolated as a purplemicrocrystalline solid (0.30 g, 8.6�10–4 mol, 82%). C10H16N6NiS2
(343.09): calcd. C 35.0, H 4.7, N 24.5; found C 34.9, H 4.7, N24.4. 1H NMR (300 MHz, [D6]DMSO, 40 °C): δ = 9.08 (br. s, 1 H,CH3NH), 7.50 (br. s, 1 H, CH3NH), 3.00 (br. m, 2 H, b-CH2), 2.80and 2.75 (2 overlapping br. s, 6 H, 2 � CH3NH), 2.38 (br. m, 2 H,b-CH2), 1.61 (br. m, 2 H, a-CH2), 1.54 (br. m, 2 H, a-CH2) ppm.
J. P. Holland, J. R. Dilworth, J. C. Green et al.FULL PAPERMS (ES+): m/z 343.0299 (calcd. 343.0310) [M + H+] (100%).HPLC: Rt = 12.81 min.
Chlorido[1,2-cyclohexanedione bis(4-methylthiosemicarbazonato)]-copper(II) Chloride {[CuIICl(H2-HTSM)]Cl, 5}: Complex 5 wassynthesised by using the same procedure as described for complex2 but with copper(II) chloride dihydrate (0.18 g, 1.05 mmol) andproligand 1 (0.30 g, 1.05 mmol) in ethanol (30 mL). Complex 5 wasiso lated as a dark green microcrysta l l ine so l id (0 .22 g,5.3�10–4 mol, 50%). C10H18Cl2CuN6S2 (420.87): calcd. C 28.5, H4.3, N 20.0; found C 28.2, H 4.1, N 19.7. MS (ES+): m/z = 348.0255(calcd. 348.0252) [M – 2 HCl + H+].
[1,2-Cyclohexanedione 1-(4-methylthiosemicarbazone) 2-(4-meth-ylsemicarbazonato)]copper(II)–Copper(I) Dichloride {[CuII(H2-HTSM)CuICl2], 6}: Complex 6 was prepared by adding complex 5(0.07 g, 1.7�10–4 mol) to a solution of [CuI(CH3CN)4]+[PF6]– indeoxygenated acetonitrile (20 mL). The reaction mixture washeated under nitrogen under reflux for 1 h, then cooled slowly toroom temperature. The precipitate was isolated by filtration anddried in vacuo to give complex 6 as a black microcrystalline solid(0.026 g, 5.3�10–5 mol, 32%). C10H17Cl2Cu2N6S2 (483.41): calcd.C 24.9, H 3.5, N 17.4; found C 25.0, H 3.8, N 17.6. Crystals suit-able for single-crystal X-ray diffraction were obtained from a solu-tion of complex 5 in deoxygenated acetonitrile. Black crystals wereisolated after heating to boiling point and then leaving the solutionto cool and concentrate slowly at room temperature.
Vibrational Spectroscopy: IR spectra were recorded as KBr discsby using a Bruker Tensor27 IR spectrometer. Raman spectra ofpowder samples were recorded with a Jobin Yvon spectrometer(Labram 1B) equipped with a microscope with a 10� magnificationobjective (Olympus company) by using a 20-mW HeNe laser. Fourspectra were collected for 20 s each and the data was averaged togive the final spectrum. Resolution was approximately 1.0 cm–1 forscattering below 200 cm–1 increasing to around 0.5 cm–1 for ener-gies up to 3600 cm–1. The abscissa was calibrated with the520.7 cm–1 peak of a silicon standard, and the sharp Raman shiftsare accurate within the limits of the resolution.
UV/Vis Spectroelectrochemistry: UV/Vis-SEC experiments wereperformed in anhydrous DMF with 0.1 moldm–3 TBA-BF4 sup-porting electrolyte, by using a custom-made optically transparentthin-layer electrode (OTTLE) quartz cell (path length: l =0.46 mm), sealed with a TeflonTM cap and Parafilm. The total vol-ume of the OTTLE cell was approximately 4 mL and, unless other-wise stated, 1.0�10–3 moldm–3 copper(II) solutions were used.The same auxiliary and reference electrodes as used in the CV mea-surements were situated in the bulk solution above the optical cav-ity. A transparent platinum wire mesh (approximately 50 wires perinch, 0.10 mm thickness) was placed inside the optical cavity andwas used as the working electrode.
Copper-64 Radiolabelling: Radiolabelling experiments were con-ducted at the Wolfson Brain Imaging Centre, Addenbrooke’s Hos-pital, Cambridge, UK. Copper-64 was provided as 64CuCl2(aq.) in0.1 mol dm–3 HCl. An aqueous solution of copper-64 acetate,64Cu(CH3CO2)2, was prepared by diluting 0.2 mL of the 64Cu-Cl2(aq.) in 0.1 HCl with 0.1 sodium acetate (1.8 mL, pH =5.5). This stock solution was used for the radiolabelling experi-ments, and the activity was measured as 78.4 MBq in 2 mL. A stan-dard solution of the proligand 1 was prepared by dissolving 1.0 mgin 1.0 mL of DMSO. Copper-64 radiolabelled complex 64Cu-2 wasprepared by treating 64Cu(CH3CO2)2 (200 µL, �10 MBq), with100 µL of the standard solution of proligand 1 and water (400 µL)in a 2 mL reaction vial. The reaction mixtures were stirred at roomtemperature for 10 min, then 25 µL of the reaction solution was
www.eurjic.org © 2008 Wiley-VCH Verlag GmbH & Co. KGaA, Weinheim Eur. J. Inorg. Chem. 2008, 3549–35603558
taken for analysis by reverse-phase radio-HPLC. The syringe waswashed thoroughly with DMSO and water both before and afteruse to prevent contamination. All washings were stored behind thelead shield. HPLC analysis was performed by using a Gilson HPLCmachine equipped with a 250 mm�4.6 mm Phenomenox Primes-phere 5 C18-HC 110H column. Both UV detection (λobsd. =254 nm) and NaI scintillation crystal detection were used in serieswith a delay time of approximately 10 s. A 25 min water/acetonitrilegradient elution method was used (Supporting Information).
Density Functional Theory Calculations: All calculations were con-ducted by using density functional theory[46,47] (DFT) as im-plemented in the Gaussian03, Revision C.02 and D.01 suite of abinitio quantum chemistry programs.[26] Geometry optimisationsand vibrational frequency calculations were performed with an un-restricted scheme by using the hybrid-DFT uB3LYP exchange-cor-relation functionals[48–53] and the all-electron double-ζ 6-31++G(d,p) basis set by Pople et al.[54–60] for all atoms. NormalSCF and geometry convergence criteria were used throughout, andno symmetry constraints were imposed. For all of the gas-phasecalculations, harmonic-frequency analysis based on analytical sec-ond derivatives was used to characterise the optimised geometriesas local minima. Simulated IR and Raman spectra were calculatedfrom the DFT frequency output by using the SWizard program[42]
with a global half-band width of 15 cm–1. Calculated vibrationalenergies were scaled by a factor of 0.97.[43] The effects of solvationwere incorporated[61,62] iteratively by performing self-consistent re-action field (SCRF) calculations and using the integral equationformalism polarisable continuum model (IEFPCM) initially devel-oped by Tomasi and co-workers.[63] The solute/solvent boundarywas defined by using a solvent-excluding surface[64] (SES), and thesolute surface was defined by using the United Atom (Hartree–Fock) Topological model (UAHF) for the radii of the soluteatoms.[65] Three solvent models were employed: water (ε = 78.39,Rsolv = 1.385 Å), DMSO (ε = 46.7, Rsolv = 2.455 Å) and DMF (ε= 36.7, Rsolv = 2.67 Å),[66] where ε is the dielectric constant andRsolv is the sphere radius of the solvent.
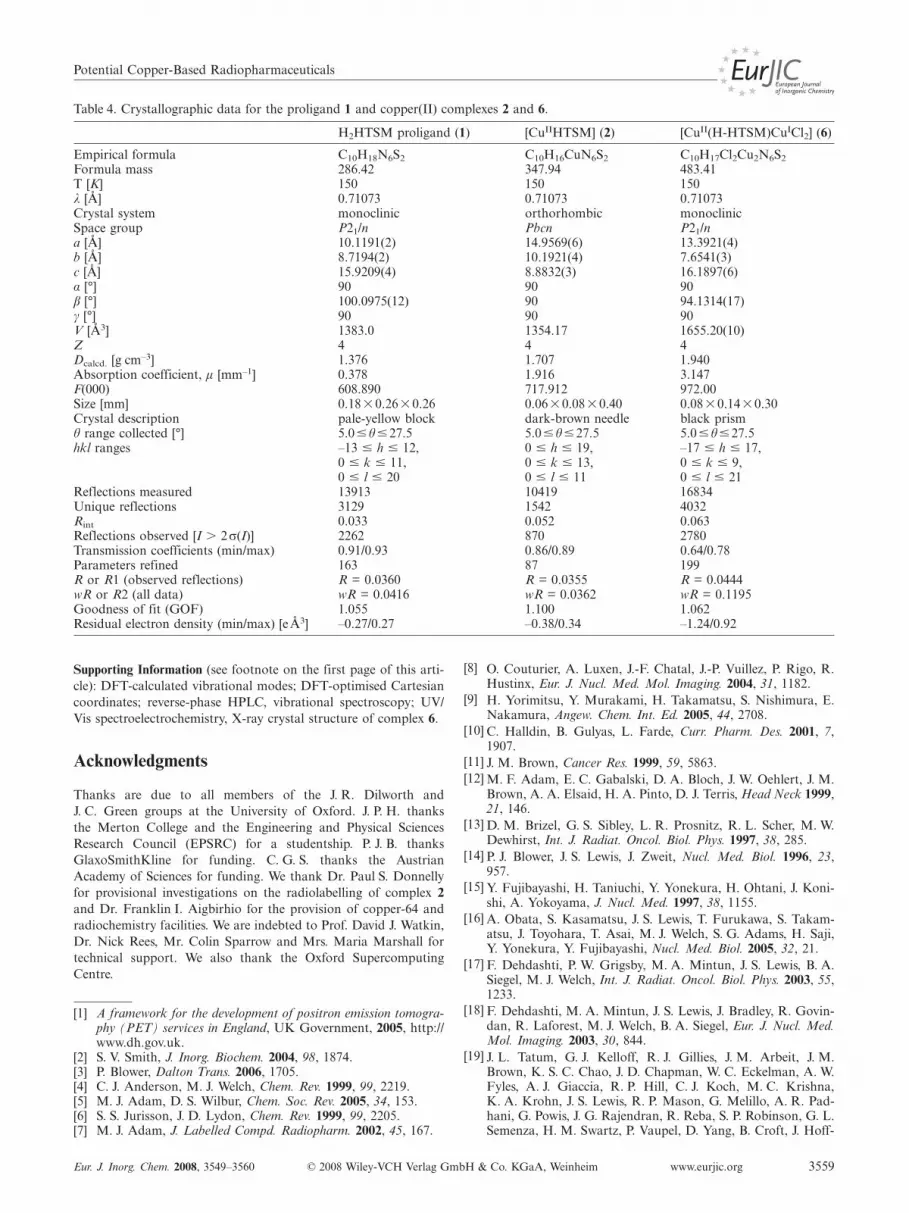
X-ray Crystallography: Crystallographic data for all structures de-termined are given in Table 4. Crystals were mounted on a glassfibre and cooled rapidly to 150 K in a stream of cold N2 by usingan Oxford Cryosystems CRYOSTREAM unit. Diffraction datawere measured by using an Enraf–Nonius Kappa CCD dif-fractometer (graphite-monochromated Mo-Kα radiation, λ =0.71073 Å). Cell parameters and intensities were corrected for ab-sorption effects by using the multiscan method based on multiplescans of identical reflections, and intensity data were processed byusing the DENZO-SMN package.[67] Space groups were identifiedby examination of the systematic absences in the intensity data.The structures were solved by using the direct methods programSIR92,[68] which located all non-hydrogen atoms. Subsequent full-matrix least-squares refinement was carried out by using theCRYSTALS program suite.[69] Coordinates and anisotropic thermalparameters of all non-hydrogen atoms were refined. The NH hydro-gen atoms were located in the difference Fourier map, and theircoordinates and isotropic thermal parameters were subsequentlyrefined. Other hydrogen atoms were positioned geometrically aftereach cycle of refinement. A three-term Chebychev polynomialweighting scheme was applied. Images were generated by usingORTEP-3.[24] CCDC-685641 (for 1), -685642 (for 2), -685643 (for6) contain the supplementary crystallographic data for this paper.This data can be obtained free of charge from The Cam-bridge Crystallographic Data Centre via www.ccdc.cam.ac.uk/data_request/cif.
Potential Copper-Based Radiopharmaceuticals
Table 4. Crystallographic data for the proligand 1 and copper(II) complexes 2 and 6.
H2HTSM proligand (1) [CuIIHTSM] (2) [CuII(H-HTSM)CuICl2] (6)
Empirical formula C10H18N6S2 C10H16CuN6S2 C10H17Cl2Cu2N6S2
Formula mass 286.42 347.94 483.41T [K] 150 150 150λ [Å] 0.71073 0.71073 0.71073Crystal system monoclinic orthorhombic monoclinicSpace group P21/n Pbcn P21/na [Å] 10.1191(2) 14.9569(6) 13.3921(4)b [Å] 8.7194(2) 10.1921(4) 7.6541(3)c [Å] 15.9209(4) 8.8832(3) 16.1897(6)α [°] 90 90 90β [°] 100.0975(12) 90 94.1314(17)γ [°] 90 90 90V [Å3] 1383.0 1354.17 1655.20(10)Z 4 4 4Dcalcd. [g cm–3] 1.376 1.707 1.940Absorption coefficient, µ [mm–1] 0.378 1.916 3.147F(000) 608.890 717.912 972.00Size [mm] 0.18�0.26�0.26 0.06�0.08�0.40 0.08�0.14�0.30Crystal description pale-yellow block dark-brown needle black prismθ range collected [°] 5.0�θ�27.5 5.0�θ�27.5 5.0�θ�27.5hkl ranges –13 � h � 12, 0 � h � 19, –17 � h � 17,
0 � k � 11, 0 � k � 13, 0 � k � 9,0 � l � 20 0 � l � 11 0 � l � 21
Reflections measured 13913 10419 16834Unique reflections 3129 1542 4032Rint 0.033 0.052 0.063Reflections observed [I � 2σ(I)] 2262 870 2780Transmission coefficients (min/max) 0.91/0.93 0.86/0.89 0.64/0.78Parameters refined 163 87 199R or R1 (observed reflections) R = 0.0360 R = 0.0355 R = 0.0444wR or R2 (all data) wR = 0.0416 wR = 0.0362 wR = 0.1195Goodness of fit (GOF) 1.055 1.100 1.062Residual electron density (min/max) [eÅ3] –0.27/0.27 –0.38/0.34 –1.24/0.92
Supporting Information (see footnote on the first page of this arti-cle): DFT-calculated vibrational modes; DFT-optimised Cartesiancoordinates; reverse-phase HPLC, vibrational spectroscopy; UV/Vis spectroelectrochemistry, X-ray crystal structure of complex 6.
Acknowledgments
Thanks are due to all members of the J. R. Dilworth andJ. C. Green groups at the University of Oxford. J. P. H. thanksthe Merton College and the Engineering and Physical SciencesResearch Council (EPSRC) for a studentship. P. J. B. thanksGlaxoSmithKline for funding. C. G. S. thanks the AustrianAcademy of Sciences for funding. We thank Dr. Paul S. Donnellyfor provisional investigations on the radiolabelling of complex 2and Dr. Franklin I. Aigbirhio for the provision of copper-64 andradiochemistry facilities. We are indebted to Prof. David J. Watkin,Dr. Nick Rees, Mr. Colin Sparrow and Mrs. Maria Marshall fortechnical support. We also thank the Oxford SupercomputingCentre.
[1] A framework for the development of positron emission tomogra-phy (PET) services in England, UK Government, 2005, http://www.dh.gov.uk.
[2] S. V. Smith, J. Inorg. Biochem. 2004, 98, 1874.[3] P. Blower, Dalton Trans. 2006, 1705.[4] C. J. Anderson, M. J. Welch, Chem. Rev. 1999, 99, 2219.[5] M. J. Adam, D. S. Wilbur, Chem. Soc. Rev. 2005, 34, 153.[6] S. S. Jurisson, J. D. Lydon, Chem. Rev. 1999, 99, 2205.[7] M. J. Adam, J. Labelled Compd. Radiopharm. 2002, 45, 167.
Eur. J. Inorg. Chem. 2008, 3549–3560 © 2008 Wiley-VCH Verlag GmbH & Co. KGaA, Weinheim www.eurjic.org 3559
[8] O. Couturier, A. Luxen, J.-F. Chatal, J.-P. Vuillez, P. Rigo, R.Hustinx, Eur. J. Nucl. Med. Mol. Imaging. 2004, 31, 1182.
[9] H. Yorimitsu, Y. Murakami, H. Takamatsu, S. Nishimura, E.Nakamura, Angew. Chem. Int. Ed. 2005, 44, 2708.
[10] C. Halldin, B. Gulyas, L. Farde, Curr. Pharm. Des. 2001, 7,1907.
[11] J. M. Brown, Cancer Res. 1999, 59, 5863.[12] M. F. Adam, E. C. Gabalski, D. A. Bloch, J. W. Oehlert, J. M.
Brown, A. A. Elsaid, H. A. Pinto, D. J. Terris, Head Neck 1999,21, 146.
[13] D. M. Brizel, G. S. Sibley, L. R. Prosnitz, R. L. Scher, M. W.Dewhirst, Int. J. Radiat. Oncol. Biol. Phys. 1997, 38, 285.
[14] P. J. Blower, J. S. Lewis, J. Zweit, Nucl. Med. Biol. 1996, 23,957.
[15] Y. Fujibayashi, H. Taniuchi, Y. Yonekura, H. Ohtani, J. Koni-shi, A. Yokoyama, J. Nucl. Med. 1997, 38, 1155.
[16] A. Obata, S. Kasamatsu, J. S. Lewis, T. Furukawa, S. Takam-atsu, J. Toyohara, T. Asai, M. J. Welch, S. G. Adams, H. Saji,Y. Yonekura, Y. Fujibayashi, Nucl. Med. Biol. 2005, 32, 21.
[17] F. Dehdashti, P. W. Grigsby, M. A. Mintun, J. S. Lewis, B. A.Siegel, M. J. Welch, Int. J. Radiat. Oncol. Biol. Phys. 2003, 55,1233.
[18] F. Dehdashti, M. A. Mintun, J. S. Lewis, J. Bradley, R. Govin-dan, R. Laforest, M. J. Welch, B. A. Siegel, Eur. J. Nucl. Med.Mol. Imaging. 2003, 30, 844.
[19] J. L. Tatum, G. J. Kelloff, R. J. Gillies, J. M. Arbeit, J. M.Brown, K. S. C. Chao, J. D. Chapman, W. C. Eckelman, A. W.Fyles, A. J. Giaccia, R. P. Hill, C. J. Koch, M. C. Krishna,K. A. Krohn, J. S. Lewis, R. P. Mason, G. Melillo, A. R. Pad-hani, G. Powis, J. G. Rajendran, R. Reba, S. P. Robinson, G. L.Semenza, H. M. Swartz, P. Vaupel, D. Yang, B. Croft, J. Hoff-

J. P. Holland, J. R. Dilworth, J. C. Green et al.FULL PAPERman, G. Liu, H. Stone, D. Sullivan, Int. J. Radiat. Biol. 2006,82, 699.
[20] J. P. Holland, F. I. Aigbirhio, H. M. Betts, P. D. Bonnitcha, P.Burke, M. Christlieb, G. C. Churchill, A. R. Cowley, J. R.Dilworth, P. S. Donnelly, J. C. Green, J. M. Peach, S. R. Vasud-evan, J. E. Warren, Inorg. Chem. 2007, 46, 465.
[21] M. Mohan, P. Sharma, M. Kumar, N. K. Jha, Inorg. Chim.Acta 1986, 125, 9.
[22] M. C. Rodriguez-Arguelles, L. P. Battaglia, M. B. Ferrari,G. G. Fava, C. Pelizzi, G. Pelosi, J. Chem. Soc., Dalton Trans.1995, 2297.
[23] F. H. Allen, O. Kennard, D. G. Watson, L. Brammer, A. G.Orpen, R. Taylor, J. Chem. Soc. Perkin Trans. 2 1987, S1.
[24] L. J. Farrugia, J. Appl. Crystallogr. 1997, 30, 565.[25] P. J. Blower, T. C. Castle, A. R. Cowley, J. R. Dilworth, P. S.
Donnelly, E. Labisbal, F. E. Sowrey, S. J. Teat, M. J. Went, Dal-ton Trans. 2003, 4416.
[26] M. J. Frisch, G. W. Trucks, H. B. Schlegel, G. E. Scuseria,M. A. Robb, J. R. Cheeseman, J. A. Montgomery, Jr., T.Vreven, K. N. Kudin, J. C. Burant, J. M. Millam, S. S. Iyengar,J. Tomasi, V. Barone, B. Mennucci, M. Cossi, G. Scalmani, N.Rega, G. A. Petersson, H. Nakatsuji, M. Hada, M. Ehara, K.Toyota, R. Fukuda, J. Hasegawa, M. Ishida, T. Nakajima, Y.Honda, O. Kitao, H. Nakai, M. Klene, X. Li, J. E. Knox, H. P.Hratchian, J. B. Cross, V. Bakken, C. Adamo, J. Jaramillo, R.Gomperts, R. E. Stratmann, O. Yazyev, A. J. Austin, R.Cammi, C. Pomelli, J. W. Ochterski, P. Y. Ayala, K. Morok-uma, G. A. Voth, P. Salvador, J. J. Dannenberg, V. G. Zakrzew-ski, S. Dapprich, A. D. Daniels, M. C. Strain, O. Farkas, D. K.Malick, A. D. Rabuck, K. Raghavachari, J. B. Foresman, J. V.Ortiz, Q. Cui, A. G. Baboul, S. Clifford, J. Cioslowski, B. B.Stefanov, G. Liu, A. Liashenko, P. Piskorz, I. Komaromi, R. L.Martin, D. J. Fox, T. Keith, M. A. Al-Laham, C. Y. Peng, A.Nanayakkara, M. Challacombe, P. M. W. Gill, B. Johnson, W.Chen, M. W. Wong, C. Gonzalez, J. A. Pople, Gaussian 03, Re-vision C.02, Gaussian, Inc., Wallingford CT, 2004.
[27] J. L. J. Dearling, J. S. Lewis, D. W. McCarthy, M. J. Welch, P. J.Blower, Chem. Commun. 1998, 2531.
[28] J. L. J. Dearling, J. S. Lewis, G. E. D. Mullen, M. J. Welch, P. J.Blower, J. Biol. Inorg. Chem. 2002, 7, 249.
[29] J. L. J. Dearling, P. J. Blower, Chem. Commun. 1998, 2531.[30] R. I. Maurer, P. J. Blower, J. R. Dilworth, C. A. Reynolds, Y.
Zheng, G. E. D. Mullen, J. Med. Chem. 2002, 45, 1420.[31] A. J. Bard, L. R. Faulkner, Electrochemical Methods: Funda-
mentals and Applications, 2nd ed., Wiley, New York, 2001.[32] J. P. Holland, J. C. Green, J. R. Dilworth, Dalton Trans. 2006,
783.[33] L. E. Warren, S. M. Horner, W. E. Hatfield, J. Am. Chem. Soc.
1972, 94, 6392.[34] D. L. Maricle, W. G. Hodgson, Anal. Chem. 1965, 37, 1562.[35] D. Vasudevan, H. Wendt, J. Electroanal. Chem. 1995, 392, 69.[36] S. Stoll, A. Schweiger, J. Magn. Reson. 2006, 178, 42.[37] Bruker, Win-EPR SimFonia, version 1.26 beta, http://
www.bruker-biospin.com/simfonia.html.[38] D. X. West, J. S. Ives, G. A. Bain, A. E. Liberta, J. Valdes-Mar-
tinez, K. H. Ebert, S. Hernandez-Ortega, Polyhedron 1997, 16,1895.
www.eurjic.org © 2008 Wiley-VCH Verlag GmbH & Co. KGaA, Weinheim Eur. J. Inorg. Chem. 2008, 3549–35603560
[39] D. X. West, A. E. Liberta, S. B. Padhye, R. C. Chikate, P. B.Sonawane, A. S. Kumbhar, R. G. Yerande, Coord. Chem. Rev.1993, 123, 49.
[40] D. X. West, S. B. Padhye, P. B. Sonawane, Struct. Bonding(Berlin) 1991, 76, 1.
[41] L. Tosi, A. Garnier-Suillerot, J. Chem. Soc., Dalton Trans.1982, 103.
[42] S. I. Gorelsky, SWizard program, Department of Chemistry,York University, Toronto, ON, Canada, 1998, http://www.sg-chem.net/.
[43] K. K. Irikura, R. D. Johnson III, R. N. Kacker, J. Phys. Chem.2005, 109, 8430.
[44] A. R. Cowley, J. Davis, J. R. Dilworth, P. S. Donnelly, R. Dob-son, A. Nightingale, J. M. Peach, B. Shore, D. Kerr, L. Seym-our, Chem. Commun. 2005, 845.
[45] A. Obata, E. Yoshimi, A. Waki, J. S. Lewis, N. Oyama, M. J.Welch, H. Saji, Y. Yonekura, Y. Fujibayashi, Ann. Nucl. Med.2001, 15, 499.
[46] P. Hohenberg, W. Kohn, Phys. Rev. B 1964, 136, 864.[47] W. Kohn, L. J. Sham, Phys. Rev. B 1965, 140, 1133.[48] A. D. Becke, Phys. Rev. A 1988, 38, 3098.[49] A. D. Becke, J. Chem. Phys. 1992, 96, 2155.[50] A. D. Becke, J. Chem. Phys. 1992, 97, 9173.[51] A. D. Becke, J. Chem. Phys. 1993, 98, 5648.[52] S. H. Vosko, L. Wilk, M. Nusair, Can. J. Phys. 1980, 58, 1200.[53] C. Lee, W. Yang, R. G. Parr, Phys. Rev. B 1988, 37, 785.[54] R. Ditchfield, W. J. Hehre, J. A. Pople, J. Chem. Phys. 1971, 54,
724.[55] W. J. Hehre, R. Ditchfield, J. A. Pople, J. Chem. Phys. 1972, 56,
2257.[56] P. C. Hariharan, J. A. Pople, Mol. Phys. 1974, 27, 209.[57] P. C. Hariharan, J. A. Pople, Theor. Chim. Acta 1973, 28, 213.[58] M. M. Francl, W. J. Pietro, W. J. Hehre, J. S. Binkley, M. S.
Gordon, D. J. DeFrees, J. A. Pople, J. Chem. Phys. 1982, 77,3654.
[59] V. A. Rassolov, J. A. Pople, M. A. Ratner, T. L. Windus, J.Chem. Phys. 1998, 109, 1223.
[60] V. A. Rassolov, M. A. Ratner, J. A. Pople, P. C. Redfern, L. A.Curtiss, J. Comput. Chem. 2001, 22, 976.
[61] R. J. Hall, M. M. Davidson, N. A. Burton, I. H. Hillier, J. Phys.Chem. 1995, 99, 921.
[62] J. L. Chen, L. Noodleman, D. A. Case, D. Bashford, J. Phys.Chem. 1994, 98, 11059.
[63] J. Tomasi, B. Mennucci, R. Cammi, Chem. Rev. 2005, 105,2999.
[64] M. L. Connolly, Science 1983, 221, 709.[65] V. Barone, M. Cossi, J. Tomasi, J. Chem. Phys. 1997, 107, 3210.[66] L. Y. Zhang, R. A. Friesner, J. Phys. Chem. 1995, 99, 16479.[67] Z. Otwinowski, W. Minor, Methods Enzymol. 1997, 276, 307.[68] A. Altomare, G. Cascarano, G. Giacovazzo, A. Guagliardi,
M. C. Burla, G. Polidori, M. Camalli, J. Appl. Crystallogr.1994, 27, 435.
[69] P. W. Betteridge, J. R. Carruthers, R. I. Cooper, K. Prout, D. J.Watkin, J. Appl. Crystallogr. 2003, 36, 1487.
Received: April 22, 2008Published Online: June 24, 2008
Copyright © 2022 FDOKUMEN