Composition and comparative toxicity of particulate matter emitted from a diesel and biodiesel...
11
This article appeared in a journal published by Elsevier. The attached copy is furnished to the author for internal non-commercial research and education use, including for instruction at the authors institution and sharing with colleagues. Other uses, including reproduction and distribution, or selling or licensing copies, or posting to personal, institutional or third party websites are prohibited. In most cases authors are permitted to post their version of the article (e.g. in Word or Tex form) to their personal website or institutional repository. Authors requiring further information regarding Elsevier’s archiving and manuscript policies are encouraged to visit: http://www.elsevier.com/copyright
Transcript of Composition and comparative toxicity of particulate matter emitted from a diesel and biodiesel...

This article appeared in a journal published by Elsevier. The attachedcopy is furnished to the author for internal non-commercial researchand education use, including for instruction at the authors institution
and sharing with colleagues.
Other uses, including reproduction and distribution, or selling orlicensing copies, or posting to personal, institutional or third party
websites are prohibited.
In most cases authors are permitted to post their version of thearticle (e.g. in Word or Tex form) to their personal website orinstitutional repository. Authors requiring further information
regarding Elsevier’s archiving and manuscript policies areencouraged to visit:
http://www.elsevier.com/copyright
Author's personal copy
Composition and comparative toxicity of particulate matter emitted from a dieseland biodiesel fuelled CRDI engine
Jitendra N. Gangwara, Tarun Guptab, Avinash K. Agarwala,*aDepartment of Mechanical Engineering, Indian Institute of Technology Kanpur, Kanpur-208016, UP, IndiabDepartment of Civil Engineering, Indian Institute of Technology Kanpur, Kanpur-208016, UP, India
a r t i c l e i n f o
Article history:Received 25 January 2011Received in revised form2 September 2011Accepted 3 September 2011
Keywords:BiodieselParticulatesTrace MetalsElemental carbon/ organic carbonPAHs
a b s t r a c t
There is a global concern about adverse health effects of particulate matter (PM) originating from dieselengine exhaust. In the current study, parametric investigations were carried out using a CRDI (CommonRail Direct Injection) diesel engine operated at different loads at two different engine speeds (1800 and2400 rpm), employing diesel and 20% biodiesel blends (B20) produced from Karanja oil. A partial flowdilution tunnel was employed to collect and measure the mass of the primary particulates from dieseland biodiesel blend collected on a 47 mm quartz substrate. The collected PM (particulate matter) wassubjected to chemical analyses in order to assess the amount of Benzene Soluble Organic Fraction (BSOF)and trace metals using Inductively Coupled Plasma-Optical Emission Spectrometer (ICP-OES). For bothdiesel and biodiesel, BSOF results showed decreasing levels with increasing engine load. B20 showedhigher BSOF as compared to those measured with diesel. The concentration of different trace metalsanalyzed also showed decreasing trends with increasing engine loads. In addition, real-time measure-ments for Organic Carbon (OC), Elemental Carbon (EC) and total particle-bound Polycyclic AromaticHydrocarbons (PAHs) were carried out on the primary engine exhaust coming out of the partial flowdilution tunnel. Analysis of OC/EC data suggested that the ratio of OC to EC decreases with correspondingincrease in engine load for both fuels. A peak in PAH concentration was observed at 60% engine load at1800 rpm and 20% engine load at 2400 rpm engine speeds almost identical for both kinds of fuels.Comparison of chemical components of PM emitted from this CRDI engine provides new insight in termsof PM toxicity for B20 vis-a-vis diesel.
� 2011 Elsevier Ltd. All rights reserved.
1. Introduction
Diesel engine is themost efficient power source among all types ofinternal combustion engines. Diesel engine is advantageous in termsof lower CO and HC emissions vis-a-vis gasoline engines. However,diesel engines are disadvantaged in terms of high NOx and particulatematters which are directly associatedwith adverse human health andenvironmental impacts. This study mainly focuses on particulatematter emitted in engine exhaust. PM in engine exhaust containstoxic species such as benzene and polycyclic aromatic hydrocarbons(PAHs), and trace metals (Gupta et al., 2010). Diesel particulates area complexmixture of several organic compounds (OC), also known assoluble organic fraction (SOF), sulphate, nitrates, elemental metals,and irritants (such as acrolein, ammonia, acids, fuel vapours, unburnt
lubricating oils, moisture, PAHs) mostly adsorbed onto an elementalcarbon (EC) core.
The solid phase emissions are made up of small (10e80 nm)spherical carbon particles; these are termed as solids (SOL), solidparticulate or soot. The liquid phase emissions are composed of theorganic or hydrocarbon compounds and sulfates. The organic fractionof diesel particulate contains compounds such as aldehydes, alkanesand alkenes, aliphatic hydrocarbons, PAH and PAH derivatives(Johnson et al., 1994). Interaction of biodiesel with lubricating oil isquite different from interaction of mineral diesel with lubricating oil(Agarwal, 2005). The organic fraction comes from the unburnt fueland lubricating oils, and from partially oxidized/pyrolysed fuel andoils (Williams et al., 1987). The National Research Council (1983)showed that approximately 25% of the particlemassmay be extractedusing organic solvent but, depending on the engine conditions andtesting cycle (Williams et al., 1989). Organic fraction containingneutral and aromatic fraction of diesel soot has been found to bemutagenic and carcinogenic in nature (USEPA, 1995). PAHs arearomatic hydrocarbon with two or more (upto five or six) benzene
* Corresponding author. Tel./fax: þ91 512 2597982.E-mail address: [email protected] (A.K. Agarwal).
Contents lists available at SciVerse ScienceDirect
Atmospheric Environment
journal homepage: www.elsevier .com/locate/atmosenv
1352-2310/$ e see front matter � 2011 Elsevier Ltd. All rights reserved.doi:10.1016/j.atmosenv.2011.09.007
Atmospheric Environment 46 (2012) 472e481
Author's personal copy
rings joined in various (more or less) clustered forms. Aromaticcompound concentration in diesel varies between 1.5% and 2.5%. It isalso believed that some of the heaviest PAH compounds are generatedby pyrosynthesis of these aromatic compounds in the engine.
A four-stroke heavy-duty engine emits various tracemetals suchas silicon, calcium, zinc and phosphorus (Hare, 1997). Calcium wasfound to be a dominant metal in PM with levels ranging from 0.01to 0.29% (w/wparticulate) (Springer, 1997). Phosphorus, silica and zincwere next most abundantmetallic element found and sodium, iron,nickel, barium, chromium and copper were present either in small
concentrations or were below detection limits (Agarwal et al., 2010;Kothari, 2009). In contrast with diesel emissions, scientists areconstantly working on alternative fuels, to help address energycost, energy security and global warming concerns associated withliquid fossil fuels. Biofuels contribution to greenhouse effect isalmost negligible, since carbon dioxide (CO2) emitted duringcombustion is recycled in the photosynthesis process in the plants(Agarwal & Agarwal, 2007; Bona et al., 1999; Agarwal, 1998;Narayan, 1992). Amongst alternative fuels, biodiesel has showna great potential, especially to address the problem of CO2 emis-sions and need for decentralized power, especially in rural areas(Wedel, 1999). A number of studies of larger heavy-duty enginesand heavy-duty vehicles have concluded that biodiesel can provideemission reductions in terms of hydrocarbons (HC), carbonmonoxide (CO) and particulate matter (PM), with some increaseobserved for nitrogen oxides (NOx) (Amann et al., 1980). Biodieselhas higher cetane number than mineral diesel because of its higheroxygen content. It reduces the ignition delay thus combustionstarts earlier and therefore emissions of HC, CO and PM are reduceddue to higher degree of premixed combustion. Biodiesel can beused in neat form (B100) or can be blended with petroleum dieselin any proportions (CARB, 1998; Agarwal et al., 2006). Biodiesel hasadvantages of being virtually free from sulphur and aromaticcompounds (Turrio-Baldassarri et al., 2004), therefore the possi-bility of its particulate being less toxic is contemplated, however itneeds to be experimentally verified. For this purpose, it is essentialto collect the samples of particulates from biodiesel fuelled engineand carry out detailed chemical characterisation including theirtrace metal content vis-a-vis diesel fuelled exhaust particulates.Therefore the objective of this paper is to comparatively assess andcharacterize the particulate emissions from a CRDI engine fuelledwith diesel and B20 (20% biodiesel blend) in terms of (i) Particulate
mass (ii) BSOF (iii) PAHs and (iv) Elemental carbon, organic carbonand total carbon and (v) Trace elemental metals.
2. Materials and methods
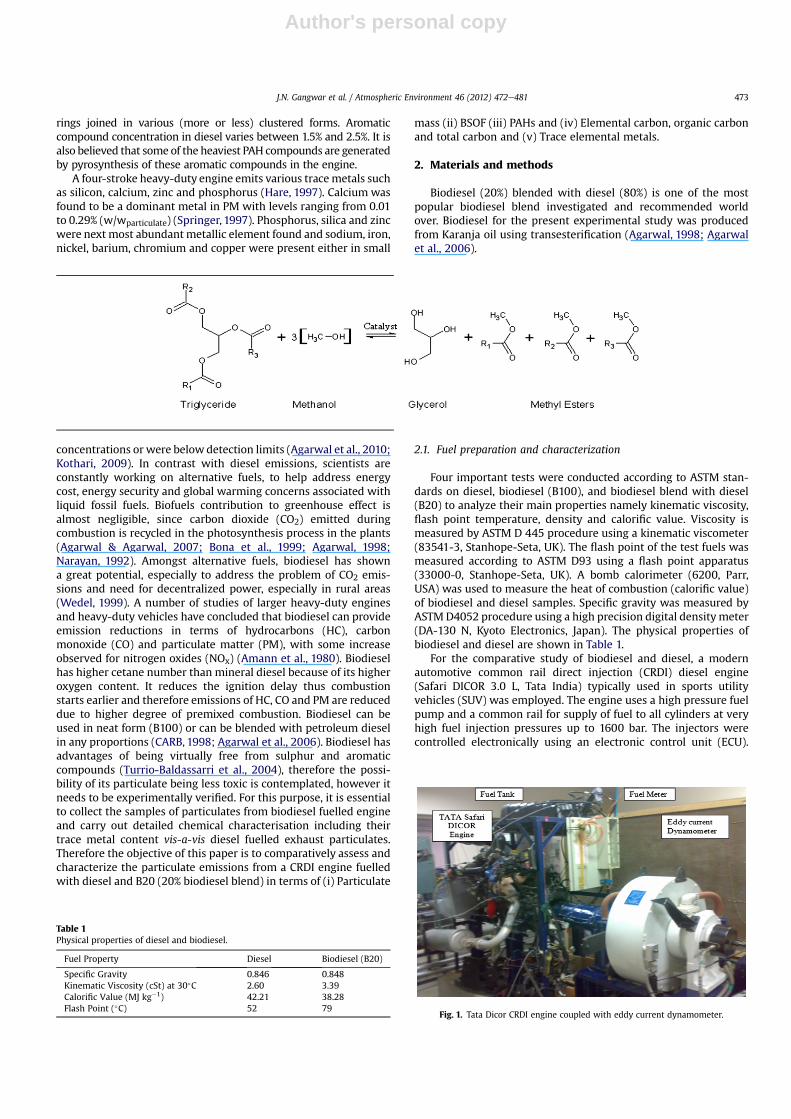
Biodiesel (20%) blended with diesel (80%) is one of the mostpopular biodiesel blend investigated and recommended worldover. Biodiesel for the present experimental study was producedfrom Karanja oil using transesterification (Agarwal, 1998; Agarwalet al., 2006).
2.1. Fuel preparation and characterization
Four important tests were conducted according to ASTM stan-dards on diesel, biodiesel (B100), and biodiesel blend with diesel(B20) to analyze their main properties namely kinematic viscosity,flash point temperature, density and calorific value. Viscosity ismeasured by ASTM D 445 procedure using a kinematic viscometer(83541-3, Stanhope-Seta, UK). The flash point of the test fuels wasmeasured according to ASTM D93 using a flash point apparatus(33000-0, Stanhope-Seta, UK). A bomb calorimeter (6200, Parr,USA) was used to measure the heat of combustion (calorific value)of biodiesel and diesel samples. Specific gravity was measured byASTMD4052 procedure using a high precision digital densitymeter(DA-130 N, Kyoto Electronics, Japan). The physical properties ofbiodiesel and diesel are shown in Table 1.
For the comparative study of biodiesel and diesel, a modernautomotive common rail direct injection (CRDI) diesel engine(Safari DICOR 3.0 L, Tata India) typically used in sports utilityvehicles (SUV) was employed. The engine uses a high pressure fuelpump and a common rail for supply of fuel to all cylinders at veryhigh fuel injection pressures up to 1600 bar. The injectors werecontrolled electronically using an electronic control unit (ECU).
Table 1Physical properties of diesel and biodiesel.
Fuel Property Diesel Biodiesel (B20)
Specific Gravity 0.846 0.848Kinematic Viscosity (cSt) at 30�C 2.60 3.39Calorific Value (MJ kg�1) 42.21 38.28Flash Point (�C) 52 79
Fig. 1. Tata Dicor CRDI engine coupled with eddy current dynamometer.
J.N. Gangwar et al. / Atmospheric Environment 46 (2012) 472e481 473

Author's personal copy
High fuel injection pressure results in finer atomization of the fuelsprays, which leads to more complete combustion, higher effi-ciency and lower emissions. The engine is coupled with an eddycurrent dynamometer for loading the engine at different speeds(Fig. 1). The dynamometer is controlled using a dynamometercontroller as well as a computer with a software interface betweenthe dynamometer and the computer. The specifications of theengine and dynamometer used in the experimental setup are givenin Table 2.
The schematic of the experimental setup developed for carryingout the engine experiments is given in Fig. 2.
An experimental setup was developed which included a set ofdifferentmeasuring instruments like semi continuous OC/EC analyzer(Semi continuous field v.4, Sunset Laboratory), which measuresorganic carbon, elemental carbon and total carbon (Bae et al., 2004);Online PAH analyzer (PAS 2000, EcoChem Labs) (Ott and Siegmann,2006), which measures total particulate bound PAHs for primary aswell as secondary aerosols, and emission analyzer (4000 Digas, AVL).A partial flow dilution tunnel was used for dilution of diesel exhaustemissions with ambient air in order to complete the coagulation andcondensation processes occurring during the particulate formation.When the diesel engine is operated, carbonaceous soot particles and
high boiling point hydrocarbons are emitted from the tailpipe. Thesehydrocarbons condense on soot (mostly EC) to form PM after beingdiluted with preheated air inside the partial flow dilution tunnel(Dwivedi et al., 2006). Engine exhaust flows through partial flowdilution tunnel before entering different instrument inlets as shownin the Fig. 2. Experimental setup was developed using pipes, elbowsand valves (Swagelok fittings) made of stainless steel (SS, grade 316),in order to ensureminimumcontamination during experiment due tothe inert nature of SS. Valves were installed at different places tocontrol and distribute required exhaust aerosol flows to the instru-ments at different times of experiment, for sampling primary aerosolsaccording to the measurement requirements. From the exhaust pipeof engine, small fraction of exhaust gases were passed to partial flowdilution tunnel. Thereafter, preheated and pre-filtered atmosphericair is mixed with this exhaust to attain a specific dilution ratio asspecified by EPA (maintained between 10 and 16 in this case). Thesample gas is mixed with the ambient air inside the dilution tunneland they travel together so that mixing and agglomeration processesof particulate formation are completed to a reasonable extent. Thisdiluted gas then passes through the filter assembly, where particu-lates are filtered out on a preconditioned filter paper. A 4 way valvewas put through which undiluted exhaust was passed from one side,on the other side diluted exhaust comes out and from one sideambient air was passed. Finally from the exit line of 4 way valvethrough pipe, it was passed to Exhaust gas emission analyser. Thisanalyzer measures CO2, CO, HC, NO, and O2 in the exhaust gases. Thecarbon dioxide (CO2) concentration is measured for undilutedexhaust, ambient air and diluted exhaust for the calculation andverification of dilution ratio using the formulae given below.
Dilution ratio r ¼ ½Undiluted exhaust CO2�½Diluted exhaust CO2 � Ambient air CO2�
One exhaust line from the dilution tunnel was taken to the real-time instruments (PAS2000 and OC/EC Analyzer) for measuring thereal time measurements of PAHs and elemental, organic and totalcarbon in the exhaust. The volume of exhaust flow passing throughthese instruments was controlled by separate twoway valves fittedon the pipes going to the instruments.
All the instruments were calibrated and tested individually withambient air before carrying out the engine experiments. The Semicontinuous OC/EC analyzer measures organic carbon, elemental
Table 2Engine and eddy current dynamometer specifications.
Engine SpecificationsMake/Model Tata motors, India/Safari Dicor 3.0 L (BS-III/Euro-III)Engine Type Water cooled, CRDI, Turbocharged, IntercooledNo. of Cylinders 4, In-lineBore/Stroke 97/100 mmCubic Capacity 2956 ccMaximum Engine Output 84.5 kW @ 3000 rpmMaximum Torque 300 Nm at 1600e2000 rpmCompression Ratio 17.5Firing Order 1-3-4-2Fuel Injection System CRDI with 1600 bar max fuel injection pressureTiming and Governing ECU controlDynamometer SpecificationsMake/Model Dynomerk, Pune, India/EC-300Capacity 220 kW at 2500e8000 rpmMaximum Speed 8000 rpmMaximum Torque 702 NmDirection Of Rotation Bi-directionalRPM Accuracy �1 rpm
Fig. 2. Schematic of the experimental setup.
J.N. Gangwar et al. / Atmospheric Environment 46 (2012) 472e481474
Author's personal copy
carbon and total carbon (Bae et al., 2004). OC/EC instrument providesorganic and elemental carbon results, which are comparable to therecognized NIOSH method 5040. Once the sample collection iscomplete, the oven is purged with helium. This is followed bya stepped-temperature ramp, which increases the oven temperatureto 850 �C, thus thermally desorbing OC and pyrolysis products intoamanganese dioxide (MnO2) oxidizing oven. As the carbon fragmentsflow through the MnO2 oven, they are quantitatively converted toCO2. The CO2 is swept out of the oxidizing oven along with heliumstream and measured directly by a self-contained non-dispersiveinfrared (NDIR) detector system. A second temperature ramp is theninitiated in the oxidizing gas stream and then elemental carbon isoxidized off the filter and into the oxidizing oven and measured byNDIR. The EC is then detected in the samemanner as the OC (Springer,1997). Online PAH analyzer (PAS 2000, EcoChem Labs) is a standardreal-time monitor for Particle-Bound Polycyclic Aromatic Hydrocar-bons (PAHs), which works on the principle of photo ionization ofparticle-bound PAH. It can range from 0 to 100 pico amp and hassensitivity range ofw0.3e1 g m�3 PAH per pico amp. It has responsetime less than 10 s. PAH analyzer measures total particulate boundPAH content of primary exhaust particulates in the present study. Theparticulate samples collected on the filter substrate need to beanalyzed for detection of elemental trace metals using the Inductivelycoupled plasma-optical emission spectrometry (ICP-OES) (iCAP DUO6300 ICP Spectrophotometer, Thermo Fischer Scientific). It is a type ofemission spectroscopy that uses inductively coupled plasma toproduce excited atoms and ions that emit electromagnetic radiationsat wavelengths characteristic to a particular element. The intensity ofthis emission is indicative of the concentration of the particularelement present in the particulate sample.
To characterize the emissions from mineral diesel and biodiesel(B20), the engine was operated at loads ranging from 0%, 20%, 40%,60%, 80% to 100% rated engine load at two constant speeds of 1800and 2400 rpm. Particulate samples were collected iso-kineticallyusing a partial flow dilution tunnel. The partial flow dilutiontunnel was used to simulate the ambient environment for collect-ing the exhaust particulates from the engine. This tunnel drawsa fraction of exhaust gases from the main exhaust line. Thereafter,pre-filtered and preheated atmospheric air is mixed with thisexhaust to attain a specific dilution ratio as specified by EPA, whichis maintained between 14 and 16. The diluted exhaust undergoescomplete mixing and particulate formation via condensation ofgaseous material on tiny nuclei particles (heterogeneous conden-sation) along with adsorption, absorption and coagulationprocesses, which are completed to a reasonable extent within thedesigned residence time inside the dilution tunnel.
For determining the sampling duration for each test, engineexperiments were conducted for different time durations and allthe particulate samples were collected in triplicate and analysed.Based on the results from the graphical presentation of data,appropriate sampling durations for this study were chosen e.g. formetal analysis of particulate samples, the sampling duration waschosen as 15 min. Similar sampling duration was also recom-mended by previous studies.
The first step in the sampling procedure was conditioning andpreparation of filter papers (Make: Whatman; 47 mm, Tissue-Quartz Filter). Filter papers were first desiccated for 12 h in anhy-drate silica gel desiccators and then weighed using a microbalance(CPa2P-F, Sartorius AG). For collecting the particulate sample, pre-weighed, conditioned filter paper was placed in filter holderassembly of the partial flow dilution tunnel. The engine wasoperated for a predetermined period of time at desired load andspeed, and particulates were collected on the filter substrate(Table 3). After completion of the engine experiment, the filtersubstrate was carefully removed from the filter assembly and kept
in the desiccators for 12 h and then weighed again. These filterpapers were then further analyzed for total mass of particulatescollected, BSOF, and trace elemental metals as per the test plan.
2.2. BSOF analysis procedure
ASTM test method D4600-87 (2001) was used for estimation ofBSOF in diesel particulates. This gravimetric method was recom-mended by National Institute of Occupational Safety and Health(NIOSH), USA to represent the toxic organic compounds present inthe particulates collected on filter paper. Filter papers were desic-cated for 12 h before and after sampling and initial and finalweights were noted. Filter papers were cut into several small piecesusing a metal scissor and then placed into a reagent beaker.Thereafter 20 ml of benzene was added to it. These reagent bottleswere kept in ultrasonic bath for 20 min. Thereafter sample wasdecanted and vacuum filtered through 0.45 mm Millipore filterpaper. The filtrate was collected in a 100 ml pre-weighed beaker.The procedure was repeated with another 10 ml of benzene in thesame reagent beaker. These 100 ml beakers were covered withaluminium foil having holes and were kept in oven at 40 �C for12e18 h until the sample dried. The initial and final weight of thebeaker was measured at room temperatures to estimate the totalmass of benzene soluble organic fraction in the sample. In order tocheck the reference concentration; blank filters were used forbenzene extraction as per the same ASTM standard.
2.3. Trace metal analysis procedure
USEPA, MESW-846, 3015A method was used for extractingtrace metals from exhaust particulate matter. Sample extractionwas carried out using hot plate digestion method. This digestionprocedure is used for preparing samples, which are to beanalyzed by ICP-OES. One half of the sample laden filter was cutinto small pieces using plastic scissors and then put into an inert
Table 3Sampling details.
Engine speed(rpm)
Engineload (%)
Samplingduration forMass/BSOF(min)
Onlinesamplingduration forOC/EC (min)
Onlinesamplingduration forPAHs (min)
Samplingduration forMetals (min)
1800/2400 0 30 7 5 151800/2400 20 30 7 5 151800/2400 40 30 7 5 151800/2400 60 30 7 5 151800/2400 80 30 7 5 151800/2400 100 30 7 5 15
Note: Particulate samples were collected in triplicate for all the different chemicalanalyses.
Table 4Average metal presence in blank (tissue-quartz) filter samples.
Metals Concentration(mg g�1
filter weight)
Fe 5.73Ca 2.47Cr 0.44Cu 0.23Mg 1.79Na 0.33Pb 0.06Mn 0.015B 0.24Si 0.13
J.N. Gangwar et al. / Atmospheric Environment 46 (2012) 472e481 475

Author's personal copy
bottle, in which 15 ml concentrated HNO3 (High Purity, Merck)was added. The remaining half of the filter paper was taken insimilar way into another bottle. Temperature of each samplewas raised to 175 �C in less than 5.5 min and maintained at175 �C for more than 4.5 min. After digestion, the acid from thetwo vessels was taken together and filtered through 0.22 micronfilter paper. The filtrate was measured and diluted 3 times withMilli-Q water and then further stored in inert bottles. Referencewas taken as analytical blank filter paper and 30 ml of conc.HNO3 (High Purity, Merck), 10% of blanks from the same lot offilter papers were used to get a best representative averageblank concentration for data correction. By this method,concentrations of trace metals such as Ca, Cu, Cr, Fe, Na, Ni, Pb,Zn, Mn, Mg were analyzed by ICP-OES.
2.4. Quality control and error budget
Variousmetals were investigated howevermany of thesemetalswere below detection limit of the instrument and only the metalsdetected with confidence are presented in this section.
Quality control procedures involved steps like using clearforceps (cleaned with ethanol), while handling the filters each timeto avoid contamination; and keeping the filters in sealed glasswarein refrigerated environment until the analysis. The data is correctedfor blanks and the metals present in particulate collected on thefilter paper. 10% analytical blank filters were used for determiningmetal concentrations using ICP-OES. Table 4 represents averageconcentration of metals present in the blank filters. Concentrationis represented in terms of weight of metal present in blank filter(mg) per gram of the filter paper weight.
All the data presented in this paper have been corrected forblank concentrations. Typical weight of a quartz filter is between
0.14 and 0.15 g, hence contribution of blanks in exhaust particulatesamples was miniscule however it has been accounted for in theinterest of accuracy of the results.
3. Results and discussion
Samples of particulates from engine operating at various loadand speed combinations were collected for soluble organic fractionanalysis and metal analysis on filter paper using partial flow dilu-tion tunnel. The exhaust gases were also analysed for total PAHsand EC/OC using online instruments. The two test fuels used in thisstudy were diesel and 20% blend of biodiesel with diesel (B20). Inthis chapter, these results are discussed and compared.
3.1. Particulate mass emissions
Fig. 3 shows the particulate mass collected on a filter paperfrom diesel and biodiesel (B20) exhaust from the CRDI engine atconstant speeds of 1800 and 2400 rpm for varying load condi-tions. The sampling of exhaust particulate collected on the filterpaper was carried out thrice (30 min each) under identicalconditions. The values shown in graph are the average of threereadings with the variability depicted in the error bars. Theabsolute error bars shown in the graph also includes the inherenterror introduced due to the overall error associated with thegravimetric measurement.
Fig. 3 shows that the particulate mass increases with increase inengine load for both fuels, biodiesel (B20) and diesel. As the loadincreases, more fuel undergoes combustion resulting in highermass of the primary particulate formation in the engine cylinder.However, it is noteworthy that particulate emission is slightlyhigher in diesel exhaust (13.3 mg @ 1800 rpm and 17.6 mg @
Fig. 3. Comparison of total particulate mass from a CRDI engine.
Fig. 4. BSOF of particulates from diesel and biodiesel fuelled CRDI engine.
J.N. Gangwar et al. / Atmospheric Environment 46 (2012) 472e481476

Author's personal copy
2400 rpm) at rated load as compared to biodiesel exhaust (7.9 mg @1800 rpm and 17.2 mg @ 2400 rpm) at rated load. The reduction inparticulate concentration with B20 fuel compared to diesel can beattributed to lower C/H ratio and presence of oxygen atoms in themolecular structure of biodiesel.
3.2. Benzene soluble organic fraction (BSOF) in particulates
The particulates were collected on the filter substrates in trip-licate under identical conditions with a sampling duration of30 min (Table 3). The filter papers were then analyzed for BSOF of
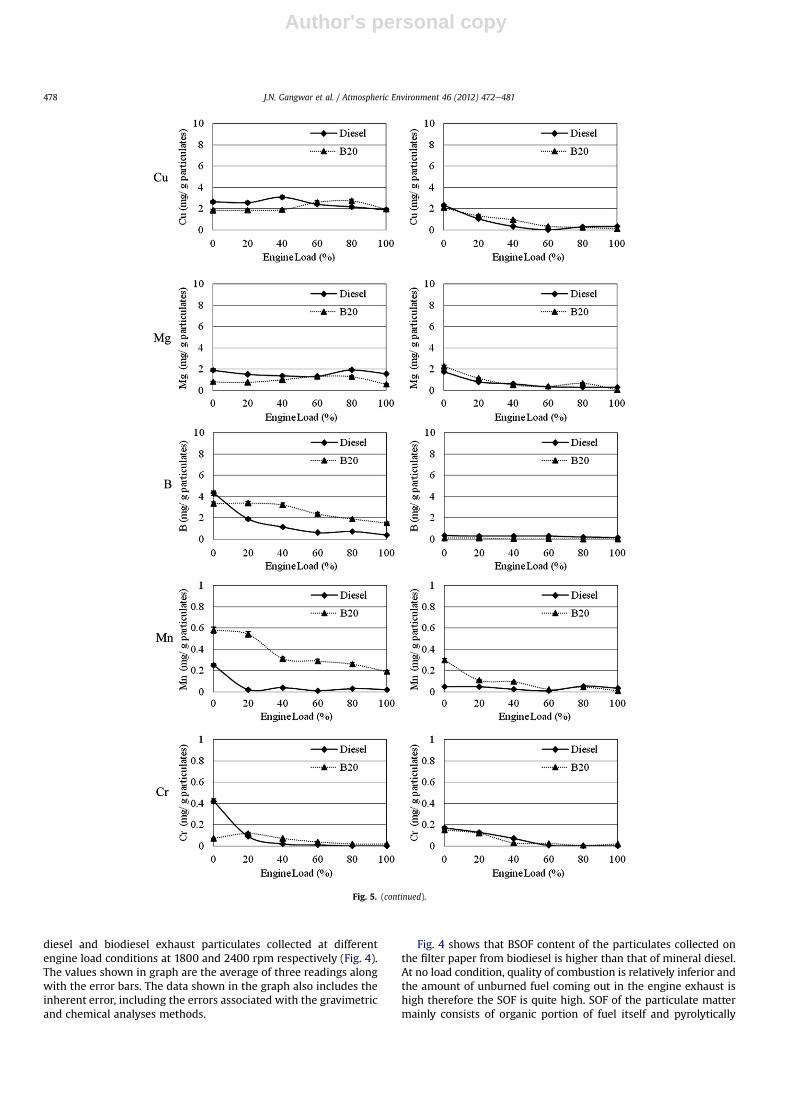
Fig. 5. Comparison of metal content from diesel and biodiesel fuelled CRDI engine.
J.N. Gangwar et al. / Atmospheric Environment 46 (2012) 472e481 477
Author's personal copy
diesel and biodiesel exhaust particulates collected at differentengine load conditions at 1800 and 2400 rpm respectively (Fig. 4).The values shown in graph are the average of three readings alongwith the error bars. The data shown in the graph also includes theinherent error, including the errors associated with the gravimetricand chemical analyses methods.
Fig. 4 shows that BSOF content of the particulates collected onthe filter paper from biodiesel is higher than that of mineral diesel.At no load condition, quality of combustion is relatively inferior andthe amount of unburned fuel coming out in the engine exhaust ishigh therefore the SOF is quite high. SOF of the particulate mattermainly consists of organic portion of fuel itself and pyrolytically
Fig. 5. (continued).
J.N. Gangwar et al. / Atmospheric Environment 46 (2012) 472e481478
Author's personal copy
generated organic products formed during the process of sootformation. As the load increases, SOF of particulate matterdecreases. At higher engine loads, combustion efficiency is relativelybetter hence amount of unburned fuel decreases leading to loweramount of soluble organic fraction. Fig. 4b also showed similar trendas Fig. 4a however the BSOF content at 2400 rpm at higher speedwas higher than that of 1800 rpm. Since the time available forcombustion is lower at higher engine speed, which may be thepossible reason for relatively higher BSOF of particulates at higherengine speed. The main point to be noticed here is that the BSOFcontent of particulates from biodiesel engine is higher than that ofmineral diesel, indicating possibly higher toxicity potential of bio-diesel particulates. This needs to be further investigated and verifiedby animal exposure studies, before going for large scale imple-mentation of biodiesel program. Similar results were also presentedin another earlier study from our research group (Dwivedi et al.,2006).
3.3. Trace metals in exhaust particulates
A detailed experimental study was carried out to study theeffects of variation in engine load on the concentration of metals inparticulate coming out of engine exhaust, when the speed of engineis kept constant at 1800 and 2400 rpm.
Fig. 5 shows the trace metal content of the particulate collectedon the filter paper for 15 min from diesel and biodiesel (B20)exhaust from CRDI engine at varying load conditions at two enginespeeds of 1800 and 2400 rpm respectively. The sampling of exhaustparticulate collected on the filter paper was conducted in triplicatefor each engine load and speed condition. The values shown in thegraph are the average of three readings along with the methoddetection limit (MDL) and standard deviation for each metalmeasured during the analysis by ICP-OES. Various metals were
investigated however many of the metals were below detectionlimit of the instrument. Experimental data showed that concen-trations of Ca, Fe, Cu, Mg, Na, Pb, B and Si were much higher thanthose of Cr and Mn (Table 5).
Fig. 5 shows comparison in metal concentrations from dieseland biodiesel fuelled CRDI engine at two constant speeds of1800 rpm and 2400 rpm respectively.
All the graphs for detection of metal content in diesel and bio-diesel exhaust showed more or less same trend with increasingloads but Na concentration in particulates is very high compared toany other metal. The possible reason for higher concentration of Nafrom biodiesel may be addition of NaOH (catalyst) during theprocess of biodiesel production by transesterification process. Allthe metal concentration results presented reflect that as loadincreases, the trace metal content in particulates graduallydecreases. This can be explained by the fact that at higher engineloads, combustion takes place at relatively higher temperature;leading to improved thermal efficiency. Brake specific fuelconsumption of diesel engine decreases with increasing load/speedand this is reflected in reduced emission of metals with increasingengine load. Three metals silicon, cooper and magnesium arepresent in higher concentration in the particulate collected fromDEcompared to BDE. Other metals such as sodium, calcium, iron, lead,manganese and chromium are found in higher concentration in theparticulate collected from BDE compared to DE. This can beattributed to the fact that these all metals might be in higherconcentration in the fuel itself.
3.4. Concentration of particulate bound PAH’s
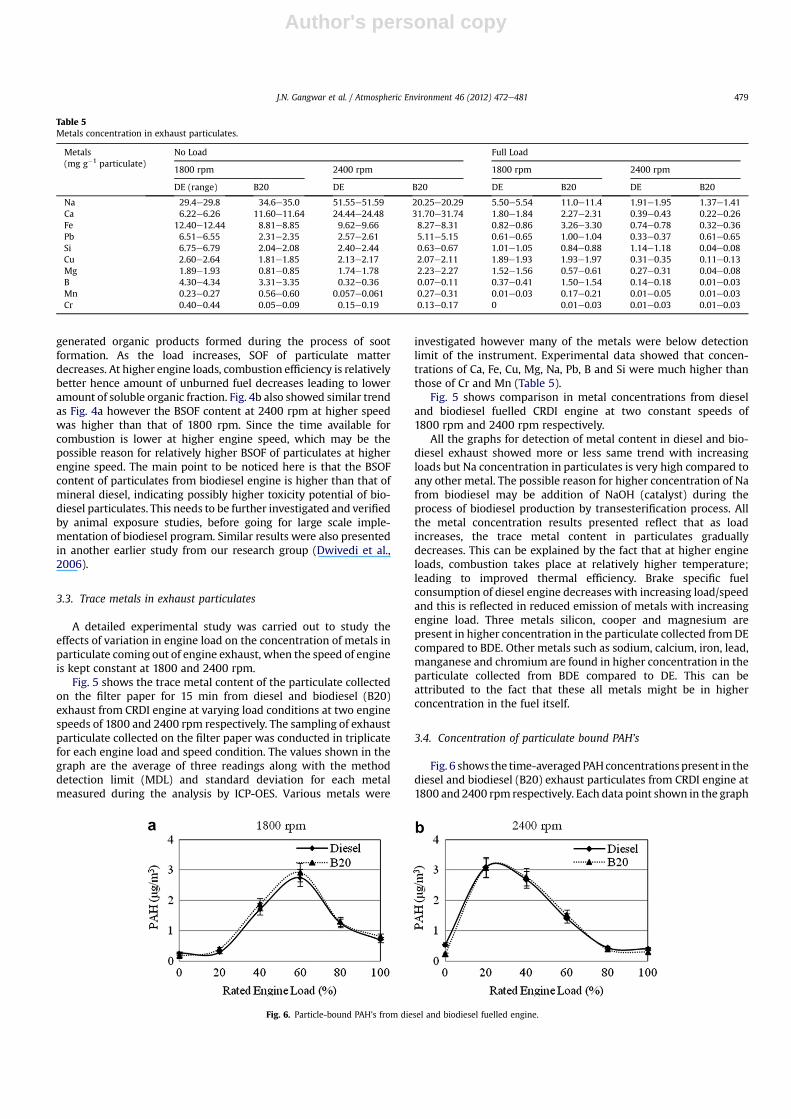
Fig. 6 shows the time-averagedPAHconcentrations present in thediesel and biodiesel (B20) exhaust particulates from CRDI engine at1800 and 2400 rpm respectively. Each data point shown in the graph
Fig. 6. Particle-bound PAH’s from diesel and biodiesel fuelled engine.
Table 5Metals concentration in exhaust particulates.
Metals(mg g�1 particulate)
No Load Full Load
1800 rpm 2400 rpm 1800 rpm 2400 rpm
DE (range) B20 DE B20 DE B20 DE B20
Na 29.4e29.8 34.6e35.0 51.55e51.59 20.25e20.29 5.50e5.54 11.0e11.4 1.91e1.95 1.37e1.41Ca 6.22e6.26 11.60e11.64 24.44e24.48 31.70e31.74 1.80e1.84 2.27e2.31 0.39e0.43 0.22e0.26Fe 12.40e12.44 8.81e8.85 9.62e9.66 8.27e8.31 0.82e0.86 3.26e3.30 0.74e0.78 0.32e0.36Pb 6.51e6.55 2.31e2.35 2.57e2.61 5.11e5.15 0.61e0.65 1.00e1.04 0.33e0.37 0.61e0.65Si 6.75e6.79 2.04e2.08 2.40e2.44 0.63e0.67 1.01e1.05 0.84e0.88 1.14e1.18 0.04e0.08Cu 2.60e2.64 1.81e1.85 2.13e2.17 2.07e2.11 1.89e1.93 1.93e1.97 0.31e0.35 0.11e0.13Mg 1.89e1.93 0.81e0.85 1.74e1.78 2.23e2.27 1.52e1.56 0.57e0.61 0.27e0.31 0.04e0.08B 4.30e4.34 3.31e3.35 0.32e0.36 0.07e0.11 0.37e0.41 1.50e1.54 0.14e0.18 0.01e0.03Mn 0.23e0.27 0.56e0.60 0.057e0.061 0.27e0.31 0.01e0.03 0.17e0.21 0.01e0.05 0.01e0.03Cr 0.40e0.44 0.05e0.09 0.15e0.19 0.13e0.17 0 0.01e0.03 0.01e0.03 0.01e0.03
J.N. Gangwar et al. / Atmospheric Environment 46 (2012) 472e481 479
Author's personal copy
is an average of three readings along with the error bars, whichreflects the maximum possible error asociated with the PAS 2000(i.e. 1 ng m�3). The online sampling of particulate bound PAH’s wasconducted for 5min for each observation under identical conditions.
The PAHs concentration is low at no load condition possibly dueto lower combustion temperatures that prevent extensive pyrolysisand cyclization resulting in lower PAH formation. It can be observedfrom Fig. 6 that the peak concentrations for PAHs are attained at60% load for 1800 rpm and at 20% load for 2400 rpm indicating thatat these engine load, high enough combustion temperatures areattained which favour formation of highest amount of PAHs. As theengine load increases further, the combustion takes place at evenhigher temperature resulting in reburning of cyclic and organicspecies and therefore relatively lesser amounts of OC getsproduced. Since, OC are important precursors for PAHs, this causesfurther reduction in overall production of PAHs in the engineexhaust. Another possibility for relatively lower PAHs at higherengine loads could be the migration of particle-bound PAHs to thegas phase, and lesser PAH condensation due to increasing overallcombustion temperatures and exhaust gas temperatures.
PAH results are shown in Fig. 6, which show almost similartrends for both diesel and B20 exhaust, with a slightly higher PAHemission from B20. The possible reason for this minor difference ispresence of 80% mineral diesel in the B20 blend. The minordifference observed is because of biodiesel component of B20. Thetrend in the figure indicates that this difference will definitely bemore pronounced, if the test fuel was 100% biodiesel.
3.5. Elemental, organic and total carbon in particulates
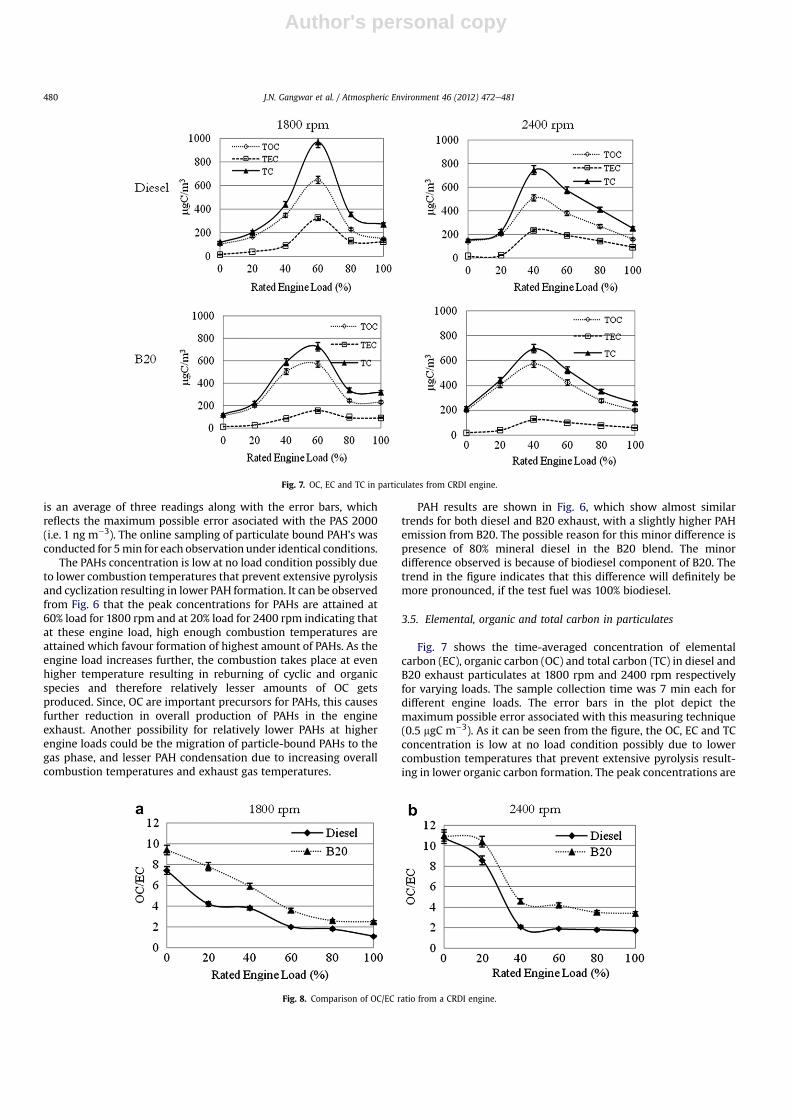
Fig. 7 shows the time-averaged concentration of elementalcarbon (EC), organic carbon (OC) and total carbon (TC) in diesel andB20 exhaust particulates at 1800 rpm and 2400 rpm respectivelyfor varying loads. The sample collection time was 7 min each fordifferent engine loads. The error bars in the plot depict themaximum possible error associated with this measuring technique(0.5 mgC m�3). As it can be seen from the figure, the OC, EC and TCconcentration is low at no load condition possibly due to lowercombustion temperatures that prevent extensive pyrolysis result-ing in lower organic carbon formation. The peak concentrations are
Fig. 7. OC, EC and TC in particulates from CRDI engine.
Fig. 8. Comparison of OC/EC ratio from a CRDI engine.
J.N. Gangwar et al. / Atmospheric Environment 46 (2012) 472e481480
Author's personal copy
visible at 60% load indicating that at this temperature, high enoughcombustion temperatures are attained, which favour formation ofhighest EC and OC. As the engine load increases further, thecombustion takes place at even higher temperature resulting inrelatively lesser amounts of OC being produced thus lower totalcarbon emission from the engine.
The only difference at 2400 rpm is that at higher engine speed,the peak shifts towards lower load i.e. at 40%. This means that athigher speeds, favourable temperatures for carbon formation areattained earlier, which favours formation of highest amount of ECand OC.
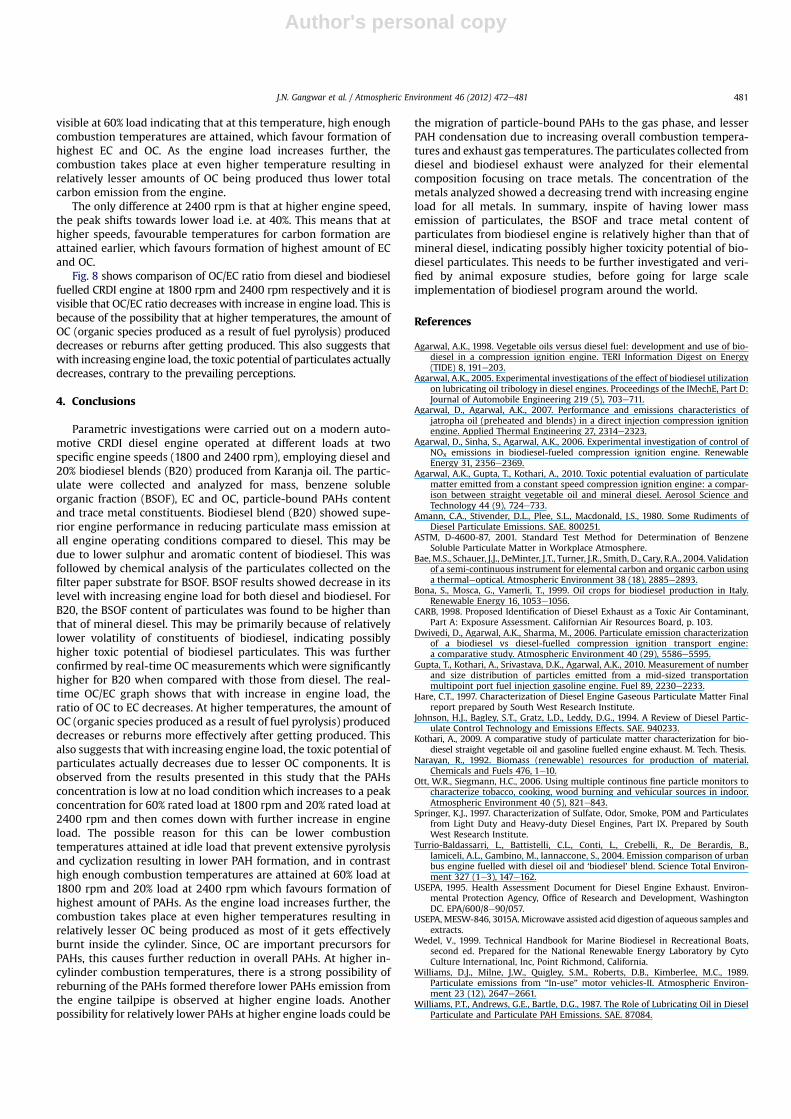
Fig. 8 shows comparison of OC/EC ratio from diesel and biodieselfuelled CRDI engine at 1800 rpm and 2400 rpm respectively and it isvisible that OC/EC ratio decreases with increase in engine load. This isbecause of the possibility that at higher temperatures, the amount ofOC (organic species produced as a result of fuel pyrolysis) produceddecreases or reburns after getting produced. This also suggests thatwith increasing engine load, the toxic potential of particulates actuallydecreases, contrary to the prevailing perceptions.
4. Conclusions
Parametric investigations were carried out on a modern auto-motive CRDI diesel engine operated at different loads at twospecific engine speeds (1800 and 2400 rpm), employing diesel and20% biodiesel blends (B20) produced from Karanja oil. The partic-ulate were collected and analyzed for mass, benzene solubleorganic fraction (BSOF), EC and OC, particle-bound PAHs contentand trace metal constituents. Biodiesel blend (B20) showed supe-rior engine performance in reducing particulate mass emission atall engine operating conditions compared to diesel. This may bedue to lower sulphur and aromatic content of biodiesel. This wasfollowed by chemical analysis of the particulates collected on thefilter paper substrate for BSOF. BSOF results showed decrease in itslevel with increasing engine load for both diesel and biodiesel. ForB20, the BSOF content of particulates was found to be higher thanthat of mineral diesel. This may be primarily because of relativelylower volatility of constituents of biodiesel, indicating possiblyhigher toxic potential of biodiesel particulates. This was furtherconfirmed by real-time OC measurements which were significantlyhigher for B20 when compared with those from diesel. The real-time OC/EC graph shows that with increase in engine load, theratio of OC to EC decreases. At higher temperatures, the amount ofOC (organic species produced as a result of fuel pyrolysis) produceddecreases or reburns more effectively after getting produced. Thisalso suggests that with increasing engine load, the toxic potential ofparticulates actually decreases due to lesser OC components. It isobserved from the results presented in this study that the PAHsconcentration is low at no load condition which increases to a peakconcentration for 60% rated load at 1800 rpm and 20% rated load at2400 rpm and then comes down with further increase in engineload. The possible reason for this can be lower combustiontemperatures attained at idle load that prevent extensive pyrolysisand cyclization resulting in lower PAH formation, and in contrasthigh enough combustion temperatures are attained at 60% load at1800 rpm and 20% load at 2400 rpm which favours formation ofhighest amount of PAHs. As the engine load increases further, thecombustion takes place at even higher temperatures resulting inrelatively lesser OC being produced as most of it gets effectivelyburnt inside the cylinder. Since, OC are important precursors forPAHs, this causes further reduction in overall PAHs. At higher in-cylinder combustion temperatures, there is a strong possibility ofreburning of the PAHs formed therefore lower PAHs emission fromthe engine tailpipe is observed at higher engine loads. Anotherpossibility for relatively lower PAHs at higher engine loads could be
the migration of particle-bound PAHs to the gas phase, and lesserPAH condensation due to increasing overall combustion tempera-tures and exhaust gas temperatures. The particulates collected fromdiesel and biodiesel exhaust were analyzed for their elementalcomposition focusing on trace metals. The concentration of themetals analyzed showed a decreasing trend with increasing engineload for all metals. In summary, inspite of having lower massemission of particulates, the BSOF and trace metal content ofparticulates from biodiesel engine is relatively higher than that ofmineral diesel, indicating possibly higher toxicity potential of bio-diesel particulates. This needs to be further investigated and veri-fied by animal exposure studies, before going for large scaleimplementation of biodiesel program around the world.
References
Agarwal, A.K., 1998. Vegetable oils versus diesel fuel: development and use of bio-diesel in a compression ignition engine. TERI Information Digest on Energy(TIDE) 8, 191e203.
Agarwal, A.K., 2005. Experimental investigations of the effect of biodiesel utilizationon lubricating oil tribology in diesel engines. Proceedings of the IMechE, Part D:Journal of Automobile Engineering 219 (5), 703e711.
Agarwal, D., Agarwal, A.K., 2007. Performance and emissions characteristics ofjatropha oil (preheated and blends) in a direct injection compression ignitionengine. Applied Thermal Engineering 27, 2314e2323.
Agarwal, D., Sinha, S., Agarwal, A.K., 2006. Experimental investigation of control ofNOx emissions in biodiesel-fueled compression ignition engine. RenewableEnergy 31, 2356e2369.
Agarwal, A.K., Gupta, T., Kothari, A., 2010. Toxic potential evaluation of particulatematter emitted from a constant speed compression ignition engine: a compar-ison between straight vegetable oil and mineral diesel. Aerosol Science andTechnology 44 (9), 724e733.
Amann, C.A., Stivender, D.L., Plee, S.L., Macdonald, J.S., 1980. Some Rudiments ofDiesel Particulate Emissions. SAE. 800251.
ASTM, D-4600-87, 2001. Standard Test Method for Determination of BenzeneSoluble Particulate Matter in Workplace Atmosphere.
Bae,M.S., Schauer, J.J., DeMinter, J.T., Turner, J.R., Smith, D., Cary, R.A., 2004. Validationof a semi-continuous instrument for elemental carbon and organic carbon usinga thermaleoptical. Atmospheric Environment 38 (18), 2885e2893.
Bona, S., Mosca, G., Vamerli, T., 1999. Oil crops for biodiesel production in Italy.Renewable Energy 16, 1053e1056.
CARB, 1998. Proposed Identification of Diesel Exhaust as a Toxic Air Contaminant,Part A: Exposure Assessment. Californian Air Resources Board, p. 103.
Dwivedi, D., Agarwal, A.K., Sharma, M., 2006. Particulate emission characterizationof a biodiesel vs diesel-fuelled compression ignition transport engine:a comparative study. Atmospheric Environment 40 (29), 5586e5595.
Gupta, T., Kothari, A., Srivastava, D.K., Agarwal, A.K., 2010. Measurement of numberand size distribution of particles emitted from a mid-sized transportationmultipoint port fuel injection gasoline engine. Fuel 89, 2230e2233.
Hare, C.T., 1997. Characterization of Diesel Engine Gaseous Particulate Matter Finalreport prepared by South West Research Institute.
Johnson, H.J., Bagley, S.T., Gratz, L.D., Leddy, D.G., 1994. A Review of Diesel Partic-ulate Control Technology and Emissions Effects. SAE. 940233.
Kothari, A., 2009. A comparative study of particulate matter characterization for bio-diesel straight vegetable oil and gasoline fuelled engine exhaust. M. Tech. Thesis.
Narayan, R., 1992. Biomass (renewable) resources for production of material.Chemicals and Fuels 476, 1e10.
Ott, W.R., Siegmann, H.C., 2006. Using multiple continous fine particle monitors tocharacterize tobacco, cooking, wood burning and vehicular sources in indoor.Atmospheric Environment 40 (5), 821e843.
Springer, K.J., 1997. Characterization of Sulfate, Odor, Smoke, POM and Particulatesfrom Light Duty and Heavy-duty Diesel Engines, Part IX. Prepared by SouthWest Research Institute.
Turrio-Baldassarri, L., Battistelli, C.L., Conti, L., Crebelli, R., De Berardis, B.,Iamiceli, A.L., Gambino, M., Iannaccone, S., 2004. Emission comparison of urbanbus engine fuelled with diesel oil and ‘biodiesel’ blend. Science Total Environ-ment 327 (1e3), 147e162.
USEPA, 1995. Health Assessment Document for Diesel Engine Exhaust. Environ-mental Protection Agency, Office of Research and Development, WashingtonDC. EPA/600/8e90/057.
USEPA, MESW-846, 3015A. Microwave assisted acid digestion of aqueous samples andextracts.
Wedel, V., 1999. Technical Handbook for Marine Biodiesel in Recreational Boats,second ed. Prepared for the National Renewable Energy Laboratory by CytoCulture International, Inc, Point Richmond, California.
Williams, D.J., Milne, J.W., Quigley, S.M., Roberts, D.B., Kimberlee, M.C., 1989.Particulate emissions from “In-use” motor vehicles-II. Atmospheric Environ-ment 23 (12), 2647e2661.
Williams, P.T., Andrews, G.E., Bartle, D.G., 1987. The Role of Lubricating Oil in DieselParticulate and Particulate PAH Emissions. SAE. 87084.
J.N. Gangwar et al. / Atmospheric Environment 46 (2012) 472e481 481