Particle emission from heavy-duty engine fuelled with blended diesel and biodiesel
14
Environ Monit Assess (2012) 184:2663–2676 DOI 10.1007/s10661-011-2142-3 Particle emission from heavy-duty engine fuelled with blended diesel and biodiesel Leila Droprinchinski Martins · Carlos Roberto da Silva Júnior · Maria Cristina Solci · Jurandir Pereira Pinto · Davi Zacarias Souza · Pérola Vasconcellos · Aline Lefol Nani Guarieiro · Lílian Lefol Nani Guarieiro · Eliane Teixeira Sousa · Jailson B. de Andrade Received: 10 August 2010 / Accepted: 25 May 2011 / Published online: 29 June 2011 © Springer Science+Business Media B.V. 2011 Abstract In this study, particulate matter (PM) were characterized from a place impacted by heavy-duty vehicles (Bus Station) fuelled with diesel/biodiesel fuel blend (B3) in the city of Londrina, Brazil. Sixteen priority polycyclic aro- matic hydrocarbons (PAH) concentrations were analyzed in the samples by their association with atmospheric PM, mass size distributions and ma- jor ions (fluorite, chloride, bromide, nitrate, phos- phate, sulfate, nitrite, oxalate; fumarate, formate, succinate and acetate; lithium, sodium, potas- sium, magnesium, calcium and ammonium). Re- sults indicate that major ions represented 21.2% particulate matter mass. Nitrate, sulfate, and L. D. Martins · C. R. da S. Júnior · M. C. Solci · J. P. Pinto Chemistry Department, Universidade Estadual de Londrina, 86051-990 Londrina, Brazil L. D. Martins (B ) Universidade Tecnológica Federal do Paraná, 86812-460, Apucarana, Brazil e-mail: [email protected] D. Z. Souza Instituto de Pesquisas Energéticas e Nucleares, São Paulo, Brazil P. Vasconcellos Instituto de Química, Universidade de São Paulo, São Paulo, Brazil e-mail: [email protected] ammonium, respectively, presented the highest concentration levels, indicating that biodiesel may also be a significant source for these ions, especially nitrate. Dibenzo[a,h]anthracene and indeno[1,2,3,-cd]pyrene were the main PAH found, and a higher fraction of PAH particles was found in diameters lower than 0.25 μm in Londrina bus station. The fine and ultrafine par- ticles were dominant among the PM evaluated, suggesting that biodiesel decreases the total PAH emission. However, it does also increase the frac- tion of fine and ultrafine particles when compared to diesel. A. L. N. Guarieiro · L. L. N. Guarieiro · E. T. Sousa · J. B. de Andrade Chemistry Institute, Universidade Federal da Bahia, 40170290, Salvador-BA, Brazil E. T. Sousa · J. B. de Andrade Centro Interdisciplinar de Energia e Ambiente—CIEnAm, Universidade Federal da Bahia, Canela, 40110-040, Salvador, BA, Brazil M. C. Solci · P. Vasconcellos · A. L. N. Guarieiro · L. L. N. Guarieiro · E. T. Sousa · J. B. de Andrade INCT de Energia e Ambiente, UFBA, 40170-290, Salvador, BA, Brazil L. L. N. Guarieiro SENAI-CIMATEC, 41650-010, Salvador, BA, Brazil
-
Upload
independent -
Category
Documents
-
view
9 -
download
0
Transcript of Particle emission from heavy-duty engine fuelled with blended diesel and biodiesel

Environ Monit Assess (2012) 184:2663–2676DOI 10.1007/s10661-011-2142-3
Particle emission from heavy-duty engine fuelledwith blended diesel and biodiesel
Leila Droprinchinski Martins · Carlos Roberto da Silva Júnior ·Maria Cristina Solci · Jurandir Pereira Pinto · Davi Zacarias Souza ·Pérola Vasconcellos · Aline Lefol Nani Guarieiro ·Lílian Lefol Nani Guarieiro · Eliane Teixeira Sousa · Jailson B. de Andrade
Received: 10 August 2010 / Accepted: 25 May 2011 / Published online: 29 June 2011© Springer Science+Business Media B.V. 2011
Abstract In this study, particulate matter (PM)were characterized from a place impacted byheavy-duty vehicles (Bus Station) fuelled withdiesel/biodiesel fuel blend (B3) in the city ofLondrina, Brazil. Sixteen priority polycyclic aro-matic hydrocarbons (PAH) concentrations wereanalyzed in the samples by their association withatmospheric PM, mass size distributions and ma-jor ions (fluorite, chloride, bromide, nitrate, phos-phate, sulfate, nitrite, oxalate; fumarate, formate,succinate and acetate; lithium, sodium, potas-sium, magnesium, calcium and ammonium). Re-sults indicate that major ions represented 21.2%particulate matter mass. Nitrate, sulfate, and
L. D. Martins · C. R. da S. Júnior · M. C. Solci ·J. P. PintoChemistry Department, Universidade Estadual deLondrina, 86051-990 Londrina, Brazil
L. D. Martins (B)Universidade Tecnológica Federal do Paraná,86812-460, Apucarana, Brazile-mail: [email protected]
D. Z. SouzaInstituto de Pesquisas Energéticas e Nucleares,São Paulo, Brazil
P. VasconcellosInstituto de Química, Universidade de São Paulo,São Paulo, Brazile-mail: [email protected]
ammonium, respectively, presented the highestconcentration levels, indicating that biodieselmay also be a significant source for theseions, especially nitrate. Dibenzo[a,h]anthraceneand indeno[1,2,3,-cd]pyrene were the main PAHfound, and a higher fraction of PAH particleswas found in diameters lower than 0.25 μm inLondrina bus station. The fine and ultrafine par-ticles were dominant among the PM evaluated,suggesting that biodiesel decreases the total PAHemission. However, it does also increase the frac-tion of fine and ultrafine particles when comparedto diesel.
A. L. N. Guarieiro · L. L. N. Guarieiro · E. T. Sousa ·J. B. de AndradeChemistry Institute, Universidade Federal da Bahia,40170290, Salvador-BA, Brazil
E. T. Sousa · J. B. de AndradeCentro Interdisciplinar de Energia eAmbiente—CIEnAm, Universidade Federal daBahia, Canela, 40110-040, Salvador, BA, Brazil
M. C. Solci · P. Vasconcellos ·A. L. N. Guarieiro · L. L. N. Guarieiro ·E. T. Sousa · J. B. de AndradeINCT de Energia e Ambiente, UFBA, 40170-290,Salvador, BA, Brazil
L. L. N. GuarieiroSENAI-CIMATEC, 41650-010, Salvador, BA, Brazil
2664 Environ Monit Assess (2012) 184:2663–2676
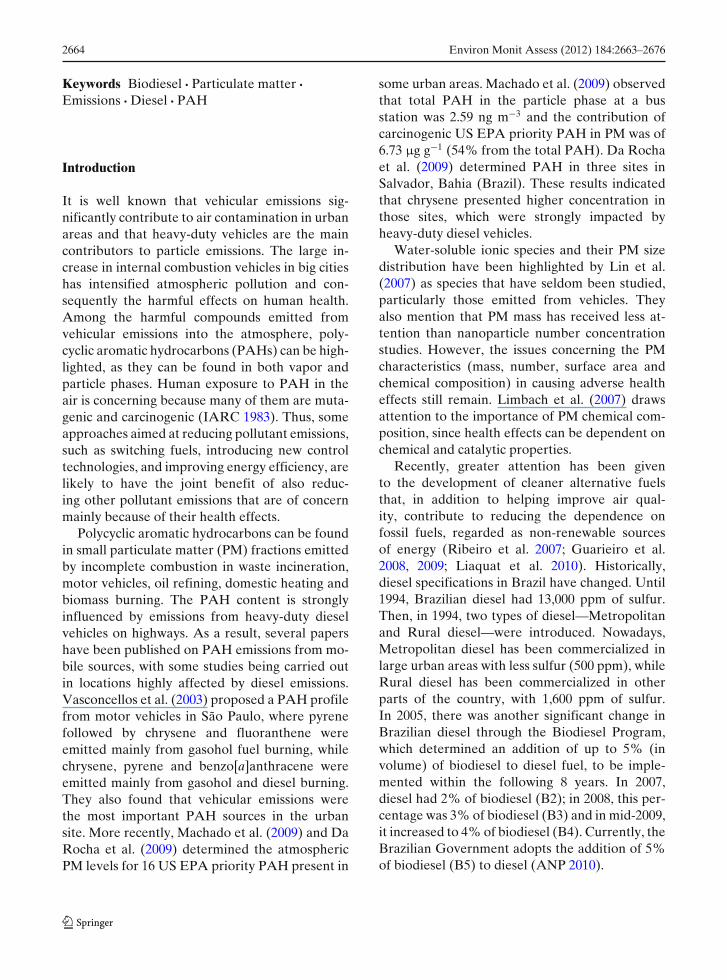
Keywords Biodiesel · Particulate matter ·Emissions · Diesel · PAH
Introduction
It is well known that vehicular emissions sig-nificantly contribute to air contamination in urbanareas and that heavy-duty vehicles are the maincontributors to particle emissions. The large in-crease in internal combustion vehicles in big citieshas intensified atmospheric pollution and con-sequently the harmful effects on human health.Among the harmful compounds emitted fromvehicular emissions into the atmosphere, poly-cyclic aromatic hydrocarbons (PAHs) can be high-lighted, as they can be found in both vapor andparticle phases. Human exposure to PAH in theair is concerning because many of them are muta-genic and carcinogenic (IARC 1983). Thus, someapproaches aimed at reducing pollutant emissions,such as switching fuels, introducing new controltechnologies, and improving energy efficiency, arelikely to have the joint benefit of also reduc-ing other pollutant emissions that are of concernmainly because of their health effects.
Polycyclic aromatic hydrocarbons can be foundin small particulate matter (PM) fractions emittedby incomplete combustion in waste incineration,motor vehicles, oil refining, domestic heating andbiomass burning. The PAH content is stronglyinfluenced by emissions from heavy-duty dieselvehicles on highways. As a result, several papershave been published on PAH emissions from mo-bile sources, with some studies being carried outin locations highly affected by diesel emissions.Vasconcellos et al. (2003) proposed a PAH profilefrom motor vehicles in São Paulo, where pyrenefollowed by chrysene and fluoranthene wereemitted mainly from gasohol fuel burning, whilechrysene, pyrene and benzo[a]anthracene wereemitted mainly from gasohol and diesel burning.They also found that vehicular emissions werethe most important PAH sources in the urbansite. More recently, Machado et al. (2009) and DaRocha et al. (2009) determined the atmosphericPM levels for 16 US EPA priority PAH present in
some urban areas. Machado et al. (2009) observedthat total PAH in the particle phase at a busstation was 2.59 ng m−3 and the contribution ofcarcinogenic US EPA priority PAH in PM was of6.73 μg g−1 (54% from the total PAH). Da Rochaet al. (2009) determined PAH in three sites inSalvador, Bahia (Brazil). These results indicatedthat chrysene presented higher concentration inthose sites, which were strongly impacted byheavy-duty diesel vehicles.
Water-soluble ionic species and their PM sizedistribution have been highlighted by Lin et al.(2007) as species that have seldom been studied,particularly those emitted from vehicles. Theyalso mention that PM mass has received less at-tention than nanoparticle number concentrationstudies. However, the issues concerning the PMcharacteristics (mass, number, surface area andchemical composition) in causing adverse healtheffects still remain. Limbach et al. (2007) drawsattention to the importance of PM chemical com-position, since health effects can be dependent onchemical and catalytic properties.
Recently, greater attention has been givento the development of cleaner alternative fuelsthat, in addition to helping improve air qual-ity, contribute to reducing the dependence onfossil fuels, regarded as non-renewable sourcesof energy (Ribeiro et al. 2007; Guarieiro et al.2008, 2009; Liaquat et al. 2010). Historically,diesel specifications in Brazil have changed. Until1994, Brazilian diesel had 13,000 ppm of sulfur.Then, in 1994, two types of diesel—Metropolitanand Rural diesel—were introduced. Nowadays,Metropolitan diesel has been commercialized inlarge urban areas with less sulfur (500 ppm), whileRural diesel has been commercialized in otherparts of the country, with 1,600 ppm of sulfur.In 2005, there was another significant change inBrazilian diesel through the Biodiesel Program,which determined an addition of up to 5% (involume) of biodiesel to diesel fuel, to be imple-mented within the following 8 years. In 2007,diesel had 2% of biodiesel (B2); in 2008, this per-centage was 3% of biodiesel (B3) and in mid-2009,it increased to 4% of biodiesel (B4). Currently, theBrazilian Government adopts the addition of 5%of biodiesel (B5) to diesel (ANP 2010).
Environ Monit Assess (2012) 184:2663–2676 2665
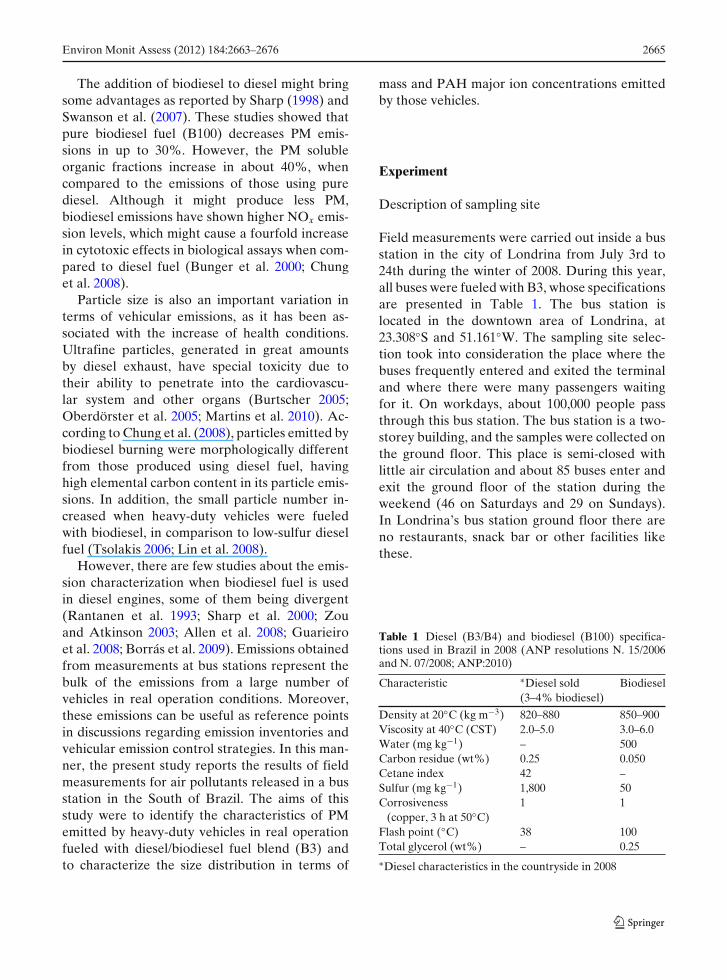
The addition of biodiesel to diesel might bringsome advantages as reported by Sharp (1998) andSwanson et al. (2007). These studies showed thatpure biodiesel fuel (B100) decreases PM emis-sions in up to 30%. However, the PM solubleorganic fractions increase in about 40%, whencompared to the emissions of those using purediesel. Although it might produce less PM,biodiesel emissions have shown higher NOx emis-sion levels, which might cause a fourfold increasein cytotoxic effects in biological assays when com-pared to diesel fuel (Bunger et al. 2000; Chunget al. 2008).
Particle size is also an important variation interms of vehicular emissions, as it has been as-sociated with the increase of health conditions.Ultrafine particles, generated in great amountsby diesel exhaust, have special toxicity due totheir ability to penetrate into the cardiovascu-lar system and other organs (Burtscher 2005;Oberdörster et al. 2005; Martins et al. 2010). Ac-cording to Chung et al. (2008), particles emitted bybiodiesel burning were morphologically differentfrom those produced using diesel fuel, havinghigh elemental carbon content in its particle emis-sions. In addition, the small particle number in-creased when heavy-duty vehicles were fueledwith biodiesel, in comparison to low-sulfur dieselfuel (Tsolakis 2006; Lin et al. 2008).
However, there are few studies about the emis-sion characterization when biodiesel fuel is usedin diesel engines, some of them being divergent(Rantanen et al. 1993; Sharp et al. 2000; Zouand Atkinson 2003; Allen et al. 2008; Guarieiroet al. 2008; Borrás et al. 2009). Emissions obtainedfrom measurements at bus stations represent thebulk of the emissions from a large number ofvehicles in real operation conditions. Moreover,these emissions can be useful as reference pointsin discussions regarding emission inventories andvehicular emission control strategies. In this man-ner, the present study reports the results of fieldmeasurements for air pollutants released in a busstation in the South of Brazil. The aims of thisstudy were to identify the characteristics of PMemitted by heavy-duty vehicles in real operationfueled with diesel/biodiesel fuel blend (B3) andto characterize the size distribution in terms of
mass and PAH major ion concentrations emittedby those vehicles.
Experiment
Description of sampling site
Field measurements were carried out inside a busstation in the city of Londrina from July 3rd to24th during the winter of 2008. During this year,all buses were fueled with B3, whose specificationsare presented in Table 1. The bus station islocated in the downtown area of Londrina, at23.308◦S and 51.161◦W. The sampling site selec-tion took into consideration the place where thebuses frequently entered and exited the terminaland where there were many passengers waitingfor it. On workdays, about 100,000 people passthrough this bus station. The bus station is a two-storey building, and the samples were collected onthe ground floor. This place is semi-closed withlittle air circulation and about 85 buses enter andexit the ground floor of the station during theweekend (46 on Saturdays and 29 on Sundays).In Londrina’s bus station ground floor there areno restaurants, snack bar or other facilities likethese.
Table 1 Diesel (B3/B4) and biodiesel (B100) specifica-tions used in Brazil in 2008 (ANP resolutions N. 15/2006and N. 07/2008; ANP:2010)
Characteristic ∗Diesel sold Biodiesel(3–4% biodiesel)
Density at 20◦C (kg m−3) 820–880 850–900Viscosity at 40◦C (CST) 2.0–5.0 3.0–6.0Water (mg kg−1) – 500Carbon residue (wt%) 0.25 0.050Cetane index 42 –Sulfur (mg kg−1) 1,800 50Corrosiveness 1 1
(copper, 3 h at 50◦C)Flash point (◦C) 38 100Total glycerol (wt%) – 0.25∗Diesel characteristics in the countryside in 2008

2666 Environ Monit Assess (2012) 184:2663–2676
Sampling procedure
Air samples were collected for the analysis ofPM10 mass concentration, major ions concentra-tion, PAH concentration in PM size distribution,and PM size distribution from 0.01 μm to 18.0 μm.Thus, different pieces of equipment were usedto collect PM from the air as well as to per-form the methodological analysis. A PM10 low-vol(PM10-LV) impactor (built at ZUF—FrankfurtUniversity), a high volume (PM10-HV) air sam-pler (Hi-vol, Energética, Brazil) model, a SioutasCascate Impactor (SKC) and NanoMoudi equip-ment (NanoMoudi™ II, model 125A, MSP Cor-poration, MN, USA) were used to obtain PM10,major ions concentration, PAH concentrations inthe PM size distributions, and PM size distribu-tion, respectively.
Samples of PM10 were collected using PM10-LV system by drawing air using 47-mm Teflonfilters with a 2-μm pore size at a 20 L min−1 rate,used to investigate daily PM10 mass emission. Inaddition, PM10 samples were also collected usinga PM10-HV air sampler at a 1.3 m3 min−1 rate toobtain major ions concentration. For this collec-tion, quartz fiber filters (20 × 25 cm2) were used,pre-cleaned with deionized water, and dried at800◦C for 8 h. After each sampling, the filters werewrapped in aluminum foil envelopes and kept ina refrigerator inside sealed plastic bags until beingweighed and analyzed. Both PM10 systems workedin 24-h intervals.
The Sioutas impactor operated at 9.0 L min−1
rate and separated PM in five different stages. Sizeintervals were as follows: <0.25 μm (after-filter);from 0.25 to 0.50 μm; from 0.50 to 1.00 μm; from1.00 to 2.50 μm, and from 2.50 to 10.0 μm (Sioutaset al. 2002). Teflon filters with a 0.5 μm pore sizeand a 25-mm diameter (SKC) were used from the0.25 μm stage to the inlet, and a 2-μm pore sizeTeflon-backed filter with a 37-mm diameter wasused at the after-filter stage (Sioutas et al. 2003).Five substrate sets were used to perform PAHconcentration sampling in PM size distributions.All samplings were conducted over 24-h periods,and the sampling temperature varied from 18◦C to26◦C, with humidity ranging from 11% to 40%.
In the PAH study, sampling is a critical stepdue to possible losses for both volatilization and
chemical reactions (Miguel et al. 1986). Possibleartifacts in sampling procedures might occur withPAH in particulate and gas phase. In the partic-ulate phase, a negative artifact (underestimation)is a result of PAH volatilization from filters andoxidation processes (Goriaux et al. 2006; Ravindraet al. 2008). Thus, in order not to have problemsduring the PAH analysis, these compounds wereanalyzed only in Sioutas filters, which were im-mediately extracted (Sioutas et al. 2003). Somestudies have used sampling methodology similarto the ones used in this paper (e.g., Wingfors et al.2001; Allen et al. 2008; Dallarosa et al. 2008).
Finally, in order to investigate PM size distribu-tion emitted by engines in real operation fueledwith B3 fuel, NanoMoudi equipment was used.This is a single-nozzle impactor with rotating im-pactor plates providing nearly uniform depositsover circular impaction areas. It operated at a10.0 L min−1 rate and separated PM in 14 differentstages, with the following equivalent cutoff diam-eters (dp, at 50% efficiency): <10.0 nm (after-filter); 14.0 nm; 25.0 nm; 44.0 nm; 78.0 nm; 140 nm;250 nm; 440 nm; 780 nm; 1.40 μm; 2.50 μm;4.40 μm; 7.80 μm and 14.0 μm. Teflon filters(SKC) with a 47-mm diameter and 1-μm pore sizewere used from the 0.01 μm stage to the inlet. TheNanoMoudi operated in 7-day intervals (168 h)in the period between July 3rd and 24th of 2008,corresponding to three cycles.
Analysis procedure
Gravimetric analysis was performed by weighingthe filters before and after sampling. In order tocontrol humidity, filters were conditioned for 24 h.The PM mass was obtained using an analyticalMicrobalance Metter (Metter Toledo AX26) with1 μg sensitivity (IO-3 1999 Method).
For the extraction of ionic compounds, both thesample and the blank quartz filters (47 mm di-ameter) were extracted using a shaker for 90 minwith 20 ml deionized water (18 M�) (Wang et al.2007). After passing through Millipore MillexGV (PVDF 0.22 μm pore size; 33 mm diameter)microporous membranes, ionic concentrations inaqueous extracts were determined by ion chroma-tography (Metrohm AG, Herisau, Switzerland)with chemical suppression (50 mM H2SO4) and
Environ Monit Assess (2012) 184:2663–2676 2667
conductivity detector. For anion detection (SO2−4 ,
Cl−, NO−2 , NO−
3 , F−, PO3−4 including C2O2−
4 ), sam-ples were injected via a 20-μL loop through aMetrosep A Supp 5 250/4.0 mm analytical col-umn. The mixture of 1.0 mM NaHCO3 and3.2 mM Na2CO3 was used as eluent. The suppres-sor system was regenerated by a 50 mM H2SO4
solution pumped through the suppressor unitsimultaneously with deionized water.
Organic acid determination was performed byinjecting the samples via a 20 μL loop using aMetrosep Organic acids 250/7.8 mm analytical col-umn. The system was run in isocratic mode witha solution of perchloric acid (0.5 mM) as eluentand the chemical suppressor system was regener-ated by a 10.0 mM LiCl solution pumped throughthe suppressor unit simultaneously with deionizedwater.
Metrosep C2-150 150/4.0 mm analytical columnwas used for cation detection (K+, NH+
4 , Ca2+,Mg2+ and Na+) and a solution of 2.7 mM oxalicacid was used as eluent. The system ran in isocraticmode.
The recoveries ranged from 109% to 118% forinorganic anions, from 80% to 101% for cationsand from 87% to 107% for carboxylic acids. Thedetection limits (S/N = 4) ranged between 3–45 ngm−3 (inorganic anions), 4–24 ng m−3 (cations)and 13–35 ng m−3 (organic acids). Blank val-ues were subtracted from sample determinations(Vasconcellos et al. 2010).
The analysis of PAH was carried out for everycollected sample and blank filters from the Sioutasequipment, which were extracted with 100-μLacetonitrile and shaken for 30 min. The extractswere then centrifuged for 10 min and kept at4◦C until analysis. The PAH concentrations weredetermined by HPLC-UV-FLU (Perkin Elmer,model 200) with a Fluorescence selective detector.The chromatography column used was a LC-PAH(2.1 cm × 250 mm × 5 μm) Supelcosil. For theanalysis, a gradient system was used with mixtureA, containing 35% acetonitrile and 65% ultra-pure water, and solvent B (100% acetonitrile).The program performed by the system consistedin ramps with mobile phase variation during re-tention time. For the first 20 min, a ramp from90% to 0% mixture A and from 10% to 100%of B was used as the mobile phase; from minutes
20 to 32.5, 0% mixture A and 100% B was used;from minutes 32.5 to 35.5, a ramp from 0% to 93%mixture A and 100% to 7% B was used. A flowrate of 0.5 mL min−1 and 20 mL aliquots wereused for PAH analysis. The fluorescence selectivedetector worked with variable excitation (from220 to 289 nm) and emission (from 330 to 480 nm)wavelengths during analysis time (Miguel and DeAndrade 1989).
A standard certificate (Supelco, Bellefonte,PA, USA) of sixteen PAH was used to quantifythe samples from the Sioutas equipment. Thisstandard contains naphthalene (NAP), acen-aphthylene (ACY), acenaphthene (ACE), fluo-rene (FLU), phenanthrene (PHE), anthracene(ANT), fluoranthene (FLT), pyrene (PYR),benzo[a]anthracene (BaA), chrysene (CRY),benzo[b ]fluoranthene (BbF), benzo[k]fluoranthene (BkF), dibenzo[a,h]anthracene(DBA), benzo[a]pyrene (BaP), indeno[1,2,3,-cd]pyrene (IND) and benzo[ghi]perylene (BgP).Blank values were subtracted from sampledeterminations, and the recovery efficiency ofPAH species was performed in triplicate, usingthe standard certificate solution. Only nine PAHswere found in the samples and their recoveryranged from 80% to 90%. Detection limits rangedfrom 0.4 to 5.0 μg L−1 and quantification limitsranged from 1.2 to 15.0 μg L−1 for samplesanalyzed using HPLC-UV-FLU. Relativestandard deviations for the nine PAH foundin the samples were between 1.3% and 4.7%.
Results and discussion
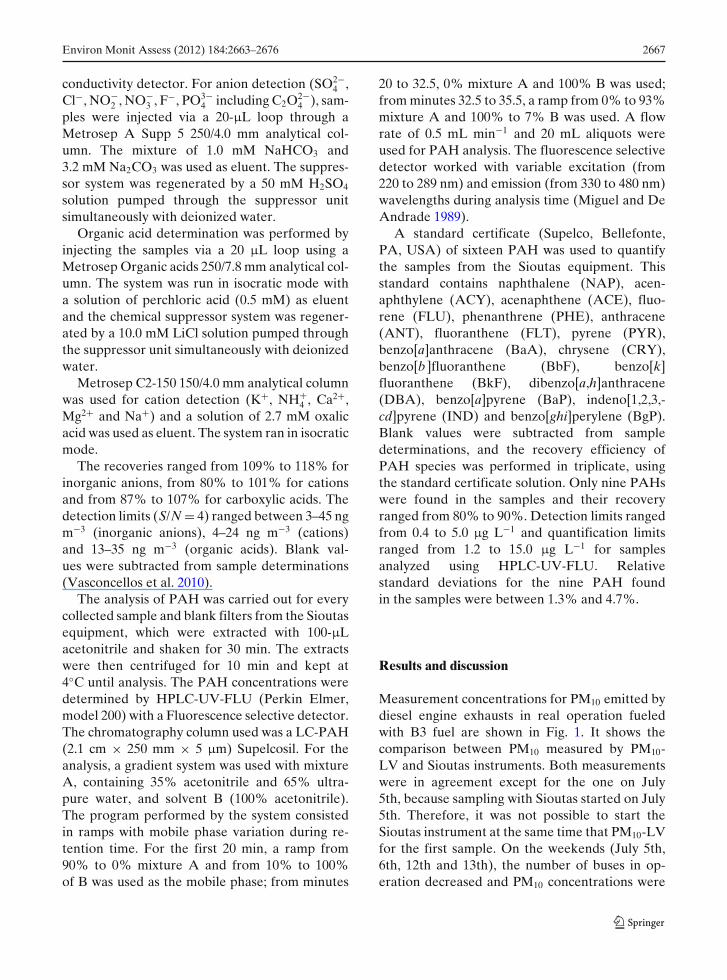
Measurement concentrations for PM10 emitted bydiesel engine exhausts in real operation fueledwith B3 fuel are shown in Fig. 1. It shows thecomparison between PM10 measured by PM10-LV and Sioutas instruments. Both measurementswere in agreement except for the one on July5th, because sampling with Sioutas started on July5th. Therefore, it was not possible to start theSioutas instrument at the same time that PM10-LVfor the first sample. On the weekends (July 5th,6th, 12th and 13th), the number of buses in op-eration decreased and PM10 concentrations were
2668 Environ Monit Assess (2012) 184:2663–2676
Fig. 1 Comparison ofPM10 mass concentrationmeasured throughPM10-LV and Sioutasinstruments at the busstation in Londrinain 2008
consequently lower than those observed on week-days. As the bus station is a semi-closed place,PM from this location might have some effectssuch as particle accumulation inside of the station,resulting in higher concentrations in the middleof the week; the contribution of meteorologicalconditions, mainly humidity and wind, which mayresult in the increase of particle concentrationdue to their resuspension; influence of other localsources like smoking and particles being broughtin from outside of the bus station.
PM10 concentration found in this study waslower (38.8–92.2 μg m−3) than the Brazilian airquality standard of 150 μg m−3 for 24 hours.However, when mass size distributions were an-alyzed (Fig. 2), a large fraction of fine particles inmass could be observed. The PM mean concen-trations on five Sioutas size ranges are shown inFig. 3. Seventy-six percent of PM10 particles emit-ted were below 2.5 μm (PM2.5), in agreement withthe works from Freitas and Solci (2009), whichwere of 70%; and 30% of this PM2.5 were below0.25 μm, with a large fraction of soot, accordingto data provided by Sioutas equipment. This dataagrees with measurements performed in a tunnelin the city of São Paulo (Sánchez-Ccoyllo et al.
2009). Furthermore, in Brazil the PM10 air qual-ity standards are much higher than those recom-mended by the World Health Organization andthere is no standard established for fine particles(PM2.5).
The PM size distribution from 0.01 μm to18.0 μm was also investigated using NanoMoudisystem. Figure 4 shows PM size distribution ofmass concentration averages emitted by enginesin real operation using B3 fuel. Two modes couldbe clearly identified in Fig. 4: an accumulationmode (D50 = 0.25 μm), and a coarse mode (D50 =14.0 μm). A less pronounced mode could be iden-tified in sizes smaller than 10 nm. The sum of PMconcentrations from all size intervals obtained inevery sampling cycle were 53.5 μg m−3 in the firstcycle (from July 3rd to 9th); 34.1 μg m−3 in thesecond cycle (from July 10th to 16th) and 44.1 μgm−3 in the third cycle (from July 17th to 23rd).
The total average concentrations of water-soluble ions found in the samples at Londrinabus station were over 11 μg m−3. In Fig. 5 andTable 2, it can be observed that the most abundantspecies were nitrate (8 μg m−3), sulfate (1.4 μgm−3) and ammonium (0.3 μg m−3). These re-sults are in agreement with studies performed in

Environ Monit Assess (2012) 184:2663–2676 2669
Fig. 2 Particulate matterconcentration at five sizeinterval ranges sampledwith Sioutas equipment atthe bus station inLondrina in 2008
urban sites, except for the contaminant levels (Linet al. 2007; Kai et al. 2007; Vasconcellos et al.2007). Notably, nitrate and sulfate presented thehighest concentrations on weekdays (July 3rd, 7th
and 14th for nitrate, and July 10th and 16th forsulfate). This fact can be associated with dieselengine emissions, which emit significant amountsof nitrogen compounds. Also, the nitrate emissionfactors are 2.7 times higher than sulfate, as re-ported by Kerminen et al. (1997). On weekendsthe flow of buses at the station decreases whencompared to the flow during weekdays, as previ-ously mentioned.
The presence of sulfate and nitrate is usuallyattributed to anthropogenic activities such as ve-hicle and industry emissions. Zhang et al. (2009)found that sulfate and nitrate had higher emissionrates for B20 (20% biodiesel and 80% diesel)than those for pure diesel. However, differentresults were observed by Wall et al. (1987), whichreported that lowering fuel sulfur content couldreduce emissions for both sulfur dioxide and par-ticulate sulfate. Thus, sulfate levels and mainlynitrate concentrations from PM found in this workcould be attributed to the presence of biodieselto diesel fuel (B3), which can emit higher NOx
concentrations when compared to diesel emission(Chung et al. 2008; Cheung et al. 2009).
Ammonia is found in animal and humanwaste, and is also emitted during combustionprocesses, fertilizer production and sugarcane
Fig. 3 Mean particulate matter (PM) concentration ineach size range (external circle) and percentage of PAHmass obtained from air samples collected using Sioutasequipment at the bus station in Londrina in 2008

2670 Environ Monit Assess (2012) 184:2663–2676
Fig. 4 Mean size distribution of mass concentration sam-pled with NanoMoudi equipment at the bus station inLondrina in 2008
burning (Allen et al. 2008; Vasconcellos et al.2007; Viana et al. 2008). Other ammonia sourcesinclude industrial and vehicular emissions, as wellas in a wide range of transportation. Differently,potassium average concentration (0.33 μg m−3)
is widely found in biomass burning plumesaround the world and can, eventually, be trans-
ported. Magnesium (0.08 μg m−3) and calcium(0.38 μg m−3) have both been attributed to soilresuspension.
Among acids studied in this present work, ox-alic (0.13 μg m−3), formic (0.04 μg m−3) andsuccinic (0.04 μg m−3) acids were the mostabundant in the PM from Londrina bus station.Oxalic acid contributed to 52% of the acids stud-ied. Kawamura and Kaplan (1987) have suggestedthat primary vehicular emission is responsiblefor the dicarboxylic acids in urban atmosphere.The major ions concentrations found in this workrepresented 21.2% PM mass in the filters (seeTable 2; fluorite, nitrite, bromide and lithium werebelow detection limit), representing the particlecharacteristics emitted mainly by biodiesel (B3)engines in real operation.
Sixteen PAH compounds were analyzed in fivePM size ranges, which are included in the list ofpriority in US EPA due to their characteristics.PAH compounds with low molecular weight werenot detected in the PM samples collected, becausethey are mostly found in gaseous phase. In thissense, PAH with two rings exist solely in the gasphase, those with two to three rings are presentin both gas and particle phases, and PAH withfive or more rings are predominantly adsorbedin PM (Corrêa and Arbilla 2006). According to
Fig. 5 The mostabundant ionconcentrations foundat the bus station inLondrina in 2008
Environ Monit Assess (2012) 184:2663–2676 2671
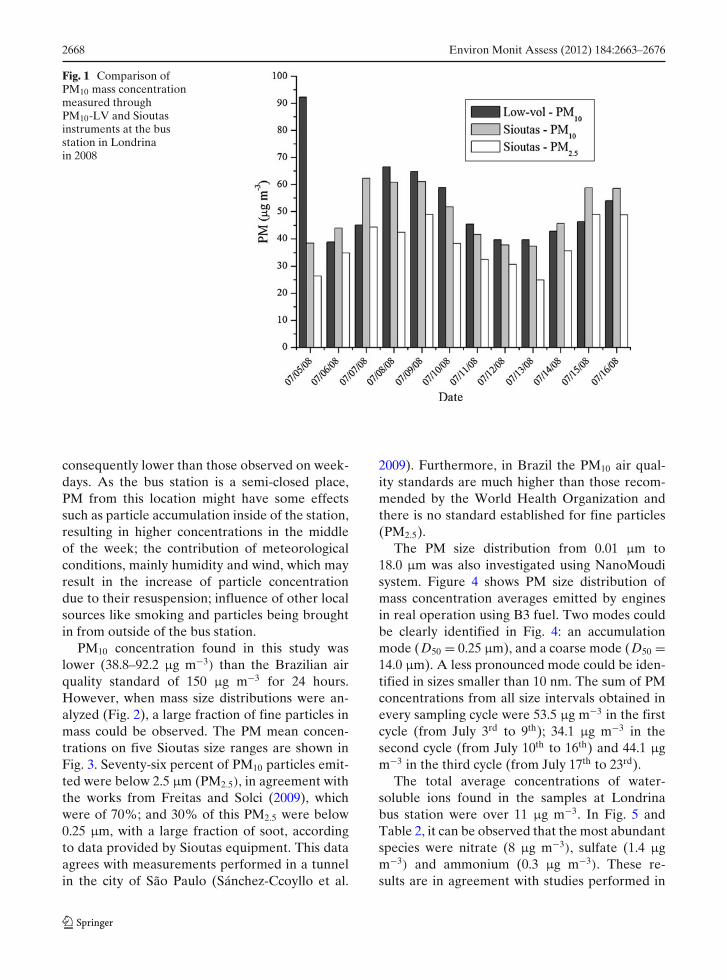
Table 2 Mean PAH concentration in five size intervals and mean ion concentrations collected at the bus station in Londrinafrom July 05 to July 16, 2008
PAH ng m−3 (n = 12)
10 > D50 > 2.5 > D50 > 1.0 > D50 > 0.5 > D50 > >0.25 μm Total2.5 μm 1.0 μm 0.5 μm 0.25 μm
Mean SD Mean SD Mean SD Mean SD Mean SD Mean SD
PYR <DL 0.17 0.09 0.16 <DL 0.20 0.06 0.24 0.13BaA 0.02 0.01 0.08 0.08 0.06 0.09 0.05 0.05 0.09 0.07 0.20 0.14CRY 0.03 0.02 0.06 0.06 0.06 0.08 0.06 0.04 0.10 0.09 0.25 0.13BbF 0.04 0.03 0.07 0.06 0.04 0.05 0.10 0.07 0.05 0.07 0.22 0.13BkF 0.02 0.01 0.03 0.02 0.02 0.03 0.04 0.02 0.03 0.03 0.08 0.04DBA 0.04 0.01 0.17 0.21 0.19 0.20 0.09 0.06 0.53 0.02 0.43 0.21BaP 0.03 0.02 0.04 0.04 0.03 0.04 0.06 0.05 0.05 0.05 0.11 0.06IND 0.03 0.01 0.09 0.12 0.13 0.11 0.10 0.09 0.28 0.16 0.34 0.15BgP 0.02 <0.01 0.03 0.01 0.09 0.06 0.04 0.02 0.09 0.03 0.10 0.04Mean ions concentrations (μg m−3), n = 10Chlorite Nitrate Phosphate Sulfate Formate Succinate Fumarate0.08 8.02 0.04 1.35 0.04 0.04 0.01Acetate Oxalate Sodium Ammonium Potassium Magnesium Calcium0.03 0.13 0.15 0.34 0.33 0.08 0.38
DL detection limit; SD standard deviation
ATSDR/US EPA, ACE and ACY are present ingas phase while FLT, ANT, PHE, PYR are in bothparticle and gas phase (Ravindra et al. 2008).
PAH concentrations collected with Sioutas areshown in Table 2. The major PAH findings wereDBA and IND with mean total concentrations of0.43 ± 0.21 and 0.34 ± 0.15 ng m−3, respectively.The total PAH mean concentrations were 2.21 ±
1.22 ng m−3 and the sum of all daily PAH concen-trations varied between 0.08 and 3.10 ng m−3, withmean value of 1.69 ± 0.93 ng m−3.
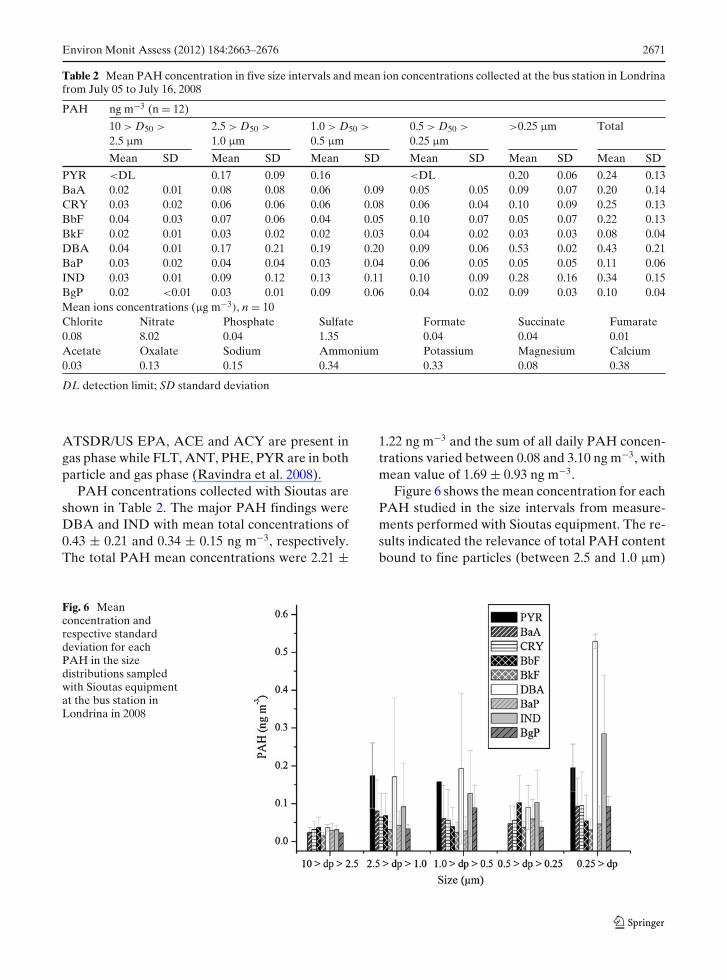
Figure 6 shows the mean concentration for eachPAH studied in the size intervals from measure-ments performed with Sioutas equipment. The re-sults indicated the relevance of total PAH contentbound to fine particles (between 2.5 and 1.0 μm)
Fig. 6 Meanconcentration andrespective standarddeviation for eachPAH in the sizedistributions sampledwith Sioutas equipmentat the bus station inLondrina in 2008

2672 Environ Monit Assess (2012) 184:2663–2676
and particles lower than 0.25 μm, which resultedin a contribution of 53.7% in PM mass from allPAH studied during the sampling period. Thecontribution of PAH in mass percentage for eachsize interval is shown in the internal circle in Fig. 3.The PAH concentrations were higher for diam-eters lower than 0.25 μm and the PAH showingthe highest concentration in this size distributionwas DBA (0.53 ± 0.02 ng m−3). This result wasin agreement with others studies performed withlaboratory engine, which suggests that the use ofbiodiesel can increase fine particle emissions whencompared to diesel fuel (Krahl et al. 2001).
It is important to mention that both fine and ul-trafine particles (<100 nm) have been consideredrelevant factors contributing to a series of healthproblems, including premature deaths, aggravatedasthma, chronic bronchitis, and a number of socialconsequences (Sioutas et al. 2005; Ostiguy et al.2006; Asgharian and Price 2007). Recent studiessuggest that the population has been exposed tohealth risks in levels well below those allowed bythe current air quality standard (USEPA 2007;
Baldauf et al. 2009). Martins et al. (2010) investi-gated the relationships among air quality, aerosolsize distribution, meteorological conditions usingdata from aerosol number size distribution (9.82–414 nm) and numerical modeling in the highlypolluted megacity of São Paulo. They suggestedthat the period characterized as clean, based onPM10 measurements, could not be considered aperiod presenting low health impacts, when usingultrafine particle concentration as a criterion.
Schnelle-Kreis et al. (2001) investigated par-ticle size fractions for PAH distributions in PMnext to a road. About 40% of PAH were foundin the particle fraction with 0.06–0.13 μm diam-eters. Some research found that in regions nearvehicular sources, the PAH can be associated withparticles whose size is less than 180 nm. Therefore,the size intervals of both nucleation and accumu-lation modes could be found far from the source(Eiguren-Fernandez et al. 2004; Miguel et al.2005). Since particles with diameters <0.1 μmcoagulate relatively fast, with life-times <1 h (Puiand Chen 1997), differences in particle size dis-
Table 3 Mean PAH concentration from different studies in urban locations
PAH This work At same sitea Brazilb South Americac Europed Asiae
(ng m−3) (ng m−3) (ng m−3) (ng m−3) (ng m−3) (ng m−3)
NAP – 97.7 0.29 – – 7.40ACY – 83.9 0.07 – – –ACE – 61.4 0.11 – – –FLU – 140.2 0.13 – – 1.40PHE – 348 0.80 – 0.32 7.90ANT – 31.1 0.19 0.04 0.05 1.30FLT – 37.9 0.73 0.16 0.47 20.70PYR 0.24 39.8 1.32 0.24 0.83 26.50BaA 0.20 1.4 1.00 0.23 0.52 5.20CRY 0.25 3.8 2.63 0.29 0.61 6.00BbF 0.22 – 1.30 0.07 0.35 1.20BkF 0.08 – 0.49 – 0.13 0.34DBA 0.43 – 0.36 0.04 0.23 0.30BaP 0.11 – 1.05 0.06 0.13 1.30IND 0.34 – 0.73 0.04 <0.3 0.15BgP 0.10 – 1.06 0.07 0.97 –�PAH 1.97 – 12.26 1.24 4.61 79.69aMeasurements at bus station performed in 2002 (100% diesel) in vapor phase (Tavares et al. 2004)bMeasurements in 2005 at a bus station in Salvador, Bahia, Brazil, in particle phase (Da Rocha et al. 2009)cMeasurements in-tunnel in particle phase, average at Maria Maluf tunnel (Vasconcellos et al. 2003)dMeasurements in-tunnel at the entrance of a tunnel and in PM10 (Wingfors et al. 2001)eMeasurements in-tunnel on summer weekday in particle phase (Ho et al. 2009)
Environ Monit Assess (2012) 184:2663–2676 2673
tributions versus the distance of the sampling sitefrom major sources are expected.
In 2004, PAH measurements in particle phasewere performed at the same bus station where thisresearch took place. The methodology, operationconditions, age of fleet and the fuel used weredifferent from those used in this work. There-fore, the concentrations found before were muchhigher than the ones presented in this paper(Ferraz et al. 2006). In addition, Tavares et al.(2004) in 2002 (see Table 3), performed PAHmeasurements at the same bus station, when thediesel being burned did not contain biodiesel,and also found higher PAH concentrations thanthose shown in this paper. Although PAH con-centrations obtained by Tavares et al. (2004) wereanalyzed in vapor phase, these results indicatedthat biodiesel can decrease PAH emission. Turrio-Baldassarri et al. (2004) also found that biodieselblend seems to result in small reductions of PAHemissions.
Table 3 shows mean PAH concentrations fromdifferent places collected and analyzed usingdifferent techniques. A large range of PAH con-centrations were observed, which can be at-tributed to different sampling characteristics foreach site, such as addition of biodiesel to diesel;engine operation conditions; presence of othersources near the sampling site when measure-ments were performed in real situation (in-tunnel,bus station or others); analysis methodology, en-gine power and fleet age (Lim et al. 2005).Karavalakis et al. (2010), for example, found thatthe addition of biodiesel to diesel can increasePAH emission of low molecular weight (phenan-threne and anthracene) and both increases andreductions in emission for large PAH.
Compared to Lapa bus station in the city ofSalvador (Bahia, Brazil; Da Rocha et al. 2009),those PAH concentrations are much higher thanthe ones found in this research. The Lapa busstation is strongly impacted by heavy-duty dieselvehicles and its PAH concentrations are shown inTable 2.
The major PAHs in that station were CRY(2.63 ng m−3), PYR (1.32 ng m−3), BbF (1.30 ngm−3), and BgP (1.06 ng m−3), while the PAHs thatwere mainly found in the present study were DBA(0.43 ng m−3), IND (0.34 ng m−3), CRY (0.25 ng
m−3), and PYR (0.24 ng m−3). These differences(in concentration and major species) can be dueto both the use of different fuels (pure diesel atLapa station and B3 at Londrina bus station) andthe flow of buses in each station.
Conclusions
In this study, PAH associated with small parti-cles were determined using an impactor systemto investigate these compound emissions fromheavy-duty vehicles in real operation running ondiesel/biodiesel fuel blend (B3). Particulate sizedistributions and major ions were also evaluatedfrom B3 fuel combustion. Among major ions, ni-trate and sulfate were the highest, representing21.2% of PM mass. Nine PAH were determinedand quantified at the bus station with pronouncedDBA concentration in smaller sizes. In general,from all PAH found in the air samples at Londrinabus station, particles with diameter lower than0.25 μm were the most abundant. Additionally,particulate mass size distribution presented thesemodes: coarse, accumulation and ultrafine modes,the latter being less significant in terms of totalmass. Thus, this study verified that both fine andultrafine particles were dominant among the eval-uated PM, and these particles can contain somechemical species with mutagenic characteristics,such as PAH. Finally, the results suggest thatbiodiesel decreases the total PAH emission. How-ever, it increased the fraction of fine and ultrafineparticles when compared to diesel fuel. It has alsoshown evidence that levels of particulate sulfateand mainly nitrate found in this study may alsobe attributed to the emission from diesel/biodieselfuel blend (B3).
It is well known that particles can cause humanhealth problems, although further studies con-cerning the health effects of biodiesel exhausts arestill needed. Hence, this work is expected to helpestablish legislation about this issue in Brazil.
Acknowledgements This study received financial sup-port in the form of a grant from the National Instituteof Science and Technology for Energy and Environment(INCT-EA; notification 15/2008). The authors would alsolike to thank the National Council of Technological andScientific Development (Conselho Nacional de Desen-

2674 Environ Monit Assess (2012) 184:2663–2676
volvimento Científico e Tecnológico—CNPq), Coorde-nação de Aperfeiçoamento de Pessoal de Nível Superior(CAPES) and Araucária Foundation.
References
Allen, A. G., Da Rocha, G. O., Cardoso, A. A.,Paterlini, W. C., de Machado, C. M. D., & Andrade,J. B. (2008). Atmospheric particulate polycyclic aro-matic hydrocarbons from road transport in southeastBrazil. Transportation Research Part D, 13, 483–490.
ANP (2010). Agência Nacional de Petróleo, Gás Natural eBiocombustíveis, ANP, 2010. Access www.anp.gov.br.
Asgharian, B., & Price, O. T. (2007). Deposition of ul-trafine (nano) particles in the human lung. InhalationToxicology, 19, 1045–1052.
Baldauf, R., Watkins, N., Heist, D., Bailey, C., Rowley, P.,& Shores, R. (2009). Near-road air quality monitoring:Factors affecting network design and interpretation ofdata. Air Quality, Atmosphere & Health, 2, 1–9.
Borrás, E., Tortajada-Genaro, L. A., Vásquez, M., &Zielinska, B. (2009). Polycyclic aromatic hydrocarbonexhaust emissions from different reformulated dieselfuels and engine operating conditions. AtmosphericEnvironment, 37(43), 5944–5952.
Bunger, J., Krahl, J., Baum, K., Schroder, O., Muller,M., Westphal, G., et al. (2000). Cytotoxic and muta-genic effects, particle size and concentration analysisof diesel engine emissions using biodiesel and petroldiesel as fuel. Archives of Toxicology, 74, 490–498.
Burtscher, H. (2005). Physical characterization of particu-late emissions from diesel engines: A review. Journalof Aerosol Science, 36, 896–932.
Cheung, K. L., Polidori, A., Ntziachristos, L., Samaras,Z., Cassee, F. R., Gerlofs, M., et al. (2009). Chemicalcharacteristics and oxidative potential of particulatematter emissions from gasoline, diesel, and biodieselcars. Environmental Science & Technology, 43, 6334–6340.
Chung, A., Lall, A. A., & Paulson, S. E. (2008). Particulateemissions by a small non-road diesel engine: Biodieseland diesel characterization and mass measurementsusing the extended idealized aggregates theory. At-mospheric Environment, 42(9), 2129–2140.
Corrêa, S. M., & Arbilla, G. (2006). Aromatic hydrocar-bons emissions in diesel and biodiesel exhaust. At-mospheric Environment, 40(35), 6821–6826.
Da Rocha, G. O., Lopes, W. A., Pereira, P. A. P.,Vasconcellos, P. C., Oliveira, F. S., Carvalho, L. S.,et al. (2009). Quantification and source identificationof atmospheric particulate polycyclic aromatic hydro-carbons and their dry deposition fluxes at three sitesin Salvador Basin, Brazil, impacted by mobile andstationary sources. Journal of the Brazilian ChemicalSociety, 20, 680–692.
Dallarosa, J., Teixeira, E. C., Meira, L., & Wiegand, F.(2008). Study of the chemical elements and polycyclicaromatic hydrocarbons in atmospheric particles of
PM10 and PM2.5 in the urban and rural areas of SouthBrazil. Atmospheric Research, 89, 76–92.
Eiguren-Fernandez, A., Miguel, A. H., Froines, J. R.,Thurairatnam, S., & Avol, E. L. (2004). Seasonal andspatial variation of polycyclic aromatic hydrocarbonsin vapor-phase and PM2.5 in Southern California ur-ban and rural communities. Aerosol Science and Tech-nology, 38, 447–455.
Ferraz, W. H. S., Pelicho, A. F., & Solci, M. C. (2006). Sizedistributions of mutagenic compounds in particulatematter emitted from diesel engine in a bus station,Londrina, Brazil. Healthy Buildings 2006, Lisboa. Pro-ceedings Lisboa, 1, 33–37.
Freitas, A. M., & Solci, M. C. (2009). Caracterização doMP10 e MP2.5 e distribuição por tamanho de cloreto,nitrato e sulfato em atmosfera urbana e rural deLondrina. Química Nova, 32, 1750–1754.
Goriaux, et al. (2006). Field comparison of PAH measure-ments using a low flow denudeur device and conven-tional sampling systems. Environmental Sciences andTechnology, 40, 6398–6404.
Guarieiro, L. L. N., de Souza, A. F., Torres, E. A., & deAndrade, J. B. (2009). Emission profile of 18 carbonylcompounds, CO, CO2, and NOx emitted by a dieselengine fuelled with diesel and ternary blends contain-ing diesel, ethanol and biodiesel or vegetable oils. At-mospheric Environment, 43(17), 2754–2761.
Guarieiro, L. L. N., Pereira, P. A. P., Torres, E. A., daRocha, G. O., & de Andrade, J. B. (2008). Carbonylcompounds emitted by a diesel engine fuelled withdiesel and biodiesel–diesel blends: Sampling optimiza-tion and emissions profile. Atmospheric Environment,42(35), 8211–8218.
Ho, K. F., Ho, S. S. H., Lee, S. C., Cheng, Y., Chow,J. C., Watson, J. G., et al. (2009). Emissions of gas-and particle-phase polycyclic aromatic hydrocarbons(PAHs) in the Shing Mun Tunnel, Hong Kong. At-mospheric Environment, 43(40), 6343–6351.
IARC (1983). International agency for research on cancer.In Polynuclear aromatic compounds, Part 1: Chemical,environmental and experimental data (Vol. 32). Lyon,France, 1983.
Kai, Z., Yuesi, W., Tianxue, W., Yousef, M., & Frank, M.(2007). Properties of nitrate, sulfate and ammoniumin typical polluted atmospheric aerosols (PM10) inBeijing. Atmospheric Research, 84, 67–77.
Karavalakis, G., Fontaras, G., Ampatzoglou, D.,Kousoulidou, M., Stournas, S., Samaras, Z., et al.(2010). Effects of low concentration biodiesel blendsapplication on modern passenger cars. Part 3: Impacton PAH, nitro-PAH, and oxy-PAH emissions.Environmental Pollution, 158, 1584–1594.
Kawamura, K., & Kaplan, I. R. (1987). Motor exhaustemissions as a primary source for dicarboxylic acidsin Los Angeles Ambient. Environmental Science &technology, 27, 2227–2233.
Kerminen, V. M., Madela, T. E., Ojanen, C. H., Hillamo,R. E., Vilhunen, J. K., Rantanen, L., et al. (1997).Characterization of the particulate phase in the ex-haust from a diesel car. Environmental Science andTechnology, 31, 1883–1889.
Environ Monit Assess (2012) 184:2663–2676 2675
Krahl, J., Baum, K., Uackbarth, U., Jeberien, H. E.,Munack, A., Schutt, C., et al. (2001). Gaseouscompounds, ozone precursors, particle number andparticle-size distributions, and mutagenic effects dueto biodiesel. American Society of Agricultural Engi-neers, 44, 179–191.
Liaquat, A. M., Kalam, M. A., Masjuki, H. H.,& Jayed, M. H. (2010). Potential emissionsreduction in road transport sector using biofuelin developing contries. Atmospheric Environment.doi:10.1016/j.atmosenv.2010.07.03.
Lim, M. C. H., Ayoko, G. A., Morawska, L., Ristovski,Z. D., & Jayaratne, E. R. (2005). Effect of fuel com-position and engine operating conditions on polycyclicaromatic hydrocarbon emissions from a fleet of heavy-duty diesel buses. Atmospheric Environment, 39(40),7836–7848.
Limbach, L. K., Wick, P., Manser, P., et al. (2007). Expo-sure of engineered nanoparticles to human lung ep-ithelial cells: Influence of chemical composition andcatalytic activity on oxidative stress. EnvironmentalScience & Technology, 41, 4158–4163.
Lin, C., Chen, S., Huang, K., Lee, W., Lin, W.,Liao, C., et al. (2007). Water-soluble ions innano/ultrafine/fine/coarse particles collected near abusy road and at a rural site. Environmental Pollution,145, 562–570.
Lin, Y., Tsai, C., Yang, C., Jim, C. H. W., Wu, T., & Chang-Chien, G. (2008). Effects on aerosol size distributionof polycyclic aromatic hydrocarbons from the heavy-duty diesel generator fueled with feedstock palm-biodiesel blends. Atmospheric Environment, 42(27),6679–6688.
Machado, C. S., Loyola, J., Quiterio, S. L., da Rocha,G. O., de Andrade, J. B., & Arbilla, G. (2009).Particle-associated polycyclic aromatic hydrocarbonsand their dry deposition fluxes from a bus-station inRio de Janeiro metropolitan area, Brazil. Journal ofthe Brazilian Chemical Society, 20, 1565–1573.
Martins, L. D., Martins, J. A., Freitas, E. D., Rocha,C. R. M., Gonçalves, F. L. T., Ynoue, R. Y., et al.(2010). Potential health impact of ultrafine particlesunder clean and polluted urban atmospheric condi-tions: A model-based study. Air Quality, Atmosphere& Health, 3, 29–39.
Method IO-3.1. (1999). Compendium of methods for thedetermination of inorganic compounds in ambient air;selection, preparation and extraction of f ilter material.USA: EPA.
Miguel, A. H., & De Andrade, J. B. (1989). Rapid quan-titation of ten polycyclic aromatic hydrocarbons inatmospheric aerosols by diret HPLC separation af-ter ultrasonic acetronitrile extraction. InternationalJournal of Environmental Analytical Chemistry, 35,35–41.
Miguel, A. H., de Andrade, J. B., & Hering, S. V.(1986). Desorptivity versus chemical reactivity of poly-cyclic aromatic hydrocarbons (PAHs) in atmosphericaerosols collected on quartz fiber filters. InternationalJournal of Environmental Analytical Chemistry, 26,265–278.
Miguel, A. H., Eiguren-Fernandez, A., Sioutas, C., Fine,M., Geller, M., & Mayo, R. (2005). Observations oftwelve USEPA priority aromatic hydrocarbons in theAitken size range (10–32 nm Dp). Aerosol Science andTechnology, 39, 415–418.
Oberdörster, G., Maynard, A., Donaldson, K., Castranova,V., Fitzpatrick, J., Ausman, K., et al. (2005). Principlesfor characterizing the potential human health effectsfrom exposure to nanomaterials: Elements of a screen-ing strategy. Part Fibre Toxicology, 2, 1–35.
Ostiguy, C., Lapointe, G., Ménard, L., Cloutier, Y.,Trottier, M., Boutin, M., et al. (2006). Health Ef fectsof Nanoparticles (p. 53). Montréal: IRSST, ReportIRSST R-469.
Pui, D. Y. H., & Chen, D. (1997). Nanometer particles: Anew frontier for multidisciplinary research. Journal ofAerosol Science, 28, 539–544.
Rantanen, L., Mikkonen, S., Nylund, L., Kociba, P., Lappi,M., & Nylund, N. O. (1993). Ef fect of fuel on the regu-lated, unregulated and mutagenic emissions of DI dieselengines. SAE Technical Paper, No 932686.
Ravindra, K., Sokhia, R., & Grieken, R. V. (2008). At-mospheric polycyclic aromatic hydrocarbons: Sourceattribution, emission factors and regulation. At-mospheric Environment, 42(13), 2895–2921.
Ribeiro, N. M., Pinto, A. C., Quintella, C. M., da Rocha,G. O., Teixeira, L. S. G., Guarieiro, L. L. N., et al.(2007). The role of additives for diesel and dieselblended (ethanol or biodiesel) fuels: A review. Energy& Fuels, 21, 2433–2445.
Sánchez-Ccoyllo, O. R., Martins, L. D., Ynoue, R. Y.,Astolfo, R., Miranda, R. M., Freitas, E. D., et al.(2009). Vehicular particulate matter emission in roadtunnels in São Paulo, Brazil. Environmental Monitor-ing and Assessment, 149, 241–249.
Schnelle-Kreis, J., GebefuK Gi, I., Welzl, G., Jaensch, T., &Kettrup, A. (2001). Occurrence of particle-associatedpolycyclic aromatic compounds in ambient air of thecity of Munich. Atmospheric Environment, 35, S71–S81.
Sharp, C. A. (1998). Characterization of biodiesel exhaustemissions for EPA 211 (b)—f inal report for the na-tional biodiesel board, Jef ferson City, MO. San Anto-nio, TX: Southwest Research Institute.
Sharp, C. A., Howell, S. A., & Jobe, J. (2000). The ef fectof biodiesel fuels on transient emissions from moderndiesel engines, part 1 regulated emissions and perfor-mance. SAE Technical Paper No. 2000-01-1967.
Sioutas, C., Misra, C., Singh, M., Shen, S., & Hall, P. M.(2002). Development and evaluation of a personalcascade impactor sampler (PCIS). Journal of AerosolScience, 33, 1027–1047.
Sioutas, C., Singh, M., & Misra, C. (2003). Field evalua-tion of a personal cascade impactor sampler (PCIS).Atmospheric Environment, 37(34), 4781–4793.
Sioutas, C., Delfino, R. J., & Manisha, S. (2005). Exposureassessment for atmospheric ultrafine particles (UFPs)and implications in epidemiologic research. Environ-mental Health Perspectives, 113, 947–955.
Swanson, K. J., Madden, M. C., & Ghio, A. J. (2007).Biodiesel exhaust: The need for health effects re-
2676 Environ Monit Assess (2012) 184:2663–2676
search. Environmental Health Perspectives, 115, 496–499.
Tavares, M., Jr., Pinto, J. P., Souza, A. L., Scarmínio, I., &Solci, M. C. (2004). Emission of polycyclic aromatichydrocarbons from diesel engine in a bus station,Londrina, Brazil. Atmospheric Environment, 38(30),5039–5044.
Tsolakis, A. (2006). Effects on particle-size distributionfrom the diesel engine operating on RME-biodieselwith EGR. Energy & Fuels, 20, 1418–1424.
Turrio-Baldassarri, L., Battistelli, C. L., Conti, L., Crebelli,R., Berardis, B. D., Iamiceli, A. L., et al. (2004). Emis-sion comparison of urban bus engine fueled with dieseloil and biodiesel blend. Science of The Total Environ-ment, 327, 147–162.
USEPA (2007). U.S. Environmental Protection Agency.Review of the national ambient air quality standardsfor ozone: Policy assessment of scientif ic and technicalinformation. Staff Paper Available via DIALOGhttp://www.epa.gov/ttn/naaqs/standards/ozone/data/2007_01_ozone_staff_paper.pdf.
Vasconcellos, P. C., Zacarias, D., Pires, M. A. F.,Pool, C. S., & Carvalho, L. R. F. (2003). Measure-ments of polycyclic aromatic hydrocarbons in airboneparticles from the metropolitan area of São Paulocity, Brazil. Atmospheric Environment, 37(21), 3009–3018.
Vasconcellos, P. C., Balasubramanian, R., Bruns, R. E.,Sanchez-Ccoyllo, O. R., Andrade, M. F., & Flues, M.(2007). Water-soluble ions and trace metals in air-borne particles over urban areas of the state of SãoPaulo, Brazil: Influences of local sources and long
range transport. Water, Air, and Soil Pollution, 186,63–73.
Vasconcellos, P. C., Souza, D. Z., Sanchez-Ccoyllo, O. R.,Bustillos, J. O. V., Lee, H., Santos, F. C., et al. (2010).Determination of anthropogenic and biogenic com-pounds on atmospheric aerosol collected in urban,biomass burning and forest areas in São Paulo, Brazil.Science of the Total Environment, 408, 5836–5844.
Viana, M., López, J. M., Querol, X., Alastuey, A., García-Gacio, D., Blanco-Heras, G., et al. (2008). Tracers andimpact of open burning of rice straw residues on PMin Eastern Spain. Atmospheric Environment, 42(8),1941–1957.
Wall, J. C., Shimpi, S. A., & Yu, M. L. (1987). Fuel sulfurreduction for control of diesel particulate emissions.SAE Technical Paper Series No. 872139.
Wang, Y., Zhuang, G., Chen, S., An, Z., & Zheng, A.(2007). Characteristics and sources of formic, aceticand oxalic acids in PM2.5 and PM10 aerosols in Beijing,China. Atmospheric Research, 84, 169–181.
Wingfors, H., Sjödin, A., Haglund, P., & Brorström-Lundén, E. (2001). Characterisation and determina-tion of profiles of polycyclic aromatic hydrocarbons ina traffic tunnel in Gothenburg, Sweden. AtmosphericEnvironment, 35(36), 6361–6369.
Zhang, J., He, K., Shi, X., & Zhao, Y. (2009). Effect of SMEbiodiesel blends on PM2.5 emission from a heavy-dutyengine. Atmospheric Environment, 43(15), 2442–2448.
Zou, L., & Atkinson, S. (2003). Characterizing vehicleemissions from the burning of biodiesel made fromvegetable oil. Environmental Technology, 24, 1253–1260.