Composite Structures - TORE (TUHH Open Research)
10
Weak adhesion detection – Enhancing the analysis of vibroacoustic modulation by machine learning Benjamin Boll b , Erik Willmann b , Bodo Fiedler b , Robert Horst Meißner a,b,⇑ a Institute of Surface Science, Helmholtz-Zentrum Hereon, Max-Planck Str. 1, 21502 Geesthacht, Germany b Institute of Polymers and Composites, Hamburg University of Technology, Hamburg, Germany ARTICLE INFO Keywords: Composites Weak‐bonds Non‐destructive testing Vibroacoustic modulation Artificial neural networks ABSTRACT Adhesive bonding is a well‐established technique for composite materials. Despite advanced surface treatments and preparations, surface contamination and application errors still occur, resulting in localised areas with a reduced adhesion. The dramatic reduction of the bond strength limits the applicability of adhesive bonds and hampers further industrial adaptation. This study aims to detect weak‐bonds due to manufacturing errors or contamination by analysing and interpreting the vibroacoustic modulation signals with the aid of machine learning. An ultrasonic signal is introduced into the specimen by a piezoceramic actuator and modulated through a low frequency vibration excited by a servo‐hydraulic testing system. Tested samples are single‐lap shear specimens, according to ASTM D5868‐01, with artificial circular debonding areas introduced as PTFE‐ films or a release agent contamination. It is shown that an artificial neural network can identify various defects in the bonded joint robustly and is able to predict residual strengths and hence demonstrates great potential for non‐destructive testing of adhesive joints. 1. Introduction Fibre reinforced composites are utilised in many load‐bearing pri- mary structures in aerospace and renewable energy production due to their superior weight and strength ratio, fatigue properties and resistance to corrosion [1]. Contrary to the idea of lightweight design, however, composite parts in primary structures are joined using tradi- tional methods such as bolts or rivets which cause high stress concen- trations in the bonded area and damages around the hole while machining. Consequently, this has to be compensated by an increased material thickness or metal inserts in the bonded region [2]. Adhesive bonding aids in reducing this additional weight and leads to homogeneous stress distribution in the joint [2,3]. For many appli- cations a high level of process control with surface activation and pro- cess automation for the bonding process is available. Despite this, areas of reduced adhesion persist due to the occurrence of contamina- tions [2–5]. While other adhesive defects like voids and porosities can be detected with ultrasonic techniques, weak‐bonds are determined by chemical interactions at the atomic level, which is orders of magnitude smaller than ultrasonic wavelengths [4]. Therefore, these defects are not detectable with conventional non‐destructive testing (NDT) meth- ods but reducing the bonds’ strength dramatically [3,5,6]. To create artificially weak‐bonds, most studies are either introduc- ing a non‐adhesive film [7–13] or contaminating the adherents surface [11–18]. The insertion of a polytetrafluoroethylene (PTFE) film into the adhesive joint is straightforward to implement. Since the physical properties of the bond are locally altered by the introduction of a PTFE‐film, those defects are typically clearly detectable by ultrasonic techniques or other NDT methods [7,11,13]. Creating weak‐bonds by applying a small amount of release agent on one of the adherents resembles reality much closer [17]. The detection of bond line flaws, especially weak‐bonds, has been subject of various works employing various NDT techniques including linear and non‐linear ultrasonic methods [4,11,12,19],X‐ray [7], guided Lamb‐waves [8,20,21], laser shock adhesion testing [14,22], digital image correlation [23] and highly non‐linear solitary waves [18]. A summary of various NDT methods for the assessment of adhe- sive bonds is found in Ehrhart et al. [3]. Nevertheless, the Federal Avi- ation Authority approves currently no method to reliably detect a reduced adhesion—which emphasises the need for new methods appli- cable to real‐life structures which are sensitive to all types of defects [2,5,6,24]. Despite the fact, that some non‐linear methods show promising results in the aforementioned works, the vibroacoustic modulation https://doi.org/10.1016/j.compstruct.2021.114233 Received 22 February 2021; Revised 25 May 2021; Accepted 3 June 2021 Available online 08 June 2021 0263-8223/© 2021 The Author(s). Published by Elsevier Ltd. This is an open access article under the CC BY license (http://creativecommons.org/licenses/by/4.0/). ⇑ Corresponding author. E-mail address: [email protected] (R.H. Meißner). Composite Structures 273 (2021) 114233 Contents lists available at ScienceDirect Composite Structures journal homepage: www.elsevier.com/locate/compstruct
-
Upload
khangminh22 -
Category
Documents
-
view
3 -
download
0
Transcript of Composite Structures - TORE (TUHH Open Research)
Composite Structures 273 (2021) 114233
Contents lists available at ScienceDirect
Composite Structures
journal homepage: www.elsevier .com/locate /compstruct
Weak adhesion detection – Enhancing the analysis of vibroacousticmodulation by machine learning
https://doi.org/10.1016/j.compstruct.2021.114233Received 22 February 2021; Revised 25 May 2021; Accepted 3 June 2021Available online 08 June 20210263-8223/© 2021 The Author(s). Published by Elsevier Ltd.This is an open access article under the CC BY license (http://creativecommons.org/licenses/by/4.0/).
⇑ Corresponding author.E-mail address: [email protected] (R.H. Meißner).
Benjamin Boll b, Erik Willmann b, Bodo Fiedler b, Robert Horst Meißner a,b,⇑a Institute of Surface Science, Helmholtz-Zentrum Hereon, Max-Planck Str. 1, 21502 Geesthacht, Germanyb Institute of Polymers and Composites, Hamburg University of Technology, Hamburg, Germany
A R T I C L E I N F O
Keywords:CompositesWeak‐bondsNon‐destructive testingVibroacoustic modulationArtificial neural networks
A B S T R A C T
Adhesive bonding is a well‐established technique for composite materials. Despite advanced surface treatmentsand preparations, surface contamination and application errors still occur, resulting in localised areas with areduced adhesion. The dramatic reduction of the bond strength limits the applicability of adhesive bondsand hampers further industrial adaptation. This study aims to detect weak‐bonds due to manufacturing errorsor contamination by analysing and interpreting the vibroacoustic modulation signals with the aid of machinelearning. An ultrasonic signal is introduced into the specimen by a piezoceramic actuator and modulatedthrough a low frequency vibration excited by a servo‐hydraulic testing system. Tested samples are single‐lapshear specimens, according to ASTM D5868‐01, with artificial circular debonding areas introduced as PTFE‐films or a release agent contamination. It is shown that an artificial neural network can identify various defectsin the bonded joint robustly and is able to predict residual strengths and hence demonstrates great potential fornon‐destructive testing of adhesive joints.
1. Introduction
Fibre reinforced composites are utilised in many load‐bearing pri-mary structures in aerospace and renewable energy production dueto their superior weight and strength ratio, fatigue properties andresistance to corrosion [1]. Contrary to the idea of lightweight design,however, composite parts in primary structures are joined using tradi-tional methods such as bolts or rivets which cause high stress concen-trations in the bonded area and damages around the hole whilemachining. Consequently, this has to be compensated by an increasedmaterial thickness or metal inserts in the bonded region [2].
Adhesive bonding aids in reducing this additional weight and leadsto homogeneous stress distribution in the joint [2,3]. For many appli-cations a high level of process control with surface activation and pro-cess automation for the bonding process is available. Despite this,areas of reduced adhesion persist due to the occurrence of contamina-tions [2–5]. While other adhesive defects like voids and porosities canbe detected with ultrasonic techniques, weak‐bonds are determined bychemical interactions at the atomic level, which is orders of magnitudesmaller than ultrasonic wavelengths [4]. Therefore, these defects arenot detectable with conventional non‐destructive testing (NDT) meth-ods but reducing the bonds’ strength dramatically [3,5,6].
To create artificially weak‐bonds, most studies are either introduc-ing a non‐adhesive film [7–13] or contaminating the adherents surface[11–18]. The insertion of a polytetrafluoroethylene (PTFE) film intothe adhesive joint is straightforward to implement. Since the physicalproperties of the bond are locally altered by the introduction of aPTFE‐film, those defects are typically clearly detectable by ultrasonictechniques or other NDT methods [7,11,13]. Creating weak‐bondsby applying a small amount of release agent on one of the adherentsresembles reality much closer [17].
The detection of bond line flaws, especially weak‐bonds, has beensubject of various works employing various NDT techniques includinglinear and non‐linear ultrasonic methods [4,11,12,19], X‐ray [7],guided Lamb‐waves [8,20,21], laser shock adhesion testing [14,22],digital image correlation [23] and highly non‐linear solitary waves[18]. A summary of various NDT methods for the assessment of adhe-sive bonds is found in Ehrhart et al. [3]. Nevertheless, the Federal Avi-ation Authority approves currently no method to reliably detect areduced adhesion—which emphasises the need for new methods appli-cable to real‐life structures which are sensitive to all types of defects[2,5,6,24].
Despite the fact, that some non‐linear methods show promisingresults in the aforementioned works, the vibroacoustic modulation

B. Boll et al. Composite Structures 273 (2021) 114233
(VAM) analysis has shown a superior sensitivity for the damage detec-tion compared to other nonlinear ultrasonic techniques [25]. It hasalready been used to detect fatigue damage on metallic specimens[25–33] as well as impacts and subsequent delaminations in compos-ites [34–36]. Further applications are summarised in [37]. Neverthe-less, to our knowledge, a VAM analysis has not yet been applied toadhesive joints. And although the analysis of Lamb‐wave based exper-iments with machine learning methods has been already the subject ofseveral other studies [38–41], applying machine learning methods toanalyse a VAM was to the authors knowledge only proposed by [32]who predicted the crack length and the remaining fatigue lifetime ofaluminium specimens. In contrast to the method of [32], in this work,we propose to use multiple modulation amplitudes as input values foran Artificial Neural Network (ANN) rather then a (linear) combinationof such.
A unique aspect of this work is the first‐time application of VAM toadhesively bonded composite parts. In addition, we train neural net-works on several subsets of our measured data to investigate if achange of the excitation frequency of the piezoceramic actuators ortheir positions on the specimen affect the accuracy of the algorithm.Finally, we discuss the as yet unprecedented classification accuracyof the defect detection, especially for weak‐bonds, and interpret themin terms of true and predicted shear strengths of the various defects bymeans of sideband influences.
2. Materials and methods
2.1. Vibroacoustic modulation
A high sensitivity is achieved in the VAM method due to the mod-ulation of an ultrasonic probe wave (with frequency f Ca) with anintense low‐frequency pump vibration (with frequency f P) at defectlocations. The low‐frequency vibration locally and nonlinearly altersthe mechanical properties in the specimen at inhomogeneities ordefects, which affects the ultrasonic wave propagation and can conse-quently be detected by another piezoceramic receiver. The generalapproach of a VAM analysis is illustrated in Fig. 1. Damages (and ini-tial defects, i.e., discontinuities such as grain boundaries in metals, sur-faces, interfaces and interphases, etc.) lead to non‐linearities in thewave propagation [29]. It is hypothesised that due to the nonlinearbehaviour in the weak‐bond induced by a large amplitude pump wave,
Fig. 1. Schematic representation of a vibroacoustic modulation analysis. Combincarrier f Ca (denoted as black lines) results in a signal modulation and sidebands. Hvibrations are received by another piezoceramic actuator (Out).
2
the ultrasonic Lamb wave is further modulated. This ultimately leadsto higher sensitivities than conventional NDT techniques such aspulse‐echo ultrasound. Consequently, the introduced frequencies willreveal higher harmonics (nfP ^ nfCajn∈N) and sidebands will evolvearound the higher frequency (f Ca � nfPjn∈N) due to the modulation[37].
Relevant for this work are “damage indices” usually calculatedfrom the amplitude of the sidebands (An�jn∈N) which are commonlyused to evaluate the “severity” of a damage. Frequently used damageindices are the “modulation intensity coefficient” (R) [28,34,37], the“Modulation Index” (MI) [31], a “non‐linearity parameter” [29,32]and the “sideband ratio” [13]. In this work, only the first two are con-sidered which are given by:
R ¼∑n¼1
Anþ þ An�ð ÞACa
MI ¼ 20 � log10 A1þþA1�2�ACa
� �:
The non‐linearity parameter and the sideband ratio are frequentlyused in a different experimental setup (i.e., pump and probe frequen-cies are introduced by either a single or two separate piezoceramicactuators in combination or alone) and since those had not shown adistinguishable differentiation using our experimental setup they werenot further considered in this work. It should be noted that since sev-eral sources only use the first sidebands [28,34] to calculate the mod-ulation intensity coefficient, the dB scaling of the modulation index isbasically the relevant dissimilarity between modulation index andmodulation intensity.
Recent studies have attributed amplitude modulation and phase orfrequency modulation to different damage types in the sample [30,31].In the frequency domain, a pure amplitude modulation is only con-tributing to the occurrence of the first sidebands, while frequencymodulation and phase modulation contribute effectively to an infinitenumber of sidebands [31]. To remedy this, Hu et al. [42] proposes theseparation by a Hilbert‐Huang transformation which suggested thatthe amplitude modulated signal has a higher correlation with the cracksize. In contrast, after applying the so‐called In‐phase/QuadratureHomodyne Separation algorithm, the frequency modulated signal indi-cates fatigue damage for aluminium at an earlier point [30,31]. How-ever, under certain conditions, narrow‐band frequency modulation cancause just one sideband and a distorted or over‐modulated amplitudemodulation potentially leads to several artificial sidebands [42]. Tak-
ing a high-strain pump frequency f P with an ultrasonic Lamb-wave as signalere, the piezoceramic of the carrier signal (In) is excited at f Ca and resulting

B. Boll et al. Composite Structures 273 (2021) 114233
ing all these factors into account, the evaluation of the patterns in VAMsidebands is a complex endeavour. Thus, a data‐driven analysis, as pre-sented later, using an ANN to examine specific patterns in sidebandamplitudes proves beneficial for such complex and highly correlatedinput data—if aforementioned limitations are taken into account.
2.2. Specimen preparation
The specimen geometry is based on the ASTM D5868 ‐01 [43] stan-dard as shown in Fig. 2. Glass‐fibre reinforced polymer laminates weremanufactured in a resin transfer moulding process with a ½04�s layup ofdry UT‐E500 E‐glass fibres from Gurit and a low‐viscosity epoxy sys-tem RIMH135 with a RIMR137 amine‐based hardener from Hexion.After infiltration, the plates were cured at 50 �C for 24h, and post‐cured for 15h at 80 �C outside the mould and in compliance withthe datasheet. The glass‐fibre reinforced polymer plates are furthercropped to the required mould dimensions with a water‐cooled corun-dum saw blade (ATM Brillant 265). The bond lines were finished witha 1000‐grit sandpaper and cleaned with isopropanol to eliminate priorcontamination.
Single‐lap joints containing three different bonding types, includ-ing pristine specimen, are produced by bonding the glass‐fibre rein-forced polymer substrates in a secondary‐bonding process using a2C‐epoxy adhesive (SikaPower‐1280). Both materials are commonlyfound in adhesively bonded parts of wind turbine blades. Manufactur-ing of the weak‐bonds was adapted from Harder et al. [17]. Circularareas with a diameter of 12mm (18% of the overall surface) were con-taminated with release agent (Mikon W‐64 + from Münch Chemie)according to the datasheet. For a precise application of the releaseagent, stencils (Hostaphan from Mitsubishi) were cut (using an Aris-tomat TL 1625) and fixed with adhesive tape (Tesa) outside of theadherent area to prevent further contamination due to the tape. Thesecond class of defects was created by introducing a circular PTFE‐
Fig. 2. Sample dimensions after ASTM D 5868-01 and piezoceramic actuatoralignments.
Fig. 3. Schematic of the manufacturing process and introduction of artificial defecthe final specimen (right).
3
film (Goodfellow FP301100) in the centre of the joint with a thicknessof 0.01mm and a diameter of 12mm. Sheets were cut and positionedusing a stencil. This procedure led to equal‐sized and similar locatedbond line flaws.
A milled jig was used to ensure an optimal alignment of the adher-ents and spacers, separating the adherents by 0.2mm, as shown inFig. 3. The produced panels are cured in an autoclave for 4h at70 �C with a pressure of 2bar and afterwards cut to their final dimen-sion of 25.4mm width with a water‐cooled saw. Finally, all specimenswere conditioned for two weeks according to ISO 291 at 23 �C and50% relative humidity.
Subsequent tests evaluating the quality of all produced specimens,have been performed to detect defects from the manufacturing pro-cess. First by an optical analysis (EPSON V850 Pro transmission lightscanner) and afterwards using a pulse‐echo ultrasonic measurementof bonded regions (USPC 3040 ultrasonic imaging system). In theultrasonic C‐scans shown in Fig. 4, inserted PTFE‐films are clearly vis-ible as red areas. In contrast, specimen with applied release agent arenot distinguishable from pristine specimens. Proper application of therelease agent was ensured by preparing different specimens in permu-tative order using a single stencil for all types of bonds (cf. Fig. 3).Indeed, in the fracture surfaces shown in Fig. 4 introduced defectsare clearly identifiable as circular areas where the reduced adhesionprevents fibre tearing and, more importantly, adhesion.
ts (left), the curing of the adhesive in an autoclave (middle) and the cutting of
Fig. 4. Comparison of fracture surfaces and ultrasonic C-scans of the overlapregion of a pristine (left), applied release agent (middle) and introduced PTFE-film (right) specimen.
B. Boll et al. Composite Structures 273 (2021) 114233
2.3. Data acquisition
2.3.1. Vibration measurementVibro‐acoustic measurements were conducted similar to the
method described in Refs. [27,30,31,33,44,45]. A pump frequency off P=5Hz was applied by an 8801 servo‐hydraulic testing system fromInstron (max. load capacity of 63kN) and controlled by the InstronWaveMatrixTM software. The pump frequency is limited by the hydrau-lic valve of the testing system and the maximum possible was hence5Hz. The hydraulic grips of the testing machine were closed with aconstant pressure to eliminate boundary influences [36]. The ampli-tude of the pump frequency σmax was set to 11MPa with a stress ratioof R=0.1.
A high‐frequency Lamb‐wave is introduced into the specimen bybonding piezoceramic actuator disks with dimensions 10×2mm (PI‐Ceramics) to the adherents with double‐sided tape (Tesa). Preliminarytests using double‐sided tape have shown only a slight reduction of therelative signal strength (when measured in dB) and equivalent infor-mation in the signal as compared to the more commonly used 2C‐adhesives—which offers the great advantage of reusing piezoceramicsat almost no cost in terms of signal‐to‐noise ratio. The excitation anddata acquisition was performed by a NI‐USB 6366 data acquisitionboard (National Instruments) with a sampling rate of 2MS/s and16bit resolution and was controlled from MATLAB2020a. The gener-ated signal was twofold amplified using a BUF634 amplifier with anadditional low‐pass of 420 kHz and a 12Vpp sine.
The choice of the high frequency for the Lamb‐wave excitationdepends on the resonant frequency of the piezoceramic disks and thenatural frequencies of the specimen, so the dimensions must be care-fully chosen to account for the generation of Lamb waves for a givenspecimen dimension. A detailed summary of the conditions for theoccurrence of signal modulation with Lamb waves is found in Ref.[29]. The sinusoidal signal was linearly swept between 1–300kHzwithin 10s to determine a suitable frequency range for the HF (moredetails on this frequency chirp are found in the Supplementary Infor-mation). The strongest signal on the receiving piezoceramic was foundat around f Ca = 200–220kHz. Using this range, 39 VAM measure-ments were made with an equal frequency spacing of 500Hz and aduration of 2s each. Additionally, as shown in Fig. 2, signal pathsbetween receiver and sender are alternated for each specimen to deter-
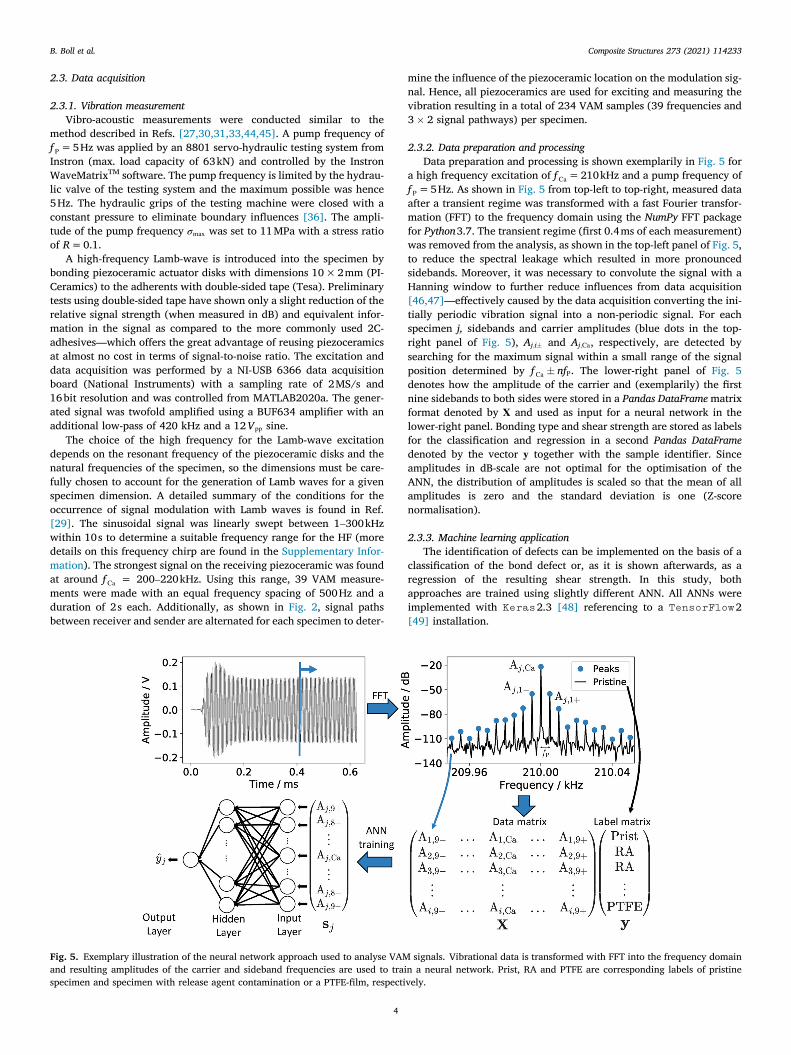
Fig. 5. Exemplary illustration of the neural network approach used to analyse VAMand resulting amplitudes of the carrier and sideband frequencies are used to traispecimen and specimen with release agent contamination or a PTFE-film, respecti
4
mine the influence of the piezoceramic location on the modulation sig-nal. Hence, all piezoceramics are used for exciting and measuring thevibration resulting in a total of 234 VAM samples (39 frequencies and3� 2 signal pathways) per specimen.
2.3.2. Data preparation and processingData preparation and processing is shown exemplarily in Fig. 5 for
a high frequency excitation of f Ca=210kHz and a pump frequency off P=5Hz. As shown in Fig. 5 from top‐left to top‐right, measured dataafter a transient regime was transformed with a fast Fourier transfor-mation (FFT) to the frequency domain using the NumPy FFT packagefor Python3.7. The transient regime (first 0.4ms of each measurement)was removed from the analysis, as shown in the top‐left panel of Fig. 5,to reduce the spectral leakage which resulted in more pronouncedsidebands. Moreover, it was necessary to convolute the signal with aHanning window to further reduce influences from data acquisition[46,47]—effectively caused by the data acquisition converting the ini-tially periodic vibration signal into a non‐periodic signal. For eachspecimen j, sidebands and carrier amplitudes (blue dots in the top‐right panel of Fig. 5), Aj;i� and Aj;Ca, respectively, are detected bysearching for the maximum signal within a small range of the signalposition determined by f Ca � nfP. The lower‐right panel of Fig. 5denotes how the amplitude of the carrier and (exemplarily) the firstnine sidebands to both sides were stored in a Pandas DataFramematrixformat denoted by X and used as input for a neural network in thelower‐right panel. Bonding type and shear strength are stored as labelsfor the classification and regression in a second Pandas DataFramedenoted by the vector y together with the sample identifier. Sinceamplitudes in dB‐scale are not optimal for the optimisation of theANN, the distribution of amplitudes is scaled so that the mean of allamplitudes is zero and the standard deviation is one (Z‐scorenormalisation).
2.3.3. Machine learning applicationThe identification of defects can be implemented on the basis of a
classification of the bond defect or, as it is shown afterwards, as aregression of the resulting shear strength. In this study, bothapproaches are trained using slightly different ANN. All ANNs wereimplemented with Keras2.3 [48] referencing to a TensorFlow2[49] installation.
signals. Vibrational data is transformed with FFT into the frequency domainn a neural network. Prist, RA and PTFE are corresponding labels of pristinevely.

B. Boll et al. Composite Structures 273 (2021) 114233
Optimal network architecture and learning parameters are deter-mined from a randomised grid search [50] in which the number of hid-den layers ranging between 1 and 4 and the number of neurons perlayer are varied. Furthermore, the number of input values (as givenby the input vector sj ¼ ½Aj�; . . . ;ACa; . . . ;Ajþ� in Fig. 5), the range ofused probe frequencies and the signal pathways between the piezoce-ramics was permuted. Partly, this procedure was done to evaluate theinformation gain adding more the sidebands than usually analysedand, on the other hand, to identify the most information‐rich fre-quency range and piezo separations for classifying the bond (defect)and predicting the shear strength.
The evaluation metric for training a classification ANN is the clas-sification accuracy and for a regression ANN the mean absolute error(MAE) of the prediction. These metrics are calculated as
accuracy ðy; yÞ ¼ 1n ∑
n
i¼11yi ðyiÞ and
MAEðy; yÞ ¼ 1n ∑
n
i¼1yi �yij j
ð1Þ
where i runs over the total number of samples n; yi is the predictedlabel of the i‐th sample, yi the corresponding true label and 1yi ðyiÞ isthe indicator function which returns 1 if the predicted label corre-sponds to the true label. Furthermore, reliability and robustness ofthe predictions are ensured by employing a ten‐fold cross‐validationby training ten ANNs on differently composed training sets, wherethe data set is split randomly into a training set (80%) and a test set(20%). Obviously, evaluating the ten ANNs trained on different trainsets where all measurements from one specimen are either in the testor training set increases the reliability of the resulting prediction. Thedifferences in the ANN used for classification or regression were basi-cally in the output layer and loss function. A softmax output‐layer1
was chosen for the classification and a single neuron2 was chosen forthe regression.
Over‐fitting of the ANNs was inhibited by implementing a dropoutof nodes in the ANN with a probability of p ¼ 0:1 for every hiddenlayer of the ANN and early stopping—effectively stopping the trainingat the smallest error [52]—with a delay of 100 epochs on the valida-tion loss for the training process. After the initial search for the hyperparameters, the neural network architecture was set to four hiddenlayers with a minimum of [40, 40, 30, 20] neurons. The architecturewas the same for all ANNs in each cross‐validation, but between per-mutations, the minimum number of each layer was multiplied by arandom number between one and two to test whether, for example,slightly larger networks performed better.
2.3.4. Feature importanceIn this work, the influence of each sideband on the prediction is cal-
culated to assess their individual importance. For this purpose, the fea-ture importance is calculated with two methods. Firstly, game‐theoretical shapely values were calculated with the DeepExplainerfrom the SHapley Additive exPlanations (SHAP) package [53]. Here,the marginal contributions of each feature are calculated across per-mutated input values. Obtained results from SHAP are compared toGarsons’ algorithm [54,55] in which, explained rather briefly here,the weights of the neural network are analysed to obtain a featureimportance of the input values. Since the feature importance withineach of the ten different cross‐validation runs differs, a mean valuewas calculated.
1 with categorical cross‐entropy lossand an Adam optimiser [51] with an initial learningrate set to 0.01
2 with ReLu activation, mean squared error loss and Adam optimiser with an initiallearning rate set to 0.0001
5
2.4. Mechanical testing
The shear strength measurements were performed on a universaltesting machine Z100 from ZwickRoell equipped with a 100kN loadcell. Due to the small fracture strain of the adhesive bond, the displace-ment rate was set to 2mm/min. The strain was monitored with a mul-tiXtens extensometer from ZwickRoell at a distance of 50mm. Theshear strength of each specimen is calculated using the measured ten-sile strength normalised by the (initial) cross‐section of the adhesivejoint overlap.
3. Results and discussion
3.1. Mechanical testing
Shear strength and modulus are shown in Fig. 6 for different defecttypes. As expected, shear strengths of the pristine specimens are high-est with 22.3�1.5MPa—near the 25MPa specified in the datasheet. Inthe presence of a defect, the shear strengths of release agent specimensare reduced to 20.7 �1MPa and in case of PTFE to 19.7�0.9MPa.Although standard deviations of the latter two are similar, it isassumed that the stress concentration due to the finite thickness ofthe PTFE‐film leads to a further reduction of the shear strength as com-pared to the release agent. The shear strength reduction due to therelease agent is only half as severe as compared to scarf bonded jointstested by Harder et al. [17] where a 26% decrease was observed. Thisdifference can be explained by stress concentrations at the edges of thesingle‐lap shear joints compared to the more homogeneous stress dis-tribution in scarf bonded joints. Defects in the central region of scarfbonded joints have thus a higher influence on the shear strength ofthe bond. In contrast to the shear strengths, no significant differencesin the shear modulus have been observed for contaminated specimens.Corresponding stress–strain curves can be found in the SupplementaryInformation.
3.2. Vibroacoustic measurements
The vibroacoustic measurements are evaluated firstly by calculat-ing the “traditional” damage indices mentioned in detail in the meth-ods part. Box plots illustrating the distributions of the modulationindex and modulation intensity coefficient are shown in Fig. 7. Indi-cated by the position of the mean value of the modulation index orintensity, both indices would eventually enable a detection of theinserted PTFE‐film in principle—if their standard deviation wouldnot prohibit this. However, as expected, distinguishing between pris-tine and release agent specimens is impossible, regardless if the mod-ulation index or modulation intensity coefficient is used. Theprominent difference of PTFE is in accordance with the work of Chenet al. [13] where a PTFE‐film was detectable inside a laminate.
3.3. Adhesive bonding classification
To improve the classification based on the damage indices pre-sented in the previous chapter, a more sophisticated defect detectionemploying neural networks is proposed in the following. In general,accurate classifications from an ANN depend on the network architec-ture, the number of used sidebands, the frequencies and the signalpath between piezoceramic actuator combinations as it is shown inFig. 8. Concerning the network architecture, best results wereachieved with four hidden layers with ½60;70;50;40� neurons. Theinclusion of n sidebands in the ANN analysis of the VAM signal isdenoted by sj ¼ ½Aj�; . . . ;ACa; . . . ;Ajþ� as given on the horizontal axisof Fig. 8 (left). Each point shown in Fig. 8 (left) is the mean accuracyresulting from a ten‐fold cross‐validation based on different train/testcompositions (at a fixed ratio of 80/20). For each input parameter sj,

Fig. 6. Shear strengths (left) and shear modulus (right) of adhesive joints with or without defects as given by labels on the x-axis.
Fig. 7. Modulation index (left) and modulation intensity coefficient (right)obtained from the frequency domain signal for pristine and release agent (RA)or PTFE-film contaminated specimen.
B. Boll et al. Composite Structures 273 (2021) 114233
the ten‐fold cross‐validation process was repeated several times, eachtime with VAM samples from a different randomly selected probe fre-quency range. Each time, the ANN was trained on VAM samples from aprobe frequency range randomly selected by choosing two values froman interval between 200� 220kHz with an equal spacing of 500Hzand at least five values in between. The results for a certain frequencyrange that provided the most accurate classifications are shown inFig. 8. In general, a dependency on the signal pathway is observedand higher accuracies for the damage type classification are obtainedusing more sidebands—implicating relevant information in the higherorder sidebands. However, a maximum is reached for s5 (five side-bands on each side plus the carrier signal). One reason for the accuracydecreasing after s5 is probably the amplitude decrease of the higher‐order sidebands and the aggravation of the signal‐to‐noise ratio. TheANN eventually identifies artificial patterns in the noise and overfitsthe data, resulting in a reduced accuracy. On the other hand, anincreasing number of input parameters negatively impacts the optimi-sation with a gradient descent method as well, which would in turnrequire more data.
By splitting the data set in three distinct signal paths between thepiezoceramics, a difference in information quality and resulting classi-
Fig. 8. Comparison of the bond line defect classification for a different number ofThe accuracy of the ANN depends on the number of sidebands sj (left) and the fre
6
fication accuracies can be observed in the right panel of Fig. 8. Higheraccuracy is achieved if the distances of piezoceramics to the bondedarea are asymmetric (P1–P3, P2–P4) with a wider spacing than a sym-metric positioning (P2–P3). Furthermore, asymmetric alignmentsappear to be more frequency dependent which might be an effect ofthe signal path length, the distance to the bond or more generallythe eigenmodes of the specimen. Note that in Fig. 8 (right), differentprobe frequency ranges (which possibly also overlap) were used totrain the ANNs, as previously discussed, rather than individual fre-quencies as it might be anticipated. Hence, each point in Fig. 8 (right)is the highest achievable accuracy of a frequency obtained for traininga neural network with input data from a certain frequency range. Thus,if a wider frequency range is beneficial for training, this would in prin-ciple lead to more horizontal parts in Fig. 8; but may also have otherreasons.
More detailed illustrations of the classification results using theabove mentioned optimised input parameters (in percentage) areshown in Fig. 9 (left) as a confusion matrix. For this classification,ten different frequencies per specimen (5 from P4–P2 and 5 fromP2–P4 in the range 202:5� 204:5kHz) and for each 11 input values(i.e., s5: 5 sidebands to each side and the amplitude of the carrier)are used for the corresponding ANN training which resulted in thehighest possible classification accuracy. Classification accuracies areagain estimated from a ten‐fold cross‐validation each using a randomlychosen train/test composition at fixed 80/20 ratio. The diagonal rep-resents the true‐positive classifications while the off‐diagonal valuesrepresent false classified samples. Measurements from specimens witha PTFE‐film in the bonded area are detectable with an accuracy of99%. As already suspected, distinguishing between pristine and arelease agent contamination is less precise with an accuracy of91.6%. Nevertheless, an overall accuracy of 93.4% is achieved forthe ternary classification.
Since PTFE‐films can already be detected by ultrasonic testing with-out the use of a sophisticated ANN, it is natural to remove all PTFE‐film samples from the training and test set and use a second binaryANN alone to distinguish the latter two defects. This further improvesthe detection of weak‐bonds, as shown in the right confusion matrix ofFig. 9. This network is based on a similar randomised input parameter
sidebands, signal pathways between the piezoceramics and probe frequencies.quency range used in the VAM measurements (right).
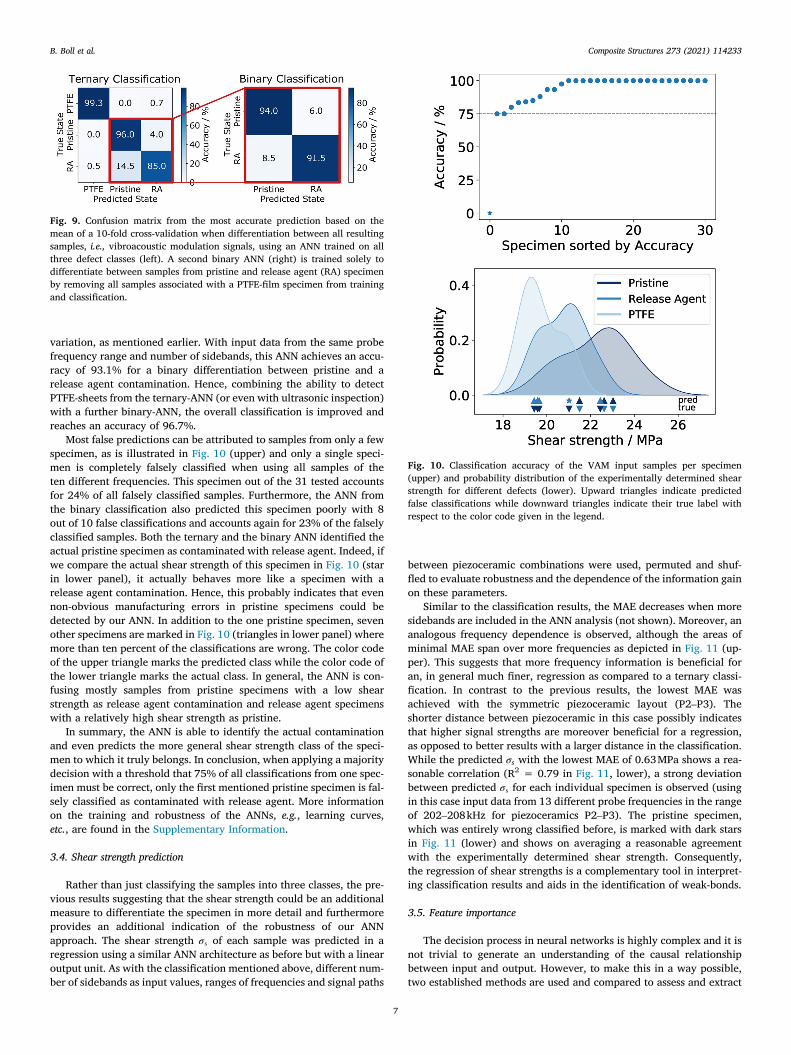
Fig. 9. Confusion matrix from the most accurate prediction based on themean of a 10-fold cross-validation when differentiation between all resultingsamples, i.e., vibroacoustic modulation signals, using an ANN trained on allthree defect classes (left). A second binary ANN (right) is trained solely todifferentiate between samples from pristine and release agent (RA) specimenby removing all samples associated with a PTFE-film specimen from trainingand classification.
Fig. 10. Classification accuracy of the VAM input samples per specimen(upper) and probability distribution of the experimentally determined shearstrength for different defects (lower). Upward triangles indicate predictedfalse classifications while downward triangles indicate their true label withrespect to the color code given in the legend.
B. Boll et al. Composite Structures 273 (2021) 114233
variation, as mentioned earlier. With input data from the same probefrequency range and number of sidebands, this ANN achieves an accu-racy of 93.1% for a binary differentiation between pristine and arelease agent contamination. Hence, combining the ability to detectPTFE‐sheets from the ternary‐ANN (or even with ultrasonic inspection)with a further binary‐ANN, the overall classification is improved andreaches an accuracy of 96.7%.
Most false predictions can be attributed to samples from only a fewspecimen, as is illustrated in Fig. 10 (upper) and only a single speci-men is completely falsely classified when using all samples of theten different frequencies. This specimen out of the 31 tested accountsfor 24% of all falsely classified samples. Furthermore, the ANN fromthe binary classification also predicted this specimen poorly with 8out of 10 false classifications and accounts again for 23% of the falselyclassified samples. Both the ternary and the binary ANN identified theactual pristine specimen as contaminated with release agent. Indeed, ifwe compare the actual shear strength of this specimen in Fig. 10 (starin lower panel), it actually behaves more like a specimen with arelease agent contamination. Hence, this probably indicates that evennon‐obvious manufacturing errors in pristine specimens could bedetected by our ANN. In addition to the one pristine specimen, sevenother specimens are marked in Fig. 10 (triangles in lower panel) wheremore than ten percent of the classifications are wrong. The color codeof the upper triangle marks the predicted class while the color code ofthe lower triangle marks the actual class. In general, the ANN is con-fusing mostly samples from pristine specimens with a low shearstrength as release agent contamination and release agent specimenswith a relatively high shear strength as pristine.
In summary, the ANN is able to identify the actual contaminationand even predicts the more general shear strength class of the speci-men to which it truly belongs. In conclusion, when applying a majoritydecision with a threshold that 75% of all classifications from one spec-imen must be correct, only the first mentioned pristine specimen is fal-sely classified as contaminated with release agent. More informationon the training and robustness of the ANNs, e.g., learning curves,etc., are found in the Supplementary Information.
3.4. Shear strength prediction
Rather than just classifying the samples into three classes, the pre-vious results suggesting that the shear strength could be an additionalmeasure to differentiate the specimen in more detail and furthermoreprovides an additional indication of the robustness of our ANNapproach. The shear strength σs of each sample was predicted in aregression using a similar ANN architecture as before but with a linearoutput unit. As with the classification mentioned above, different num-ber of sidebands as input values, ranges of frequencies and signal paths
7
between piezoceramic combinations were used, permuted and shuf-fled to evaluate robustness and the dependence of the information gainon these parameters.
Similar to the classification results, the MAE decreases when moresidebands are included in the ANN analysis (not shown). Moreover, ananalogous frequency dependence is observed, although the areas ofminimal MAE span over more frequencies as depicted in Fig. 11 (up-per). This suggests that more frequency information is beneficial foran, in general much finer, regression as compared to a ternary classi-fication. In contrast to the previous results, the lowest MAE wasachieved with the symmetric piezoceramic layout (P2–P3). Theshorter distance between piezoceramic in this case possibly indicatesthat higher signal strengths are moreover beneficial for a regression,as opposed to better results with a larger distance in the classification.While the predicted σs with the lowest MAE of 0.63MPa shows a rea-sonable correlation (R2 = 0.79 in Fig. 11, lower), a strong deviationbetween predicted σs for each individual specimen is observed (usingin this case input data from 13 different probe frequencies in the rangeof 202–208kHz for piezoceramics P2–P3). The pristine specimen,which was entirely wrong classified before, is marked with dark starsin Fig. 11 (lower) and shows on averaging a reasonable agreementwith the experimentally determined shear strength. Consequently,the regression of shear strengths is a complementary tool in interpret-ing classification results and aids in the identification of weak‐bonds.
3.5. Feature importance
The decision process in neural networks is highly complex and it isnot trivial to generate an understanding of the causal relationshipbetween input and output. However, to make this in a way possible,two established methods are used and compared to assess and extract
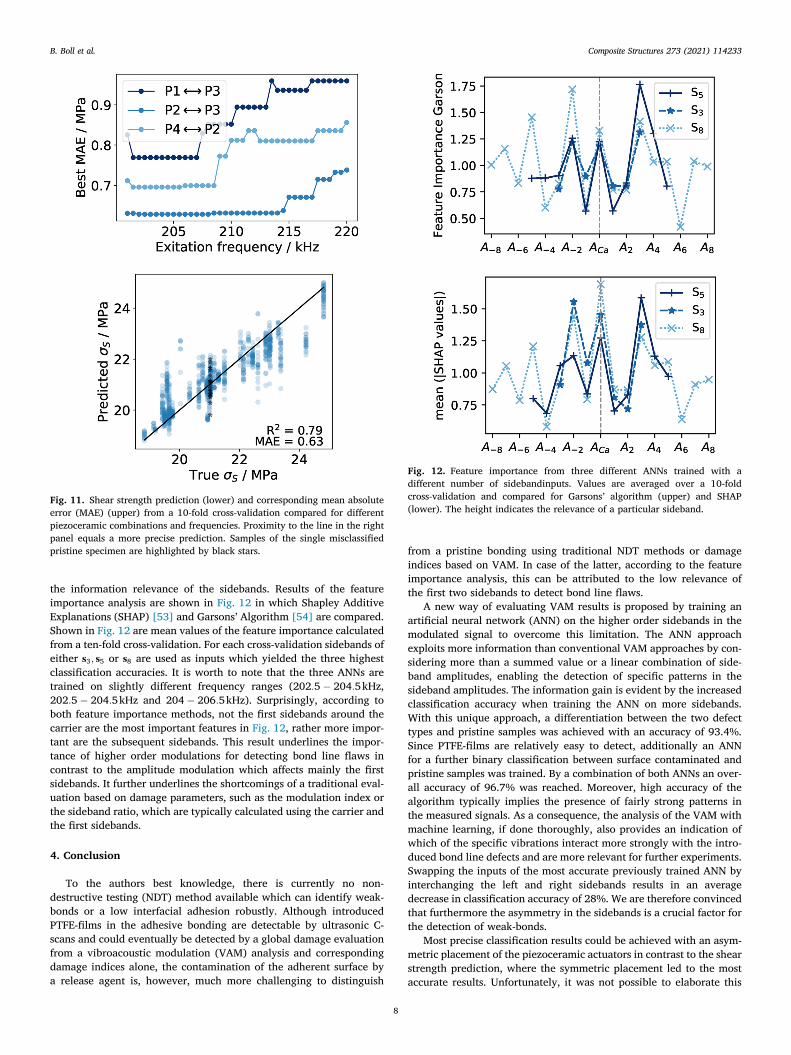
Fig. 11. Shear strength prediction (lower) and corresponding mean absoluteerror (MAE) (upper) from a 10-fold cross-validation compared for differentpiezoceramic combinations and frequencies. Proximity to the line in the rightpanel equals a more precise prediction. Samples of the single misclassifiedpristine specimen are highlighted by black stars.
Fig. 12. Feature importance from three different ANNs trained with adifferent number of sidebandinputs. Values are averaged over a 10-foldcross-validation and compared for Garsons’ algorithm (upper) and SHAP(lower). The height indicates the relevance of a particular sideband.
B. Boll et al. Composite Structures 273 (2021) 114233
the information relevance of the sidebands. Results of the featureimportance analysis are shown in Fig. 12 in which Shapley AdditiveExplanations (SHAP) [53] and Garsons’ Algorithm [54] are compared.Shown in Fig. 12 are mean values of the feature importance calculatedfrom a ten‐fold cross‐validation. For each cross‐validation sidebands ofeither s3; s5 or s8 are used as inputs which yielded the three highestclassification accuracies. It is worth to note that the three ANNs aretrained on slightly different frequency ranges (202:5� 204:5kHz,202:5� 204:5kHz and 204� 206:5kHz). Surprisingly, according toboth feature importance methods, not the first sidebands around thecarrier are the most important features in Fig. 12, rather more impor-tant are the subsequent sidebands. This result underlines the impor-tance of higher order modulations for detecting bond line flaws incontrast to the amplitude modulation which affects mainly the firstsidebands. It further underlines the shortcomings of a traditional eval-uation based on damage parameters, such as the modulation index orthe sideband ratio, which are typically calculated using the carrier andthe first sidebands.
4. Conclusion
To the authors best knowledge, there is currently no non‐destructive testing (NDT) method available which can identify weak‐bonds or a low interfacial adhesion robustly. Although introducedPTFE‐films in the adhesive bonding are detectable by ultrasonic C‐scans and could eventually be detected by a global damage evaluationfrom a vibroacoustic modulation (VAM) analysis and correspondingdamage indices alone, the contamination of the adherent surface bya release agent is, however, much more challenging to distinguish
8
from a pristine bonding using traditional NDT methods or damageindices based on VAM. In case of the latter, according to the featureimportance analysis, this can be attributed to the low relevance ofthe first two sidebands to detect bond line flaws.
A new way of evaluating VAM results is proposed by training anartificial neural network (ANN) on the higher order sidebands in themodulated signal to overcome this limitation. The ANN approachexploits more information than conventional VAM approaches by con-sidering more than a summed value or a linear combination of side-band amplitudes, enabling the detection of specific patterns in thesideband amplitudes. The information gain is evident by the increasedclassification accuracy when training the ANN on more sidebands.With this unique approach, a differentiation between the two defecttypes and pristine samples was achieved with an accuracy of 93.4%.Since PTFE‐films are relatively easy to detect, additionally an ANNfor a further binary classification between surface contaminated andpristine samples was trained. By a combination of both ANNs an over-all accuracy of 96.7% was reached. Moreover, high accuracy of thealgorithm typically implies the presence of fairly strong patterns inthe measured signals. As a consequence, the analysis of the VAM withmachine learning, if done thoroughly, also provides an indication ofwhich of the specific vibrations interact more strongly with the intro-duced bond line defects and are more relevant for further experiments.Swapping the inputs of the most accurate previously trained ANN byinterchanging the left and right sidebands results in an averagedecrease in classification accuracy of 28%. We are therefore convincedthat furthermore the asymmetry in the sidebands is a crucial factor forthe detection of weak‐bonds.
Most precise classification results could be achieved with an asym-metric placement of the piezoceramic actuators in contrast to the shearstrength prediction, where the symmetric placement led to the mostaccurate results. Unfortunately, it was not possible to elaborate this

B. Boll et al. Composite Structures 273 (2021) 114233
further in this work due to the destructive testing of the specimen.Thus, an assessment of whether symmetrical or asymmetrical place-ment, or generally the distance to the bond (or even the different prox-imity to the clamping points) are relevant factors, are a good startingpoint for follow‐up work and will be investigated in the future. More-over, instead of focusing on the importance of individual sidebands,possible correlations between several sidebands will be examined inmore detail.
Although the prediction of the shear strength varies strongly fordifferent frequencies, which is mostly associated with our rather smalltraining set for this regression purpose (cf. learning curves in the SI), itshows promising capabilities for bonded structures. Due to the natureof Lamb‐waves, it would be interesting to investigate if a similar accu-racy is achievable for adhesively bonded joints which are not in theload path, like stringers or other stiffening elements.
In summary, combining the vibroacoustic measurements with amachine learning approach as presented in this work shows promisingcapabilities for the detection of bond line defects. This study confirmsthat nonlinear modulations of ultrasonic waves can detect damages oradhesive properties in the interface between adhesive and substratealthough the wavelength is in the cm‐range and hence much largerthan the adhesive layer thickness [19]. This is probably associatedwith the wavelength (and obviously the wave characteristics) ofLamb‐waves, being in the range of the defect cross‐section, combinedwith the increased sensitivity due to the cyclic stress change in thebond due to the high‐strain pump frequency. It is expected that largercontaminated areas would increase the nonlinear amplitudes of thesignal and ultimately improve the ANN accuracy, while contamina-tions smaller than the Lamb wavelength might be more challengingto detect. Nevertheless, we are optimistic about identifying even smal-ler defects with the same setup, since microcracks could be success-fully detected with VAM, despite the fact that those are muchsmaller than the Lamb wavelengths as shown in Ref. [27].
Worth to mention is that this supervised ANN approach is well sui-ted for analysing similar specimens, e.g., in mass production, once it istrained carefully. However, differences in specimen design, manufac-turing process, or application in unique civil structures may make itnecessary to train individual networks for each application or wouldrequire an even more sophisticated machine learning approach.
Funding
All authors thanks the Hamburg University of Technology for fund-ing the I3‐Lab VAM.
Author contributions
BB: Design and execution of the experiments, analysis of results,writing of the draft; EW&BF: Help with development of the experi-ments, editing and reviewing of the draft; RM: Developing the concept,discussion of results, editing and reviewing of the draft. All authors redand approved the final manuscript.
Data availability
All data is stored on a secure server at the Institute of Polymer andComposites, Hamburg University of Technology. The raw data, thepython codes for processing and the processed data required to repro-duce these findings are available from the corresponding author onreasonable request.
Declaration of Competing Interest
The authors declare that they have no known competing financialinterests or personal relationships that could have appeared to influ-ence the work reported in this paper.
9
Acknowledgements
The authors would like to thank Philipp Depperschmidt for the sup-port with specimen manufacturing and preparation.
Appendix A. Supplementary data
Supplementary data associated with this article can be found, in theonline version, at https://doi.org/10.1016/j.compstruct.2021.114233.
References
[1] Schürmann H. Konstruieren mit Faser-Kunststoff-Verbunden. VDI-Buch, Springer-Verlag, Berlin Heidelberg; Berlin, Heidelberg 2007. https://doi.org/10.1007/978-3-540-72190-1.
[2] Breuer UP. Commercial Aircraft Composite Technology. Springer InternationalPublishing 2016. https://doi.org/10.1007/978-3-319-31918-6.
[3] Ehrhart B, Valeske B, Muller C, Bockenheimer C. Methods for the QualityAssessment of Adhesive Bonded CFRP Structures - A Resumé. AIP Conf. Proc.2010;44:1–8. https://doi.org/10.1109/TUFFC.924.
[4] Brotherhood CJ, Drinkwater BW, Dixon S. The detectability of kissing bonds inadhesive joints using ultrasonic techniques. Ultrasonics 2003;41:521–9. https://doi.org/10.1016/S0041-624X(03)00156-2.
[5] Schmid Fuertes TA, Kruse T, Körwien T, Geistbeck M. Bonding of CFRP primaryaerospace structures - Discussion of the certification boundary conditions andrelated technology fields addressing the needs for development. Compos Interfaces2015;22:795–808. https://doi.org/10.1080/09276440.2015.1077048.
[6] Heilmann L. Qualitätskontrolle von Reparaturklebungen anFaserverbundstrukturen durch vollflächige Festigkeitsprüfung, Dissertation,Fakultät für. Maschinenbau der Technischen Universität Carolo-Wilhelmina zuBraunschweig; 2020.
[7] Jairaja R, Naik GN. Weak bond effects in adhesively bonded joints between thedissimilar adherends. J Adhes 2019:1–23. https://doi.org/10.1080/00218464.2019.1702027.
[8] Ren B, Lissenden C. Ultrasonic guided wave inspection of adhesive bonds betweencomposite laminates. Int J Adhes Adhes 2013;45:59–68. https://doi.org/10.1016/j.ijadhadh.2013.04.001.
[9] Heidarpour F, Farahani M, Ghabezi P. Experimental investigation of the effects ofadhesive defects on the single lap joint strength. Int J Adhes Adhes2018;80:128–32. https://doi.org/10.1016/j.ijadhadh.2017.08.005.
[10] Wang P, Li Z, Zhou L, Pei Y. Microwave nondestructive detection and quantitativeevaluation of kissing defects in GFRP laminates. Compos Sci Technol2018;162:117–22. https://doi.org/10.1016/j.compscitech.2018.04.029.
[11] Wood M, Charlton P, Yan D. Ultrasonic evaluation of artificial kissing bonds inCFRP composites. e-J Nondestructive Testing 2014;19:1–10.
[12] Yilmaz Elena B. Advanced ultrasonic ndt for weak bond detection in composite-adhesive bonded structures. Int J Adhes Adhes 2020;102:. https://doi.org/10.1016/j.ijadhadh.2020.102675102675.
[13] Chen BY, Soh SK, Lee HP, Tay TE, Tan VB. A vibro-acoustic modulation method forthe detection of delamination and kissing bond in composites. J. Compos. Mater.2016;50:3089–104. https://doi.org/10.1177/0021998315615652.
[14] Ehrhart B, Ecault R, Touchard F, Boustie M, Berthe L, Bockenheimer C, Valeske B.Development of a laser shock adhesion test for the assessment of weak adhesivebonded cfrp structures. Int J Adhes Adhes 2014;52:57–65. https://doi.org/10.1016/j.ijadhadh.2014.04.002.
[15] Nagy PB. Ultrasonic classification of imperfect interfaces. J Nondestr Eval1992;11:127–39. https://doi.org/10.1007/BF00566404.
[16] Jeenjitkaew C, Luklinska Z, Guild F. Morphology and surface chemistry of kissingbonds in adhesive joints produced by surface contamination. Int J Adhes Adhes2010;30:643–53. https://doi.org/10.1016/j.ijadhadh.2010.06.005.
[17] Harder S, Röper F, Gibhardt D, Koert B, Fiedler B. Strength of scarf-bonded cfrprepairs containing disc-shaped zones of weak bonding considering hot-wetconditioning. Int J Adhes Adhes 2020:. https://doi.org/10.1016/j.ijadhadh.2020.102643102643.
[18] Singhal T, Kim E, Kim T-Y, Yang J. Weak bond detection in composites usinghighly nonlinear solitary waves. Smart Mater Struct 2017;26:. https://doi.org/10.1088/1361-665X/aa6823055011.
[19] Yan D, Drinkwater BW, Neild SA. Measurement of the ultrasonic nonlinearity ofkissing bonds in adhesive joints. NDT E Int 2009;42:459–66. https://doi.org/10.1016/j.ndteint.2009.02.002.
[20] Gauthier C, Ech-Cherif El-Kettani M, Galy J, Predoi M, Leduc D. Structuraladhesive bonding characterization using guided lamb waves and the verticalmodes. Int J Adhes Adhes 2020;98:. https://doi.org/10.1016/j.ijadhadh.2019.102467102467.
[21] Spytek J, Ziaja-Sujdak A, Dziedziech K, Pieczonka L, Pelivanov I, Ambrozinski L.Evaluation of disbonds at various interfaces of adhesively bonded aluminum platesusing all-optical excitation and detection of zero-group velocity lamb waves. NDT& E Int 2020;112:. https://doi.org/10.1016/j.ndteint.2020.102249102249.
[22] Ecault R, Touchard F, Berthe L, Boustie M. Laser shock adhesion test numericaloptimization for composite bonding assessment. Compos Struct 2020;247:.https://doi.org/10.1016/j.compstruct.2020.112441112441.
B. Boll et al. Composite Structures 273 (2021) 114233
[23] Vijaya Kumar R, Bhat M, Murthy C. Evaluation of kissing bond in compositeadhesive lap joints using digital image correlation: Preliminary studies. Int J AdhesAdhes 2013;42:60–8. https://doi.org/10.1016/j.ijadhadh.2013.01.004.
[24] U.S. Department of Transportation. Federal Aviation Administration, FederalAviation Administration, Advisory Circular Advisory Circular, Aviation 1 (2012)1–2. doi: 10.1177/004728757301200242..
[25] Donskoy DM, Sutin A, Ekimov A. Nonlinear acoustic interaction on contactinterfaces and its use for nondestructive testing. NDT & E Int 2001;34:231–8.https://doi.org/10.1016/S0963-8695(00)00063-3.
[26] A.M. Sutin, D.M. Donskoy, Vibro-acoustic modulation nondestructive evaluationtechnique, in: Nondestructive Evaluation of Aging Aircraft, Airports, andAerospace Hardware II, volume 3397, 1998, pp. 226–237. doi: 10.1117/12.305057..
[27] Zagrai A, Donskoy D, Chudnovsky A, Golovin E. Micro- and macroscale damagedetection using the nonlinear acoustic vibro-modulation technique. Res NondestrEval 2008;19:104–28. https://doi.org/10.1080/09349840801931817.
[28] Klepka A, Staszewski WJ, Jenal RB, Szwedo M, Iwaniec J, Uhl T. Nonlinearacoustics for fatigue crack detection - experimental investigations of vibro-acousticwave modulations. Structural Health Monitoring 2012;11:197–211. https://doi.org/10.1177/1475921711414236.
[29] Lim HJ, Sohn H. Necessary conditions for nonlinear ultrasonic modulationgeneration given a localized fatigue crack in a plate-like structure. Materials2017;10. https://doi.org/10.3390/ma10030248.
[30] Donskoy DM, Ramezani M. Separation of amplitude and frequency modulations invibro-acoustic modulation nondestructive testing method. Proc Meetings Acoust2018;34. https://doi.org/10.1121/2.0000831.
[31] Ramezani M, Stevens E. Institute of Technology. Department of Civil, O.Engineering, Enhancement of Joining Method and Damage DetectionMethodology in Structural Materials. Stevens Institute of Technology 2018.
[32] Lim HJ, Sohn H, Kim Y. Data-driven fatigue crack quantification and prognosisusing nonlinear ultrasonic modulation. Mech Syst Signal Process2018;109:185–95. https://doi.org/10.1016/j.ymssp.2018.03.003.
[33] L. Dorendorf, N. Lalkovski, R. Stolz, M. Rutner, Zuverlässigkeit der Vibro-Akustischen Modulationsmethode zur Strukturüberwachung von Metallen unterErmüdungsbeanspruchung und ihr Potenzial für das Bauwesen, in: 22. DASt-Forschungskolloquium, Karlsruhe, Deutschland, 2020, pp. 135–139..
[34] Klepka A, Pieczonka L, Staszewski WJ, Aymerich F. Impact damage detection inlaminated composites by non-linear vibro-acoustic wave modulations. ComposPart B: Eng 2014;65:99–108. https://doi.org/10.1016/j.compositesb.2013.11.003.
[35] Pieczonka L, Ukowski P, Klepka A, Staszewski WJ, Uhl T, Aymerich F. Impactdamage detection in light composite sandwich panels using piezo-based nonlinearvibro-acoustic modulations. Smart Mater Struct 2014;23. https://doi.org/10.1088/0964-1726/23/10/105021.
[36] Aymerich F, Staszewski WJ. Experimental study of impact-damage detection incomposite laminates using a cross-modulation vibro-acoustic technique. StructHealth Monit 2010;9:541–53. https://doi.org/10.1177/1475921710365433.
[37] Pieczonka L, Klepka A, Martowicz A, Staszewski WJ. Nonlinear vibroacoustic wavemodulations for structural damage detection: an overview. Opt Eng 2015;55:.https://doi.org/10.1117/1.oe.55.1.011005011005.
[38] Lu Y, Ye L, Su Z, Zhou L, Cheng L. Artificial Neural Network (ANN)-based crackidentification in aluminum plates with lamb wave signals. J Intell Mater SystStruct 2009;20:39–49. https://doi.org/10.1177/1045389X07088782.
10
[39] De Fenza A, Sorrentino A, Vitiello P. Application of Artificial Neural Networks andProbability Ellipse methods for damage detection using Lamb waves. ComposStruct 2015;133:390–403. https://doi.org/10.1016/j.compstruct.2015.07.089.
[40] V. Ewald, R.M. Groves, R. Benedictus, DeepSHM: a deep learning approach forstructural health monitoring based on guided Lamb wave technique, in: Sensorsand Smart Structures Technologies for Civil, Mechanical, and Aerospace Systems2019, volume 10970, SPIE, 2019, pp. 84–99. doi: 10.1117/12.2506794..
[41] Tabian I, Fu H, Khodaei ZS. A Convolutional Neural Network for Impact Detectionand Characterization of Complex Composite Structures. Sensors (Basel,Switzerland) 2019;19:1–25. https://doi.org/10.3390/s19224933.
[42] Hu HF, Staszewski WJ, Hu NQ, Jenal RB, Qin GJ. Crack detection using nonlinearacoustics and piezoceramic transducers—instantaneous amplitude and frequencyanalysis. Smart Mater Struct 2010;19:. https://doi.org/10.1088/0964-1726/19/6/065017065017.
[43] ASTM D5868-01(2014), Standard Test Method for Lap Shear Adhesion for FiberReinforced Plastic (FRP) Bonding, ASTM International, West Conshohocken, PA(2014). doi: 10.1520/D5868-01R14..
[44] P. Oppermann, L. Dorendorf, B. Boll, A. Gagani, N. Lalkovski, C. Renner, M.Rutner, R. Meißner, B. Fiedler, Towards structural health monitoring using vibro-acoustic modulation in the real world, in: 18. GI/ITG KuVS FachGesprächSensorNetze, FGSN 19–20.9. 2019, Magdeburg, 2019, pp. 21–24..
[45] Oppermann P, Dorendorf L, Rutner M, Renner C. Nonlinear modulation with low-power sensor networks using undersampling. Struct Health Monit 2021. https://doi.org/10.1177/1475921720982885. 147592172098288.
[46] Kundu T. Nonlinear ultrasonic and vibro-acoustical techniques for nondestructiveevaluation. Springer 2018. https://doi.org/10.1007/978-3-319-94476-0.
[47] Kim S, Adams DE, Sohn H, Rodriguez-Rivera G, Myrent N, Bond R, Vitek J, Carr S,Grama A, Meyer JJ. Crack detection technique for operating wind turbine bladesusing vibro-acoustic modulation. Struct Health Monit 2014;13:660–70. https://doi.org/10.1177/1475921714553732.
[48] F. Chollet, et al., Keras, 2015..[49] Developers TensorFlow. Tensorflow 2021. https://doi.org/10.5281/
zenodo.4758419.[50] Bergstra J, Bengio Y. Random search for hyper-parameter optimization. J Mach
Learn Res 2012;13:281–305.[51] D.P. Kingma, J.L. Ba, Adam: A method for stochastic optimization, 3rd
International Conference on Learning Representations, ICLR 2015 - ConferenceTrack Proceedings (2015) 1–15. arXiv:1412.6980..
[52] Bishop CM. Pattern Recognition and Machine Learning (Information Science andStatistics). Springer; 2006.
[53] Lundberg SM, Lee S-I. A unified approach to interpreting model predictions. In:Guyon I, Luxburg UV, Bengio S, Wallach H, Fergus R, Vishwanathan S, Garnett R,editors. Advances in Neural Information Processing Systems 30. Curran AssociatesInc; 2017. p. 4765–74.
[54] Garson GD. Interpreting neural-network connection weights. AI Expert1991;6:46–51.
[55] Fischer A. Garson’s method trumps Olden’s method in every case - How todetermine relative importance of input-variables in nonlinear regression withartificial neural networks. Ecol Model 2015;309–310:60–3. https://doi.org/10.1016/j.ecolmodel.2015.04.015.