Non-ENSO interannual rainfall variability in central Chile during austral winter
Upload
independentCategory
view
0download
0
October 1989 K. Hanawa, Y. Yoshikawa and T. Watanabe 833
Composite Analyses of Wintertime Wind Stress Vector Fields
with Respect to SST Anomalies in the Western North Pacific
and the ENSO Events
Part II. ENSO Composite
By Kimio Hanawa, Yasushi Yoshikawa and Tomowo Watanabe
Department of Geophysics, Faculty of Science, Tohoku University, Aoba-ku, Sendai 980, Japan
(Manuscript received 10 April 1989, in revised form 26 July 1989)
Abstract
Following the previous paper (Part I, Hanawa et al., 1989), long-term wind stress vector (WSV) fields over the North Pacific are analyzed by means of the composite method with respect to the
ENSO events (ENSO composite). As made in Hanawa et al. (1988), every winter during the 24 years from 1961 to 1984 was classified into one of four categorized winters, i.e., ENSO-1 year, ENSO year, ENSO+1 year and the other year winters.
Among four categorized winters, WSV anomaly fields for the ENSO year winter are relatively well- organized and those in the mid-latitudes of the western North pacific and in low-latitudes are quite similar to those for the warm winter of Part I. That is, the East Asian Winter Monsoon (Kisetsuhu)
weakens and in the equatorial region, WSV anomaly fields suggest that the central to eastern Pacific is the strengthened convergence region of wind, i.e., convection region. The weakening of the East Asian
Monsoon is responsible for the appearance of remarkably positive SST anomalies in the mid-latitudes of western North Pacific in the ENSO year winter described by Hanawa et al. (1988). However,
although the mid-latitudes westerly shifts northward, it strengthens compared with the other three categorized winters and the warm winter of Part I.
Composited sea-level pressure fields show the marked strengthening and eastward shift of the Aleu- tian Low, and positive and negative anomalies over the North Pacific appear in mid- and high-latitudes
respectively, which is responsible for the strengthening of the mid-latitudes westerly. For the other three categorized winters except for the ENSO year winter, the stabilities of WSV
anomalies are low, and the time series of scores of Degree of similarity introduced in Part I do not show that the composited WSV anomalies are typical for each categorized winter. That is, characteristic
basin-scale WSV anomaly patterns could not be extracted using the present viewpoint. Therefore, it can be concluded that although ENSO events have remarkable effect on the atmospheric general
circulation in the ENSO year winter, they are not necessarily good sampling conditions for the ex- traction of the characteristic pattern of mid- and high-latitude wintertime WSV fields over the North
Pacific, at least in the frame of the present study.
1. Introduction
In the previous paper (Part I, Hanawa et al., 1989), the wind stress vector (WSV) fields over the North Pacific were analyzed for two categorized win-ters based on sea-surface temperature (SST) anoma-lies in the mid-latitudes of the western North Pa-cific : warm winter (WW) and cold winter (CW). It was shown that in a WW (CW), the mid-latitudes westerly shifts northward (southward) and weakens (strengthens). As a result, in a WW (CW), the East Asian Winter Monsoon (Kise1suhu) weakens
C 1989, Meteorological Society of Japan
(strengthens), and it was concluded that this change is responsible for the appearance of SST anomalies in the mid-latitudes of the western North Pacific. In the present paper, following Part I, the compos-ite analysis with respect to the ENSO events is per-formed (ENSO composite).
In the present study, attention will be also fo-cused on WSV fields of the mid- and high-latitudes. That is, our purpose is to clarify whether or not characteristic WSV fields appear in each categorized winter, classified by the phase of the ENSO events, which may be responsible for the characteristic ap-pearance of SST anomalies as described by Hanawa
834 Journal of the Meteorological Society of Japan Vol. 67, No. 5
Fig. 1. Composited SST anomaly fields normalized by the standard deviation at each grid point for four categorized winters: ENSO-1 (EB) winter, ENSO (EY) winter, ENSO+1 (EA) winter and the other
year winter (EO) winter. The contour intervals are 0.25. These were cited from Hanawa et al. (1988).
et al. (1988, henceforth abbreviated to HWIST). In other words, as stated in the Introduction of Part I, this work is devoted to the extraction of the char-acteristic pattern of wintertime WSV fields over the North Pacific relating to the ENSO events.
The WSV data used are the same as in Part I, i. e.,those prepared by Kutsuwada and Teramoto (1987). Analytical procedures and tools are also the same as in the previous study. For this ENSO compos-ite, as made in HWIST, every winter during the 24 years from 1961 to 1984 is classified into one of four categorized winters : ENSO-1 year (in this paper, abbreviated as EB for neatness), ENSO year (EY), ENSO+1 year (EA) and the other year (EO) win-ters. "Winter" is defined as the months from Decem-
ber of the previous year to February for WSV and
sea level pressure fields, and January to March for
SST fields. EY winters are selected as those of 1964, 1966, 1970, 1973, 1977 and 1983. The numbers of
the four categorized winters are six for the EB, EY,
and EA winters and seven for the EO winters. The
winter of 1965 is regarded as an EA winter as well
as an EB winter. Figure 1 shows the composite SST
anomaly fields normalized by the standard deviation at each grid point for the four categorized winters, which was cited from HWIST. Mean SST anomalies for the area in the mid-latitudes of western North Pacific (20* to 32*N, 125*E to 160*E, see Fig. 2a of Part I) are -0.05, 0.32, -0.13 and -0.07* for EB, EY, EA and EO winters, respectively. The positive SST anomaly in the EY winter is remarkable, and among the other three categorized winters a nega-tive anomaly in EA winter is notable.
The remainder of this paper is organized as fol-lows: in Section 2, composited WSV fields and their anomaly fields for the four categorized winters are presented, and scores of Degree of similarity for them are discussed. In Section 3, results of com-posited sea level pressure fields are described, while Section 4 gives a conclusion and discussions.
2. Results of the ENSO composite
2.1 Composited WSV fields and thezr anomaly fields for the four categorized winters
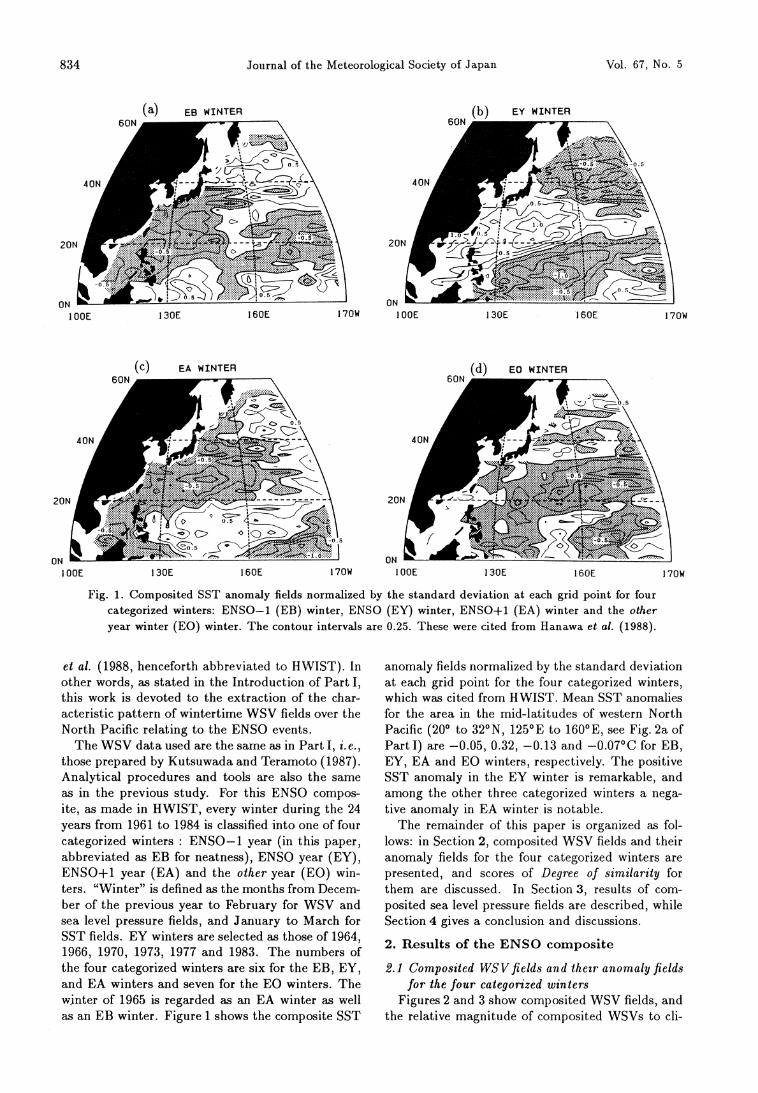
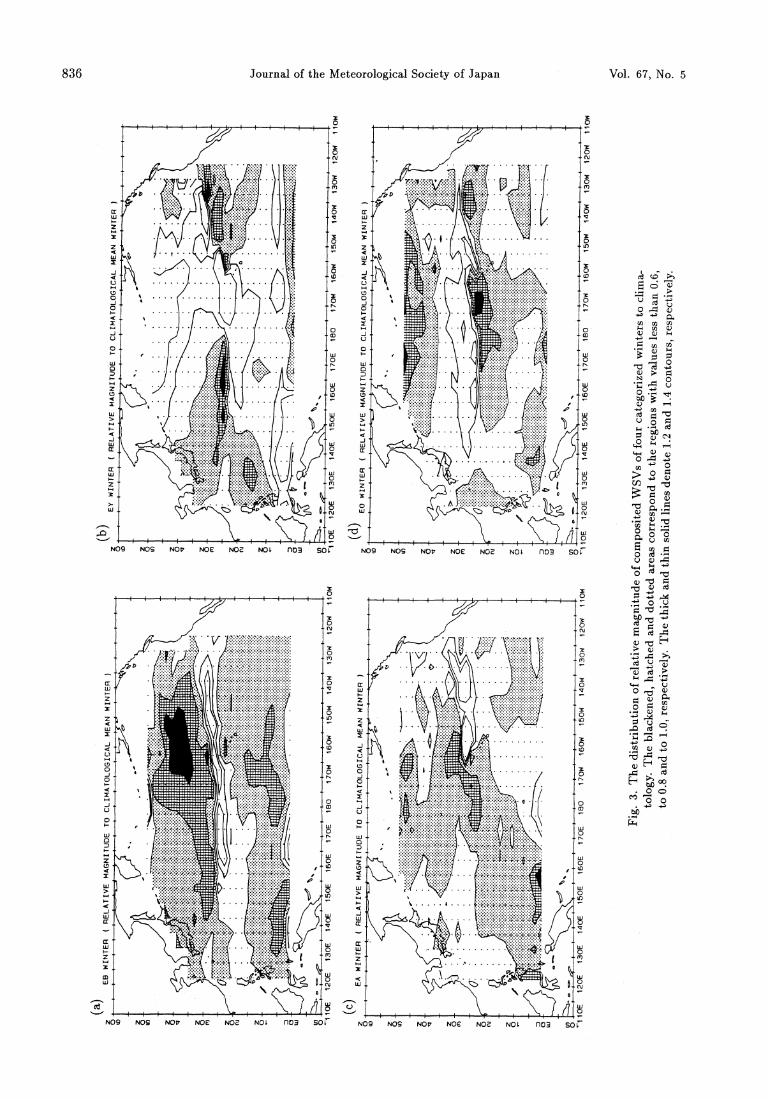
Figures 2 and 3 show composited WSV fields, and the relative magnitude of composited WSVs to cli-
October 1989 K. Hanawa, Y. Yoshikawa and T. Watanabe 835
836 Journal of the Meteorological Society of Japan Vol. 67, No. 5
October 1989 K. Hanawa, Y. Yoshikawa and T. Watanabe 837
838 Journal of the Meteorological Society of Japan Vol. 67, No. 5
October 1989 K. Hanawa, Y. Yoshikawa and T. Watanabe 839
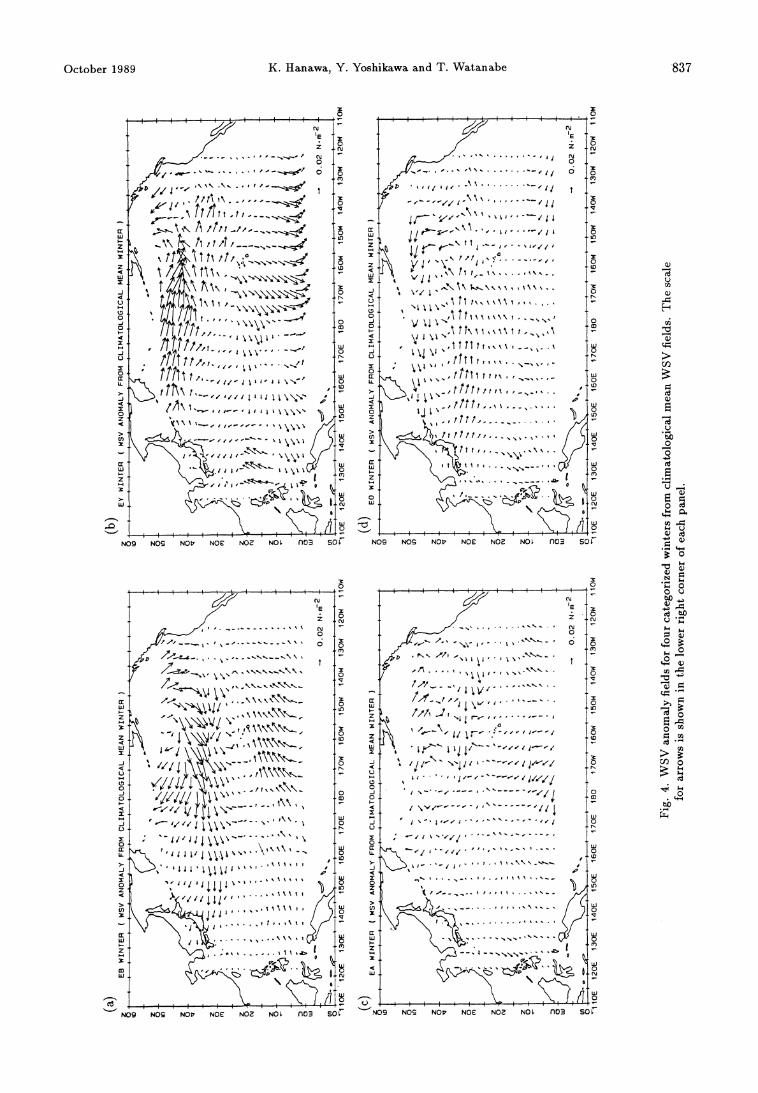
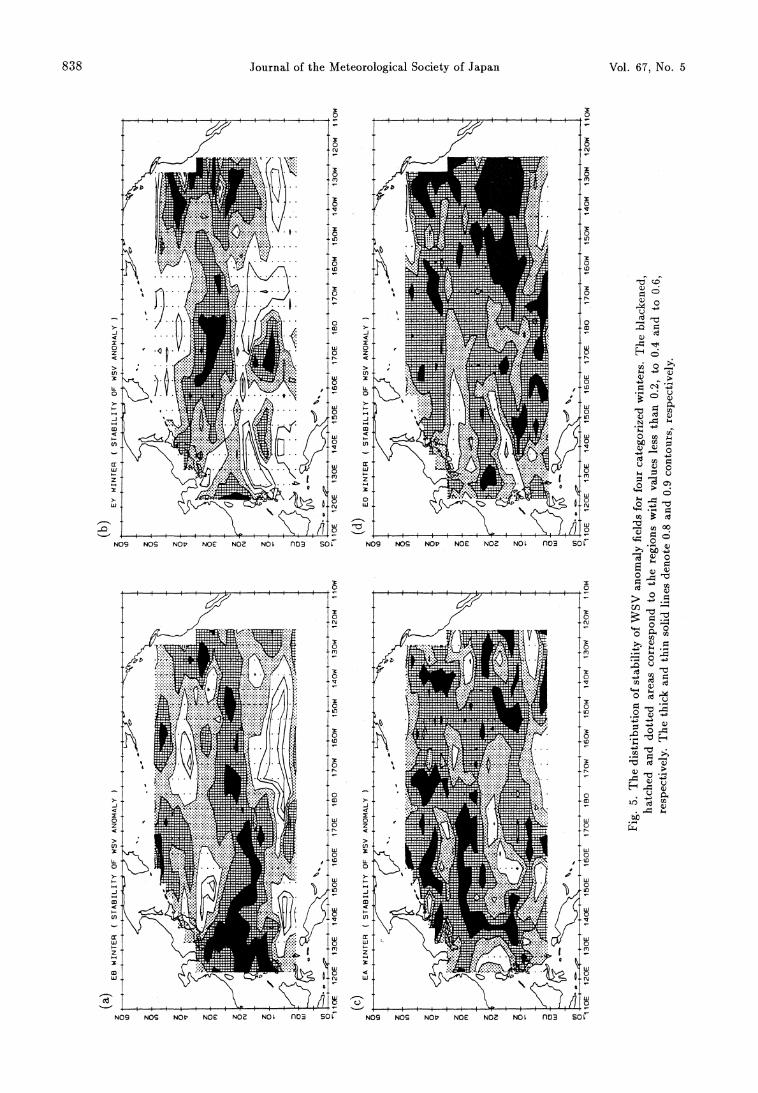
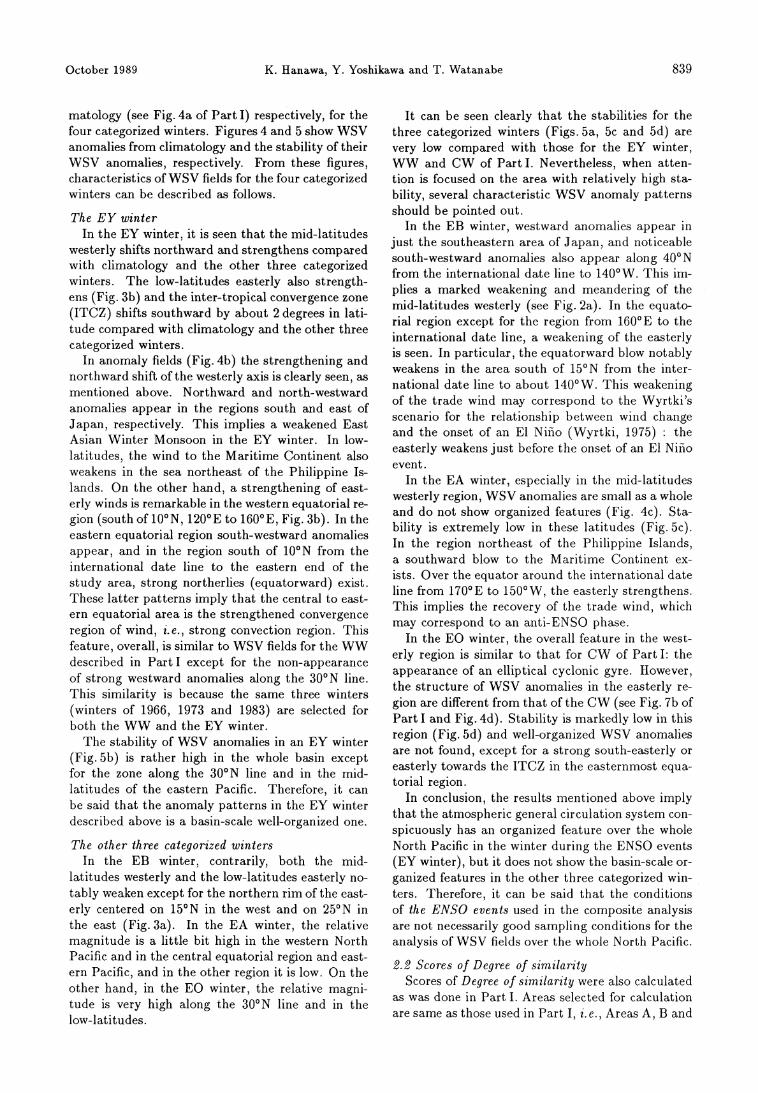
matology (see Fig. 4a of Part I) respectively, for the four categorized winters. Figures 4 and 5 show WSV anomalies from climatology and the stability of their WSV anomalies, respectively. From these figures, characteristics of WSV fields for the four categorized winters can be described as follows.
The EY winter In the EY winter, it is seen that the mid-latitudes
westerly shifts northward and strengthens compared with climatology and the other three categorized winters. The low-latitudes easterly also strength-ens (Fig. 3b) and the inter-tropical convergence zone (ITCZ) shifts southward by about 2 degrees in lati-tude compared with climatology and the other three categorized winters.
In anomaly fields (Fig. 4b) the strengthening and northward shift of the westerly axis is clearly seen, as mentioned above. Northward and north-westward anomalies appear in the regions south and east of Japan, respectively. This implies a weakened East Asian Winter Monsoon in the EY winter. In low-latitudes, the wind to the Maritime Continent also weakens in the sea northeast of the Philippine Is-lands. On the other hand, a strengthening of east-erly winds is remarkable in the western equatorial re-gion (south of 10*N,120*E to 160*E, Fig. 3b). In the eastern equatorial region south-westward anomalies appear, and in the region south of 10*N from the international date line to the eastern end of the study area, strong northerlies (equatorward) exist. These latter patterns imply that the central to east-ern equatorial area is the strengthened convergence region of wind, i, e., strong convection region. This feature, overall, is similar to WSV fields for the WW described in Part I except for the non-appearance of strong westward anomalies along the 30*N line. This similarity is because the same three winters (winters of 1966, 1973 and 1983) are selected for both the WW and the EY winter.
The stability of WSV anomalies in an EY winter (Fig. 5b) is rather high in the whole basin except for the zone along the 30*N line and in the mid-latitudes of the eastern Pacific. Therefore, it can be said that the anomaly patterns in the EY winter described above is a basin-scale well-organized one.
The other three categorized winters In the EB winter, contrarily, both the mid-
latitudes westerly and the low-latitudes easterly no-tably weaken except for the northern rim of the east-erly centered on 15*N in the west and on 25*N in the east (Fig. 3a). In the EA winter, the relative magnitude is a little bit high in the western North Pacific and in the central equatorial region and east-ern Pacific, and in the other region it is low. On the other hand, in the EO winter, the relative magni-tude is very high along the 30*N line and in the low-latitudes.
It can be seen clearly that the stabilities for the three categorized winters (Figs. 5a, 5c and 5d) are very low compared with those for the EY winter, WW and CW of Part I. Nevertheless, when atten-tion is focused on the area with relatively high sta-bility, several characteristic WSV anomaly patterns should be pointed out.
In the EB winter, westward anomalies appear in just the southeastern area of Japan, and noticeable south-westward anomalies also appear along 40*N from the international date line to 140*W. This im-plies a marked weakening and meandering of the mid-latitudes westerly (see Fig. 2a). In the equato-rial region except for the region from 160*E to the international date line, a weakening of the easterly is seen. In particular, the equatorward blow notably weakens in the area south of 15*N from the inter-national date line to about 140*W. This weakening of the trade wind may correspond to the Wyrtki's scenario for the relationship between wind change and the onset of an El Nino (Wyrtki, 1975) : the easterly weakens just before the onset of an El Nina event.
In the EA winter, especially in the mid-latitudes westerly region, WSV anomalies are small as a whole and do not show organized features (Fig. 4c). Sta-bility is extremely low in these latitudes (Fig. 5c). In the region northeast of the Philippine Islands, a southward blow to the Maritime Continent ex-ists. Over the equator around the international date line from 170*E to 150*W, the easterly strengthens. This implies the recovery of the trade wind, which may correspond to an anti-ENSO phase.
In the EO winter, the overall feature in the west-erly region is similar to that for CW of Part I: the appearance of an elliptical cyclonic gyre. However, the structure of WSV anomalies in the easterly re-gion are different from that of the CW (see Fig. 7b of Part I and Fig. 4d). Stability is markedly low in this region (Fig. 5d) and well-organized WSV anomalies are not found, except for a strong south-easterly or easterly towards the ITCZ in the easternmost equa-torial region.
In conclusion, the results mentioned above imply that the atmospheric general circulation system con-spicuously has an organized feature over the whole North Pacific in the winter during the ENSO events (EY winter), but it does not show the basin-scale or-ganized features in the other three categorized win-ters. Therefore, it can be said that the conditions of the ENSO events used in the composite analysis are not necessarily good sampling conditions for the analysis of WSV fields over the whole North Pacific.
2.2 Scores of Degree of similarity Scores of Degree of similarity were also calculated
as was done in Part I. Areas selected for calculation are same as those used in Part I, i.e., Areas A, B and

840 Journal of the Meteorological Society of Japan Vol. 67, No. 5
C (see Fig. 8 of Part I) : Area A is the region near Japan from 25*N to about 35*N and from 125*E to 165°E. Areas B and C are the regions from 145*E to 145*W, from 30*N to 50*N and from the equa-tor to 20*N, respectively. These areas can be re-garded as the region of the East Asian Winter Mon-soon (Area A) and the main parts of mid-latitudes westerly (Area B) and low-latitudes easterly regions (Area C).
Table 1 shows scores among WSV anomalies of six categorized winters: WW and CW of Part I and EB, EY, EA and EO winters in the present study. In Area A, scores for EB and EY winters to WW are relatively high (0.66 and 0.77) and that of EO winter to CW is also high (0.84). These can be eas-ily deduced from comparison of the WSV anomaly fields. In Area B, any scores among six categorized winters except for the EO winter versus the CW (0.67) are not high. In Area C, the score for the EY winter to the WW is again high (0.74). That is, WSV anomalies in the EY winter are very similar to those of the WW in Areas A and C except for Area B, where the score for the EY winter to the WW is very low (0.09). On the other hand, WSV anomalies in the EO winter are similar to those of the CW in Areas A and B (0.84 and 0.67).
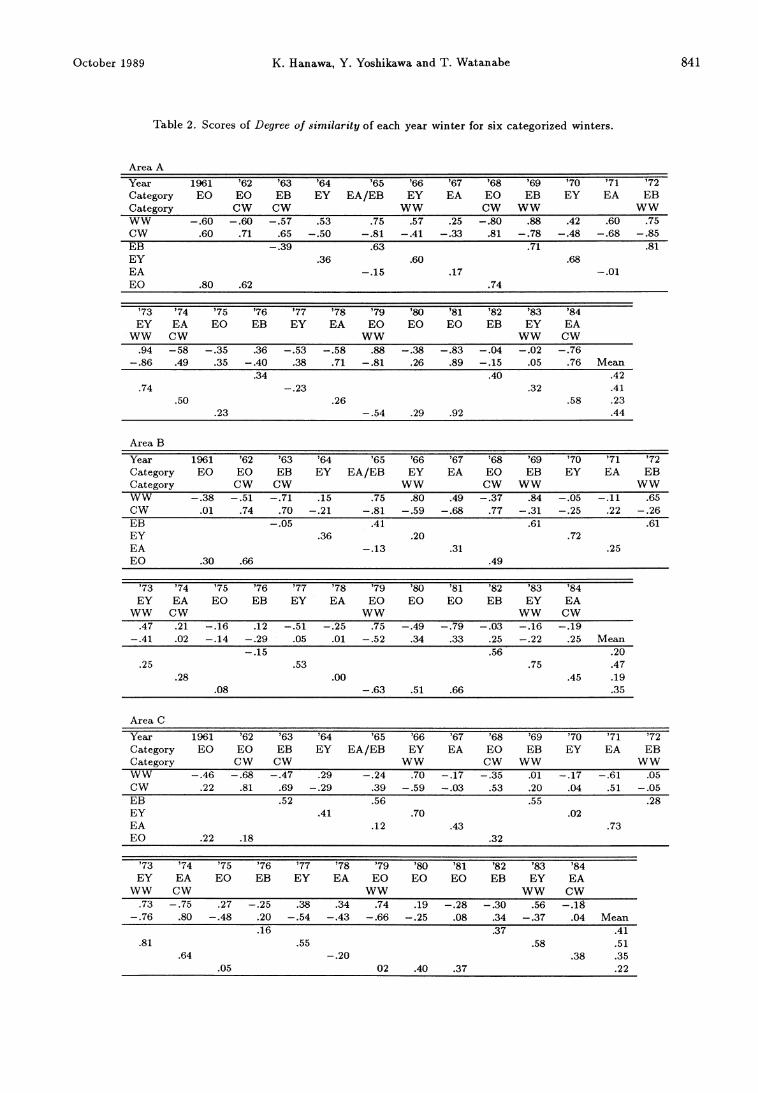
Table 2 shows scores of Degree of similarity for each winter. In the Table, for neatness, scores are given only to the winter which is originally catego-rized for the ENSO composite: since the 1961 winter is categorized as an EO winter, only the score to the EO winter is shown, although calculations are made for the other categorized winters. But for reference scores for the WW and the CW are also given to every winter.
As is easily deduced from the descriptions in the preceding subsection, scores of each winter for four categorized winters are not high compared with those for the WW and the CW in Part I. Neverthe-less, Table 2 shows as a gross feature that the WSV anomaly fields of an EY winter are relatively well-ordered in all three areas compared with those of the other three categorized winters (see mean values of Table 2). On the other hand, those of an EB win-ter show relatively rigid structures in Areas A and C, and those of the EO winter in Areas A and B. Those of the EA winter are low in all areas.
3. The Siberian High (SH) and the Aleutian Low (AL)
Figures 6 and 7 show composited sea level pres-sure (SLP) and anomaly fields from climatology (see Fig. l0a of Part I) for four categorized winters. Anomaly fields are normalized by the standard de-viation at each grid point.
For the four categorized winters, the SH is situ-ated in almost same position at 50*N, 90*E and its strength is about 1038hPa, although it is slightly
Table 1. Scores of Degree of similarity among six categorized winters for Areas A, B and
C. See Part I for WSV anomaly fields of WW and CW (Figs. 7a and 7b of Part I) and for regions of Areas A, B and C (Fig.
8 of Part I).
stronger in an EA winter. That is, no remarkable anomalies appear in this SH region. This is the point of difference from the results of Part I.
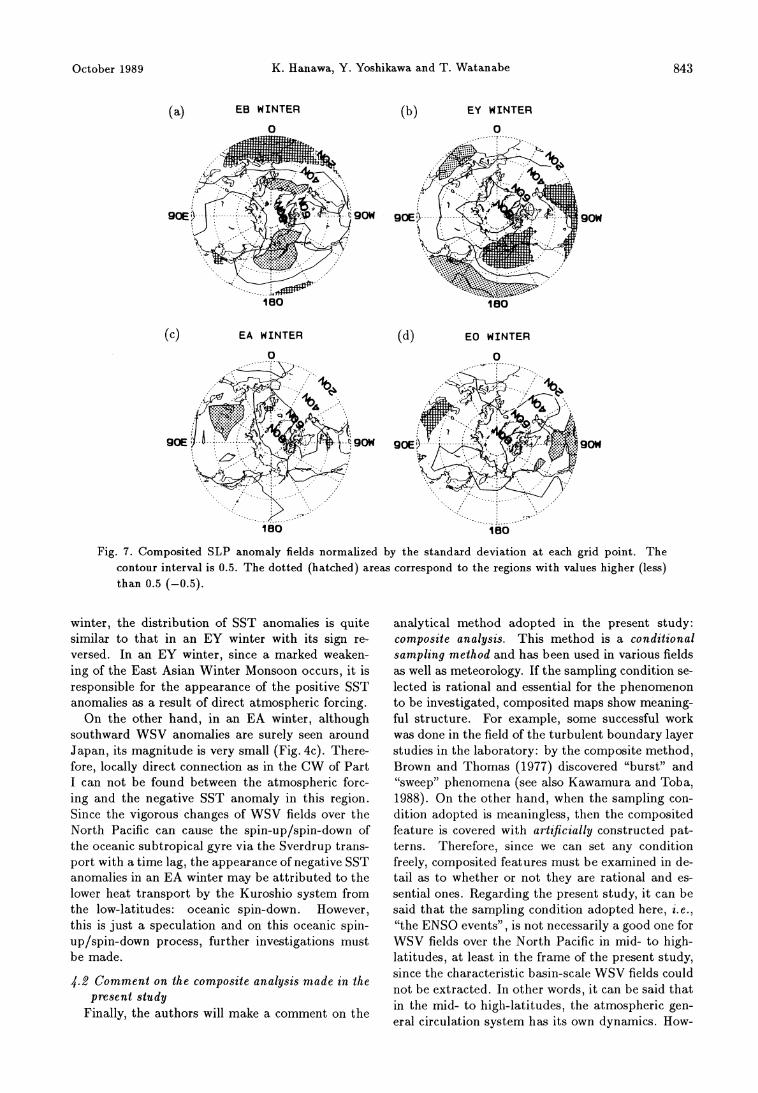
The most prominent feature is the development and eastward shift of the AL in an EY winter com-pared with climatology: the pressure of the depres-sion center is 996.0hPa at 50*N, 180* . In anomaly fields, in the EY winter a positive pressure anomaly appears in the low-latitudes and a negative in the high-latitudes over the North Pacific sector. In pos-
itive pressure anomaly regions, anomalies exceed one standard deviation. In addition in an EY winter, in the zonal band except for the North American Con-
tinent, pressure is low. On the other hand, in the polar region and at low-latitudes, especially over the North Pacific and the area from 30*E to 60*E, pres-sure becomes high. This global pattern is similar to the atmospheric condition for a low Southern Oscil-lation Index extracted by Iwasaki and Hirota (1988).
In the other three categorized winters, the centers of the AL shift westward to 170*E from 180* in an
EY winter and central pressures are about 1000hPa.
October 1989 K. Hanawa, Y. Yoshikawa and T. Watanabe 841
Table 2. Scores of Degree of similarity of each year winter for six categorized winters.

842 Journal of the Meteorological Society of Japan Vol. 67, No. 5
Fig. 6. Composited SLP fields for four categorized winters. The contour interval is 4hPa. The dotted
(hatched) areas correspond to the regions with values higher (less) than 1028 (1012)hPa.
As seen in anomaly fields of EA and EO winters, normalized anomalies do not show characteristic fea-tures over the globe. Anomaly fields in an EB winter are opposite in character from an EY winter over the North Pacific. Over the North Atlantic, a weaken-ing of the Icelandic Low and the existence of high pressure anomalies in mid-latitudes are clearly seen. This seems to be the manifestation of the Western Atlantic (WA) teleconnection pattern (Wallace and Gutzler,1981). This appearance of the WA telecon-nection pattern may give some information on the onset of an ENSO event.
When attention is paid to the SLP gradient in a tonal direction over Japan, it is found that it is gen-tle in an EY winter compared with those in the other three categorized winters. That is, since the AL shifts eastward in an EY winter, as a result the East Asian Winter Monsoon weakens irrespective of the strengthening of the AL. As described in HWIST, the monsoon index (MOl : SLP difference between Irkutsk, USSR and Nemuro, Japan) is lower in an EY winter than those in the other three categorized winters (see Fig. 10 of HWIST). This fact coincides with the SLP fields described here.
4. Conclusion and discussions
Following Part I, WSV fields over the North Pa-
cific were analyzed by the composite method with respect to the ENSO events. Among four catego-rized winters, the WSV anomaly fields for an EY winter are relatively well-organized and are similar to those for the WW of Part I except for the re-gion of the mid-latitudes westerly: the East Asian Winter Monsoon weakens and the westerly shifts northward but strengthens. In the equatorial region they suggest the central and eastern Pacific is the strengthened convergence region of wind, i. e., con-vection region. Composited sea-level pressure fields show the strengthening and eastward shift of the Aleutian Low.
For the other three categorized winters, the sta-bilities of WSV anomalies were very low, and time series of scores of Degree o f similarity did not show that the composited WSV anomalies were typical for each categorized winter. That is, basin-scale well-organized patterns could not be extracted.
1.1 The relationship between results by HWIST for SST anomalies and present results
As mentioned in the Introduction, HWIST found that in an EY winter a well-ordered and notably positive SST anomaly appears in a wide tonal band along the 30*N line, extending from the Asian coast to near 170*E (Fig. 1). On the other hand, in an EA
October 1989 K. Hanawa, Y. Yoshikawa and T. Watanabe 843
Fig. 7. Composited SLP anomaly fields normalized by the standard deviation at each grid point. The contour interval is 0.5. The dotted (hatched) areas correspond to the regions with values higher (less)
than 0.5 (-0.5).
winter, the distribution of SST anomalies is quite similar to that in an EY winter with its sign re-versed. In an EY winter, since a marked weaken-ing of the East Asian Winter Monsoon occurs, it is responsible for the appearance of the positive SST anomalies as a result of direct atmospheric forcing.
On the other hand, in an EA winter, although southward WSV anomalies are surely seen around Japan, its magnitude is very small (Fig. 4c). There-fore, locally direct connection as in the CW of Part I can not be found between the atmospheric forc-ing and the negative SST anomaly in this region. Since the vigorous changes of WSV fields over the North Pacific can cause the spin-up/spin-down of the oceanic subtropical gyre via the Sverdrup trans-port with a time lag, the appearance of negative SST anomalies in an EA winter may be attributed to the lower heat transport by the Kuroshio system from the low-latitudes: oceanic spin-down. However, this is just a speculation and on this oceanic spin-up/spin-down process, further investigations must be made.
4.2 Comment on the composite analysis made in the present study
Finally, the authors will make a comment on the
analytical method adopted in the present study: composite analysis. This method is a conditional sampling method and has been used in various fields as well as meteorology. If the sampling condition se-lected is rational and essential for the phenomenon to be investigated, composited maps show meaning-ful structure. For example, some successful work was done in the field of the turbulent boundary layer studies in the laboratory: by the composite method, Brown and Thomas (1977) discovered "burst" and "sweep" phenomena (see also Kawamura and Toba, 1988). On the other hand, when the sampling con-dition adopted is meaningless, then the composited feature is covered with artificially constructed pat-terns. Therefore, since we can set any condition freely, composited features must be examined in de-tail as to whether or not they are rational and es-sential ones. Regarding the present study, it can be said that the sampling condition adopted here, i. e., "the ENSO events" , is not necessarily a good one for WSV fields over the North Pacific in mid- to high-latitudes, at least in the frame of the present study, since the characteristic basin-scale WSV fields could not be extracted. In other words, it can be said that in the mid- to high-latitudes, the atmospheric gen-eral circulation system has its own dynamics. How-

844 Journal of the Meteorological Society of Japan Vol. 67, No. 5
ever, it goes without saying that this does not deny the approach to atmospheric general circulation in mid- to high-latitudes based on the viewpoint of the ENSO events.
Acknowledgment
The authors wish to express their sincere thanks to Prof. Y. Toba and other members of the Phys-ical Oceanography Laboratory, Tohoku University for their useful comments and discussion. Com-ments by two anonymous reviewers have been useful in improving the manuscript.
This study was made as part of OMLET (Chair-man: Prof. Y. Toba), one of the Japanese WCRP activities, which was financially supported by the Japanese Ministry of Education, Science and Cul-ture. The first author (KH) was also financially supported by the Japanese Fisheries Agency, in the special project, "Oyashio Region".
References
Brown, G.L. and A.S.W. Thomas, 1977: Large struc- ture in a turbulent boundary layer. Phys. Fluids,
20, 234-252.
Hanawa, K, T. Watanabe, N. Iwasaka, T. Suga and
Y. Toba, 1988: Surface thermal conditions in the
western North Pacific during the ENSO events. J.
Meteor. Soc. Japan, 66, 445-456.
Hanawa, K, Y. Yoshikawa and T. Watanabe, 1989:
Composite analyses of wintertime wind stress vec-
tor fields with respect to SST anomalies in the west-
ern North Pacific and the ENSO events. Part I. SST
composite. J. Meteor. Soc. Japan, 67, 385-400.
Iwasaki, T. and I. Hirota, 1988: The influence of the
Southern Oscillation on extratropical circulations
during Northern Hemisphere winter. J. Meteor.
Soc. Japan, 66, 419-432.
Kawamura, H. and Y. Toba, 1988: Ordered motion in
the turbulent boundary layer over wind waves. J.
Fluid Mech., 197, 105-138.
Kutsuwada, K. and T. Teramoto, 1987: Monthly maps
of surface wind stress fields over the North Pacific
during 1961-1984. Bull. Ocean Res. Insti., Univ.
Tokyo, No. 24, 100pp.
Wallace, J.M. and D.S. Gutzler,1981: Teleconnections
in the geopotential height field during the Northern
Hemisphere winter. Mon. Wea. Rev., 109, 784-
812.
Wyrtki, K., 1975: El Nino - The dynamic response of
the equatorial Pacific ocean to atmospheric forcing.
J. Phys. Oceanogr., 5, 572-584.
西 部 北 大 平 洋 の 海 面 水 温 ア ノマ リ とENSOイ ベ ン トに 関 す る
冬 期 の 海 面 風 応 力 ベ ク トル の 合 成 図 解 析
Part II. ENSOイ ベ ン トに 対 す る 解 析
花 輪 公 雄 ・吉 川 泰 司 ・渡 邊 朝 生
(東北大学理学部地球物理学教室)
前報(Part I, Hanawa et al.,1989)に 続 き、北太平洋上の風の海面応力ベク トル場 を、ENSOイ ベン トに
着 目して合成図解析手法 により調べた。1961年 から1984年 までの24年 間の冬季を Hanawa et al.(1988)
が行ったよ うに、ENSO。1年 、 ENSO年 、 ENSO+1年 、他の年 の冬季 の4つ のカテゴリに分類 した。
4つ のカテゴリの冬季の中で、ENSO年 冬季のア ノマ リベク トル場 は、相対的 によく組織化 されてお り、
西部北太平洋中緯度や低緯度域では、Part Iで 示 され た"暖 か い冬"の 場 とよ く似て いるもので あった。
す なわち、東アジア冬季モンスーン(季 節風)は 弱 ま り、赤道域 のア ノマ リベ ク トル場 は、強化 された風
の収束域(対 流の中心)が 、中部か ら東部太平洋 に広 がっていることを示 していた。東アジアモンスーン
の弱 ま りは、Hanawa et al.(1988)が 示 したENSO年 冬季における 日本近海の顕著 な正のSSTア ノマ リ
の出現 を説明す るものである。 しか しなが ら、中緯度偏西風は北ヘ シフ トしているが、Part Iの"暖 かい
冬"や 他の3つ の冬季 と比較 して強まっていることがわかった。
海面気圧場に対す る合成図解析は、ア リューシャ ン低気圧の発達 と東方への移動 を示 していた。また、北
太平洋上では中緯度 に正のアノマ リ、高緯度 に負のアノマ リが出現 し、 これ は中緯度の偏西風の強化 と対
応 して いる。
ENSO年 冬季を除 く他の3つ のカテゴリの冬季では、アノマ リベク トル場の安定度は低 く、Part Iで 導入 し
た"相 似度"の スコアの時系列 は、各カテゴ リに対 して合成 されたア ノマ リ場は典型的な ものではないことを
示 していた。すなわち、大規模スケールの特徴的なパターンをこの解析では抽出することがで きなかった。こ
October 1989 K. Hanawa, Y. Yoshikawa and T. Watanabe 845
の こ とか ら、ENSOイ ベ ン トは 、確 か にENSO年 冬 季 の 中 ・高 緯 度 の循 環 場 に 大 き な影 響 を 与 え.てい るが 、少
な く と も中 ・高 緯 度 の 冬 季 の海 面 風 応 力場 の特 徴 を抽 出 す る際 の 良 い サンプ リン グ 条 件 で は な い とい え る。
Copyright © 2022 FDOKUMEN