
competitive strategies for enterprise growth - UoN Repository
64
COMPETITIVE STRATEGIES FOR ENTERPRISE GROWTH ADOPTED BY INCUBATOR COMPANIES AT NAIROBI GARAGE, NAIROBI COUNTY, KENYA ANNE AKOTH MISERE A RESEARCH PROJECT SUBMITTED IN PARTIAL FULFILLMENT OF THE REQUIREMENT FOR THE AWARD OF THE DEGREE OF MASTER OF BUSINESS ADMINISTRATION, SCHOOL OF BUSINESS, UNIVERSITY OF NAIROBI 2019
-
Upload
khangminh22 -
Category
Documents
-
view
0 -
download
0
Transcript of competitive strategies for enterprise growth - UoN Repository

i
COMPETITIVE STRATEGIES FOR ENTERPRISE GROWTH
ADOPTED BY INCUBATOR COMPANIES AT NAIROBI
GARAGE, NAIROBI COUNTY, KENYA
ANNE AKOTH MISERE
A RESEARCH PROJECT SUBMITTED IN PARTIAL
FULFILLMENT OF THE REQUIREMENT FOR THE AWARD
OF THE DEGREE OF MASTER OF BUSINESS
ADMINISTRATION, SCHOOL OF BUSINESS, UNIVERSITY OF
NAIROBI
2019

ii
DECLARATION
This research project is my original work and has not been submitted for examination
in any other university or institution of higher learning for any academic award of
credit.
Signed ……………………………... Date………………………
Name: Anne Akoth Misere
Registration Number: D61/78974/2015
This research project has been submitted for examination with my approval as the
University Supervisor.
Signed ……………………………... Date………………………
Prof. Bitange Ndemo

iii
DEDICATION
I dedicate this work to my dear husband Duke Omwamba Sitemba and children;
Maryanne Bonareri and Daxton Sitemba as well as my friends and siblings for their
continued support while I was researching about the project. This study is also
dedicated to the Almighty God for His love, provisions, guidance and help towards the
successful completion of this research project.

iv
ACKNOWLEDGENT
Special thanks to the Almighty God for sustaining me through the entire thick and thin
of another stage of education in my life. I would like to profoundly thank my supervisor
Prof. Bitange Ndemo and moderator Prof. Martin Ogutu for their steadfast guidance,
patience and keen interest in my work. My in-depth appreciation goes to my family for
their prayers, and moral support during this programme. I would like to acknowledge
my dear husband Duke Omwamba Sitemba for his love, patience, support and
encouragement during the entire period.

v
TABLE OF CONTENTS
DECLARATION.......................................................................................................... ii
DEDICATION............................................................................................................. iii
ACKNOWLEDGENT ................................................................................................ iv
LIST OF TABLES ..................................................................................................... vii
LIST OF FIGURES ................................................................................................. Viii
ABBREVIATIONS AND ACRONYMS .................................................................. iix
ABSTRACT .................................................................................................................. x
CHAPTER ONE: INTRODUCTION ........................................................................ 1
1.1 Background ...................................................................................................................... 1
1.1.1 Concept of Competitive Strategy .............................................................................. 3
1.1.2 Concept of Enterprise growth ................................................................................... 4
1.1.3 Concept of Incubation ............................................................................................... 5
1.1.4 Nairobi Garage .......................................................................................................... 6
1.1.5 Incubator Companies ................................................................................................ 7
1.2 Research Problem ............................................................................................................ 9
1.3 Research Objective ........................................................................................................ 10
1.4 Value of the Study ......................................................................................................... 10
CHAPTER TWO: LITERATURE REVIEW ......................................................... 12
2.1 Introduction .................................................................................................................... 12
2.2 Theoretical Foundations of the Study ............................................................................ 12
2.2.1 Resource-Based View ............................................................................................. 12
2.2.2 Porter’s Five Forces ................................................................................................ 13
2.3 Porter’s Generic Competitive Strategies ........................................................................ 14
2.3.1 Cost Leadership ...................................................................................................... 15
2.3.2 Differentiation ......................................................................................................... 15
2.3.3 Focus ....................................................................................................................... 16
2.4 Enterprise Growth .......................................................................................................... 16
2.5 Empirical Studies and Research Gaps ........................................................................... 17
2.5 Conceptual Framework .................................................................................................. 21
CHAPTER THREE: RESEARCH METHODOLOGY ........................................ 22
3.1 Introduction .................................................................................................................... 22
3.2 Research Design............................................................................................................. 22
3.3 Population ...................................................................................................................... 22

vi
3.4 Sample Design ............................................................................................................... 23
3.5 Data Collection .............................................................................................................. 23
3.6 Data Analysis ................................................................................................................. 24
CHAPTER FOUR: RESULTS, FINDINGS AND DISCUSSION ........................ 25
4.1 Introduction .................................................................................................................... 25
4.2 Response Rate ................................................................................................................ 25
4.3 Company Profile ............................................................................................................ 26
4.3.1 Years of Operation in Kenya .................................................................................. 26
4.3.2 Branches outside Kenya .......................................................................................... 26
4.3.3 Company Ownership .............................................................................................. 27
4.3.4 Number of Employees ............................................................................................ 28
4.4. Competition .................................................................................................................. 29
4.5 Competitive Strategies ................................................................................................... 30
4.6 Competitive Advantage ................................................................................................. 31
4.7 Enterprise Growth .......................................................................................................... 32
4.8 Correlation Analysis ...................................................................................................... 33
4.9 Discussion ...................................................................................................................... 35
CHAPTER FIVE: SUMMARY, CONCLUSIONS AND
RECOMMENDATIONS ........................................................................................... 39
5.1 Introduction .................................................................................................................... 39
5.2 Summary of Findings ..................................................................................................... 39
5.3 Conclusions .................................................................................................................... 40
5.4 Recommendations from the study.................................................................................. 41
5.5 Limitations of the Study ................................................................................................. 42
5.6 Suggestions for Further Research .................................................................................. 42
REFERENCES ........................................................................................................... 44
APPENDICES ............................................................................................................ 46
Appendix I: Letter of Introduction ............................................................................... 46
Appendix II: Incubator Companies at Nairobi Garage, Nairobi County, Kenya as at
November 2018. ........................................................................................................... 47
Appendix III: Questionnaire ........................................................................................ 49

vii
LIST OF TABLES
Table 2.1: Summary and Knowledge Gaps ......................................................................... 20
Table 3.1: Population ........................................................................................................... 23
Table 3.2: Sample Size ........................................................................................................ 23
Table 4.1: Response rate ...................................................................................................... 25
Table 4.2: Factors Determining Intensity of Competition ................................................... 30
Table 4.3: Competitive Strategies ........................................................................................ 31
Table 4.4: Competitive Advantage ...................................................................................... 32
Table 4.5: Enterprise Growth ............................................................................................... 33
Table 4.6: Correlation Analysis ........................................................................................... 34

viii
LIST OF FIGURES
Figure 2.1: Conceptual Framework ..................................................................................... 21
Figure 4.1: Years of Operation in Kenya ............................................................................. 26
Figure 4.2: Branches outside Kenya .................................................................................... 27
Figure 4.3: Company Ownership ......................................................................................... 28
Figure 4.4: Number of Employees ....................................................................................... 29

ix
ABBREVIATIONS AND ACRONYMS
MEST : Melt water Entrepreneurial School of Technology
NBIA : National Business Incubation Association
PEST : Political, Economic, Social and Technological
RBV : Resource-Based View
SMEs : Small and Medium Enterprises
SPSS : Statistical Package for the Social Sciences
SWOT : Strengths, Weaknesses, Opportunities and Threats
VRIN : Valuable, Rare, Imperfectly Imitable, and Non-Substitutable

x
ABSTRACT
Currently, there is renewed interest in incubation as a framework for facilitating start-
ups. Potential entrepreneurs consider it a viable option for support while venture
investors see it as an avenue to diversify risky investment portfolios. Anchored on the
Porter’s Five Forces Model and Resource-Based Theory; this study’s objective was to
investigate the competitive strategies for enterprise growth used by incubator
companies at Nairobi Garage, Nairobi County, Kenya. The study employed cross-
sectional survey perspective that is both quantitative and qualitative in nature. This
study focused on the for-profit incubator companies at Nairobi Garage. The sampling
frame comprised of all for-profit incubator firms in Nairobi garage. The for-profit
incubator companies at Nairobi Garage were classified based on the sector
characteristics of information technology, service and trading, to ensure good
representation. 30 respondents formed the sample of the study which is 34.88% of the
population. Primary data was gathered using a structured questionnaire with open-
ended as well as closed questions to achieve the research objective. Data from the study
was analyzed both quantitatively and qualitatively. It was established that many of the
business incubator firms were providing services and products falling in three
categories: Information and communication technology, service and trading. The
respondents agreed that competitive rivalry is one of the factors that determine intensity
of competition (M=4.05, SD=0.71842). The other factors include: bargaining power of
buyers (M=3.938, SD=.68636), bargaining power of suppliers (M=3.725, SD=.70732),
threat of new entrants (M=4.093, SD=.68906) and existence of substitute
goods/services (M=4.013, SD=.77186). From the findings, the respondents suggested
that the incubator companies used cost leadership strategy to a large extent (M=3.8313,
SD=0.6948). The incubator companies also adopted differentiation and focus strategies
to a large extent as illustrated by the mean of 4.0188 and 3.9687 in that order. It is the
recommendation of the study therefore that incubator companies ought to invest most
in, as well as adopt cost leadership mechanisms particularly the formation of forming
linkages with service providers. To gain competitive edge over rivals in the sector and
to ensure the long-term viability and sustainability, the management of incubator
companies should emphasize and enhance investments in organizational differentiation
strategies. To attain this, it is important that incubator companies differentiate their
operations, products and services from an informed knowledge perspective.

1
CHAPTER ONE: INTRODUCTION
1.1 Background
Incubation has on recent times drawn the attention of venture capitalists and potential
entrepreneurs alike as a means for start-up financing. For venture capitalists, the
incubation model offers a strategic option of risk diversification while potential
entrepreneurs on the other hand consider it as an avenue for mobilizing capital for start-
ups. In recent times, regional rather than international incubators are credited with
driving the successful establishment of incubators. This has spurred the emergence of
a new variety of incubators whose; skills and competencies, target market and strategic
objective focus is a complete departure from the past. They a different understanding
which has transformed the sector’s business model and sources of competitive
advantage such that they operate and compete in the same business environment as
fellow incubators, business angels, law firms, real estate agents, consultants and venture
capitalists for the most viable start-up companies and entrepreneurs.
Porter (1986) identifies industrial, geographical, vertical and segment elements as the
main four compositions of a competitive scope. This study endeavored to determine the
competitive approaches used by incubator firms for enterprise growth. The study also
adopted the Resource-Based View Theory (RBV) and Porters Five Forces Models. The
Resource-Based View theory as advanced in Barney (1991) argues that there is
potential for developing competitive advantage in every organization’s resources that
valuable, rare, imperfectly imitable, and non-substitutable (VRIN). To outperform
rivals and gain a competitive edge, Solesvik and Westhead (2010) argue that firms only
need to identify and effectively manage these unique resources to their advantage.
Granted these unique resources or capabilities are internal, competitive advantage for

2
concerned business enterprises can accordingly be obtained through formulation of
plans or activities meant to harness their full potential (Alvarez-Suescun, 2007). In the
case of incubator companies, improved performance through exploitation of the
internal resources can potentially confer unique value or competitive advantage. An
evaluation of the competitive environmental conditions in the business incubation
sector rests on five critical elements otherwise called Five Forces Model as postulated
by Porter (1985). The Five Forces Model comprises the assessment of supplier’s
bargaining power, buyers or potential customers, threats posed by potential or new
players, challenges of substitute products and the potential of rivalry between existing
competitors.
Improved business environment in Kenya has seen several startup companies being
established in the country over the years. Nairobi has attracted many companies with
both local and international owners to set up in the city. This trend can be attributed to
the support provided by the growth of incubation centers in the city and a conducive
business environment in the country realized because of the economic reforms and anti-
corruption campaigns conducted in the 1990s. While many businesses are started in
Kenya each day, several startups are failing and closing daily. According to a survey
done by the Kenya National Bureau of Statistics, approximately 61% of micro, small
and medium-sized enterprises do not get to celebrate their second anniversary (Mwangi,
2016). Due to this high failure rate of businesses at their early-stages of inception in the
country, it would be useful to investigate competitive strategies adopted by incubator
companies commonly referred to as startup companies that are currently at one of the
largest coworking spaces in Nairobi, Nairobi Garage, to ensure that they gain a
competitive advantage over their competition and survive in the long run.

3
1.1.1 Concept of Competitive Strategy
According to Johnson and Scholes (2005), the term strategy refers to an organization’s
orientation and scope over the long term by the way in which it positions its resources
in a continuously changing business environment to satisfy the demands of the market
and to meet stakeholders’ expectations. There are three forms of organizational
strategies. Strategy in general which describes the way in which a stated objective in a
business will be achieved; corporate strategy that defines the organization’s operations
in terms of the target markets and the business activities in which the organization will
engage in; and competitive strategy or business strategy that states for a firm the
premise upon which it will compete (Nickols, 2016). This study focused on the last
form of strategy, competitive strategy, which relies on an organization’s capabilities,
weaknesses and strengths in connection with the market traits and the equivalent
strengths and weaknesses of the competition.
Competitive strategy involves looking for positive conditions for competing within the
sector on which to lay a competitive position that is sustainably profitable in
comparison to powers that dictate an industry’s competition and it is the basis upon
which a strategic business unit is likely to realize a competitive advantage within the
industry (Porter, 1985). A business entity’s competitive strategy Thompson and
Stickland (2007) aver, mainly involves precise details of top leadership’s approach for
competing successfully and gaining a competitive advantage over their competitors.
Porter (1980) asserted that every organization competing in a given industry usually
has a strategy for competing; either clearly developed from a well-organized process of
planning or may have advanced implicitly because of the various actions and decisions
of the different functional departments of the organization. Porter (1986) asserted that

4
competitive strategy can take any one of the following three kinds; cost leadership,
differentiation and focus.
1.1.2 Concept of Enterprise growth
Many scholars have acknowledged and documented the significance of enterprise
growth across the globe. Okpara and Wynn (2007) in their study for instance found that
the potential value of enterprise development in terms of income generation and
creation of employment opportunities is widely recognized. Entrepreneurship is the
engine of economic growth and development and prime tool for actualizing novel
dreams and ideas. A basic definition of an entrepreneur is an individual who is capable
of scanning and identifying opportunities within ones surrounding, mobilizing the
requisite resources that facilitates successful implementation of plans or actions.
Ardichvili, et al., (2003) views entrepreneurship from a purely transactional perspective
meant to attain economic growth. In their opinion, the important indicators of economic
growth comprise of; sales and profits, market share, employment, branch distribution
and generally assets. The challenge here is that while growth in traditional businesses
are measured in gross profits or share value, the quantification or measurement of new
ventures remains non-existent or a challenge. Additionally, the incubation cycle is
normally brief compared to other traditional business cycles and as such an evaluation
of incubators does not capture the longer-term output (Dee et al., 2011).
Proponents of incubation hold that a standard evaluation mechanism can insulate
incubatees from adverse competitive factors in the market and enhance short-term
viability. Critics however consider the process as ineffectual that will lead to the
incubators collapsing once exposed to free market forces (Amezcua 2010).

5
1.1.3 Concept of Incubation
Business incubation according to the American National Business Incubation
Association (NBIA) is an ever-changing process of developing business enterprises.
The main goal of incubation process is mobilization of resources to finance
entrepreneurs particularly those involved in the development of innovative products.
The ultimate aim of incubation is to expedite the exploitation of technologies by
facilitating linkages between technology, capital know-how and development of start-
ups. Start-up benefit from incubators facilitative efforts such as formulation of business
and marketing plans, building of critical entrepreneurship skills and competencies,
provision of cheap capital and facilitating availability to a variety of specialized
professional service options. Furthermore, start-ups can also benefit from incentives
and resources meant to maximize their value such as shared equipment, flexible space
and shared administrative services. This helps incubators to build capacity for
resilience, independent entities that can withstand the competitive elements within the
market. It is important to note that while common activities and services are common
in the incubation sector; most incubators cultivate distinct products using unique
resources found within their environment, and in response to their own unique base of
clientele. These varied characteristics result in different incubating models.
Business incubation can also be defined as a business-support process that speed up the
effective establishment and growth of startups or incubator companies by providing
their founders with a set of business requirements and services (Changi, 2013). In this
context, business incubators are therefore establishments that are designed to speed up
the growth of startup companies by providing a set of business necessities and services.

6
It is estimated by the International Business Innovation Association based in the United
States of America (USA) that there are about 7,000 incubators worldwide today. Silicon
Valley in California, Massachusetts Institute of Technology in Boston and Berlin which
is home to WISTA are some of the biggest startup ecosystems in the world. Based on
an article by Quartz Africa, as at 2016; there were over 300 business incubators spread
across 42 nations and 93 cities in the African region. According to the report, the
number of Tech Centers within the African region exponentially grew significantly
more than doubling in the year 2016. The article pointed out the fact that more than half
of these incubators are concentrated in Nigeria, Egypt, Morocco, South Africa and
Kenya. Some of the incubation centers that were home to several startup companies in
Kenya at the time of this study include: Nairobi Garage, iHub, m:Lab East Africa,
Nailab, C4D Lab, Lake Hub, iBiz Africa, iLab Africa among others. This study focused
only on the incubator companies at Nairobi Garage at the time of the study.
1.1.4 Nairobi Garage
Formerly known as 88MPH, Nairobi Garage is one of the biggest incubation hubs
offering co-working spaces to startup companies in Nairobi. Nairobi Garage has
incubated some of the most successful startup companies in Kenya in the past, including
online-based news sources, such as Ghafla!Kenya, Futaa.com and HiviSasa; one of
Africa’s biggest initiative for data journalism and civic technology, Code for Africa;
food delivery service provider, Yum Kenya; platform for downloading free music,
Mdundo; and crowd funding platform, M-Changa among others. It is a fully serviced,
co-working office space for startup companies and freelancers providing a flexible
office solution to its members.
7
The space offers some administrative services, high-speed internet connection, people
connectivity and networking opportunities as well as education and access to
knowledge by routinely inviting experts in various fields to the space. With two
operational branches as at the time of this study, the co-working space is home to about
86 members out of which 90% are for profit. Nairobi Garage offers 3 packages to its
clients; co-working options, enclosed private offices and club space.
The Nairobi Garage is a privately-owned operated incubation hub that is meant to be a
catalyst of innovative entrepreneurship. It is owned by Pan-African Entrepreneurial
Training Program. The key feature of the Nairobi Garage is that it provides shared co-
working space which has attracted many top start-ups in Nairobi. This is entirely unique
concept in Africa though the same arrangement can be found in other African cities
such as Lagos and Cape Town that runs on the 88MPH’s tech accelerator program. The
idea was born out of the need to ease the cost of doing business in Africa’s fastest
growing cities through the provision of convenient, cheap business facilities. It also
facilitates the growth of local businesses by tapping into key international networks of
events, investors, innovation idea exchange. This study specifically investigated the
competitive strategies applied by for-profit enterprises based at the office space in the
two branches in Chiromo, Westlands and along Ngong Road in Nairobi, Kenya.
1.1.5 Incubator Companies
Business incubators are set up for the dual purpose of attaining social and economic
development and to serve as resource centers for start-ups. Incubators are particularly
helpful to start-ups through provision of business opportunity consultancies that
explores viability, establishment and operation of business enterprises. This leads to not
only the generation of income for local and national economies which accrues from

8
employment opportunities, commercialization of new technologies but also the
revitalization of whole communities. According to Dee et al. (2011), incubator
activities’ impact is dependent on the scale of incubatee portfolio as well as that of
incubator’s portfolio. The important indicators influencing the impact of incubators
include; the emerging character of the new ventures and the availability of incubation
at their disposal.
Most of the incubator companies are startup companies. Startup companies come in
several forms and sizes. According to Blank (2013), there are six categories of start-up
companies: lifestyle startups which comprise of entrepreneurs not working for anyone
such as freelance coders or web designers; small business start-ups which comprise of
entrepreneurs who run small businesses that are not designed to scale; scalable start-
ups which are start-ups whose founders believe they are capable of changing the world
and they are in constant search for a business paradigm that they can replicate and scale;
buyable start-ups whose aim is not to create a big firm but to be sold off to a more
established company for some good amount of money; large company start-ups which
are companies that have to produce new innovative products for new clients in new
markets in order to survive; and lastly social start-ups which are start-ups that are
passionate and motivated to have an impact with a mission to make the community and
the world a better place, not to be wealthy, but for the sake of their ideas.
According to Moyi (2005), in Kenya 98% of all enterprises are small-scale in size and
include startup companies; employing less than 100 people. These businesses
contribute largely towards solving the problem of unemployment, stimulating growth
of the economy, enhancing distribution of income more evenly, facilitating efficiency
and productivity in utilization of resources, enhancing the regional distribution of

9
industries as well as developing a vibrant private sector in Kenya. The contribution of
the growth and existence of start-ups in Kenya’s economy makes it useful to study the
competitive strategies used by some of the startups in the country to ensure their
survival and growth.
1.2 Research Problem
All businesses have some form of strategy whether clearly laid down or not and need
competitive advantages that are sustainable to survive competition and grow. Some
previous studies have been extensively done that investigated the competitive strategies
that are adopted by various companies within various industries. Most of these studies
however, focused on the competitive strategies adopted by specific organizations in the
country for instance Multichoice Kenya Limited (Wekesa, 2013) or focused on small-
scale businesses in different contexts for instance “Competitive Strategies Adopted by
Small-Scale Enterprises in Exhibition Halls in Nairobi” done by Namada and Bagire
(2008). Wekesa (2013) found out that Miltichoice Kenya Limited employed various
competitive strategies including expanding their service provision to offer more
services to their clients, decentralizing services to reach more people as well as
partnering with known brands in the market. The study was based on Multichoice
Kenya Limited which is a well-established company with international partners. The
study was also a case study while this study employed cross-sectional survey approach.
Namada and Bagire (2008) found out that small enterprises that are in exhibition halls
in Nairobi adopted competitive strategies that were related to pricing and cost
management as well as product and marketing. The study focused on SMEs in
exhibition halls as opposed to incubator companies which is the premise of the current
study.

10
Based on the literature review conducted in the Kenyan context, no study currently has
tried to explicitly analyze the competitive strategies adopted by startups incubated in
co-working spaces/incubation hubs in Nairobi County. This study sought to investigate
and analyze the competitive strategies adopted by incubator companies also known as
startup companies at Nairobi Garage to ensure they survive competition and thrive in
the long run. As one of the major incubation hubs for startup companies in Nairobi, this
study sought to answer the question; what are competitive strategies for enterprise
growth adopted by incubator companies at Nairobi garage?
1.3 Research Objective
This study’s objective was to investigate the competitive strategies for enterprise
growth adopted by incubator companies at Nairobi Garage, Nairobi County, Kenya.
1.4 Value of the Study
Based on the contribution of startups and small-scale enterprises to the Kenyan
economy, the high failure rates of businesses in Kenya and the role that the private
sector plays in a country’s development in general, there are compelling reasons for the
study of competitive strategies for enterprise growth adopted by incubator companies
to ensure their long-term survival in a highly competitive business environment. This
study will be useful in practice to individuals such as current and aspiring entrepreneurs
as well as investors, policy makers and to both business and academic researchers.
This study’s findings will be useful to current entrepreneurs and founders of companies
incubated at Nairobi Garage for informed future strategy formulation. To avoid failure,
startups must look at ways where they can change their competitive strategy and
improve their rate of survival every day. They need to align to the market and customer
needs and companies which fail to do so die eventually. New startups will use the

11
findings to look at and understand competitive strategies adopted by their predecessors
and the mistakes made by the previous startups to improve their rate of survival and
grow into bigger corporations. Investors on the other hand will use the findings to
understand the competitive strategies adopted by startups in various industries to enable
them to assess the probability or survival of various startups hence establishing their go
to companies in their chosen industries for investment.
The findings will also be useful to the Kenyan government as well as other policy
makers in helping them to assess the support that can be given to startups in the country
to thrive in the increasingly competitive business environment. Policy makers will use
the findings to establish and create educative forums for startup founders, entrepreneurs
and investors that can help grow the startup ecosystem in Kenya.
Besides practice and policy, the study will also add on to knowledge in the topic of
competitive strategy and will form the basis for future and additional research for both
business and academic researchers. The findings will help in the advancement of the
Resource-Based View model and Porter’s five forces model. Scholars and students of
business especially in the field of strategic management will use the findings for
academic purposes while business researchers will use the findings for informed
decision making and strategy formulation.

12
CHAPTER TWO: LITERATURE REVIEW
2.1 Introduction
Chapter two contains a discussion on the two theories which underpin this study:
resource-based view and Porter’s five forces model as well as literature review
revolving around the concept of competitive strategy which is related to the study either
directly or indirectly. It also presents a discussion of various competitive strategies and
how firms use them to enhance their competitive advantage in specific industries.
Studies related to competitive strategies adopted by small businesses are also presented
as well as conceptual framework that guided this study.
2.2 Theoretical Foundations of the Study
This study was based on the resource-based view and Porter’s five forces models.
2.2.1 Resource-Based View
The Resource-Based View (RBV) is a theory that terms resources as very important to
achieving superior firm performance. According to the model, suppose a certain
resource is of value, is rare, is hard to imitate and the organization has the capability to
exploit it (VRIO qualities), then the resource permits the business enterprises to attain
and sustain competitive advantage over its competitors (Rothaermel, 2012). The
proponents of RBV asserted that firms ought to look within the firm to find competitive
advantage sources rather than focusing on the external business environment (Barney
(1991), Rotharmel (2012).
The resource-based view tends to overlook the implementation of strategies in line with
the external environment as opposed to the industrial organization view. According to
Barney (1991), the foundation of the RBV framework is that successful businesses gain
their future sustained competitiveness on the development of distinct and unique

13
capabilities hence the firm’s strategy should center around reflecting on the uniqueness
aspects of its resources. In the model, resources which can either be tangible or
intangible are tasked with helping companies to achieve above average organizational
performance.
2.2.2 Porter’s Five Forces
Porter’s Five Forces Model defines the profitability and forces of competition of firms
in any industry. The main goal of competitive mechanisms in Porter’s (1985) view is
to manage and ultimately transform the rules of competition within the industry.
According to Porter (1985) the five forces of competitive position gives a clear view
point for assessing and analyzing the competitiveness and position of a firm. The Five
Forces together have a significant impact on the industry’s performance given they
determine the pricing of products, costs incurred, and the kind of investments needed
to keep up with industry’s competition.
The entrance of new players has the risk of increasing an industry’s capacity,
introducing market share competition and has the potential of lowering prices charged.
Substitutes can influence an industry’s financial productivity by constraining pricing of
products/services in the sector. Suppliers are regarded as a threat when: their products
have few substitutes, their products are unique, buyers are not significant to them and
they have high switching cost as well as posing credible threat of forward integration.
The buyers bargaining power is their capacity to either effect a decline in charges on a
product/service or effect a rise in a business’ operational costs in an industry by asking
for superior products or quality services. Rivalry among firms can significantly reduce
the profitability of the players in the industry and the extent of competition among the
sector’s mature firms could be attributed to: presence of exit barriers, fixed cost amount,

14
the industry’s competitive structure, presence of international clients, and the rate of
growth of the industry as well as the demand conditions.
2.3 Porter’s Generic Competitive Strategies
Competitive strategy is part of a firm’s business strategy that deals with the
management’s plan for enabling the firm to compete effectively; indicating how the
firm would build competitive advantage that is sustainable, how it will outperform
competition and how the firm will defend itself from aggressive competitors and
external business environment pressures (Thompson & Strickland, 2007). According to
McKee and Sessions-Robinson, (1989) competitive strategy relates to a firm’s
performance against the competition and a firm which is the most productive is
regarded as the most competitive. As such competitive strategy is all about productivity.
D’Cruz and Rugman (1992) termed the intensity of competitiveness of a firm as its
capacity to map out, create and/or market their products in a manner that is more
efficient compared to its competitors, putting in consideration qualities such as the price
and other non-price qualities.
Important sources of competitiveness among firms include but are not limited to:
capabilities that are dynamic and abilities to be flexible, agile and move with speed
(Barney, 2001; Sushil, 2000). Rastogi (2008) identified the detail that incorporates
competitiveness situations as “tight and loose ends” of structural properties that can
only be met by shared values, norms, beliefs and expectations of different members of
the organization. He indicated that shared values and vision provide a stable context
within which open communication, personal responsibility for outcome and commodity
of focus are enhanced (Rastogi, 2008).

15
2.3.1 Cost Leadership
According to Porter (1985) for a firm to adopt low cost leadership as a strategy, it must
be operating under a very efficient production line and have productive systems for it
to gain a competitive edge. The firm delivers the same services to its customers as its
competitors but at a much lower cost (Porter, 1988). Low cost that results in a firm’s
competitive advantage may result from process innovations, utilization of economies
of scale, product/service designs, reduction of some processes or adoption of modern
technology.
To gain meaningful reward out of this strategy, Porter (1985) argued that the
organization must be the leader in cost in an industry and must remain unchallenged in
that position. According to Thompson (1997), cost leadership adoption as a way of
competing within the industry does not mean that a firm will sell their product or service
at the lowest price, but it implies that the firm prices its products/services in a
competitive manner and in relation to how their product is perceived by customers. Cost
leadership however, doesn’t result in much loyalty and if price is kept extremely low
the firm might fail to breakeven (Porter 1980).
2.3.2 Differentiation
A firm is capable of developing differentiation strategy with unique features which are
hard to imitate by rival firms including: the firm’s product or service quality, reputation,
customer service quality, innovativeness and reliability among others. According to
Porter (1980), a firm implementing a differentiation strategy must enjoy the advantage
of price elasticity of demand for its products or services which would as a result benefit
the firm from potential stiff competitive pricing and enable it to charge a premium price.
The effective and implementation of fruitful differentiation plans however, is

16
predicated on availability of resources, strong marketing skills, product engineering/re-
engineering, good corporate reputation as well as reliable and durable products (Porter
1980).
2.3.3 Focus
According to Davidson (2001) under focus strategy, a firm identifies and serves a niche
market which is either of a specific clientele or geographical location. A firm using
focus strategy will target a market segment with tailor-made demands at the expense of
serving the whole industry. According to Porter (1985), focus strategy comes in two
forms: low cost approach and differentiation. Cost focus exploits the disparity in cost
behavior in certain segments of the industry; while differentiation focus concentrates
on the special needs of buyers in some segments of the market (Porter, 1985).
Focus strategy can achieve competitive advantage by having special dedication to
segments that are better served by the firm than the competition. Davidson (2001)
explained that a firm using focus strategy in identifying these segments may consider
certain characteristics such as buyer behavior and patterns, product specifications, and
geographical areas. The segment market must however, be large enough and have
growth potential.
2.4 Enterprise Growth
The potential contribution and role of small and medium sized enterprises to the
economy has occupied scholarly and policy makers debate around the world for many
years. Growth enterprises according to Njeru, Namusonge and Kihoro (2012) have high
potential for grow. This however is a fallacy since not all enterprises prioritize growth
but may only come to existence with sole purpose of exploiting a brief window of
opportunity while others are content in maintaining their existing size. Growth disposed

17
enterprises are by nature future oriented and less focused on short-term profit. Variables
for evaluating enterprise growth consist of size, net assets, turnover and number of
employees.
The most valuable resources for small enterprises however are found in its human
resource capacity including those of the proprietor/owner and members of staff.
Specifically, the fate of small enterprises lies with the proprietor’s strategic disposition,
managerial and operational capability and the owner’s personal goals are crucial in
determining either the success or failure of a business (Churchill & Lewis, 1983).
There are several marketing strategies from which growth-oriented enterprises can
choose from which according to Ansoff (1965; 1987) include four specific product-
market options. These include; 1) market penetration which entails intensifying
promotional and advertising activities to grow current sales in existing markets; 2)
Market development, which entails the sale of existing products in new markets via
increased distribution area or through new channels such as the internet; 3) product
development which simply denotes the sale of new products in existing markets; and
4) diversification that consists of developing and selling new products in new markets
(Hill & Jones, 2012; Kotler & Keller, 2012).
2.5 Empirical Studies and Research Gaps
To apply Porter’s framework and to transfer it from large firms to small firms such as
startups, two modifications should be made (Namada & Bagire, 2008). According to
Namada and Bagire (2008), small firms in their early stages usually portray
characteristics like those of large firms. For small firms, their efforts are directed
towards establishing themselves through discovery or by creating a niche for competing
and little of their effort is directed at defending their position and blocking competition

18
(Namada & Bagire, 2008). Comparatively, large firms are in a much more advanced
stage of development (Namada and Bagire, 2008). The second adaptation is conditioned
on the premise that the application of Porter’s Five Forces model on a portion, instead
of the whole market (Namada & Bagire, 2008).
Wekesa (2013) sought to determine the competitive mechanisms used by MultiChoice
Kenya Ltd and assessed how such strategies created avenues for sustained competitive
advantage. The study established that MultiChoice Kenya Ltd proactively and
retroactively executed a variety of strategies which accorded it the ability to effectively
cope with the turbulent and diverse pay TV industry in Kenya. The pay TV industry
has seen increased competition which has realized a profitability drop as the customers
have to be shared with the new market entrants most of whom are coming in with a
pricing strategy.
Most small businesses target market segments that have a niche that can be exploited.
Needham and Dramsfield (2004) further asserted that a focus strategy that is targeted
at a defined market segment is more likely to give small businesses a competitive
advantage over their competitors. According to Namada and Bagire (2008), a
significant trait that cuts across several categories of competitive focus in small
businesses is the role of period a firm has been in operation. Startup companies often
have steep learning curves after their inception, but the experience gained during their
operation is easily translated into competitive advantage for these companies (Namada
and Bagire, 2008). Namada and Bagire (2008) in their study of small businesses in
exhibition halls in Nairobi found out that these businesses adopted competitive
strategies that were related to pricing and cost management as well as product and
marketing. Studies before focused on the corporate and competitive strategies adopted

19
by large firms (Ansoff, 1988, Johnson & Scholes, 2005) but the emergence of startups
and small business enterprises has drawn attention to ascertaining the competitive
strategies adopted by small businesses.

20
Table 2.1: Summary and Knowledge Gaps
Author(s) Focus of the Study Methodology Major findings Knowledge gaps
Namada
and Bagire
(2008)
Competitive strategies
employed by SMEs in
open markets in
Nairobi
Quantitative Cross-
sectional method.
Adoption of similar competitive
strategies (pricing, cost
management, product and
marketing) by business enterprises
The study focused on
Small-scale enterprises while the
current study focused on incubator
companies
Wekesa
(2013)
Competitive strategies
used by Multichoice
Kenya Limited
Case study featuring
Phone and face-to-
face interviews
Multichoice has adopted strategies
aimed at improving customer
satisfaction by introducing a new
range of channels and opening two
new branches.
The study focused on a single
company that is well established.
Current study focussed on
incubator companies.
Njeru,
Namusonge
and Kihoro
(2012)
The role of size in
determining financing
options for small-sized
enterprises in Thika
district
Empirical
descriptive survey
study design
The size and choice of source of
business financing are not directly
related and has had minimal effect
on firm growth
The study did not look at enterprise
growth
Rastogi
(2008)
Globalization
strategies and policies
Descriptive survey
approach
Maintaining competitiveness
requires continuous incremental
improvement in the function cost
and quality, cost effective design,
new processes/product technologies,
The study did not narrow down to
competitive strategies
Okpara &
Wynn,
(2007)
Challenges affecting
the growth of small
businesses in a sub-
Saharan African
market
Structured
interviews and
survey
The challenges facing start ups
comprise of weak infrastructure,
corruption, poor management and
lack of capital
The study looked at the entire sub-
Saharan Africa while the current
study focused on Kenya.

21
2.5 Conceptual Framework
The conceptual framework presents the interrelationship between variables considered
to be of great significance in a study (Kothari, 2004). Within the conceptual framework
interrelationship between variables of a study are examined. This study investigated
and analyzed the competitive strategies that are adopted by incubator companies at
Nairobi Garage while considering the forces of competition in the various industries
these companies operate. The independent variables were cost leadership,
differentiation and focus strategies while the dependent variable was enterprise growth.
Figure 2.1 shows the conceptual framework upon which this study was based.
Figure 2.1: Conceptual Framework
Source: Author, (2018)
Cost leadership strategy
Differentiation strategy
Focus strategy
Growth of incubator
companies
- Size
- Employees
- Turnover
- Profit
- Net asset

22
CHAPTER THREE: RESEARCH METHODOLOGY
3.1 Introduction
This chapter serves the purpose of stating the methods that were used for this research
work to realize the research objective and in so doing answering the research question.
The chapter contains the research design, target population, sampling design, as well as
the procedures that were used to collect and analyze data to achieve the research
objective.
3.2 Research Design
Research design explains the plan that was used to consolidate the various elements of
the study in a solid and logical manner, hence, ensuring that the research question is
effectively answered. It comprises of the approach that was used for the collection,
measurement as well as analyzing the data. This study’s focus was on profit-making
incubator companies at Nairobi Garage. The study applied cross-sectional survey
perspective that is both quantitative and qualitative in nature. Quantitative approach
was used to quantify the hypothesized influence of competitive strategies on enterprise
growth while qualitative design was used in open ended constructs meant to interrogate
a given variable further. This approach was used to enable the derivation of descriptive
and analytical analysis of the research problem.
3.3 Population
Target population were all the members of a real or assumed set of people, events or
elements from which a researcher plans to generate the findings of a given research
study. This study focused on the profit-making incubator companies at Nairobi Garage.
The companies were categorized into three categories; information technology, service

23
and trading. The full list of the 86 incubator companies that were incubated at Nairobi
Garage at the time of this study is presented in Appendix II.
Table 3.1: Population
Sector Population Percentage
Information technology 30 34.88
Service 43 50.00
Trading 13 15.12
Total 86 100.00
Source: Author, (2018)
3.4 Sample Design
The sampling frame comprised of all profit-making incubator firms in Nairobi Garage.
Profit-making incubator companies at Nairobi Garage were stratified according to the
characteristics of sector (technology, service and trading) to ensure good representation.
The size of the sample for this study was 30 respondents which is 34.88% of the
population.
Table 3.2: Sample Size
Sector Population Sample Size
Information technology 30 10
Service 43 15
Trading 13 5
Total 86 30
Source: Author, (2018)
3.5 Data Collection
Primary data from respondents was collected to achieve the research objective. Primary
data was gathered using a structured questionnaire with open-ended as well as closed
questions to achieve the research objective. Parts of the questionnaire were designed
using a 5-point Likert scale to measure respondents’ viewpoint on various items of the

24
study. A sample of the questionnaire that was used for collecting data for this study is
presented in Appendix III.
The letter in Appendix I was used to get permission to administer the questionnaires to
respondents. The questionnaire was administered using personal interviews as well as
the drop-and-pick method in cases where the respondents were not present for personal
interviews at the time of the visit by the researcher. The respondents of the study were
either founders of the incubator companies or where not applicable the managers-in-
charge of the Kenyan operations of the companies.
3.6 Data Analysis
Data from the study was analyzed both quantitatively and qualitatively. Cronbach’s
alpha coefficient was the main yardstick for ascertaining the internal consistency and
reliability of the study. The quantitative analysis of the collected data was undertaken
by way of Statistical Package for the Social Sciences (SPSS), computer software which
then was presented in form of descriptive statistics as percentages, mean scores, tables
and frequencies. Content analysis was undertaken to evaluate the qualitative data to
provide a detailed and in-depth understanding of the responses emanating from the
respondents. The unit of analysis was the profit-making incubator companies at Nairobi
Garage and data was analyzed to ascertain the competitive strategies adopted by these
companies to ensure their long-term survival.

25
CHAPTER FOUR: RESULTS, FINDINGS AND DISCUSSION
4.1 Introduction
This chapter presents analysis of data, interpretations and discussions. In this chapter
data is presented and discussed to meet the research objectives. The unit of analysis was
the profit-making incubator companies at Nairobi Garage and data was analyzed to
ascertain the competitive strategies adopted by these companies to ensure their long-
term survival. Data from the study was analyzed both quantitatively and qualitatively.
An analysis of content was used to analyze the qualitative data to provide detailed as
well as in-depth understanding of the responses emanating from the respondents.
4.2 Response Rate
Detailed and well thought through questionnaires were designed and distributed to the
managers of the incubator companies. To make the analysis more comprehensive a total
of 30 questionnaires were administered. All the 30 questionnaires were satisfactorily
filled and returned. This is a 100 percent response rate which was excellent according
to postulation of Mugenda and Mugenda (2003).
Table 4.1: Response rate
Sector Questionnaires
Administered
Questionnaires filled
and returned
Response
Rate
Information
technology
10 10 100.00
Service 15 15 100.00
Trading 5 5 100.00
Total 30 30 100.00
Source: Field survey, 2018

26
4.3 Company Profile
The study set out to find out the incubator companies’ general profile which included:
how long they had been in operation in Kenya, branches outside Kenya, form of
company ownership and number of employees in the company.
4.3.1 Years of Operation in Kenya
As part of the general profile, the study sought to establish the period the companies
had operated in Kenya. Based on the findings, 44% of the companies had operated in
Kenya for a period of between 3 and 5 years. Further findings indicated that 33% had
operated in Kenya for over 5 years while 23% had operated in Kenya for 2 years and
below. The findings are displayed in figured 4.1.
Figure 4.1: Years of Operation in Kenya
Source: Field survey, 2018
4.3.2 Branches outside Kenya
The study also sought to establish the number of branches outside Kenya that the
incubator companies had. The findings revealed that majority (70%) had no branches
23%
44%
33%
0%
5%
10%
15%
20%
25%
30%
35%
40%
45%
50%
0 to 2 years 3 to 5 years Over 5 years
Years of operation

27
outside Kenya as they were owned locally while only 24% of the companies had
established branches outside Kenya as shown in figure 4.2.
Figure 4.2: Branches outside Kenya
Source: Field survey, 2018
4.3.3 Company Ownership
In terms of form of company ownership, the study established that majority (63%) were
locally owned while 20% were both locally and foreign owned. Only 17% were wholly
foreign companies. This corroborates the findings above that majority of the incubator
firms did not have branches outside Kenya. Figure 4.3 illustrates the key findings of the
study.

28
Figure 4.3: Company Ownership
Source: Field survey, 2018
4.3.4 Number of Employees
The study also sought to establish the number of employees in the incubator firms.
Based on the findings, 53% of the companies had between 1 to 10 employees while
37% had between 11 to 20 employees. Further findings indicated that 10% of the
companies had over 30 employees. The findings imply that majority of the incubator
companies are startups or SMEs hence the small number of employees.
0%
10%
20%
30%
40%
50%
60%
70%
Local Foreign Both
63%
20% 17%
Form of Company Ownership

29
Figure 4.4: Number of Employees
Source: Field survey, 2018
4.4. Competition
It was established that many of the business incubator firms were providing services
and products falling in three categories: Information and communication technology,
service and trading. Several challenges are faced by incubator companies. These
include: stiff competition, the need and capacity to cope with the ever-changing market
demands, rapid technological variations, and ability related limitations in the areas of
knowledge, innovation, and creativity. The major competitors of incubator companies
were other well established local and foreign firms in Kenya dealing with products and
services like those offered by the incubator firms. The respondents also indicated that
availability of close substitutes also puts pressure on the incubator companies.
The study also sought to establish the factors determining the intensity of competition
among the incubator firms. The respondents agreed that competitive rivalry was among
53%
37%
10%
0%
10%
20%
30%
40%
50%
60%
1 to 10 11 to 20 Above 30
Number of employees

30
the factors that determine competition intensity. This was depicted with a mean of 4.05
and a standard deviation of 0.71842. Other factors included: bargaining power of buyers
(M=3.938, SD=.68636), bargaining power of suppliers (M=3.725, SD=.70732), threat
of new entrants (M=4.093, SD=.68906) and existence of substitute goods/services
(M=4.013, SD=.77186). These findings are presented in table 4.2.
Table 4.2: Factors Determining Intensity of Competition
Factors determining intensity of
competition
Mean Std. Deviation
Competitive rivalry 4.050 .71842
Buyers bargaining power 3.938 .68636
Suppliers bargaining power 3.725 .70732
Threat posed by new firms 4.093 .68906
Existence of substitute goods/services 4.013 .77186
Source: Field survey, 2018
Porter (1980) indicated that there exist five competitive forces in every sector which
jointly define the intensity of competition and profitability of the industry. Competing
industry players makes the first competitive force and affect the competitive
environment of every industry. Various competitive forces provide different influences
in every industry and distinct technical and economic characteristics that determine the
intensity of competition.
4.5 Competitive Strategies
The study also sought to investigate the level to which the studied incubator business
entities had adopted competitive strategies listed in table 4.3. The findings indicated
that the incubator companies adopted cost leadership strategy to a large extent as
depicted by a mean of 3.8313 and a standard deviation of 0.6948. The incubator

31
companies adopted differentiation and focus strategies to a large extent as supported by
a means 4.0188 and 3.9687 respectively. Table 4.3 shows the summary of the findings.
Table 4.3: Competitive Strategies
Strategy Mean Std. Deviation
Cost Leadership Strategy 3.8313 .6948
Differentiation Strategy 4.0188 .8321
Focus Strategy 3.9687 .6468
Source: Field survey, 2018
The study findings imply that cost leadership strategy enables incubator companies to
maintain their market share through reducing of cost. Therefore, they can vary the
prices of goods and services to counter rivalry posed by substitutes and rivals who lower
their prices to appeal to more customers. The results also show that majority of the
respondents agreed that information and communication technology has increasingly
been an important tool used in differentiation strategy for incubator companies because
it enables firms to reduce cost and keep abreast with the new trends in the industry.
Further findings show that focus strategy is critical in incubator companies.
4.6 Competitive Advantage
The study sought to establish the competitive advantage of the incubator companies.
The respondents were presented with various sources of competitive advantage to rate
on a 5-point Likert scale. Findings indicated that company’s resource was a source of
competitive advantage to a great extent as shown by a mean of 3.9244. It was also
established that technology adoption and customer service was a source of competitive
advantage as represented by mean of 4.1095 and 3.8952 respectively. Further findings
showed that other sources of competitive advantage that were adopted to a great extent
were: company reputation (M=3.8333, SD=.9338), superior or unique

32
products/services (M=4.0750, SD=.7040) and low prices charged on products/services
(M=3.5095, SD=.8477). Table 4.4 show a summary of further findings of the study.
Table 4.4: Competitive Advantage
Sources of competitive advantage Mean Std. Deviation
Company’s resources 3.9244 .7062
Technology adoption 4.1095 .8737
Customer service 3.8952 .6373
Company reputation 3.8333 .9338
Superior or unique products/services 4.0750 .7040
Low prices charged on products/services 3.5095 .8477
Source: Field survey, 2018
A firm has competitive advantage when it implements the strategy of value creation
which cannot be easily copied and replicated by other rivals. It is therefore crucial for
incubator companies to gain, sustain and increase competitive advantage by using
unique resources in their disposal. The incubator companies should also do external
environmental analysis to spot opportunities and threats. Similarly internal
environmental analysis should be done to ascertain and make use of unique
competencies.
4.7 Enterprise Growth
To measure enterprise growth of the incubator companies, the respondents were asked
to evaluate their growth over the last five years using the following dimensions:
enterprise growth, company profits, market share and number of employees. The year
2012 was set as the benchmark which was equal to 100%. The findings are presented
as illustrated in table 4.5.

33
Table 4.5: Enterprise Growth
Constructs
considered
Annual growth or decline as a percentage (%) age Average
Annual
growth 2012=100% 2013 2014 2015 2016 2017
Company
profits
100% 22 23 23 24 31 24.6
Employee
numbers
100 2 2 3 3 3 3
Market
Share/Number
of customers
100% 22 23 23 24 24 23.2
Enterprise
turnover
100% 15 15 20 21 24 19
Source: Field survey, 2018
From the findings on enterprise growth with 2012 being the base year and benchmarked
at 100%, the year 2013 company profits had a score of (22%), the year 2014 was (23%),
the year 2015 score was (23%), a mean score of (24%) for 2016 with the year 2017
having the highest average profit of (31%). In terms of the number of employees, there
was an average increase of 2 employees in 2013, 2 in 2014, of 3 in 2015, of 3 in 2016
with a mean of 3 employees in 2017. The market share increased by 22% in 2013 and
23% in 2014 and 2015. In 2016 and 2017, the market share increased by (24%) showing
a positive increase of (1%) as compared to the previous years. enterprise turnover was
highest in 2017 with a mean of 24%.
4.8 Correlation Analysis
In seeking to establish the competitive advantage of the incubator companies, Pearson’s
Product Moment Correlation was used. The study examined the independent variables’
(sources of competitive advantage) and dependent variable (enterprise growth) at a
confidence level of 95%. The range in Pearson Product Moment of Correlation is given
as: -1˂ r +1; where 0 to 0.29 is considered a weak positive correlation, 0.3-0.49 is a
moderately positive correlation; and 0.5-1 implying strong positive correlation. On

34
negative correlations, the reverse holds where 0 to -0.29 is a weak negative correlation;
-0.3 to -0.49 moderately negative correlation; and -0.5 to -1 corresponding to strong
negative correlation. The findings are summarised in table 4.6.
Table 4.6: Correlation Analysis
The results indicate that all the predictor variables namely: company’s resources,
technology adoption, customer service, company reputation, superior products/services
and low prices on products/services has positive but strong relationship with enterprise
growth. Technology adoption, superior products/services and company’s resources had
very strong correlation coefficients of 0.827, 0.805 and 0.706 respectively. The
correlation coefficients of customer service, company reputation and low prices on
products/services were 0.638, 0.622 and 0.520 respectively. The correlation
coefficients were positive and statistically significant implying that an increase in any
of the predictor variables would lead to an increase in enterprise growth for the
incubator companies.
Company’s
resources
Technology
adoption
Customer
service
Company
reputation
Superior
products/services
Low prices on
products/services
Enterprise
Growth
Company’s
resources
1
Technology
adoption
0.904 1
Customer
service
0.554 0.639 1
Company
reputation
0.853 0.509 0.710 1
Superior
products/services
0.906 0.723 0.519 0.5091 1
Low prices on
products/services
0.765 0.681 0.470 0.8227 0.6773 1
Enterprise Growth 0.706 0.827 0.638 0.622 0.805 0.520 1

35
4.9 Discussion
It was established that the incubator companies are facing stiff competition from other
local and foreign companies in Kenya. The factors determining the intensity of
competition among the incubator firms were: competitive rivalry, ability of buyers to
bargain, abilities of suppliers to bargain, and the constant threat of new market entrants
as well as the existence of substitute goods/services.
Organizations often have different objectives. Several entities are enterprises focusing
on growth, yet some are more traditionally focused (Covin & Slevin, 1991). A variety
of stakeholders in the incubation sector prioritize their goals differently (Freeman,
1984). Governments and local societies may underscore the value of job creation and
revenues generated through tax collections; the priority for venture capitalists on the
other hand rests on profits or return on their investment, while proprietors or
management would focus on firm’s contribution toward the creation of nice, safe and
attractive environment. Firms’ objectives also often vary with the size and age of the
organization.
According to Porter (1985) for a firm to adopt low cost leadership as a strategy, it must
be operating under a very efficient production line and have productive systems for it
to gain a competitive edge. The firm delivers the same services to its customers as its
competitors but at a much lower cost (Porter, 1988). A firm implementing a
differentiation strategy must enjoy the benefit of price elasticity of demand for its
products or services which would as a result benefit the firm from potential severe price
competition and enable it to charge a premium price. Focus strategy can achieve

36
competitive advantage by having special dedication to segments that are better served
by the firm than the competition.
In the field of Strategic Management, researchers have taken crucial steps towards the
classification of competitive strategy. More precisely, the formulation of strategy-
structure performance approach has immensely enhanced the understanding of how
businesses adapt to the ever-changing market place environment (Porter, 1980).
According to (Mintzberg, 1988), the primary framework of these exigency strategic
prototypes is to provide the basis of linkages between conditions in the market and the
strategic and organizational competencies of business entities. A few of these studies
explored the strategies and resources in small organizations; majority however, often
concentrated on large organizations (Smith, Guthrie, & Chen, 1989). Most studies do
focus on large corporations which compete internationally about their strategies and
resources (Kim & Lim, 1998). On the contrary, in many countries and industries
markets are often characterized by small-scale manufacturing firms and limited
competition across the region. Such markets often have many of small firms, each with
relatively low market shares.
Porter (1980) is a major contribution in the understanding of the concept of competitive
strategy. He makes clear distinction between differentiation and cost leadership, for
instance in pricing tactics and holds that the two methods may not necessarily have the
same level of focus. Differentiation and cost leadership should be viewed from the
different ends of a continuum which as a result may not occur concurrently. Generally,
micro small enterprises are often expected to adopt differentiation mechanisms because
such firms rarely benefit from the adoption or utilization of economies of scale. In a
study conducted by Segev (1989), a comparison is made between differentiation

37
strategies and Miles and Snow's (1978) prospectors while cost leadership (price
strategies) could assume or be weighed against the role of defenders.
The findings of the study are supported by the propositions of resource-based theory
and Porter’s Five Forces Model. Resource based theory supports the fact that the
incubator companies at the Nairobi Garage leverage on company’s resources to produce
unique products and services. This means that the resources they possess are valuable,
rare, inimitable, non-substitutable hence becoming a source of competitive advantage.
These resources involve all assets, processes, capabilities, knowledge, information and
firm attributes controlled by an organization that can be used to formulate and
implement strategies that increase effectiveness and efficiency leading to superior
performance. Based on the Resource based theory, competitive advantage of a firm
depends on the resources a firm has in its possession that sets it apart from the rivals.
These resources must have the following characteristics; durability, inimitability and
non-substitutability (Zaridis, 2009). Some of the incubator companies have strong
intangible assets while others have tangible assets; both assets enable them to create
competitive advantage ahead of their competitors. The resources that are easy to
identify include; technological, financial, human resource, and physical resources.
The findings of the study concur with Porter’s Five Forces Model. This is because the
incubator companies at the Nairobi garage just like any other firm in the market face
the five competitive forces, namely; bargaining power of suppliers, bargaining power
of customers, threat of substitutes, threat of new entrants and rivalry among existing
firms. Arising from technological advancement and competition, the business strategies

38
are dynamic and changing to acquire greater standards across all the business
operations.
Porter indicates that companies can record superior performance by implementing
multiple strategies to develop distinct business units for each of the strategy because
clients usually seek multiple traits of a product to gain optimum utility. This mix could
be price, quality, style or convenience among other characteristics of products and
services (Barney, 2007). The adoption of this theory by incubator companies is likely
to steer their competitiveness to enable them to survive in the industry in which they
operate. The incubator companies studied recorded a steady growth over the last five
years. In terms of short or long term strategy objectives, growth-oriented enterprises
are more inclined to pursuing long-term growth rather than short-term gains. The
identified measures of enterprise growth variables consist of: profits, number of
employees, turnover and market share.

39
CHAPTER FIVE: SUMMARY, CONCLUSIONS AND
RECOMMENDATIONS
5.1 Introduction
This chapter summarizes the study and draws conclusion from the findings. The
recommendations of the study and areas for further research are also discussed.
5.2 Summary of Findings
It was established that many of the business incubator firms were providing services
and products falling in three categories: Information and communication technology,
service and trading. The challenges facing the incubator companies include intense
competition, their potential capacity to adjust to fast and dynamic market demands,
constant technological changes, and capacity inadequacies associated with knowledge,
creativity and innovation. It was also established that the major competitors of incubator
companies were other well established local and foreign firms in Kenya dealing with
products and services like those offered by the incubator firms. The respondents also
indicated that availability of close substitutes also put pressure on the incubator
companies. The study also investigated the factors determining the intensity of
competition among the incubator firms. The respondents agreed that competitive
rivalry was among the factors that determined intensity of competition. The other
factors include: the ability of buyers and suppliers to bargain, threat of new entrants in
the market and existence of alternate goods/services.
The study also set out to determine the extent to which the incubator companies had
adopted competitive strategies. The respondents indicated that the incubator companies
adopted cost leadership strategy to a large extent. In addition, the incubator companies
also adopted differentiation and focus strategies to a large extent.

40
The findings indicated that company’s resources were to a large degree responsible for
generating competitive advantage. The study also found out that the adoption of
technology and customer service were sources of competitive advantage. Further
findings showed that other sources of competitive advantage that were adopted to a
great extent were: company reputation, superior or unique products/services and low
prices charged on products/services.
To measure their enterprise growth, the respondents were asked to evaluate their growth
over the last five years using the following dimensions: enterprise profits, employee
numbers, market share/number of customers, and enterprise turnover/growth in sales.
All these were benchmarked to 100% in 2012 as the base year. The incubators recorded
stable growth over the last five years.
5.3 Conclusions
The study revealed that for the incubator companies to ensure that they apply
sustainable competitive strategies, they must constantly monitor other companies and
businesses, as well as scan their operating environment, to overcome all the challenges
that may impede their pursuit of organizational goals. Any business should strive to
satisfy a real customer need. Usually, identifying a customer need is the first step to
creating a business. The first step of formulating a competitive strategy framework is
therefore to identify a real need that exists for a specific customer segment.
The conclusion made from the findings therefore is that cost leadership or low cost
mechanism is best implemented in a scenario where a business organization; plans,
produces and markets its products more efficiently than its rival or competitors. In this
case, enterprises need not forego profits or revenues to occupy the position of a cost

41
leader since the same result can be gotten through the attainment of a large market
share.
From the study it can be concluded that innovation occupies a central place in the
formulation of differentiation strategies. Innovation ultimately results into processes,
services and products that make the firm more competitive. However, there are inherent
risks linked to the use of differentiation strategy as an exclusive source of competitive
advantage. These risks include replication by competitors and susceptibility to
changing client tastes or preferences. Incubator companies must be alert to such threats
by continuously scanning the market to ensure such risks are identified early enough
and ensure necessary steps are taken to mitigate the risk to defend their market share.
It is also concluded that a cultivating a closer and much stronger relationship with
clients can be attained by a business firm through the use of focus strategy which
facilitates the monitoring of customers’ needs. The risks associated with focus strategy
emanates from its vulnerability to the industry’s bigger players such as suppliers. This
is due to the fact that smaller firms transacts in smaller quantities and cannot therefore
take advantage of the economies of scale.
5.4 Recommendations from the study
It is the recommendation of the study that incubator companies invest and make
maximum use of cost leadership strategies particularly by developing a close
networking relationship with suppliers; service providers, and; other supplementary
entities capable of facilitating the development of competitive advantage in the market.
The management of incubator companies ought to focus and invest more on
differentiation as it could be used as a major competitive advantage tool against

42
competitors in the industry and it can guarantee the long-term survival of the
organization. In the long term, it is recommended that incubator firms invest and put
emphasis on differentiation strategies that will help them reap the benefits of strong
brands in the market.
From the foregoing findings and conclusions, the study recommends that incubator
companies should consider various factors in coming up with competitive strategies.
These are the operating environment factors as well as the competitive environment
monitoring, which changes over short periods of time. Incubator companies must
develop processes of collecting intelligence in the markets they operate from, integrate
best practices that are at par with optimal international standards and ensure they stay
in touch to receive real-time feedback from customers. This is most important as it
guarantees continuous upgrading of the firms’ products based on prevailing market
demands.
5.5 Limitations of the Study
There were limitations identified in this study which could be impediments to the
research, and they constituted potential vulnerabilities that arose from available data
including the sample size. Another limitation is related to non- cooperation with
some of the respondents who refused to fill in the questioners that were provided hence
limitation on information gathered.
5.6 Suggestions for Further Research
The scope of this study was constrained to incubator companies at Nairobi Garage. The
study therefore strongly suggests that a similar study could be undertaken on other
incubation hubs to determine concurrence with results of this study. This study also

43
suggests that a research study could be carried out to determine factors influencing
effective implementation of competitive strategies by incubator companies.

44
REFERENCES
Amezcua, A. S. (2010) Boon or Boondoggle? Business Incubation as
Entrepreneurship Policy. Unpublished manuscript. Martin J. Whitman School
of Management.
Ansoff, I. (1988). Corporate Strategy, McGraw Hill, London.
Ardichvili, A., Cardozo, R. & Ray, S. (2003). A theory of entrepreneurial opportunity
identification and development. Journal of Business Venturing 18 (1), 105-
123.
Barney (1997). Gaining and Sustaining Competitive advantage. New York Addison –
Wesley Publishing Company.
Barney J, Wright M. and Ketchen D. J. (2001). The Resource-based View of the
Firm: Ten Years after 1991, Journal of Management, 27(6), Pergamon, 625–
641.
Blank S. (2013, June 24). The 6 types of Startups. The Wall Street Journal. Retrieved
from https://blogs.wsj.com/accelerators/2013/06/24/steve-blank-the-6-types-
of-startups-2/
Changi M. (2013, October 5). Business Incubation. Slide Share. Retrieved from:
https://www.slideshare.net/mustafachangi/business-incubation-
26891501Competitiveness.Journal of Manufacturing, 3, 35–9.
D’Cruz J and A Rugman (1992). New Concepts for Canadian Competitiveness,
Kodak,
Davidson, S. 2001. “Seizing the Competitive Advantage”, Community Banker, 10(8),
Dee, N.J. et al. (2011) Incubation for Growth. A review of the impact of business
incubation on new ventures with high growth potential. London: NESTA.
Johnson, G., & Scholes, K. (2005). Exploring corporate strategy (7th Ed.). New
Delhi,
Kothari C. R., (2004). Research Methodology: Methods and Techniques. New Delhi:
New Age International (P) Ltd, Publishers.
McKee K. and C Sessions-Robinson (1989). Manufacturing Productivity and
Moyi, E. (2005). Micro and small enterprises in Kenya; Improving public policy
making for economic growth and poverty eradication, Kippra Policy Monitor,
3(1), 1-8.
Mwangi Z. (2016). The 2016 National Micro, Small and Medium Establishment
(MSME) Survey. Kenya National Bureau of Statistics, pp. 35.
Namada J.M. and Bagire V. (2008). Competitive strategies adopted by small-scale
enterprises in exhibition halls in Nairobi. Business Management review, 12
(2), 33 -51.
45
Needham, D. and Dramsfield, R. (2004). Advanced Business, Heinmann Educational
Nickols F. (2016). Three forms of strategy. Distance Consulting. Retrieved from:
http://www.nickols.us/three_forms.pdf
Njeru, A.W., Namusonge, G.S., & Kihoro, J.M. (2012). Determinants of choice of
entrepreneurial finance for small and medium sized enterprises: A survey of
Thika District. Journal of Human Resource and Entrepreneurship
Development, 4(1), 109-117.
Okpara, J. O., & Wynn, P. (2007). Determinants of Small Business Growth
Constraints in a Sub Saharan African Economy. SAM Advanced Management
Journal.
Porter, M.E. (1980). Competitive strategy: Techniques for analyzing industries and
competitors. New York: Free Press.
Porter, M.E. (1985). Competitive advantage: Creating and sustaining superior
performance. New York: Free Press.
Porter, M.E. (1986). Competitive strategy. Harvard Business School Press. Publishers.
Quartz Africa (2016, August 17). The number of tech hubs across Africa has more
than doubled in less than a year. Retrieved from: https://qz.com/759666/the-
number-of-tech-hubs-across-africa-has-more-than-doubled-in-less-than-a-
year/
Rastogi D.N. (2008) Globalization strategies and policies. Allied Press Private.
Reid, C. G. (1993). Small Business Enterprise: An Economic Analysis, Routledge,
London.
Rothaermel, F. T. (2012). Strategic Management: Concepts and Cases (p. 5).
McGraw-Hill/Irwin.
Rothschild, W. E (1994). How to Gain (and Maintain) Competitive Advantage in
Business. McGraw – Hill, New York.
Sushil (2000) Flexibility in Management. Vikas Publishing House, New Delhi.
Thompson, J. L. (1997). Strategic management: Awareness and change (3rd Ed.).
New York, USA: McGraw-Hill.
Thompson, Jr. A.A., & Strickland, A.J. (2007). Crafting and executing strategy:
Concepts and cases (5th Ed.). New York, USA: McGraw-Hill.
Wekesa E. (2013). Competitive strategies adopted by Multichoice Kenya Limited.
Unpublished Master’s project, University of Nairobi, Nairobi, Kenya.

46
APPENDICES
Appendix I: Letter of Introduction
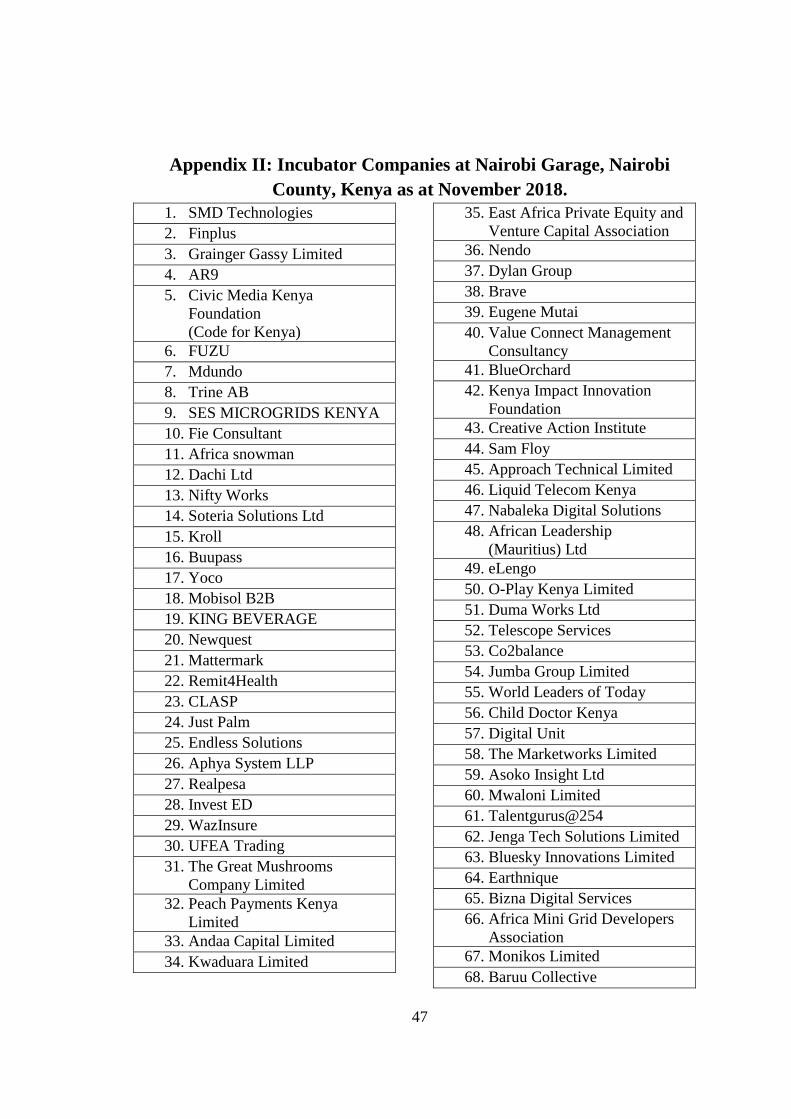
47
Appendix II: Incubator Companies at Nairobi Garage, Nairobi
County, Kenya as at November 2018.
1. SMD Technologies
2. Finplus
3. Grainger Gassy Limited
4. AR9
5. Civic Media Kenya
Foundation
(Code for Kenya)
6. FUZU
7. Mdundo
8. Trine AB
9. SES MICROGRIDS KENYA
10. Fie Consultant
11. Africa snowman
12. Dachi Ltd
13. Nifty Works
14. Soteria Solutions Ltd
15. Kroll
16. Buupass
17. Yoco
18. Mobisol B2B
19. KING BEVERAGE
20. Newquest
21. Mattermark
22. Remit4Health
23. CLASP
24. Just Palm
25. Endless Solutions
26. Aphya System LLP
27. Realpesa
28. Invest ED
29. WazInsure
30. UFEA Trading
31. The Great Mushrooms
Company Limited
32. Peach Payments Kenya
Limited
33. Andaa Capital Limited
34. Kwaduara Limited
35. East Africa Private Equity and
Venture Capital Association
36. Nendo
37. Dylan Group
38. Brave
39. Eugene Mutai
40. Value Connect Management
Consultancy
41. BlueOrchard
42. Kenya Impact Innovation
Foundation
43. Creative Action Institute
44. Sam Floy
45. Approach Technical Limited
46. Liquid Telecom Kenya
47. Nabaleka Digital Solutions
48. African Leadership
(Mauritius) Ltd
49. eLengo
50. O-Play Kenya Limited
51. Duma Works Ltd
52. Telescope Services
53. Co2balance
54. Jumba Group Limited
55. World Leaders of Today
56. Child Doctor Kenya
57. Digital Unit
58. The Marketworks Limited
59. Asoko Insight Ltd
60. Mwaloni Limited
61. Talentgurus@254
62. Jenga Tech Solutions Limited
63. Bluesky Innovations Limited
64. Earthnique
65. Bizna Digital Services
66. Africa Mini Grid Developers
Association
67. Monikos Limited
68. Baruu Collective

48
69. Meltwater Entrepreneurial
School of Technology
70. Edel Digital
71. Annona
72. Tripple D Media.
73. Scopic Africa
74. Africa Social Financing Centre
Ltd
75. Noah Hofmann
76. Tendo Software Technologies
77. DAVN Experience Limited
78. Upscale Dynamics
79. Crypto Adoption
80. Biashara Savvy Limited
81. Aeternity Africa
82. African Leadership Finance
company
83. Derisked Limited
84. Brian Prince
85. BGI Europe
86. Asaana Solutions Limited
Source: Nairobi Garage (2018)

49
Appendix III: Questionnaire
Answer all the questions by ticking where necessary and filling in the spaces provided as
appropriate. (All the information provided will be regarded as confidential).
TOPIC: COMPETITIVE STRATEGIES FOR ENTERPRISE GROWTH ADOPTED BY
INCUBATOR COMPANIES AT NAIROBI GARAGE, NAIROBI COUNTY, KENYA
SECTION A: COMPANY PROFILE
1. What is your company’s name? ……………………………………
2. For how long has the company been operational in Kenya?
0 – 2 years 3-5 years More than 5 years
3. Does your company have other branches outside Kenya?
Yes No
If yes, specify countries …………………………………………………….
4. What is the form of ownership of your company in Kenya?
Local Foreign Both
5. What is your company size in terms of employee numbers in Kenya?
1-10 11-20 21-30 Above 30
In the sections that follow, please answer in relation to your company’s Kenyan operations.
SECTION B: COMPETITION
6. What is your core business activity in terms of service/product offering?
…………………………………………………………………………………………
……………………………………………………………………………………
7. Competition usually happens when two or more organizations act independently to
sell their products/services to the same group of buyers:
a. Who do you consider as your major competitors?
…………………………………………………………………………………
……………….…………………………………………………………………
How would you describe the level of competition in the market in which you
serve?

50
…………………………………………………………………………………
…………………………………………………………………………………
…………………………………………………………………………
8. The availability of substitute services or products in any market will give customers
choices as well as affect price that a company can charge for their product or service:
a. Does substitute products/services for your products/services exist in the
market?
Yes No
b. If so how do you ensure that you remain relevant to your customers given the
availability of substitutes?
…………………………………………………………………………………
…………………………………………………………………………………
…………………………………………………………………………
9. Any sustainable business should have a reliable supplier network and build a good
relationship with them. In view of this;
a. Do you have any major suppliers you are dealing with?
Yes No
b. How long have you had a business relationship with your longest standing
suppliers? ………………………………………………………………..
c. Have you experienced any difficulties in your supply chains?
…………………………………………………………………………………
…………………………………………………………………………………
…………………………………………………………………………
If yes, how did this affect your operations and competitiveness?
…………………………………………………………………………………
…………………………………………………………………………………
…………………………………………………………………………

51
10. The startup environment is very dynamic with potential new entrants in different
industries given the supportive business environment Kenya is enjoying now.
a. Have you had to make any significant adjustments in the past because of new
entrants in the market to remain competitive?
………………………………………………………………………………………
………………………………………………………………………………………
………………………………………………………………………
b. Are there any challenges posed to your company with the entry of new
competitors into the market? Explain
………………………………………………………………………………………
………………………………………………………………………………………
………………………………………………………………………
11. To what extent does the following factors contribute to the level of competition in the
industry in which your company operate?
[5] Very Great Extent [4] Great Extent [3] Moderate Extent [2] Low Extent
[1] Very Low Extent to Not at all
Factor determining
intensity of
competition
Intensity of competition
1 2 3 4 5
Competitive rivalry
Bargaining power of
buyers
Bargaining power of
suppliers
Threat of new entrants
Existence of substitute
goods/services

52
SECTION C: COMPETITIVE STRATEGIES
12. To what extent does your company adopt any of the listed strategies?
5-point Likert scale where: 5=Very Great Extent, 4=Great Extent, 3=Moderate Extent, 2=Low
Extent, 3=Very low extent.
Strategy Level of Adoption
1 2 3 4 5
Cost Leadership
Strategy
Differentiation Strategy
Focus Strategy
13. How do you price your products/services? (Tick as appropriate)
Above competitor prices Same as competitor prices
Below competitors’ prices Don’t know
14. Which competitive strategies does your company use to ensure it survive in the
turbulent market? List as many as is applicable.
SECTION D: COMPETITIVE ADVANTAGE
15. Indicate where appropriate, the extent to which the following contribute to your
company’s competitive advantage in the industry.
[1] Very Great Extent [2] Great Extent [3] Moderate Extent [4] Low Extent
[5] Very Low Extent to Not at all
Sources of competitive
advantage
Contribution to Competitive Advantage
1 2 3 4 5
Company’s resources

53
Technology adoption
Customer service
Company reputation
Superior or unique
products/services
Low prices charged on
products/services
16. By targeting a group of customers in the market, a company can attract and maintain
customers.
a. Who is your target market?
…………………………………………………………………………………
…………………………………………………………………………
b. How do you ensure you stay visible to your customers?
…………………………………………………………………………………
……………………………………………………………………………
17. What major advantages would you say you have over your competitors?
…………………………………………………………………………………………
……………………………………………………………………………………
SECTION E: ENTERPRISE GROWTH
18. Provide the percentage increase or decrease in the following. The benchmark is 10%
Constructs
considered
Annual growth or decline as a percentage (%) age Overall
Annual
growth 2012=100% 2013 2014 2015 2016 2017
Company
profits
Employee
numbers
Market
Share

54
Enterprise
turnover
Net assets
ROI, ROS
and ROE
16. On overall, how would you rate the success of your enterprise for the past 5 years?
Exceptional growth Satisfactory growth No growth
Negative Growth