Competition modulates the adaptation capacity of forests to climatic stress: insights from recent...
12
Competition modulates the adaptation capacity of forests to climatic stress: insights from recent growth decline and death in relict stands of the Mediterranean fir Abies pinsapo Juan Carlos Linares 1 *, Jesu´s Julio Camarero 2 and Jose´ Antonio Carreira 3 1 Departamento de Sistemas Fı´sicos, Quı´micos y Naturales, Universidad Pablo de Olavide. Ctra. Utrera km. 1, 41002 Sevilla, Spain; 2 ARAID, Instituto Pirenaico de Ecologı´a (CSIC). Apdo. 202, 50080 Zaragoza, Spain; and 3 Departamento de Biologı´a Animal, Biologı´a Vegetal y Ecologı´a, Universidad de Jae ´n, Ed. B3, Paraje las Lagunillas s ⁄ n, 23071, Jae ´n, Spain Summary 1. Long-term basal area increment (BAI) in Abies pinsapo was studied to investigate the way density-dependent factors modulate the responses of radial growth to climatic stresses in relict stands of a drought-sensitive Mediterranean fir. 2. First, we verified that spatially explicit competition predicts mean A. pinsapo BAI at our study site; i.e. it modulates the degree to which the average climate-driven potential for growth is expressed. Second, we verified that the long-term pattern of temperature predicts the long-term pattern of BAI, estimated as the main trend over a time period of c. 40 years. Finally, we assessed whether the intensity of tree-to-tree competition restrains the potential improvements achieved by our model of BAI when a short-term, high-frequency stressor such as drought (inter-annual precipitation variability) is introduced. 3. We applied Dynamic Factor Analysis (DFA) to characterize regional climatic trends and to test the hypothesis that trees subjected to contrasting competition intensity may differ in their growth pattern. Significant long-term climate trends obtained by DFA were used as predictors of long-term BAI. 4. The mean BAI was mainly determined by competition, whereas growth trends obtained by DFA did not differ among dominant, suppressed and dying trees. Common trends of growth decline were strongly related to long-term, late-winter to summer temperatures, while the residuals were related to total annual precipitation, although with decreasing significance as competition increased. Our results support the contention that the reported patterns of A. pinsapo growth decline and death occur as a result of the interacting effects of both competition and climate stressors acting at long- and short-term time scales. 5. Synthesis. Long-term climatic drought stress was the main driving factor of growth decline in A. pinsapo. Moreover, trees already suffering from competition (a long-term stress) were predis- posed to decline given an additional short-term stress, such as a severe drought. Key-words: Abies pinsapo, adaptive capacity, basal area increment, climatic change, compe- tition, drought, Dynamic Factor Analysis, global warming, linear mixed models, vulnerability Introduction Both drought and stand structural changes have the potential to profoundly alter the growth and vigour of tree populations (Saxe et al. 2001; Sarris, Christodoulakis & Ko¨rner 2007; Thuiller et al. 2008). Trees of different sizes and crown classes compete differently for light, water and other resources within a stand (Peet & Christensen 1987; Orwig & Abrams 1997). Thus, depending on stand structural attributes, a same type of forest community might exhibit different ecological thresholds and regime shifts in the face of changing climatic conditions (Andersen et al. 2008). Nevertheless, the interacting effects of *Correspondence author. E-mail: [email protected] Journal of Ecology 2010, 98, 592–603 doi: 10.1111/j.1365-2745.2010.01645.x ȑ 2010 The Authors. Journal compilation ȑ 2010 British Ecological Society
-
Upload
independent -
Category
Documents
-
view
0 -
download
0
Transcript of Competition modulates the adaptation capacity of forests to climatic stress: insights from recent...
Competition modulates the adaptation capacity of
forests to climatic stress: insights from recent growth
decline and death in relict stands of the Mediterranean
fir Abies pinsapo
Juan Carlos Linares1*, Jesus Julio Camarero2 and Jose Antonio Carreira3
1Departamento de Sistemas Fısicos, Quımicos y Naturales, Universidad Pablo de Olavide. Ctra. Utrera km. 1,
41002 Sevilla, Spain; 2ARAID, Instituto Pirenaico de Ecologıa (CSIC). Apdo. 202, 50080 Zaragoza, Spain; and3Departamento de Biologıa Animal, Biologıa Vegetal y Ecologıa, Universidad de Jaen, Ed. B3, Paraje las Lagunillas
s ⁄n, 23071, Jaen, Spain
Summary
1. Long-term basal area increment (BAI) in Abies pinsapo was studied to investigate the way
density-dependent factors modulate the responses of radial growth to climatic stresses in relict
stands of a drought-sensitiveMediterranean fir.
2. First, we verified that spatially explicit competition predicts mean A. pinsapo BAI at our study
site; i.e. it modulates the degree to which the average climate-driven potential for growth
is expressed. Second, we verified that the long-term pattern of temperature predicts the long-term
pattern of BAI, estimated as the main trend over a time period of c. 40 years. Finally, we assessed
whether the intensity of tree-to-tree competition restrains the potential improvements achieved by
our model of BAI when a short-term, high-frequency stressor such as drought (inter-annual
precipitation variability) is introduced.
3. We applied Dynamic Factor Analysis (DFA) to characterize regional climatic trends and to test
the hypothesis that trees subjected to contrasting competition intensity may differ in their growth
pattern. Significant long-term climate trends obtained byDFAwere used as predictors of long-term
BAI.
4. Themean BAI wasmainly determined by competition, whereas growth trends obtained byDFA
did not differ among dominant, suppressed and dying trees. Common trends of growth decline were
strongly related to long-term, late-winter to summer temperatures, while the residuals were related
to total annual precipitation, although with decreasing significance as competition increased. Our
results support the contention that the reported patterns of A. pinsapo growth decline and death
occur as a result of the interacting effects of both competition and climate stressors acting at long-
and short-term time scales.
5. Synthesis. Long-term climatic drought stress was the main driving factor of growth decline in
A. pinsapo. Moreover, trees already suffering from competition (a long-term stress) were predis-
posed to decline given an additional short-term stress, such as a severe drought.
Key-words: Abies pinsapo, adaptive capacity, basal area increment, climatic change, compe-
tition, drought, Dynamic Factor Analysis, global warming, linear mixed models, vulnerability
Introduction
Both drought and stand structural changes have the potential
to profoundly alter the growth and vigour of tree populations
(Saxe et al. 2001; Sarris, Christodoulakis & Korner 2007;
Thuiller et al. 2008). Trees of different sizes and crown classes
compete differently for light, water and other resources within
a stand (Peet & Christensen 1987; Orwig & Abrams 1997).
Thus, depending on stand structural attributes, a same type of
forest community might exhibit different ecological thresholds
and regime shifts in the face of changing climatic conditions
(Andersen et al. 2008). Nevertheless, the interacting effects of*Correspondence author. E-mail: [email protected]
Journal of Ecology 2010, 98, 592–603 doi: 10.1111/j.1365-2745.2010.01645.x
� 2010 The Authors. Journal compilation � 2010 British Ecological Society
these two factors have rarely been assessed, perhaps because
they are likely to operate simultaneously, making it difficult to
disentangle their separate impacts.
Individual tree growth decline and death often occur as a
result of the combined effects of many different long- and
short-term stressors (Manion 1991; Pedersen 1998a). How-
ever, many studies attempting to decipher the causes of tree
decline and death in undisturbed stands have traditionally
viewed suppression as a primary cause of mortality rather than
as a predisposing factor. Such a biased view comes from stud-
ies in which observations of mortality events linked to high
competition either mainly concerned small trees (He, Zhang &
Bazzaz 2005; Martın-Benito et al. 2007) or discarded interact-
ing effects of competition with long- and short-term climatic
stressors (Pedersen 1998b; Dobbertin 2005). Consequently, an
assessment of the effects of drought stress and changes in stand
structure on forest growthmust define the spatial and temporal
scales that are suitable according to the specific traits of the
studied species, such as life span, drought-stress tolerance and
competitive ability.
The dendrochronological assessment of radial-growth
trends may be useful to identify trees with high probabilities of
decline and death (Ogle, Whitham & Cobb 2000; Bigler et al.
2004). Several studies have shown that mortality rates are
inversely related to radial-growth rates (Wyckoff & Clark
2000; Bigler 2003; vanMantgem et al. 2003). Usually, reduced
wood formation occurs prior to visual symptoms of decline
(e.g. crown defoliation) and tree death. This highlights the use-
fulness of dendrochronology to investigate the ecological
implication of tree-to-tree competition under a warmer future
climate and to forecast the impending decline of particular for-
ests (Bigler et al. 2004).
Contrasting growth responses to water stress among trees in
different crown classes might be particularly relevant for
understanding the dynamics of forests dominated by species
that are highly sensitive to drought stress (Adams & Kolb
2004). Previous works have suggested that tree-to-tree
competition, as a long-term predisposing stressor, may be an
additional risk factor for drought-induced mortality in water-
stressed areas (Bigler et al. 2007; Greenwood & Weisberg
2008). Because soil-water availability is a key limiting resource
in Mediterranean ecosystems, drought spells are a common
short-term disturbance in these forests (Penuelas, Lloret &
Montoya 2001). To assess the contributing effects on forest
decline of competition and drought, as long- and short-term
stressors, respectively, we focused on declining Spanish stands
of Abies pinsapo Boiss. (Linares, Camarero & Carreira 2009),
a relict fir species endemic to coastal mountains near the strait
of Gibraltar.
In Spain, current climatic warming has severely affected the
growth of drought-sensitive conifer species (Macias et al.
2006;Andreu et al. 2007). Recently, Linares, Camarero&Car-
reira (2009) pointed out that, in addition to climate stress,
endogenous factors such as stand structural changes promoted
by shifts in land use can also be important contributors to for-
est decline processes. They reported that the likelihood of high-
mortality plots in A. pinsapo forests increased downwards
(drier conditions), where mortality showed no overall prefer-
ence for smaller size classes, and was linked to closed oversto-
rey stands with homogeneous structure exhibiting long-term
trends of little tree radial-growth. Conversely, low-mortality
plots were equally likely at both low and high elevations and
corresponded to more diversified and open-canopy stands
(Linares, Camarero & Carreira 2009). In Spain, the strict pro-
tection measures applied since the 1950s to protect the rem-
nants of A. pinsapo forests have eliminated their traditional
uses (logging, fuel extraction, grazing) leading to a remarkable
increase in tree cover and density (Linares &Carreira 2009).
In this study, we assess whether the performance of statisti-
cal models of tree growth and decline can be improved signifi-
cantly by combining climatic and density-dependent stressors
as predictor variables operating at different time scales. Our
approach provides an original way to analyse the effects of
both climatic stress and tree-to-tree competition on radial
growth using Dynamic Factor Analysis (DFA) to quantify
common trends in climatic variables and to provide climatic
predictors of growth (basal area increment, BAI) at the indi-
vidual level. We hypothesize that any structural changes that
increase tree-to-tree competition reduce the average adaptive
capacity of the trees to drier climatic conditions, thus enhanc-
ing their vulnerability. Our specific aims were to (i) quantify
the growth patterns ofA. pinsapo trees subjected to contrasting
competition intensities, (ii) use long-term regional climate
trends of temperature and precipitation for predicting tree
growth, and (iii) discuss the effects of climatic trends and stand
structure modifications on ecological thresholds and regime
shifts of tree populations. The results are interpreted within a
conceptual framework of vulnerability, sensitivity and adap-
tive capacity to change.
Materials and methods
We used ring-width data as the response variable, the intensity of
competition and smoothed climatic trends as long-term stressors, and
precipitation as a short-term stressor. First, we assessed whether
competition may be a reliable predictor of A. pinsapo radial growth.
Second, we examined whether long-term climatic trends predict long-
term growth patterns. Third, we evaluated whether the introduction
of inter-annual precipitation variability as a short-term stressor
improves our growth model, and how it depends on competition
intensity.
CLIMATIC DATA
To estimate robust and long-term regional climatic records, local data
from six nearby meteorological stations were combined into a regio-
nal mean for the period of 1920–2005 (Table S1 in Supporting Infor-
mation). For each station, monthly variables (mean temperature,
total precipitation)were transformed into normalized standard devia-
tions to give each station the same weight in calculating the average
values for each month and year. To combine the data from each
station, we used the MET routine from the Dendrochronology
Program Library (Holmes 1992). In the study area, the estimated
mean annual temperature is 11.6 �C, and the total annual precipita-
tion is 1089 mm. Because of the Mediterranean-type seasonality at
our study sites, annual means were based on data from September of
Competition enhances drought in Abies pinsapo 593
� 2010 The Authors. Journal compilation � 2010 British Ecological Society, Journal of Ecology, 98, 592–603
the previous year to the current August (see also Linares, Camarero
&Carreira 2009).
Field sampling and dendrochronological methods
Abies pinsapo Boiss. is a relict species belonging to the group of
circum-Mediterranean firs that have been mostly restricted to small
populations located in coastal Mediterranean mountain areas
(Linares & Carreira 2009). At present, A. pinsapo is just locally
distributed in the Baetic Range (S Spain) and the Rifain Range
(N Morocco), mainly on north-facing slopes above 1000 m a.s.l.
(Linares, Camarero&Carreira 2009).
The study was carried out in 2004 at natural stands of A. pinsapo
located near the lower elevation limit (36�43¢ N, 4�57¢ W, 1200 m
a.s.l., aspect NW, slope c. 40%) of the species’ altitudinal range. In
four plots (size c. 0.1 ha; located c. 100 m apart), all trees with more
than 3 cm diameter at 1.3 m (d.b.h.) were identified, tagged and
mapped, and their d.b.h. wasmeasured (see the structural characteris-
tics of the four study plots in Table 1). A total of 184 stem d.b.h
cross-sections (42, 32, 52 and 58 trees from plots 1, 2, 3 and 4, respec-
tively) fromdominant, co-dominant and suppressed trees, whichwere
all randomly selected and felled in an ongoing thinning experiment,
were studied for age determination at 1.3 m and radial-growth analy-
ses. Selection of the trees was performed with the consideration of
two criteria: (i) achieving a data set covering the whole diameter class
distribution and (ii) selecting randomly located trees (once the num-
ber of trees to be felled in each size-class was fixed, the specific target
individuals were selected by a random procedure). Only alive and
apparently healthy trees were sampled to avoid, as much as possible,
other factors affecting growth. Further information about the age dis-
tribution of sampled trees can be found in Fig. S1.
Cross-sections taken at 1.3 m were sanded until tree rings were
clearly visible under a binocular microscope. All samples were visu-
ally cross-dated. Tree-ring widths (TRWs) weremeasured to the near-
est 0.01 mm on two radii per cross-section using a LINTAB
measuring device (F. Rinntech, Heidelberg, Germany), and cross-
dating quality was checked using COFECHA (Holmes 1983). The
trend of decreasing ring-width with increasing tree age and size was
removed by converting TRWs into BAI. Relative radial-growth
reduction (GR) was estimated using the method developed by
Nowacki & Abrams (1997) to identify suppressions, i.e. abrupt and
sustained decreases in radial growth. We first calculated the ring-
width means of subsequent 10-year periods over all growth series.
Then, we defined the percentage of growth reduction as GR =
[(M1 ) M2) ⁄M2 · 100], where M1 and M2 are the preceding and
subsequent 10-year ring-width means, respectively. We considered a
sustained or a severe growth reduction when GR was greater than
50%or 100%, respectively, in at least half the trees.
COMPETIT ION INDEX
We estimated the tree-to-tree competition intensity (CI) that each
focal tree was subjected to by calculating a distance-dependent com-
petition index, which takes into account the number, size and distance
to the neighbouring competitors (Linares et al. 2009). The degree of
competition experienced by the focal i tree was calculated as the sum
of the quotients, for all j neighbouring trees surrounding it within a
radius R, between the ratio d.b.h.j ⁄ d.b.h.i and the distance between
the i and the corresponding j trees (distij):
CI ¼XNðRÞ
j¼1ðd:b:h:j=d:b:h:iÞ=distij eqn 1
The threshold radius above which neighbours were regarded as not
competing was estimated by comparing the CI data sets that were
obtained using R values ranging from 1 to10 m with the mean BAI.
The mean BAI–CI relationship was calculated over the entire time
span of each TRW series, and only in the case of trees older than
60 years the period 1945–2004 was used. The highest correlations
between CI and mean BAI were obtained for values of R = 8 m and
this threshold radius was selected for further calculations. Then, we
fitted an exponential-decay function between the competition index
and BAI. We used the CI value in which the slope of the exponential
function changes to classify trees as dominant or suppressed individu-
als. Additionally, trees with stable, very low secondary growth or
inactive cambial activity over the past 5 years were classified as dying
trees (Bigler et al. 2004).
DATA ANALYSES AND MODELLING
Dynamic factor analysis
DFA (see Zuur et al. 2003) was used to estimate underlying common
patterns in both the climate and tree-ring data. In DFA, the time ser-
ies are modelled as a linear combination of stochastic nonlinear
trends, which describe trends better than traditional models. In the
present study, DFA was applied independently to (i) obtain a climate
dynamic factor model and (ii) test differences of BAI trends from
trees subjected to contrasting competition strength.
CLIMATE DFA
First, DFA was applied on monthly mean temperature and total pre-
cipitation regional series as a dimension reduction technique to
obtain latent smoothing functions over the time of the annual and
seasonal climatic trends. The analysis was based on the so-called
structural time series models (Harvey 1989) that allow a description
Table 1. Structural characteristics of the study plots. Values are means±SE. Significant (P < 0.05) differences between plots based on
Mann–Whitney tests are indicated by different letters: D, dominant trees; S, suppressed trees; dy, dying trees
Plot Surface (m2) d.b.h. (cm)
Age
(years)*
Density
(trees ha)1)
Basal
area (m2 ha)1)
Basal area of D ⁄ S ⁄ dytrees (%)
1 982 17.18±0.76a 50±2.4 1314 37.64 80.5 ⁄ 16.4 ⁄ 3.12 905 17.25±1.02a 48±1.6 1425 46.93 79.3 ⁄ 18.9 ⁄ 1.83 850 14.84±0.81a 49±1.9 1682 38.78 87.3 ⁄ 10.0 ⁄ 2.74 852 12.31±0.56b 52±1.3 2535 39.90 69.2 ⁄ 23.1 ⁄ 7.7
*Age estimated at 1.3 m.
594 J. C. Linares, J. J. Camarero & J. A. Carreira
� 2010 The Authors. Journal compilation � 2010 British Ecological Society, Journal of Ecology, 98, 592–603
of the N response variables (i.e. each monthly climatic series) with a
Dynamic FactorModel (DFM) given by:
snðtÞ ¼XM
m¼1cm:namðtÞ þ lnðtÞ þ enðtÞ eqn 2
am tð Þ ¼ am t� 1ð Þ þ gm tð Þ eqn 3
where sn(t) is the value of the nth response variable at time t
(with 1 £ n £ N); am(t) is the mth unknown trend (with
1 £ m £ M) at time t; cm,n represents the unknown factor load-
ings; ln is the nth constant level parameter for displacing up and
down each linear combination of common trends (i.e. the inter-
cept term in the regression DFM); and en(t) and gm(t) are error
components that are assumed to be independent of each other
and normally distributed with zero mean and unknown covari-
ance matrix. Factor loadings cm,n indicate the weight of a particu-
lar common trend in the response time series sn. In addition, the
comparison of factor loadings of different time series (i.e. precipi-
tation or temperature for different months) allows for the detec-
tion of interactions between the different sn. The annual DFM
was obtained including the monthly series as response variables
(n = 12), whereas seasonal DFM was obtained using a 3-month
moving window (i.e. September–October–November, then Octo-
ber–November–December, and so on). Results from the DFA
were interpreted in terms of the estimated parameters cm,n; the
goodness-of-fit of the model was assessed by Akaike’s (1974)
Information Criterion (AIC), which combines the measure of fit
with a penalty term based on the number of parameters used in
the model. Based on this, the two most significant seasonal com-
mon trends of temperature and precipitation were used after-
wards as the potential explanatory variables of the BAI [see
below, Linear Mixed-Effect Model (LMEM) design).
TREE-GROWTH DFA
Second, we applied DFA to identify underlying common trends or
latent effects in the tree-ring data series in order to test differences
among contrasting tree-competition classes. We applied the DFA
model on normalized BAI series of trees of the above defined tree
classes (i.e. dominant, suppressed and dying trees). We analysed the
BAI series for the 1970–2004 period, when sample size was maximum
and BAI had stabilized. Iterative selection of trees with the higher
loading factors was performed in order to obtain robust underlying
trends. Trees with loading factors lower than 0.1 were discarded from
further analyses, because a loading value close to zero indicates that
such trees do not follow the common pattern. This procedure yielded
a set of 17 dominant, 25 suppressed and 28 dying trees. Several com-
binations of trend numbers and error covariance matrices were inves-
tigated. The results were interpreted in terms of the estimated
parameter cm,n (i.e. weight of the common trend in each tree) and the
visual agreement between model estimates for the different competi-
tion classes.
For both approximations, the optimal number of common trends
was based on AIC values. In addition, a symmetric, non-diagonal
error covariance matrix was used for the noise term that was also
based on the AIC values. The model used was Data = Sum of theM
common trends + noise.We performed amaximum number of 1500
iterations with a stop criterion Epsilon (difference in likelihood) set to
0.00001 (Zuur et al. 2003). All analyses were applied on normalized
time series, because this facilitates the interpretation of DFA factor
loadings and the comparison of regression parameters. DFA was
implemented using the Brodgar ver. 2.4.1 statistical package (High-
land Statistics Ltd., Newburgh, UK), which was linked to the R soft-
ware (R Development Core Team 2010). Further details about DFA
may be found in Zuur et al. (2010).
L INEAR MIXED-EFFECT MODEL
Significant temperature and precipitation trends, which were
obtained by DFA, were used as potential long-term explanatory
variables for BAI of dominant, suppressed and dying trees in each
plot. To model BAI as a function of long-term climatic trends, we
fitted LMEM using the nlme package in R software (R Develop-
ment Core Team 2010). Common trends of seasonal temperature
and precipitation were included as fixed effects, and each tree was
included as a random effect. The covariance parameters were esti-
mated using the restricted maximum-likelihood (REML) method,
which obtains estimates of parameters by minimizing the likelihood
of residuals from fitting the fixed-effects portion of the model
(Zuur et al. 2009). We used an information-theoretic approach for
multi-model selection based on the AIC corrected for small sample
sizes (AICc). We considered models with substantial support to be
those in which the DAIC (i.e. the difference of AICc between
models) was < 2 (Burnham & Anderson 2002). The residuals of
the model with the highest support were related to annual and
seasonal precipitation data using simple linear regressions (Fortin
et al. 2008).
Results
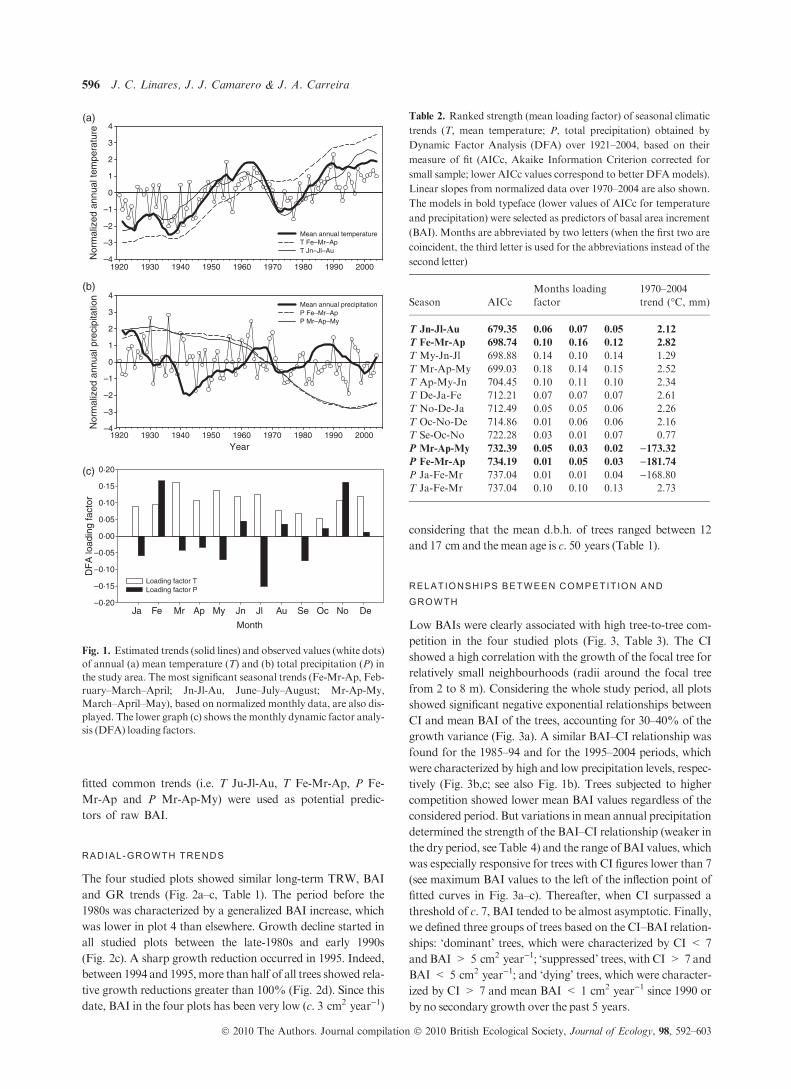
CLIMATE TRENDS
For all climatic variables, small AIC values indicated that just
one common trend captured the main climatic trends in the
study area. The DFA explained 55.17% of the observed vari-
ance on mean annual temperature (Fig. 1a), which has
increased by 0.20 units of standard deviation per year over the
period from 1970 to 2004, indicating a warming trend of
+0.74 �C.Monthly temperature loadings were relatively large
and positive for the period from spring tomid-summer (March
to July; see Fig. 1c), which indicates congruent trends for these
months. The fitted annual common trend allowed the recogni-
tion of two regional warming episodes from the late-1930s to
the early 1960s and from the mid-1970s to the present. No
long-term trends were detected by the DFA with regard to
total annual precipitation (Fig. 1b). High positive loadings
corresponded to February and November rainfall, whereas
July showed a negative loading factor (Fig. 1c).
Seasonal DFAs over a 3-month running window
revealed that the spring to mid-summer months present
the most significant common temperature trend (Table 2).
The June–July–August mean temperature (T Jn-Jl-Au in
Table 2) showed the lower AIC followed by that of the
February–March–April (T Fe-Mr-Ap) seasonal span (see
also Fig. 1a). The higher mean loading factor was obtained
for March–April–May (Mr-Ap-My), because these
3 months showed similar warming trends. The first ranked
precipitation (P) DFA loadings were obtained for the
Fe-Mr-Ap and the Mr-Ap-My intervals (Table 2 and
Fig. 1b), although these trends were less significant than
those obtained for temperature. Subsequently, these four
Competition enhances drought in Abies pinsapo 595
� 2010 The Authors. Journal compilation � 2010 British Ecological Society, Journal of Ecology, 98, 592–603
fitted common trends (i.e. T Ju-Jl-Au, T Fe-Mr-Ap, P Fe-
Mr-Ap and P Mr-Ap-My) were used as potential predic-
tors of raw BAI.
RADIAL-GROWTH TRENDS
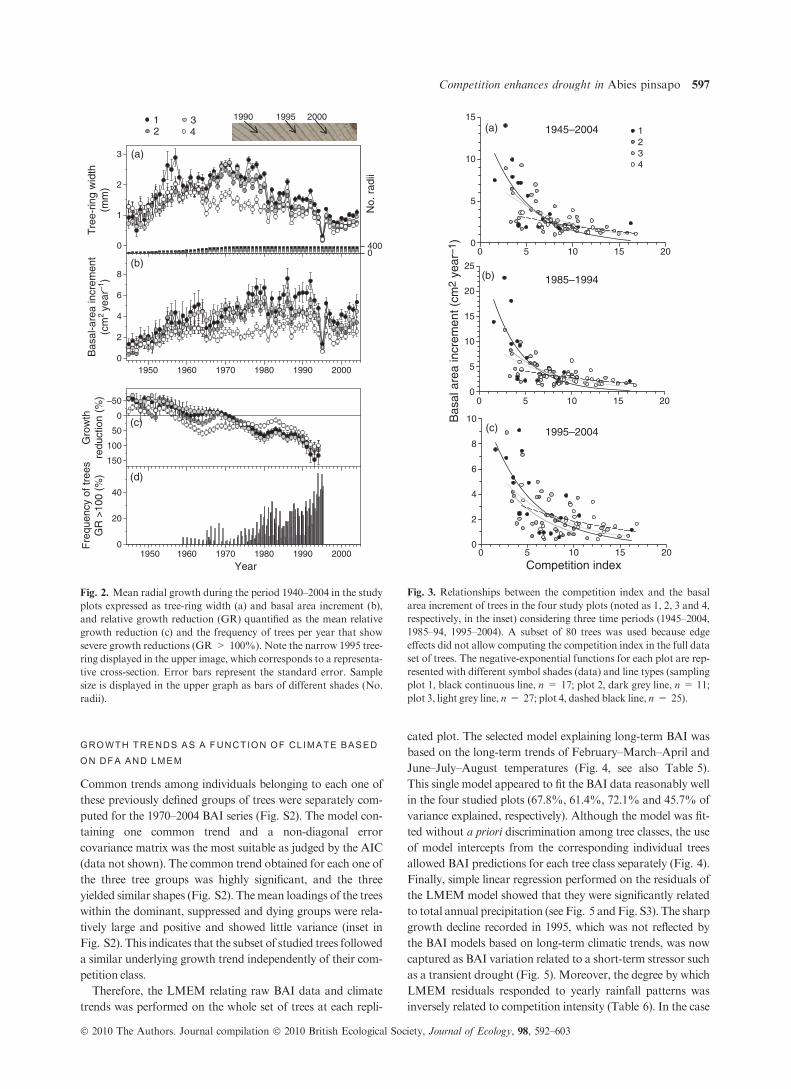
The four studied plots showed similar long-term TRW, BAI
and GR trends (Fig. 2a–c, Table 1). The period before the
1980s was characterized by a generalized BAI increase, which
was lower in plot 4 than elsewhere. Growth decline started in
all studied plots between the late-1980s and early 1990s
(Fig. 2c). A sharp growth reduction occurred in 1995. Indeed,
between 1994 and 1995,more than half of all trees showed rela-
tive growth reductions greater than 100% (Fig. 2d). Since this
date, BAI in the four plots has been very low (c. 3 cm2 year)1)
considering that the mean d.b.h. of trees ranged between 12
and 17 cm and themean age is c. 50 years (Table 1).
RELATIONSHIPS BETWEEN COMPETIT ION AND
GROWTH
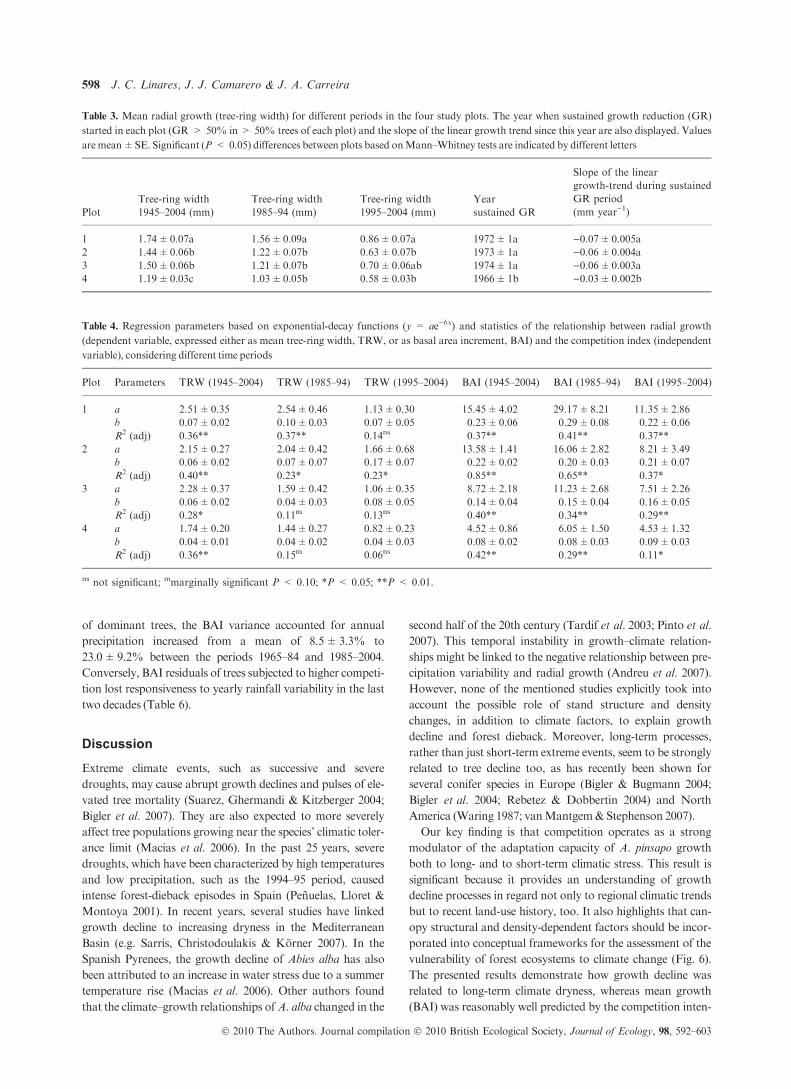
Low BAIs were clearly associated with high tree-to-tree com-
petition in the four studied plots (Fig. 3, Table 3). The CI
showed a high correlation with the growth of the focal tree for
relatively small neighbourhoods (radii around the focal tree
from 2 to 8 m). Considering the whole study period, all plots
showed significant negative exponential relationships between
CI and mean BAI of the trees, accounting for 30–40% of the
growth variance (Fig. 3a). A similar BAI–CI relationship was
found for the 1985–94 and for the 1995–2004 periods, which
were characterized by high and low precipitation levels, respec-
tively (Fig. 3b,c; see also Fig. 1b). Trees subjected to higher
competition showed lower mean BAI values regardless of the
considered period. But variations inmean annual precipitation
determined the strength of the BAI–CI relationship (weaker in
the dry period, see Table 4) and the range of BAI values, which
was especially responsive for trees with CI figures lower than 7
(see maximum BAI values to the left of the inflection point of
fitted curves in Fig. 3a–c). Thereafter, when CI surpassed a
threshold of c. 7, BAI tended to be almost asymptotic. Finally,
we defined three groups of trees based on the CI–BAI relation-
ships: ‘dominant’ trees, which were characterized by CI < 7
andBAI > 5 cm2 year)1; ‘suppressed’ trees, with CI > 7 and
BAI < 5 cm2 year)1; and ‘dying’ trees, which were character-
ized by CI > 7 and mean BAI < 1 cm2 year)1 since 1990 or
by no secondary growth over the past 5 years.
Month
DF
A lo
adin
g fa
ctor
–0·20
–0·15
–0·10
–0·05
0·00
0·05
0·10
0·15
0·20
Loading factor T Loading factor P
De
Year
Nor
mal
ized
ann
ual p
reci
pita
tion
–4
–3
–2
–1
0
1
2
3
4Mean annual precipitationP Fe–Mr–ApP Mr–Ap–My
ApJa Fe Mr My Jn Jl Au Se Oc No
1920 1930 1940 1950 1960 1970 1980 1990 2000
1920 1930 1940 1950 1960 1970 1980 1990 2000
Nor
mal
ized
ann
ual t
empe
ratu
re
–4
–3
–2
–1
0
1
2
3
4
Mean annual temperatureT Fe–Mr–ApT Jn–Jl–Au
(a)
(b)
(c)
Fig. 1. Estimated trends (solid lines) and observed values (white dots)
of annual (a) mean temperature (T) and (b) total precipitation (P) in
the study area. The most significant seasonal trends (Fe-Mr-Ap, Feb-
ruary–March–April; Jn-Jl-Au, June–July–August; Mr-Ap-My,
March–April–May), based on normalized monthly data, are also dis-
played. The lower graph (c) shows the monthly dynamic factor analy-
sis (DFA) loading factors.
Table 2. Ranked strength (mean loading factor) of seasonal climatic
trends (T, mean temperature; P, total precipitation) obtained by
Dynamic Factor Analysis (DFA) over 1921–2004, based on their
measure of fit (AICc, Akaike Information Criterion corrected for
small sample; lower AICc values correspond to better DFAmodels).
Linear slopes from normalized data over 1970–2004 are also shown.
The models in bold typeface (lower values of AICc for temperature
and precipitation) were selected as predictors of basal area increment
(BAI). Months are abbreviated by two letters (when the first two are
coincident, the third letter is used for the abbreviations instead of the
second letter)
Season AICc
Months loading
factor
1970–2004
trend (�C, mm)
T Jn-Jl-Au 679.35 0.06 0.07 0.05 2.12
T Fe-Mr-Ap 698.74 0.10 0.16 0.12 2.82
T My-Jn-Jl 698.88 0.14 0.10 0.14 1.29
T Mr-Ap-My 699.03 0.18 0.14 0.15 2.52
T Ap-My-Jn 704.45 0.10 0.11 0.10 2.34
T De-Ja-Fe 712.21 0.07 0.07 0.07 2.61
T No-De-Ja 712.49 0.05 0.05 0.06 2.26
T Oc-No-De 714.86 0.01 0.06 0.06 2.16
T Se-Oc-No 722.28 0.03 0.01 0.07 0.77
P Mr-Ap-My 732.39 0.05 0.03 0.02 )173.32P Fe-Mr-Ap 734.19 0.01 0.05 0.03 )181.74P Ja-Fe-Mr 737.04 0.01 0.01 0.04 )168.80T Ja-Fe-Mr 737.04 0.10 0.10 0.13 2.73
596 J. C. Linares, J. J. Camarero & J. A. Carreira
� 2010 The Authors. Journal compilation � 2010 British Ecological Society, Journal of Ecology, 98, 592–603
GROWTH TRENDS AS A FUNCTION OF CLIMATE BASED
ON DFA AND LMEM
Common trends among individuals belonging to each one of
these previously defined groups of trees were separately com-
puted for the 1970–2004 BAI series (Fig. S2). The model con-
taining one common trend and a non-diagonal error
covariance matrix was the most suitable as judged by the AIC
(data not shown). The common trend obtained for each one of
the three tree groups was highly significant, and the three
yielded similar shapes (Fig. S2). Themean loadings of the trees
within the dominant, suppressed and dying groups were rela-
tively large and positive and showed little variance (inset in
Fig. S2). This indicates that the subset of studied trees followed
a similar underlying growth trend independently of their com-
petition class.
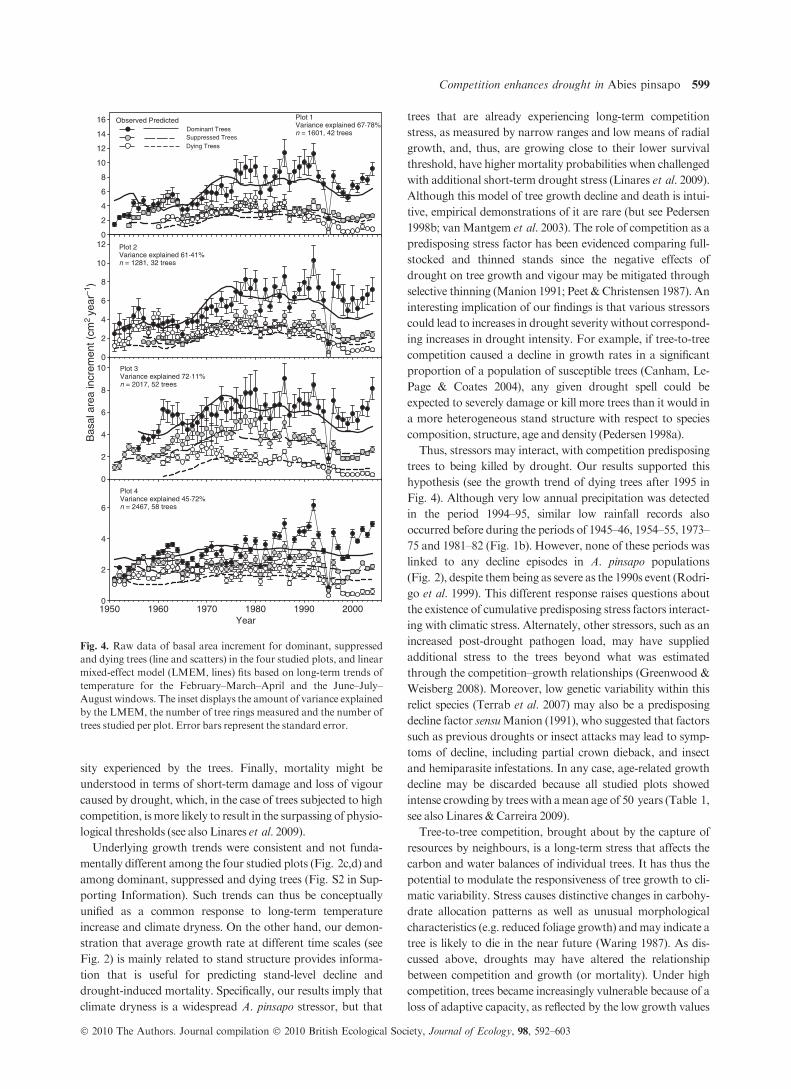
Therefore, the LMEM relating raw BAI data and climate
trends was performed on the whole set of trees at each repli-
cated plot. The selected model explaining long-term BAI was
based on the long-term trends of February–March–April and
June–July–August temperatures (Fig. 4, see also Table 5).
This single model appeared to fit the BAI data reasonably well
in the four studied plots (67.8%, 61.4%, 72.1% and 45.7% of
variance explained, respectively). Although the model was fit-
ted without a priori discrimination among tree classes, the use
of model intercepts from the corresponding individual trees
allowed BAI predictions for each tree class separately (Fig. 4).
Finally, simple linear regression performed on the residuals of
the LMEM model showed that they were significantly related
to total annual precipitation (see Fig. 5 and Fig. S3). The sharp
growth decline recorded in 1995, which was not reflected by
the BAI models based on long-term climatic trends, was now
captured as BAI variation related to a short-term stressor such
as a transient drought (Fig. 5). Moreover, the degree by which
LMEM residuals responded to yearly rainfall patterns was
inversely related to competition intensity (Table 6). In the case
1990 1995 2000
(a)
Tre
e-rin
g w
idth
(mm
)
0
1
2
3
No.
rad
ii
0400
(b)
Gro
wth
redu
ctio
n (%
) –50
0
50
100
150
Year1950 1960 1970 1980 1990 2000
1950 1960 1970 1980 1990 2000
Fre
quen
cy o
f tre
esG
R >
100
(%)
0
20
40
(c)
Bas
al-a
rea
incr
emen
t(c
m2
year
–1)
0
2
4
6
8
(d)
12
34
Fig. 2. Mean radial growth during the period 1940–2004 in the study
plots expressed as tree-ring width (a) and basal area increment (b),
and relative growth reduction (GR) quantified as the mean relative
growth reduction (c) and the frequency of trees per year that show
severe growth reductions (GR > 100%). Note the narrow 1995 tree-
ring displayed in the upper image, which corresponds to a representa-
tive cross-section. Error bars represent the standard error. Sample
size is displayed in the upper graph as bars of different shades (No.
radii).
Competition index
Bas
al a
rea
incr
emen
t (cm
2 ye
ar–1
)
0
2
4
6
8
10
1995–2004
0 5 10 15 20
0 5 10 15 20
0 5 10 15 20
0
5
10
15
20
25
0
5
10
15
1 2 3 4
1945–2004
1985–1994
(a)
(b)
(c)
Fig. 3. Relationships between the competition index and the basal
area increment of trees in the four study plots (noted as 1, 2, 3 and 4,
respectively, in the inset) considering three time periods (1945–2004,
1985–94, 1995–2004). A subset of 80 trees was used because edge
effects did not allow computing the competition index in the full data
set of trees. The negative-exponential functions for each plot are rep-
resented with different symbol shades (data) and line types (sampling
plot 1, black continuous line, n = 17; plot 2, dark grey line, n = 11;
plot 3, light grey line, n = 27; plot 4, dashed black line, n = 25).
Competition enhances drought in Abies pinsapo 597
� 2010 The Authors. Journal compilation � 2010 British Ecological Society, Journal of Ecology, 98, 592–603
of dominant trees, the BAI variance accounted for annual
precipitation increased from a mean of 8.5±3.3% to
23.0±9.2% between the periods 1965–84 and 1985–2004.
Conversely, BAI residuals of trees subjected to higher competi-
tion lost responsiveness to yearly rainfall variability in the last
two decades (Table 6).
Discussion
Extreme climate events, such as successive and severe
droughts, may cause abrupt growth declines and pulses of ele-
vated tree mortality (Suarez, Ghermandi & Kitzberger 2004;
Bigler et al. 2007). They are also expected to more severely
affect tree populations growing near the species’ climatic toler-
ance limit (Macias et al. 2006). In the past 25 years, severe
droughts, which have been characterized by high temperatures
and low precipitation, such as the 1994–95 period, caused
intense forest-dieback episodes in Spain (Penuelas, Lloret &
Montoya 2001). In recent years, several studies have linked
growth decline to increasing dryness in the Mediterranean
Basin (e.g. Sarris, Christodoulakis & Korner 2007). In the
Spanish Pyrenees, the growth decline of Abies alba has also
been attributed to an increase in water stress due to a summer
temperature rise (Macias et al. 2006). Other authors found
that the climate–growth relationships ofA. alba changed in the
second half of the 20th century (Tardif et al. 2003; Pinto et al.
2007). This temporal instability in growth–climate relation-
ships might be linked to the negative relationship between pre-
cipitation variability and radial growth (Andreu et al. 2007).
However, none of the mentioned studies explicitly took into
account the possible role of stand structure and density
changes, in addition to climate factors, to explain growth
decline and forest dieback. Moreover, long-term processes,
rather than just short-term extreme events, seem to be strongly
related to tree decline too, as has recently been shown for
several conifer species in Europe (Bigler & Bugmann 2004;
Bigler et al. 2004; Rebetez & Dobbertin 2004) and North
America (Waring 1987; vanMantgem&Stephenson 2007).
Our key finding is that competition operates as a strong
modulator of the adaptation capacity of A. pinsapo growth
both to long- and to short-term climatic stress. This result is
significant because it provides an understanding of growth
decline processes in regard not only to regional climatic trends
but to recent land-use history, too. It also highlights that can-
opy structural and density-dependent factors should be incor-
porated into conceptual frameworks for the assessment of the
vulnerability of forest ecosystems to climate change (Fig. 6).
The presented results demonstrate how growth decline was
related to long-term climate dryness, whereas mean growth
(BAI) was reasonably well predicted by the competition inten-
Table 3. Mean radial growth (tree-ring width) for different periods in the four study plots. The year when sustained growth reduction (GR)
started in each plot (GR > 50% in> 50% trees of each plot) and the slope of the linear growth trend since this year are also displayed. Values
aremean±SE. Significant (P < 0.05) differences between plots based onMann–Whitney tests are indicated by different letters
Plot
Tree-ring width
1945–2004 (mm)
Tree-ring width
1985–94 (mm)
Tree-ring width
1995–2004 (mm)
Year
sustained GR
Slope of the linear
growth-trend during sustained
GR period
(mm year)1)
1 1.74±0.07a 1.56±0.09a 0.86±0.07a 1972±1a )0.07±0.005a
2 1.44±0.06b 1.22±0.07b 0.63±0.07b 1973±1a )0.06±0.004a
3 1.50±0.06b 1.21±0.07b 0.70±0.06ab 1974±1a )0.06±0.003a
4 1.19±0.03c 1.03±0.05b 0.58±0.03b 1966±1b )0.03±0.002b
Table 4. Regression parameters based on exponential-decay functions (y = ae)bx) and statistics of the relationship between radial growth
(dependent variable, expressed either as mean tree-ring width, TRW, or as basal area increment, BAI) and the competition index (independent
variable), considering different time periods
Plot Parameters TRW (1945–2004) TRW (1985–94) TRW (1995–2004) BAI (1945–2004) BAI (1985–94) BAI (1995–2004)
1 a 2.51±0.35 2.54±0.46 1.13±0.30 15.45±4.02 29.17±8.21 11.35±2.86
b 0.07±0.02 0.10±0.03 0.07±0.05 0.23±0.06 0.29±0.08 0.22±0.06
R2 (adj) 0.36** 0.37** 0.14ns 0.37** 0.41** 0.37**
2 a 2.15±0.27 2.04±0.42 1.66±0.68 13.58±1.41 16.06±2.82 8.21±3.49
b 0.06±0.02 0.07±0.07 0.17±0.07 0.22±0.02 0.20±0.03 0.21±0.07
R2 (adj) 0.40** 0.23* 0.23* 0.85** 0.65** 0.37*
3 a 2.28±0.37 1.59±0.42 1.06±0.35 8.72±2.18 11.23±2.68 7.51±2.26
b 0.06±0.02 0.04±0.03 0.08±0.05 0.14±0.04 0.15±0.04 0.16±0.05
R2 (adj) 0.28* 0.11m 0.13ns 0.40** 0.34** 0.29**
4 a 1.74±0.20 1.44±0.27 0.82±0.23 4.52±0.86 6.05±1.50 4.53±1.32
b 0.04±0.01 0.04±0.02 0.04±0.03 0.08±0.02 0.08±0.03 0.09±0.03
R2 (adj) 0.36** 0.15m 0.06ns 0.42** 0.29** 0.11*
ns not significant; mmarginally significant P < 0.10; *P < 0.05; **P < 0.01.
598 J. C. Linares, J. J. Camarero & J. A. Carreira
� 2010 The Authors. Journal compilation � 2010 British Ecological Society, Journal of Ecology, 98, 592–603
sity experienced by the trees. Finally, mortality might be
understood in terms of short-term damage and loss of vigour
caused by drought, which, in the case of trees subjected to high
competition, ismore likely to result in the surpassing of physio-
logical thresholds (see also Linares et al. 2009).
Underlying growth trends were consistent and not funda-
mentally different among the four studied plots (Fig. 2c,d) and
among dominant, suppressed and dying trees (Fig. S2 in Sup-
porting Information). Such trends can thus be conceptually
unified as a common response to long-term temperature
increase and climate dryness. On the other hand, our demon-
stration that average growth rate at different time scales (see
Fig. 2) is mainly related to stand structure provides informa-
tion that is useful for predicting stand-level decline and
drought-induced mortality. Specifically, our results imply that
climate dryness is a widespread A. pinsapo stressor, but that
trees that are already experiencing long-term competition
stress, as measured by narrow ranges and low means of radial
growth, and, thus, are growing close to their lower survival
threshold, have higher mortality probabilities when challenged
with additional short-term drought stress (Linares et al. 2009).
Although this model of tree growth decline and death is intui-
tive, empirical demonstrations of it are rare (but see Pedersen
1998b; vanMantgem et al. 2003). The role of competition as a
predisposing stress factor has been evidenced comparing full-
stocked and thinned stands since the negative effects of
drought on tree growth and vigour may be mitigated through
selective thinning (Manion 1991; Peet &Christensen 1987). An
interesting implication of our findings is that various stressors
could lead to increases in drought severity without correspond-
ing increases in drought intensity. For example, if tree-to-tree
competition caused a decline in growth rates in a significant
proportion of a population of susceptible trees (Canham, Le-
Page & Coates 2004), any given drought spell could be
expected to severely damage or kill more trees than it would in
a more heterogeneous stand structure with respect to species
composition, structure, age and density (Pedersen 1998a).
Thus, stressors may interact, with competition predisposing
trees to being killed by drought. Our results supported this
hypothesis (see the growth trend of dying trees after 1995 in
Fig. 4). Although very low annual precipitation was detected
in the period 1994–95, similar low rainfall records also
occurred before during the periods of 1945–46, 1954–55, 1973–
75 and 1981–82 (Fig. 1b). However, none of these periods was
linked to any decline episodes in A. pinsapo populations
(Fig. 2), despite thembeing as severe as the 1990s event (Rodri-
go et al. 1999). This different response raises questions about
the existence of cumulative predisposing stress factors interact-
ing with climatic stress. Alternately, other stressors, such as an
increased post-drought pathogen load, may have supplied
additional stress to the trees beyond what was estimated
through the competition–growth relationships (Greenwood &
Weisberg 2008). Moreover, low genetic variability within this
relict species (Terrab et al. 2007) may also be a predisposing
decline factor sensuManion (1991), who suggested that factors
such as previous droughts or insect attacks may lead to symp-
toms of decline, including partial crown dieback, and insect
and hemiparasite infestations. In any case, age-related growth
decline may be discarded because all studied plots showed
intense crowding by trees with amean age of 50 years (Table 1,
see also Linares &Carreira 2009).
Tree-to-tree competition, brought about by the capture of
resources by neighbours, is a long-term stress that affects the
carbon and water balances of individual trees. It has thus the
potential to modulate the responsiveness of tree growth to cli-
matic variability. Stress causes distinctive changes in carbohy-
drate allocation patterns as well as unusual morphological
characteristics (e.g. reduced foliage growth) andmay indicate a
tree is likely to die in the near future (Waring 1987). As dis-
cussed above, droughts may have altered the relationship
between competition and growth (or mortality). Under high
competition, trees became increasingly vulnerable because of a
loss of adaptive capacity, as reflected by the low growth values
Year1950 1960 1970 1980 1990 20000
2
4
6
0
2
4
6
8
100
2
4
6
8
10
120
2
4
6
8
10
12
14
16 Plot 1Variance explained 67·78%n = 1601, 42 trees
Bas
al a
rea
incr
emen
t (cm
2 ye
ar–1
)
Plot 4Variance explained 45·72%n = 2467, 58 trees
Plot 2Variance explained 61·41%n = 1281, 32 trees
Plot 3Variance explained 72·11%n = 2017, 52 trees
Observed PredictedDominant TreesSuppressed TreesDying Trees
Fig. 4. Raw data of basal area increment for dominant, suppressed
and dying trees (line and scatters) in the four studied plots, and linear
mixed-effect model (LMEM, lines) fits based on long-term trends of
temperature for the February–March–April and the June–July–
August windows. The inset displays the amount of variance explained
by the LMEM, the number of tree rings measured and the number of
trees studied per plot. Error bars represent the standard error.
Competition enhances drought in Abies pinsapo 599
� 2010 The Authors. Journal compilation � 2010 British Ecological Society, Journal of Ecology, 98, 592–603
(Fig. 3, Table 3 and Fig. 4) and their weakened correlation
with rainfall variability during drier periods (Table 6, Figs 5
and S3). Long-term competition could lead to further chal-
lenges in overcoming drought events, for instance, a require-
ment for superior carbon balance when faced with the need to
recover from drought-induced crown loss (Franklin, Shugart
&Harmon 1987). Because of their size, trees have large storage
capacities and may thus accumulate considerable nutrients,
carbohydrates and water. These resources can often be mobi-
lized during periods of stress, enabling a canopy or root system
to continue to function or to be re-established following a
stressful period (Waring 1987). Therefore, the relationships
between competition, growth rate and the probability of post-
drought death may be at least partly mediated by the size of
the tree crown and, hence, the tree’s ability to fix carbon
(Pedersen 1998b; Dobbertin 2005). For a given tree size,
Table 5. Model selection criteria for Abies pinsapo growth expressed as basal area increment in the four studied plots. The most significant
Dynamic Factor Analysis (DFA) climatic common-trends models, shown in Table 2, were tested. A null model (BAI = constant) was also
included. DAIC, difference of AICc (Akaike information criterion corrected for small samples) with respect to the best model; L(gi ⁄ x),Likelihood of a model gi given the data x; Wi, relative probability that the model i is the best model given the observed data. Values in bold
correspond to models with substantial support. T, mean monthly temperature; P, total monthly precipitation. Months are abbreviated by two
letters (when the first two are coincident, the third letter is used for the abbreviations instead of the second letter)
Plot Model AICc DAIC L(gi ⁄ x) Wi
1
42 trees (n = 1601)
T Fe-Ma-Ap + T Jn-Jl-Au )1198.07 0.00 1.00 1.00
T Fe-Ma-Ap + P Fe-Ma-Ap )1184.82 13.24 0.00 0.00
P Ma-Ap-My )905.33 292.74 0.00 0.00
P Fe-Ma-Ap )880.47 317.60 0.00 0.00
T Fe-Ma-Ap )847.56 350.51 0.00 0.00
Null model )802.08 395.98 0.00 0.00
T Jn-Jl-Au )796.40 401.67 0.00 0.00
Sum 1.00
2
32 trees (n = 1281)
T Fe-Ma-Ap + P Fe-Ma-Ap )1131.69 0.00 1.00 0.73
T Fe-Ma-Ap + T Jn-Jl-Au )1129.73 1.96 0.38 0.27
T Fe-Ma-Ap )893.30 238.39 0.00 0.00
P Ma-Ap-My )735.33 396.36 0.00 0.00
P Fe-Ma-Ap )723.47 408.22 0.00 0.00
Null model )716.12 415.58 0.00 0.00
T Jn-Jl-Au )712.71 418.98 0.00 0.00
Sum 1.38
3
52 trees (n = 2017)
T Fe-Ma-Ap + T Jn-Jl-Au )1694.43 0.00 1.00 1.00
T Fe-Ma-Ap + P Fe-Ma-Ap )1665.49 28.94 0.00 0.00
T Fe-Ma-Ap )1433.70 260.72 0.00 0.00
P Ma-Ap-My )1201.21 493.22 0.00 0.00
T Jn-Jl-Au )1197.89 496.54 0.00 0.00
Null model )1191.57 502.86 0.00 0.00
P Fe-Ma-Ap )1189.45 504.98 0.00 0.00
Sum 1.00
4
58 trees (n = 2467)
T Fe-Ma-Ap + T Jn-Jl-Au )2856.36 0.00 1.00 1.00
T Fe-Ma-Ap + P Fe-Ma-Ap )2824.79 31.57 0.00 0.00
T Fe-Ma-Ap )2781.99 74.37 0.00 0.00
P Ma-Ap-My )2750.69 105.67 0.00 0.00
Null model )2745.73 110.63 0.00 0.00
P Fe-Ma-Ap )2744.70 111.66 0.00 0.00
T Jn-Jl-Au )2733.62 122.74 0.00 0.00
Sum 1.00
Year1965 1970 1975 1980 1985 1990 1995 2000 2005
BA
I res
idua
ls
–0.8
–0.6
–0.4
–0.2
0.0
0.2
0.4
0.6
0.8
Pre
cipi
tatio
n (m
m)
400
600
800
1000
1200
1400
1600
1800
2000
2200
Dominant trees Suppressed trees Dying trees Annual precipitation
Fig. 5. Graphical comparison between total
annual precipitation and the mean LMEM
residuals of the three social classes (domi-
nant, suppressed and dying trees). The dot-
ted line separates two consecutive periods of
twenty years (1965–84 and 1985–2004, see
Table 6).
600 J. C. Linares, J. J. Camarero & J. A. Carreira
� 2010 The Authors. Journal compilation � 2010 British Ecological Society, Journal of Ecology, 98, 592–603
individuals subjected to high competition are more likely to
have a sparser crown and lower total leaf area than dominant
trees (Linares et al. 2009). Thus, a given amount of crown
defoliation induced by drought on a suppressed growing tree
would cause the tree to have much less total photosynthetic
leaf area than the same relative defoliation of crown in a domi-
nant growing tree would do (Dobbertin & Brang 2001). Con-
versely, trees not experiencing such intense long-term stress
due to competition would be better able to resist the effects of
short-term, drought-induced stress (Figs 4 and 5).
Given the interactions between stand structure and growth,
the predictive power provided by climate-focused models that
neglect tree-to-tree competition is unlikely to bematched in the
future. More fundamentally, we suggest that the challenges of
managing andmaintaining structurally complex stands require
a shift from empirical, non-spatial models that emphasize pre-
diction to more mechanistic, spatially explicit models that can
incorporate the consequences of changing physical and com-
petitive environments within stands (Canham, LePage &
Coates 2004; Das et al. 2008). Information concerning stand
structure and tree growth are also useful in the context of pro-
active conservationmanagement, for instance, to support deci-
sion options on partial harvesting measures aimed to reduce
average tree-to-tree competition and to achieve a more diversi-
fied forest structure (Franklin et al. 2002; Carreira, Quintanilla
& Linares 2009). It is difficult, however, to generalize the
results of these models, because few attempts to describe the
process of post-drought mortality in a comprehensive manner
exist. Amoremechanistic description of drought-inducedmor-
tality would include measures of the trees’ physiological status
and an account of the effects of the damage on post-drought
carbon gain and water use on trees that are subjected to
contrasting competition (Linares et al. 2009).
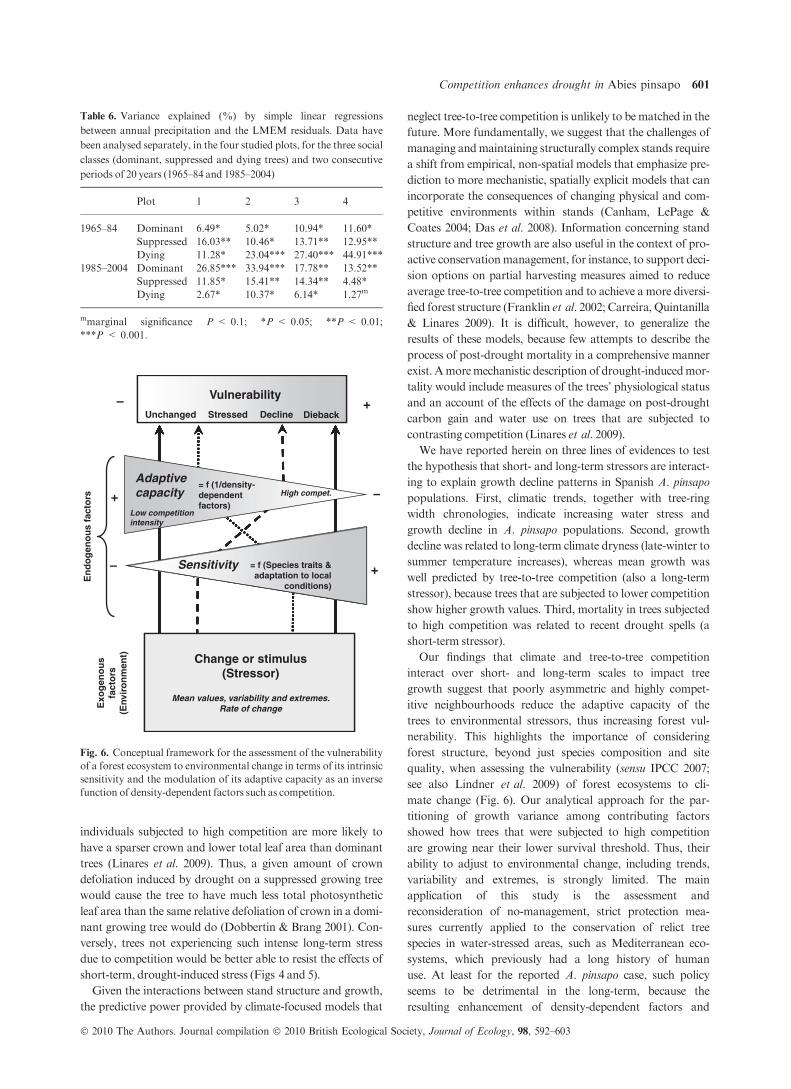
We have reported herein on three lines of evidences to test
the hypothesis that short- and long-term stressors are interact-
ing to explain growth decline patterns in Spanish A. pinsapo
populations. First, climatic trends, together with tree-ring
width chronologies, indicate increasing water stress and
growth decline in A. pinsapo populations. Second, growth
decline was related to long-term climate dryness (late-winter to
summer temperature increases), whereas mean growth was
well predicted by tree-to-tree competition (also a long-term
stressor), because trees that are subjected to lower competition
show higher growth values. Third, mortality in trees subjected
to high competition was related to recent drought spells (a
short-term stressor).
Our findings that climate and tree-to-tree competition
interact over short- and long-term scales to impact tree
growth suggest that poorly asymmetric and highly compet-
itive neighbourhoods reduce the adaptive capacity of the
trees to environmental stressors, thus increasing forest vul-
nerability. This highlights the importance of considering
forest structure, beyond just species composition and site
quality, when assessing the vulnerability (sensu IPCC 2007;
see also Lindner et al. 2009) of forest ecosystems to cli-
mate change (Fig. 6). Our analytical approach for the par-
titioning of growth variance among contributing factors
showed how trees that were subjected to high competition
are growing near their lower survival threshold. Thus, their
ability to adjust to environmental change, including trends,
variability and extremes, is strongly limited. The main
application of this study is the assessment and
reconsideration of no-management, strict protection mea-
sures currently applied to the conservation of relict tree
species in water-stressed areas, such as Mediterranean eco-
systems, which previously had a long history of human
use. At least for the reported A. pinsapo case, such policy
seems to be detrimental in the long-term, because the
resulting enhancement of density-dependent factors and
Table 6. Variance explained (%) by simple linear regressions
between annual precipitation and the LMEM residuals. Data have
been analysed separately, in the four studied plots, for the three social
classes (dominant, suppressed and dying trees) and two consecutive
periods of 20 years (1965–84 and 1985–2004)
Plot 1 2 3 4
1965–84 Dominant 6.49* 5.02* 10.94* 11.60*
Suppressed 16.03** 10.46* 13.71** 12.95**
Dying 11.28* 23.04*** 27.40*** 44.91***
1985–2004 Dominant 26.85*** 33.94*** 17.78** 13.52**
Suppressed 11.85* 15.41** 14.34** 4.48*
Dying 2.67* 10.37* 6.14* 1.27m
mmarginal significance P < 0.1; *P < 0.05; **P < 0.01;
***P < 0.001.
–
–
–
+
+
+
Vulnerability
Change or stimulus(Stressor)
Adaptivecapacity
Sensitivity
Unchanged
En
do
gen
ou
s fa
cto
rsE
xog
eno
us
fact
ors
(Env
iro
nm
ent)
Stressed
= f (1/density-dependentfactors)
= f (Species traits &adaptation to local
conditions)
Mean values, variability and extremes.Rate of change
High compet.
Low competitionintensity
Decline Dieback
Fig. 6. Conceptual framework for the assessment of the vulnerability
of a forest ecosystem to environmental change in terms of its intrinsic
sensitivity and the modulation of its adaptive capacity as an inverse
function of density-dependent factors such as competition.
Competition enhances drought in Abies pinsapo 601
� 2010 The Authors. Journal compilation � 2010 British Ecological Society, Journal of Ecology, 98, 592–603
competition leads to a reduction in the intrinsic adaptive
capacity of tree growth to both long- and short-term cli-
matic variability. The assessment of stand structure effects
on tree vulnerability to climate dryness should aid to bet-
ter protect tree populations growing near the species’ cli-
matic tolerance limit under the context of current climate
warming.
Acknowledgements
This study was supported by projects PP06-RNM-02183 (Consejerıa de Inno-
vacion y Ciencia, Junta de Andalucıa) and REN2002-2003-09509 (Spanish
Ministry of Science). J.C.L. acknowledges a MEC-FPU grant. J.J.C. thanks
the support of ARAID and Globimed network. We thank F.T. Maestre for
helpful comments. We also want to thank the Handling Editor and two anony-
mous referees whose comments helped to improve a previous version of the
manuscript.
References
Adams, H.D. & Kolb, T.E. (2004) Drought responses of conifers in ecotone
forests of northern Arizona: tree ring growth and leaf d13C. Oecologia, 140,
217–225.
Akaike, H. (1974) A new look at statistical model identification. IEEETransac-
tions onAutomatic Control, 19, 716–722.
Andersen, T., Carstensen, J., Hermandez-Garcıa, E. & Duarte, C.M. (2008)
Ecological thresholds and regime shifts: approaches to identification. Trends
in Ecology and Evolution, 24, 49–57.
Andreu, L., Gutierrez, E., Macias, M., Ribas, M., Bosch, O. & Camarero, J.J.
(2007) Climate increases regional tree-growth variability in Iberian pine for-
ests.Global Change Biology, 13, 1–12.
Bigler, C.J.. (2003) Growth-dependent tree mortality: ecological processes and
modeling approaches based on tree-ring data. PhDThesis, ETH-Swiss Federal
Institute of Technology, Zurich.
Bigler, C.J. & Bugmann, H. (2004) Assessing the performance of theoretical
and empirical tree mortality models using tree-ring series of Norway spruce.
EcologicalModelling, 174, 225–239.
Bigler, C.J., Gricar, J., Bugmann, H. & Cufar, K. (2004) Growth patterns as
indicators of impending tree death in silver fir. Forest Ecology and Manage-
ment, 199, 183–190.
Bigler, C.J., Gavin, D.G., Gunning, C. & Veblen, T.T. (2007) Drought induces
lagged tree mortality in a subalpine forest in the Rocky mountains. Oikos,
116, 1983–1994.
Burnham, K.P. & Anderson, D.R.. (2002) Model Selection and Multimodel
Inference: A Practical Information – Theoretic Approach. Springer-Verlag,
Heidelberg, Germany.
Canham, C.D., LePage, P.T. & Coates, K.D. (2004) A neighborhood analysis
of canopy tree competition: effects of shading versus crowding. Canadian
Journal of Forest Research, 34, 778–787.
Carreira, J.A., Quintanilla, J. & Linares, J.C.. (2009) Conservation and
management adaptation options for the in-situ preservation of
endemic mountain conifer forests: the Abies pinsapo case in Andalusia
(Spain).MediterraneanMountains in a ChangingWorld. Guidelines for Devel-
oping Action Plans, pp. 57–61. IUCN, Gland, Switzerland and Malaga,
Spain.
Das, A., Battles, J., van Mantgem, P.J. & Stephenson, N.L. (2008) Spatial ele-
ments ofmortality risk in old-growth forests.Ecology, 89, 1744–1756.
Dobbertin, M. (2005) Tree growth as indicator of tree vitality and of tree reac-
tion to environmental stress: a review. European Journal of Forest Research,
124, 319–333.
Dobbertin, M. & Brang, P. (2001) Crown defoliation improves tree mortality
models. Forest Ecology andManagement, 141, 271–284.
Fortin, M.J., Bedard, S., DeBlois, J. &Meunier, S. (2008) Accounting for error
correlations in diameter increment modelling: a case study applied to north-
ern hardwood stands in Quebec, Canada. Canadian Journal of Forest
Research, 38, 2274–2286.
Franklin, J.F., Shugart, H.H.&Harmon,M.E. (1987) Tree death as an ecologi-
cal process.BioScience, 37, 550–556.
Franklin, J.F., Spies, T.A., Van Pelt, R., Carey, A.B., Thornburgh, D.A., Berg,
D.R., Lindenmayer, D.B., Harmon,M.E., Keeton,W.S., Shaw, D.C., Bible,
K. & Chen, J. (2002) Disturbances and structural development of natural
forest ecosystems with silvicultural implications, using Douglas-fir forests as
an example. Forest Ecology andManagement, 155, 399–423.
Greenwood, D.L. & Weisberg, P.J. (2008) Density-dependent tree mortality in
pinyon-juniper woodlands. Forest Ecology and Management, 255, 2129–
2137.
Harvey, A.C.. (1989) Forecasting, Structural Time Series Models and the
Kalman Filter. CambridgeUniversity Press, Cambridge, UK.
He, J.-S., Zhang, Q.-B. & Bazzaz, F.A. (2005) Differential drought
responses between saplings and adult trees in four co-occurring species of
NewEngland.Trees- Structure and Function, 19, 442–450.
Holmes, R.L. (1983) Computer-assisted quality control in tree-ring dating and
measurement.Tree-RingBulletin, 43, 68–78.
Holmes, R.L.. (1992). Dendrochronology Program Library. Laboratory of
Tree-RingResearch,University of Arizona, Tucson, AZ.
IPCC (2007) Climate Change 2007: The Physical Science Basis. Contribution of
Working Group I to the Fourth Assessment Report of the Intergovernmental
Panel on Climate Change (eds S. Solomon, D. Qin, M. Manning, Z. Chen,
M. Marquis, K.B. Averyt, M. Tignor & H.L. Miller), 996 pp. Cambridge
University Press, Cambridge.
Linares, J.C., Camarero, J.J. & Carreira, J.A. (2009) Interacting effects
of climate and forest-cover changes on mortality and growth of the
southernmost European fir forests. Global Ecology and Biogeography, 18,
485–497.
Linares, J.C. & Carreira, J.A. (2009) Temperate-like stand dynamics in relict
Mediterranean-fir (Abies pinsapo, Boiss.) forests from Southern Spain.
Annals of Forest Science, 66, 610–619.
Linares, J.C., Delgado-Huertas, A., Camarero, J.J., Merino, J. &Carreira, J.A.
(2009) Competition and drought limit the response of water-use efficiency to
rising atmospheric carbon dioxide in the Mediterranean fir Abies pinsapo.
Oecologia, 161, 611–624.
Lindner, M., Maroschek, M., Netherer, S., Kremer, A., Barbati, A., Garcia-
Gonzalo, J., Seidl, R., Delzon, S., Corona, P., Kolstrom, M., Lexer, M.J. &
Marchetti, M. (2009) Climate change impacts, adaptive capacity, and vul-
nerability of European forest ecosystems. Forest Ecology and Management,
162, 73–86.
Macias, M., Andreu, L., Bosch, O., Camarero, J.J. & Gutierrez, E. (2006)
Increasing aridity is enhancing silver fir Abies alba (Mill.) water
stress in its south-western distribution limit. Climatic Change, 79, 289–
313.
Manion, P.D.. (1991) Tree Disease Concepts. Prentice-Hall, Englewood
Cliffs.
van Mantgem, P.J. & Stephenson, N.L. (2007) Apparent climatically induced
increase of tree mortality rates in a temperate forest. Ecology Letters, 10,
909–916.
vanMantgem, P.J., Stephenson, N.L., Mutch, L.S., Johnson, V.G., Esperanza,
A.M. & Parsons, D.J. (2003) Growth rate predicts mortality ofAbies concol-
or in both burned and unburned stands. Canadian Journal of Forest
Research, 33, 1029–1038.
Martın-Benito, D., Cherubini, P., del Rıo, M. & Canellas, I. (2007) Growth
response to climate and drought in Pinus nigraArn. trees of different crown
classes.Trees- Structure and Function, 22, 363–373.
Nowacki, G.J. & Abrams, M.D. (1997) Radial-growth averaging criteria
for reconstructing disturbance histories from presettelement-origin oaks.
EcologicalMonographs, 67, 225–249.
Ogle, K., Whitham, T.C. & Cobb, N.S. (2000) Tree-ring variation in pinyon
predicts likelihood of death following severe drought. Ecology, 81, 3237–
3243.
Orwig, D.A. & Abrams, M.D. (1997) Variation in radial growth responses to
drought among species, site, and canopy strata. Trees- Structure and Func-
tion, 11, 474–484.
Pedersen, B.S. (1998a) Modeling tree mortality in response to short and long-
term environmental stresses.EcologicalModelling, 105, 347–351.
Pedersen, B.S. (1998b) The role of stress in the mortality ofMidwestern oaks as
indicated by growth prior to death.Ecology, 79, 79–93.
Peet, R.K. & Christensen, N.L. (1987) Competition and tree death. BioScience,
37, 586–594.
Penuelas, J., Lloret, F. & Montoya, R. (2001) Severe drought effects on Medi-
terranean woody flora in Spain. Forest Science, 47, 214–218.
Pinto, P.E., Gegout, J.C., Herve, J.C. &Dhote, J.F. (2007) Changes in environ-
mental controls on the growth of Abies albaMill. in the Vosges Mountains,
north-eastern France, during the 20th century. Global Ecology and Biogeog-
raphy, 16, 472–484.
RDevelopment Core Team (2010)R:A Language and Environment for Statisti-
cal Computing. R Foundation for Statistical Computing, Vienna, Austria.
Available at: http://www.R-project.org.
602 J. C. Linares, J. J. Camarero & J. A. Carreira
� 2010 The Authors. Journal compilation � 2010 British Ecological Society, Journal of Ecology, 98, 592–603
Rebetez, M. & Dobbertin, M. (2004) Climate change may already threaten
Scots pine stands in the Swiss Alps. Theoretical and Applied Climatology, 79,
1–9.
Rodrigo, F.S., Esteban-Parra, M.J., Pozo-Vazquez, D. & Castro-Diez, Y.
(1999) A 500-year precipitation record in Southern Spain. International Jour-
nal of Climatology, 19, 1233–1253.
Sarris, D., Christodoulakis, D. &Korner, C. (2007) Recent decline in precipita-
tion and tree growth in the eastern Mediterranean. Global Change Biology,
13, 1187–1200.
Saxe, H., Cannell, M.G.R., Johnsen, B., Ryan, M.G. & Vourlitis, G. (2001)
Tree and forest functioning in response to global warming.New Phytologist,
149, 369–399.
Suarez,M.L., Ghermandi, L. &Kitzberger, T. (2004) Factors predisposing epi-
sodic drought-induced tree mortality inNothofagus – site, climatic sensitivity
and growth trends. Journal of Ecology, 92, 954–966.
Tardif, J., Camarero, J.J., Ribas, M. & Gutierrez, E. (2003) Spatiotemporal
variability in radial growth of trees in the Central Pyrenees: climatic and site
influences.EcologicalMonographs, 73, 241–257.
Terrab, A., Talavera, S., Arista, M., Paun, O., Stuessy, T. & Tremetsberger, K.
(2007) Genetic diversity at chloroplast microsatellites (cpSSRs) and geo-
graphic structure in endangered West Mediterranean firs (Abies spp., Pina-
ceae).Taxon, 56, 409–416.
Thuiller, W., Albert, C., Araujo, M.B., Berry, P.M., Cabeza, M., Guisan, A.,
Hickler, T., Midgley, G.F., Paterson, J., Schurr, F.M., Sykes, M.T. & Zim-
mermann, L. (2008) Predicting global change impacts on plant species’ distri-
butions: Future challenges. Perspectives in Plant Ecology, Evolution and
Systematics, 9, 137–152.
Waring, R.H. (1987) Characteristics of trees predisposed to die. BioScience, 37,
569–574.
Wyckoff, P.H. & Clark, J.S. (2000) Predicting tree mortality from diameter
growth: a comparison of maximum likelihood and Bayesian approaches.
Canadian Journal of Forest Research, 30, 156–167.
Zuur, A.F., Fryer, R.J., Jolliffe, I.T., Dekker, R. & Beukema, J.J. (2003) Esti-
mating common trends inmultivariate time series using dynamic factor anal-
ysis.Environmetrics, 14, 665–685.
Zuur, A.F., Ieno, E.N., Walker, N., Saveliev, A.A. & Smith, G.M.. (2009)
Mixed Effects Models and Extensions in Ecology with R. Springer, New
York.
Received 31October 2009; accepted 28 January 2010
Handling Editor: JonathanNewman
Supporting Information
Additional Supporting Information may be found in the online ver-
sion of this article:
Table S1. Characteristics of the meteorological stations used to com-
pute the regionalmean climatic series.
Figure S1.Age (estimated at 1.3 m) distribution for sampled trees.
Figure S2. Estimated trends obtained by DFA of the normalized
basal area increment for dominant (Dom, black symbols, n = 17),
suppressed (Supp, grey symbols, n = 25), and dying trees (white
symbols, n = 28).
Figure S3. (a) Graphical comparison between total annual precipi-
tation and the stand-level residuals of BAI not accounted for by
the linear mixed effect model (LMEM) based on the long-term
trends of temperature for the February–March–April and the
June–July–August windows, and (b) linear regressions between
annual precipitation and the LMEM residuals in the four studied
plots.
As a service to our authors and readers, this journal provides
supporting information supplied by the authors. Such materials
may be re-organized for online delivery, but are not copy-edited
or typeset. Technical support issues arising from supporting
information (other than missing files) should be addressed to the
authors.
Competition enhances drought in Abies pinsapo 603
� 2010 The Authors. Journal compilation � 2010 British Ecological Society, Journal of Ecology, 98, 592–603


![genetic variation of norway spruce (picea abies [l.] karst ...](https://static.fdokumen.com/doc/165x107/633d6582b988f9753c06267d/genetic-variation-of-norway-spruce-picea-abies-l-karst-.jpg)