Compartmental-modelling-based measurement of ... - Nature
9
1 SCIENTIFIC REPORTS | (2019) 9:11269 | https://doi.org/10.1038/s41598-019-47728-x www.nature.com/scientificreports Compartmental-modelling-based measurement of murine glomerular filtration rate using 18 F-fluoride PET/CT Hyo Sang Lee 1 , Yeon-koo Kang 2 , Hyunjong Lee 2 , Jeong Hee Han 3 , Byung Seok Moon 3 , Seok-Soo Byun 4 , Dong-Wan Chae 5 , Keon Wook Kang 6,7 & Won Woo Lee 3,8 Accurate measurement of glomerular filtration rate (GFR) is essential for optimal decision making in many clinical settings of renal failure. We aimed to show that GFR can be accurately measured using compartmental tracer kinetic analysis of 18 F-fluoride dynamic PET/CT. Twenty-three male Sprague-Dawley rats of three experimental groups (cyclosporine-administered [n = 8], unilaterally nephrectomized [n = 8], and control [n = 7]) underwent simultaneous 18 F-fluoride dynamic PET/CT and reference 51 Cr-EDTA GFR (GFR CrEDTA ) test at day 0 and post-intervention day 3. 18 F-fluoride PET GFR (GFR F-PET ) was calculated by multiplying the influx rate and functional kidney volume in a single-tissue- compartmental kinetic model. Within-test repeatability and between-test agreement were evaluated by intraclass correlation coefficient (ICC) and Bland-Altman analysis. In the control group, repeatability of GFR F-PET was excellent (ICC = 0.9901, repeatability coefficient = 12.5%). GFR F-PET significantly decreased in the renally impaired rats in accordance with respective GFR CrEDTA changes. In the pooled population, GFR F-PET agreed well with GFR CrEDTA with minimal bias (−2.4%) and narrow 95% limits of agreement (−25.0% to 20.1%). These data suggest that the single-compartmental kinetic analysis of 18 F-fluoride dynamic PET/CT is an accurate method for GFR measurement. Further studies in humans are warranted. e glomerular filtration rate (GFR) is a widely accepted measure of global renal function, and accurate measure- ment of GFR is essential for optimal decision making in many clinical settings of renal failure 1 . e GFR has been typically measured as the urinary clearance of an ideal filtration marker such as inulin 2 . Alternatively, plasma clearance of a filtration marker, such as 51 Cr-ethylenediamine-tetraacetic acid (EDTA), has been advocated for GFR measurement because of its acceptable accuracy without the necessity for tricky urine handling 3 . However, its drawbacks include the requirement for multiple blood samplings and a time-consuming procedure. Nuclear medicine imaging techniques offer various means of GFR quantitation. Planar renal scintigraphy using 99m Tc-diethylenetriamine-pentaacetic acid (DTPA) can provide imaging-based estimation of GFR via Gates’ method 4 . However, the GFR calculated from the Gates’ formula was reported to be less accurate than measured or estimated GFR, probably due to the potential errors in the correction of background and kidney depth, inherent limitations of two-dimensional images 5,6 . Positron emission tomography (PET) enables dynamic 3-dimensional 1 Department of Nuclear Medicine, Gangneung Asan Hospital, University of Ulsan College of Medicine, Gangneung, Republic of Korea. 2 Department of Molecular Medicine and Biopharmaceutical Sciences, Graduate School of Convergence Science and Technology, Seoul National University, Seoul, Republic of Korea. 3 Department of Nuclear Medicine, Seoul National University Bundang Hospital, Seoul National University College of Medicine, Seongnam-si, Republic of Korea. 4 Department of Urology, Seoul National University Bundang Hospital, Seoul National University College of Medicine, Seongnam-si, Republic of Korea. 5 Department of Internal Medicine, Seoul National University Bundang Hospital, Seoul National University College of Medicine, Seongnam-si, Republic of Korea. 6 Department of Nuclear Medicine, Seoul National University Hospital, Seoul National University College of Medicine, Seoul, Republic of Korea. 7 Cancer Research Institute, Seoul National University, Seoul, Republic of Korea. 8 Institute of Radiation Medicine, Medical Research Centre, Seoul National University, Seoul, Republic of Korea. Hyo Sang Lee and Yeon- koo Kang contributed equally. Correspondence and requests for materials should be addressed to W.W.L. (email: [email protected]) Received: 30 November 2018 Accepted: 23 July 2019 Published: xx xx xxxx OPEN
-
Upload
khangminh22 -
Category
Documents
-
view
0 -
download
0
Transcript of Compartmental-modelling-based measurement of ... - Nature
1Scientific RepoRtS | (2019) 9:11269 | https://doi.org/10.1038/s41598-019-47728-x
www.nature.com/scientificreports
compartmental-modelling-based measurement of murine glomerular filtration rate using 18F-fluoride pet/ctHyo Sang Lee1, Yeon-koo Kang2, Hyunjong Lee2, Jeong Hee Han3, Byung Seok Moon3, Seok-Soo Byun4, Dong-Wan chae5, Keon Wook Kang6,7 & Won Woo Lee 3,8
Accurate measurement of glomerular filtration rate (GFR) is essential for optimal decision making in many clinical settings of renal failure. We aimed to show that GFR can be accurately measured using compartmental tracer kinetic analysis of 18F-fluoride dynamic PET/CT. Twenty-three male Sprague-Dawley rats of three experimental groups (cyclosporine-administered [n = 8], unilaterally nephrectomized [n = 8], and control [n = 7]) underwent simultaneous 18F-fluoride dynamic PET/CT and reference 51Cr-EDTA GFR (GFRcreDtA) test at day 0 and post-intervention day 3. 18F-fluoride PET GFR (GFRf-pet) was calculated by multiplying the influx rate and functional kidney volume in a single-tissue-compartmental kinetic model. Within-test repeatability and between-test agreement were evaluated by intraclass correlation coefficient (ICC) and Bland-Altman analysis. In the control group, repeatability of GFRf-pet was excellent (ICC = 0.9901, repeatability coefficient = 12.5%). GFRf-pet significantly decreased in the renally impaired rats in accordance with respective GFRcreDtA changes. in the pooled population, GFRf-pet agreed well with GFRcreDtA with minimal bias (−2.4%) and narrow 95% limits of agreement (−25.0% to 20.1%). These data suggest that the single-compartmental kinetic analysis of 18F-fluoride dynamic PET/CT is an accurate method for GFR measurement. Further studies in humans are warranted.
The glomerular filtration rate (GFR) is a widely accepted measure of global renal function, and accurate measure-ment of GFR is essential for optimal decision making in many clinical settings of renal failure1. The GFR has been typically measured as the urinary clearance of an ideal filtration marker such as inulin2. Alternatively, plasma clearance of a filtration marker, such as 51Cr-ethylenediamine-tetraacetic acid (EDTA), has been advocated for GFR measurement because of its acceptable accuracy without the necessity for tricky urine handling3. However, its drawbacks include the requirement for multiple blood samplings and a time-consuming procedure.
Nuclear medicine imaging techniques offer various means of GFR quantitation. Planar renal scintigraphy using 99mTc-diethylenetriamine-pentaacetic acid (DTPA) can provide imaging-based estimation of GFR via Gates’ method4. However, the GFR calculated from the Gates’ formula was reported to be less accurate than measured or estimated GFR, probably due to the potential errors in the correction of background and kidney depth, inherent limitations of two-dimensional images5,6. Positron emission tomography (PET) enables dynamic 3-dimensional
1Department of Nuclear Medicine, Gangneung Asan Hospital, University of Ulsan College of Medicine, Gangneung, Republic of Korea. 2Department of Molecular Medicine and Biopharmaceutical Sciences, Graduate School of Convergence Science and Technology, Seoul National University, Seoul, Republic of Korea. 3Department of Nuclear Medicine, Seoul National University Bundang Hospital, Seoul National University College of Medicine, Seongnam-si, Republic of Korea. 4Department of Urology, Seoul National University Bundang Hospital, Seoul National University College of Medicine, Seongnam-si, Republic of Korea. 5Department of Internal Medicine, Seoul National University Bundang Hospital, Seoul National University College of Medicine, Seongnam-si, Republic of Korea. 6Department of Nuclear Medicine, Seoul National University Hospital, Seoul National University College of Medicine, Seoul, Republic of Korea. 7Cancer Research Institute, Seoul National University, Seoul, Republic of Korea. 8Institute of Radiation Medicine, Medical Research Centre, Seoul National University, Seoul, Republic of Korea. Hyo Sang Lee and Yeon-koo Kang contributed equally. Correspondence and requests for materials should be addressed to W.W.L. (email: [email protected])
Received: 30 November 2018
Accepted: 23 July 2019
Published: xx xx xxxx
open
2Scientific RepoRtS | (2019) 9:11269 | https://doi.org/10.1038/s41598-019-47728-x
www.nature.com/scientificreportswww.nature.com/scientificreports/
imaging, allowing accurate measurement of input function and tissue concentration of radiotracers, therefore has the potential for quantitative renal imaging7. Several proof-of-concept studies produced promising results. 68Ga-1,4,7-triaza-cyclononane-1,4,7-triacetic acid (68Ga-NOTA) or 68Ga-EDTA have been investigated for GFR measurement but the results are yet to be validated8,9. To date, there is no accepted methodological standard of PET for GFR measurement.
18F-fluoride is an established skeletal PET radiopharmaceutical, but it could also be used for renal imaging because fluoride is not bound to plasma protein and thus is freely filtered through glomeruli10. However, flu-oride clearance is always lower than GFR due to significant tubular reabsorption11,12. Therefore, the previous 18F-fluoride dynamic PET/CT study reported a moderate correlation of fluoride clearance with a broad range of renal function parameters; the direct measurement of GFR was beyond the scope13.
Compartmental tracer kinetic modelling enables the measurement of rate constants as parameters of impor-tant physiological processes in vivo. Dynamic PET is suited for this purpose due to its accurate and non-invasive quantification ability. We hypothesized that because the compartmental modelling allows the separate quantifica-tion of influx and efflux rates, we might be able to quantify GFR using 18F-fluoride influx rate despite the presence of tubular reabsorption. In this study, we showed that GFR could be accurately measured in rats via compart-mental modelling of dynamic 18F-fluoride PET/CT. Neither urine handling nor blood sampling was necessary in this imaging-based approach. Validity of the compartmental model was independently tested by calculating GFR using dynamic PET/CT scans of 68Ga-NOTA.
ResultsWithin-test repeatability. The single-tissue-compartmental model provided excellent goodness-of-fit to the 18F-fluoride renal cortical time-activity curve (TAC) (median R2 = 0.9674 [inter-quartile range (IQR) = 0.9538–0.9763]). The results of the parameter estimation are summarized in Table 1. The renal cor-tical volume VC between paired measurements was highly concordant (intraclass correlation coefficient [ICC] = 0.9846 [95% confidence interval (CI) = 0.9802–0.9946], repeatability coefficient = 3.1%), which suggests the reproducibility of the manual drawing of the volumes of interest (VOIs).
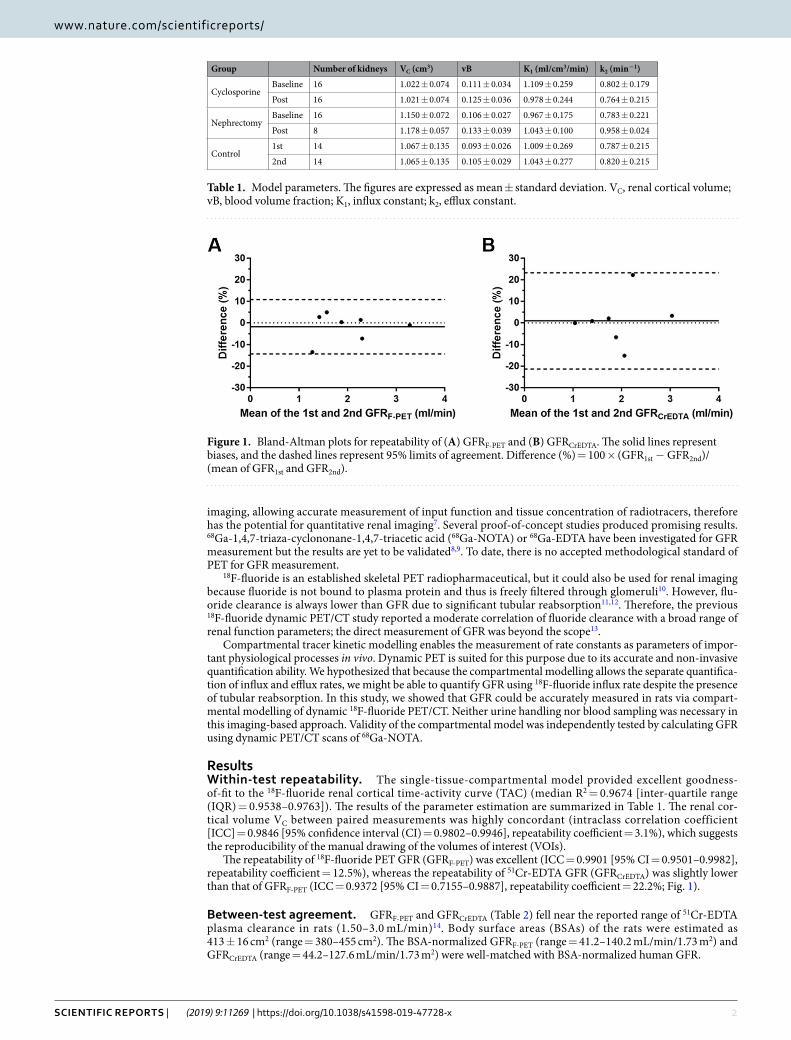
The repeatability of 18F-fluoride PET GFR (GFRF-PET) was excellent (ICC = 0.9901 [95% CI = 0.9501–0.9982], repeatability coefficient = 12.5%), whereas the repeatability of 51Cr-EDTA GFR (GFRCrEDTA) was slightly lower than that of GFRF-PET (ICC = 0.9372 [95% CI = 0.7155–0.9887], repeatability coefficient = 22.2%; Fig. 1).
Between-test agreement. GFRF-PET and GFRCrEDTA (Table 2) fell near the reported range of 51Cr-EDTA plasma clearance in rats (1.50–3.0 mL/min)14. Body surface areas (BSAs) of the rats were estimated as 413 ± 16 cm2 (range = 380–455 cm2). The BSA-normalized GFRF-PET (range = 41.2–140.2 mL/min/1.73 m2) and GFRCrEDTA (range = 44.2–127.6 mL/min/1.73 m2) were well-matched with BSA-normalized human GFR.
Group Number of kidneys VC (cm3) vB K1 (ml/cm3/min) k2 (min−1)
CyclosporineBaseline 16 1.022 ± 0.074 0.111 ± 0.034 1.109 ± 0.259 0.802 ± 0.179
Post 16 1.021 ± 0.074 0.125 ± 0.036 0.978 ± 0.244 0.764 ± 0.215
NephrectomyBaseline 16 1.150 ± 0.072 0.106 ± 0.027 0.967 ± 0.175 0.783 ± 0.221
Post 8 1.178 ± 0.057 0.133 ± 0.039 1.043 ± 0.100 0.958 ± 0.024
Control1st 14 1.067 ± 0.135 0.093 ± 0.026 1.009 ± 0.269 0.787 ± 0.215
2nd 14 1.065 ± 0.135 0.105 ± 0.029 1.043 ± 0.277 0.820 ± 0.215
Table 1. Model parameters. The figures are expressed as mean ± standard deviation. VC, renal cortical volume; vB, blood volume fraction; K1, influx constant; k2, efflux constant.
Figure 1. Bland-Altman plots for repeatability of (A) GFRF-PET and (B) GFRCrEDTA. The solid lines represent biases, and the dashed lines represent 95% limits of agreement. Difference (%) = 100 × (GFR1st − GFR2nd)/(mean of GFR1st and GFR2nd).
3Scientific RepoRtS | (2019) 9:11269 | https://doi.org/10.1038/s41598-019-47728-x
www.nature.com/scientificreportswww.nature.com/scientificreports/
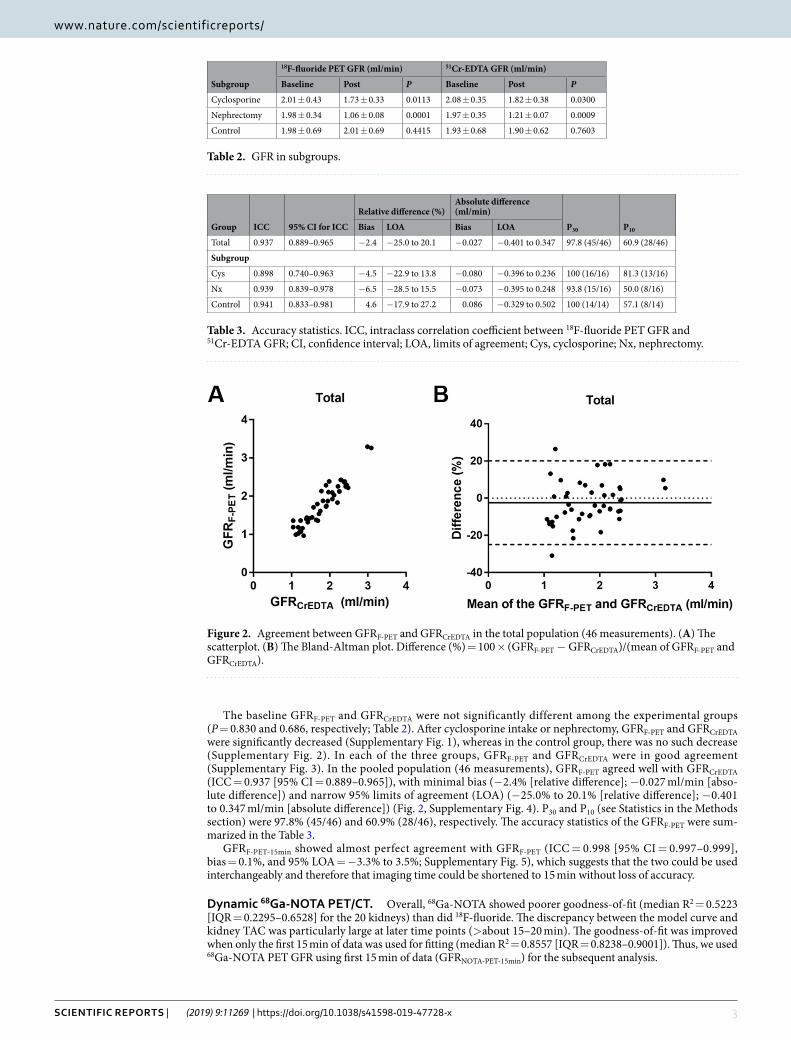
The baseline GFRF-PET and GFRCrEDTA were not significantly different among the experimental groups (P = 0.830 and 0.686, respectively; Table 2). After cyclosporine intake or nephrectomy, GFRF-PET and GFRCrEDTA were significantly decreased (Supplementary Fig. 1), whereas in the control group, there was no such decrease (Supplementary Fig. 2). In each of the three groups, GFRF-PET and GFRCrEDTA were in good agreement (Supplementary Fig. 3). In the pooled population (46 measurements), GFRF-PET agreed well with GFRCrEDTA (ICC = 0.937 [95% CI = 0.889–0.965]), with minimal bias (−2.4% [relative difference]; −0.027 ml/min [abso-lute difference]) and narrow 95% limits of agreement (LOA) (−25.0% to 20.1% [relative difference]; −0.401 to 0.347 ml/min [absolute difference]) (Fig. 2, Supplementary Fig. 4). P30 and P10 (see Statistics in the Methods section) were 97.8% (45/46) and 60.9% (28/46), respectively. The accuracy statistics of the GFRF-PET were sum-marized in the Table 3.
GFRF-PET-15min showed almost perfect agreement with GFRF-PET (ICC = 0.998 [95% CI = 0.997–0.999], bias = 0.1%, and 95% LOA = −3.3% to 3.5%; Supplementary Fig. 5), which suggests that the two could be used interchangeably and therefore that imaging time could be shortened to 15 min without loss of accuracy.
Dynamic 68Ga-NOTA PET/CT. Overall, 68Ga-NOTA showed poorer goodness-of-fit (median R2 = 0.5223 [IQR = 0.2295–0.6528] for the 20 kidneys) than did 18F-fluoride. The discrepancy between the model curve and kidney TAC was particularly large at later time points (>about 15–20 min). The goodness-of-fit was improved when only the first 15 min of data was used for fitting (median R2 = 0.8557 [IQR = 0.8238–0.9001]). Thus, we used 68Ga-NOTA PET GFR using first 15 min of data (GFRNOTA-PET-15min) for the subsequent analysis.
Subgroup
18F-fluoride PET GFR (ml/min) 51Cr-EDTA GFR (ml/min)
Baseline Post P Baseline Post P
Cyclosporine 2.01 ± 0.43 1.73 ± 0.33 0.0113 2.08 ± 0.35 1.82 ± 0.38 0.0300
Nephrectomy 1.98 ± 0.34 1.06 ± 0.08 0.0001 1.97 ± 0.35 1.21 ± 0.07 0.0009
Control 1.98 ± 0.69 2.01 ± 0.69 0.4415 1.93 ± 0.68 1.90 ± 0.62 0.7603
Table 2. GFR in subgroups.
Figure 2. Agreement between GFRF-PET and GFRCrEDTA in the total population (46 measurements). (A) The scatterplot. (B) The Bland-Altman plot. Difference (%) = 100 × (GFRF-PET − GFRCrEDTA)/(mean of GFRF-PET and GFRCrEDTA).
Group ICC 95% CI for ICC
Relative difference (%)Absolute difference (ml/min)
P30 P10Bias LOA Bias LOA
Total 0.937 0.889–0.965 −2.4 −25.0 to 20.1 −0.027 −0.401 to 0.347 97.8 (45/46) 60.9 (28/46)
Subgroup
Cys 0.898 0.740–0.963 −4.5 −22.9 to 13.8 −0.080 −0.396 to 0.236 100 (16/16) 81.3 (13/16)
Nx 0.939 0.839–0.978 −6.5 −28.5 to 15.5 −0.073 −0.395 to 0.248 93.8 (15/16) 50.0 (8/16)
Control 0.941 0.833–0.981 4.6 −17.9 to 27.2 0.086 −0.329 to 0.502 100 (14/14) 57.1 (8/14)
Table 3. Accuracy statistics. ICC, intraclass correlation coefficient between 18F-fluoride PET GFR and 51Cr-EDTA GFR; CI, confidence interval; LOA, limits of agreement; Cys, cyclosporine; Nx, nephrectomy.
4Scientific RepoRtS | (2019) 9:11269 | https://doi.org/10.1038/s41598-019-47728-x
www.nature.com/scientificreportswww.nature.com/scientificreports/
Because 68Ga-NOTA GFR calculation using whole-blood input function produced significant bias, conversion to plasma input function was essential (Supplementary Fig. 6A). After conversion using measured haematocrit, GFRNOTA-PET-15min showed a good agreement with GFRCrEDTA (ICC = 0.9664 [95% CI = 0.8787–0.9914]) with min-imal bias (−2.4%) and narrow 95% LOA (−25.9% to 21.1%; Supplementary Fig. 6B). GFRNOTA-PET-15min using a fixed haematocrit of 0.45 showed far wider LOA (−46.8% to 55.5%) than those using measured haematocrit (Supplementary Fig. 6C).
DiscussionIn this study, we developed a compartmental tracer kinetic model for PET-based GFR measurement and applied it to 18F-fluoride, which is not a GFR tracer under the conventional concept of urinary or plasma clearance meas-urement. According to the model, the influx rate K1 can be considered as GFR per unit extravascular renal cortical volume for any tracer that is freely filtered through glomeruli but does not undergo tubular secretion. Previous reports suggests that 18F-fluoride has such properties11,12. GFRF-PET was in good agreement with gold-standard GFRCrEDTA in conditions of nephrotoxic drug use and post-nephrectomy with minimal bias and narrow LOA. P30 and P10 were 97.8% and 60.9%, respectively, which suggests that GFRF-PET possesses sufficient accuracy (P30 > 80% and P10 > 50%) compared with other GFR markers such as iohexol, iothalamate and DTPA15,16. Furthermore, the accuracy of GFRF-PET was preserved with a reduction in imaging time to 15 min, which bears practical importance.
Good within-test repeatability is a prerequisite for assessing between-test agreement17. The repeatability of GFRF-PET was excellent with repeatability coefficient (half-width of the LOA) of 12.6%. GFRCrEDTA measured in this study showed slightly poorer repeatability coefficient of 22.2%, which is somewhat large compared to the reproducibility figures previously reported in humans (7.4–9.0%)18. This might have been caused by technical difficulties of the small animal experiment. We speculate that the agreement between GFRF-PET and GFRCrEDTA might be even better in humans, considering the expected increase in the precision of GFRCrEDTA.
To our knowledge, approaches of measuring GFR by using a compartmental rate constant have not been attempted in the field of nuclear medicine. In contrast, various types of compartmental modelling approach have been employed in magnetic resonance imaging (MRI) or CT studies. However, a critical literature review suggested that these MRI- or CT-based methodologies are not adequately accurate to be used as routine clinical or research tools19. Among the MRI-based methods, the cortical compartment model proposed by Annet et al. is similar to ours20. The differences are that Annet’s method used two-dimensional regions of interest (ROIs) and abdominal aortic input function and that the dispersion and time delay from aorta to renal vasculature were accounted for. Many MRI-based methods use two-dimensional single-slice ROIs for better temporal res-olution, and this acts as a limitation because a single slice or a slab cannot be representative of a whole kid-ney20–22. In this respect, the inherent 3-dimensional capability of PET is an advantage. The use of dispersion- and time-delay-corrected aortic input curves might be a merit of Annet’s method in their rabbit experiment. However, we do not think that the non-correction for dispersion and time-delay caused any significant biases in our rat experiments because of smaller animal size. If this PET/CT analysis is implemented in humans, a proper selection of site for arterial input function measurement may become an important issue.
There may be a concern about the spill-out from the renal pelvic radioactivity into the renal cortical ROIs, considering small size of the rat kidneys. However, the scatter from the renal pelvic radioactivity turned out to be negligible compared with the renal cortical uptake. No significant amount of spill-out activity from the renal pel-vis reached the renal cortical ROIs because the renal cortex and renal pelvis are intervened by the renal medulla and because the spatial resolution in terms of full-width half-maximum of the micro PET system used in our study was 0.7 mm that was much smaller than the thickness of the renal medulla (more than 3 mm).
We conducted another set of experiments using 68Ga-NOTA. The results also showed good agreement with GFRCrEDTA (Supplementary Fig. 6B). However, the goodness-of-fit to the 68Ga-NOTA data was not as good as that for 18F-fluoride. The cause of the poor fit is unclear. We speculate that the urination process might not fol-low first-order (exponential) kinetics and therefore that the process might not be appropriately described by an exponential rate constant ku. For 68Ga-NOTA, the rate constant k2 (=ku + kreabs) becomes ku because kreabs = 0, and according to the above speculation, k2 also becomes an inappropriately modelled parameter. This could hamper the validity of the model equations. In contrast, 18F-fluoride is reabsorbed through the lipid bilayer of tubular cells via passive diffusion23, and passive diffusion follows first-order kinetics. The reabsorption of fluoride is approximately 60% of glomerular filtrate, but it could increase up to 90%11,12. This implies that kreabs comprises a major portion of the efflux constant k2, causing the efflux process to roughly follow first-order kinetics. Therefore, the model fit becomes better for 18F-fluoride, which would be a paradoxical advantage of nonzero reabsorption.
Measurement of haematocrit was essential for the calculation of 68Ga-NOTA plasma input function because the fixed plasma fraction produced imprecise GFR (Supplementary Fig. 6C). In contrast, a fixed plasma fraction of 1.23 produced accurate GFR for 18F-fluoride. It is likely that the plasma fraction of 18F-fluoride remained relatively stable irrespective of haematocrit because 18F-fluoride permeates into the RBC24, whereas the plasma fraction of 68Ga-NOTA is more affected by haematocrit because 68Ga-NOTA cannot enter in the RBC8. The high accuracy of GFRF-PET under a fixed plasma fraction is an advantage because haematocrit need not be measured, eliminating the need for blood sampling.
Given the high accuracy of the GFR measurement using dynamic 18F-fluoride PET, translational application to humans may be promising for appropriate indications. Using the expensive PET technology for GFR measure-ment could only be justified in clinical situations where accurate measurement of GFR is critically necessary. Such situations might include nephron-sparing surgery for malignant lesions in patients with marginal renal function, determination of overall and split renal function before abdominal radiotherapy, and monitoring of renal func-tion during nephrotoxic drug use9,25.
5Scientific RepoRtS | (2019) 9:11269 | https://doi.org/10.1038/s41598-019-47728-x
www.nature.com/scientificreportswww.nature.com/scientificreports/
The present study has limitations. First, the range of the measured GFR was not sufficiently wide. The normal-ized GFRF-PET measured in this study fell within 41.2–140.2 mL/min/1.73 m2 BSA. Further validation is needed for low GFR values because chronic kidney disease stage grades 4 and 5 (GFR <30 mL/min/1.73 m2) were not included in the tested range26. Second, manual drawing of ROIs is too laborious for future clinical application. Automatic segmentation of renal cortex might have to be implemented.
In conclusion, dynamic 18F-fluoride PET/CT in conjunction with a single-compartmental modelling approach holds promise as a reliable and accurate method for GFR measurement. The difficulties in urine handling and blood sampling in the measurement of conventional urinary and plasma clearance of ideal filtration markers may be overcome by pure image-based analysis. A quick assessment of GFR (within 15 min) is another practical advantage of this approach. Further studies in humans are warranted.
Materials and Methodstracer kinetic modelling. The compartmental tracer kinetic modelling is a mathematical framework that originated from the field of pharmacokinetics and is a commonly used model for analysing PET data27. In the modelling, it is assumed that there are physiologically separate pools, or compartments, of a tracer substance27. Each compartment has its own influx and efflux rate constants, and the model fitting procedure allows to quantify them. We devised a compartmental tracer kinetic model in which the rate constant of a certain compartment could be interpreted as GFR.
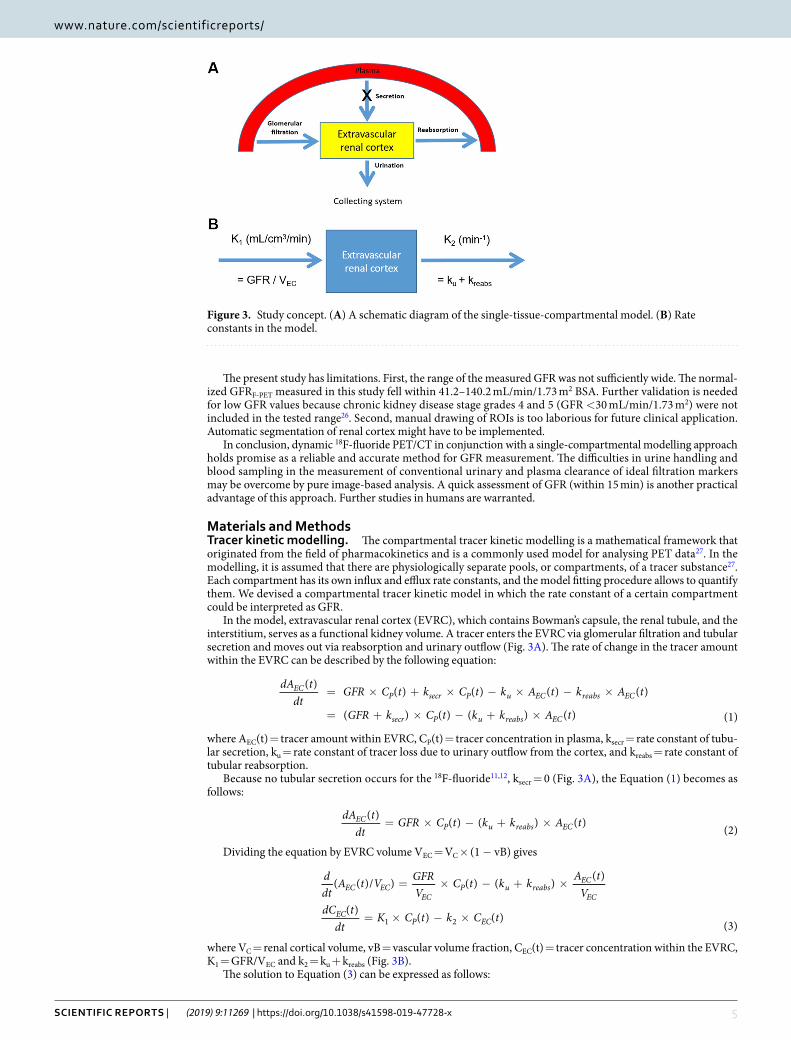
In the model, extravascular renal cortex (EVRC), which contains Bowman’s capsule, the renal tubule, and the interstitium, serves as a functional kidney volume. A tracer enters the EVRC via glomerular filtration and tubular secretion and moves out via reabsorption and urinary outflow (Fig. 3A). The rate of change in the tracer amount within the EVRC can be described by the following equation:
= × + × − × − ×
= + × − + ×
dA tdt
GFR C t k C t k A t k A t
GFR k C t k k A t
( ) ( ) ( ) ( ) ( )
( ) ( ) ( ) ( ) (1)
ECP secr P u EC reabs EC
secr P u reabs EC
where AEC(t) = tracer amount within EVRC, CP(t) = tracer concentration in plasma, ksecr = rate constant of tubu-lar secretion, ku = rate constant of tracer loss due to urinary outflow from the cortex, and kreabs = rate constant of tubular reabsorption.
Because no tubular secretion occurs for the 18F-fluoride11,12, ksecr = 0 (Fig. 3A), the Equation (1) becomes as follows:
dA tdt
GFR C t k k A t( ) ( ) ( ) ( ) (2)EC
P u reabs EC= × − + ×
Dividing the equation by EVRC volume VEC = VC × (1 − vB) gives
= × − + ×
= × − ×
ddt
A t V GFRV
C t k k A tV
dC tdt
K C t k C t
( ( )/ ) ( ) ( ) ( )
( ) ( ) ( )(3)
EC ECEC
P u reabsEC
EC
ECP EC1 2
where VC = renal cortical volume, vB = vascular volume fraction, CEC(t) = tracer concentration within the EVRC, K1 = GFR/VEC and k2 = ku + kreabs (Fig. 3B).
The solution to Equation (3) can be expressed as follows:
Figure 3. Study concept. (A) A schematic diagram of the single-tissue-compartmental model. (B) Rate constants in the model.
6Scientific RepoRtS | (2019) 9:11269 | https://doi.org/10.1038/s41598-019-47728-x
www.nature.com/scientificreportswww.nature.com/scientificreports/
∫ τ τ= × = × ⊗τ− − −C t K C e d K C t e( ) ( ) ( ) (4)ECt
Pk t
Pk t
10
( )1
2 2
where ⊗ = convolution integral.The model function Cmodel(t) can be expressed as a superposition of CEC(t) and CP(t) according to their respec-
tive volume fractions in the kidney:
C t C t vB C t vB( ) ( ) (1 ) ( )model EC P= × − + ×
The Cmodel(t) is fitted to the renal cortical TAC with K1, k2, and vB as fitting parameters. Single-kidney GFR is obtained by multiplying K1 and VC × (1 − vB), and total GFR is the sum of the GFR values of both kidneys.
We applied the above model to 18F-fluoride dynamic PET/CT to measure the GFR and compared the val-ues with gold-standard 51Cr-EDTA GFR. Additionally, we tested the model using 68Ga-NOTA. 68Ga-NOTA was recently reported as a promising GFR tracer with no tubular reabsorption and secretion, and minimal binding to RBCs and serum protein8.
Radiopharmaceutical preparation. 18F-fluoride was produced by proton irradiation to the H218O target
using an in-house cyclotron (KOTRON-13, Samyoung Unitech). 68Ga-NOTA was produced by labelling NOTA (ChemaTech) with 68Ga eluted from a 68Ge/68Ga generator (IGG100; Eckert & Ziegler) as previously described8.
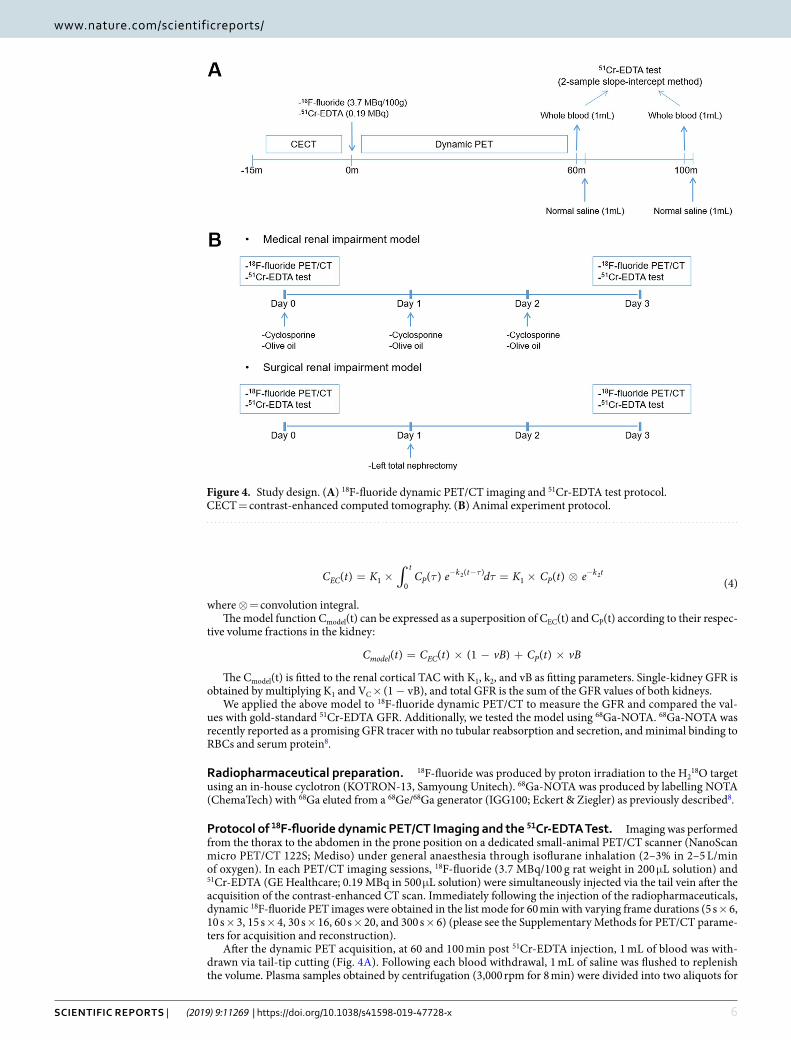
protocol of 18F-fluoride dynamic PET/CT Imaging and the 51cr-eDtA test. Imaging was performed from the thorax to the abdomen in the prone position on a dedicated small-animal PET/CT scanner (NanoScan micro PET/CT 122S; Mediso) under general anaesthesia through isoflurane inhalation (2–3% in 2–5 L/min of oxygen). In each PET/CT imaging sessions, 18F-fluoride (3.7 MBq/100 g rat weight in 200 μL solution) and 51Cr-EDTA (GE Healthcare; 0.19 MBq in 500 μL solution) were simultaneously injected via the tail vein after the acquisition of the contrast-enhanced CT scan. Immediately following the injection of the radiopharmaceuticals, dynamic 18F-fluoride PET images were obtained in the list mode for 60 min with varying frame durations (5 s × 6, 10 s × 3, 15 s × 4, 30 s × 16, 60 s × 20, and 300 s × 6) (please see the Supplementary Methods for PET/CT parame-ters for acquisition and reconstruction).
After the dynamic PET acquisition, at 60 and 100 min post 51Cr-EDTA injection, 1 mL of blood was with-drawn via tail-tip cutting (Fig. 4A). Following each blood withdrawal, 1 mL of saline was flushed to replenish the volume. Plasma samples obtained by centrifugation (3,000 rpm for 8 min) were divided into two aliquots for
Figure 4. Study design. (A) 18F-fluoride dynamic PET/CT imaging and 51Cr-EDTA test protocol. CECT = contrast-enhanced computed tomography. (B) Animal experiment protocol.
7Scientific RepoRtS | (2019) 9:11269 | https://doi.org/10.1038/s41598-019-47728-x
www.nature.com/scientificreportswww.nature.com/scientificreports/
duplication, and the radioactivity of the plasma aliquots was measured for 20 min using a well counter (Wizard 1480, Perkin Elmer) 24 h after the blood withdrawal to ensure full decay of the PET radiopharmaceuticals. The plasma clearance of 51Cr-EDTA was calculated from the mean values of the duplicate counts after background correction using the two-sample slope-intercept method28. The slope-intercept plasma clearance was corrected for neglecting the fast exponential in the bi-exponential plasma curve, generating the GFRCrEDTA (please see the Supplementary Methods for details)29.
Animal experiment protocol. For the 18F-fluoride PET/CT experiment, 23 male Sprague-Dawley rats (age: 8 weeks; weight: 280 ± 12 g) were used. The rats were divided into three experimental groups. Eight rats were administered with cyclosporine (Sandimmun INJ, Novartis) 30 mg/kg orally from day 0 to 2 to induce renal impairment medically. Another eight rats underwent left total nephrectomy at day 1 to form a surgical renal impairment group. The remaining seven rats were fed 1 mL/day olive oil from day 0 to 2 and served as controls. Each rat underwent two 18F-fluoride PET/CT imaging sessions at an interval of 3 days, at baseline (day 0) and after the renal impairment or control procedures (day 3) (Fig. 4B).
For the 68Ga-NOTA PET/CT experiment, 10 male naïve Sprague-Dawley rats (334 ± 52 g) underwent dynamic PET/CT and a 51Cr-EDTA test. The experimental protocol was the same for the 68Ga-NOTA experiment, except for the haematocrit measurement (please see Supplementary Methods) and 68Ga-NOTA (3.7 MBq/100 g rat weight) injection.
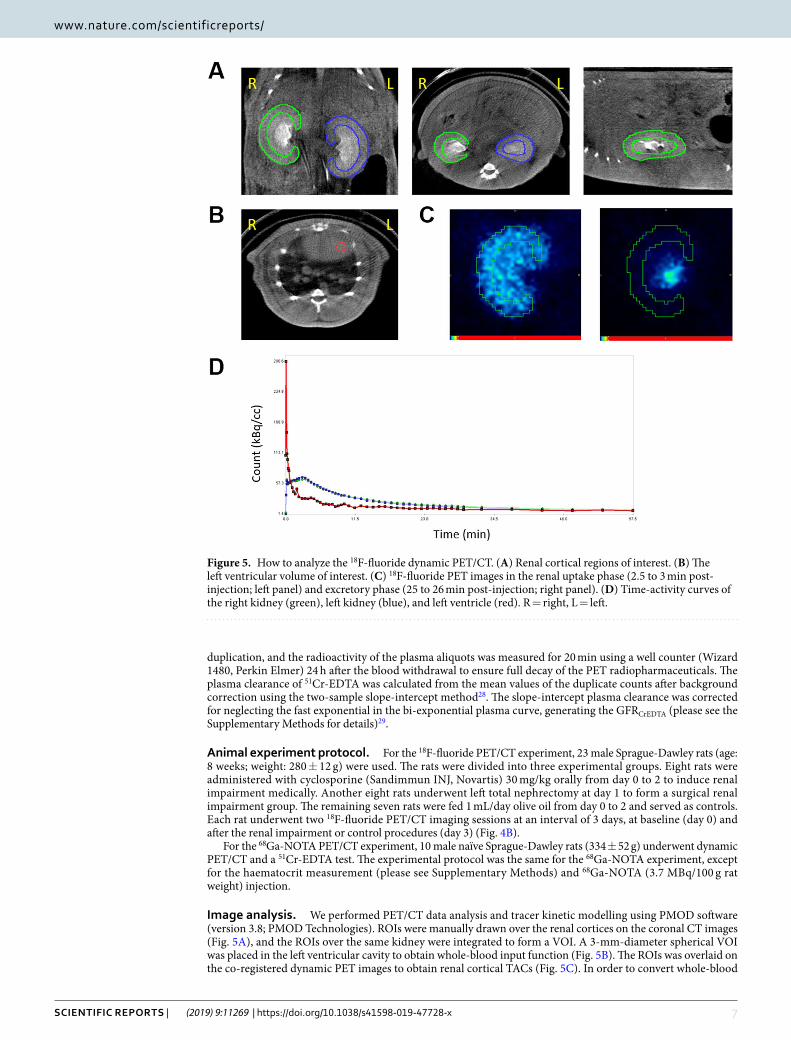
image analysis. We performed PET/CT data analysis and tracer kinetic modelling using PMOD software (version 3.8; PMOD Technologies). ROIs were manually drawn over the renal cortices on the coronal CT images (Fig. 5A), and the ROIs over the same kidney were integrated to form a VOI. A 3-mm-diameter spherical VOI was placed in the left ventricular cavity to obtain whole-blood input function (Fig. 5B). The ROIs was overlaid on the co-registered dynamic PET images to obtain renal cortical TACs (Fig. 5C). In order to convert whole-blood
Figure 5. How to analyze the 18F-fluoride dynamic PET/CT. (A) Renal cortical regions of interest. (B) The left ventricular volume of interest. (C) 18F-fluoride PET images in the renal uptake phase (2.5 to 3 min post-injection; left panel) and excretory phase (25 to 26 min post-injection; right panel). (D) Time-activity curves of the right kidney (green), left kidney (blue), and left ventricle (red). R = right, L = left.
8Scientific RepoRtS | (2019) 9:11269 | https://doi.org/10.1038/s41598-019-47728-x
www.nature.com/scientificreportswww.nature.com/scientificreports/
input function to plasma input function, we adopted a fixed plasma fraction of 1.23 for 18F-fluoride30 because it permeates into RBCs with its intracellular concentration stable with about half in plasma31,32. In contrast, we adopted a plasma fraction of 1/(1–hematocrit) for 68Ga-NOTA because it does not distribute into RBCs8. To test whether the measurement of haematocrit is mandatory for the calculation of 68Ga-NOTA plasma input function, we calculated another set of plasma input functions by assuming a fixed haematocrit of 0.45.
The single-tissue-compartmental model curve using the plasma input function was fitted to the renal cortical TACs to obtain GFRF-PET and 68Ga-NOTA PET GFR (GFRNOTA-PET) (Fig. 5D). Additionally, we calculated PET GFR only using the first 15 min of data (GFRF-PET-15min and GFRNOTA-PET-15min) to test the feasibility of reducing imaging time.
Statistics. The goodness-of-fit of the model was assessed using the coefficient of determination (R2). We used the control group data to test for repeatability. Within-test repeatability and between-test agreement were assessed by means of the ICC and the Bland-Altman analysis17,33. Accuracy of GFRF-PET was expressed by P30 and P10, which are defined as the percentages of the measurements that lie within the ±30% and ±10% ranges from reference GFRCrEDTA, respectively15,16. The paired-samples t-test was performed to analyse the difference between paired observations. The Kruskal-Wallis test was performed for group comparisons. Two-sided P < 0.05 was considered as significant. All statistical tests were performed using MedCalc statistical software (version 18.5; MedCalc Software bvba).
Study approval. The rats were cared for in a facility accredited by the Association for Assessment and Accreditation of Laboratory Animal Care International. The study protocol was approved by the Institutional Animal Care and Use Committee of Seoul National University Bundang Hospital (IACUC No. BA1705-223/041-01). All experiments were performed in accordance with relevant guidelines and regulations.
Data AvailabilityThe datasets generated during and/or analysed during the current study are available from the corresponding author on reasonable request.
References 1. Go, A. S., Chertow, G. M., Fan, D., McCulloch, C. E. & Hsu, C. Chronic kidney disease and the risks of death, cardiovascular events,
and hospitalization. N. Engl. J. Med., https://doi.org/10.1056/NEJMoa041031 (2004). 2. Stevens, L. A. & Levey, A. S. Measured GFR as a Confirmatory Test for Estimated GFR. J. Am. Soc. Nephrol. 20, 2305–2313 (2009). 3. Fleming, J. S., Zivanovic, M. A., Blake, G. M., Burniston, M. & Cosgriff, P. S. Guidelines for the measurement of glomerular filtration
rate using plasma sampling. Nucl. Med. Commun. 25, 759–769 (2004). 4. Gates, G. F. Glomerular filtration rate: estimation from fractional renal accumulation of 99mTc-DTPA (stannous). AJR. Am. J.
Roentgenol. 138, 565 (1982). 5. De Santo, N. G. et al. Measurement of glomerular filtration rate by the 99mTc-DTPA renogram is less precise than measured and
predicted creatinine clearance. Nephron 81, 136–140 (1999). 6. Ma, Y.-C. et al. Comparison of 99mTc-DTPA renal dynamic imaging with modified MDRD equation for glomerular filtration rate
estimation in Chinese patients in different stages of chronic kidney disease. Nephrol. Dial. Transplant. 22, 417–423 (2006). 7. Szabo, Z., Xia, J., Mathews, W. B. & Brown, P. R. Future direction of renal positron emission tomography. Seminars in Nuclear
Medicine 36, 36–50 (2006). 8. Lee, J. Y. et al. Preparation of Ga-68-NOTA as a renal PET agent and feasibility tests in mice. Nucl. Med. Biol. 41, 210–215 (2014). 9. Hofman, M. et al. 68Ga-EDTA PET/CT imaging and plasma clearance for glomerular filtration rate quantification: comparison to
conventional 51Cr-EDTA. J. Nucl. Med. 56, 405–9 (2015). 10. Zohoori, F. V., Innerd, A., Azevedo, L. B., Whitford, G. M. & Maguire, A. Effect of exercise on fluoride metabolism in adult humans:
A pilot study. Sci. Rep. 5, 1–9 (2015). 11. Järnberg, P. O., Ekstrand, J. & Ehrnebo, M. Renal excretion of fluoride during water diuresis and induced urinary ph-changes in
man. Toxicol. Lett., https://doi.org/10.1016/0378-4274(83)90084-X (1983). 12. Spak, C. J., Berg, U. & Ekstrand, J. Renal clearance of fluoride in children and adolescents. Pediatrics 75, 575–9 (1985). 13. Schnöckel, U. et al. Dynamic 18F-fluoride small animal PET to noninvasively assess renal function in rats. Eur. J. Nucl. Med. Mol.
Imaging 35, 2267–2274 (2008). 14. Seefeldt, T. Plasma Clearance of 51Cr-EDTA as an Estimator of Glomerular Filtration Rate in Conscious Rats. J. Appl. Toxicol. 10,
439–442 (1990). 15. Stevens, L. A., Zhang, Y. & Schmid, C. H. Evaluating the performance of equations for estimating glomerular filtration rate. J.
Nephrol. 21, 797–807 (2008). 16. Soveri, I. et al. Measuring GFR: A systematic review. Am. J. Kidney Dis. 64, 411–424 (2014). 17. Martin, B. J. & Altman, D. Statistical Methods for Assessing Agreement Between Two Methods of Clinical Measurement. Lancet,
https://doi.org/10.1016/S0140-6736(86)90837-8 (1986). 18. Delanaye, P., Cavalier, E., Froissart, M. & Krzesinski, J. M. Reproducibility of GFR measured by chromium-51-EDTA and iohexol.
Nephrol. Dial. Transplant. 23, 4077–4078 (2008). 19. Mendichovszky, I. et al. How accurate is dynamic contrast-enhanced MRI in the assessment of renal glomerular filtration rate? A
critical appraisal. J. Magn. Reson. Imaging 27, 925–931 (2008). 20. Annet, L. et al. Glomerular filtration rate: Assessment with dynamic contrast-enhanced MRI and a cortical-compartment model in
the rabbit kidney. J. Magn. Reson. Imaging 20, 843–849 (2004). 21. Niendorf, E. R., Grist, T. M., Lee, F. T., Brazy, P. C. & Santyr, G. E. Rapid in vivo measurement of single-kidney extraction fraction
and glomerular filtration rate with MR imaging. Radiology 206, 791–798 (1998). 22. Hackstein, N., Heckrodt, J. & Rau, W. S. Measurement of Single-Kidney Glomerular Filtration Rate Using a Contrast-Enhanced
Dynamic Gradient-Echo Sequence and the Rutland-Patlak Plot Technique. J. Magn. Reson. Imaging 18, 714–725 (2003). 23. Buzalaf, M. A. R. & Whitford, G. M. Fluoride metabolism. In Fluoride and the Oral Environment, https://doi.org/10.1159/000325107
(2011). 24. Park-Holohan, S. J., Blake, G. M. & Fogelman, I. Quantitative studies of bone using (18)F-fluoride and (99m)Tc-methylene
diphosphonate: evaluation of renal and whole-blood kinetics. Nucl. Med. Commun. 22, 1037–44 (2001). 25. Blaufox, M. D. PET Measurement of Renal GFR: Is there a role in Nuclear Medicine. J. Nucl. Med. 1495–1497, https://doi.
org/10.2967/jnumed.116.174607 (2016).
9Scientific RepoRtS | (2019) 9:11269 | https://doi.org/10.1038/s41598-019-47728-x
www.nature.com/scientificreportswww.nature.com/scientificreports/
26. KDIGO 2017 Clinical Practice Guideline Update for the Diagnosis, Evaluation, Prevention, and Treatment of Chronic Kidney Disease–Mineral and Bone Disorder (CKD-MBD). Kidney Int. Suppl. 7, 1–59 (2017).
27. Watabe, H., Ikoma, Y., Kimura, Y., Naganawa, M. & Shidahara, M. PET kinetic analysis - Compartmental model. Ann. Nucl. Med. 20, 583–588 (2006).
28. Blaufox, M. D. et al. Report of the Radionuclides in Nephrourology Committee on Renal Clearance. J. Urol. 2297, https://doi.org/10.1097/00005392-199812010-00116 (1998).
29. Fleming, J. S. An improved equation for correcting slope-intercept measurements of glomerular filtration rate for the single exponential approximation. Nucl. Med. Commun. 28, 315–320 (2007).
30. Hawkins, Ra et al. Evaluation of the skeletal kinetics of fluorine-18-fluoride ion with PET. J. Nucl. Med. 33, 633–42 (1992). 31. Charkes, N. D., Brookes, M. & Makler, P. T. Studies of skeletal tracer kinetics: II. evaluation of a five-compartment model of [18F]
fluoride kinetics in rats. J. Nucl. Med. 20, 1150–7 (1979). 32. Schiepers, C. et al. Fluoride kinetics of the axial skeleton measured in vivo with fluorine-18-fluoride PET. J. Nucl. Med. 38, 1970–1976
(1997). 33. Shrout, P. E. & Fleiss, J. L. Intraclass correlations: uses in assessing rater reliability.1. Shrout PE, Fleiss JL: Intraclass correlations: uses
in assessing rater reliability. Psychol Bull 86, 420–8 (1979).
AcknowledgementsThis work was supported in part by the research fund of Gangneung Asan Hospital (2017S002) and Seoul National University Bundang Hospital (14-2016-012).
Author contributionsW.L. and H.S.L. designed research. Y.K. and H.J. conducted experiments. H.S.L., Y.K., H.L., H.J. and B.M. acquired data. H.S.L., Y.K. and W.L. analysed data. S.B., D.C. and K.K. gave critique. H.S.L., Y.K., H.J. and W.L. wrote the manuscript.
Additional informationSupplementary information accompanies this paper at https://doi.org/10.1038/s41598-019-47728-x.Competing Interests: The authors declare no competing interests.Publisher’s note: Springer Nature remains neutral with regard to jurisdictional claims in published maps and institutional affiliations.
Open Access This article is licensed under a Creative Commons Attribution 4.0 International License, which permits use, sharing, adaptation, distribution and reproduction in any medium or
format, as long as you give appropriate credit to the original author(s) and the source, provide a link to the Cre-ative Commons license, and indicate if changes were made. The images or other third party material in this article are included in the article’s Creative Commons license, unless indicated otherwise in a credit line to the material. If material is not included in the article’s Creative Commons license and your intended use is not per-mitted by statutory regulation or exceeds the permitted use, you will need to obtain permission directly from the copyright holder. To view a copy of this license, visit http://creativecommons.org/licenses/by/4.0/. © The Author(s) 2019