Comparison Study of Particle Measurement Systems for ...
156
Research-report No. 202779 Eidgenössische Materialprüfungs- und Forschungsanstalt ■ Laboratoire fédéral d'essai des matériaux et de recherche ■ Laboratorio federale di prova dei materiali e di ricerca ■ Institut federal da controlla da material e da retschertgas ■ Swiss Federal Laboratories for Materials Testing and Research EMPA Dübendorf Überlandstrasse 129 CH-8600 Dübendorf Fon +41 (0)1 823 55 11 Fax +41 (0)1 821 62 44 ■ www.empa.ch Laboratory for I.C. Engines and Furnaces May 2003 Comparison Study of Particle Measurement Systems for Future Type Approval Application Swiss contribution to GRPE Particle Measurement Programme (GRPE-PMP CH5) Authors: Martin Mohr & Urs Lehmann Contractors: Swiss Federal Roads Authority, FEDRO, Berne Bundesamt für Strassen, ASTRA, Bern Contract-No: 259/6.2.208/02 806.3189.002 Federal Office of Environment, Forests and Landscape, FOEFL, Berne Bundesamt für Umwelt, Wald und Landschaft, BUWAL, Bern Contract-No: 2002.I.07a 810.3189.004
-
Upload
khangminh22 -
Category
Documents
-
view
0 -
download
0
Transcript of Comparison Study of Particle Measurement Systems for ...
Research-report No. 202779
Eidgenössische Materialprüfungs- und Forschungsanstalt ■ Laboratoire fédéral d'essai des matériaux et de recherche ■ Laboratorio federale di provadei materiali e di ricerca ■ Institut federal da controlla da material e da retschertgas ■ Swiss Federal Laboratories for Materials Testing and Research
EMPA Dübendorf Überlandstrasse 129 CH-8600 Dübendorf Fon +41 (0)1 823 55 11 Fax +41 (0)1 821 62 44 ■ www.empa.ch
Laboratory for I.C. Engines and FurnacesMay 2003
Comparison Study ofParticle Measurement Systems
for Future Type Approval Application
Swiss contribution to GRPE Particle Measurement Programme(GRPE-PMP CH5)
Authors:Martin Mohr & Urs Lehmann
Contractors:
Swiss Federal Roads Authority, FEDRO, BerneBundesamt für Strassen, ASTRA, BernContract-No: 259/6.2.208/02 806.3189.002
Federal Office of Environment, Forests and Landscape, FOEFL, BerneBundesamt für Umwelt, Wald und Landschaft, BUWAL, BernContract-No: 2002.I.07a 810.3189.004
GRPE Particle Measurement Programme (PMP)
Comparison Study of Particle Measurement Systems
M. Mohr, U. Lehmann, 13.05.03 2/156 Report-No.: 202779
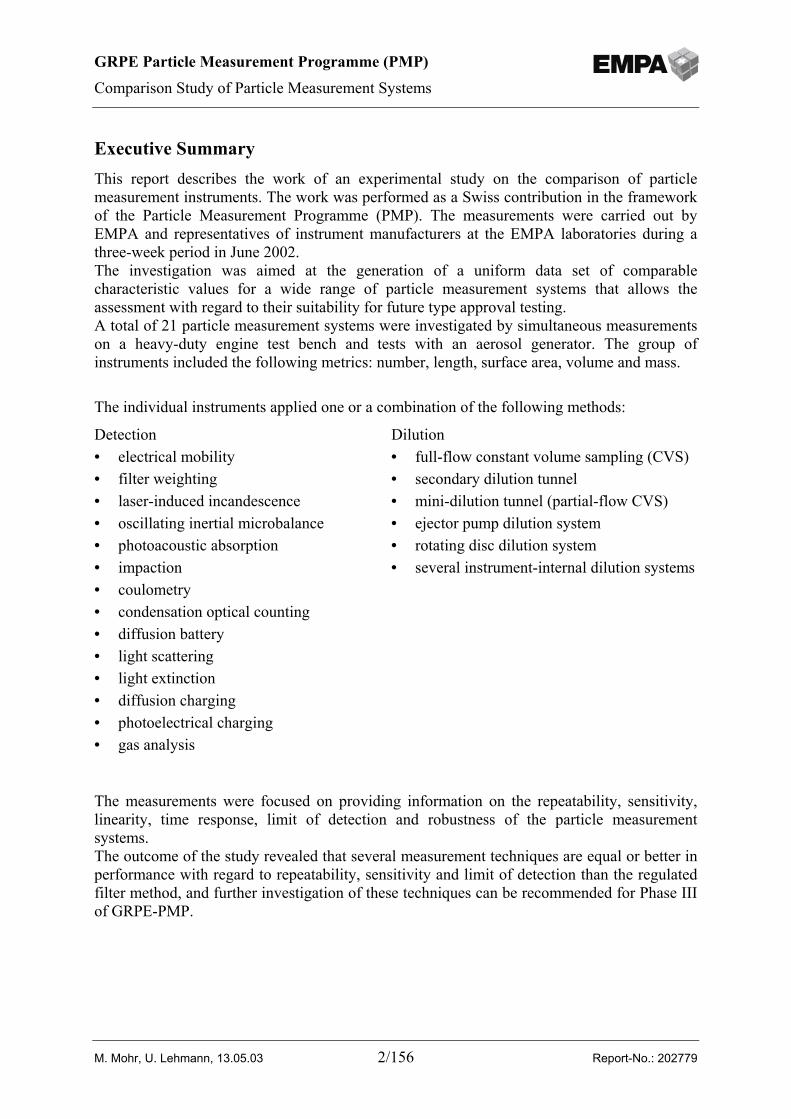
Executive SummaryThis report describes the work of an experimental study on the comparison of particlemeasurement instruments. The work was performed as a Swiss contribution in the frameworkof the Particle Measurement Programme (PMP). The measurements were carried out byEMPA and representatives of instrument manufacturers at the EMPA laboratories during athree-week period in June 2002.The investigation was aimed at the generation of a uniform data set of comparablecharacteristic values for a wide range of particle measurement systems that allows theassessment with regard to their suitability for future type approval testing.A total of 21 particle measurement systems were investigated by simultaneous measurementson a heavy-duty engine test bench and tests with an aerosol generator. The group ofinstruments included the following metrics: number, length, surface area, volume and mass.
The individual instruments applied one or a combination of the following methods:
Detection Dilution• electrical mobility • full-flow constant volume sampling (CVS)• filter weighting • secondary dilution tunnel• laser-induced incandescence • mini-dilution tunnel (partial-flow CVS)• oscillating inertial microbalance • ejector pump dilution system• photoacoustic absorption • rotating disc dilution system• impaction • several instrument-internal dilution systems• coulometry• condensation optical counting• diffusion battery• light scattering• light extinction• diffusion charging• photoelectrical charging• gas analysis
The measurements were focused on providing information on the repeatability, sensitivity,linearity, time response, limit of detection and robustness of the particle measurementsystems.The outcome of the study revealed that several measurement techniques are equal or better inperformance with regard to repeatability, sensitivity and limit of detection than the regulatedfilter method, and further investigation of these techniques can be recommended for Phase IIIof GRPE-PMP.
GRPE Particle Measurement Programme (PMP)
Comparison Study of Particle Measurement Systems
M. Mohr, U. Lehmann, 13.05.03 3/156 Report-No.: 202779
CONTENT
1 Definitions, Acronyms, Abbreviations ..............................................................................52 List of Diagrams, Figures and Tables ..............................................................................63 Introduction .......................................................................................................................9
3.1 Financing ................................................................................................................................. 104 Objectives of the Programme ..........................................................................................105 Methodology and approach.............................................................................................106 Experimental....................................................................................................................11
6.1 Particle Measurement systems .............................................................................................. 116.1.1 Particulate mass measurement by gravimetric filter method ........................................... 13
6.2 Engine test facilities ................................................................................................................ 136.2.1 Engine .............................................................................................................................. 136.2.2 Engine Fuel and Lubricant............................................................................................... 146.2.3 HD test bench................................................................................................................... 146.2.4 Experimental set-up ......................................................................................................... 15
6.3 CAST test facilities ................................................................................................................. 176.3.1 CAST ............................................................................................................................... 176.3.2 Experimental set-up ......................................................................................................... 17
7 Description of the test programme..................................................................................177.1 CAST measurements .............................................................................................................. 18
7.1.1 Size settings / Emission levels ......................................................................................... 187.1.2 Measurement programme ................................................................................................ 18
7.2 Engine measurements............................................................................................................. 197.2.1 Test cycles........................................................................................................................ 197.2.2 Conditioning of the engine............................................................................................... 207.2.3 Measurement programme ................................................................................................ 20
8 Measured parameters and calculations ..........................................................................218.1 Data evaluation methodology ................................................................................................ 218.2 Limit of detection.................................................................................................................... 228.3 Sensitivity ................................................................................................................................ 228.4 Response time.......................................................................................................................... 228.5 Linearity .................................................................................................................................. 238.6 Repeatability ........................................................................................................................... 238.7 Outliers .................................................................................................................................... 248.8 Robustness............................................................................................................................... 24
9 Results and Discussion....................................................................................................259.1 Engine measurements............................................................................................................. 26
9.1.1 Robustness ....................................................................................................................... 269.1.2 Repeatability .................................................................................................................... 26
9.1.2.1 European Transient Test (ETC) / ETC high-emission .............................................................. 269.1.2.2 European Transient Test (ETC) / ETC low-emission................................................................ 309.1.2.3 Steady-State Tests (SM) / SM high-emission............................................................................ 329.1.2.4 Steady-State Tests (SM) / SM low-emission ............................................................................. 35
9.1.3 Background measurements .............................................................................................. 38
GRPE Particle Measurement Programme (PMP)
Comparison Study of Particle Measurement Systems
M. Mohr, U. Lehmann, 13.05.03 4/156 Report-No.: 202779
9.1.3.1 Noise and repeatability ............................................................................................................. 389.1.3.2 Ratio of ETC emission levels to background levels .................................................................. 39
9.1.4 Limit of detection (LOD)................................................................................................. 419.1.5 Response Time................................................................................................................. 44
9.1.5.1 Characteristic response times................................................................................................... 449.1.6 Time-resolved results....................................................................................................... 46
9.1.6.1 Time-resolved data / SCT cycle ................................................................................................ 469.1.6.2 Time-resolved data / ETC cycle ................................................................................................ 46
9.1.7 Absolute values................................................................................................................ 499.1.7.1 European Transient Test (ETC)................................................................................................ 49
9.1.7.1.1 High-emission ................................................................................................................. 499.1.7.1.2 Low-emission .................................................................................................................. 519.1.7.1.3 Ratio of high to low-emission level................................................................................. 52
9.1.7.2 European Steady-State Test (ESC) ........................................................................................... 549.1.7.2.1 High and low-emission.................................................................................................... 549.1.7.2.2 Ratio of high to low-emission level................................................................................. 56
9.1.7.3 Steady-State Tests (SM) ............................................................................................................ 569.1.7.3.1 High and low-emission.................................................................................................... 569.1.7.3.2 Ratio of high to low-emission level................................................................................. 59
9.1.7.4 Particle composition ................................................................................................................. 609.1.8 Correlation between instruments ..................................................................................... 619.1.9 Size Information............................................................................................................... 72
9.1.9.1 Number size distribution and average size for ETC ................................................................. 729.1.9.2 Number size distribution and average size for ESC.................................................................. 749.1.9.3 Number size distribution and average size for single modes .................................................... 75
9.2 CAST measurements .............................................................................................................. 779.2.1 Calibration of CAST ........................................................................................................ 779.2.2 Repeatability during the CAST measurements ................................................................ 789.2.3 Noise level of instruments for CAST measurements ....................................................... 799.2.4 Linearity........................................................................................................................... 819.2.5 Correlation between instruments ..................................................................................... 829.2.6 Size information............................................................................................................... 89
10 Discussion ........................................................................................................................9111 Conclusions....................................................................................................................11712 Acknowledgements ........................................................................................................11813 References ......................................................................................................................11914 Appendices .....................................................................................................................120
Appendix A : Fuel specifications ............................................................................................................. 120Appendix B : HD-engine test bench at EMPA......................................................................................... 121Appendix C : Total measuring Programme.............................................................................................. 122Appendix D : Detailed sequence of CAST measuring programme.......................................................... 122Appendix E : Time-resolved data for SCT............................................................................................... 123Appendix F : Absolute values SM / high-emission................................................................................ 126Appendix G : Absolute values SM / low-emission ................................................................................ 129Appendix H : Number size distribution / SM......................................................................................... 132Appendix I : Test cycles........................................................................................................................... 135Appendix J : Instruments.......................................................................................................................... 136
GRPE Particle Measurement Programme (PMP)
Comparison Study of Particle Measurement Systems
M. Mohr, U. Lehmann, 13.05.03 5/156 Report-No.: 202779
1 Definitions, Acronyms, Abbreviations
ACEA Association of European Automobile Manufacturers
ASTRA Swiss Federal Roads Authority (Bundesamt für Strassen)
BG Background measurement
BUWAL Swiss Agency for the Environment, Forests and Landscape (SAEFL)
CO Carbon monoxide, gaseous pollutant
COV Coefficient of variation, COV = 1 standard deviation / mean
CPC Condensation Particle Counter
CVS Constant Volume Sampler
DF Dilution factor
dp Particle diameter
EC Elemental carbon
ECE Economic Commission for Europe
EMPA Swiss Federal Laboratories for Materials Testing and Research(Eidgenössische Materialprüfungs- und Forschungsanstalt)
ESC European steady-state test cycle
ETC European transient test cycle
GRPE Working Party on Pollution and Energy
LOD Limit of Detection
METAS Federal Office for Metrology and Accreditation Switzerland (METAS)
MMD(p) Mass Medium Diameter of primary particles
MSD Mass Surface Diameter
nm Nanometre = 1·10-9 metre
NOX gaseous pollutant comprising NO and NO2
NSD Number size distribution
OC Organic carbon
PM Particulate matter
PM10 Particulate Matter of particles with an aerodynamic diameter less than 10 µmmeasured by mass
PM2.5 Particulate Matter of particles with an aerodynamic diameter less than 2.5 µmmeasured by mass
PMP Particle Measurement Programme (under auspices of UNECE WP29/GRPE)
ppm Parts per million
SCT Step change test cycle (own definition)
SM Single Mode Test
GRPE Particle Measurement Programme (PMP)
Comparison Study of Particle Measurement Systems
M. Mohr, U. Lehmann, 13.05.03 6/156 Report-No.: 202779
SOF Soluble Organic Fraction
SUVA Swiss Institution for aAcccident iInsurance(Schweizerische Unfallversicherungsanstalt)
T.HC Total hydrocarbons as measured by FID according to regulations, group of gaseouspollutants
TD Thermodesorber
UNECE United Nations Economic Commission for Europe
2 List of Diagrams, Figures and Tables
List of FiguresFigure 1: Schematic of the experimental set-up..................................................................................................... 15Figure 2: Set-up of instruments for simultaneous particle measurements. ........................................................... 17Figure 3: Pattern of the SCT cycle......................................................................................................................... 22Figure 4: Definition of characteristic times in the SCT cycle................................................................................ 23Figure 5: Variation of engine parameters/gaseous emissionsETC high-emission................................................ 27Figure 6: NO conversion rate as a function of time for all ETC cycles. ............................................................... 28Figure 7: Relative standard deviation of each instrument (R21 here total number) /ETC high-emission ............ 29Figure 8: Variation of engine parameters/gaseous emissions/ETC low-emission................................................. 30Figure 9: Relative standard deviation of each instrument (R21 here total number)/ETC low-emission ............. 31Figure 10: Relative standard deviation of the engine parameters / gaseous emissions for each step in the SM test
/ SM high-emission....................................................................................................................................... 32Figure 11: Relative standard deviation of all SM measurements for each instrument / SM (total) high-emission 33Figure 12: Relative standard deviation of each instrument / SM high-emission ................................................. 34Figure 13: Relative standard deviation of the engine parameters / gaseous emissions for each step in the SM test
/ SM low-emission ........................................................................................................................................ 35Figure 14: Time-resolved deviation of the individual measurements from mean value during the SM low-
emission. Comparison between exhaust flow and PASS (C08) as an example. ........................................... 35Figure 15: Relative standard deviation of all SM measurements for each instrument / SM (total) low-emission . 36Figure 16: Relative standard deviation of each instrument / SM low-emission.................................................. 37Figure 17: Noise-to-mean ratio for the background measurements at the engine test bench................................ 38Figure 18: Relative standard deviation of the background measurement. ............................................................ 39Figure 19: Ratio of measured raw concentrations for ETC low-emission and engine background tests, R21 total
size range ..................................................................................................................................................... 40Figure 20: Ratio of measured raw concentrations for ETC high-emission and engine background tests ............. 40Figure 21: Ratio of measured raw concentrations for ETC high-emission and the LOD. R21: DMA fixed to 80
nm for ETC high-emission ........................................................................................................................... 43Figure 22: Ratio of measured raw concentrations for ETC low-emission and the LOD. ...................................... 43Figure 23: Characteristic times in the SCT cycle regarding the up-step / average over all steps, R21 fixed to 80
nm, data for R14 and R23 are based on raw data (marked)........................................................................ 44Figure 24: Characteristic times in the SCT cycle regarding the down-step /average over all steps, R21 fixed to 80
nm, data for R14 and R23 is based on raw data (marked) .......................................................................... 45Figure 25: Time-resolved sequence of the ETC cycle / ETC high-emission / Mass........................................... 46Figure 26: Time-resolved sequence of the ETC cycle / ETC high-emission / Number ...................................... 47Figure 27: Time-resolved sequence of the ETC cycle / ETC high-emission / Surface ....................................... 48Figure 28: Time-resolved sequence of the ETC cycle / ETC high-emission / Opacity....................................... 48Figure 29: Absolute value of total number concentration on ETC high-emission R21 fixed to 80 nm,R22 total
number w/o filter stage ................................................................................................................................ 50
GRPE Particle Measurement Programme (PMP)
Comparison Study of Particle Measurement Systems
M. Mohr, U. Lehmann, 13.05.03 7/156 Report-No.: 202779
Figure 30: Absolute value of total mass concentration on ETC high-emission ..................................................... 50Figure 31: Absolute value of total number concentration during ETC low-emission R21 fixed to 80 nm,R22 total
number w/o filter stage ................................................................................................................................ 51Figure 32: Absolute value of total mass concentration on ETC low-emission ...................................................... 52Figure 33: Comparison between ETC high and ETC low-emission (R21: DMA fixed to 80 nm).......................... 53Figure 34: Absolute number and mass results for ESC high and low-emissions / ESC high/low-emission........ 55Figure 35: Comparison between ESC high and ESC low-emission....................................................................... 56Figure 36: Total number concentration / total mass concentration / SM high-emissions ................................. 57Figure 37: Total number concentration / total mass concentration / SM low-emissions.................................. 58Figure 38: Comparison between SM high and SM low-emission ......................................................................... 59Figure 39: Chemical composition / ETC high-emission ...................................................................................... 60Figure 40: Key to the following graphs (Figure 41 to Figure 60) ......................................................................... 61Figure 41: Correlation between C03 and selected instruments / engine measurements ....................................... 61Figure 42: Correlation between C04 and selected instruments / engine measurements ....................................... 62Figure 43: Correlation between C05 and selected instruments / engine measurements ....................................... 62Figure 44: Correlation between C06 and selected instruments / engine measurements ....................................... 63Figure 45: Correlation between C06E and selected instruments / engine measurements ..................................... 63Figure 46: Correlation between C08 and selected instruments / engine measurements ....................................... 64Figure 47: Correlation between R10 and selected instruments / engine measurements........................................ 64Figure 48: Correlation between R11 and selected instruments / engine measurements........................................ 65Figure 49: Correlation between R11E and selected instruments / engine measurements ..................................... 65Figure 50: Correlation between R14 and selected instruments / engine measurements........................................ 66Figure 51: Correlation between R15 and selected instruments / engine measurements........................................ 66Figure 52: Correlation between R16 and selected instruments / engine measurements........................................ 67Figure 53: Correlation between R17 and selected instruments / engine measurements........................................ 67Figure 54: Correlation between R18 and selected instruments / engine measurements........................................ 68Figure 55: Correlation between R19 and selected instruments / engine measurements........................................ 68Figure 56: Correlation between R20 and selected instruments / engine measurements........................................ 69Figure 57: Correlation between SMPS (R21) and selected instruments / only SM / engine measurements .......... 69Figure 58: Correlation between R22 and selected instruments / engine measurements....................................... 70Figure 59: Correlation between R23 and selected instruments / engine measurements....................................... 70Figure 60: Correlation between R24 and selected instruments / engine measurements...................................... 71Figure 61: Number Size Distribution (NSD) / ETC high/low-emission ............................................................... 73Figure 62: Number Size Distribution (NSD) / ESC high/low-emission ............................................................... 74Figure 63: Number Size Distribution (NSD) / SM high/low-emission ................................................................. 76Figure 64: Results of the CAST calibration at METAS before and after the measurement programme at EMPA 77Figure 65: Relative deviation on CAST measurements before & after the engine test period / CAST size A ........ 78Figure 66: Relative deviation on CAST measurements before & after the engine test period / CAST size B ........ 78Figure 67: Ratio on CAST measurements, Ratio between concentrations measured at 0% CAST setting (i.e. zero-
check) and 10% CAST setting ..................................................................................................................... 79Figure 68: Noise-to-mean ratio on CAST measurements, concentration setting: 10% ......................................... 80Figure 69: Noise-to-mean ratio on CAST measurements, concentration setting: 90% ......................................... 80Figure 70: Linearity of size A (upper figure) and size B (lower figure) measurements / CAST measurements.. 82Figure 71: Correlation between C03 and selected instruments / CAST measurements...................................... 83Figure 72: Correlation between C05 and selected instruments / CAST measurements...................................... 84Figure 73: Correlation between C08 and selected instruments / CAST measurements...................................... 84Figure 74: Correlation between R10 and selected instruments / CAST measurements ...................................... 85Figure 75: Correlation between R15 and selected instruments / CAST measurements ...................................... 85Figure 76: Correlation between R16 and selected instruments / CAST measurements ....................................... 86Figure 77: Correlation between R17 and selected instruments / CAST measurements ...................................... 86Figure 78: Correlation between R19 and selected instruments / CAST measurements ...................................... 87Figure 79: Correlation between R20 and selected instruments / CAST measurements ...................................... 87Figure 80: Correlation between R21 and selected instruments / CAST measurements ...................................... 88Figure 81: Correlation between R22 and selected instruments / CAST measurements ....................................... 88Figure 82: Mode of NSD of the CAST measurements before and after EMPA measurement programme /
measured by METAS.................................................................................................................................... 89Figure 83: Mode of NSD as measured by DMS (C03) on the CAST measurements .............................................. 89Figure 84: Mean of primary particles as measured by LI2SA (C05) on the CAST measurements ........................ 89
GRPE Particle Measurement Programme (PMP)
Comparison Study of Particle Measurement Systems
M. Mohr, U. Lehmann, 13.05.03 8/156 Report-No.: 202779
Figure 85: Median of active surface distribution for the CAST measurements as measured by MasMo (R10) .... 90Figure 86: Mode of NSD for the CAST measurements as measured by EDB (R16) .............................................. 90Figure 87: Mode of NSD for the CAST measurements as measured by SMPS (R21) ............................................ 90Figure 88: Mode of NSD for the CAST measurements as measured by ELPI (R22) ............................................. 90Figure 89: Time-resolved data of engine power and instruments C03, C05, C08, R10, R12, R12, R13 for SCT at
high-emission configuration ...................................................................................................................... 123Figure 90: Time-resolved data of engine power and instruments R14 ([ng/s],[ng/Ncm3]), R15, R16, R17, R18 for
SCT at high-emission configuration .......................................................................................................... 124Figure 91: Time-resolved data of instruments R19 R20, R21, R22, R23 ([cm3/s], [cm3/Ncm3]), R24 for SCT in
high-emission configuration ...................................................................................................................... 125Figure 92: Total number / SM high/low-emissions ............................................................................................ 126Figure 93: Total number / SM high-emissions................................................................................................... 127Figure 94: Total mass / SM high-emissions ....................................................................................................... 128Figure 95: Total number / SM low-emissions .................................................................................................... 129Figure 96: Total number / SM low-emissions .................................................................................................... 130Figure 97: Total mass / SM low-emissions ........................................................................................................ 131Figure 98: Total number / SM low-emissions .................................................................................................... 132Figure 99: Number Size Distribution (NSD) / SM high-emission ...................................................................... 133Figure 100: Number Size Distribution (NSD) / SM low-emission ..................................................................... 134
List of TablesTable 1: Instruments and measurement metrics .................................................................................................... 12Table 2: Engine parameters .................................................................................................................................. 14Table 3: Instruments and their sampling location/dilution during the measurements with the engine ................. 16Table 4: CAST settings as determined by a SMPS 3934 (TSI) .............................................................................. 18Table 5: Groups for the CAST measurements ....................................................................................................... 19Table 6: Test cycles for the measurements using the engine ................................................................................. 20Table 7: Engine test programme ........................................................................................................................... 20Table 8: Available Data......................................................................................................................................... 25Table 9: Absolute values of LOD.......................................................................................................................... 42Table 10: Particle components measured by the individual instruments .............................................................. 60Table 11: Particle size measured by the individual instruments ........................................................................... 72Table 12: Measured concentration of selected instruments for CAST settings ..................................................... 79Table 13: Diesel-fuel specifications (CEC-RF-06-99) ....................................................................................... 120Table 14: Lubricant oil specifications (Shell Myrina TX Oil 10W-40).............................................................. 121Table 15: Time schedule of measurements .......................................................................................................... 122Table 16: Detailed sequence of CAST measuring programme ............................................................................ 122
GRPE Particle Measurement Programme (PMP)
Comparison Study of Particle Measurement Systems
M. Mohr, U. Lehmann, 13.05.03 9/156 Report-No.: 202779
3 IntroductionEmissions primarily produced by automotive road vehicles are an important source underinvestigation. Particles in the exhaust gas of diesel engines in particular, and to a lesser extentparticles from gasoline engines equipped with direct injection technology, are of majorconcern.Because of the adverse effect of particles from combustion on human health, particleemissions of road vehicles have been restricted in terms of mass for many years. Thecontinuous improvement of engine technology and the development of after-treatmentsystems has resulted in a sharp reduction in the particle emissions of present-day vehicles.The effective limits of measurement in the current legislative method are consequently beingapproached.A more sensitive method would make it possible to continue the present progress in loweringlimit values. Representatives from the United Kingdom, Germany, France, Sweden, theNetherlands and Switzerland have therefore initiated a programme for the development of anew particle measurement system. This Particle Measurement Programme (PMP) is acollaborative programme operating under the auspices of the UNECE WP29/GRPE Group. Itis focused on a new approach to the measurement of particles in vehicle exhaust emissions,which may be used to complement or to replace the existing regulated mass-based measuringsystem. The output will be a draft text with a proposal for a new measurement system.The PMP is divided in three phases. The first two phases are based on several isolatednational sub-programmes with the focus on developing and validating new particlemeasurement systems. It is planned that the third part will deal with testing of the preferredsystems on different advanced vehicle technologies at different laboratories in a round robintest.Several national programmes covering the task of phase 1 of the programme were run. InSwitzerland, two studies were carried out looking at the performance of the NanoMet system1
in comparison with the scanning mobility particle sizer (SMPS 3934, TSI) ([HTL Biel (1), 2001],[HTL Biel (2), 2001]). The United Kingdom presented two reports of studies comparing differentelectrical mobility methods (SMPS, DMS), CPC, Oscillating Microbalance (QCM, TEOM)([Ricardo, 2002], [AEAT, 2002]). The performance of a thermodesorber was investigated inSweden ([MTC, 2003]).All these studies significantly added to knowledge on recent particle measuring systems.However, as always a limited number of instruments were investigated in each study underdifferent testing procedures, and the meaningfulness of an overall comparison is very limited.The Swiss authorities therefore initiated an investigation to obtain a uniform overview of theperformance and quality of the particle measurement system within the PMP. The intentionwas to compare all available measurement systems in the same test procedure at the same testfacility and at the same time. The tests were carried out in the laboratories of EMPA inDuebendorf in June 2002.This report presents the main results of this investigation. It is obvious that the study cannotdeliver exact specifications for all the individual instruments. However, the study will providecomparable information about the performance of 21 particle measurement instruments and, itis hoped, will in this way contribute to the development of a future particle measurementsystem for certification purposes.
1 The NanoMet system consists of a diffusion charger, a photoelectric charge, a diffusion battery and a rotatingdisk dilution system.
GRPE Particle Measurement Programme (PMP)
Comparison Study of Particle Measurement Systems
M. Mohr, U. Lehmann, 13.05.03 10/156 Report-No.: 202779
3.1 FinancingThis study was financed by ASTRA, EMPA and BUWAL with contributions from Volvo,METAS, SUVA and R&P. The particle instrument manufacturers participated at their ownexpense.
4 Objectives of the ProgrammeThe objective of this study was to obtain a uniform overview of a wide range of state-of-the-art particle measurement systems. The capability and quality of the systems was to beinvestigated with regard to application for future legislative purposes. Comparableinformation about robustness, repeatability, linearity, sensitivity, limit of detection andresponse time of the single instruments was to be obtained. Characterisation of theinstruments and correlation between the instruments was also an important item inconsideration of the selection of core candidate instruments for PMP phase 3.
5 Methodology and approachThe measurement programme was undertaken in co-operation with the participatinginstrument manufacturers. All interested manufacturers of particle measurement instrumentsand laboratories were invited to participate with their own system or systems. Themaintenance and operation of the systems during the test programme were in theresponsibility of the manufacturers’ representatives. EMPA assisted with the installation andprovided advice on the individual set-up. Representatives of the instrument manufacturerscould decide to take the sample from the raw gas line or from the full-flow CVS tunnel andwere free in the conditioning of the sample flow for their instrument.The measurements were carried out simultaneously with all systems according to a well-defined standard test protocol.The experimental phase of the programme was divided into two phases. In the main phase,the instruments were compared using a real diesel exhaust of a modern heavy-duty engine.These tests comprised transient and steady-state tests cycles. The tests were performed at twodifferent emission levels: post-particle-trap level and about 60% of the Euro 4 limit value forparticulate matter for the ETC cycle. This phase was aimed at evaluating the candidatesystems under practical conditions. In a second phase, an aerosol generator was used as anemission source to obtain information about the performance of the instrumentsindependently of the engine.The instrument manufacturers were also involved in the data evaluation. Using detailedguidelines and specified data sheets, the representatives of the systems synchronised theirindividual raw data sets to the engine data and converted them to particle concentration(whatever metric). All further data evaluation (e.g. averaging, exclusion of outliers, systemcomparisons) and the compilation of this report were dealt with by EMPA.
GRPE Particle Measurement Programme (PMP)
Comparison Study of Particle Measurement Systems
M. Mohr, U. Lehmann, 13.05.03 11/156 Report-No.: 202779
6 Experimental
6.1 Particle Measurement systemsThere was no pre-selection of any system for participation in this comparison study, and allmanufacturers or institutes developing particle measurement systems were invited toparticipate. The candidate systems had to consist of a• Sampling line• Sample treatment unit (e.g. sample heater, dilution unit(s), thermodesorber) [optional]• Size classification unit [optional]• Detection unit• On-line data recording [optional]• Concept for calibration check
It was open to the manufacturer to decide where to take their sample, either from the full-flowCVS tunnel or directly from the raw exhaust line.A total of 21 particle measurement systems were involved in the three-week measurementprogramme. This group comprises state-of-the-art and prototypes technologies. The AVLopacimeter (R24) is not considered as a PMP candidate system but was included by EMPAfor its own interest, as it is part of the standard test bench facilities.
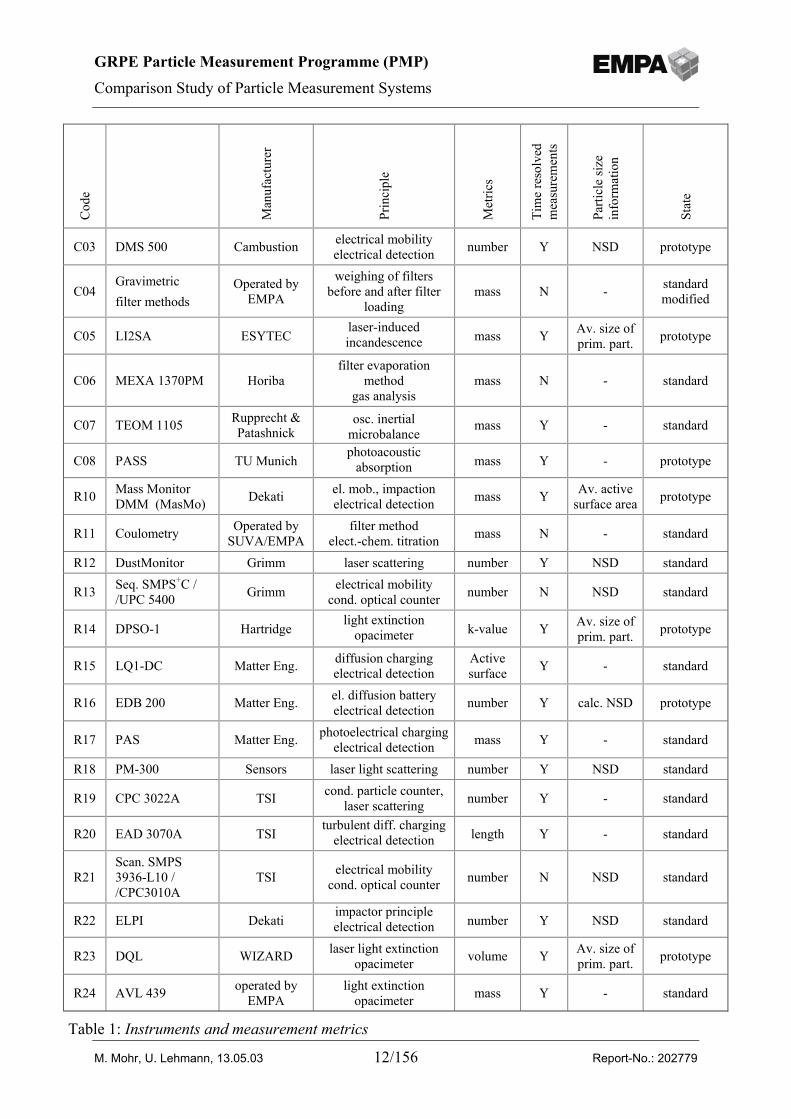
The instruments (detection units) and their measurement metrics are listed in Table 1.A more detailed description of the instruments can be found in the appendix.
GRPE Particle Measurement Programme (PMP)
Comparison Study of Particle Measurement Systems
M. Mohr, U. Lehmann, 13.05.03 12/156 Report-No.: 202779
Cod
e
Man
ufac
ture
r
Prin
cipl
e
Met
rics
Tim
e re
solv
edm
easu
rem
ents
Parti
cle
size
info
rmat
ion
Stat
e
C03 DMS 500 Cambustion electrical mobilityelectrical detection number Y NSD prototype
C04Gravimetricfilter methods
Operated byEMPA
weighing of filtersbefore and after filter
loadingmass N - standard
modified
C05 LI2SA ESYTEClaser-inducedincandescence mass Y Av. size of
prim. part. prototype
C06 MEXA 1370PM Horibafilter evaporation
methodgas analysis
mass N - standard
C07 TEOM 1105 Rupprecht &Patashnick
osc. inertialmicrobalance
mass Y - standard
C08 PASS TU Munichphotoacoustic
absorption mass Y - prototype
R10 Mass MonitorDMM (MasMo) Dekati el. mob., impaction
electrical detection mass Y Av. activesurface area prototype
R11 Coulometry Operated bySUVA/EMPA
filter methodelect.-chem. titration mass N - standard
R12 DustMonitor Grimm laser scattering number Y NSD standard
R13 Seq. SMPS+C //UPC 5400 Grimm electrical mobility
cond. optical counter number N NSD standard
R14 DPSO-1 Hartridgelight extinction
opacimeter k-value Y Av. size ofprim. part. prototype
R15 LQ1-DC Matter Eng. diffusion chargingelectrical detection
Activesurface Y - standard
R16 EDB 200 Matter Eng. el. diffusion batteryelectrical detection number Y calc. NSD prototype
R17 PAS Matter Eng. photoelectrical chargingelectrical detection mass Y - standard
R18 PM-300 Sensors laser light scattering number Y NSD standard
R19 CPC 3022A TSI cond. particle counter,laser scattering number Y - standard
R20 EAD 3070A TSIturbulent diff. charging
electrical detection length Y - standard
R21Scan. SMPS3936-L10 //CPC3010A
TSI electrical mobilitycond. optical counter number N NSD standard
R22 ELPI Dekatiimpactor principleelectrical detection number Y NSD standard
R23 DQL WIZARD laser light extinctionopacimeter volume Y Av. size of
prim. part. prototype
R24 AVL 439 operated byEMPA
light extinctionopacimeter mass Y - standard
Table 1: Instruments and measurement metrics
GRPE Particle Measurement Programme (PMP)
Comparison Study of Particle Measurement Systems
M. Mohr, U. Lehmann, 13.05.03 13/156 Report-No.: 202779
6.1.1 Particulate mass measurement by gravimetric filter methodThe conventional mass measurement by filter loading (C04) was based on the Europeanregulations. In order to evaluate the potential of an improved gravimetric filter method asmuch as possible, some specifications of the US EPA2007 regulations were adopted. Due tothe short preparation period for this study, the complete US EPA2007 regulations could notbe applied. In the following respects, the gravimetric filter measurement was modified to bein line with the US EPA2007 regulations:• filter quality and dimensions (Pallflex TX40HI20WW)• filter holder and pre-classifier assembly (supplied by Rupprecht&Patashnick)• face velocity• filtering of primary and secondary dilution air• conditioning in temperature and humidity of microbalance workstation and filter
stabilisation environment• thermal isolation of transfer lines and pre-classifier (lower temperature limit of 315 K was
not met in all cases.)
Parallel to the filter loading system, an identical assembly (incl. pre-classifier) was installeddownstream of the secondary dilution tunnel for the particle measurement system of themanufacturer Horiba (C06). Downstream of the pre-classifier for the C06 branch, the flowwas split once more to feed the TEOM (C07). To clarify, it should be mentioned that all threeinstruments use the same sampling line as far as downstream of the secondary dilution tunnel.All transfer tubes, both pre-classifiers and both filter holders were thermally isolated to keepthe sample at a higher temperature, but always below the upper limit temperature of 325 K.Using a mini-tunnel (AVL Smart Sampler SPC 472), additional filter sampling was carriedout from the raw exhaust gas for the coulometric analysis (R11). The partial flow dilutionsystem was operated in CVS mode with the same dilution ratio as the full flow system.The filters were weighed on a microbalance (Mettler MT5) with a readability of 1 µg and ameasurement uncertainty of 2.6 µg for the applied mass range.Pure quartz-fibre filters of the same quality were used for MEXA (C06) and the coulometricanalysis (R11).
6.2 Engine test facilities
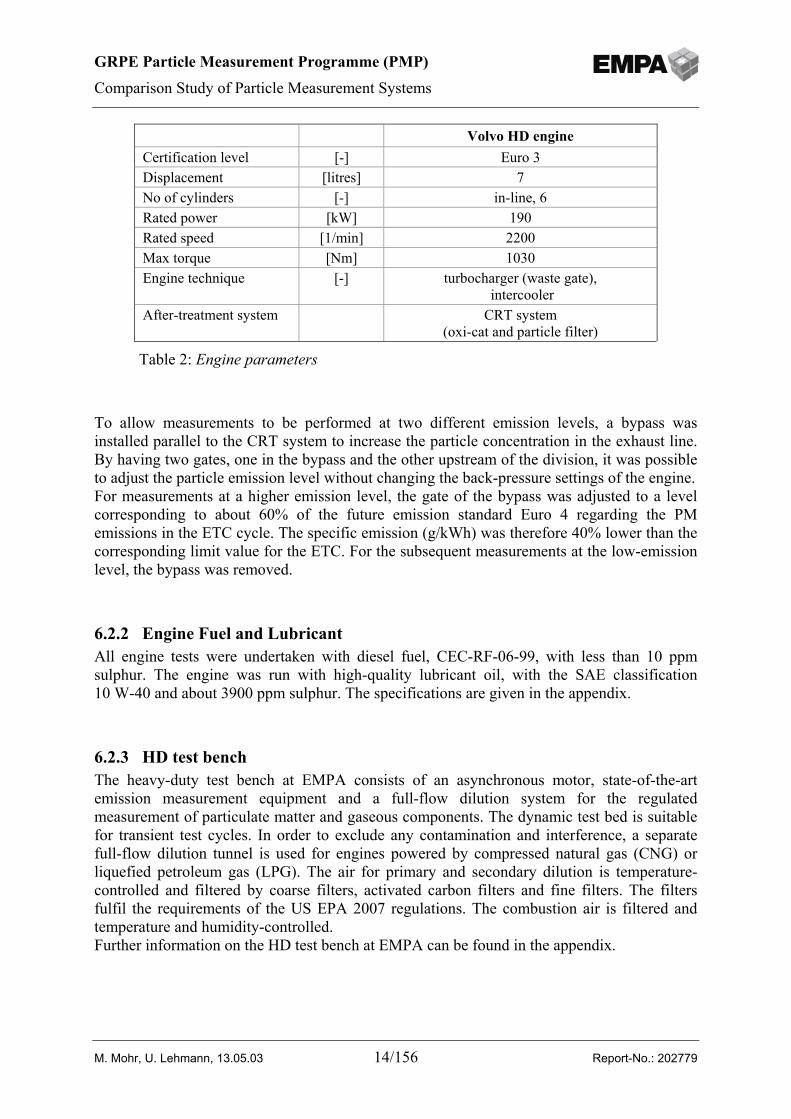
6.2.1 EngineThe engine tests were carried out with a heavy-duty diesel engine manufactured by Volvo.This type of engine is typically installed in buses and was certified in combination with aparticle filter system CRTTM according to the Euro 3 regulations. More technical informationon the engine is provided in Table 2.
GRPE Particle Measurement Programme (PMP)
Comparison Study of Particle Measurement Systems
M. Mohr, U. Lehmann, 13.05.03 14/156 Report-No.: 202779
To allow measurements to be performed at two different emission levels, a bypass wasinstalled parallel to the CRT system to increase the particle concentration in the exhaust line.By having two gates, one in the bypass and the other upstream of the division, it was possibleto adjust the particle emission level without changing the back-pressure settings of the engine.For measurements at a higher emission level, the gate of the bypass was adjusted to a levelcorresponding to about 60% of the future emission standard Euro 4 regarding the PMemissions in the ETC cycle. The specific emission (g/kWh) was therefore 40% lower than thecorresponding limit value for the ETC. For the subsequent measurements at the low-emissionlevel, the bypass was removed.
6.2.2 Engine Fuel and LubricantAll engine tests were undertaken with diesel fuel, CEC-RF-06-99, with less than 10 ppmsulphur. The engine was run with high-quality lubricant oil, with the SAE classification10 W-40 and about 3900 ppm sulphur. The specifications are given in the appendix.
6.2.3 HD test benchThe heavy-duty test bench at EMPA consists of an asynchronous motor, state-of-the-artemission measurement equipment and a full-flow dilution system for the regulatedmeasurement of particulate matter and gaseous components. The dynamic test bed is suitablefor transient test cycles. In order to exclude any contamination and interference, a separatefull-flow dilution tunnel is used for engines powered by compressed natural gas (CNG) orliquefied petroleum gas (LPG). The air for primary and secondary dilution is temperature-controlled and filtered by coarse filters, activated carbon filters and fine filters. The filtersfulfil the requirements of the US EPA 2007 regulations. The combustion air is filtered andtemperature and humidity-controlled.Further information on the HD test bench at EMPA can be found in the appendix.
Volvo HD engine Certification level [-] Euro 3 Displacement [litres] 7 No of cylinders [-] in-line, 6 Rated power [kW] 190 Rated speed [1/min] 2200 Max torque [Nm] 1030 Engine technique [-] turbocharger (waste gate),
intercooler After-treatment system CRT system
(oxi-cat and particle filter)
Table 2: Engine parameters
GRPE Particle Measurement Programme (PMP)
Comparison Study of Particle Measurement Systems
M. Mohr, U. Lehmann, 13.05.03 15/156 Report-No.: 202779
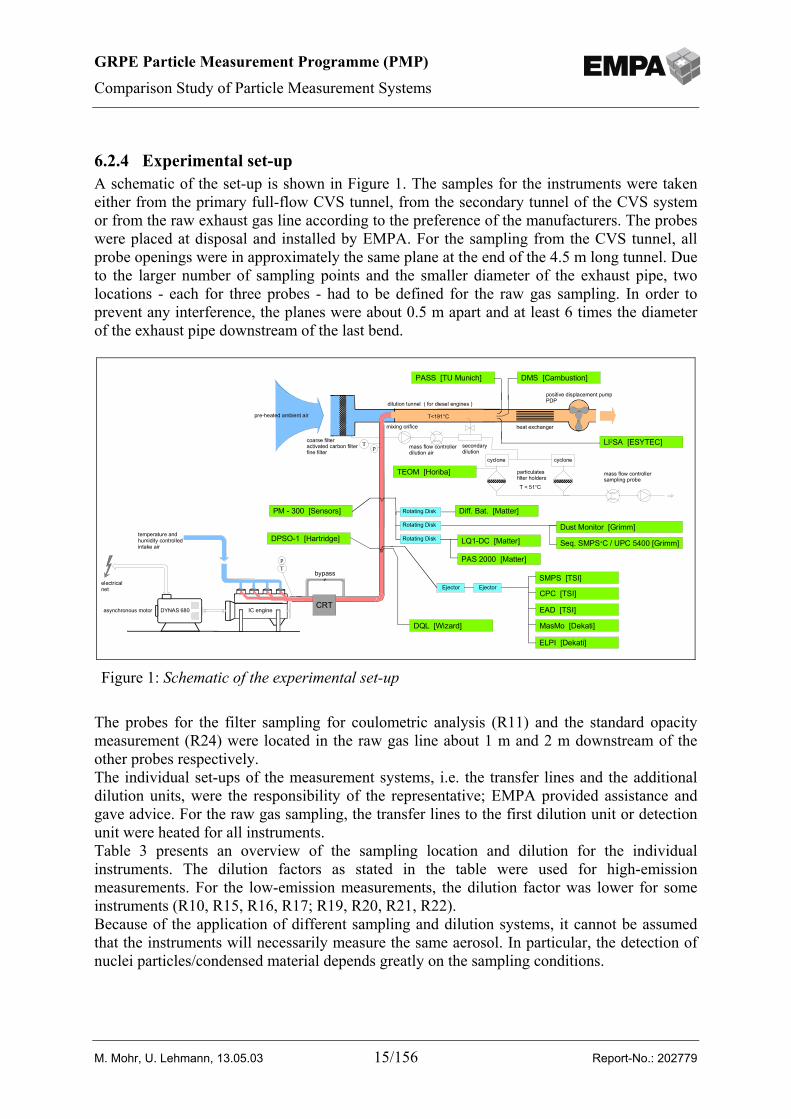
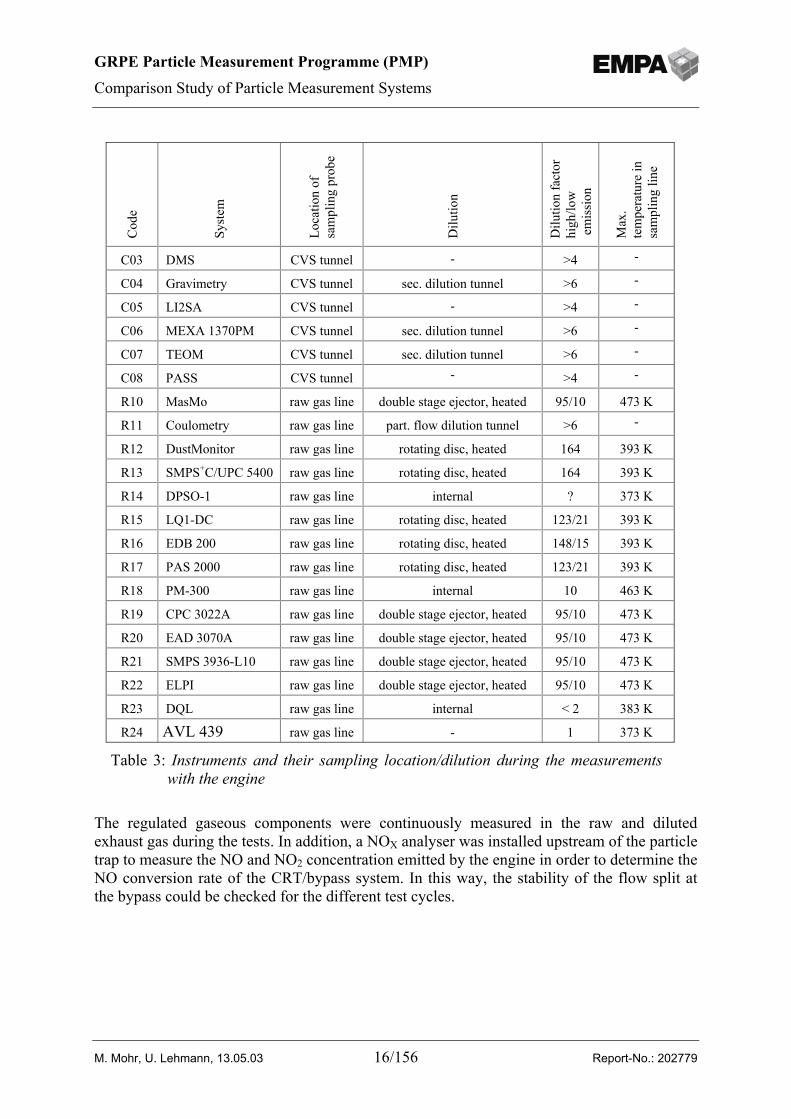
6.2.4 Experimental set-upA schematic of the set-up is shown in Figure 1. The samples for the instruments were takeneither from the primary full-flow CVS tunnel, from the secondary tunnel of the CVS systemor from the raw exhaust gas line according to the preference of the manufacturers. The probeswere placed at disposal and installed by EMPA. For the sampling from the CVS tunnel, allprobe openings were in approximately the same plane at the end of the 4.5 m long tunnel. Dueto the larger number of sampling points and the smaller diameter of the exhaust pipe, twolocations - each for three probes - had to be defined for the raw gas sampling. In order toprevent any interference, the planes were about 0.5 m apart and at least 6 times the diameterof the exhaust pipe downstream of the last bend.
The probes for the filter sampling for coulometric analysis (R11) and the standard opacitymeasurement (R24) were located in the raw gas line about 1 m and 2 m downstream of theother probes respectively.The individual set-ups of the measurement systems, i.e. the transfer lines and the additionaldilution units, were the responsibility of the representative; EMPA provided assistance andgave advice. For the raw gas sampling, the transfer lines to the first dilution unit or detectionunit were heated for all instruments.Table 3 presents an overview of the sampling location and dilution for the individualinstruments. The dilution factors as stated in the table were used for high-emissionmeasurements. For the low-emission measurements, the dilution factor was lower for someinstruments (R10, R15, R16, R17; R19, R20, R21, R22).Because of the application of different sampling and dilution systems, it cannot be assumedthat the instruments will necessarily measure the same aerosol. In particular, the detection ofnuclei particles/condensed material depends greatly on the sampling conditions.
mass flow controllerdilution air
mass flow controllersampling probe
heat exchanger
positive displacement pumpPDP
secondarydilution
dilution tunnel ( for diesel engines )
particulatesfilter holders
mixing orifice
coarse filteractivated carbon filterfine filter
T<191°C
T < 51°C
pre-heated ambient air
temperature andhumidity controlledintake air
IC engineasynchronous motor
electricalnet
DYNAS 680
T<191°C
T p
Tp
Rotating Disk
Rotating Disk
Rotating Disk
Dust Monitor [Grimm]
Seq. SMPS+C / UPC 5400 [Grimm]LQ1-DC [Matter]
PAS 2000 [Matter]
PM - 300 [Sensors] Diff. Bat. [Matter]
DPSO-1 [Hartridge]
DQL [Wizard]
SMPS [TSI]
ELPI [Dekati]
CPC [TSI]
EAD [TSI]
Ejector
MasMo [Dekati]
PASS [TU Munich]
LI2SA [ESYTEC]
TEOM [Horiba]
DMS [Cambustion]
CRT
bypass
Ejector
cyclone cyclone
Figure 1: Schematic of the experimental set-up
GRPE Particle Measurement Programme (PMP)
Comparison Study of Particle Measurement Systems
M. Mohr, U. Lehmann, 13.05.03 16/156 Report-No.: 202779
The regulated gaseous components were continuously measured in the raw and dilutedexhaust gas during the tests. In addition, a NOX analyser was installed upstream of the particletrap to measure the NO and NO2 concentration emitted by the engine in order to determine theNO conversion rate of the CRT/bypass system. In this way, the stability of the flow split atthe bypass could be checked for the different test cycles.
Cod
e
Syst
em
Loca
tion
ofsa
mpl
ing
prob
e
Dilu
tion
Dilu
tion
fact
orhi
gh/lo
w e
mis
sion
Max
.te
mpe
ratu
re in
sam
plin
g lin
e
C03 DMS CVS tunnel - >4 -
C04 Gravimetry CVS tunnel sec. dilution tunnel >6 -
C05 LI2SA CVS tunnel - >4 -
C06 MEXA 1370PM CVS tunnel sec. dilution tunnel >6 -
C07 TEOM CVS tunnel sec. dilution tunnel >6 -
C08 PASS CVS tunnel - >4 -
R10 MasMo raw gas line double stage ejector, heated 95/10 473 K
R11 Coulometry raw gas line part. flow dilution tunnel >6 -
R12 DustMonitor raw gas line rotating disc, heated 164 393 K
R13 SMPS+C/UPC 5400 raw gas line rotating disc, heated 164 393 K
R14 DPSO-1 raw gas line internal ? 373 K
R15 LQ1-DC raw gas line rotating disc, heated 123/21 393 K
R16 EDB 200 raw gas line rotating disc, heated 148/15 393 K
R17 PAS 2000 raw gas line rotating disc, heated 123/21 393 K
R18 PM-300 raw gas line internal 10 463 K
R19 CPC 3022A raw gas line double stage ejector, heated 95/10 473 K
R20 EAD 3070A raw gas line double stage ejector, heated 95/10 473 K
R21 SMPS 3936-L10 raw gas line double stage ejector, heated 95/10 473 K
R22 ELPI raw gas line double stage ejector, heated 95/10 473 K
R23 DQL raw gas line internal < 2 383 K
R24 AVL 439 raw gas line - 1 373 K
Table 3: Instruments and their sampling location/dilution during the measurementswith the engine
GRPE Particle Measurement Programme (PMP)
Comparison Study of Particle Measurement Systems
M. Mohr, U. Lehmann, 13.05.03 17/156 Report-No.: 202779
6.3 CAST test facilitiesBesides the engine tests, additional measurements were carried out with a combustion aerosolgenerator. The purpose of these measurements was to obtain data independent of the morecomplex engine exhaust.
6.3.1 CASTThe CAST (Combustion Aerosol STandard) is a stand-alone soot generating burner based ona co-flow diffusion flame which generates air suspended sub-micron combustion sootparticles. These particles correspond to the particles emitted by diesel engines in the mostimportant characteristics. The concentration and size distribution of the particles arereproducible and are calibrated by the Swiss Federal Office of Metrology and Accreditation(METAS). Further details are presented at (http://www.sootgenerator.com/). During themeasurement programme, the CAST was operated by a representative of METAS.
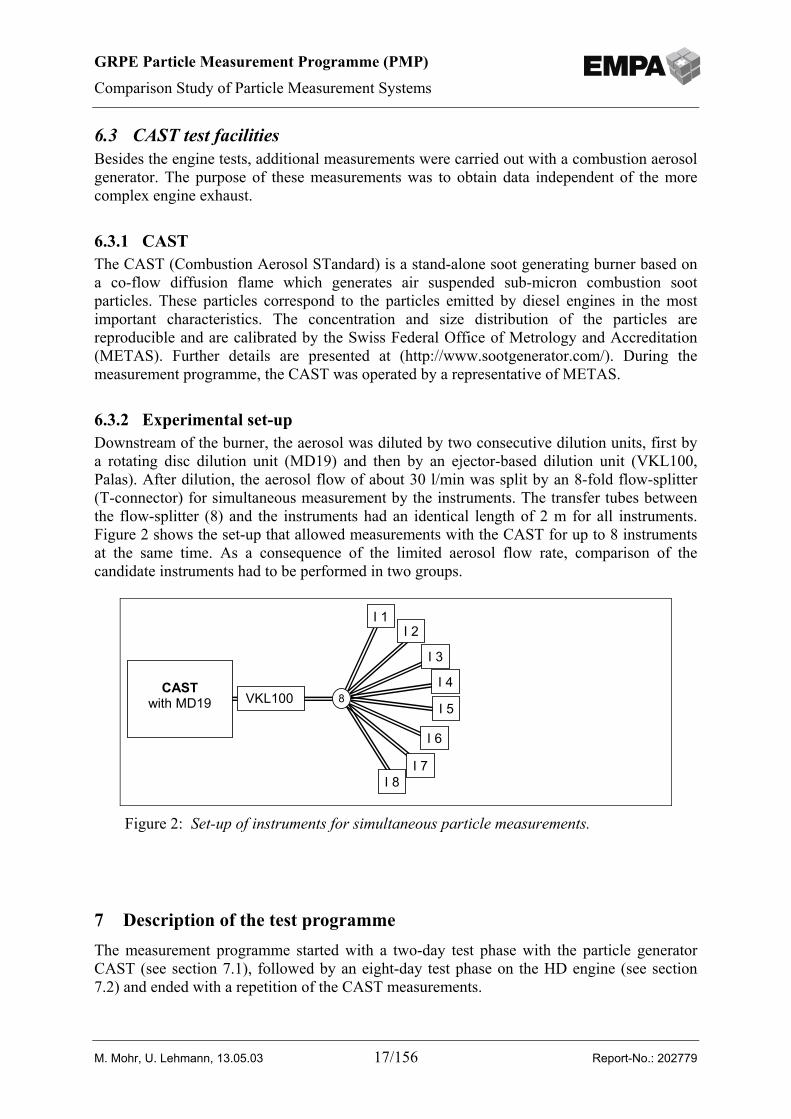
6.3.2 Experimental set-upDownstream of the burner, the aerosol was diluted by two consecutive dilution units, first bya rotating disc dilution unit (MD19) and then by an ejector-based dilution unit (VKL100,Palas). After dilution, the aerosol flow of about 30 l/min was split by an 8-fold flow-splitter(T-connector) for simultaneous measurement by the instruments. The transfer tubes betweenthe flow-splitter (8) and the instruments had an identical length of 2 m for all instruments.Figure 2 shows the set-up that allowed measurements with the CAST for up to 8 instrumentsat the same time. As a consequence of the limited aerosol flow rate, comparison of thecandidate instruments had to be performed in two groups.
7 Description of the test programmeThe measurement programme started with a two-day test phase with the particle generatorCAST (see section 7.1), followed by an eight-day test phase on the HD engine (see section7.2) and ended with a repetition of the CAST measurements.
VKL100CAST
with MD19 8
I 1I 2
I 3
I 4
I 5
I 6
I 7I 8
Figure 2: Set-up of instruments for simultaneous particle measurements.
GRPE Particle Measurement Programme (PMP)
Comparison Study of Particle Measurement Systems
M. Mohr, U. Lehmann, 13.05.03 18/156 Report-No.: 202779
The candidate systems were operated and maintained by the representatives of themanufactures. They ran their systems at their own responsibility throughout the measurementprogramme.
7.1 CAST measurementsThe purpose of these tests was to obtain information about the calibration, detection limit andlinearity of the instruments.
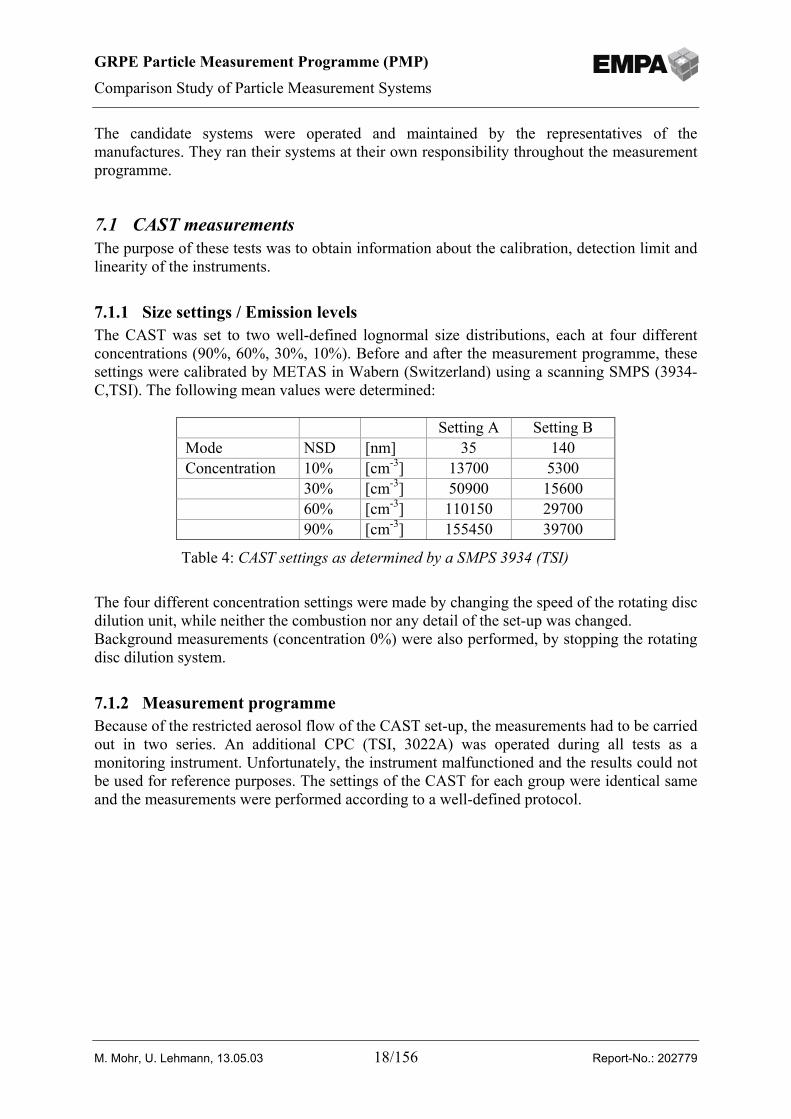
7.1.1 Size settings / Emission levelsThe CAST was set to two well-defined lognormal size distributions, each at four differentconcentrations (90%, 60%, 30%, 10%). Before and after the measurement programme, thesesettings were calibrated by METAS in Wabern (Switzerland) using a scanning SMPS (3934-C,TSI). The following mean values were determined:
The four different concentration settings were made by changing the speed of the rotating discdilution unit, while neither the combustion nor any detail of the set-up was changed.Background measurements (concentration 0%) were also performed, by stopping the rotatingdisc dilution system.
7.1.2 Measurement programmeBecause of the restricted aerosol flow of the CAST set-up, the measurements had to be carriedout in two series. An additional CPC (TSI, 3022A) was operated during all tests as amonitoring instrument. Unfortunately, the instrument malfunctioned and the results could notbe used for reference purposes. The settings of the CAST for each group were identical sameand the measurements were performed according to a well-defined protocol.
Setting A Setting B Mode NSD [nm] 35 140 Concentration 10% [cm-3] 13700 5300
30% [cm-3] 50900 1560060% [cm-3] 110150 2970090% [cm-3] 155450 39700
Table 4: CAST settings as determined by a SMPS 3934 (TSI)
GRPE Particle Measurement Programme (PMP)
Comparison Study of Particle Measurement Systems
M. Mohr, U. Lehmann, 13.05.03 19/156 Report-No.: 202779
The test procedure of the two series followed the same schedule:• warm-up CAST: 45 min• concentration setting• stabilisation phase: 5 min• measurement period: 10 min• next concentration setting• stabilisation phase after size change: 20 min
The detailed sequence of the tests can be found in the appendix.
7.2 Engine measurements
7.2.1 Test cyclesThe test programme comprised two steady-state and two transient test cycles. The main focuswas on the European transient cycle (ETC), which is the official transient certification testcycle in Europe. For the steady-state test, five operation modes were selected from theEuropean steady-state cycle (ESC) for a so-called single mode test cycle (SM). The modeswere run for 15 minutes one after the other without interruption.To obtain information about the time response of the particle systems, a so-called step changetest (SCT) was defined, consisting of a repeated switch between two loads, with a three-minute stabilisation phase between two switches. Finally some runs of the complete Europeansteady-state certification test cycle (ESC) were carried out. Details of the test cycles arepresented below (Table 6) and in the appendix.At the beginning of each day of measurement, background measurements (BG) were carriedout by running the complete CVS dilution system and all measurement instruments, but theengine was switched off. The tests were run for 30 minutes, which is the same duration as forthe ETC test cycle.
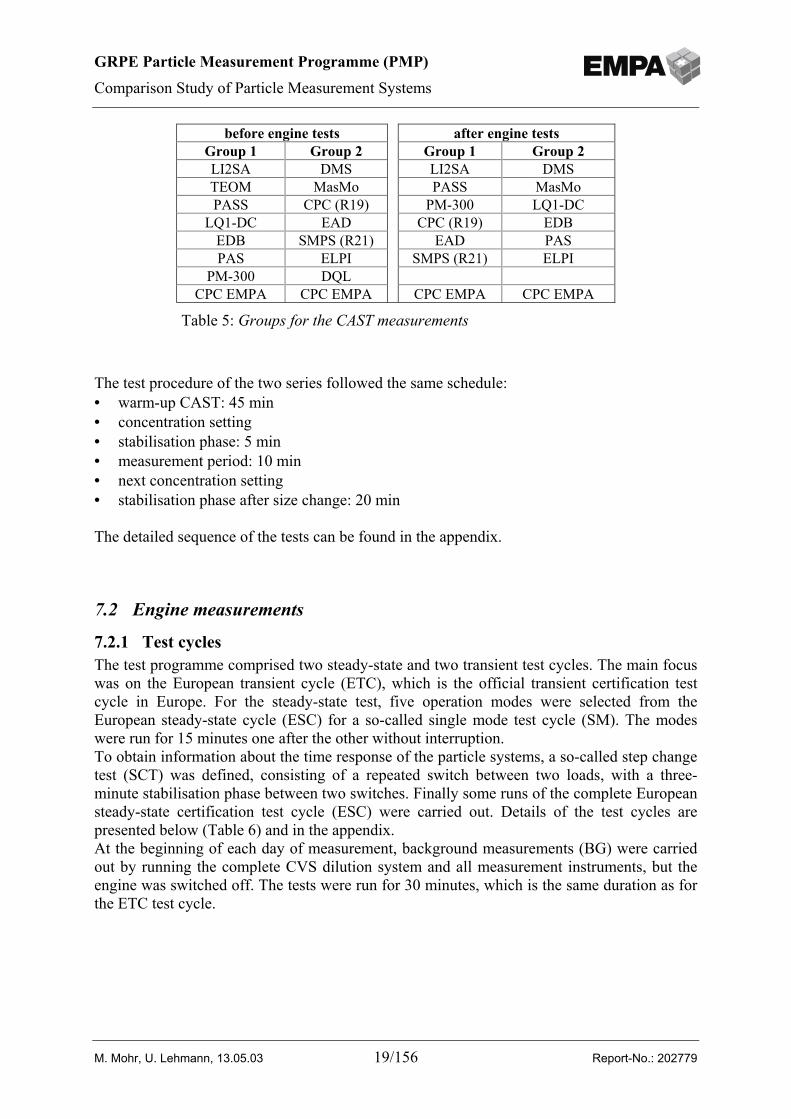
before engine tests after engine testsGroup 1 Group 2 Group 1 Group 2LI2SA DMS LI2SA DMSTEOM MasMo PASS MasMoPASS CPC (R19) PM-300 LQ1-DC
LQ1-DC EAD CPC (R19) EDBEDB SMPS (R21) EAD PASPAS ELPI SMPS (R21) ELPI
PM-300 DQLCPC EMPA CPC EMPA CPC EMPA CPC EMPA
Table 5: Groups for the CAST measurements
GRPE Particle Measurement Programme (PMP)
Comparison Study of Particle Measurement Systems
M. Mohr, U. Lehmann, 13.05.03 20/156 Report-No.: 202779
7.2.2 Conditioning of the engineThe conditioning of the engine and the engine exhaust system was carried according to theEPEFE protocols (European Programme on Engines, Fuels and Emissions, ACEA, Brussels).1. Standard warm-up of the engine (until the oil temp was 80°C)2. Running the engine at rated power for one minute3. Running the engine at idle for about one minute4. Running the engine at B100 for two minutes
In the case of the SCT test, the engine was run at 90% load for 4 minutes in addition to thedescribed conditioning procedure before starting the test.
7.2.3 Measurement programmeThe engine tests started with the bypass set-up (high-emission), followed by the tests with thefull trap set-up. Preconditioning of the engine, trap, exhaust lines and CVS tunnel werecarried for several hours between the two series. Table 7 shows the test sequence for theengine test programme.
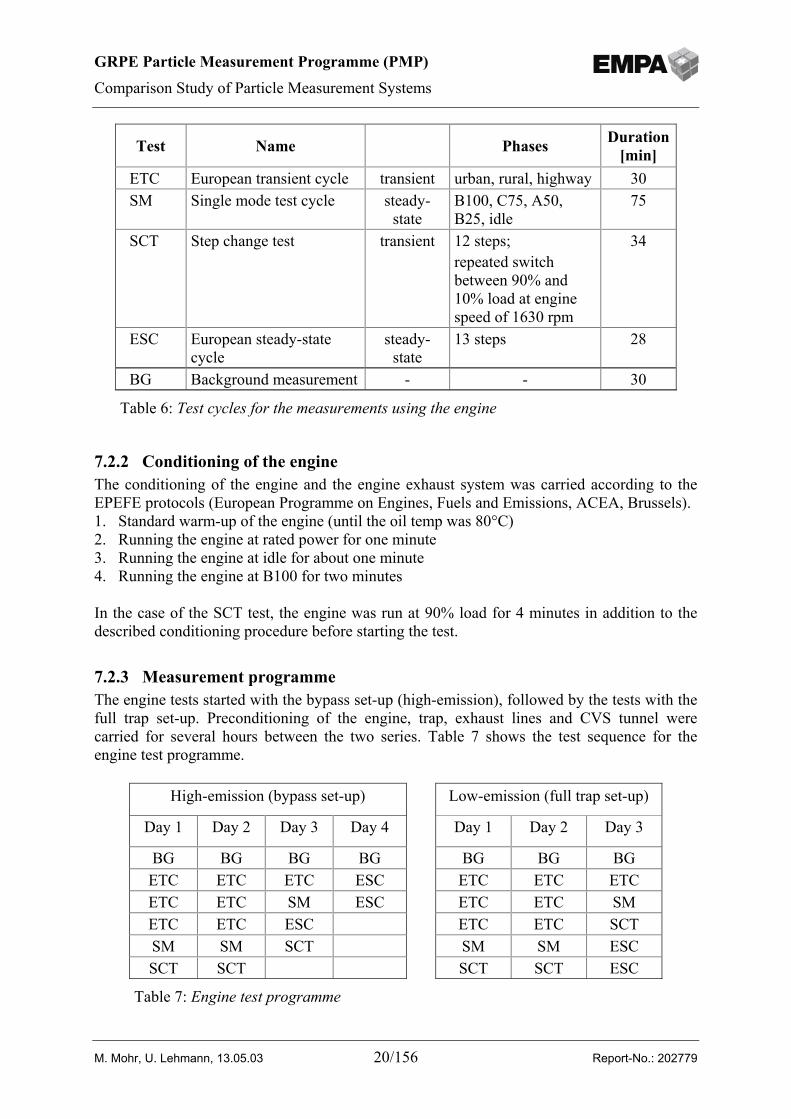
Test Name Phases Duration[min]
ETC European transient cycle transient urban, rural, highway 30SM Single mode test cycle steady-
stateB100, C75, A50,B25, idle
75
SCT Step change test transient 12 steps;repeated switchbetween 90% and10% load at enginespeed of 1630 rpm
34
ESC European steady-statecycle
steady-state
13 steps 28
BG Background measurement - - 30
Table 6: Test cycles for the measurements using the engine
High-emission (bypass set-up) Low-emission (full trap set-up)
Day 1 Day 2 Day 3 Day 4 Day 1 Day 2 Day 3
BG BG BG BG BG BG BGETC ETC ETC ESC ETC ETC ETCETC ETC SM ESC ETC ETC SMETC ETC ESC ETC ETC SCTSM SM SCT SM SM ESCSCT SCT SCT SCT ESC
Table 7: Engine test programme
GRPE Particle Measurement Programme (PMP)
Comparison Study of Particle Measurement Systems
M. Mohr, U. Lehmann, 13.05.03 21/156 Report-No.: 202779
8 Measured parameters and calculations
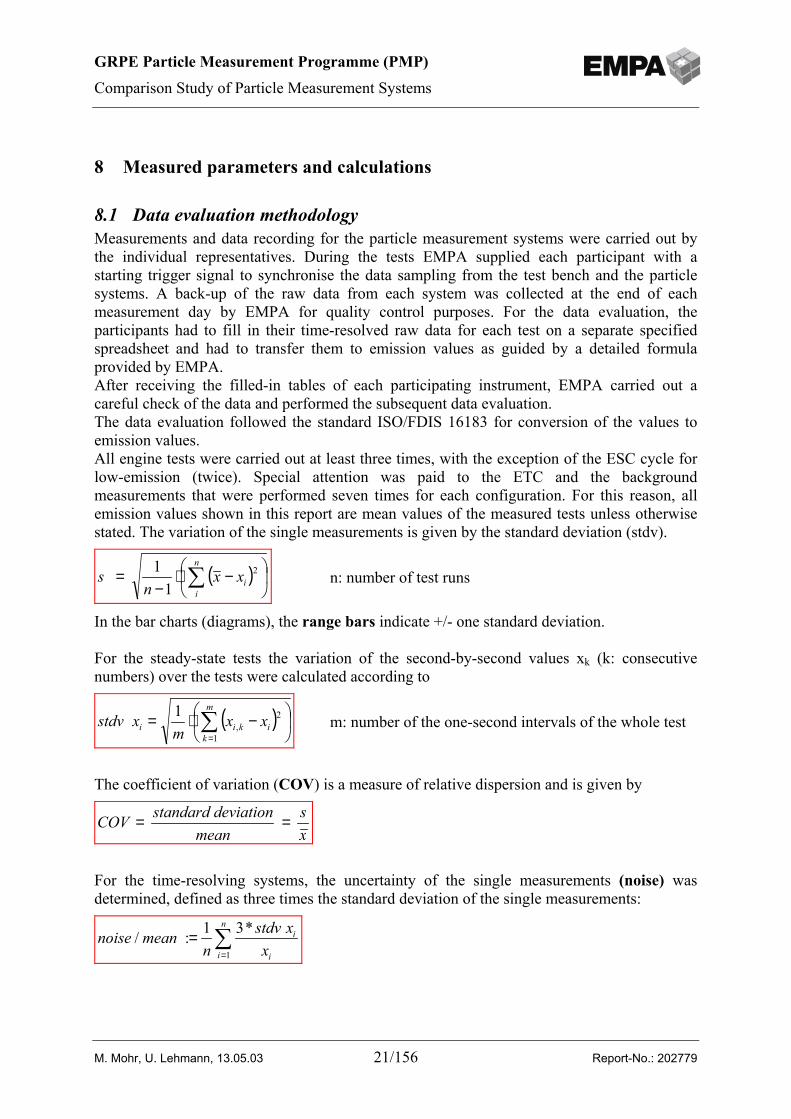
8.1 Data evaluation methodologyMeasurements and data recording for the particle measurement systems were carried out bythe individual representatives. During the tests EMPA supplied each participant with astarting trigger signal to synchronise the data sampling from the test bench and the particlesystems. A back-up of the raw data from each system was collected at the end of eachmeasurement day by EMPA for quality control purposes. For the data evaluation, theparticipants had to fill in their time-resolved raw data for each test on a separate specifiedspreadsheet and had to transfer them to emission values as guided by a detailed formulaprovided by EMPA.After receiving the filled-in tables of each participating instrument, EMPA carried out acareful check of the data and performed the subsequent data evaluation.The data evaluation followed the standard ISO/FDIS 16183 for conversion of the values toemission values.All engine tests were carried out at least three times, with the exception of the ESC cycle forlow-emission (twice). Special attention was paid to the ETC and the backgroundmeasurements that were performed seven times for each configuration. For this reason, allemission values shown in this report are mean values of the measured tests unless otherwisestated. The variation of the single measurements is given by the standard deviation (stdv).
( )
−⋅−
= ∑n
iixx
ns 2
11 n: number of test runs
In the bar charts (diagrams), the range bars indicate +/- one standard deviation.
For the steady-state tests the variation of the second-by-second values xk (k: consecutivenumbers) over the tests were calculated according to
( )
−⋅= ∑=
m
kikii xx
mxstdv
1
2,
1m: number of the one-second intervals of the whole test
The coefficient of variation (COV) is a measure of relative dispersion and is given by
xs
meaneviationstandard dCOV ==
For the time-resolving systems, the uncertainty of the single measurements (noise) wasdetermined, defined as three times the standard deviation of the single measurements:
∑=
=n
i i
i
xxstdv
nmeannoise
1
*31:/
GRPE Particle Measurement Programme (PMP)
Comparison Study of Particle Measurement Systems
M. Mohr, U. Lehmann, 13.05.03 22/156 Report-No.: 202779
Noise-to-mean ratios were determined for the background measurements with the engine (theengine was shut off) (see section 7.2.1) and for the CAST measurements for the 10% and 90%concentration settings (see section 7.1).
8.2 Limit of detectionThe limit of detection (LOD) of the particle measurement systems was calculated by takingthree times the standard deviation of the mean value of a set of measurements at very lowconcentrations.We decided to calculate the LOD from the ETC low-emission tests and not from the enginebackground tests, as the repeatability was better for the ETC tests than for the backgroundmeasurements at the same low concentration level. In addition, for the backgroundmeasurements temperatures and flow rates are significantly different than real exhaustmeasurements. The LOD as defined and determined provides a comparison of the instrumentswithin this programme and cannot be used generally.
)(3 lowETCsLOD ⋅=
8.3 SensitivityThe sensitivity of the systems is deduced from the ratio of the concentrations measured for themeasurements at high and low-emission level of the individual test cycles (see section 8.6).This characterisation is influenced by the limit of detection of the instruments, by themeasured particle composition and naturally also by the sampling conditions. Thequantification by the sensitivity therefore provides a comparison of the instruments within thisprogramme; it cannot be used generally.
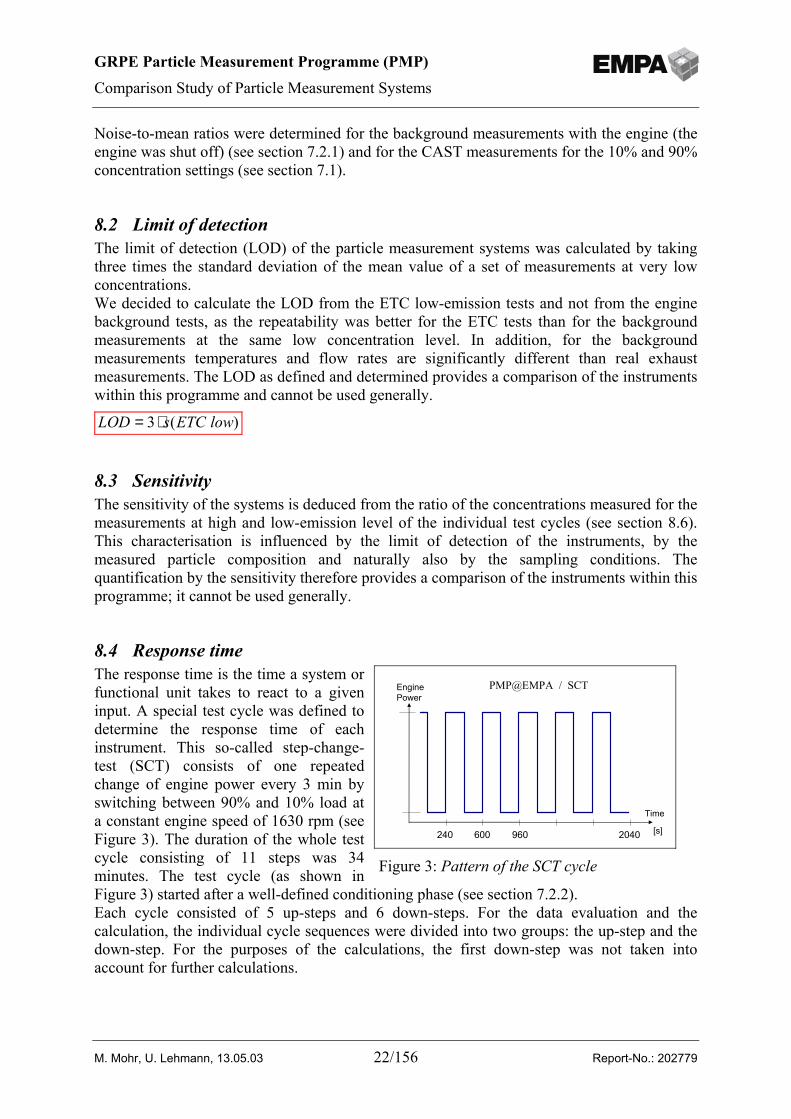
8.4 Response timeThe response time is the time a system orfunctional unit takes to react to a giveninput. A special test cycle was defined todetermine the response time of eachinstrument. This so-called step-change-test (SCT) consists of one repeatedchange of engine power every 3 min byswitching between 90% and 10% load ata constant engine speed of 1630 rpm (seeFigure 3). The duration of the whole testcycle consisting of 11 steps was 34minutes. The test cycle (as shown inFigure 3) started after a well-defined conditioning phase (see section 7.2.2).Each cycle consisted of 5 up-steps and 6 down-steps. For the data evaluation and thecalculation, the individual cycle sequences were divided into two groups: the up-step and thedown-step. For the purposes of the calculations, the first down-step was not taken intoaccount for further calculations.
PMP@EMPA / SCTEngine Power
Time
240 600 960 2040 [s]
Figure 3: Pattern of the SCT cycle
GRPE Particle Measurement Programme (PMP)
Comparison Study of Particle Measurement Systems
M. Mohr, U. Lehmann, 13.05.03 23/156 Report-No.: 202779
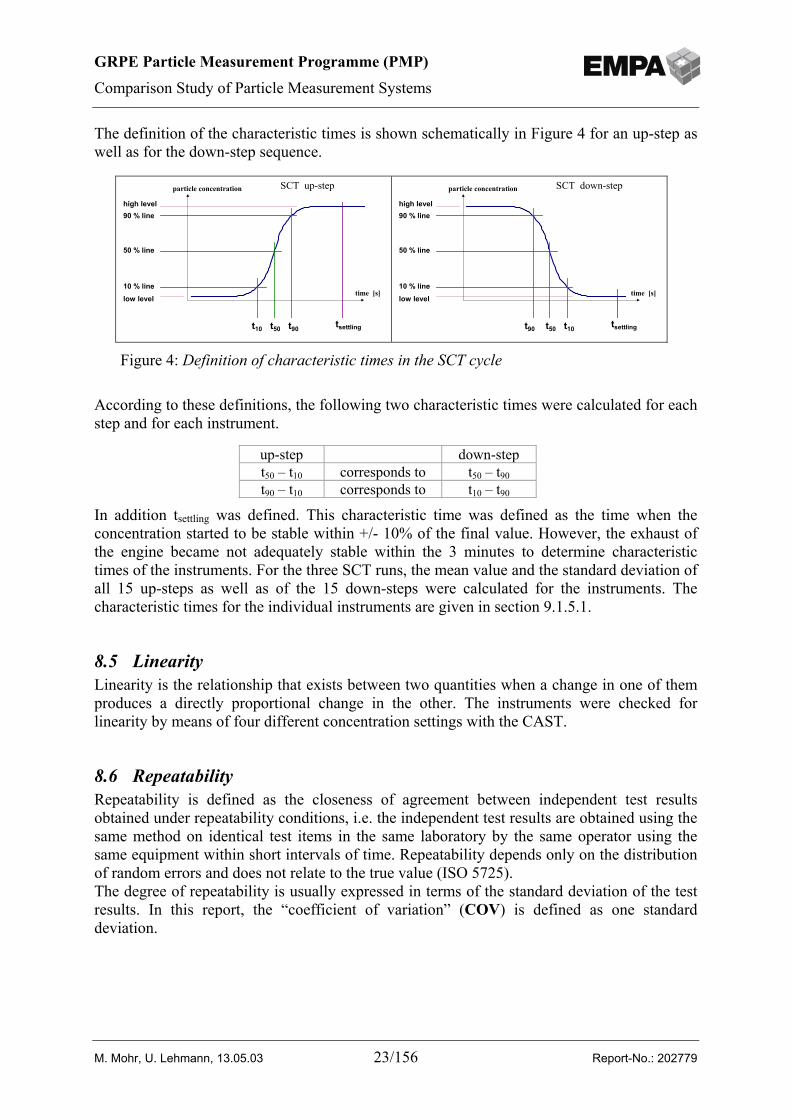
The definition of the characteristic times is shown schematically in Figure 4 for an up-step aswell as for the down-step sequence.
According to these definitions, the following two characteristic times were calculated for eachstep and for each instrument.
In addition tsettling was defined. This characteristic time was defined as the time when theconcentration started to be stable within +/- 10% of the final value. However, the exhaust ofthe engine became not adequately stable within the 3 minutes to determine characteristictimes of the instruments. For the three SCT runs, the mean value and the standard deviation ofall 15 up-steps as well as of the 15 down-steps were calculated for the instruments. Thecharacteristic times for the individual instruments are given in section 9.1.5.1.
8.5 LinearityLinearity is the relationship that exists between two quantities when a change in one of themproduces a directly proportional change in the other. The instruments were checked forlinearity by means of four different concentration settings with the CAST.
8.6 RepeatabilityRepeatability is defined as the closeness of agreement between independent test resultsobtained under repeatability conditions, i.e. the independent test results are obtained using thesame method on identical test items in the same laboratory by the same operator using thesame equipment within short intervals of time. Repeatability depends only on the distributionof random errors and does not relate to the true value (ISO 5725).The degree of repeatability is usually expressed in terms of the standard deviation of the testresults. In this report, the “coefficient of variation” (COV) is defined as one standarddeviation.
10 % line
50 % line
90 % linehigh level
low level
t10 t50 t90 tsettling
SCT up-step
time [s]
particle concentration
10 % line
50 % line
90 % linehigh level
low level
t10t50t90 tsettling
SCT down-step
time [s]
particle concentration
Figure 4: Definition of characteristic times in the SCT cycle
up-step down-stept50 – t10 corresponds to t50 – t90
t90 – t10 corresponds to t10 – t90
GRPE Particle Measurement Programme (PMP)
Comparison Study of Particle Measurement Systems
M. Mohr, U. Lehmann, 13.05.03 24/156 Report-No.: 202779
PrecisionThe closeness of agreement between independent test results obtained under stipulatedconditions. Repeatability conditions are a particular set of extreme conditions. As precisiondemands weaker conditions, this report is focused on repeatability.
AccuracyThe closeness of agreement between the result of the measurement and the accepted referencevalue of the quantity. As no reference values of the particle emissions for the individualmetrics were available, the accuracy of the individual instruments could not be determined.
ReproducibilityThe closeness of agreement between independent test results obtained under repeatabilityconditions, i.e. the test results are obtained with the same method on identical test items indifferent laboratories with different operators using different equipment. By definition, it wasnot possible to determine reproducibility within the EMPA measurement programme.
8.7 OutliersInconsistent values in a set of measurement values were identified by a simple test accordingto Dixon [Dixon, 1953]. In addition, the outlier had to deviate by at least 40% from the meanof the other measurements in the same set. A maximum of one value per set was defined as anoutlier.
8.8 RobustnessNo analysis of the robustness of the particle measurement systems was carried due to theshort duration of the programme. Only a personal impression is reported, based on availabilityduring the tests in consideration of the schedule of test series and the ambient conditions.
GRPE Particle Measurement Programme (PMP)
Comparison Study of Particle Measurement Systems
M. Mohr, U. Lehmann, 13.05.03 25/156 Report-No.: 202779
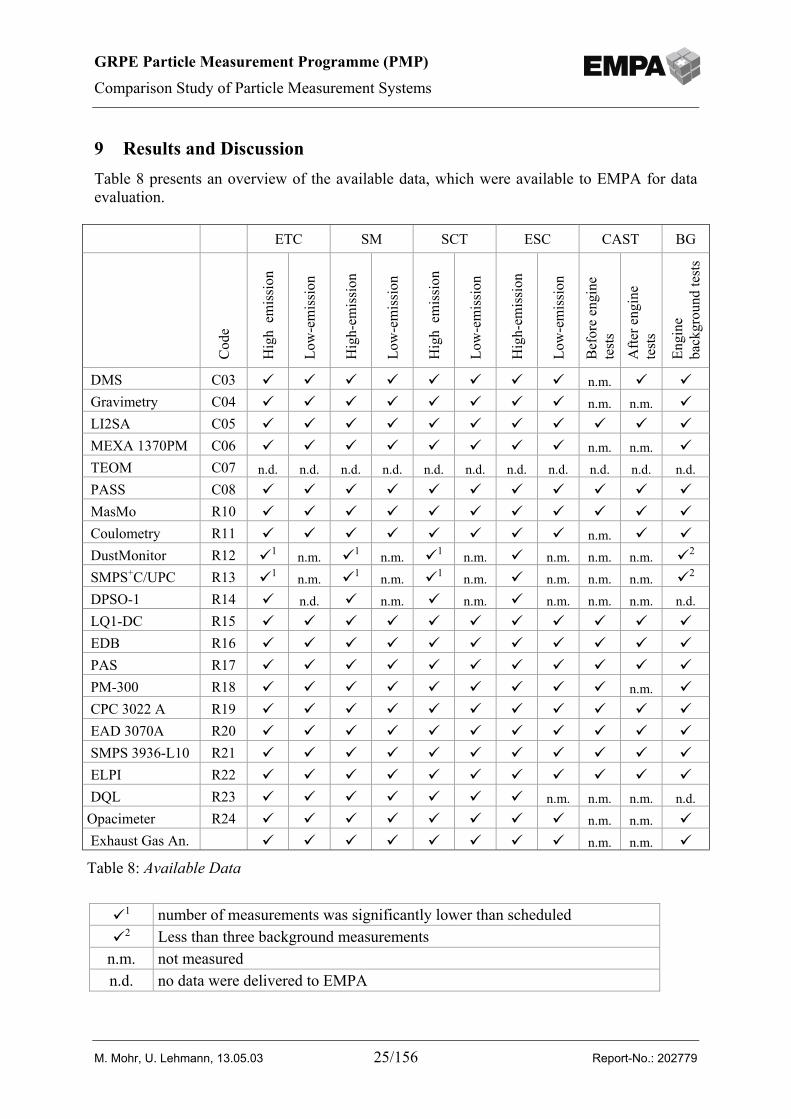
9 Results and DiscussionTable 8 presents an overview of the available data, which were available to EMPA for dataevaluation.
1 number of measurements was significantly lower than scheduled2 Less than three background measurements
n.m. not measuredn.d. no data were delivered to EMPA
ETC SM SCT ESC CAST BGC
ode
Hig
h e
mis
sion
Low
-em
issi
on
Hig
h-em
issi
on
Low
-em
issi
on
Hig
h e
mis
sion
Low
-em
issi
on
Hig
h-em
issi
on
Low
-em
issi
on
Bef
ore
engi
nete
sts
Afte
r eng
ine
test
s
Engi
neba
ckgr
ound
test
s
DMS C03 n.m. Gravimetry C04 n.m. n.m. LI2SA C05 MEXA 1370PM C06 n.m. n.m. TEOM C07 n.d. n.d. n.d. n.d. n.d. n.d. n.d. n.d. n.d. n.d. n.d. PASS C08 MasMo R10 Coulometry R11 n.m. DustMonitor R12 1 n.m. 1 n.m. 1 n.m. n.m. n.m. n.m. 2
SMPS+C/UPC R13 1 n.m. 1 n.m. 1 n.m. n.m. n.m. n.m. 2
DPSO-1 R14 n.d. n.m. n.m. n.m. n.m. n.m. n.d. LQ1-DC R15 EDB R16 PAS R17 PM-300 R18 n.m. CPC 3022 A R19 EAD 3070A R20 SMPS 3936-L10 R21 ELPI R22 DQL R23 n.m. n.m. n.m. n.d.Opacimeter R24 n.m. n.m. Exhaust Gas An. n.m. n.m.
Table 8: Available Data
GRPE Particle Measurement Programme (PMP)
Comparison Study of Particle Measurement Systems
M. Mohr, U. Lehmann, 13.05.03 26/156 Report-No.: 202779
9.1 Engine measurements
9.1.1 RobustnessNone of the participating instruments had serious problems in running the tight and 2.5 weeklong test programme. This cannot be regarded as a matter of course because the instrumentswere exposed to ambient temperature up to 30° C for more than a week. Some losses of dataoccasionally occur, mainly due to incorrect operation, missing of the start signal or failure incommunication. The prototype DMS was still being optimised during the measurementprogramme, skipping some measurements at the beginning.
9.1.2 RepeatabilityThe results for the determination of the repeatability of the instruments are based on theparticle concentration per exhaust gas volume, i.e. [x/Ncm3]. The repeatability of theinstruments is characterised by what is known as the coefficient of variation (COV), definedas one relative standard deviation of the test (see section 8.2)
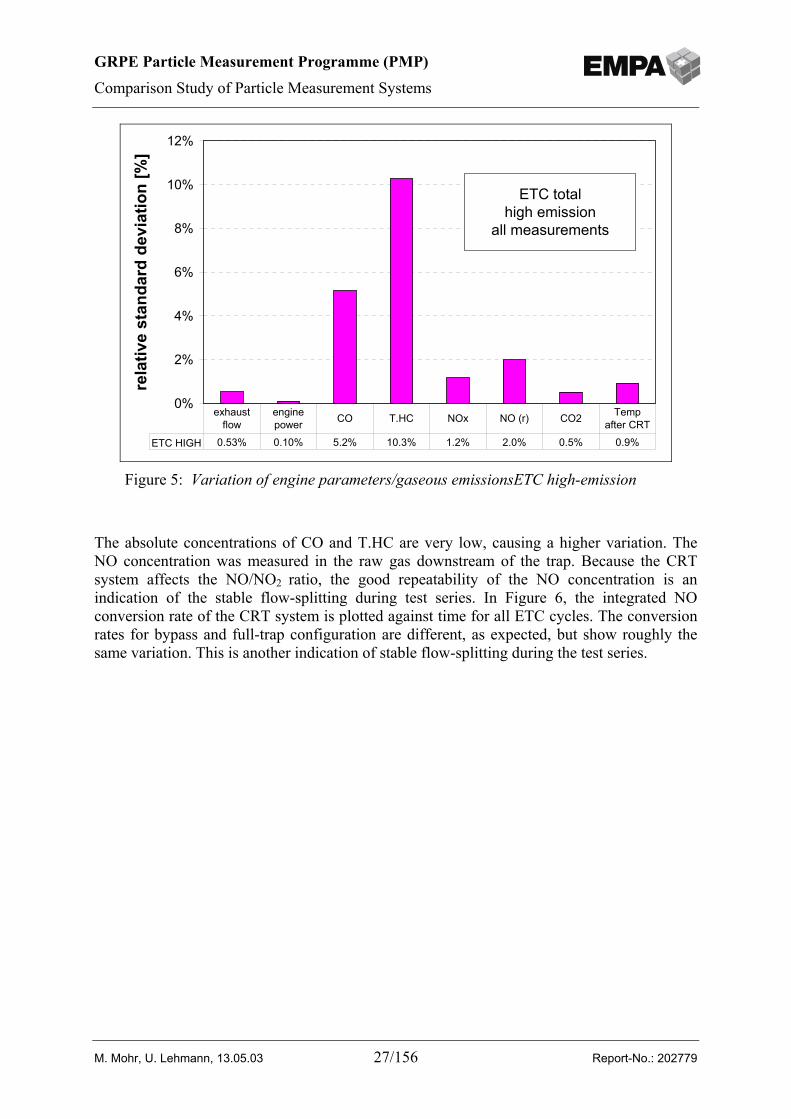
9.1.2.1 European Transient Test (ETC) / ETC high-emissionSeven ETC cycles were carried out at a high-emission level, i.e. by using the bypass (seesection 6.2). These cycles were measured on three successive days.
The stability and repeatability of the engine is shown in Figure 5, looking at some importantengine-related data and the regulated gaseous components. The engine was very stable duringthe seven tests on three different days, which is an important condition to be met for theinvestigation of the performance of the particle instruments.
Although the variations in the engine exhaust emissions are very small, their contribution tothe variation of the particle measurement results cannot be determined. Within a group ofinstruments with the same metrics, the instrument with the lowest variation provides the upperlimit of the engine’s contribution.
GRPE Particle Measurement Programme (PMP)
Comparison Study of Particle Measurement Systems
M. Mohr, U. Lehmann, 13.05.03 27/156 Report-No.: 202779
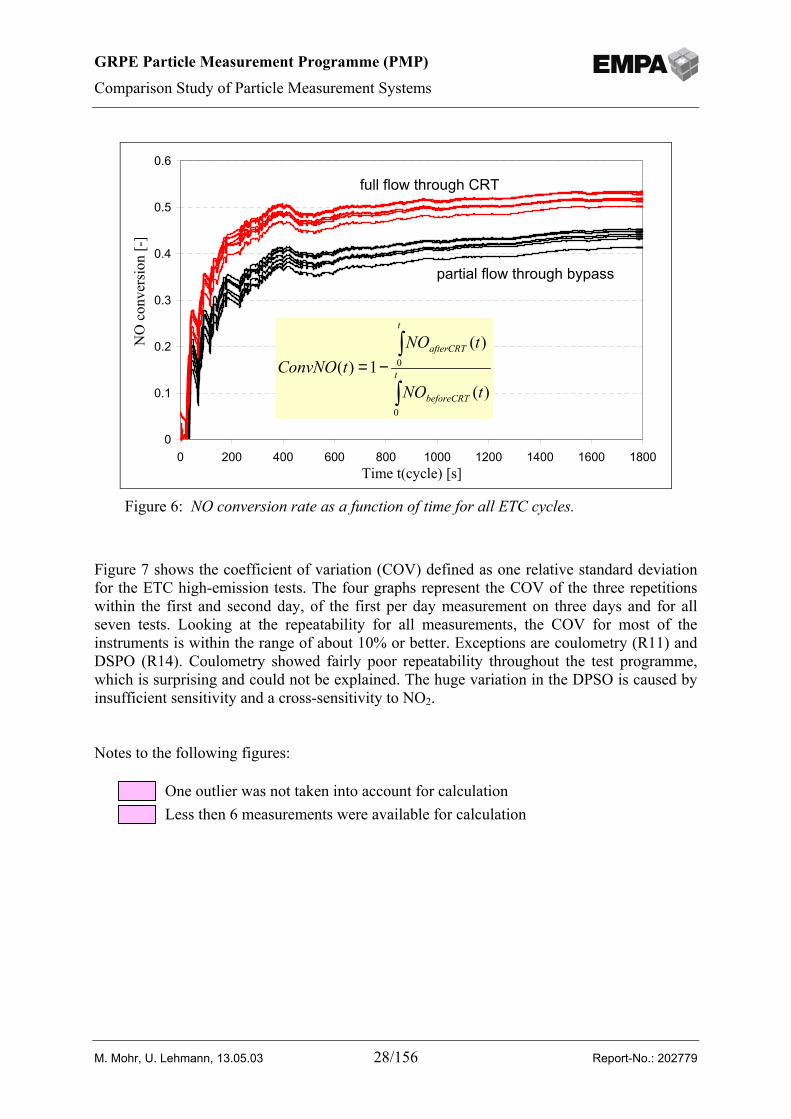
The absolute concentrations of CO and T.HC are very low, causing a higher variation. TheNO concentration was measured in the raw gas downstream of the trap. Because the CRTsystem affects the NO/NO2 ratio, the good repeatability of the NO concentration is anindication of the stable flow-splitting during test series. In Figure 6, the integrated NOconversion rate of the CRT system is plotted against time for all ETC cycles. The conversionrates for bypass and full-trap configuration are different, as expected, but show roughly thesame variation. This is another indication of stable flow-splitting during the test series.
0%
2%
4%
6%
8%
10%
12%re
lativ
e st
anda
rd d
evia
tion
[%]
ETC HIGH 0.53% 0.10% 5.2% 10.3% 1.2% 2.0% 0.5% 0.9%
exhaust flow
engine power CO T.HC NOx NO (r) CO2 Temp
after CRT
ETC totalhigh emission
all measurements
Figure 5: Variation of engine parameters/gaseous emissionsETC high-emission
GRPE Particle Measurement Programme (PMP)
Comparison Study of Particle Measurement Systems
M. Mohr, U. Lehmann, 13.05.03 28/156 Report-No.: 202779
Figure 7 shows the coefficient of variation (COV) defined as one relative standard deviationfor the ETC high-emission tests. The four graphs represent the COV of the three repetitionswithin the first and second day, of the first per day measurement on three days and for allseven tests. Looking at the repeatability for all measurements, the COV for most of theinstruments is within the range of about 10% or better. Exceptions are coulometry (R11) andDSPO (R14). Coulometry showed fairly poor repeatability throughout the test programme,which is surprising and could not be explained. The huge variation in the DPSO is caused byinsufficient sensitivity and a cross-sensitivity to NO2.
Notes to the following figures:
One outlier was not taken into account for calculationLess then 6 measurements were available for calculation
0
0.1
0.2
0.3
0.4
0.5
0.6
0 200 400 600 800 1000 1200 1400 1600 1800Time t(cycle) [s]
NO
con
vers
ion
[-]
∫
∫−= t
beforeCRT
t
afterCRT
tNO
tNOtConvNO
0
0
)(
)(1)(
full flow through CRT
partial flow through bypass
Figure 6: NO conversion rate as a function of time for all ETC cycles.
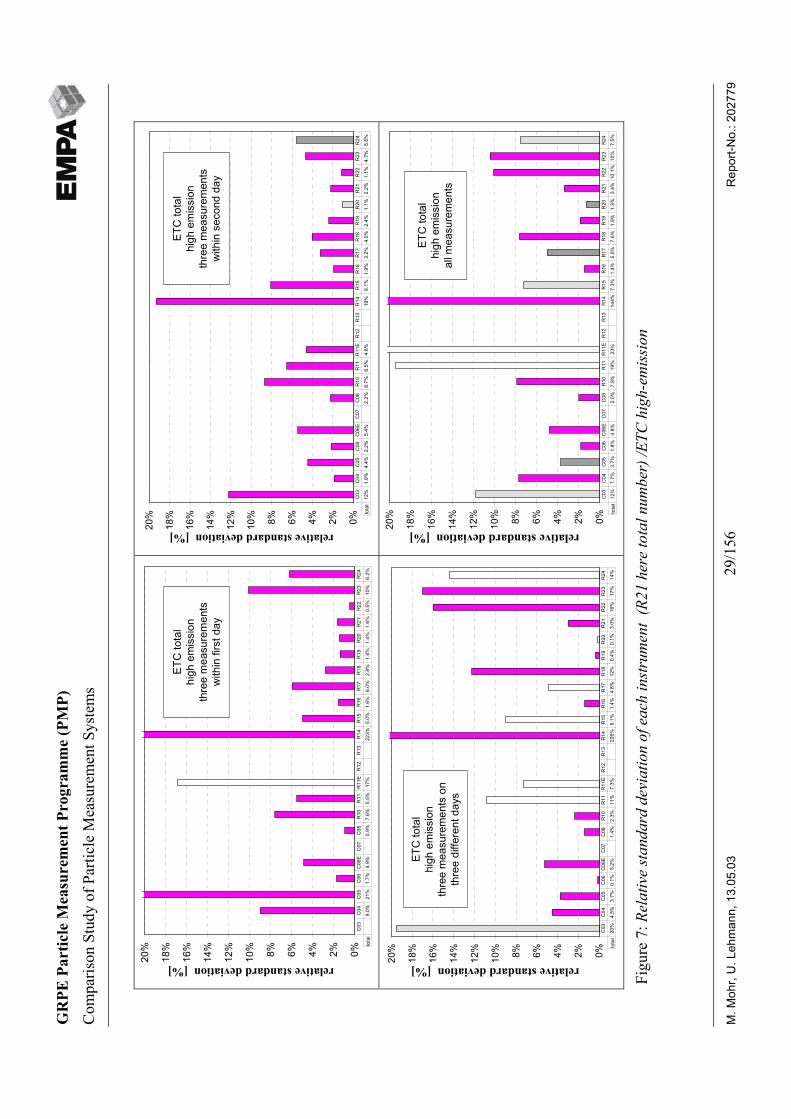
GR
PE P
artic
le M
easu
rem
ent P
rogr
amm
e (P
MP)
Com
paris
on S
tudy
of P
artic
le M
easu
rem
ent S
yste
ms
M. M
ohr,
U. L
ehm
ann,
13.
05.0
329
/156
Rep
ort-N
o.: 2
0277
9
0%2%4%6%8%10%
12%
14%
16%
18%
20%
relative standard deviation [%]
tota
l9.
0%21
%1.
7%4.
9%0.
9%7.
6%5.
5%17
%22
3%5.
0%1.
6%6.
0%2.
8%1.
4%1.
4%1.
6%0.
5%10
%6.
2%C
03C
04C
05C
06C
06E
C07
C08
R10
R11
R11
ER
12R
13R
14R
15R
16R
17R
18R
19R
20R
21R
22R
23R
24
ETC
tota
lhi
gh e
mis
sion
thre
e m
easu
rem
ents
with
in fi
rst d
ay
0%2%4%6%8%10%
12%
14%
16%
18%
20%
relative standard deviation [%]
tota
l12
%1.
9%4.
4%2.
2%5.
4%2.
2%8.
7%6.
5%4.
6%19
%8.
1%1.
9%3.
2%4.
0%2.
4%1.
1%2.
2%1.
1%4.
7%5.
6%C
03C
04C
05C
06C
06E
C07
C08
R10
R11
R11
ER
12R
13R
14R
15R
16R
17R
18R
19R
20R
21R
22R
23R
24
ETC
tota
lhi
gh e
mis
sion
thre
e m
easu
rem
ents
with
in s
econ
d da
y
0%2%4%6%8%10%
12%
14%
16%
18%
20%
relative standard deviation [%]
tota
l20
%4.
5%3.
7%0.
1%5.
2%1.
4%2.
3%11
%7.
3%22
6%9.
1%1.
4%4.
8%12
%0.
4%0.
1%3.
0%16
%17
%14
%C
03C
04C
05C
06C
06E
C07
C08
R10
R11
R11
ER
12R
13R
14R
15R
16R
17R
18R
19R
20R
21R
22R
23R
24
ETC
tota
lhi
gh e
mis
sion
thre
e m
easu
rem
ents
on
thre
e di
ffere
nt d
ays
0%2%4%6%8%10%
12%
14%
16%
18%
20%
relative standard deviation [%]
tota
l12
%7.
7%3.
7%1.
8%4.
8%2.
0%7.
9%19
%23
%14
4%7.
3%1.
4%5.
0%7.
6%1.
9%1.
3%3.
4%10
.1%
10%
7.5%
C03
C04
C05
C06
C06
EC
07C
08R
10R
11R
11E
R12
R13
R14
R15
R16
R17
R18
R19
R20
R21
R22
R23
R24
ETC
tota
lhi
gh e
mis
sion
all m
easu
rem
ents
Figu
re 7
: Rel
ativ
e st
anda
rd d
evia
tion
of e
ach
inst
rum
ent
(R21
her
e to
tal n
umbe
r) /E
TC h
igh-
emis
sion
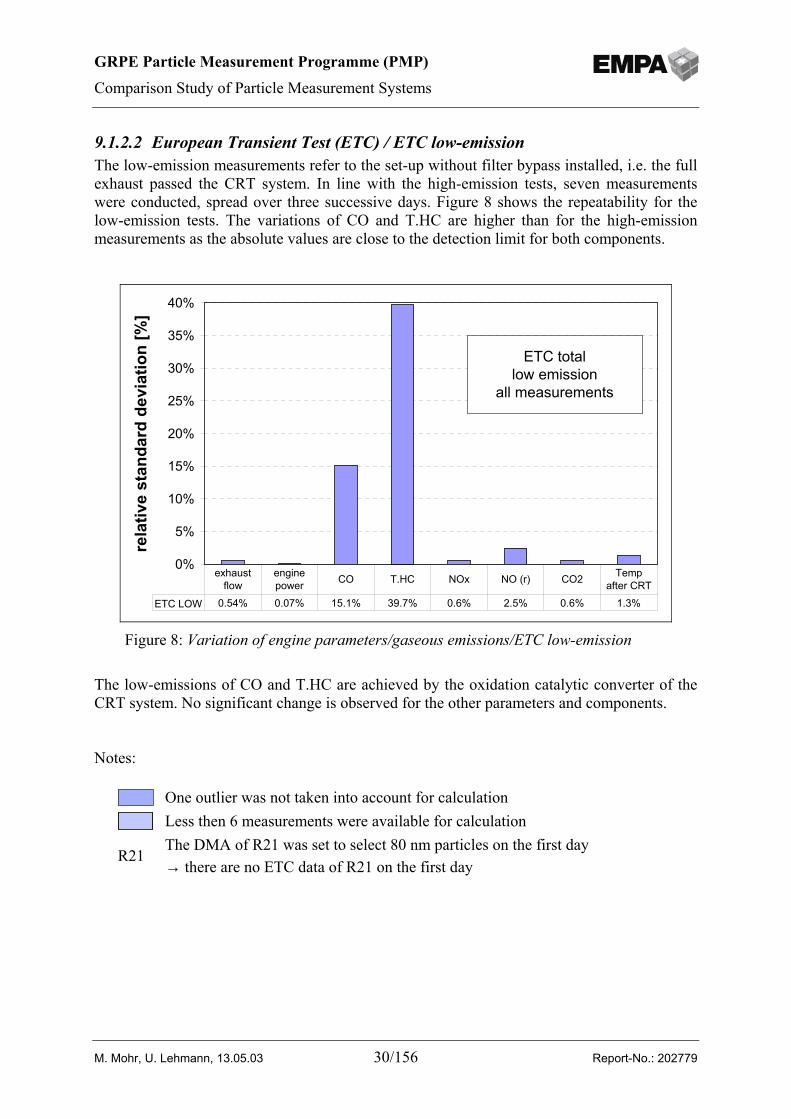
GRPE Particle Measurement Programme (PMP)
Comparison Study of Particle Measurement Systems
M. Mohr, U. Lehmann, 13.05.03 30/156 Report-No.: 202779
9.1.2.2 European Transient Test (ETC) / ETC low-emissionThe low-emission measurements refer to the set-up without filter bypass installed, i.e. the fullexhaust passed the CRT system. In line with the high-emission tests, seven measurementswere conducted, spread over three successive days. Figure 8 shows the repeatability for thelow-emission tests. The variations of CO and T.HC are higher than for the high-emissionmeasurements as the absolute values are close to the detection limit for both components.
The low-emissions of CO and T.HC are achieved by the oxidation catalytic converter of theCRT system. No significant change is observed for the other parameters and components.
Notes:
One outlier was not taken into account for calculationLess then 6 measurements were available for calculation
R21The DMA of R21 was set to select 80 nm particles on the first day→ there are no ETC data of R21 on the first day
0%
5%
10%
15%
20%
25%
30%
35%
40%
rela
tive
stan
dard
dev
iatio
n [%
]
ETC LOW 0.54% 0.07% 15.1% 39.7% 0.6% 2.5% 0.6% 1.3%
exhaust flow
engine power CO T.HC NOx NO (r) CO2 Temp
after CRT
ETC totallow emission
all measurements
Figure 8: Variation of engine parameters/gaseous emissions/ETC low-emission
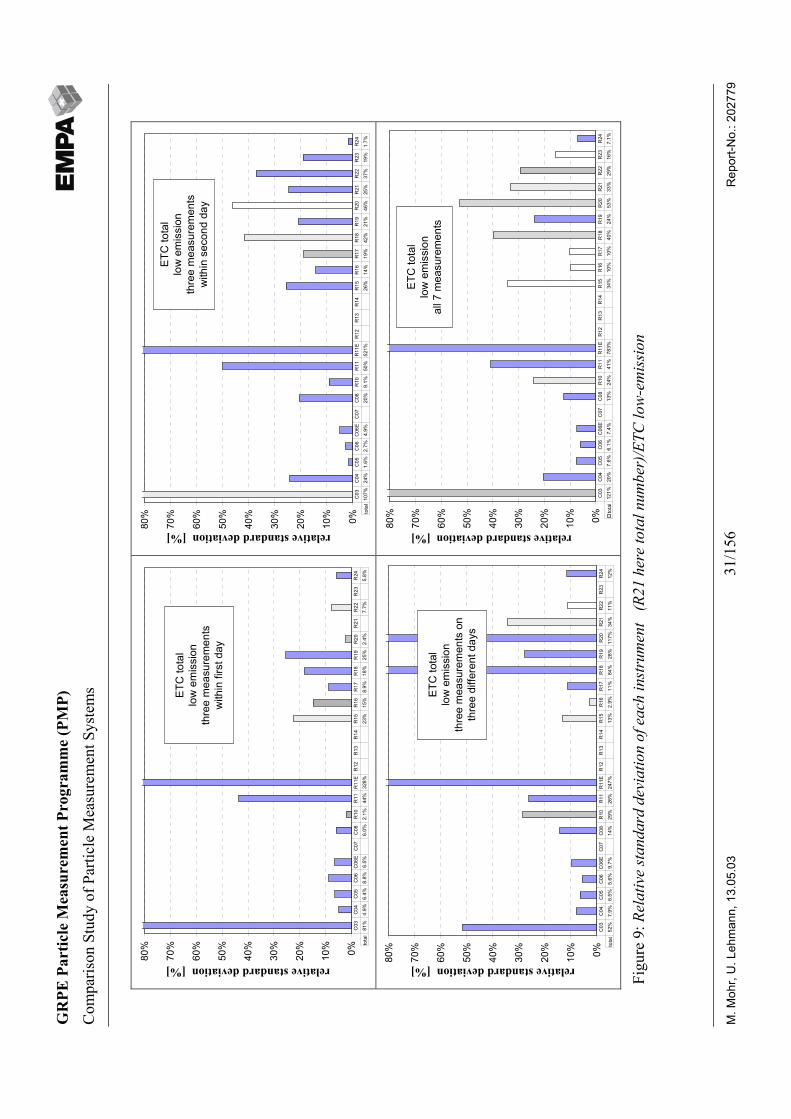
GR
PE P
artic
le M
easu
rem
ent P
rogr
amm
e (P
MP)
Com
paris
on S
tudy
of P
artic
le M
easu
rem
ent S
yste
ms
M. M
ohr,
U. L
ehm
ann,
13.
05.0
331
/156
Rep
ort-N
o.: 2
0277
9
0%10%
20%
30%
40%
50%
60%
70%
80%
relative standard deviation [%]
tota
l81
%4.
9%6.
4%8.
8%6.
5%6.
0%2.
1%44
%32
8%23
%15
%8.
9%18
%25
%2.
4%7.
7%5.
8%C
03C
04C
05C
06C
06E
C07
C08
R10
R11
R11
ER
12R
13R
14R
15R
16R
17R
18R
19R
20R
21R
22R
23R
24
ETC
tota
llo
w e
mis
sion
thre
e m
easu
rem
ents
with
in fi
rst d
ay
0%10%
20%
30%
40%
50%
60%
70%
80%
relative standard deviation [%]
tota
l10
7%24
%1.
6%2.
7%4.
9%20
%9.
1%50
%52
1%26
%14
%19
%42
%21
%46
%25
%37
%19
%1.
7%C
03C
04C
05C
06C
06E
C07
C08
R10
R11
R11
ER
12R
13R
14R
15R
16R
17R
18R
19R
20R
21R
22R
23R
24
ETC
tota
llo
w e
mis
sion
thre
e m
easu
rem
ents
with
in s
econ
d da
y
0%10%
20%
30%
40%
50%
60%
70%
80%
relative standard deviation [%]
tota
l52
%7.
9%6.
5%5.
6%9.
7%14
%29
%26
%24
7%13
%2.
9%11
%84
%28
%11
7%34
%11
%12
%C
03C
04C
05C
06C
06E
C07
C08
R10
R11
R11
ER
12R
13R
14R
15R
16R
17R
18R
19R
20R
21R
22R
23R
24
ETC
tota
llo
w e
mis
sion
thre
e m
easu
rem
ents
on
thre
e di
ffere
nt d
ays
0%10%
20%
30%
40%
50%
60%
70%
80%
relative standard deviation [%]
tota
l12
1%20
%7.
6%6.
1%7.
4%13
%24
%41
%78
3%34
%10
%10
%40
%24
%53
%33
%29
%16
%7.
1%C
03C
04C
05C
06C
06E
C07
C08
R10
R11
R11
ER
12R
13R
14R
15R
16R
17R
18R
19R
20R
21R
22R
23R
24
ETC
tota
llo
w e
mis
sion
all 7
mea
sure
men
ts
Figu
re 9
: Rel
ativ
e st
anda
rd d
evia
tion
of e
ach
inst
rum
ent
(R21
her
e to
tal n
umbe
r)/E
TC lo
w-e
mis
sion
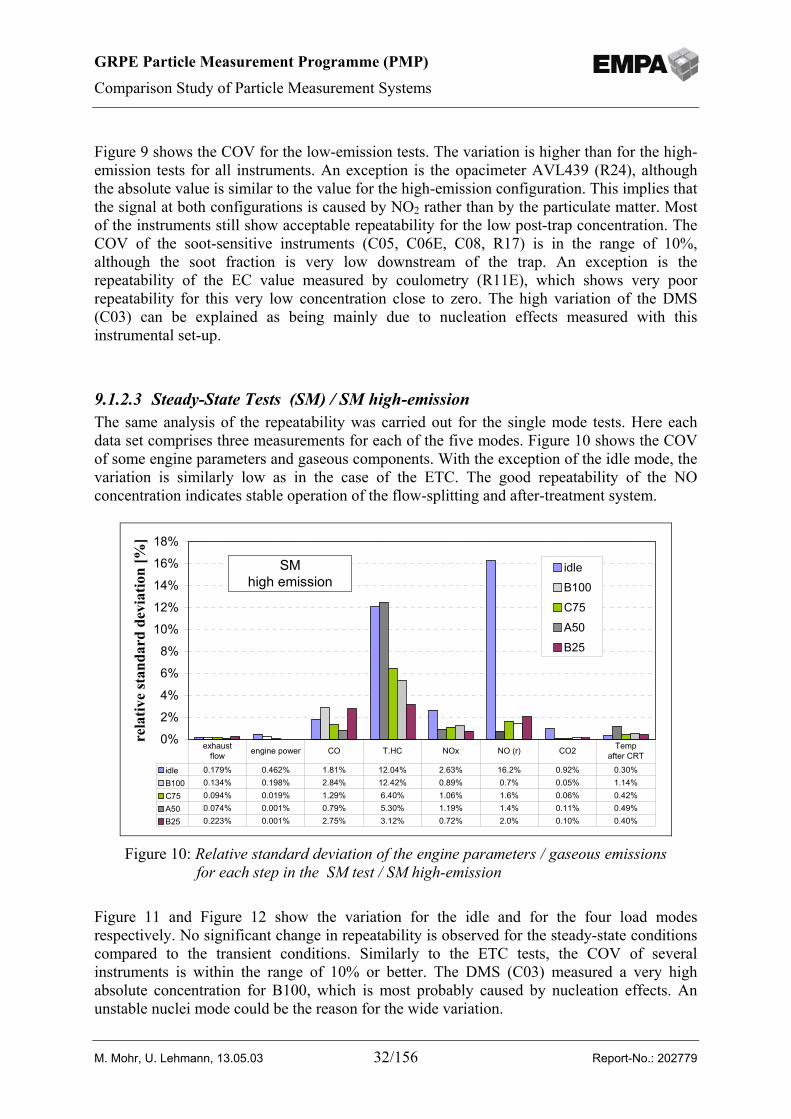
GRPE Particle Measurement Programme (PMP)
Comparison Study of Particle Measurement Systems
M. Mohr, U. Lehmann, 13.05.03 32/156 Report-No.: 202779
Figure 9 shows the COV for the low-emission tests. The variation is higher than for the high-emission tests for all instruments. An exception is the opacimeter AVL439 (R24), althoughthe absolute value is similar to the value for the high-emission configuration. This implies thatthe signal at both configurations is caused by NO2 rather than by the particulate matter. Mostof the instruments still show acceptable repeatability for the low post-trap concentration. TheCOV of the soot-sensitive instruments (C05, C06E, C08, R17) is in the range of 10%,although the soot fraction is very low downstream of the trap. An exception is therepeatability of the EC value measured by coulometry (R11E), which shows very poorrepeatability for this very low concentration close to zero. The high variation of the DMS(C03) can be explained as being mainly due to nucleation effects measured with thisinstrumental set-up.
9.1.2.3 Steady-State Tests (SM) / SM high-emissionThe same analysis of the repeatability was carried out for the single mode tests. Here eachdata set comprises three measurements for each of the five modes. Figure 10 shows the COVof some engine parameters and gaseous components. With the exception of the idle mode, thevariation is similarly low as in the case of the ETC. The good repeatability of the NOconcentration indicates stable operation of the flow-splitting and after-treatment system.
Figure 11 and Figure 12 show the variation for the idle and for the four load modesrespectively. No significant change in repeatability is observed for the steady-state conditionscompared to the transient conditions. Similarly to the ETC tests, the COV of severalinstruments is within the range of 10% or better. The DMS (C03) measured a very highabsolute concentration for B100, which is most probably caused by nucleation effects. Anunstable nuclei mode could be the reason for the wide variation.
0%
2%
4%
6%
8%
10%
12%
14%
16%
18%
rela
tive
stan
dard
dev
iatio
n [%
]
idleB100
C75
A50B25
idle 0.179% 0.462% 1.81% 12.04% 2.63% 16.2% 0.92% 0.30%B100 0.134% 0.198% 2.84% 12.42% 0.89% 0.7% 0.05% 1.14%C75 0.094% 0.019% 1.29% 6.40% 1.06% 1.6% 0.06% 0.42%A50 0.074% 0.001% 0.79% 5.30% 1.19% 1.4% 0.11% 0.49%B25 0.223% 0.001% 2.75% 3.12% 0.72% 2.0% 0.10% 0.40%
exhaust flow engine power CO T.HC NOx NO (r) CO2 Temp
after CRT
SM high emission
Figure 10: Relative standard deviation of the engine parameters / gaseous emissionsfor each step in the SM test / SM high-emission
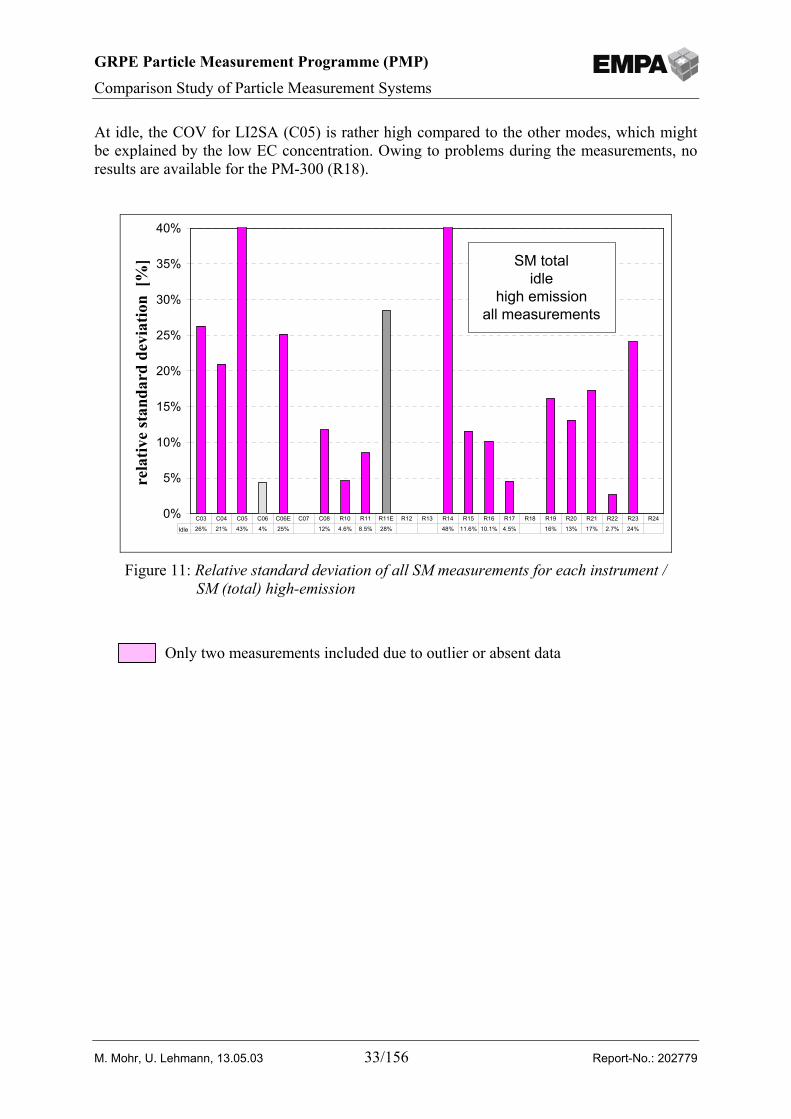
GRPE Particle Measurement Programme (PMP)
Comparison Study of Particle Measurement Systems
M. Mohr, U. Lehmann, 13.05.03 33/156 Report-No.: 202779
At idle, the COV for LI2SA (C05) is rather high compared to the other modes, which mightbe explained by the low EC concentration. Owing to problems during the measurements, noresults are available for the PM-300 (R18).
Only two measurements included due to outlier or absent data
0%
5%
10%
15%
20%
25%
30%
35%
40%
rela
tive
stan
dard
dev
iatio
n [%
]
Idle 26% 21% 43% 4% 25% 12% 4.6% 8.5% 28% 48% 11.6% 10.1% 4.5% 16% 13% 17% 2.7% 24%
C03 C04 C05 C06 C06E C07 C08 R10 R11 R11E R12 R13 R14 R15 R16 R17 R18 R19 R20 R21 R22 R23 R24
SM totalidle
high emissionall measurements
Figure 11: Relative standard deviation of all SM measurements for each instrument /SM (total) high-emission
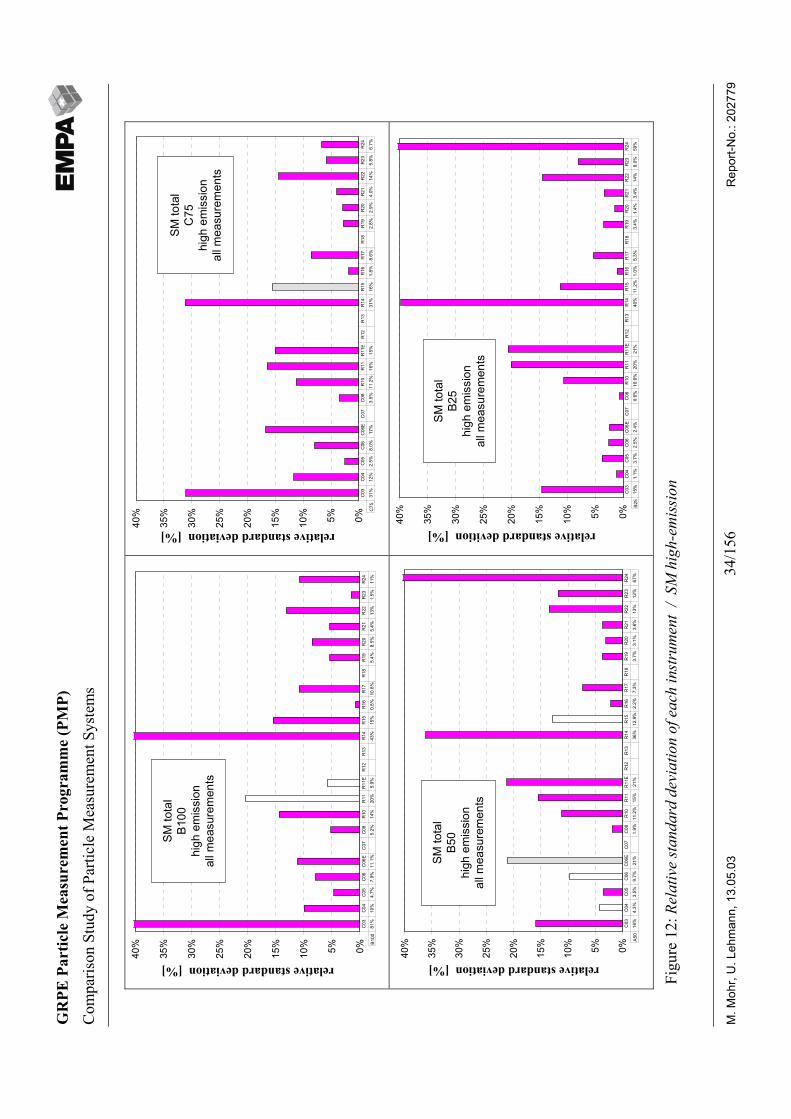
GR
PE P
artic
le M
easu
rem
ent P
rogr
amm
e (P
MP)
Com
paris
on S
tudy
of P
artic
le M
easu
rem
ent S
yste
ms
M. M
ohr,
U. L
ehm
ann,
13.
05.0
334
/156
Rep
ort-N
o.: 2
0277
9
0%5%10%
15%
20%
25%
30%
35%
40%
relative standard deviation [%]
B100
81%
10%
4.7%
7.9%
11.1
%5.
2%14
%20
%5.
9%43
%15
%0.
8%10
.8%
5.4%
8.5%
5.4%
13%
1.5%
11%
C03
C04
C05
C06
C06
EC
07C
08R
10R
11R
11E
R12
R13
R14
R15
R16
R17
R18
R19
R20
R21
R22
R23
R24
SM to
tal
B100
high
em
issi
onal
l mea
sure
men
ts
0%5%10%
15%
20%
25%
30%
35%
40%
relative standard deviation [%]
C75
31%
12%
2.5%
8.0%
17%
3.5%
11.2
%16
%15
%31
%16
%1.
8%8.
6%2.
8%2.
9%4.
0%14
%5.
8%6.
7%
C03
C04
C05
C06
C06
EC
07C
08R
10R
11R
11E
R12
R13
R14
R15
R16
R17
R18
R19
R20
R21
R22
R23
R24
SM to
tal
C75
high
em
issi
onal
l mea
sure
men
ts
0%5%10%
15%
20%
25%
30%
35%
40%
relative standard deviation [%]
A50
16%
4.3%
3.5%
9.7%
21%
1.9%
11.2
%15
%21
%36
%12
.9%
2.2%
7.3%
3.7%
3.1%
3.6%
13%
12%
67%
C03
C04
C05
C06
C06
EC
07C
08R
10R
11R
11E
R12
R13
R14
R15
R16
R17
R18
R19
R20
R21
R22
R23
R24
SM to
tal
B50
high
em
issi
onal
l mea
sure
men
ts
0%5%10%
15%
20%
25%
30%
35%
40%
relative standard devition [%]
B25
15%
1.1%
3.7%
2.5%
2.4%
0.6%
10.6
%20
%21
%40
%11
.2%
1.0%
5.3%
3.4%
1.4%
3.4%
14%
8.0%
59%
C03
C04
C05
C06
C06
EC
07C
08R
10R
11R
11E
R12
R13
R14
R15
R16
R17
R18
R19
R20
R21
R22
R23
R24
SM to
tal
B25
high
em
issi
onal
l mea
sure
men
ts
Figu
re 1
2: R
elat
ive
stan
dard
dev
iatio
n of
eac
h in
stru
men
t /
SM h
igh-
emis
sion
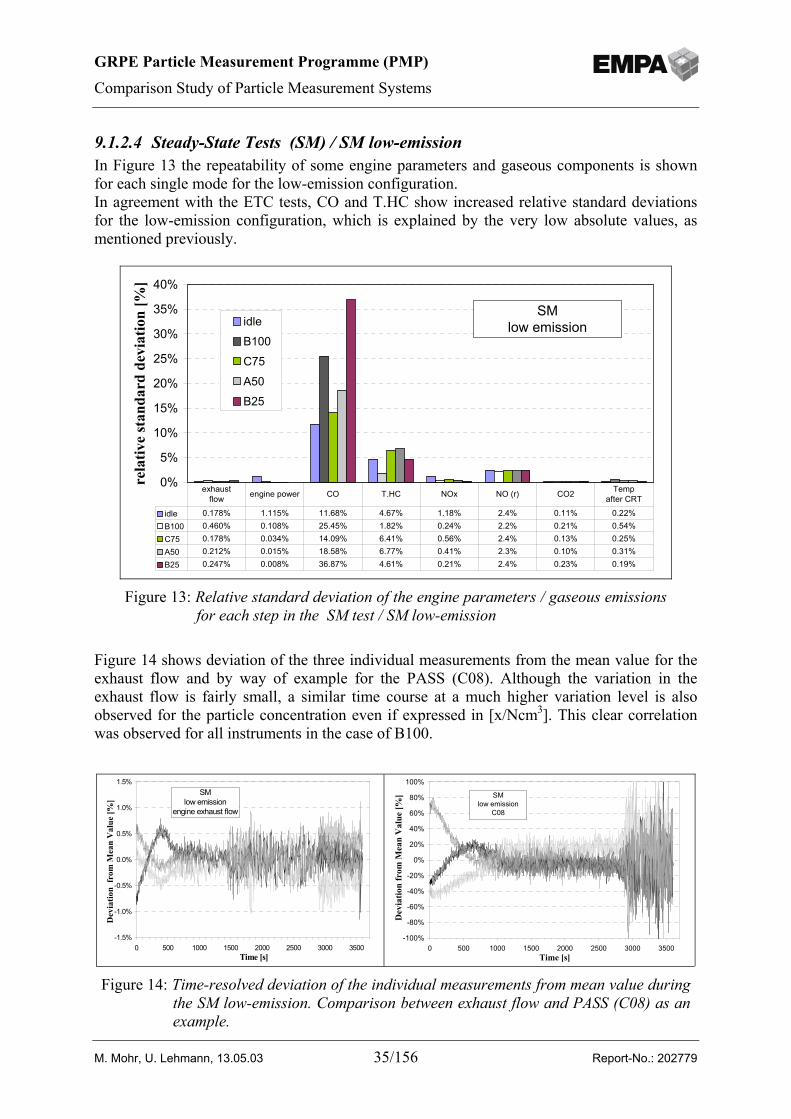
GRPE Particle Measurement Programme (PMP)
Comparison Study of Particle Measurement Systems
M. Mohr, U. Lehmann, 13.05.03 35/156 Report-No.: 202779
9.1.2.4 Steady-State Tests (SM) / SM low-emissionIn Figure 13 the repeatability of some engine parameters and gaseous components is shownfor each single mode for the low-emission configuration.In agreement with the ETC tests, CO and T.HC show increased relative standard deviationsfor the low-emission configuration, which is explained by the very low absolute values, asmentioned previously.
Figure 14 shows deviation of the three individual measurements from the mean value for theexhaust flow and by way of example for the PASS (C08). Although the variation in theexhaust flow is fairly small, a similar time course at a much higher variation level is alsoobserved for the particle concentration even if expressed in [x/Ncm3]. This clear correlationwas observed for all instruments in the case of B100.
0%
5%
10%
15%
20%
25%
30%
35%
40%
rela
tive
stan
dard
dev
iatio
n [%
]
idleB100
C75
A50B25
idle 0.178% 1.115% 11.68% 4.67% 1.18% 2.4% 0.11% 0.22%B100 0.460% 0.108% 25.45% 1.82% 0.24% 2.2% 0.21% 0.54%C75 0.178% 0.034% 14.09% 6.41% 0.56% 2.4% 0.13% 0.25%A50 0.212% 0.015% 18.58% 6.77% 0.41% 2.3% 0.10% 0.31%B25 0.247% 0.008% 36.87% 4.61% 0.21% 2.4% 0.23% 0.19%
exhaust flow engine power CO T.HC NOx NO (r) CO2 Temp
after CRT
SM low emission
Figure 13: Relative standard deviation of the engine parameters / gaseous emissionsfor each step in the SM test / SM low-emission
-1.5%
-1.0%
-0.5%
0.0%
0.5%
1.0%
1.5%
0 500 1000 1500 2000 2500 3000 3500Time [s]
Dev
iatio
n fr
om M
ean
Val
ue [%
]
SM low emission
engine exhaust flow
-100%
-80%
-60%
-40%
-20%
0%
20%
40%
60%
80%
100%
0 500 1000 1500 2000 2500 3000 3500Time [s]
Dev
iatio
n fr
om M
ean
Val
ue [%
] SMlow emission
C08
Figure 14: Time-resolved deviation of the individual measurements from mean value duringthe SM low-emission. Comparison between exhaust flow and PASS (C08) as anexample.
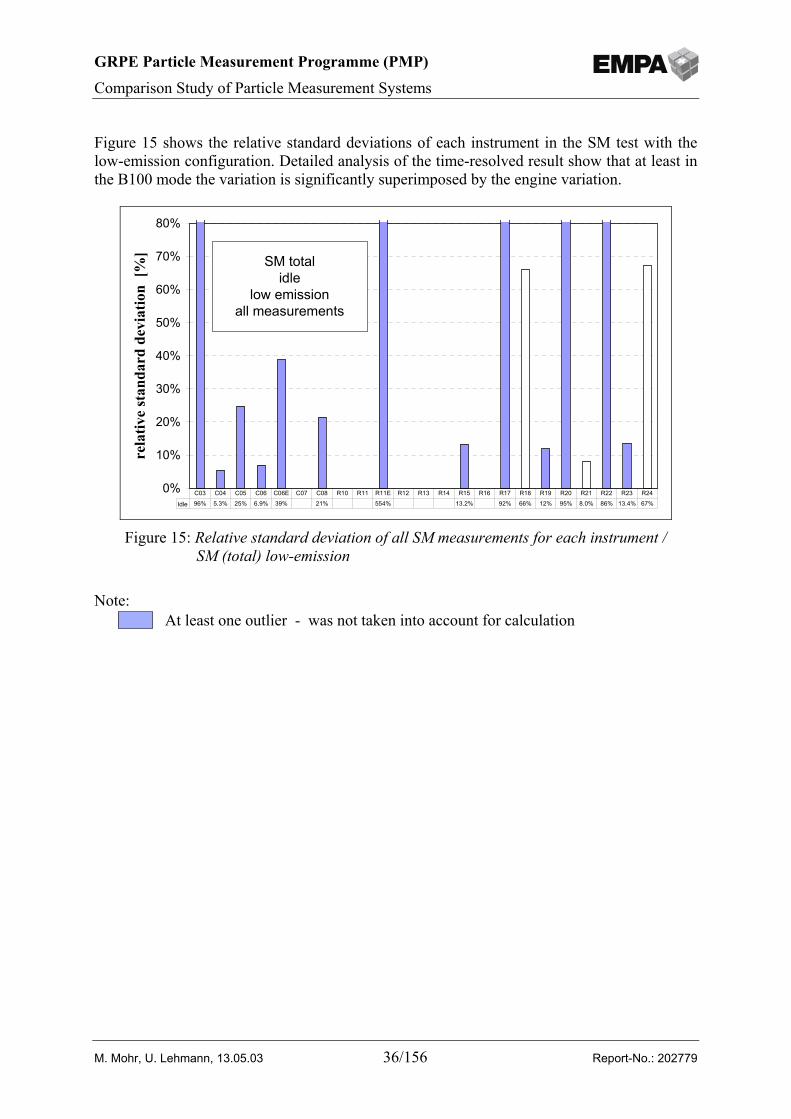
GRPE Particle Measurement Programme (PMP)
Comparison Study of Particle Measurement Systems
M. Mohr, U. Lehmann, 13.05.03 36/156 Report-No.: 202779
Figure 15 shows the relative standard deviations of each instrument in the SM test with thelow-emission configuration. Detailed analysis of the time-resolved result show that at least inthe B100 mode the variation is significantly superimposed by the engine variation.
Note:At least one outlier - was not taken into account for calculation
0%
10%
20%
30%
40%
50%
60%
70%
80%
rela
tive
stan
dard
dev
iatio
n [%
]
Idle 96% 5.3% 25% 6.9% 39% 21% 554% 13.2% 92% 66% 12% 95% 8.0% 86% 13.4% 67%C03 C04 C05 C06 C06E C07 C08 R10 R11 R11E R12 R13 R14 R15 R16 R17 R18 R19 R20 R21 R22 R23 R24
SM totalidle
low emissionall measurements
Figure 15: Relative standard deviation of all SM measurements for each instrument /SM (total) low-emission
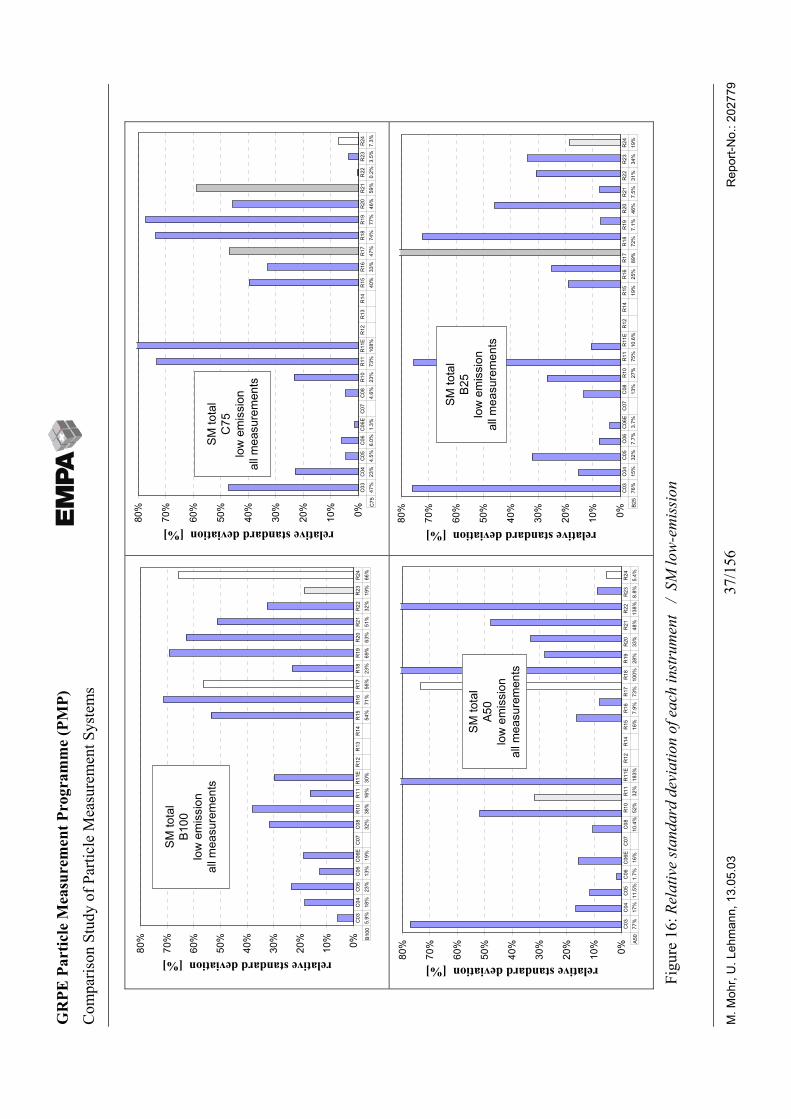
GR
PE P
artic
le M
easu
rem
ent P
rogr
amm
e (P
MP)
Com
paris
on S
tudy
of P
artic
le M
easu
rem
ent S
yste
ms
M. M
ohr,
U. L
ehm
ann,
13.
05.0
337
/156
Rep
ort-N
o.: 2
0277
9
0%10%
20%
30%
40%
50%
60%
70%
80%
relative standard deviation [%]
B100
5.9%
18%
23%
13%
19%
32%
38%
16%
30%
54%
71%
56%
23%
69%
63%
51%
32%
19%
66%
C03
C04
C05
C06
C06
EC
07C
08R
10R
11R
11E
R12
R13
R14
R15
R16
R17
R18
R19
R20
R21
R22
R23
R24
SM to
tal
B100
low
em
issi
onal
l mea
sure
men
ts
0%10%
20%
30%
40%
50%
60%
70%
80%
relative standard deviation [%]
C75
47%
23%
4.5%
6.0%
1.3%
4.6%
23%
73%
108%
40%
33%
47%
74%
77%
46%
59%
0.2%
3.5%
7.3%
C03
C04
C05
C06
C06
EC
07C
08R
10R
11R
11E
R12
R13
R14
R15
R16
R17
R18
R19
R20
R21
R22
R23
R24
SM to
tal
C75
low
em
issi
onal
l mea
sure
men
ts
0%10%
20%
30%
40%
50%
60%
70%
80%
relative standard deviation [%]
A50
77%
17%
11.5
%1.
7%16
%10
.4%
52%
32%
183%
16%
7.9%
73%
100%
28%
33%
48%
138%
8.8%
5.4%
C03
C04
C05
C06
C06
EC
07C
08R
10R
11R
11E
R12
R14
R15
R16
R17
R18
R19
R20
R21
R22
R23
R24
SM to
tal
A50
low
em
issi
onal
l mea
sure
men
ts
0%10%
20%
30%
40%
50%
60%
70%
80%
relative standard deviation [%]
B25
76%
15%
32%
7.7%
3.7%
13%
27%
75%
10.6
%19
%25
%89
%72
%7.
1%46
%7.
5%31
%34
%19
%C
03C
04C
05C
06C
06E
C07
C08
R10
R11
R11
ER
12R
14R
15R
16R
17R
18R
19R
20R
21R
22R
23R
24
SM to
tal
B25
low
em
issi
onal
l mea
sure
men
ts
Figu
re 1
6: R
elat
ive
stan
dard
dev
iatio
n of
eac
h in
stru
men
t /
SM
low
-em
issi
on
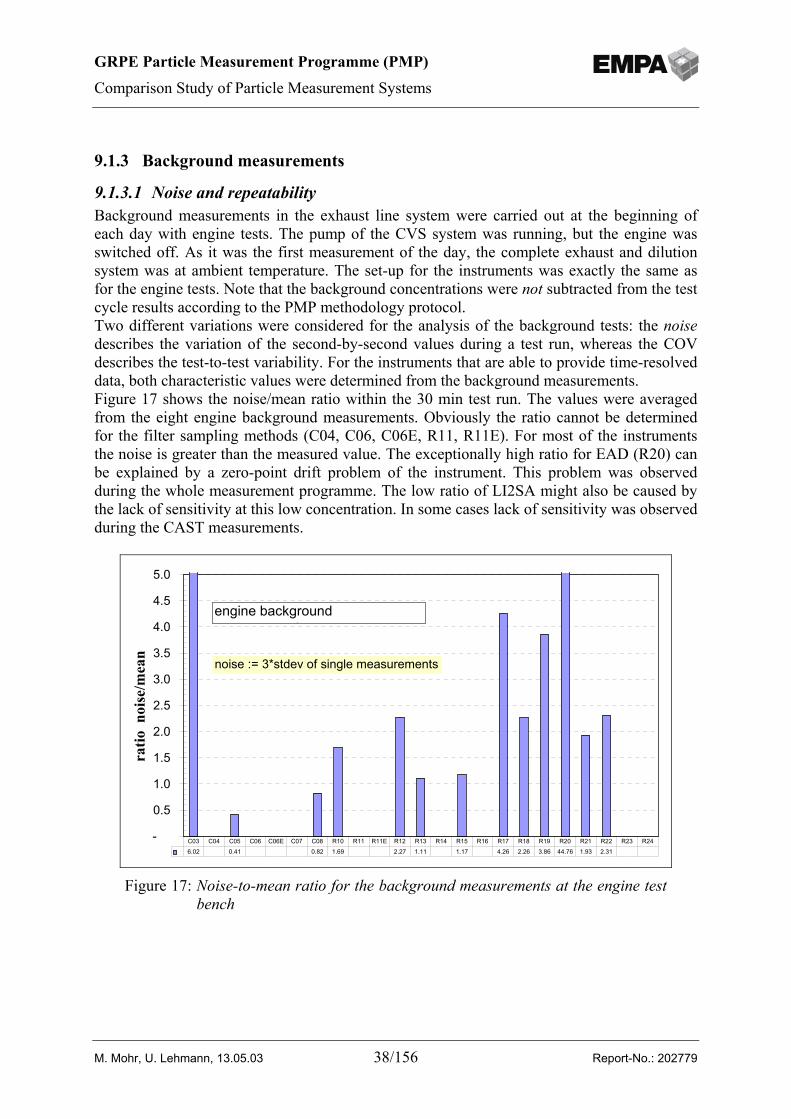
GRPE Particle Measurement Programme (PMP)
Comparison Study of Particle Measurement Systems
M. Mohr, U. Lehmann, 13.05.03 38/156 Report-No.: 202779
9.1.3 Background measurements
9.1.3.1 Noise and repeatabilityBackground measurements in the exhaust line system were carried out at the beginning ofeach day with engine tests. The pump of the CVS system was running, but the engine wasswitched off. As it was the first measurement of the day, the complete exhaust and dilutionsystem was at ambient temperature. The set-up for the instruments was exactly the same asfor the engine tests. Note that the background concentrations were not subtracted from the testcycle results according to the PMP methodology protocol.Two different variations were considered for the analysis of the background tests: the noisedescribes the variation of the second-by-second values during a test run, whereas the COVdescribes the test-to-test variability. For the instruments that are able to provide time-resolveddata, both characteristic values were determined from the background measurements.Figure 17 shows the noise/mean ratio within the 30 min test run. The values were averagedfrom the eight engine background measurements. Obviously the ratio cannot be determinedfor the filter sampling methods (C04, C06, C06E, R11, R11E). For most of the instrumentsthe noise is greater than the measured value. The exceptionally high ratio for EAD (R20) canbe explained by a zero-point drift problem of the instrument. This problem was observedduring the whole measurement programme. The low ratio of LI2SA might also be caused bythe lack of sensitivity at this low concentration. In some cases lack of sensitivity was observedduring the CAST measurements.
-
0.5
1.0
1.5
2.0
2.5
3.0
3.5
4.0
4.5
5.0
ratio
noi
se/m
ean
6.02 0.41 0.82 1.69 2.27 1.11 1.17 4.26 2.26 3.86 44.76 1.93 2.31 C03 C04 C05 C06 C06E C07 C08 R10 R11 R11E R12 R13 R14 R15 R16 R17 R18 R19 R20 R21 R22 R23 R24
engine background t
noise := 3*stdev of single measurements
Figure 17: Noise-to-mean ratio for the background measurements at the engine testbench
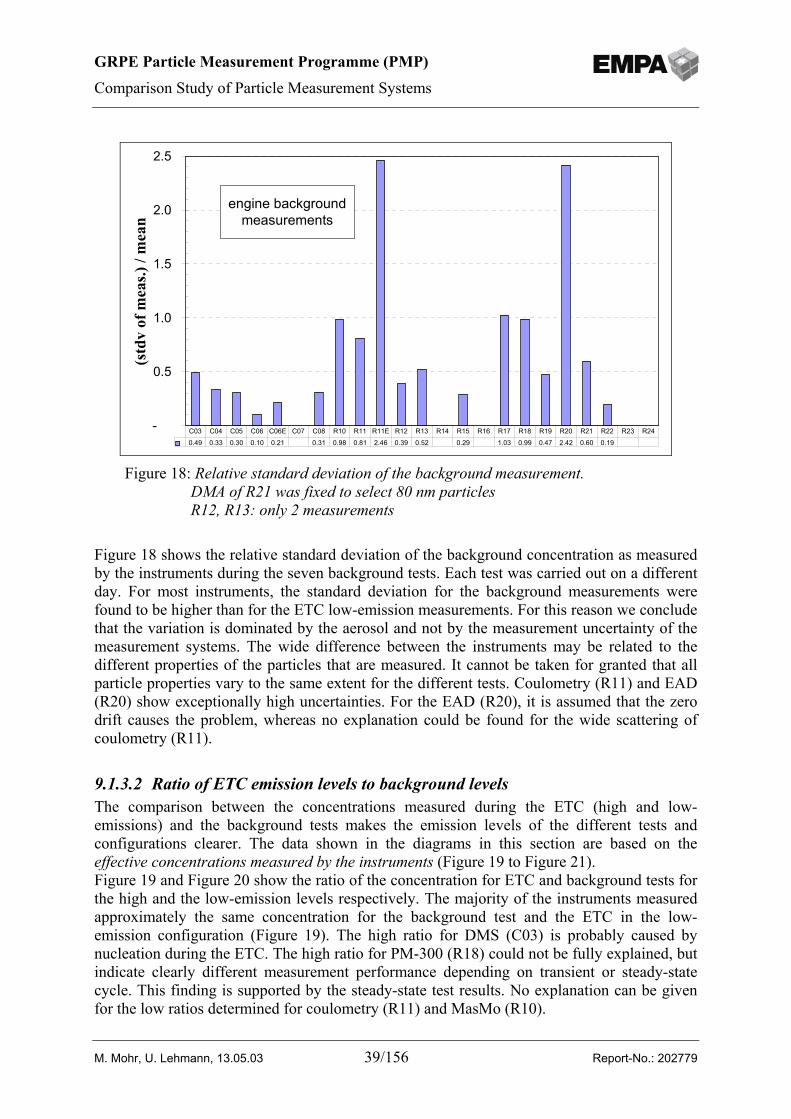
GRPE Particle Measurement Programme (PMP)
Comparison Study of Particle Measurement Systems
M. Mohr, U. Lehmann, 13.05.03 39/156 Report-No.: 202779
Figure 18 shows the relative standard deviation of the background concentration as measuredby the instruments during the seven background tests. Each test was carried out on a differentday. For most instruments, the standard deviation for the background measurements werefound to be higher than for the ETC low-emission measurements. For this reason we concludethat the variation is dominated by the aerosol and not by the measurement uncertainty of themeasurement systems. The wide difference between the instruments may be related to thedifferent properties of the particles that are measured. It cannot be taken for granted that allparticle properties vary to the same extent for the different tests. Coulometry (R11) and EAD(R20) show exceptionally high uncertainties. For the EAD (R20), it is assumed that the zerodrift causes the problem, whereas no explanation could be found for the wide scattering ofcoulometry (R11).
9.1.3.2 Ratio of ETC emission levels to background levelsThe comparison between the concentrations measured during the ETC (high and low-emissions) and the background tests makes the emission levels of the different tests andconfigurations clearer. The data shown in the diagrams in this section are based on theeffective concentrations measured by the instruments (Figure 19 to Figure 21).Figure 19 and Figure 20 show the ratio of the concentration for ETC and background tests forthe high and the low-emission levels respectively. The majority of the instruments measuredapproximately the same concentration for the background test and the ETC in the low-emission configuration (Figure 19). The high ratio for DMS (C03) is probably caused bynucleation during the ETC. The high ratio for PM-300 (R18) could not be fully explained, butindicate clearly different measurement performance depending on transient or steady-statecycle. This finding is supported by the steady-state test results. No explanation can be givenfor the low ratios determined for coulometry (R11) and MasMo (R10).
-
0.5
1.0
1.5
2.0
2.5(s
tdv
of m
eas.)
/ m
ean
0.49 0.33 0.30 0.10 0.21 0.31 0.98 0.81 2.46 0.39 0.52 0.29 1.03 0.99 0.47 2.42 0.60 0.19 C03 C04 C05 C06 C06E C07 C08 R10 R11 R11E R12 R13 R14 R15 R16 R17 R18 R19 R20 R21 R22 R23 R24
engine background measurements
Figure 18: Relative standard deviation of the background measurement.DMA of R21 was fixed to select 80 nm particlesR12, R13: only 2 measurements
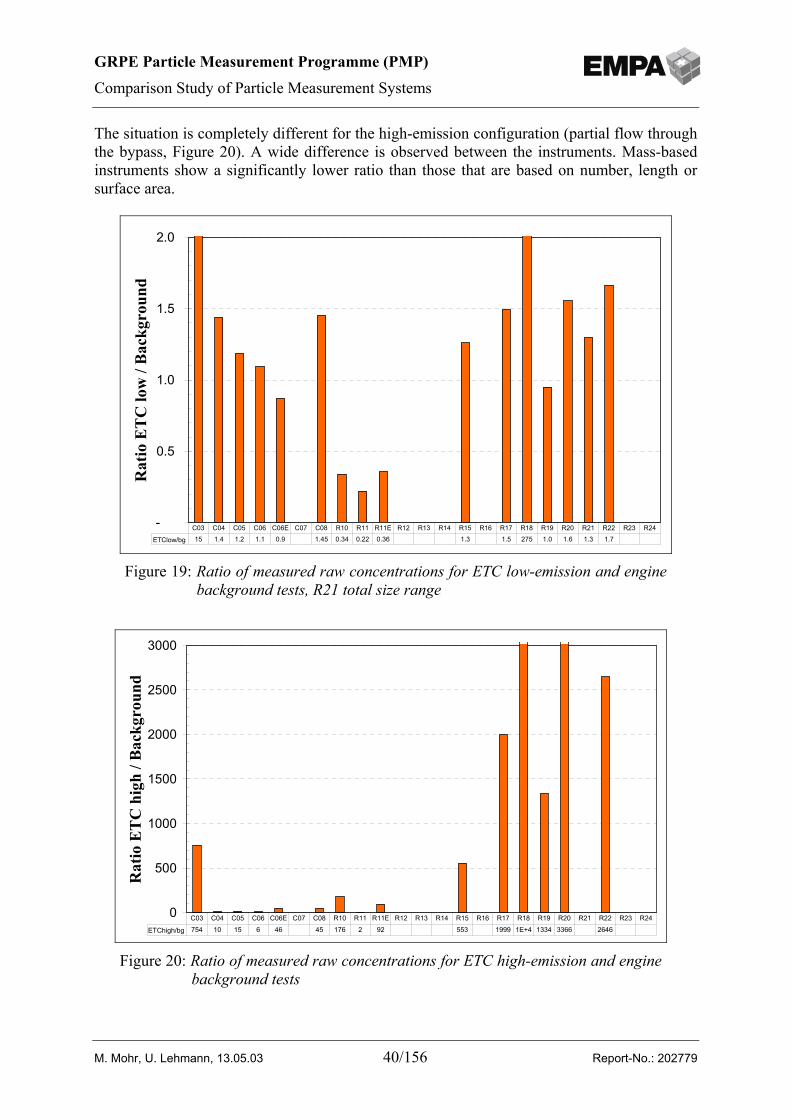
GRPE Particle Measurement Programme (PMP)
Comparison Study of Particle Measurement Systems
M. Mohr, U. Lehmann, 13.05.03 40/156 Report-No.: 202779
The situation is completely different for the high-emission configuration (partial flow throughthe bypass, Figure 20). A wide difference is observed between the instruments. Mass-basedinstruments show a significantly lower ratio than those that are based on number, length orsurface area.
-
0.5
1.0
1.5
2.0
Rat
io E
TC
low
/ B
ackg
roun
d
ETClow/bg 15 1.4 1.2 1.1 0.9 1.45 0.34 0.22 0.36 1.3 1.5 275 1.0 1.6 1.3 1.7 C03 C04 C05 C06 C06E C07 C08 R10 R11 R11E R12 R13 R14 R15 R16 R17 R18 R19 R20 R21 R22 R23 R24
Figure 19: Ratio of measured raw concentrations for ETC low-emission and enginebackground tests, R21 total size range
0
500
1000
1500
2000
2500
3000
Rat
io E
TC
hig
h / B
ackg
roun
d
ETChigh/bg 754 10 15 6 46 45 176 2 92 553 1999 1E+4 1334 3366 2646C03 C04 C05 C06 C06E C07 C08 R10 R11 R11E R12 R13 R14 R15 R16 R17 R18 R19 R20 R21 R22 R23 R24
Figure 20: Ratio of measured raw concentrations for ETC high-emission and enginebackground tests
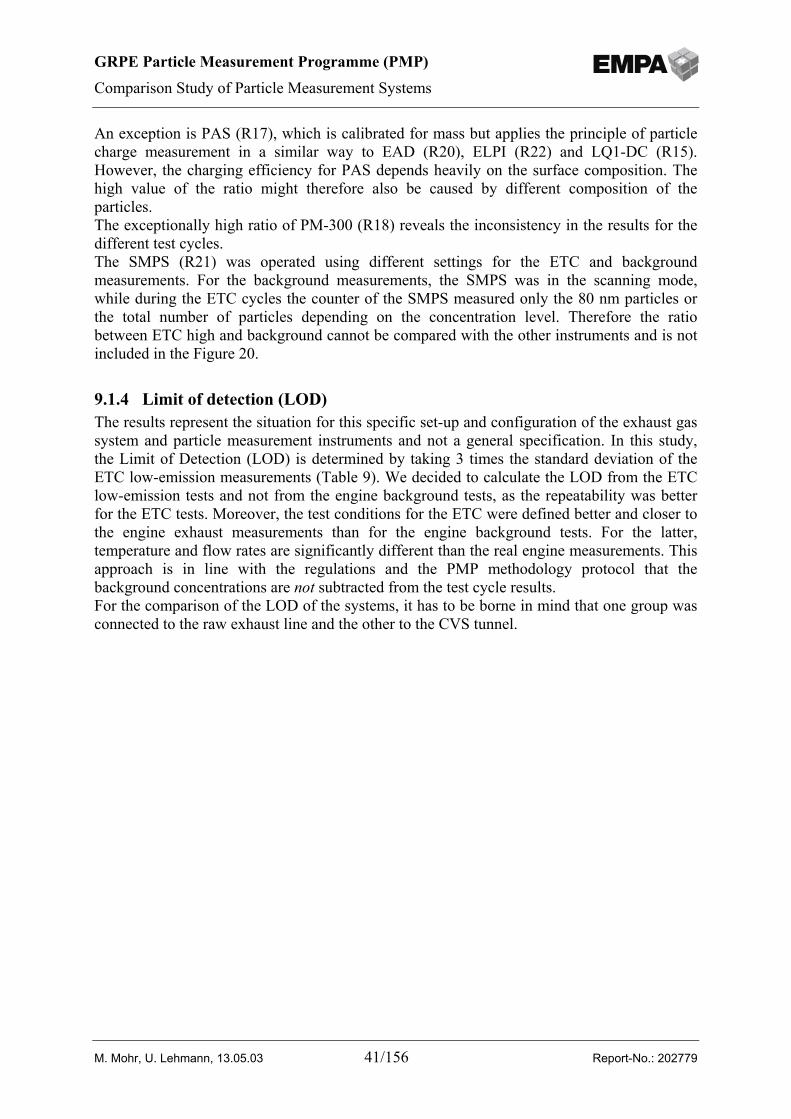
GRPE Particle Measurement Programme (PMP)
Comparison Study of Particle Measurement Systems
M. Mohr, U. Lehmann, 13.05.03 41/156 Report-No.: 202779
An exception is PAS (R17), which is calibrated for mass but applies the principle of particlecharge measurement in a similar way to EAD (R20), ELPI (R22) and LQ1-DC (R15).However, the charging efficiency for PAS depends heavily on the surface composition. Thehigh value of the ratio might therefore also be caused by different composition of theparticles.The exceptionally high ratio of PM-300 (R18) reveals the inconsistency in the results for thedifferent test cycles.The SMPS (R21) was operated using different settings for the ETC and backgroundmeasurements. For the background measurements, the SMPS was in the scanning mode,while during the ETC cycles the counter of the SMPS measured only the 80 nm particles orthe total number of particles depending on the concentration level. Therefore the ratiobetween ETC high and background cannot be compared with the other instruments and is notincluded in the Figure 20.
9.1.4 Limit of detection (LOD)The results represent the situation for this specific set-up and configuration of the exhaust gassystem and particle measurement instruments and not a general specification. In this study,the Limit of Detection (LOD) is determined by taking 3 times the standard deviation of theETC low-emission measurements (Table 9). We decided to calculate the LOD from the ETClow-emission tests and not from the engine background tests, as the repeatability was betterfor the ETC tests. Moreover, the test conditions for the ETC were defined better and closer tothe engine exhaust measurements than for the engine background tests. For the latter,temperature and flow rates are significantly different than the real engine measurements. Thisapproach is in line with the regulations and the PMP methodology protocol that thebackground concentrations are not subtracted from the test cycle results.For the comparison of the LOD of the systems, it has to be borne in mind that one group wasconnected to the raw exhaust line and the other to the CVS tunnel.
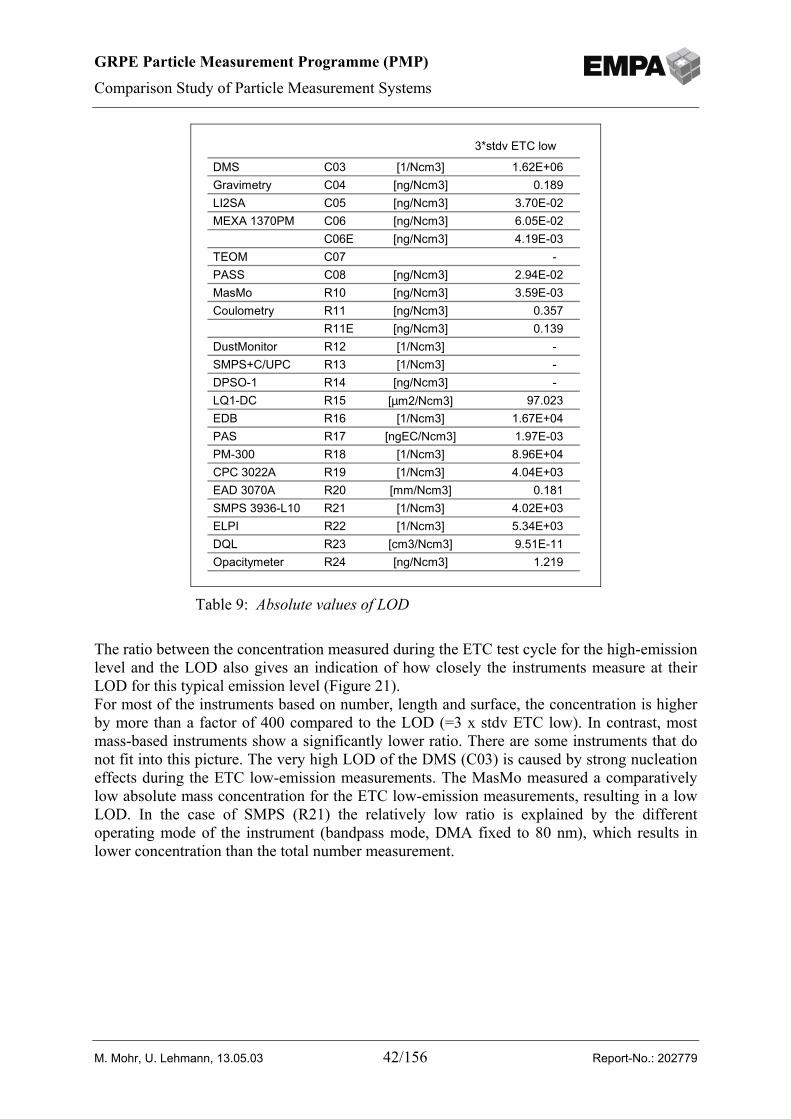
GRPE Particle Measurement Programme (PMP)
Comparison Study of Particle Measurement Systems
M. Mohr, U. Lehmann, 13.05.03 42/156 Report-No.: 202779
The ratio between the concentration measured during the ETC test cycle for the high-emissionlevel and the LOD also gives an indication of how closely the instruments measure at theirLOD for this typical emission level (Figure 21).For most of the instruments based on number, length and surface, the concentration is higherby more than a factor of 400 compared to the LOD (=3 x stdv ETC low). In contrast, mostmass-based instruments show a significantly lower ratio. There are some instruments that donot fit into this picture. The very high LOD of the DMS (C03) is caused by strong nucleationeffects during the ETC low-emission measurements. The MasMo measured a comparativelylow absolute mass concentration for the ETC low-emission measurements, resulting in a lowLOD. In the case of SMPS (R21) the relatively low ratio is explained by the differentoperating mode of the instrument (bandpass mode, DMA fixed to 80 nm), which results inlower concentration than the total number measurement.
3*stdv ETC low
DMS C03 [1/Ncm3] 1.62E+06 Gravimetry C04 [ng/Ncm3] 0.189 LI2SA C05 [ng/Ncm3] 3.70E-02 MEXA 1370PM C06 [ng/Ncm3] 6.05E-02
C06E [ng/Ncm3] 4.19E-03 TEOM C07 - PASS C08 [ng/Ncm3] 2.94E-02 MasMo R10 [ng/Ncm3] 3.59E-03 Coulometry R11 [ng/Ncm3] 0.357
R11E [ng/Ncm3] 0.139 DustMonitor R12 [1/Ncm3] - SMPS+C/UPC R13 [1/Ncm3] - DPSO-1 R14 [ng/Ncm3] - LQ1-DC R15 [µm2/Ncm3] 97.023 EDB R16 [1/Ncm3] 1.67E+04 PAS R17 [ngEC/Ncm3] 1.97E-03 PM-300 R18 [1/Ncm3] 8.96E+04 CPC 3022A R19 [1/Ncm3] 4.04E+03 EAD 3070A R20 [mm/Ncm3] 0.181 SMPS 3936-L10 R21 [1/Ncm3] 4.02E+03 ELPI R22 [1/Ncm3] 5.34E+03 DQL R23 [cm3/Ncm3] 9.51E-11 Opacitymeter R24 [ng/Ncm3] 1.219
Table 9: Absolute values of LOD
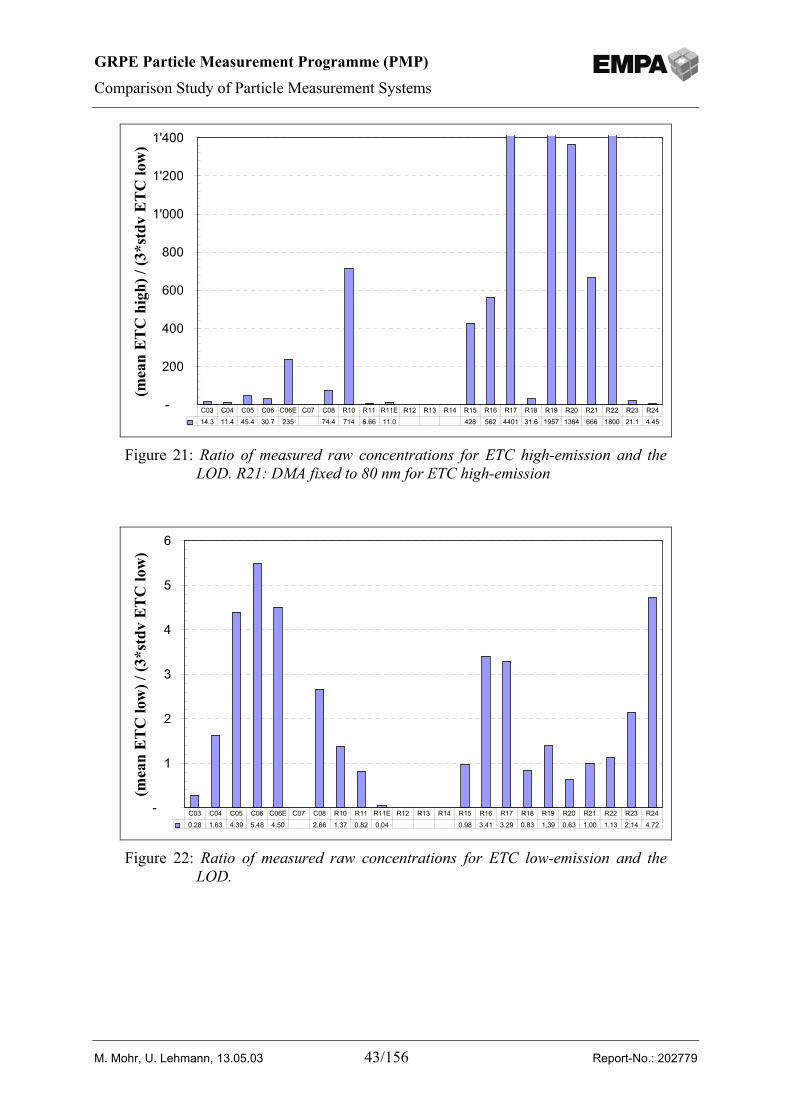
GRPE Particle Measurement Programme (PMP)
Comparison Study of Particle Measurement Systems
M. Mohr, U. Lehmann, 13.05.03 43/156 Report-No.: 202779
-
200
400
600
800
1'000
1'200
1'400(m
ean
ET
C h
igh)
/ (3
*std
v E
TC
low
)
14.3 11.4 45.4 30.7 235 74.4 714 6.66 11.0 428 562 4401 31.6 1957 1364 666 1800 21.1 4.45C03 C04 C05 C06 C06E C07 C08 R10 R11 R11E R12 R13 R14 R15 R16 R17 R18 R19 R20 R21 R22 R23 R24
Figure 21: Ratio of measured raw concentrations for ETC high-emission and theLOD. R21: DMA fixed to 80 nm for ETC high-emission
-
1
2
3
4
5
6
(mea
n E
TC
low
) / (3
*std
v E
TC
low
)
0.28 1.63 4.39 5.48 4.50 2.66 1.37 0.82 0.04 0.98 3.41 3.29 0.83 1.39 0.63 1.00 1.13 2.14 4.72C03 C04 C05 C06 C06E C07 C08 R10 R11 R11E R12 R13 R14 R15 R16 R17 R18 R19 R20 R21 R22 R23 R24
Figure 22: Ratio of measured raw concentrations for ETC low-emission and theLOD.
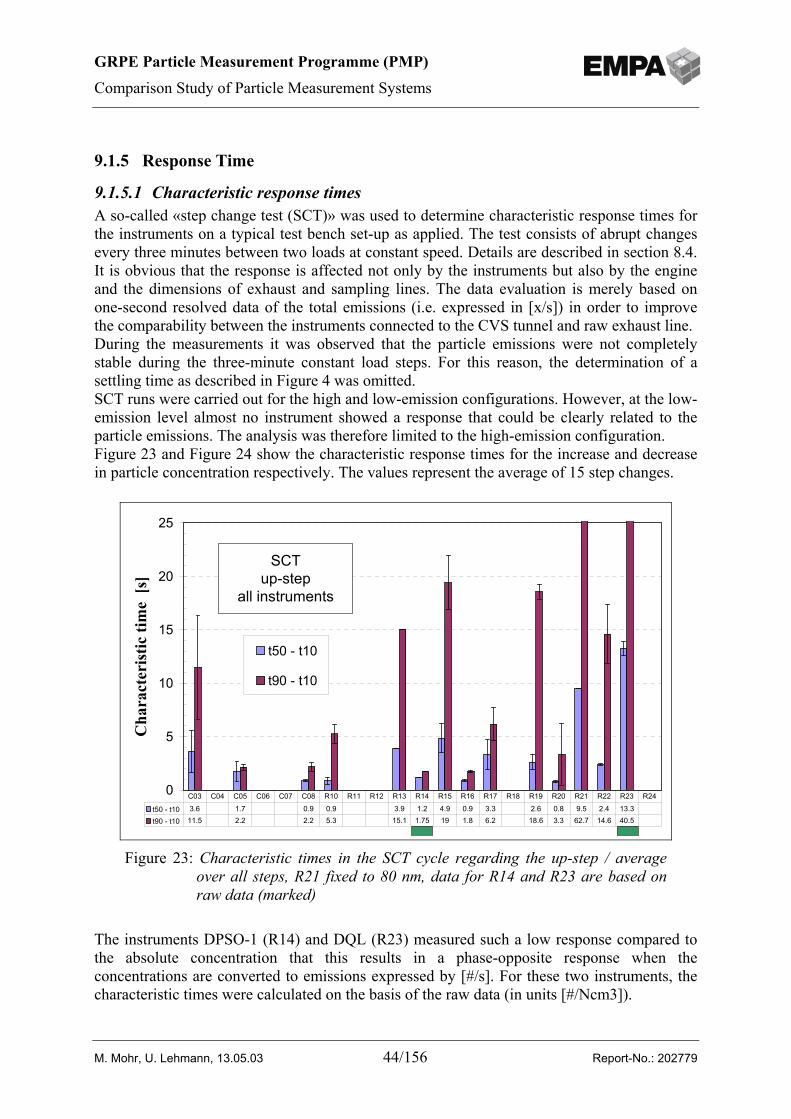
GRPE Particle Measurement Programme (PMP)
Comparison Study of Particle Measurement Systems
M. Mohr, U. Lehmann, 13.05.03 44/156 Report-No.: 202779
9.1.5 Response Time
9.1.5.1 Characteristic response timesA so-called «step change test (SCT)» was used to determine characteristic response times forthe instruments on a typical test bench set-up as applied. The test consists of abrupt changesevery three minutes between two loads at constant speed. Details are described in section 8.4.It is obvious that the response is affected not only by the instruments but also by the engineand the dimensions of exhaust and sampling lines. The data evaluation is merely based onone-second resolved data of the total emissions (i.e. expressed in [x/s]) in order to improvethe comparability between the instruments connected to the CVS tunnel and raw exhaust line.During the measurements it was observed that the particle emissions were not completelystable during the three-minute constant load steps. For this reason, the determination of asettling time as described in Figure 4 was omitted.SCT runs were carried out for the high and low-emission configurations. However, at the low-emission level almost no instrument showed a response that could be clearly related to theparticle emissions. The analysis was therefore limited to the high-emission configuration.Figure 23 and Figure 24 show the characteristic response times for the increase and decreasein particle concentration respectively. The values represent the average of 15 step changes.
The instruments DPSO-1 (R14) and DQL (R23) measured such a low response compared tothe absolute concentration that this results in a phase-opposite response when theconcentrations are converted to emissions expressed by [#/s]. For these two instruments, thecharacteristic times were calculated on the basis of the raw data (in units [#/Ncm3]).
0
5
10
15
20
25
Cha
ract
eris
tic ti
me
[s]
t50 - t10
t90 - t10
t50 - t10 3.6 1.7 0.9 0.9 3.9 1.2 4.9 0.9 3.3 2.6 0.8 9.5 2.4 13.3t90 - t10 11.5 2.2 2.2 5.3 15.1 1.75 19 1.8 6.2 18.6 3.3 62.7 14.6 40.5
C03 C04 C05 C06 C07 C08 R10 R11 R12 R13 R14 R15 R16 R17 R18 R19 R20 R21 R22 R23 R24
SCT up-step
all instruments
Figure 23: Characteristic times in the SCT cycle regarding the up-step / averageover all steps, R21 fixed to 80 nm, data for R14 and R23 are based onraw data (marked)
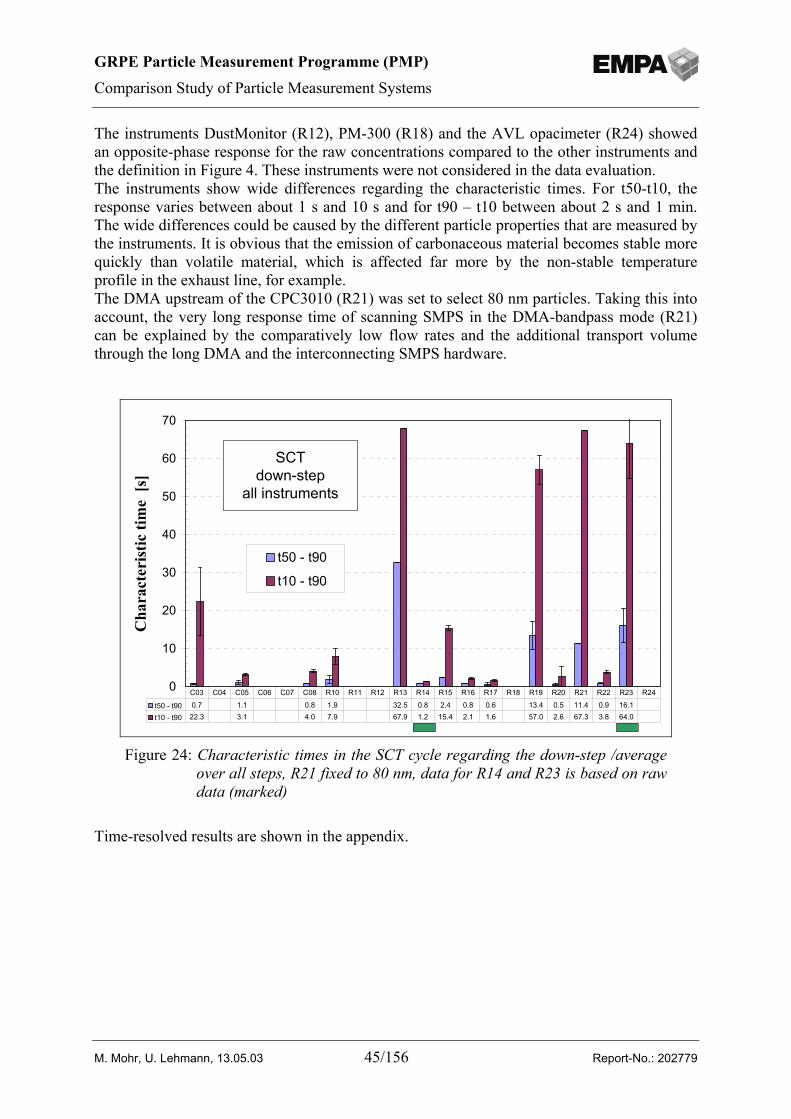
GRPE Particle Measurement Programme (PMP)
Comparison Study of Particle Measurement Systems
M. Mohr, U. Lehmann, 13.05.03 45/156 Report-No.: 202779
The instruments DustMonitor (R12), PM-300 (R18) and the AVL opacimeter (R24) showedan opposite-phase response for the raw concentrations compared to the other instruments andthe definition in Figure 4. These instruments were not considered in the data evaluation.The instruments show wide differences regarding the characteristic times. For t50-t10, theresponse varies between about 1 s and 10 s and for t90 – t10 between about 2 s and 1 min.The wide differences could be caused by the different particle properties that are measured bythe instruments. It is obvious that the emission of carbonaceous material becomes stable morequickly than volatile material, which is affected far more by the non-stable temperatureprofile in the exhaust line, for example.The DMA upstream of the CPC3010 (R21) was set to select 80 nm particles. Taking this intoaccount, the very long response time of scanning SMPS in the DMA-bandpass mode (R21)can be explained by the comparatively low flow rates and the additional transport volumethrough the long DMA and the interconnecting SMPS hardware.
Time-resolved results are shown in the appendix.
0
10
20
30
40
50
60
70
Cha
ract
eris
tic ti
me
[s]
t50 - t90
t10 - t90
t50 - t90 0.7 1.1 0.8 1.9 32.5 0.8 2.4 0.8 0.6 13.4 0.5 11.4 0.9 16.1t10 - t90 22.3 3.1 4.0 7.9 67.9 1.2 15.4 2.1 1.6 57.0 2.6 67.3 3.8 64.0
C03 C04 C05 C06 C07 C08 R10 R11 R12 R13 R14 R15 R16 R17 R18 R19 R20 R21 R22 R23 R24
SCT down-step
all instruments
Figure 24: Characteristic times in the SCT cycle regarding the down-step /averageover all steps, R21 fixed to 80 nm, data for R14 and R23 is based on rawdata (marked)
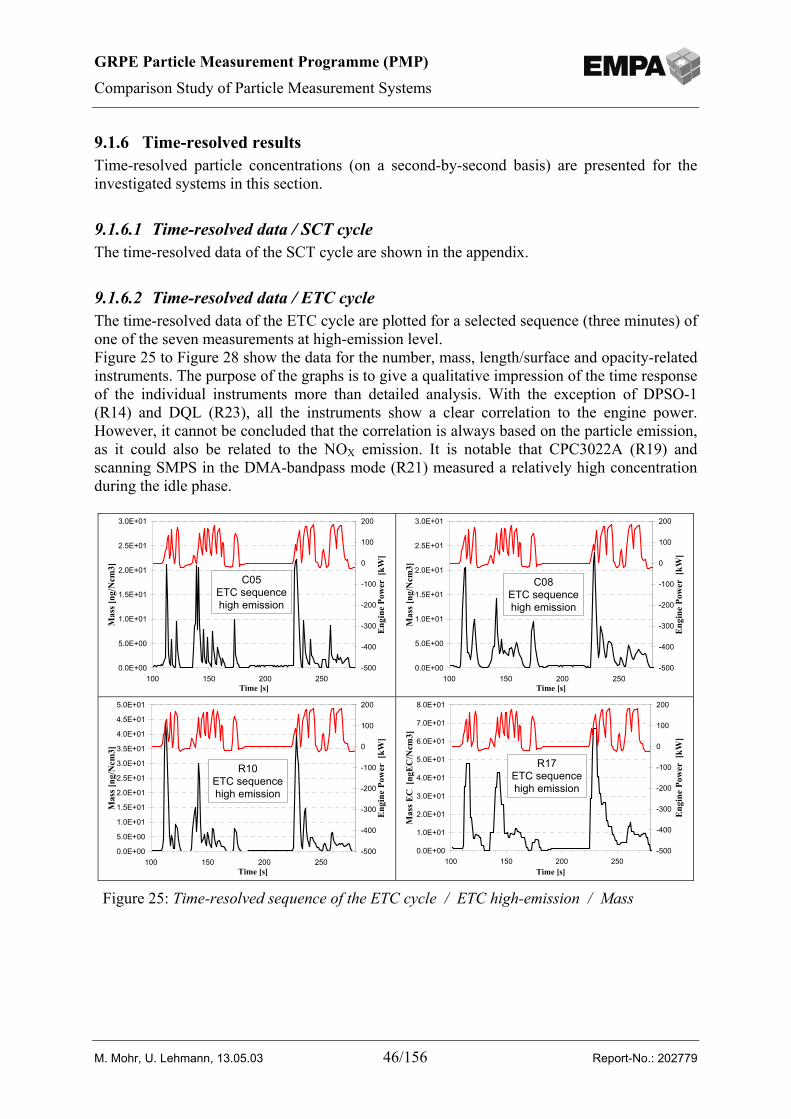
GRPE Particle Measurement Programme (PMP)
Comparison Study of Particle Measurement Systems
M. Mohr, U. Lehmann, 13.05.03 46/156 Report-No.: 202779
9.1.6 Time-resolved resultsTime-resolved particle concentrations (on a second-by-second basis) are presented for theinvestigated systems in this section.
9.1.6.1 Time-resolved data / SCT cycleThe time-resolved data of the SCT cycle are shown in the appendix.
9.1.6.2 Time-resolved data / ETC cycleThe time-resolved data of the ETC cycle are plotted for a selected sequence (three minutes) ofone of the seven measurements at high-emission level.Figure 25 to Figure 28 show the data for the number, mass, length/surface and opacity-relatedinstruments. The purpose of the graphs is to give a qualitative impression of the time responseof the individual instruments more than detailed analysis. With the exception of DPSO-1(R14) and DQL (R23), all the instruments show a clear correlation to the engine power.However, it cannot be concluded that the correlation is always based on the particle emission,as it could also be related to the NOX emission. It is notable that CPC3022A (R19) andscanning SMPS in the DMA-bandpass mode (R21) measured a relatively high concentrationduring the idle phase.
0.0E+00
5.0E+00
1.0E+01
1.5E+01
2.0E+01
2.5E+01
3.0E+01
100 150 200 250Time [s]
Mas
s [ng
/Ncm
3]
-500
-400
-300
-200
-100
0
100
200
Eng
ine
Pow
er [
kW]
C05ETC sequencehigh emission
0.0E+00
5.0E+00
1.0E+01
1.5E+01
2.0E+01
2.5E+01
3.0E+01
100 150 200 250Time [s]
Mas
s [ng
/Ncm
3]
-500
-400
-300
-200
-100
0
100
200
Eng
ine
Pow
er [
kW]
C08ETC sequencehigh emission
0.0E+00
5.0E+00
1.0E+01
1.5E+01
2.0E+01
2.5E+01
3.0E+01
3.5E+01
4.0E+01
4.5E+01
5.0E+01
100 150 200 250Time [s]
Mas
s [ng
/Ncm
3]
-500
-400
-300
-200
-100
0
100
200
Eng
ine
Pow
er [
kW]
R10ETC sequencehigh emission
0.0E+00
1.0E+01
2.0E+01
3.0E+01
4.0E+01
5.0E+01
6.0E+01
7.0E+01
8.0E+01
100 150 200 250Time [s]
Mas
s EC
[ng
EC
/Ncm
3]
-500
-400
-300
-200
-100
0
100
200
Eng
ine
Pow
er [
kW]
R17ETC sequencehigh emission
Figure 25: Time-resolved sequence of the ETC cycle / ETC high-emission / Mass
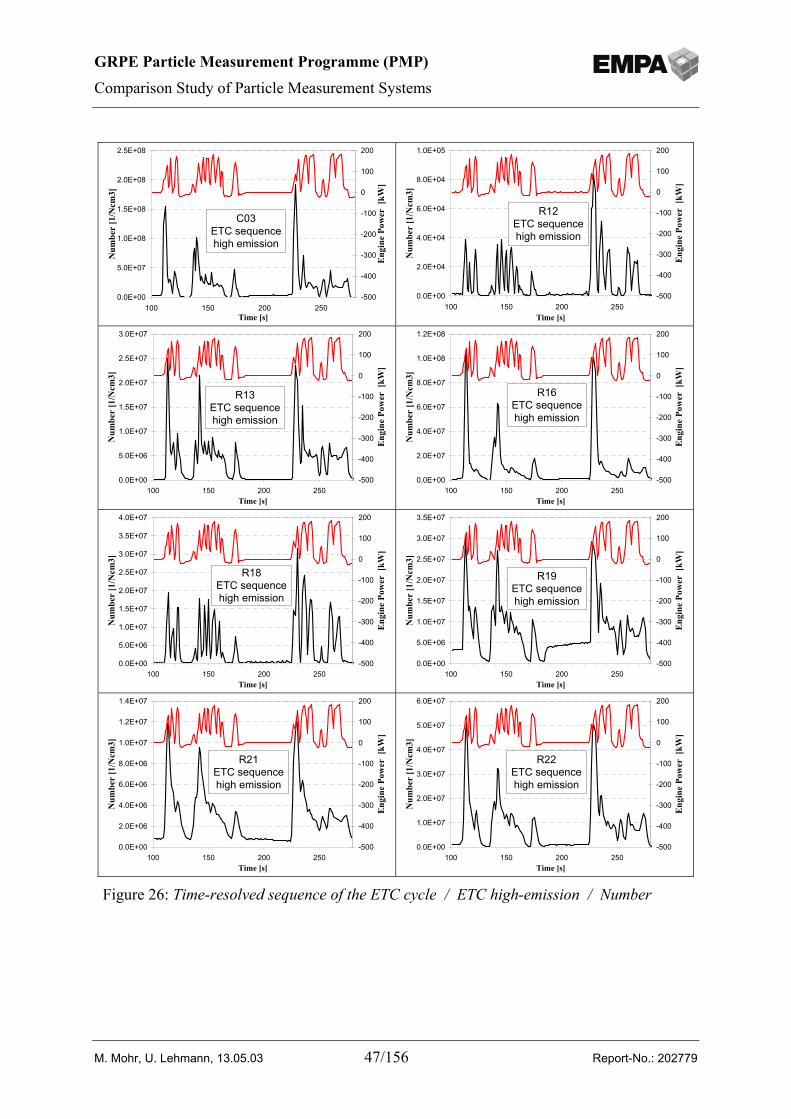
GRPE Particle Measurement Programme (PMP)
Comparison Study of Particle Measurement Systems
M. Mohr, U. Lehmann, 13.05.03 47/156 Report-No.: 202779
0.0E+00
5.0E+07
1.0E+08
1.5E+08
2.0E+08
2.5E+08
100 150 200 250Time [s]
Num
ber
[1/N
cm3]
-500
-400
-300
-200
-100
0
100
200
Eng
ine
Pow
er [
kW]
C03ETC sequencehigh emission
0.0E+00
2.0E+04
4.0E+04
6.0E+04
8.0E+04
1.0E+05
100 150 200 250Time [s]
Num
ber
[1/N
cm3]
-500
-400
-300
-200
-100
0
100
200
Eng
ine
Pow
er [
kW]
R12ETC sequencehigh emission
0.0E+00
5.0E+06
1.0E+07
1.5E+07
2.0E+07
2.5E+07
3.0E+07
100 150 200 250Time [s]
Num
ber
[1/N
cm3]
-500
-400
-300
-200
-100
0
100
200
Eng
ine
Pow
er [
kW]
R13ETC sequencehigh emission
0.0E+00
2.0E+07
4.0E+07
6.0E+07
8.0E+07
1.0E+08
1.2E+08
100 150 200 250Time [s]
Num
ber
[1/N
cm3]
-500
-400
-300
-200
-100
0
100
200
Eng
ine
Pow
er [
kW]
R16ETC sequencehigh emission
0.0E+00
5.0E+06
1.0E+07
1.5E+07
2.0E+07
2.5E+07
3.0E+07
3.5E+07
4.0E+07
100 150 200 250Time [s]
Num
ber
[1/N
cm3]
-500
-400
-300
-200
-100
0
100
200
Eng
ine
Pow
er [
kW]
R18ETC sequencehigh emission
0.0E+00
5.0E+06
1.0E+07
1.5E+07
2.0E+07
2.5E+07
3.0E+07
3.5E+07
100 150 200 250Time [s]
Num
ber
[1/N
cm3]
-500
-400
-300
-200
-100
0
100
200
Eng
ine
Pow
er [
kW]
R19ETC sequencehigh emission
0.0E+00
2.0E+06
4.0E+06
6.0E+06
8.0E+06
1.0E+07
1.2E+07
1.4E+07
100 150 200 250Time [s]
Num
ber
[1/N
cm3]
-500
-400
-300
-200
-100
0
100
200
Eng
ine
Pow
er [
kW]
R21ETC sequencehigh emission
0.0E+00
1.0E+07
2.0E+07
3.0E+07
4.0E+07
5.0E+07
6.0E+07
100 150 200 250Time [s]
Num
ber
[1/N
cm3]
-500
-400
-300
-200
-100
0
100
200
Eng
ine
Pow
er [
kW]
R22ETC sequencehigh emission
Figure 26: Time-resolved sequence of the ETC cycle / ETC high-emission / Number
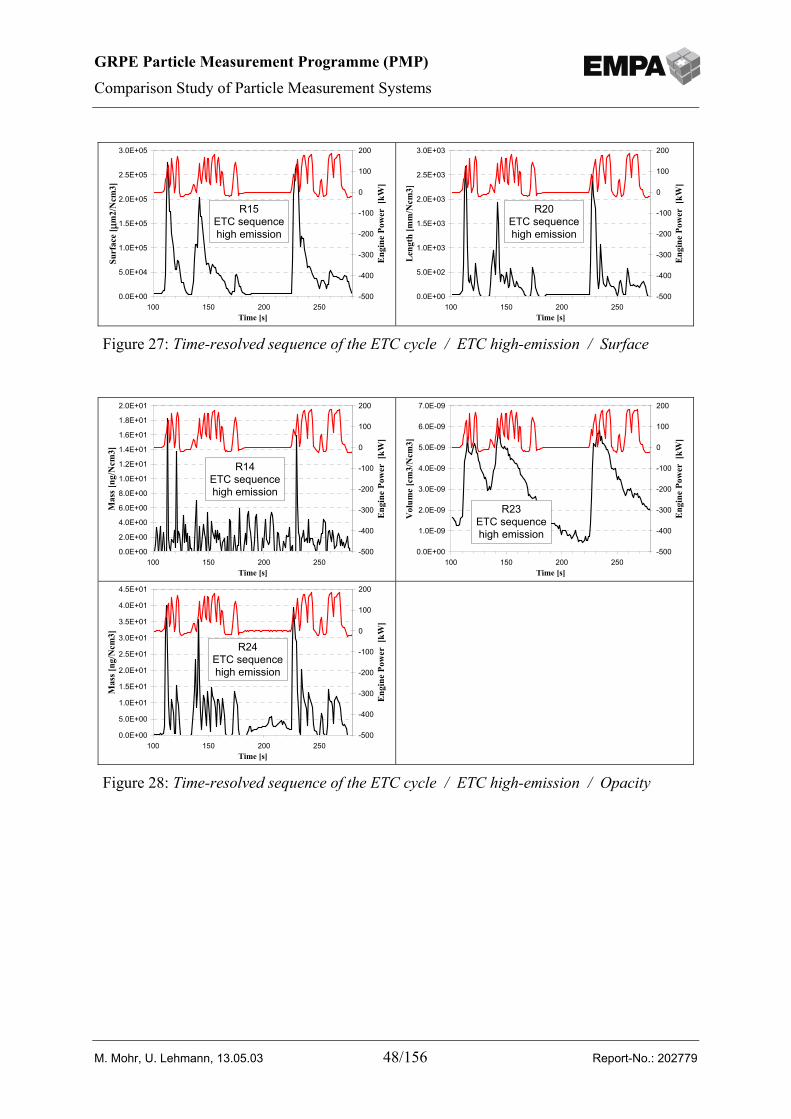
GRPE Particle Measurement Programme (PMP)
Comparison Study of Particle Measurement Systems
M. Mohr, U. Lehmann, 13.05.03 48/156 Report-No.: 202779
0.0E+00
5.0E+04
1.0E+05
1.5E+05
2.0E+05
2.5E+05
3.0E+05
100 150 200 250Time [s]
Surf
ace
[ µm
2/N
cm3]
-500
-400
-300
-200
-100
0
100
200
Eng
ine
Pow
er [
kW]
R15ETC sequencehigh emission
0.0E+00
5.0E+02
1.0E+03
1.5E+03
2.0E+03
2.5E+03
3.0E+03
100 150 200 250Time [s]
Len
gth
[mm
/Ncm
3]
-500
-400
-300
-200
-100
0
100
200
Eng
ine
Pow
er [
kW]
R20ETC sequencehigh emission
Figure 27: Time-resolved sequence of the ETC cycle / ETC high-emission / Surface
0.0E+00
2.0E+00
4.0E+00
6.0E+00
8.0E+00
1.0E+01
1.2E+01
1.4E+01
1.6E+01
1.8E+01
2.0E+01
100 150 200 250Time [s]
Mas
s [ng
/Ncm
3]
-500
-400
-300
-200
-100
0
100
200
Eng
ine
Pow
er [
kW]
R14ETC sequencehigh emission
0.0E+00
1.0E-09
2.0E-09
3.0E-09
4.0E-09
5.0E-09
6.0E-09
7.0E-09
100 150 200 250Time [s]
Vol
ume
[cm
3/N
cm3]
-500
-400
-300
-200
-100
0
100
200
Eng
ine
Pow
er [
kW]
R23ETC sequencehigh emission
0.0E+00
5.0E+00
1.0E+01
1.5E+01
2.0E+01
2.5E+01
3.0E+01
3.5E+01
4.0E+01
4.5E+01
100 150 200 250Time [s]
Mas
s [ng
/Ncm
3]
-500
-400
-300
-200
-100
0
100
200
Eng
ine
Pow
er [
kW]
R24ETC sequencehigh emission
Figure 28: Time-resolved sequence of the ETC cycle / ETC high-emission / Opacity
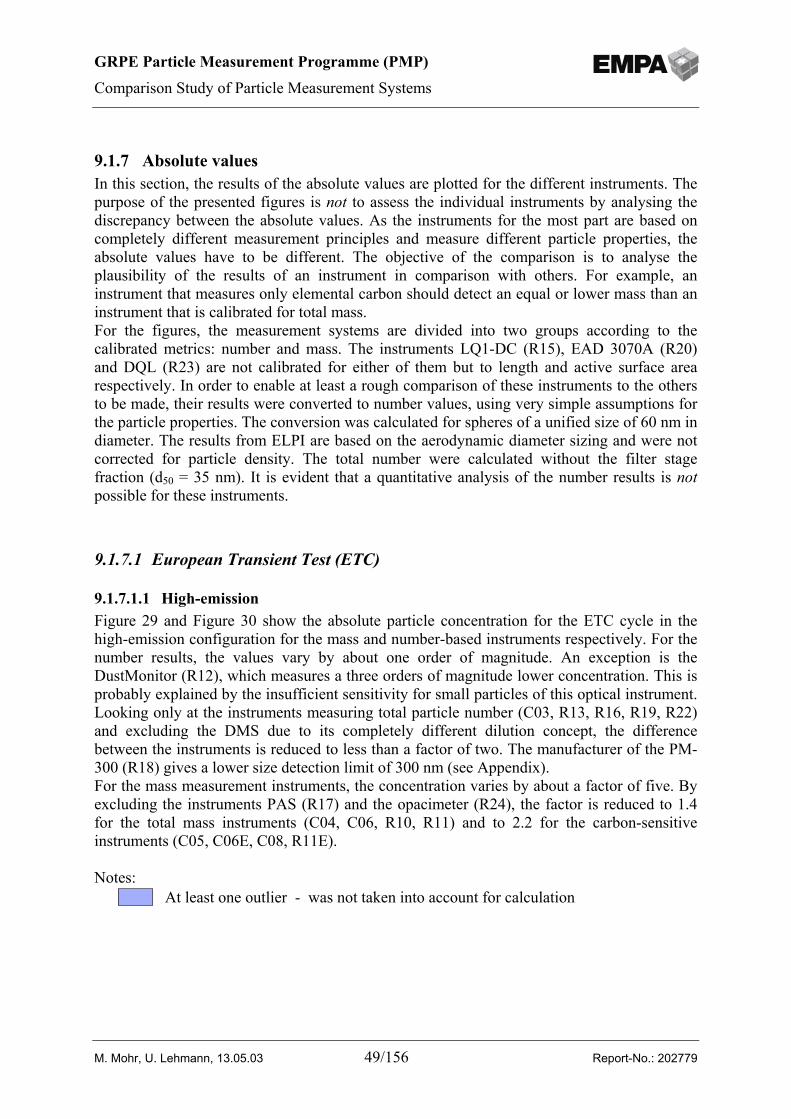
GRPE Particle Measurement Programme (PMP)
Comparison Study of Particle Measurement Systems
M. Mohr, U. Lehmann, 13.05.03 49/156 Report-No.: 202779
9.1.7 Absolute valuesIn this section, the results of the absolute values are plotted for the different instruments. Thepurpose of the presented figures is not to assess the individual instruments by analysing thediscrepancy between the absolute values. As the instruments for the most part are based oncompletely different measurement principles and measure different particle properties, theabsolute values have to be different. The objective of the comparison is to analyse theplausibility of the results of an instrument in comparison with others. For example, aninstrument that measures only elemental carbon should detect an equal or lower mass than aninstrument that is calibrated for total mass.For the figures, the measurement systems are divided into two groups according to thecalibrated metrics: number and mass. The instruments LQ1-DC (R15), EAD 3070A (R20)and DQL (R23) are not calibrated for either of them but to length and active surface arearespectively. In order to enable at least a rough comparison of these instruments to the othersto be made, their results were converted to number values, using very simple assumptions forthe particle properties. The conversion was calculated for spheres of a unified size of 60 nm indiameter. The results from ELPI are based on the aerodynamic diameter sizing and were notcorrected for particle density. The total number were calculated without the filter stagefraction (d50 = 35 nm). It is evident that a quantitative analysis of the number results is notpossible for these instruments.
9.1.7.1 European Transient Test (ETC)
9.1.7.1.1 High-emissionFigure 29 and Figure 30 show the absolute particle concentration for the ETC cycle in thehigh-emission configuration for the mass and number-based instruments respectively. For thenumber results, the values vary by about one order of magnitude. An exception is theDustMonitor (R12), which measures a three orders of magnitude lower concentration. This isprobably explained by the insufficient sensitivity for small particles of this optical instrument.Looking only at the instruments measuring total particle number (C03, R13, R16, R19, R22)and excluding the DMS due to its completely different dilution concept, the differencebetween the instruments is reduced to less than a factor of two. The manufacturer of the PM-300 (R18) gives a lower size detection limit of 300 nm (see Appendix).For the mass measurement instruments, the concentration varies by about a factor of five. Byexcluding the instruments PAS (R17) and the opacimeter (R24), the factor is reduced to 1.4for the total mass instruments (C04, C06, R10, R11) and to 2.2 for the carbon-sensitiveinstruments (C05, C06E, C08, R11E).
Notes:At least one outlier - was not taken into account for calculation
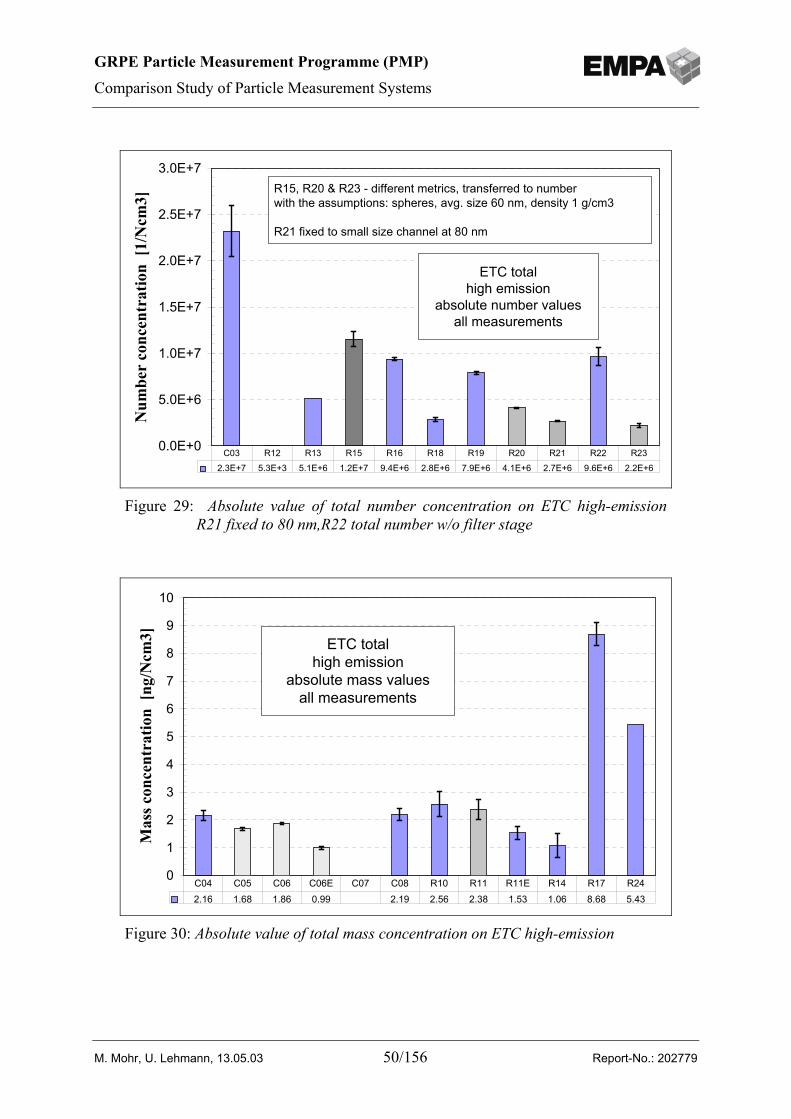
GRPE Particle Measurement Programme (PMP)
Comparison Study of Particle Measurement Systems
M. Mohr, U. Lehmann, 13.05.03 50/156 Report-No.: 202779
0.0E+0
5.0E+6
1.0E+7
1.5E+7
2.0E+7
2.5E+7
3.0E+7
Num
ber
conc
entr
atio
n [1
/Ncm
3]
2.3E+7 5.3E+3 5.1E+6 1.2E+7 9.4E+6 2.8E+6 7.9E+6 4.1E+6 2.7E+6 9.6E+6 2.2E+6C03 R12 R13 R15 R16 R18 R19 R20 R21 R22 R23
R15, R20 & R23 - different metrics, transferred to number with the assumptions: spheres, avg. size 60 nm, density 1 g/cm3
R21 fixed to small size channel at 80 nm
ETC totalhigh emission
absolute number valuesall measurements
Figure 29: Absolute value of total number concentration on ETC high-emissionR21 fixed to 80 nm,R22 total number w/o filter stage
0
1
2
3
4
5
6
7
8
9
10
Mas
s con
cent
ratio
n [n
g/N
cm3]
2.16 1.68 1.86 0.99 2.19 2.56 2.38 1.53 1.06 8.68 5.43C04 C05 C06 C06E C07 C08 R10 R11 R11E R14 R17 R24
ETC totalhigh emission
absolute mass valuesall measurements
Figure 30: Absolute value of total mass concentration on ETC high-emission
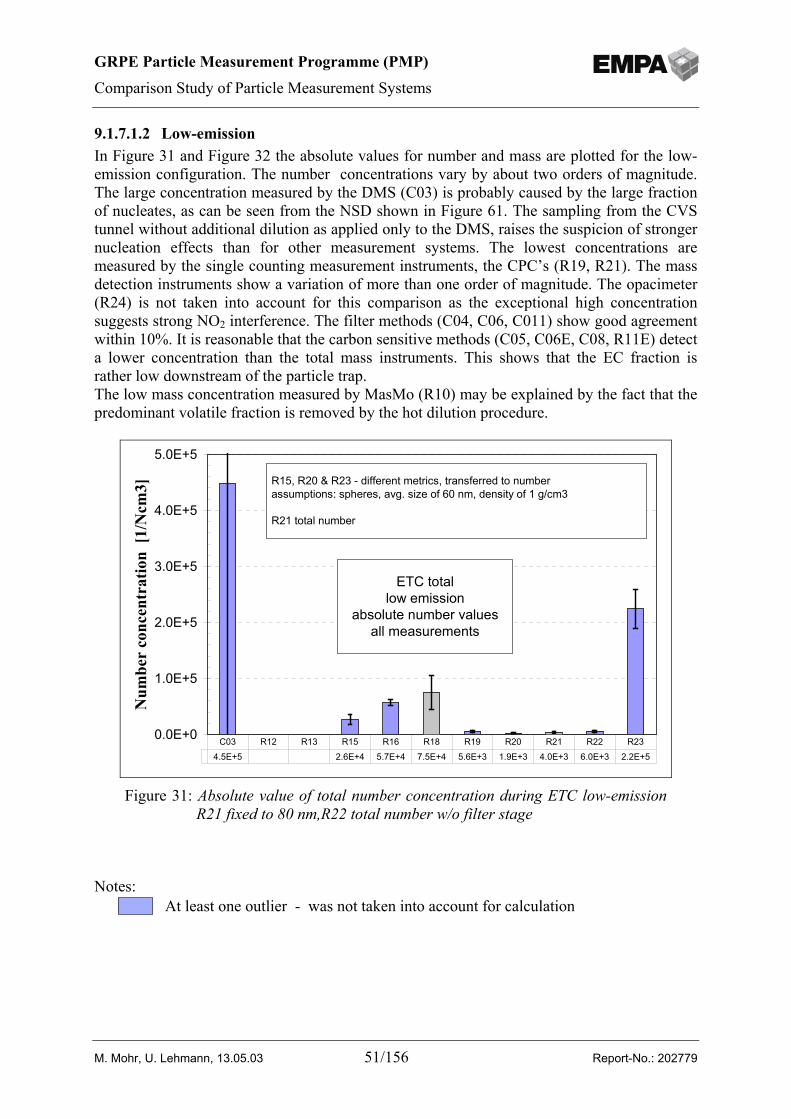
GRPE Particle Measurement Programme (PMP)
Comparison Study of Particle Measurement Systems
M. Mohr, U. Lehmann, 13.05.03 51/156 Report-No.: 202779
9.1.7.1.2 Low-emissionIn Figure 31 and Figure 32 the absolute values for number and mass are plotted for the low-emission configuration. The number concentrations vary by about two orders of magnitude.The large concentration measured by the DMS (C03) is probably caused by the large fractionof nucleates, as can be seen from the NSD shown in Figure 61. The sampling from the CVStunnel without additional dilution as applied only to the DMS, raises the suspicion of strongernucleation effects than for other measurement systems. The lowest concentrations aremeasured by the single counting measurement instruments, the CPC’s (R19, R21). The massdetection instruments show a variation of more than one order of magnitude. The opacimeter(R24) is not taken into account for this comparison as the exceptional high concentrationsuggests strong NO2 interference. The filter methods (C04, C06, C011) show good agreementwithin 10%. It is reasonable that the carbon sensitive methods (C05, C06E, C08, R11E) detecta lower concentration than the total mass instruments. This shows that the EC fraction israther low downstream of the particle trap.The low mass concentration measured by MasMo (R10) may be explained by the fact that thepredominant volatile fraction is removed by the hot dilution procedure.
Notes:At least one outlier - was not taken into account for calculation
0.0E+0
1.0E+5
2.0E+5
3.0E+5
4.0E+5
5.0E+5
Num
ber
conc
entr
atio
n [1
/Ncm
3]
4.5E+5 2.6E+4 5.7E+4 7.5E+4 5.6E+3 1.9E+3 4.0E+3 6.0E+3 2.2E+5C03 R12 R13 R15 R16 R18 R19 R20 R21 R22 R23
R15, R20 & R23 - different metrics, transferred to number assumptions: spheres, avg. size of 60 nm, density of 1 g/cm3
R21 total number
ETC totallow emission
absolute number valuesall measurements
Figure 31: Absolute value of total number concentration during ETC low-emissionR21 fixed to 80 nm,R22 total number w/o filter stage
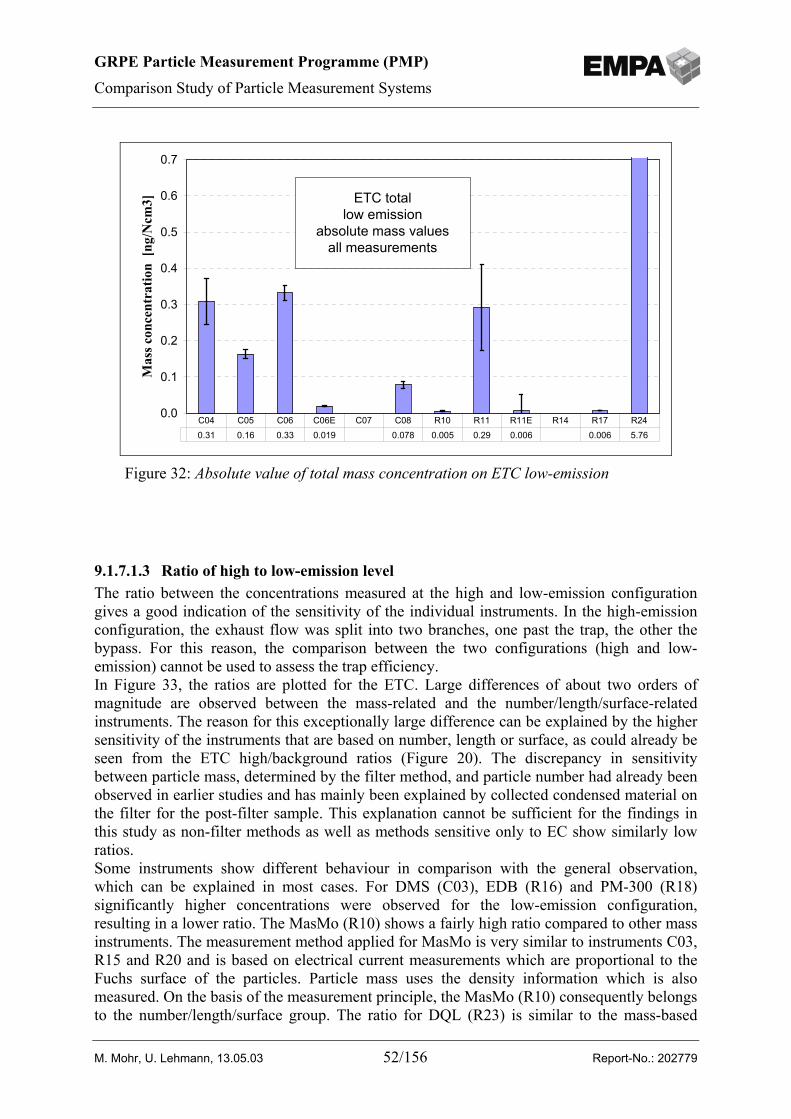
GRPE Particle Measurement Programme (PMP)
Comparison Study of Particle Measurement Systems
M. Mohr, U. Lehmann, 13.05.03 52/156 Report-No.: 202779
9.1.7.1.3 Ratio of high to low-emission levelThe ratio between the concentrations measured at the high and low-emission configurationgives a good indication of the sensitivity of the individual instruments. In the high-emissionconfiguration, the exhaust flow was split into two branches, one past the trap, the other thebypass. For this reason, the comparison between the two configurations (high and low-emission) cannot be used to assess the trap efficiency.In Figure 33, the ratios are plotted for the ETC. Large differences of about two orders ofmagnitude are observed between the mass-related and the number/length/surface-relatedinstruments. The reason for this exceptionally large difference can be explained by the highersensitivity of the instruments that are based on number, length or surface, as could already beseen from the ETC high/background ratios (Figure 20). The discrepancy in sensitivitybetween particle mass, determined by the filter method, and particle number had already beenobserved in earlier studies and has mainly been explained by collected condensed material onthe filter for the post-filter sample. This explanation cannot be sufficient for the findings inthis study as non-filter methods as well as methods sensitive only to EC show similarly lowratios.Some instruments show different behaviour in comparison with the general observation,which can be explained in most cases. For DMS (C03), EDB (R16) and PM-300 (R18)significantly higher concentrations were observed for the low-emission configuration,resulting in a lower ratio. The MasMo (R10) shows a fairly high ratio compared to other massinstruments. The measurement method applied for MasMo is very similar to instruments C03,R15 and R20 and is based on electrical current measurements which are proportional to theFuchs surface of the particles. Particle mass uses the density information which is alsomeasured. On the basis of the measurement principle, the MasMo (R10) consequently belongsto the number/length/surface group. The ratio for DQL (R23) is similar to the mass-based
0.0
0.1
0.2
0.3
0.4
0.5
0.6
0.7M
ass c
once
ntra
tion
[ng/
Ncm
3]
0.31 0.16 0.33 0.019 0.078 0.005 0.29 0.006 0.006 5.76 C04 C05 C06 C06E C07 C08 R10 R11 R11E R14 R17 R24
ETC totallow emission
absolute mass valuesall measurements
Figure 32: Absolute value of total mass concentration on ETC low-emission
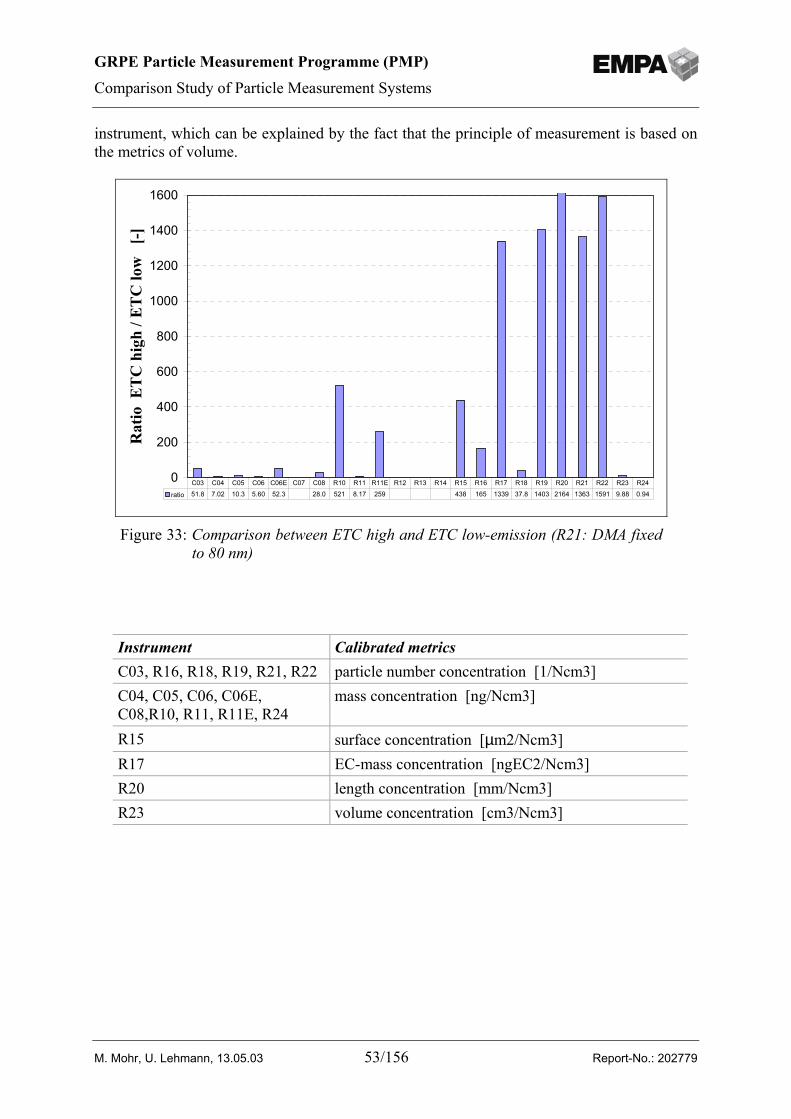
GRPE Particle Measurement Programme (PMP)
Comparison Study of Particle Measurement Systems
M. Mohr, U. Lehmann, 13.05.03 53/156 Report-No.: 202779
instrument, which can be explained by the fact that the principle of measurement is based onthe metrics of volume.
Instrument Calibrated metricsC03, R16, R18, R19, R21, R22 particle number concentration [1/Ncm3]C04, C05, C06, C06E,C08,R10, R11, R11E, R24
mass concentration [ng/Ncm3]
R15 surface concentration [µm2/Ncm3]R17 EC-mass concentration [ngEC2/Ncm3]R20 length concentration [mm/Ncm3]R23 volume concentration [cm3/Ncm3]
0
200
400
600
800
1000
1200
1400
1600
Rat
io E
TC
hig
h / E
TC
low
[-
]
ratio 51.8 7.02 10.3 5.60 52.3 28.0 521 8.17 259 438 165 1339 37.8 1403 2164 1363 1591 9.88 0.94C03 C04 C05 C06 C06E C07 C08 R10 R11 R11E R12 R13 R14 R15 R16 R17 R18 R19 R20 R21 R22 R23 R24
Figure 33: Comparison between ETC high and ETC low-emission (R21: DMA fixedto 80 nm)
GRPE Particle Measurement Programme (PMP)
Comparison Study of Particle Measurement Systems
M. Mohr, U. Lehmann, 13.05.03 54/156 Report-No.: 202779
9.1.7.2 European Steady-State Test (ESC)
9.1.7.2.1 High and low-emissionFigure 34 shows the absolute concentrations expressed in emission per output work [1/kWh]measured for the ESC at the high and low-emission levels.In general, the figure of the absolute ETC values is quite similar to the figure of the absoluteESC values, for both emission levels. An exception is PM-300 (R18). Relative to otherinstruments, the concentration measured by R18 is two orders of magnitude lower in the ESCcompared to the ETC, at both high and low-emission levels.The high ratio for DMS (C03) is caused by a strong nucleation effect in the low-emissionconfiguration.
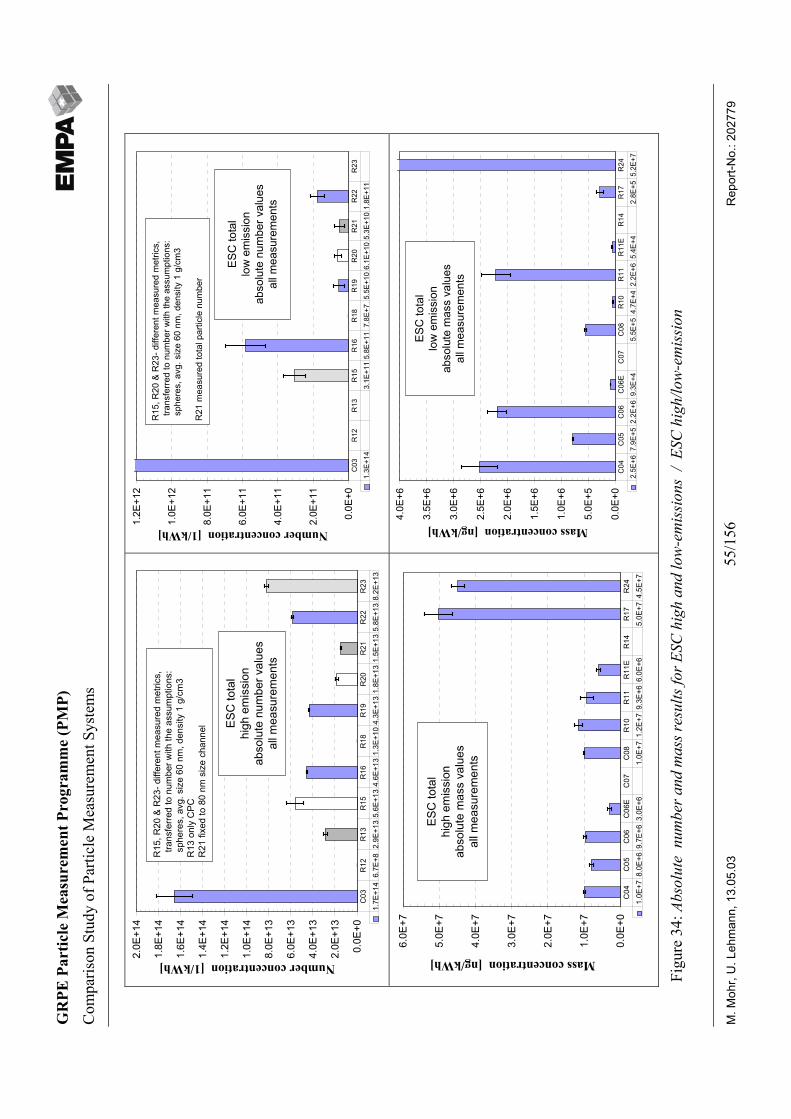
GR
PE P
artic
le M
easu
rem
ent P
rogr
amm
e (P
MP)
Com
paris
on S
tudy
of P
artic
le M
easu
rem
ent S
yste
ms
M. M
ohr,
U. L
ehm
ann,
13.
05.0
355
/156
Rep
ort-N
o.: 2
0277
9
0.0E
+0
2.0E
+13
4.0E
+13
6.0E
+13
8.0E
+13
1.0E
+14
1.2E
+14
1.4E
+14
1.6E
+14
1.8E
+14
2.0E
+14
Number concentration [1/kWh]
1.7E
+14
6.7E
+82.
9E+1
35.
6E+1
34.
6E+1
31.
3E+1
04.
3E+1
31.
8E+1
31.
5E+1
35.
8E+1
38.
2E+1
3C
03R
12R
13R
15R
16R
18R
19R
20R
21R
22R
23
R15
, R20
& R
23- d
iffer
ent m
easu
red
met
rics,
trans
ferre
d to
num
ber w
ith th
e as
sum
ptio
ns:
sp
here
s, a
vg. s
ize
60 n
m, d
ensi
ty 1
g/c
m3
R13
onl
y C
PC R
21 fi
xed
to 8
0 nm
siz
e ch
anne
l ESC
tota
lhi
gh e
mis
sion
abso
lute
num
ber v
alue
sal
l mea
sure
men
ts
0.0E
+0
2.0E
+11
4.0E
+11
6.0E
+11
8.0E
+11
1.0E
+12
1.2E
+12
Number concentration [1/kWh]
1.3E
+14
3.1E
+11
5.8E
+11
7.8E
+75.
5E+1
06.
1E+1
05.
3E+1
01.
8E+1
1C
03R
12R
13R
15R
16R
18R
19R
20R
21R
22R
23
ESC
tota
llo
w e
mis
sion
abso
lute
num
ber v
alue
sal
l mea
sure
men
ts
R15
, R20
& R
23- d
iffer
ent m
easu
red
met
rics,
trans
ferre
d to
num
ber w
ith th
e as
sum
ptio
ns:
sp
here
s, a
vg. s
ize
60 n
m, d
ensi
ty 1
g/c
m3
R21
mea
sure
d to
tal p
artic
le n
umbe
r
0.0E
+0
1.0E
+7
2.0E
+7
3.0E
+7
4.0E
+7
5.0E
+7
6.0E
+7
Mass concentration [ng/kWh]
1.0E
+78.
0E+6
9.7E
+63.
0E+6
1.0E
+71.
2E+7
9.3E
+66.
0E+6
5.0E
+74.
5E+7
C04
C05
C06
C06
EC
07C
08R
10R
11R
11E
R14
R17
R24
ESC
tota
lhi
gh e
mis
sion
abso
lute
mas
s va
lues
all m
easu
rem
ents
0.0E
+0
5.0E
+5
1.0E
+6
1.5E
+6
2.0E
+6
2.5E
+6
3.0E
+6
3.5E
+6
4.0E
+6
Mass concentration [ng/kWh]
2.5E
+67.
9E+5
2.2E
+69.
3E+4
5.5E
+54.
7E+4
2.2E
+65.
4E+4
2.8E
+55.
2E+7
C04
C05
C06
C06
EC
07C
08R
10R
11R
11E
R14
R17
R24
ESC
tota
llo
w e
mis
sion
abso
lute
mas
s va
lues
all m
easu
rem
ents
Figu
re 3
4: A
bsol
ute
num
ber a
nd m
ass r
esul
ts fo
r ESC
hig
h an
d lo
w-e
mis
sion
s /
ESC
hig
h/lo
w-e
mis
sion
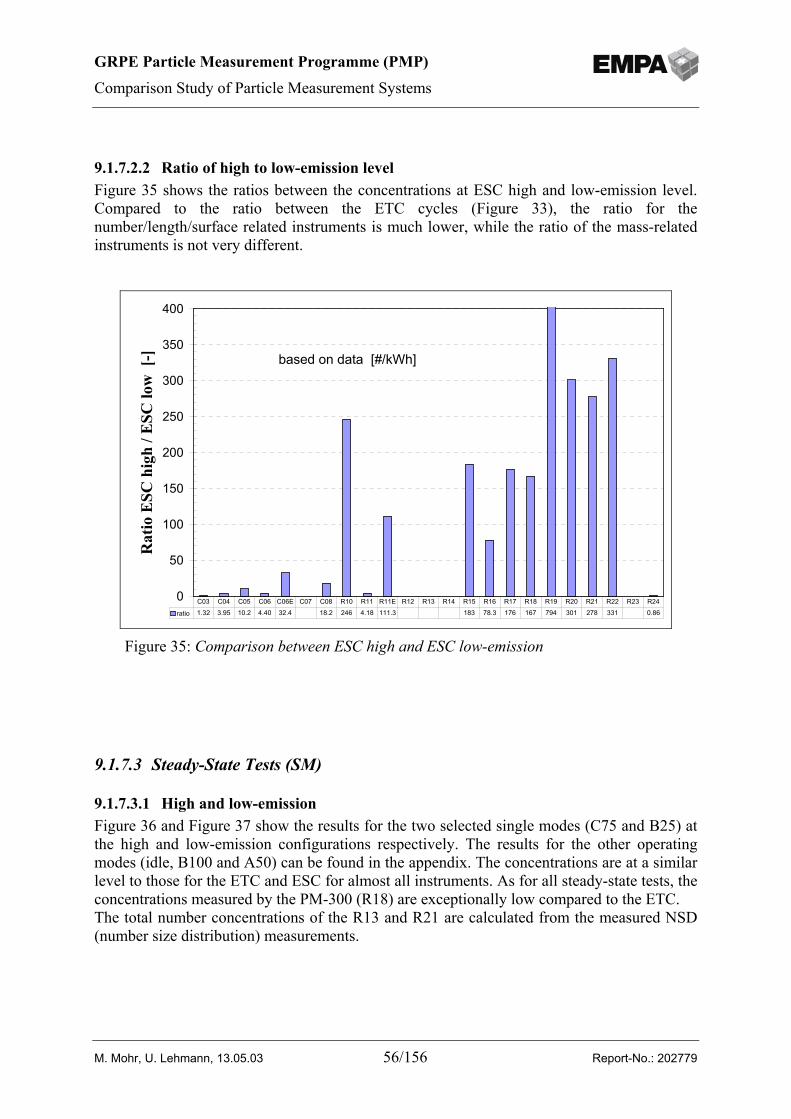
GRPE Particle Measurement Programme (PMP)
Comparison Study of Particle Measurement Systems
M. Mohr, U. Lehmann, 13.05.03 56/156 Report-No.: 202779
9.1.7.2.2 Ratio of high to low-emission levelFigure 35 shows the ratios between the concentrations at ESC high and low-emission level.Compared to the ratio between the ETC cycles (Figure 33), the ratio for thenumber/length/surface related instruments is much lower, while the ratio of the mass-relatedinstruments is not very different.
9.1.7.3 Steady-State Tests (SM)
9.1.7.3.1 High and low-emissionFigure 36 and Figure 37 show the results for the two selected single modes (C75 and B25) atthe high and low-emission configurations respectively. The results for the other operatingmodes (idle, B100 and A50) can be found in the appendix. The concentrations are at a similarlevel to those for the ETC and ESC for almost all instruments. As for all steady-state tests, theconcentrations measured by the PM-300 (R18) are exceptionally low compared to the ETC.The total number concentrations of the R13 and R21 are calculated from the measured NSD(number size distribution) measurements.
0
50
100
150
200
250
300
350
400
Rat
io E
SC h
igh
/ ESC
low
[-]
ratio 1.32 3.95 10.2 4.40 32.4 18.2 246 4.18 111.3 183 78.3 176 167 794 301 278 331 0.86C03 C04 C05 C06 C06E C07 C08 R10 R11 R11E R12 R13 R14 R15 R16 R17 R18 R19 R20 R21 R22 R23 R24
based on data [#/kWh]
Figure 35: Comparison between ESC high and ESC low-emission
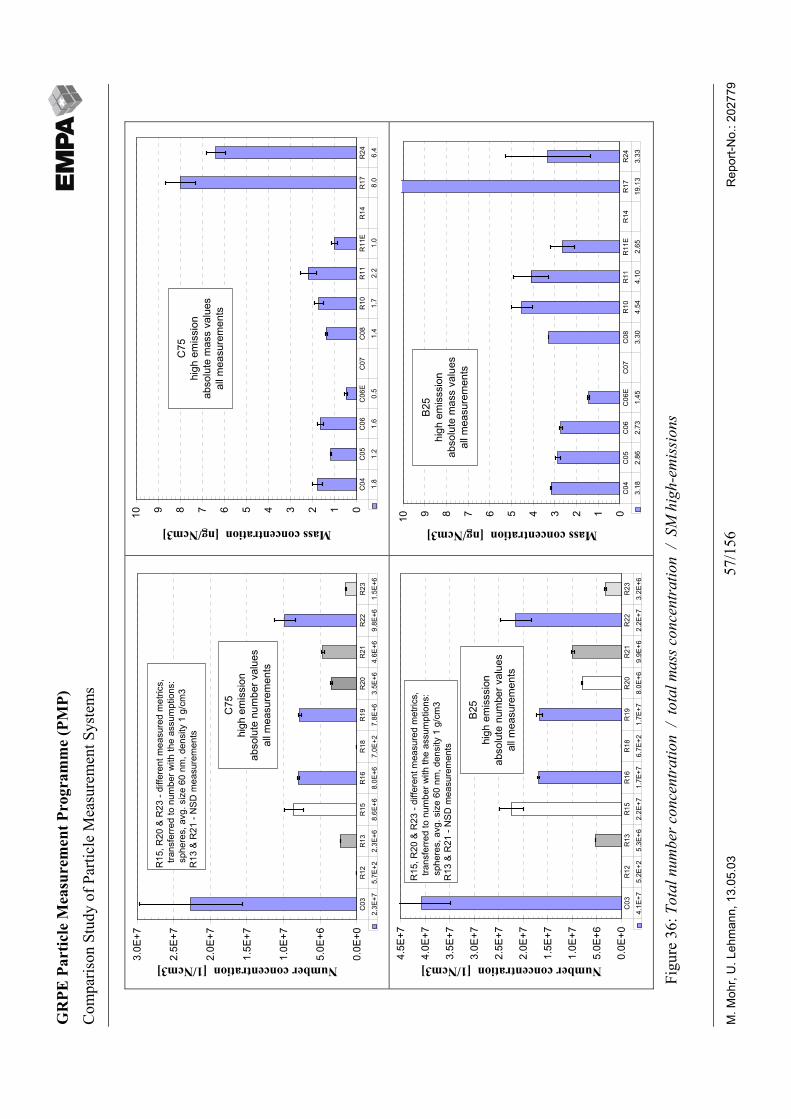
GR
PE P
artic
le M
easu
rem
ent P
rogr
amm
e (P
MP)
Com
paris
on S
tudy
of P
artic
le M
easu
rem
ent S
yste
ms
M. M
ohr,
U. L
ehm
ann,
13.
05.0
357
/156
Rep
ort-N
o.: 2
0277
9
0.0E
+0
5.0E
+6
1.0E
+7
1.5E
+7
2.0E
+7
2.5E
+7
3.0E
+7Number concentration [1/Ncm3]
2.3E
+75.
7E+2
2.3E
+68.
6E+6
8.0E
+67.
0E+2
7.8E
+63.
5E+6
4.6E
+69.
8E+6
1.5E
+6C
03R
12R
13R
15R
16R
18R
19R
20R
21R
22R
23
R15
, R20
& R
23 -
diffe
rent
mea
sure
d m
etric
s,
tra
nsfe
rred
to n
umbe
r with
the
assu
mpt
ions
: s
pher
es, a
vg. s
ize
60 n
m, d
ensi
ty 1
g/c
m3
R13
& R
21 -
NSD
mea
sure
men
ts
C75
high
em
issi
onab
solu
te n
umbe
r val
ues
all m
easu
rem
ents
012345678910
Mass concentration [ng/Ncm3]
1.8
1.2
1.6
0.5
1.4
1.7
2.2
1.0
8.0
6.4
C04
C05
C06
C06
EC
07C
08R
10R
11R
11E
R14
R17
R24
C75
high
em
issi
onab
solu
te m
ass
valu
esal
l mea
sure
men
ts
0.0E
+0
5.0E
+6
1.0E
+7
1.5E
+7
2.0E
+7
2.5E
+7
3.0E
+7
3.5E
+7
4.0E
+7
4.5E
+7
Number concentration [1/Ncm3]
4.1E
+75.
2E+2
5.3E
+62.
2E+7
1.7E
+76.
7E+2
1.7E
+78.
0E+6
9.9E
+62.
2E+7
3.2E
+6C
03R
12R
13R
15R
16R
18R
19R
20R
21R
22R
23
R15
, R20
& R
23 -
diffe
rent
mea
sure
d m
etric
s,
tra
nsfe
rred
to n
umbe
r with
the
assu
mpt
ions
: s
pher
es, a
vg. s
ize
60 n
m, d
ensi
ty 1
g/c
m3
R13
& R
21 -
NSD
mea
sure
men
ts
B25
high
em
isss
ion
abso
lute
num
ber v
alue
sal
l mea
sure
men
ts
012345678910
Mass concentration [ng/Ncm3]
3.18
2.86
2.73
1.45
3.30
4.54
4.10
2.65
19.1
33.
33C
04C
05C
06C
06E
C07
C08
R10
R11
R11
ER
14R
17R
24
B25
high
em
isss
ion
abso
lute
mas
s va
lues
all m
easu
rem
ents
Figu
re 3
6: T
otal
num
ber c
once
ntra
tion
/ to
tal m
ass c
once
ntra
tion
/ S
M h
igh-
emis
sion
s
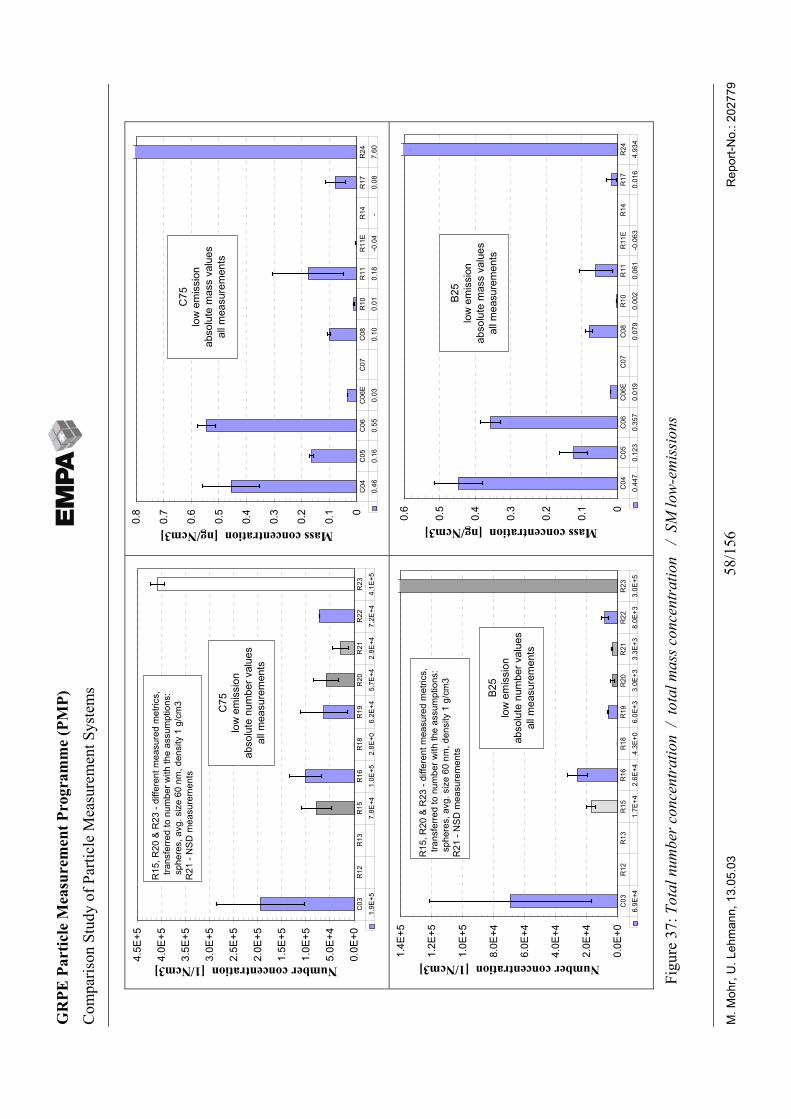
GR
PE P
artic
le M
easu
rem
ent P
rogr
amm
e (P
MP)
Com
paris
on S
tudy
of P
artic
le M
easu
rem
ent S
yste
ms
M. M
ohr,
U. L
ehm
ann,
13.
05.0
358
/156
Rep
ort-N
o.: 2
0277
9
0.0E
+0
5.0E
+4
1.0E
+5
1.5E
+5
2.0E
+5
2.5E
+5
3.0E
+5
3.5E
+5
4.0E
+5
4.5E
+5Number concentration [1/Ncm3]
1.9E
+57.
8E+4
1.0E
+52.
8E+0
6.2E
+45.
7E+4
2.8E
+47.
2E+4
4.1E
+5C
03R
12R
13R
15R
16R
18R
19R
20R
21R
22R
23
C75
low
em
issi
onab
solu
te n
umbe
r val
ues
all m
easu
rem
ents
R15
, R20
& R
23 -
diffe
rent
mea
sure
d m
etric
s,
tra
nsfe
rred
to n
umbe
r with
the
assu
mpt
ions
: s
pher
es, a
vg. s
ize
60 n
m, d
ensi
ty 1
g/c
m3
R21
- N
SD m
easu
rem
ents
0
0.1
0.2
0.3
0.4
0.5
0.6
0.7
0.8
Mass concentration [ng/Ncm3]
0.46
0
.16
0.5
5 0
.03
0.1
0 0
.01
0.1
8 -0
.04
-
0.0
8 7
.60
C04
C05
C06
C06
EC
07C
08R
10R
11R
11E
R14
R17
R24
C75
low
em
issi
onab
solu
te m
ass
valu
esal
l mea
sure
men
ts
0.0E
+0
2.0E
+4
4.0E
+4
6.0E
+4
8.0E
+4
1.0E
+5
1.2E
+5
1.4E
+5
Number concentration [1/Ncm3]
6.9E
+41.
7E+4
2.6E
+44.
3E+0
6.0E
+33.
0E+3
3.3E
+38.
0E+3
3.0E
+5C
03R
12R
13R
15R
16R
18R
19R
20R
21R
22R
23
B25
low
em
issi
onab
solu
te n
umbe
r val
ues
all m
easu
rem
ents
R15
, R20
& R
23 -
diffe
rent
mea
sure
d m
etric
s,
tra
nsfe
rred
to n
umbe
r with
the
assu
mpt
ions
: s
pher
es, a
vg. s
ize
60 n
m, d
ensi
ty 1
g/c
m3
R21
- N
SD m
easu
rem
ents
0
0.1
0.2
0.3
0.4
0.5
0.6
Mass concentration [ng/Ncm3]
0.4
47
0.12
3 0.
357
0.01
9 0
.079
0
.002
0
.061
-0
.063
0
.016
4
.934
C
04C
05C
06C
06E
C07
C08
R10
R11
R11
ER
14R
17R
24
B25
low
em
issi
onab
solu
te m
ass
valu
es
all m
easu
rem
ents
Figu
re 3
7: T
otal
num
ber c
once
ntra
tion
/ to
tal m
ass c
once
ntra
tion
/ S
M lo
w-e
mis
sion
s
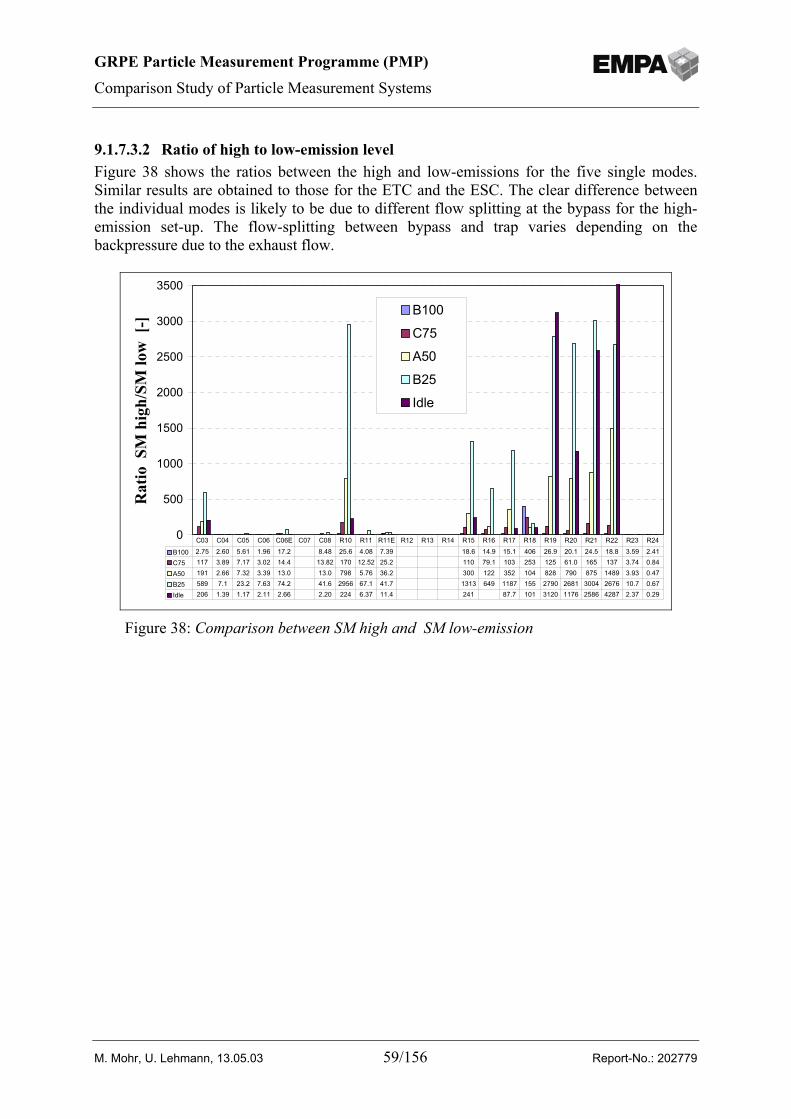
GRPE Particle Measurement Programme (PMP)
Comparison Study of Particle Measurement Systems
M. Mohr, U. Lehmann, 13.05.03 59/156 Report-No.: 202779
9.1.7.3.2 Ratio of high to low-emission levelFigure 38 shows the ratios between the high and low-emissions for the five single modes.Similar results are obtained to those for the ETC and the ESC. The clear difference betweenthe individual modes is likely to be due to different flow splitting at the bypass for the high-emission set-up. The flow-splitting between bypass and trap varies depending on thebackpressure due to the exhaust flow.
0
500
1000
1500
2000
2500
3000
3500
Rat
io S
M h
igh/
SM lo
w [
-]
B100
C75
A50
B25
Idle
B100 2.75 2.60 5.61 1.96 17.2 8.48 25.6 4.08 7.39 18.6 14.9 15.1 406 26.9 20.1 24.5 18.8 3.59 2.41
C75 117 3.89 7.17 3.02 14.4 13.82 170 12.52 25.2 110 79.1 103 253 125 61.0 165 137 3.74 0.84
A50 191 2.66 7.32 3.39 13.0 13.0 798 5.76 36.2 300 122 352 104 828 790 875 1489 3.93 0.47
B25 589 7.1 23.2 7.63 74.2 41.6 2956 67.1 41.7 1313 649 1187 155 2790 2681 3004 2676 10.7 0.67
Idle 206 1.39 1.17 2.11 2.66 2.20 224 6.37 11.4 241 87.7 101 3120 1176 2586 4287 2.37 0.29
C03 C04 C05 C06 C06E C07 C08 R10 R11 R11E R12 R13 R14 R15 R16 R17 R18 R19 R20 R21 R22 R23 R24
Figure 38: Comparison between SM high and SM low-emission
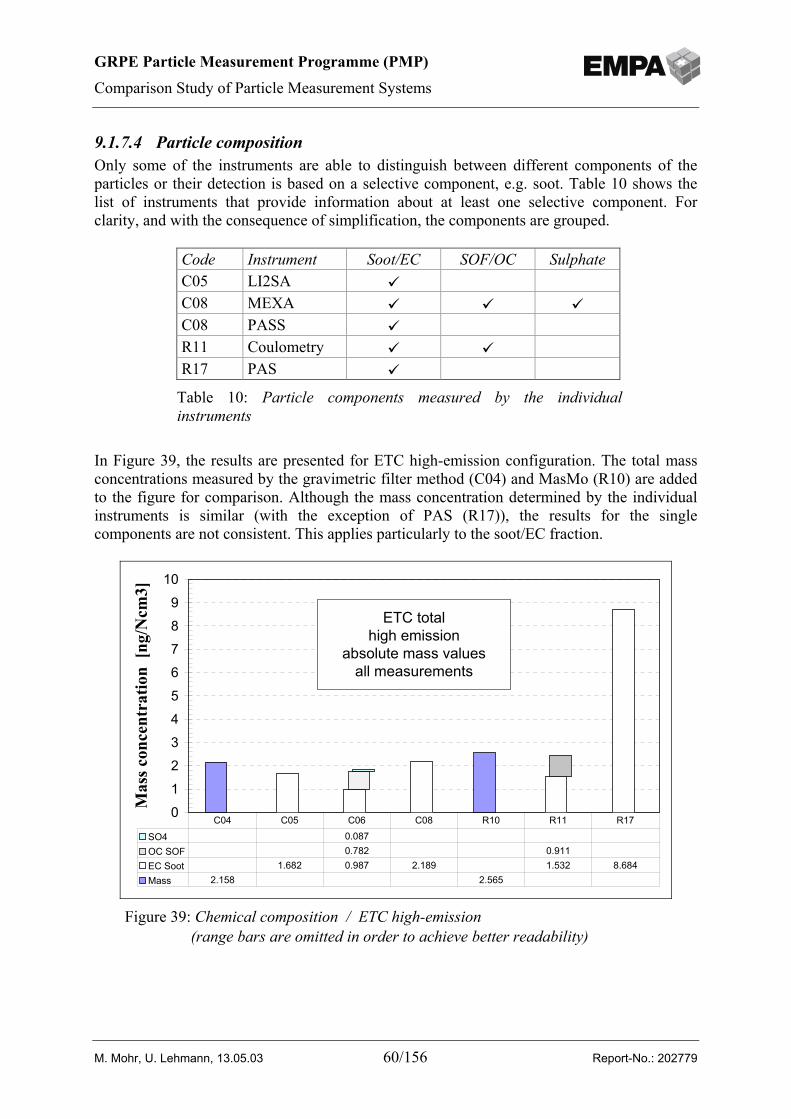
GRPE Particle Measurement Programme (PMP)
Comparison Study of Particle Measurement Systems
M. Mohr, U. Lehmann, 13.05.03 60/156 Report-No.: 202779
9.1.7.4 Particle compositionOnly some of the instruments are able to distinguish between different components of theparticles or their detection is based on a selective component, e.g. soot. Table 10 shows thelist of instruments that provide information about at least one selective component. Forclarity, and with the consequence of simplification, the components are grouped.
In Figure 39, the results are presented for ETC high-emission configuration. The total massconcentrations measured by the gravimetric filter method (C04) and MasMo (R10) are addedto the figure for comparison. Although the mass concentration determined by the individualinstruments is similar (with the exception of PAS (R17)), the results for the singlecomponents are not consistent. This applies particularly to the soot/EC fraction.
Code Instrument Soot/EC SOF/OC SulphateC05 LI2SAC08 MEXAC08 PASSR11 CoulometryR17 PAS
Table 10: Particle components measured by the individualinstruments
0123456789
10
Mas
s con
cent
ratio
n [n
g/N
cm3]
SO4 0.087OC SOF 0.782 0.911EC Soot 1.682 0.987 2.189 1.532 8.684Mass 2.158 2.565
C04 C05 C06 C08 R10 R11 R17
ETC totalhigh emission
absolute mass valuesall measurements
Figure 39: Chemical composition / ETC high-emission(range bars are omitted in order to achieve better readability)
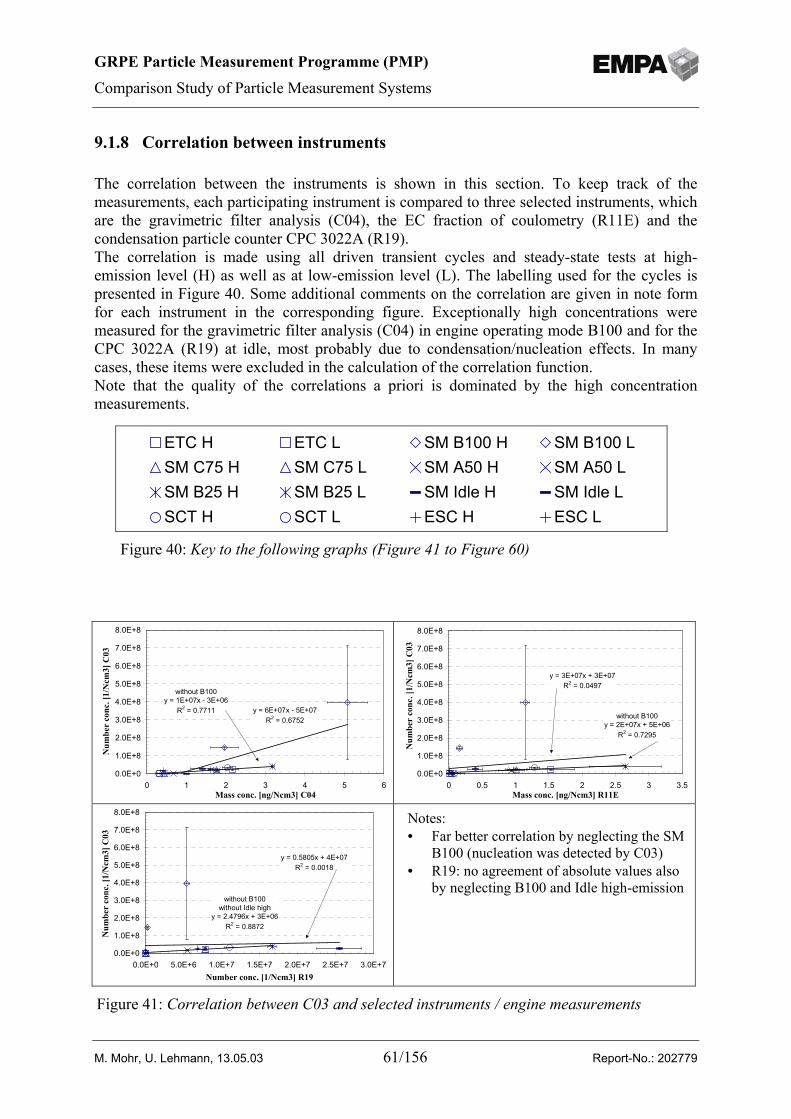
GRPE Particle Measurement Programme (PMP)
Comparison Study of Particle Measurement Systems
M. Mohr, U. Lehmann, 13.05.03 61/156 Report-No.: 202779
9.1.8 Correlation between instruments
The correlation between the instruments is shown in this section. To keep track of themeasurements, each participating instrument is compared to three selected instruments, whichare the gravimetric filter analysis (C04), the EC fraction of coulometry (R11E) and thecondensation particle counter CPC 3022A (R19).The correlation is made using all driven transient cycles and steady-state tests at high-emission level (H) as well as at low-emission level (L). The labelling used for the cycles ispresented in Figure 40. Some additional comments on the correlation are given in note formfor each instrument in the corresponding figure. Exceptionally high concentrations weremeasured for the gravimetric filter analysis (C04) in engine operating mode B100 and for theCPC 3022A (R19) at idle, most probably due to condensation/nucleation effects. In manycases, these items were excluded in the calculation of the correlation function.Note that the quality of the correlations a priori is dominated by the high concentrationmeasurements.
ETC H ETC L SM B100 H SM B100 LSM C75 H SM C75 L SM A50 H SM A50 LSM B25 H SM B25 L SM Idle H SM Idle LSCT H SCT L ESC H ESC L
Figure 40: Key to the following graphs (Figure 41 to Figure 60)
y = 6E+07x - 5E+07R2 = 0.6752
without B100y = 1E+07x - 3E+06
R2 = 0.7711
0.0E+0
1.0E+8
2.0E+8
3.0E+8
4.0E+8
5.0E+8
6.0E+8
7.0E+8
8.0E+8
0 1 2 3 4 5 6Mass conc. [ng/Ncm3] C04
Num
ber
conc
. [1/
Ncm
3] C
03
y = 3E+07x + 3E+07R2 = 0.0497
without B100y = 2E+07x + 5E+06
R2 = 0.7295
0.0E+0
1.0E+8
2.0E+8
3.0E+8
4.0E+8
5.0E+8
6.0E+8
7.0E+8
8.0E+8
0 0.5 1 1.5 2 2.5 3 3.5Mass conc. [ng/Ncm3] R11E
Num
ber
conc
. [1/
Ncm
3] C
03
y = 0.5805x + 4E+07R2 = 0.0018
without B100 without Idle high
y = 2.4796x + 3E+06R2 = 0.8872
0.0E+0
1.0E+8
2.0E+8
3.0E+8
4.0E+8
5.0E+8
6.0E+8
7.0E+8
8.0E+8
0.0E+0 5.0E+6 1.0E+7 1.5E+7 2.0E+7 2.5E+7 3.0E+7Number conc. [1/Ncm3] R19
Num
ber
conc
. [1/
Ncm
3] C
03
Notes:• Far better correlation by neglecting the SM
B100 (nucleation was detected by C03)• R19: no agreement of absolute values also
by neglecting B100 and Idle high-emission
Figure 41: Correlation between C03 and selected instruments / engine measurements
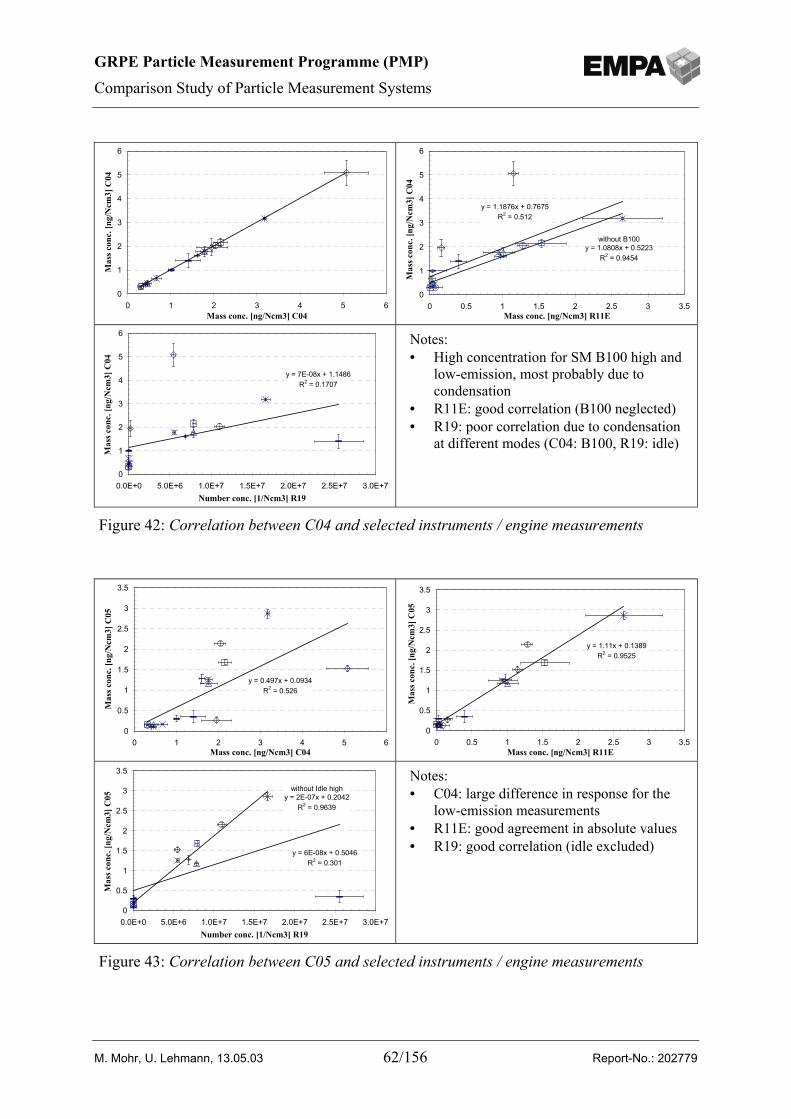
GRPE Particle Measurement Programme (PMP)
Comparison Study of Particle Measurement Systems
M. Mohr, U. Lehmann, 13.05.03 62/156 Report-No.: 202779
0
1
2
3
4
5
6
0 1 2 3 4 5 6Mass conc. [ng/Ncm3] C04
Mas
s con
c. [n
g/N
cm3]
C04
y = 1.1876x + 0.7675R2 = 0.512
without B100y = 1.0808x + 0.5223
R2 = 0.9454
0
1
2
3
4
5
6
0 0.5 1 1.5 2 2.5 3 3.5Mass conc. [ng/Ncm3] R11E
Mas
s con
c. [n
g/N
cm3]
C04
y = 7E-08x + 1.1486R2 = 0.1707
0
1
2
3
4
5
6
0.0E+0 5.0E+6 1.0E+7 1.5E+7 2.0E+7 2.5E+7 3.0E+7Number conc. [1/Ncm3] R19
Mas
s con
c. [n
g/N
cm3]
C04
Notes:• High concentration for SM B100 high and
low-emission, most probably due tocondensation
• R11E: good correlation (B100 neglected)• R19: poor correlation due to condensation
at different modes (C04: B100, R19: idle)
Figure 42: Correlation between C04 and selected instruments / engine measurements
y = 0.497x + 0.0934R2 = 0.526
0
0.5
1
1.5
2
2.5
3
3.5
0 1 2 3 4 5 6Mass conc. [ng/Ncm3] C04
Mas
s con
c. [n
g/N
cm3]
C05
y = 1.11x + 0.1389R2 = 0.9525
0
0.5
1
1.5
2
2.5
3
3.5
0 0.5 1 1.5 2 2.5 3 3.5Mass conc. [ng/Ncm3] R11E
Mas
s con
c. [n
g/N
cm3]
C05
y = 6E-08x + 0.5046R2 = 0.301
without Idle highy = 2E-07x + 0.2042
R2 = 0.9639
0
0.5
1
1.5
2
2.5
3
3.5
0.0E+0 5.0E+6 1.0E+7 1.5E+7 2.0E+7 2.5E+7 3.0E+7Number conc. [1/Ncm3] R19
Mas
s con
c. [n
g/N
cm3]
C05
Notes:• C04: large difference in response for the
low-emission measurements• R11E: good agreement in absolute values• R19: good correlation (idle excluded)
Figure 43: Correlation between C05 and selected instruments / engine measurements
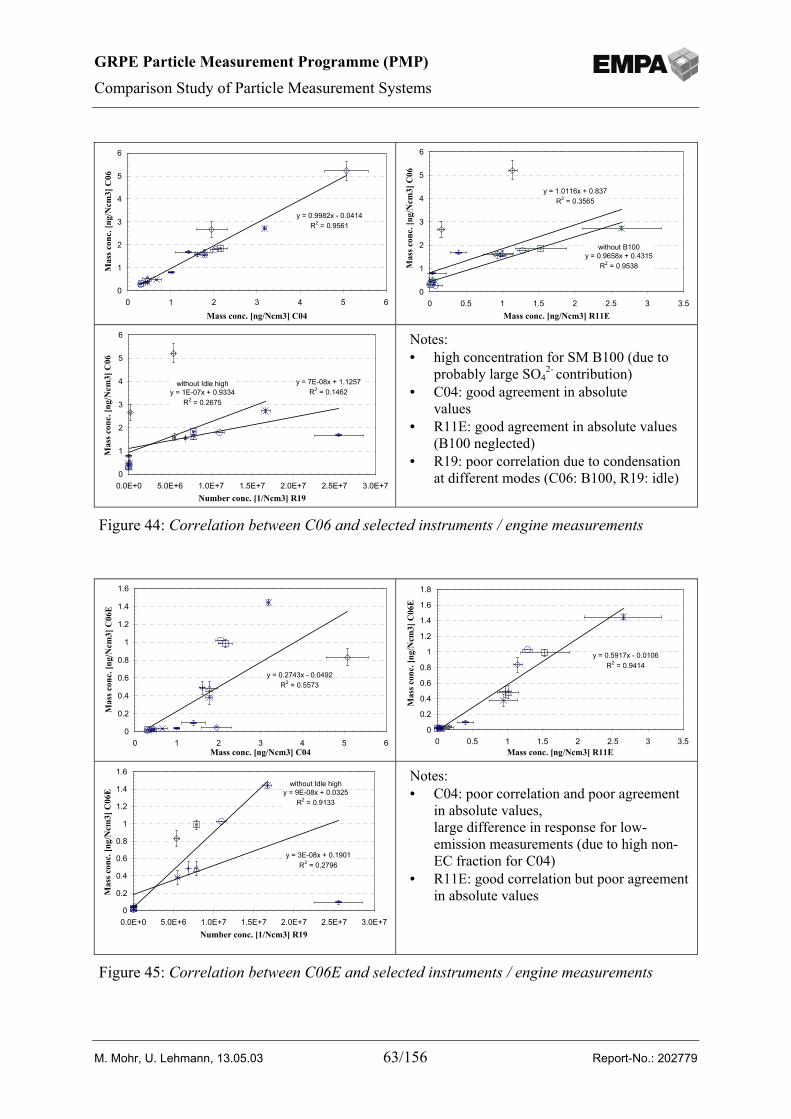
GRPE Particle Measurement Programme (PMP)
Comparison Study of Particle Measurement Systems
M. Mohr, U. Lehmann, 13.05.03 63/156 Report-No.: 202779
y = 0.9982x - 0.0414R2 = 0.9561
0
1
2
3
4
5
6
0 1 2 3 4 5 6
Mass conc. [ng/Ncm3] C04
Mas
s con
c. [n
g/N
cm3]
C06
y = 1.0116x + 0.837R2 = 0.3565
without B100y = 0.9658x + 0.4315
R2 = 0.9538
0
1
2
3
4
5
6
0 0.5 1 1.5 2 2.5 3 3.5Mass conc. [ng/Ncm3] R11E
Mas
s con
c. [n
g/N
cm3]
C06
y = 7E-08x + 1.1257R2 = 0.1462
without Idle highy = 1E-07x + 0.9334
R2 = 0.2675
0
1
2
3
4
5
6
0.0E+0 5.0E+6 1.0E+7 1.5E+7 2.0E+7 2.5E+7 3.0E+7Number conc. [1/Ncm3] R19
Mas
s con
c. [n
g/N
cm3]
C06
Notes:• high concentration for SM B100 (due to
probably large SO42- contribution)
• C04: good agreement in absolutevalues
• R11E: good agreement in absolute values(B100 neglected)
• R19: poor correlation due to condensationat different modes (C06: B100, R19: idle)
Figure 44: Correlation between C06 and selected instruments / engine measurements
y = 0.2743x - 0.0492R2 = 0.5573
0
0.2
0.4
0.6
0.8
1
1.2
1.4
1.6
0 1 2 3 4 5 6Mass conc. [ng/Ncm3] C04
Mas
s con
c. [n
g/N
cm3]
C06
E
y = 0.5917x - 0.0106R2 = 0.9414
0
0.2
0.4
0.6
0.8
1
1.2
1.4
1.6
1.8
0 0.5 1 1.5 2 2.5 3 3.5Mass conc. [ng/Ncm3] R11E
Mas
s con
c. [n
g/N
cm3]
C06
E
y = 3E-08x + 0.1901R2 = 0.2796
without Idle highy = 9E-08x + 0.0325
R2 = 0.9133
0
0.2
0.4
0.6
0.8
1
1.2
1.4
1.6
0.0E+0 5.0E+6 1.0E+7 1.5E+7 2.0E+7 2.5E+7 3.0E+7Number conc. [1/Ncm3] R19
Mas
s con
c. [n
g/N
cm3]
C06
E
Notes:• C04: poor correlation and poor agreement
in absolute values,large difference in response for low-emission measurements (due to high non-EC fraction for C04)
• R11E: good correlation but poor agreementin absolute values
Figure 45: Correlation between C06E and selected instruments / engine measurements
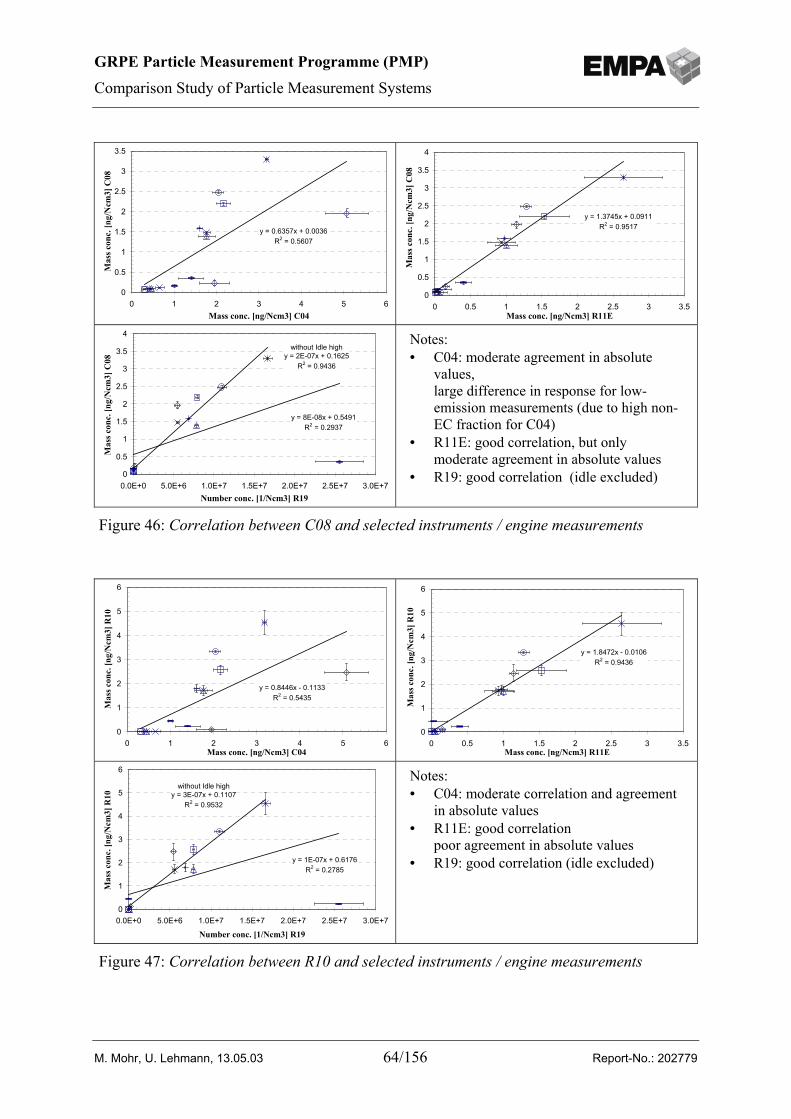
GRPE Particle Measurement Programme (PMP)
Comparison Study of Particle Measurement Systems
M. Mohr, U. Lehmann, 13.05.03 64/156 Report-No.: 202779
y = 0.6357x + 0.0036R2 = 0.5607
0
0.5
1
1.5
2
2.5
3
3.5
0 1 2 3 4 5 6Mass conc. [ng/Ncm3] C04
Mas
s con
c. [n
g/N
cm3]
C08
y = 1.3745x + 0.0911R2 = 0.9517
0
0.5
1
1.5
2
2.5
3
3.5
4
0 0.5 1 1.5 2 2.5 3 3.5Mass conc. [ng/Ncm3] R11E
Mas
s con
c. [n
g/N
cm3]
C08
y = 8E-08x + 0.5491R2 = 0.2937
without Idle highy = 2E-07x + 0.1625
R2 = 0.9436
0
0.5
1
1.5
2
2.5
3
3.5
4
0.0E+0 5.0E+6 1.0E+7 1.5E+7 2.0E+7 2.5E+7 3.0E+7Number conc. [1/Ncm3] R19
Mas
s con
c. [n
g/N
cm3]
C08
Notes:• C04: moderate agreement in absolute
values,large difference in response for low-emission measurements (due to high non-EC fraction for C04)
• R11E: good correlation, but onlymoderate agreement in absolute values
• R19: good correlation (idle excluded)
Figure 46: Correlation between C08 and selected instruments / engine measurements
y = 0.8446x - 0.1133R2 = 0.5435
0
1
2
3
4
5
6
0 1 2 3 4 5 6Mass conc. [ng/Ncm3] C04
Mas
s con
c. [n
g/N
cm3]
R10
y = 1.8472x - 0.0106R2 = 0.9436
0
1
2
3
4
5
6
0 0.5 1 1.5 2 2.5 3 3.5Mass conc. [ng/Ncm3] R11E
Mas
s con
c. [n
g/N
cm3]
R10
y = 1E-07x + 0.6176R2 = 0.2785
without Idle highy = 3E-07x + 0.1107
R2 = 0.9532
0
1
2
3
4
5
6
0.0E+0 5.0E+6 1.0E+7 1.5E+7 2.0E+7 2.5E+7 3.0E+7
Number conc. [1/Ncm3] R19
Mas
s con
c. [n
g/N
cm3]
R10
Notes:• C04: moderate correlation and agreement
in absolute values• R11E: good correlation
poor agreement in absolute values• R19: good correlation (idle excluded)
Figure 47: Correlation between R10 and selected instruments / engine measurements
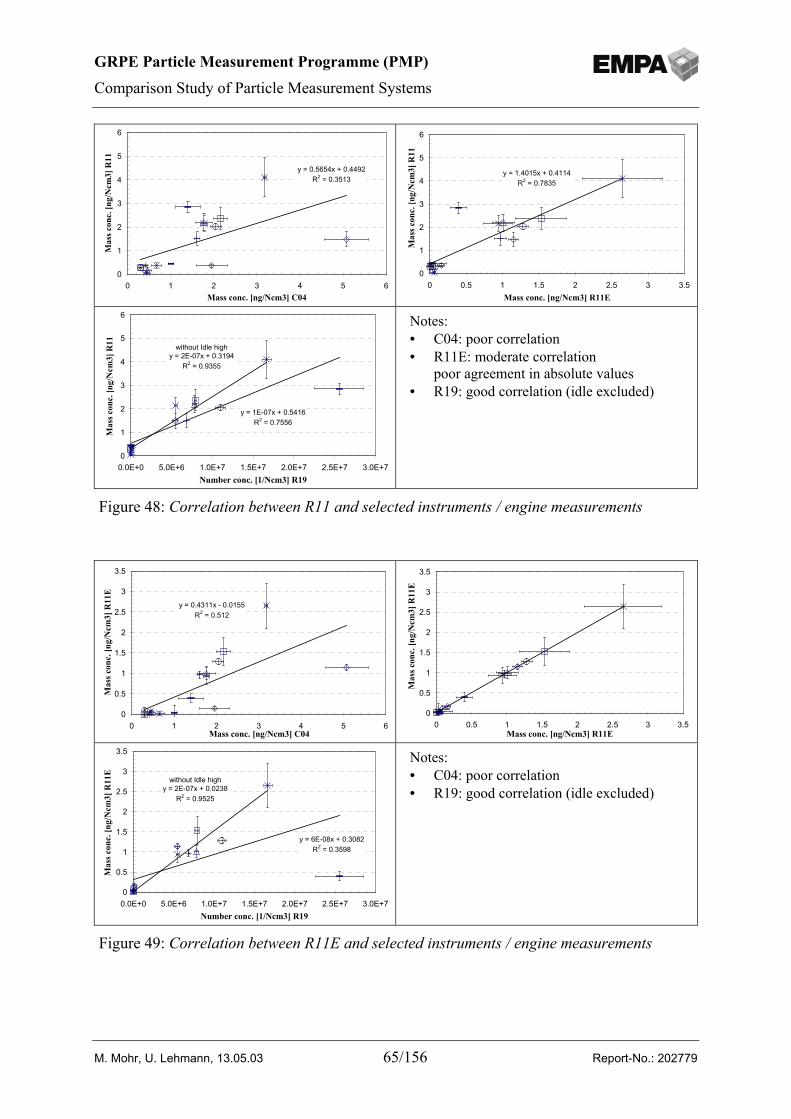
GRPE Particle Measurement Programme (PMP)
Comparison Study of Particle Measurement Systems
M. Mohr, U. Lehmann, 13.05.03 65/156 Report-No.: 202779
y = 0.5654x + 0.4492R2 = 0.3513
0
1
2
3
4
5
6
0 1 2 3 4 5 6Mass conc. [ng/Ncm3] C04
Mas
s con
c. [n
g/N
cm3]
R11
y = 1.4015x + 0.4114R2 = 0.7835
0
1
2
3
4
5
6
0 0.5 1 1.5 2 2.5 3 3.5Mass conc. [ng/Ncm3] R11E
Mas
s con
c. [n
g/N
cm3]
R11
y = 1E-07x + 0.5416R2 = 0.7556
without Idle highy = 2E-07x + 0.3194
R2 = 0.9355
0
1
2
3
4
5
6
0.0E+0 5.0E+6 1.0E+7 1.5E+7 2.0E+7 2.5E+7 3.0E+7Number conc. [1/Ncm3] R19
Mas
s con
c. [n
g/N
cm3]
R11
Notes:• C04: poor correlation• R11E: moderate correlation
poor agreement in absolute values• R19: good correlation (idle excluded)
Figure 48: Correlation between R11 and selected instruments / engine measurements
y = 0.4311x - 0.0155R2 = 0.512
0
0.5
1
1.5
2
2.5
3
3.5
0 1 2 3 4 5 6Mass conc. [ng/Ncm3] C04
Mas
s con
c. [n
g/N
cm3]
R11
E
0
0.5
1
1.5
2
2.5
3
3.5
0 0.5 1 1.5 2 2.5 3 3.5Mass conc. [ng/Ncm3] R11E
Mas
s con
c. [n
g/N
cm3]
R11
E
y = 6E-08x + 0.3082R2 = 0.3598
without Idle highy = 2E-07x + 0.0238
R2 = 0.9525
0
0.5
1
1.5
2
2.5
3
3.5
0.0E+0 5.0E+6 1.0E+7 1.5E+7 2.0E+7 2.5E+7 3.0E+7Number conc. [1/Ncm3] R19
Mas
s con
c. [n
g/N
cm3]
R11
E
Notes:• C04: poor correlation• R19: good correlation (idle excluded)
Figure 49: Correlation between R11E and selected instruments / engine measurements
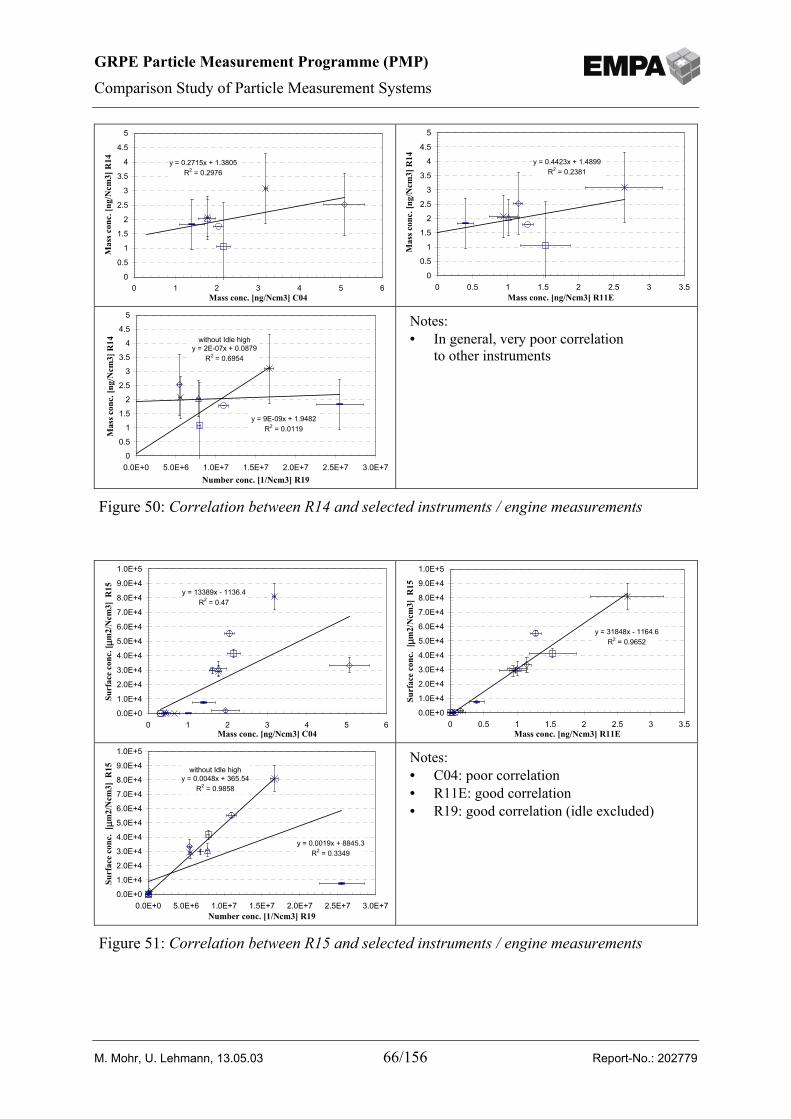
GRPE Particle Measurement Programme (PMP)
Comparison Study of Particle Measurement Systems
M. Mohr, U. Lehmann, 13.05.03 66/156 Report-No.: 202779
y = 0.2715x + 1.3805R2 = 0.2976
0
0.5
1
1.5
2
2.5
3
3.5
4
4.5
5
0 1 2 3 4 5 6Mass conc. [ng/Ncm3] C04
Mas
s con
c. [n
g/N
cm3]
R14 y = 0.4423x + 1.4899
R2 = 0.2381
0
0.5
1
1.5
2
2.5
3
3.5
4
4.5
5
0 0.5 1 1.5 2 2.5 3 3.5Mass conc. [ng/Ncm3] R11E
Mas
s con
c. [n
g/N
cm3]
R14
y = 9E-09x + 1.9482R2 = 0.0119
without Idle highy = 2E-07x + 0.0879
R2 = 0.6954
0
0.5
1
1.5
2
2.5
3
3.5
4
4.5
5
0.0E+0 5.0E+6 1.0E+7 1.5E+7 2.0E+7 2.5E+7 3.0E+7Number conc. [1/Ncm3] R19
Mas
s con
c. [n
g/N
cm3]
R14
Notes:• In general, very poor correlation
to other instruments
Figure 50: Correlation between R14 and selected instruments / engine measurements
y = 13389x - 1136.4R2 = 0.47
0.0E+0
1.0E+4
2.0E+4
3.0E+4
4.0E+4
5.0E+4
6.0E+4
7.0E+4
8.0E+4
9.0E+4
1.0E+5
0 1 2 3 4 5 6Mass conc. [ng/Ncm3] C04
Surf
ace
conc
. [µm
2/N
cm3]
R15
y = 31848x - 1164.6R2 = 0.9652
0.0E+0
1.0E+4
2.0E+4
3.0E+4
4.0E+4
5.0E+4
6.0E+4
7.0E+4
8.0E+4
9.0E+4
1.0E+5
0 0.5 1 1.5 2 2.5 3 3.5Mass conc. [ng/Ncm3] R11E
Surf
ace
conc
. [ µ
m2/
Ncm
3] R
15
y = 0.0019x + 8845.3R2 = 0.3349
without Idle highy = 0.0048x + 365.54
R2 = 0.9858
0.0E+0
1.0E+4
2.0E+4
3.0E+4
4.0E+4
5.0E+4
6.0E+4
7.0E+4
8.0E+4
9.0E+4
1.0E+5
0.0E+0 5.0E+6 1.0E+7 1.5E+7 2.0E+7 2.5E+7 3.0E+7Number conc. [1/Ncm3] R19
Surf
ace
conc
. [ µ
m2/
Ncm
3] R
15
Notes:• C04: poor correlation• R11E: good correlation• R19: good correlation (idle excluded)
Figure 51: Correlation between R15 and selected instruments / engine measurements
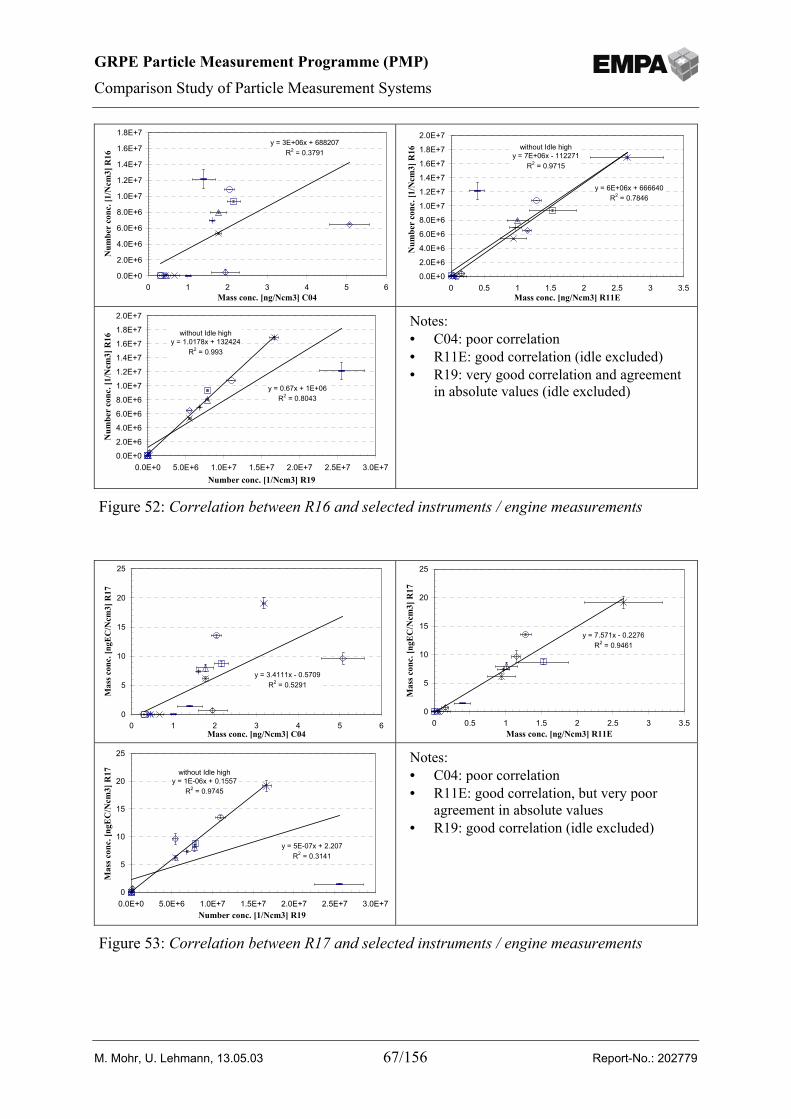
GRPE Particle Measurement Programme (PMP)
Comparison Study of Particle Measurement Systems
M. Mohr, U. Lehmann, 13.05.03 67/156 Report-No.: 202779
y = 3E+06x + 688207R2 = 0.3791
0.0E+0
2.0E+6
4.0E+6
6.0E+6
8.0E+6
1.0E+7
1.2E+7
1.4E+7
1.6E+7
1.8E+7
0 1 2 3 4 5 6Mass conc. [ng/Ncm3] C04
Num
ber
conc
. [1/
Ncm
3] R
16
y = 6E+06x + 666640R2 = 0.7846
without Idle highy = 7E+06x - 112271
R2 = 0.9715
0.0E+0
2.0E+6
4.0E+6
6.0E+6
8.0E+6
1.0E+7
1.2E+7
1.4E+7
1.6E+7
1.8E+7
2.0E+7
0 0.5 1 1.5 2 2.5 3 3.5Mass conc. [ng/Ncm3] R11E
Num
ber
conc
. [1/
Ncm
3] R
16
y = 0.67x + 1E+06R2 = 0.8043
without Idle highy = 1.0178x + 132424
R2 = 0.993
0.0E+0
2.0E+6
4.0E+6
6.0E+6
8.0E+6
1.0E+7
1.2E+7
1.4E+7
1.6E+7
1.8E+7
2.0E+7
0.0E+0 5.0E+6 1.0E+7 1.5E+7 2.0E+7 2.5E+7 3.0E+7Number conc. [1/Ncm3] R19
Num
ber
conc
. [1/
Ncm
3] R
16
Notes:• C04: poor correlation• R11E: good correlation (idle excluded)• R19: very good correlation and agreement
in absolute values (idle excluded)
Figure 52: Correlation between R16 and selected instruments / engine measurements
y = 3.4111x - 0.5709R2 = 0.5291
0
5
10
15
20
25
0 1 2 3 4 5 6Mass conc. [ng/Ncm3] C04
Mas
s con
c. [n
gEC
/Ncm
3] R
17
y = 7.571x - 0.2276R2 = 0.9461
0
5
10
15
20
25
0 0.5 1 1.5 2 2.5 3 3.5Mass conc. [ng/Ncm3] R11E
Mas
s con
c. [n
gEC
/Ncm
3] R
17
y = 5E-07x + 2.207R2 = 0.3141
without Idle highy = 1E-06x + 0.1557
R2 = 0.9745
0
5
10
15
20
25
0.0E+0 5.0E+6 1.0E+7 1.5E+7 2.0E+7 2.5E+7 3.0E+7Number conc. [1/Ncm3] R19
Mas
s con
c. [n
gEC
/Ncm
3] R
17
Notes:• C04: poor correlation• R11E: good correlation, but very poor
agreement in absolute values• R19: good correlation (idle excluded)
Figure 53: Correlation between R17 and selected instruments / engine measurements
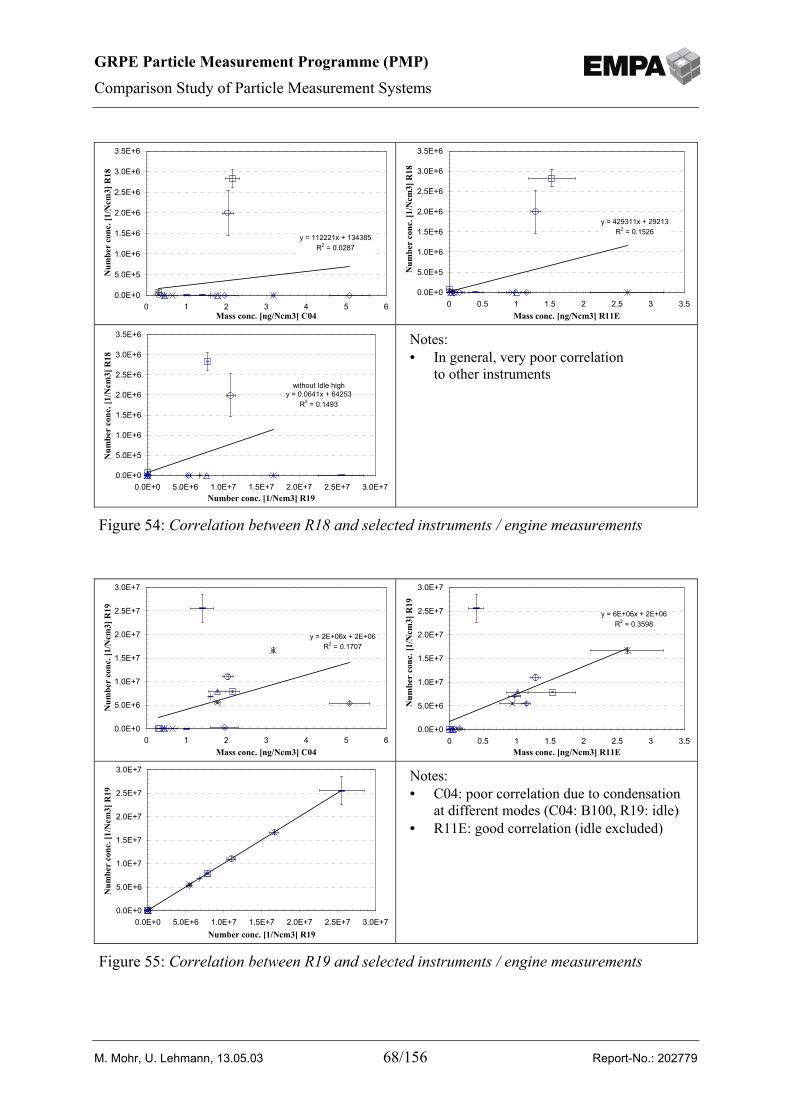
GRPE Particle Measurement Programme (PMP)
Comparison Study of Particle Measurement Systems
M. Mohr, U. Lehmann, 13.05.03 68/156 Report-No.: 202779
y = 112221x + 134385R2 = 0.0287
0.0E+0
5.0E+5
1.0E+6
1.5E+6
2.0E+6
2.5E+6
3.0E+6
3.5E+6
0 1 2 3 4 5 6Mass conc. [ng/Ncm3] C04
Num
ber
conc
. [1/
Ncm
3] R
18
y = 429311x + 29213R2 = 0.1526
0.0E+0
5.0E+5
1.0E+6
1.5E+6
2.0E+6
2.5E+6
3.0E+6
3.5E+6
0 0.5 1 1.5 2 2.5 3 3.5Mass conc. [ng/Ncm3] R11E
Num
ber
conc
. [1/
Ncm
3] R
18
without Idle highy = 0.0641x + 64253
R2 = 0.1493
0.0E+0
5.0E+5
1.0E+6
1.5E+6
2.0E+6
2.5E+6
3.0E+6
3.5E+6
0.0E+0 5.0E+6 1.0E+7 1.5E+7 2.0E+7 2.5E+7 3.0E+7Number conc. [1/Ncm3] R19
Num
ber
conc
. [1/
Ncm
3] R
18
Notes:• In general, very poor correlation
to other instruments
Figure 54: Correlation between R18 and selected instruments / engine measurements
y = 2E+06x + 2E+06R2 = 0.1707
0.0E+0
5.0E+6
1.0E+7
1.5E+7
2.0E+7
2.5E+7
3.0E+7
0 1 2 3 4 5 6Mass conc. [ng/Ncm3] C04
Num
ber
conc
. [1/
Ncm
3] R
19 y = 6E+06x + 2E+06R2 = 0.3598
0.0E+0
5.0E+6
1.0E+7
1.5E+7
2.0E+7
2.5E+7
3.0E+7
0 0.5 1 1.5 2 2.5 3 3.5Mass conc. [ng/Ncm3] R11E
Num
ber
conc
. [1/
Ncm
3] R
19
0.0E+0
5.0E+6
1.0E+7
1.5E+7
2.0E+7
2.5E+7
3.0E+7
0.0E+0 5.0E+6 1.0E+7 1.5E+7 2.0E+7 2.5E+7 3.0E+7Number conc. [1/Ncm3] R19
Num
ber
conc
. [1/
Ncm
3] R
19
Notes:• C04: poor correlation due to condensation
at different modes (C04: B100, R19: idle)• R11E: good correlation (idle excluded)
Figure 55: Correlation between R19 and selected instruments / engine measurements
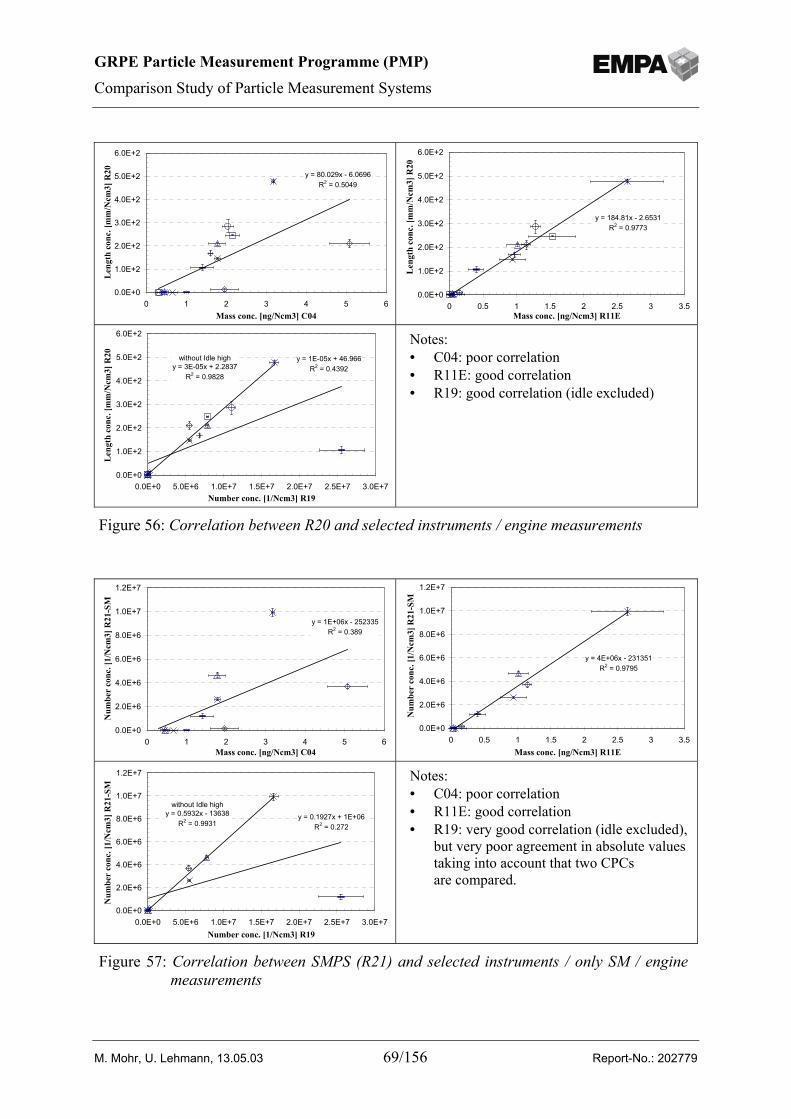
GRPE Particle Measurement Programme (PMP)
Comparison Study of Particle Measurement Systems
M. Mohr, U. Lehmann, 13.05.03 69/156 Report-No.: 202779
y = 80.029x - 6.0696R2 = 0.5049
0.0E+0
1.0E+2
2.0E+2
3.0E+2
4.0E+2
5.0E+2
6.0E+2
0 1 2 3 4 5 6Mass conc. [ng/Ncm3] C04
Len
gth
conc
. [m
m/N
cm3]
R20
y = 184.81x - 2.6531R2 = 0.9773
0.0E+0
1.0E+2
2.0E+2
3.0E+2
4.0E+2
5.0E+2
6.0E+2
0 0.5 1 1.5 2 2.5 3 3.5Mass conc. [ng/Ncm3] R11E
Len
gth
conc
. [m
m/N
cm3]
R20
y = 1E-05x + 46.966R2 = 0.4392
without Idle highy = 3E-05x + 2.2837
R2 = 0.9828
0.0E+0
1.0E+2
2.0E+2
3.0E+2
4.0E+2
5.0E+2
6.0E+2
0.0E+0 5.0E+6 1.0E+7 1.5E+7 2.0E+7 2.5E+7 3.0E+7Number conc. [1/Ncm3] R19
Len
gth
conc
. [m
m/N
cm3]
R20
Notes:• C04: poor correlation• R11E: good correlation• R19: good correlation (idle excluded)
Figure 56: Correlation between R20 and selected instruments / engine measurements
y = 1E+06x - 252335R2 = 0.389
0.0E+0
2.0E+6
4.0E+6
6.0E+6
8.0E+6
1.0E+7
1.2E+7
0 1 2 3 4 5 6Mass conc. [ng/Ncm3] C04
Num
ber
conc
. [1/
Ncm
3] R
21-S
M
y = 4E+06x - 231351R2 = 0.9795
0.0E+0
2.0E+6
4.0E+6
6.0E+6
8.0E+6
1.0E+7
1.2E+7
0 0.5 1 1.5 2 2.5 3 3.5Mass conc. [ng/Ncm3] R11E
Num
ber
conc
. [1/
Ncm
3] R
21-S
M
y = 0.1927x + 1E+06R2 = 0.272
without Idle highy = 0.5932x - 13638
R2 = 0.9931
0.0E+0
2.0E+6
4.0E+6
6.0E+6
8.0E+6
1.0E+7
1.2E+7
0.0E+0 5.0E+6 1.0E+7 1.5E+7 2.0E+7 2.5E+7 3.0E+7Number conc. [1/Ncm3] R19
Num
ber
conc
. [1/
Ncm
3] R
21-S
M
Notes:• C04: poor correlation• R11E: good correlation• R19: very good correlation (idle excluded),
but very poor agreement in absolute valuestaking into account that two CPCsare compared.
Figure 57: Correlation between SMPS (R21) and selected instruments / only SM / enginemeasurements
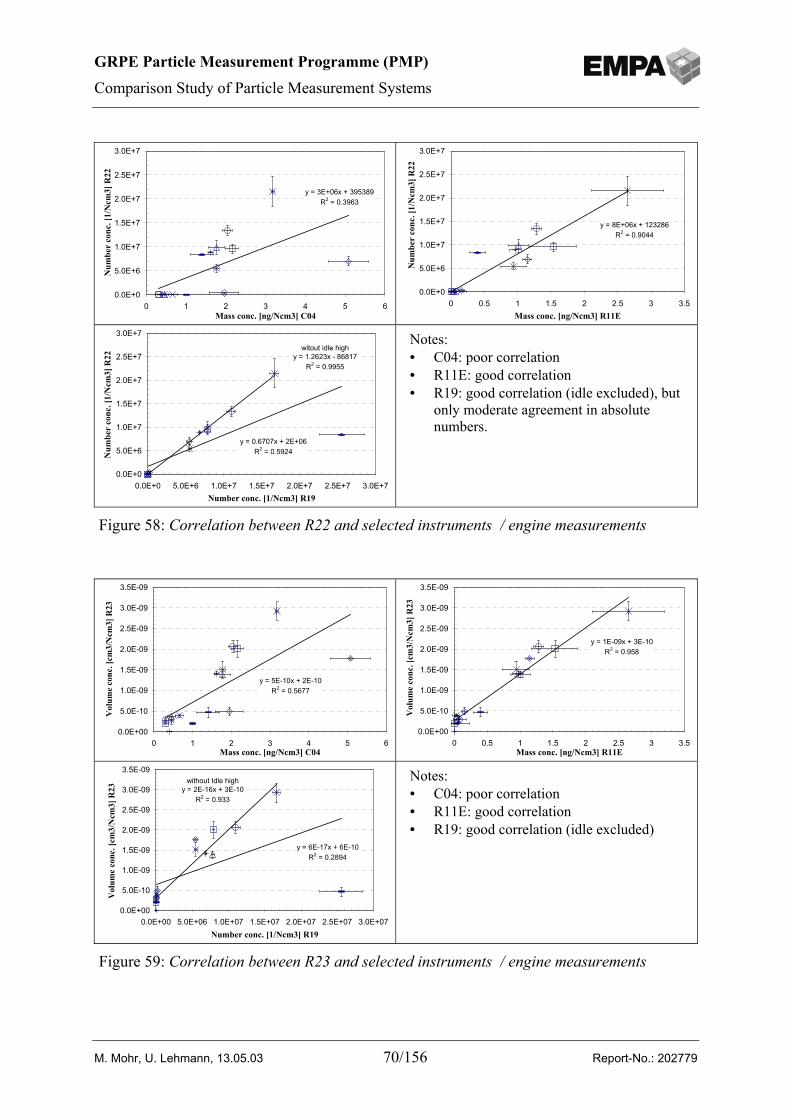
GRPE Particle Measurement Programme (PMP)
Comparison Study of Particle Measurement Systems
M. Mohr, U. Lehmann, 13.05.03 70/156 Report-No.: 202779
y = 3E+06x + 395389R2 = 0.3963
0.0E+0
5.0E+6
1.0E+7
1.5E+7
2.0E+7
2.5E+7
3.0E+7
0 1 2 3 4 5 6Mass conc. [ng/Ncm3] C04
Num
ber
conc
. [1/
Ncm
3] R
22
y = 8E+06x + 123286R2 = 0.9044
0.0E+0
5.0E+6
1.0E+7
1.5E+7
2.0E+7
2.5E+7
3.0E+7
0 0.5 1 1.5 2 2.5 3 3.5Mass conc. [ng/Ncm3] R11E
Num
ber
conc
. [1/
Ncm
3] R
22
y = 0.6707x + 2E+06R2 = 0.5924
witout idle highy = 1.2623x - 86817
R2 = 0.9955
0.0E+0
5.0E+6
1.0E+7
1.5E+7
2.0E+7
2.5E+7
3.0E+7
0.0E+0 5.0E+6 1.0E+7 1.5E+7 2.0E+7 2.5E+7 3.0E+7Number conc. [1/Ncm3] R19
Num
ber
conc
. [1/
Ncm
3] R
22
Notes:• C04: poor correlation• R11E: good correlation• R19: good correlation (idle excluded), but
only moderate agreement in absolutenumbers.
Figure 58: Correlation between R22 and selected instruments / engine measurements
y = 5E-10x + 2E-10R2 = 0.5677
0.0E+00
5.0E-10
1.0E-09
1.5E-09
2.0E-09
2.5E-09
3.0E-09
3.5E-09
0 1 2 3 4 5 6Mass conc. [ng/Ncm3] C04
Vol
ume
conc
. [cm
3/N
cm3]
R23
y = 1E-09x + 3E-10R2 = 0.958
0.0E+00
5.0E-10
1.0E-09
1.5E-09
2.0E-09
2.5E-09
3.0E-09
3.5E-09
0 0.5 1 1.5 2 2.5 3 3.5Mass conc. [ng/Ncm3] R11E
Vol
ume
conc
. [cm
3/N
cm3]
R23
y = 6E-17x + 6E-10R2 = 0.2894
without Idle highy = 2E-16x + 3E-10
R2 = 0.933
0.0E+00
5.0E-10
1.0E-09
1.5E-09
2.0E-09
2.5E-09
3.0E-09
3.5E-09
0.0E+00 5.0E+06 1.0E+07 1.5E+07 2.0E+07 2.5E+07 3.0E+07Number conc. [1/Ncm3] R19
Vol
ume
conc
. [cm
3/N
cm3]
R23
Notes:• C04: poor correlation• R11E: good correlation• R19: good correlation (idle excluded)
Figure 59: Correlation between R23 and selected instruments / engine measurements
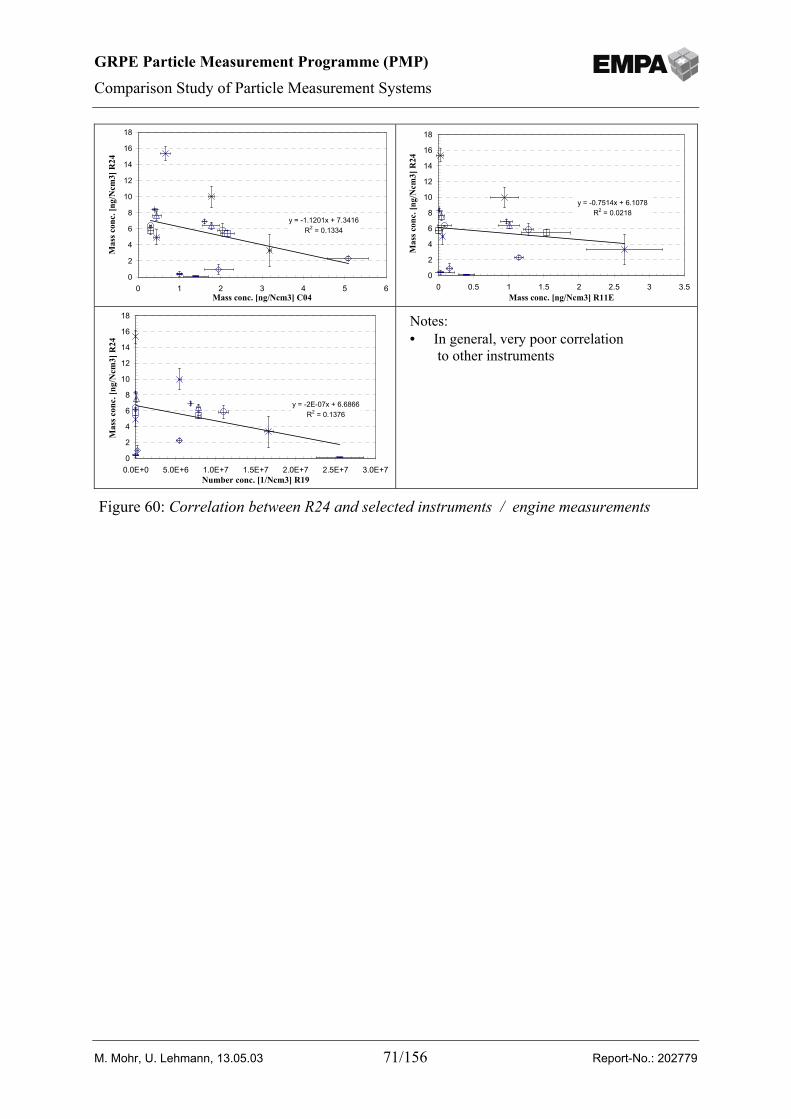
GRPE Particle Measurement Programme (PMP)
Comparison Study of Particle Measurement Systems
M. Mohr, U. Lehmann, 13.05.03 71/156 Report-No.: 202779
y = -1.1201x + 7.3416R2 = 0.1334
0
2
4
6
8
10
12
14
16
18
0 1 2 3 4 5 6Mass conc. [ng/Ncm3] C04
Mas
s con
c. [n
g/N
cm3]
R24
y = -0.7514x + 6.1078R2 = 0.0218
0
2
4
6
8
10
12
14
16
18
0 0.5 1 1.5 2 2.5 3 3.5Mass conc. [ng/Ncm3] R11E
Mas
s con
c. [n
g/N
cm3]
R24
y = -2E-07x + 6.6866R2 = 0.1376
0
2
4
6
8
10
12
14
16
18
0.0E+0 5.0E+6 1.0E+7 1.5E+7 2.0E+7 2.5E+7 3.0E+7Number conc. [1/Ncm3] R19
Mas
s con
c. [n
g/N
cm3]
R24
Notes:• In general, very poor correlation
to other instruments
Figure 60: Correlation between R24 and selected instruments / engine measurements
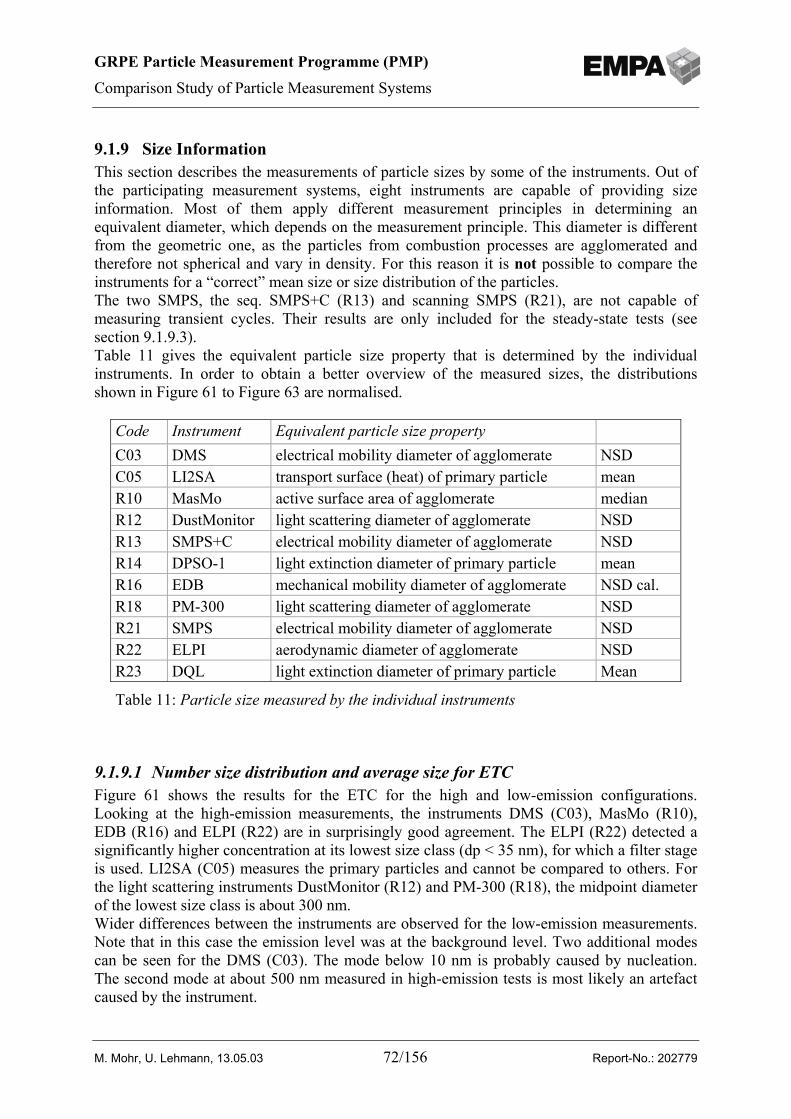
GRPE Particle Measurement Programme (PMP)
Comparison Study of Particle Measurement Systems
M. Mohr, U. Lehmann, 13.05.03 72/156 Report-No.: 202779
9.1.9 Size InformationThis section describes the measurements of particle sizes by some of the instruments. Out ofthe participating measurement systems, eight instruments are capable of providing sizeinformation. Most of them apply different measurement principles in determining anequivalent diameter, which depends on the measurement principle. This diameter is differentfrom the geometric one, as the particles from combustion processes are agglomerated andtherefore not spherical and vary in density. For this reason it is not possible to compare theinstruments for a “correct” mean size or size distribution of the particles.The two SMPS, the seq. SMPS+C (R13) and scanning SMPS (R21), are not capable ofmeasuring transient cycles. Their results are only included for the steady-state tests (seesection 9.1.9.3).Table 11 gives the equivalent particle size property that is determined by the individualinstruments. In order to obtain a better overview of the measured sizes, the distributionsshown in Figure 61 to Figure 63 are normalised.
9.1.9.1 Number size distribution and average size for ETCFigure 61 shows the results for the ETC for the high and low-emission configurations.Looking at the high-emission measurements, the instruments DMS (C03), MasMo (R10),EDB (R16) and ELPI (R22) are in surprisingly good agreement. The ELPI (R22) detected asignificantly higher concentration at its lowest size class (dp < 35 nm), for which a filter stageis used. LI2SA (C05) measures the primary particles and cannot be compared to others. Forthe light scattering instruments DustMonitor (R12) and PM-300 (R18), the midpoint diameterof the lowest size class is about 300 nm.Wider differences between the instruments are observed for the low-emission measurements.Note that in this case the emission level was at the background level. Two additional modescan be seen for the DMS (C03). The mode below 10 nm is probably caused by nucleation.The second mode at about 500 nm measured in high-emission tests is most likely an artefactcaused by the instrument.
Code Instrument Equivalent particle size propertyC03 DMS electrical mobility diameter of agglomerate NSDC05 LI2SA transport surface (heat) of primary particle meanR10 MasMo active surface area of agglomerate medianR12 DustMonitor light scattering diameter of agglomerate NSDR13 SMPS+C electrical mobility diameter of agglomerate NSDR14 DPSO-1 light extinction diameter of primary particle meanR16 EDB mechanical mobility diameter of agglomerate NSD cal.R18 PM-300 light scattering diameter of agglomerate NSDR21 SMPS electrical mobility diameter of agglomerate NSDR22 ELPI aerodynamic diameter of agglomerate NSDR23 DQL light extinction diameter of primary particle Mean
Table 11: Particle size measured by the individual instruments
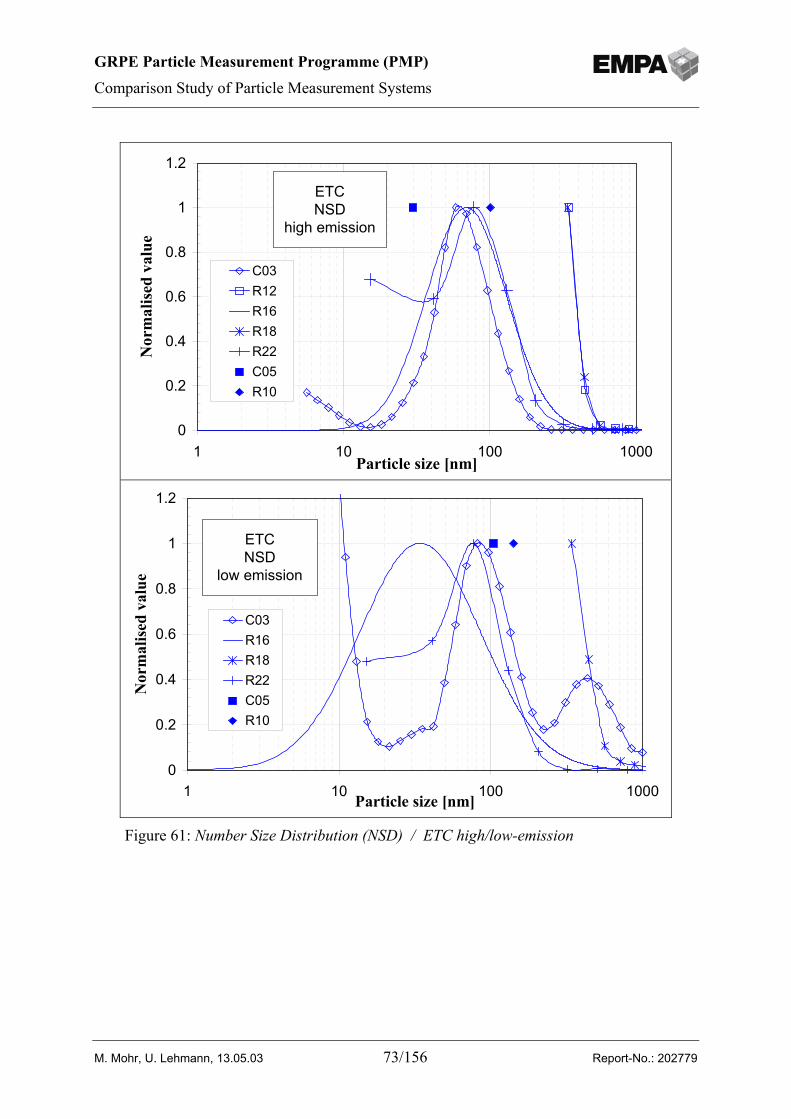
GRPE Particle Measurement Programme (PMP)
Comparison Study of Particle Measurement Systems
M. Mohr, U. Lehmann, 13.05.03 73/156 Report-No.: 202779
0
0.2
0.4
0.6
0.8
1
1.2
1 10 100 1000Particle size [nm]
Nor
mal
ised
val
ue
C03R12R16R18R22C05R10
ETCNSD
high emission
0
0.2
0.4
0.6
0.8
1
1.2
1 10 100 1000Particle size [nm]
Nor
mal
ised
val
ue
C03R16R18R22C05R10
ETCNSD
low emission
Figure 61: Number Size Distribution (NSD) / ETC high/low-emission
GRPE Particle Measurement Programme (PMP)
Comparison Study of Particle Measurement Systems
M. Mohr, U. Lehmann, 13.05.03 74/156 Report-No.: 202779
9.1.9.2 Number size distribution and average size for ESCFigure 62 shows the results for the size measurements for the ESC for high and low-emissionset-up. The NSD, mean and median represent the weighted average over the ESC. Allinstruments measure the particles in the same size range as for the ETC. DMS (C03) detectsmore nucleates for both emission levels for this test cycle. No data from LIS2A (C05) wereavailable for the low-emission set-up.
0
0.2
0.4
0.6
0.8
1
1.2
1 10 100 1000Particle size [nm]
Nor
mal
ised
val
ue
C03R12R16R18R22C05R10
ESCNSD
high emission
0
0.2
0.4
0.6
0.8
1
1.2
1 10 100 1000Particle size [nm]
Nor
mal
ised
val
ue
C03
R16
R18
R22
R10
ESCNSD
low emission
Figure 62: Number Size Distribution (NSD) / ESC high/low-emission
GRPE Particle Measurement Programme (PMP)
Comparison Study of Particle Measurement Systems
M. Mohr, U. Lehmann, 13.05.03 75/156 Report-No.: 202779
9.1.9.3 Number size distribution and average size for single modesFigure 63 plots the number size distributions, mean and median as measured by theinstruments during a high-load mode (C75) and a low-load mode (B25) of the engine. Theresults of the other single modes are shown in the appendix. The diagrams include data fromthe two mobility particle sizers (R13, R21). In general, good agreement between theinstruments is observed with the exception of the optical instruments (R12, R18). It is notablethat the DMS (C03) measures a significantly smaller width of the distributions than the otherinstruments. The seq. SMPS+C (R13) is the only instrument that shows a large particle modeat about 250 nm. This is in all probability an artefact originated by the instrument. For the fulltrap set-up single mode B25, the concentration is very low, resulting in wide scatter,especially for the DMS (C03). As already noted for the ETC and ESC, the ELPI (R22)measures fairly high concentrations with its filter stage for the high-emission set-up.
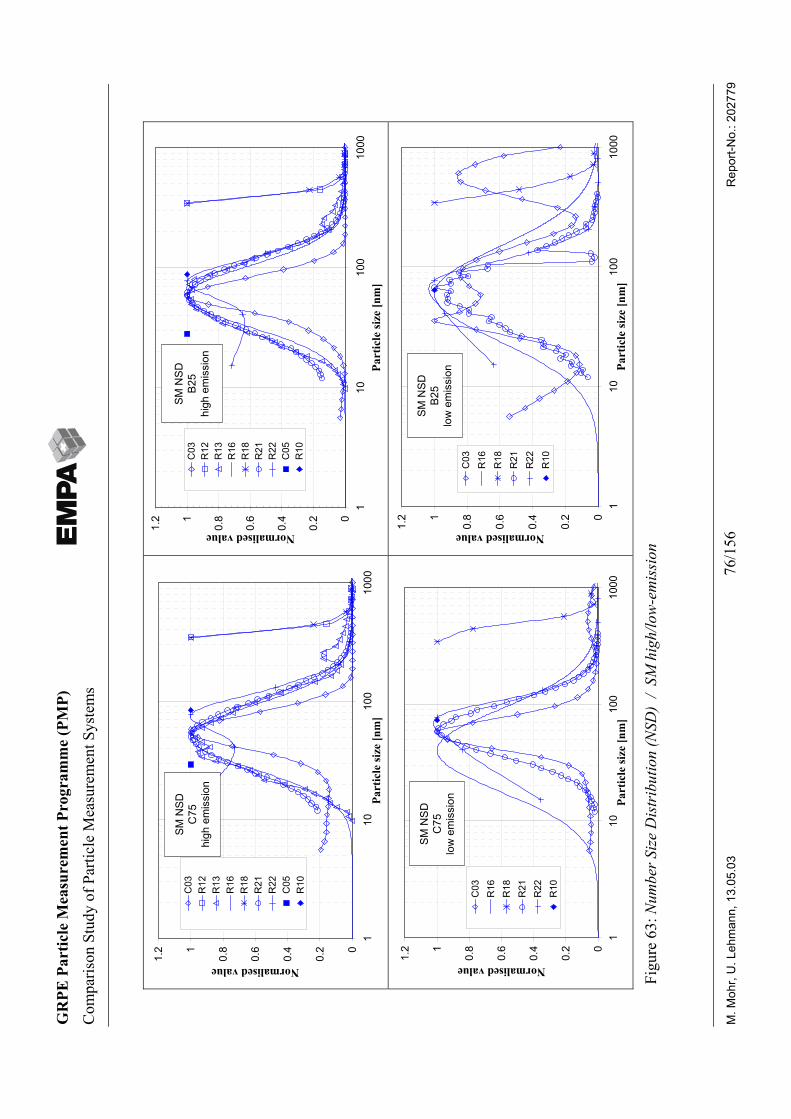
GR
PE P
artic
le M
easu
rem
ent P
rogr
amm
e (P
MP)
Com
paris
on S
tudy
of P
artic
le M
easu
rem
ent S
yste
ms
M. M
ohr,
U. L
ehm
ann,
13.
05.0
376
/156
Rep
ort-N
o.: 2
0277
9
0
0.2
0.4
0.6
0.81
1.2
110
100
1000
Part
icle
size
[nm
]
Normalised value
C03
R12
R13
R16
R18
R21
R22
C05
R10
SM N
SDC
75hi
gh e
mis
sion
0
0.2
0.4
0.6
0.81
1.2
110
100
1000
Part
icle
size
[nm
]
Normalised value
C03
R12
R13
R16
R18
R21
R22
C05
R10
SM N
SDB2
5hi
gh e
mis
sion
0
0.2
0.4
0.6
0.81
1.2
110
100
1000
Part
icle
size
[nm
]
Normalised value
C03
R16
R18
R21
R22
R10
SM N
SDC
75lo
w e
mis
sion
0
0.2
0.4
0.6
0.81
1.2
110
100
1000
Part
icle
size
[nm
]
Normalised value
C03
R16
R18
R21
R22
R10
SM N
SDB2
5lo
w e
mis
sion
Figu
re 6
3: N
umbe
r Siz
e D
istr
ibut
ion
(NSD
) /
SM h
igh/
low
-em
issi
on
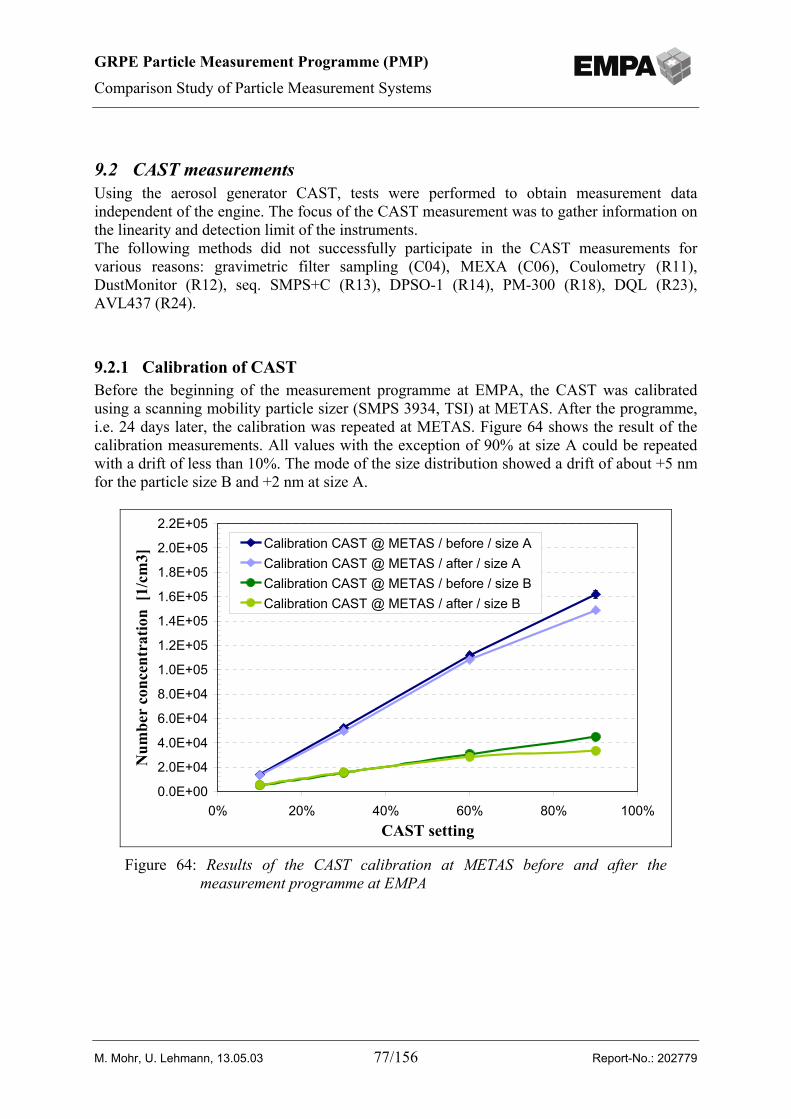
GRPE Particle Measurement Programme (PMP)
Comparison Study of Particle Measurement Systems
M. Mohr, U. Lehmann, 13.05.03 77/156 Report-No.: 202779
9.2 CAST measurementsUsing the aerosol generator CAST, tests were performed to obtain measurement dataindependent of the engine. The focus of the CAST measurement was to gather information onthe linearity and detection limit of the instruments.The following methods did not successfully participate in the CAST measurements forvarious reasons: gravimetric filter sampling (C04), MEXA (C06), Coulometry (R11),DustMonitor (R12), seq. SMPS+C (R13), DPSO-1 (R14), PM-300 (R18), DQL (R23),AVL437 (R24).
9.2.1 Calibration of CASTBefore the beginning of the measurement programme at EMPA, the CAST was calibratedusing a scanning mobility particle sizer (SMPS 3934, TSI) at METAS. After the programme,i.e. 24 days later, the calibration was repeated at METAS. Figure 64 shows the result of thecalibration measurements. All values with the exception of 90% at size A could be repeatedwith a drift of less than 10%. The mode of the size distribution showed a drift of about +5 nmfor the particle size B and +2 nm at size A.
0.0E+00
2.0E+04
4.0E+04
6.0E+04
8.0E+04
1.0E+05
1.2E+05
1.4E+05
1.6E+05
1.8E+05
2.0E+05
2.2E+05
0% 20% 40% 60% 80% 100%CAST setting
Num
ber
conc
entr
atio
n [1
/cm
3]
Calibration CAST @ METAS / before / size ACalibration CAST @ METAS / after / size ACalibration CAST @ METAS / before / size BCalibration CAST @ METAS / after / size B
Figure 64: Results of the CAST calibration at METAS before and after themeasurement programme at EMPA
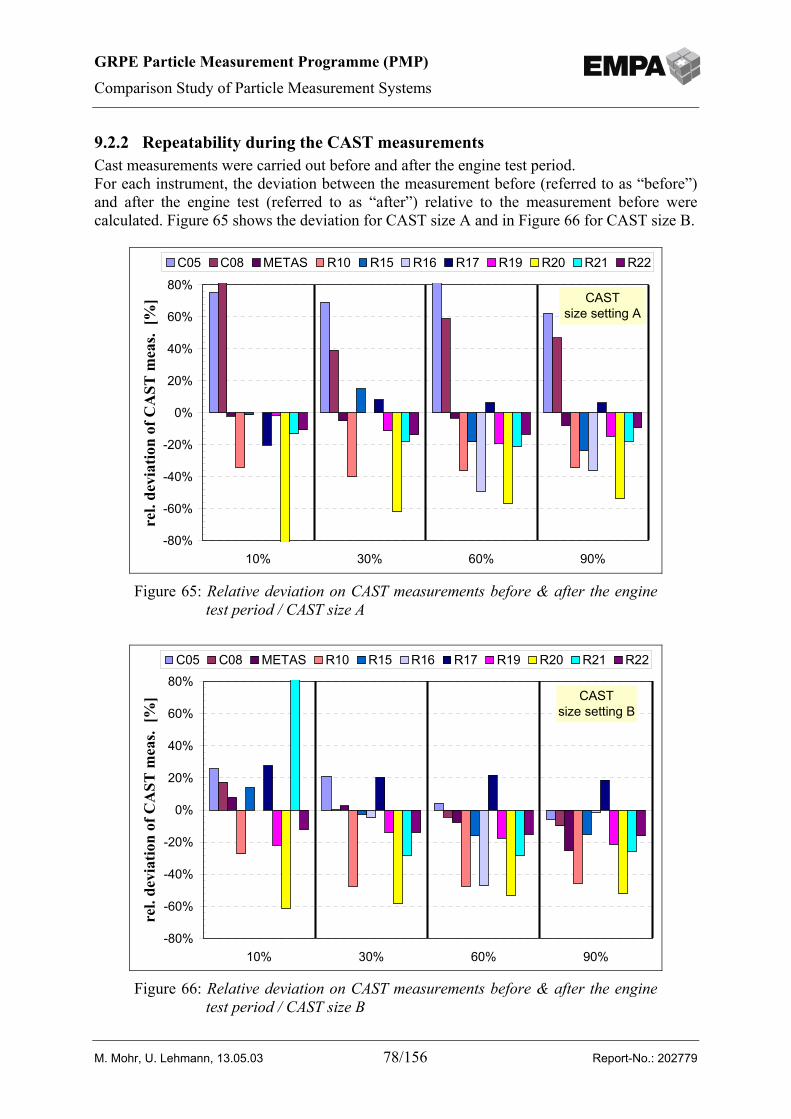
GRPE Particle Measurement Programme (PMP)
Comparison Study of Particle Measurement Systems
M. Mohr, U. Lehmann, 13.05.03 78/156 Report-No.: 202779
9.2.2 Repeatability during the CAST measurementsCast measurements were carried out before and after the engine test period.For each instrument, the deviation between the measurement before (referred to as “before”)and after the engine test (referred to as “after”) relative to the measurement before werecalculated. Figure 65 shows the deviation for CAST size A and in Figure 66 for CAST size B.
-80%
-60%
-40%
-20%
0%
20%
40%
60%
80%
10% 30% 60% 90%
rel.
devi
atio
n of
CA
ST m
eas.
[%]
C05 C08 METAS R10 R15 R16 R17 R19 R20 R21 R22
CASTsize setting A
Figure 65: Relative deviation on CAST measurements before & after the enginetest period / CAST size A
CASTsize setting B
-80%
-60%
-40%
-20%
0%
20%
40%
60%
80%
10% 30% 60% 90%
rel.
devi
atio
n of
CA
ST m
eas.
[%]
C05 C08 METAS R10 R15 R16 R17 R19 R20 R21 R22
Figure 66: Relative deviation on CAST measurements before & after the enginetest period / CAST size B
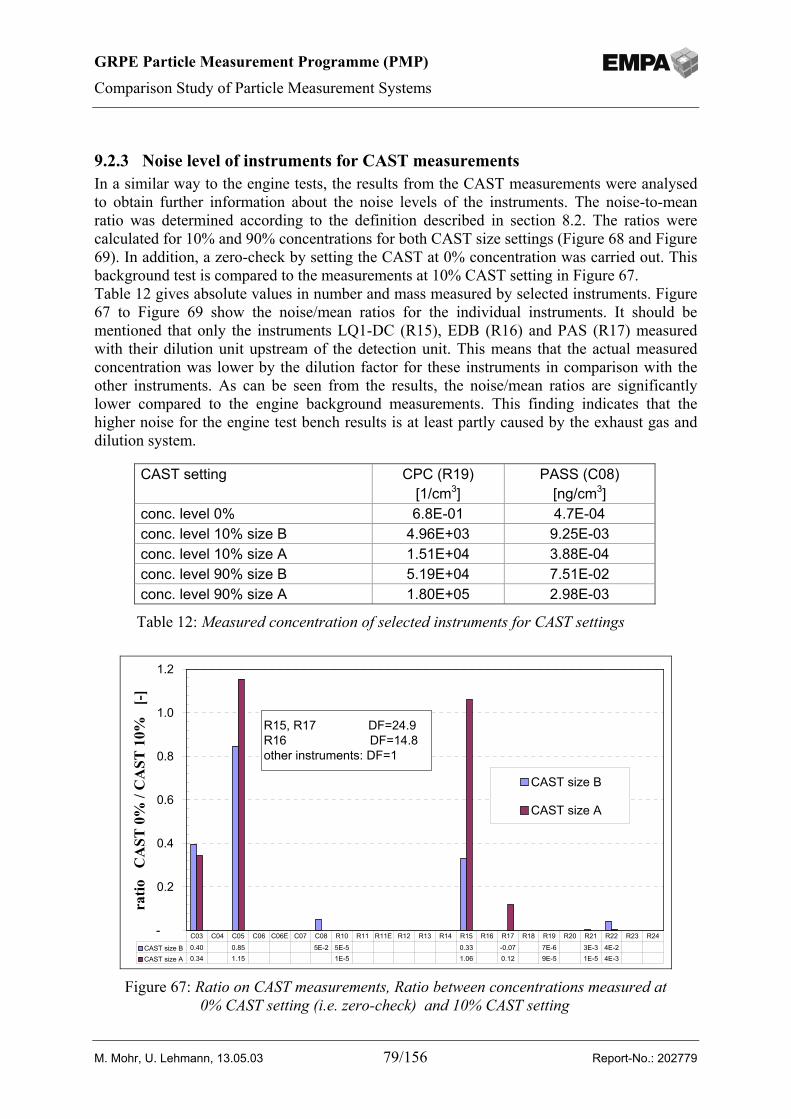
GRPE Particle Measurement Programme (PMP)
Comparison Study of Particle Measurement Systems
M. Mohr, U. Lehmann, 13.05.03 79/156 Report-No.: 202779
9.2.3 Noise level of instruments for CAST measurementsIn a similar way to the engine tests, the results from the CAST measurements were analysedto obtain further information about the noise levels of the instruments. The noise-to-meanratio was determined according to the definition described in section 8.2. The ratios werecalculated for 10% and 90% concentrations for both CAST size settings (Figure 68 and Figure69). In addition, a zero-check by setting the CAST at 0% concentration was carried out. Thisbackground test is compared to the measurements at 10% CAST setting in Figure 67.Table 12 gives absolute values in number and mass measured by selected instruments. Figure67 to Figure 69 show the noise/mean ratios for the individual instruments. It should bementioned that only the instruments LQ1-DC (R15), EDB (R16) and PAS (R17) measuredwith their dilution unit upstream of the detection unit. This means that the actual measuredconcentration was lower by the dilution factor for these instruments in comparison with theother instruments. As can be seen from the results, the noise/mean ratios are significantlylower compared to the engine background measurements. This finding indicates that thehigher noise for the engine test bench results is at least partly caused by the exhaust gas anddilution system.
CAST setting CPC (R19)[1/cm3]
PASS (C08)[ng/cm3]
conc. level 0% 6.8E-01 4.7E-04 conc. level 10% size B 4.96E+03 9.25E-03 conc. level 10% size A 1.51E+04 3.88E-04 conc. level 90% size B 5.19E+04 7.51E-02 conc. level 90% size A 1.80E+05 2.98E-03
Table 12: Measured concentration of selected instruments for CAST settings
-
0.2
0.4
0.6
0.8
1.0
1.2
ratio
C
AST
0%
/ C
AST
10%
[-
]
CAST size B
CAST size A
CAST size B 0.40 0.85 5E-2 5E-5 0.33 -0.07 7E-6 3E-3 4E-2CAST size A 0.34 1.15 1E-5 1.06 0.12 9E-5 1E-5 4E-3
C03 C04 C05 C06 C06E C07 C08 R10 R11 R11E R12 R13 R14 R15 R16 R17 R18 R19 R20 R21 R22 R23 R24
R15, R17 DF=24.9R16 DF=14.8other instruments: DF=1
Figure 67: Ratio on CAST measurements, Ratio between concentrations measured at0% CAST setting (i.e. zero-check) and 10% CAST setting
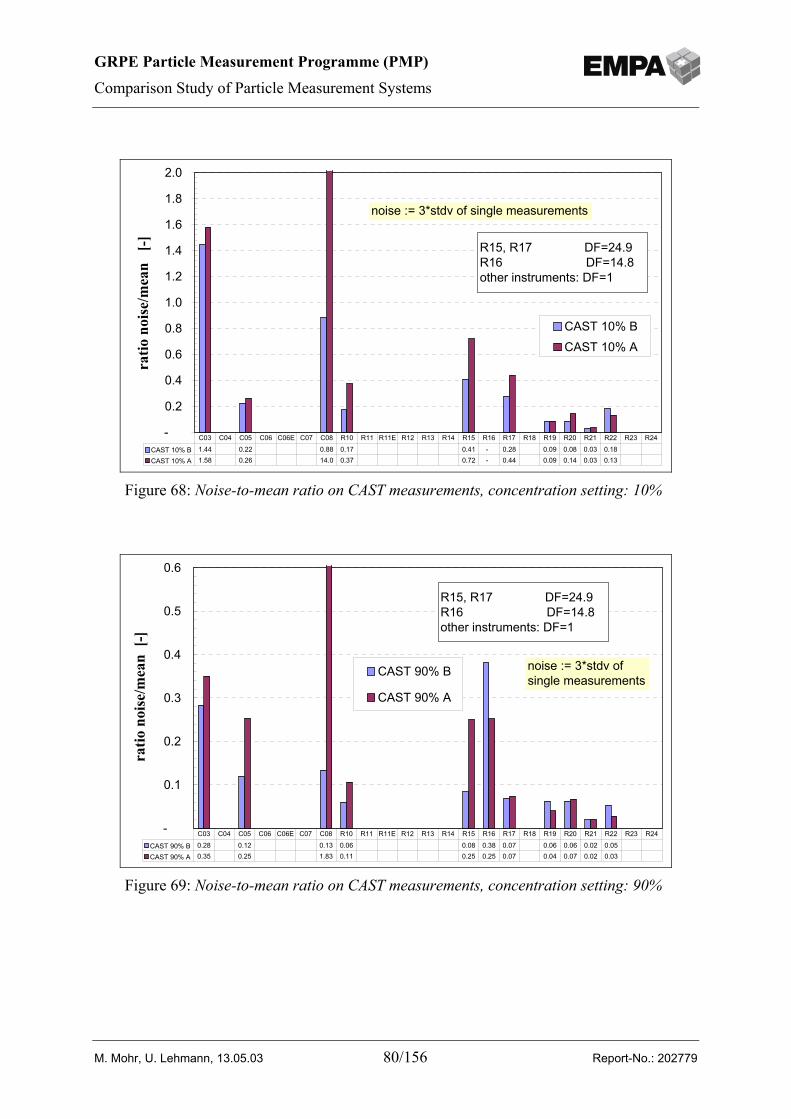
GRPE Particle Measurement Programme (PMP)
Comparison Study of Particle Measurement Systems
M. Mohr, U. Lehmann, 13.05.03 80/156 Report-No.: 202779
-
0.2
0.4
0.6
0.8
1.0
1.2
1.4
1.6
1.8
2.0
ratio
noi
se/m
ean
[-]
CAST 10% BCAST 10% A
CAST 10% B 1.44 0.22 0.88 0.17 0.41 - 0.28 0.09 0.08 0.03 0.18 CAST 10% A 1.58 0.26 14.0 0.37 0.72 - 0.44 0.09 0.14 0.03 0.13
C03 C04 C05 C06 C06E C07 C08 R10 R11 R11E R12 R13 R14 R15 R16 R17 R18 R19 R20 R21 R22 R23 R24
noise := 3*stdv of single measurements
R15, R17 DF=24.9R16 DF=14.8other instruments: DF=1
Figure 68: Noise-to-mean ratio on CAST measurements, concentration setting: 10%
-
0.1
0.2
0.3
0.4
0.5
0.6
ratio
noi
se/m
ean
[-]
CAST 90% B
CAST 90% A
CAST 90% B 0.28 0.12 0.13 0.06 0.08 0.38 0.07 0.06 0.06 0.02 0.05 CAST 90% A 0.35 0.25 1.83 0.11 0.25 0.25 0.07 0.04 0.07 0.02 0.03
C03 C04 C05 C06 C06E C07 C08 R10 R11 R11E R12 R13 R14 R15 R16 R17 R18 R19 R20 R21 R22 R23 R24
noise := 3*stdv of single measurements
R15, R17 DF=24.9R16 DF=14.8other instruments: DF=1
Figure 69: Noise-to-mean ratio on CAST measurements, concentration setting: 90%
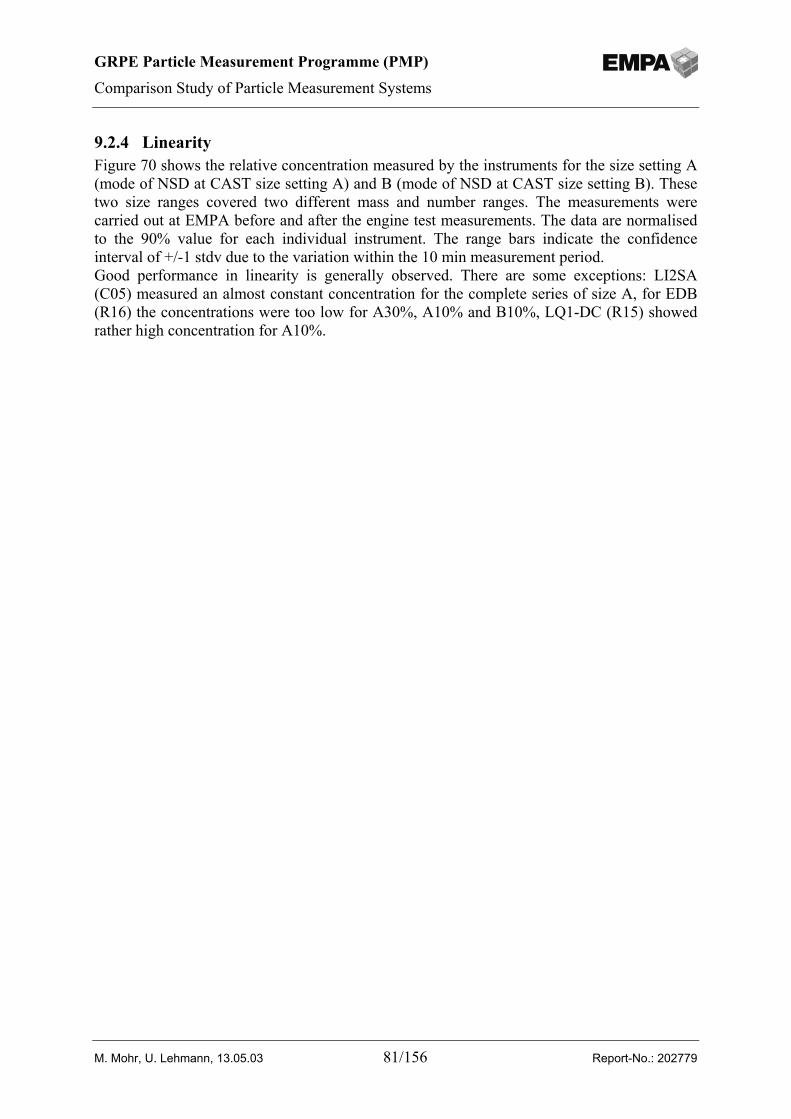
GRPE Particle Measurement Programme (PMP)
Comparison Study of Particle Measurement Systems
M. Mohr, U. Lehmann, 13.05.03 81/156 Report-No.: 202779
9.2.4 LinearityFigure 70 shows the relative concentration measured by the instruments for the size setting A(mode of NSD at CAST size setting A) and B (mode of NSD at CAST size setting B). Thesetwo size ranges covered two different mass and number ranges. The measurements werecarried out at EMPA before and after the engine test measurements. The data are normalisedto the 90% value for each individual instrument. The range bars indicate the confidenceinterval of +/-1 stdv due to the variation within the 10 min measurement period.Good performance in linearity is generally observed. There are some exceptions: LI2SA(C05) measured an almost constant concentration for the complete series of size A, for EDB(R16) the concentrations were too low for A30%, A10% and B10%, LQ1-DC (R15) showedrather high concentration for A10%.
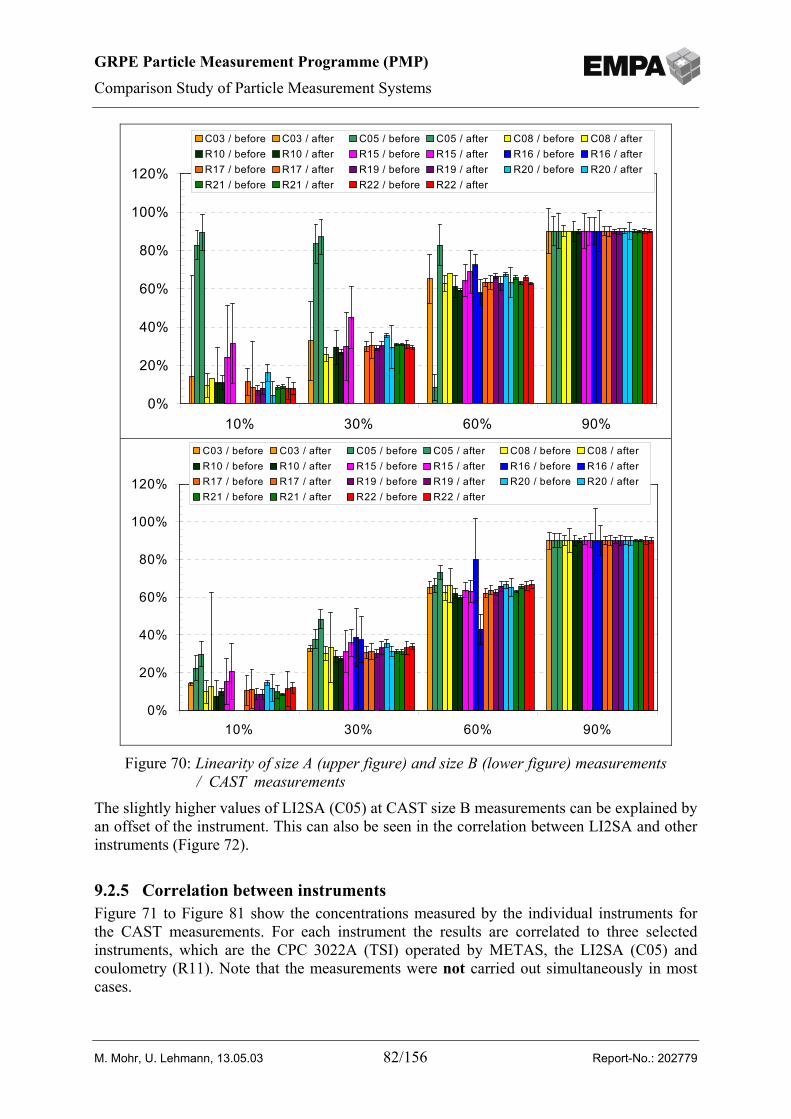
GRPE Particle Measurement Programme (PMP)
Comparison Study of Particle Measurement Systems
M. Mohr, U. Lehmann, 13.05.03 82/156 Report-No.: 202779
The slightly higher values of LI2SA (C05) at CAST size B measurements can be explained byan offset of the instrument. This can also be seen in the correlation between LI2SA and otherinstruments (Figure 72).
9.2.5 Correlation between instrumentsFigure 71 to Figure 81 show the concentrations measured by the individual instruments forthe CAST measurements. For each instrument the results are correlated to three selectedinstruments, which are the CPC 3022A (TSI) operated by METAS, the LI2SA (C05) andcoulometry (R11). Note that the measurements were not carried out simultaneously in mostcases.
0%
20%
40%
60%
80%
100%
120%
10% 30% 60% 90%
C03 / before C03 / after C05 / before C05 / after C08 / before C08 / afterR10 / before R10 / after R15 / before R15 / after R16 / before R16 / afterR17 / before R17 / after R19 / before R19 / after R20 / before R20 / afterR21 / before R21 / after R22 / before R22 / after
Figure 70: Linearity of size A (upper figure) and size B (lower figure) measurements/ CAST measurements
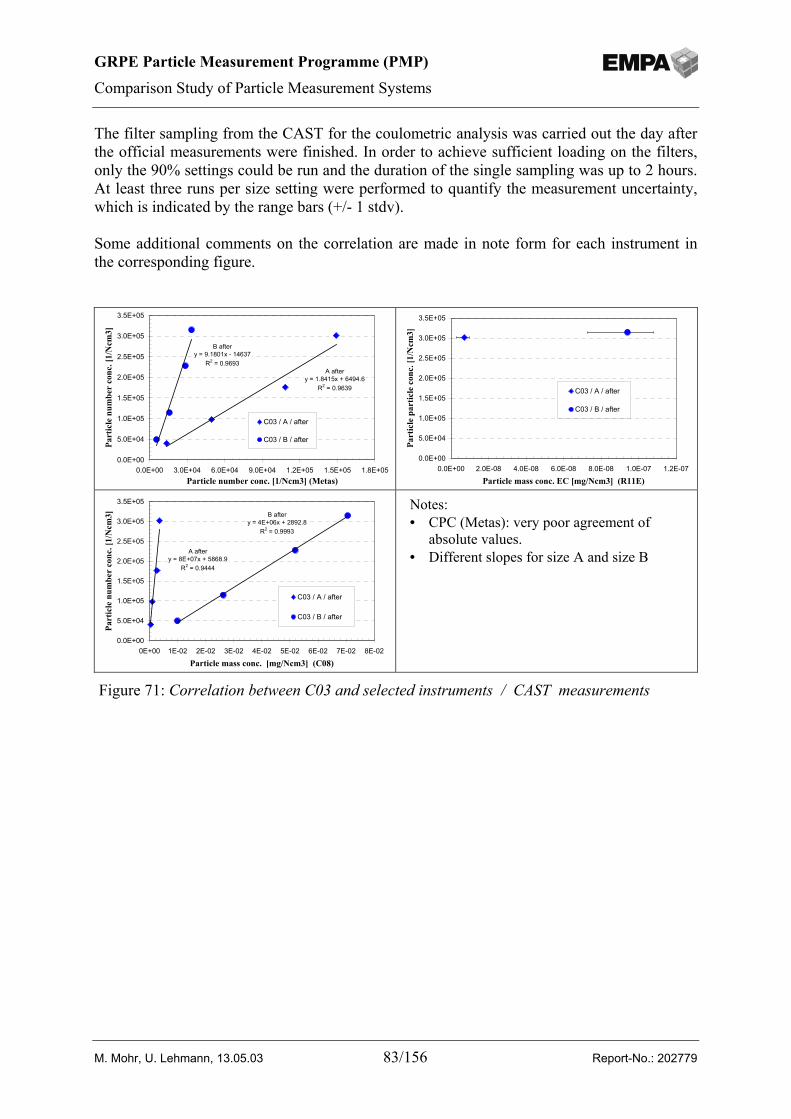
GRPE Particle Measurement Programme (PMP)
Comparison Study of Particle Measurement Systems
M. Mohr, U. Lehmann, 13.05.03 83/156 Report-No.: 202779
The filter sampling from the CAST for the coulometric analysis was carried out the day afterthe official measurements were finished. In order to achieve sufficient loading on the filters,only the 90% settings could be run and the duration of the single sampling was up to 2 hours.At least three runs per size setting were performed to quantify the measurement uncertainty,which is indicated by the range bars (+/- 1 stdv).
Some additional comments on the correlation are made in note form for each instrument inthe corresponding figure.
A aftery = 1.8415x + 6494.6
R2 = 0.9639
B aftery = 9.1801x - 14637
R2 = 0.9693
0.0E+00
5.0E+04
1.0E+05
1.5E+05
2.0E+05
2.5E+05
3.0E+05
3.5E+05
0.0E+00 3.0E+04 6.0E+04 9.0E+04 1.2E+05 1.5E+05 1.8E+05Particle number conc. [1/Ncm3] (Metas)
Part
icle
num
ber
conc
. [1/
Ncm
3]
C03 / A / after
C03 / B / after
0.0E+00
5.0E+04
1.0E+05
1.5E+05
2.0E+05
2.5E+05
3.0E+05
3.5E+05
0.0E+00 2.0E-08 4.0E-08 6.0E-08 8.0E-08 1.0E-07 1.2E-07
Particle mass conc. EC [mg/Ncm3] (R11E)
Part
icle
par
ticle
con
c. [1
/Ncm
3]
C03 / A / after
C03 / B / after
B aftery = 4E+06x + 2892.8
R2 = 0.9993
A aftery = 8E+07x + 5868.9
R2 = 0.9444
0.0E+00
5.0E+04
1.0E+05
1.5E+05
2.0E+05
2.5E+05
3.0E+05
3.5E+05
0E+00 1E-02 2E-02 3E-02 4E-02 5E-02 6E-02 7E-02 8E-02
Particle mass conc. [mg/Ncm3] (C08)
Part
icle
num
ber
conc
. [1/
Ncm
3]
C03 / A / after
C03 / B / after
Notes:• CPC (Metas): very poor agreement of
absolute values.• Different slopes for size A and size B
Figure 71: Correlation between C03 and selected instruments / CAST measurements
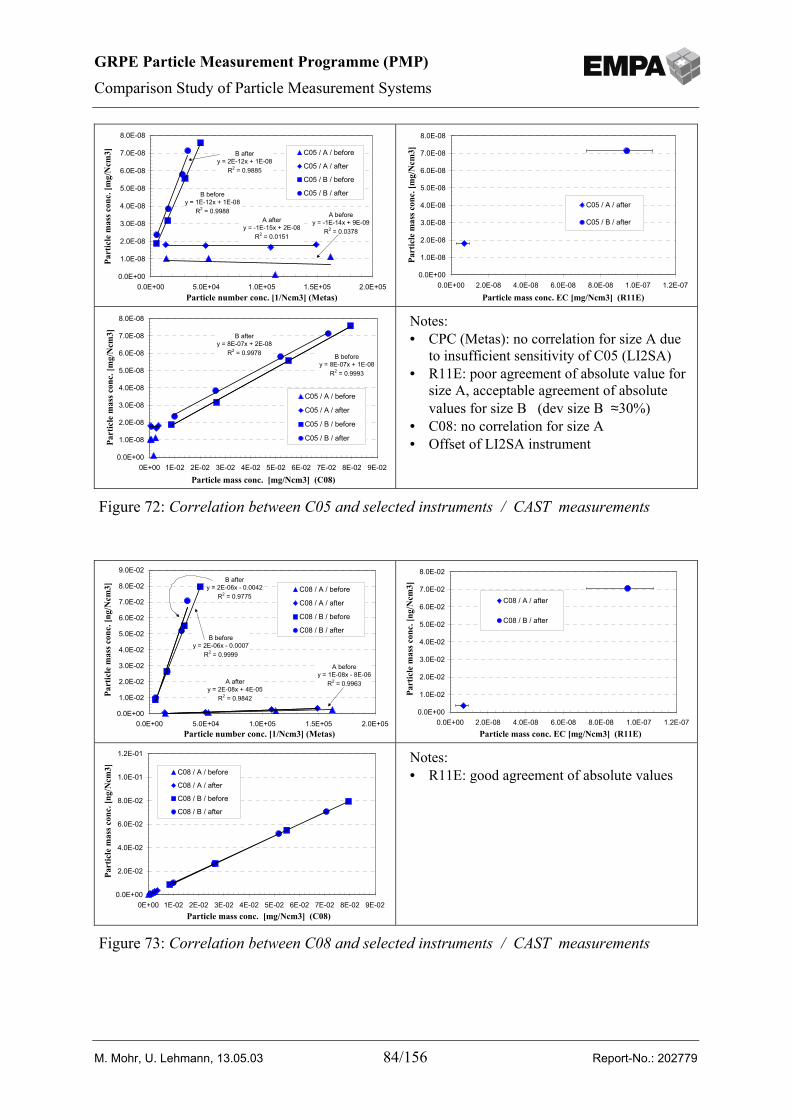
GRPE Particle Measurement Programme (PMP)
Comparison Study of Particle Measurement Systems
M. Mohr, U. Lehmann, 13.05.03 84/156 Report-No.: 202779
B beforey = 1E-12x + 1E-08
R2 = 0.9988A after
y = -1E-15x + 2E-08R2 = 0.0151
A beforey = -1E-14x + 9E-09
R2 = 0.0378
B aftery = 2E-12x + 1E-08
R2 = 0.9885
0.0E+00
1.0E-08
2.0E-08
3.0E-08
4.0E-08
5.0E-08
6.0E-08
7.0E-08
8.0E-08
0.0E+00 5.0E+04 1.0E+05 1.5E+05 2.0E+05Particle number conc. [1/Ncm3] (Metas)
Part
icle
mas
s con
c. [m
g/N
cm3] C05 / A / before
C05 / A / after
C05 / B / before
C05 / B / after
0.0E+00
1.0E-08
2.0E-08
3.0E-08
4.0E-08
5.0E-08
6.0E-08
7.0E-08
8.0E-08
0.0E+00 2.0E-08 4.0E-08 6.0E-08 8.0E-08 1.0E-07 1.2E-07
Particle mass conc. EC [mg/Ncm3] (R11E)
Part
icle
mas
s con
c. [m
g/N
cm3]
C05 / A / after
C05 / B / after
B aftery = 8E-07x + 2E-08
R2 = 0.9978 B beforey = 8E-07x + 1E-08
R2 = 0.9993
0.0E+00
1.0E-08
2.0E-08
3.0E-08
4.0E-08
5.0E-08
6.0E-08
7.0E-08
8.0E-08
0E+00 1E-02 2E-02 3E-02 4E-02 5E-02 6E-02 7E-02 8E-02 9E-02
Particle mass conc. [mg/Ncm3] (C08)
Part
icle
mas
s con
c. [m
g/N
cm3]
C05 / A / before
C05 / A / after
C05 / B / before
C05 / B / after
Notes:• CPC (Metas): no correlation for size A due
to insufficient sensitivity of C05 (LI2SA)• R11E: poor agreement of absolute value for
size A, acceptable agreement of absolutevalues for size B (dev size B ≈30%)
• C08: no correlation for size A• Offset of LI2SA instrument
Figure 72: Correlation between C05 and selected instruments / CAST measurements
A beforey = 1E-08x - 8E-06
R2 = 0.9963
B beforey = 2E-06x - 0.0007
R2 = 0.9999
A aftery = 2E-08x + 4E-05
R2 = 0.9842
B aftery = 2E-06x - 0.0042
R2 = 0.9775
0.0E+00
1.0E-02
2.0E-02
3.0E-02
4.0E-02
5.0E-02
6.0E-02
7.0E-02
8.0E-02
9.0E-02
0.0E+00 5.0E+04 1.0E+05 1.5E+05 2.0E+05Particle number conc. [1/Ncm3] (Metas)
Part
icle
mas
s con
c. [n
g/N
cm3] C08 / A / before
C08 / A / after
C08 / B / before
C08 / B / after
0.0E+00
1.0E-02
2.0E-02
3.0E-02
4.0E-02
5.0E-02
6.0E-02
7.0E-02
8.0E-02
0.0E+00 2.0E-08 4.0E-08 6.0E-08 8.0E-08 1.0E-07 1.2E-07Particle mass conc. EC [mg/Ncm3] (R11E)
Part
icle
mas
s con
c. [n
g/N
cm3]
C08 / A / after
C08 / B / after
0.0E+00
2.0E-02
4.0E-02
6.0E-02
8.0E-02
1.0E-01
1.2E-01
0E+00 1E-02 2E-02 3E-02 4E-02 5E-02 6E-02 7E-02 8E-02 9E-02Particle mass conc. [mg/Ncm3] (C08)
Part
icle
mas
s con
c. [n
g/N
cm3] C08 / A / before
C08 / A / after
C08 / B / before
C08 / B / after
Notes:• R11E: good agreement of absolute values
Figure 73: Correlation between C08 and selected instruments / CAST measurements
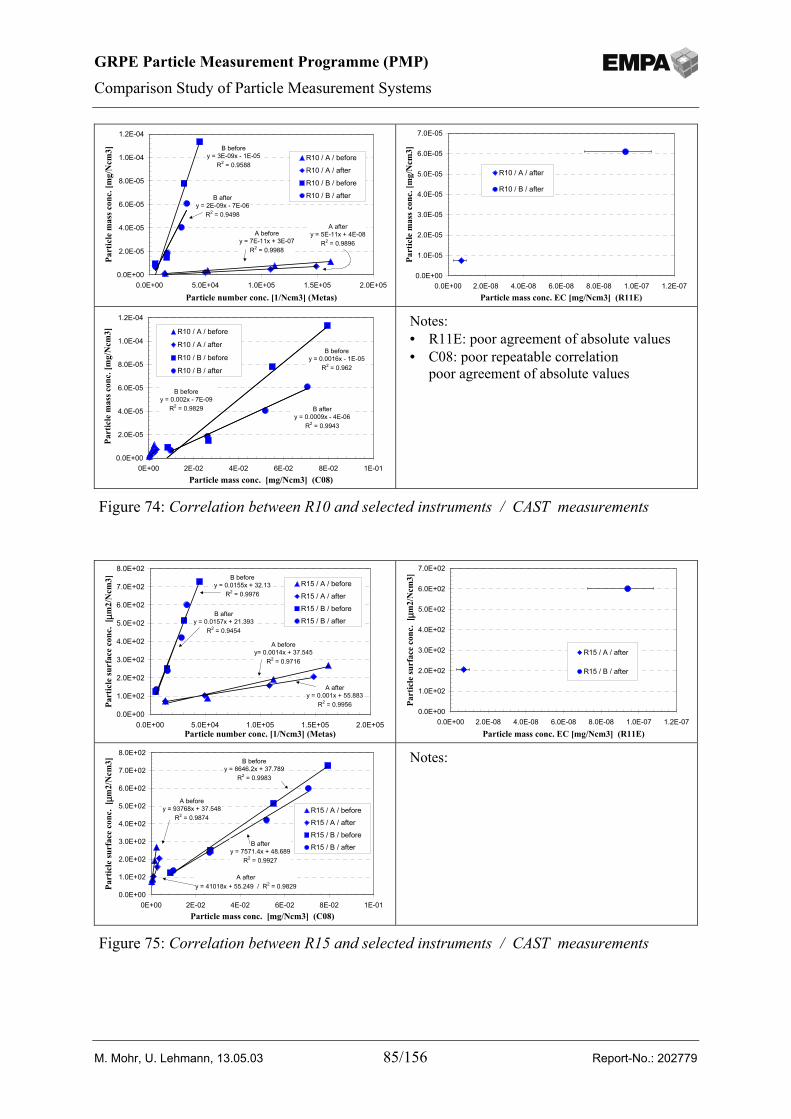
GRPE Particle Measurement Programme (PMP)
Comparison Study of Particle Measurement Systems
M. Mohr, U. Lehmann, 13.05.03 85/156 Report-No.: 202779
B beforey = 3E-09x - 1E-05
R2 = 0.9588
A beforey = 7E-11x + 3E-07
R2 = 0.9988
A aftery = 5E-11x + 4E-08
R2 = 0.9896
B aftery = 2E-09x - 7E-06
R2 = 0.9498
0.0E+00
2.0E-05
4.0E-05
6.0E-05
8.0E-05
1.0E-04
1.2E-04
0.0E+00 5.0E+04 1.0E+05 1.5E+05 2.0E+05
Particle number conc. [1/Ncm3] (Metas)
Part
icle
mas
s con
c. [m
g/N
cm3]
R10 / A / before
R10 / A / after
R10 / B / before
R10 / B / after
0.0E+00
1.0E-05
2.0E-05
3.0E-05
4.0E-05
5.0E-05
6.0E-05
7.0E-05
0.0E+00 2.0E-08 4.0E-08 6.0E-08 8.0E-08 1.0E-07 1.2E-07Particle mass conc. EC [mg/Ncm3] (R11E)
Part
icle
mas
s con
c. [m
g/N
cm3]
R10 / A / after
R10 / B / after
B aftery = 0.0009x - 4E-06
R2 = 0.9943
B beforey = 0.0016x - 1E-05
R2 = 0.962
B beforey = 0.002x - 7E-09
R2 = 0.9829
0.0E+00
2.0E-05
4.0E-05
6.0E-05
8.0E-05
1.0E-04
1.2E-04
0E+00 2E-02 4E-02 6E-02 8E-02 1E-01Particle mass conc. [mg/Ncm3] (C08)
Part
icle
mas
s con
c. [m
g/N
cm3] R10 / A / before
R10 / A / after
R10 / B / before
R10 / B / after
Notes:• R11E: poor agreement of absolute values• C08: poor repeatable correlation
poor agreement of absolute values
Figure 74: Correlation between R10 and selected instruments / CAST measurements
A beforey= 0.0014x + 37.545
R2 = 0.9716
A aftery = 0.001x + 55.883
R2 = 0.9956
B aftery = 0.0157x + 21.393
R2 = 0.9454
B beforey = 0.0155x + 32.13
R2 = 0.9976
0.0E+00
1.0E+02
2.0E+02
3.0E+02
4.0E+02
5.0E+02
6.0E+02
7.0E+02
8.0E+02
0.0E+00 5.0E+04 1.0E+05 1.5E+05 2.0E+05Particle number conc. [1/Ncm3] (Metas)
Part
icle
surf
ace
conc
. [ µ
m2/
Ncm
3] R15 / A / before
R15 / A / after
R15 / B / before
R15 / B / after
0.0E+00
1.0E+02
2.0E+02
3.0E+02
4.0E+02
5.0E+02
6.0E+02
7.0E+02
0.0E+00 2.0E-08 4.0E-08 6.0E-08 8.0E-08 1.0E-07 1.2E-07
Particle mass conc. EC [mg/Ncm3] (R11E)
Part
icle
surf
ace
conc
. [ µ
m2/
Ncm
3]
R15 / A / after
R15 / B / after
B aftery = 7571.4x + 48.689
R2 = 0.9927
B beforey = 8646.2x + 37.789
R2 = 0.9983
A beforey = 93768x + 37.548
R2 = 0.9874
A aftery = 41018x + 55.249 / R2 = 0.9829
0.0E+00
1.0E+02
2.0E+02
3.0E+02
4.0E+02
5.0E+02
6.0E+02
7.0E+02
8.0E+02
0E+00 2E-02 4E-02 6E-02 8E-02 1E-01Particle mass conc. [mg/Ncm3] (C08)
Part
icle
surf
ace
conc
. [ µ
m2/
Ncm
3]
R15 / A / beforeR15 / A / after
R15 / B / beforeR15 / B / after
Notes:
Figure 75: Correlation between R15 and selected instruments / CAST measurements
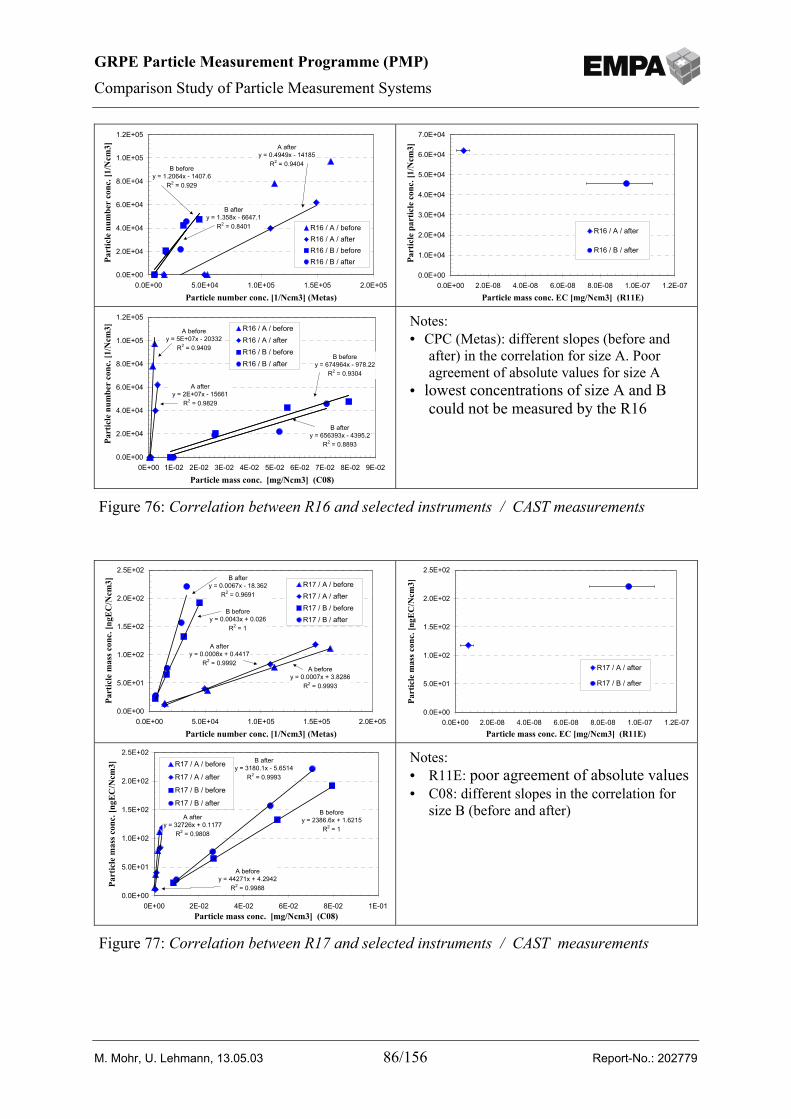
GRPE Particle Measurement Programme (PMP)
Comparison Study of Particle Measurement Systems
M. Mohr, U. Lehmann, 13.05.03 86/156 Report-No.: 202779
A aftery = 0.4949x - 14185
R2 = 0.9404B before
y = 1.2064x - 1407.6R2 = 0.929
B aftery = 1.358x - 6647.1
R2 = 0.8401
0.0E+00
2.0E+04
4.0E+04
6.0E+04
8.0E+04
1.0E+05
1.2E+05
0.0E+00 5.0E+04 1.0E+05 1.5E+05 2.0E+05
Particle number conc. [1/Ncm3] (Metas)
Part
icle
num
ber
conc
. [1/
Ncm
3]
R16 / A / beforeR16 / A / afterR16 / B / beforeR16 / B / after
0.0E+00
1.0E+04
2.0E+04
3.0E+04
4.0E+04
5.0E+04
6.0E+04
7.0E+04
0.0E+00 2.0E-08 4.0E-08 6.0E-08 8.0E-08 1.0E-07 1.2E-07
Particle mass conc. EC [mg/Ncm3] (R11E)
Part
icle
par
ticle
con
c. [1
/Ncm
3]
R16 / A / after
R16 / B / after
B beforey = 674964x - 978.22
R2 = 0.9304
B aftery = 656393x - 4395.2
R2 = 0.8893
A beforey = 5E+07x - 20332
R2 = 0.9409
A aftery = 2E+07x - 15661
R2 = 0.9829
0.0E+00
2.0E+04
4.0E+04
6.0E+04
8.0E+04
1.0E+05
1.2E+05
0E+00 1E-02 2E-02 3E-02 4E-02 5E-02 6E-02 7E-02 8E-02 9E-02
Particle mass conc. [mg/Ncm3] (C08)
Part
icle
num
ber
conc
. [1/
Ncm
3] R16 / A / beforeR16 / A / afterR16 / B / beforeR16 / B / after
Notes:• CPC (Metas): different slopes (before and
after) in the correlation for size A. Pooragreement of absolute values for size A
• lowest concentrations of size A and Bcould not be measured by the R16
Figure 76: Correlation between R16 and selected instruments / CAST measurements
B beforey = 0.0043x + 0.026
R2 = 1
A aftery = 0.0008x + 0.4417
R2 = 0.9992A before
y = 0.0007x + 3.8286R2 = 0.9993
B aftery = 0.0067x - 18.362
R2 = 0.9691
0.0E+00
5.0E+01
1.0E+02
1.5E+02
2.0E+02
2.5E+02
0.0E+00 5.0E+04 1.0E+05 1.5E+05 2.0E+05
Particle number conc. [1/Ncm3] (Metas)
Part
icle
mas
s con
c. [n
gEC
/Ncm
3] R17 / A / beforeR17 / A / afterR17 / B / beforeR17 / B / after
0.0E+00
5.0E+01
1.0E+02
1.5E+02
2.0E+02
2.5E+02
0.0E+00 2.0E-08 4.0E-08 6.0E-08 8.0E-08 1.0E-07 1.2E-07Particle mass conc. EC [mg/Ncm3] (R11E)
Part
icle
mas
s con
c. [n
gEC
/Ncm
3]
R17 / A / after
R17 / B / after
B aftery = 3180.1x - 5.6514
R2 = 0.9993
B beforey = 2386.6x + 1.6215
R2 = 1
A aftery = 32726x + 0.1177
R2 = 0.9808
A beforey = 44271x + 4.2942
R2 = 0.99880.0E+00
5.0E+01
1.0E+02
1.5E+02
2.0E+02
2.5E+02
0E+00 2E-02 4E-02 6E-02 8E-02 1E-01Particle mass conc. [mg/Ncm3] (C08)
Part
icle
mas
s con
c. [n
gEC
/Ncm
3] R17 / A / before
R17 / A / after
R17 / B / before
R17 / B / after
Notes:• R11E: poor agreement of absolute values• C08: different slopes in the correlation for
size B (before and after)
Figure 77: Correlation between R17 and selected instruments / CAST measurements
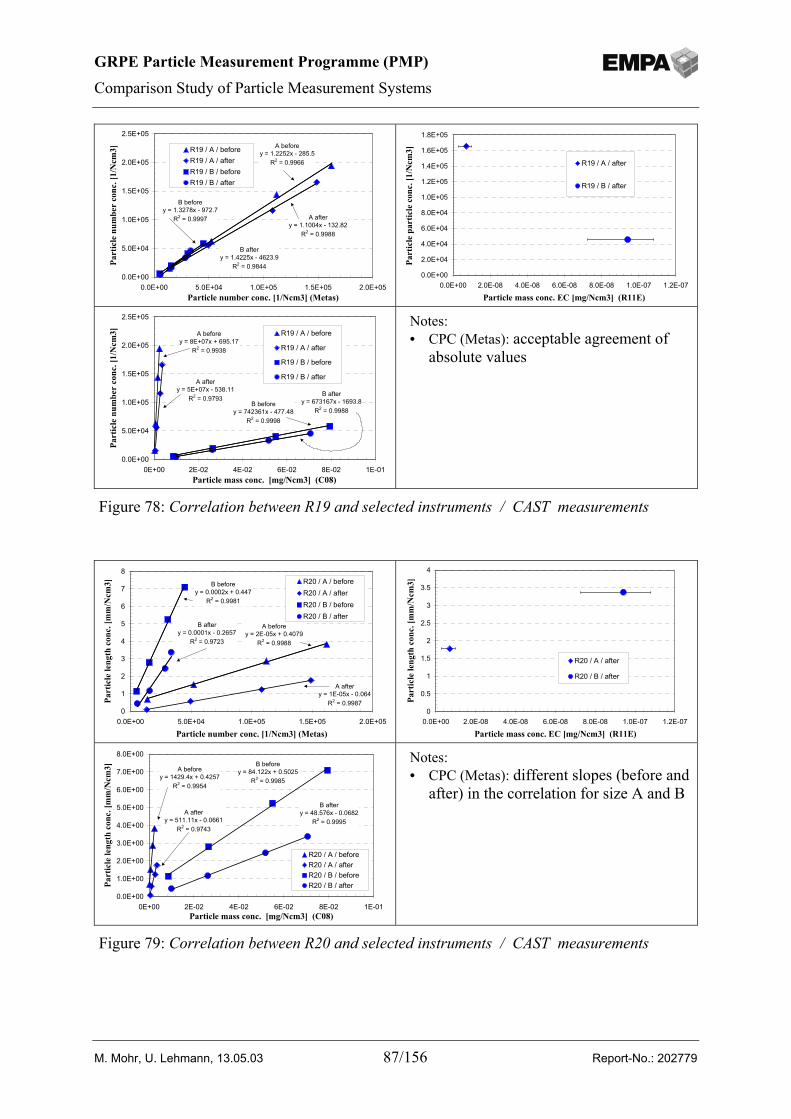
GRPE Particle Measurement Programme (PMP)
Comparison Study of Particle Measurement Systems
M. Mohr, U. Lehmann, 13.05.03 87/156 Report-No.: 202779
A beforey = 1.2252x - 285.5
R2 = 0.9966
A aftery = 1.1004x - 132.82
R2 = 0.9988
B beforey = 1.3278x - 972.7
R2 = 0.9997
B aftery = 1.4225x - 4623.9
R2 = 0.98440.0E+00
5.0E+04
1.0E+05
1.5E+05
2.0E+05
2.5E+05
0.0E+00 5.0E+04 1.0E+05 1.5E+05 2.0E+05Particle number conc. [1/Ncm3] (Metas)
Part
icle
num
ber
conc
. [1/
Ncm
3] R19 / A / beforeR19 / A / afterR19 / B / beforeR19 / B / after
0.0E+00
2.0E+04
4.0E+04
6.0E+04
8.0E+04
1.0E+05
1.2E+05
1.4E+05
1.6E+05
1.8E+05
0.0E+00 2.0E-08 4.0E-08 6.0E-08 8.0E-08 1.0E-07 1.2E-07
Particle mass conc. EC [mg/Ncm3] (R11E)
Part
icle
par
ticle
con
c. [1
/Ncm
3]
R19 / A / after
R19 / B / after
B beforey = 742361x - 477.48
R2 = 0.9998
B aftery = 673167x - 1693.8
R2 = 0.9988
A aftery = 5E+07x - 538.11
R2 = 0.9793
A beforey = 8E+07x + 695.17
R2 = 0.9938
0.0E+00
5.0E+04
1.0E+05
1.5E+05
2.0E+05
2.5E+05
0E+00 2E-02 4E-02 6E-02 8E-02 1E-01Particle mass conc. [mg/Ncm3] (C08)
Part
icle
num
ber
conc
. [1/
Ncm
3] R19 / A / before
R19 / A / after
R19 / B / before
R19 / B / after
Notes:• CPC (Metas): acceptable agreement of
absolute values
Figure 78: Correlation between R19 and selected instruments / CAST measurements
A aftery = 1E-05x - 0.064
R2 = 0.9987
B beforey = 0.0002x + 0.447
R2 = 0.9981
B aftery = 0.0001x - 0.2657
R2 = 0.9723
A beforey = 2E-05x + 0.4079
R2 = 0.9988
0
1
2
3
4
5
6
7
8
0.0E+00 5.0E+04 1.0E+05 1.5E+05 2.0E+05
Particle number conc. [1/Ncm3] (Metas)
Part
icle
leng
th c
onc.
[mm
/Ncm
3] R20 / A / beforeR20 / A / afterR20 / B / beforeR20 / B / after
0
0.5
1
1.5
2
2.5
3
3.5
4
0.0E+00 2.0E-08 4.0E-08 6.0E-08 8.0E-08 1.0E-07 1.2E-07
Particle mass conc. EC [mg/Ncm3] (R11E)
Part
icle
leng
th c
onc.
[mm
/Ncm
3]
R20 / A / after
R20 / B / after
B beforey = 84.122x + 0.5025
R2 = 0.9985
B aftery = 48.576x - 0.0682
R2 = 0.9995
A beforey = 1429.4x + 0.4257
R2 = 0.9954
A aftery = 511.11x - 0.0661
R2 = 0.9743
0.0E+00
1.0E+00
2.0E+00
3.0E+00
4.0E+00
5.0E+00
6.0E+00
7.0E+00
8.0E+00
0E+00 2E-02 4E-02 6E-02 8E-02 1E-01Particle mass conc. [mg/Ncm3] (C08)
Part
icle
leng
th c
onc.
[mm
/Ncm
3]
R20 / A / beforeR20 / A / afterR20 / B / beforeR20 / B / after
Notes:• CPC (Metas): different slopes (before and
after) in the correlation for size A and B
Figure 79: Correlation between R20 and selected instruments / CAST measurements
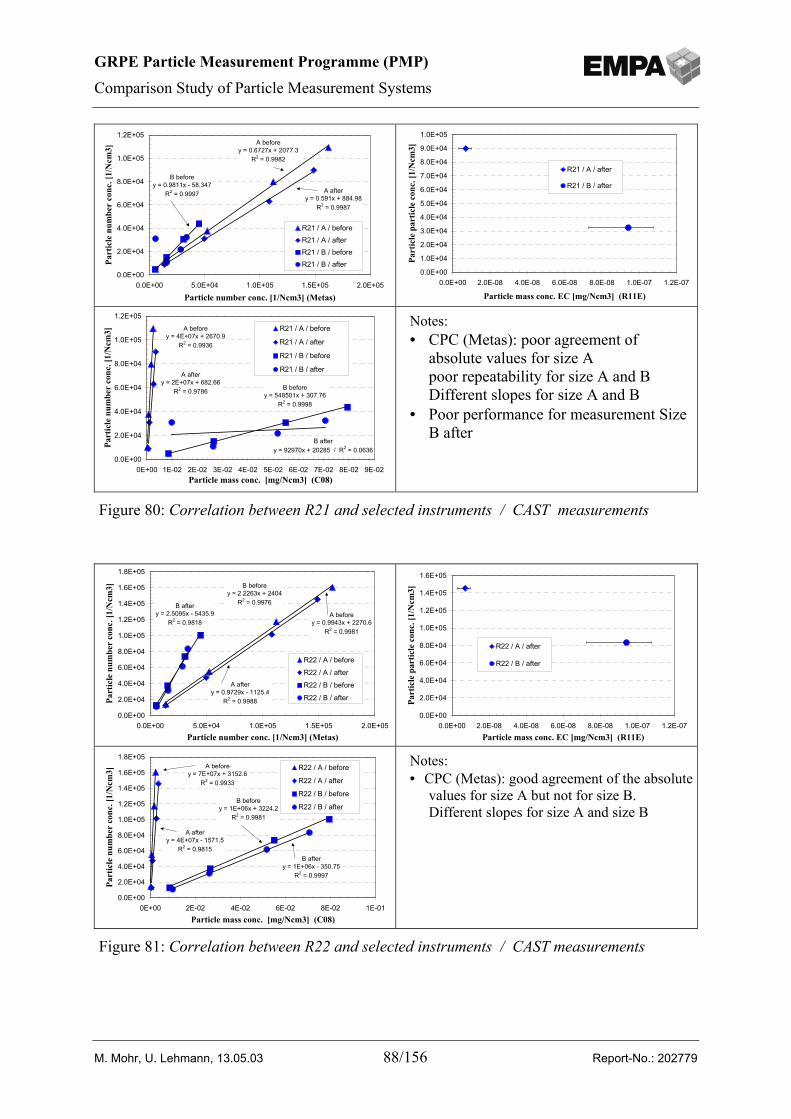
GRPE Particle Measurement Programme (PMP)
Comparison Study of Particle Measurement Systems
M. Mohr, U. Lehmann, 13.05.03 88/156 Report-No.: 202779
B beforey = 0.9811x - 58.347
R2 = 0.9997
A beforey = 0.6727x + 2077.3
R2 = 0.9982
A aftery = 0.591x + 884.98
R2 = 0.9987
0.0E+00
2.0E+04
4.0E+04
6.0E+04
8.0E+04
1.0E+05
1.2E+05
0.0E+00 5.0E+04 1.0E+05 1.5E+05 2.0E+05
Particle number conc. [1/Ncm3] (Metas)
Part
icle
num
ber
conc
. [1/
Ncm
3]
R21 / A / beforeR21 / A / afterR21 / B / beforeR21 / B / after
0.0E+00
1.0E+04
2.0E+04
3.0E+04
4.0E+04
5.0E+04
6.0E+04
7.0E+04
8.0E+04
9.0E+04
1.0E+05
0.0E+00 2.0E-08 4.0E-08 6.0E-08 8.0E-08 1.0E-07 1.2E-07
Particle mass conc. EC [mg/Ncm3] (R11E)
Part
icle
par
ticle
con
c. [1
/Ncm
3]
R21 / A / after
R21 / B / after
B beforey = 548501x + 307.76
R2 = 0.9998
B aftery = 92970x + 20285 / R2 = 0.0636
A aftery = 2E+07x + 682.66
R2 = 0.9786
A beforey = 4E+07x + 2670.9
R2 = 0.9936
0.0E+00
2.0E+04
4.0E+04
6.0E+04
8.0E+04
1.0E+05
1.2E+05
0E+00 1E-02 2E-02 3E-02 4E-02 5E-02 6E-02 7E-02 8E-02 9E-02Particle mass conc. [mg/Ncm3] (C08)
Part
icle
num
ber
conc
. [1/
Ncm
3] R21 / A / before
R21 / A / after
R21 / B / before
R21 / B / after
Notes:• CPC (Metas): poor agreement of
absolute values for size Apoor repeatability for size A and BDifferent slopes for size A and B
• Poor performance for measurement SizeB after
Figure 80: Correlation between R21 and selected instruments / CAST measurements
B beforey = 2.2263x + 2404
R2 = 0.9976
A aftery = 0.9729x - 1125.4
R2 = 0.9988
A beforey = 0.9943x + 2270.6
R2 = 0.9981
B aftery = 2.5095x - 5435.9
R2 = 0.9818
0.0E+00
2.0E+04
4.0E+04
6.0E+04
8.0E+04
1.0E+05
1.2E+05
1.4E+05
1.6E+05
1.8E+05
0.0E+00 5.0E+04 1.0E+05 1.5E+05 2.0E+05Particle number conc. [1/Ncm3] (Metas)
Part
icle
num
ber
conc
. [1/
Ncm
3]
R22 / A / before
R22 / A / after
R22 / B / before
R22 / B / after
0.0E+00
2.0E+04
4.0E+04
6.0E+04
8.0E+04
1.0E+05
1.2E+05
1.4E+05
1.6E+05
0.0E+00 2.0E-08 4.0E-08 6.0E-08 8.0E-08 1.0E-07 1.2E-07Particle mass conc. EC [mg/Ncm3] (R11E)
Part
icle
par
ticle
con
c. [1
/Ncm
3]
R22 / A / after
R22 / B / after
B aftery = 1E+06x - 350.75
R2 = 0.9997
B beforey = 1E+06x + 3224.2
R2 = 0.9981
A aftery = 4E+07x - 1571.5
R2 = 0.9815
A beforey = 7E+07x + 3152.6
R2 = 0.9933
0.0E+00
2.0E+04
4.0E+04
6.0E+04
8.0E+04
1.0E+05
1.2E+05
1.4E+05
1.6E+05
1.8E+05
0E+00 2E-02 4E-02 6E-02 8E-02 1E-01Particle mass conc. [mg/Ncm3] (C08)
Part
icle
num
ber
conc
. [1/
Ncm
3] R22 / A / before
R22 / A / after
R22 / B / before
R22 / B / after
Notes:• CPC (Metas): good agreement of the absolute
values for size A but not for size B.Different slopes for size A and size B
Figure 81: Correlation between R22 and selected instruments / CAST measurements
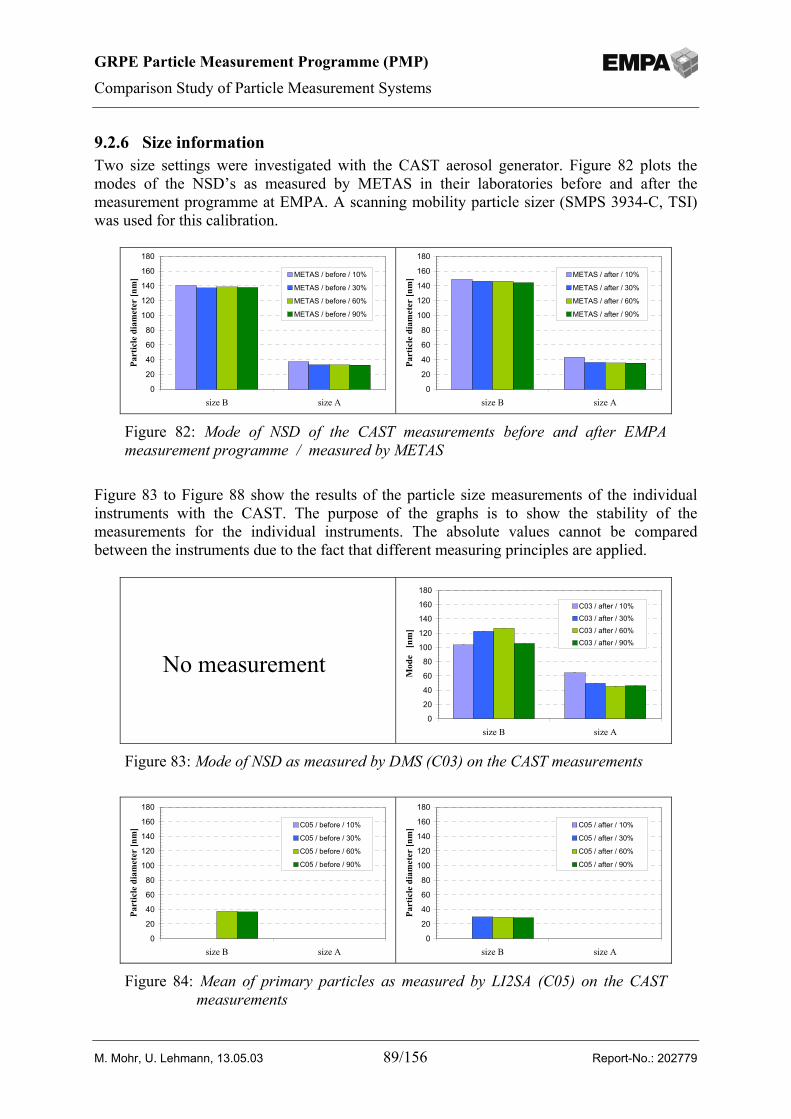
GRPE Particle Measurement Programme (PMP)
Comparison Study of Particle Measurement Systems
M. Mohr, U. Lehmann, 13.05.03 89/156 Report-No.: 202779
9.2.6 Size informationTwo size settings were investigated with the CAST aerosol generator. Figure 82 plots themodes of the NSD’s as measured by METAS in their laboratories before and after themeasurement programme at EMPA. A scanning mobility particle sizer (SMPS 3934-C, TSI)was used for this calibration.
Figure 83 to Figure 88 show the results of the particle size measurements of the individualinstruments with the CAST. The purpose of the graphs is to show the stability of themeasurements for the individual instruments. The absolute values cannot be comparedbetween the instruments due to the fact that different measuring principles are applied.
0
20
40
60
80
100
120
140
160
180
size B size A
Part
icle
dia
met
er [n
m] METAS / before / 10%
METAS / before / 30%
METAS / before / 60%
METAS / before / 90%
0
20
40
60
80
100
120
140
160
180
size B size APa
rtic
le d
iam
eter
[nm
] METAS / after / 10%
METAS / after / 30%
METAS / after / 60%
METAS / after / 90%
Figure 82: Mode of NSD of the CAST measurements before and after EMPAmeasurement programme / measured by METAS
0
20
40
60
80
100
120
140
160
180
size B size A
Mod
e [
nm]
C03 / after / 10%C03 / after / 30%C03 / after / 60%C03 / after / 90%
Figure 83: Mode of NSD as measured by DMS (C03) on the CAST measurements
0
20
40
60
80
100
120
140
160
180
size B size A
Part
icle
dia
met
er [n
m] C05 / before / 10%
C05 / before / 30%
C05 / before / 60%
C05 / before / 90%
0
20
40
60
80
100
120
140
160
180
size B size A
Part
icle
dia
met
er [n
m] C05 / after / 10%
C05 / after / 30%
C05 / after / 60%
C05 / after / 90%
Figure 84: Mean of primary particles as measured by LI2SA (C05) on the CASTmeasurements
No measurement
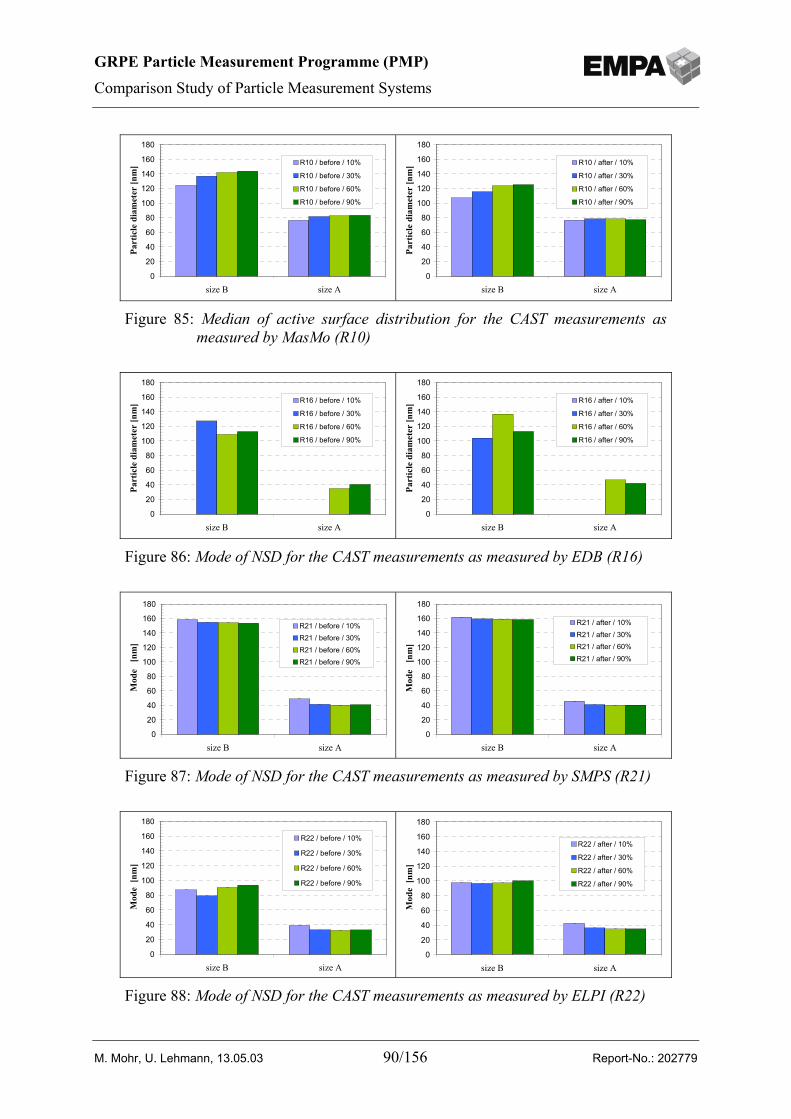
GRPE Particle Measurement Programme (PMP)
Comparison Study of Particle Measurement Systems
M. Mohr, U. Lehmann, 13.05.03 90/156 Report-No.: 202779
0
20
40
60
80
100
120
140
160
180
size B size A
Part
icle
dia
met
er [n
m] R10 / before / 10%
R10 / before / 30%
R10 / before / 60%
R10 / before / 90%
0
20
40
60
80
100
120
140
160
180
size B size A
Part
icle
dia
met
er [n
m] R10 / after / 10%
R10 / after / 30%
R10 / after / 60%
R10 / after / 90%
Figure 85: Median of active surface distribution for the CAST measurements asmeasured by MasMo (R10)
0
20
40
60
80
100
120
140
160
180
size B size A
Part
icle
dia
met
er [n
m] R16 / before / 10%
R16 / before / 30%
R16 / before / 60%
R16 / before / 90%
0
20
40
60
80
100
120
140
160
180
size B size A
Part
icle
dia
met
er [n
m] R16 / after / 10%
R16 / after / 30%
R16 / after / 60%
R16 / after / 90%
Figure 86: Mode of NSD for the CAST measurements as measured by EDB (R16)
0
20
40
60
80
100
120
140
160
180
size B size A
Mod
e [
nm]
R21 / before / 10%R21 / before / 30%R21 / before / 60%R21 / before / 90%
0
20
40
60
80
100
120
140
160
180
size B size A
Mod
e [
nm]
R21 / after / 10%R21 / after / 30%R21 / after / 60%R21 / after / 90%
Figure 87: Mode of NSD for the CAST measurements as measured by SMPS (R21)
0
20
40
60
80
100
120
140
160
180
size B size A
Mod
e [n
m]
R22 / before / 10%
R22 / before / 30%
R22 / before / 60%
R22 / before / 90%
0
20
40
60
80
100
120
140
160
180
size B size A
Mod
e [n
m]
R22 / after / 10%
R22 / after / 30%
R22 / after / 60%
R22 / after / 90%
Figure 88: Mode of NSD for the CAST measurements as measured by ELPI (R22)
GRPE Particle Measurement Programme (PMP)
Comparison Study of Particle Measurement Systems
M. Mohr, U. Lehmann, 13.05.03 91/156 Report-No.: 202779
10 DiscussionAt the time of completion of this report, there was as yet no detailed catalogue of criteria inexistence within PMP for the assessment of the candidate systems. This fact affected thepresent experimental study in the following ways:• The participating systems could not be optimised for this catalogue of criteria that will be
defined in a later phase of PMP.• The manufacturers applied their own individual strategy for their measurement set-up
with the consequence of reduced comparability between the candidate systems.• A clear assessment and ranking of the systems for the suitability for future legislation was
not possible owing to the missing criteria.Complete measurement systems were investigated in this study, consisting of sampling anda detection unit. Some of the instruments took their sample from the exhaust gas line, othersfrom the primary full-flow CVS tunnel and a third group took it from the secondary dilutiontunnel. The use of different sampling systems has to be taken into account by comparing theinstruments only to each other.In order to generate emission values (e.g. in units per kWh), the particle concentrationsmeasured from raw gas exhaust line has to be multiplied by the time-synchronised exhaustgas flow that is measured separately. The separate procedure of exhaust flow measurementhas not been taken into account for the assessment of the candidate systems as it is a generalrequirement for all applications of raw gas measurements.
For the assessment of the candidate systems, the following criteria were investigated in thisstudy:
Robustness suitability for type approval tests
Repeatability transient tests steady-state tests
Time response capability to follow a transient cycle response on step changes in engine operation
Linearity
Sensitivity Ratio between two emission levels
Detection limit Variation of several low concentration measurements Noise-to-signal ratio
Plausibility of absolute values Correlation between instruments
Further aspects for the assessment were considered but were not investigated in this study
Ease of calibration
GRPE Particle Measurement Programme (PMP)
Comparison Study of Particle Measurement Systems
M. Mohr, U. Lehmann, 13.05.03 92/156 Report-No.: 202779
link to traceable references
Criteria that were not considered due to lack of data but should be considered in future studies
Reproducibility accuracy and precision (determined by measurement with different instruments of the
same model for the same emission source)
Response to variation in particle properties composition of particles (soot, adsorbates, etc.) morphology, density
Response to variation in sampling conditions temperature, humidity, pressure conditions, residence times, flow rates
Concentration range defines the demands on the dilution system
DMS (C03)
RobustnessThe version of DMS that was tested at EMPA was a prototype. The instrument was still beingoptimised during the measurement programme with the result that some measurements wereskipped. No fundamental problems in robustness were identified that would restrict use fortype approval tests.
RepeatabilityThe conditioning of the sample for the DMS was not optimised as no additional dilution orthermal treatment was used downstream of the sampling from the primary CVS tunnel. As aconsequence, the DMS measures significantly volatile particles more often and in a muchhigher concentration during the test runs compared to other measurement systems. Thepresence of nuclei particles had a detrimental effect on the repeatability of the results, mainlyfor the low post-trap set-up (i.e. low-emission configuration). In the few cases withoutnucleation, the DMS showed a COV in the range of 15% or better.
Response timeThe response time (t50-10) of the DMS to well-defined concentration changes was observed tobe fast, within a few seconds. The t90-10 times showed slightly higher values in the range of 10to 20 s, probably due to the non-stable contribution of volatile particles. The DMS was able tofollow a transient test cycle and to detect individual peaks in particle concentration due tobrief load peaks during the transient ETC.
Limit of detection (LOD)The LOD of the DMS shows a rather high value caused by nucleation effects, resulting in avery low (about 15) ratio between ETC high-emission and LOD.The LOD is larger than the concentration measured at ETC low-emission level. Noproposition was therefore possible for the ETC low-emission configuration (post-trap).
GRPE Particle Measurement Programme (PMP)
Comparison Study of Particle Measurement Systems
M. Mohr, U. Lehmann, 13.05.03 93/156 Report-No.: 202779
SensitivityThe results are affected by the frequently detected nucleation particles (very high LOD).The use of an modified sampling system in order to get rid of the nucleation phenomena willgreatly improve the sensitivity of the instrument.
LinearityThe DMS showed flawless performance in linearity during the CAST tests.
Comparison with other instrumentsThe frequent detection of nucleation particles again made it difficult to interpret the absolutevalues. Owing to this effect, the DMS measured significantly higher number concentrationsthan the other number-based instruments in most cases. But significant discrepancy is alsoobserved for the CAST measurements between the absolute values measured by CPC(METAS) and those measured by the DMS, which cannot be explained by nucleation.Nevertheless, a rather close correlation between DMS and the CPC (R19) was observed(R2=0.89) for the engine data when modes with obviously strong nucleation were excluded.
CalibrationThe calibration procedure of absolute number concentration by a traceable standard is not yetfixed. The calibration of size can be carried out by means of standard reference particles(latex, gold).
SummaryThe tested DMS was a prototype, and it is assumed that further development will improve theperformance. The DMS provides time-resolved and size-discriminated data that mostprobably exceed the requirements for a future type approval test procedure. The benefit of thenumber-based instrument is the very high sensitivity and the ability to distinguish betweendifferent modes of particles by the size information.The results obtained by the DMS were greatly affected by the detection of nucleation particlesdue to non-heated sampling. For this reason, the true performance of the DMS could not beevaluated. However, discrepancies in number concentration were also observed for the CASTmeasured where no nucleation took place.
Gravimetric filter method (C04)
RobustnessThe application as the regulated method for type approval tests for more than twenty yearsproves the robustness of the gravimetric filter method. No detrimental effects was observeddue to the adoption of some specifications of US 2007 Federal Register.
RepeatabilityGood repeatability was observed for all test measurements. The COVs of the measurementresults were found to be within 10% for the high-emission configuration and 20% for thepost-trap (low-emission) configuration.
GRPE Particle Measurement Programme (PMP)
Comparison Study of Particle Measurement Systems
M. Mohr, U. Lehmann, 13.05.03 94/156 Report-No.: 202779
Response timeThe method does not provide time-resolved results.
Limit of detection (LOD)The LOD was found to be about 60% of the measured ETC low-emission concentration.The concentration for the ETC high-emission (about 60% of Euro 4) was about 11 timeshigher than the LOD.
SensitivityThe gravimetric filter method showed comparatively small differences in concentrationbetween the two investigated emission levels configuration with and without bypass. For alltest cycles, the ratio between high (60% of Euro 4) and low-emission (post-trap) configurationwas below 10.The concentrations for the background and post-trap were measured in the same range as formost instruments.
LinearityNo tests for linearity were carried out with CAST due to the high flow rates required for thefilter methods.
Comparison with other instrumentsRather poor correlation to other measurement systems was generally observed. For the single-mode B100, significantly higher concentrations were found in comparison with otherinstruments probably due to condensed material. Almost perfect correlation was found to theMEXA 1370 PM (C06) (R2 = 0.96). The regression factor (R2) for the correlation to the otherinstruments did not exceed 0.56.
CalibrationA calibration procedure is established for the regulated gravimetric filter method which isbased on reference weights.
SummaryThe gravimetric filter method as applied in this study is based on EU Directive 1999/96/EC.However some specifications of the US 2007 Federal Register were adopted. The mainmodifications affected the use of a pre-cyclone and filter holders for filters of 47 mmdiameter, filters of different quality, the thermal insulation of the sampling system and theconditioning of the dilution air.The gravimetric filter method performed very well in the repeatability tests. The relativelylow sensitivity compared to number/surface-based systems has to be assessed less favourably.The poor correlation to most of the other instruments is probably due to the volatile fraction.Whereas most instrument detect only solid particles, the particle mass collected on the filteralso includes volatile material due to the sampling conditions.
GRPE Particle Measurement Programme (PMP)
Comparison Study of Particle Measurement Systems
M. Mohr, U. Lehmann, 13.05.03 95/156 Report-No.: 202779
LI2SA (C05)
RobustnessAlthough the LI2SA is a fairly new measurement instrument, it gave the impression of beingvery robust during the measurement programme.
RepeatabilityVery good repeatability was observed for most test cycles. The COVs of the measurementresults were found to be within 4% for the high-emission configuration (60% Euro 4) and 8%for the post-trap (low-emission) configuration of the transient ETC. A higher variation up to30% was only found for some single modes at the low-emission level..
Response timeThe response of the LI2SA to concentration changes were observed to be fast and stablewithin a few seconds (t90-10 < 4 s). The LI2SA was able to detect individual peaks in particleconcentration during the transient ETC test cycle due to brief load peaks.
Limit of detection (LOD)The LOD was found to be about 22% of the measured ETC low-emission concentration.The concentration for the ETC high-emission was about 45 times above the LOD.
SensitivityThe LI2SA showed comparatively low differences in concentration between the twoinvestigated emission levels with and without bypass. The ratio between high (60% Euro 4)and low-emission (post-trap) configuration did not exceed 15 for any test cycle.The concentration for the background and post-trap were measured in the same range as formost instruments.At the CAST measurements the LI2SA showed insufficient sensitivity for the low-masssettings.
LinearityDuring the CAST tests, the LI2SA showed a flawless performance in linearity for the largersize setting (CAST size B). For the size setting (CAST size A), LI2SA did not show anyresponse at all, as the mass concentrations of these samples with smaller particles were toolow according to the specification of the instrument (see Appendix).
Comparison with other instrumentsGood agreement to other mass-based methods was generally observed for the high-emissionconfiguration. Very good correlation was found to EC mass-based instruments (C06E: R2 =0.97, C08: R2 = 0.99) and to the MasMo (R10: R2 = 0.99). Moreover, the LI2SA showed goodcorrelation to the CPC 3022A (R19) (R2 = 0.96). For the high-emission configuration, theagreement of the absolute values was within 12% of the EC values measured by coulometry(R11E) and 25% for PASS (C08). Significantly higher concentration compared to coulometry(R11E) and MEXA (C06E) were measured for the post-trap configuration. Poor performancewas observed in the CAST measurements at CAST size setting A (lower mode of the numbersize distribution). Here, the LI2SA did not show any response, in contrast to most otherinstruments.
GRPE Particle Measurement Programme (PMP)
Comparison Study of Particle Measurement Systems
M. Mohr, U. Lehmann, 13.05.03 96/156 Report-No.: 202779
CalibrationThe LI2SA can be calibrated for EC mass by the coulometric reference method.With regard to the primary particle size, no calibration method is as yet available to theauthors’ knowledge.
SummaryThe LI2SA provides time-resolved real mass data including information on the mean size ofthe primary particles. The instrument performed very well in relation to repeatability andshowed good correlation to other instruments. However, the sensitivity is low in comparisonwith number-based instruments and was not sufficient for some very low concentrationsettings. It should be mentioned that the LI2SA is able to measure from the raw gas line,which would have increased the sensitivity by the dilution factor. According to themanufacturer, the sensitivity has been improved in the latest version of the instrument.
MEXA 1370 PM (C06)
RobustnessThe filter sampling and its analysis by the instrument were found not to pose any problemsduring the measurement programme.
RepeatabilityGood repeatability was observed for all test measurements. For the ETC, the COV of themeasurement results was found to be within 2% for the high-emission configuration (60%Euro 4) and 6% for the post-trap (low-emission) configuration. For the steady-state tests ahigher COV of up to 20% was observed for both configurations. Looking at all cyclesperformed at high-emission level, the COV values of EC tend to have higher values.
Response timeThis method does not supply time-resolved results.
Limit of detection (LOD)The LOD was found to be about 20% of the measured ETC low-emission concentration.The concentration for the ETC high-emission (about 60% of Euro 4) was about 31 timeshigher than the LOD.
SensitivityThe MEXA 1370 PM showed comparatively small differences in total mass between the twoinvestigated emission levels with and without bypass. For all test cycles, the ratio betweenhigh (60% Euro 4) and low-emission (post-trap) configuration was below 10. Higher ratios ofbetween 13 and 70 were determined by looking only at the EC fraction. For both, total massand EC mass, the values were measured in the same range for the background and post-trap asfor most instruments.
LinearityNo tests for linearity were carried out by CAST due to the high flow rates required for thefilter methods.
GRPE Particle Measurement Programme (PMP)
Comparison Study of Particle Measurement Systems
M. Mohr, U. Lehmann, 13.05.03 97/156 Report-No.: 202779
Comparison with other instrumentsThe MEXA showed almost perfect agreement to the gravimetric filter method (C04). Thedeviation of the slope of regression line was within 1% with R2 = 0.96. This is also a result ofthe identical sampling procedure applied for both filters. With regard to correlation to otherinstruments, a good result was found for the EC mass (R11E: R2 = 0.94, C05: R2 = 0.97).However, the MEXA detected about 60% of the EC mass measured by coulometry.
CalibrationThe instrument is calibrated by CO2 and SO2 calibration gas.
SummaryThe MEXA 1370 PM is a filter-based method where weighing is replaced by gas analysisafter vaporisation. The method performed very well in the repeatability tests. The very goodagreement compared to the gravimetric filter method (C04) was due to the identical samplingprocedure.The MEXA shows low sensitivity similar to the gravimetric filter method (C04) and mostother mass-based instruments in comparison with the number-, length-, surface-basedinstruments. Because the method is able to distinguish between different species of particles,the sensitivity can be improved by taking only the EC mass into account for thequantification.
TEOM (C07)The TEOM participated in the measurement programme, but EMPA has never received anymeasurement results for further data evaluation. For this reason, no assessment of theinstrument is possible.
PASS (C08)
RobustnessThe PASS tested at EMPA was a prototype, but proved to be very robust during themeasurement programme.
RepeatabilityA very good repeatability was observed for most test cycles. The COVs of the measurementresults were found to be within 2% for the high-emission configuration (60% Euro 4) and13% for the post-trap configuration of the transient ETC. A higher variation of up to 32% wasonly found for some single modes at the low-emission level.
Response timeThe response of the PASS to a defined concentration changes was found to be fast and stablewithin a few seconds (t90-10 < 4 s). The PASS was able to follow a transient test cycle and todetect individual peaks in particle concentration due to brief load peaks during the transientETC.
GRPE Particle Measurement Programme (PMP)
Comparison Study of Particle Measurement Systems
M. Mohr, U. Lehmann, 13.05.03 98/156 Report-No.: 202779
Limit of detection (LOD)The LOD was found to be about 40% of the measured ETC low-emission concentration. Theconcentration for the ETC high-emission (about 60% of Euro 4) was about 74 times higherthan the LOD.The PASS showed fairly high noise-to-signal values for the CAST measurements.
SensitivityThe PASS showed comparatively small differences in the ratios between high (60% Euro 4)and low-emission (post-trap) configuration. Ratios between 8 and 41 were determined for thedifferent test cycles (ETC: 28). These results are significantly lower than for most number/length/surface-based instruments.
LinearityDuring the CAST tests the PASS showed flawless performance in linearity for both sizesettings studied.
Comparison with other instrumentsGood agreement with other mass-based methods was generally observed for the high-emission configuration. Very good correlation was found to EC mass-based instruments(C06E: R2 = 0.95, C05: R2 = 0.99). Moreover, the PASS showed good correlation with theCPC (R19) (R2 = 0.94). Looking at the high-emission level, the agreement of the absolutevalues compared to the EC values measured by the coulometry is within 37%, and agreementin comparison with LI2SA (C05) is about 25%. Significantly higher concentrations comparedwith coulometry (R11E) and MEXA (C06E) were measured for the post-trap configuration.
CalibrationThe PASS can be calibrated for EC mass by comparison with the coulometric referencemethod.
SummaryThe PASS provides time-resolved real mass data. The instrument performed very well inrepeatability and showed good correlation with other instruments. However, the sensitivity islow in comparison with number-based instruments. Some discrepancy in absolute values wasfound for very low concentration compared to EC values. Although the PASS tested at EMPAwas a prototype, the instrument showed convincing performance.
MasMo (R10)
RobustnessAlthough the MasMo is a fairly new measurement instrument, it proved to be very robustduring the measurement programme.
RepeatabilityGood repeatability was observed for most test cycles. The COV of the measurement resultswas found to be within 8% for the high-emission configuration (60% Euro 4) and 24% for thepost-trap (low-emission) configuration of the transient ETC. Only for some single modes atthe low-emission level was a higher variation of up to 52%.
GRPE Particle Measurement Programme (PMP)
Comparison Study of Particle Measurement Systems
M. Mohr, U. Lehmann, 13.05.03 99/156 Report-No.: 202779
Response timeThe response to a defined concentration change was observed to be fast and stable within afew seconds (t90-10 < 8 s). The MasMo was able to follow a transient test cycle and to detectindividual peaks in particle concentration due to brief load peaks during the transient ETC.
Limit of detection (LOD)The LOD was found to be about 72% of the measured ETC low-emission concentration.The concentration for the ETC high-emission (about 60% of Euro 4) was about 715 timeshigher than the LOD, which is somewhat high for a mass-based instrument.The MasMo showed a rather low noise-to-signal value within single CAST measurements.
SensitivityRelatively high differences between high (60% Euro 4) and low-emission (post-trap)configuration were measured by the MasMo. Ratios between 25 and 3000 were determinedfor the different test cycles (ETC: 520). The MasMo showed high sensitivity in comparisonwith other mass-based instruments.In contrast to most other instruments, the MasMo measured a significantly higher massconcentration for the background than for the post-trap configuration.
LinearityThe CAST tests exhibited flawless performance in linearity for the MasMo.
Comparison with other instrumentsGood agreement with other mass-based methods was generally observed for the high-emission configuration. Very good correlation was found to EC mass based instruments(C06E: R2 = 0.95, C05: R2 = 0.99). The agreement of the absolute values was within 37%compared to the EC values measured by the coulometry (R11E) and 25% in correlation to theLI2SA (C05).The MasMo also benefited from the use of a heated sampling line and the heated dilution unit.
CalibrationA calibration by a traceable standard would be a problem as the mass is calculated from asurface-related size distribution. The calibration of absolute surface area concentration by atraceable standard has not yet been solved.
SummaryThe MasMo provides time-resolved mass concentrations including some size information.The mass and size information is calculated using size distribution for the active surface andthe particle density. The reliability of the median active surface area diameter was notinvestigated in this study. The mass median diameter will be calculated in the updatedsoftware version.The instrument performed very well in repeatability and showed good correlation with otherinstruments for mass concentration. The sensitivity was found to be high in comparison withother mass-calibrated instruments. Although the MasMo is a very new measurementtechnique, the instrument showed convincing performance. As the algorithms assume amonomodal symmetric distribution of the measured aerosol, more experience has to be gainedwith aerosols that do not fulfil this condition, e.g. aerosol downstream of a trap, bimodality byadditives.
GRPE Particle Measurement Programme (PMP)
Comparison Study of Particle Measurement Systems
M. Mohr, U. Lehmann, 13.05.03 100/156 Report-No.: 202779
Coulometry (R11)Filter sampling using the partial flow system AVL Smart Sampler was found to operatewithout any problems during the measurement programme.
RepeatabilityIn view of the fact that the coulometry is a reference method, the results for the repeatabilitywere not very satisfactory. The COV of the EC+OC mass was found to be within 19% (EC:23%) for the high-emission configuration (60% Euro 4) and 41% (EC: >700%) for the post-trap configuration of the transient ETC. For some single modes higher variation up to 180%was found for the low-emission configuration. The high variation for the EC mass at theclose-to-zero level indicates offset instability of the instrument.
Response timeThe method does not provide time-resolved information.
Limit of detection (LOD)For both, EC+OC and EC, the LOD was found to be about 120% of the measured ETC low-emission concentration. The concentration for the ETC high-emission (about 60% of Euro 4)was about 6.6 times higher than the LOD.For the EC measurements (R11E), the ratio between ETC low-emission and LOD is about0.04, while the ratio between ETC high-emission and LOD is about 11.
SensitivityThe coulometry showed comparatively low differences in concentration between the ratiobetween high (60% Euro 4) and low-emission (post-trap) configuration for EC+OC. Ratiosbetween 4 and 60 were determined for the different test cycles (ETC: 8). EC alone revealed asignificantly higher sensitivity. The values for the ratios between high and low were found tobe between 7 and 260 (ETC: 260). Only slightly lower sensitivity was consequentlydetermined for EC mass measured by coulometry than for the number/length/surface-basedinstruments.Significantly higher EC+OC and EC mass concentration was measured for the backgroundthan for the post-trap configuration.
LinearityNo tests for linearity were carried out with CAST due to the high flow rates required for thefilter methods.
Comparison with other instrumentsAcceptable agreement to other mass-based methods was generally observed for the high-emission configuration. For the ETC post-trap measurements, the absolute PM valuesmeasured by the coulometry, by the gravimetric filter sampling (C04) and by the MEXA 1370(C06) showed less than 10% variation in total mass. Better correlation with other instrumentswas found for the EC mass fraction (C06E: R2 = 0.94, C05: R2 = 0.95, R2 = 0.95, R10: R2 =0.94, R19: R2 = 0.95) than for OC+EC (C04: R2 = 0.51). The agreement of the absolute ECconcentrations was within about ±40% to the PASS (C08), LI2SA (C05) and MEXA (C06E).
GRPE Particle Measurement Programme (PMP)
Comparison Study of Particle Measurement Systems
M. Mohr, U. Lehmann, 13.05.03 101/156 Report-No.: 202779
CalibrationCoulometry is a reference method for the quantification of elemental carbon (EC).
SummaryCoulometry provides real mass concentrations for elemental carbon (EC) and organic boundcarbon (OC). Due to the sampling, no time-resolved data is obtained. The principle is widelyused for the regulation of EC exposure at workplaces in many countries. The measurementscarried out in this study did not show very good repeatability, but good correlation of the ECconcentration with many other instruments. However, the sensitivity is low compared tonumber-based instruments.
Dust Monitor (R12)As the instrument took part in a very limited number of measurements, only a very reducedassessment of the system is possible.
RobustnessThe number of measurements was too low for an assessment to be made.
RepeatabilityThe very limited number of measurements available for the instrument did not allow anevaluation of repeatability to be made.
Response timeFor the DustMonitor, the characteristic times (response values) could not be determined as theinstrument responded to load changes during the SCT in the opposite way . The DustMonitorwas able to follow the transient ETC but it is questionable whether the signal was related tothe particle emission.
Limit of detection (LOD)The LOD could not be determined because the instrument did not measure at engine low-emission level.The DustMonitor showed a rather high noise-to-signal value within single measurements forthe engine background.
SensitivityNo findings about the sensitivity of the DustMonitor could be obtained as the instrument didnot participate in the measurements with the post-trap (low-emission) configuration.
LinearityNo measurements with the CAST were carried out for linearity tests.
Comparison with other instrumentsThe DustMonitor showed a concentration about three orders of magnitude lower than othernumber-based instruments.
GRPE Particle Measurement Programme (PMP)
Comparison Study of Particle Measurement Systems
M. Mohr, U. Lehmann, 13.05.03 102/156 Report-No.: 202779
CalibrationCalibration of absolute number concentration by a traceable standard has not yet been solved.The calibration of size can be carried out using standard reference particles (latex, gold).
SummaryThe DustMonitor is based on a light scattering method and provides time-resolved particlenumber concentrations. In this study, the instrument measured much far low particleconcentrations in comparison with other instruments. Due to the principle of measurement,the instrument is focused on the detection of particles in a far higher size range than thetypical emissions level of a modern diesel engine. This version of the DustMonitor proved notto be suitable for future type approval purposes.
Seq. SMPS+C/UPC (Ultrafine Particle Counter) (R13)As the instrument took part in a very limited number of measurements, only a very reducedassessment of the system is possible.
RobustnessThe number of measurements was too low for an assessment to be made.
RepeatabilityThe very limited number of measurements available for the instrument did not allow anevaluation of repeatability to be made.
Response timeA measurement with the seq. SMPS+C requires a stable aerosol for a few minutes. For thisreason SMPS+C is not able to perform transient measurements, and a stand-alone CPC wastherefore used for these tests. The UPC showed fairly long response times (t90-10 > 15 s, t10-90 >60 s). The long response times are probably caused by the low flow rate through the UPCand/or by the non-stable contribution of volatile particles. The UPC was able to follow atransient test cycle and to detect individual peaks in particle concentration due to brief loadpeaks during the transient ETC.
Limit of detection (LOD)The LOD could not be determined because the instrument did not measure at low engineemission level.
SensitivityNo findings on the sensitivity of the seq. SMPS+C could be obtained as the instrument did nottake part in the measurements with the post-trap (low-emission) configuration.
LinearityNo measurements with the CAST were carried out for linearity tests.
GRPE Particle Measurement Programme (PMP)
Comparison Study of Particle Measurement Systems
M. Mohr, U. Lehmann, 13.05.03 103/156 Report-No.: 202779
Comparison with other instrumentsOnly a few measurements were available for the comparison with other instruments. With thereservation that different dilution systems were used, the comparison of the SMPS+C (R13) tothe SMPS3936-L10 (R21) revealed significant discrepancies in number concentrations up to afactor of 2. A deviation of up to 35% was observed for the stand-alone CPCs. For both set-upsthe Grimm instrument (R13) measured the lower concentration.
CalibrationCalibration of absolute number concentration by a traceable standard has not yet been solved.The calibration of size can be carried out using standard reference particles (latex, gold).
SummaryThe SMPS+C provides detailed number size distributions. The advantage of particle sizeinformation is offset by the inability to follow a transient test cycle, as constant particleemission for several minutes is needed for the measurement. Due to the very short period ofparticipation in the programme, performance could not be properly evaluated. The few resultsobtained by the SMPS+C indicated a significant discrepancy in concentration compared withother number-based instruments. A stand-alone CPC was able to measure transient cycleswith high sensitivity, but any size information became lost. As the CPC is very susceptible tonucleation particles, the removal of such particles (e.g. by a thermodesorber) is highlyrecommended for repeatable results to be obtained.
DPSO-1 (R14)
RobustnessThe instrument proved to operate very robustly during the measurement programme.
RepeatabilityDue to the strong NO2 sensitivity, only the data measured at the high-emission level could beevaluated. The DPSO-1 showed poor repeatability for the ETC cycles (COV = 144%) and forthe single modes, repeatability being in the range of 40%. However, it is not known to whatextent these results are also affected by the NO2 concentration.
Response timeCharacteristic times (response values) could not be determined for the DPSO-1 because theinstrument showed opposite behaviour in relation to load changes during the SCT comparedto other instruments. The DPSO-1 was able to follow the transient ETC, but it is questionablewhether the signal was related to the particle emission.
Limit of detection (LOD)Due to the strong NO2 interference, it was not possible to determine a limit of detection forparticle measurement.
SensitivityThe sensitivity of the instrument was too low and the NO2 interference was too high forreliable measurements at low-emission level.
GRPE Particle Measurement Programme (PMP)
Comparison Study of Particle Measurement Systems
M. Mohr, U. Lehmann, 13.05.03 104/156 Report-No.: 202779
LinearityThe particle concentration provided by the CAST was too low for linearity tests with theDPSO-1.
Comparison with other instrumentsIt was difficult to relate the interpretation of the results to particle concentration because ofthe strong NO2 interference of the instrument. It was therefore not possible to make acomparison of absolute values. Poor correlation with other instruments was generally found.
CalibrationThe DPSO-1 is calibrated for the extinction coefficient by zero & span check. There is nogenerally valid relationship between k-value and particle mass.
SummaryThe DPSO-1 is an opacimeter that uses sensors at three different wavelengths. Although themultiple sensors allow the interference of NO2 to be reduced, the instrument had seriousproblems in measuring reliable particle concentrations in this study.The cross-sensitivity of NO2 was dominant, especially at low-emission level. This version ofthe DPSO-1 was found not to be suitable for future type approval purposes.
LQ1-DC (R15)
RobustnessThis instrument was found to operate very robustly during the measurement programme.
RepeatabilityGood repeatability was observed for most test cycles. The COV of the measurement resultswas found to be within 7% for the high-emission configuration (60% Euro 4) and 34% for thepost-trap configuration of the transient ETC. Higher variation up to 56% was only observedfor some single modes for the low-emission configuration.
Response timeThe response time (t50-10) of the LQ1-DC to well-defined concentration changes was observedto be fast, within a few seconds. The t90-10 times showed slightly higher values in the range of15 to 20 s, probably due to the non-stable contribution of volatile particles. The LQ1-DC wasable to follow a transient test cycle and to detect individual peaks in particle concentrationdue to short load pulses during the transient ETC being limited.
Limit of detection (LOD)The LOD was found to be in the same range as the measured ETC low-emissionconcentration. The concentration for the ETC high-emission (about 60% of Euro 4) was about430 times higher than the LOD.The LQ1-DC showed fairly low noise-to-signal values within single measurements on CASTmeasurements.
GRPE Particle Measurement Programme (PMP)
Comparison Study of Particle Measurement Systems
M. Mohr, U. Lehmann, 13.05.03 105/156 Report-No.: 202779
SensitivityThe LQ1-DC showed comparatively large differences in the ratio between high (60% Euro 4)and low-emission (post-trap) configurations. Ratios between 19 and 1300 were determined forthe different test cycles (ETC: 440). The results demonstrate high sensitivity.The concentration for the background and post-trap were measured in the same range as formost instruments.
LinearityThe tests with the CAST tests revealed flawless performance in linearity for the LQ1-DC forboth investigated size settings.
Comparison with other instrumentsThe absolute values measured by the LQ1-DC could not be compared to other instruments asthe LQ1-DC is the only instrument calibrated on active surface area. However, a cross-checkby the transfer to number, applying very simple assumptions gave reasonable results. Verygood correlation was obtained to some number (R19: R2 = 0.99) and mass-based instruments(C05: R2: 0.99, R11E: R2 = 0.97). The correlation to the EAD (R20), which is based on thesame principle of diffusion charging, showed a correlation with R2 = 0.98.
CalibrationThe calibration of absolute surface concentration by a traceable standard is not yet available.
SummaryThe LQ1-DC is based on diffusion charging and provides time-resolved data on an integralsurface area. The instrument performed very well in repeatability and showed very goodcorrelation to most other instruments. The sensitivity of the instrument is very high. Themeasurement is susceptible to nucleation particles, but less pronounced than number-basedmethods. Nevertheless, the removal of volatile particles (e.g. by thermal treatment) is highlyrecommended in order to obtain more repeatable results. The rotating disc dilution unit(heated to T = 393 K), as used for the LQ1-DC (and R16, R17, R12, R13), gave no indicationof significant interference by volatile particles. Calibration is found to be very difficult as theintegral active surface area has to be calculated by means of the number concentration of amonodisperse aerosol.
EDB (R16)
RobustnessThe EDB tested at EMPA was a prototype but proved to be very robust during themeasurement programme.
RepeatabilityA very good repeatability was observed for most test cycles. The COV of the measurementresults were found to be within 2% for the high-emission configuration (60% Euro 4) andwithin 10% for the post-trap configuration of the transient ETC cycle. A higher variation ofup to 70% was only observed for some single modes at the low-emission level.
GRPE Particle Measurement Programme (PMP)
Comparison Study of Particle Measurement Systems
M. Mohr, U. Lehmann, 13.05.03 106/156 Report-No.: 202779
Response timeThe response time of the EDB to defined concentration changes was observed to be fast andstable within a few seconds (t90-10 < 3 s). The EDB was able to follow a transient test cycle.The detection of individual peaks in particle concentration due to short load pulse during thetransient ETC cycle was limited.
Limit of detection (LOD)The LOD was found to be about 30% of the measured ETC low-emission concentration. Theconcentration for the ETC high-emission (about 60% of Euro 4) was about 560 times higherthan the LOD. The EDB was not able to measure the engine background concentration.
SensitivityThe EDB showed only moderate ratios between the high (60% Euro 4) and low-emission(post-trap) configurations. Ratios between 15 and 650 were determined for the different testcycles (ETC: 165).
LinearityThe tests with the CAST showed moderate linearity performance for the EDB for bothinvestigated size settings. It should be noted that the concentration of the test aerosol waslower by a factor 15 than most other instruments because of using an additional dilution unit.
Comparison with other instrumentsThe EAD showed agreement in total number with the CPC (R19) and the ELPI (R22) within20% for the ETC high-emission configuration. For the post-trap configuration, the measuredconcentration was about 10 times higher than with other instruments. Very good correlationwas obtained to the CPC (R19: R2 = 0.99) and mass-based instruments (R11E: R2 = 0.97).
CalibrationCalibration of absolute number concentration by a traceable standard has not yet been solved.The calibration of size can be carried out using standard reference particles (latex, gold).
SummaryThe EDB provides time-resolved real number concentrations, including some sizeinformation. The instrument performed very well in repeatability and showed goodcorrelation to other instruments for the high-emission configuration (about 60% of Euro 4).Measurements at post-trap emission level showed wide discrepancies in numberconcentrations and lack of sensitivity for this early-stage prototype instrument. It is expectedthat further development will overcome these shortcomings. As the algorithms assume amonomodal lognormal distribution of the measured aerosol, more experience has to be gainedon aerosols that do not fulfil this condition, e.g. post-trap aerosols. The calibration for numberconcentration is found to be difficult as the instrument applies size-dependent diffusioncharging and the size channels of the diffusion battery are very wide..
GRPE Particle Measurement Programme (PMP)
Comparison Study of Particle Measurement Systems
M. Mohr, U. Lehmann, 13.05.03 107/156 Report-No.: 202779
PAS (R17)
RobustnessThe instrument was found to operate without any problems during the measurementprogramme.
RepeatabilityVery good repeatability was observed for many test cycles. The COV of the measurementresults was found to be within 5% for the high-emission configuration (60% Euro 4) and 10%for the post-trap (low-emission) configuration of the transient ETC cycle. The variation wasobserved to be larger than 50% for the low-emission configuration for all single modes.
Response timeThe response time of the PAS to well-defined concentration changes was observed to be fastand stable within a few seconds (t90-10 < 7 s). The PAS was able follow a transient test cycle.Detection of individual peaks in particle concentration was limited due to short load peaksduring the transient ETC.
Limit of detection (LOD)The LOD was found to be about 30% of the measured ETC low-emission concentration.The concentration for the ETC high-emission (about 60% of Euro 4) was about 4400 timeshigher than the LOD.
SensitivityThe PAS showed comparatively small differences in concentration between high (60% Euro4) and low-emission (post-trap) configurations. Ratios between 15 and 1440 were determinedfor the different test cycles (ETC: 1440). The results demonstrate good sensitivity of theinstrument.The concentrations for the background and post-trap were measured in the same range as formost instruments.
LinearityThe tests with the CAST revealed flawless performance in linearity of the PAS for bothinvestigated size settings.
Comparison with other instrumentsThe PAS showed very poor agreement in the absolute values compared to other instruments.For the ETC high-emission configuration, the measured EC mass concentration exceeded by afactor 3 to 5. According to the manufacturer, the instrument was not correctly calibrated. Verygood correlation was observed to the CPC (R19: R2 = 0.97) and coulometry (R11E: R2 =0.95).
CalibrationIn principle, the PAS can be calibrated for EC mass by comparison to the coulometricreference method.
SummaryThe measurement principle of PAS is based on the photoelectric charging of the particles. Theinstrument provides time-resolved data calibrated on EC mass concentration. A large
GRPE Particle Measurement Programme (PMP)
Comparison Study of Particle Measurement Systems
M. Mohr, U. Lehmann, 13.05.03 108/156 Report-No.: 202779
discrepancy in the absolute values with other instruments was observed, giving an indicationof poor calibration of the instrument. The instrument performed very well in repeatability andshowed good correlation to other instruments. Generally applicable mass calibration is foundto be very difficult as charging is highly sensitive to the properties and is related to the surfacearea. This means that changes in size distribution, morphology or slight adsorption processescan significantly affect the result. From our point of view, these major difficultiessignificantly restrict the suitability of the method for type approval applications.
PM-300 (R18)
RobustnessThe PM-300 operated stably during most of the project, but some measurements had to beskipped due to problems with a mass flow controller for the dilution unit.
RepeatabilityFor the transient test cycle ETC, good repeatability with a COV of 8% was observed for thehigh-emission configuration (60% Euro 4). For the post-trap configuration, a COV of 40%was measured. The absolute concentration for the steady-state tests were exceptionally lowcompared to other instruments, so there was no point in evaluating repeatability.
Response timeFor the PM-300 the characteristic time response values could not be determined as theinstrument reacted to load changes during the SCT in the opposite way. The PM-300 was ableto follow a transient test cycle and to detect individual peaks in particle concentration due toshort load pulses during the transient ETC.
Limit of detection (LOD)The LOD could not be evaluated for the PM-300 due to inconsistent results.
SensitivityWith reservation for inconsistency, the PM-300 showed comparatively moderate differencesin concentration between high (60% Euro 4) and low-emission (post-trap) configurations.Ratios between 40 and 400 were determined for the different test cycles (ETC: 40).
LinearityThe particle concentration provided by the CAST was too low for the linearity check of thePM-300.
Comparison with other instrumentsThe concentrations measured for the different cycles by the PM-300 are not consistent incomparison with all other instruments. The concentrations of the transient cycles ETC and theSCT were measured as about four orders of magnitude higher compared to the steady-state-cycles SM and ESC. This is in clear contrast to all other instruments, which measured theconcentration of SM and ETC in the same range. This inconsistency is observed for the highand low-emission configurations. Concerning the ETC, the values for the absoluteconcentration are in the same range as for most other number-calibrated instruments. But the
GRPE Particle Measurement Programme (PMP)
Comparison Study of Particle Measurement Systems
M. Mohr, U. Lehmann, 13.05.03 109/156 Report-No.: 202779
reliability of these results is questionable in view of the very low concentrations as measuredfor the steady-state tests.
CalibrationCalibration of absolute number concentration by a traceable standard has not yet been solved.The calibration of size can be carried out using standard reference particles (latex, gold).
SummaryThe PM-300 is based on the light-scattering method and provides time-resolved particlenumber concentrations. Inconsistent results were obtained in this study.The particle concentrations of the steady-state test measured by this instrument were far toolow compared to other instruments. Due to the principle of measurement the instruments arefocused on the detection of particles in a size range that is higher than the typical emissionsfrom diesel engines. From our point of view, the PM-300 has little potential for future typeapproval application.
CPC 3022A (R19)
RobustnessThe instrument was found to operate without any problems during the measurementprogramme.
RepeatabilityThe CPC showed very good repeatability for all tests in the high-emission configuration (60%Euro 4) (ETC: 2%, SM: 5%). Higher variation was determined at the low-emission level witha COV of 24% for ETC and up to 77% for SM. The high variation is probably caused bynucleation effects due to the inadequate performance of the heated dilution system.
Response timeThe response time (t50-10) of the CPC to well-defined concentration changes was observed tobe fast within a few seconds. The t90-10 times showed larger values up to 60 s. Significantlylonger times were observed for the down-steps compared to the up-steps. The long responsetimes are probably due to an error in the data read-out software. The CPC was able to follow atransient test cycle and to detect individual peaks in particle concentration due to short loadpulses during the transient ETC.
Limit of detection (LOD)The LOD was found to be about 70% of the measured ETC low-emission concentration.The concentration for the ETC high-emission (about 60% of Euro 4) was about 1950 timeshigher than the LOD.
SensitivityThe CPC showed high differences in the ratios between high (60% Euro 4) and low-emission(post-trap) configuration. Ratios between 27 and 3100 were determined for the different testcycles (ETC: 1400). The results demonstrate very high sensitivity for the instrument.The concentrations of the background and post-trap measurement were measured in the samerange as for most instruments.
GRPE Particle Measurement Programme (PMP)
Comparison Study of Particle Measurement Systems
M. Mohr, U. Lehmann, 13.05.03 110/156 Report-No.: 202779
LinearityThe tests with the CAST showed flawless performance in linearity for both investigated sizesettings. For most of the concentration settings, the instrument operated in the photometricmode.
Comparison with other instrumentsIn general, acceptable agreement with other number-based methods was found with fewexceptions. For the ETC, very good agreement in absolute values was found in comparisonwith the ELPI (R22) and EAD (R20) within 20%. A surprisingly wide difference of 30% wasobserved in comparison with the CPC3010 (R21) for the ETC post-trap (low-emission)measurements. This could be explained by the lower cut size of 7 nm for the CPC 3022A(R19), compared with 12 nm for the CPC 3010, which was used for the SMPS (R21).In general, the CPC showed good correlation to most other instruments but not to filtermethods (C04, C06) and some optical instruments (R14, R18). For the EC mass-basedinstruments (C06E, C08, R11E, C05) values for R2 were always higher than 0.94. Even betterresults for R2 were found for the relationship to number/length/surface-related instruments(e.g. R22: 0.99, R15: 0.99,: R10: 0.95).
CalibrationCalibration of absolute number concentration by a traceable standard has not yet been solved.
SummaryThe stand-alone CPC provides time-resolved total number concentrations. The instrumentperformed very well in repeatability and showed very good correlation to most otherinstruments. The sensitivity of the instrument is very high, but is very susceptible tonucleation particles which can completely distort the measurement of solid particlesconcentration. The CPC showed unusually long relaxation times. According to themanufacturer, the long relaxation were caused by an error in the data read-out software.Removal of volatile particles (e.g. by a thermal treatment) is highly recommended forrepeatable results. The heated double ejector-based dilution as applied for the CPC (and R22,R10) proved not to be sufficient to eliminate all nucleation particles during all engineoperation modes.
EAD 3070A (R20)
RobustnessThe EAD 3070A was found to operate without malfunction but had a zero drift problemthroughout the measurement programme. According to the manufacturer, the problem wasdue to an insufficiently long warm-up period before zeroing the instrument.
RepeatabilityThe EAD showed very good repeatability for all tests of the high-emission configuration(ETC: 2%, SM: 9%). Significantly higher variation was determined for the low-emissionconfiguration with a COV of 53% for the ETC and up to 63% for the SM. The high variationis probably caused by nucleation effects due to the inadequate performance of the heateddilution system.
GRPE Particle Measurement Programme (PMP)
Comparison Study of Particle Measurement Systems
M. Mohr, U. Lehmann, 13.05.03 111/156 Report-No.: 202779
Response timeThe response of the EAD to well-defined concentration changes was observed to be fast andstable within a few seconds (t90-10 < 4 s). The EAD was able to follow a transient test cycleand to detect individual peaks in particle concentration due to short load pulses during thetransient ETC test cycle.
Limit of detection (LOD)The LOD was found to be about 160% of the measured ETC low-emission concentration.The concentration for the ETC high-emission (about 60% of Euro 4) was about 1370 timeshigher than the LOD.
SensitivityThe EAD showed high differences in the ratios between high (60% Euro 4) and low-emission(post-trap) configuration. Ratios between 20 and 2700 were determined for the different testcycles (ETC: 2200). The results demonstrate very high sensitivity for the instrument.The concentration for the background and post-trap were measured in the same range as formost instruments.
LinearityThe tests with the CAST revealed flawless performance in linearity of the EAD for bothinvestigated size settings.
Comparison with other instrumentsThe absolute values measured by the EAD could not be compared to other instruments as theEAD is the only instrument calibrated on integral particle length. However, a cross-check bytransferring the length to number applying very simple assumptions gave reasonable results.Very good correlation was obtained to the CPC (R19: R2 = 0.98) and to coulometry (R11E:R2 = 0.91). The correlation to the LQ1-DC (R15), which is based on the same principle ofdiffusion charging, showed correlation with R2 = 0.98.
CalibrationThe calibration of absolute length concentration by a traceable standard has not yet beensolved.
SummaryThe EAD 3070A is based on turbulent diffusion charging and provides time-resolved data onan integral particle length. The instrument performed very well in repeatability and showedvery good correlation to other instruments for the high-emission configuration (about 60% ofEuro 4). The sensitivity of the instrument was found to be very high, but problems were foundat low concentrations due to zero-point drifting. The measurement is susceptible to nucleationparticles, so the removal of volatile particles (e.g. by thermal treatment) is highlyrecommended in order to obtain more repeatable results. Calibration is found to be verydifficult as the integral particle length has to be calculated using the number concentration ofa monodisperse aerosol.
GRPE Particle Measurement Programme (PMP)
Comparison Study of Particle Measurement Systems
M. Mohr, U. Lehmann, 13.05.03 112/156 Report-No.: 202779
Scan. SMPS 3936-L10 (CPC3010) (R21)These instruments were operated in three different configurations depending on the test cycleand the emission level: SMPS scanning mode for all steady-state operating modes, stand-alone CPC for transient low-emission tests (CPC3010 alone without using the DMA) andDMA-CPC combination with fixed voltage setting for transient high-emission tests (scanningSMPS was in the DMA-Bandpass mode with CPC detection). An integrated assessment isconsequently difficult.
RobustnessThe instrument was found to operate without any problems during the measurementprogramme.
RepeatabilityVery good repeatability was observed for SMPS scanning mode setting and DMA-CPCcombination at high-emission level with a COV of 4% and 5% respectively. For the post-trapconfiguration, the SMPS and the stand-alone CPC showed significantly higher COV values of59% and up to 33%.
Response timeA measurement with the scanning SMPS 3936-L10 requires a stable aerosol for at least oneminute. For this reason it is not able to carry out transient measurements. The combinationDMA-CPC with fixed voltage on the DMA in order to select a defined particle diameter wasslow (t90-10 > 60 s). The long response times are probably due to by the large aerosol volumeinside the DMA and an error in the read-out software.The DMA-CPC combination (selection of defined particle diameters) was able to follow atransient test cycle. The detection of individual peaks in particle concentration was limiteddue to short load peaks during the transient ETC.
Limit of detection (LOD)The LOD was found to be in the same range as the measured ETC low-emissionconcentration. The concentration of the 80 nm bandpass mode was about 670 times higher forthe ETC high-emission (about 60% of Euro 4) than the LOD.
SensitivityThe SMPS 3936-L10 showed high differences in the ratio between high (60% Euro 4) andlow-emission (post-trap) configurations. For the SMPS, ratios between 24 and 3000 weredetermined for the different single modes. Because of different settings of the SMPS 3936-L10 in ETC low-emission measurements, a ratio between the ETC high and low-emissionlevels could only be calculated from a few measurements. The ratio comparing the ETCcycles by measuring the 80 nm particles was calculated at about 1660.The concentration for the background and post-trap were measured in the same range as formost instruments.
LinearityThe tests with the CAST revealed flawless performance in linearity of the SMPS for bothinvestigated size settings.
GRPE Particle Measurement Programme (PMP)
Comparison Study of Particle Measurement Systems
M. Mohr, U. Lehmann, 13.05.03 113/156 Report-No.: 202779
Comparison with other instrumentsThe engine tests showed that the SMPS measured only about 60% of the particleconcentration as determined for the stand-alone CPC (R19) and the ELPI (R22). A similarfinding was also observed for the smaller size setting of the CAST measurements.Two major reasons are assumed to explain the discrepancy: the difference in the lower cutsize and the diffusion losses in the DMA. The lower size range was 12 to 14 nm for the SMPS3936L-10 (R21) compared to 7 nm for the stand-alone CPC 3022A. Diffusion losses of theparticles smaller than 20 nm caused by the low flow rate and the length of the DMA may playan important role. The direct comparison to the seq. SMPS+C (R13) revealed a significantdiscrepancy approximately a factor of 2 higher for the steady-state tests and about 35% higherconcentration for the stand-alone CPC3010 compared to the UPC5400 (R13).
CalibrationThe calibration of absolute number concentration by a traceable standard has not yet beensolved.The calibration of size can be carried out using standard reference particles (latex, gold).
SummaryThe SMPS provides detailed number size distributions. The abundance of size information isoffset by the inability to follow a transient test cycle, as a constant particle emission of at leasta minute is needed for the measurement. The measurement of number concentrations within asingle mobility channel as applied in some measurements of this study enables transientmeasurements and can exclude the interference of nucleation particles in most cases. But themethod delivers very little information, and small shifts in the size distribution affect theresult significantly. For this reason a stand-alone CPC would be the better option for futuretype approval applications.A significant discrepancy in total particle number as measured by SMPS and stand-alone CPCwas observed in the study. A correction for the diffusion losses and the specification of thelower cut size would probably improve the results. Removal of nucleation particles is stronglyrecommended for more repeatable results as the CPC is highly susceptible to such particles.
ELPI (R22)
RobustnessThe instrument was found to operate without any problems during the measurementprogramme.
RepeatabilityGood repeatability was observed for the test cycles at the high-emission level (60% Euro 4).For the transient ETC cycle, the COV of the measurement results were found to be within10%. For the post-trap configuration the COV was in the range of 30% for the ETC and SM,but with one exception (A50: 140%).
Response timeThe response time of the ELPI to well defined concentration changes was observed to be veryshort (t50-10 < 3 s). For t90-10 times were found to be between 4 s and 15 s. The ELPI was able
GRPE Particle Measurement Programme (PMP)
Comparison Study of Particle Measurement Systems
M. Mohr, U. Lehmann, 13.05.03 114/156 Report-No.: 202779
to follow a transient test cycle and to detect individual peaks in particle concentration due toshort load pulses during the transient ETC.
Limit of detection (LOD)The LOD was found to be about 90% of the measured ETC low-emission concentration.The concentration for the ETC high-emission (about 60% of Euro 4) was about 1800 timeshigher than the LOD.
SensitivityThe ELPI showed high differences in concentration between the high (60% Euro 4) and low-emission (post-trap) configuration. Ratios between 25 and 4300 were determined for thedifferent test cycles (ETC: 1500). The results demonstrate very high sensitivity of theinstrument. Slightly higher number concentration was measured for the post-trap than for thebackground configuration.
LinearityThe tests with the CAST revealed flawless performance in linearity of the ELPI for bothinvestigated size settings.
Comparison with other instrumentsIn general, an acceptable agreement to other number-based methods were found with fewexceptions. For the ETC, good agreement in absolute values was found to the CPC (R21) andEAD (R20) within 20%. The ELPI showed very good correlation to the CPC (R19: R2 = 0.99)and coulometry (R11E: R2 = 0.90) and to many other instruments.
CalibrationThe calibration of absolute number concentration by a traceable standard has not yet beensolved.The calibration of size can be carried out using standard reference particles (latex, gold).
SummaryThe ELPI is a low-pressure impactor that provides time-resolved number size distributions.The instrument performed very well in repeatability and sensitivity and showed goodcorrelation to other instruments. The measurement principle of the ELPI is quite complex asthe measured number concentration and sizing is affected by the particle morphology andbulk density. The concentration of particle below 35 nm as determined by a filter stagerevealed significant discrepancies in relation to other instruments. As the filter stageundergoes further development, performance is expected to improve. The ELPI is susceptibleto nucleation particles. The removal of volatile particles (e.g. by a thermodesorber) istherefore highly recommended for more repeatable results. The calibration for numberconcentration is found to be very difficult, as charging and sizing are based on differentphysical principles.
GRPE Particle Measurement Programme (PMP)
Comparison Study of Particle Measurement Systems
M. Mohr, U. Lehmann, 13.05.03 115/156 Report-No.: 202779
DQL (R23)
RobustnessThe instrument was found to operate without any problems during the measurementprogramme.
RepeatabilityThe DQL showed good repeatability at the high-emission level (60% Euro 4). The COVs ofthe measurement results were found to be within 10% for the ETC and 12% for the SM. TheCOVs showed comparable low variation for the low-emission tests (ETC: 16%, SM: < 35%),but it is questionable whether the signal is related to the particle concentration only and notinfluenced by NO2.
Response timeThe response of the DQL was found to be rather slow (t90-10 > 40 s). The DQL was not reallyable to follow a transient test cycle in a satisfactory manner due to a long relaxation time afterhigh peaks of the signal.
Limit of detection (LOD)The LOD was found to be about 50% of the measured ETC low-emission concentration.The concentration for the ETC high-emission (about 60% of Euro 4) was about 21 timeshigher than the LOD.Due to the low concentrations the DQL was not able to measure the engine background and toparticipate in the CAST measurements. Therefore, a limit of detection (LOD) of theinstrument in relation to the background could not be determined.
SensitivityWhereas the concentrations of the CAST aerosol were too low, the DQL was able to measureduring the low-emission configuration of the engine tests. The DQL showed low differencesin concentration between the high (60% Euro 4) and low-emission (post-trap) configurations.Ratios between 2 and 10 were determined for the different test cycles (ETC: 10). The resultsrevealed very low sensitivity for the instrument.
LinearityThe particle concentration provided by the CAST was too low for the DQL for the linearitycheck.
Comparison with other instrumentsThe absolute values measured by the DQL could not be compared with other instruments asthe DQL is the only instrument calibrated on integral particle volume. However, a cross-check by transferring the volume to number applying very simple assumptions gavereasonable results. Very good correlation was obtained to the CPC (R19: R2 = 0.94) and tocoulometry (R11E: R2 = 0.96).
CalibrationCalibration of absolute number concentration by a traceable standard has not yet been solved.The calibration of size can be carried out using standard reference particles (latex, gold).
GRPE Particle Measurement Programme (PMP)
Comparison Study of Particle Measurement Systems
M. Mohr, U. Lehmann, 13.05.03 116/156 Report-No.: 202779
SummaryThe measurement principle of the DQL is based on laser light extinction at three wavelengthsand applies a very extensive optical absorption path. The DQL provides time-resolved data onintegral particle volume and a calculated mean size of the primary particles. The instrumenttested in this program was a prototype and was not yet optimised regarding sensitivity andtime response behaviour. In general, the instrument performed very well in repeatability andshowed good correlation to other instruments. The sensitivity was observed to be lowcompared to many other instruments. Due to the lack of sensitivity, the DQL was not able tomeasure the low concentrations of the CAST aerosol. The DQL represents an advanceddevelopment of the light-extinction method to overcome the low sensitivity and the NO2cross-sensitivity of common opacimeters. Nevertheless, the results show the limitedsuitability of the instrument for future low-emission levels.
AVL 439 (R24)The AVL439 is not considered as an option for a future measurement technique for typeapproval, but has been included in the programme for the sake of completeness.The measurements revealed a strong NO2 sensitivity of the instruments that did not allow astraightforward data evaluation and comparison to the other measurement systems. Forexample, the instrument had the tendency to measure higher concentrations for the post-trap(low-emission) than for the bypass (high-emission) configuration.
CASTThe CAST produced a very stable aerosol during the continuous operation phases of 10minutes duration. The COV for the majority of the instruments were within 5%. Theadjustment of the relative concentration levels by means of a rotating disk dilution could becarried out in a very repeatable way. For the tests for linearity in this investigation the CASTfulfilled the requirements completely and in a good manner. The absolute values forconcentration and size distribution could be repeated after a break of two weeks within thespecified measurement uncertainties of 30% by the majority of the instruments. With a fewexceptions, all the instruments measured lower concentrations for the repetition, indicating adrift of the CAST. The drift could be caused by the clearly different ambient conditions forthe two measurement phases. A final assessment of the CAST for calibration use was outsidethe scope of this study and cannot be made on the basis of these data.
GRPE Particle Measurement Programme (PMP)
Comparison Study of Particle Measurement Systems
M. Mohr, U. Lehmann, 13.05.03 117/156 Report-No.: 202779
11 ConclusionsIn this comparison study, twenty-one measurement systems were investigated and comparedto each other. The aim was to generate a uniform data set of the performance of a wide rangeof instruments with regard to their suitability for future type approval application.On the basis of the data and the experience gained during this investigation, we suggest fourmajor criteria that have to be taken into consideration for the definition of future particlemeasurement systems.
SensitivityThe future legislative measurement system will have to face emission levels well below theEuro 4 emission level and a wider variation in particle composition than at present. This willalso be the consequence of the application of particle traps and SCR systems. In the future,more economically and technically optimised particle traps may penetrate the market, whichwill result in lower pressure drop and reduced regeneration efforts, but perhaps also in lowerprecipitation efficiency. Methods with high sensitivity would be able to identify cleardifferences in emissions on a very low level.Our study revealed a significantly higher sensitivity of number-based, length-based orsurface-based particle measurement methods than for the mass-based methods. Advancedmass measurement methods that are based on solid matter, mainly EC, did not improve thesituation significantly.
ReproducibilityAn important aspect is the stability of the measured particle concentration in respect of thesampling conditions. As volatile components are an important source that causes variation inthe particle concentration, measurement methods based on solid particles (material) willachieve better repeatability and reproducibility. Most systems in this study were onlysensitive to solid matter or followed the strategy of removing volatile material before thedetection.Our measurements gave some indication that the elimination of volatile particles by a hotdilution procedure was not always sufficient. Another option is the application of athermodesorber, but its performance was not investigated in this study.
Relation to impact on healthDiesel engines generate particles mainly in the size range below 100 nm. Although there aremany unanswered questions about the mechanisms of impact on health, recent studiesindicate the possible adverse effect of small particles (diameter smaller than 100 nm) onhuman health. Future measurement methods should therefore be able to detect particles in thislow particle size range. In this study optical instruments based on extinction and lightscattering (without CPC) were found to have limited sensitivity for such small particles. Themass-based instruments detect small particles, but in principle their measured result isdominated by the larger particles. Restricted to solid particles and mono-modal NSDs adecrease in mass also results in a decrease in number.
GRPE Particle Measurement Programme (PMP)
Comparison Study of Particle Measurement Systems
M. Mohr, U. Lehmann, 13.05.03 118/156 Report-No.: 202779
CalibrationA very important aspect for future measurement methods is the ability for them to becalibrated according to a traceable standard. A concept is mainly established for mass-basedmethods, whereas a standard for particle number does not yet exist. As well as the metrics ofnumber, this open question also applies to length and surface area. In principle, theconcentration of number, length and surface area is affected by the coagulation process incontrast to the mass concentration. For this reason sampling conditions need to be specified inabsolute concentration range, dilution ratio and residence time.The feasibility of calibration of the instruments was not investigated in this study. Themeasurements with the aerosol generator CAST showed promising performance with regardto stability and repeatability and could be a suitable approach for a particle number standard.
As a final conclusion, we wish to stress that there are several candidates for measurementsystems that are of great value to be considered for closer investigation within Phase III of theGRPE-PMP. Their individual potential for the future type approval application dependsmainly on the requirements defined in a detailed catalogue of criteria.
12 AcknowledgementsThis investigation was funded in large part by the Swiss Federal Roads Authority (FEDRO)and the Swiss Agency for the Environment, Forest and Landscape (SAEFL) and supported bythe Swiss Federal Office of Metrology and Accreditation (METAS). We are indebted to JürgSchlatter from METAS for his overall control of the CAST measurements. We would like tothank the Volvo Truck Cooperation for putting the engine at our disposal.Rupprecht&Patashnick Co., Inc. deserves special mention for providing filter holders and pre-samplers that met the specification of the US2007 Federal Register. Finally, we wish toexpress our gratitude to the instrument manufacturers for their participation and theirrepresentatives during the measurements for very good co-operation and the friendly workingatmosphere.Thanks are due to the co-ordinator of the Swiss contributions to PMP, Mr Andreas Mayer,TTM, for launching this project.The authors acknowledge the contribution of their colleagues at EMPA in carrying out themeasurement programme: Roland Graf, Alfred Mack, Hans-Kristian Opstad, Josef Rütter, UziSaghi, Daniel Schreiber, Thomas Schweizer and Rolf Ziegler.
GRPE Particle Measurement Programme (PMP)
Comparison Study of Particle Measurement Systems
M. Mohr, U. Lehmann, 13.05.03 119/156 Report-No.: 202779
13 References
[ACEA, 2002] «ACEA programme on emissions of fine particles from passenger cars [2]», ACEAReport July 2002.
[Dixon, 1953] «Processing data for outliers », Dixon W.J., Biometrics 9 (1953) 74-89, Appendix p.89
[AEAT, 2002] «Final Report of Phase 1 of Module 3: Development of Candidate Systems – LightDuty Vehicles», Particle Measurement Programme (PMP), Dickens C.J., Payne E.L.,Reading A.H., Feest E.A., AEA Technology /DDSE/R/ED 15003, A report producedfor the DTLR, January 2002
[HTL Biel (1), 2001] «NanoMet an option for supplementing the legal exhaust gas measuring procedurefor the diesel vehicles with particle filter (DPF)», Czerwinski J., Napoli S., MatterU., Mosimann T., Preliminary research phase 1, technical report, University ofapplied Sciences, Biel (Switzerland), Mai 2001
[HTL Biel (2), 2001] «NanoMet a Nanoparticle Analyser for supplementing the legal exhaust gasmeasuring procedure for diesel vehicles with particle filter (DPF) Part II»,Czerwinski J., Napoli S., Wili Ph., Matter U., Mosimann T., Kasper M., Preliminaryresearch phase 1, technical report, University of applied Sciences, Biel(Switzerland), October 2001
[Ricardo, 2002] «UK Particle measurement Programme – Heavy duty, Methodology development»,Andersson J.D., Final Report DP 02/2493, Ricardo Consulting Engineers Ltd., July2002
[MTC] «Investigation of Thermodenuder Effect», Cleas de Serves, Karlsson, presented atGRPE-Meeting 15.1.2003
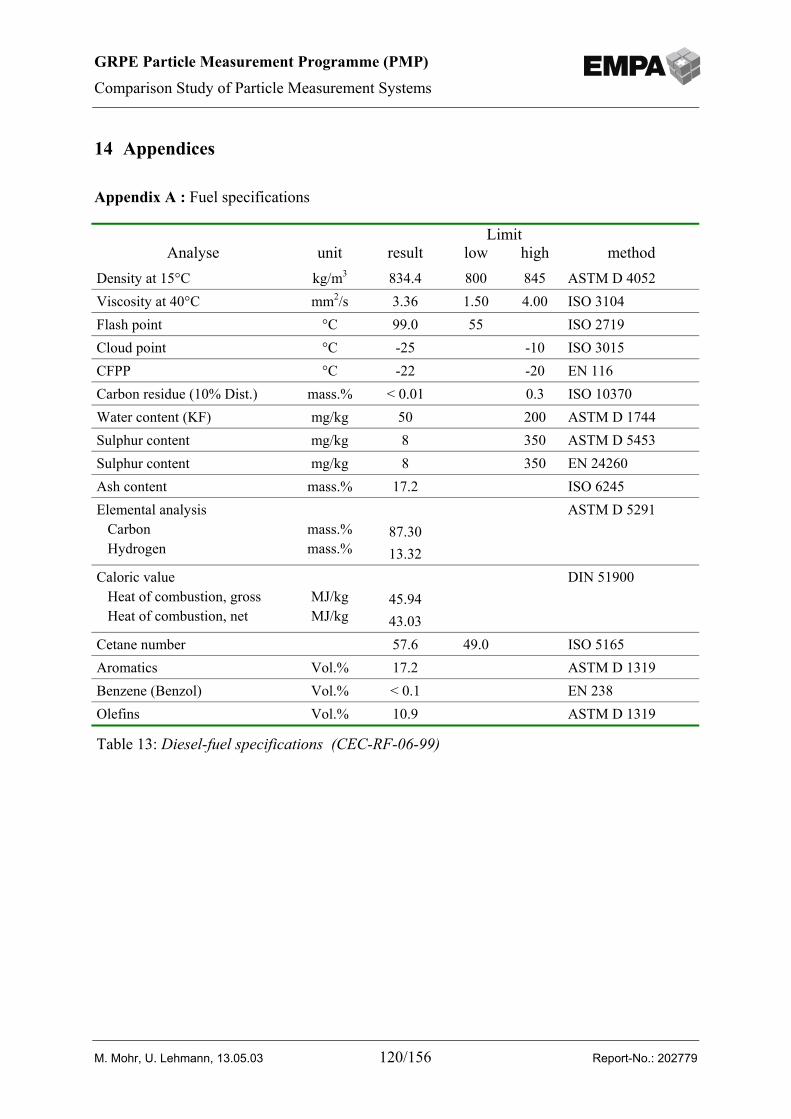
GRPE Particle Measurement Programme (PMP)
Comparison Study of Particle Measurement Systems
M. Mohr, U. Lehmann, 13.05.03 120/156 Report-No.: 202779
14 Appendices
Appendix A : Fuel specifications
LimitAnalyse unit result low high method
Density at 15°C kg/m3 834.4 800 845 ASTM D 4052Viscosity at 40°C mm2/s 3.36 1.50 4.00 ISO 3104Flash point °C 99.0 55 ISO 2719Cloud point °C -25 -10 ISO 3015CFPP °C -22 -20 EN 116Carbon residue (10% Dist.) mass.% < 0.01 0.3 ISO 10370Water content (KF) mg/kg 50 200 ASTM D 1744Sulphur content mg/kg 8 350 ASTM D 5453Sulphur content mg/kg 8 350 EN 24260Ash content mass.% 17.2 ISO 6245Elemental analysis Carbon Hydrogen
mass.%mass.%
87.3013.32
ASTM D 5291
Caloric value Heat of combustion, gross Heat of combustion, net
MJ/kgMJ/kg
45.9443.03
DIN 51900
Cetane number 57.6 49.0 ISO 5165Aromatics Vol.% 17.2 ASTM D 1319Benzene (Benzol) Vol.% < 0.1 EN 238Olefins Vol.% 10.9 ASTM D 1319
Table 13: Diesel-fuel specifications (CEC-RF-06-99)
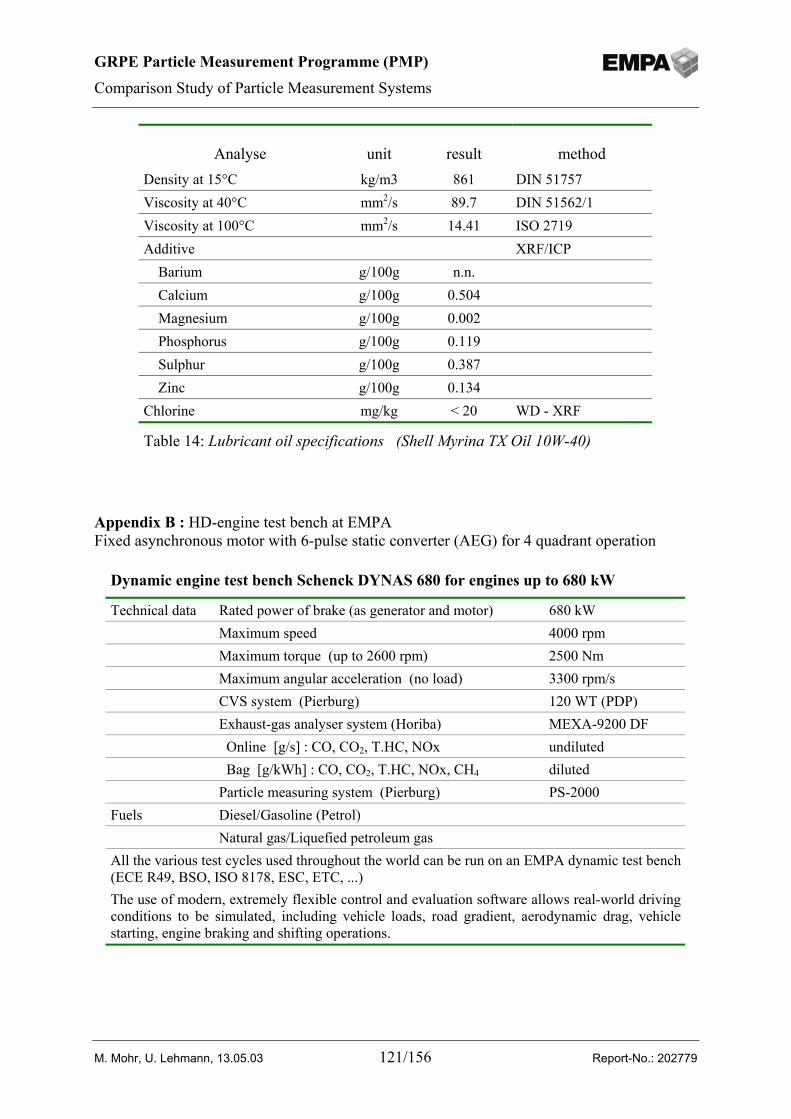
GRPE Particle Measurement Programme (PMP)
Comparison Study of Particle Measurement Systems
M. Mohr, U. Lehmann, 13.05.03 121/156 Report-No.: 202779
Appendix B : HD-engine test bench at EMPAFixed asynchronous motor with 6-pulse static converter (AEG) for 4 quadrant operation
Analyse unit result methodDensity at 15°C kg/m3 861 DIN 51757Viscosity at 40°C mm2/s 89.7 DIN 51562/1Viscosity at 100°C mm2/s 14.41 ISO 2719Additive XRF/ICP Barium g/100g n.n. Calcium g/100g 0.504 Magnesium g/100g 0.002 Phosphorus g/100g 0.119 Sulphur g/100g 0.387 Zinc g/100g 0.134Chlorine mg/kg < 20 WD - XRF
Table 14: Lubricant oil specifications (Shell Myrina TX Oil 10W-40)
Dynamic engine test bench Schenck DYNAS 680 for engines up to 680 kW
Technical data Rated power of brake (as generator and motor) 680 kWMaximum speed 4000 rpmMaximum torque (up to 2600 rpm) 2500 NmMaximum angular acceleration (no load) 3300 rpm/sCVS system (Pierburg) 120 WT (PDP)Exhaust-gas analyser system (Horiba) MEXA-9200 DF Online [g/s] : CO, CO2, T.HC, NOx undiluted Bag [g/kWh] : CO, CO2, T.HC, NOx, CH4 dilutedParticle measuring system (Pierburg) PS-2000
Fuels Diesel/Gasoline (Petrol)Natural gas/Liquefied petroleum gas
All the various test cycles used throughout the world can be run on an EMPA dynamic test bench(ECE R49, BSO, ISO 8178, ESC, ETC, ...)The use of modern, extremely flexible control and evaluation software allows real-world drivingconditions to be simulated, including vehicle loads, road gradient, aerodynamic drag, vehiclestarting, engine braking and shifting operations.
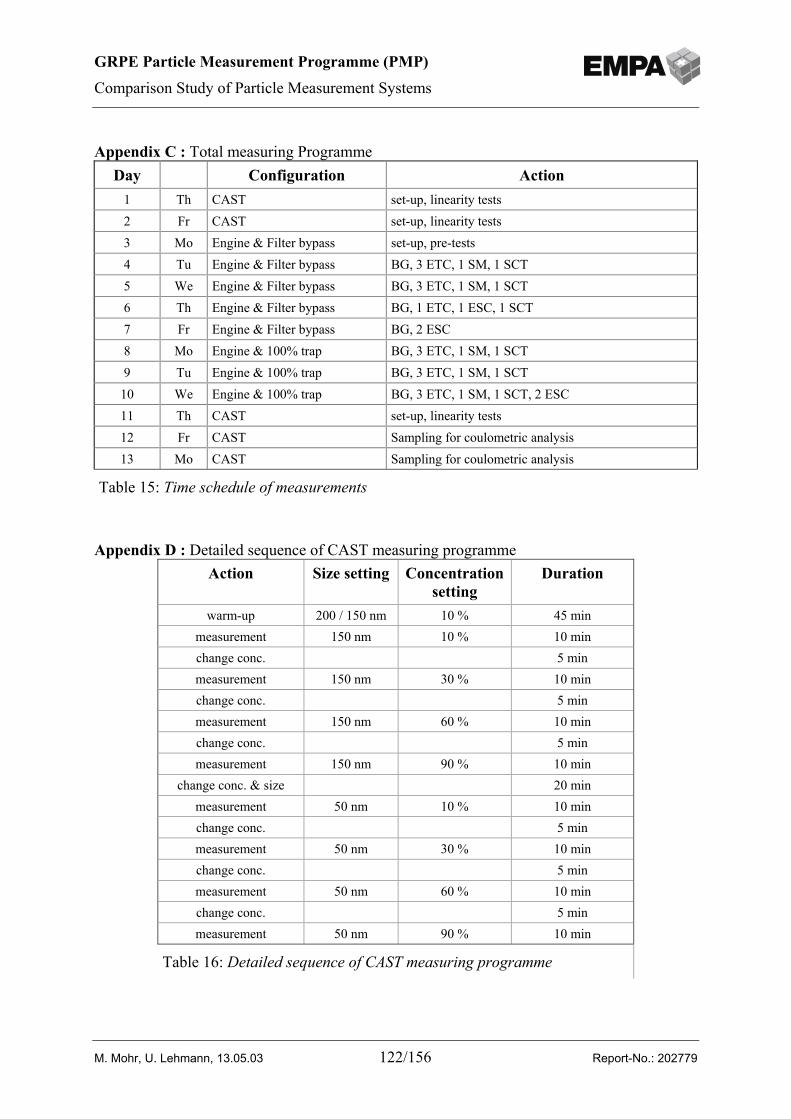
GRPE Particle Measurement Programme (PMP)
Comparison Study of Particle Measurement Systems
M. Mohr, U. Lehmann, 13.05.03 122/156 Report-No.: 202779
Appendix C : Total measuring Programme
Appendix D : Detailed sequence of CAST measuring programme
Day Configuration Action1 Th CAST set-up, linearity tests2 Fr CAST set-up, linearity tests3 Mo Engine & Filter bypass set-up, pre-tests4 Tu Engine & Filter bypass BG, 3 ETC, 1 SM, 1 SCT5 We Engine & Filter bypass BG, 3 ETC, 1 SM, 1 SCT6 Th Engine & Filter bypass BG, 1 ETC, 1 ESC, 1 SCT7 Fr Engine & Filter bypass BG, 2 ESC8 Mo Engine & 100% trap BG, 3 ETC, 1 SM, 1 SCT9 Tu Engine & 100% trap BG, 3 ETC, 1 SM, 1 SCT
10 We Engine & 100% trap BG, 3 ETC, 1 SM, 1 SCT, 2 ESC11 Th CAST set-up, linearity tests12 Fr CAST Sampling for coulometric analysis13 Mo CAST Sampling for coulometric analysis
Table 15: Time schedule of measurements
Action Size setting Concentrationsetting
Duration
warm-up 200 / 150 nm 10 % 45 minmeasurement 150 nm 10 % 10 minchange conc. 5 minmeasurement 150 nm 30 % 10 minchange conc. 5 minmeasurement 150 nm 60 % 10 minchange conc. 5 minmeasurement 150 nm 90 % 10 min
change conc. & size 20 minmeasurement 50 nm 10 % 10 minchange conc. 5 minmeasurement 50 nm 30 % 10 minchange conc. 5 minmeasurement 50 nm 60 % 10 minchange conc. 5 minmeasurement 50 nm 90 % 10 min
Table 16: Detailed sequence of CAST measuring programme
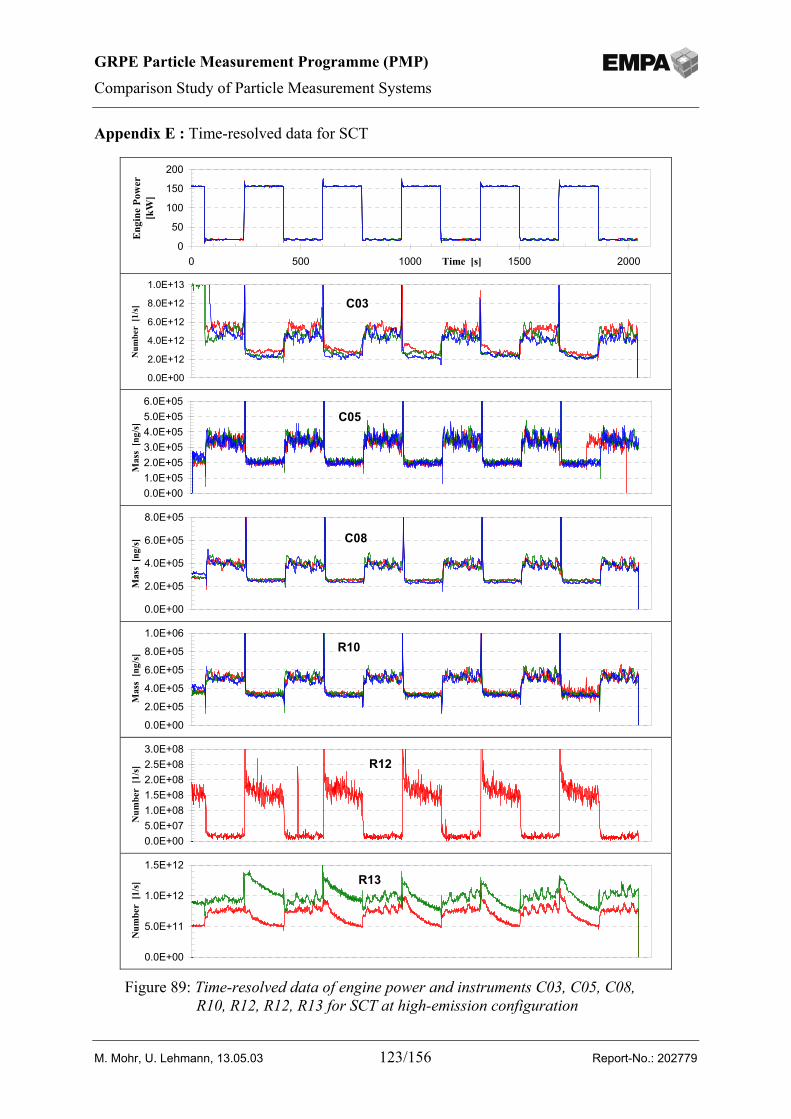
GRPE Particle Measurement Programme (PMP)
Comparison Study of Particle Measurement Systems
M. Mohr, U. Lehmann, 13.05.03 123/156 Report-No.: 202779
Appendix E : Time-resolved data for SCT
0
50
100
150
200
0 500 1000 1500 2000Time [s]
Eng
ine
Pow
er
[kW
]
C03
0.0E+00
2.0E+12
4.0E+12
6.0E+12
8.0E+12
1.0E+13
Num
ber
[1/s
]
C05
0.0E+001.0E+052.0E+053.0E+054.0E+055.0E+056.0E+05
Mas
s [n
g/s]
C08
0.0E+00
2.0E+05
4.0E+05
6.0E+05
8.0E+05
Mas
s [n
g/s]
R10
0.0E+00
2.0E+05
4.0E+05
6.0E+05
8.0E+05
1.0E+06
Mas
s [n
g/s]
R12
0.0E+005.0E+071.0E+081.5E+082.0E+082.5E+083.0E+08
Num
ber
[1/s
]
R13
0.0E+00
5.0E+11
1.0E+12
1.5E+12
Num
ber
[1/s
]
Figure 89: Time-resolved data of engine power and instruments C03, C05, C08,R10, R12, R12, R13 for SCT at high-emission configuration
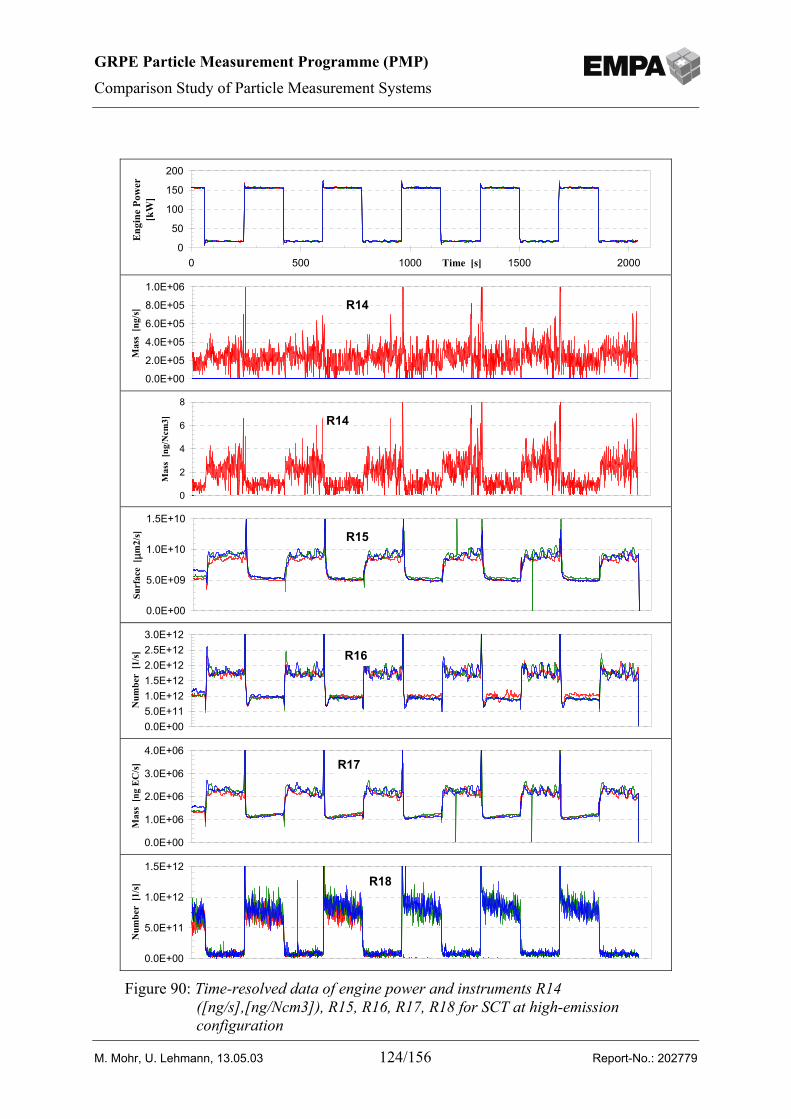
GRPE Particle Measurement Programme (PMP)
Comparison Study of Particle Measurement Systems
M. Mohr, U. Lehmann, 13.05.03 124/156 Report-No.: 202779
0
50
100
150
200
0 500 1000 1500 2000Time [s]
Eng
ine
Pow
er
[kW
]
R14
0.0E+00
2.0E+05
4.0E+05
6.0E+05
8.0E+05
1.0E+06
Mas
s [n
g/s]
R14
0
2
4
6
8
Mas
s [n
g/N
cm3]
R15
0.0E+00
5.0E+09
1.0E+10
1.5E+10
Surf
ace
[ µm
2/s]
R16
0.0E+005.0E+111.0E+121.5E+122.0E+122.5E+123.0E+12
Num
ber
[1/s
]
R17
0.0E+00
1.0E+06
2.0E+06
3.0E+06
4.0E+06
Mas
s [n
g E
C/s
]
R18
0.0E+00
5.0E+11
1.0E+12
1.5E+12
Num
ber
[1/s
]
Figure 90: Time-resolved data of engine power and instruments R14([ng/s],[ng/Ncm3]), R15, R16, R17, R18 for SCT at high-emissionconfiguration
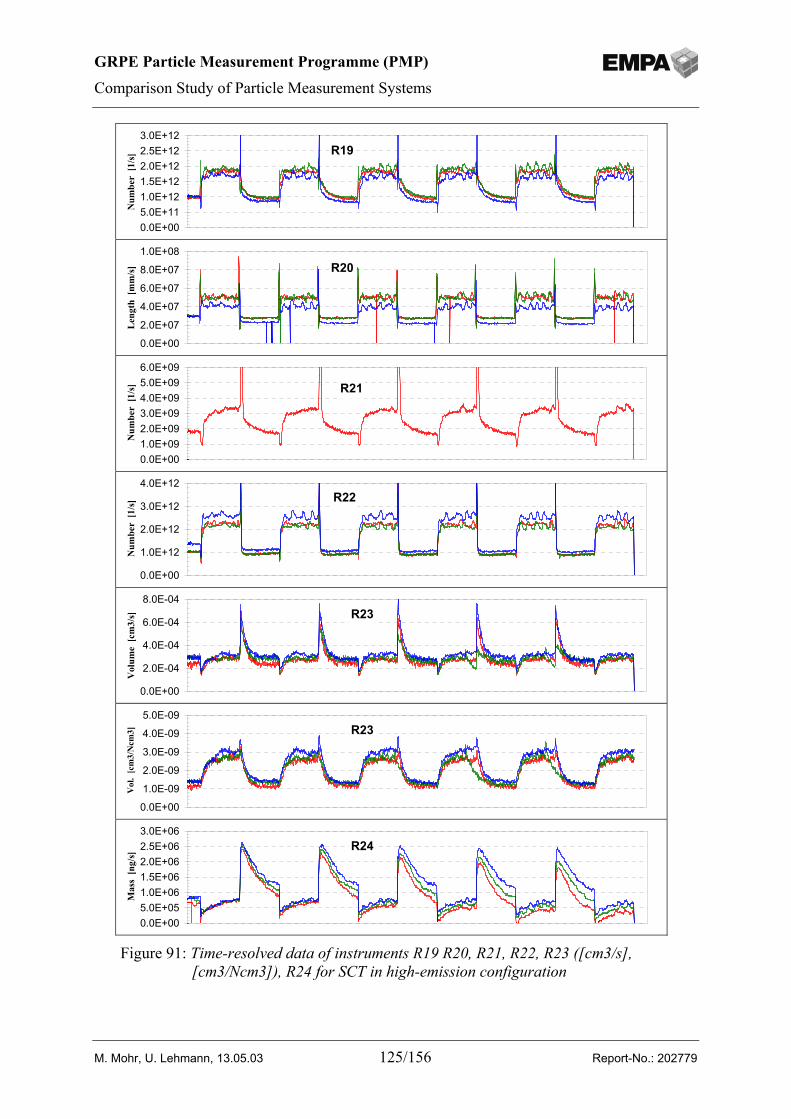
GRPE Particle Measurement Programme (PMP)
Comparison Study of Particle Measurement Systems
M. Mohr, U. Lehmann, 13.05.03 125/156 Report-No.: 202779
R19
0.0E+005.0E+111.0E+121.5E+122.0E+122.5E+123.0E+12
Num
ber
[1/s
]
R20
0.0E+00
2.0E+07
4.0E+07
6.0E+07
8.0E+07
1.0E+08
Len
gth
[mm
/s]
R21
0.0E+001.0E+092.0E+093.0E+094.0E+095.0E+096.0E+09
Num
ber
[1/s
]
R22
0.0E+00
1.0E+12
2.0E+12
3.0E+12
4.0E+12
Num
ber
[1/s
]
R23
0.0E+00
2.0E-04
4.0E-04
6.0E-04
8.0E-04
Vol
ume
[cm
3/s]
R23
0.0E+00
1.0E-09
2.0E-09
3.0E-09
4.0E-09
5.0E-09
Vol
. [c
m3/
Ncm
3]
R24
0.0E+005.0E+051.0E+061.5E+062.0E+062.5E+063.0E+06
Mas
s [n
g/s]
Figure 91: Time-resolved data of instruments R19 R20, R21, R22, R23 ([cm3/s],[cm3/Ncm3]), R24 for SCT in high-emission configuration
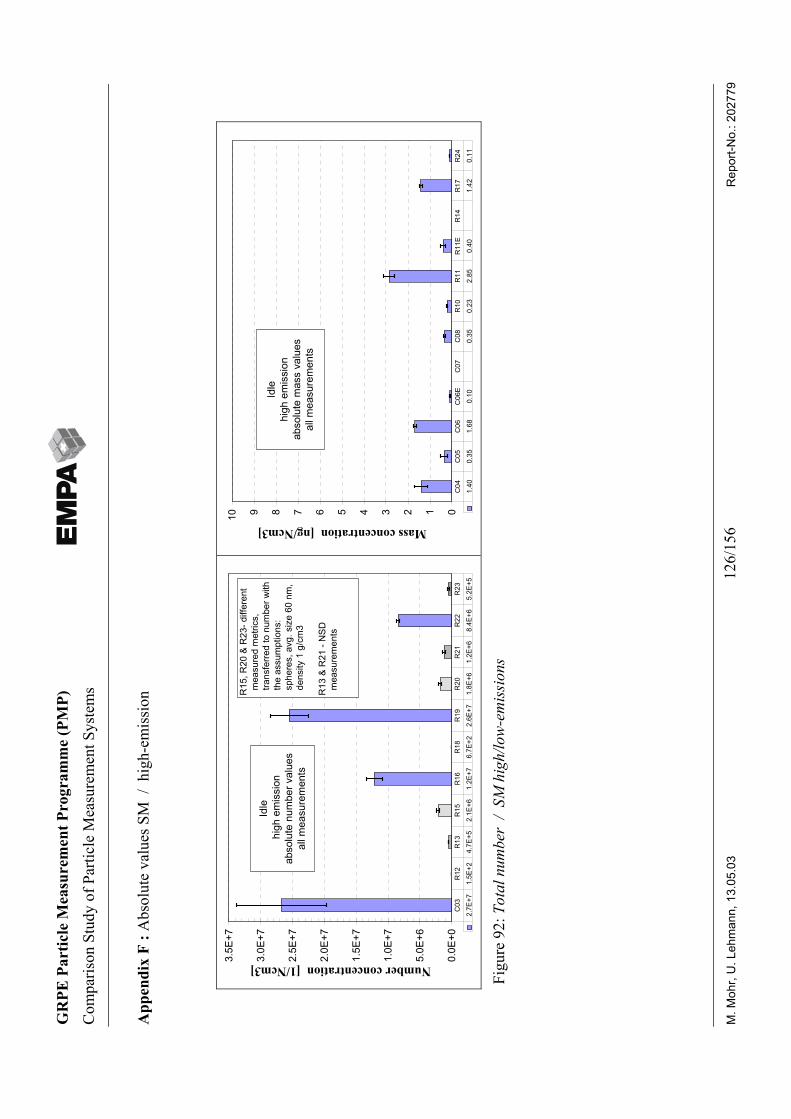
GR
PE P
artic
le M
easu
rem
ent P
rogr
amm
e (P
MP)
Com
paris
on S
tudy
of P
artic
le M
easu
rem
ent S
yste
ms
M. M
ohr,
U. L
ehm
ann,
13.
05.0
312
6/15
6R
epor
t-No.
: 202
779
App
endi
x F
: Abs
olut
e va
lues
SM
/ h
igh-
emis
sion
0.0E
+0
5.0E
+6
1.0E
+7
1.5E
+7
2.0E
+7
2.5E
+7
3.0E
+7
3.5E
+7
Number concentration [1/Ncm3]
2.7E
+71.
5E+2
4.7E
+52.
1E+6
1.2E
+76.
7E+2
2.6E
+71.
8E+6
1.2E
+68.
4E+6
5.2E
+5C
03R
12R
13R
15R
16R
18R
19R
20R
21R
22R
23
R15
, R20
& R
23- d
iffer
ent
mea
sure
d m
etric
s,
tran
sfer
red
to n
umbe
r with
t
he a
ssum
ptio
ns:
sph
eres
, avg
. siz
e 60
nm
, d
ensi
ty 1
g/c
m3
R13
& R
21 -
NSD
m
easu
rem
ents
Idle
hig
h em
issi
onab
solu
te n
umbe
r val
ues
all m
easu
rem
ents
012345678910
Mass concentration [ng/Ncm3]
1.40
0.35
1.68
0.10
0.35
0.23
2.85
0.40
1.42
0.11
C04
C05
C06
C06
EC
07C
08R
10R
11R
11E
R14
R17
R24
Idle
high
em
issi
onab
solu
te m
ass
valu
esal
l mea
sure
men
ts
Figu
re 9
2: T
otal
num
ber
/ SM
hig
h/lo
w-e
mis
sion
s
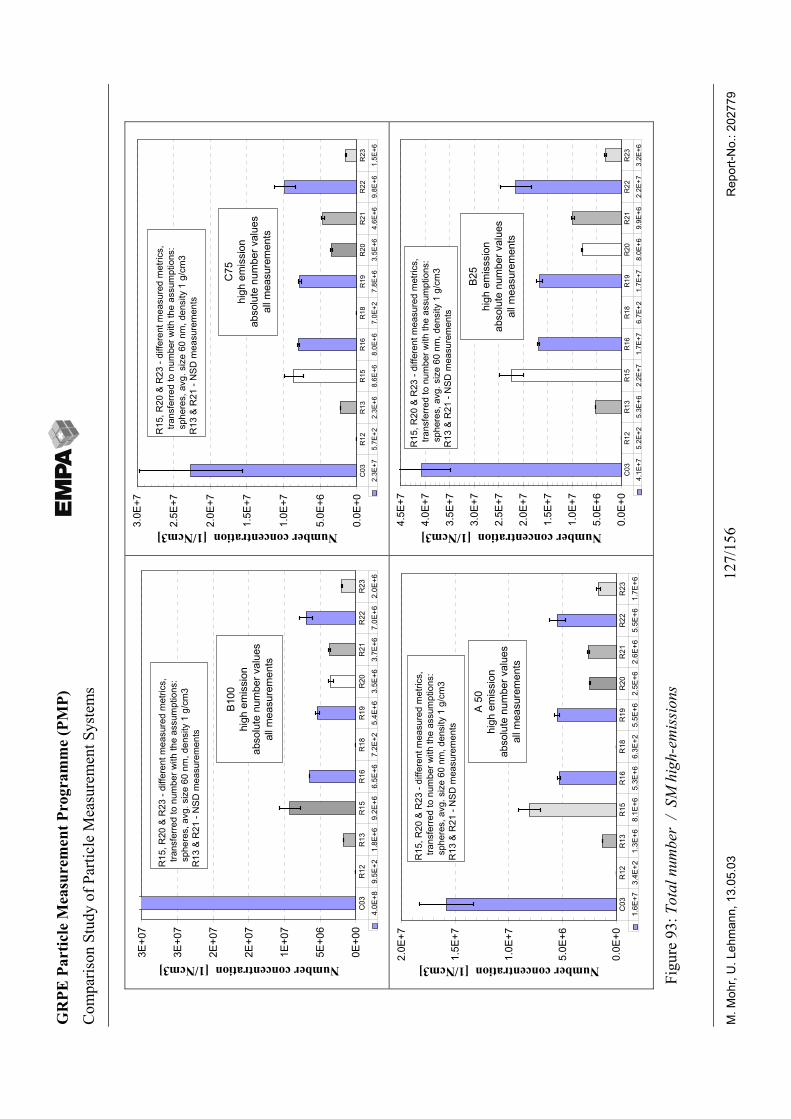
GR
PE P
artic
le M
easu
rem
ent P
rogr
amm
e (P
MP)
Com
paris
on S
tudy
of P
artic
le M
easu
rem
ent S
yste
ms
M. M
ohr,
U. L
ehm
ann,
13.
05.0
312
7/15
6R
epor
t-No.
: 202
779
0E+0
0
5E+0
6
1E+0
7
2E+0
7
2E+0
7
3E+0
7
3E+0
7Number concentration [1/Ncm3]
4.0E
+89.
5E+2
1.8E
+69.
2E+6
6.5E
+67.
2E+2
5.4E
+63.
5E+6
3.7E
+67.
0E+6
2.0E
+6C
03R
12R
13R
15R
16R
18R
19R
20R
21R
22R
23
B100
high
em
issi
onab
solu
te n
umbe
r val
ues
all m
easu
rem
ents
R15
, R20
& R
23 -
diffe
rent
mea
sure
d m
etric
s,
tra
nsfe
rred
to n
umbe
r with
the
assu
mpt
ions
: s
pher
es, a
vg. s
ize
60 n
m, d
ensi
ty 1
g/c
m3
R13
& R
21 -
NSD
mea
sure
men
ts
0.0E
+0
5.0E
+6
1.0E
+7
1.5E
+7
2.0E
+7
2.5E
+7
3.0E
+7
Number concentration [1/Ncm3]
2.3E
+75.
7E+2
2.3E
+68.
6E+6
8.0E
+67.
0E+2
7.8E
+63.
5E+6
4.6E
+69.
8E+6
1.5E
+6C
03R
12R
13R
15R
16R
18R
19R
20R
21R
22R
23
R15
, R20
& R
23 -
diffe
rent
mea
sure
d m
etric
s,
tra
nsfe
rred
to n
umbe
r with
the
assu
mpt
ions
: s
pher
es, a
vg. s
ize
60 n
m, d
ensi
ty 1
g/c
m3
R13
& R
21 -
NSD
mea
sure
men
ts
C75
high
em
issi
onab
solu
te n
umbe
r val
ues
all m
easu
rem
ents
0.0E
+0
5.0E
+6
1.0E
+7
1.5E
+7
2.0E
+7
Number concentration [1/Ncm3]
1.6E
+73.
4E+2
1.3E
+68.
1E+6
5.3E
+66.
3E+2
5.5E
+62.
5E+6
2.6E
+65.
5E+6
1.7E
+6C
03R
12R
13R
15R
16R
18R
19R
20R
21R
22R
23
A 50
high
em
issi
onab
solu
te n
umbe
r val
ues
all m
easu
rem
ents
R15
, R20
& R
23 -
diffe
rent
mea
sure
d m
etric
s,
tra
nsfe
rred
to n
umbe
r with
the
assu
mpt
ions
: s
pher
es, a
vg. s
ize
60 n
m, d
ensi
ty 1
g/c
m3
R13
& R
21 -
NSD
mea
sure
men
ts
0.0E
+0
5.0E
+6
1.0E
+7
1.5E
+7
2.0E
+7
2.5E
+7
3.0E
+7
3.5E
+7
4.0E
+7
4.5E
+7
Number concentration [1/Ncm3]
4.1E
+75.
2E+2
5.3E
+62.
2E+7
1.7E
+76.
7E+2
1.7E
+78.
0E+6
9.9E
+62.
2E+7
3.2E
+6C
03R
12R
13R
15R
16R
18R
19R
20R
21R
22R
23
R15
, R20
& R
23 -
diffe
rent
mea
sure
d m
etric
s,
tra
nsfe
rred
to n
umbe
r with
the
assu
mpt
ions
: s
pher
es, a
vg. s
ize
60 n
m, d
ensi
ty 1
g/c
m3
R13
& R
21 -
NSD
mea
sure
men
ts
B25
high
em
isss
ion
abso
lute
num
ber v
alue
sal
l mea
sure
men
ts
Figu
re 9
3: T
otal
num
ber
/ SM
hig
h-em
issi
ons
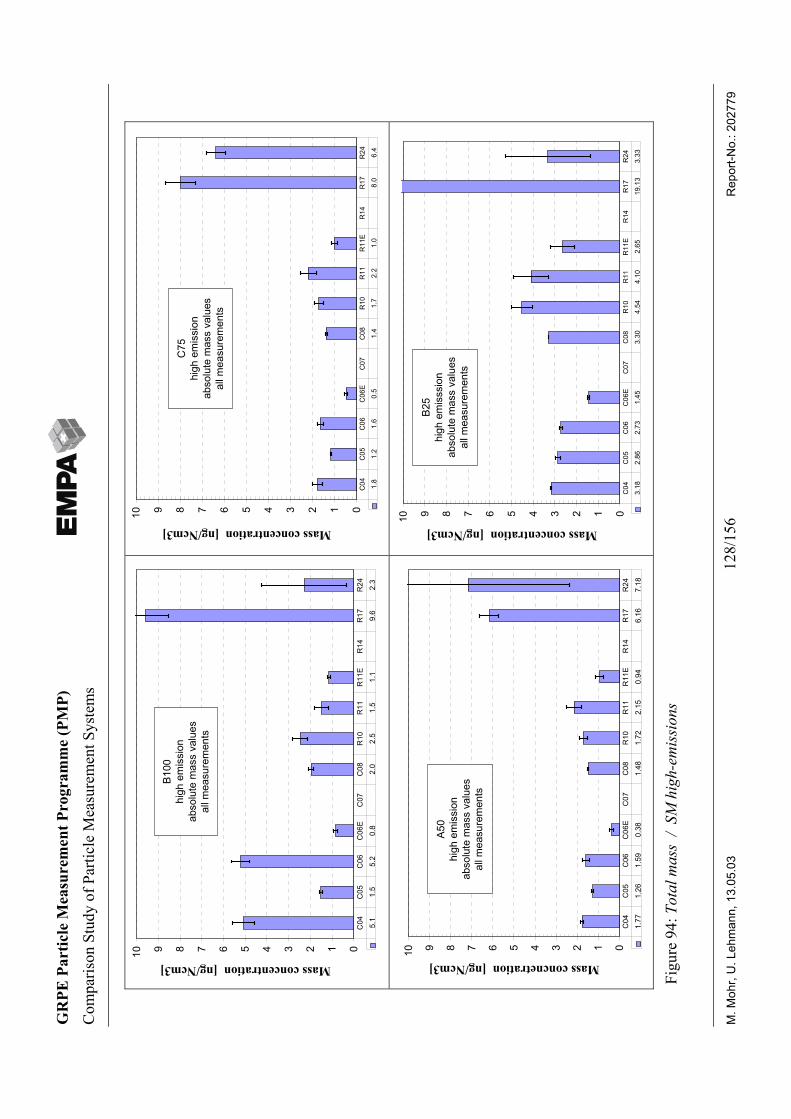
GR
PE P
artic
le M
easu
rem
ent P
rogr
amm
e (P
MP)
Com
paris
on S
tudy
of P
artic
le M
easu
rem
ent S
yste
ms
M. M
ohr,
U. L
ehm
ann,
13.
05.0
312
8/15
6R
epor
t-No.
: 202
779
012345678910Mass concentration [ng/Ncm3]
5.1
1.5
5.2
0.8
2.0
2.5
1.5
1.1
9.6
2.3
C04
C05
C06
C06
EC
07C
08R
10R
11R
11E
R14
R17
R24
B100
high
em
issi
onab
solu
te m
ass
valu
esal
l mea
sure
men
ts
012345678910
Mass concentration [ng/Ncm3]
1.8
1.2
1.6
0.5
1.4
1.7
2.2
1.0
8.0
6.4
C04
C05
C06
C06
EC
07C
08R
10R
11R
11E
R14
R17
R24
C75
high
em
issi
onab
solu
te m
ass
valu
esal
l mea
sure
men
ts
012345678910
Mass concnetration [ng/Ncm3]
1.7
7 1.
26
1.5
9 0
.38
1.4
8 1.
72
2.1
5 0
.94
6.1
6 7
.18
C04
C05
C06
C06
EC
07C
08R
10R
11R
11E
R14
R17
R24
A50
high
em
issi
onab
solu
te m
ass
valu
esal
l mea
sure
men
ts
012345678910
Mass concentration [ng/Ncm3]
3.18
2.86
2.73
1.45
3.30
4.54
4.10
2.65
19.1
33.
33C
04C
05C
06C
06E
C07
C08
R10
R11
R11
ER
14R
17R
24
B25
high
em
isss
ion
abso
lute
mas
s va
lues
all m
easu
rem
ents
Figu
re 9
4: T
otal
mas
s /
SM h
igh-
emis
sion
s
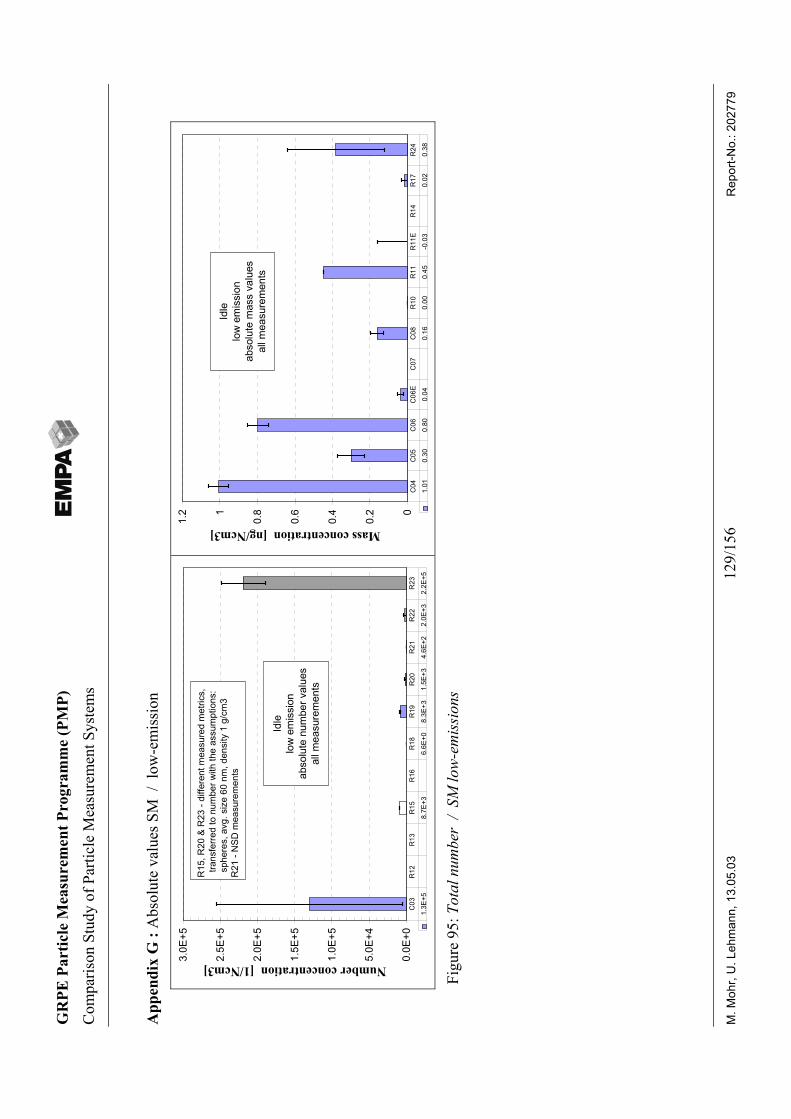
GR
PE P
artic
le M
easu
rem
ent P
rogr
amm
e (P
MP)
Com
paris
on S
tudy
of P
artic
le M
easu
rem
ent S
yste
ms
M. M
ohr,
U. L
ehm
ann,
13.
05.0
312
9/15
6R
epor
t-No.
: 202
779
App
endi
x G
: A
bsol
ute
valu
es S
M /
low
-em
issi
on
0.0E
+0
5.0E
+4
1.0E
+5
1.5E
+5
2.0E
+5
2.5E
+5
3.0E
+5
Number concentration [1/Ncm3]
1.3E
+58.
7E+3
6.6E
+08.
3E+3
1.5E
+34.
6E+2
2.0E
+32.
2E+5
C03
R12
R13
R15
R16
R18
R19
R20
R21
R22
R23
Idle
low
em
issi
onab
solu
te n
umbe
r val
ues
all m
easu
rem
ents
R15
, R20
& R
23 -
diffe
rent
mea
sure
d m
etric
s,
tra
nsfe
rred
to n
umbe
r with
the
assu
mpt
ions
: s
pher
es, a
vg. s
ize
60 n
m, d
ensi
ty 1
g/c
m3
R21
- N
SD m
easu
rem
ents
0
0.2
0.4
0.6
0.81
1.2
Mass concentration [ng/Ncm3]
1.0
1 0
.30
0.8
0 0
.04
0.1
6 0
.00
0.4
5 -0
.03
0.0
2 0
.38
C04
C05
C06
C06
EC
07C
08R
10R
11R
11E
R14
R17
R24
Idle
low
em
issi
onab
solu
te m
ass
valu
esal
l mea
sure
men
ts
Figu
re 9
5: T
otal
num
ber
/ SM
low
-em
issi
ons
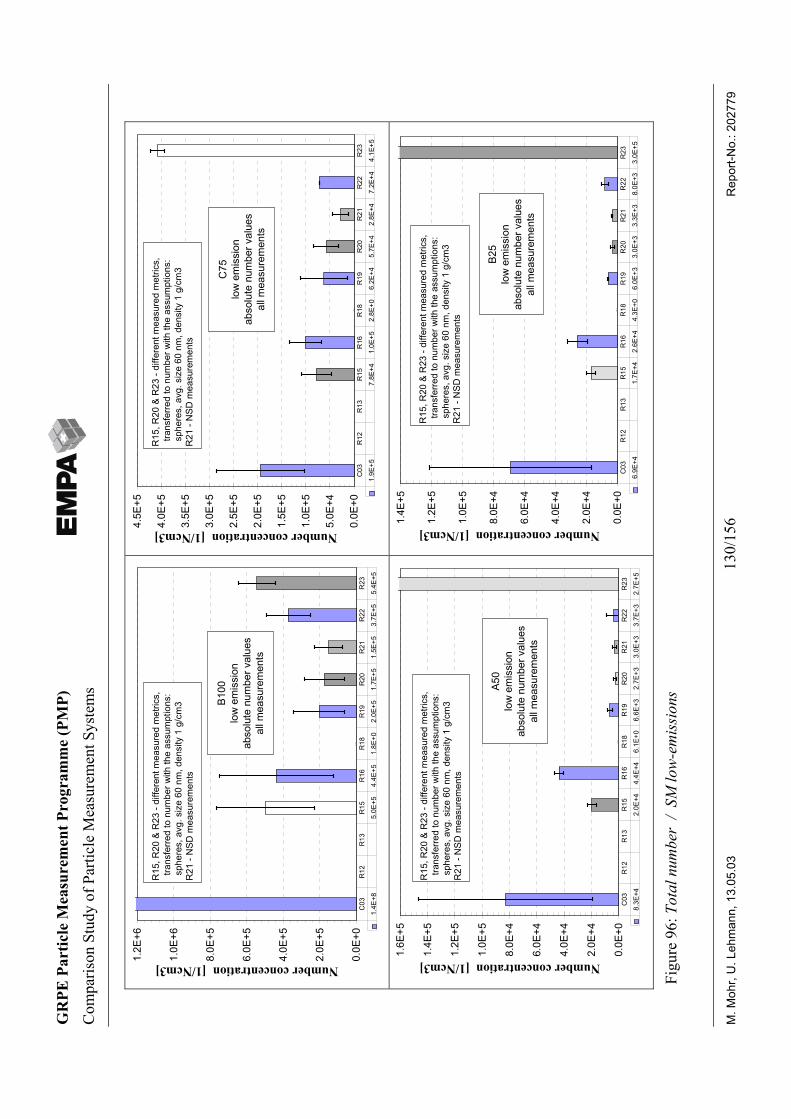
GR
PE P
artic
le M
easu
rem
ent P
rogr
amm
e (P
MP)
Com
paris
on S
tudy
of P
artic
le M
easu
rem
ent S
yste
ms
M. M
ohr,
U. L
ehm
ann,
13.
05.0
313
0/15
6R
epor
t-No.
: 202
779
0.0E
+0
2.0E
+5
4.0E
+5
6.0E
+5
8.0E
+5
1.0E
+6
1.2E
+6Number concentration [1/Ncm3]
1.4E
+85.
0E+5
4.4E
+51.
8E+0
2.0E
+51.
7E+5
1.5E
+53.
7E+5
5.4E
+5C
03R
12R
13R
15R
16R
18R
19R
20R
21R
22R
23
B100
low
em
issi
onab
solu
te n
umbe
r val
ues
all m
easu
rem
ents
R15
, R20
& R
23 -
diffe
rent
mea
sure
d m
etric
s,
tra
nsfe
rred
to n
umbe
r with
the
assu
mpt
ions
: s
pher
es, a
vg. s
ize
60 n
m, d
ensi
ty 1
g/c
m3
R21
- N
SD m
easu
rem
ents
0.0E
+0
5.0E
+4
1.0E
+5
1.5E
+5
2.0E
+5
2.5E
+5
3.0E
+5
3.5E
+5
4.0E
+5
4.5E
+5
Number concentration [1/Ncm3]
1.9E
+57.
8E+4
1.0E
+52.
8E+0
6.2E
+45.
7E+4
2.8E
+47.
2E+4
4.1E
+5C
03R
12R
13R
15R
16R
18R
19R
20R
21R
22R
23
C75
low
em
issi
onab
solu
te n
umbe
r val
ues
all m
easu
rem
ents
R15
, R20
& R
23 -
diffe
rent
mea
sure
d m
etric
s,
tra
nsfe
rred
to n
umbe
r with
the
assu
mpt
ions
: s
pher
es, a
vg. s
ize
60 n
m, d
ensi
ty 1
g/c
m3
R21
- N
SD m
easu
rem
ents
0.0E
+0
2.0E
+4
4.0E
+4
6.0E
+4
8.0E
+4
1.0E
+5
1.2E
+5
1.4E
+5
1.6E
+5
Number concentration [1/Ncm3]
8.3E
+42.
0E+4
4.4E
+46.
1E+0
6.6E
+32.
7E+3
3.0E
+33.
7E+3
2.7E
+5C
03R
12R
13R
15R
16R
18R
19R
20R
21R
22R
23
A50
low
em
issi
onab
solu
te n
umbe
r val
ues
all m
easu
rem
ents
R15
, R20
& R
23 -
diffe
rent
mea
sure
d m
etric
s,
tra
nsfe
rred
to n
umbe
r with
the
assu
mpt
ions
: s
pher
es, a
vg. s
ize
60 n
m, d
ensi
ty 1
g/c
m3
R21
- N
SD m
easu
rem
ents
0.0E
+0
2.0E
+4
4.0E
+4
6.0E
+4
8.0E
+4
1.0E
+5
1.2E
+5
1.4E
+5
Number concentration [1/Ncm3]
6.9E
+41.
7E+4
2.6E
+44.
3E+0
6.0E
+33.
0E+3
3.3E
+38.
0E+3
3.0E
+5C
03R
12R
13R
15R
16R
18R
19R
20R
21R
22R
23
B25
low
em
issi
onab
solu
te n
umbe
r val
ues
all m
easu
rem
ents
R15
, R20
& R
23 -
diffe
rent
mea
sure
d m
etric
s,
tra
nsfe
rred
to n
umbe
r with
the
assu
mpt
ions
: s
pher
es, a
vg. s
ize
60 n
m, d
ensi
ty 1
g/c
m3
R21
- N
SD m
easu
rem
ents
Figu
re 9
6: T
otal
num
ber
/ SM
low
-em
issi
ons
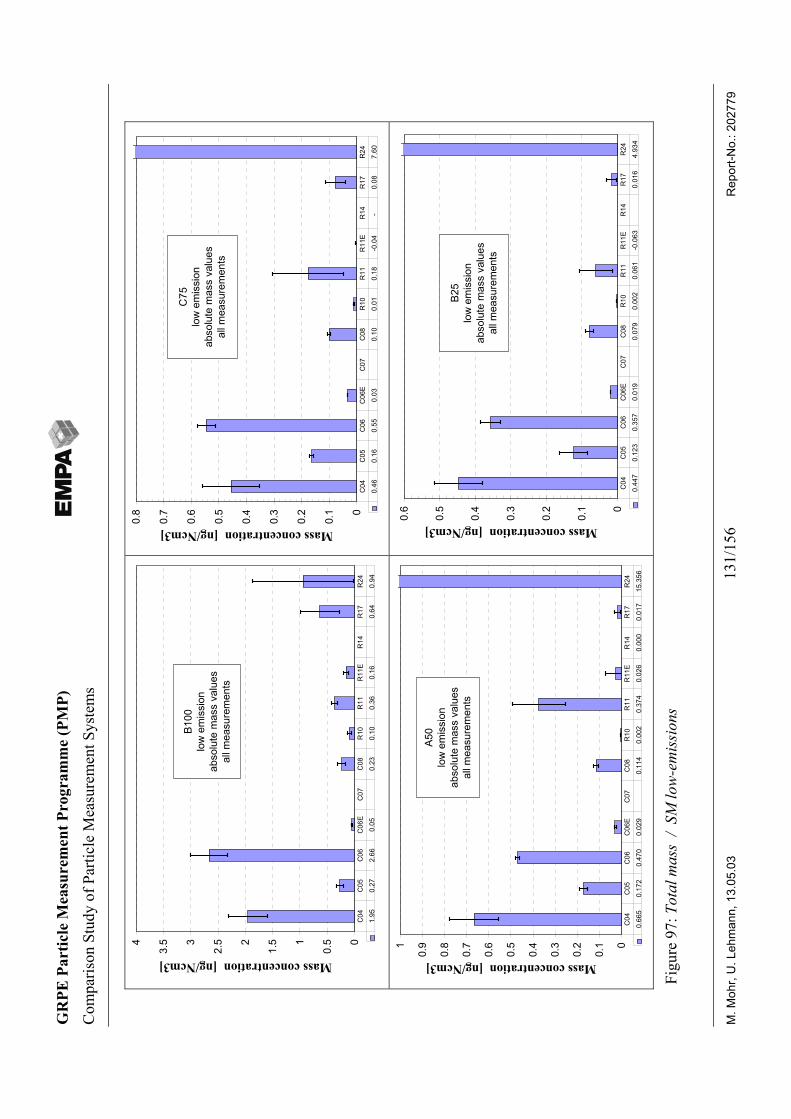
GR
PE P
artic
le M
easu
rem
ent P
rogr
amm
e (P
MP)
Com
paris
on S
tudy
of P
artic
le M
easu
rem
ent S
yste
ms
M. M
ohr,
U. L
ehm
ann,
13.
05.0
313
1/15
6R
epor
t-No.
: 202
779
0
0.51
1.52
2.53
3.54
Mass concentration [ng/Ncm3]
1.95
0.27
2.66
0.05
0.23
0.10
0.36
0.16
0.64
0.94
C04
C05
C06
C06
EC
07C
08R
10R
11R
11E
R14
R17
R24
B100
low
em
issi
onab
solu
te m
ass
valu
esal
l mea
sure
men
ts
0
0.1
0.2
0.3
0.4
0.5
0.6
0.7
0.8
Mass concentration [ng/Ncm3]
0.46
0
.16
0.5
5 0
.03
0.1
0 0
.01
0.1
8 -0
.04
-
0.0
8 7
.60
C04
C05
C06
C06
EC
07C
08R
10R
11R
11E
R14
R17
R24
C75
low
em
issi
onab
solu
te m
ass
valu
esal
l mea
sure
men
ts
0
0.1
0.2
0.3
0.4
0.5
0.6
0.7
0.8
0.91
Mass concentration [ng/Ncm3]
0.66
50.
172
0.47
00.
029
0.11
40.
002
0.37
40.
026
0.00
00.
017
15.3
56C
04C
05C
06C
06E
C07
C08
R10
R11
R11
ER
14R
17R
24
A50
low
em
issi
onab
solu
te m
ass
valu
esal
l mea
sure
men
ts
0
0.1
0.2
0.3
0.4
0.5
0.6
Mass concentration [ng/Ncm3]
0.4
47
0.12
3 0.
357
0.01
9 0
.079
0
.002
0
.061
-0
.063
0
.016
4
.934
C
04C
05C
06C
06E
C07
C08
R10
R11
R11
ER
14R
17R
24
B25
low
em
issi
onab
solu
te m
ass
valu
es
all m
easu
rem
ents
Figu
re 9
7: T
otal
mas
s /
SM lo
w-e
mis
sion
s
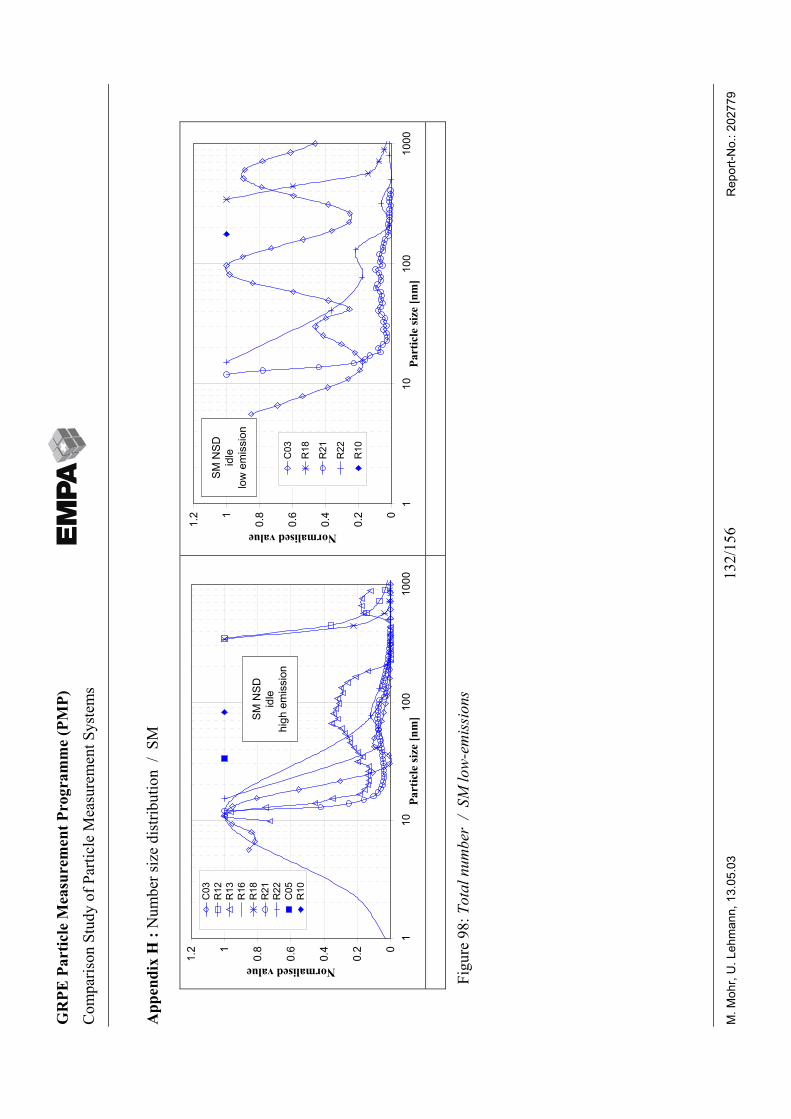
GR
PE P
artic
le M
easu
rem
ent P
rogr
amm
e (P
MP)
Com
paris
on S
tudy
of P
artic
le M
easu
rem
ent S
yste
ms
M. M
ohr,
U. L
ehm
ann,
13.
05.0
313
2/15
6R
epor
t-No.
: 202
779
App
endi
x H
: N
umbe
r siz
e di
strib
utio
n /
SM
0
0.2
0.4
0.6
0.81
1.2
110
100
1000
Part
icle
size
[nm
]
Normalised value
C03
R12
R13
R16
R18
R21
R22
C05
R10
SM N
SDid
lehi
gh e
mis
sion
0
0.2
0.4
0.6
0.81
1.2
110
100
1000
Part
icle
size
[nm
]
Normalised value
C03
R18
R21
R22
R10
SM N
SDid
lelo
w e
mis
sion
Figu
re 9
8: T
otal
num
ber
/ SM
low
-em
issi
ons
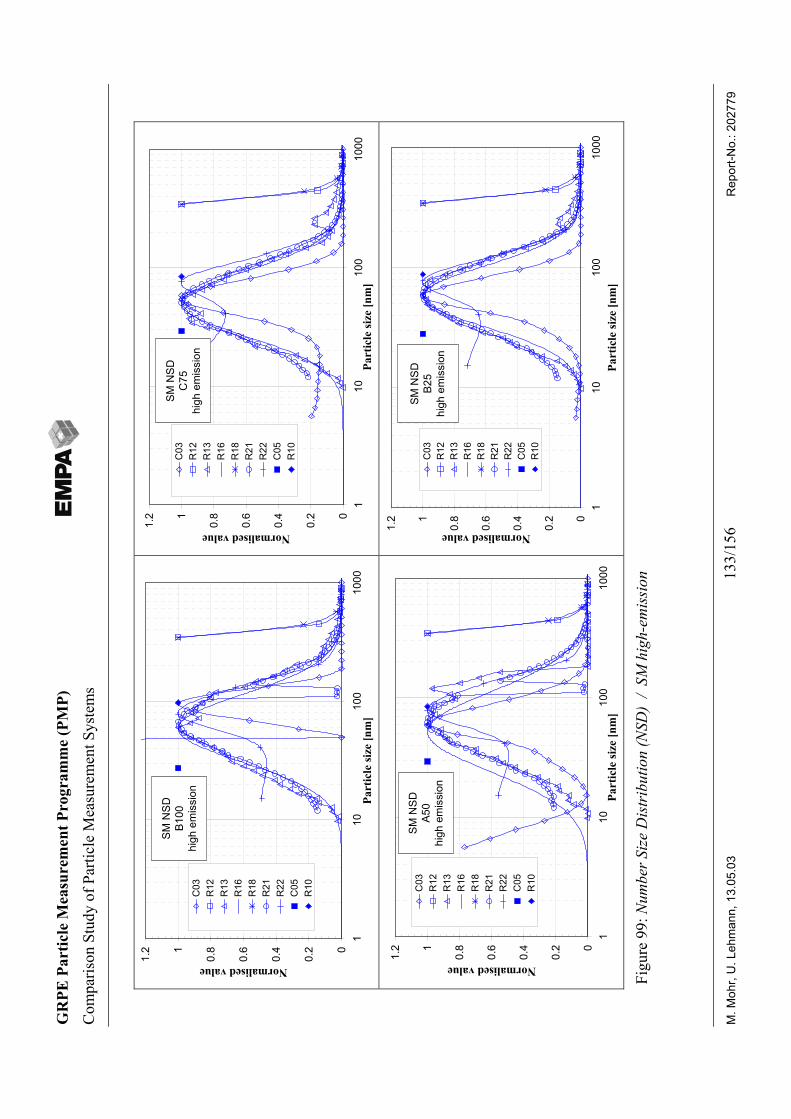
GR
PE P
artic
le M
easu
rem
ent P
rogr
amm
e (P
MP)
Com
paris
on S
tudy
of P
artic
le M
easu
rem
ent S
yste
ms
M. M
ohr,
U. L
ehm
ann,
13.
05.0
313
3/15
6R
epor
t-No.
: 202
779
0
0.2
0.4
0.6
0.81
1.2
110
100
1000
Part
icle
size
[nm
]
Normalised value
C03
R12
R13
R16
R18
R21
R22
C05
R10
SM N
SDB1
00hi
gh e
mis
sion
0
0.2
0.4
0.6
0.81
1.2
110
100
1000
Part
icle
size
[nm
]
Normalised value
C03
R12
R13
R16
R18
R21
R22
C05
R10
SM N
SDC
75hi
gh e
mis
sion
0
0.2
0.4
0.6
0.81
1.2
110
100
1000
Part
icle
size
[nm
]
Normalised value
C03
R12
R13
R16
R18
R21
R22
C05
R10
SM N
SDA5
0hi
gh e
mis
sion
0
0.2
0.4
0.6
0.81
1.2
110
100
1000
Part
icle
size
[nm
]
Normalised value
C03
R12
R13
R16
R18
R21
R22
C05
R10
SM N
SDB2
5hi
gh e
mis
sion
Figu
re 9
9: N
umbe
r Siz
e D
istr
ibut
ion
(NSD
) /
SM h
igh-
emis
sion
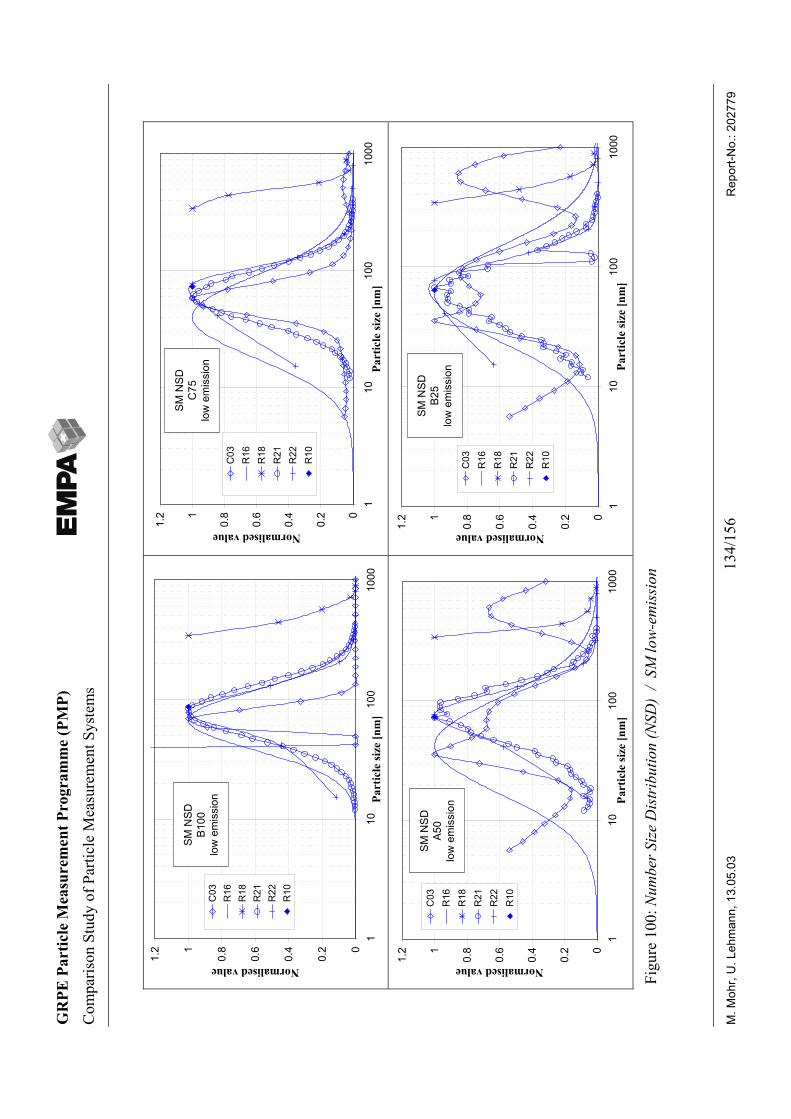
GR
PE P
artic
le M
easu
rem
ent P
rogr
amm
e (P
MP)
Com
paris
on S
tudy
of P
artic
le M
easu
rem
ent S
yste
ms
M. M
ohr,
U. L
ehm
ann,
13.
05.0
313
4/15
6R
epor
t-No.
: 202
779
0
0.2
0.4
0.6
0.81
1.2
110
100
1000
Part
icle
size
[nm
]
Normalised value
C03
R16
R18
R21
R22
R10
SM N
SDB1
00lo
w e
mis
sion
0
0.2
0.4
0.6
0.81
1.2
110
100
1000
Part
icle
size
[nm
]
Normalised value
C03
R16
R18
R21
R22
R10
SM N
SDC
75lo
w e
mis
sion
0
0.2
0.4
0.6
0.81
1.2
110
100
1000
Part
icle
size
[nm
]
Normalised value
C03
R16
R18
R21
R22
R10
SM N
SDA5
0lo
w e
mis
sion
0
0.2
0.4
0.6
0.81
1.2
110
100
1000
Part
icle
size
[nm
]
Normalised value
C03
R16
R18
R21
R22
R10
SM N
SDB2
5lo
w e
mis
sion
Figu
re 1
00: N
umbe
r Siz
e D
istr
ibut
ion
(NSD
) /
SM lo
w-e
mis
sion
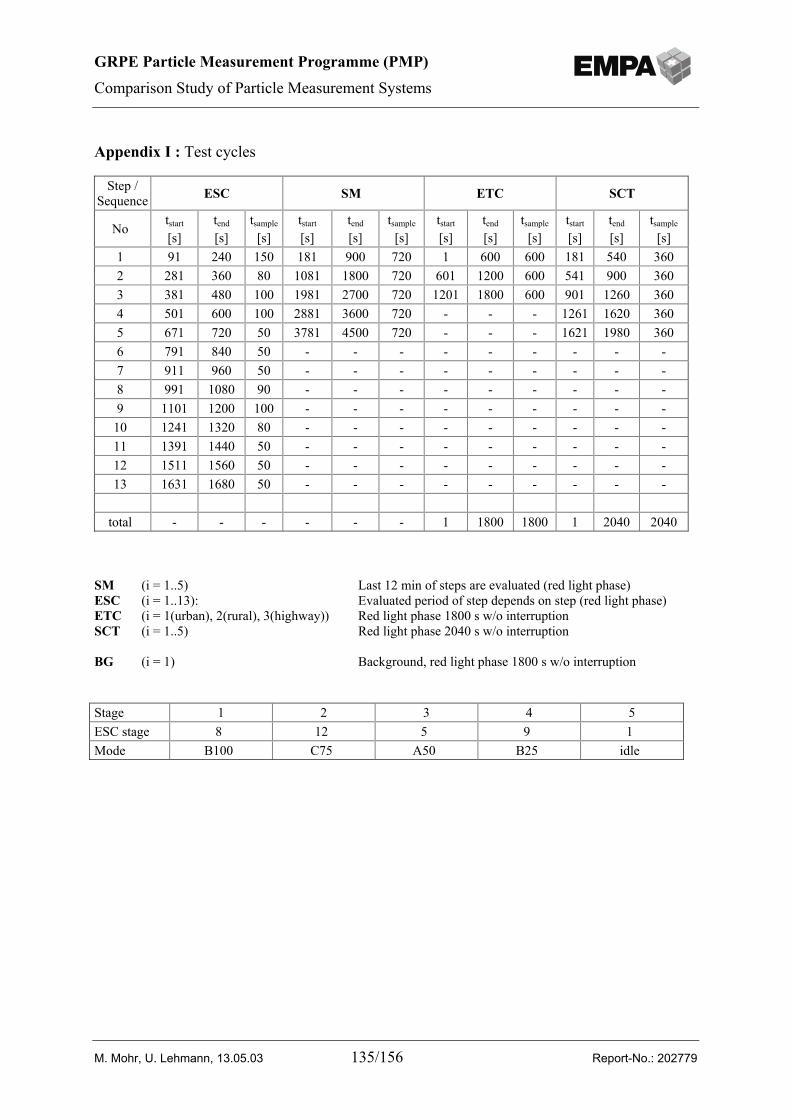
GRPE Particle Measurement Programme (PMP)
Comparison Study of Particle Measurement Systems
M. Mohr, U. Lehmann, 13.05.03 135/156 Report-No.: 202779
Appendix I : Test cycles
Step /Sequence ESC SM ETC SCT
Notstart
[s]tend
[s]tsample
[s]tstart
[s]tend
[s]tsample
[s]tstart
[s]tend
[s]tsample
[s]tstart
[s]tend
[s]tsample
[s]1 91 240 150 181 900 720 1 600 600 181 540 3602 281 360 80 1081 1800 720 601 1200 600 541 900 3603 381 480 100 1981 2700 720 1201 1800 600 901 1260 3604 501 600 100 2881 3600 720 - - - 1261 1620 3605 671 720 50 3781 4500 720 - - - 1621 1980 3606 791 840 50 - - - - - - - - -7 911 960 50 - - - - - - - - -8 991 1080 90 - - - - - - - - -9 1101 1200 100 - - - - - - - - -
10 1241 1320 80 - - - - - - - - -11 1391 1440 50 - - - - - - - - -12 1511 1560 50 - - - - - - - - -13 1631 1680 50 - - - - - - - - -
total - - - - - - 1 1800 1800 1 2040 2040
SM (i = 1..5) Last 12 min of steps are evaluated (red light phase)ESC (i = 1..13): Evaluated period of step depends on step (red light phase)ETC (i = 1(urban), 2(rural), 3(highway)) Red light phase 1800 s w/o interruptionSCT (i = 1..5) Red light phase 2040 s w/o interruption
BG (i = 1) Background, red light phase 1800 s w/o interruption
Stage 1 2 3 4 5ESC stage 8 12 5 9 1Mode B100 C75 A50 B25 idle
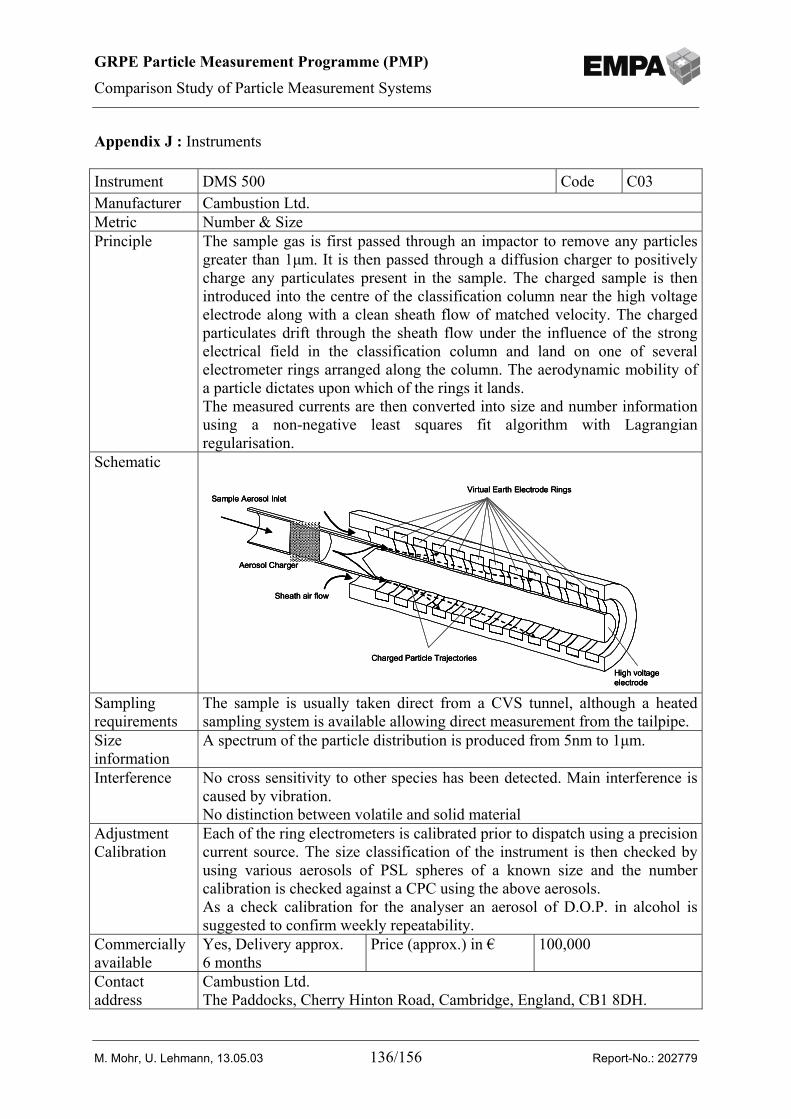
GRPE Particle Measurement Programme (PMP)
Comparison Study of Particle Measurement Systems
M. Mohr, U. Lehmann, 13.05.03 136/156 Report-No.: 202779
Appendix J : Instruments
Instrument DMS 500 Code C03Manufacturer Cambustion Ltd.Metric Number & SizePrinciple The sample gas is first passed through an impactor to remove any particles
greater than 1µm. It is then passed through a diffusion charger to positivelycharge any particulates present in the sample. The charged sample is thenintroduced into the centre of the classification column near the high voltageelectrode along with a clean sheath flow of matched velocity. The chargedparticulates drift through the sheath flow under the influence of the strongelectrical field in the classification column and land on one of severalelectrometer rings arranged along the column. The aerodynamic mobility ofa particle dictates upon which of the rings it lands.The measured currents are then converted into size and number informationusing a non-negative least squares fit algorithm with Lagrangianregularisation.
Schematic
High voltageelectrode
Sample Aerosol Inlet
Aerosol Charger
Sheath air flow
Virtual Earth Electrode Rings
Charged Particle Trajectories
High voltageelectrodeHigh voltageelectrode
Sample Aerosol Inlet
Aerosol Charger
Sheath air flow
Virtual Earth Electrode Rings
Charged Particle Trajectories
Sample Aerosol Inlet
Aerosol Charger
Sheath air flow
Virtual Earth Electrode Rings
Charged Particle Trajectories
Samplingrequirements
The sample is usually taken direct from a CVS tunnel, although a heatedsampling system is available allowing direct measurement from the tailpipe.
Sizeinformation
A spectrum of the particle distribution is produced from 5nm to 1µm.
Interference No cross sensitivity to other species has been detected. Main interference iscaused by vibration.No distinction between volatile and solid material
AdjustmentCalibration
Each of the ring electrometers is calibrated prior to dispatch using a precisioncurrent source. The size classification of the instrument is then checked byusing various aerosols of PSL spheres of a known size and the numbercalibration is checked against a CPC using the above aerosols.As a check calibration for the analyser an aerosol of D.O.P. in alcohol issuggested to confirm weekly repeatability.
Commerciallyavailable
Yes, Delivery approx.6 months
Price (approx.) in € 100,000
Contactaddress
Cambustion Ltd.The Paddocks, Cherry Hinton Road, Cambridge, England, CB1 8DH.
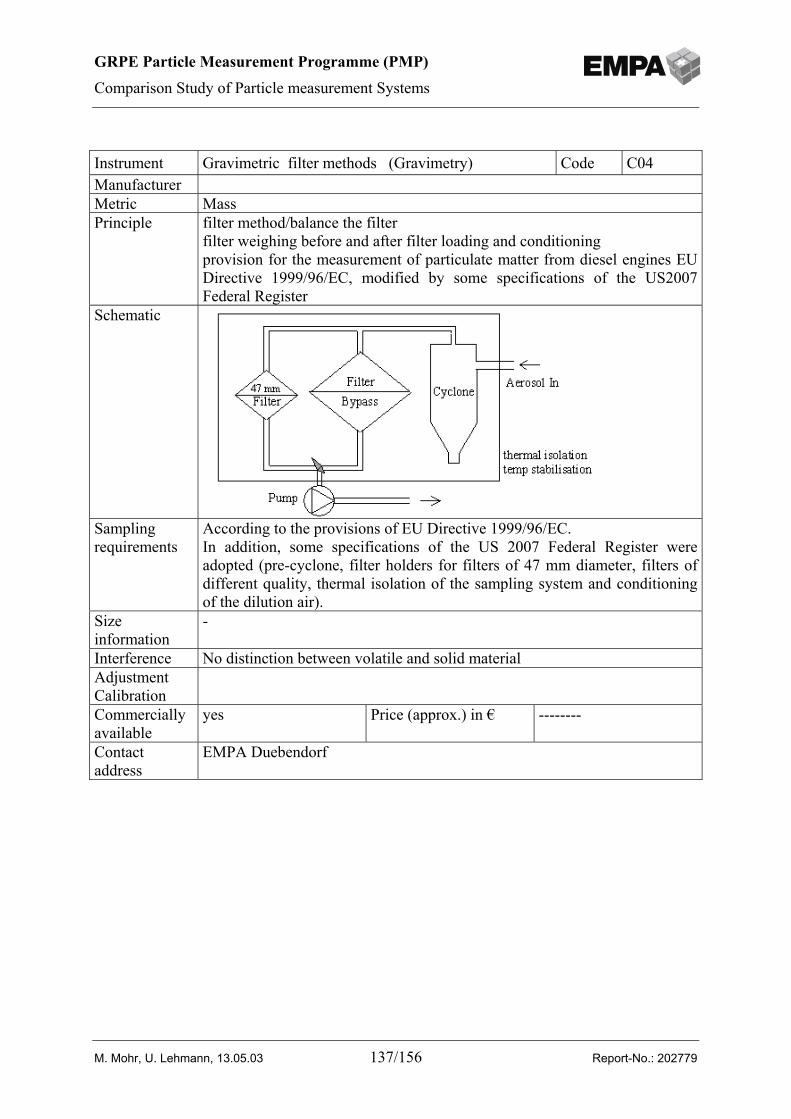
GRPE Particle Measurement Programme (PMP)
Comparison Study of Particle measurement Systems
M. Mohr, U. Lehmann, 13.05.03 137/156 Report-No.: 202779
Instrument Gravimetric filter methods (Gravimetry) Code C04ManufacturerMetric MassPrinciple filter method/balance the filter
filter weighing before and after filter loading and conditioningprovision for the measurement of particulate matter from diesel engines EUDirective 1999/96/EC, modified by some specifications of the US2007Federal Register
Schematic
Samplingrequirements
According to the provisions of EU Directive 1999/96/EC.In addition, some specifications of the US 2007 Federal Register wereadopted (pre-cyclone, filter holders for filters of 47 mm diameter, filters ofdifferent quality, thermal isolation of the sampling system and conditioningof the dilution air).
Sizeinformation
-
Interference No distinction between volatile and solid materialAdjustmentCalibrationCommerciallyavailable
yes Price (approx.) in € --------
Contactaddress
EMPA Duebendorf
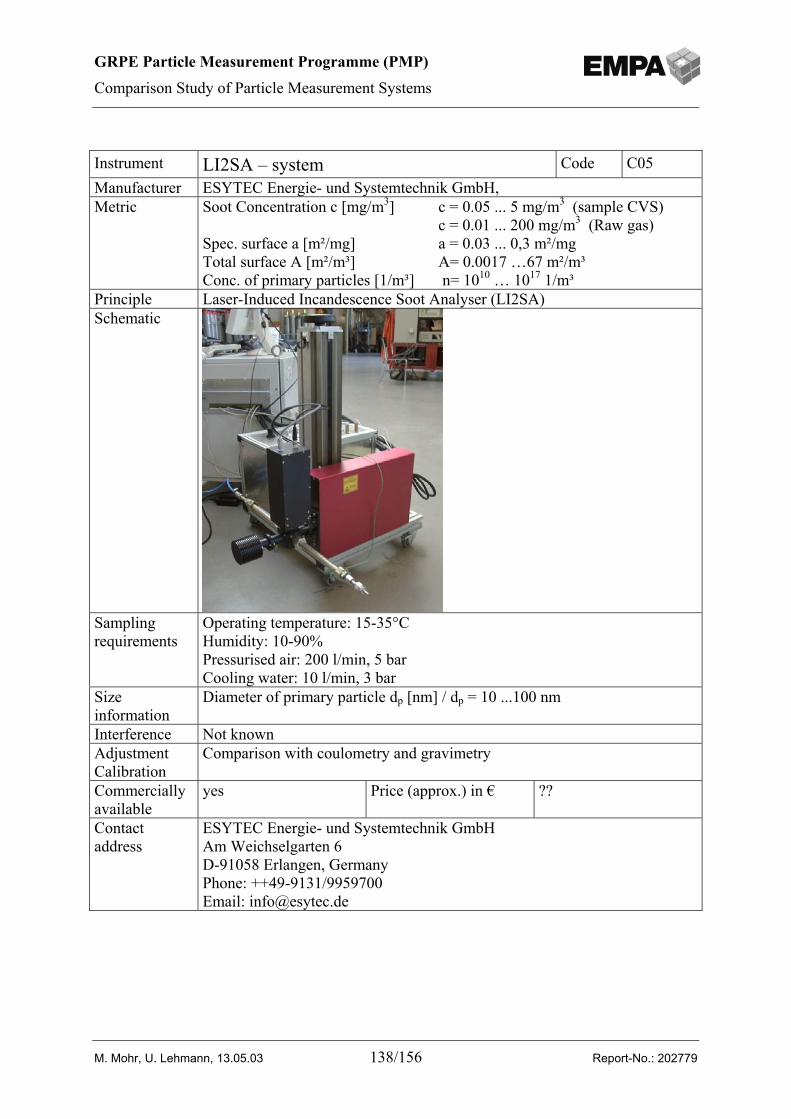
GRPE Particle Measurement Programme (PMP)
Comparison Study of Particle Measurement Systems
M. Mohr, U. Lehmann, 13.05.03 138/156 Report-No.: 202779
Instrument LI2SA – system Code C05Manufacturer ESYTEC Energie- und Systemtechnik GmbH,Metric Soot Concentration c [mg/m3] c = 0.05 ... 5 mg/m3 (sample CVS)
c = 0.01 ... 200 mg/m3 (Raw gas)Spec. surface a [m²/mg] a = 0.03 ... 0,3 m²/mgTotal surface A [m²/m³] A= 0.0017 …67 m²/m³Conc. of primary particles [1/m³] n= 1010 … 1017 1/m³
Principle Laser-Induced Incandescence Soot Analyser (LI2SA)Schematic
Samplingrequirements
Operating temperature: 15-35°CHumidity: 10-90%Pressurised air: 200 l/min, 5 barCooling water: 10 l/min, 3 bar
Sizeinformation
Diameter of primary particle dp [nm] / dp = 10 ...100 nm
Interference Not knownAdjustmentCalibration
Comparison with coulometry and gravimetry
Commerciallyavailable
yes Price (approx.) in € ??
Contactaddress
ESYTEC Energie- und Systemtechnik GmbHAm Weichselgarten 6D-91058 Erlangen, GermanyPhone: ++49-9131/9959700Email: [email protected]
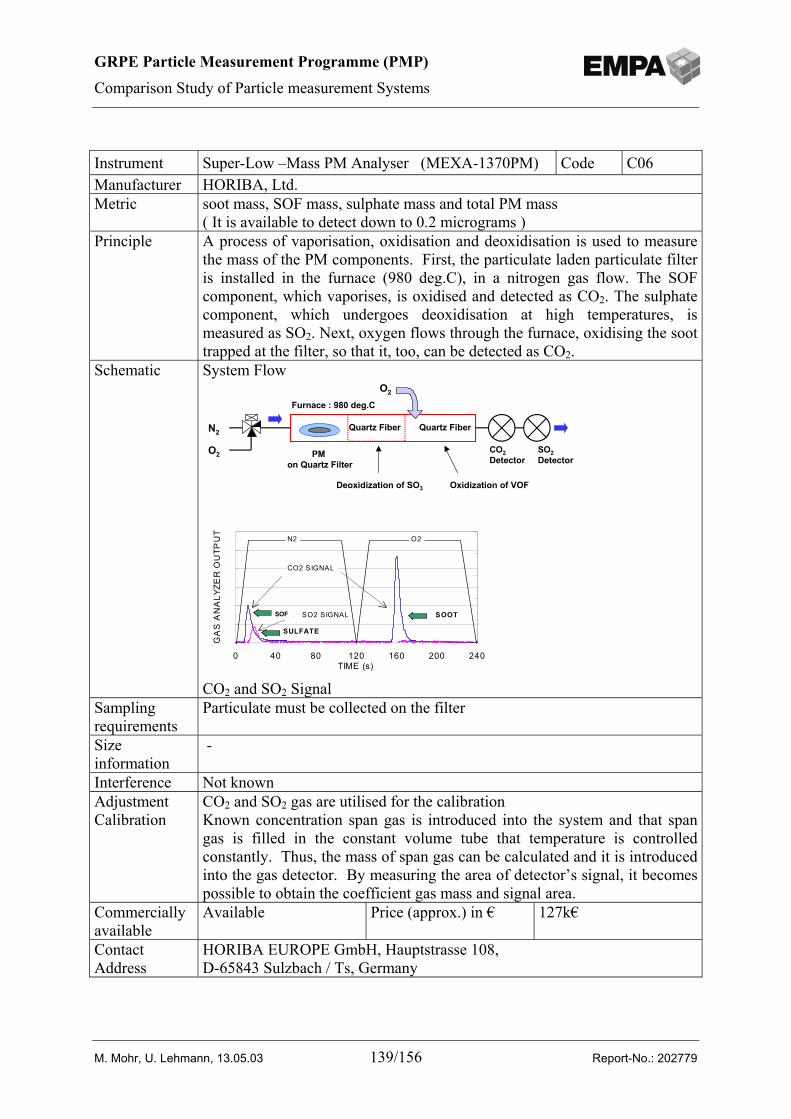
GRPE Particle Measurement Programme (PMP)
Comparison Study of Particle measurement Systems
M. Mohr, U. Lehmann, 13.05.03 139/156 Report-No.: 202779
Instrument Super-Low –Mass PM Analyser (MEXA-1370PM) Code C06Manufacturer HORIBA, Ltd.Metric soot mass, SOF mass, sulphate mass and total PM mass
( It is available to detect down to 0.2 micrograms )Principle A process of vaporisation, oxidisation and deoxidisation is used to measure
the mass of the PM components. First, the particulate laden particulate filteris installed in the furnace (980 deg.C), in a nitrogen gas flow. The SOFcomponent, which vaporises, is oxidised and detected as CO2. The sulphatecomponent, which undergoes deoxidisation at high temperatures, ismeasured as SO2. Next, oxygen flows through the furnace, oxidising the soottrapped at the filter, so that it, too, can be detected as CO2.
Schematic System Flow
N2
SO2 Detector
CO2 Detector
O2
O2
Quartz FiberQuartz Fiber
PM on Quartz Filter
Furnace : 980 deg.C
Deoxidization of SO3 Oxidization of VOF
0 40 80 120 160 200 240TIME (s)
GA
S A
NA
LYZE
R O
UTP
UT
CO2 SIGNAL
SO2 SIGNAL
N2 O2
SOOT
SULFATE
VOFSOF
CO2 and SO2 SignalSamplingrequirements
Particulate must be collected on the filter
Sizeinformation
-
Interference Not knownAdjustmentCalibration
CO2 and SO2 gas are utilised for the calibrationKnown concentration span gas is introduced into the system and that spangas is filled in the constant volume tube that temperature is controlledconstantly. Thus, the mass of span gas can be calculated and it is introducedinto the gas detector. By measuring the area of detector’s signal, it becomespossible to obtain the coefficient gas mass and signal area.
Commerciallyavailable
Available Price (approx.) in € 127k€
ContactAddress
HORIBA EUROPE GmbH, Hauptstrasse 108,D-65843 Sulzbach / Ts, Germany
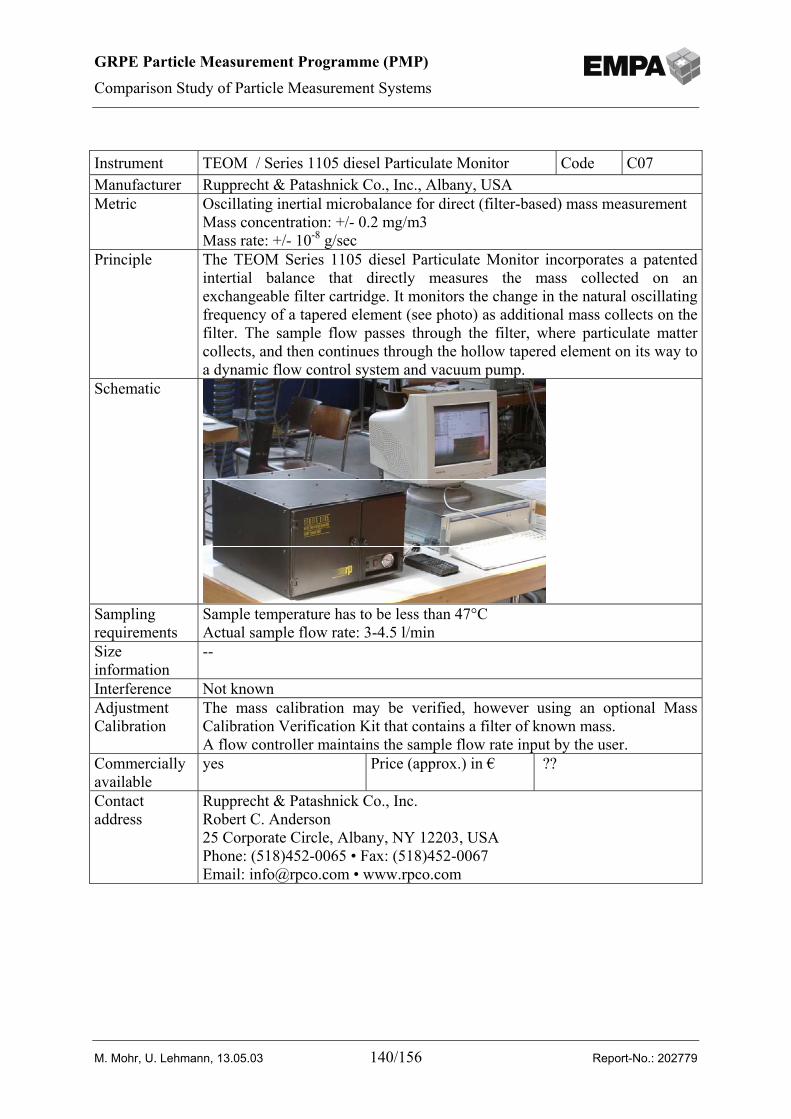
GRPE Particle Measurement Programme (PMP)
Comparison Study of Particle Measurement Systems
M. Mohr, U. Lehmann, 13.05.03 140/156 Report-No.: 202779
Instrument TEOM / Series 1105 diesel Particulate Monitor Code C07Manufacturer Rupprecht & Patashnick Co., Inc., Albany, USAMetric Oscillating inertial microbalance for direct (filter-based) mass measurement
Mass concentration: +/- 0.2 mg/m3Mass rate: +/- 10-8 g/sec
Principle The TEOM Series 1105 diesel Particulate Monitor incorporates a patentedintertial balance that directly measures the mass collected on anexchangeable filter cartridge. It monitors the change in the natural oscillatingfrequency of a tapered element (see photo) as additional mass collects on thefilter. The sample flow passes through the filter, where particulate mattercollects, and then continues through the hollow tapered element on its way toa dynamic flow control system and vacuum pump.
Schematic
Samplingrequirements
Sample temperature has to be less than 47°CActual sample flow rate: 3-4.5 l/min
Sizeinformation
--
Interference Not knownAdjustmentCalibration
The mass calibration may be verified, however using an optional MassCalibration Verification Kit that contains a filter of known mass.A flow controller maintains the sample flow rate input by the user.
Commerciallyavailable
yes Price (approx.) in € ??
Contactaddress
Rupprecht & Patashnick Co., Inc.Robert C. Anderson25 Corporate Circle, Albany, NY 12203, USAPhone: (518)452-0065 • Fax: (518)452-0067Email: [email protected] • www.rpco.com
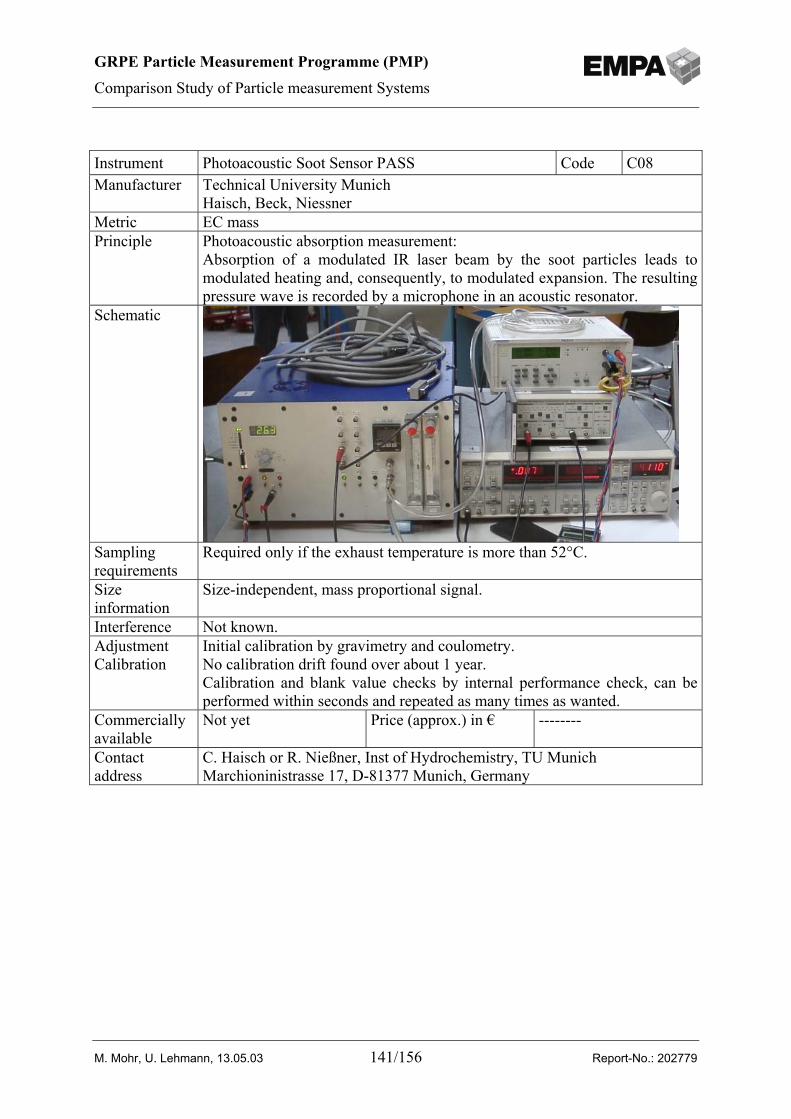
GRPE Particle Measurement Programme (PMP)
Comparison Study of Particle measurement Systems
M. Mohr, U. Lehmann, 13.05.03 141/156 Report-No.: 202779
Instrument Photoacoustic Soot Sensor PASS Code C08Manufacturer Technical University Munich
Haisch, Beck, NiessnerMetric EC massPrinciple Photoacoustic absorption measurement:
Absorption of a modulated IR laser beam by the soot particles leads tomodulated heating and, consequently, to modulated expansion. The resultingpressure wave is recorded by a microphone in an acoustic resonator.
Schematic
Samplingrequirements
Required only if the exhaust temperature is more than 52°C.
Sizeinformation
Size-independent, mass proportional signal.
Interference Not known.AdjustmentCalibration
Initial calibration by gravimetry and coulometry.No calibration drift found over about 1 year.Calibration and blank value checks by internal performance check, can beperformed within seconds and repeated as many times as wanted.
Commerciallyavailable
Not yet Price (approx.) in € --------
Contactaddress
C. Haisch or R. Nießner, Inst of Hydrochemistry, TU MunichMarchioninistrasse 17, D-81377 Munich, Germany
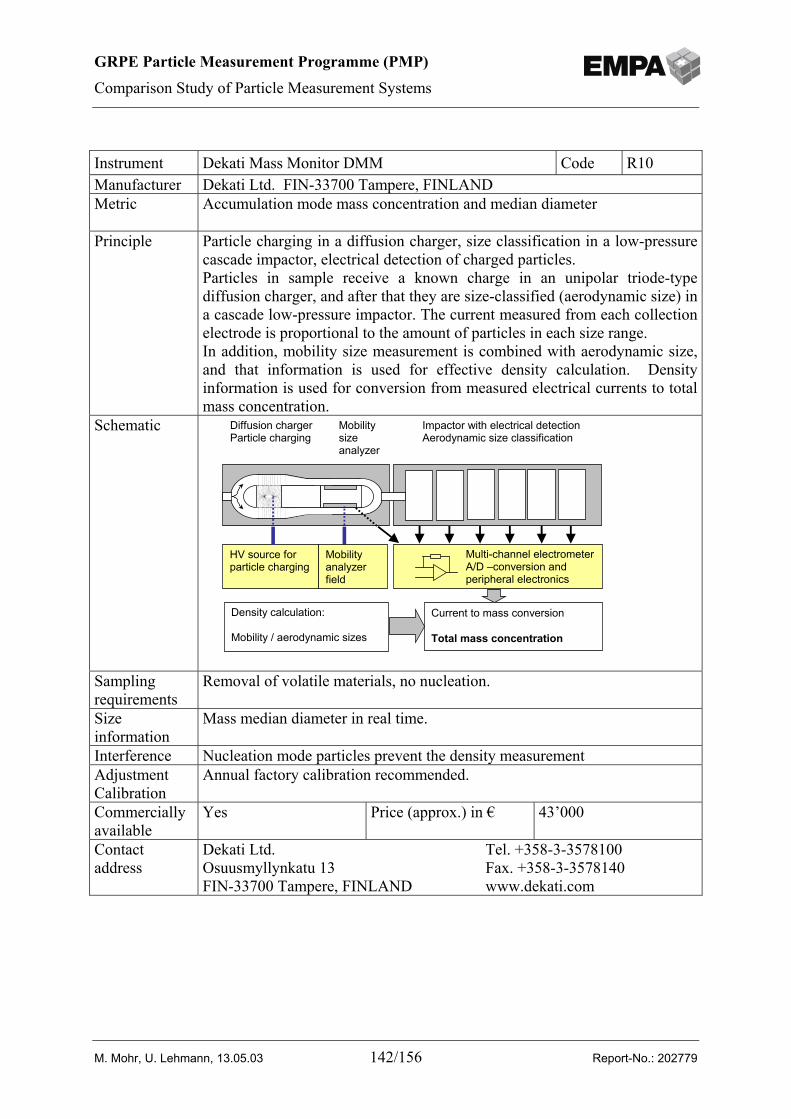
GRPE Particle Measurement Programme (PMP)
Comparison Study of Particle Measurement Systems
M. Mohr, U. Lehmann, 13.05.03 142/156 Report-No.: 202779
Instrument Dekati Mass Monitor DMM Code R10Manufacturer Dekati Ltd. FIN-33700 Tampere, FINLANDMetric Accumulation mode mass concentration and median diameter
Principle Particle charging in a diffusion charger, size classification in a low-pressurecascade impactor, electrical detection of charged particles.Particles in sample receive a known charge in an unipolar triode-typediffusion charger, and after that they are size-classified (aerodynamic size) ina cascade low-pressure impactor. The current measured from each collectionelectrode is proportional to the amount of particles in each size range.In addition, mobility size measurement is combined with aerodynamic size,and that information is used for effective density calculation. Densityinformation is used for conversion from measured electrical currents to totalmass concentration.
Schematic
Density calculation: Mobility / aerodynamic sizes
Diffusion charger Particle charging
Mobility size analyzer
HV source for particle charging
Impactor with electrical detection Aerodynamic size classification
Current to mass conversion Total mass concentration
Multi-channel electrometer A/D –conversion and peripheral electronics
Mobility analyzer field
Samplingrequirements
Removal of volatile materials, no nucleation.
Sizeinformation
Mass median diameter in real time.
Interference Nucleation mode particles prevent the density measurementAdjustmentCalibration
Annual factory calibration recommended.
Commerciallyavailable
Yes Price (approx.) in € 43’000
Contactaddress
Dekati Ltd. Tel. +358-3-3578100Osuusmyllynkatu 13 Fax. +358-3-3578140FIN-33700 Tampere, FINLAND www.dekati.com
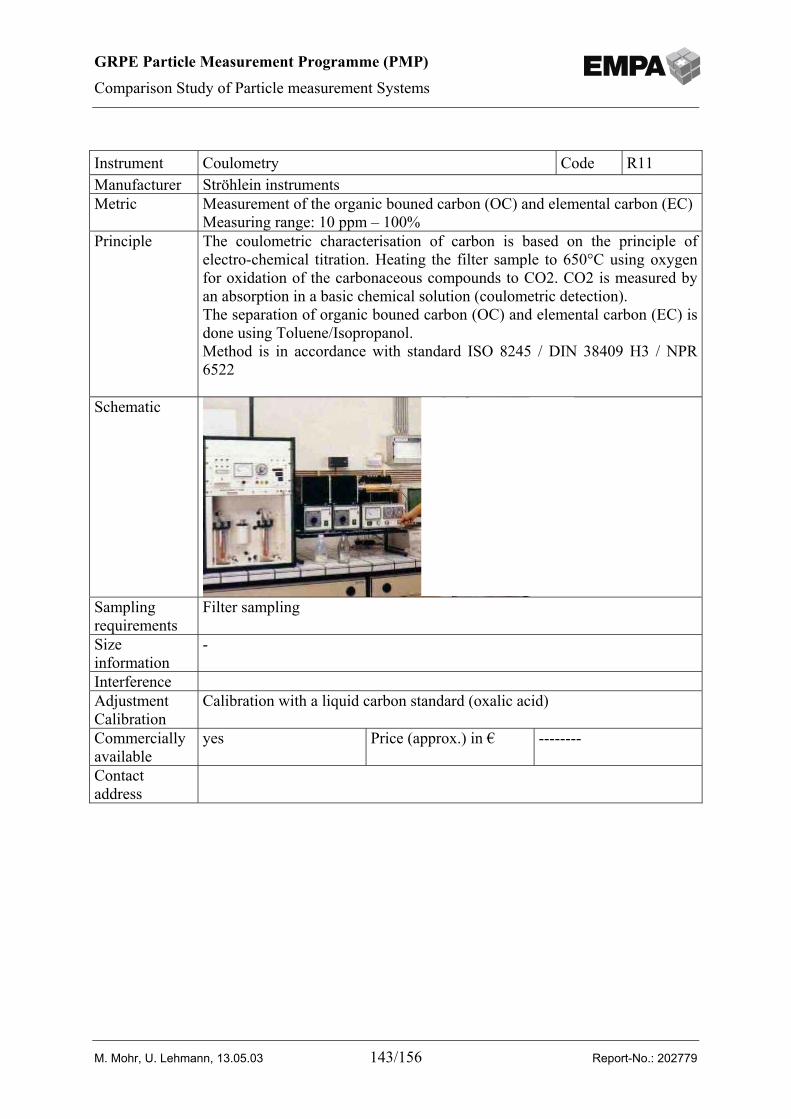
GRPE Particle Measurement Programme (PMP)
Comparison Study of Particle measurement Systems
M. Mohr, U. Lehmann, 13.05.03 143/156 Report-No.: 202779
Instrument Coulometry Code R11Manufacturer Ströhlein instrumentsMetric Measurement of the organic bouned carbon (OC) and elemental carbon (EC)
Measuring range: 10 ppm – 100%Principle The coulometric characterisation of carbon is based on the principle of
electro-chemical titration. Heating the filter sample to 650°C using oxygenfor oxidation of the carbonaceous compounds to CO2. CO2 is measured byan absorption in a basic chemical solution (coulometric detection).The separation of organic bouned carbon (OC) and elemental carbon (EC) isdone using Toluene/Isopropanol.Method is in accordance with standard ISO 8245 / DIN 38409 H3 / NPR6522
Schematic
Samplingrequirements
Filter sampling
Sizeinformation
-
InterferenceAdjustmentCalibration
Calibration with a liquid carbon standard (oxalic acid)
Commerciallyavailable
yes Price (approx.) in € --------
Contactaddress
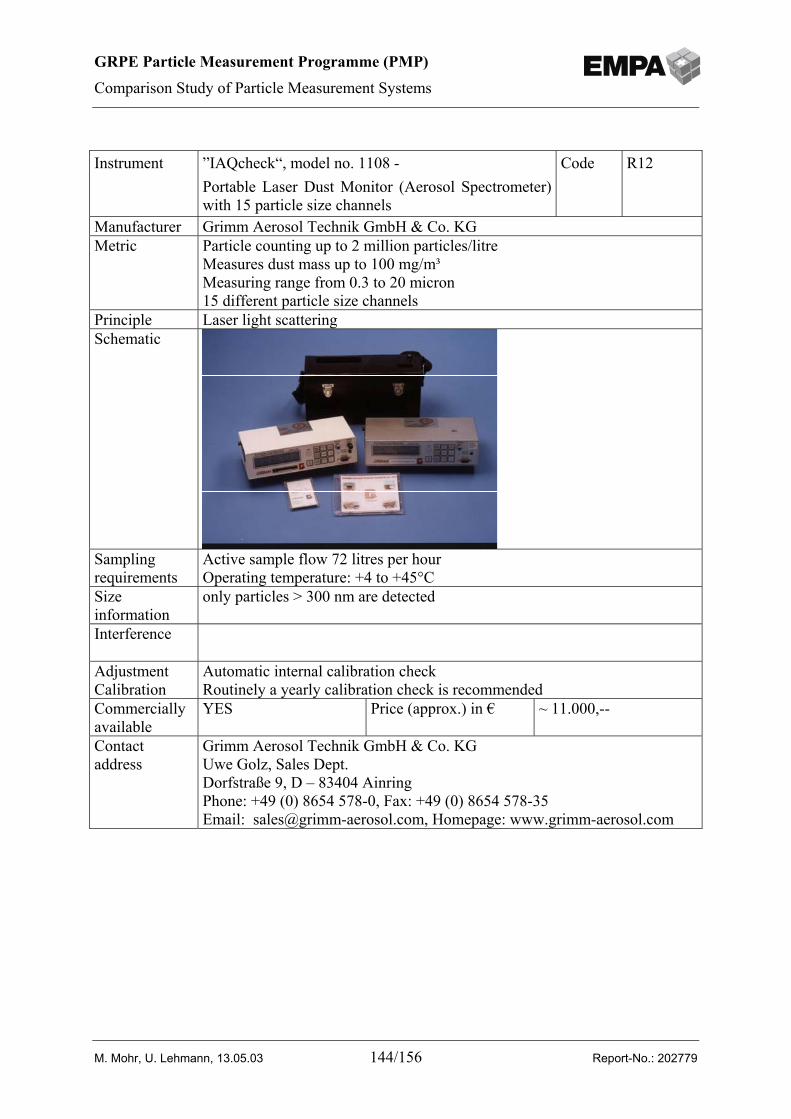
GRPE Particle Measurement Programme (PMP)
Comparison Study of Particle Measurement Systems
M. Mohr, U. Lehmann, 13.05.03 144/156 Report-No.: 202779
Instrument ”IAQcheck“, model no. 1108 -Portable Laser Dust Monitor (Aerosol Spectrometer)with 15 particle size channels
Code R12
Manufacturer Grimm Aerosol Technik GmbH & Co. KGMetric Particle counting up to 2 million particles/litre
Measures dust mass up to 100 mg/m³Measuring range from 0.3 to 20 micron15 different particle size channels
Principle Laser light scatteringSchematic
Samplingrequirements
Active sample flow 72 litres per hourOperating temperature: +4 to +45°C
Sizeinformation
only particles > 300 nm are detected
Interference
AdjustmentCalibration
Automatic internal calibration checkRoutinely a yearly calibration check is recommended
Commerciallyavailable
YES Price (approx.) in € ~ 11.000,--
Contactaddress
Grimm Aerosol Technik GmbH & Co. KGUwe Golz, Sales Dept.Dorfstraße 9, D – 83404 AinringPhone: +49 (0) 8654 578-0, Fax: +49 (0) 8654 578-35Email: [email protected], Homepage: www.grimm-aerosol.com
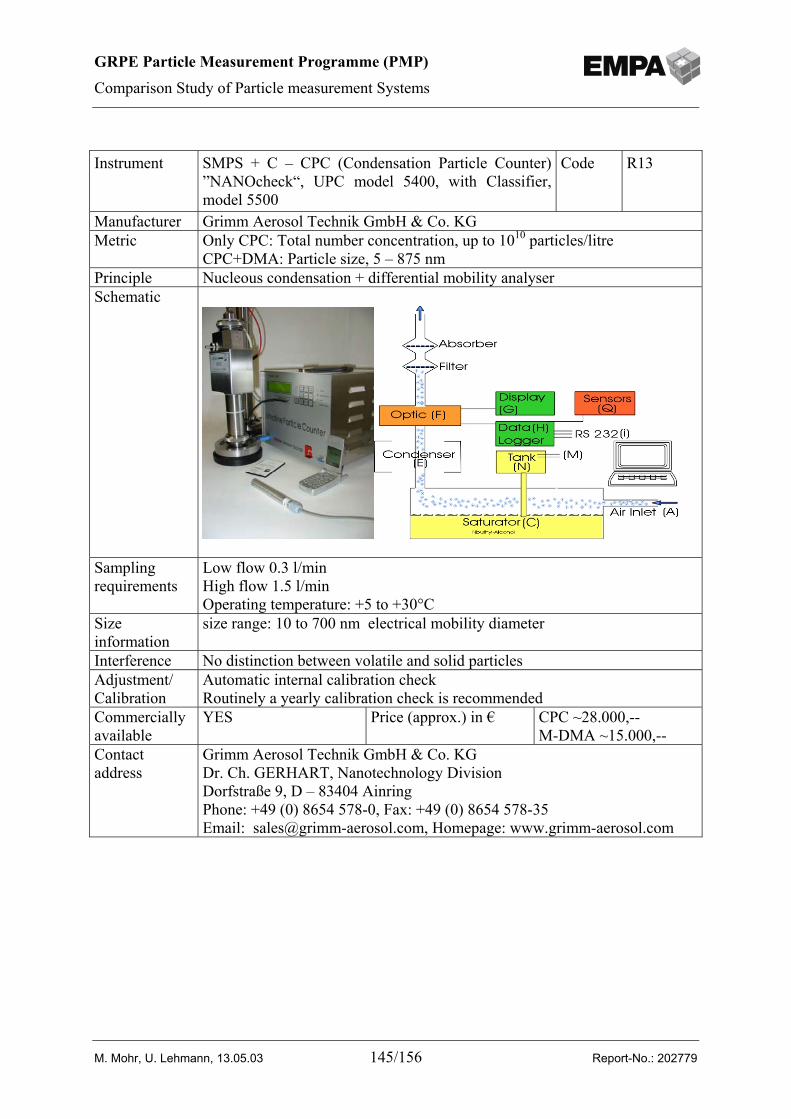
GRPE Particle Measurement Programme (PMP)
Comparison Study of Particle measurement Systems
M. Mohr, U. Lehmann, 13.05.03 145/156 Report-No.: 202779
Instrument SMPS + C – CPC (Condensation Particle Counter)”NANOcheck“, UPC model 5400, with Classifier,model 5500
Code R13
Manufacturer Grimm Aerosol Technik GmbH & Co. KGMetric Only CPC: Total number concentration, up to 1010 particles/litre
CPC+DMA: Particle size, 5 – 875 nmPrinciple Nucleous condensation + differential mobility analyserSchematic
Samplingrequirements
Low flow 0.3 l/minHigh flow 1.5 l/minOperating temperature: +5 to +30°C
Sizeinformation
size range: 10 to 700 nm electrical mobility diameter
Interference No distinction between volatile and solid particlesAdjustment/Calibration
Automatic internal calibration checkRoutinely a yearly calibration check is recommended
Commerciallyavailable
YES Price (approx.) in € CPC ~28.000,--M-DMA ~15.000,--
Contactaddress
Grimm Aerosol Technik GmbH & Co. KGDr. Ch. GERHART, Nanotechnology DivisionDorfstraße 9, D – 83404 AinringPhone: +49 (0) 8654 578-0, Fax: +49 (0) 8654 578-35Email: [email protected], Homepage: www.grimm-aerosol.com
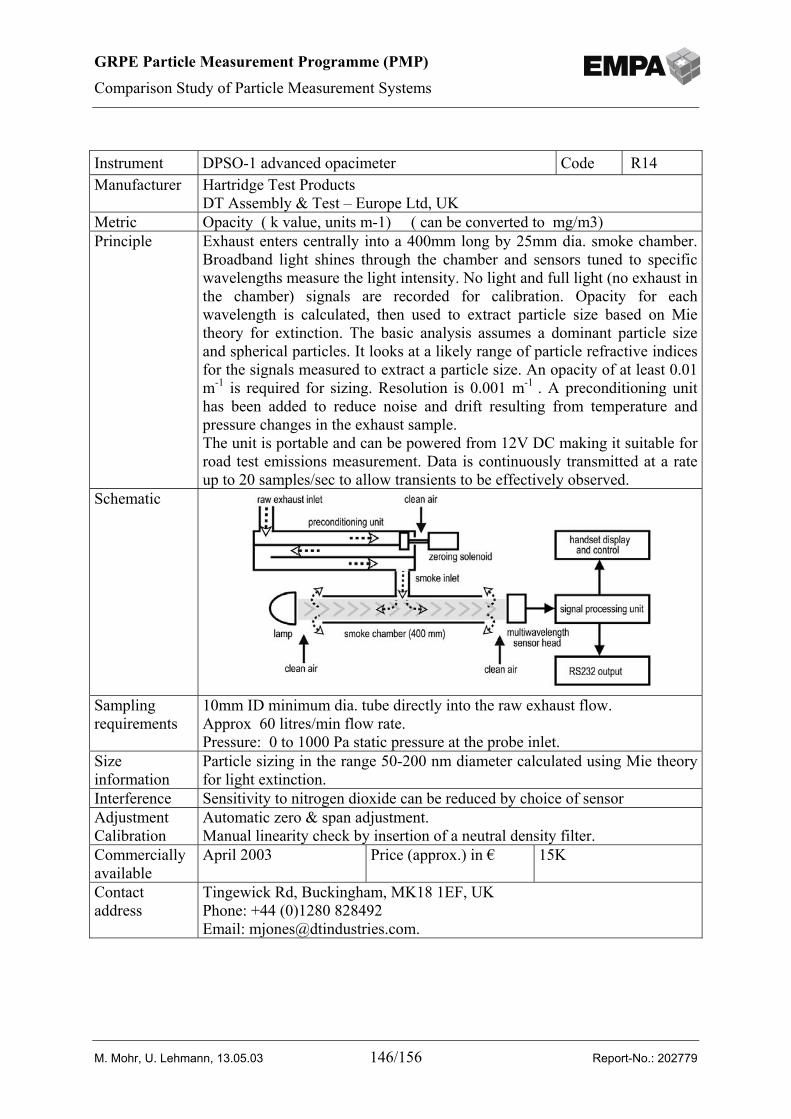
GRPE Particle Measurement Programme (PMP)
Comparison Study of Particle Measurement Systems
M. Mohr, U. Lehmann, 13.05.03 146/156 Report-No.: 202779
Instrument DPSO-1 advanced opacimeter Code R14Manufacturer Hartridge Test Products
DT Assembly & Test – Europe Ltd, UKMetric Opacity ( k value, units m-1) ( can be converted to mg/m3)Principle Exhaust enters centrally into a 400mm long by 25mm dia. smoke chamber.
Broadband light shines through the chamber and sensors tuned to specificwavelengths measure the light intensity. No light and full light (no exhaust inthe chamber) signals are recorded for calibration. Opacity for eachwavelength is calculated, then used to extract particle size based on Mietheory for extinction. The basic analysis assumes a dominant particle sizeand spherical particles. It looks at a likely range of particle refractive indicesfor the signals measured to extract a particle size. An opacity of at least 0.01m-1 is required for sizing. Resolution is 0.001 m-1 . A preconditioning unithas been added to reduce noise and drift resulting from temperature andpressure changes in the exhaust sample.The unit is portable and can be powered from 12V DC making it suitable forroad test emissions measurement. Data is continuously transmitted at a rateup to 20 samples/sec to allow transients to be effectively observed.
Schematic
Samplingrequirements
10mm ID minimum dia. tube directly into the raw exhaust flow.Approx 60 litres/min flow rate.Pressure: 0 to 1000 Pa static pressure at the probe inlet.
Sizeinformation
Particle sizing in the range 50-200 nm diameter calculated using Mie theoryfor light extinction.
Interference Sensitivity to nitrogen dioxide can be reduced by choice of sensorAdjustmentCalibration
Automatic zero & span adjustment.Manual linearity check by insertion of a neutral density filter.
Commerciallyavailable
April 2003 Price (approx.) in € 15K
Contactaddress
Tingewick Rd, Buckingham, MK18 1EF, UKPhone: +44 (0)1280 828492Email: [email protected].
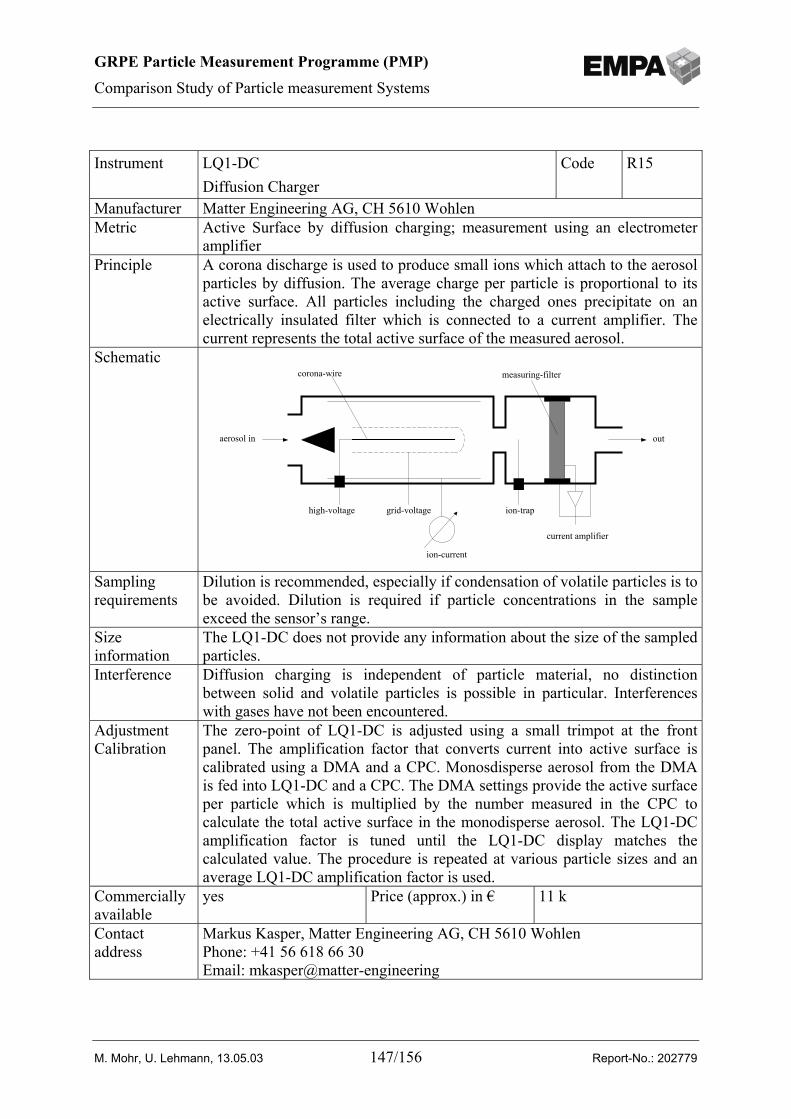
GRPE Particle Measurement Programme (PMP)
Comparison Study of Particle measurement Systems
M. Mohr, U. Lehmann, 13.05.03 147/156 Report-No.: 202779
Instrument LQ1-DCDiffusion Charger
Code R15
Manufacturer Matter Engineering AG, CH 5610 WohlenMetric Active Surface by diffusion charging; measurement using an electrometer
amplifierPrinciple A corona discharge is used to produce small ions which attach to the aerosol
particles by diffusion. The average charge per particle is proportional to itsactive surface. All particles including the charged ones precipitate on anelectrically insulated filter which is connected to a current amplifier. Thecurrent represents the total active surface of the measured aerosol.
Schematic
high-voltage grid-voltage ion-trap
corona-wire measuring-filter
current amplifier
aerosol in out
ion-current
Samplingrequirements
Dilution is recommended, especially if condensation of volatile particles is tobe avoided. Dilution is required if particle concentrations in the sampleexceed the sensor’s range.
Sizeinformation
The LQ1-DC does not provide any information about the size of the sampledparticles.
Interference Diffusion charging is independent of particle material, no distinctionbetween solid and volatile particles is possible in particular. Interferenceswith gases have not been encountered.
AdjustmentCalibration
The zero-point of LQ1-DC is adjusted using a small trimpot at the frontpanel. The amplification factor that converts current into active surface iscalibrated using a DMA and a CPC. Monosdisperse aerosol from the DMAis fed into LQ1-DC and a CPC. The DMA settings provide the active surfaceper particle which is multiplied by the number measured in the CPC tocalculate the total active surface in the monodisperse aerosol. The LQ1-DCamplification factor is tuned until the LQ1-DC display matches thecalculated value. The procedure is repeated at various particle sizes and anaverage LQ1-DC amplification factor is used.
Commerciallyavailable
yes Price (approx.) in € 11 k
Contactaddress
Markus Kasper, Matter Engineering AG, CH 5610 WohlenPhone: +41 56 618 66 30Email: mkasper@matter-engineering
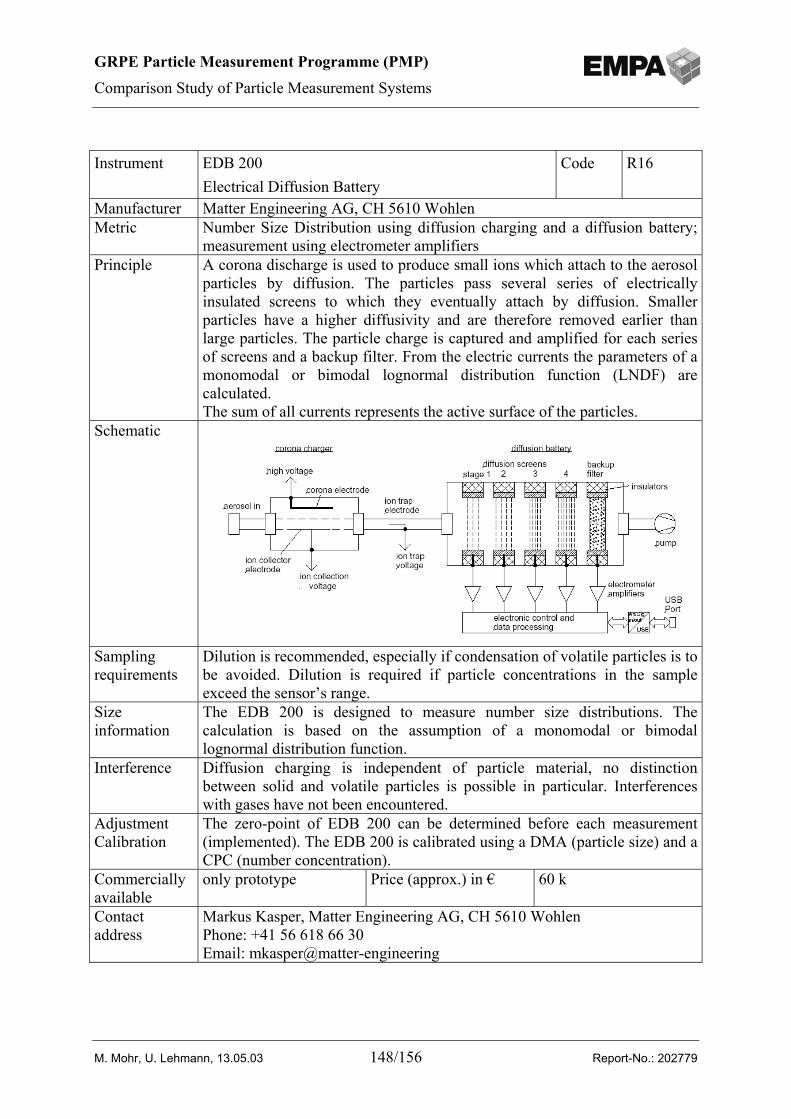
GRPE Particle Measurement Programme (PMP)
Comparison Study of Particle Measurement Systems
M. Mohr, U. Lehmann, 13.05.03 148/156 Report-No.: 202779
Instrument EDB 200Electrical Diffusion Battery
Code R16
Manufacturer Matter Engineering AG, CH 5610 WohlenMetric Number Size Distribution using diffusion charging and a diffusion battery;
measurement using electrometer amplifiersPrinciple A corona discharge is used to produce small ions which attach to the aerosol
particles by diffusion. The particles pass several series of electricallyinsulated screens to which they eventually attach by diffusion. Smallerparticles have a higher diffusivity and are therefore removed earlier thanlarge particles. The particle charge is captured and amplified for each seriesof screens and a backup filter. From the electric currents the parameters of amonomodal or bimodal lognormal distribution function (LNDF) arecalculated.The sum of all currents represents the active surface of the particles.
Schematic
Samplingrequirements
Dilution is recommended, especially if condensation of volatile particles is tobe avoided. Dilution is required if particle concentrations in the sampleexceed the sensor’s range.
Sizeinformation
The EDB 200 is designed to measure number size distributions. Thecalculation is based on the assumption of a monomodal or bimodallognormal distribution function.
Interference Diffusion charging is independent of particle material, no distinctionbetween solid and volatile particles is possible in particular. Interferenceswith gases have not been encountered.
AdjustmentCalibration
The zero-point of EDB 200 can be determined before each measurement(implemented). The EDB 200 is calibrated using a DMA (particle size) and aCPC (number concentration).
Commerciallyavailable
only prototype Price (approx.) in € 60 k
Contactaddress
Markus Kasper, Matter Engineering AG, CH 5610 WohlenPhone: +41 56 618 66 30Email: mkasper@matter-engineering
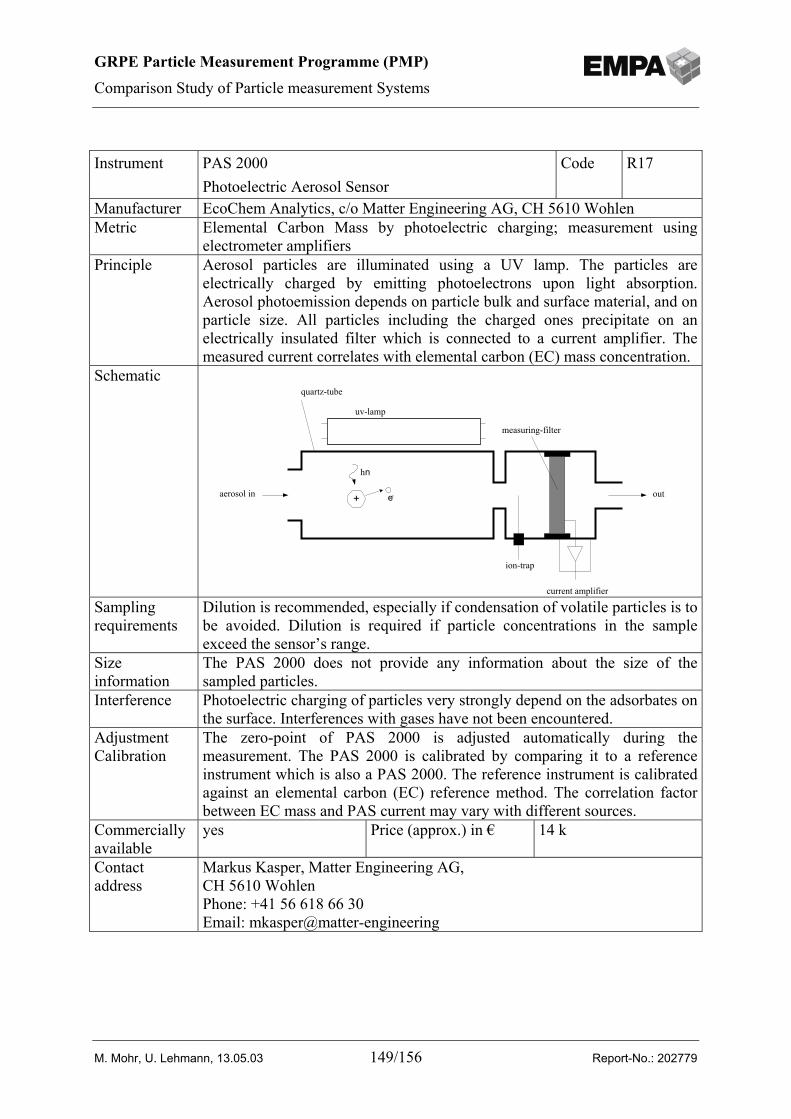
GRPE Particle Measurement Programme (PMP)
Comparison Study of Particle measurement Systems
M. Mohr, U. Lehmann, 13.05.03 149/156 Report-No.: 202779
Instrument PAS 2000Photoelectric Aerosol Sensor
Code R17
Manufacturer EcoChem Analytics, c/o Matter Engineering AG, CH 5610 WohlenMetric Elemental Carbon Mass by photoelectric charging; measurement using
electrometer amplifiersPrinciple Aerosol particles are illuminated using a UV lamp. The particles are
electrically charged by emitting photoelectrons upon light absorption.Aerosol photoemission depends on particle bulk and surface material, and onparticle size. All particles including the charged ones precipitate on anelectrically insulated filter which is connected to a current amplifier. Themeasured current correlates with elemental carbon (EC) mass concentration.
Schematic
ion-trap
uv-lamp
measuring-filter
current amplifier
aerosol in out
quartz-tube
hn
e-+
Samplingrequirements
Dilution is recommended, especially if condensation of volatile particles is tobe avoided. Dilution is required if particle concentrations in the sampleexceed the sensor’s range.
Sizeinformation
The PAS 2000 does not provide any information about the size of thesampled particles.
Interference Photoelectric charging of particles very strongly depend on the adsorbates onthe surface. Interferences with gases have not been encountered.
AdjustmentCalibration
The zero-point of PAS 2000 is adjusted automatically during themeasurement. The PAS 2000 is calibrated by comparing it to a referenceinstrument which is also a PAS 2000. The reference instrument is calibratedagainst an elemental carbon (EC) reference method. The correlation factorbetween EC mass and PAS current may vary with different sources.
Commerciallyavailable
yes Price (approx.) in € 14 k
Contactaddress
Markus Kasper, Matter Engineering AG,CH 5610 WohlenPhone: +41 56 618 66 30Email: mkasper@matter-engineering
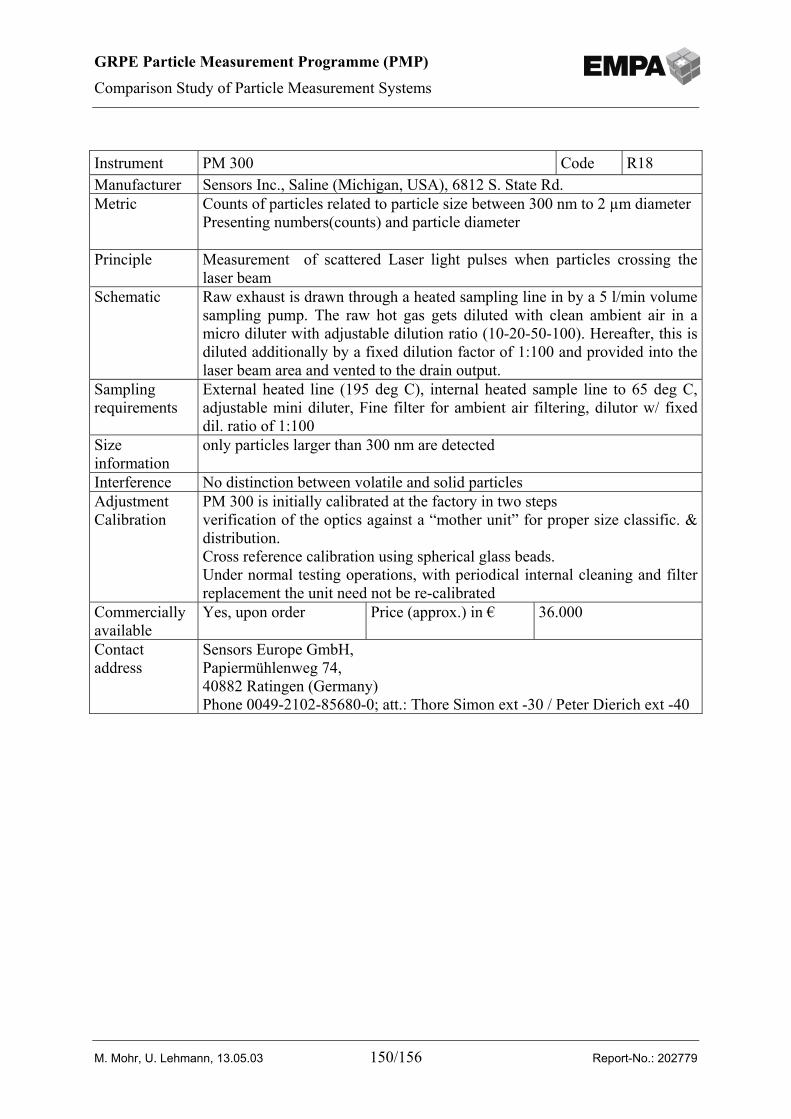
GRPE Particle Measurement Programme (PMP)
Comparison Study of Particle Measurement Systems
M. Mohr, U. Lehmann, 13.05.03 150/156 Report-No.: 202779
Instrument PM 300 Code R18Manufacturer Sensors Inc., Saline (Michigan, USA), 6812 S. State Rd.Metric Counts of particles related to particle size between 300 nm to 2 µm diameter
Presenting numbers(counts) and particle diameter
Principle Measurement of scattered Laser light pulses when particles crossing thelaser beam
Schematic Raw exhaust is drawn through a heated sampling line in by a 5 l/min volumesampling pump. The raw hot gas gets diluted with clean ambient air in amicro diluter with adjustable dilution ratio (10-20-50-100). Hereafter, this isdiluted additionally by a fixed dilution factor of 1:100 and provided into thelaser beam area and vented to the drain output.
Samplingrequirements
External heated line (195 deg C), internal heated sample line to 65 deg C,adjustable mini diluter, Fine filter for ambient air filtering, dilutor w/ fixeddil. ratio of 1:100
Sizeinformation
only particles larger than 300 nm are detected
Interference No distinction between volatile and solid particlesAdjustmentCalibration
PM 300 is initially calibrated at the factory in two stepsverification of the optics against a “mother unit” for proper size classific. &distribution.Cross reference calibration using spherical glass beads.Under normal testing operations, with periodical internal cleaning and filterreplacement the unit need not be re-calibrated
Commerciallyavailable
Yes, upon order Price (approx.) in € 36.000
Contactaddress
Sensors Europe GmbH,Papiermühlenweg 74,40882 Ratingen (Germany)Phone 0049-2102-85680-0; att.: Thore Simon ext -30 / Peter Dierich ext -40
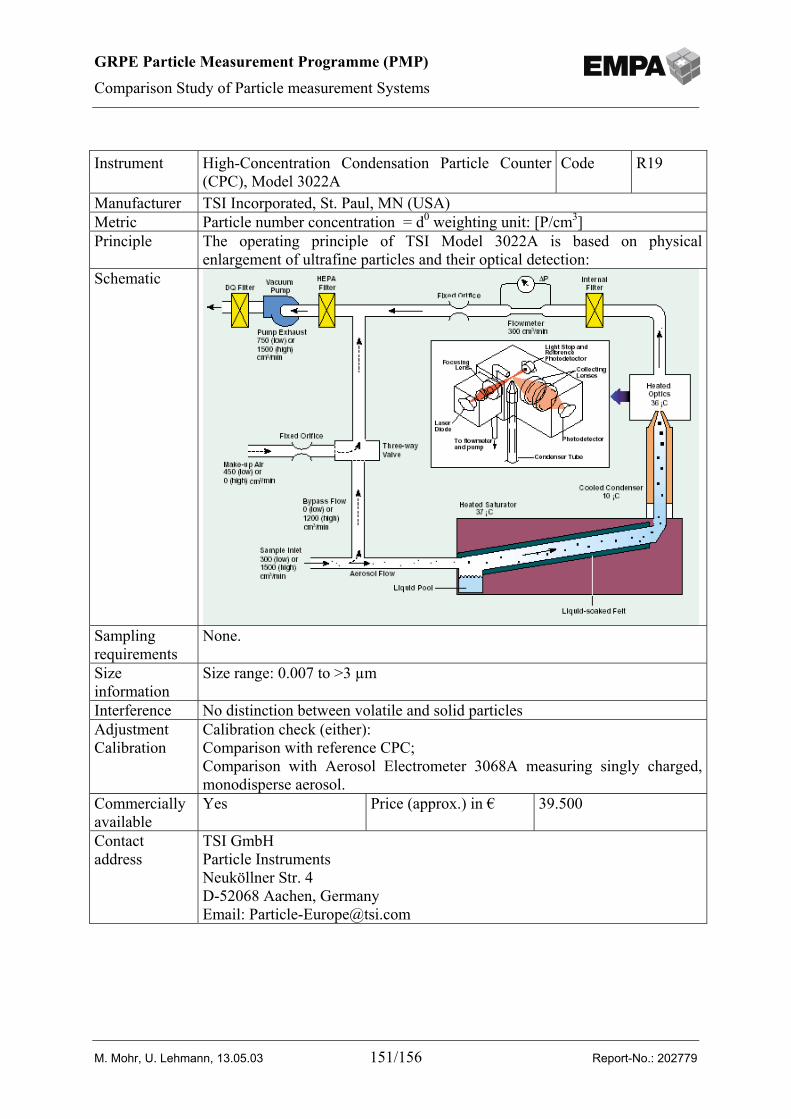
GRPE Particle Measurement Programme (PMP)
Comparison Study of Particle measurement Systems
M. Mohr, U. Lehmann, 13.05.03 151/156 Report-No.: 202779
Instrument High-Concentration Condensation Particle Counter(CPC), Model 3022A
Code R19
Manufacturer TSI Incorporated, St. Paul, MN (USA)Metric Particle number concentration = d0 weighting unit: [P/cm3]Principle The operating principle of TSI Model 3022A is based on physical
enlargement of ultrafine particles and their optical detection:Schematic
Samplingrequirements
None.
Sizeinformation
Size range: 0.007 to >3 µm
Interference No distinction between volatile and solid particlesAdjustmentCalibration
Calibration check (either):Comparison with reference CPC;Comparison with Aerosol Electrometer 3068A measuring singly charged,monodisperse aerosol.
Commerciallyavailable
Yes Price (approx.) in € 39.500
Contactaddress
TSI GmbHParticle InstrumentsNeuköllner Str. 4D-52068 Aachen, GermanyEmail: [email protected]
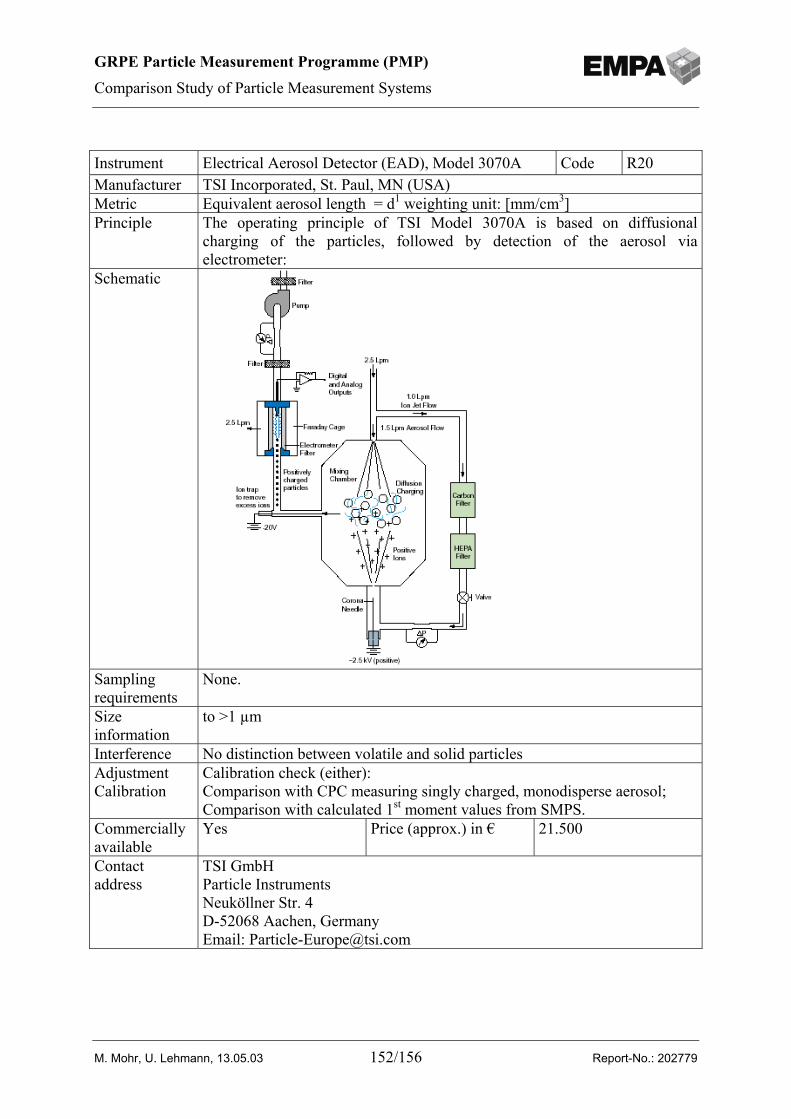
GRPE Particle Measurement Programme (PMP)
Comparison Study of Particle Measurement Systems
M. Mohr, U. Lehmann, 13.05.03 152/156 Report-No.: 202779
Instrument Electrical Aerosol Detector (EAD), Model 3070A Code R20Manufacturer TSI Incorporated, St. Paul, MN (USA)Metric Equivalent aerosol length = d1 weighting unit: [mm/cm3]Principle The operating principle of TSI Model 3070A is based on diffusional
charging of the particles, followed by detection of the aerosol viaelectrometer:
Schematic
Samplingrequirements
None.
Sizeinformation
to >1 µm
Interference No distinction between volatile and solid particlesAdjustmentCalibration
Calibration check (either):Comparison with CPC measuring singly charged, monodisperse aerosol;Comparison with calculated 1st moment values from SMPS.
Commerciallyavailable
Yes Price (approx.) in € 21.500
Contactaddress
TSI GmbHParticle InstrumentsNeuköllner Str. 4D-52068 Aachen, GermanyEmail: [email protected]
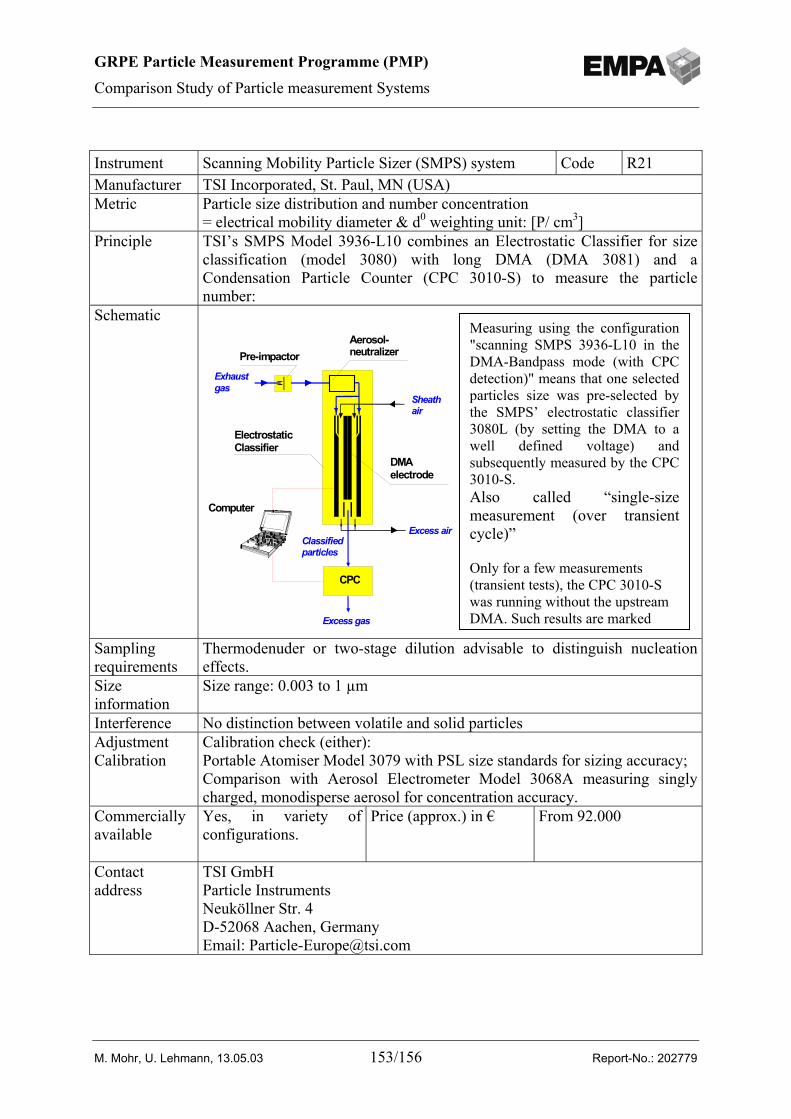
GRPE Particle Measurement Programme (PMP)
Comparison Study of Particle measurement Systems
M. Mohr, U. Lehmann, 13.05.03 153/156 Report-No.: 202779
Instrument Scanning Mobility Particle Sizer (SMPS) system Code R21Manufacturer TSI Incorporated, St. Paul, MN (USA)Metric Particle size distribution and number concentration
= electrical mobility diameter & d0 weighting unit: [P/ cm3]Principle TSI’s SMPS Model 3936-L10 combines an Electrostatic Classifier for size
classification (model 3080) with long DMA (DMA 3081) and aCondensation Particle Counter (CPC 3010-S) to measure the particlenumber:
Schematic
Sheathair
Excess gas
Aerosol-neutralizer
CPC
Exhaust gas
Pre-impactor
Computer
Excess air Classifiedparticles
DMA electrode
Electrostatic Classifier
Samplingrequirements
Thermodenuder or two-stage dilution advisable to distinguish nucleationeffects.
Sizeinformation
Size range: 0.003 to 1 µm
Interference No distinction between volatile and solid particlesAdjustmentCalibration
Calibration check (either):Portable Atomiser Model 3079 with PSL size standards for sizing accuracy;Comparison with Aerosol Electrometer Model 3068A measuring singlycharged, monodisperse aerosol for concentration accuracy.
Commerciallyavailable
Yes, in variety ofconfigurations.
Price (approx.) in € From 92.000
Contactaddress
TSI GmbHParticle InstrumentsNeuköllner Str. 4D-52068 Aachen, GermanyEmail: [email protected]
Measuring using the configuration"scanning SMPS 3936-L10 in theDMA-Bandpass mode (with CPCdetection)" means that one selectedparticles size was pre-selected bythe SMPS’ electrostatic classifier3080L (by setting the DMA to awell defined voltage) andsubsequently measured by the CPC3010-S.Also called “single-sizemeasurement (over transientcycle)”
Only for a few measurements(transient tests), the CPC 3010-Swas running without the upstreamDMA. Such results are marked
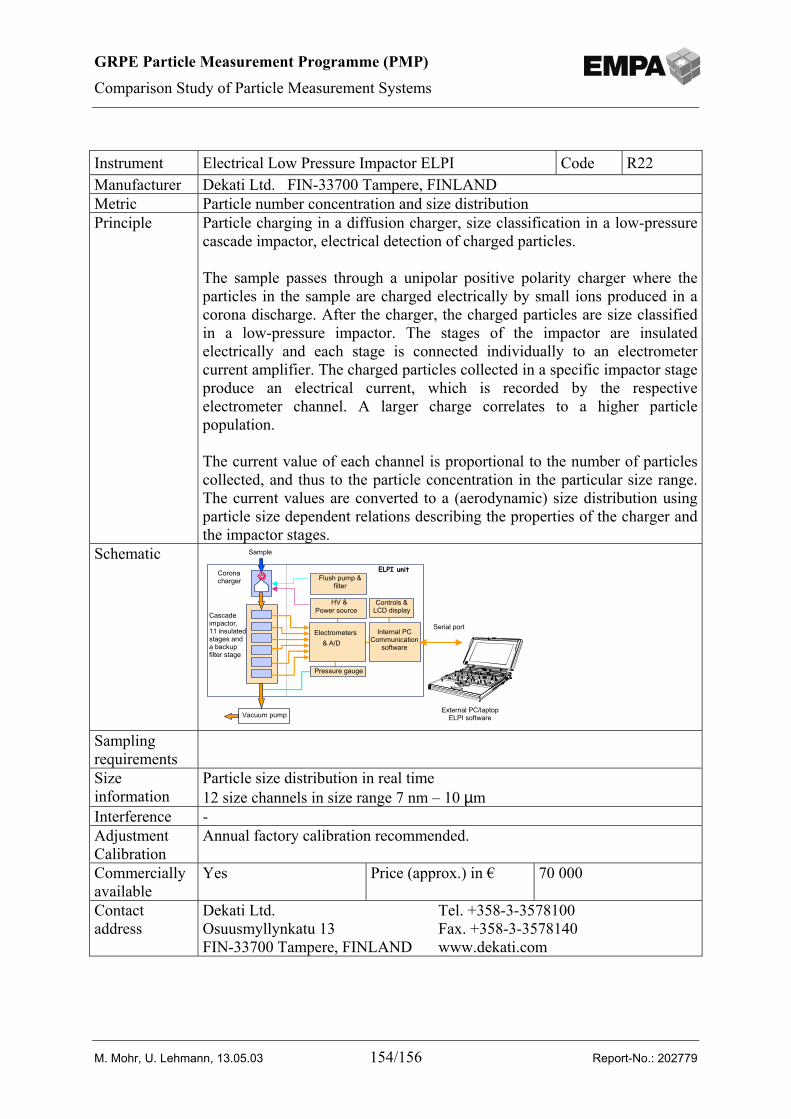
GRPE Particle Measurement Programme (PMP)
Comparison Study of Particle Measurement Systems
M. Mohr, U. Lehmann, 13.05.03 154/156 Report-No.: 202779
Instrument Electrical Low Pressure Impactor ELPI Code R22Manufacturer Dekati Ltd. FIN-33700 Tampere, FINLANDMetric Particle number concentration and size distributionPrinciple Particle charging in a diffusion charger, size classification in a low-pressure
cascade impactor, electrical detection of charged particles.
The sample passes through a unipolar positive polarity charger where theparticles in the sample are charged electrically by small ions produced in acorona discharge. After the charger, the charged particles are size classifiedin a low-pressure impactor. The stages of the impactor are insulatedelectrically and each stage is connected individually to an electrometercurrent amplifier. The charged particles collected in a specific impactor stageproduce an electrical current, which is recorded by the respectiveelectrometer channel. A larger charge correlates to a higher particlepopulation.
The current value of each channel is proportional to the number of particlescollected, and thus to the particle concentration in the particular size range.The current values are converted to a (aerodynamic) size distribution usingparticle size dependent relations describing the properties of the charger andthe impactor stages.
Schematic
Corona charger
External PC/laptop ELPI software
Electrometers & A/D
ELPI unit
Controls & LCD display
Cascade impactor, 11 insulated stages and a backup filter stage
Vacuum pump
HV &Power source
Serial port
Flush pump & filter
Internal PC Communication
software
Pressure gauge
Sample
SamplingrequirementsSizeinformation
Particle size distribution in real time12 size channels in size range 7 nm – 10 µm
Interference -AdjustmentCalibration
Annual factory calibration recommended.
Commerciallyavailable
Yes Price (approx.) in € 70 000
Contactaddress
Dekati Ltd. Tel. +358-3-3578100Osuusmyllynkatu 13 Fax. +358-3-3578140FIN-33700 Tampere, FINLAND www.dekati.com
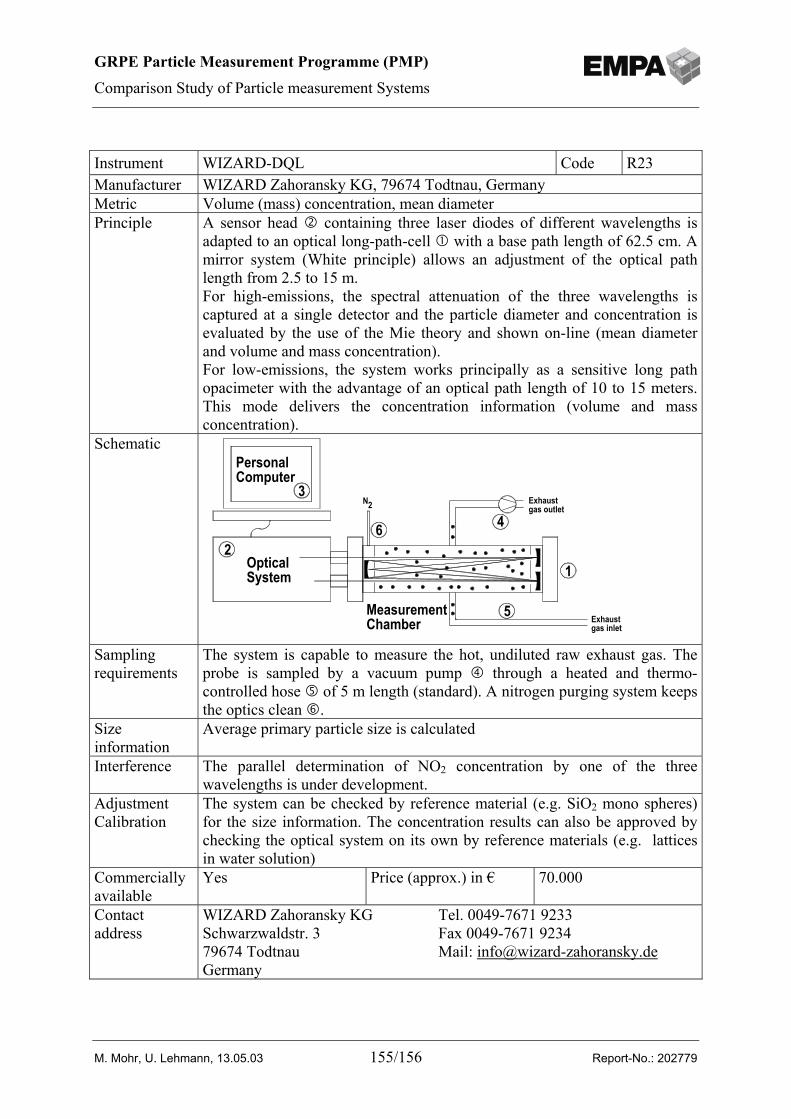
GRPE Particle Measurement Programme (PMP)
Comparison Study of Particle measurement Systems
M. Mohr, U. Lehmann, 13.05.03 155/156 Report-No.: 202779
Instrument WIZARD-DQL Code R23Manufacturer WIZARD Zahoransky KG, 79674 Todtnau, GermanyMetric Volume (mass) concentration, mean diameterPrinciple A sensor head containing three laser diodes of different wavelengths is
adapted to an optical long-path-cell with a base path length of 62.5 cm. Amirror system (White principle) allows an adjustment of the optical pathlength from 2.5 to 15 m.For high-emissions, the spectral attenuation of the three wavelengths iscaptured at a single detector and the particle diameter and concentration isevaluated by the use of the Mie theory and shown on-line (mean diameterand volume and mass concentration).For low-emissions, the system works principally as a sensitive long pathopacimeter with the advantage of an optical path length of 10 to 15 meters.This mode delivers the concentration information (volume and massconcentration).
Schematic
Exhaustgas outlet
Exhaust gas inlet
N
PersonalComputer
3
OpticalSystem
MeasurementChamber
6
2
5
4
12
Samplingrequirements
The system is capable to measure the hot, undiluted raw exhaust gas. Theprobe is sampled by a vacuum pump through a heated and thermo-controlled hose of 5 m length (standard). A nitrogen purging system keepsthe optics clean .
Sizeinformation
Average primary particle size is calculated
Interference The parallel determination of NO2 concentration by one of the threewavelengths is under development.
AdjustmentCalibration
The system can be checked by reference material (e.g. SiO2 mono spheres)for the size information. The concentration results can also be approved bychecking the optical system on its own by reference materials (e.g. latticesin water solution)
Commerciallyavailable
Yes Price (approx.) in € 70.000
Contactaddress
WIZARD Zahoransky KG Tel. 0049-7671 9233Schwarzwaldstr. 3 Fax 0049-7671 923479674 Todtnau Mail: [email protected]
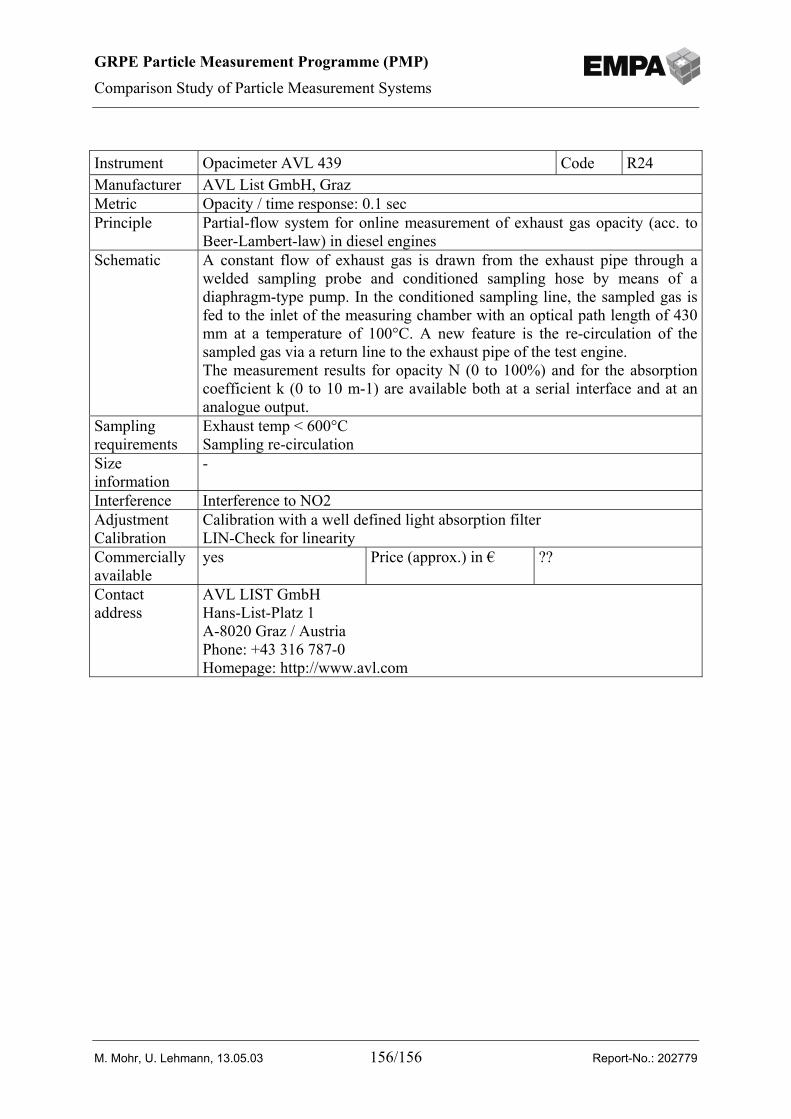
GRPE Particle Measurement Programme (PMP)
Comparison Study of Particle Measurement Systems
M. Mohr, U. Lehmann, 13.05.03 156/156 Report-No.: 202779
Instrument Opacimeter AVL 439 Code R24Manufacturer AVL List GmbH, GrazMetric Opacity / time response: 0.1 secPrinciple Partial-flow system for online measurement of exhaust gas opacity (acc. to
Beer-Lambert-law) in diesel enginesSchematic A constant flow of exhaust gas is drawn from the exhaust pipe through a
welded sampling probe and conditioned sampling hose by means of adiaphragm-type pump. In the conditioned sampling line, the sampled gas isfed to the inlet of the measuring chamber with an optical path length of 430mm at a temperature of 100°C. A new feature is the re-circulation of thesampled gas via a return line to the exhaust pipe of the test engine.The measurement results for opacity N (0 to 100%) and for the absorptioncoefficient k (0 to 10 m-1) are available both at a serial interface and at ananalogue output.
Samplingrequirements
Exhaust temp < 600°CSampling re-circulation
Sizeinformation
-
Interference Interference to NO2AdjustmentCalibration
Calibration with a well defined light absorption filterLIN-Check for linearity
Commerciallyavailable
yes Price (approx.) in € ??
Contactaddress
AVL LIST GmbHHans-List-Platz 1A-8020 Graz / AustriaPhone: +43 316 787-0Homepage: http://www.avl.com