Measurement of balance in computer posturography: Comparison of methods—A brief review
59
Measurement of Balance in Computer Posturography: Comparison of Methods A Brief Review Hans Chaudhry, Ph.D., Research Professor 1,4 ; Bruce Bukiet, Ph.D., Associate Professor 2 Zhiming Ji, Ph.D., Associate Professor 3 , Thomas Findley, M.D., Ph.D., Co- Director 4,1 1. Department of Biomedical Engineering, New Jersey Institute of Technology, Newark, New Jersey 07102, USA. 2. Department of Mathematical Sciences, Center for Applied Mathematics and Statistics, New Jersey Institute of Technology, Newark, New Jersey 07102, USA. 3. Department of Mechanical Engineering, New Jersey Institute of Technology, Newark, New Jersey 07102, USA. 4. Center for Healthcare Knowledge Management, VA Medical Center, East Orange, NJ 07018, USA. 1
-
Upload
independent -
Category
Documents
-
view
2 -
download
0
Transcript of Measurement of balance in computer posturography: Comparison of methods—A brief review

Measurement of Balance in Computer Posturography: Comparisonof Methods
A Brief Review
Hans Chaudhry, Ph.D., Research Professor1,4; Bruce Bukiet,
Ph.D., Associate Professor 2 Zhiming Ji, Ph.D.,
Associate Professor 3, Thomas Findley, M.D., Ph.D., Co-
Director 4,1
1. Department of Biomedical Engineering, New Jersey
Institute of Technology, Newark, New Jersey 07102, USA.
2. Department of Mathematical Sciences, Center for Applied
Mathematics and Statistics, New Jersey Institute of
Technology, Newark, New Jersey 07102, USA.
3. Department of Mechanical Engineering, New Jersey
Institute of Technology, Newark, New Jersey 07102, USA.
4. Center for Healthcare Knowledge Management, VA Medical
Center, East Orange, NJ 07018, USA.
1

Corresponding author. Bruce Bukiet, Email: [email protected]., Phone 973-
596-8392, Fax 973-596-5591
This is the authors prepublication version. The final text is available at the Journal of Bodywork and Movement Therapies http://www.bodyworkmovementtherapies.com/
ABSTRACT
Some symptoms related to disequilibrium may not be detected
by a clinical exam. Therefore, objective study is important
in assessing balance. In this paper, methods to measure
balance in computer posturography are compared. Center of
pressure (COP) displacement, equilibrium score (ES) and
postural stability index (PSI), the main measures of
assessing balance are described and their merits and
disadvantages are discussed. Clinicians should apply that
measure which suits the specific strategies in a specific
situation.
2

Measuring devices such as Force plate, Balance Master and
Equitest are also discussed. Although the Balance Master
and Equitest devices are more costly compared to the force
plate only, they are more useful for assessing balance
relevant to daily life activities that might result in
falls.
3

INTRODUCTION
Posture is the orientation of any body segment relative
to the gravitational vector (Winter 1995). Postural
stability / Balance is an essential component in assessing
the efficacy of interventions for improving balance (Berg et
al 1992, Horak 1997). Balance is a generic term that means
both postural steadiness (static) and postural stability
(dynamic). “Postural steadiness is the characterization of
postural sway during quiet standing. The terms posturometry,
posturography, stabilometry, and stabilography are usually
associated with postural steadiness” (Prieto et al 1993).
“Postural stability, also referred to as dynamic
posturography, is the postural response to an external or
volitional perturbation of the postural control system”
(Johansson et al 1991). Earlier methods for evaluating
balance are summarized in (Terekhov 1976). Postural
steadiness can be determined directly by evaluating head,
limb or trunk movements with ultrasonic distance sensors
4

embedded on the head (Yoshizawa et al 1991). Balance is also
measured by assessing motor control function during sitting,
standing and /or walking (Tyson & Desouza 2003).
Clinicians have available only a limited number of
clinical tests to quantify balance, such as seconds standing
on one leg or performance on multiple observable tasks.
Equipment which has previously been used primarily in a
laboratory with biomedical engineering staff, is now more
widely available for use in clinical settings. More
clinicians will have access to this equipment, or to results
done in more specialized balance clinic settings. However,
there is a plethora of laboratory measures which can be
confusing to the clinician. In this paper, the authors
focus on methods of computerized dynamic posturography,
since this has become an important tool for assessing
balance in clinical settings (Fabio et al 1998, Johansson et
al 2001, Piitrola & Era 2006). As will be explained in the
Methods section, common instrumentation includes force
plates, BalanceMaster, and Equitest. These three instruments
5

measure ground reaction forces. From these ground reaction
forces, one can compute center of pressure (COP)
displacements, sway of the center of mass (COM), equilibrium
score (ES), postural stability index (PSI) and other
quantities. A detailed description of how ES and PSI are
computed will be provided in the Methods section.
A key test in the Equitest (2001) device and Balance
Master (2001) computerized dynamic posturography systems,
the Sensory Organization Test (SOT) provides information
about the integration of the visual, proprioceptive, and
vestibular components of balance which leads to an outcome
measure called the equilibrium score (ES), reflecting the
overall coordination of these systems to maintain standing
posture (Chaudhry et al 2004). The Equitest System consists
of a support surface (platform) and a visual surround. The
Equitest device performs a sensory organization test (SOT)
with six conditions: conditions 1, 2 and 3 with the platform
fixed and conditions 4, 5, and 6 with the platform moving.
When the platform moves, it is referenced to the subject’s
6

sway such that as the individual leans forward, the platform
tilts forward to minimize the degree of changed
proprioceptive input from the self-generated sway. This
platform adjustment is called “sway-referenced motion”.
Similarly, in conditions where the visual surround moves,
the surround is referenced to the person’s sway so as to
minimize the ability to obtain visually relevant information
about how far the individual is from the vertical. In other
conditions, visual input is removed instead by asking the
subject to close his or her eyes. Participants are asked to
stand quietly and steadily for 3 trials in each of the
following 6 conditions: (1) eyes open, surround and platform
stable, (2) eyes closed, surround and platform stable, (3)
eyes open, sway-referenced surround, (4) eyes open, sway-
referenced platform, (5) eyes closed, sway-referenced
platform, and (6) eyes open, sway-referenced surround and
platform.
EQUIPMENT USED TO MEASURE BALANCE
7

Force Plate only
As the name implies, force plate is a device that
measures ground reaction forces as the person stands quietly
in conditions (1, 2) only, as described above and is used to
determine the COP (center of pressure) displacement . It is
then used to obtain sway of the COM (center of mass) which
can be used to determine the ES (equilibrium score). Its
estimated cost is $6500.
Balance Master
This device consists of a movable support surface
(force plate) and a visual surround with a harness to
prevent fall during testing. Its estimated cost is $50,000.
It can determine the COP displacement as well as the sway of
COM in conditions 1,2,4 and 5. It cannot be used for
conditions 3 and 6 since the surround cannot move in a sway-
referenced manner. It can be used to determine the ES
(equilibrium score) and PSI (Postural Stability Index).
Equitest (See Figure 1)
8

This device also consists of a movable support surface
(force plate) and a visual surround, which can move in a
sway-referenced manner, along with a harness to prevent fall
during testing. Its estimated cost is $100,000. It can
determine the COP displacement as well as the sway of COM.
in conditions 1-6. It can be used to determine the ES
(equilibrium score) and PSI (Postural Stability Index).
Insert Figure1 here
METHODS TO MEASURE BALANCE
1. Center of Pressure ( COP) :
The COP is the location of the vertical ground reaction
vector on the force platform (Winter 1995). This is
different from the vertical projection of the center of
gravity (COG). Under static conditions COP coincides with
the COG projection. COP is usually measured by the force
9

plate in conditions 1 and 2 only. However, it can also be
measured in all six conditions of the SOT from the Equitest
device and in conditions 1, 2, 4 and 5 from the
BalanceMaster. Since the COP reflects the movement of the
body to keep the COG over the base of support, its
displacement from its equilibrium position is generally
greater in magnitude than the displacement of the COG
(Prieto et al 1993). The controlled variable, i.e. COG/ COM,
is seen to be virtually in phase with the controlling
variable, COP (Winter 2003). In both AP (anterior -
posterior) and ML (medial - lateral) directions, a simple
inverted pendulum model (Winter et al 1998) for quiet
standing showed that:
Here is the total body moment of inertia about the
ankles, W is the body weight and h is height of the COM
above the ankles.
10

A dual force plate is used to locate the position of
the COP for the left foot and the right foot separately. The
combined COP can be determined from the COP of each foot and
the weight supported by each foot. When one force plate is
used, only the combined COP is available. It has been
demonstrated (Clair & Riach 1996) that the test duration on
the force plate is important for the reliability and
validity of stability measures based on COP, with longer
duration tests providing more valid results. Doyle et al
(2007) reported that COP measures reached acceptable levels
of reliability (for displacement, average velocity and 95%
confidence ellipse area) with five 60s trials. Postural sway
has been found to increase as a result of narrowing the base
of the support (Amiridis et al 2003).
Six different conditions were used by Melzer &
Kaplanski (2004) to assess COP measurements. Subjects were
asked to stand still on a single force plate in the
following conditions: (1) wide stance, (1a) eyes open, (1b)
11

eyes closed , (1c) eyes open standing on foam and (2) same
as in (1a-1c) in narrow stance (heals and toes touching).
Six different force-platform-based balance instruments
have been used by different researchers to measure postural
balance (Piirtola & Era 2006). The references to the papers
by these researchers are given in (Piirtola & Era 2006). All
these instruments measure COP displacement.
Movement of the COP in quiet standing may be influenced
by internal dynamics associated with the respiratory (Jeong
1991) and cardiovascular systems (Goldie et al 1989). “COP
measures of postural steadiness can be classified as time
domain measures of distance, area or velocity; and frequency
– domain measures of spectral magnitude or distribution”
(Prieto et al 1993). “Time domain measures include
characterization of the COP path, average distance from its
geometric mean, mean velocity of the COP, total distance
traveled by the COP, the range of the COP, the enclosed area
as a percentage of the base of support area, and the
confidence ellipse area. Frequency –domain measures are
12

usually calculated from the power spectral density” (Prieto
et al 1993).
A stability criterion was proposed to assess the
standing condition of a subject from the COP measurements
(Popovic et al 2000). In this criterion, four stability
zones, i.e., high preference, low preference, undesirable
and unstable zones are identified. The boundaries of
stability zones are modeled using ellipses to capture the
two dimensional form and orientation of the stability zone.
However, in practice it is difficult for physicians to
identify these stability zones to assess postural stability
of a patient and assign a quantitative measure of the
balance. In addition, this technique does not assign a
single value to assess the stability of a subject. It is
preferable that a single number (as will be seen for ES and
PSI) representing postural stability / instability be
assigned to a subject before and after a specific
intervention. From the before and after values, the
13

clinician can quickly determine the efficacy of the
intervention.
It is also not clear from the COP studies as to which
parameter(s), i.e. area, velocity, total distance, or
frequency should be used to quantitatively assess balance.
However, COP displacements can be used to compare balance
between two different groups, such as the young and the
elderly, fallers and non- fallers. Those having higher
magnitudes of any of the above parameters are considered
less stable.
In the study done by Piirtola & Era (2006),
mediolateral (ML) movements of the COP during normal
standing, the mean amplitude of the ML movements of the COP
and the root-mean square value of the ML displacement of the
COP, all with eyes open and closed were the indicators that
showed significant association with future falls. But the
strength of association / correlation is not evaluated in
this study. Similarly, the findings by Benjuya & Kaplanski
14

(2004) show an increase in ML sway in fallers in older
people for narrow base stance studies.
The authors of the current article note that although
poor postural balance is one of the major risk factors for
falling and can be measured by ES and PSI, the method
usually used for prediction of falls is based upon the COP
displacement in conditions 1 and 2 only.
Comments on COP measurements of area and distance (excursion)
In a recent study by the authors of this article
regarding COP trajectories (Figure 2) of a subject during
quiet standing in different conditions and trials, it was
found that there is large variation in the area and
excursion length in three trials for the same test
condition. This does not allow one to arrive at a specific
conclusion about assessing the balance using COP
measurements.
Examples of the plots of COP trajectory are shown
below. In these plots, the calculated values of their
15

corresponding 95 percent confidence ellipse area (Prieto et
al 1996) and total excursion are also displayed, where “A”
is for the corresponding 95 percent confidence ellipse area
in cm2 and “L” is for the total excursion of the COP in cm.
Trajectory 11 means trajectory for condition 1 and trial 1.
Similarly, trajectory 12 and 13 mean trajectory for
condition 1 and trials 2 and 3, respectively. AP means
Anterior-posterior, and ML means Medial –lateral. The values
of area and excursion for conditions 1, 2 and 3 of the same
subject are summarized in the Table 1.
Insert Figure 2 about here
Insert Table 1 about here
2. Equilibrium score (ES)
The force plate, the BalanceMaster and the Equitest
are used to calculate the ES in conditions 1 and 2; 1, 2, 4
and 5; and conditions 1-6, respectively. ES for each trial
16

in each condition is calculated according to a simple
formula:
ES = [12.5 - [Thetamax (ant) – Thetamax (post)]] / 12.5
(1)
where, Theta (ant) is the maximum anterior sway angle in
degrees during a trial; Theta (pos) is the maximum posterior
sway angle in degrees during the same trial; 12.5 is the
limit of sway in degrees in the sagittal plane for normal
stance; and 12.5 degrees is assumed to be the limit of
stability for a normal individual (Balance Master 2001 PO-5,
Appendix, 6).
No movement of the subject results in a perfect score
of ‘100’. If the subject falls or the value of the ES is
negative, the subject receives a score of ‘0’. Thus, the
ES ranges between 0 and 100.The Composite ES is evaluated as
a weighted average of the scores from the six conditions of
the SOT of a subject, where each condition consists of three
identical, 20 second trials with force data sampled at 100
17

Hz. The composite ES in three trials is evaluated according
to the formula:
.
where C.E.S is the composite equilibrium score, ES(1) is the
average of ES in all three trials in condition 1. Similarly
ES(2) is the average of ES in all the three trials, in
condition 2 and so on. Note that the ES in the most
challenging conditions (3-6) is given three times the weight
of conditions 1, and 2.
Ambiguities/Disadvantages of ES
Ambiguities/disadvantages of ES include the following
(Chaudhry et al 2004):
1. For some subjects, the limits of stability may vary
significantly from the age- and height-matched norms, i.e.,
the limit of sway may be more or less than 12.5 degrees, say
11 or 14 degrees. Thus, the assumptions about the overall
18

magnitude of the limits of stability can introduce errors
into the ES calculation for individuals.
2. It is also known from experimental results (Balance
Master 2001, PO-3, Appendix, 7) that functional stability
limits for the average adult subject are approximately 7
degrees of anterior sway and 5 degrees of posterior sway.
Thus, there is an asymmetry in the usual limit of stability
that is disregarded in the ES calculation.
3. Many combinations of anterior and posterior sway across
the same overall range can give the same ES. For example,
the overall limit of stability of 6 degrees can be made up
of the many combinations, (e.g., 6 degrees of anterior sway
and 0 degree of posterior sway; or 3 degrees of anterior
sway and –3 degrees of posterior sway, etc.). These
combinations would result in the same composite ES. Yet, a
subject with a +6/0 degrees of sway combination, has a
greater risk of falling than a subject with a +3/-3.
combination, since the former is close to the functional
stability limit on the anterior side, and is therefore
19

indicative of greater risk of fall on the anterior side,
whereas the second combination is not close to the
functional stability limit on either side, and therefore
indicates a smaller risk of fall either on the anterior or
the posterior side. Therefore, the ES which would be
identical in these two situations, can be insensitive to
functionally relevant differences in postural stability.
4. To assess postural stability, the formula for a stability
measure should include important biomechanical information,
such as mass and height of the subject and ankle torque
produced to maintain stability. These are absent in the
formula for ES .
5. The ES considers only the two extreme values of the sway
angle in a given trial, not the complete sway history (2000
data points) in a trial of 20 seconds.
6. It was reported by Chaudhry et al (2005) that the
composite ES score increases as composite ankle stiffness
increases (Fig. 3) This is counter intuitive.
20

7. It was also demonstrated by Chaudhry et al (2004), by
performing experiments on 30 subjects, that as the average
sway angle, which is an important facet of balance
(Lee et al 2001, Stalenhoef et al 2002, Stel et al 2003),
increases, the composite ES also increases (Fig. 4). This is
also counter intuitive.
8. The effect of the shear force as well as the mass and
rotation of the force plate are ignored in the formula for
machine reported ES.
Insert Fig. 3 and Fig. 4 here
In order to overcome the above ambiguities, Chaudhry et
al (2004) devised a new formula for assessing stability /
balance, known as PSI (Postural Stability Index) that
reflects balance or postural stability. PSI incorporates a
broader range of biomechanical aspects of upright stance.
PSI is described in the following section.
3. Postural Stability Index (PSI)
21

PSI overcomes the ambiguities in ES as described above.
The BalanceMaster and the Equitest devices are used to
evaluate PSI in conditions 1, 2, 4 and 5 and 1-6, of the
SOT, respectively.
To assess postural stability, the effort (stabilizing
torque) needed to maintain stability should be considered
(Chaudhry et al 2004). The total value of the stabilizing
torque is considered to counteract the destabilizing torque
due to gravity in quiet standing. PSI is defined as the
percentage ratio of the total stabilizing ankle torque, ,
and the total destabilizing torque due to gravity (obtained
from the product of the weight, height and the sine of the
sway angle) during quiet standing in any of the six
conditions (see Figure 3). Since the sway angle is typically
small, the approximation is traditionally applied to
simplify the calculations. A value of 100 indicates perfect
stability. The amount of instability is reflected in how
much the PSI is less than 100, and the range of PSI is 0
to100. In mathematical terms, PSI is expressed as
22

(2)
In equation (2), M is the mass of the subject, g is
acceleration due to gravity, h is 0.55 times the height of
the subject (the average distance of COM from the platform,
based on anthropometric data), is the stabilizing
torque at the ankle at any time t., the vertical bars
indicate the absolute value, S is the summation of the
values inside the bars, and q (t) is the sway angle of COM
in radians at any time t during the test (Ji et al 2004).
In equation (2), when the numerator and the denominator are
equal, the PSI is 100%, and the subject is perfectly stable.
When the numerator is greater than the denominator, the PSI
is calculated as the ratio of the denominator to the
numerator. Equation (2) can be used to independently
calculate a PSI value for each condition. The composite PSI
23

is evaluated in the same way as the composite ES described
above.
In this model, the sway angle q and the torque t at
2000 data points (20 seconds at 100 Hz) are given by:
(3)
and
(4)
The detailed derivation of these equations is given in Ji et
al (2004). The calculated sway angle q of COM has been
validated by comparing the theoretical curve for sway with
the experimental one (Ji et al 2004). Thus, the torque t
given by (4) is also valid.
It is noted that the above formula for evaluating PSI
is based upon using an ankle strategy, i.e., hip muscles are
24

ignored. It is noted that “normal individuals move primarily
about the ankle joints when stable, and shift to hip
movements as they become less stable.” [SmartEquitest
System, page 1]
“Hip movements generate horizontal (shear) forces
against the support surface that are proportional to the
second derivative of the hip joint angle, i.e. the angular
acceleration. During hip movements, the vertical force
position changes only when the hip movement also causes
change in the COG (center of gravity) sway angle.”
[SmartEquitest System,2001, PO-7].
Mok, et al ( 2004) showed that “in normal
adults, postural adjustments in bilateral
stance on a flat surface are generally achieved using an
ankle strategy in which ankle torque maintains the center of
mass(COM) over the base of the support. In this strategy,
muscle activity occurs in a distal to proximal sequence. If
the support surface is short in relation to foot length,
this strategy is replaced by a hip strategy that involves
25

operation of horizontal shear forces from torques at the
hip, rather than shifting the center of vertical foot
pressure by the torques at the ankle. This strategy involves
motion at the trunk and hip, using a proximal – distal
sequence of muscle activation”. They also showed by studying
24 participants with chronic low back pain (LBP) and 24
matched controls that “the hip strategy was reduced with
increased visual dependence in study participants with LBP.
The failure rate was more than 4 times that of the control
in the bilateral standing task on short base with eyes
closed. Analysis of COP motion also showed that they have
inability to initiate and control a hip strategy”.
Postural strategies associated with somatosensory and
vestibular loss have been studied by measuring flexion at
ankle and hip joints [Horak, et.al 1990]. Postural
responses at the ankle and hip have been described in terms
of feedback control gains [Park,et al. 2004]. The torques at
ankle and hip can be studied by using a multi-joint inverted
26

pendulum model [Colobert, et al 2006, Horak & Nashner 1986,
Guihard & Gorce 2002, Rugea et al. 1999].
The parameters involved in equation (2) can be seen in
Figures 3 & 4 below: Note that a (in equation 4) is not
shown in Figure 4 since it is very small. It is the
perpendicular distance from the line through the ankle and
pin joints to the center of mass of the foot.
Insert Figure 5 about here
Insert Figuer 6 about here
4. Total angular momentum of all body segments.
In studying the postural control of young and elderly
adults when stance is perturbed, Gu et al (1996) used the
criterion that “peak values of total body angular momentum
of all body segments about the ankles are measures of
instability. The rate at which consecutive peak values
27
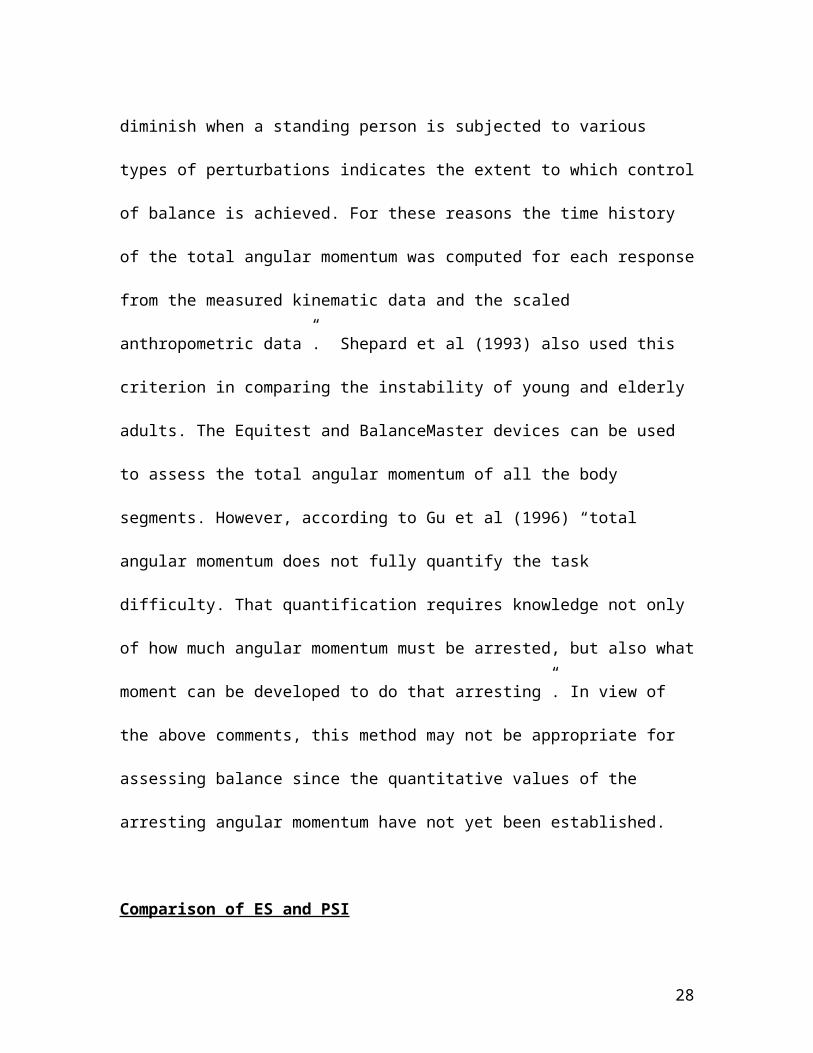
diminish when a standing person is subjected to various
types of perturbations indicates the extent to which control
of balance is achieved. For these reasons the time history
of the total angular momentum was computed for each response
from the measured kinematic data and the scaled
anthropometric data”. Shepard et al (1993) also used this
criterion in comparing the instability of young and elderly
adults. The Equitest and BalanceMaster devices can be used
to assess the total angular momentum of all the body
segments. However, according to Gu et al (1996) “total
angular momentum does not fully quantify the task
difficulty. That quantification requires knowledge not only
of how much angular momentum must be arrested, but also what
moment can be developed to do that arresting”. In view of
the above comments, this method may not be appropriate for
assessing balance since the quantitative values of the
arresting angular momentum have not yet been established.
Comparison of ES and PSI
28
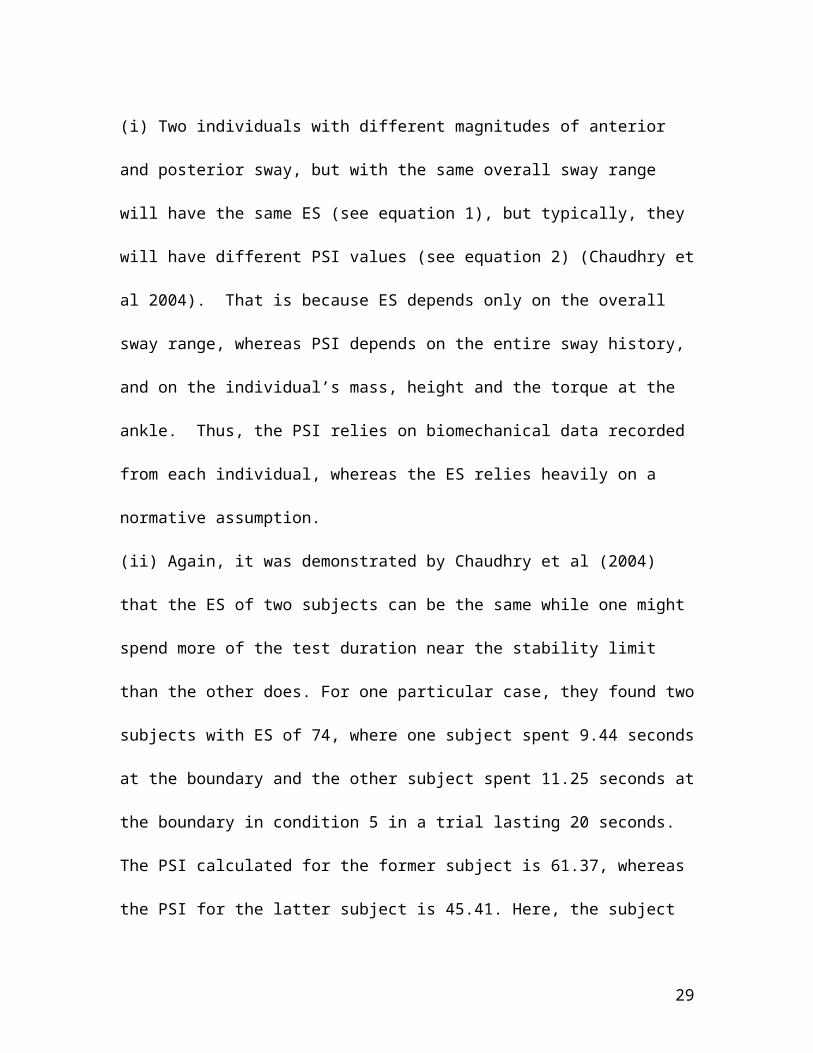
(i) Two individuals with different magnitudes of anterior
and posterior sway, but with the same overall sway range
will have the same ES (see equation 1), but typically, they
will have different PSI values (see equation 2) (Chaudhry et
al 2004). That is because ES depends only on the overall
sway range, whereas PSI depends on the entire sway history,
and on the individual’s mass, height and the torque at the
ankle. Thus, the PSI relies on biomechanical data recorded
from each individual, whereas the ES relies heavily on a
normative assumption.
(ii) Again, it was demonstrated by Chaudhry et al (2004)
that the ES of two subjects can be the same while one might
spend more of the test duration near the stability limit
than the other does. For one particular case, they found two
subjects with ES of 74, where one subject spent 9.44 seconds
at the boundary and the other subject spent 11.25 seconds at
the boundary in condition 5 in a trial lasting 20 seconds.
The PSI calculated for the former subject is 61.37, whereas
the PSI for the latter subject is 45.41. Here, the subject
29

who spent less time near the stability boundary had higher
PSI, indicating better stability.
With respect to the ambiguities 6 & 7 in ES, mentioned
above, it is demonstrated in Chaudhry et al (2004) and
Chaudhry et al (2005) that:
(iii) Composite PSI decreases as composite ankle stiffness
increases, as expected (Fig. 3), contrary to the results
obtained in ES.
(iv) As the average sway angle, which is an important facet
of balance (Lee et al 2001, Stalenhoef et al 2002, Stel4)
increases, the composite PSI decreases as expected (Fig.4),
contrary to the results obtained in ES.
In view of the above findings, it was concluded that
PSI is a more valid measure of stability than ES. However,
the above formula for PSI is based upon ankle strategy only
(Chaudhry et al 2005).
The software for ES is installed in the BalanceMaster
as well as in Equitest machines to give the ES results
directly from the machines. The software for PSI based upon
30
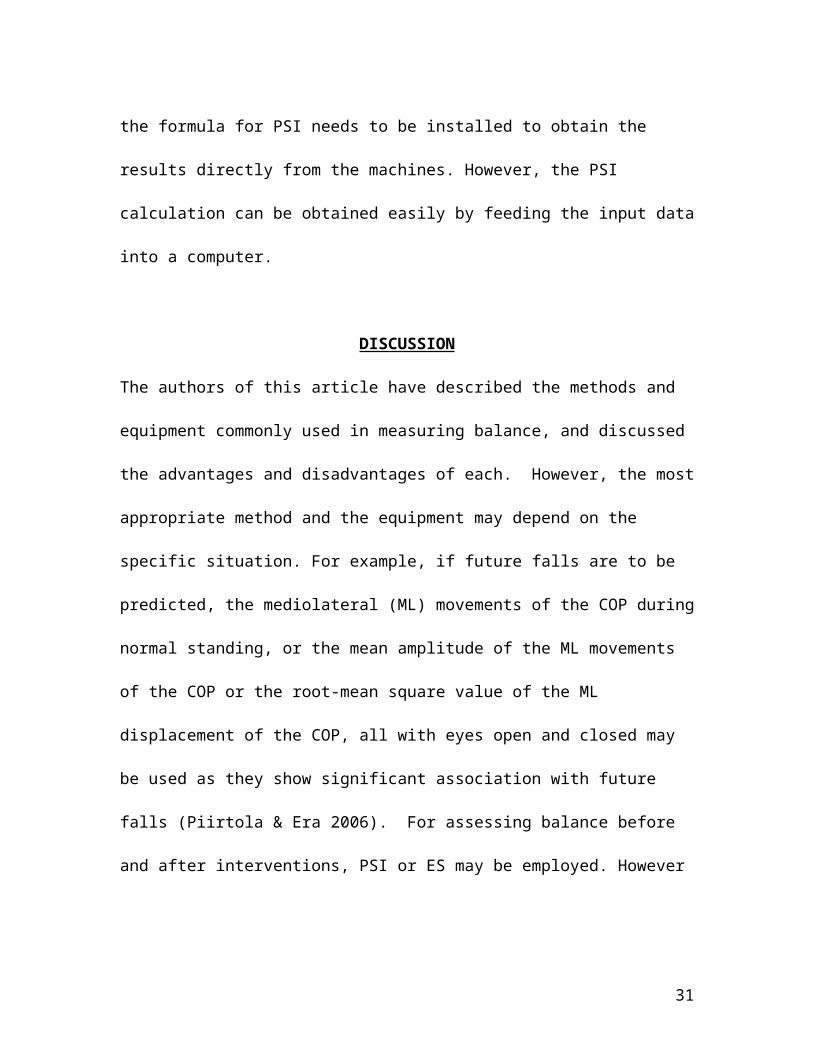
the formula for PSI needs to be installed to obtain the
results directly from the machines. However, the PSI
calculation can be obtained easily by feeding the input data
into a computer.
DISCUSSION
The authors of this article have described the methods and
equipment commonly used in measuring balance, and discussed
the advantages and disadvantages of each. However, the most
appropriate method and the equipment may depend on the
specific situation. For example, if future falls are to be
predicted, the mediolateral (ML) movements of the COP during
normal standing, or the mean amplitude of the ML movements
of the COP or the root-mean square value of the ML
displacement of the COP, all with eyes open and closed may
be used as they show significant association with future
falls (Piirtola & Era 2006). For assessing balance before
and after interventions, PSI or ES may be employed. However
31

PSI may be used in preference to ES due to many ambiguities
in ES as discussed above.
Objective measurements of stability are important since
subjects and clinicians often cannot detect symptoms related
to disequilibrium (Kaufman et al 2006, Sataloff et al 2005).
Kaufman et al (2006) compared subjective and objective
measurements of balance disorders following traumatic brain
injury. They report that “objective measurement (such as SOT
and COM motion) can quantify the patient’s functional
deficits. Therefore objective measurement techniques should
be used to assess the clinical complaints of imbalance for
patients with TBI (Traumatic Brain Injury)”. Sataloff et al
(2005) reported that although ENG caloric testing (for
diagnosing inner eye disease based on eye movements) were
normal in 33 dizzy patients, computerized dynamic
posturography (CDP) showed abnormal disequilibrium in these
patients.
A force plate, although cheaper compared to the
BalanceMaster and the Equitest devices, measures the balance
32

in the ideal conditions 1 and 2 only in quiet standing by
measuring COP displacements. But in daily life activities,
inside and outside the home, one encounters sudden up and
down slopes, stairs, conflicting visual stimuli such as busy
shopping malls, large moving objects, abrupt changes in
smooth and rough ground surfaces, loud noises, etc. The SOT
takes into account many of these situations so that balance
is more realistically assessed by evaluating ES and PSI,
using the BalanceMaster and Equitest devices. Although these
are more costly compared to the force plate, they have
greater applicability.
It has been noted earlier in this paper that it is so
far unclear from COP studies using force plates, as to which
parameter(s), i.e. area, velocity, total distance, or
frequency should be used to assess balance. Also in the
authors’ recent study of COP trajectories of a subject
during quiet standing in different conditions and trials, it
was found that there is large variation of area and
excursion in three trials for the same subject and for the
33

same condition. However, Doyle et al (2007) reported that
COP measures reached acceptable levels of reliability with
five trials of 60s duration for each trial. More research on
the uses of COP needs to be performed to allow researchers
and clinicians to come to definite conclusions about the
preferable COP parameters for assessing balance.
It is observed that most of the models ignore the non-
linear behaviors of viscoelastic loading at the joints in
the free-body diagrams. However, recently Kuczynski and
Ostrowska (2006) used a viscoelastic model to investigate
the effect of viscoelasticity on 37 postmenopausal women
(aged 42-79 years) diagnosed with osteopenia or
osteoporosis. They found that irrespective of age ,
increased ML viscosity was the sole predictor of falls As
people lean forward at the ankle, the calf muscle fibers
paradoxically shorten (Loram 2004); this implies that the
fascial and ligamentous structures must be lengthening even
more than required by the amount of forward lean. While
Loram concludes from his studies that neural control of
34

length of the musculature is important for balance, he
ignores the influence of fascial and other connective
tissues to the total length of the muscular complexes.
Furthermore, Huijing et al (2007) has shown substantial
extramuscular myofascial force transmission of up to 40% of
the total muscle force generated, between both synergistic
and antagonistic muscles, which is particularly important at
lower firing frequencies (Meijer et al 2006). These recent
research findings suggest that the fascial system may also
have an important bearing on balance and that this system
also needs investigation. Indeed, bodywork directed at the
fascial system (Structural Integration or Rolfing) does
improve balance measured by computerized posturography
(Findley et al 2004). Current research does not suggest
specific palpatory and other observational findings of the
fascial system related to balance, but that these are
fruitful subjects for further fascial research. Such areas
include the fascial connection between the hamstring and the
calf muscles which transmits hamstring forces directly to
35

the foot (Wicke and Zajac, 1981) but has been little studied
since its report more than 25 years ago.
36

References
1. Amiridis GA, Hatzitaki V, Arabatzi F 2003 Age–induced
modifications of static posture control in humans.
Neuroscience Letters. 2003, 350, 137-140.
2. Balance Master Operator's manual 2001 Clackamas (OR)
NeuroCom International.
3. Benjuya MN, Kaplanski J 2004 Postural stability in the
elderly: a comparison between fallers and no- fallers.
Age and Ageing, 33, 6, 602-607.
4. Berg K, Wood-Dauphinee S, Williams JI, Maki B Jul-Aug
1992 Measuring balance in the elderly: Validation of an
instrument. Canadian Journal of Public Health;
5. Chaudhry H, Findley T, Quigley K, Bukiet B, Ji Z, Sims,
T, Maney M Sept./Oct 2004 Measures of postural
stability. Journal of Rehabilitation Research and
Development. 41,5:713-720.
37

6. Chaudhry H, Findley T, Quigley K, Ji Z, Maney M, Sims, T,
Bukiet B, Foulds R July/Aug/ 2005 Postural stability is a
more valid measure of stability than equilibrium score..
Journal of Rehabilitation Research and Development; 4,
547-556.
7. Clair KL, Riach C 1996 Postural stability measures: What
to measure and for how long. Clinical Biomechanics, 11,3
176-178.
8. Colobert B, Crétual A, Allard P, Delamarche P 2006 Force-
plate based computation of ankle and hip strategies from
double-inverted pendulum model, Clinical Biomechanics,
vol. 21,no. 4, 427-434.
9. Doyle RJ, Wecksler ETH, Ragan BG, Rosengren KS 2007
Generealizability of center of pressure measures of quiet
standing. Gait & Posture 25, 166-171.
38

10. Fabio RB, Emasthi A, Paul S 1998 Validity of visual
stabilization used with computerized dynamic platform
posturography. Acta Otolaryngolica (Stockholm) 118:449-
454
11. Findley T, Quigley K, Maney M, Chaudhry H, Agbaje I.
2004 Improvement in Balance with Structural Integration
(Rolfing): A Controlled Case Series in persons with
myofascial pain. Arch Phys Med Rehabil. 85(9):E34.
12. Goldie PA, Bach M Evans OM 1989 Force platform measures
for evaluating postural control, reliability and
validity. Archives of Physical Medicine and
Rehabilitation 70, 510-517.
13. Gu MJ, Schultz AB, Shepard NT, Alexander NB 1996
Postural control in young and elderly adults when stance
is perturbed: Dynamics. Journal of Biomechanics, 29, 3,
319-329.
39

14. Guihard M, Gorce P Oct. 6-9 2002 Hip strategy applied
to biped dynamic control, IEEE International Conference
on Systems, Man and Cybernetics, Vol. 1, 159- 164.
15. Horak FB, Nashner LM 1986 Central programming of
postural movements: adaptation to altered support surface
configurations, J. of Neurophysiology, vol. 55, no. 6,
1369-1381.
16. Horak FB, Nashner LM, Diener HC 1990 Postural
strategies associated with somatosensory and vestibular
loss. Exp. Brain Res., 82:167-177.
17. Horak FB 1997 Clinical assessment of balance
disorders. Gait & Posture; 6:74-86
18. Huijing PA, van de Langenberg RW, Meesters JJ, Baan GC
2007 Extramuscular myofascial force transmission also
occurs between synergistic muscles and antagonistic
40

muscles. Journal of Electromyography & Kinesiology.
17(6):680-9,
19. Jeong,BY 1991 Respiration effect on standing balance.
Archives of Physical Medicine and Rehabilitation 72:99,
642-645.
20. Ji, Z, Findley, T, Chaudhry, H, and Bukiet, B 2004
Computational method to evaluate ankle muscle stiffness
with ground reaction forces. Journal of Rehabilitation
Research and Development. 41(2):207-14.
21. Johansson R, Magnuson M 1991 Human postural dynamics.
CRC Critical Reviews in Biomedical Engineering. 18, 413-
427.
22. Johansson R, Magnusson PA, Karlberg M 2001 Multi-
stimulus multi-response posturography. Mathematical
Biosciences; 174:41-59.
41

23. Kaufman KR, Brey RH, Chou LS, Rabatin A Brown AW
Basford JR. 2006 Comparison of objective measurements of
balance disorders following traumatic brain injury.
Medical Engineering & Physics. 28, 234-239.
24. Kuczynski M, Ostrowska B. Jan. 2006 Understanding falls
in osteoporosis: the viscoelastic modeling perspective.
Gait & Posture, 23 (1): 51-8
25. Lee J, Fujimoto N, Batiner A, Cervo F, Meyer J, Rubin
C, McLeod K 2001 Prediction of fall risk in the elderly:
Time dependent measures of postural sway dynamics. San
Francisco, CA meeting of the Orthopaedic Research
Society.
26. Meijer HJ, Baan GC, Huijing PA 2006 Myofascial force
transmission is increasingly important at lower forces:
firing frequency-related length-force characteristics of
rat extensor digitorum longus. Acta Physiologica.
186(3):185-95,
42

27. Melzer NB, Kaplanski J 2004 Postural stability in the
elderly: a comparison between fallers and non-fallers.
Age and Aging, 33,6, 602-07.
28. Mok NW, Brauer MS, Sandra G, Hodges PW 2004, March 15
Hip strategy for balance control in quiet standing is
reduced in people with low back pain. Spine, 29 (6) E107-
112.
29. Park S, Horak FB, Kuo AD 2004. Postural feedback
responses scale with biomechanical constraints in human
standing. Exp. Brain Res. 154: 417-427.
30. Piirtola M, Era P 2006 Force platform measurements as
predictor of falls among older people- A review.
Gerontology, 52; 1-16.
31. Popovic MR, Pappas IPI, Nakazawa K, Keller T, Morari M,
Dietz V 2000 Stability criterion for controlling standing
43
in able-bodied subjects. Journal of Biomechanics 33:1359-
1368
32. Prieto TE, Myklebust JB, Myklebust BM 1993
Characterization and modeling of postural steadiness in
the elderly: A review. IEEE Transactions on
Rehabilitation Engineering; 1:26-34
33. Prieto TE, Myklebust JB, Hoffmann RG, Lovett EG,
Myklebust BM. September 1996 Measures of Postural
Steadiness: Differences Between Healthy Young and Elderly
Adults. IEEE Transactions on Biomedical Engineering, 43,
9, 956-966.
34.Rungea CF, Shupert CL, Horak FB, Zajac FE 1999 Ankle and
hip postural strategies defined by joint torques, Gait &
Posture, vol. 10, no. 2, 161-170.
44

35. Sataloff RT, Hawkshaw, MJ, Mandel H, Zwislewski AB,
Armour J, Mandel S. April 2005 Abnormal computerized
dynamic posturography findings in dizzy patients with
normal ENG results. ENT-Ear, Nose & Throat Journal 84,4,
212-14.
36. Shepard N, Schultz A, Alexander NB, Gu MJ, Boismier T
1993 Postural control in young and elderly adults when
stance is challenged: Clinical versus laboratory
measurements. Annals of Otology, Rhinology & Laryngology;
102:508-517
37. SmartEquitest System Operator's manual. 2001. NeuroCom
International.
38. Stalenhoef PA, Diederiks JP, Knottnerus JA, Kester AD,
Crebolder HF 2002 A risk model for the prediction of
recurrent falls in community-dwelling elderly: A
prospective cohort study. Journal of Clinical
Epidemiology; 55:1088-1094
45

39. Stel VS, Smit JH, Pluijm SM, Lips P 2003 Balance and
mobility performance as treatable risk factors for
recurrent falling in older persons. Journal of Clinical
Epidemiology; 56:659-668
40. Terekhov Y 1976 Stabilometry and some aspects of its
applications – A review. Biomedical Engineering; 11, 12-
15.
41. Tyson S, Desouza 2002 A systematic review of methods to
measure balance and walking post-stroke. Part-1. Ordinal
scales. Physical Therapy Review 7: 173-86.
42. Wicke RW, Zajac FE 1981 Isometric torque produced by the
hamstrings muscle about the ankle as a function of
hindlimb position. Soc Neurosci. Abst. 7:648
43. Winter DA 1995 Biomechanics of motor control and human
movements. 2 nd Ed. Winter DA, Human balance and posture
46

control during standing and walking (Review article).
Gait & Posture 3,4, 193-214.
44. Winter DA, Palta AE, Prince F, Ishac K, Perczak G 1998
Stiffness control of balance in quiet standing. Journal
of Neurophysiology, 80, 1211-2121.
45. Winter DA, Palta AE, Ishac M, Gage W 2003 Motor
mechanism of balance during quiet standing. Journal of
Electromyography and Kinesology, 13, 49-56.
46. Yoshizawa M, Takeda H, Ozawa M, Sasaki Y. 1991 A
hypothesis that explains the human postural control
characteristics. 13 th Ann. Int. Conf. IEEE, 13, 2005-
2006
47

Tables
Table 1. Excursion length and area for a subject over 3
trials in each of 3 conditions.
Excursion(cm)
Trial1
Trial2
Trial 3 Mean Std.Dev.
Condition 1 28.356 43.514 28.020 33.30 8.85Condition 2 27.351 27.164 25.340 26.62 1.11Condition 3 24.716 25.046 24.555 24.77 0.25
Area (cm^2) Trial1
Trial2
Trial 3 Mean Std.Dev.
Condition 1 1.559 5.787 2.022 3.12 2.32Condition 2 0.481 0.230 0.299 0.34 0.13Condition 3 0.197 0.171 0.274 0.21 0.05
48

Figures
Figure 1 NeuroCom EquiTest System.
The NeuroCom EquiTest System consists of a support surface
with sensors at the corners below the surface and a visual
surround. The EquiTest device performs a sensory
organization test (SOT) with six conditions: conditions 1, 2
and 3 with the platform fixed and conditions 4, 5, and 6
with the platform moving.
Participants are asked to stand quietly and steadily for 3
trials for each of the following 6 conditions: (1) eyes
open, surround and platform stable, (2) eyes closed,
49

surround and platform stable, (3) eyes open, sway-referenced
surround, (4) eyes open, sway-referenced platform, (5) eyes
closed, sway-referenced platform, and (6) eyes open, sway-
referenced surround and platform.
Fig. 2(a)
50

Fig. 2(b)
51

Fig. 2(c)
Figures 2(a-c). COP trajectories of a subject during quiet
standing in condition 1 for three 20-second duration trials.
Trajectory 11 means trajectory for condition 1 and trial 1.
Similarly, trajectory 12 and trajectory 13 mean trajectory
for condition 1 and trials 2 and 3, respectively. AP means
Anterior-posterior, and ML means Medial –lateral.
Fig. 3 Composite ES and PSI vs. composite ankle stiffness.
The units of ankle stiffness are N.m /rad.
52

Fig. 4. Composite ES and PSI vs. Average Sway Angle
(radians).
Figure 5. Free body diagram of body (above ankle).
53

The ankle is at the small open circle. Here,
M is the mass of the body above the ankle.
is the absolute sway angle with respect to a fixed
vertical reference.
is the vertical force acting at the ankle joint.
is the horizontal force acting at the ankle joint.
is the torque acting at the ankle joint.
g is acceleration due to gravity.
Figure 6. Free body diagram of feet with force plate.
Here
, are reaction forces measured with front and rear
force transducers respectively.
54

d is the distance from the force transducer to the pin
axis on the force plate
is the horizontal reaction force (shear force) measured
with force transducer at the pin joint of the force plate.
e is the distance from the horizontal force transducer to
the ankle joint
is the vertical force at the ankle joint..
m is the total mass of the feet and the force plate.
M is the mass of the body above the ankle joint.
is the rotation angle of the force plate during sway
referenced motion..
g is the acceleration due to gravity.
is the measured relative sway angle with respect to the
line perpendicular to the force plate
is the horizontal force acting at the ankle joint.
55

Caption list
Figure 1 NeuroCom EquiTest System.
The NeuroCom EquiTest System consists of a support surface
with sensors at the corners below the surface and a visual
surround. The EquiTest device performs a sensory
organization test (SOT) with six conditions: conditions 1, 2
and 3 with the platform fixed and conditions 4, 5, and 6
with the platform moving.
Participants are asked to stand quietly and steadily for 3
trials for each of the following 6 conditions: (1) eyes
open, surround and platform stable, (2) eyes closed,
surround and platform stable, (3) eyes open, sway-referenced
surround, (4) eyes open, sway-referenced platform, (5) eyes
closed, sway-referenced platform, and (6) eyes open, sway-
referenced surround and platform.
Figures 2(a-c). COP trajectories of a subject during quiet
standing in condition 1 for three 20-second duration trials.
Trajectory 11 means trajectory for condition 1 and trial 1.
56

Similarly, trajectory 12 and trajectory 13 mean trajectory
for condition 1 and trials 2 and 3, respectively. AP means
Anterior-posterior, and ML means Medial –lateral.
Fig. 3 Composite ES and PSI vs. composite ankle stiffness.
The units of ankle stiffness.
Fig. 4. Composite ES and PSI vs. Average Sway Angle
(radians).
Figure 5. Free body diagram of body (above ankle).
The ankle is at the small open circle. Here,
M is the mass of the body above the ankle.
is the absolute sway angle with respect to a fixed
vertical reference.
is the vertical force acting at the ankle joint.
is the horizontal force acting at the ankle joint.
is the torque acting at the ankle joint.
57

g is acceleration due to gravity.
Figure 6. Free body diagram of feet with force plate.
Here,
, are reaction forces measured with front and rear
force transducers respectively.
d is the distance from the force transducer to the pin
axis on the force plate
is the horizontal reaction force (shear force) measured
with force transducer at the pin joint of the force plate.
e is the distance from the horizontal force transducer to
the ankle joint
is the vertical force at the ankle joint..
m is the total mass of the feet and the force plate.
M is the mass of the body above the ankle joint.
is the rotation angle of the force plate during sway
referenced motion..
g is the acceleration due to gravity.
58

is the measured relative sway angle with respect to the
line perpendicular to the force plate
is the horizontal force acting at the ankle joint.
59