Comparison of the miRNome and piRNome of bovine blood and plasma by small RNA sequencing
12
ORIGINAL RESEARCH PAPER Comparison of the miRNome and piRNome of bovine blood and plasma by small RNA sequencing Melanie Spornraft • Benedikt Kirchner • Michael W. Pfaffl • Irmgard Riedmaier Received: 10 December 2014 / Accepted: 5 February 2015 Ó Springer Science+Business Media Dordrecht 2015 Abstract Objectives The small RNAs of bovine plasma and whole blood were analysed using next-generation sequencing to quantify, profile and compare the microRNAs (miRNA) and piRNA signatures in both bio fluids. Results Evaluating read-count data resulted in a proportion of 5.0 ± 2.9 % of miRNAs in plasma while 38.2 ± 3.4 % were identified in whole blood. Regarding piRNAs, the percentages in both matrices were nearly the same: 1.4 ± 0.8 % of piRNAs in plasma and 1.9 ± 0.8 % in whole blood. Investigation of the ten most abundant miRNAs and piRNAs in both bio fluids revealed that two miRNAs and seven piRNAs were identical. Comparing the read-count values of these matching pairs highlighted that miRNA and piRNA levels in blood exceeded the abundance of their corresponding miRNAs and piRNAs in plasma, except liver-specific miR-122 and three piRNAs. Conclusions The data strengthened evidence that the circulating small RNA signature in plasma is not only influenced by hematocytes and certain small RNAs could originate from other sources than cellular blood components. Keywords Blood analysis microRNA Next-generation sequencing (NGS) piRNA Plasma analysis Small RNAs Small RNA-Seq Introduction The presence of free-circulating, non-cell-bound mi- croRNAs (miRNAs) has already been verified for various bio fluids, e.g. urine, serum, plasma, saliva, tears, cerebrospinal fluid, breast milk, colostrum etc. (Weber et al. 2010). Non- or minimal-invasive sample matrices clearly offer multiple advantages compared to biopsies and additionally, the potential of circulat- ing miRNAs as biomarkers for different diseases and physiological conditions has already been successfully demonstrated. Therefore, they earn great attention by scientists in the search for novel biomarkers. In addition, compared to other RNAs, circulating M. Spornraft (&) B. Kirchner M. W. Pfaffl I. Riedmaier Physiology Weihenstephan, TUM School of Life Sciences Weihenstephan, Technical University Munich, Weihenstephaner Berg 3, 85354 Freising, Germany e-mail: [email protected] B. Kirchner e-mail: [email protected] M. W. Pfaffl e-mail: michael.pfaffl@wzw.tum.de I. Riedmaier e-mail: [email protected] 123 Biotechnol Lett DOI 10.1007/s10529-015-1788-2
Transcript of Comparison of the miRNome and piRNome of bovine blood and plasma by small RNA sequencing

ORIGINAL RESEARCH PAPER
Comparison of the miRNome and piRNome of bovine bloodand plasma by small RNA sequencing
Melanie Spornraft • Benedikt Kirchner •
Michael W. Pfaffl • Irmgard Riedmaier
Received: 10 December 2014 / Accepted: 5 February 2015
� Springer Science+Business Media Dordrecht 2015
Abstract
Objectives The small RNAs of bovine plasma and
whole blood were analysed using next-generation
sequencing to quantify, profile and compare the
microRNAs (miRNA) and piRNA signatures in both
bio fluids.
Results Evaluating read-count data resulted in a
proportion of 5.0 ± 2.9 % of miRNAs in plasma
while 38.2 ± 3.4 % were identified in whole blood.
Regarding piRNAs, the percentages in both matrices
were nearly the same: 1.4 ± 0.8 % of piRNAs in
plasma and 1.9 ± 0.8 % in whole blood. Investigation
of the ten most abundant miRNAs and piRNAs in both
bio fluids revealed that two miRNAs and seven
piRNAs were identical. Comparing the read-count
values of these matching pairs highlighted that
miRNA and piRNA levels in blood exceeded the
abundance of their corresponding miRNAs and
piRNAs in plasma, except liver-specific miR-122
and three piRNAs.
Conclusions The data strengthened evidence that the
circulating small RNA signature in plasma is not only
influenced by hematocytes and certain small RNAs
could originate from other sources than cellular blood
components.
Keywords Blood analysis � microRNA �Next-generation sequencing (NGS) � piRNA �Plasma analysis � Small RNAs � Small RNA-Seq
Introduction
The presence of free-circulating, non-cell-bound mi-
croRNAs (miRNAs) has already been verified for
various bio fluids, e.g. urine, serum, plasma, saliva,
tears, cerebrospinal fluid, breast milk, colostrum etc.
(Weber et al. 2010). Non- or minimal-invasive sample
matrices clearly offer multiple advantages compared
to biopsies and additionally, the potential of circulat-
ing miRNAs as biomarkers for different diseases and
physiological conditions has already been successfully
demonstrated. Therefore, they earn great attention by
scientists in the search for novel biomarkers. In
addition, compared to other RNAs, circulating
M. Spornraft (&) � B. Kirchner � M. W. Pfaffl �I. Riedmaier
Physiology Weihenstephan, TUM School of Life Sciences
Weihenstephan, Technical University Munich,
Weihenstephaner Berg 3, 85354 Freising, Germany
e-mail: [email protected]
B. Kirchner
e-mail: [email protected]
M. W. Pfaffl
e-mail: [email protected]
I. Riedmaier
e-mail: [email protected]
123
Biotechnol Lett
DOI 10.1007/s10529-015-1788-2

miRNAs are highly stable, resistant to variations in
temperature, pH value and multiple thaw and freezing
cycles (Mitchell et al. 2008), which makes them
suitable candidates for routine biomarker profiling in
laboratories. Circulating miRNAs are small non-
coding molecules with a length of 18–25 nucleotides
(nts) that are either transported throughout the circu-
lation encapsulated in microvesicles (e.g. exosomes)
or associated and therefore protected by proteins, e.g.
argonaute 2 (Arroyo et al. 2011) or nucleophosmin
(Wang et al. 2010) or high density lipoproteins
(Vickers et al. 2011). They act on the post-transcrip-
tional level as modulators of mRNAs by either
repressing their translation or destabilizing the corre-
sponding mRNA targets and are therefore capable of
regulating gene expression in manifold biological
processes. In the search for miRNA biomarkers,
altered levels of distinct miRNAs or miRNA signa-
tures are investigated, but not much is known about the
normal physiological level and composition of
miRNomes, the collectivity of all miRNAs, in either
tissues or bio fluids.
microRNAs are involved in numerous cell func-
tions such as differentiation, proliferation and apop-
tosis and they can act both as promotors (e.g.
oncogenes) or as suppressors (e.g. tumor suppressor
genes) (as shown in Vasilatou et al. 2010). Hence,
investigating the normal and healthy physiological
landscape of miRNAs could lead to a better under-
standing of dysregulations diverging from ordinary
physiology. MiRNAs in plasma are thought to have
key roles in almost every stage of hematopoiesis
(Ramkissoon et al. 2006) and additionally, plasma and
the different hematocytes seem to be characterized by
a specific miRNA profile. For example, miR-451 and
miR-16 are contained in red blood cells (RBCs) at high
levels but at low concentrations in leucocytes and
thrombocytes (Ramkissoon et al. 2006; Kirschner
et al. 2011).
Since miRNAs, as comparable class of posttran-
scriptional regulatory molecules, are very successful
in the search for novel biomarkers, PIWI-interacting
small non-coding RNAs (piRNAs) are also traded as
new potential goldmine in molecular diagnostics (Qi
and Du 2013). PiRNAs have a length of 25–32 nt and
were initially detected in germ-line cells, where they
maintain genome stability, are involved in RNA
silencing and regulate gene expression (as reviewed
in Gou et al. 2014). Hence, they act as genetic and
epigenetic regulatory factors in the germ-line branch
of the RNAi aspect. Nevertheless, differentially
expressed small RNAs could also be identified in
tumor cells, e.g. colon, lung, breast or gastric cancer
(Cheng et al. 2011). Additionally, circulating piRNAs
in bio fluids were already identified as biomarkers for
several cancer types, e.g. gastric cancer (Cui et al.
2011). Consequently, besides the functions of piRNAs
in germ-line, their role in somatic tissues or body
fluids is up to date not well understood.
When the aim is developing a significant biomarker
signature, it is important to consider that each body
fluid appears to have a normal spectrum of miRNAs or
piRNAs, which is presumably the reflection of healthy
ordinary physiological processes (Kirschner et al.
2011). Therefore, besides screening for differentially
expressed biomarkers, it is no less interesting to profile
healthy individuals to increase the knowledge about
the miRNA and piRNA status quo of certain samples.
This paper describes the miRNA and piRNA signa-
tures of plasma and whole blood of bovines and
compares the two specimens regarding the miRNA
and piRNA profiles, raising evidence that blood cells
or blood vessel epithelial cells are contributing to the
plasma community, but there must be further factors
adding miRNA and piRNAs to the circulation. Yet
little is known about the origin of circulating
mi-/piRNAs in either healthy or pathogen conditions
and which factors influence their expression levels.
High-throughput next-generation sequencing
(NGS) was applied in this study to profile the totality
of the ‘‘small RNA universe’’ in the analyzed samples.
Small RNA-Sequencing (small RNA-Seq) is the
technology of choice in sequencing entire small
RNA transcriptomes. The benefits lie in high data
output, massive parallel sequencing ability by multi-
plexing samples, decreasing costs and shorter hands-
on-time during sample preparation and sequencing
itself.
Materials and methods
Blood and plasma sampling
Peripheral blood was taken from vena jugularis from
male Holstein–Friesian calves (n = 9). For blood
drawing, 9 ml K3E K3EDTA-Vacuette tubes (Greiner
bio-one, Germany) and single-use needles (20
Biotechnol Lett
123

G 9 1�00, Greiner bio-one, Germany) were used.
Plasma was separated from other blood components
directly after blood sampling (15 min for 35009g at
room temperature with transportable centrifuges) and
stored at -80 �C until RNA extraction. Whole blood
was collected with PAXgene Blood RNA Tubes
(PreAnalytiX, Germany) that guarantee immediate
stabilization of RNAs. PAXgene tubes were kept at -
20 �C until RNA extraction. The ethical committee of
the Landesamt fur Natur, Umwelt und Verbraucher-
schutz Nordrhein-Westfalen (Recklinghausen, Ger-
many) permitted specimen sampling (permit number
84-02.04.2012.A040). Taking care of the animals
according to good livestock farming practices was as
granted as avoiding suffering.
Total RNA isolation
Circulating RNAs from plasma (starting vol-
ume = 9 ml) were isolated as presented by our group
by an optimized method that enabled small RNA-Seq
(Spornraft et al. 2014). Total RNA purification of
whole blood was done by using the PAXgene Blood
miRNA Kit (PreAnalytiX, Germany) and RNA eluates
were stored at -80 �C until further usage.
Small RNA sequencing, data evaluation, mapping
and annotation
The workflow starting with library preparation
(NEBNext Multiplex Small RNA Library Prep Set
for Illumina, New England BioLabs Inc., USA) until
small RNA-Seq on a HiSeq 2000 high-throughput
sequencing system (Illumina Inc., USA) was per-
formed as previously described by our group (Sporn-
raft et al. 2014). In brief, 35 ng total plasma RNA and
1 lg total blood RNA were adapter-ligated, reverse
transcribed, PCR amplified and barcoded for multi-
plexing. Fractions were size-selected via gel elec-
trophoresis and DNA libraries were controlled
regarding correct size, purity and concentration with
a High Sensitivity DNA chip on the Bioanalyzer 2100
(Agilent). Single-read sequencing-by-synthesis was
carried out in 50 cycles. Seq-data was processed as
previously described in (Spornraft et al. 2014). In
brief, to generate miRNA and piRNA read-count
tables, the data analysis pipeline basically consisted of
adaptor trimming, quality controls, size assortment
and stepwise mapping of reads to different databases
to improve specificity. Data sets were gradually
reduced of reads with a sequencing length of \16 nt
for miRNAs and \26 nt for piRNA analysis. Reads
with appropriate sequencing lengths were mapped to
Rfam database (Burge et al. 2013) to exclude rRNA,
tRNA, snRNA as well as snoRNA reads prior to
aligning them to miRBase (Kozomara and Griffiths-
Jones 2013, release 20), a high confidence miRNA
repository to generate mature Bos taurus (bta) miRNA
read-counts. To obtain piRNA read-counts, size-
selected reads were first removed by additional
filtering steps on Rfam and the complete miRBase
database. To generate a bowtie index (Langmead et al.
2009) for piRNA alignment using reads that did not
match either to Rfam nor miRBase, the nucleotide
database of NCBI Genbank (Benson et al. 2013,
Release 201) was searched for human piRNA entries.
Although bovine plasma was used, the mapping of
reads to human piRNA references was essential, as
there are no piRNAs annotated yet for bos taurus. All
read-counts were normalized to library sizes in reads
per million (rpm). As a noise cut-off, reads with
\50 rpm at an average were excluded from read-
count tables. Sequencing data was recorded at the
European Nucleotide Archive (ENA) with the study
accession numbers PRJEB7882/ERP008868 (http://
www.ebi.ac.uk/ena).
Results
Data evaluation
Sequencing the plasma samples resulted in 10.47 9
106 ± 3.64 9 106 reads and 16.16 9 106 ± 5.48 9
106 reads for whole blood samples (Table 1) (Total
sequences). Raw sequencing reads were quality
checked and size pre-filtered prior to mapping. To
evaluate miRNAs, sequences that were shorter than 16
nt (Failed trimming\16 nt) were eliminated from the
sequenced library of each animal. As a consequence,
the number of sequences that passed the trimming
process were further subjected to an alignment to
Rfam database to further exclude unwanted RNAs
such as rRNAs, tRNAs, snoRNAs and snRNAs (Rfam
mapped). Unmapped sequences to Rfam database
were aligned to bovine entries in miRBase as a second
mapping step (annotated reads miRBase bta) (Table 1,
plasma miRNA and blood miRNA). Sequences that
Biotechnol Lett
123

Ta
ble
1D
ata
eval
uat
ion
.C
om
pil
atio
no
fev
alu
ated
read
dat
ain
the
pro
cess
of
gen
erat
ing
miR
NA
and
piR
NA
read
-co
un
tli
sts
of
pla
sma
and
blo
od
sam
ple
so
fal
lse
qu
ence
d
bo
vin
es(a
nim
als
1–
9)
Dat
aev
alu
atio
nA
nim
al1
An
imal
2A
nim
al3
An
imal
4A
nim
al5
An
imal
6A
nim
al7
An
imal
8A
nim
al9
Mea
nS
D
PL
AS
MA
miR
NA
To
tal
seq
uen
ces
9,6
94
,74
39
,58
5,6
90
18
,08
9,4
52
11
,22
5,2
00
9,2
10
,63
41
3,0
46
,39
69
,87
1,7
68
8,9
00
,34
04
,56
3,9
07
10
,46
5,3
48
3,6
38
,96
8
Pas
sed
trim
min
g[
16
nt
5,9
42
,47
85
,18
9,1
72
4,7
97
,22
94
,65
6,9
21
4,6
55
,60
92
,16
4,6
06
6,8
94
,50
72
,82
6,2
35
3,4
53
,50
84
,50
8,9
18
1,4
90
,66
0
Fai
led
trim
min
g\
16
nt
3,7
52
,26
54
,39
6,5
18
13
,29
2,2
23
6,5
68
,27
94
,55
5,0
25
10
,88
1,7
90
2,9
77
,26
16
,07
4,1
05
1,1
10
,39
95
,95
6,4
29
3,8
74
,21
5
Rfa
mm
app
ed1
55
,10
89
5,2
16
20
7,4
25
10
2,9
96
96
,95
67
8,4
87
13
2,3
35
92
,17
37
0,4
02
11
4,5
66
43
,52
3
Rfa
mu
nm
app
ed5
,78
7,3
70
5,0
93
,95
64
,58
9,8
04
4,5
53
,92
54
,55
8,6
53
2,0
86
,11
96
,76
2,1
72
2,7
34
,06
23
,38
3,1
06
4,3
94
,35
21
,46
7,7
49
An
no
tate
dre
ads
miR
Bas
e
bta
76
4,0
79
28
3,4
05
84
0,5
42
43
0,8
32
33
4,8
47
16
2,1
23
88
5,2
41
23
7,0
19
40
0,5
60
48
2,0
72
27
4,6
37
%(/
To
tal
seq
uen
ces)
7.9
3.0
4.6
3.8
3.6
1.2
9.0
2.7
8.8
5.0
2.9
Un
map
ped
read
sm
iRB
ase
bta
5,0
23
,29
14
,81
0,5
51
3,7
49
,26
24
,12
3,0
93
4,2
23
,80
61
,92
3,9
96
5,8
76
,93
12
,49
7,0
43
2,9
82
,54
63
,91
2,2
80
1,2
69
,33
7
PL
AS
MA
piR
NA
Pas
sed
trim
min
g[
26
nt
1,9
92
,98
73
,00
2,8
46
31
3,3
00
1,9
77
,29
12
,67
5,4
51
30
3,7
27
3,3
85
,64
88
71
,33
61
,61
2,6
39
1,7
92
,80
31
,12
5,9
65
Fai
led
trim
min
g\
26
nt
3,0
30
,30
41
,80
7,7
05
3,4
35
,96
22
,14
5,8
02
1,5
48
,35
51
,62
0,2
69
2,4
91
,28
31
,62
5,7
07
1,3
69
,90
72
,11
9,4
77
72
2,8
35
Rfa
m/m
iRB
ase
map
ped
24
,22
92
7,2
54
10
,25
41
5,3
75
23
,49
54
16
63
4,1
96
97
94
14
,27
31
8,1
15
97
23
Rfa
m/m
iRB
ase
un
map
ped
1,9
68
,75
82
,97
5,5
92
30
3,0
46
1,9
61
,91
62
,65
1,9
56
29
9,5
61
3,3
51
,45
28
61
,54
21
,59
8,3
66
1,7
74
,68
81
,11
6,7
66
An
no
tate
dre
ads
piR
NA
s1
44
,66
78
9,7
86
33
,64
91
40
,60
11
90
,09
01
01
,36
32
71
,98
77
7,6
65
10
5,1
86
12
8,3
33
69
,95
4
%(/
To
tal
seq
uen
ces)
1.5
0.9
0.2
1.3
2.1
0.8
2.8
0.9
2.3
1.4
0.8
Un
map
ped
read
sp
iRN
As
1,8
24
,09
12
,88
5,8
06
26
9,3
97
1,8
21
,31
52
,46
1,8
66
19
8,1
98
3,0
79
,46
57
83
,87
71
,49
3,1
80
1,6
46
,35
51
,06
5,2
35
BL
OO
Dm
iRN
A
To
tal
seq
uen
ces
17
,20
3,1
27
18
,66
8,7
97
17
,90
1,6
34
16
,75
1,6
14
17
,32
7,5
18
26
,84
4,3
88
7,7
95
,01
41
1,2
57
,80
11
1,7
00
,46
71
6,1
61
,15
15
,47
9,2
41
Pas
sed
trim
min
g[
16
nt
14
,38
6,8
25
16
,00
3,3
11
14
,51
5,8
34
12
,98
5,1
48
12
,95
5,4
57
21
,32
4,6
26
6,3
15
,96
88
,95
9,2
06
9,1
65
,24
81
2,9
56
,84
74
,44
7,4
06
Fai
led
trim
min
g\
16
nt
2,8
16
,30
22
,66
5,4
86
3,3
85
,80
03
,76
6,4
66
4,3
72
,06
15
,51
9,7
62
1,4
79
,04
62
,29
8,5
95
2,5
35
,21
93
,20
4,3
04
1,2
12
,40
1
Rfa
mm
app
ed6
2,6
34
59
,68
17
9,1
11
58
,10
66
8,8
31
91
,11
92
8,5
51
43
,60
94
0,4
01
59
,11
61
9,5
48
Rfa
mu
nm
app
ed1
4,3
24
,19
11
5,9
43
,63
01
4,4
36
,72
31
2,9
27
,04
21
2,8
86
,62
62
1,2
33
,50
76
,28
7,4
17
8,9
15
,59
79
,12
4,8
47
12
,89
7,7
31
4,4
29
,38
0
An
no
tate
dre
ads
miR
Bas
e
bta
7,3
19
,24
18
,21
4,2
17
6,2
15
,32
86
,46
8,9
48
6,2
51
,89
41
0,3
43
,55
23
,07
1,1
47
3,9
17
,10
64
,10
6,1
22
6,2
11
,95
12
,28
9,6
08
%(/
To
tal
seq
uen
ces)
42
.54
4.0
34
.73
8.6
36
.13
8.5
39
.43
4.8
35
.13
8.2
3.4
Un
map
ped
read
sm
iRB
ase
bta
7,0
04
,95
07
,72
9,4
13
8,2
21
,39
56
,45
8,0
94
6,6
34
,73
21
0,8
89
,95
53
,21
6,2
70
4,9
98
,49
15
,01
8,7
25
6,6
85
,78
12
,20
6,3
04
BL
OO
Dp
iRN
A
Pas
sed
trim
min
g[
26
nts
2,7
20
,17
31
,99
2,5
99
3,4
15
,68
11
,57
7,1
84
1,9
84
,92
33
,25
5,9
51
1,2
09
,61
91
,53
2,5
28
1,9
22
,46
32
,17
9,0
13
77
7,8
26
Fai
led
trim
min
g\
26
nts
4,2
84
,77
75
,73
6,8
14
4,8
05
,71
44
,88
0,9
10
4,6
49
,80
97
,63
4,0
04
2,0
06
,65
13
,46
5,9
63
3,0
96
,26
24
,50
6,7
67
1,6
16
,90
7
Biotechnol Lett
123

passed the length filtering ([26 nt) and were not
aligned to Rfam database as well as miRBase database
were mapped to piRNA reference indexes to generate
annotated piRNA read-counts (annotated reads piR-
NAs) (Table 1, PLASMA piRNA and BLOOD
piRNA). In plasma, more reads failed the size
trimming and first selective mapping compared to
blood that resulted in more annotated miRNAs in
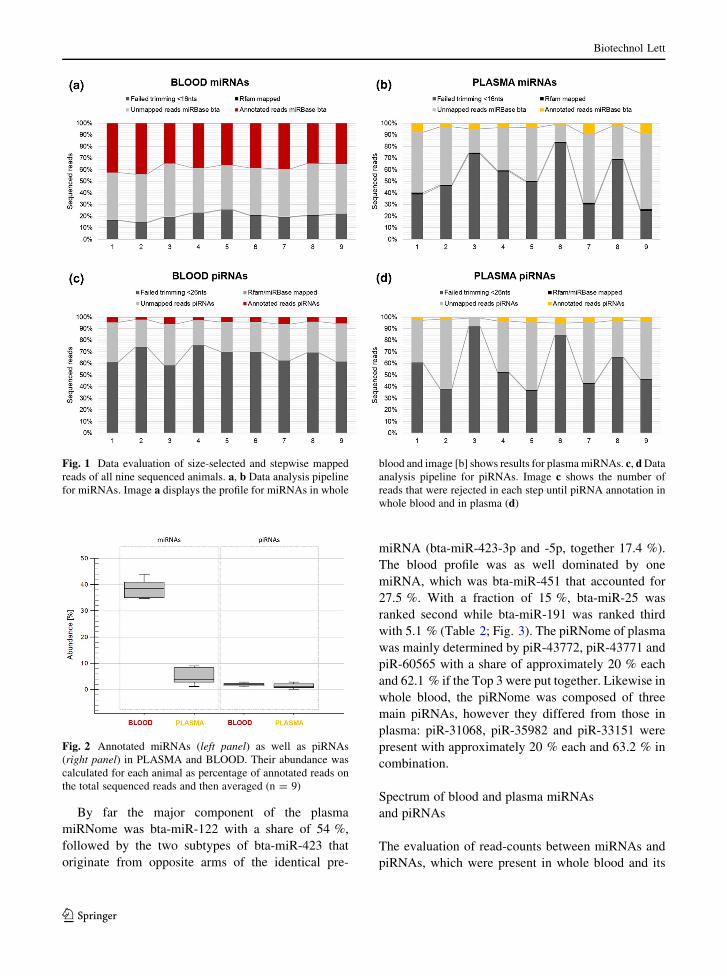
whole blood (Fig. 1a, b). Plasma data was subject of
greater variations compared to the obviously more
unified picture of blood parameters (Fig. 1a–d). The
proportion of annotated miRNAs and piRNAs on the
total sequences was calculated (%/total sequences). In
plasma, 5 ± 2.9 % of miRNAs could be identified,
while 38.2 ± 3.4 % could be identified in whole blood
(Fig. 2, left panel). Concerning piRNAs, the share of
piRNAs in both matrices was nearly the same:
1.4 ± 0.8 % of piRNAs in plasma and 1.9 ± 0.8 %
in whole blood (Fig. 2, right panel).
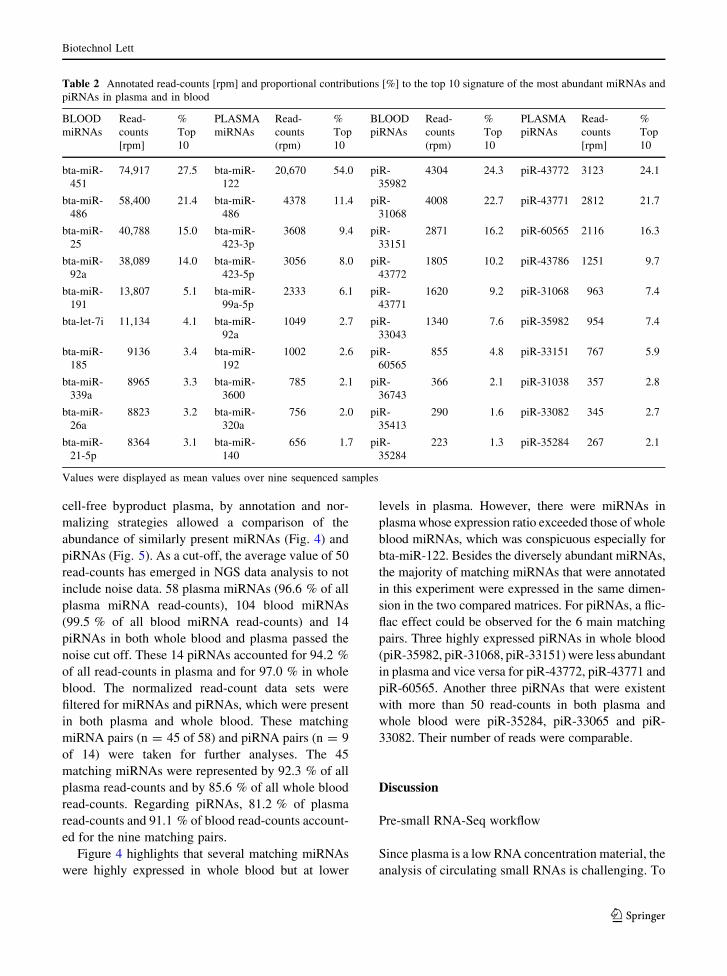
Profiling of Top 10 miRNAs and piRNAs
All annotated miRNA and piRNA reads were normal-
ized to library sizes in rpm and organized according to
their abundances. Top 10 lists for the most abundant
miRNAs and piRNAs respectively, in both plasma and
whole blood were created by sorting read-counts
according to MEAN values over all nine sequenced
animals (Table 2). The sum of selected miRNAs/
piRNAs was set to 100 % and respective percentages
were calculated (% Top 10). Visualizing the Top 10
miRNA profiles in plasma compared to whole blood in
pie charts easily allowed the comparison: two
miRNAs (bta-miR-486 and bta-miR-92a) were pre-
sent in both bio-fluids while the other eight differed
between plasma and whole blood (Fig. 3a, c). Taking
the shares of bta-miR-486 and bta-miR-92a together,
their proportion of the Top 10 is 14.2 % for plasma
and 35.4 % for whole blood (Fig. 3a, c). In both cases,
bta-miR-486 appeared in second place in terms of
occurrence. The situation was different when the
piRNA profiles of plasma and whole blood were
opposed: seven out of ten piRNAs were found in both
sample types (piR-43772, piR-43771, piR-60565, piR-
43786, piR-31068, piR-35982 and piR-33151)
(Fig. 3b, d). The matching piRNAs in plasma ac-
counted for a portion of 84.9 % and of 88.7 % in
whole blood. However, the order of identified piRNAs
differed (Table 2).Ta
ble
1co
nti
nu
ed
Dat
aev
alu
atio
nA
nim
al1
An
imal
2A
nim
al3
An
imal
4A
nim
al5
An
imal
6A
nim
al7
An
imal
8A
nim
al9
Mea
nS
D
Rfa
m/m
iRB
ase
map
ped
50
51
48
31
61
37
33
45
48
22
31
18
33
82
96
15
6
Rfa
m/m
iRB
ase
un
map
ped
2,7
19
,66
81
,99
2,4
51
3,4
15
,36
51
,57
7,0
47
1,9
84
,58
93
,25
5,4
03
1,2
09
,39
61
,53
2,4
10
1,9
22
,12
52
,17
8,7
17
77
7,7
13
An
no
tate
dre
ads
piR
NA
s3
21
,78
21
82
,97
55
09
,88
71
77
,16
72
87
,87
44
68
,79
41
93
,77
72
05
,52
52
73
,72
02
91
,27
81
23
,57
3
%(/
To
tal
seq
uen
ces)
1.9
1.0
2.8
1.1
1.7
1.7
2.5
1.8
2.3
1.9
0.6
Un
map
ped
read
sp
iRN
As
2,3
97
,88
61
,80
9,4
76
2,9
05
,47
81
,39
9,8
80
1,6
96
,71
52
,78
6,6
09
1,0
15
,61
91
,32
6,8
85
1,6
48
,40
51
,88
7,4
39
66
3,0
48
Th
ep
rop
ort
ion
of
miR
NA
and
piR
NA
sw
ere
calc
ula
ted
asp
erce
nta
ge
of
ann
ota
ted
miR
NA
so
rp
iRN
As
toto
tal
seq
uen
ces
[%(/
tota
lse
qu
ence
s)]
Biotechnol Lett
123
By far the major component of the plasma
miRNome was bta-miR-122 with a share of 54 %,
followed by the two subtypes of bta-miR-423 that
originate from opposite arms of the identical pre-
miRNA (bta-miR-423-3p and -5p, together 17.4 %).
The blood profile was as well dominated by one
miRNA, which was bta-miR-451 that accounted for
27.5 %. With a fraction of 15 %, bta-miR-25 was
ranked second while bta-miR-191 was ranked third
with 5.1 % (Table 2; Fig. 3). The piRNome of plasma
was mainly determined by piR-43772, piR-43771 and
piR-60565 with a share of approximately 20 % each
and 62.1 % if the Top 3 were put together. Likewise in
whole blood, the piRNome was composed of three
main piRNAs, however they differed from those in
plasma: piR-31068, piR-35982 and piR-33151 were
present with approximately 20 % each and 63.2 % in
combination.
Spectrum of blood and plasma miRNAs
and piRNAs
The evaluation of read-counts between miRNAs and
piRNAs, which were present in whole blood and its
Fig. 1 Data evaluation of size-selected and stepwise mapped
reads of all nine sequenced animals. a, b Data analysis pipeline
for miRNAs. Image a displays the profile for miRNAs in whole
blood and image [b] shows results for plasma miRNAs. c, d Data
analysis pipeline for piRNAs. Image c shows the number of
reads that were rejected in each step until piRNA annotation in
whole blood and in plasma (d)
Fig. 2 Annotated miRNAs (left panel) as well as piRNAs
(right panel) in PLASMA and BLOOD. Their abundance was
calculated for each animal as percentage of annotated reads on
the total sequenced reads and then averaged (n = 9)
Biotechnol Lett
123
cell-free byproduct plasma, by annotation and nor-
malizing strategies allowed a comparison of the
abundance of similarly present miRNAs (Fig. 4) and
piRNAs (Fig. 5). As a cut-off, the average value of 50
read-counts has emerged in NGS data analysis to not
include noise data. 58 plasma miRNAs (96.6 % of all
plasma miRNA read-counts), 104 blood miRNAs
(99.5 % of all blood miRNA read-counts) and 14
piRNAs in both whole blood and plasma passed the
noise cut off. These 14 piRNAs accounted for 94.2 %
of all read-counts in plasma and for 97.0 % in whole
blood. The normalized read-count data sets were
filtered for miRNAs and piRNAs, which were present
in both plasma and whole blood. These matching
miRNA pairs (n = 45 of 58) and piRNA pairs (n = 9
of 14) were taken for further analyses. The 45
matching miRNAs were represented by 92.3 % of all
plasma read-counts and by 85.6 % of all whole blood
read-counts. Regarding piRNAs, 81.2 % of plasma
read-counts and 91.1 % of blood read-counts account-
ed for the nine matching pairs.
Figure 4 highlights that several matching miRNAs
were highly expressed in whole blood but at lower
levels in plasma. However, there were miRNAs in
plasma whose expression ratio exceeded those of whole
blood miRNAs, which was conspicuous especially for
bta-miR-122. Besides the diversely abundant miRNAs,
the majority of matching miRNAs that were annotated
in this experiment were expressed in the same dimen-
sion in the two compared matrices. For piRNAs, a flic-
flac effect could be observed for the 6 main matching
pairs. Three highly expressed piRNAs in whole blood
(piR-35982, piR-31068, piR-33151) were less abundant
in plasma and vice versa for piR-43772, piR-43771 and
piR-60565. Another three piRNAs that were existent
with more than 50 read-counts in both plasma and
whole blood were piR-35284, piR-33065 and piR-
33082. Their number of reads were comparable.
Discussion
Pre-small RNA-Seq workflow
Since plasma is a low RNA concentration material, the
analysis of circulating small RNAs is challenging. To
Table 2 Annotated read-counts [rpm] and proportional contributions [%] to the top 10 signature of the most abundant miRNAs and
piRNAs in plasma and in blood
BLOOD
miRNAs
Read-
counts
[rpm]
%
Top
10
PLASMA
miRNAs
Read-
counts
(rpm)
%
Top
10
BLOOD
piRNAs
Read-
counts
(rpm)
%
Top
10
PLASMA
piRNAs
Read-
counts
[rpm]
%
Top
10
bta-miR-
451
74,917 27.5 bta-miR-
122
20,670 54.0 piR-
35982
4304 24.3 piR-43772 3123 24.1
bta-miR-
486
58,400 21.4 bta-miR-
486
4378 11.4 piR-
31068
4008 22.7 piR-43771 2812 21.7
bta-miR-
25
40,788 15.0 bta-miR-
423-3p
3608 9.4 piR-
33151
2871 16.2 piR-60565 2116 16.3
bta-miR-
92a
38,089 14.0 bta-miR-
423-5p
3056 8.0 piR-
43772
1805 10.2 piR-43786 1251 9.7
bta-miR-
191
13,807 5.1 bta-miR-
99a-5p
2333 6.1 piR-
43771
1620 9.2 piR-31068 963 7.4
bta-let-7i 11,134 4.1 bta-miR-
92a
1049 2.7 piR-
33043
1340 7.6 piR-35982 954 7.4
bta-miR-
185
9136 3.4 bta-miR-
192
1002 2.6 piR-
60565
855 4.8 piR-33151 767 5.9
bta-miR-
339a
8965 3.3 bta-miR-
3600
785 2.1 piR-
36743
366 2.1 piR-31038 357 2.8
bta-miR-
26a
8823 3.2 bta-miR-
320a
756 2.0 piR-
35413
290 1.6 piR-33082 345 2.7
bta-miR-
21-5p
8364 3.1 bta-miR-
140
656 1.7 piR-
35284
223 1.3 piR-35284 267 2.1
Values were displayed as mean values over nine sequenced samples
Biotechnol Lett
123

isolate sufficient RNA concentrations from plasma, an
increased volume had to be used as starting material
followed by an extensive extraction technique (Sporn-
raft et al. 2014). Quality controls regarding the RNA
integrity of samples is essential (Fleige et al. 2006;
Bustin et al. 2009) prior to library preparation. It was
not feasible in the case for circulating RNAs in
plasma, as the concentration was too low to perform a
RNA quality control analysis, e.g. using a Bioanalyzer
2100 RNA 6000 Nano Assay (Agilent). However, as
shown elsewhere (Spornraft et al. 2014), the high-
volume extraction method and data analysis pipeline
resulted in high quality sequencing data from plasma.
Contrarily, whole blood is rich of cellular components
and therefore, the isolated RNA concentration allowed
the RNA Integrity Number (RIN) measurement. The
result was a RIN of 8.6 ± 0.3 that stands for high
integrity of RNA samples.
Extraction of low amounts of RNAs from a
complex matrix is difficult, especially when plasma
had to be generated prior to RNA purification by
separation of cellular parts. This processing step could
lead to a prolonged exposure to RNases, which could
promote degradation. In comparison, PAX-gene tubes
contain stabilizers for RNAs in whole blood and could
be used directly for RNA isolation without any
additional manual steps. Therefore, extraction of total
RNAs from whole blood resulted in increased RNA
yields than isolation of plasma circulating total RNAs,
which is reflected in higher RIN values and the more
robust sequencing data (Fig. 1). These may also be the
reasons why inter-individual differences appeared not
as stable as in blood-based data.
Small RNA data analysis workflow
To generate read-count tables, in a first step, for
sequencing essential adaptor sequences were trimmed
from the 30-end of sequenced reads and reads that did
not show detectable adaptors were excluded. The data
set was in a second step further depleted of sequenced
reads that were too short to be miRNAs. This length
cut-off of reads with\16 nt reduced the possibility of
false positive mappings by degraded RNA fragments.
Reads with appropriate sequencing lengths were
mapped to Rfam database (Burge et al. 2013) to
Fig. 3 The ten most abundant miRNAs and piRNAs in BLOOD (a, b) and PLASMA (c, d). MiRNAs that were found in both bio fluids
were colored in red (pie charts a, c). Equally found piRNAs were marked in blue colors (pie charts b, d)
Biotechnol Lett
123

exclude rRNA, tRNA, snRNA as well as snoRNA
traits. Doing so, the initial data set was gradually
diminished of complexity to improve specificity and
accuracy in the final mapping to miRBase (Kozomara
and Griffiths-Jones 2013) to better identify mature bta
miRNAs. For the analysis of piRNAs, the length cut-
off was set to 26 nt, to reduce the maximum number of
reads that could lead to distortion from the start. The
remaining sequences were aligned to Rfam database
and to all subsets of the 206 species in miRBase
database as an additional filtering step to exclude
further reads that did not show piRNA-specific
criteria. This sequential reduction of unsuitable se-
quences led to the highest achievable specificity and
accuracy of the detected miRNAs and piRNAs,
respectively. This pipeline used the most recent
database versions and since all software tools are
non-commercially available online, it gives the op-
portunity to replicate the presented data management
and analyses.
Physiological differences between plasma
and whole blood small transcriptomes
The encouraging results of research dedicated to find
circulating miRNA biomarkers that exist today are
very promising. miRNomes are profiled to find
differences in expression ratios that are associated
with specific diseases and their progression (Nair et al.
2014). Although this screening strategy works well in
biomarker identification, not much is known about the
origin of circulating small RNAs and their fate or
destination in the circulatory system. There is still a
lack of knowledge about the status quo of miRNA and
piRNA distribution in healthy individuals. That
applies in particular for piRNAs, as they are a younger
class of investigated small RNAs and besides research
in Drosophila melanogaster, the model organism
where they were primarily described, and reproductive
tissue, the organs where they were primarily found,
fewer is examined regarding piRNA distribution in
other tissues and species. Furthermore, it remains
unclear which factors are regulating the concentration
of small RNAs in plasma or if they are actively
regulated at all. Can the circulation be seen as a
repository, where miRNAs come and go, as all organs
are permanently in direct contact to the blood stream?
Additionally, it would be of interest if there is a basis
level of certain small RNAs in a healthy body.
Our small RNA-Seq profiling of healthy randomly
selected bovines indicated that there are core compo-
nents of miRNAs and piRNAs in plasma and whole
blood. The presented profiling enabled an insight into
the basis miRNA and piRNA pattern of healthy
Fig. 4 Matching miRNAs. Zooming into the read-count lists allowed insights into the differential distribution of miRNAs and piRNA
which were expressed higher than the noise ratio of 50 read-counts in blood (red lines) and in plasma (yellow lines)
Biotechnol Lett
123

bovines. As all the individuals showed an expression
of these small RNAs at the same sampling time point,
it may lead to the assumption that those play leading
roles in either blood or plasma. It can be speculated
that, based on the high abundance of specific miRNAs
and piRNAs, the sequencing results mirrored a picture
of the key small RNA modulators, at least of bovines
at that specific age and gender. The analyses indicated
that the sum of circulating small RNAs was not merely
the product of disrupted blood cells, but other tissues
than blood must contribute to the plasma small RNA
pattern. Analysis of matching RNAs raised evidence
that individual miRNAs and piRNAs cannot exclu-
sively originate from cellular components of blood
(e.g. RBCs, thrombocytes, leukocytes) as especially
the content of bta-miR-122, piR-43772, piR-43771
and piR-60565 in plasma exceeded the levels of their
counterparts in whole blood. Moreover, miR-122 is
very well known to be liver-restricted (Long and Chen
2009; Lagos-Quintana et al. 2002) and in the initially
investigated mouse model, Lagos-Quintana et al.
(2002) found out that miR-122 accounted for 72 %
of all investigated liver miRNAs. A profiling of a
healthy human cohort (n = 18) revealed that the most
abundant miRNA in the circulation was hsa-miR-122
(Duttagupta et al. 2011). These findings go in accor-
dance with our data and emphasize the role of this
miRNA. It is well known that miR-122 is relevant in
maintenance of liver homeostasis and has essential
metabolic, anti-inflammatory and anti-tumorigenic
functions in liver (Hsu et al. 2012). Although miR-
122 is a liver-related miRNA, recent research focusses
other diseases in conjunction with it, e.g. sepsis (Wang
et al. 2012). However, a detailed map of allocated
miRNAs throughout an either healthy or dysfunctional
organism is still missing and, regarding the highly
expressed piRNAs, no information about their func-
tions could be found in the literature.
MiR-451 and miR-144 are erythrocyte markers
(Rasmussen et al. 2010) that were found in our blood
data set at 19.6 and 0.02 % respectively. In plasma,
miR-451 held a proportion of 0.4 % and of 0.005 %
for miR-144. Furthermore, a commonly used normal-
ization miRNA, miR-16 (Kirschner et al. 2011) was
marginally expressed in both sample matrices. Other
RBC markers are miR-486 and miR-92a that were
present in our analyzed blood samples (15.3 and 10 %,
respectively) and plasma samples (8.8 and 2.1 %,
respectively). In summary, not all RBC miRNA
markers (miR-16, miR-92a, miR-144, miR-451 and
miR-486) that are commonly applied (Blondal et al.
2013; Pritchard et al. 2012) could be used as such in
our data sets. Therefore, the usability of RBC miRNA
markers in normalizing strategies, e.g. in RT-qPCR
Fig. 5 Matching piRNAs. A flic-flac effect could be observed: three highly abundant piRNAs in whole blood were less expressed in
plasma and vice versa. Three minor expressed piRNAs did not differ in their content in the two compared body fluids
Biotechnol Lett
123

profilings, need to be determined in each individual
case. In a human plasma profiling study via small
RNA-Seq (Williams et al. 2013), the miRNA pattern
seems to be comparable: miR-486, miR-92a, miR-21,
miR-25 and miR-22 were also found in our top 20.
However, their most abundant miR-451, which com-
prises approximately 50 % of the RBC miRNA
content in humans, was not as abundant in our dataset
(0.4 %). An important fact that has to be considered in
explaining alterations between miRNA spectrums in
humans and bovines is the different erythropoiesis. In
cattle, the complete erythropoiesis is located in the
bone marrow and only mature erythrocytes are
released into the circulation. Since erythropoiesis in
humans is not limited to the bone marrow, erythrocyte
precursor cells (reticulocytes) are present in blood.
Their miRNAs could cause alterations in the human
profile compared to bovines.
Conclusions
A comprehensive NGS approach was chosen for the
screening of whole blood and plasma small RNA
specimens in nine healthy bovines. The applied data
evaluation pipeline offered to analyze data regarding
quality and allowed annotation and generation of read-
count tables by aligning sequencing reads to reference
databases (Table 1). The combination of small RNA-
Seq with the presented way of data processing is valuable
for a holistic screening of the miRNA and piRNA
spectrum to make statements about the composition of
matrices (Fig. 1), abundance of miRNAs or piRNAs
(Fig. 2) and compare characteristics (Figs. 4, 5).
The data strengthened evidence that blood cell
miRNAs could contribute to the plasma circulating
small RNA profile. The present specific blood cell
markers that exist in literature were found in plasma,
indicating that the plasma profile could be a down-
sized reflection of the whole blood profile. However,
data also gave an indication that certain miRNAs
circulate in the bloodstream and originate from other
sources than cellular blood components or exhibit
increased stability in plasma (Figs. 4, 5).
Taken together, plasma is a technically challenging
bio fluid for small RNA measurements for several
reasons. First, the concentration of circulating small
RNAs is very low and second, there are so far no
standardized protocols for extraction, library
preparation, sequencing itself and data analysis pro-
cedures nor are there comparable checklists for the
accurate publication of small RNA-Seq experiments
like there are the MIQE guidelines for qPCR ex-
periments (Bustin et al. 2009). Moreover, contamina-
tion with blood cell derived RNAs could be a severe
disturbance in the highly investigated research field of
circulating small RNA biomarkers.
Nevertheless, this study could have laid a founda-
tion for future comparative studies by providing
information about the small RNA signature of bovine
whole blood and plasma. Investigating the status quo
of miRNomes and also piRNomes of healthy indi-
viduals provided a basis to explore the potentially
altered footprints of other parameters, for example,
comparison of different ages, gender, organs, physio-
logical conditions and/or other species. Moreover, the
presented read-count tables could serve as template for
literature-based, targeted gene expression profiling
studies via candidate gene RT-qPCR approaches.
The data pointed out that the circulating miRNA
spectrum was more than just a by-product of dead cells
that remained in extracellular space as it was hy-
pothesized in the past years (Turchinovich et al. 2011).
Finally, this work provided a footprint of miRNAs and
piRNAs revealed by high-throughput sequencing that
could facilitate further biomarker studies in bovine bio
fluids, e.g. saliva or urine. Therefore, the door was
opened to screen the transcriptome to detect small
RNA changes as a result of ruminant maladies, track
physiological changes (e.g. pregnancy) or proof the
illegal administration of anabolic substances or
growth promotors.
References
Arroyo JD, Chevillet JR, Kroh EM, Ruf IK, Pritchard CC,
Gibson DF, Mitchell PS, Bennett CF, Pogosova-Agad-
janyan EL, Stirewalt DL, Tait JF, Tewari M (2011) Arg-
onaute2 complexes carry a population of circulating
microRNAs independent of vesicles in human plasma.
Proc Natl Acad Sci USA 108:5003–5008
Benson DA, Cavanaugh M, Clark K, Karsch-Mizrachi I, Lip-
man DJ, Ostell J, Sayers EW (2013) GenBank. Nucleic
Acid Res 41:D36–D42
Blondal T, Jensby Nielsen S, Baker A, Andreasen D, Mouritzen
P, Wrang Teilum M, Dahlsveen IK (2013) Assessing
sample and miRNA profile quality in serum and plasma or
other biofluids. Methods 59:S1–S6
Biotechnol Lett
123

Burge SW, Daub J, Eberhardt R, Tate J, Barquist L, Nawrocki
EP, Eddy SR, Gardner PP, Bateman A (2013) Rfam 11.0:
10 years of RNA families. Nucleic Acid Res 41:D226–
D232
Bustin SA, Benes V, Garson JA, Hellemans J, Huggett J, Ku-
bista M, Mueller R, Nolan T, Pfaffl MW, Shipley GL,
Vandesompele J, Wittwer CT (2009) The MIQE guideli-
nes: minimum information for publication of quantitative
real-time PCR experiments. Clin Chem 55:611–622
Cheng J, Guo J, Xiao B, Miao Y, Jiang Z, Zhou H, Li Q (2011)
piRNA, the new non-coding RNA, is aberrantly expressed
in human cancer cells. Clin Chim Acta 412:1621–1625
Cui L, Lou Y, Zhang X, Zhou H, Deng H, Song H, Yu X, Xiao B,
Wang W, Guo J (2011) Detection of circulating tumor cells
in peripheral blood from patients with gastric cancer using
piRNAs as markers. Clin Biochem 44:1050–1057
Duttagupta R, Jiang R, Gollub J, Getts RC, Jones KW (2011)
Impact of cellular miRNAs on circulating miRNA
biomarker signatures. PLoS One 6:e20769
Fleige S, Walf V, Huch S, Prgomet C, Sehm J, Pfaffl MW (2006)
Comparison of relative mRNA quantification models and
the impact of RNA integrity in quantitative real-time RT-
PCR. Biotechnol Lett 28:1601–1613
Gou L, Dai P, Liu M (2014) Small noncoding RNAs and male
infertility. Wiley Interdiscip Rev RNA 5:733–745
Hsu S, Wang B, Kota J, Yu J, Costinean S, Kutay H, Yu L, Bai S,
La Perle K, Chivukula RR, Mao H, Wei M, Clark KR,
Mendell JR, Caligiuri MA, Jacob ST, Mendell JT, Ghoshal
K (2012) Essential metabolic, anti-inflammatory, and anti-
tumorigenic functions of miR-122 in liver. J Clin Invest
122:2871–2883
Kirschner MB, Kao SC, Edelman JJ, Armstrong NJ, Vallely MP,
van Zandwijk N, Reid G (2011) Haemolysis during sample
preparation alters microRNA content of plasma. PLoS One
6:e24145
Kozomara A, Griffiths-Jones S (2013) miRBase: annotating
high confidence microRNAs using deep sequencing data.
Nucleic Acid Res 42:D68
Lagos-Quintana M, Rauhut R, Yalcin A, Meyer J, Lendeckel W,
Tuschl T (2002) Identification of tissue-specific mi-
croRNAs from mouse. Curr Biol 12:735–739
Langmead B, Trapnell C, Pop M, Salzberg SL (2009) Ultrafast
and memory-efficient alignment of short DNA sequences
to the human genome. Genome Biol 10:R25
Long J, Chen H (2009) Identification and characteristics of
cattle microRNAs by homology searching and small RNA
cloning. Biochem Genet 47:329–343
Mitchell PS, Parkin RK, Kroh EM, Fritz BR, Wyman SK, Po-
gosova-Agadjanyan EL, Peterson A, Noteboom J, O’Briant
KC, Allen A, Lin DW, Urban N, Drescher CW, Knudsen
BS, Stirewalt DL, Gentleman R, Vessella RL, Nelson PS,
Martin DB, Tewari M (2008) Circulating microRNAs as
stable blood-based markers for cancer detection. Proc Natl
Acad Sci USA 105:10513–10518
Nair VS, Pritchard CC, Tewari M, Ioannidis, John PA (2014)
Design and analysis for studying microRNAs in human
disease: a primer on -omic technologies. Am J Epidemiol
180:140–152
Pritchard CC, Kroh E, Wood B, Arroyo JD, Dougherty KJ,
Miyaji MM, Tait JF, Tewari M (2012) Blood cell origin of
circulating microRNAs: a cautionary note for cancer
biomarker studies. Cancer Prev Res (Phila) 5:492–497
Qi P, Du X (2013) The long non-coding RNAs, a new cancer
diagnostic and therapeutic gold mine. Mod Pathol
26:155–165
Ramkissoon SH, Mainwaring LA, Ogasawara Y, Keyvanfar K,
McCoy JP, Sloand EM, Kajigaya S, Young NS (2006)
Hematopoietic-specific microRNA expression in human
cells. Leuk Res 30:643–647
Rasmussen KD, Simmini S, Abreu-Goodger C, Bartonicek N,
Di Giacomo M, Bilbao-Cortes D, Horos R, von Lindern M,
Enright AJ, O’Carroll D (2010) The miR-144/451 locus is
required for erythroid homeostasis. J Exp Med
207:1351–1358
Spornraft M, Kirchner B, Haase B, Benes V, Pfaffl MW,
Riedmaier I (2014) Optimization of extraction of circu-
lating RNAs from plasma—enabling small RNA se-
quencing. PLoS One 9:e107259
Turchinovich A, Weiz L, Langheinz A, Burwinkel B (2011)
Characterization of extracellular circulating microRNA.
Nucleic Acid Res 39:7223–7233
Vasilatou D, Papageorgiou S, Pappa V, Papageorgiou E, Der-
venoulas J (2010) The role of microRNAs in normal and
malignant hematopoiesis. Eur J Haematol 84:1–16
Vickers KC, Palmisano BT, Shoucri BM, Shamburek RD, Re-
maley AT (2011) MicroRNAs are transported in plasma
and delivered to recipient cells by high-density lipopro-
teins. Nat Cell Biol 13:423–433
Wang K, Zhang S, Weber J, Baxter D, Galas DJ (2010) Export
of microRNAs and microRNA-protective protein by
mammalian cells. Nucleic Acids Res 38:7248–7259
Wang H, Zhang P, Chen W, Feng D, Jia Y, Xie L (2012) Serum
microRNA signatures identified by Solexa sequencing
predict sepsis patients’ mortality: a prospective observa-
tional study. PLoS One 7:e38885
Weber JA, Baxter DH, Zhang S, Huang DY, How Huang K, Jen
Lee M, Galas DJ, Wang K (2010) The microRNA spectrum
in 12 body fluids. Clin Chem 56:1733–1741
Williams Z, Ben-Dov IZ, Elias R, Mihailovic A, Brown M,
Rosenwaks Z, Tuschl T (2013) Comprehensive profiling of
circulating microRNA via small RNA sequencing of
cDNA libraries reveals biomarker potential and limita-
tions. Proc Natl Acad Sci USA 110:4255–4260
Biotechnol Lett
123