Comparison of somatic mutation landscapes in Chinese ...
8
ARTICLE Comparison of somatic mutation landscapes in Chinese versus European breast cancer patients Bin Zhu, 1 Lijin Joo, 1 Tongwu Zhang, 1 Hela Koka, 1 DongHyuk Lee, 1 Jianxin Shi, 1 Priscilla Lee, 2 Difei Wang, 1,3 Feng Wang, 2 Wing-cheong Chan, 4 Sze Hong Law, 4,5 Yee-kei Tsoi, 4 Gary M. Tse, 6 Shui Wun Lai, 7 Cherry Wu, 7 Shuyuan Yang, 2 Emily Ying Yang Chan, 2 Samuel Yeung Shan Wong, 2 Mingyi Wang, 1,3 Lei Song, 1,3 Kristine Jones, 1,3 Bin Zhu, 1,3 Amy Hutchinson, 1,3 Belynda Hicks, 1,3 Ludmila Prokunina-Olsson, 1 Montserrat Garcia-Closas, 1 Stephen Chanock, 1 Lap Ah Tse, 2, * and Xiaohong R. Yang 1, * Summary Recent genomic studies suggest that Asian breast cancer (BC) may have distinct somatic features; however, most comparisons of BC genomic features across populations did not account for differences in age, subtype, and sequencing methods. In this study, we analyzed whole-exome sequencing (WES) data to characterize somatic copy number alterations (SCNAs) and mutation profiles in 98 Hong Kong BC (HKBC) patients and compared with those from The Cancer Genome Atlas of European ancestry (TCGA-EA, N ¼ 686), which had similar distributions of age at diagnosis and PAM50 subtypes as in HKBC. We developed a two-sample Poisson model to compare driver gene selection pressure, which reflects the effect sizes of cancer driver genes, while accounting for differences in sample size, sequencing platforms, depths, and mutation calling methods. We found that somatic mutation and SCNA profiles were overall very similar between HKBC and TCGA-EA. The selection pressure for small insertions and deletions (indels) in GATA3 (false discovery rate (FDR) corrected p < 0.01) and single-nucleotide variants (SNVs) in TP53 (nominal p ¼ 0.02, FDR corrected p ¼ 0.28) was lower in HKBC than in TCGA-EA. Among the 13 signatures of single-base substitutions (SBS) that are common in BC, we found a suggestively higher contribution of SBS18 and a lower contribution of SBS1 in HKBC than in TCGA-EA, while the two APOBEC-induced signatures showed similar prevalence. Our results suggest that the genomic landscape of BC was largely very similar between HKBC and TCGA-EA, despite suggestive differences in some driver genes and mutational signatures that warrant future investigations in large and diverse Asian populations. Introduction Despite being lower than in North America and Europe, 1 the incidence rates for invasive female breast cancer (BC) [MIM: 114480] have been increasing rapidly in many Asian populations. Moreover, Asian women seem to have a distinct profile of BC, such as earlier age at onset and higher frequencies of luminal B and HER2-enriched tu- mors, compared with European populations. 2 Recent genomic studies based on a limited number of Asian sub- jects suggest that Asian breast tumors may display a higher frequency of somatic mutations in TP53[MIM: 191170] 3–5 and distinct immune gene expression profiles. 4–6 In partic- ular, a germline APOBEC3B deletion polymorphism [MIM:607110], which has been associated with increased BC risk 7 and increased APOBEC-associated mutation signa- tures in BC, 8,9 is much more common in East Asians (31.2%) than in Europeans (9.0%) and West Africans (4.2%). These previous studies suggest that East Asian breast tumors may exhibit a distinct somatic profile compared with other BC populations. Cancer develops as a result of somatic mutations and clonal selection. The selection pressure of somatic muta- tions in cancer driver genes reflects the adaptiveness or ef- fect size of clonal selection. 10,11 The positive selection pres- sure indicates that the corresponding cancer subclone has a growth advantage over normal cells and other cancer subclones. Selection pressure is frequently measured by dN/dS ratio, which represents the mutation rate of nonsy- nonymous (NS) mutations (including missense, nonsense, splicing site mutations, and insertions and deletions (in- dels)) versus the mutation rate of synonymous muta- tions. 11 In previous studies, population differences in the driver gene landscape were compared primarily based on mutation frequencies among study populations. However, these comparisons are sensitive to differences in sequencing platforms and bioinformatic analyses. 12 On the other hand, by leveraging mutation rates of synony- mous mutations as the reference group, the dN/dS ratio is less sensitive to variations in sequencing and somatic mutation calling, assuming the technical variations are not discriminative against the function of mutations. In 1 Division of Cancer Epidemiology and Genetics, National Cancer Institute, National Institutes of Health, Rockville, MD, USA; 2 Division of Occupational and Environmental Health, The Chinese University of Hong Kong, Hong Kong, China; 3 Cancer Genomics Research Laboratory, Leidos Biomedical Research, Frederick National Laboratory for Cancer Research, Frederick, MD, USA; 4 Department of Surgery, North District Hospital, Hong Kong, China; 5 Department of Pathology, Yan Chai Hospital, Hong Kong, China; 6 Department of Anatomical and Cellular Pathology, Prince of Wales Hospital, The Chi- nese University of Hong Kong, Hong Kong, China; 7 Department of Pathology, North District Hospital, Hong Kong, China *Correspondence: [email protected] (X.R.Y.), [email protected] (L.A.T.) https://doi.org/10.1016/j.xhgg.2021.100076. Human Genetics and Genomics Advances 3, 100076, January 13, 2022 1 Ó 2021 The Authors. This is an open access article under the CC BY-NC-ND IGO license (http://creativecommons.org/licenses/by-nc-nd/3.0/igo/).
-
Upload
khangminh22 -
Category
Documents
-
view
4 -
download
0
Transcript of Comparison of somatic mutation landscapes in Chinese ...
ARTICLE
Comparison of somatic mutation landscapes in Chineseversus European breast cancer patients
Bin Zhu,1 Lijin Joo,1 Tongwu Zhang,1 Hela Koka,1 DongHyuk Lee,1 Jianxin Shi,1 Priscilla Lee,2
Difei Wang,1,3 Feng Wang,2 Wing-cheong Chan,4 Sze Hong Law,4,5 Yee-kei Tsoi,4 Gary M. Tse,6
Shui Wun Lai,7 Cherry Wu,7 Shuyuan Yang,2 Emily Ying Yang Chan,2 Samuel Yeung Shan Wong,2
Mingyi Wang,1,3 Lei Song,1,3 Kristine Jones,1,3 Bin Zhu,1,3 Amy Hutchinson,1,3 Belynda Hicks,1,3
Ludmila Prokunina-Olsson,1 Montserrat Garcia-Closas,1 Stephen Chanock,1 Lap Ah Tse,2,*and Xiaohong R. Yang1,*
Summary
Recent genomic studies suggest that Asian breast cancer (BC) may have distinct somatic features; however, most comparisons of BC
genomic features across populations did not account for differences in age, subtype, and sequencingmethods. In this study, we analyzed
whole-exome sequencing (WES) data to characterize somatic copy number alterations (SCNAs) and mutation profiles in 98 Hong Kong
BC (HKBC) patients and compared with those from The Cancer Genome Atlas of European ancestry (TCGA-EA, N ¼ 686), which had
similar distributions of age at diagnosis and PAM50 subtypes as in HKBC. We developed a two-sample Poisson model to compare driver
gene selection pressure, which reflects the effect sizes of cancer driver genes, while accounting for differences in sample size, sequencing
platforms, depths, andmutation calling methods. We found that somatic mutation and SCNA profiles were overall very similar between
HKBC and TCGA-EA. The selection pressure for small insertions and deletions (indels) inGATA3 (false discovery rate (FDR) corrected p<
0.01) and single-nucleotide variants (SNVs) in TP53 (nominal p ¼ 0.02, FDR corrected p ¼ 0.28) was lower in HKBC than in TCGA-EA.
Among the 13 signatures of single-base substitutions (SBS) that are common in BC, we found a suggestively higher contribution of SBS18
and a lower contribution of SBS1 in HKBC than in TCGA-EA, while the two APOBEC-induced signatures showed similar prevalence.Our
results suggest that the genomic landscape of BC was largely very similar between HKBC and TCGA-EA, despite suggestive differences in
some driver genes and mutational signatures that warrant future investigations in large and diverse Asian populations.
Introduction
Despite being lower than in North America and Europe,1
the incidence rates for invasive female breast cancer (BC)
[MIM: 114480] have been increasing rapidly in many
Asian populations. Moreover, Asian women seem to have
a distinct profile of BC, such as earlier age at onset and
higher frequencies of luminal B and HER2-enriched tu-
mors, compared with European populations.2 Recent
genomic studies based on a limited number of Asian sub-
jects suggest that Asian breast tumors may display a higher
frequency of somatic mutations in TP53[MIM: 191170]3–5
and distinct immune gene expression profiles.4–6 In partic-
ular, a germline APOBEC3B deletion polymorphism
[MIM:607110], which has been associated with increased
BC risk7 and increased APOBEC-associated mutation signa-
tures in BC,8,9 is much more common in East Asians
(31.2%) than in Europeans (9.0%) and West Africans
(4.2%). These previous studies suggest that East Asian
breast tumors may exhibit a distinct somatic profile
compared with other BC populations.
1Division of Cancer Epidemiology and Genetics, National Cancer Institute, N
and Environmental Health, The Chinese University of Hong Kong, Hong
Research, Frederick National Laboratory for Cancer Research, Frederick, MD,5Department of Pathology, Yan Chai Hospital, Hong Kong, China; 6Departmen
nese University of Hong Kong, Hong Kong, China; 7Department of Pathology
*Correspondence: [email protected] (X.R.Y.), [email protected] (L.A.T.)
https://doi.org/10.1016/j.xhgg.2021.100076.
Human
� 2021 The Authors. This is an open access article under the CC BY-NC-ND I
Cancer develops as a result of somatic mutations and
clonal selection. The selection pressure of somatic muta-
tions in cancer driver genes reflects the adaptiveness or ef-
fect size of clonal selection.10,11 The positive selection pres-
sure indicates that the corresponding cancer subclone has
a growth advantage over normal cells and other cancer
subclones. Selection pressure is frequently measured by
dN/dS ratio, which represents the mutation rate of nonsy-
nonymous (NS) mutations (including missense, nonsense,
splicing site mutations, and insertions and deletions (in-
dels)) versus the mutation rate of synonymous muta-
tions.11 In previous studies, population differences in the
driver gene landscape were compared primarily based on
mutation frequencies among study populations. However,
these comparisons are sensitive to differences in
sequencing platforms and bioinformatic analyses.12 On
the other hand, by leveraging mutation rates of synony-
mous mutations as the reference group, the dN/dS ratio
is less sensitive to variations in sequencing and somatic
mutation calling, assuming the technical variations are
not discriminative against the function of mutations. In
ational Institutes of Health, Rockville, MD, USA; 2Division of Occupational
Kong, China; 3Cancer Genomics Research Laboratory, Leidos Biomedical
USA; 4Department of Surgery, North District Hospital, Hong Kong, China;
t of Anatomical and Cellular Pathology, Prince of Wales Hospital, The Chi-
, North District Hospital, Hong Kong, China
Genetics and Genomics Advances 3, 100076, January 13, 2022 1
GO license (http://creativecommons.org/licenses/by-nc-nd/3.0/igo/).
addition, although the same set of cancer driver genes may
present in different populations, the effect size of selection
can be different. Cannataro et al. estimated the selection
pressure of all recurrent single-nucleotide variants (SNVs)
in 22 cancer types in The Cancer Genome Atlas (TCGA)
and found that selection pressures varied considerably
across cancer types, even within the same cancer type.13
For example, although TP53 is a driver gene for all BC sub-
types, TP53 mutations present with higher selection pres-
sure in ER-negative than ER-positive BCs. Comparing the
selection pressure of driver genes in different populations
may therefore provide a more accurate and quantitative
measure to evaluate racial heterogeneity of somatic muta-
tions than comparing mutation frequencies alone. In this
study, we compared driver gene selection pressure, as
well as mutational signatures and somatic copy number
alteration (SCNA) profiles, between Chinese and TCGA
BC patients of European ancestry that had similar distribu-
tions of age at diagnosis and PAM50 subtypes.
Methods
Participants and samplesWe analyzed data and biospecimens collected from a hospital-
based BC case-control study in Hong Kong BC (HKBC), as previ-
ously described.14 In brief, fresh frozen breast tumors and paired
normal tissues were collected from newly diagnosed BC patients
of Han Chinese ancestry in two Hong Kong hospitals between
2013 and 2016. Patients with pre-surgery treatment were excluded
from the study. Clinical characteristics and BC risk factors were ob-
tained frommedical records and a questionnaire. The study proto-
col was approved by ethics committees of the Joint Chinese Uni-
versity of Hong Kong, New Territories East Cluster, the Kowloon
West Cluster, and the National Cancer Institute (NCI). Written
informed consent was obtained prior to the surgery for all
participants.
Bioinformatic analysesPaired tumor and histologically normal breast tissue samples were
processed for pathology review at the Biospecimen Core Resource
(BCR), Nationwide Children’s Hospital, using modified TCGA
criteria.8 Specifically, only tumors with >50% tumor cells and
normal tissue with no detected tumor cells were included for
dual DNA/RNA extraction.
Whole-exome sequencing (WES) was performed on 98 paired
tumor and normal samples at the Cancer Genomics Research Lab-
oratory (CGR), NCI, using SeqCAP EZ Human Exome Library v3.0
(Roche NimbleGen, Madison, WI) for exome sequence capture.
The captured DNA was then subjected to paired-end sequencing
utilizing Illumina HiSeq2000. The average sequencing depth was
106.2x for tumors and 47.6x for the paired blood or normal tis-
sues. Somatic mutations were called using four different algo-
rithms (MuTect,15 MuTect2 (GATK tool), Strelka,16 and TNScope
by Sentieon)17 and the final variant calls were based on mutations
called by three or more of four established callers. Variants were
excluded if they did not pass the pipeline quality control metrics,
had variant allele fraction (VAF) < 0.07 in tumor, VAF >0.02 in
normal, alternative allele read count <3 or total read count <8
in tumor, total read count <6 in normal. In addition, variants
2 Human Genetics and Genomics Advances 3, 100076, January 13, 2
would be excluded if its minor allele frequency (MAF) was
>0.1% in reference germline variant databases including 1,000
Genomes Project,18 the ESP6500 dataset from University of Wash-
ington’s Exome Sequencing Project (http://evs.gs.washington.
edu/EVS/), or ExAC.19
SNP rs12628403, which is a proxy for the APOBEC3B deletion
(r2 ¼ 1.00 in Chinese from Beijing (CHB) in HapMap samples),
was genotyped in germline DNA with a custom TaqMan assay, as
previously described.20
RNA sequencing (RNA-Seq) data were generated in these tumors
at Macrogen Corporation on Illumina HiSeq4000 using a TruSeq
stranded RNA kit with Ribo-Zero for rRNA depletion and 100-bp
paired-end method. Gene expression was quantified as transcript
per million (TPM) using RSEM,21 and log2TPM was used for statis-
tical analyses. PAM50 subtype, which is a 50-gene signature that
classifies BC into five molecular intrinsic subtypes, was defined
by an absolute intrinsic subtyping (AIMS) method22 using RNA-
Seq data.6 For patients without RNASeq data, subtype was defined
using immunohistochemical status of estrogen receptor (ER), pro-
gesterone receptor (PR), and human epidermal growth factor re-
ceptor-2 (HER2).
TCGA datasetWe included 686 BC patients of European ancestry in TCGA
(TCGA-EA, defined by the study information) with both WES
and RNA-Seq as a comparison dataset. WES calls for 779 BC tu-
mors, which were downloaded from Multi-Center Mutation Call-
ing in Multiple Cancers (MC3),23 and tumors from non-European
ancestry patients were excluded. RNA-Seq data were downloaded
from the NCI’s Genomic Data Commons (GDC) (legacy archive)
and processed and quantified using similar methods as in HKBC.
PAM50 was called using the same AIMS method for each TCGA
sample, as it was used for HKBC. The somatic mutation files
(including called variants and SCNAs) were obtained from the
pan-cancer TCGA study,23 and variants were processed and filtered
using the same criteria as in HKBC.
Mutational signaturesGiven the limited sample size of the HKBC study, we did not
perform de novomutation signature analysis. Instead, we evaluated
contributions of 13 COSMIC single-base substitution (SBS) signa-
tures that were previously reported to be common in BC (SBS1,
SBS2, SBS3, SBS5, SBS8, SBS9, SBS13, SBS17a, SBS17b, SBS18,
SBS37, SBS40, and SBS41).24 SBS signatures were defined by 96
mutational catalogs, each of which refers to a mutated pyrimidine
(C or T) in the center and two flanking nucleotides (flanking 50
AND-30 bases). SignatureEstimation (version 1.0.0),25 SIGNAL
(downloaded around Nov 2021),26 and YAPSA (version 1.19.0)27
were used to evaluate the contribution of each COSMIC SBS signa-
ture (version 3.2) with confidence for each tumor sample.
Driver gene detectiondNdScv11 (version 0.1.0) with the default arguments was used to
identify driver and significantly mutated genes (SMGs) (the signif-
icance was defined as false discovery rate (FDR) q < 0.01), which
were compared with previously identified BC driver genes.23 For
this analysis, we further filtered out somatic mutations with VAF
<0.1. After the filtering step and restricting the variants to those
in protein-coding regions, 39,439 mutations from 686 TCGA-EA
samples (98.7% are singletons) and 5,116 mutations from 98
HKBC samples (98.8% singletons) were used for the selection
022
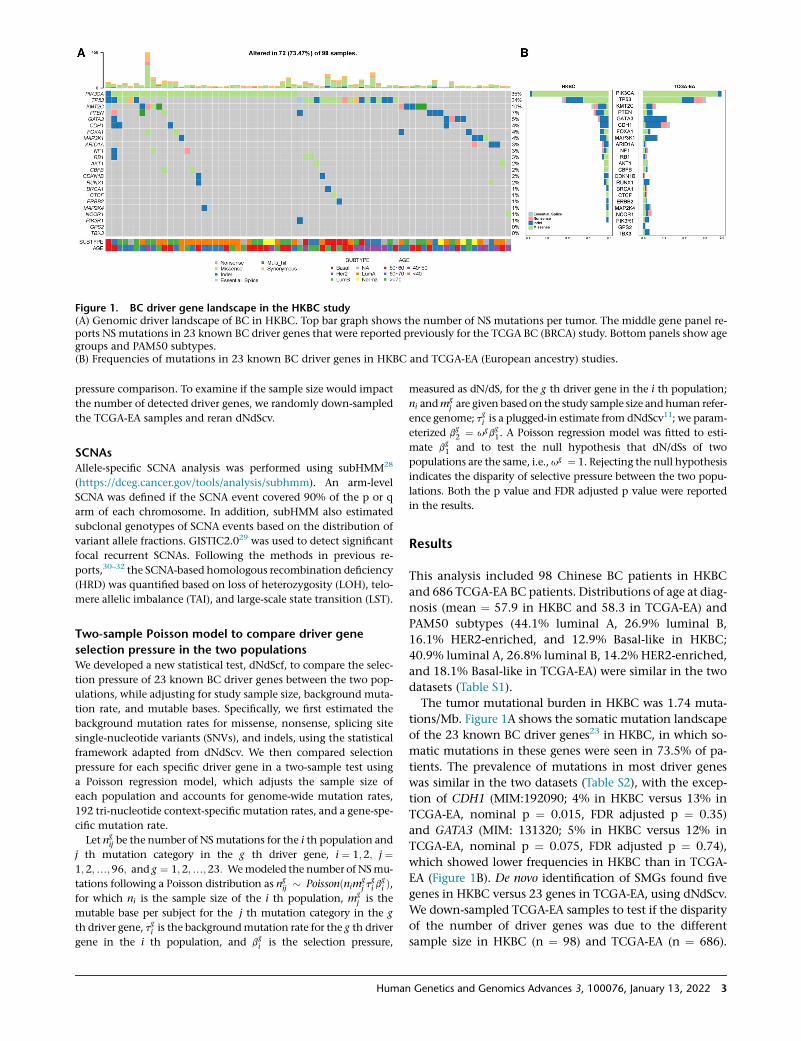
Figure 1. BC driver gene landscape in the HKBC study(A) Genomic driver landscape of BC in HKBC. Top bar graph shows the number of NS mutations per tumor. The middle gene panel re-ports NS mutations in 23 known BC driver genes that were reported previously for the TCGA BC (BRCA) study. Bottom panels show agegroups and PAM50 subtypes.(B) Frequencies of mutations in 23 known BC driver genes in HKBC and TCGA-EA (European ancestry) studies.
pressure comparison. To examine if the sample size would impact
the number of detected driver genes, we randomly down-sampled
the TCGA-EA samples and reran dNdScv.
SCNAsAllele-specific SCNA analysis was performed using subHMM28
(https://dceg.cancer.gov/tools/analysis/subhmm). An arm-level
SCNA was defined if the SCNA event covered 90% of the p or q
arm of each chromosome. In addition, subHMM also estimated
subclonal genotypes of SCNA events based on the distribution of
variant allele fractions. GISTIC2.029 was used to detect significant
focal recurrent SCNAs. Following the methods in previous re-
ports,30–32 the SCNA-based homologous recombination deficiency
(HRD) was quantified based on loss of heterozygosity (LOH), telo-
mere allelic imbalance (TAI), and large-scale state transition (LST).
Two-sample Poisson model to compare driver gene
selection pressure in the two populationsWe developed a new statistical test, dNdScf, to compare the selec-
tion pressure of 23 known BC driver genes between the two pop-
ulations, while adjusting for study sample size, background muta-
tion rate, and mutable bases. Specifically, we first estimated the
background mutation rates for missense, nonsense, splicing site
single-nucleotide variants (SNVs), and indels, using the statistical
framework adapted from dNdScv. We then compared selection
pressure for each specific driver gene in a two-sample test using
a Poisson regression model, which adjusts the sample size of
each population and accounts for genome-wide mutation rates,
192 tri-nucleotide context-specific mutation rates, and a gene-spe-
cific mutation rate.
Let ngij be the number of NSmutations for the i th population and
j th mutation category in the g th driver gene, i ¼ 1;2; j ¼1;2;.;96; and g ¼ 1;2;.;23: Wemodeled the number of NSmu-
tations following a Poisson distribution as ngij � Poissonðnim
gj t
gi b
gi Þ,
for which ni is the sample size of the i th population, mgj is the
mutable base per subject for the j th mutation category in the g
th driver gene, tgi is the backgroundmutation rate for the g th driver
gene in the i th population, and bgi is the selection pressure,
Human
measured as dN/dS, for the g th driver gene in the i th population;
ni andmgj are given based on the study sample size andhuman refer-
ence genome; tgi is a plugged-in estimate from dNdScv11; we param-
eterized bg2 ¼ ugb
g1. A Poisson regression model was fitted to esti-
mate bg1 and to test the null hypothesis that dN/dSs of two
populations are the same, i.e.,ug ¼ 1. Rejecting the null hypothesis
indicates the disparity of selective pressure between the two popu-
lations. Both the p value and FDR adjusted p value were reported
in the results.
Results
This analysis included 98 Chinese BC patients in HKBC
and 686 TCGA-EA BC patients. Distributions of age at diag-
nosis (mean ¼ 57.9 in HKBC and 58.3 in TCGA-EA) and
PAM50 subtypes (44.1% luminal A, 26.9% luminal B,
16.1% HER2-enriched, and 12.9% Basal-like in HKBC;
40.9% luminal A, 26.8% luminal B, 14.2% HER2-enriched,
and 18.1% Basal-like in TCGA-EA) were similar in the two
datasets (Table S1).
The tumor mutational burden in HKBC was 1.74 muta-
tions/Mb. Figure 1A shows the somatic mutation landscape
of the 23 known BC driver genes23 in HKBC, in which so-
matic mutations in these genes were seen in 73.5% of pa-
tients. The prevalence of mutations in most driver genes
was similar in the two datasets (Table S2), with the excep-
tion of CDH1 (MIM:192090; 4% in HKBC versus 13% in
TCGA-EA, nominal p ¼ 0.015, FDR adjusted p ¼ 0.35)
and GATA3 (MIM: 131320; 5% in HKBC versus 12% in
TCGA-EA, nominal p ¼ 0.075, FDR adjusted p ¼ 0.74),
which showed lower frequencies in HKBC than in TCGA-
EA (Figure 1B). De novo identification of SMGs found five
genes in HKBC versus 23 genes in TCGA-EA, using dNdScv.
We down-sampled TCGA-EA samples to test if the disparity
of the number of driver genes was due to the different
sample size in HKBC (n ¼ 98) and TCGA-EA (n ¼ 686).
Genetics and Genomics Advances 3, 100076, January 13, 2022 3
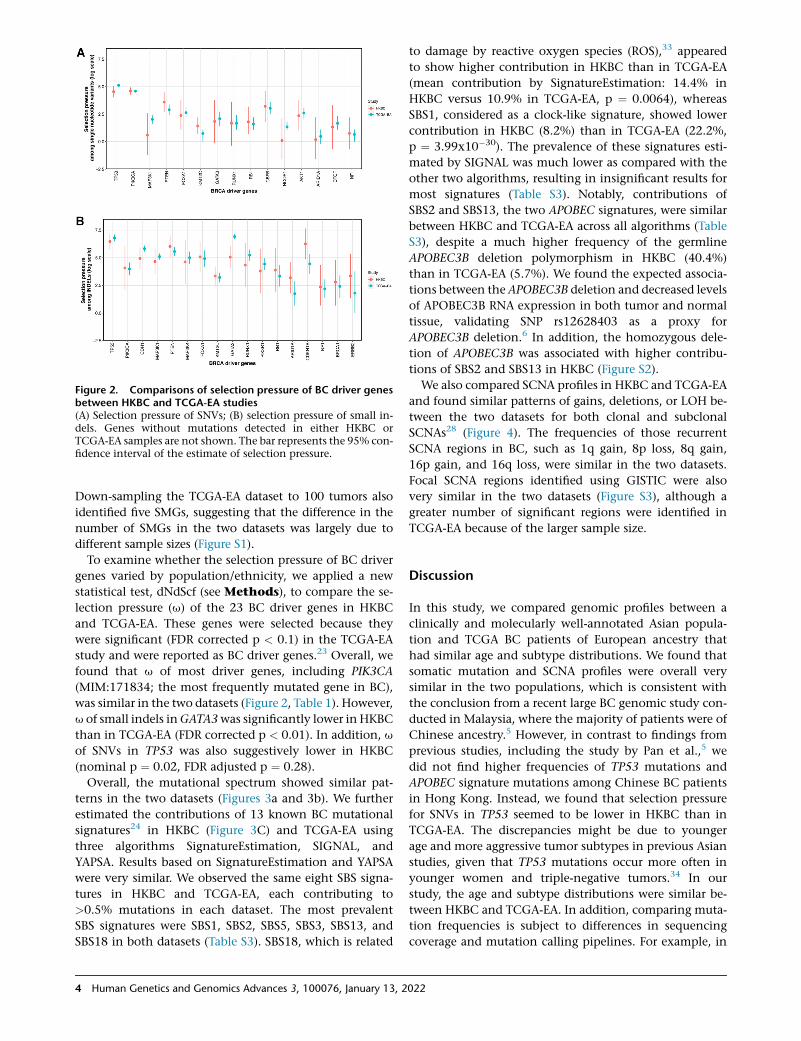
Figure 2. Comparisons of selection pressure of BC driver genesbetween HKBC and TCGA-EA studies(A) Selection pressure of SNVs; (B) selection pressure of small in-dels. Genes without mutations detected in either HKBC orTCGA-EA samples are not shown. The bar represents the 95% con-fidence interval of the estimate of selection pressure.
Down-sampling the TCGA-EA dataset to 100 tumors also
identified five SMGs, suggesting that the difference in the
number of SMGs in the two datasets was largely due to
different sample sizes (Figure S1).
To examine whether the selection pressure of BC driver
genes varied by population/ethnicity, we applied a new
statistical test, dNdScf (see Methods), to compare the se-
lection pressure (u) of the 23 BC driver genes in HKBC
and TCGA-EA. These genes were selected because they
were significant (FDR corrected p < 0.1) in the TCGA-EA
study and were reported as BC driver genes.23 Overall, we
found that u of most driver genes, including PIK3CA
(MIM:171834; the most frequently mutated gene in BC),
was similar in the two datasets (Figure 2, Table 1). However,
u of small indels inGATA3was significantly lower in HKBC
than in TCGA-EA (FDR corrected p < 0.01). In addition, u
of SNVs in TP53 was also suggestively lower in HKBC
(nominal p ¼ 0.02, FDR adjusted p ¼ 0.28).
Overall, the mutational spectrum showed similar pat-
terns in the two datasets (Figures 3a and 3b). We further
estimated the contributions of 13 known BC mutational
signatures24 in HKBC (Figure 3C) and TCGA-EA using
three algorithms SignatureEstimation, SIGNAL, and
YAPSA. Results based on SignatureEstimation and YAPSA
were very similar. We observed the same eight SBS signa-
tures in HKBC and TCGA-EA, each contributing to
>0.5% mutations in each dataset. The most prevalent
SBS signatures were SBS1, SBS2, SBS5, SBS3, SBS13, and
SBS18 in both datasets (Table S3). SBS18, which is related
4 Human Genetics and Genomics Advances 3, 100076, January 13, 2
to damage by reactive oxygen species (ROS),33 appeared
to show higher contribution in HKBC than in TCGA-EA
(mean contribution by SignatureEstimation: 14.4% in
HKBC versus 10.9% in TCGA-EA, p ¼ 0.0064), whereas
SBS1, considered as a clock-like signature, showed lower
contribution in HKBC (8.2%) than in TCGA-EA (22.2%,
p ¼ 3.99x10�30). The prevalence of these signatures esti-
mated by SIGNAL was much lower as compared with the
other two algorithms, resulting in insignificant results for
most signatures (Table S3). Notably, contributions of
SBS2 and SBS13, the two APOBEC signatures, were similar
between HKBC and TCGA-EA across all algorithms (Table
S3), despite a much higher frequency of the germline
APOBEC3B deletion polymorphism in HKBC (40.4%)
than in TCGA-EA (5.7%). We found the expected associa-
tions between the APOBEC3B deletion and decreased levels
of APOBEC3B RNA expression in both tumor and normal
tissue, validating SNP rs12628403 as a proxy for
APOBEC3B deletion.6 In addition, the homozygous dele-
tion of APOBEC3B was associated with higher contribu-
tions of SBS2 and SBS13 in HKBC (Figure S2).
We also compared SCNA profiles in HKBC and TCGA-EA
and found similar patterns of gains, deletions, or LOH be-
tween the two datasets for both clonal and subclonal
SCNAs28 (Figure 4). The frequencies of those recurrent
SCNA regions in BC, such as 1q gain, 8p loss, 8q gain,
16p gain, and 16q loss, were similar in the two datasets.
Focal SCNA regions identified using GISTIC were also
very similar in the two datasets (Figure S3), although a
greater number of significant regions were identified in
TCGA-EA because of the larger sample size.
Discussion
In this study, we compared genomic profiles between a
clinically and molecularly well-annotated Asian popula-
tion and TCGA BC patients of European ancestry that
had similar age and subtype distributions. We found that
somatic mutation and SCNA profiles were overall very
similar in the two populations, which is consistent with
the conclusion from a recent large BC genomic study con-
ducted in Malaysia, where the majority of patients were of
Chinese ancestry.5 However, in contrast to findings from
previous studies, including the study by Pan et al.,5 we
did not find higher frequencies of TP53 mutations and
APOBEC signature mutations among Chinese BC patients
in Hong Kong. Instead, we found that selection pressure
for SNVs in TP53 seemed to be lower in HKBC than in
TCGA-EA. The discrepancies might be due to younger
age and more aggressive tumor subtypes in previous Asian
studies, given that TP53 mutations occur more often in
younger women and triple-negative tumors.34 In our
study, the age and subtype distributions were similar be-
tween HKBC and TCGA-EA. In addition, comparing muta-
tion frequencies is subject to differences in sequencing
coverage and mutation calling pipelines. For example, in
022
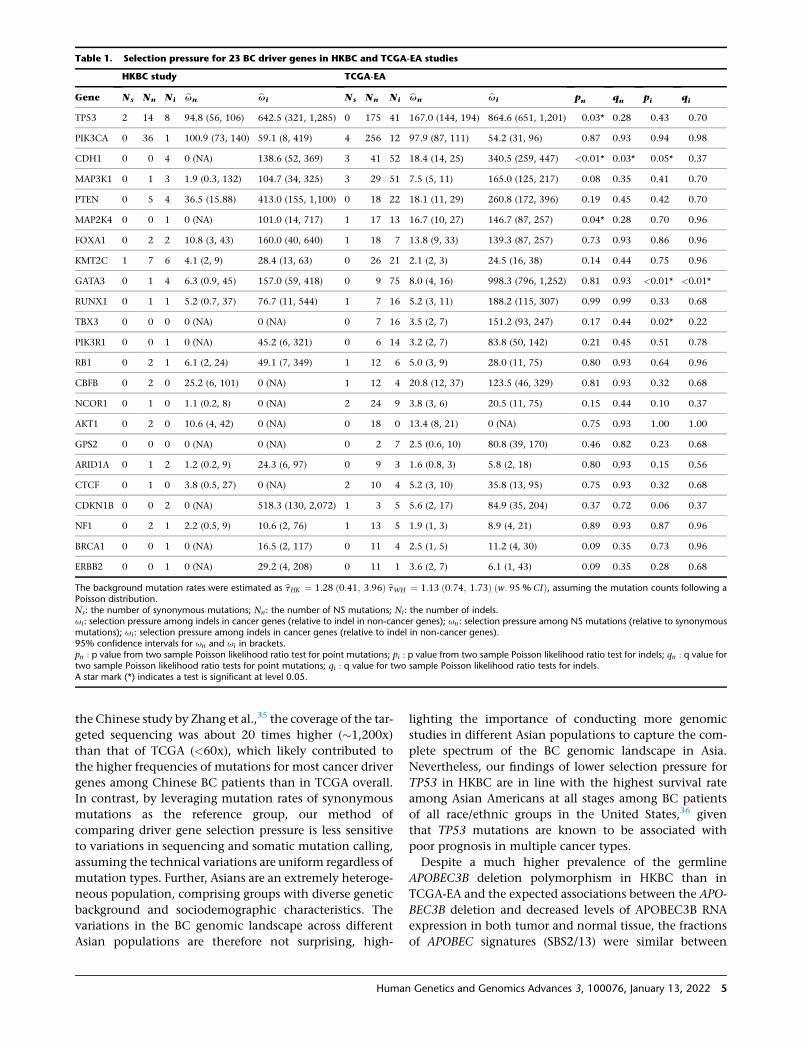
Table 1. Selection pressure for 23 BC driver genes in HKBC and TCGA-EA studies
HKBC study TCGA-EA
Gene Ns Nn Ni bun; bui Ns Nn Ni bun bui pn qn pi qi
TP53 2 14 8 94.8 (56, 106) 642.5 (321, 1,285) 0 175 41 167.0 (144, 194) 864.6 (651, 1,201) 0.03* 0.28 0.43 0.70
PIK3CA 0 36 1 100.9 (73, 140) 59.1 (8, 419) 4 256 12 97.9 (87, 111) 54.2 (31, 96) 0.87 0.93 0.94 0.98
CDH1 0 0 4 0 (NA) 138.6 (52, 369) 3 41 52 18.4 (14, 25) 340.5 (259, 447) <0.01* 0.03* 0.05* 0.37
MAP3K1 0 1 3 1.9 (0.3, 132) 104.7 (34, 325) 3 29 51 7.5 (5, 11) 165.0 (125, 217) 0.08 0.35 0.41 0.70
PTEN 0 5 4 36.5 (15.88) 413.0 (155, 1,100) 0 18 22 18.1 (11, 29) 260.8 (172, 396) 0.19 0.45 0.42 0.70
MAP2K4 0 0 1 0 (NA) 101.0 (14, 717) 1 17 13 16.7 (10, 27) 146.7 (87, 257) 0.04* 0.28 0.70 0.96
FOXA1 0 2 2 10.8 (3, 43) 160.0 (40, 640) 1 18 7 13.8 (9, 33) 139.3 (87, 257) 0.73 0.93 0.86 0.96
KMT2C 1 7 6 4.1 (2, 9) 28.4 (13, 63) 0 26 21 2.1 (2, 3) 24.5 (16, 38) 0.14 0.44 0.75 0.96
GATA3 0 1 4 6.3 (0.9, 45) 157.0 (59, 418) 0 9 75 8.0 (4, 16) 998.3 (796, 1,252) 0.81 0.93 <0.01* <0.01*
RUNX1 0 1 1 5.2 (0.7, 37) 76.7 (11, 544) 1 7 16 5.2 (3, 11) 188.2 (115, 307) 0.99 0.99 0.33 0.68
TBX3 0 0 0 0 (NA) 0 (NA) 0 7 16 3.5 (2, 7) 151.2 (93, 247) 0.17 0.44 0.02* 0.22
PIK3R1 0 0 1 0 (NA) 45.2 (6, 321) 0 6 14 3.2 (2, 7) 83.8 (50, 142) 0.21 0.45 0.51 0.78
RB1 0 2 1 6.1 (2, 24) 49.1 (7, 349) 1 12 6 5.0 (3, 9) 28.0 (11, 75) 0.80 0.93 0.64 0.96
CBFB 0 2 0 25.2 (6, 101) 0 (NA) 1 12 4 20.8 (12, 37) 123.5 (46, 329) 0.81 0.93 0.32 0.68
NCOR1 0 1 0 1.1 (0.2, 8) 0 (NA) 2 24 9 3.8 (3, 6) 20.5 (11, 75) 0.15 0.44 0.10 0.37
AKT1 0 2 0 10.6 (4, 42) 0 (NA) 0 18 0 13.4 (8, 21) 0 (NA) 0.75 0.93 1.00 1.00
GPS2 0 0 0 0 (NA) 0 (NA) 0 2 7 2.5 (0.6, 10) 80.8 (39, 170) 0.46 0.82 0.23 0.68
ARID1A 0 1 2 1.2 (0.2, 9) 24.3 (6, 97) 0 9 3 1.6 (0.8, 3) 5.8 (2, 18) 0.80 0.93 0.15 0.56
CTCF 0 1 0 3.8 (0.5, 27) 0 (NA) 2 10 4 5.2 (3, 10) 35.8 (13, 95) 0.75 0.93 0.32 0.68
CDKN1B 0 0 2 0 (NA) 518.3 (130, 2,072) 1 3 5 5.6 (2, 17) 84.9 (35, 204) 0.37 0.72 0.06 0.37
NF1 0 2 1 2.2 (0.5, 9) 10.6 (2, 76) 1 13 5 1.9 (1, 3) 8.9 (4, 21) 0.89 0.93 0.87 0.96
BRCA1 0 0 1 0 (NA) 16.5 (2, 117) 0 11 4 2.5 (1, 5) 11.2 (4, 30) 0.09 0.35 0.73 0.96
ERBB2 0 0 1 0 (NA) 29.2 (4, 208) 0 11 1 3.6 (2, 7) 6.1 (1, 43) 0.09 0.35 0.28 0.68
The background mutation rates were estimated as btHK ¼ 1:28 ð0:41; 3:96Þ btWH ¼ 1:13 ð0:74; 1:73Þ ðw: 95 % CIÞ, assuming the mutation counts following aPoisson distribution.Ns: the number of synonymous mutations; Nn: the number of NS mutations; Ni: the number of indels.ui: selection pressure among indels in cancer genes (relative to indel in non-cancer genes); un: selection pressure among NS mutations (relative to synonymousmutations); ui: selection pressure among indels in cancer genes (relative to indel in non-cancer genes).95% confidence intervals for un and ui in brackets.pn : p value from two sample Poisson likelihood ratio test for point mutations; pi : p value from two sample Poisson likelihood ratio test for indels; qn : q value fortwo sample Poisson likelihood ratio tests for point mutations; qi : q value for two sample Poisson likelihood ratio tests for indels.A star mark (*) indicates a test is significant at level 0.05.
the Chinese study by Zhang et al.,35 the coverage of the tar-
geted sequencing was about 20 times higher (�1,200x)
than that of TCGA (<60x), which likely contributed to
the higher frequencies of mutations for most cancer driver
genes among Chinese BC patients than in TCGA overall.
In contrast, by leveraging mutation rates of synonymous
mutations as the reference group, our method of
comparing driver gene selection pressure is less sensitive
to variations in sequencing and somatic mutation calling,
assuming the technical variations are uniform regardless of
mutation types. Further, Asians are an extremely heteroge-
neous population, comprising groups with diverse genetic
background and sociodemographic characteristics. The
variations in the BC genomic landscape across different
Asian populations are therefore not surprising, high-
Human
lighting the importance of conducting more genomic
studies in different Asian populations to capture the com-
plete spectrum of the BC genomic landscape in Asia.
Nevertheless, our findings of lower selection pressure for
TP53 in HKBC are in line with the highest survival rate
among Asian Americans at all stages among BC patients
of all race/ethnic groups in the United States,36 given
that TP53 mutations are known to be associated with
poor prognosis in multiple cancer types.
Despite a much higher prevalence of the germline
APOBEC3B deletion polymorphism in HKBC than in
TCGA-EA and the expected associations between the APO-
BEC3B deletion and decreased levels of APOBEC3B RNA
expression in both tumor and normal tissue, the fractions
of APOBEC signatures (SBS2/13) were similar between
Genetics and Genomics Advances 3, 100076, January 13, 2022 5
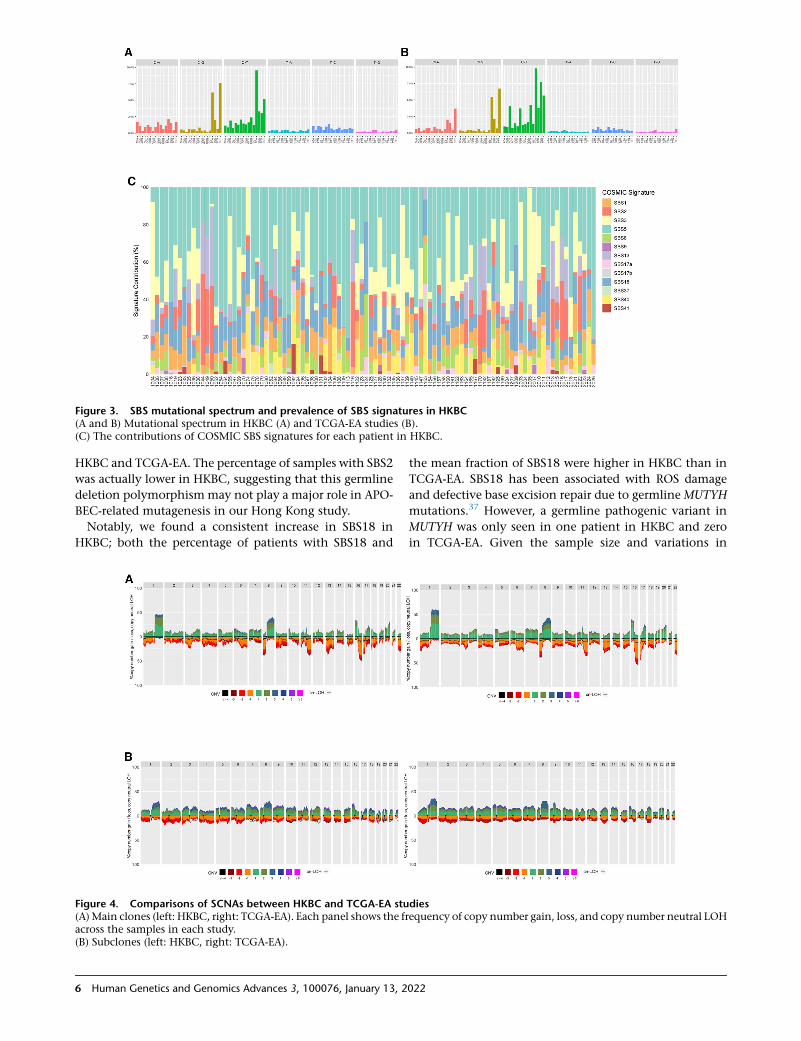
Figure 3. SBS mutational spectrum and prevalence of SBS signatures in HKBC(A and B) Mutational spectrum in HKBC (A) and TCGA-EA studies (B).(C) The contributions of COSMIC SBS signatures for each patient in HKBC.
HKBC and TCGA-EA. The percentage of samples with SBS2
was actually lower in HKBC, suggesting that this germline
deletion polymorphismmay not play a major role in APO-
BEC-related mutagenesis in our Hong Kong study.
Notably, we found a consistent increase in SBS18 in
HKBC; both the percentage of patients with SBS18 and
Figure 4. Comparisons of SCNAs between HKBC and TCGA-EA stu(A) Main clones (left: HKBC, right: TCGA-EA). Each panel shows the fracross the samples in each study.(B) Subclones (left: HKBC, right: TCGA-EA).
6 Human Genetics and Genomics Advances 3, 100076, January 13, 2
the mean fraction of SBS18 were higher in HKBC than in
TCGA-EA. SBS18 has been associated with ROS damage
and defective base excision repair due to germline MUTYH
mutations.37 However, a germline pathogenic variant in
MUTYH was only seen in one patient in HKBC and zero
in TCGA-EA. Given the sample size and variations in
diesequency of copy number gain, loss, and copy number neutral LOH
022
signature estimates across different algorithms, future
studies are warranted to follow up these findings in addi-
tional Asian studies.
The major limitation of the HKBC study is the small
sample size, which limited the power to agnostically iden-
tify HK-specific events, to extract de novomutational signa-
tures, and to compare selection pressure for less frequently
mutated genes. In addition, lack of whole-genome
sequencing data prohibited us from assessing HRD signa-
tures based on structural variants. Nevertheless, taking
advantage of the existing knowledge of BC genomics, we
found suggestive differences in mutational signatures
and selection pressure for several genes, suggesting some
extent of racial heterogeneity in mutation generation
and selection. Future large studies are warranted to confirm
these findings and to relate these genomic differences with
germline genetic variants and other etiologic factors.
Data and code availability
Sequencing data generated in the HKBC study has been
deposited in the dbGaP database under Accession
Code phs001870.v1.p1. at https://www.ncbi.nlm.nih.gov/
projects/gap/cgi-bin/study.cgi?study_id¼phs001870.v1.p1.
Supplemental information
Supplemental information can be found online at https://doi.org/
10.1016/j.xhgg.2021.100076.
Acknowledgments
This research was supported by the Intramural Research Program
of the National Institutes of Health, National Cancer Institute, Di-
vision of Cancer Epidemiology and Genetics, and Research Grants
Council (grant number 474811 to Dr. Tse), Hong Kong SAR.
Declaration of interests
The authors declare no competing interests.
Received: September 9, 2021
Accepted: November 30, 2021
Web resources
Online Mendelian Inheritance in Man: http://www.omim.
org.
References
1. Bray, F., Ferlay, J., Soerjomataram, I., Siegel, R.L., Torre, L.A.,
and Jemal, A. (2018). Global cancer statistics 2018: GLOBO-
CAN estimates of incidence and mortality worldwide for 36
cancers in 185 countries. CA Cancer J. Clin. 68, 394–424.
2. Yap, Y.S., Lu, Y.S., Tamura, K., Lee, J.E., Ko, E.Y., Park, Y.H., et al.
(2019). Insights into breast cancer in the East vs the west: a re-
view. JAMA Oncol. 5, 1489–1496.
Human
3. Yap, Y.S., Singh, A.P., Lim, J.H.C., Ahn, J.H., Jung, K.H., Kim, J.,
Dent, R.A., Ng, R.C.H., Kim, S.B., and Chiang, D.Y. (2018).
Elucidating therapeutic molecular targets in premenopausal
Asian womenwith recurrent breast cancers. NPJ Breast Cancer
4, 19.
4. Kan, Z., Ding, Y., Kim, J., Jung, H.H., Chung, W., Lal, S., Cho,
S., Fernandez-Banet, J., Lee, S.K., Kim, S.W., et al. (2018).
Multi-omics profiling of younger Asian breast cancers reveals
distinctive molecular signatures. Nat. Commun. 9, 1725.
5. Pan, J.-W., Ahmad Zabidi, M.M., Ng, P.-S., Meng, M.-Y., Hasan,
S.N., Sandey, B., et al. (2020). The molecular landscape of
Asian breast cancers reveals clinically relevant population-spe-
cific differences. Nat. Commun. 11, 6433.
6. Zhu, B., Tse, L.A., Wang, D., Koka, H., Zhang, T., Abubakar, M.,
Lee, P., Wang, F., Wu, C., Tsang, K.H., et al. (2019). Immune
gene expression profiling reveals heterogeneity in luminal
breast tumors. Breast Cancer Res. 21, 147.
7. Long, J., Delahanty, R.J., Li, G., Gao, Y.T., Lu, W., Cai, Q.,
Xiang, Y.B., Li, C., Ji, B.T., Zheng, Y., et al. (2013). A common
deletion in the APOBEC3 genes and breast cancer risk. J. Natl.
Cancer Inst. 105, 573–579.
8. Cancer Genome Atlas, N. (2012). Comprehensive molecular
portraits of human breast tumours. Nature 490, 61–70.
9. Chen, Z., Wen, W., Bao, J., Kuhs, K.L., Cai, Q., Long, J., Shu,
X.O., Zheng, W., and Guo, X. (2019). Integrative genomic an-
alyses of APOBEC-mutational signature, expression and germ-
line deletion of APOBEC3 genes, and immunogenicity inmul-
tiple cancer types. BMC Med. Genomics 12, 131.
10. Greaves, M., and Maley, C.C. (2012). Clonal evolution in can-
cer. Nature 481, 306–313.
11. Martincorena, I., Raine, K.M., Gerstung, M., Dawson, K.J.,
Haase, K., Van Loo, P., Davies, H., Stratton, M.R., and Camp-
bell, P.J. (2017). Universal patterns of selection in cancer and
somatic tissues. Cell 171, 1029–1041 e1021.
12. Xiao, W., Ren, L., Chen, Z., Fang, L.T., Zhao, Y., Lack, J., Guan,
M., Zhu, B., Jaeger, E., Kerrigan, L., et al. (2021). Toward best
practice in cancer mutation detection with whole-genome
andwhole-exome sequencing. Nat. Biotechnol. 39, 1141–1150.
13. Cannataro, V.L., Gaffney, S.G., and Townsend, J.P. (2018). Ef-
fect sizes of somatic mutations in cancer. J. Natl. Cancer Inst.
110, 1171–1177.
14. Li, M., Tse, L.A., Chan, W.C., Kwok, C.H., Leung, S.L., Wu, C.,
Yu,W.C., Lee, P.M., Tsang, K.H., Law, S.H., et al. (2017). Night-
time eating and breast cancer amongChinese women inHong
Kong. Breast Cancer Res. 19, 31.
15. Cibulskis, K., Lawrence, M.S., Carter, S.L., Sivachenko, A.,
Jaffe, D., Sougnez, C., Gabriel, S., Meyerson, M., Lander, E.S.,
and Getz, G. (2013). Sensitive detection of somatic point mu-
tations in impure and heterogeneous cancer samples. Nat.
Biotechnol. 31, 213–219.
16. Saunders, C.T., Wong, W.S., Swamy, S., Becq, J., Murray, L.J.,
and Cheetham, R.K. (2012). Strelka: accurate somatic small-
variant calling from sequenced tumor-normal sample pairs.
Bioinformatics 28, 1811–1817.
17. Freed, D., Pan, R., and Aldana, R. (2018). TNscope: accurate
detection of somatic mutations with haplotype-based variant
candidate detection and machine learning filtering. bioRxiv,
250647.
18. Genomes Project, C., Abecasis, G.R., Altshuler, D., Auton, A.,
Brooks, L.D., Durbin, R.M., Gibbs, R.A., Hurles, M.E., and
McVean, G.A. (2010). A map of human genome variation
from population-scale sequencing. Nature 467, 1061–1073.
Genetics and Genomics Advances 3, 100076, January 13, 2022 7
19. Lek, M., Karczewski, K.J., Minikel, E.V., Samocha, K.E., Banks,
E., Fennell, T., O’Donnell-Luria, A.H., Ware, J.S., Hill, A.J.,
Cummings, B.B., et al. (2016). Analysis of protein-coding ge-
netic variation in 60,706 humans. Nature 536, 285–291.
20. Middlebrooks, C.D., Banday, A.R., Matsuda, K., Udquim, K.I.,
Onabajo, O.O., Paquin, A., Figueroa, J.D., Zhu, B., Koutros, S.,
Kubo, M., et al. (2016). Association of germline variants in the
APOBEC3 region with cancer risk and enrichment with APO-
BEC-signature mutations in tumors. Nat. Genet. 48, 1330–
1338.
21. Li, B., and Dewey, C.N. (2011). RSEM: accurate transcript
quantification from RNA-Seq data with or without a reference
genome. BMC Bioinformatics 12, 323.
22. Paquet, E.R., and Hallett, M.T. (2015). Absolute assignment of
breast cancer intrinsic molecular subtype. J. Natl. Cancer Inst.
107, 357.
23. Bailey, M.H., Tokheim, C., Porta-Pardo, E., Sengupta, S., Ber-
trand, D., Weerasinghe, A., Colaprico, A., Wendl, M.C., Kim,
J., Reardon, B., et al. (2018). Comprehensive Characterization
of cancer driver genes and mutations. Cell 174, 1034–1035.
24. Alexandrov, L.B., Kim, J., Haradhvala, N.J., Huang, M.N., Tian
Ng, A.W., Wu, Y., Boot, A., Covington, K.R., Gordenin, D.A.,
Bergstrom, E.N., et al. (2020). The repertoire of mutational sig-
natures in human cancer. Nature 578, 94–101.
25. Huang, X., Wojtowicz, D., and Przytycka, T.M. (2018). Detect-
ing presence of mutational signatures in cancer with confi-
dence. Bioinformatics 34, 330–337.
26. Degasperi, A., Amarante, T.D., Czarnecki, J., Shooter, S., Zou,
X., Glodzik, D., Morganella, S., Nanda, A.S., Badja, C., Koh,
G., et al. (2020). A practical framework and online tool for
mutational signature analyses show inter-tissue variation
and driver dependencies. Nat. Cancer 1, 249–263.
27. Hubschmann, D., Jopp-Saile, L., Andresen, C., Kramer, S., Gu,
Z., Heilig, C.E., Kreutzfeldt, S., Teleanu, V., Frohling, S., Eils, R.,
et al. (2021). Analysis of mutational signatures with yet
another package for signature analysis. Genes Chromosomes
Cancer 60, 314–331.
28. Choo-Wosoba, H., Albert, P.S., and Zhu, B. (2019). A hidden
markov modeling approach for identifying tumor subclones
in next-generation sequencing studies. bioRxiv, 675512.
29. Mermel, C.H., Schumacher, S.E., Hill, B., Meyerson, M.L., Ber-
oukhim, R., and Getz, G. (2011). GISTIC2.0 facilitates sensi-
8 Human Genetics and Genomics Advances 3, 100076, January 13, 2
tive and confident localization of the targets of focal somatic
copy-number alteration in human cancers. Genome Biol.
12, R41.
30. Sinha, S., Mitchell, K.A., Zingone, A., Bowman, E., Sinha, N.,
Schaffer, A.A., Lee, J.S., Ruppin, E., and Ryan, B.M. (2020).
Higher prevalence of homologous recombination deficiency
in tumors from African Americans versus European Ameri-
cans. Nat. Cancer 1, 112–121.
31. Swisher, E.M., Lin, K.K., Oza, A.M., Scott, C.L., Giordano, H.,
Sun, J., Konecny, G.E., Coleman, R.L., Tinker, A.V., O’Malley,
D.M., et al. (2017). Rucaparib in relapsed, platinum-sensitive
high-grade ovarian carcinoma (ARIEL2 Part 1): an interna-
tional, multicentre, open-label, phase 2 trial. Lancet Oncol.
18, 75–87.
32. Telli, M.L., Timms, K.M., Reid, J., Hennessy, B., Mills, G.B.,
Jensen, K.C., Szallasi, Z., Barry, W.T., Winer, E.P., Tung, N.M.,
et al. (2016). Homologous recombination deficiency (HRD)
score predicts response to platinum-containing neoadjuvant
chemotherapy in patients with triple-negative breast cancer.
Clin. Cancer Res. 22, 3764–3773.
33. Poetsch, A.R. (2020). The genomics of oxidative DNA damage,
repair, and resulting mutagenesis. Comput. Struct. Bio-
technol. J. 18, 207–219.
34. Nik-Zainal, S., Davies, H., Staaf, J., Ramakrishna, M., Glodzik,
D., Zou, X., Martincorena, I., Alexandrov, L.B., Martin, S.,
Wedge, D.C., et al. (2016). Landscape of somatic mutations
in 560 breast cancer whole-genome sequences. Nature 534,
47–54.
35. Zhang, G., Wang, Y., Chen, B., Guo, L., Cao, L., Ren, C., Wen,
L., Li, K., Jia, M., Li, C., et al. (2019). Characterization of
frequently mutated cancer genes in Chinese breast tumors: a
comparison of Chinese and TCGA cohorts. Ann. Transl.
Med. 7, 179.
36. DeSantis, C.E., Ma, J., Gaudet, M.M., Newman, L.A., Miller,
K.D., Goding Sauer, A., Jemal, A., and Siegel, R.L. (2019).
Breast cancer statistics, 2019. CA Cancer J. Clin. 69, 438–
451.
37. Thibodeau, M.L., Zhao, E.Y., Reisle, C., Ch’ng, C., Wong, H.L.,
Shen, Y., et al. (2019). Base excision repair deficiency signa-
tures implicate germline and somatic MUTYH aberrations in
pancreatic ductal adenocarcinoma and breast cancer onco-
genesis. Cold Spring Harb. Mol. Case Stud. 5, a003681.
022