
The Effects of Restrictive Business Practiceson Australian Inbound Package Tourism

Comparison of New DopplerEchocardiographic Methodsto Differentiate Constrictive
Pericardial Heart Disease andRestrictive Cardiomyopathy
Navin Rajagopalan, MD, Mario J. Garcia, MD, Leonardo Rodriguez, MD,R. Daniel Murray, PhD, Carolyn Apperson-Hansen, PhD, Marie Stugaard, MD,
James D. Thomas, MD, and Allan L. Klein, MD
This study assesses how the newer modalities of tissueDoppler echocardiography and color M-mode flowpropagation compare with respiratory variation ofDoppler flow in distinguishing between constrictive peri-carditis and restrictive cardiomyopathy. We studied 30patients referred for further evaluation of diastolic func-tion who had a diagnosis of constrictive pericarditis orrestrictive cardiomyopathy established by diagnostictests, including clinical assessment, magnetic resonanceimaging, cardiac catheterization, endomyocardial bi-opsy, and surgical findings. Nineteen patients had con-strictive pericarditis and 11 had restrictive cardiomyop-athy. We performed 2-dimensional transesophagealechocardiography combined with pulsed-wave Dopplerof the pulmonary veins and mitral inflow with respira-tory monitoring, tissue Doppler echocardiography of thelateral mitral annulus, and color M-mode flow propaga-tion of left ventricular filling. Respiratory variation of themitral inflow peak early (peak E) velocity of >10%predicted constrictive pericarditis with 84% sensitivity
and 91% specificity and variation in the pulmonaryvenous peak diastolic (peak D) flow velocity of >18%distinguished constriction with 79% sensitivity and 91%specificity. Using tissue Doppler echocardiography, apeak early velocity of longitudinal expansion (peak Ea)of >8.0 cm/s differentiated patients with constrictionfrom restriction with 89% sensitivity and 100% specific-ity. A slope of >100 cm/s for the first aliasing contour incolor M-mode flow propagation predicted patients withconstriction with 74% sensitivity and 91% specificity.Thus, the newer methods of tissue Doppler echocardiog-raphy and color M-mode flow propagation are equiva-lent and complimentary with Doppler respiratory varia-tion in distinguishing between constrictive pericarditisand restrictive cardiomyopathy. The additive role of thenew methods needs to be established in difficult cases ofconstrictive pericarditis where respiratory variation maybe absent or decreased. Q2001 by Excerpta Medica,Inc.
(Am J Cardiol 2001;87:86–94)
Despite recent advances in cardiac imaging, differ-entiation between constrictive pericarditis and re-
strictive cardiomyopathy still remains a clinical chal-lenge.1,2 Constrictive pericarditis and restrictive car-diomyopathy may produce identical clinical,hemodynamic, and echocardiographic findings, andsurgical exploration can be undertaken to establish adefinitive diagnosis.2–4 Doppler echocardiographictechniques have been shown to be useful in differen-tiating between the 2 diseases.5–8 A marked respira-tory variation in mitral inflow and pulmonary venousflow is present in patients with constrictive pericarditisbut is absent in those with restrictive cardiomyopa-thy.7,9 Recently, the newer echocardiographic modal-ities of tissue Doppler echocardiography and colorM-mode flow propagation have been proposed as an-
cillary tools to distinguish between these diseases.10,11
Preliminary observations have suggested that longitu-dinal axis expansion velocities by tissue Dopplerechocardiography are markedly reduced in patientswith restrictive cardiomyopathy compared with thosewith constrictive pericarditis,12 and that the flow prop-agation slope using color M-mode Doppler is delayedwith restriction and rapid with constriction.10,13–15Thepurpose of this study is to evaluate how the newermodalities compare with respiratory variation ofDoppler flow to distinguish between these 2 diseasesin a large series of patients.
METHODSStudy population: The study population consisted
of 30 patients with predominantly right-sided cardiacfailure and clinically suspected complex diastolic dys-function, who were referred to the transesophagealechocardigraphic (TEE) laboratory for determinationof constrictive pericarditis or restrictive cardiomyop-athy. All patients had a complete evaluation withpulsed-wave Doppler of the pulmonary venous flowand mitral inflow, tissue Doppler echocardiography,
From the Department of Cardiology, Section of Cardiovascular Imag-ing, The Cleveland Clinic Foundation, Cleveland, Ohio. Manuscriptreceived March 22, 2000; revised manuscript received and ac-cepted July 10, 2000.
Address for reprints: Allan L. Klein, MD, Department of Cardiol-ogy, The Cleveland Clinic Foundation, 9500 Euclid Avenue, DeskF15, Cleveland, Ohio 44195. E-mail: [email protected].
86 ©2001 by Excerpta Medica, Inc. All rights reserved. 0002-9149/01/$–see front matterThe American Journal of Cardiology Vol. 87 January 1, 2001 PII S0002-9149(00)01278-9

and color M-mode Doppler. There were 24 men and 6women with a mean age of 596 13 years.
Patients were categorized as having constrictivepericarditis or restrictive cardiomyopathy based on anumber of diagnostic tests, including clinical assess-ment, magnetic resonance imaging, cardiac catheter-ization, endomyocardial biopsy, and surgical findings,independent of the echocardiographic examination.Constrictive pericarditis was defined as having ascarred or fused pericardium with reduced compli-ance, causing decreased ventricular and atrial disten-sibility and right-sided cardiac failure.16,17Restrictivecardiomyopathy was defined as a disease of cardiacmuscle with an impaired endomyocardium or myocar-dium being the principle abnormality, resulting inimpaired ventricular compliance.16,17Patients with lo-calized right- or left-sided constriction or features ofmixed constriction and/or restriction were not in-cluded in the study.9,18,19Patients were considered tohave mixed disease when there was evidence of lo-calized pericardial thickening, but with the classicfeatures of restrictive physiology.9 The clinical, he-modynamic, and echocardiographic results for bothgroups of patients are shown in Table 1.
All 19 patients were diagnosed and confirmed tohave constrictive pericarditis by several diagnostictests, including surgery (n5 12), magnetic resonanceimaging (n5 14), or cardiac catheterization (n5 16).All patients had at least 1 of these tests performed and8 of the 19 patients (42%) had all 3 tests to confirm thediagnosis of constrictive pericarditis. For 13 patients(68%), no discernible cause (idiopathic) could befound for the etiology of constrictive pericarditis.Other etiologies included postcardiac surgery in 3patients, chronic infection (tuberculosis, Q fever) in 2cases, and radiation in 1 patient. Of the 19 patients, 6(32%) were in atrial fibrillation and 9 (47%) were in
New York Heart Association func-tional class III or IV.
Eleven patients were found tohave advanced restrictive cardiomy-opathy showing restrictive physiolo-gy.2 Four (36%) were in atrial fibril-lation and 6 (55%) were in NewYork Heart Association functionalclass III or IV. Confirming tests in-cluded cardiac catheterization in 6patients (55%), magnetic resonanceimaging in 3 patients (27%), and en-domyocardial biopsies in 8 patients(73%). The major cause of restrictivecardiomyopathy was cardiac amy-loidosis in 8 patients (73%). Theother etiologies were advanced hy-pertension and diabetic small vesseldisease in 2 patients, respectively,and idiopathic in another patient.
Transthoracic echocardiographicexamination: An ultrasound systemequipped with tissue Doppler echo-cardiographic capabilities (Acuson128 XP/10 or Sequoia, Mountain
View, California) was used to examine patients in theleft lateral decubitus position. All 2-dimensional, M-mode, and Doppler echocardiographic examinationswere performed using a 2.5-MHz transducer. Using2-dimensional directed M-mode echocardiographyfrom the parasternal short-axis view, left ventricularend-diastolic and end-systolic dimensions and the leftatrial dimension were derived. We calculated the ejec-tion fraction using the method of Quinones et al.20
Pulsed-wave Doppler flow measurements of the mitralinflow peak early (E) and atrial (A) wave were ob-tained at the level of the leaflet tips of the mitral valve,using the apical 4-chamber window.10 The isovolumicrelaxation time was defined as the time period be-tween aortic valve closure and mitral valve opening.10
Tissue Doppler echocardiography: The displacementand velocities of left ventricular motion in the longi-tudinal axis was performed by 2-dimensional guidedM-mode and tissue Doppler echocardiography exam-ination of the lateral mitral annulus from the apical4-chamber view at a depth of 16 cm.21 In all studysubjects, a fixed sampling gate of 10 mm placed in thelateral aspect of the mitral annulus was used. ANyquist limit of 15 and 20 cm/s was set and thespectral pulsed Doppler signal filters were minimized.Measurements of the peak systolic velocity (Sa) andthe peak early (Ea) and late (Aa) diastolic expansionvelocities were obtained.12,21 The mean rate of accel-eration of early diastolic expansion was calculated bydividing the peak early diastolic velocity by the inter-val between the onset of diastolic excursion and thepeak velocity. The mean rate of deceleration wascalculated by dividing the peak velocity by the inter-val between peak velocity and the point where itreached baseline.12,21Three to 6 beats were measuredand averaged for each measurement. The index ofannular expansion velocity (Ea)/mitral inflow peak E
TABLE 1 Clinical, Hemodynamic, and Echocardiographic Findings in PatientsWith Constrictive Pericarditis and Patients With Restrictive Cardiomyopathy
ConstrictivePericarditis(n 5 19)
RestrictiveCardiomyopathy
(n 5 11) p Value
Age (yrs) 56 6 13 66 6 12 NSMen/women 16/3 8/3 NSNYHA functional class III/IV 9 6 NSAtrial fibrillation 6 4 NSMRI verification of diagnosis 14 3 0.02EM biopsy: verification of diagnosis 0 8 ,0.001Surgery: verification of diagnosis 12 0 ,0.001Cardiac catheterization 16 6 NSMean RA pressure (mm Hg) 17 6 5 13 6 10 NSPA systolic pressure (mm Hg) 37 6 8 62 6 24 0.004PA diastolic pressure (mm Hg) 20 6 5 25 6 9 NSMean PA wedge pressure (mm Hg) 19 6 5 20 6 7 NSLV end-diastolic dimension (mm) 45 6 6 49 6 10 NSLV end-systolic dimension (mm) 30 6 6 35 6 12 NSLeft atrium dimension (mm) 47 6 9 50 6 12 NSLV ejection fraction (%) 57 6 10 51 6 14 NS
Values are mean value 6 SD or number of patients. A p value ,0.05 was considered statisticallysignificant.
EM 5 endomyocardial; LV 5 left ventricular; MRI 5 magnetic resonance imaging; NYHA 5 New YorkHeart Association; PA 5 pulmonary artery; RA 5 right atrial pressure.
MISCELLANEOUS/PERICARDIAL HEART DISEASE AND RESTRICTIVE CARDIOMYOPATHY 87

velocity was calculated to normalize for possible pre-load effects.12
Transesophageal echocardiographic examination: A5-MHz biplane and multiplane transducer attached toa commercially available Doppler echocardiographicmachine (Acuson model 128 XP, Sequoia, MountainView, California; and Hewlett-Packard Sonos 1500 or2500, Andover, Massachusetts) was used for the TEEexamination.22 The transducer was placed approxi-mately 30 cm from the incisors, obtaining the short-axis view of the pulmonary veins. The sample volumewas placed 1 to 2 cm distal to the orifice of the left orright pulmonary vein where it joins the left atrium.7
For pulsed-wave mitral inflow measurements, the api-cal 4-chamber view was used with the sample volumeplaced at the leaflet tips of the mitral valve. Thephases of inspiration and expiration were recordedusing a nasal respirometer (Interspec Co., Watertown,New York).
Mean values of pulmonary venous flow were cal-culated using an off-line computer that averaged peakvelocities during inspiration and expiration for 3 to 6respiratory cycles. Peak velocities were measuredfrom the baseline to their peaks, and a systolic/dia-stolic flow ratio was calculated.7 In the same manner,the peak E and A velocities for mitral valve inflowwere measured during inspiration and expiration. De-celeration time was calculated from the peak E veloc-ity, extrapolated to the baseline. Both variables weredetermined during inspiration and expiration. Digitiz-ing the tracings allowed the determination of flowvelocity integrals of pulmonary venous systolic anddiastolic flow and mitral inflow. The percent change inDoppler flow velocities from expiration to inspiration(percent E) was calculated by the formula (expira-tion 2 inspiration)/expiration3 100%.16
Color M-mode Doppler: Color M-mode imageswere obtained from transthoracic echocardiography in20 patients and from transesophageal echocardiogra-phy in 10 patients. The M-mode cursor was aligned
within the main direction of the mitral inflow using the2- or 4-chamber view. A spatial velocity distributionalong the Doppler scanline from the left atrium to theleft ventricle was produced along with its temporalchanges during the cardiac cycle. Using a sweep ve-locity of 100 cm/s, 3 to 6 beats were recorded onoptical disk, allowing for digital processing. The rawimage was composed of 2 bytes of data for each pixelwith 1 byte containing the structural M-mode data andthe other containing velocity (5 bits) and variance (3bits) information. This velocity distribution across themitral valve had a spatial resolution of 0.5 mm, atemporal resolution of 5 ms, and a velocity resolutionof 3 cm/s.11 Extraction and dealiasing of the velocitypattern was performed using the LabVIEW program(National Instruments, Austin, Texas). The Nyquistvelocity was used to calculate the actual velocities foreach pixel in the color Doppler velocity maps usingthe method described by Thomas et al.23 The distri-bution was calibrated using the temporal and spatialimage resolutions. Examination of the digital veloci-ties of the early mitral inflow allowed measurement of3 parameters. The slope of the early color M-modeinflow was described as the slope of a line hand-drawnalong the color/no-color border as described in Brun etal.13 To better assess the propagation of the highervelocities, the slope of the first aliasing contour wasalso measured.15 The time delay of the maximal ve-locity was measured as the time difference of themaximal velocity at the mitral annulus level and themaximal velocity at the apical level.14 In addition, theapical displacement of maximal velocities was foundas the distance from the mitral annulus to the locationwhere the maximal velocity was observed in the leftventricular cavity.15
Statistical analysis: Descriptive statistics were usedto summarize the data. For categorical variables, thisincluded frequencies and percentages. For continuousvariables, this included mean6 SD. Comparisonsbetween patients with constrictive pericarditis and pa-
TABLE 2 Pulmonary Venous Flow Data in 19 Patients With Constrictive Pericarditis and 11 Patients With RestrictiveCardiomyopathy
Constrictive Pericarditis Restrictive Cardiomyopathy
Inspiration Expiration %E Inspiration Expiration %E
Heart rate (beats/min) 89 6 22 89 6 20 1 6 3 81 6 10 81 6 12 1 6 2Peak velocities
Peak S (cm/s) 34 6 12*† 39 6 14† 12 6 11 22 6 10 22 6 10 1 6 17Peak D (cm/s) 33 6 19* 45 6 21 28 6 16† 43 6 8* 48 6 10 9 6 10S/D ratio 1.5 6 1.1† 1.1 6 0.7† 227 6 32 0.5 6 0.2 0.5 6 0.2 29 6 22Peak AR (cm/s) 17 6 11 18 6 10 4 6 17 15 6 4 17 6 6 3 6 32
Flow velocity integralS velocity (cm) 6.7 6 4.0* 7.6 6 4.0† 13 6 12 3.9 6 2.4 4.1 6 2.4 5 6 22D velocity (cm) 4.8 6 3.4* 6.7 6 3.4 30 6 19† 6.3 6 2.3 6.8 6 2.4 7 6 14AR velocity (cm) 1.8 6 1.1 2.0 6 1.1 4 6 29 1.6 6 0.7 1.6 6 0.8 25 6 22S/D velocity 2.2 6 2.4† 1.5 6 1.2† 236 6 52 0.6 6 0.3 0.6 6 0.3 22 6 23
*p ,0.001 inspiration versus expiration values.†Constrictive pericarditis versus restrictive cardiomyopathy values.Values presented are mean value 6 SD.AR 5 atrial reversal flow velocity; %E 5 percent change in Doppler flow velocity from expiration to inspiration; D 5 diastolic flow velocity; S 5 systolic flow velocity;
S/D ratio 5 systolic/diastolic flow ratio.
88 THE AMERICAN JOURNAL OF CARDIOLOGYT VOL. 87 JANUARY 1, 2001
tients with restrictive cardiomyopathy were made us-ing the t test for each of the different methods. Be-cause multiple tests were performed for each variable,a Bonferroni adjustment was made and p values of,0.001 were considered statistically significant. Inaddition, pairedt tests were used to compare differ-ences within the groups from expiration to inspiration.Receiver operating characteristic (ROC) curves meth-ods were used to determine the summary measure ofrelative accuracy for the various approaches as a func-tion of specificity and sensitivity. Unless otherwisestated, statistical testing was conducted using 2-sidedalternatives with a type 1 error level of 0.05.
RESULTSPulmonary venous flow: The pulmonary venous
flow data for both groups are described in Table 2.The pulmonary venous peak systolic flow velocitywas significantly greater in patients with constrictivepericarditis than in patients with restrictive cardiomy-opathy during the inspiration and expiration phases (p,0.001). The increase in the peak systolic flow ve-locity from inspiration to expiration (percent E) inpatients with constricive pericarditis was not signifi-cantly different from the respiratory variation in pa-
tients with restrictive cardiomyopathy. There was asignificantly greater increase in the peak diastolic flowvelocity from inspiration to expiration in constrictivepericarditis than in restrictive cardiomyopathy (Fig-ures 19 and 2). A distribution of the values for therespiratory variation of peak D for both groups isshown in Figure 3.
Mitral inflow: Mitral inflow measurements are sum-marized in Table 3. In both constrictive pericarditisand restrictive cardiomyopathy, there was an increasein peak E velocity and in the integral from inspirationto expiration. For peak E velocity, the percent E forconstrictive pericarditis was significantly greater thanthe percent E for restrictive cardiomyopathy. Figures1 and 2 illustrate this greater variation found in con-strictive pericarditis. The deceleration times were re-duced in restrictive cardiomyopathy and constrictivepericarditis and there was no significant respiratoryvariation. A distribution of the values for percent E of
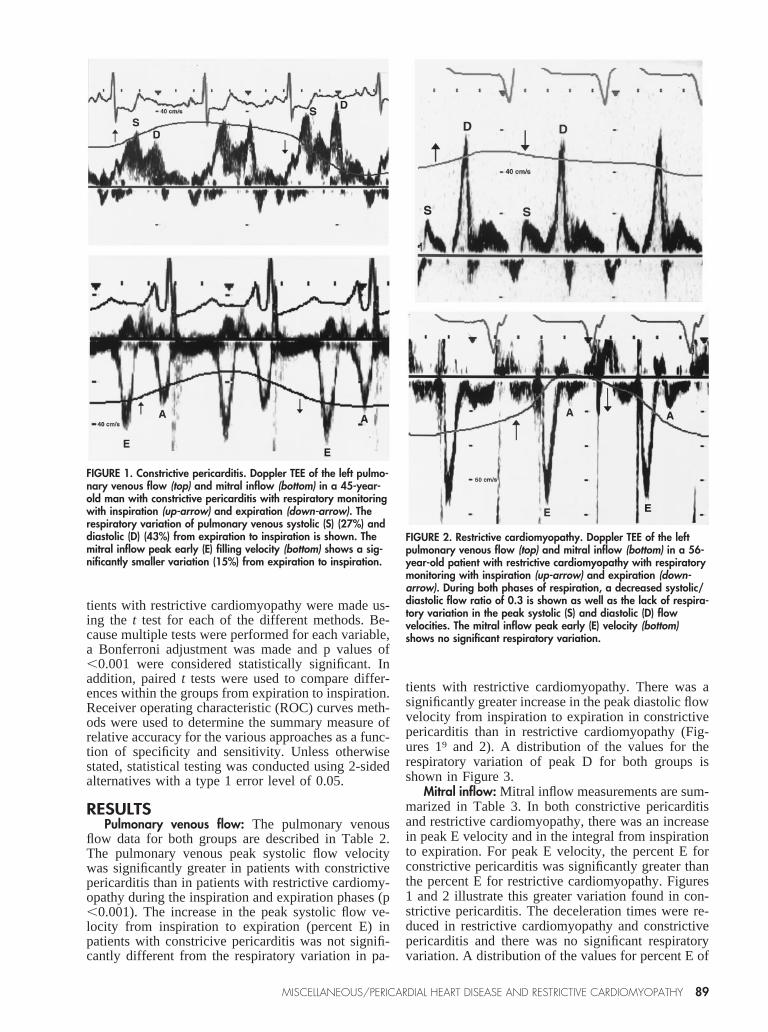
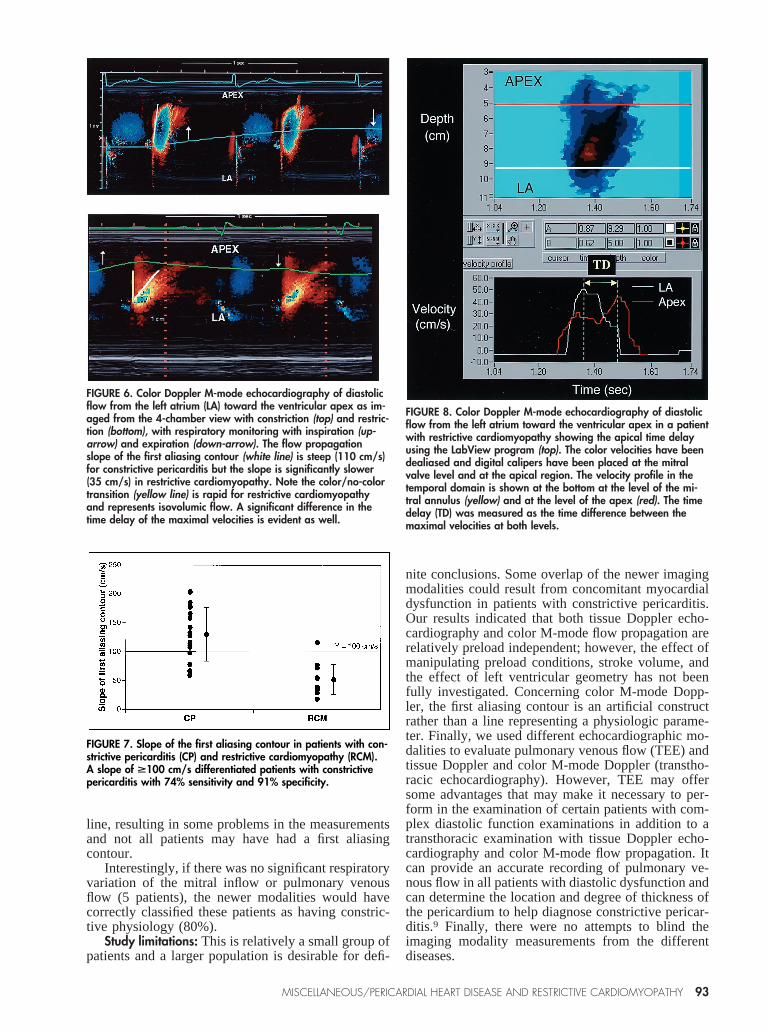
FIGURE 1. Constrictive pericarditis. Doppler TEE of the left pulmo-nary venous flow (top) and mitral inflow (bottom) in a 45-year-old man with constrictive pericarditis with respiratory monitoringwith inspiration (up-arrow) and expiration (down-arrow). Therespiratory variation of pulmonary venous systolic (S) (27%) anddiastolic (D) (43%) from expiration to inspiration is shown. Themitral inflow peak early (E) filling velocity (bottom) shows a sig-nificantly smaller variation (15%) from expiration to inspiration.
FIGURE 2. Restrictive cardiomyopathy. Doppler TEE of the leftpulmonary venous flow (top) and mitral inflow (bottom) in a 56-year-old patient with restrictive cardiomyopathy with respiratorymonitoring with inspiration (up-arrow) and expiration (down-arrow). During both phases of respiration, a decreased systolic/diastolic flow ratio of 0.3 is shown as well as the lack of respira-tory variation in the peak systolic (S) and diastolic (D) flowvelocities. The mitral inflow peak early (E) velocity (bottom)shows no significant respiratory variation.
MISCELLANEOUS/PERICARDIAL HEART DISEASE AND RESTRICTIVE CARDIOMYOPATHY 89

the peak E wave is shown in Figure 3 with the lineshowing the best separation between the 2 groups.
The peak E/A ratio tended to be greater in restric-tive cardiomyopathy than in constrictive pericarditisfor inspiration (p5 0.07) and for expiration (p50.04). A significant decrease in isovolumic relaxationtime was also observed from inspiration to expirationin constrictive pericarditis that was not seen in restric-tive cardiomyopathy.
Tissue Doppler echocardiography: The tissue Dopp-ler echocardiographic data are summarized in Table 4.Systolic longitudinal velocities were not significantlydifferent between the 2 groups. Patients with constric-tive pericarditis had a significantly higher early dia-stolic velocity than the restriction group. The acceler-ation and deceleration rates of Ea were also signifi-cantly higher in the constrictive pericarditis group. Asignificant difference was found between the Ea/Eindex of the constrictive and the restrictive groups.Figure 4 illustrates representative samples of lateralmitral annulus velocities by tissue Doppler echocar-diography. No correlation was found between Ea andpeak E (r5 20.24, p5 0.20) or with the E/A ratio(r 5 20.37, p5 0.10). A peak Ea velocity of 8.0 cm/sdifferentiated the 2 groups with the best sensitivityand specificity (Figure 5).
Color M-mode: Table 5 shows the color M-modemeasurements for the 2 groups. Using the slope of thecolor/no-color transition, patients with restriction dis-played a slope similar to those with constrictive peri-carditis. However, using the slope of the first aliasingcontour (Figure 6), the restrictive group showed asignificantly slower slope than the constrictive group.A distribution of the first aliasing slopes for the 2groups is shown in Figure 7. As shown, a slope of 100cm/s provided the best separation between the 2groups. There was no relation between peak E waveand the slope of the first aliasing contour (r5 20.37,p 5 0.04).
In the constrictive group, the maximal velocityreached the apex almost instantaneously comparedwith a significant delay in the restrictive group. Figure8 shows an example of the apical time delay in apatient with restrictive cardiomyopathy.
Sensitivity and specificity: A 10% respiratory varia-tion of the mitral inflow peak E wave showed 84%sensitivity and 91% specificity; an 18% respiratoryvariation of pulmonary venous peak D produced 79%sensitivity and 91% specificity; a peak tissue DopplerEa velocity of 8.0 cm/s showed 89% sensitivity and100% specificity; a color M-mode first aliasing slopevelocity of 100 cm/s had 74% sensitivity and 91%specificity.
Analysis of the area under the curve (AUC) usingROC curves methods was computed to determine therelative accuracy of the various approaches as a func-tion of sensitivity and specificity. Comparisons weremade among all diagnostic methods for identifyingrestrictive cardiomyopathy using z-tests and the cut-off points previously discussed. AUC accuracy mea-sures ranged from 0.80 to 0.93 probability for thevarious approaches. There were no significant differ-ences in AUC measures for the echocardiographicapproaches used to distinguish constrictive pericardi-tis from restrictive cardiomyopathy.
Comparison of the modalities: There were 5 patientswith constrictive pericarditis who did not meet 1 of the2 criteria regarding respiratory variation of the mitralinflow or pulmonary venous flow. Tissue Doppler orcolor M-mode criteria would have correctly classified4 of these 5 patients (80%) as having constrictivepericarditis.
DISCUSSIONIn the last decade, Doppler echocardiography with
respiratory monitoring has been used to differentiateconstrictive pericarditis from restrictive cardiomyop-athy.2,5 Recently, tissue Doppler echocardiographyand color M-mode Doppler have been advanced asnewer methods of evaluating diastolic function inthese diseases.10,11 This study is the first to compareall 3 Doppler echocardiographic techniques to differ-entiate these 2 similar conditions in the same series ofpatients. Our results show that a peak myocardiallongitudinal expansion Ea velocity of 8.0 cm/s bytissue Doppler echocardiography, and a rapid firstaliasing slope velocity of 100 cm/s by color M-modeflow propagation of left ventricular filling can be used
FIGURE 3. Respiratory variation (percent E) of the pulmonary ve-nous peak diastolic flow velocity (peak D) (top) and of the peakearly mitral filling (peak E) (bottom) in patients with constrictivepericarditis (CP) and restrictive cardiomyopathy (RCM). A varia-tion of >18% in peak D differentiated patients with constrictivepericarditis from those with restrictive cardiomyopathy with 79%sensitivity and 91% specificity, whereas a variation of >10% inpeak E differentiated both groups of patients with 84% sensitivityand 91% specificity.
90 THE AMERICAN JOURNAL OF CARDIOLOGYT VOL. 87 JANUARY 1, 2001

to separate patients with constrictive pericarditis andrestrictive cardiomyopathy with comparable accuracyto the traditional methods of respiratory variation ofpulmonary venous flow (18%) and mitral inflow(10%).
Using pulsed-wave Doppler transthoracic echocar-diography, Hatle et al5 showed significant respiratorychanges in mitral inflow, tricuspid inflow, aortic, andpulmonary outflow in patients with constrictive peri-carditis that was significantly diminished in those withrestrictive cardiomyopathy. Other investigators haveconfirmed these findings on the left side of the heart.7
In this present study, patients with constrictive peri-carditis had a respiratory variation of 15% in peakmitral inflow E that was significantly less than the28% variation in pulmonary venous flow peak D wave(p ,0.001), whereas the variation of mitral inflow Ewave and pulmonary venous peak D wave was dimin-ished and similar in patients with restrictive cardio-myopathy. The difference in respiratory variation be-tween pulmonary venous flow and mitral inflow inconstrictive pericarditis has been documented previ-ously.7,24,25 It may be related to technical difficulties
of obtaining optimal sample volumepositioning and alignment of the ul-trasound beam at the left ventricularinflow level, using the TEE ap-proach.
Tissue Doppler echocardiographyis an echocardiographic tool that al-lows investigators to obtain myocar-dial wall velocities during ultrasoundexamination.11,26–28In this study, weperformed pulsed Doppler of the lat-eral annulus and observed the motionand velocity of the mitral annulustoward the base during diastole andtoward the apex during systole withno movement by the apex in relationto the imaging transducer. These ve-locities reflect the expansion andcontraction of the left ventricle in the
longitudinal plane.21
Using a peak Ea of 8.0 cm/s, we have clearlyseparated patients with constrictive pericarditis fromthose with restrictive cardiomyopathy (Figure 5). Al-though there were differences between constrictionand restriction in regards to peak Sa and peak Aa, moreoverlap was evident in these variables between the 2groups. In addition, not all recordings produced avisible and measurable Aa peak due to the presence ofatrial fibrillation or background interference. A num-ber of investigators have speculated that peak Ea is animportant measure of left ventricular relaxation.27,28
Primary myocardial diseases influence the rate of leftventricular relaxation, which may explain its utility indifferentiating between constrictive and restrictivediseases. We observed a significantly lower Ea inpatients with restrictive cardiomyopathy than in thosewith constrictive pericarditis. Similarly, other investi-gators were able to use the peak Ea wave to identifypatients with relaxation abnormalities independent oftheir filling pressures.29
Color M-mode Doppler is a technique that allowsone to obtain a spatio-temporal velocity map with a
TABLE 3 Mitral Inflow Data in 19 Patients With Constrictive Pericarditis and 11 Patients With Restrictive Cardiomyopathy
Constrictive Pericarditis Restrictive Cardiomyopathy
Inspiration Expiration %E Inspiration Expiration %E
Peak velocitiesPeak E (cm/s) 61 6 26* 72 6 29 15 6 7† 82 6 18* 87 6 18 6 6 4Peak A (cm/s) 40 6 23 46 6 25 14 6 10† 36 6 13 36 6 17 5 6 17E/A 1.7 6 0.9 1.7 6 0.7 1 6 16 2.4 6 0.7 2.8 6 1.3 10 6 13DT (ms) 136 6 41 142 6 43 4 6 15 126 6 21 122 6 21 24 6 11IVRT (ms) 74 6 4 67 6 6 210 6 10† 62 6 5 62 6 6 1 6 4
Flow velocity integralE velocity (cm) 6.8 6 4.1* 8.9 6 4.7 22 6 19† 10 6 2 11 6 2 2 6 7A velocity (cm) 3.7 6 2.1* 4.4 6 2.1 18 6 12† 4.3 6 1.8 4.3 6 2.1 4 6 13E/A 1.9 6 0.9 2.0 6 0.7 6 6 0.3 2.7 6 0.9 2.9 6 1.5 5 6 14
*p ,0.001 inspiration versus expiration values.†Constrictive pericarditis versus restrictive cardiomyopathy values.Values presented are mean value 6 SD.A 5 peak late transmitral flow velocity; DT 5 deceleration time; E 5 peak early transmitral flow velocity; E/A 5 early/late filling velocity; IVRT 5 isovolumic
relaxation time.
TABLE 4 Tissue Doppler Echocardiographic Measurements for 19 Patients WithPericarditis and 11 Patients With Restrictive Cardiomyopathy
ConstrictivePericarditis
RestrictiveCardiomyopathy p Value
Transmitral flowPeak E (cm/s) 67 6 25 85 6 19 NSE/A ratio 1.8 6 1.0 2.7 6 1.4 NS
Mitral annulusPeak systolic velocity (cm/s) 7.9 6 1.4 5.5 6 2.5 NSEa (cm/s) 12.7 6 4.3 5.3 6 1.6 ,0.001Ea acceleration (m/s2) 1.8 6 0.9 0.6 6 0.2 ,0.001Ea deceleration (m/s2) 1.9 6 1.2 0.6 6 0.3 ,0.001Aa 9.6 6 3.0 3.8 6 2.7 ,0.001Ea/E ratio 0.19 6 0.08 0.07 6 0.03 ,0.001
Values are mean value 6 SD. A p value ,0.001 was considered statistically significant.Aa 5 peak velocity of longitudinal axis expansion during atrial contraction; Ea 5 peak early velocity
of longitudinal axis expansion.
MISCELLANEOUS/PERICARDIAL HEART DISEASE AND RESTRICTIVE CARDIOMYOPATHY 91

temporal resolution of 5 ms, a spatial resolution of 300mm, and a velocity resolution of about 3 cm/s. Amajor difference exists between color M-mode Dopp-
ler and normal pulsed-wave Doppler because the latteryields data on the temporal course of velocity at afixed spatial point, whereas color M-mode Dopplerallows acquisition of information on velocity, time,and space.10 By obtaining information on these 3parameters, a more complete picture of the diastolicfilling pattern can be acquired. Brun et al,13 usingcolor M-mode of early left ventricular filling, foundthat the slope of the transition color/no-color wasstrongly correlated with the time constant of left ven-tricular relaxation and that this slope was not relatedwith the mitral inflow peak early E wave. Pai et al30
analyzed E-wave propagation inside the left ventricleand found that the rate of propagation was determinedsolely by left ventricular early diastolic stiffness,which is increased in those patients with restrictivecardiomyopathy.
In our study, using the slope of the first aliasingcontour, which measures the propagation of highervelocities, we observed that patients with restrictivecardiomyopathy had a progressively slower flow prop-agation velocity than those patients with constrictivepericarditis. Interestingly, the slope of the color/no-color transition as defined by Brun et al13 was notsignificantly different between the 2 groups. Thisslope measurement could be misleading due to theimpact of isovolumic flow on the measurement. Wealso found that the progression of the maximal veloc-ity from the mitral annulus to the apex was signifi-cantly delayed in patients with restrictive cardiomy-opathy, which most likely reflects abnormalities in leftventricular relaxation in these patients.
Of the 2 newer modalities, tissue Doppler echocar-diography of the mitral annulus tended to have greaterspecificity and sensitivity than color M-mode flowpropagation and was generally easier to use. It wasrelatively easier to measure the lateral annulus S, E,and A waves during diastolic function examination.11
One potential scenario in which the mitral annularvelocities may actually be reduced in constrictive peri-carditis is if the mitral annulus is relatively fixed bythe pericardial process.31 The slopes of the color/no-color transition and first aliasing contour were readilyobtainable using the tools available on most ultra-sound equipment and was often done on a routinebasis for the evaluation of diastolic function. How-ever, for some patients, the interface was not a straight
FIGURE 4. Representative tracings of the tissue Doppler echocar-diographic velocities in the longitudinal axis in a patient withconstrictive pericarditis (top) and a patient with restrictive cardio-myopathy (bottom) with respiratory monitoring with inspiration(up-arrow) and expiration (down-arrow). Note the peak systolicvelocities are similar in both patients (10 cm/s), but a markeddifference in early diastolic longitudinal axis velocities Ea wasnoted for the patient with constrictive pericarditis (15 cm/s) com-pared with the patient who had restrictive cardiomyopathy (5cm/s).
FIGURE 5. Peak early longitudinal axial velocities (Ea) in patientswith constrictive pericarditis (CP) and restrictive cardiomyopathy(RCM). A value of >8.0 cm/s differentiated patients with con-strictive pericarditis with 89% sensitivity and 100% specificity.
TABLE 5 Color M-mode Flow Propagation Measurements for19 Constrictive and 11 Restrictive Patients
ConstrictivePericarditis
RestrictiveCardiomyopathy p Value
Slope (cm/s)Color/no color transition 128 6 47 111 6 37 NSFirst aliasing contour 129 6 49 53 6 27 ,0.001
Apical displacement ofmaximal velocity (cm)
1.9 6 0.9 1.1 6 0.2 NS
Time delay of maximalvelocity (ms)
22 6 10 61 6 20 ,0.001
Values presented are mean value 6 SD. A p value ,0.001 was consideredstatistically significant.
92 THE AMERICAN JOURNAL OF CARDIOLOGYT VOL. 87 JANUARY 1, 2001
line, resulting in some problems in the measurementsand not all patients may have had a first aliasingcontour.
Interestingly, if there was no significant respiratoryvariation of the mitral inflow or pulmonary venousflow (5 patients), the newer modalities would havecorrectly classified these patients as having constric-tive physiology (80%).
Study limitations: This is relatively a small group ofpatients and a larger population is desirable for defi-
nite conclusions. Some overlap of the newer imagingmodalities could result from concomitant myocardialdysfunction in patients with constrictive pericarditis.Our results indicated that both tissue Doppler echo-cardiography and color M-mode flow propagation arerelatively preload independent; however, the effect ofmanipulating preload conditions, stroke volume, andthe effect of left ventricular geometry has not beenfully investigated. Concerning color M-mode Dopp-ler, the first aliasing contour is an artificial constructrather than a line representing a physiologic parame-ter. Finally, we used different echocardiographic mo-dalities to evaluate pulmonary venous flow (TEE) andtissue Doppler and color M-mode Doppler (transtho-racic echocardiography). However, TEE may offersome advantages that may make it necessary to per-form in the examination of certain patients with com-plex diastolic function examinations in addition to atransthoracic examination with tissue Doppler echo-cardiography and color M-mode flow propagation. Itcan provide an accurate recording of pulmonary ve-nous flow in all patients with diastolic dysfunction andcan determine the location and degree of thickness ofthe pericardium to help diagnose constrictive pericar-ditis.9 Finally, there were no attempts to blind theimaging modality measurements from the differentdiseases.
FIGURE 6. Color Doppler M-mode echocardiography of diastolicflow from the left atrium (LA) toward the ventricular apex as im-aged from the 4-chamber view with constriction (top) and restric-tion (bottom), with respiratory monitoring with inspiration (up-arrow) and expiration (down-arrow). The flow propagationslope of the first aliasing contour (white line) is steep (110 cm/s)for constrictive pericarditis but the slope is significantly slower(35 cm/s) in restrictive cardiomyopathy. Note the color/no-colortransition (yellow line) is rapid for restrictive cardiomyopathyand represents isovolumic flow. A significant difference in thetime delay of the maximal velocities is evident as well.
FIGURE 7. Slope of the first aliasing contour in patients with con-strictive pericarditis (CP) and restrictive cardiomyopathy (RCM).A slope of >100 cm/s differentiated patients with constrictivepericarditis with 74% sensitivity and 91% specificity.
FIGURE 8. Color Doppler M-mode echocardiography of diastolicflow from the left atrium toward the ventricular apex in a patientwith restrictive cardiomyopathy showing the apical time delayusing the LabView program (top). The color velocities have beendealiased and digital calipers have been placed at the mitralvalve level and at the apical region. The velocity profile in thetemporal domain is shown at the bottom at the level of the mi-tral annulus (yellow) and at the level of the apex (red). The timedelay (TD) was measured as the time difference between themaximal velocities at both levels.
MISCELLANEOUS/PERICARDIAL HEART DISEASE AND RESTRICTIVE CARDIOMYOPATHY 93

1. Nishimura RA, Connolly DC, Parkin TW, Stanson AW. Constrictive pericar-ditis: assessment of current diagnostic procedures.Mayo Clin Proc1985;60:397–401.2. Klein AL, Cohen GI. Doppler echocardiographic assessment of constrictivepericarditis, cardiac amyloidosis, and cardiac tamponade.Cleve Clin J Med1992;59:278–290.3. Lorell B, Grossman W. Profiles in constrictive pericarditis, restrictive cardio-myopathy and cardiac tamponade. In: Baim DS, Grossman W, eds. Cardiaccatheterization, Angiography and Intervention. Baltimore: Williams and Wilkins,1996:801–857.4. Spodick DH. Constrictive pericarditis. In: Spodick DH, ed. The Pericardium:A Comprehensive Textbook. New York: Marcel Dekker, Inc, 1997:214–259.5. Hatle LK, Appleton CP, Popp RL. Differentiation of constrictive pericarditisand restrictive cardiomyopathy by Doppler echocardiography.Circulation 1989;79:357–370.6. Schiavone WA, Calafiore PA, Currie PJ, Lytle BW. Doppler echocardio-graphic demonstration of pulmonary venous flow velocity in three patients withconstrictive pericarditis before and after pericardiectomy.Am J Cardiol1989;63:145–147.7. Klein AL, Cohen GI, Pietrolungo JF, White RD, Bailey A, Pearce GL, StewartWJ, Salcedo EE. Differentiation of constrictive pericarditis from restrictivecardiomyopathy by Doppler transesophageal echocardiographic measurements ofrespiratory variations in pulmonary venous flow.J Am Coll Cardiol1993;22:1935–1943.8. Oh JK, Hatle LK, Seward JB, Danielson GK, Schaff HV, Reeder GS, Tajik AJ.Diagnostic role of Doppler echocardiography in constrictive pericarditis.J AmColl Cardiol 1994;23:154–162.9. Klein AL, Canale MP, Rajagopalan N, White RD, Murray RD, Wahi S,Arheart KL, Thomas JD. Role of two-dimensional and Doppler transesophagealechocardiography in assessing diastolic dysfunction in a large clinical practice: anine-year experience.Am Heart J1999;138:880–889.10. Cohen GI, Pietrolungo JF, Thomas JD, Klein AL. A practical guide toassessment of ventricular diastolic function using Doppler echocardiography.J Am Coll Cardiol1996;27:1753–1760.11. Garcia MJ, Thomas JD, Klein AL. New Doppler echocardiographic appli-cations for the study of diastolic function.J Am Coll Cardiol1998;32:865–875.12. Garcia MJ, Rodriguez L, Ares M, Griffin BP, Thomas JD, Klein AL.Differentiation of constrictive pericarditis from restrictive cardiomyopathy: as-sessment of left ventricular diastolic velocities in longitudinal axis by Dopplertissue imaging.J Am Coll Cardiol1996;27:108–114.13. Brun P, Tribouilloy C, Duval AM, Iserin L, Meguira A, Pelle G, Dubois-Rande JL. Left ventricular flow propagation during early filling is related to wallrelaxation: a color M-mode Doppler analysis.J Am Coll Cardiol1992;20:420–432.14. Stugaard M, Smiseth OA, Risoe C, Ihlen H. Intraventricular early diastolicfilling during acute myocardial ischemia, assessment by multigated color m-modeDoppler echocardiography.Circulation 1993;88:2705–2713.15. Rodriguez L, Ares MA, Vandervoort P, Thomas JD, Greenberg N, Klein AL.Does color M-mode flow propagation differentiate between patients with restrictivevs. constrictive physiology (abstr)?J Am Coll Cardiol1996;27(suppl A):268A.
16. Appleton CP, Popp RL, Hatle LK. Differentiation of constrictive pericarditisand restrictive cardiomyopathy: general overview and new insights from two-dimensional and Doppler echocardiographic studies. In: Soler-Soler J, ed. Peri-cardial Disease. Dordrecht, The Netherlands: Kluwer Academic Publishers, 1990:59–93.17. Klein A, Scalia G. Diseases of the pericardium, restrictive cardiomyopathyand diastolic dysfunction. In: Topol E, ed. Textbook of Cardiovascular Medicine.Philadelphia: Lippincott-Raven Publishers, 1998:639–705.18. Spodick DH. Combined restrictive cardiomyopathy and constrictive pericar-ditis (lett). Circulation 1996;93:616.19. Zelin S, Skiles JA, Klein AL. Echocardiographic and clinical features ofmixed constriction restriction (abstr).J Am Coll Cardiol2000;35:434A.20. Quinones MA, Waggoner AD, Reduto LA, Nelson JG, Young JB, WintersWL Jr, Ribeiro LG, Miller RR. A new simplified and accurate method fordetermining ejection fraction with two-dimensional echocardiography.Circula-tion 1981;64:744–753.21. Garcia MJ, Rodriguez L, Ares M, Griffin BP, Klein AL, Stewart WJ, ThomasJD. Myocardial wall velocity assessment by pulsed Doppler tissue imaging:characteristic findings in normal subjects.Am Heart J1996;132:648–656.22. Seward JB, Khandheria BK, Freeman WK, Oh JK, Enriquez-Sarano M,Miller FA, Edwards WD, Tajik AJ. Multiplane transesophageal echocardiogra-phy: image orientation, examination technique, anatomic correlations, and clin-ical applications.Mayo Clin Proc1993;68:523–551.23. Thomas JD, Garcia MJ, Greenberg NL. Application of color Doppler M-mode echocardiography in the assessment of ventricular diastolic function: po-tential for quantitative analysis.Heart Vessels1997;12(suppl):135–137.24. Meijburg HW, Visser CA, Bredee JJ, Westerhof PW. Clinical relevance ofDoppler pulmonary venous flow characteristics in constrictive pericarditis.EurHeart J 1995;16:506–513.25. Grodecki PV, Klein AL. Pitfalls in the echo-Doppler assessment of diastolicdysfunction.Echocardiography1993;10:213–234.26. Sohn DW, Chai IH, Lee DJ, Kim HC, Kim HS, Oh BH, Lee MM, Park YB,Choi YS, Seo JD, Lee YW. Assessment of mitral annulus velocity by Dopplertissue imaging in the evaluation of left ventricular diastolic function.J Am CollCardiol 1997;30:474–480.27. Oki T, Tabata T, Yamada H, Wakatsuki T, Shinohara H, Nishikado A, IuchiA, Fukuda N, Ito S. Clinical application of pulsed Doppler tissue imaging forassessing abnormal left ventricular relaxation.Am J Cardiol1997;79:921–928.28. Nagueh SF, Lakkis NM, Middleton KJ, Spencer WH III Zoghbi WA,Quinones MA. Doppler estimation of left ventricular filling pressures in patientswith hypertrophic cardiomyopathy.Circulation 1999;99:254–261.29. Nagueh SF, Middleton KJ, Kopelen HA, Zoghbi WA, Quinones MA.Doppler tissue imaging: a noninvasive technique for evaluation of left ventricularrelaxation and estimation of filling pressures.J Am Coll Cardiol1997;30:1527–1533.30. Pai RG, Yoganathan AP, Toomes C, Eberhardt C, Shah PM. Mitral E wavepropagation as an index of left ventricular diastolic function. I: Its hydrodynamicbasis.J Heart Valve Dis1998;7:438–444.31. Hatle L, Sutherland GR. Regional myocardial function—a new approach.EurHeart J 2000;21:1337–1357.
94 THE AMERICAN JOURNAL OF CARDIOLOGYT VOL. 87 JANUARY 1, 2001
Copyright © 2022 FDOKUMEN


![[Clinical and laboratory features of patients with pericardial effusion]](https://static.fdokumen.com/doc/165x107/6325f6805547884b71068814/clinical-and-laboratory-features-of-patients-with-pericardial-effusion.jpg)


