Comparison of methods for the simplification of mesh models of the lungs using quality indices and...
12
Comparison of Methods for the Simplification of Mesh Models using Quality Indices and an Observer Study Samuel Silva, a Joaquim Madeira, a,b Carlos Ferreira c,d and Beatriz Sousa Santos a,b a Instituto de Engenharia Electr´ onica e Telem´atica de Aveiro, Universidade de Aveiro, Portugal b Dep. Electr´ onica, Telecomunica¸ c˜oes e Inform´atica, Universidade de Aveiro, Portugal c Dep. Economia, Gest˜ ao e Engenharia Industrial, Universidade de Aveiro, Portugal d Centro de Investiga¸ c˜ao Operacional, Universidade de Lisboa, Portugal ABSTRACT The complexity of a polygonal mesh model is usually reduced by applying a simplification method, resulting in a similar mesh having less vertices and faces. Although several such methods have been developed, only a few observer studies are reported comparing them regarding the perceived quality of the obtained simplified meshes, and it is not yet clear how the choice of a given method, and the level of simplification achieved, influence the quality of the resulting model, as perceived by the final users. Mesh quality indices are the obvious less costly alternative to user studies, but it is also not clear how they relate to perceived quality, and which indices best describe the users behavior. Following on earlier work carried out by the authors, but only for mesh models of the lungs, a comparison among the results of three simplification methods was performed through (1) quality indices and (2) a controlled experiment involving 65 observers, for a set of five reference mesh models of different kinds. These were simplified using two methods provided by the OpenMesh library — one using error quadrics, the other additionally using a normal flipping criterion — and also by the widely used QSlim method, for two simplification levels: 50% and 20% of the original number of faces. The main goal was to ascertain whether the findings previously obtained for lung models, through quality indices and a study with 32 observers, could be generalized to other types of models and confirmed for a larger number of observers. Data obtained using the quality indices and the results of the controlled experiment were compared and do confirm that some quality indices (e.g., geometric distance and normal deviation, as well as a new proposed weighted index) can be used, in specific circumstances, as reasonable estimators of the user perceived quality of mesh models. Keywords: Meshes, perceived quality, evaluation, user study, mesh simplification. 1. INTRODUCTION Polygonal meshes are widely used to represent different kinds of models in many application domains (e.g., medical visualization, CAD/CAM, physically-based modeling and computer games). Whenever such models are defined by a relatively large number of faces, and due to insufficient memory or low processing power, the required rendering time might not be adequate to allow interactive visualization, a mostly desirable feature in, for instance, decision scenarios, where the choice of adequate views is important. In this case, a possible solution consists in showing a simplified version while the user interactively chooses the viewpoint and, then, a fully detailed version of the model to support its analysis. To tackle this problem, simplification methods can be used to generate a similar and more manageable, less complex mesh model having a smaller number of vertices and faces. While several such simplification methods have been developed and are reported in the literature (e.g., see the survey by Luebke 1 ), only a few evaluation studies are reported comparing them regarding the perceived quality of the obtained simplified meshes. 2 Moreover, it is not yet clear how the choice of a given method, and the level of simplification achieved, influence the quality of the resulting model, as perceived by the final users. Clearly, this should be taken into account when choosing a particular simplification method for a given application domain. Send correspondence to Samuel Silva ([email protected]).
-
Upload
independent -
Category
Documents
-
view
0 -
download
0
Transcript of Comparison of methods for the simplification of mesh models of the lungs using quality indices and...

Comparison of Methods for the Simplification of MeshModels using Quality Indices and an Observer Study
Samuel Silva,a Joaquim Madeira,a,b Carlos Ferreirac,d and Beatriz Sousa Santosa,b
aInstituto de Engenharia Electronica e Telematica de Aveiro, Universidade de Aveiro, PortugalbDep. Electronica, Telecomunicacoes e Informatica, Universidade de Aveiro, PortugalcDep. Economia, Gestao e Engenharia Industrial, Universidade de Aveiro, Portugal
dCentro de Investigacao Operacional, Universidade de Lisboa, Portugal
ABSTRACT
The complexity of a polygonal mesh model is usually reduced by applying a simplification method, resulting ina similar mesh having less vertices and faces. Although several such methods have been developed, only a fewobserver studies are reported comparing them regarding the perceived quality of the obtained simplified meshes,and it is not yet clear how the choice of a given method, and the level of simplification achieved, influence thequality of the resulting model, as perceived by the final users. Mesh quality indices are the obvious less costlyalternative to user studies, but it is also not clear how they relate to perceived quality, and which indices bestdescribe the users behavior.
Following on earlier work carried out by the authors, but only for mesh models of the lungs, a comparisonamong the results of three simplification methods was performed through (1) quality indices and (2) a controlledexperiment involving 65 observers, for a set of five reference mesh models of different kinds. These were simplifiedusing two methods provided by the OpenMesh library — one using error quadrics, the other additionally usinga normal flipping criterion — and also by the widely used QSlim method, for two simplification levels: 50% and20% of the original number of faces. The main goal was to ascertain whether the findings previously obtainedfor lung models, through quality indices and a study with 32 observers, could be generalized to other types ofmodels and confirmed for a larger number of observers. Data obtained using the quality indices and the resultsof the controlled experiment were compared and do confirm that some quality indices (e.g., geometric distanceand normal deviation, as well as a new proposed weighted index) can be used, in specific circumstances, asreasonable estimators of the user perceived quality of mesh models.
Keywords: Meshes, perceived quality, evaluation, user study, mesh simplification.
1. INTRODUCTION
Polygonal meshes are widely used to represent different kinds of models in many application domains (e.g.,medical visualization, CAD/CAM, physically-based modeling and computer games). Whenever such modelsare defined by a relatively large number of faces, and due to insufficient memory or low processing power, therequired rendering time might not be adequate to allow interactive visualization, a mostly desirable feature in,for instance, decision scenarios, where the choice of adequate views is important. In this case, a possible solutionconsists in showing a simplified version while the user interactively chooses the viewpoint and, then, a fullydetailed version of the model to support its analysis. To tackle this problem, simplification methods can be usedto generate a similar and more manageable, less complex mesh model having a smaller number of vertices andfaces.
While several such simplification methods have been developed and are reported in the literature (e.g., see thesurvey by Luebke1), only a few evaluation studies are reported comparing them regarding the perceived qualityof the obtained simplified meshes.2 Moreover, it is not yet clear how the choice of a given method, and the level ofsimplification achieved, influence the quality of the resulting model, as perceived by the final users. Clearly, thisshould be taken into account when choosing a particular simplification method for a given application domain.
Send correspondence to Samuel Silva ([email protected]).
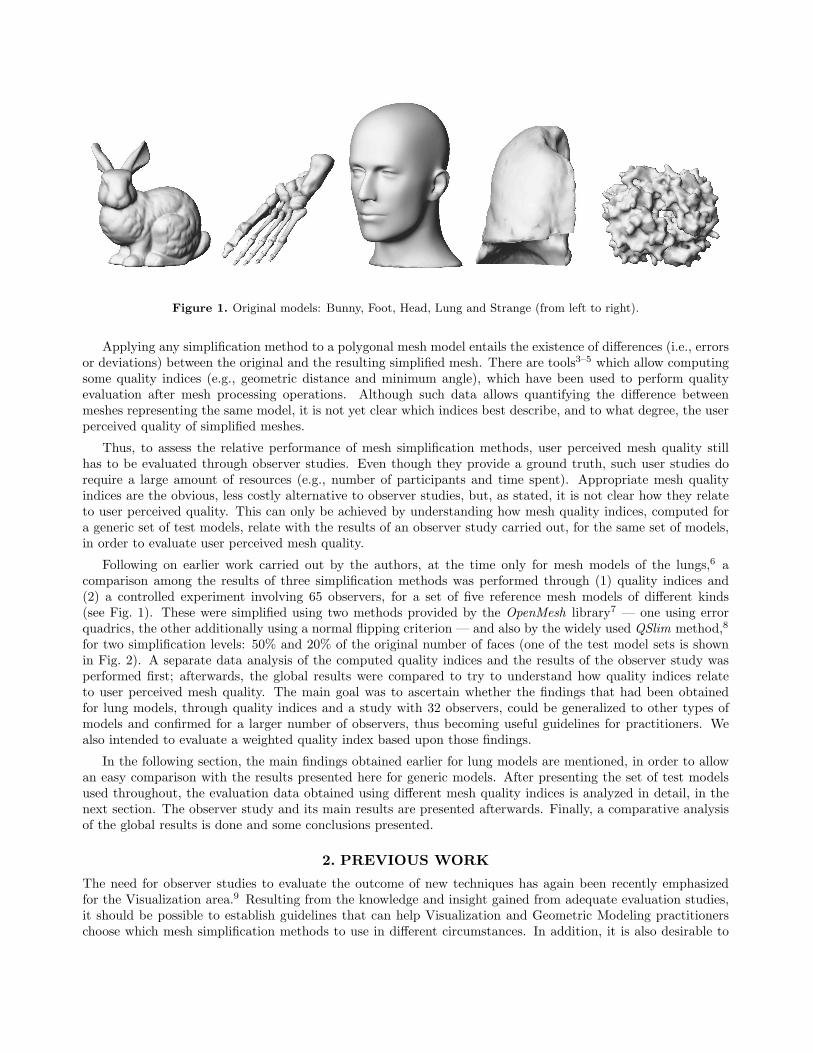
Figure 1. Original models: Bunny, Foot, Head, Lung and Strange (from left to right).
Applying any simplification method to a polygonal mesh model entails the existence of differences (i.e., errorsor deviations) between the original and the resulting simplified mesh. There are tools3–5 which allow computingsome quality indices (e.g., geometric distance and minimum angle), which have been used to perform qualityevaluation after mesh processing operations. Although such data allows quantifying the difference betweenmeshes representing the same model, it is not yet clear which indices best describe, and to what degree, the userperceived quality of simplified meshes.
Thus, to assess the relative performance of mesh simplification methods, user perceived mesh quality stillhas to be evaluated through observer studies. Even though they provide a ground truth, such user studies dorequire a large amount of resources (e.g., number of participants and time spent). Appropriate mesh qualityindices are the obvious, less costly alternative to observer studies, but, as stated, it is not clear how they relateto user perceived quality. This can only be achieved by understanding how mesh quality indices, computed fora generic set of test models, relate with the results of an observer study carried out, for the same set of models,in order to evaluate user perceived mesh quality.
Following on earlier work carried out by the authors, at the time only for mesh models of the lungs,6 acomparison among the results of three simplification methods was performed through (1) quality indices and(2) a controlled experiment involving 65 observers, for a set of five reference mesh models of different kinds(see Fig. 1). These were simplified using two methods provided by the OpenMesh library7 — one using errorquadrics, the other additionally using a normal flipping criterion — and also by the widely used QSlim method,8
for two simplification levels: 50% and 20% of the original number of faces (one of the test model sets is shownin Fig. 2). A separate data analysis of the computed quality indices and the results of the observer study wasperformed first; afterwards, the global results were compared to try to understand how quality indices relateto user perceived mesh quality. The main goal was to ascertain whether the findings that had been obtainedfor lung models, through quality indices and a study with 32 observers, could be generalized to other types ofmodels and confirmed for a larger number of observers, thus becoming useful guidelines for practitioners. Wealso intended to evaluate a weighted quality index based upon those findings.
In the following section, the main findings obtained earlier for lung models are mentioned, in order to allowan easy comparison with the results presented here for generic models. After presenting the set of test modelsused throughout, the evaluation data obtained using different mesh quality indices is analyzed in detail, in thenext section. The observer study and its main results are presented afterwards. Finally, a comparative analysisof the global results is done and some conclusions presented.
2. PREVIOUS WORK
The need for observer studies to evaluate the outcome of new techniques has again been recently emphasizedfor the Visualization area.9 Resulting from the knowledge and insight gained from adequate evaluation studies,it should be possible to establish guidelines that can help Visualization and Geometric Modeling practitionerschoose which mesh simplification methods to use in different circumstances. In addition, it is also desirable to

Figure 2. Sample test model set: original Head model and three severely simplified versions using QSlim and the twomethods provided by the OpenMesh library (from left to right).
identify which quality indices are the most appropriate (in the sense that they estimate the users behavior) forevaluating the results of the simplification operations.
Aiming at establishing guidelines for the proper choice of mesh simplification methods, the authors have beenevaluating the quality of simplified mesh models both using observer studies and computing quality indices. Ourfirst objective was to try to find out which methods entail better user perceived quality for the same simplificationlevel. Since such observer studies are costly, we have also been studying quality indices which might provide analternative measure of user perceived mesh quality, and be reasonable estimators of the users preferences.
The whole research work carried out is based on three simplification methods deemed representative: thewidely used QSlim8 and the other two provided by the relatively recent OpenMesh7 library — one using errorquadrics, the other additionally using a normal flipping criterion. Two simplification levels were set: moderatesimplification to 50% and severe simplification to 20% of the number of original model faces. In a first stage, wedealt only with mesh models of the lungs; currently, we are using generic mesh models of different kinds, andinvestigating whether the particular earlier findings are confirmed for such models.
As thoroughly described by Silva et al.,10 an experimental framework, supporting software, and a data analysismethodology were developed which allowed conducting a users study with 32 observers, who evaluated, for thethree methods and simplification levels chosen and by performing preference and rating tasks, 24 simplified lungmodels according to their perceived quality. A within subjects experimental design was used and all participantscould interact (e.g., zoom, rotate) with each 3D model at all experimental conditions, although in different order.
The analysis of the collected data suggested that the simplification level does influence the observers’ decisiontimes, as expected from the onset of the experiment: they seem to make faster decisions for the severely simplifiedmodels (20%). More important, observers seem also to be responsive to the simplification method used, althoughthey react differently according to the simplification level: for a moderate simplification (50%), the modelsgenerated by the OpenMesh simplification method, with the additional normal flipping criterion, obtained thebest results for the preference task; for a severe simplification, it is the QSlim method that generates most ofthe models classified in the first place, this time for both tasks.
In Santos et al.6 we used several quality indices to analyze the differences between the original and thesimplified versions of all the lung models used in the previous study: for each one of the 24 simplified models, wecomputed six quality indices regarding the corresponding original. Namely, we determined the maximum, meanand variance values of the geometric distance (the distance between corresponding points on both surfaces), aswell as of the normal deviation (the difference between corresponding normal vectors).
A preliminary analysis of the data showed that, for the three geometric distance quality indices, QSlim isthe best classified method for both simplification levels. However, for the three normal deviation indices, thebest classified method is the one provided by OpenMesh, with the additional normal flipping criterion. Furtheranalysis regarding the mean geometric distance values showed that, for both simplification levels, QSlim isthe best method, followed by the OpenMesh simplification method using error quadrics, and by the OpenMesh

Figure 3. Left, dendogram showing associations between all computed quality indices for severe simplifications; right,dendogram showing associations after discarding some redundant quality indices.
method using the additional normal flipping criterion. For the mean normal deviation no clear association couldbe established for the severe (20%) simplification level, while for moderately simplified models the OpenMeshsimplification method, with the normal flipping criterion, was the best classified, followed by QSlim, and by theOpenMesh method using error quadrics.
Additional comparison between those results and the ones obtained for the previous observer study showedthat, at least in those specific circumstances, the mean geometric distance between the original and the simplifiedmesh could be a good estimator of the observers’ preferences for severely (20%) simplified models, but notfor moderate simplifications. Conversely, mean normal deviation might be a good estimator of the observers’preferences for moderately (50%) simplified models.
The findings briefly presented above suggest that users might be more sensitive to the geometric distance,between a simplified model and its original, in the presence of less information, and more sensitive to the normaldeviation in the presence of more information (i.e., for moderately simplified models). Nevertheless, this resulthas to be confirmed by an observer study involving more observers, as well as generalized to other kinds ofmodels. Other quality indices should also be considered. Such are the objectives of the work reported in theremaining of this paper.
3. QUALITY INDICES
Quality indices have been used in many situations to assess the resulting quality of several mesh processingmethods. Some tools like Metro,3 MeshDev4 and more recently PolyMeCo,5 the mesh analysis and comparisontool being developed at the University of Aveiro, allow the computation of various quality indices for polygonalmesh models.
In what follows the quality assessment of several simplified mesh models is described. First, a short presen-tation of the evaluated model set is provided. Then, the quality indices, which were computed using PolyMeCo,are briefly described. Finally, the analysis of the mean values obtained for each quality index is presented.
3.1. Simplified Mesh Models
In order to be able to compare the outcomes of the observer study, and the analysis using quality indices, with thefindings previously obtained for mesh models of the lungs, test models were generated using the same methods(from now on denoted simply by QS, OM and OMNF ) and simplification levels (50% and 20%) as before.
Model sets were built from the set of five reference models (see Fig. 1): for each model and each simplificationlevel three simplified models were created using the three simplification methods. This resulted in a total of 10test sets, each composed by an original and three simplified models (see Fig. 2, for an example of such a set).Note that the five original, reference models chosen are different from each other and have different numbers ofvertices and faces.

Figure 4. Left, dendogram showing associations between all computed quality indices for moderate simplifications;right, dendogram showing associations after discarding some redundant quality indices.
3.2. Quality Indices
Several quality indices provided by PolyMeCo5 were computed for each one of the 30 simplified models:
• Geometric Distance (GD) — This quality index computes the distance between corresponding pointsof two model surfaces;4
• Normal Deviation (ND) — This quality index measures the deviation between surface normals of twomodels. This can be an important issue, since surface normals are directly related with the renderingprocess: a strong deviation may result in visual artifacts;4
• Composed Deviation (COM2) — This quality index is being proposed based upon our previous resultswhich suggest that the Geometric Distance is a good estimator of user perceived quality for severe simplifi-cations, while Normal Deviation is a good estimator for moderate simplifications. Thus, these two qualityindices are weighted according to the simplification level of the mesh;
• Smoothness — To measure smoothness some alternatives were considered. S3 is the usual smoothnessmeasure which computes the distance of each vertex to the centroid of its one ring. S1 computes smoothnessusing, not the norm of the vertex-centroid distance, but the difference vector, which implies that, whencomputing the mean value, symmetric differences will cancel each other. This tries to explore the factthat, if a model has a less smooth surface, it can still be deemed acceptable if it maintains some symmetry.Finally, the Sijk indices compute smoothness using vertices from the first, second and third neighborhoodsof a vertex, assigning them weights of 0.1 × i, 0.1 × j and 0.1 × k, respectively;
• Mean and Gaussian Deviations (MCD, GCD) — These indices express the differences in Mean andGaussian curvature between two models;11
• Angle Analysis (ANG) — This index computes the smallest angle for each triangle which composesthe mesh. A minimum angle close to 60 degrees identifies a triangle close to equilateral; a smaller valueidentifies deformed triangles (e.g., flat or needle triangles).12
Note that PolyMeCo was used to compute the values distribution for each simplified model and quality index,but only the mean values (deemed more representative) were considered for the data analysis.
3.3. Data Analysis
For every simplified model, the mean value for each one of the above described quality indices was computed.Based upon those mean values, for each simplified model and for the same simplification level, a rank (first,second and third place) was assigned to the three models comprising each test set.

GD ND
S1 GCD
ANG COM2
Figure 5. Quality indices: correspondence analysis showing the associations between simplification method and ranksobtained for severe simplification.

GD ND
S1 GCD
ANG COM2
Figure 6. Quality indices: correspondence analysis showing the associations between simplification method and ranksobtained for moderate simplification.
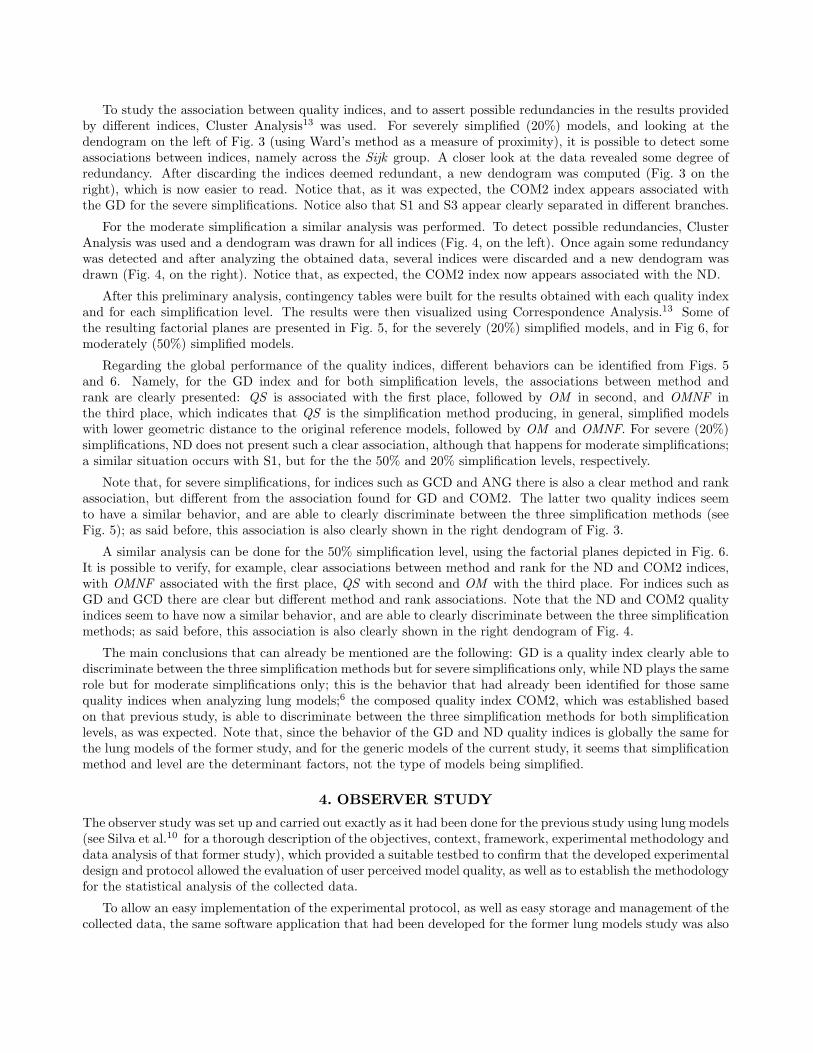
To study the association between quality indices, and to assert possible redundancies in the results providedby different indices, Cluster Analysis13 was used. For severely simplified (20%) models, and looking at thedendogram on the left of Fig. 3 (using Ward’s method as a measure of proximity), it is possible to detect someassociations between indices, namely across the Sijk group. A closer look at the data revealed some degree ofredundancy. After discarding the indices deemed redundant, a new dendogram was computed (Fig. 3 on theright), which is now easier to read. Notice that, as it was expected, the COM2 index appears associated withthe GD for the severe simplifications. Notice also that S1 and S3 appear clearly separated in different branches.
For the moderate simplification a similar analysis was performed. To detect possible redundancies, ClusterAnalysis was used and a dendogram was drawn for all indices (Fig. 4, on the left). Once again some redundancywas detected and after analyzing the obtained data, several indices were discarded and a new dendogram wasdrawn (Fig. 4, on the right). Notice that, as expected, the COM2 index now appears associated with the ND.
After this preliminary analysis, contingency tables were built for the results obtained with each quality indexand for each simplification level. The results were then visualized using Correspondence Analysis.13 Some ofthe resulting factorial planes are presented in Fig. 5, for the severely (20%) simplified models, and in Fig 6, formoderately (50%) simplified models.
Regarding the global performance of the quality indices, different behaviors can be identified from Figs. 5and 6. Namely, for the GD index and for both simplification levels, the associations between method andrank are clearly presented: QS is associated with the first place, followed by OM in second, and OMNF inthe third place, which indicates that QS is the simplification method producing, in general, simplified modelswith lower geometric distance to the original reference models, followed by OM and OMNF. For severe (20%)simplifications, ND does not present such a clear association, although that happens for moderate simplifications;a similar situation occurs with S1, but for the the 50% and 20% simplification levels, respectively.
Note that, for severe simplifications, for indices such as GCD and ANG there is also a clear method and rankassociation, but different from the association found for GD and COM2. The latter two quality indices seemto have a similar behavior, and are able to clearly discriminate between the three simplification methods (seeFig. 5); as said before, this association is also clearly shown in the right dendogram of Fig. 3.
A similar analysis can be done for the 50% simplification level, using the factorial planes depicted in Fig. 6.It is possible to verify, for example, clear associations between method and rank for the ND and COM2 indices,with OMNF associated with the first place, QS with second and OM with the third place. For indices such asGD and GCD there are clear but different method and rank associations. Note that the ND and COM2 qualityindices seem to have now a similar behavior, and are able to clearly discriminate between the three simplificationmethods; as said before, this association is also clearly shown in the right dendogram of Fig. 4.
The main conclusions that can already be mentioned are the following: GD is a quality index clearly able todiscriminate between the three simplification methods but for severe simplifications only, while ND plays the samerole but for moderate simplifications only; this is the behavior that had already been identified for those samequality indices when analyzing lung models;6 the composed quality index COM2, which was established basedon that previous study, is able to discriminate between the three simplification methods for both simplificationlevels, as was expected. Note that, since the behavior of the GD and ND quality indices is globally the same forthe lung models of the former study, and for the generic models of the current study, it seems that simplificationmethod and level are the determinant factors, not the type of models being simplified.
4. OBSERVER STUDY
The observer study was set up and carried out exactly as it had been done for the previous study using lung models(see Silva et al.10 for a thorough description of the objectives, context, framework, experimental methodology anddata analysis of that former study), which provided a suitable testbed to confirm that the developed experimentaldesign and protocol allowed the evaluation of user perceived model quality, as well as to establish the methodologyfor the statistical analysis of the collected data.
To allow an easy implementation of the experimental protocol, as well as easy storage and management of thecollected data, the same software application that had been developed for the former lung models study was also
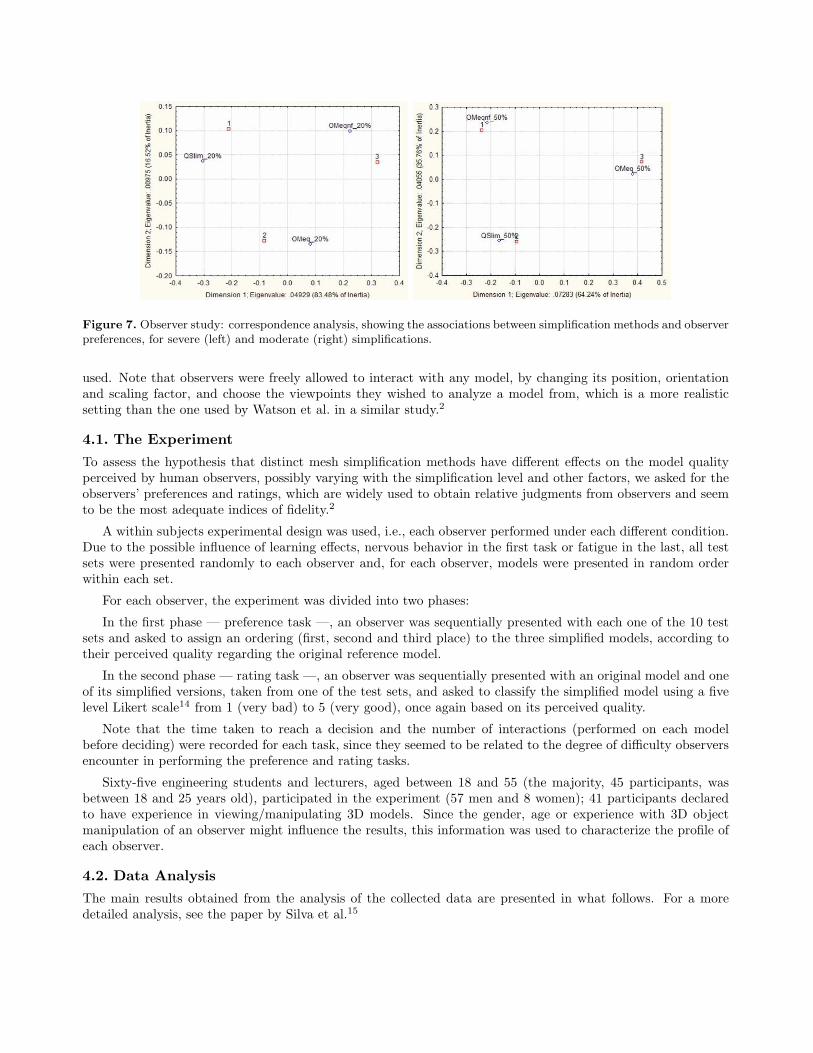
Figure 7. Observer study: correspondence analysis, showing the associations between simplification methods and observerpreferences, for severe (left) and moderate (right) simplifications.
used. Note that observers were freely allowed to interact with any model, by changing its position, orientationand scaling factor, and choose the viewpoints they wished to analyze a model from, which is a more realisticsetting than the one used by Watson et al. in a similar study.2
4.1. The Experiment
To assess the hypothesis that distinct mesh simplification methods have different effects on the model qualityperceived by human observers, possibly varying with the simplification level and other factors, we asked for theobservers’ preferences and ratings, which are widely used to obtain relative judgments from observers and seemto be the most adequate indices of fidelity.2
A within subjects experimental design was used, i.e., each observer performed under each different condition.Due to the possible influence of learning effects, nervous behavior in the first task or fatigue in the last, all testsets were presented randomly to each observer and, for each observer, models were presented in random orderwithin each set.
For each observer, the experiment was divided into two phases:
In the first phase — preference task —, an observer was sequentially presented with each one of the 10 testsets and asked to assign an ordering (first, second and third place) to the three simplified models, according totheir perceived quality regarding the original reference model.
In the second phase — rating task —, an observer was sequentially presented with an original model and oneof its simplified versions, taken from one of the test sets, and asked to classify the simplified model using a fivelevel Likert scale14 from 1 (very bad) to 5 (very good), once again based on its perceived quality.
Note that the time taken to reach a decision and the number of interactions (performed on each modelbefore deciding) were recorded for each task, since they seemed to be related to the degree of difficulty observersencounter in performing the preference and rating tasks.
Sixty-five engineering students and lecturers, aged between 18 and 55 (the majority, 45 participants, wasbetween 18 and 25 years old), participated in the experiment (57 men and 8 women); 41 participants declaredto have experience in viewing/manipulating 3D models. Since the gender, age or experience with 3D objectmanipulation of an observer might influence the results, this information was used to characterize the profile ofeach observer.
4.2. Data Analysis
The main results obtained from the analysis of the collected data are presented in what follows. For a moredetailed analysis, see the paper by Silva et al.15

An Exploratory Data Analysis16 (EDA) provided general information on the structural relations, showingthe amplitudes, asymmetries, localizations, outliers, etc. of the collected data. In addition, we used ANOVA totest for the equality of means, Contingency Tables to test the independence between variables, CorrespondenceAnalysis13 to reveal possible associations between variables, and Cluster Analysis13 to find out similarities amongvariables. All results were obtained using Statistica.17
Concerning the observer preferences, and for severely simplified models (20%), a tendency was found of theobservers to prefer the simplified models using the QSlim method (QS ), then the versions simplified by theOpenMesh method (OM ) and, in third place, the versions simplified using the OpenMesh method with theadditional normal flipping criterion (OMNF ). Contrarily, for moderately simplified models (50%), the tendencyfound was for observers to prefer first the models simplified by the OMNF method, followed by those simplifiedby QSlim, and the models simplified by the OM method coming in third place.
Contingency tables were used and independency hypothesis were tested to confirm the statistical significanceof those two tendencies: the independency between the simplification method and the observer preferences wasrejected for both simplification levels, which suggests that observers are indeed responsive to the simplificationmethod used, although they react differently for each simplification level. The results obtained by the contingencytables can be visualized using a Correspondence Analysis: Fig. 7 shows the factorial planes corresponding tothe contingency tables for both simplification levels. For the severe simplification level (20%), we can see thateach simplification method is clearly associated to a type of preference: first place for QS, second for OM andthird for OMNF. A different and even stronger association appears for moderately simplified (50%) models: theOMNF method is associated with the first place, QS with the second and OM with the third.
Concerning the observer ratings, a tendency was found of the observers to rate poorly all the severely simplifiedmodels (specially those simplified with the OMNF method), while assigning higher ratings to the moderatelysimplified models (all methods seem equally well rated, perhaps with a slight advantage of the OMNF method).Again, in order to confirm statistical significance, contingency tables were used and independency hypothesistested, confirming that observers are responsive to both simplification method and level.
The results obtained regarding observer preferences, consistently confirmed applying different statistical meth-ods, suggest that observers are indeed responsive to the simplification method used, although they react differ-ently to the chosen simplification level. Contrarily, results obtained for the rating task seem to imply thatobservers are more influenced by the simplification level than by the simplification method.
The global findings of this experiment confirm those previously obtained for the observer study using onlylung models: for each simplification level, each simplification method obtained similar preferences and ratings.Thus, the different nature of the models used in this later study did not seem to affect the results in a significantway. For a more detailed analysis and comparison of the collected data see the former paper by Silva et al.15
5. COMPARISON OF THE GLOBAL RESULTS
As the used quality indices provide information about differences between two meshes (a clue towards the qualityof the simplified models), we compared the results thus obtained with those provided by the observer study, andtried to identify the quality index which better estimates model quality, as it is perceived by users.
By comparing the factorial plane on the left of Fig. 7, showing the associations between simplification methodand observer preferences for the severe simplifications, with the factorial planes of Fig. 5 we find some similaritiesof association in all presented quality indices except for ANG and GCD. Note that the ND index exhibits aweaker association. On the other hand, by comparing the factorial plane on the right of Fig. 7 with those of Fig.6, obtained for moderate simplifications, some similar associations are observed for the ND, GCD and COM2indices.
These comparison results suggest that, for example, the GD index might be a good estimator of user perceivedquality for severe simplifications, but failing for moderate simplifications where the ND or GCD indices seemmore appropriate. These results are similar to those obtained in the previous study for lung models. The COM2index seems to be a good estimator of user perceived quality for both simplification levels ranking all methodsthe same way users did. It was an expected result since it blends both GD and ND indices, assigning a largerweight to ND when models are moderately simplified and to GD when in the presence of severe simplifications.

Figure 8. Dendograms (left, severe simplification; right, moderate simplification) showing the association between qualityresults obtained using the observer study and quality indices.
To confirm these findings Cluster Analysis was once again used. The results obtained in the observer studywere treated like a quality index and dendograms were drawn, depicting the associations between all indices.For the severe simplifications (Fig. 8, on the left) the observer (OBS) results appear associated with COM2 andGD; for the moderate simplifications (Fig. 8, on the right) the observer results appear associated with COM2and ND.
6. CONCLUSIONS
We have compared three mesh simplification methods at two simplification levels. This comparison was performedthrough two different approaches: an observer study and objective quality indices. While the former approachhas the advantage of being capable of producing a “golden standard”, it is very expensive in terms of severalresources. That is why it would be very interesting to identify quality indices capable of reasonably estimating theobservers’ behavior. Yet, quality indices usually don’t correlate well with the results obtained through observerstudies.
We selected several quality indices in order to assess if any of them might be such a good estimator ofthe observers’ behavior, at least in some specific circumstances. We confirmed a result previously presented inSantos et al.6 suggesting the Geometric Deviation as a good estimator for severe simplifications and the NormalDeviation as a good estimator for moderate simplifications. This fact had already been taken into account whendeveloping the Composed Deviation quality index (COM2), which was the best estimator for both simplificationlevels.
Note that the smoothness indices, computed using several neighborhoods, did not provide useful results: onlyS1 seemed to estimate user performance for severe simplifications. Among the curvature deviations, the GaussianCurvature Deviation seemed a good estimator of user performance for moderate simplifications. Angle Analysisdid not provide any significant results.
Clearly these results do require further confirmation. The results provided by the Composed Deviationwere obtained for two simplification levels deemed representative, but how will it behave for a wider range ofsimplification levels? To answer this question we intend to perform further work in order to understand how theobserver perceived quality varies across simplification levels and which adjustments are needed in the ComposedDeviation index(e.g., the blending factor) to encompass such changes.
ACKNOWLEDGMENTS
The authors are grateful to all participants in the observer study.
The first author would like to thank research unit 127/94 IEETA of the University of Aveiro for the grantthat supports his work.

REFERENCES1. D. Luebke, “A developer’s survey of polygonal simplification algorithms,” IEEE Computer Graphics and
Applications 21(3), pp. 24–35, 2001.2. B. Watson, A. Friedman, and A. McGaffey, “Measuring and predicting visual fidelity,” in Proc. SIGGRAPH
2001, pp. 213–220, 2001.3. P. Cignoni, C. Rocchini, and R. Scopigno, “Metro: measuring error on simplified surfaces,” Computer
Graphics Forum 17(2), pp. 167–174, 1998.4. M. Roy, S. Foufou, and F. Truchetet, “Mesh comparison using attribute deviation metric,” International
Journal of Image and Graphics 4(1), pp. 1–14, 2004.5. S. Silva, J. Madeira, and B. S. Santos, “Polymeco — a polygonal mesh comparison tool,” in Proc. 9th
International Conference on Information Visualization IV05, pp. 842–847, IEEE CS Press, 2005.6. B. S. Santos, S. Silva, C. Ferreira, and J. Madeira, “Comparison of methods for the simplification of mesh
models of the lungs using quality indices and an observer study,” in 3rd International Conference on MedicalInformation Visualization — Biomedical Visualization (MediVis’05), pp. 15–21, IEEE CS Press, 2005.
7. M. Botsch, S. Steinberg, S. Bischoff, and L. Kobbelt, “Openmesh — a generic and efficient polygon meshdata structure,” in 1st OpenSG Symp., (Darmstadt, Germany), 2002.
8. M. Garland and P. Heckbert, “Surface simplification using quadric error metrics,” in Proc. SIGGRAPH1997, pp. 209–216, 1997.
9. C. Johnson, R. Moorhead, T. Munzner, H. Pfister, P. Rheingans, and T. S. Yoo, NIH / NSF VisualizationResearch Challenges Report, IEEE Press, 2006.
10. S. Silva, B. S. Santos, J. Madeira, and C. Ferreira, “Comparing three methods for simplifying mesh modelsof the lungs: an observer test to assess perceived quality,” in Proc. SPIE 2005 vol. 5749, Image Perception,Observer Performance, and Technology Assessment, pp. 99–110, 2005.
11. M. Meyers, M. Desbrun, P. Schroder, and A. H. Barr, “Discrete differential-geometry operators for triangu-lated 2-manifolds,” Visualization and Mathematics 3, pp. 34–57, 2002.
12. P. P. Pebay and T. J. Baker, “Analysis of triangle quality measures,” Mathematics of Computation 72(244),pp. 1817–1839, 2003.
13. D. G. Johnson, Applied Multivariate Methods for Data Analysis, Duxbury, 1998.14. V. Barnett, Sample Survey Principles and Methods, Arnold Hodder, 3rd ed., 2003.15. S. Silva, C. Ferreira, J. Madeira, and B. S. Santos, “Perceived quality of simplified polygonal meshes:
Evaluation using observer studies,” in Proc. Ibero-American Symposium in Computer Graphics SIACG06,pp. 169–178, Eurographics, (Santiago de Compostela, Spain), 2006.
16. D. Hoaglin, F. Mosteller, and J. Tukey, Understanding Robust and Exploratory Data Analysis, John Wiley& Sons, 1983.
17. “Statistica 6.0,” http://www.statsoft.com , (online Mar/2006).