Comparison of Insulated with Bare Au Bonding Wire: HAZ Length, HAZ Breaking Force, and FAB...
9
Comparison of Insulated with Bare Au Bonding Wire: HAZ Length, HAZ Breaking Force, and FAB Deformability WAN HO SONG, 1 CHUNJIN HANG, 1,2 ANDREW PEQUEGNAT, 1 MICHAEL MAYER, 1,4 NORMAN Y. ZHOU, 1 YOUNG-KYU SONG, 3 and JOHN PERSIC 3 1.—Microjoining Laboratory, Centre for Advanced Materials Joining, Department of Mechanical and Mechatronics Engineering, University of Waterloo, Waterloo, ON N2L 3G1, Canada. 2.—State Key Laboratory of Advanced Welding Production Technology, Harbin Institute of Technology, Harbin 150001, China. 3.—Microbonds Inc., Markham, ON L3R 3B3, Canada. 4.—e-mail: [email protected] Two types (A and B) of 25-lm-diameter bare Au bonding wire and their corresponding insulated wire were used to produce 50-lm-diameter free-air balls (FABs) for heat-affected zone (HAZ) and FAB deformability analyses. Insulated wires showed no significant difference in HAZ length compared with bare wire for type A, while their difference lay in the range of 4% to 12% longer for type B. The HAZ breaking load of bare wire is 0.3% to 1.8% smaller than that of insulated wire for type A and not significantly different for type B even though the HAZ length is shown to be larger for insulated wire B. The deformability of the FAB from insulated wires is 1.0% to 2.1% smaller than that from bare wires for type A and 2.1% to 3.4% larger for type B. Key words: Wire bonding, insulated wire, heat-affected zone, breaking load, deformability INTRODUCTION The microelectronics industry has experienced a tremendous technological advance in the last half century. The ever-increasing complexity and ever- decreasing size of the silicon chip push not only chip fabrication processes to the limit of current tech- nology, but also the chip-to-package interconnection technology. The most widely used microelectronic interconnection technique is thermosonic wire bonding, in which thin gold or aluminum wires are welded to the deviceÕs pad and the package lead using ultrasonic power. 1 To give more functionality to a single package, stacking silicon dice has emerged as a new technology where long loops of thinner wire are needed. However, these require- ments have inherent problems such as sweeping wire during the package molding, resulting in electrical shorts between wires. To overcome these problems, electrically insulated bonding wire such as X-Wireä 2 from, e.g., Microbonds Inc. (Markham, Canada), was introduced as a possible solution, and is gaining momentum for the implementation in the standard wire-bonding process. 3 The insulation layer of such wires is transparent, submicron thick, and organic. It is produced using a proprietary coating process. The insulation has a breakdown voltage exceeding 25 V. The mechanical compliance of the insulation is large enough for all typical wire-bonding applications, as no cracks occur if mechanically bent to a radius of smaller than 25 lm with respect to the main wire direction. Insulated wire can improve the flexibility of the wire bond design because wires can touch each other without impairing the device functionality. Thus, long wire loops, sagging wires, crossing wires, lower loops, wire sway, and wire sweep are no longer a consideration during production. 4 As the insulation on the free-air ball (FAB) is readily removed by the electrical flame-off (EFO), the ball bonding process is not hindered by insulation. (Received July 2, 2008; accepted March 6, 2009; published online April 3, 2009) Journal of ELECTRONIC MATERIALS, Vol. 38, No. 6, 2009 Regular Issue Paper DOI: 10.1007/s11664-009-0762-y Ó 2009 TMS 834
Transcript of Comparison of Insulated with Bare Au Bonding Wire: HAZ Length, HAZ Breaking Force, and FAB...
Comparison of Insulated with Bare Au Bonding Wire: HAZLength, HAZ Breaking Force, and FAB Deformability
WAN HO SONG,1 CHUNJIN HANG,1,2 ANDREW PEQUEGNAT,1
MICHAEL MAYER,1,4 NORMAN Y. ZHOU,1 YOUNG-KYU SONG,3
and JOHN PERSIC3
1.—Microjoining Laboratory, Centre for Advanced Materials Joining, Department of Mechanicaland Mechatronics Engineering, University of Waterloo, Waterloo, ON N2L 3G1, Canada.2.—State Key Laboratory of Advanced Welding Production Technology, Harbin Institute ofTechnology, Harbin 150001, China. 3.—Microbonds Inc., Markham, ON L3R 3B3, Canada.4.—e-mail: [email protected]
Two types (A and B) of 25-lm-diameter bare Au bonding wire and theircorresponding insulated wire were used to produce 50-lm-diameter free-airballs (FABs) for heat-affected zone (HAZ) and FAB deformability analyses.Insulated wires showed no significant difference in HAZ length compared withbare wire for type A, while their difference lay in the range of 4% to 12%longer for type B. The HAZ breaking load of bare wire is 0.3% to 1.8% smallerthan that of insulated wire for type A and not significantly different for type Beven though the HAZ length is shown to be larger for insulated wire B. Thedeformability of the FAB from insulated wires is 1.0% to 2.1% smaller thanthat from bare wires for type A and 2.1% to 3.4% larger for type B.
Key words: Wire bonding, insulated wire, heat-affected zone, breaking load,deformability
INTRODUCTION
The microelectronics industry has experienced atremendous technological advance in the last halfcentury. The ever-increasing complexity and ever-decreasing size of the silicon chip push not only chipfabrication processes to the limit of current tech-nology, but also the chip-to-package interconnectiontechnology. The most widely used microelectronicinterconnection technique is thermosonic wirebonding, in which thin gold or aluminum wires arewelded to the device�s pad and the package leadusing ultrasonic power.1 To give more functionalityto a single package, stacking silicon dice hasemerged as a new technology where long loops ofthinner wire are needed. However, these require-ments have inherent problems such as sweepingwire during the package molding, resulting inelectrical shorts between wires. To overcome these
problems, electrically insulated bonding wire suchas X-Wire�2 from, e.g., Microbonds Inc. (Markham,Canada), was introduced as a possible solution, andis gaining momentum for the implementation in thestandard wire-bonding process.3 The insulationlayer of such wires is transparent, submicron thick,and organic. It is produced using a proprietarycoating process. The insulation has a breakdownvoltage exceeding 25 V. The mechanical complianceof the insulation is large enough for all typicalwire-bonding applications, as no cracks occur ifmechanically bent to a radius of smaller than 25 lmwith respect to the main wire direction.
Insulated wire can improve the flexibility of thewire bond design because wires can touch eachother without impairing the device functionality.Thus, long wire loops, sagging wires, crossing wires,lower loops, wire sway, and wire sweep are nolonger a consideration during production.4 As theinsulation on the free-air ball (FAB) is readilyremoved by the electrical flame-off (EFO), the ballbonding process is not hindered by insulation.(Received July 2, 2008; accepted March 6, 2009;
published online April 3, 2009)
Journal of ELECTRONIC MATERIALS, Vol. 38, No. 6, 2009 Regular Issue Paper
DOI: 10.1007/s11664-009-0762-y� 2009 TMS
834

Proper parameters result in FAB properties compa-rable to those obtained with bare Au bonding wire andmake insulated wire a very promising technology.
One of the key parameters to be controlled duringthe wire-bonding process is the length of the heat-affected zone (HAZ).5 The HAZ is where recrys-tallization and grain growth occur during theformation of the FAB. The HAZ is the weakest partof the wire-bonding system.6 By keeping the HAZshorter, the loop height of the wire can be loweredwithout compromising the mechanical strength ofthe bonded ball neck. Low looping is especiallyimportant for thin and flat packages. Figure 1adepicts the HAZ of a bonding wire.
The broken-neck problem is a common failure inwire-bonding process.7 The large grain size (GS) ofthe HAZ significantly lowers yield stress, deformingat a lower force than the thermally stable basewire.7 During the looping process, the HAZ experi-ences tensile, compressive, bending, and torsionstresses that further decrease the mechanicalstrength of the ball neck. Thus, thermomechanicalstresses could cause the wire to break at the ballneck. There is continuing research by the wiremanufacturers on how to strengthen this region toimprove looping and to increase its resistance tofatigue and wire sweep.1
In the first stage of a typical thermosonic ballbonding process, the FAB is often deformed by animpact force prior to the application of ultrasonicpower. In this stage, the bonding pad and thestructure under the pad can be damaged due toseveral different factors such as FAB hardness,bond pad thickness, and high impact force. A softand/or highly deformable FAB is often required tominimize the damage.
The quantities HAZ length, HAZ breaking force,and FAB deformability might depend on the ther-mal properties of the wire. The thermal propertiesof insulated wire might be different from those ofbare bonding wire due to the coating layer. Hence, acomparative study of these quantities was carriedout to assess the suitability of replacing bare wirewith insulated wire. There are two different ways tocompare the HAZs of bare and insulated wire. Thefirst uses identical EFO parameters, resulting indifferent FAB sizes between bare wire and insulatedwire. The second uses adjusted EFO parameters,resulting in the same FAB sizes for both, the bareand insulated wire. The second method is assumedto be the more relevant comparison and is thereforeused in this study.
In this work, the thermally stable zone (TSZ) andHAZ microstructures of bare and insulated wiresare exposed by milling and polishing with focusedion beam (FIB). The HAZ length is calculated from afitting equation of GS distribution while takinginto account a visual estimation of the boundarybetween the HAZ and TSZ. The fracture load of theHAZ and the deformability of the FAB on the bareand insulated wires are measured and comparedwith each other. An in situ online method is used forthe measurements similar to those reported inRefs. 8 and 9. The fracture load of the HAZ iscompared with that of the TSZ measured with astandard tension test method.
LENGTH OF THE HAZ
The length of the HAZ depends on the heat energyprovided by EFO and the heat transfer rate of thewire. A high heat energy and/or low heat transferrate increases the length of the HAZ. The length ofthe HAZ can be determined by identifying thetransition of GS along the wire from the FAB neck.
A K&S 8028 wire bonder is used to produce FABswith different EFO parameters. The FAB and itstail is bonded-off on PLCC 44 leadframes with an8-lm-thick Ag metallization. The temperature ofthe leadframe was not higher than 150�C to mini-mize annealing of the bonded-off wire pieces. Twopairs of 25-lm-diameter Au bonding wires of 99.99%purity are studied. Table I summarizes the desig-nation used for each of the wires.
The EFO current was fixed to 25 mA for all wiretypes. The EFO time was set to 1.06 ms, 0.98 ms,1.06 ms, and 0.98 ms for wire types AB, AX, BB,and BX, respectively, to produce 50-lm-diameter
glue
FAB sample
Adhesive
x y
z
tape
FAB Thermally stable zone (Base wire)
25 µm
HAZ
(a)
(b)
Fig. 1. (a) Schematic illustration of grain structure for bonding wireafter ball formation, showing HAZ (cross section). (b) FAB samplesare fixed with glue on the diepad surface. Wire diameters are 25 lm.
Table I. Designation of Wire Samples
Wire A Wire B
Bare Insulated Bare Insulated
Designation AB AX BB BX
Comparison of Insulated with Bare Au Bonding Wire: HAZ Length,HAZ Breaking Force, and FAB Deformability
835

FABs for all wire types. A set of five FAB samplesfor each wire was produced to measure the length ofthe HAZ. After bond-off, the FAB samples werepicked up using tweezers and placed horizontally ona new diepad. Liquid glue and double-sided adhe-sive tape were used to firmly fix the sample onto thediepad as shown in Fig. 1b.
To reveal the microstructures of the bondingwires, samples were milled and polished using aFIB system (Leo 1540 FIB/SEM) using a millingscheme as shown in Fig. 2. Milling is done alongthe wire starting from the FAB neck and contin-uing for 400 lm away from the FAB with a depthof approximately 1.2 lm from the wire surface.This partial milling process saves time and reducesthe cost of FIB milling and polishing processcompared with a central cut along the wire. Awindow approximately 10 lm wide is now availablefor microstructural analysis. The revealed micro-structure is not expected to differ from that of thecore of the wire because the dominant mechanismof heat transfer is conduction along the wire,minimizing the edge effect on the temperaturedistribution due to the convection. Prior to FIBmilling and polishing, the entire substrate andbonded wires are coated with Pt by cold cathodesputtering. The Pt makes the insulated wiresamples conductive.
METHOD OF GRAIN SIZE DETERMINATION
The GS is determined using a basic interceptmethod similar to the Heyn intercept method.10
SEM images allow to measure the GSs usingintercepts at intervals of 20 lm starting as close tothe FAB as possible (Fig. 3) using image-processingsoftware to enhance the contrast of the image. Theintercept lengths range from 7 lm to 10 lm. Thenumber of grain boundaries on the intercept line iscounted. Intercepts are taken from a total of four tofive samples. The average GS perpendicular to thewire direction is estimated by dividing the interceptlengths by the number of grain boundaries plus one.
STRENGTH OF THE HAZ AND FABDEFORMABILITY
The bonding cycle of the online measurements forthe HAZ breaking force and the deformation of FABis illustrated in Fig. 4a–e. The strength of the HAZcan be defined as the breaking load of the ball neckat a specific loading speed. The FAB deformabilitycan be defined as the percentage of the FAB height,HFAB, reduction under a defined force of 600 mN toa deformed ball height, BH, and is calculated by
Deformability ¼ HFAB � BH
HFAB� 100; (1)
where HFAB and BH are defined in Fig. 4b and d,respectively. This definition differs from that usedin previous work9 where deformability was definedas BH after a certain force applied and accountingfor FAB size sample-to-sample variability. The newdefinition addresses FAB size variability and ismore intuitive than the previous definition, wherea larger number meant a less deformable FAB.
FAB HAZ Thermally Stable Zone (Base wire)
400µm
~ 1.
2µm
.
z
y
removed portionremoved portion
zx
y
(b)(a)
Fig. 2. Illustration of wire end. Material inside dashed region removed using FIB: (a) along the wire view, and (b) cross-sectional view.
intercept lines
10 µm
Fig. 3. Intercept method applied for the measurement of GS along the bonding wire.
W.H. Song, Hang, Pequegnat, Mayer, Zhou, Y.-K. Song, and Persic836

This reduces the standard deviation of the defor-mability measurement by up to 26%.
The strength of the HAZ and deformability of theFAB for the bare wire and its corresponding insu-lated wire are investigated using an ESEC WB3100wire bonder. The bonder is capable of recording thein situ force and z-displacement signals duringbonding. For a detailed description of the onlinemethod, see Ref. 9. Figure 5 shows a schematicdiagram of parts of the bondhead structure. The zencoder provides the vertical position of the capil-lary which is used to determine HFAB and BH.A low impact force (30 mN) is used to avoid defor-mation of the FAB during the HFAB measurement.The HFAB and BH measurements are carried outwithout applying ultrasound.
Variations of the FAB diameters influence the BHmeasurement. To compensate for this variance, acorrection factor is determined. Different HFAB andBH are obtained using different EFO currents. Thelinear relationship between DHFAB and DBH isobvious from the data shown in Fig. 6. The cor-rected ball height, BHcorrected, can be calculatedusing
DHFAB ¼ HFABjtarget�HFABjmeasured; (2)
DBH ¼ k� DHFAB; (3)
BHcorrected ¼ BHmeasured þ DBH: (4)
A value of k = 1.073 was found from the fit in Fig. 6.The proximity sensor measures the distancebetween the wire clamp and the horn. This changedue to the deflection of the clamp can be translatedinto a force after calibration.
Various combinations of EFO current (40 mA,60 mA, 80 mA, 100 mA, and 120 mA) and EFO time(0.2 ms, 0.4 ms, 0.6 ms, 0.8 ms, and 1.0 ms) wereused to determine graphically the relationship
HFAB
BH
2 mm/min
TL
Reference wedge bond Ball bonding position(no bonding energy)
Looping to test wedge bond position
gnikaerb ZAH (e)noitisop dnob egdew tset ta dnob llaB (d)
(a) (b) (c)
Fig. 4. Bonding cycle for online measurement of HAZ breaking force and FAB deformability.
horn
chip
encoder
wire wire
capillary
Z
proximity sensor clamp
rockerarm
position
Fig. 5. Schematic drawing of z-position measurement structure andthe proximity force sensor location.9 Drawing not to scale.
25 30 35 40 45 505
10
15
20
25
30
35
HFAB [µm]
BH
[µm
]
BH = 1.073 HFAB – 20.81R2 = 0.9998
I = 45 mA
I = 50 mA
I = 75 mA
Fig. 6. Relationship between BH and HFAB of wire AB afterdeforming FAB with 0.6 N. EFO currents used are defined in thegraph.
Comparison of Insulated with Bare Au Bonding Wire: HAZ Length,HAZ Breaking Force, and FAB Deformability
837
between EFO parameters and FAB size. Then, a setof EFO parameters (Table II) was selected to pro-duce the same FAB size (50 lm) in both bare andinsulated wires. The minimum EFO current settingavailable from the wire bonder used for HAZbreaking loads was 40 mA. Lower EFO current issuggested for insulated wire to minimize the amountof insulation residue on the FAB. Such residue isassumed negligible for relative comparisons in HAZbreaking load between bare wire and insulated wire.
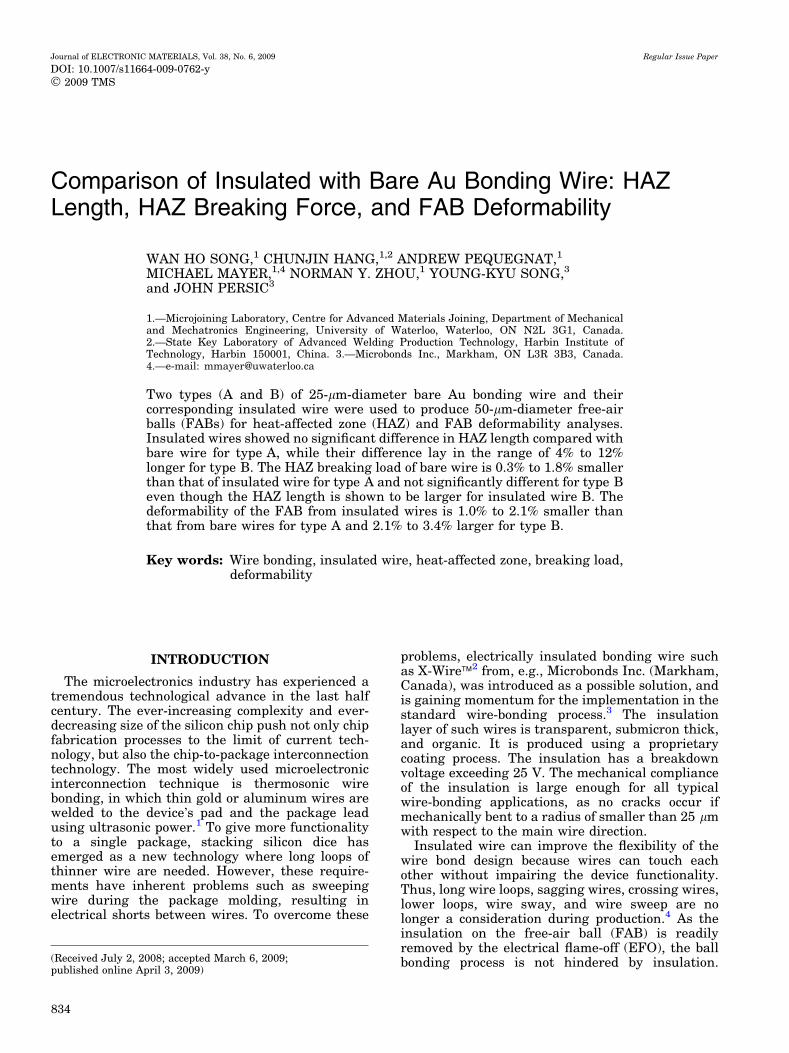
As the tail length (TL) can vary after each breakingforce measurement of HAZs produced with varyingparameters, the reference bonding group is intro-duced to produce a more constant TL (Fig. 7) astypically encountered in a real production process.The test group tail with potentially fluctuatinglength is used for the reference group FAB formation.After the formation of the reference wedge bond(Fig. 4a), the constant TL is generated for the mea-surement of the HAZ strength at the test group ballbond position illustrated in Fig. 4e. The tear speedfor the HAZ breaking is 2 mm/min, a value chosenlow enough for the data-acquisition system to time-resolve the breaking force peak. The tension acts on awire piece about 15 mm long. The bonding diagram isshown in Fig. 7. The wire samples are bonded withthe parameters summarized in Table III.
RESULTS AND EVALUATION
Length of HAZ
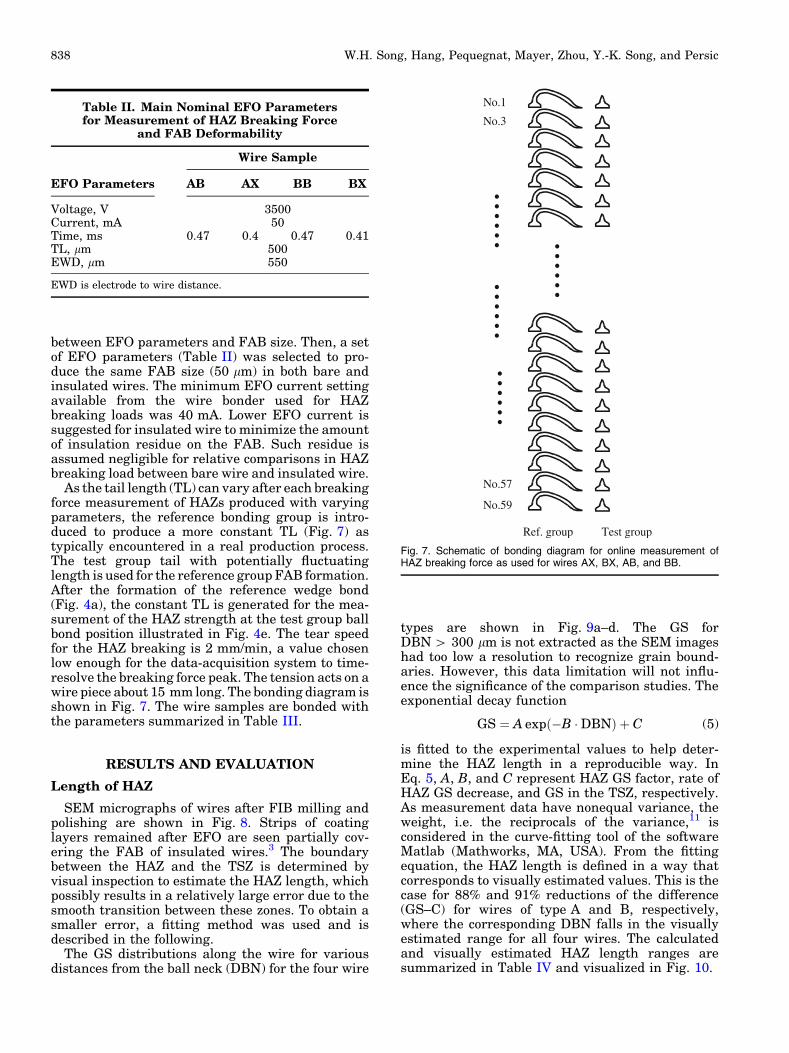
SEM micrographs of wires after FIB milling andpolishing are shown in Fig. 8. Strips of coatinglayers remained after EFO are seen partially cov-ering the FAB of insulated wires.3 The boundarybetween the HAZ and the TSZ is determined byvisual inspection to estimate the HAZ length, whichpossibly results in a relatively large error due to thesmooth transition between these zones. To obtain asmaller error, a fitting method was used and isdescribed in the following.
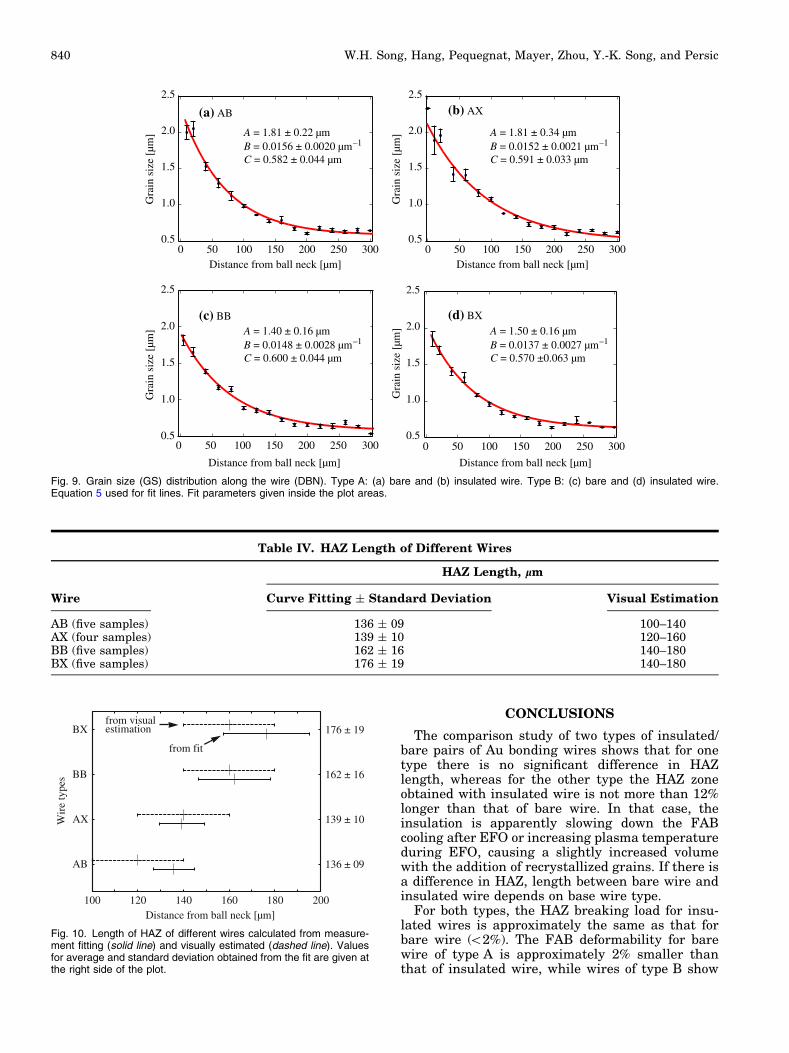
The GS distributions along the wire for variousdistances from the ball neck (DBN) for the four wire
types are shown in Fig. 9a–d. The GS forDBN > 300 lm is not extracted as the SEM imageshad too low a resolution to recognize grain bound-aries. However, this data limitation will not influ-ence the significance of the comparison studies. Theexponential decay function
GS ¼ A expð�B �DBNÞ þ C (5)
is fitted to the experimental values to help deter-mine the HAZ length in a reproducible way. InEq. 5, A, B, and C represent HAZ GS factor, rate ofHAZ GS decrease, and GS in the TSZ, respectively.As measurement data have nonequal variance, theweight, i.e. the reciprocals of the variance,11 isconsidered in the curve-fitting tool of the softwareMatlab (Mathworks, MA, USA). From the fittingequation, the HAZ length is defined in a way thatcorresponds to visually estimated values. This is thecase for 88% and 91% reductions of the difference(GS–C) for wires of type A and B, respectively,where the corresponding DBN falls in the visuallyestimated range for all four wires. The calculatedand visually estimated HAZ length ranges aresummarized in Table IV and visualized in Fig. 10.
Table II. Main Nominal EFO Parametersfor Measurement of HAZ Breaking Force
and FAB Deformability
EFO Parameters
Wire Sample
AB AX BB BX
Voltage, V 3500Current, mA 50Time, ms 0.47 0.4 0.47 0.41TL, lm 500EWD, lm 550
EWD is electrode to wire distance.
No.1
No.3
No.57
No.59...
......
...Ref. group Test group
.........
...
Fig. 7. Schematic of bonding diagram for online measurement ofHAZ breaking force as used for wires AX, BX, AB, and BB.
W.H. Song, Hang, Pequegnat, Mayer, Zhou, Y.-K. Song, and Persic838
There is no significant difference in HAZ lengthbetween AB and AX. However, the HAZ length ofBB is 4.4% to 11.5% (95% confidence interval, usedfor all following difference ranges) smaller than thatof BX.
Strength of HAZ and FAB Deformability
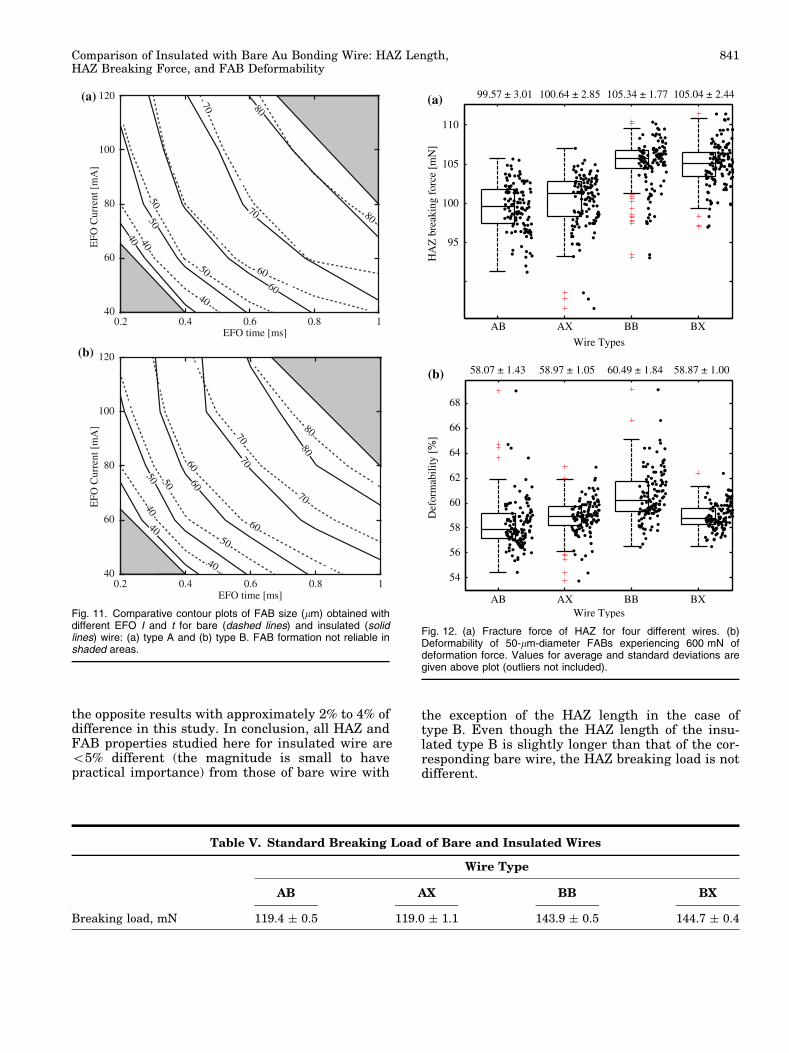
Measurements of diameters of FABs obtainedwith different combination of EFO parameters areshown in Fig. 11a and b. The same energy inputduring EFO produces a larger FAB size for insu-lated wire than for bare wire. A possible reason forthis might be a hotter EFO plasma caused by thepresence of the insulation material.
The HAZ breaking load for the various wires isshown in Fig. 12a. For comparison, the averagestandard breaking loads (SBLs) with standarddeviations as measured by the standard tension testare given in Table V.
Apparently, the SBL of wires of type B is about20% stronger than those of type A, a difference thatreduces to 5% in the case of HAZ breaking load.
The HAZ breaking loads are 16% and 27% smallerthan the SBLs for a wire from type A and B,respectively.
The average HAZ breaking loads of bare wire is0.3% to 1.8% smaller than that of insulated wire fortype A; however, there is no significant differencefor wires of type B. The HAZ breaking loads arelower than the wire breaking loads, as expected dueto the increased GS of the HAZ.12 The standarddeviations are <1% and approximately 3% for SBLand HAZ breaking load, respectively. This indicatesthat the EFO process induces additional variationinto both the insulated and the bare material HAZstrength.
The deformabilities of the FABs are shown inFig. 12b. The deformability of the FAB of AB is 1.0%to 2.1% smaller than that of AX. However, thedeformability of the FAB of BB is 2.1% to 3.4% largerthan that of BX. The FAB deformabilities of the barewire from type B is 3.3% to 4.7% higher than that ofbare wire from type A. However, the FAB deform-abilities of the insulated wires from both types showno significant difference.
100µm
AB
AX
BB
BX
BB
Fig. 8. SEM of wire samples after FIB milling and polishing. Insulated wire samples have strips of insulation layers on their FAB.
Table III. Main Nominal Bonding Parameters for the Measurement of HAZ Breaking Forceand FAB Deformability
Reference Group Test Group
Ball Bond Wedge Bond Ball Bond Wedge Bond
Impact force, mN 500 500 30 500Bonding force, mN 500 400 10 500US power, % 80 60 0 80Bonding time, ms 20 30 20 20Bonding temperature, �C 180
Comparison of Insulated with Bare Au Bonding Wire: HAZ Length,HAZ Breaking Force, and FAB Deformability
839
CONCLUSIONS
The comparison study of two types of insulated/bare pairs of Au bonding wires shows that for onetype there is no significant difference in HAZlength, whereas for the other type the HAZ zoneobtained with insulated wire is not more than 12%longer than that of bare wire. In that case, theinsulation is apparently slowing down the FABcooling after EFO or increasing plasma temperatureduring EFO, causing a slightly increased volumewith the addition of recrystallized grains. If there isa difference in HAZ, length between bare wire andinsulated wire depends on base wire type.
For both types, the HAZ breaking load for insu-lated wires is approximately the same as that forbare wire (<2%). The FAB deformability for barewire of type A is approximately 2% smaller thanthat of insulated wire, while wires of type B show
Table IV. HAZ Length of Different Wires
Wire
HAZ Length, lm
Curve Fitting ± Standard Deviation Visual Estimation
AB (five samples) 136 ± 09 100–140AX (four samples) 139 ± 10 120–160BB (five samples) 162 ± 16 140–180BX (five samples) 176 ± 19 140–180
0 50 100 150 200 250 3000.5
1.0
1.5
2.0
2.5
Distance from ball neck [µm]
Gra
in s
ize
[µm
]
0 50 100 150 200 250 3000.5
1.0
1.5
2.0
2.5
0 50 100 150 200 250 3000.5
1.0
1.5
2.0
2.5
(b) AX(a) AB
(c) BB (d) BX
Distance from ball neck [µm]
Gra
in s
ize
[µm
]
Distance from ball neck [µm]
Gra
in s
ize
[µm
]
0 50 100 150 200 250 3000.5
1.0
1.5
2.0
2.5
Distance from ball neck [µm]
Gra
in s
ize
[µm
] A = 1.81 ± 0.22 µmB = 0.0156 ± 0.0020 µm–1
C = 0.582 ± 0.044 µm
A = 1.81 ± 0.34 µmB = 0.0152 ± 0.0021 µm–1
C = 0.591 ± 0.033 µm
A = 1.40 ± 0.16 µmB = 0.0148 ± 0.0028 µm–1
C = 0.600 ± 0.044 µm
A = 1.50 ± 0.16 µmB = 0.0137 ± 0.0027 µm–1
C = 0.570 ±0.063 µm
Fig. 9. Grain size (GS) distribution along the wire (DBN). Type A: (a) bare and (b) insulated wire. Type B: (c) bare and (d) insulated wire.Equation 5 used for fit lines. Fit parameters given inside the plot areas.
136 ± 09
139 ± 10
162 ± 16
176 ± 19
from fit
from visualestimation
100 120 140 160 180 200Distance from ball neck [µm]
BX
BB
AX
AB
Wir
e ty
pes
Fig. 10. Length of HAZ of different wires calculated from measure-ment fitting (solid line) and visually estimated (dashed line). Valuesfor average and standard deviation obtained from the fit are given atthe right side of the plot.
W.H. Song, Hang, Pequegnat, Mayer, Zhou, Y.-K. Song, and Persic840
the opposite results with approximately 2% to 4% ofdifference in this study. In conclusion, all HAZ andFAB properties studied here for insulated wire are<5% different (the magnitude is small to havepractical importance) from those of bare wire with
the exception of the HAZ length in the case oftype B. Even though the HAZ length of the insu-lated type B is slightly longer than that of the cor-responding bare wire, the HAZ breaking load is notdifferent.
70
60
50
40
80
0.2 0.4 0.6 0.8 140
60
80
100
120
EFO time [ms]
EFO
Cur
rent
[m
A]
(a)
0.2 0.4 0.6 0.8 140
60
80
100
120
EFO time [ms]
EFO
Cur
rent
[m
A]
(b)
80
70
60
50
40
70
60
80
50
50
40
40
8070
70
60
60
50
50
40
40
Fig. 11. Comparative contour plots of FAB size (lm) obtained withdifferent EFO I and t for bare (dashed lines) and insulated (solidlines) wire: (a) type A and (b) type B. FAB formation not reliable inshaded areas.
99.57 ± 3.01 100.64 ± 2.85 105.34 ± 1.77 105.04 ± 2.44
58.97 ± 1.0558.07 ± 1.43 60.49 ± 1.84 58.87 ± 1.00
(a)
(b)
110
105
100
95
HA
Z b
reak
ing
forc
e [m
N]
AB AX BB BX
Wire Types
AB AX BB BXWire Types
Def
orm
abili
ty [
%]
68
66
64
62
60
58
56
54
Fig. 12. (a) Fracture force of HAZ for four different wires. (b)Deformability of 50-lm-diameter FABs experiencing 600 mN ofdeformation force. Values for average and standard deviations aregiven above plot (outliers not included).
Table V. Standard Breaking Load of Bare and Insulated Wires
Wire Type
AB AX BB BX
Breaking load, mN 119.4 ± 0.5 119.0 ± 1.1 143.9 ± 0.5 144.7 ± 0.4
Comparison of Insulated with Bare Au Bonding Wire: HAZ Length,HAZ Breaking Force, and FAB Deformability
841
ACKNOWLEDGEMENTS
This work is supported by Microbonds Inc.(Markham, Canada), NSERC, AuTEK, and OCE (allfrom Canada).
REFERENCES
1. G. Harman, Wire Bonding in Microelectronics: Materials,Processes, Reliability, and Yield, 2nd ed. (New York:McGraw-Hill, 1997).
2. R. Lyn, J. Persic, and Y.K. Song, 39th Intl. Symp. Micro-electron. Proc. (IMAPS) (2006).
3. Semiconductor Industry Association. International Tech-nology Roadmap for Semiconductors (ITRS), 2007.http://www.itrs.net/Links/2007ITRS/Home2007.htm.
4. J. Lee, M. Mayer, Y. Zhou, and J. Persic, IEEE/CPMT Elec.Pack. Tech. Conf. Proc. (2007), p. 725.
5. S.J. Hong, J.S. Cho, J.T. Moon, and J. Lee, Adv. Elec. Mater.Pack. Proc. (2001), p. 55.
6. Y. Ohno, Y. Ohzeki, T. Aso, and O. Kitamura, Elec. Comp.Tech. Conf. Proc. (1992), p. 899.
7. L. Hao, S.H. Ong, and L.C. Tang, IEEE/CPMT Elec. Pack.Tech. Conf. Proc. (1998), p. 313.
8. J. Lee, M. Mayer, Y. Zhou, and S.J. Hong, Microelectron.J. 38, 842 (2007). doi:10.1016/j.mejo.2007.07.095.
9. C. Hang, I. Lum, J. Lee, M. Mayer, C. Wang, Y. Zhou, S.J.Hong, and S.M. Lee, Microelectron. Eng. 85, 1795 (2008),doi:10.1016/j.mee.2008.05.008.
10. G.F. Vander Voort, Metallography: Principles and Practice(New York: McGraw-Hill, 1984).
11. G.E.P. Box, W.G. Hunter, and J.S. Hunter, Statistics forExperimenters: An Introduction to Design, Data Analysisand Model Building (New York: Wiley, 1978).
12. J. Schiøtz and K.W. Jacobsen, Science 301, 1357 (2003).doi:10.1126/science.1086636.
W.H. Song, Hang, Pequegnat, Mayer, Zhou, Y.-K. Song, and Persic842