Relating spin foams and canonical quantum gravity: (n-1)+1 formulation of nD spin foams
1
Citation Information: Material Science and Engineering A. Vol. 427, No. 1-2, 2006, pp. 331-342.
Comparison of Compressive Properties of Layered Syntactic Foams having Gradient in
Microballoon Volume Fraction and Wall Thickness
Nikhil Gupta and William Ricci
Composite Materials and Mechanics Laboratory
Mechanical, Aerospace and Manufacturing Engineering Department
Polytechnic University
Brooklyn, NY 11201
ABSTRACT
The existing functionally graded syntactic foams
(FGSFs) are based on creating a gradient of microballoon
(hollow particles) volume fraction along the length or
thickness of the composite to achieve a variation in density
and mechanical properties. However, such an approach has
several limitations. Variation in volume fractions of the
constituents leads to the possibility of warping or localized
swelling of FGSF if it is exposed to varying temperature and
moisture conditions. It can also lead to premature fracture due
to nonuniform distribution of stress along the microballoon
gradient and existence of resin/microballoon rich sides in the
material. Hence, a FGSF material needs to be created that is
independent of the volume fraction variation. The present
study attempts to address this requirement. A FGSF is
fabricated that is based on the microballoon wall thickness
variation along the specimen length. In this novel approach
the volume fraction is available as an additional parameter for
controlling the properties of the FGSF. The FGSFs based on
volume fraction gradient (VF-type) and on microballoon wall
thickness gradient (RR-type) are fabricated in a layered
structure, and evaluated for compressive properties. It is
observed that the VF-type FGSFs show a sharp drop in stress,
on the order of 40-60%, after the peak compressive strength
value. However, such feature is not observed in RR-type
FGSFs leading to the possibility of gaining better control over
strength and energy absorption. The compression of such
foams could be continued to 60-75% strain based on the
microballoon volume fraction in their structure. The total
energy absorption was found to be 3-5 times higher in RR-
type FGSFs compared to VF-type FGSFs and plain syntactic
foams.
Keywords: Syntactic foams, functionally graded material,
microballoon, mechanical properties, porosity.
INTRODUCTION
The closed cell foams can have either single-phase or
two-phase microstructures. The microstructure of single-
phase closed cell foams contains pores which are not
interconnected [1, 2]. Structural features of these foams
provide them with higher strength compared to the open cell
foams, which contain interconnected pores [3]. Two-phase
closed cell foams, called syntactic foams, are made by
dispersing low density hollow particles (microballoons) in a
matrix material [4]. The microstructure of syntactic foams is
shown in Figure 1,
Figure 1. A scanning electron micrograph showing the structure of a
syntactic foam. Glass microballoons are embedded in an epoxy resin
matrix.
where glass microballoons are dispersed in an epoxy
resin matrix. The presence of strong but lightweight particles
leads syntactic foams to higher strength compared to single-
phase closed cell foams. Almost all types of foams show high
energy absorption, damage tolerance and vibration damping
capabilities.
Structure and Properties of Syntactic Foams
It is possible to tailor properties of syntactic foams by
changing a wide variety of parameters, which include the
matrix and microballoon materials, and microballoon size, size
distribution, wall thickness and volume fraction [5-7]. Quasi-
static and dynamic properties of syntactic foams can be found
studied in great detail in the published literature [8-15].
Syntactic foams are currently used in marine and
aerospace applications because of their low density, which is
attributed to the presence of low density microballoons in their
structure. Increase in microballoon volume fraction (Vmb)
decreases the density of syntactic foams. Hence, most
applications tend to use syntactic foams having Vmb in the
range of 0.3-0.65. In this Vmb range most syntactic foams
show a stress-plateau in their compressive stress-strain curve,
which leads to high energy absorption [5, 16]. The stress-
plateau is observed in metal matrix syntactic foams also [17,
18]. The presence and extent of the plateau region is greatly
affected by the microballoon wall thickness, among other
parameters [19].
2
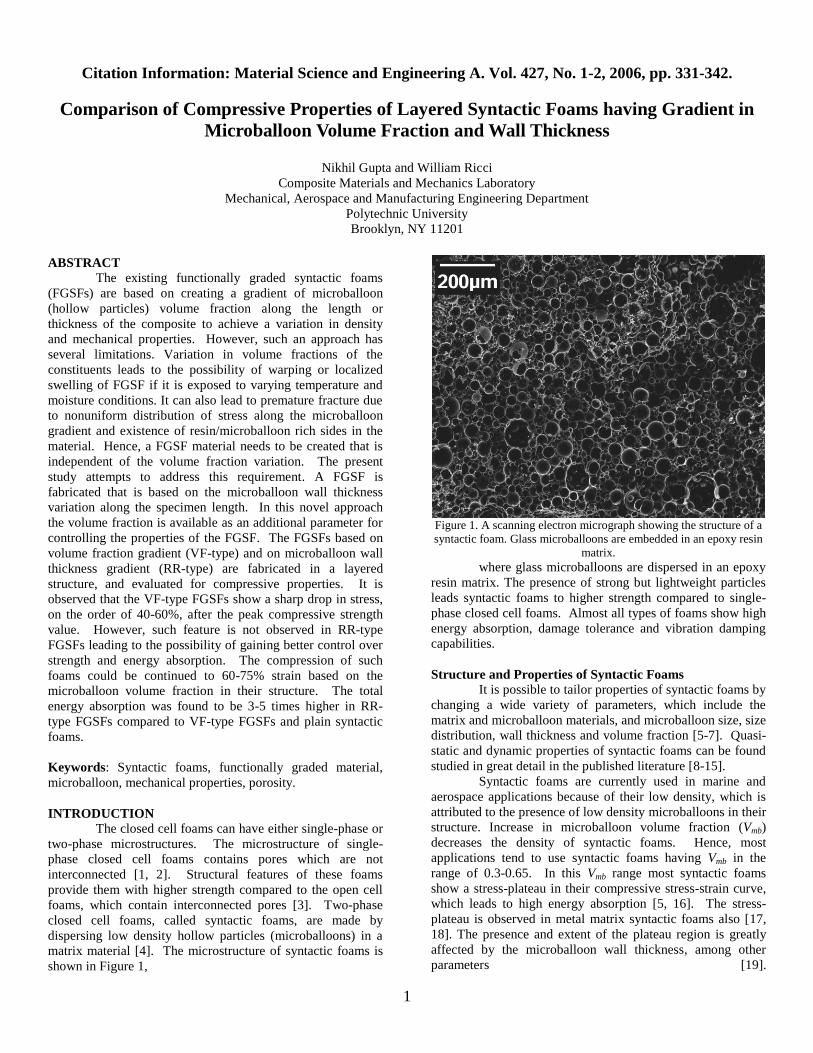
Higher density syntactic foams show higher strength
and modulus compared to lower density foams as shown in
Figure 2 [20, 21]. However, they have two distinct
disadvantages, namely lower fracture strain leading to lower
energy absorption and a 20-40% decrease in stress
immediately after attaining the peak compressive strength.
While, the compressive strength and the plateau stress are
among the design parameters and are specified by the
application, the total plateau strain can be increased in order to
increase the energy absorption by the material in the process
of compression.
Figure 2. Compressive stress-strain curves for plain syntactic foams
having different densities.
Fiber reinforcement of syntactic foams has been
studied as a means of increasing their strength [22-25].
Several studies have focused on increasing the energy
absorption in higher density syntactic foams by means of
incorporating second phase particles such as nanoclay and
rubber [26, 27]. However, moisture absorption was found to
increase considerably in some hybrid syntactic foams, which
could be detrimental in both marine and aerospace structures
[28].
Functionally Graded Syntactic Foams
In syntactic foams, an approach of obtaining high
energy absorption under compression may involve fabricating
them in functionally graded microstructure, which is explored
in the present study. Several studies are available on
functionally graded syntactic foams (FGSFs) [29-33]. In these
studies a gradient in Vmb is created along one dimension of
the material as schematically shown in Figure 3. These
FGSFs are referred here as VF-type FGSFs. Initiation and
propagation of cracks in the resin rich side of the specimen
under quasi-static and dynamic loading conditions appear to
be the problems with these kinds of FGSFs.
Creation of Vmb gradient severely limits the
possibility of tailoring the physical and mechanical properties
of syntactic foam to the desired level. Normally, the matrix
has higher thermal expansion and moisture absorption
coefficients compared to that of microballoons. Hence, high
matrix volume fraction on one side of the FGSF causes
nonuniform thermal expansion or moisture absorption when
the material is exposed to changing temperature or moisture
conditions, which can lead to warping and localized swelling.
Among other limitations, variation in Vmb causes nonuniform
stress concentrations in the material, which may cause
catastrophic failure, especially when the matrix is a brittle
polymer such as epoxies. Additionally, this approach poses
severe limitations on the minimum density achievable in such
FGSFs because Vmb cannot be varied independently. Hence,
an approach independent of Vmb variation is required for the
fabrication of FGSFs.
Figure 3. The schematic representation of the existing syntactic foam
microstructure based on microballoon volume fraction variation.
A FGSF is studied in the present research that can
have Vmb constant in the material microstructure but still have
a gradient in mechanical properties by means of changing
microballoon wall thickness. Previous studies have observed
that the strength and modulus of syntactic foams increase with
increased wall thickness of microballoons used in synthesizing
them [21, 34]. Hence, a gradient in mechanical properties of
syntactic foams can be obtained if wall thickness is varied
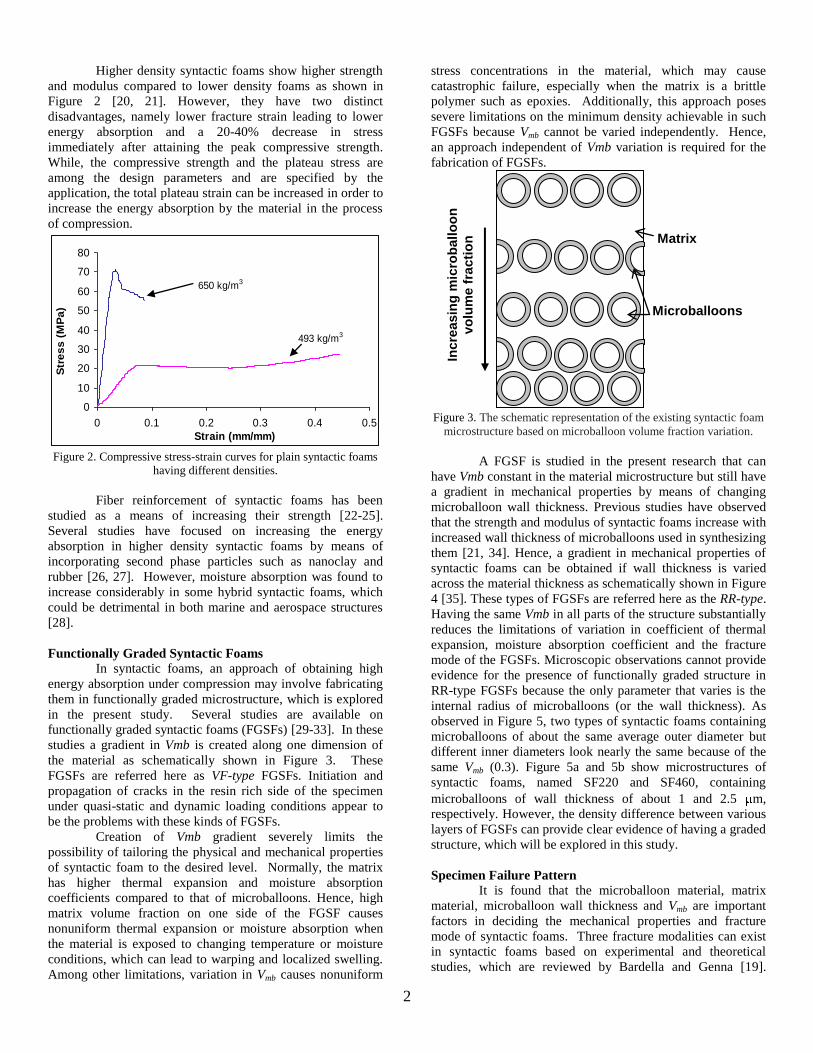
across the material thickness as schematically shown in Figure
4 [35]. These types of FGSFs are referred here as the RR-type.
Having the same Vmb in all parts of the structure substantially
reduces the limitations of variation in coefficient of thermal
expansion, moisture absorption coefficient and the fracture
mode of the FGSFs. Microscopic observations cannot provide
evidence for the presence of functionally graded structure in
RR-type FGSFs because the only parameter that varies is the
internal radius of microballoons (or the wall thickness). As
observed in Figure 5, two types of syntactic foams containing
microballoons of about the same average outer diameter but
different inner diameters look nearly the same because of the
same Vmb (0.3). Figure 5a and 5b show microstructures of
syntactic foams, named SF220 and SF460, containing
microballoons of wall thickness of about 1 and 2.5 m,
respectively. However, the density difference between various
layers of FGSFs can provide clear evidence of having a graded
structure, which will be explored in this study.
Specimen Failure Pattern
It is found that the microballoon material, matrix
material, microballoon wall thickness and Vmb are important
factors in deciding the mechanical properties and fracture
mode of syntactic foams. Three fracture modalities can exist
in syntactic foams based on experimental and theoretical
studies, which are reviewed by Bardella and Genna [19].
Incre
asin
g m
icro
ball
oo
n
vo
lum
e f
racti
on
Matrix
Microballoons
0
10
20
30
40
50
60
70
80
0 0.1 0.2 0.3 0.4 0.5
Strain (mm/mm)
Str
es
s (
MP
a)
493 kg/m3
650 kg/m3
3
Figure 4. The schematic representation of functionally graded
syntactic foam microstructure based on variation in microballoon .
(a)
(b)
Figure 5. Scanning electron micrographs of (a) SF220 and (b) SF460
syntactic foams containing 30% microballoons by volume.
The first two, longitudinal crack initiation in the
direction of applied load and shear failure at 45 , have been
widely observed and documented by various researchers in
experimental and theoretical investigations [6, 21, 34]. Metal
matrix syntactic foams were also found to fail due to the
failure of microballoons along the shear directions [18, 36].
High wall thickness of the microballoons and high volume
fraction of rigid matrix material are found to be the parameters
that lead to the longitudinal cracking in the material. The third
modality is observed by only a few researchers [11, 36, 37],
which constitutes origination of failure along some specific
weak planes in transverse direction. A review of Kim’s
experimental scheme reveals that their syntactic foam
fabrication method is based on settling of microballoons in a
fluid. Such methods have less probability of providing
random distribution of microballoons in the syntactic foams. It
can create planes of microballoons having the same wall
thickness and strength leading to generation of some weak
planes. These weak planes can be selectively crushed during
compression. Hence, the failure mechanism of such materials
is different from the first two mechanisms.
It is also observed that at high strain rates the first
two fracture modalities prevail [12, 38]. As the strain rate
increases, the material has lesser time to respond to the applied
load and longitudinal cracks become the primary fracture
mode. The crack initiation and growth is closely monitored in
the present study and is compared to these existing
observations.
POROSITY ASPECTS IN SYNTACTIC FOAMS
It is important to develop an understanding of the
porosity existing inside the syntactic foam microstructure
because it significantly affects the material properties,
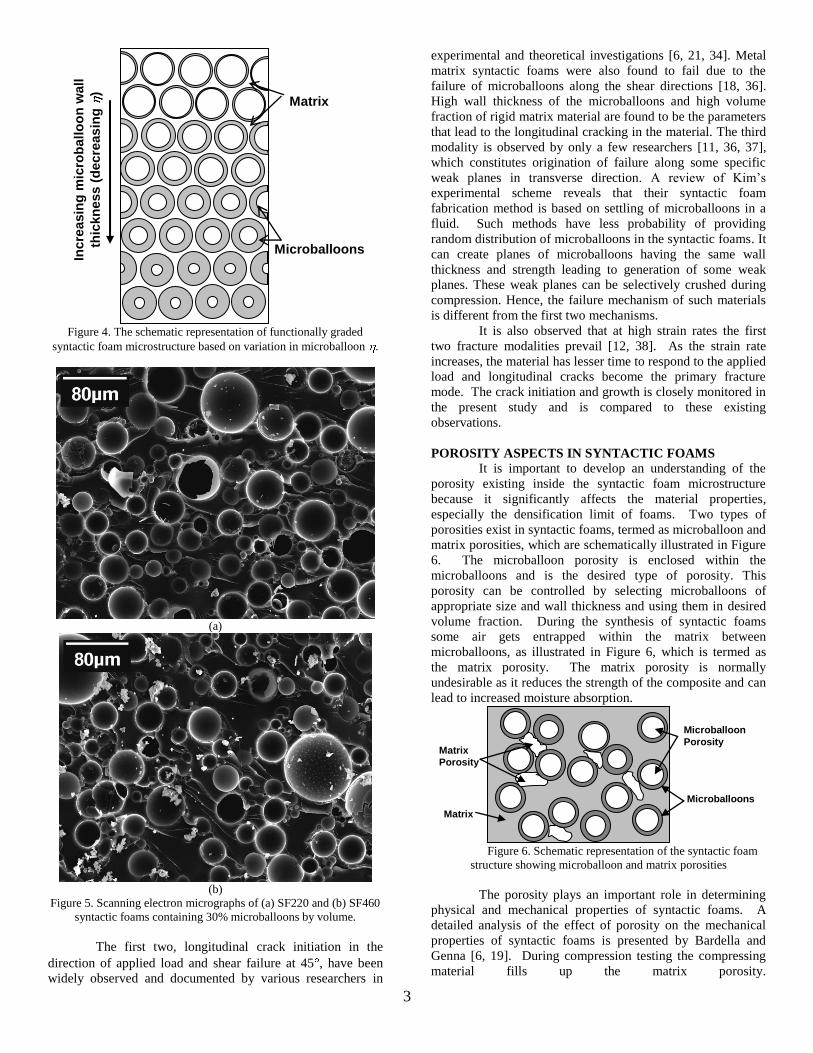
especially the densification limit of foams. Two types of
porosities exist in syntactic foams, termed as microballoon and
matrix porosities, which are schematically illustrated in Figure
6. The microballoon porosity is enclosed within the
microballoons and is the desired type of porosity. This
porosity can be controlled by selecting microballoons of
appropriate size and wall thickness and using them in desired
volume fraction. During the synthesis of syntactic foams
some air gets entrapped within the matrix between
microballoons, as illustrated in Figure 6, which is termed as
the matrix porosity. The matrix porosity is normally
undesirable as it reduces the strength of the composite and can
lead to increased moisture absorption.
Figure 6. Schematic representation of the syntactic foam
structure showing microballoon and matrix porosities
The porosity plays an important role in determining
physical and mechanical properties of syntactic foams. A
detailed analysis of the effect of porosity on the mechanical
properties of syntactic foams is presented by Bardella and
Genna [6, 19]. During compression testing the compressing
material fills up the matrix porosity.
Microballoon
Porosity Matrix
Porosity
Matrix
Microballoons
Incre
asin
g m
icro
ball
oo
n w
all
thic
kn
ess
(d
ecre
as
ing
)
Matrix
Microballoons
4
As microballoons fracture the porosity enclosed
within them is exposed, which can also be occupied by the
compressing material. Hence, the length of the stress-plateau
in the stress-stain curve of syntactic foams is directly
dependent on the total porosity in the material structure,
among other factors. The calculation method for both types of
porosities is outlined here, which will be used in the
estimation of total porosity in FGSFs.
The wall thickness of microballoons is defined by
means of a parameter named Radius Ratio ( ), which is given
by Equation 1 [34]:
o
i
r
r (1)
where ri and ro are the inner and outer radii of microballoons.
The higher values of lead to lower wall thicknesses (w) in
the same size microballoons, as given by Equation 2.
1rw o (2)
In the bulk testing it is observed that the strength of
microballoons increases with increased wall thickness or a
decrease in . Generally, for ceramic particles the
compressive strength of an individual particle increases as the
wall thickness decreases [39]. Such a trend is observed
because ceramics are very susceptible to fracture due to flaws.
Microballoons have a variety of flaws embedded in their walls
[40]. However, the bulk behavior of microballoons is opposite
to this trend and microballoons with high wall thickness show
higher strength. This trend is observed because in the bulk
testing the microballoon fracture takes place primarily due to
the shear and not due to the true compression.
The hollow fraction of the microballoon volume (Vc,mb) can
be given as 3
,mbcV (4)
Hence, the volume fraction of microballoon porosity in
syntactic foam structure is 3
mbc VV (5)
The difference between the theoretical ( th) and
experimentally measured ( m) densities of syntactic foams
can be used to get an estimate of the matrix porosity (Vv) [41].
th
mthvV (6)
where the theoretical density is calculated using Rule of
Mixtures:
rmbmbmbth V1V (7)
where r and mb are the densities of the resin system and
microballoons, respectively. The total porosity in syntactic
foams (Vt) is the sum of the microballoon and the matrix
porosities:
vct VVV (8)
During synthesis of syntactic foams it is inevitable to
cause damage to some of the microballoons. Careful
processing can minimize the damage but cannot completely
eliminate it. Fracture of microballoons opens up their cavity,
which can be filled with the matrix material. Hence, fracture
of microballoons leads to increase in the syntactic foam
density and reduces Vc. Therefore, the calculation of
microballoon and matrix porosities cannot be very precise, but
can only be approximate.
MATERIALS AND EXPERIMENTAL METHODS
Constituent Materials
DER 332 epoxy resin with hardener DEH 24,
manufactured by DOW Chemical Co., is used as the matrix
resin in the fabricated syntactic foams. A diluent C12-C14
aliphaticglycidylether is used in 5 vol.% quantity to reduce the
viscosity of the resin and facilitate mixing of microballoons in
high volume fractions. Twenty types of plain syntactic foams
are synthesized with four types of microballoons in five
volume fractions of 0.3, 0.4, 0.5, 0.6 and 0.65. Scotchlite
glass microballoons, manufactured and supplied by 3M, are
used in synthesizing these foams. The outer diameter, density
and calculated for the selected microballoons are given in
Table 1. A difference in their densities is caused by the
values because their average outer diameters are nearly the
same. The compressive strength and modulus for various types
of plain syntactic foams synthesized in this study are presented
in Table 2. These values are measured experimentally from
the synthesized syntactic foams.
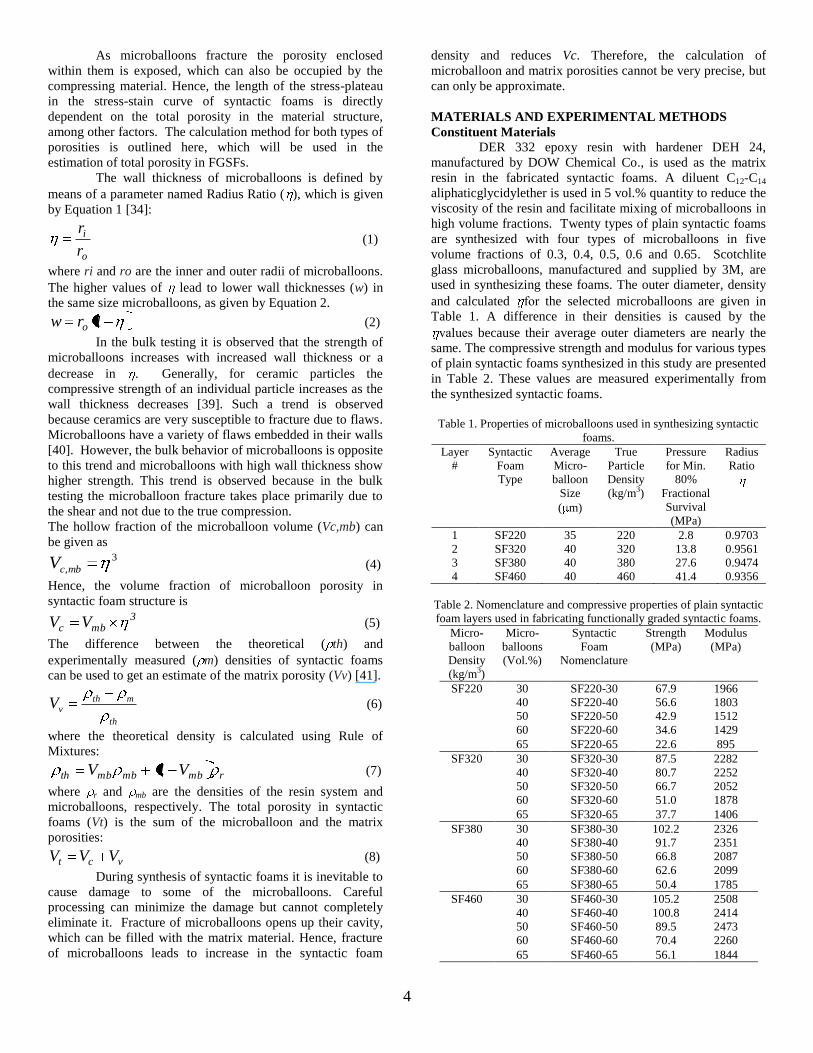
Table 1. Properties of microballoons used in synthesizing syntactic
foams.
Layer
#
Syntactic
Foam
Type
Average
Micro-
balloon
Size
( m)
True
Particle
Density
(kg/m3)
Pressure
for Min.
80%
Fractional
Survival
(MPa)
Radius
Ratio
1 SF220 35 220 2.8 0.9703
2 SF320 40 320 13.8 0.9561
3 SF380 40 380 27.6 0.9474
4 SF460 40 460 41.4 0.9356
Table 2. Nomenclature and compressive properties of plain syntactic
foam layers used in fabricating functionally graded syntactic foams.
Micro-
balloon
Density
(kg/m3)
Micro-
balloons
(Vol.%)
Syntactic
Foam
Nomenclature
Strength
(MPa)
Modulus
(MPa)
SF220 30 SF220-30 67.9 1966
40 SF220-40 56.6 1803
50 SF220-50 42.9 1512
60 SF220-60 34.6 1429
65 SF220-65 22.6 895
SF320 30 SF320-30 87.5 2282
40 SF320-40 80.7 2252
50 SF320-50 66.7 2052
60 SF320-60 51.0 1878
65 SF320-65 37.7 1406
SF380 30 SF380-30 102.2 2326
40 SF380-40 91.7 2351
50 SF380-50 66.8 2087
60 SF380-60 62.6 2099
65 SF380-65 50.4 1785
SF460 30 SF460-30 105.2 2508
40 SF460-40 100.8 2414
50 SF460-50 89.5 2473
60 SF460-60 70.4 2260
65 SF460-65 56.1 1844
5
Fabrication of Syntactic Foams
The fabrication process consists of mixing resin,
diluent and hardener and stirring them until a uniform mixture
is obtained. Microballoons are then added in desired volume
fraction. The processing is carried out at 500 C to reduce the
viscosity of the matrix resin system, which helps in achieving
uniform mixing of microballoons in the resin system. The
mixture is gently stirred using wooden dowels to obtain a
slurry, which is degassed for 10 minutes and then cast in steel
molds. The cast slabs are cured at 250 C for 24 h and post
cured at 1000 C for 3 h.
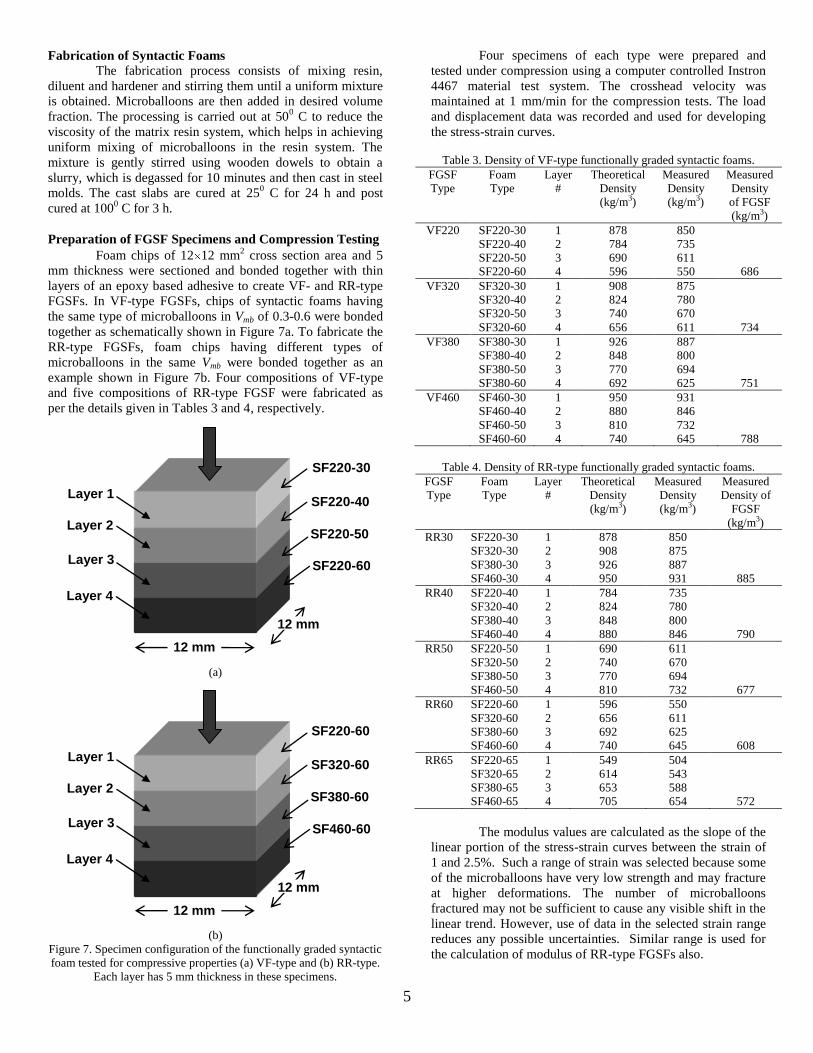
Preparation of FGSF Specimens and Compression Testing
Foam chips of 12 12 mm2 cross section area and 5
mm thickness were sectioned and bonded together with thin
layers of an epoxy based adhesive to create VF- and RR-type
FGSFs. In VF-type FGSFs, chips of syntactic foams having
the same type of microballoons in Vmb of 0.3-0.6 were bonded
together as schematically shown in Figure 7a. To fabricate the
RR-type FGSFs, foam chips having different types of
microballoons in the same Vmb were bonded together as an
example shown in Figure 7b. Four compositions of VF-type
and five compositions of RR-type FGSF were fabricated as
per the details given in Tables 3 and 4, respectively.
(a)
(b)
Figure 7. Specimen configuration of the functionally graded syntactic
foam tested for compressive properties (a) VF-type and (b) RR-type.
Each layer has 5 mm thickness in these specimens.
Four specimens of each type were prepared and
tested under compression using a computer controlled Instron
4467 material test system. The crosshead velocity was
maintained at 1 mm/min for the compression tests. The load
and displacement data was recorded and used for developing
the stress-strain curves.
Table 3. Density of VF-type functionally graded syntactic foams.
FGSF
Type
Foam
Type
Layer
#
Theoretical
Density
(kg/m3)
Measured
Density
(kg/m3)
Measured
Density
of FGSF
(kg/m3)
VF220 SF220-30 1 878 850
SF220-40 2 784 735
SF220-50 3 690 611
SF220-60 4 596 550 686
VF320 SF320-30 1 908 875
SF320-40 2 824 780
SF320-50 3 740 670
SF320-60 4 656 611 734
VF380 SF380-30 1 926 887
SF380-40 2 848 800
SF380-50 3 770 694
SF380-60 4 692 625 751
VF460 SF460-30 1 950 931
SF460-40 2 880 846
SF460-50 3 810 732
SF460-60 4 740 645 788
Table 4. Density of RR-type functionally graded syntactic foams.
FGSF
Type
Foam
Type
Layer
#
Theoretical
Density
(kg/m3)
Measured
Density
(kg/m3)
Measured
Density of
FGSF
(kg/m3)
RR30 SF220-30 1 878 850
SF320-30 2 908 875
SF380-30 3 926 887
SF460-30 4 950 931 885
RR40 SF220-40 1 784 735
SF320-40 2 824 780
SF380-40 3 848 800
SF460-40 4 880 846 790
RR50 SF220-50 1 690 611
SF320-50 2 740 670
SF380-50 3 770 694
SF460-50 4 810 732 677
RR60 SF220-60 1 596 550
SF320-60 2 656 611
SF380-60 3 692 625
SF460-60 4 740 645 608
RR65 SF220-65 1 549 504
SF320-65 2 614 543
SF380-65 3 653 588
SF460-65 4 705 654 572
The modulus values are calculated as the slope of the
linear portion of the stress-strain curves between the strain of
1 and 2.5%. Such a range of strain was selected because some
of the microballoons have very low strength and may fracture
at higher deformations. The number of microballoons
fractured may not be sufficient to cause any visible shift in the
linear trend. However, use of data in the selected strain range
reduces any possible uncertainties. Similar range is used for
the calculation of modulus of RR-type FGSFs also.
SF220-60
SF320-60
SF380-60
SF460-60
Layer 1
Layer 2
Layer 3
Layer 4
12 mm
12 mm
SF220-30
SF220-40
SF220-50
SF220-60
Layer 1
Layer 2
Layer 3
Layer 4
12 mm
12 mm
6
RESULTS AND DISCUSSION
Porosity Calculation
The total porosity (Vt) is one of the important
parameters that define the energy absorption capabilities of
syntactic foams. Hence, Vt is calculated for each layer of
FGSFs using Equations 5, 6 and 8. Vt affects the length of the
stress-plateau in the compressive stress-strain curves of
syntactic foams, in addition to several other parameters such
as properties of matrix material and matrix microballoon
interfacial bonding. However, in the present case the only
differences between various types of foams are the
microballoon wall thickness and volume fraction (both leading
to difference in porosity). Hence, the effect of only these two
parameters on the energy absorption in syntactic foams is
discussed.
It is possible to calculate the microballoon porosity
by theoretical means using Equation 5; however, calculation
of matrix porosity requires theoretical estimation and
experimental measurement of foam densities. The theoretical
density is calculated using Equation 7. The experimental
density is calculated using ASTM C271 standard method,
where at least 5 pieces of foam were measured for weight and
volume to calculate the density [42]. The calculated and
measured density values are given in Tables 3 and 4. These
values are inserted in Equation 6 to calculate the matrix
porosity, and in Equation 8 to calculate the total porosity. The
porosity values of all types of syntactic foams are presented in
Tables 5 and 6. These values are used to calculate the densities
of the FGSF specimens.
Table 5. Total porosity in VF-type functionally graded syntactic foam
specimens.
FGSF
Type
Layer # Micro-
balloon
Porosity
(Vol.%)
Matrix
Porosity
(Vol.%)
Total
Porosity
in Each
Layer
(Vol.%)
Porosity
in the
FGSF
(Vol.%)
VF220 1 27.4 3.2 30.6
2 36.5 6.3 42.8
3 45.7 11.4 56.7
4 54.8 7.7 62.8 48.2
VF320 1 26.2 3.6 29.8
2 35.0 5.3 40.3
3 43.7 9.5 52.7
4 52.4 6.9 59.4 45.5
VF380 1 25.5 4.2 29.7
2 34.0 5.7 39.7
3 42.5 9.9 52.5
4 51.0 9.7 61.0 45.7
VF460 1 24.6 2.0 26.6
2 32.8 3.9 36.7
3 40.9 9.6 50.9
4 49.1 12.8 61.1 43.8
The measured densities and total porosities in all
variations of VF- and RR-type syntactic foams are also
presented in Tables 3-6. It can be observed from Table 5 that
the average Vt in all VF-type FGSFs is around 0.45.
Microballoon does not have any significant effect on the
porosity, which is controlled only by the Vmb value. All
varieties of VF-type FGSFs have variation in Vmb over the
range 0.3-0.6. To cause an effective increase in porosity the
volume fraction range of microballoons will have to be
increased.
Table 6. Total porosity in RR-type functionally graded syntactic foam
specimens.
FGSF
Type
Layer
#
Micro-
balloon
Porosity
(Vol.%)
Matrix
Porosity
(Vol.%)
Total
Porosity
in Each
Layer
(Vol.%)
Mean
Porosity
in the
FGSF
(Vol.%)
RR30 1 27.4 3.2 30.6
2 26.2 3.6 29.8
3 25.5 4.2 29.7
4 24.6 2.0 26.6 29.2
RR40 1 36.5 6.3 42.8
2 35.0 5.3 40.3
3 34.0 5.7 39.7
4 32.8 3.9 36.7 39.9
RR50 1 45.7 11.4 56.7
2 43.7 9.5 52.7
3 42.5 9.9 52.5
4 40.9 9.6 50.9 53.2
RR60 1 54.8 7.7 62.8
2 52.4 6.9 59.4
3 51.0 9.7 61.0
4 49.1 12.8 61.1 61.1
RR65 1 59.4 8.2 67.4
2 56.8 11.6 67.8
3 55.3 10.0 65.3
4 53.2 7.2 60.2 65.2
The RR-type FGSFs show a clear trend in Vt. The
specimens containing 30 and 65 vol.% microballoons have Vt
of 0.29 and 0.65, respectively. Hence, the variation in the
porosity can be achieved by selecting microballoons of
appropriate values. Having higher Vmb of high
microballoons will provide lower density and higher Vt in
composites.
Close observations of Tables 5 and 6 reveal that Vt in
various layers of VF-type specimens varies from about 0.29 to
0.6, whereas in RR-type specimens Vt in each layer is within a
close range. The syntactic foams with lower porosity show
higher strength. Hence, a difference in the compressive
properties of VF-type and RR-type FGSFs is expected because
of a difference in pattern of porosities in the specimen
microstructure.
Compression Tests
FGSFs Based on Volume Fraction Variation (VF-Type)
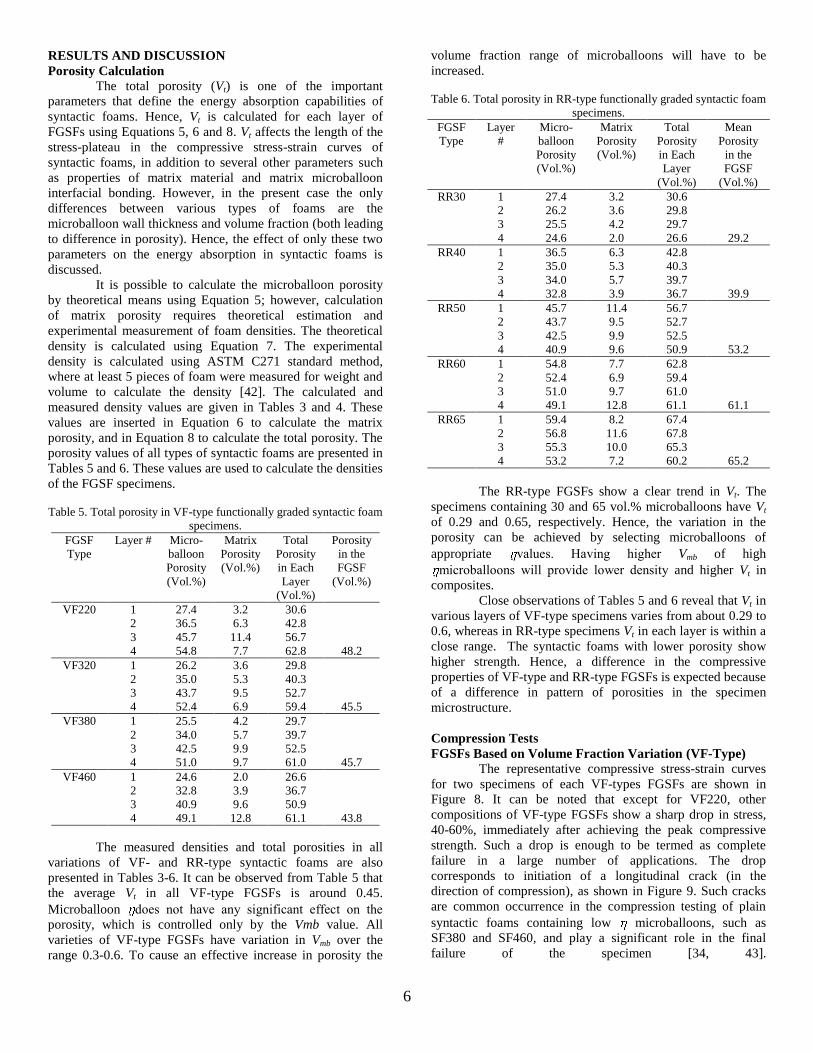
The representative compressive stress-strain curves
for two specimens of each VF-types FGSFs are shown in
Figure 8. It can be noted that except for VF220, other
compositions of VF-type FGSFs show a sharp drop in stress,
40-60%, immediately after achieving the peak compressive
strength. Such a drop is enough to be termed as complete
failure in a large number of applications. The drop
corresponds to initiation of a longitudinal crack (in the
direction of compression), as shown in Figure 9. Such cracks
are common occurrence in the compression testing of plain
syntactic foams containing low microballoons, such as
SF380 and SF460, and play a significant role in the final
failure of the specimen [34, 43].
7
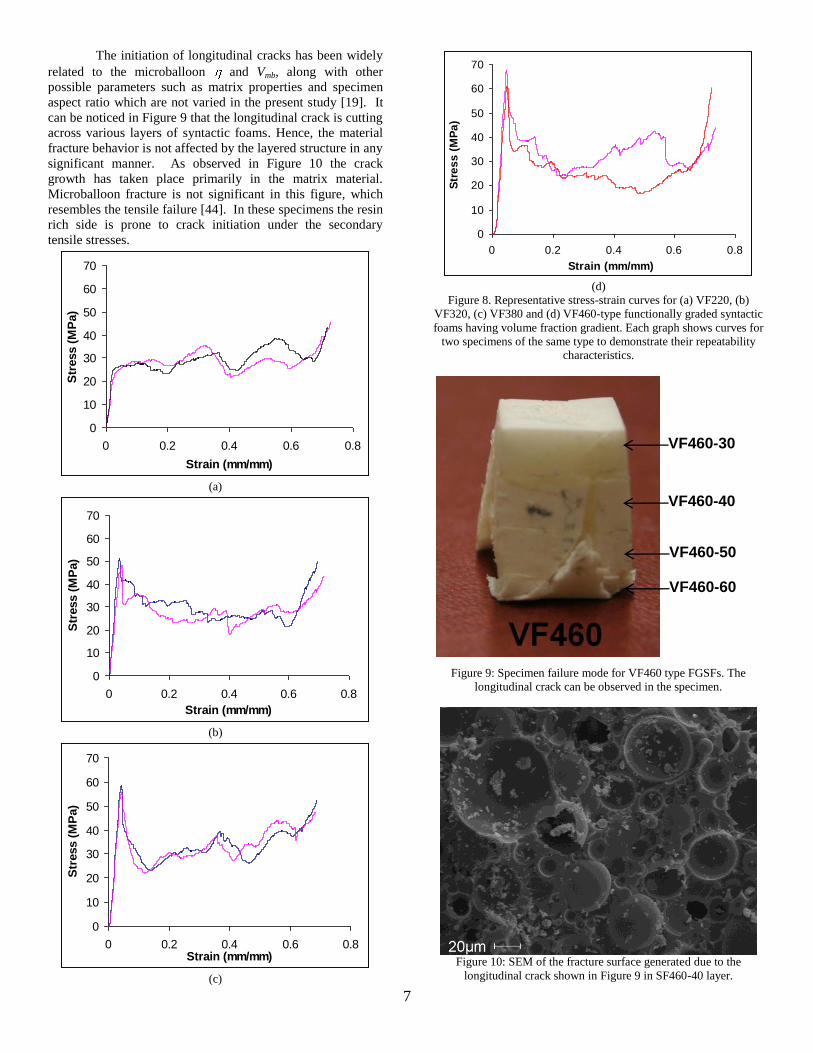
The initiation of longitudinal cracks has been widely
related to the microballoon and Vmb, along with other
possible parameters such as matrix properties and specimen
aspect ratio which are not varied in the present study [19]. It
can be noticed in Figure 9 that the longitudinal crack is cutting
across various layers of syntactic foams. Hence, the material
fracture behavior is not affected by the layered structure in any
significant manner. As observed in Figure 10 the crack
growth has taken place primarily in the matrix material.
Microballoon fracture is not significant in this figure, which
resembles the tensile failure [44]. In these specimens the resin
rich side is prone to crack initiation under the secondary
tensile stresses.
0
10
20
30
40
50
60
70
0 0.2 0.4 0.6 0.8
Strain (mm/mm)
Str
ess (
MP
a)
(a)
0
10
20
30
40
50
60
70
0 0.2 0.4 0.6 0.8
Strain (mm/mm)
Str
ess (
MP
a)
(b)
0
10
20
30
40
50
60
70
0 0.2 0.4 0.6 0.8Strain (mm/mm)
Str
ess (
MP
a)
(c)
0
10
20
30
40
50
60
70
0 0.2 0.4 0.6 0.8
Strain (mm/mm)
Str
es
s (
MP
a)
(d)
Figure 8. Representative stress-strain curves for (a) VF220, (b)
VF320, (c) VF380 and (d) VF460-type functionally graded syntactic
foams having volume fraction gradient. Each graph shows curves for
two specimens of the same type to demonstrate their repeatability
characteristics.
Figure 9: Specimen failure mode for VF460 type FGSFs. The
longitudinal crack can be observed in the specimen.
Figure 10: SEM of the fracture surface generated due to the
longitudinal crack shown in Figure 9 in SF460-40 layer.
VF460-30
VF460-40
VF460-50
VF460-60
8
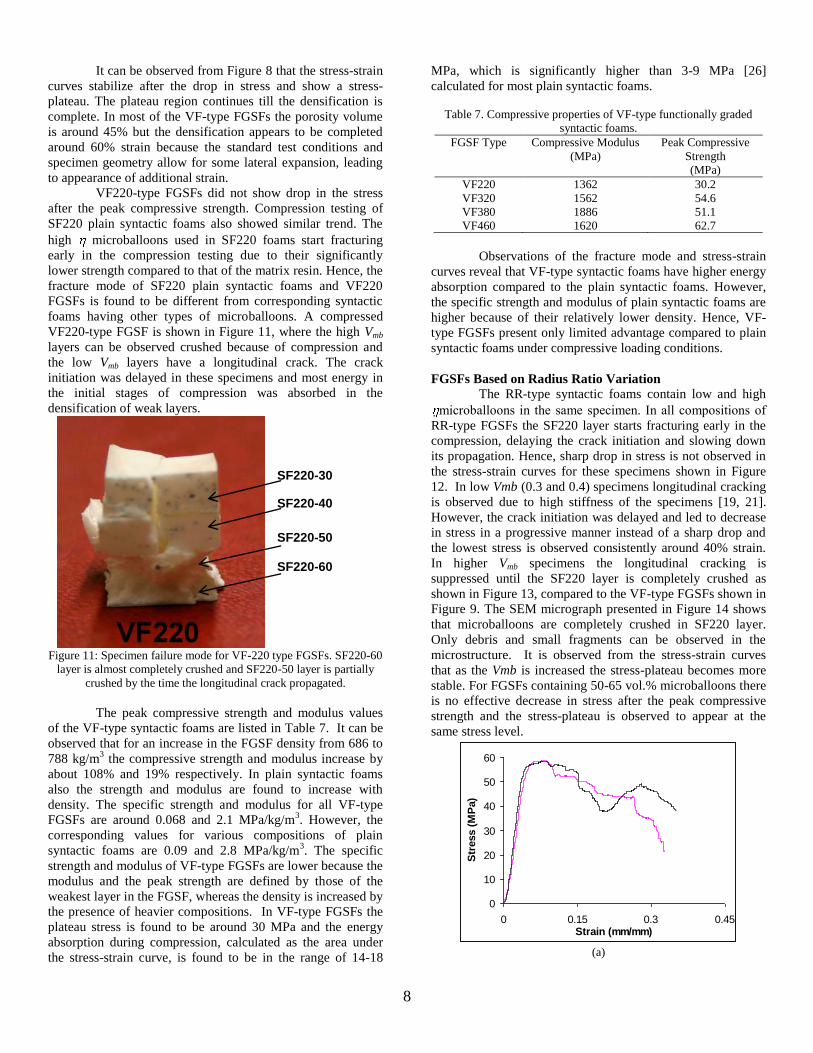
It can be observed from Figure 8 that the stress-strain
curves stabilize after the drop in stress and show a stress-
plateau. The plateau region continues till the densification is
complete. In most of the VF-type FGSFs the porosity volume
is around 45% but the densification appears to be completed
around 60% strain because the standard test conditions and
specimen geometry allow for some lateral expansion, leading
to appearance of additional strain.
VF220-type FGSFs did not show drop in the stress
after the peak compressive strength. Compression testing of
SF220 plain syntactic foams also showed similar trend. The
high microballoons used in SF220 foams start fracturing
early in the compression testing due to their significantly
lower strength compared to that of the matrix resin. Hence, the
fracture mode of SF220 plain syntactic foams and VF220
FGSFs is found to be different from corresponding syntactic
foams having other types of microballoons. A compressed
VF220-type FGSF is shown in Figure 11, where the high Vmb
layers can be observed crushed because of compression and
the low Vmb layers have a longitudinal crack. The crack
initiation was delayed in these specimens and most energy in
the initial stages of compression was absorbed in the
densification of weak layers.
Figure 11: Specimen failure mode for VF-220 type FGSFs. SF220-60
layer is almost completely crushed and SF220-50 layer is partially
crushed by the time the longitudinal crack propagated.
The peak compressive strength and modulus values
of the VF-type syntactic foams are listed in Table 7. It can be
observed that for an increase in the FGSF density from 686 to
788 kg/m3 the compressive strength and modulus increase by
about 108% and 19% respectively. In plain syntactic foams
also the strength and modulus are found to increase with
density. The specific strength and modulus for all VF-type
FGSFs are around 0.068 and 2.1 MPa/kg/m3. However, the
corresponding values for various compositions of plain
syntactic foams are 0.09 and 2.8 MPa/kg/m3. The specific
strength and modulus of VF-type FGSFs are lower because the
modulus and the peak strength are defined by those of the
weakest layer in the FGSF, whereas the density is increased by
the presence of heavier compositions. In VF-type FGSFs the
plateau stress is found to be around 30 MPa and the energy
absorption during compression, calculated as the area under
the stress-strain curve, is found to be in the range of 14-18
MPa, which is significantly higher than 3-9 MPa [26]
calculated for most plain syntactic foams.
Table 7. Compressive properties of VF-type functionally graded
syntactic foams.
FGSF Type Compressive Modulus
(MPa)
Peak Compressive
Strength
(MPa)
VF220 1362 30.2
VF320 1562 54.6
VF380 1886 51.1
VF460 1620 62.7
Observations of the fracture mode and stress-strain
curves reveal that VF-type syntactic foams have higher energy
absorption compared to the plain syntactic foams. However,
the specific strength and modulus of plain syntactic foams are
higher because of their relatively lower density. Hence, VF-
type FGSFs present only limited advantage compared to plain
syntactic foams under compressive loading conditions.
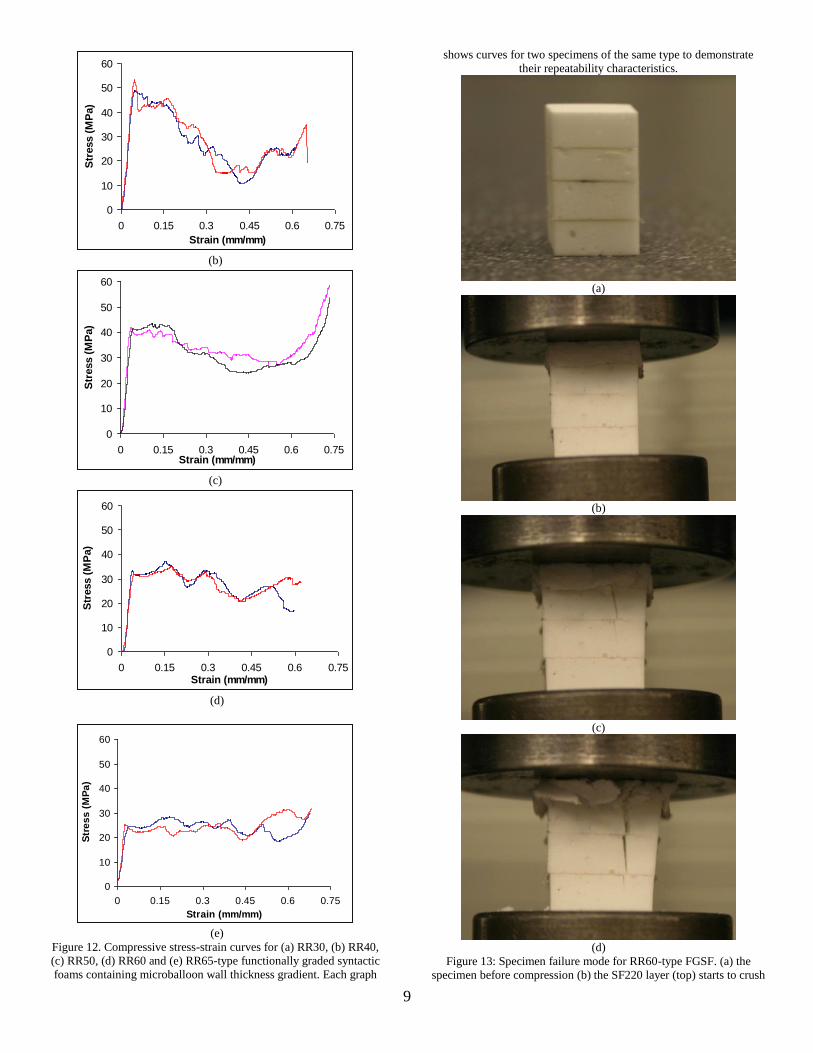
FGSFs Based on Radius Ratio Variation
The RR-type syntactic foams contain low and high
microballoons in the same specimen. In all compositions of
RR-type FGSFs the SF220 layer starts fracturing early in the
compression, delaying the crack initiation and slowing down
its propagation. Hence, sharp drop in stress is not observed in
the stress-strain curves for these specimens shown in Figure
12. In low Vmb (0.3 and 0.4) specimens longitudinal cracking
is observed due to high stiffness of the specimens [19, 21].
However, the crack initiation was delayed and led to decrease
in stress in a progressive manner instead of a sharp drop and
the lowest stress is observed consistently around 40% strain.
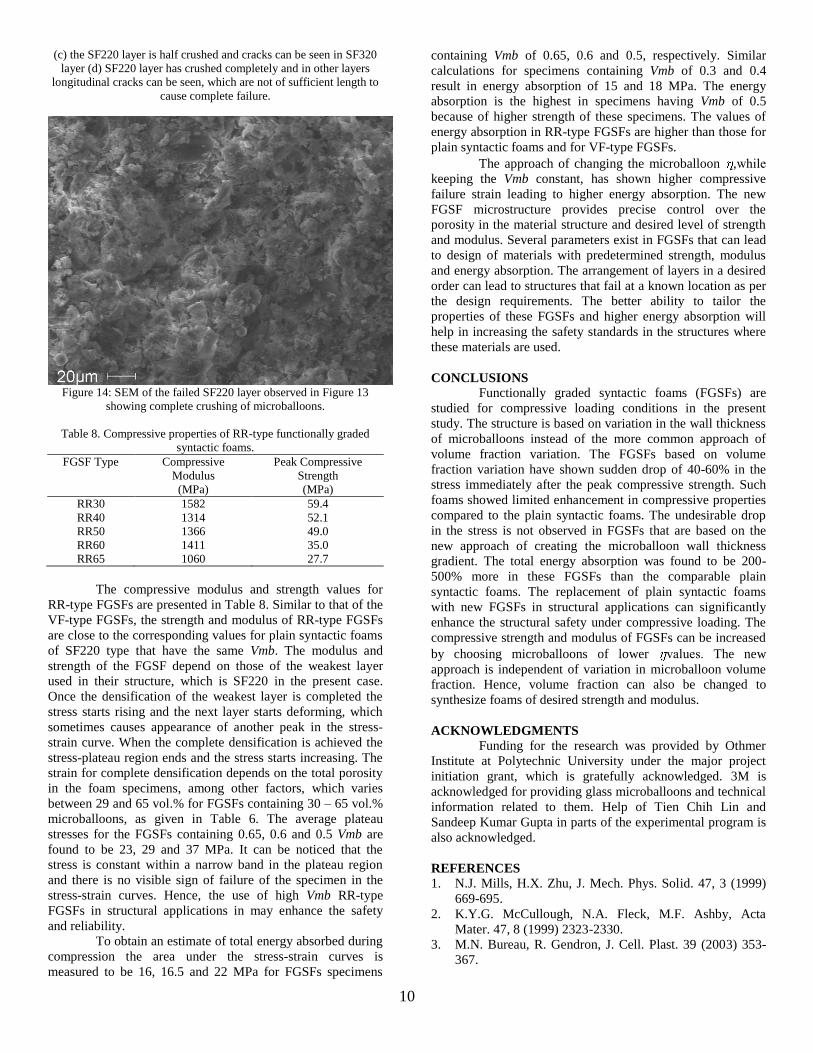
In higher Vmb specimens the longitudinal cracking is
suppressed until the SF220 layer is completely crushed as
shown in Figure 13, compared to the VF-type FGSFs shown in
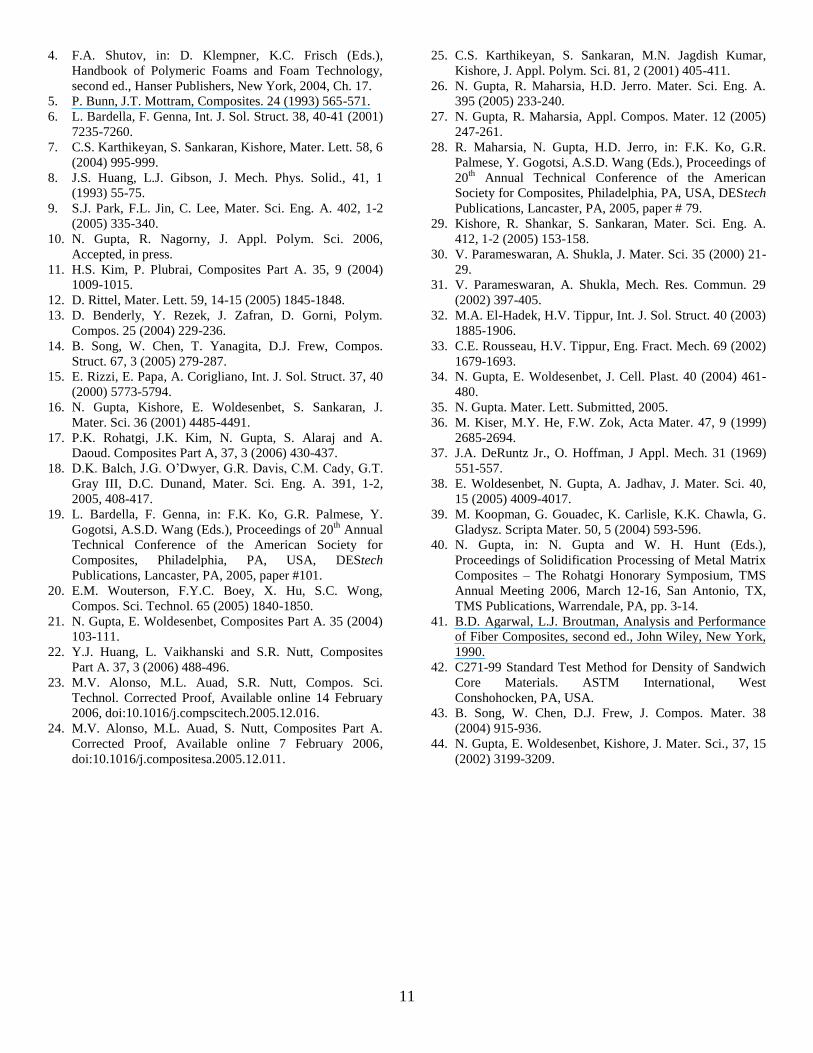
Figure 9. The SEM micrograph presented in Figure 14 shows
that microballoons are completely crushed in SF220 layer.
Only debris and small fragments can be observed in the
microstructure. It is observed from the stress-strain curves
that as the Vmb is increased the stress-plateau becomes more
stable. For FGSFs containing 50-65 vol.% microballoons there
is no effective decrease in stress after the peak compressive
strength and the stress-plateau is observed to appear at the
same stress level.
0
10
20
30
40
50
60
0 0.15 0.3 0.45Strain (mm/mm)
Str
ess (
MP
a)
(a)
SF220-30
SF220-40
SF220-50
SF220-60
9
0
10
20
30
40
50
60
0 0.15 0.3 0.45 0.6 0.75
Strain (mm/mm)
Str
ess (
MP
a)
(b)
0
10
20
30
40
50
60
0 0.15 0.3 0.45 0.6 0.75Strain (mm/mm)
Str
ess (
MP
a)
(c)
0
10
20
30
40
50
60
0 0.15 0.3 0.45 0.6 0.75Strain (mm/mm)
Str
ess (
MP
a)
(d)
0
10
20
30
40
50
60
0 0.15 0.3 0.45 0.6 0.75
Strain (mm/mm)
Str
es
s (
MP
a)
(e)
Figure 12. Compressive stress-strain curves for (a) RR30, (b) RR40,
(c) RR50, (d) RR60 and (e) RR65-type functionally graded syntactic
foams containing microballoon wall thickness gradient. Each graph
shows curves for two specimens of the same type to demonstrate
their repeatability characteristics.
(a)
(b)
(c)
(d)
Figure 13: Specimen failure mode for RR60-type FGSF. (a) the
specimen before compression (b) the SF220 layer (top) starts to crush
10
(c) the SF220 layer is half crushed and cracks can be seen in SF320
layer (d) SF220 layer has crushed completely and in other layers
longitudinal cracks can be seen, which are not of sufficient length to
cause complete failure.
Figure 14: SEM of the failed SF220 layer observed in Figure 13
showing complete crushing of microballoons.
Table 8. Compressive properties of RR-type functionally graded
syntactic foams.
FGSF Type Compressive
Modulus
(MPa)
Peak Compressive
Strength
(MPa)
RR30 1582 59.4
RR40 1314 52.1
RR50 1366 49.0
RR60 1411 35.0
RR65 1060 27.7
The compressive modulus and strength values for
RR-type FGSFs are presented in Table 8. Similar to that of the
VF-type FGSFs, the strength and modulus of RR-type FGSFs
are close to the corresponding values for plain syntactic foams
of SF220 type that have the same Vmb. The modulus and
strength of the FGSF depend on those of the weakest layer
used in their structure, which is SF220 in the present case.
Once the densification of the weakest layer is completed the
stress starts rising and the next layer starts deforming, which
sometimes causes appearance of another peak in the stress-
strain curve. When the complete densification is achieved the
stress-plateau region ends and the stress starts increasing. The
strain for complete densification depends on the total porosity
in the foam specimens, among other factors, which varies
between 29 and 65 vol.% for FGSFs containing 30 – 65 vol.%
microballoons, as given in Table 6. The average plateau
stresses for the FGSFs containing 0.65, 0.6 and 0.5 Vmb are
found to be 23, 29 and 37 MPa. It can be noticed that the
stress is constant within a narrow band in the plateau region
and there is no visible sign of failure of the specimen in the
stress-strain curves. Hence, the use of high Vmb RR-type
FGSFs in structural applications in may enhance the safety
and reliability.
To obtain an estimate of total energy absorbed during
compression the area under the stress-strain curves is
measured to be 16, 16.5 and 22 MPa for FGSFs specimens
containing Vmb of 0.65, 0.6 and 0.5, respectively. Similar
calculations for specimens containing Vmb of 0.3 and 0.4
result in energy absorption of 15 and 18 MPa. The energy
absorption is the highest in specimens having Vmb of 0.5
because of higher strength of these specimens. The values of
energy absorption in RR-type FGSFs are higher than those for
plain syntactic foams and for VF-type FGSFs.
The approach of changing the microballoon , while
keeping the Vmb constant, has shown higher compressive
failure strain leading to higher energy absorption. The new
FGSF microstructure provides precise control over the
porosity in the material structure and desired level of strength
and modulus. Several parameters exist in FGSFs that can lead
to design of materials with predetermined strength, modulus
and energy absorption. The arrangement of layers in a desired
order can lead to structures that fail at a known location as per
the design requirements. The better ability to tailor the
properties of these FGSFs and higher energy absorption will
help in increasing the safety standards in the structures where
these materials are used.
CONCLUSIONS
Functionally graded syntactic foams (FGSFs) are
studied for compressive loading conditions in the present
study. The structure is based on variation in the wall thickness
of microballoons instead of the more common approach of
volume fraction variation. The FGSFs based on volume
fraction variation have shown sudden drop of 40-60% in the
stress immediately after the peak compressive strength. Such
foams showed limited enhancement in compressive properties
compared to the plain syntactic foams. The undesirable drop
in the stress is not observed in FGSFs that are based on the
new approach of creating the microballoon wall thickness
gradient. The total energy absorption was found to be 200-
500% more in these FGSFs than the comparable plain
syntactic foams. The replacement of plain syntactic foams
with new FGSFs in structural applications can significantly
enhance the structural safety under compressive loading. The
compressive strength and modulus of FGSFs can be increased
by choosing microballoons of lower values. The new
approach is independent of variation in microballoon volume
fraction. Hence, volume fraction can also be changed to
synthesize foams of desired strength and modulus.
ACKNOWLEDGMENTS
Funding for the research was provided by Othmer
Institute at Polytechnic University under the major project
initiation grant, which is gratefully acknowledged. 3M is
acknowledged for providing glass microballoons and technical
information related to them. Help of Tien Chih Lin and
Sandeep Kumar Gupta in parts of the experimental program is
also acknowledged.
REFERENCES
1. N.J. Mills, H.X. Zhu, J. Mech. Phys. Solid. 47, 3 (1999)
669-695.
2. K.Y.G. McCullough, N.A. Fleck, M.F. Ashby, Acta
Mater. 47, 8 (1999) 2323-2330.
3. M.N. Bureau, R. Gendron, J. Cell. Plast. 39 (2003) 353-
367.
11
4. F.A. Shutov, in: D. Klempner, K.C. Frisch (Eds.),
Handbook of Polymeric Foams and Foam Technology,
second ed., Hanser Publishers, New York, 2004, Ch. 17.
5. P. Bunn, J.T. Mottram, Composites. 24 (1993) 565-571.
6. L. Bardella, F. Genna, Int. J. Sol. Struct. 38, 40-41 (2001)
7235-7260.
7. C.S. Karthikeyan, S. Sankaran, Kishore, Mater. Lett. 58, 6
(2004) 995-999.
8. J.S. Huang, L.J. Gibson, J. Mech. Phys. Solid., 41, 1
(1993) 55-75.
9. S.J. Park, F.L. Jin, C. Lee, Mater. Sci. Eng. A. 402, 1-2
(2005) 335-340.
10. N. Gupta, R. Nagorny, J. Appl. Polym. Sci. 2006,
Accepted, in press.
11. H.S. Kim, P. Plubrai, Composites Part A. 35, 9 (2004)
1009-1015.
12. D. Rittel, Mater. Lett. 59, 14-15 (2005) 1845-1848.
13. D. Benderly, Y. Rezek, J. Zafran, D. Gorni, Polym.
Compos. 25 (2004) 229-236.
14. B. Song, W. Chen, T. Yanagita, D.J. Frew, Compos.
Struct. 67, 3 (2005) 279-287.
15. E. Rizzi, E. Papa, A. Corigliano, Int. J. Sol. Struct. 37, 40
(2000) 5773-5794.
16. N. Gupta, Kishore, E. Woldesenbet, S. Sankaran, J.
Mater. Sci. 36 (2001) 4485-4491.
17. P.K. Rohatgi, J.K. Kim, N. Gupta, S. Alaraj and A.
Daoud. Composites Part A, 37, 3 (2006) 430-437.
18. D.K. Balch, J.G. O’Dwyer, G.R. Davis, C.M. Cady, G.T.
Gray III, D.C. Dunand, Mater. Sci. Eng. A. 391, 1-2,
2005, 408-417.
19. L. Bardella, F. Genna, in: F.K. Ko, G.R. Palmese, Y.
Gogotsi, A.S.D. Wang (Eds.), Proceedings of 20th
Annual
Technical Conference of the American Society for
Composites, Philadelphia, PA, USA, DEStech
Publications, Lancaster, PA, 2005, paper #101.
20. E.M. Wouterson, F.Y.C. Boey, X. Hu, S.C. Wong,
Compos. Sci. Technol. 65 (2005) 1840-1850.
21. N. Gupta, E. Woldesenbet, Composites Part A. 35 (2004)
103-111.
22. Y.J. Huang, L. Vaikhanski and S.R. Nutt, Composites
Part A. 37, 3 (2006) 488-496.
23. M.V. Alonso, M.L. Auad, S.R. Nutt, Compos. Sci.
Technol. Corrected Proof, Available online 14 February
2006, doi:10.1016/j.compscitech.2005.12.016.
24. M.V. Alonso, M.L. Auad, S. Nutt, Composites Part A.
Corrected Proof, Available online 7 February 2006,
doi:10.1016/j.compositesa.2005.12.011.
25. C.S. Karthikeyan, S. Sankaran, M.N. Jagdish Kumar,
Kishore, J. Appl. Polym. Sci. 81, 2 (2001) 405-411.
26. N. Gupta, R. Maharsia, H.D. Jerro. Mater. Sci. Eng. A.
395 (2005) 233-240.
27. N. Gupta, R. Maharsia, Appl. Compos. Mater. 12 (2005)
247-261.
28. R. Maharsia, N. Gupta, H.D. Jerro, in: F.K. Ko, G.R.
Palmese, Y. Gogotsi, A.S.D. Wang (Eds.), Proceedings of
20th
Annual Technical Conference of the American
Society for Composites, Philadelphia, PA, USA, DEStech
Publications, Lancaster, PA, 2005, paper # 79.
29. Kishore, R. Shankar, S. Sankaran, Mater. Sci. Eng. A.
412, 1-2 (2005) 153-158.
30. V. Parameswaran, A. Shukla, J. Mater. Sci. 35 (2000) 21-
29.
31. V. Parameswaran, A. Shukla, Mech. Res. Commun. 29
(2002) 397-405.
32. M.A. El-Hadek, H.V. Tippur, Int. J. Sol. Struct. 40 (2003)
1885-1906.
33. C.E. Rousseau, H.V. Tippur, Eng. Fract. Mech. 69 (2002)
1679-1693.
34. N. Gupta, E. Woldesenbet, J. Cell. Plast. 40 (2004) 461-
480.
35. N. Gupta. Mater. Lett. Submitted, 2005.
36. M. Kiser, M.Y. He, F.W. Zok, Acta Mater. 47, 9 (1999)
2685-2694.
37. J.A. DeRuntz Jr., O. Hoffman, J Appl. Mech. 31 (1969)
551-557.
38. E. Woldesenbet, N. Gupta, A. Jadhav, J. Mater. Sci. 40,
15 (2005) 4009-4017.
39. M. Koopman, G. Gouadec, K. Carlisle, K.K. Chawla, G.
Gladysz. Scripta Mater. 50, 5 (2004) 593-596.
40. N. Gupta, in: N. Gupta and W. H. Hunt (Eds.),
Proceedings of Solidification Processing of Metal Matrix
Composites – The Rohatgi Honorary Symposium, TMS
Annual Meeting 2006, March 12-16, San Antonio, TX,
TMS Publications, Warrendale, PA, pp. 3-14.
41. B.D. Agarwal, L.J. Broutman, Analysis and Performance
of Fiber Composites, second ed., John Wiley, New York,
1990.
42. C271-99 Standard Test Method for Density of Sandwich
Core Materials. ASTM International, West
Conshohocken, PA, USA.
43. B. Song, W. Chen, D.J. Frew, J. Compos. Mater. 38
(2004) 915-936.
44. N. Gupta, E. Woldesenbet, Kishore, J. Mater. Sci., 37, 15
(2002) 3199-3209.
Copyright © 2022 FDOKUMEN