eco-functional benthic biodiversity assemblage patterns in the ...

1 23
Biodiversity and Conservation ISSN 0960-3115Volume 23Number 6 Biodivers Conserv (2014) 23:1469-1484DOI 10.1007/s10531-014-0677-7
Comparison of avian assemblage structuresin two upper montane forests of theCameroon volcanic line: lessons for birdconservation
Eric Djomo Nana, Ondřej Sedláček,Nicholas Bayly, Michal Ferenc, TomášAlbrecht, Jiří Reif, Francis Njie Motombi& David Hořák

1 23
Your article is protected by copyright and all
rights are held exclusively by Springer Science
+Business Media Dordrecht. This e-offprint
is for personal use only and shall not be self-
archived in electronic repositories. If you wish
to self-archive your article, please use the
accepted manuscript version for posting on
your own website. You may further deposit
the accepted manuscript version in any
repository, provided it is only made publicly
available 12 months after official publication
or later and provided acknowledgement is
given to the original source of publication
and a link is inserted to the published article
on Springer's website. The link must be
accompanied by the following text: "The final
publication is available at link.springer.com”.

ORI GIN AL PA PER
Comparison of avian assemblage structures in two uppermontane forests of the Cameroon volcanic line: lessonsfor bird conservation
Eric Djomo Nana • Ondrej Sedlacek • Nicholas Bayly •
Michal Ferenc • Tomas Albrecht • Jirı Reif •
Francis Njie Motombi • David Horak
Received: 31 July 2013 / Revised: 17 February 2014 / Accepted: 7 March 2014 /Published online: 22 March 2014� Springer Science+Business Media Dordrecht 2014
Abstract The Cameroon volcanic line montane forests host specific avian assemblages
with many endemic species. Such unique bird assemblages deserve adequate description
for proper protection. For this purpose, we sampled birds in the upper montane forests of
Mts Cameroon and Oku situated at *2,250 m. We combined point counts and continuous
observations to describe species composition and estimate densities of particular species.
In total, we recorded 106 species; 45 only on Mt Oku, 21 only on Mt Cameroon, and 40
common to both mountains. The higher species richness on Mt Oku was due to non-forest
Communicated by Alexander NG Kirschel.
Electronic supplementary material The online version of this article (doi:10.1007/s10531-014-0677-7)contains supplementary material, which is available to authorized users.
E. D. Nana � O. Sedlacek � M. Ferenc � D. Horak (&)Department of Ecology, Faculty of Science, Charles University in Prague, Prague, Czech Republice-mail: [email protected]
E. D. NanaIRTC—International Research and Training Center, Yaounde, Cameroon
N. BaylySELVA—Investigacion para la Conservacion en el Neotropico, Bogota, Colombia
T. AlbrechtDepartment of Zoology, Faculty of Science, Charles University in Prague, Prague, Czech Republic
T. AlbrechtInstitute of Vertebrate Biology v.v.i., Academy of Sciences of the Czech Republic, Brno,Czech Republic
J. ReifInstitute for Environmental Sciences, Charles University in Prague, Prague, Czech Republic
F. N. MotombiBotanic Garden, Limbe, Cameroon
123
Biodivers Conserv (2014) 23:1469–1484DOI 10.1007/s10531-014-0677-7
Author's personal copy
species that invade the forest interior due to recent human disturbance. Endemic species of
the Cameroon volcanic line and montane non-endemic species had higher abundances than
widespread species in general. As a result, we did not find a positive abundance–range-size
relationship for both locations. Our findings support a previously made observation that
montane species of the Cameroon volcanic line have higher densities compared to wide-
spread species. However, we also show that the structures of avian assemblages vary
between sites as species spatial turnover was lower on Mt Cameroon than on Mt Oku and
species common to both were more abundant on Mt Cameroon. This could be attributed to
the more pristine forest on Mt Cameroon, with higher annual rainfall but also due to lower
human impact and the existence of a continuous forest. Conservation action within the
broader landscape context is thus necessary to secure diverse montane forests in West-
Central Africa in the future.
Keywords Assemblage structure � Species richness � Abundance–range
size relationship � West-Central Africa � Range-restricted species
Introduction
Recent macroecological analyses of global geographical distribution of avian diversity
revealed that the patterns of species richness cannot be explained fully by climatic vari-
ation (Storch et al. 2006). Instead, the information about topographic relief should be
incorporated into the models to predict correctly the extraordinary high diversity in tropical
mountain regions (Rahbek and Graves 2000; Davies et al. 2007). It appears that tropical
mountains serve as generators of diversity and recent scientific efforts are focused on
understanding the mechanisms behind (Fjeldsa et al. 2012). Mountains close to the Equator
are exceptional not only in overall species richness of birds but also because of their
unusually high levels of endemism (Orme et al. 2005). Such species are of concern to
conservation biologists as they are highly vulnerable to extinction; for instance, due to
climate change (Malcolm et al. 2006). However, the peculiarity of tropical mountain
assemblages of birds is further accentuated by a specific and still poorly known abundance
structure.
Based on a few recent studies we know that species with tiny spatial distributions tend
to be very abundant locally where they occur (Reif et al. 2006; Romdal and Rahbek 2009;
Williams et al. 2009; Fjeldsa et al. 2010). This finding goes against one of the best-
documented general relationships in macroecology—the abundance range size relation-
ship, which assumes that the geographical range of species should positively correlate with
their local abundances (Brown 1984; Gaston and Blackburn 2000). To explain this phe-
nomenon, it has been suggested that tropical mountain endemics are phylogenetically old
species which are probably well specialized for local environmental conditions, and this
may enhance their resilience by maintaining high demographic connectivity throughout
their distributional ranges (Fjeldsa et al. 2012). However, we are still far from under-
standing the processes responsible for high abundances of endemic species. Limitations in
our current knowledge of the structure of avian assemblages in tropical mountain forests
remain because of the physically demanding field work in these areas and the limited
research effort in remote tropical regions in general. Besides, factors influencing com-
munity-wide patterns in tropical bird assemblages seem to be less predictable than those
1470 Biodivers Conserv (2014) 23:1469–1484
123
Author's personal copy
observed in northern temperate zones as marked differences are reported among sites (Karr
1976; Keast 1985), as well as at the same site from year to year (Brosset 1981; Stiles 1983).
This lack of knowledge hinders the formulation of hypotheses about maintenance and
origin of diversity in tropical mountain forests and also impedes the adoption of adequate
conservation actions.
From a global perspective, Afrotropical mountain forests deserve more attention as they
show high levels of spatial isolation and endemism resulting in unique assemblage
structures. Montane forest communities in Africa occur above 1,600 m a.s.l. (Thomas
1986; Smith et al. 2000, Wethered and Lawes 2003, 2005) and form the so-called Afro-
montane archipelago (White 1981; Grimshaw 2001; Taylor et al. 2012), as individual
forest blocks are separated from each other by surrounding lowlands. In West-Central
Africa this Afromontane archipelago mostly follows the Cameroon volcanic line including
Mt Cameroon and the islands of Bioko and Sao Tome (Scatena et al. 2010). The montane
forests here have some peculiar characteristics (cooler climate and higher humidity) that
clearly distinguish them from other tropical forests and are particularly rich, with high
numbers of endemic plant, bird, amphibian, reptile, mammal and insect species (Dowsett-
Lemaire and Dowsett 2000, unpubl. data). The Cameroon volcanic line is thus considered a
‘hotspot’ for biodiversity and endemism on a continental scale for a wide variety of taxa
(Fishpool and Evans 2001; Brooks and Thompson 2001). With respect to birds, it contains
28 restricted-range endemic species including the Mount Cameroon Francolin Francolinus
camerunensis, the Mount Cameroon Speirops Speirops melanocephalus and the Banner-
man’s Turaco Tauraco bannermani and ranks third for important bird areas in mainland
Africa in terms of restricted range species (after the Albertine Rift Mts and the Eastern Arc
Mts, Dowsett-Lemaire and Dowsett 2000).
The general objective of the present study is to provide information about the structure
of avian assemblages inhabiting afromontane forests at the same elevation but located on
different mountains. We carried out this study on the two highest peaks of the Cameroon
volcanic line—Mt Cameroon and Mt Oku. These two mountains are part of the same range
but at different positions, with Mt Cameroon located on the Atlantic coast and Mt Oku
further inland, which gives rise to different climates, land use histories and landscape
contexts. Therefore, we aim to enhance our incomplete knowledge of unique montane
communities but also provide a starting point for the clarification of the role of the large
scale landscape context in shaping the structure of local avian assemblages in the Cameron
volcanic line. Specifically, our goal is to: (i) describe species composition of two avian
montane assemblages and provide information about densities of their members, (ii) assess
the level of species spatial turnover between mountains, (iii) test for differences in species-
area relationships, and (iv) evaluate whether abundances of restricted range species are
higher than those of widespread ones which would have implications for nature
conservation.
Methods
Study areas
The study was performed in the forests of Mt Cameroon and Mt Oku in the Cameroon
volcanic line. Mt Cameroon, also known as Mt Fako, is one of Africa’s largest volcanoes
(4,095 m a.s.l.) that rises from lowland tropical rain forest at sea level and extends inland
from the gulf of Guinea in the bight of Biafra (DeLancey and DeLancey 2000). Mt Oku,
Biodivers Conserv (2014) 23:1469–1484 1471
123
Author's personal copy
also known as Kilum mountain, is located in the western highland plateau of Cameroon. It
is the second highest mountain in mainland West Africa and rises from grassland to
3,011 m a.s.l (Fiona et al. 2000).
The study areas were located on Mt Cameroon (4�08.670N 9�07.310E) at an altitude of
*2,250 m a.s.l and on Mt Oku (6�12.060N 10�31.030E) at an altitude of 2,240 m a.s.l. On
Mt Cameroon, field work was carried out in the upper montane forest interior close to
Mann’s spring, which is a natural spring situated at the border of the forest and montane
grassland, and on Mt Oku in the Kilum Ijim upper montane forest interior. Unbroken high-
montane forests stretch downhill from these sites, although their edges have been degraded
to varying degrees by fires invading from the savannah on Mt Cameroon and by small scale
human clearance for farming and cattle grazing on Mt Oku. On Mt Cameroon, average
rainfall at the foot of the mountain is up to 10,000 mm per year and falls to 2,000 mm per
year in the northeast portion of the massif (Payton 1993, unpubl. data). Its montane forest is
found at relatively low elevations, generally above 800 m, but on its seaward slope
montane trees appear as low as 500 m, possibly because of extensive cloud cover and
frequent mists (Graham et al. 2005). Important trees here include Schefflera abyssinica, S.
manni, Prunus africana and Podocarpus spp. Habitats also include montane Sporobolus
grasslands and Gnidia woodlands (Njabo 2006). Average annual rainfall is over 2,400 mm
per year (Forboseh et al. 2003) in the Kilum Ijim forest on Mt Oku and the canopy of the
forest is unusually open. Important trees throughout include Carapa procera, S. abyssinica,
S. manni, Syzygium guineense bamendae and P. africana. There is extensive Arundinaria
bamboo forest above 2,600 m (Njabo 2006).
Bird sampling
Fieldwork was carried out during the dry season on both mountains. On Mt Cameroon, we
performed the fieldwork at the beginning of the dry season as well as at the turn of dry and
wet seasons in November 2011 (OS, DH, TA, MF, EDN) and February 2004 (NB, FNM),
respectively. On Mt Oku, we sampled birds at the beginning of the dry season in November
2008 (OS, DH, JR, TA). These periods correspond to the breeding season of the majority of
birds in the montane forests of the Cameroon volcanic line (Serle 1981; Tye 1986). During
field surveys we always employed two methodological approaches: point counts and
random walks. We used these two methods to maximize detection of birds in the dense
forest and estimate abundances precisely. For point counts we established a line transect
with a random starting point containing 16 census points within the forests interior on both
mountains (only 15 points were established in 2004 on Mt Cameroon and point locations
were different from those in 2011). The distance between neighbouring points was 150 m
which is enough to avoid counting the same individual twice (Huff et al. 2000). We
conducted three visits to each census point recording all birds (both visually and acous-
tically) within a 50 m radius for 15 min. For further analyses we used information about
the maximum number of species for all three visits recorded at particular points and the
maximum estimated number of individuals per species for density estimates. We believe
that abundance estimates for particular species are adequate for inter-specific comparisons
(cf. Raman 2003). We therefore decided to use a narrow fixed radius (50 m) in which the
detectability for all species was almost the same (Reif et al. 2006). We performed all visits
during morning hours (between 06:00 and 10:00), changing the order of points visited to
factor out the effect of daytime.
We also recorded all birds heard or seen both during the day and at night during the
entire duration at Mann’s spring (1 week in 2004 and 2011, respectively) and on Mt Oku
1472 Biodivers Conserv (2014) 23:1469–1484
123
Author's personal copy
(2 weeks in 2008) through random walks. Species detected through random walks were
added to those detected through point counts and that constituted our checklist. Note that
the abundance information and all the analyses (except for overall species counts) are
based on data collected during point counts only.
Data analysis
In order to describe the structure of local avian assemblages, we employed fundamental
macroecological analytical tools such as abundance–range size relationship (hereafter
ARSR) and species-area relationship (hereafter SAR); two important tools for determining
the minimum area for biodiversity conservation. The ARSR is based on the prediction that
local abundances of particular species are related to their geographical ranges (Gregory and
Gaston 2000). The SAR is simply the observation that the number of species in a region is a
positive function of the area of the region and gives information on species turnover (Storch
et al. 2012), as well as enabling the prediction of the expected loss of species richness from a
region undergoing specified levels of area reduction (habitat loss) (Connor and McCoy 2001).
For analyses, we classified species according to their geographical ranges and conservation
status using the information available on the Birdlife International website (BirdLife Inter-
national 2012) and cross-checked the distributional data with maps from Sinclair and Ryan
(2003). We also classified the species according to diet type (see supplementary material):
(i) invertebrate feeders (feeding mainly but not exclusively on invertebrates), (ii) frugivorous
species (feeding mainly but not exclusively on fruits), (iii) nectarivorous species (feeding
mainly but not exclusively on nectar), (iv) carnivorous species (feeding mainly but not
exclusively on small vertebrates), (v) granivorous species (feeding mainly but not exclusively
on seeds), and (vi) mixed diet species based on information from the Birds of Africa (Fry and
Keith 2004). Moreover, we sorted all species into three categories of range-size according to
Reif et al. (2006): (i) species endemic to the Cameroon volcanic line (hereafter ED), (ii)
montane species not endemic to the Cameroon volcanic line (hereafter MR), (iii) species
widespread throughout Africa (hereafter WD). Species with ranges at elevations mostly above
1,600 m a.s.l were considered to be montane species (Graham et al. 2005).
Data analyses were done in STATISTICA 6.0 software and R 2.15.2. (R Development
Core Team 2012) and we employed only common statistical procedures such as linear
regression and analysis of variance. We used species abundances as the response variables
and range sizes as categorical predictor. We used non-parametric alternatives of the tests
when data did not fit a normal distribution. For data analyses of species densities and
ARSR, we excluded aerial feeders and raptors because of the probability of counting the
same individual at more than one census point. For a better illustration of the ARSR we
used a variable called ‘Abundance–Range Size Ranking Difference’ (Reif et al. 2006).
Species were ordered according to abundance and range-size respectively and if a positive
ARSR is assumed, the abundance rank for a particular species will correspond to its range-
size rank. We then calculated the difference between the two rankings for each species.
The absolute value of the difference shows the degree of deviation from positive ARSR,
while its sign indicates whether the species abundance is higher or lower than expected by
range size (Reif et al. 2006). We used the SAR to estimate the species turnover along our
point count transects. It was computed by sampling points along the transect (one to
sixteen) in order to estimate how the number of species increases with an increase in area
represented by the number of points summed. While calculating SAR we summed species
numbers for all possible sets of adjacent points (pairs, triples, quadruples etc.) and then
calculated an average number of species per point, pair of points, trio of points etc. This
Biodivers Conserv (2014) 23:1469–1484 1473
123
Author's personal copy
procedure enabled us to determine the similarity of species diversity on both mountains.
We calculated Sørensen’s similarity coefficient b for comparing the similarity of two
samples (see Eq. 1 below). This is a simple measure of species turnover, ranging from a
value of 0 where there is no species overlap between the assemblages, to a value of 1 when
exactly the same species are found in both assemblages used for comparing.
b ¼ 2C=S1þ S2 ð1Þ
where S1 is the total number of species recorded in the first assemblage, S2 is the total
number of species recorded in the second assemblage, and C is the number of species
common to both assemblages.
Results
Overall description
In total, we recorded 16 species endemic to the Cameroon volcanic line, 17 non-endemic
Afrotropical montane species, and 73 widespread species to give a total of 106 species
belonging to 42 families for both study sites. Twenty one species were detected only on Mt
Cameroon, 45 only on Mt Oku and 40 on both mountains. Fifty species were detected
through point counts on both mountains and the rest through random walks. Both sources
of information were added together to make up the checklist. All 106 species recorded
were made up of 48 invertebrate feeders, 14 frugivores, three nectarivores, 16 carnivores,
nine granivores and 16 mixed diet species (see Table S1).
Mt Cameroon
In total, we found 61 species on Mt Cameroon (Table 1). In 2004 we had 46 species of which
36 were found in 2011. In 2011 we had 51 species of which 15 were not found in 2004. The
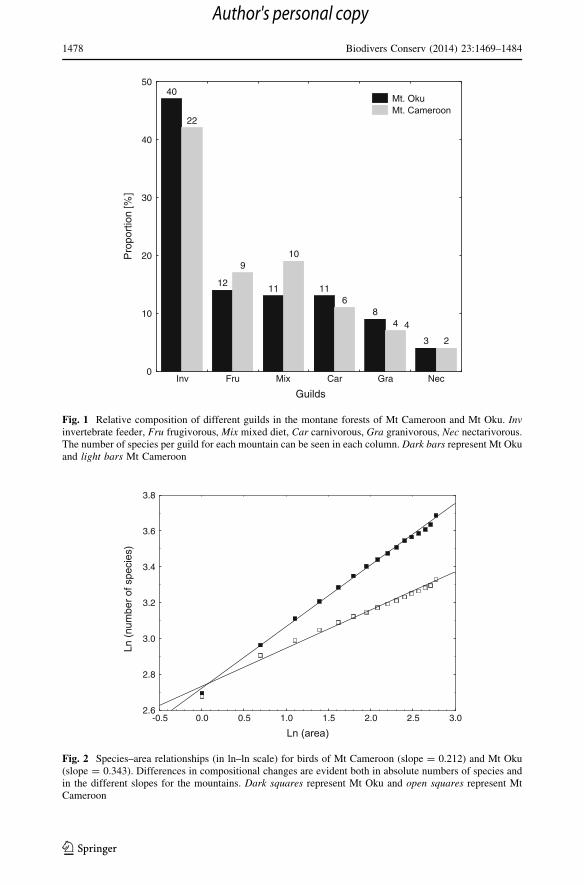
highest number of species (23) belonged to the guild of invertebrate feeders (Fig. 1).
There was no significant difference in the average abundances of species common to
both years, paired t test: t = 1.05, df = 20, P = 0.307 (Table 1). The overall number of
individuals of all species detected during point counts was 462 individuals in 2011 and 458
in 2004. The number of species was a positive function of the area indicating that species
numbers increased with area sampled as shown by SAR (to be comparable with Mt Oku,
analysis includes only point count data from 2011; Fig. 2). The most abundant species
were the Western Mountain Greenbul Andropadus tephrolaemus (ED) (68 individuals in
2004 and 61 in 2011), the Northern Double-Collared Sunbird Cinnyris reichenowi (MR)
(46 in 2004 and 58 in 2011) and the African Hill Babbler Pseudoalcippe abyssinica (MR)
(35 in 2004 and 35 in 2011). These species also had the highest occupancies, being present
at all points (Table 1). For further calculations we used information about abundances from
point counts done in 2011 only as those were performed at the beginning of dry season and
thus are comparable with Mt Oku. Differences in the average abundances among species
groups as classified according to range size were not significant (ANOVA: F2,23 = 0.535,
P = 0.593, Fig. 3a). The pattern of ARSR showed negative trend but it was not statisti-
cally significant (Pearson coefficient = -0.334, n = 26, P = 0.09). However, the abun-
dance–range size ranking difference showed significant differences among groups,
1474 Biodivers Conserv (2014) 23:1469–1484
123
Author's personal copy
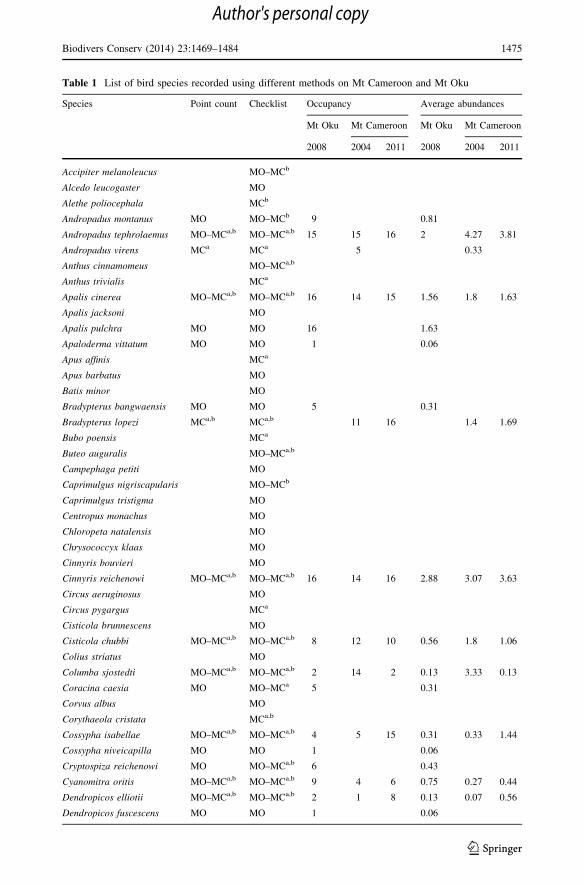
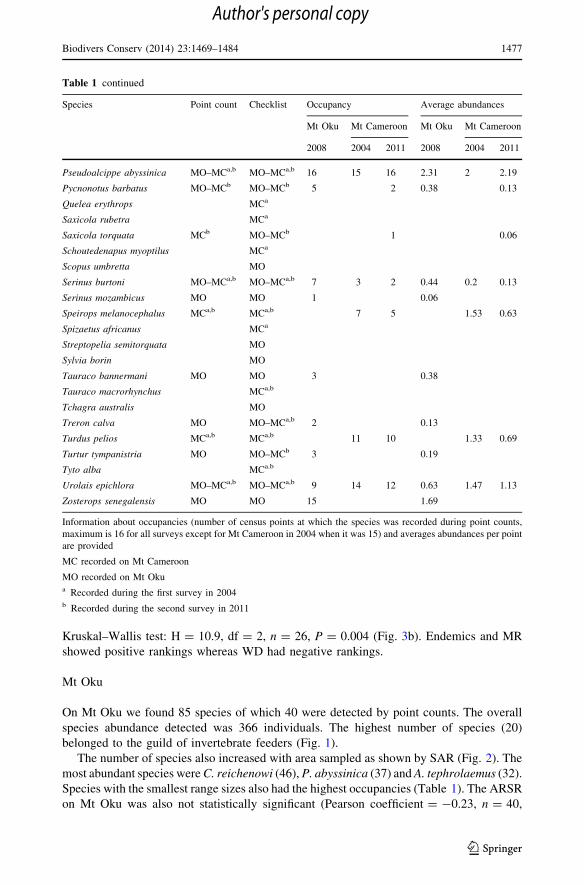
Table 1 List of bird species recorded using different methods on Mt Cameroon and Mt Oku
Species Point count Checklist Occupancy Average abundances
Mt Oku Mt Cameroon Mt Oku Mt Cameroon
2008 2004 2011 2008 2004 2011
Accipiter melanoleucus MO–MCb
Alcedo leucogaster MO
Alethe poliocephala MCb
Andropadus montanus MO MO–MCb 9 0.81
Andropadus tephrolaemus MO–MCa,b MO–MCa,b 15 15 16 2 4.27 3.81
Andropadus virens MCa MCa 5 0.33
Anthus cinnamomeus MO–MCa,b
Anthus trivialis MCa
Apalis cinerea MO–MCa,b MO–MCa,b 16 14 15 1.56 1.8 1.63
Apalis jacksoni MO
Apalis pulchra MO MO 16 1.63
Apaloderma vittatum MO MO 1 0.06
Apus affinis MCa
Apus barbatus MO
Batis minor MO
Bradypterus bangwaensis MO MO 5 0.31
Bradypterus lopezi MCa,b MCa,b 11 16 1.4 1.69
Bubo poensis MCa
Buteo auguralis MO–MCa,b
Campephaga petiti MO
Caprimulgus nigriscapularis MO–MCb
Caprimulgus tristigma MO
Centropus monachus MO
Chloropeta natalensis MO
Chrysococcyx klaas MO
Cinnyris bouvieri MO
Cinnyris reichenowi MO–MCa,b MO–MCa,b 16 14 16 2.88 3.07 3.63
Circus aeruginosus MO
Circus pygargus MCa
Cisticola brunnescens MO
Cisticola chubbi MO–MCa,b MO–MCa,b 8 12 10 0.56 1.8 1.06
Colius striatus MO
Columba sjostedti MO–MCa,b MO–MCa,b 2 14 2 0.13 3.33 0.13
Coracina caesia MO MO–MCa 5 0.31
Corvus albus MO
Corythaeola cristata MCa,b
Cossypha isabellae MO–MCa,b MO–MCa,b 4 5 15 0.31 0.33 1.44
Cossypha niveicapilla MO MO 1 0.06
Cryptospiza reichenowi MO MO–MCa,b 6 0.43
Cyanomitra oritis MO–MCa,b MO–MCa,b 9 4 6 0.75 0.27 0.44
Dendropicos elliotii MO–MCa,b MO–MCa,b 2 1 8 0.13 0.07 0.56
Dendropicos fuscescens MO MO 1 0.06
Biodivers Conserv (2014) 23:1469–1484 1475
123
Author's personal copy
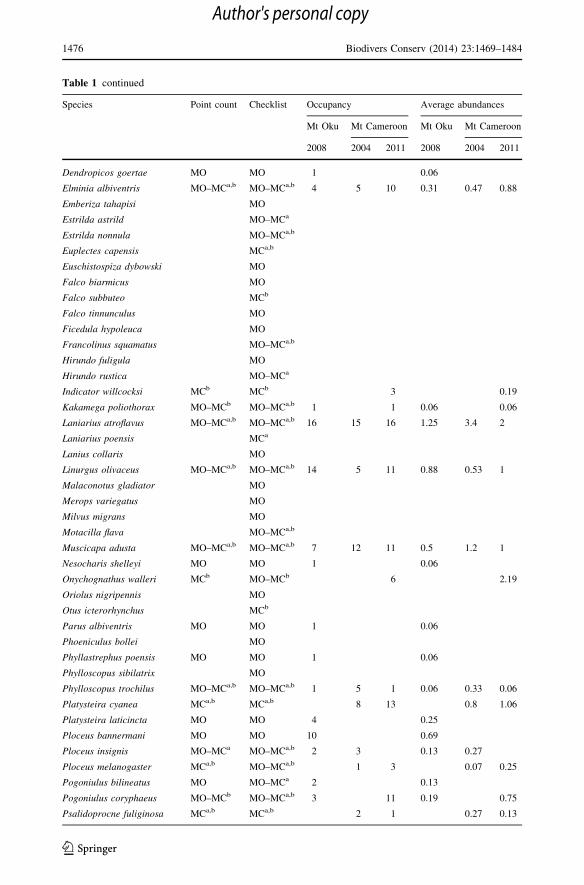
Table 1 continued
Species Point count Checklist Occupancy Average abundances
Mt Oku Mt Cameroon Mt Oku Mt Cameroon
2008 2004 2011 2008 2004 2011
Dendropicos goertae MO MO 1 0.06
Elminia albiventris MO–MCa,b MO–MCa,b 4 5 10 0.31 0.47 0.88
Emberiza tahapisi MO
Estrilda astrild MO–MCa
Estrilda nonnula MO–MCa,b
Euplectes capensis MCa,b
Euschistospiza dybowski MO
Falco biarmicus MO
Falco subbuteo MCb
Falco tinnunculus MO
Ficedula hypoleuca MO
Francolinus squamatus MO–MCa,b
Hirundo fuligula MO
Hirundo rustica MO–MCa
Indicator willcocksi MCb MCb 3 0.19
Kakamega poliothorax MO–MCb MO–MCa,b 1 1 0.06 0.06
Laniarius atroflavus MO–MCa,b MO–MCa,b 16 15 16 1.25 3.4 2
Laniarius poensis MCa
Lanius collaris MO
Linurgus olivaceus MO–MCa,b MO–MCa,b 14 5 11 0.88 0.53 1
Malaconotus gladiator MO
Merops variegatus MO
Milvus migrans MO
Motacilla flava MO–MCa,b
Muscicapa adusta MO–MCa,b MO–MCa,b 7 12 11 0.5 1.2 1
Nesocharis shelleyi MO MO 1 0.06
Onychognathus walleri MCb MO–MCb 6 2.19
Oriolus nigripennis MO
Otus icterorhynchus MCb
Parus albiventris MO MO 1 0.06
Phoeniculus bollei MO
Phyllastrephus poensis MO MO 1 0.06
Phylloscopus sibilatrix MO
Phylloscopus trochilus MO–MCa,b MO–MCa,b 1 5 1 0.06 0.33 0.06
Platysteira cyanea MCa,b MCa,b 8 13 0.8 1.06
Platysteira laticincta MO MO 4 0.25
Ploceus bannermani MO MO 10 0.69
Ploceus insignis MO–MCa MO–MCa,b 2 3 0.13 0.27
Ploceus melanogaster MCa,b MO–MCa,b 1 3 0.07 0.25
Pogoniulus bilineatus MO MO–MCa 2 0.13
Pogoniulus coryphaeus MO–MCb MO–MCa,b 3 11 0.19 0.75
Psalidoprocne fuliginosa MCa,b MCa,b 2 1 0.27 0.13
1476 Biodivers Conserv (2014) 23:1469–1484
123
Author's personal copy
Kruskal–Wallis test: H = 10.9, df = 2, n = 26, P = 0.004 (Fig. 3b). Endemics and MR
showed positive rankings whereas WD had negative rankings.
Mt Oku
On Mt Oku we found 85 species of which 40 were detected by point counts. The overall
species abundance detected was 366 individuals. The highest number of species (20)
belonged to the guild of invertebrate feeders (Fig. 1).
The number of species also increased with area sampled as shown by SAR (Fig. 2). The
most abundant species were C. reichenowi (46), P. abyssinica (37) and A. tephrolaemus (32).
Species with the smallest range sizes also had the highest occupancies (Table 1). The ARSR
on Mt Oku was also not statistically significant (Pearson coefficient = -0.23, n = 40,
Table 1 continued
Species Point count Checklist Occupancy Average abundances
Mt Oku Mt Cameroon Mt Oku Mt Cameroon
2008 2004 2011 2008 2004 2011
Pseudoalcippe abyssinica MO–MCa,b MO–MCa,b 16 15 16 2.31 2 2.19
Pycnonotus barbatus MO–MCb MO–MCb 5 2 0.38 0.13
Quelea erythrops MCa
Saxicola rubetra MCa
Saxicola torquata MCb MO–MCb 1 0.06
Schoutedenapus myoptilus MCa
Scopus umbretta MO
Serinus burtoni MO–MCa,b MO–MCa,b 7 3 2 0.44 0.2 0.13
Serinus mozambicus MO MO 1 0.06
Speirops melanocephalus MCa,b MCa,b 7 5 1.53 0.63
Spizaetus africanus MCa
Streptopelia semitorquata MO
Sylvia borin MO
Tauraco bannermani MO MO 3 0.38
Tauraco macrorhynchus MCa,b
Tchagra australis MO
Treron calva MO MO–MCa,b 2 0.13
Turdus pelios MCa,b MCa,b 11 10 1.33 0.69
Turtur tympanistria MO MO–MCb 3 0.19
Tyto alba MCa.b
Urolais epichlora MO–MCa,b MO–MCa,b 9 14 12 0.63 1.47 1.13
Zosterops senegalensis MO MO 15 1.69
Information about occupancies (number of census points at which the species was recorded during point counts,
maximum is 16 for all surveys except for Mt Cameroon in 2004 when it was 15) and averages abundances per point
are provided
MC recorded on Mt Cameroon
MO recorded on Mt Okua Recorded during the first survey in 2004b Recorded during the second survey in 2011
Biodivers Conserv (2014) 23:1469–1484 1477
123
Author's personal copy
Mt. Oku40
1211 11
8
3
22
910
6
4
2
Inv Fru Mix Car Gra Nec
Guilds
0
10
20
30
40
50
Pro
port
ion
[%]
4
Fig. 1 Relative composition of different guilds in the montane forests of Mt Cameroon and Mt Oku. Invinvertebrate feeder, Fru frugivorous, Mix mixed diet, Car carnivorous, Gra granivorous, Nec nectarivorous.The number of species per guild for each mountain can be seen in each column. Dark bars represent Mt Okuand light bars Mt Cameroon
-0.5 0.0 0.5 1.0 1.5 2.0 2.5 3.02.6
2.8
3.0
3.2
3.4
3.6
3.8
Ln(n
umbe
rof
spec
ies)
Fig. 2 Species–area relationships (in ln–ln scale) for birds of Mt Cameroon (slope = 0.212) and Mt Oku(slope = 0.343). Differences in compositional changes are evident both in absolute numbers of species andin the different slopes for the mountains. Dark squares represent Mt Oku and open squares represent MtCameroon
1478 Biodivers Conserv (2014) 23:1469–1484
123
Author's personal copy
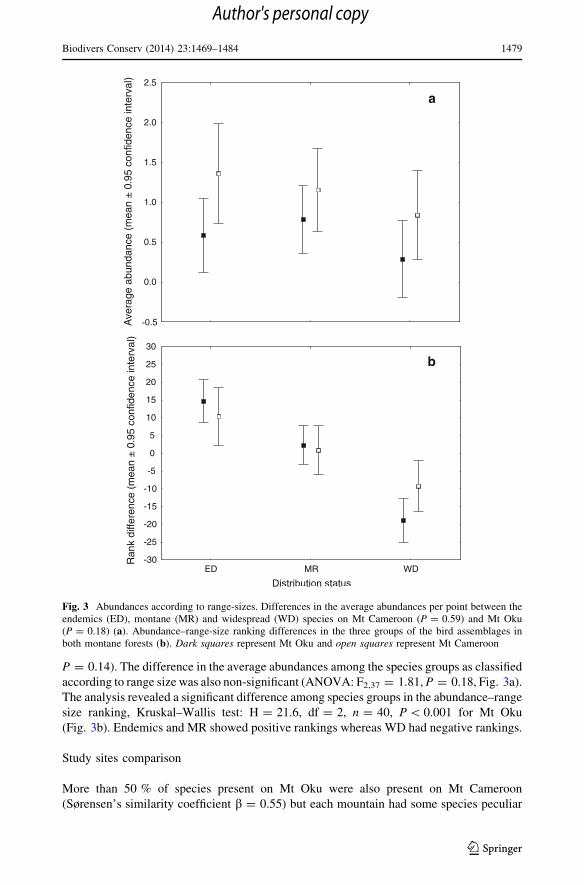
P = 0.14). The difference in the average abundances among the species groups as classified
according to range size was also non-significant (ANOVA: F2,37 = 1.81, P = 0.18, Fig. 3a).
The analysis revealed a significant difference among species groups in the abundance–range
size ranking, Kruskal–Wallis test: H = 21.6, df = 2, n = 40, P \ 0.001 for Mt Oku
(Fig. 3b). Endemics and MR showed positive rankings whereas WD had negative rankings.
Study sites comparison
More than 50 % of species present on Mt Oku were also present on Mt Cameroon
(Sørensen’s similarity coefficient b = 0.55) but each mountain had some species peculiar
0.0
0.5
1.0
1.5
2.0
2.5
Ave
rage
abun
danc
e(m
ean
±0.
95co
nfid
ence
inte
rval
)
a
ED MR WD-30
-25
-20
-15
-10
-5
0
5
10
15
20
25
30
Ran
kdi
ffere
nce
(mea
n±
0.95
conf
iden
cein
terv
al)
b
Fig. 3 Abundances according to range-sizes. Differences in the average abundances per point between theendemics (ED), montane (MR) and widespread (WD) species on Mt Cameroon (P = 0.59) and Mt Oku(P = 0.18) (a). Abundance–range-size ranking differences in the three groups of the bird assemblages inboth montane forests (b). Dark squares represent Mt Oku and open squares represent Mt Cameroon
Biodivers Conserv (2014) 23:1469–1484 1479
123
Author's personal copy

to it. On Mt Cameroon these were: S. melanocephalus, Mountain Saw-Wing Psalidoprocne
fuliginosa and Cameroon Scrub-Warbler Bradypterus lopezi, while on Mt Oku these were
T. bannermani, Bangwa Forest Warbler Bradypterus bangwaensis, Black-collared Apalis
Apalis pulchra, White-headed Wood Hoopoe Phoeniculus bollei and the Banded Wattle-
eye Platysteira laticincta amongst others (Table 1). Both mountains had similar assem-
blage structure with approximately the same number of species per guild except for the
invertebrate feeders that were almost twice as numerous on Mt Oku as on Mt Cameroon
(Fig. 1).
Species spatial turnover was higher on Mt Oku than on Mt Cameroon (Fig. 2). There
was a significant difference in abundances of particular species common to both mountains
(paired t test: t = 2.85, df = 18, P = 0.010) being higher on Mt Cameroon.
Discussion
We recorded a total of 106 bird species, 21 only on Mt Cameroon, 45 only on Mt Oku and
40 common to both mountains. Mt Cameroon had a higher proportion of endemic species
than Mt Oku while Mt Oku had a higher number of WD species than Mt Cameroon. Our
results indicate that, even though the field effort was comparable between sites, the total
number of species detected on Mt Oku was higher when compared to Mt Cameroon but the
species abundances were higher on Mt Cameroon than on Mt Oku. On both mountains,
restricted-range species had higher abundances than widespread species and species
turnover was higher for the mountain situated in the mosaic landscape than for that found
surrounded by pristine forest. This is somewhat counter intuitive as the type of forest is the
same for both sites. We suggest four possible explanations for the difference in number of
species between the mountains. First, the different geographical locations of the mountains
are responsible, with the local bird assemblages potentially reflecting different species
pools. The difference in species pool could also be caused by the location of Mt Oku within
the savannah, and as a result, savannah species which are mostly WD enrich its bird
assemblage. Second, the lower species richness on Mt Cameroon might be a result of its
geographical isolation as the theory of island biogeography would predict (MacArthur and
Wilson 1967). Indeed, geographically outlying mountains like Mt Cameroon generally
have a different species composition to those like Mt Oku which are connected to
mountains in the main massif (Graham et al. 2005). According to the theory, possible
mechanisms behind might be related to lower probability of colonisation of an isolated
mountain by new species, higher rates of extinction, or evolution of independent evolu-
tionary lineages. The third explanation includes differences in climatic conditions between
sites. As mentioned above, Mt Cameroon located by the sea has a relatively humid and
warm climate while Mt Oku situated inland is cooler and drier. Such conditions can
theoretically support different number of species but based on published information one
would expect the opposite relationship between relative humidity and species richness than
that observed here (Graham et al. 2005). The final explanation relates to the broader
landscape context of the two mountains. In our opinion the landscape composition sur-
rounding the mountains under study is crucial to explaining the observed differences. Mt
Cameroon rises from lowland forest and thus its montane forest at upper elevations is
surrounded by a lowland forest belt. Therefore, the probability that non-forest species
(usually widespread and generalist species) enter the montane forest interior is low. The
opposite situation can be found on Mt Oku where the forest patch is surrounded by a
savannah matrix and human settlements and non-forest generalist species can easily invade
1480 Biodivers Conserv (2014) 23:1469–1484
123
Author's personal copy
montane forest community. This explanation is supported by data presented here as the
difference in species richness between the mountains is mostly due to widespread species
common on Mt Oku. In conservation efforts, species richness is frequently used as a
measure of environmental quality (Sodhi and Ehrlich 2010). In this case, we show that
locally high species richness might be a result of habitat degradation or large scale frag-
mentation and the presence of restricted-range species is then a more reliable clue for
evaluating the conservation importance of a locality.
Our analysis did not suggest any differences in utilization of food resources by birds
between the study sites. Invertebrate feeders were the most abundant guild for both forests
and this finding is in congruence with information published for lowland forests in
Cameroon (De-Iongh and Van Weerd 2006).
Besides the overall number of species, we endeavoured to estimate spatial turnover in
species richness (b-diversity) using point count data. We found that the slope of SAR was
higher on Mt Oku than on Mt Cameroon suggesting higher species turnover among points
on the first mountain. The higher species turnover observed on Mt Oku could be related to
several attributes of the local montane forest community as it has been shown that high
species turnover is connected to high habitat heterogeneity (e.g. McKnight et al. 2007;
Jankowski et al. 2009). The structure of the forest itself is quite similar on both mountains,
however, the entire forest environment seems to be more heterogeneous on Mt Oku. Due to
a number of human activities, the Mt Oku forest environment is more frequently broken by
edge habitats, pathways or even pastures. Although birds were counted in the forest interior
only, the local presence of individual species might be affected by larger scale effects. As a
result, some forest interior points may not be suitable for some forest specialist species.
Alternatively, non-forest specialists common in the surrounding savannah and agricultural
landscape (Fotso 2001) might invade the margins of montane forest interior and thus
influence the composition of forest avian assemblages (Forboseh et al. 2003; but see Horak
et al. 2010). The relative area of true interior forest can be limited when the forest block is
surrounded by non-forests environments which can again influence populations of true
forest specialists. In contrast, Mt Cameroon’s montane forest is surrounded by pristine
mid-elevation forest and lowland forest (Ekobo 2003), which protects the montane
assemblages from open landscape effects.
We found that Mt Cameroon montane forest hosts both higher overall abundances and a
higher number of individuals per species for species common to both mountains. The
differences in abundances of birds between the mountains may therefore tell us something
about habitat suitability and thus be of importance to conservation science (Sodhi and
Ehrlich 2010). Our results indicate that Mt Cameroon forest can support more individuals
per species. We have two possible but not mutually exclusive explanations for this
observation. First, it can reflect differences in resource availability between the mountains.
Higher temperature and rainfall on Mt Cameroon could enhance resource availability via
increased primary productivity (Graham et al. 2005), which could in turn support more
individuals. Second, the montane forest on Mt Cameroon is part of a forest block forming a
vast area of suitable habitats for forest species. The lower abundances of birds inhabiting
the montane forest on Mt Oku might therefore be associated with higher levels of habitat
degradation at a large spatial scale and could indicate that the montane forest on Mt Oku is
of lower quality from an avian point of view.
In order to focus on restricted-range species, we divided birds into three categories
depending on their geographical distribution. Similar to our previous study performed in
the montane forest mosaic in the Bamenda highlands (Reif et al. 2006), we found that
endemics to the Cameroon volcanic line and montane restricted non-endemics are more
Biodivers Conserv (2014) 23:1469–1484 1481
123
Author's personal copy
abundant than widespread species. Other studies reports similar observation from other
African mountains. Sekercioglu and Riley (2005) found that endemic species are among
the most abundant in the Kumbira Forest in the Angola Escarpment. Similarly, endemic
and non-endemic montane species had higher counts than widespread species on the
Namuli Massif in northern Mozambique (Ryan et al. 1999). Also Owiunji et al. (2005)
reported high detection rates of endemic species in montane forest environments in the
Albertine Rift, where endemic species form a substantial part of bird assemblages at
elevations between 2,100 and 2,600 m a.s.l. Finally, Fjeldsa and Rabøl (1995) and Fjeldsa
(1999) found that endemic species of the Eastern Arc Mountains are more abundant than
widespread species in the mature montane forest. It follows that high local abundances of
restricted-range species is quite common and even ubiquitous in Afromontane regions.
Our results have serious implications for nature conservationists. We found that scarce
remnants of upper montane forests on two of the highest peaks in the Cameroon volcanic
line still host a high diversity of restricted-range bird species confined to West-Central
Africa. Moreover, members of local avian assemblages can be found in relatively high
numbers and this is possibly related to their long term adaptations to the local environment.
There are, however, two threatening facts that seem to neutralize this relatively positive
information about African birds. First, we found considerable differences in avian
assemblage compositions between the study sites suggesting that montane forest of the
same mountain range can differ substantially. Second, although our results show that
abundances of range-restricted species are still relatively high in the montane forests of the
Cameroon volcanic line, significant differences can be found between locations. We
believe that these differences can be attributed to landscape scale effects especially to
different levels of habitat degradation and fragmentation on the mountains. More con-
servation efforts are needed in the montane forests of the Cameroon volcanic line to save
the last remnants of this unique environment. In addition, more information from other
montane forest sites could help to elucidate spatial variation in montane forest bird
assemblages. Such data would allow for a proper understanding of the mechanisms leading
to observed differences and enable the adoption of appropriate conservation actions.
Acknowledgments We wish to thank the communities of Bokwango, Bakingili and Oku villages for theirsupport during field work by providing us with field guides and porters to go up the mountains. We aregrateful to Francis, Nathaniel and Collins in particular for their kind reception in the Bokwango village. Wethank the Department of Environmental Sciences of the University of Buea, Cameroon and in particular EricFokam, Philip Tem Dia and Bertilla Sirri for their assistance during the field work. We also thank KevinNjabo and the IRTC of the UCLA in Yaounde for their technical support. Ernest Vunan, David Storch andMartin Mikes helped us with data collection. Arnost L. Sizling provided kind assistance with SAR calcu-lation. This study was performed with the authorisation number: 2309/PRBS/MINFOF/SG/DFAP/SDVEF/SC of the Ministry of Forestry and Wildlife of the Republic of Cameroon and with the support of MtCameroon NP authorities. The research was funded by the Czech Science Foundation (project no. P505/11/1617).
References
BirdLife International (2012). http://www.birdlife.org/datazone. Accessed 01 Oct 2012Brooks T, Thompson HS (2001) Current bird conservation issues in Africa. Auk 118:575–582Brosset A (1981) La periodicite de la reproduction chez le Bulbul de foret equatoriale africaine Andropadus
latirostis. Ses indeces demographiques [Reproductive periodicity of A. latirostris, an African equa-torial forest Bulbul. Its demographique indices]. Revue d’Ecologie (Terre Vie) 35:109–129
Brown JH (1984) On the relationship between abundance and distribution of species. Am Nat 124:255–279
1482 Biodivers Conserv (2014) 23:1469–1484
123
Author's personal copy
Connor EF, McCoy ED (2001) Species–area relationships. Encycl Biodivers 5:397–411Davies RG, Orme CDL, Storch D, Olson VA, Thomas GH, Ross SG, Ding T, Rasmussen PC, Bennett PM,
Owens IPF, Blackburn TM, Gaston KJ (2007) Topography, energy and the global distribution of birdspecies richness. Proc R Soc Lond B 274:1189–1197
De-Iongh HH, Van Weerd M (2006) The use of avian guilds for the monitoring of tropical forest disturbanceby logging. Tropenbos Document 17. Wageningen, The Netherlands
Delancey MW, Delancey MD (2000) Historical dictionary of the Republic of Cameroon, 3rd edn. TheScarecrow Press, Lanham
Dowsett-Lemaire F, Dowsett RJ (2000) Further biological surveys of Manenguba and Central Bakossi inMarch 2000, and an evaluation of the conservation importance of Manenguba, Bakossi, Kupe andNlonako Mts, with special reference to birds. Unpublished report for WWF-Cameroon
Ekobo A (2003) Survey of large mammals in the Mount Cameroon forest. Final report for WWF CoastalForests Programme
Fiona GM, Cheek M, Wild C (2000) Rare plants on Mount Oku summit, Cameroon. Oryx 34:136–140Fishpool LDC, Evans MI (2001) Important bird areas in Africa and associated islands: priority sites for
conservation. BirdLife Conservation series no 11. Pisces Publications and BirdLife International,Newbury and Cambridge, UK
Fjeldsa J (1999) The impact of human forest disturbance on the endemic avifauna of the UdzungwaMountains, Tanzania. Bird Conserv Int 9:47–62
Fjeldsa J, Rabøl J (1995) Variation in avian communities between isolated units of the Eastern Arc montaneforests, Tanzania. Le Gerfaut 85:3–18
Fjeldsa J, Kiure J, Doggart N, Hansen LA, Perkin AW (2010) Distribution of highland forest birds across apotential dispersal barrier in the Eastern Arc Mountains of Tanzania. Steenstrupia 32:1–43
Fjeldsa J, Bowie RCK, Rahbek C (2012) The role of mountain ranges in the diversification of birds. AnnuRev Ecol Evol Syst 43:249–265
Forboseh PF, Keming EC, Toh CL, Wultof INB (2003) Monitoring of Kilum-Ijim forest bird communities:initial findings. Bird Conserv Int 13:255–271
Fotso RC (2001) A contribution to the ornithology of Mount Oku forest, Cameroon. Malimbus 23:1–12Fry CH, Keith S (eds) (2004) The birds of Africa. Christopher Helm, LondonGaston KJ, Blackburn TM (2000) Pattern and process in macroecology. Blackwell, OxfordGraham CH, Smith TB, Languy M (2005) Current and historical factors influencing patterns of species
richness and turnover of birds in the Gulf of Guinea highlands. J Biogeogr 32:1371–1384Gregory RD, Gaston KJ (2000) Explanations of commonness and rarity in British breeding birds: separating
resource use and resource availability. Oikos 88:515–526Grimshaw JM (2001) What do we really know about the Afromontane archipelago? Syst Geogr Pl
71:949–957Horak D, Sedlacek O, Reif J, Riegert J, Pesata M (2010) When savannah encroaches on the forest:
thresholds in bird–habitat associations in the Bamenda Highlands, Cameroon. Afr J Ecol 48:822–827Huff MH, Bettinger KA, Ferguson HL, Brown MJ, Altman B (2000) A habitat-based point-count protocol
for terrestrial birds, emphasizing Washington and Oregon. USDA Gen. Tech Rep PNW-GTR-501Jankowski JE, Ciecka AL, Meyer NY, Rabenold KN (2009) Beta diversity along environmental gradients:
implications of habitat specialization in tropical montane landscapes. J Anim Ecol 78:315–327Karr JR (1976) Seasonality, resource availability and community diversity of neotropical birds. Am Nat
110:973–994Keast A (1985) Tropical rainforest avifaunas: an introductory conspectus. ICBP Tech Publ 4:3–31MacArthur RH, Wilson EO (1967) The Theory of Island Biogeography. Princeton University Press,
PrincetonMalcolm JR, Liu C, Neilson RP, Hansen L, Hannah L (2006) Global warming and extinctions of endemic
species from biodiversity hotspots. Conserv Biol 20:538–548Mcknight MW, White PS, Mcdonald RI, Lamoreux JF, Sechrest W, Ridgely RS, Stuart SN (2007) Putting
beta-diversity on the map: broad-scale congruence and coincidence in the extremes. PLoS Biol5:272–281
Njabo KY (2006) Phylogeography and systematics of montane forest birds in Cameroon. Dissertation,Boston University, USA
Orme CDL, Davies RG, Burgess M, Eigenbrod F, Pickup N, Olson VA, Webster AJ, Ding T, RasmussenPC, Ridgely RS, Stattersfield AJ, Bennett PM, Blackburn TM, Gaston KJ, Owens PF (2005) Globalhotspots of species richness are not congruent with endemism or threat. Nature 436:1016–1019
Owiunji I, Nkuutu D, Kujirakwinja D, Liengola I, Plumptre AJ, Nsanzurwimo A, Fawcett K, Gray M,Mcneilage A (2005) The biodiversity of the Virunga volcanoes. Unpublished report, Wildlife Con-servation Society, New York
Biodivers Conserv (2014) 23:1469–1484 1483
123
Author's personal copy
Payton RW (1993) Ecology, altitudinal zonation and conservation of tropical rainforest of Mt. Unpublishedreport to FAO, Cameroon
R Development Core Team (2012) R: a language and environment for statistical computing. R foundationfor Statistical Computing, Vienna. http://www.r-project.org/
Rahbek C, Graves GR (2000) Detection of macro-ecological patterns in South American hummingbirds isaffected by spatial scale. Proc R Soc Lond B 267:2259–2265
Raman STR (2003) Assessment of census techniques for interspecific comparisons of tropical rainforest birddensities: a field evaluation in the Western Ghats, India. Ibis 145:9–21
Reif J, Horak D, Sedlacek O, Riegert J, Pesata M, Zaboj H, Janecek S, Storch D (2006) Unusual abundance–range size relationship in an Afromontane bird community: the effect of geographical isolation?J Biogeogr 33:1959–1968
Romdal TS, Rahbek C (2009) Elevational zonation of afrotropical forest bird communities along ahomogeneous forest gradient. J Biogeogr 36:327–336
Ryan PG, Bento C, Cohen C, Graham J, Parker V, Spottiswoode C (1999) The avifauna and conservationstatus of the Namuli Massif, northern Mozambique. Bird Conserv Int 9:315–331
Scatena FN, Bruijnzeel LA, Bubb P, Das S (2010) Setting the stage. In: Scatena FN, Hamilton LS,Bruijnzeel LA (eds) Tropical montane cloud forests: science for conservation and management.Cambridge University Press, Cambridge
Sekercioglu CH, Riley A (2005) A brief survey of the birds in Kumbira Forest, Gabela, Angola. Ostrich76:111–117
Serle W (1981) The breeding seasons of birds in the lowland forest and in montane forest of WestCameroon. Ibis 123:62–74
Sinclair I, Ryan P (2003) Birds of Africa south of the Sahara. Princeton University Press, PrincetonSmith TB, Holder K, Girman D, O’keefe K, Larison B, Chan Y (2000) Comparative avian phylogeography
of Cameroon and Equatorial Guinea mountains: implications for conservation. Mol Ecol 9:1505–1516Sodhi NS, Ehrlich PR (2010) Conservation biology for all. Oxford University Press, OxfordStiles FG (1983) Birds in Costa Rican natural history. University of Chicago Press, ChicagoStorch D, Davies RG, Zajıcek S, Orme CDL, Olson V, Thomas GH, Ding TS, Rasmussen PC, Ridgely RS,
Bennett PM, Blackburn TM, Owens IPF, Gaston KJ (2006) Energy, range dynamics and global speciesrichness patterns: reconciling mid-domain effects and environmental determinants of avian diversity.Ecol Lett 9:1308–1320
Storch D, Keil P, Jetz W (2012) Universal species–area and endemics–area relationships at continentalscales. Nature 488:78–81
Taylor PJ, Stoffberg S, Monadjem A, Schoeman MC, Bayliss J et al (2012) Four new bat species (Rhi-nolophus hildebrandtii Complex) Reflect Plio-Pleistocene Divergence of Dwarfs and Giants across anAfromontane Archipelago. PLoS One 7(9):e41744
Thomas DW (1986) Vegetation in the montane forests of Cameroon. Stuart SN. Conservation of Cameroonmontane forests. International Council for Bird Preservation, Cambridge, UK, pp 20–27
Tye H (1986) The climate of the highlands of Western Cameroon. Stuart SN Conservation of Cameroonmontane forests. International Council for Bird Preservation, Cambridge, pp 18–19
Wethered R, Lawes MJ (2003) Matrix effects on bird assemblages in fragmented Afromontane forests inSouth Africa. Biol Conserv 114:327–340
Wethered R, Lawes MJ (2005) Nestedness of bird assemblages in fragmented Afromontane forest: the effectof plantation forestry in the matrix. Biol Conserv 123:125–137
White F (1981) The history of the Afromontane archipelago and the scientific need for its conservation. AfrJ Ecol 19:33–34
Williams SE, Williams YM, VanDerWal J, Shoo LP, Johnson CN (2009) Ecological specialization andpopulation size in a biodiversity hotspot: how rare species avoid extinction. Proc Natl Acad Sci USA106:19737–19741
1484 Biodivers Conserv (2014) 23:1469–1484
123
Author's personal copy
Copyright © 2022 FDOKUMEN