Productivity of Palm Oil Extraction Technology in Cameroon
11
49 INTRODUCTION African oil palm originated in the tropical rainforest region of West Africa along the coastal strip between Liberia an Angola, from where it spread north, south and east to Senegal, the Indian Ocean, Zanzibar (Tanzania) and Madagascar. Since its domestication, oil palm has been introduced and cultivated throughout the humid tropics (16°N to 16° S) elsewhere in the world. Typically, oil palm plantations are planted at a 9 m by 7.5 m spacing and the resulting 148 palms per hectare produce one new frond every three weeks, each new leaf adds 45 mm to the trunk height i.e. (0.8 m per year, 20 m in 25 years), and goes on to form one bunch either male or female. Typically under well managed conditions, 10 - 15 bunches can be harvested per palm in a year. They weigh 15 - 20 kg each Total yields are thus 15 - 30 tons of fresh fruit bunches (FFB) per hectare per year. Cameroon’s oil palm industry still plays a significant role in the national economy, providing oil for house hold consumption, industrial use as well as employment for thousands of Cameroonians who are engaged in production, processing and marketing. Social and economic impact of palm oil production Social and economical factors have a large influence on the prospective development of palm oil production and availability of waste material. There are some critical issues which need to be mentioned. Growing demand for vegetable oil caused an increase in area under oily crops cultivation, and palm oil is not exception. Currently vegetable oil made from palm oil fruit covers 35% of world consumption. In Cameroon, major Agro-industries involved in palm oil production are: SOCAPALM (25,000 ha), C.D.C (15,000 ha), PAMOL (10,000 ha), SPFS (7,000 ha) and SAFACAM (4,000 ha). They contribute up to 80% of the total edible oil needs. Data from questionnaires presents that area about 5 ha of oil palm were planted by small and medium size farmers each year during the last decade, making a total of about 90,000 ha palm area in Cameroon at present. In mid 2008, the price of crude palm oil (CPO) was higher than the selling price of petroleum-derived diesel, given that its cost, on average about 10 US cents per litter to convert crude palm oil into biodiesel. Oil palm was enthusiastically cultivated in Cameroon mainly because of its large number of uses; which are deeply Original Research Article Productivity of Palm Oil Extraction Technology in Cameroon Bassel El Khatib 1 , Ludek Sisak 1 1 Czech University of Life Sciences Prague, Faculty of Forestry and Wood Sciences, Department of Forestry Economics and Management, Prague, Czech Republic Abstract Agriculture and forestry remain the leading sectors in Cameroon, accounting for some 36% of the merchandise exports and for more than 40% of GDP in 1998/99. Agriculture alone accounts for more than 30% of GDP and provides employment for about 68% of the active population. The Cameroon government and industry stakeholders have continuingly expressed concern about the impact of rising food import on the local industries and the rural communities especially as vegetable oils, particularly the palm oil, has a vital role to play not only as nutritional source for the Cameroon population, but for their contribution to rural incomes and employment opportunities. Particularly, Cameroon government is expecting a significant progress in implementation of new oil extraction technology where mainly in the palm oil processing technology the value added chain in this commodity is expected. Cameroon’s oil palm industry still plays a significant role in the national economy, providing oil for house hold consumption, industrial use as well as employment for thousands of Cameroonians who are engaged in production, processing and marketing. This project aims at bringing clarity on to what extent the up to date oil extraction processing technology installed in a concrete rural district, and under a clear management and regulatory structure and environment, outperforms in terms of productivity (tons of palm oil produced), quality (price of the crude palm oil) and income generation, the existing traditional manual processing palm oil producing system. The methodology applied within this study consists of comparing key indicators across populations of small scale palm oil processors in interaction with traditional non sophisticated technology with different work environment, production capacity, socio-economic status and income levels (cross-sectional statistical analysis). Keywords: Cameroon; oil extraction technology; palm oil, productivity; value added chain. DOI: 10.2478/ats-2014-0007 AGRICULTURA TROPICA ET SUBTROPICA, 47/2, 49-59, 2014
-
Upload
khangminh22 -
Category
Documents
-
view
3 -
download
0
Transcript of Productivity of Palm Oil Extraction Technology in Cameroon
49
INTRODUCTION
African oil palm originated in the tropical rainforest region of West Africa along the coastal strip between Liberia an Angola, from where it spread north, south and east to Senegal, the Indian Ocean, Zanzibar (Tanzania) and Madagascar. Since its domestication, oil palm has been introduced and cultivated throughout the humid tropics (16°N to 16° S) elsewhere in the world.
Typically, oil palm plantations are planted at a 9 m by 7.5 m spacing and the resulting 148 palms per hectare produce one new frond every three weeks, each new leaf adds 45 mm to the trunk height i.e. (0.8 m per year, 20 m in 25 years), and goes on to form one bunch either male or female. Typically under well managed conditions, 10 - 15 bunches can be harvested per palm in a year. They weigh 15 - 20 kg each Total yields are thus 15 - 30 tons of fresh fruit bunches (FFB) per hectare per year.
Cameroon’s oil palm industry still plays a significant role in the national economy, providing oil for house hold consumption, industrial use as well as employment for thousands of Cameroonians who are engaged in production, processing and marketing.
Social and economic impact of palm oil production
Social and economical factors have a large influence on the prospective development of palm oil production and availability of waste material. There are some critical issues which need to be mentioned. Growing demand for vegetable oil caused an increase in area under oily crops cultivation, and palm oil is not exception. Currently vegetable oil made from palm oil fruit covers 35% of world consumption.
In Cameroon, major Agro-industries involved in palm oil production are: SOCAPALM (25,000 ha), C.D.C (15,000 ha), PAMOL (10,000 ha), SPFS (7,000 ha) and SAFACAM (4,000 ha). They contribute up to 80% of the total edible oil needs.
Data from questionnaires presents that area about 5 ha of oil palm were planted by small and medium size farmers each year during the last decade, making a total of about 90,000 ha palm area in Cameroon at present.
In mid 2008, the price of crude palm oil (CPO) was higher than the selling price of petroleum-derived diesel, given that its cost, on average about 10 US cents per litter to convert crude palm oil into biodiesel.
Oil palm was enthusiastically cultivated in Cameroon mainly because of its large number of uses; which are deeply
Original Research Article
Productivity of Palm Oil Extraction Technology in Cameroon
Bassel El Khatib1, Ludek Sisak1
1Czech University of Life Sciences Prague, Faculty of Forestry and Wood Sciences, Department of Forestry Economics and Management, Prague, Czech Republic
Abstract
Agriculture and forestry remain the leading sectors in Cameroon, accounting for some 36% of the merchandise exports and for more than 40% of GDP in 1998/99. Agriculture alone accounts for more than 30% of GDP and provides employment for about 68% of the active population.The Cameroon government and industry stakeholders have continuingly expressed concern about the impact of rising food import on the local industries and the rural communities especially as vegetable oils, particularly the palm oil, has a vital role to play not only as nutritional source for the Cameroon population, but for their contribution to rural incomes and employment opportunities. Particularly, Cameroon government is expecting a significant progress in implementation of new oil extraction technology where mainly in the palm oil processing technology the value added chain in this commodity is expected. Cameroon’s oil palm industry still plays a significant role in the national economy, providing oil for house hold consumption, industrial use as well as employment for thousands of Cameroonians who are engaged in production, processing and marketing. This project aims at bringing clarity on to what extent the up to date oil extraction processing technology installed in a concrete rural district, and under a clear management and regulatory structure and environment, outperforms in terms of productivity (tons of palm oil produced), quality (price of the crude palm oil) and income generation, the existing traditional manual processing palm oil producing system.The methodology applied within this study consists of comparing key indicators across populations of small scale palm oil processors in interaction with traditional non sophisticated technology with different work environment, production capacity, socio-economic status and income levels (cross-sectional statistical analysis).
Keywords: Cameroon; oil extraction technology; palm oil, productivity; value added chain.
DOI: 10.2478/ats-2014-0007 AGRICULTURA TROPICA ET SUBTROPICA, 47/2, 49-59, 2014
50
AGRICULTURA TROPICA ET SUBTROPICA VOL. 47 (2) 2014
embedded in local cultures. Demand from international markets, however, has also played a great part in convincing Cameroonians to cultivate oil palm.
Oil palm is spreading throughout the tropics, most notably in Southeast Asia. In 2008, Malaysia’s Federal Land Development Authority (FELDA) announced plans to establish oil palm plantations in Kalimantan (20,000 ha), Aceh (45,000 ha), Papua New Guinea (105,000 ha), and Brazil (100,000 ha) (Wilcove and Koh, 2010). In May 2009, SIME DARBY, the world’s largest oil-palm company, also announced plans to invest 800 million US dollars in oil palm and rubber plantations in Liberia, covering around 200,000 ha (80% for oil palm) (Lopez et al., 2008). Given that large expanses of forested areas in these regions are suitable for oil palm, oil palm will likely continue to replace tropical forests (Laurance et al., 2010). Along with employment, large oil palm plantations provide a variety of facilities for employees and their families, including housing, water, electricity, roads, medical care, and schools. In some rural areas, palm oil plantations offer the only livelihood option (Koh and Wilcove, 2007).
Large palm oil plantations have also been associated with corruption of community members, the decline of cultural traditions (the result of large inflows of immigrant workers), dependence on palm oil plantations and companies, and the loss of biodiversity. The loss of biodiversity is reducing opportunities for hunting, fishing, use of forest products, and access to clean water (Colchester et al., 2006).
In response to social concerns associated with palm oil production (as well as legal, economic, and environmental issues), the Roundtable on Sustainable Palm Oil (RSPO) was formed in 2004 to develop and implement global standards for sustainable production. The RSPO members are associated in the fifteen groups and now include 257 ordinary and 92 affiliate members, who represent about 35 % of palm oil production in the world (RSPO, 2013).
Expansion of palm oil plantation can have a negative effect to the environment and can lead to irreversible losses of natural heritage. A report prepared by WWF shows that clearance of tropical forests for oil palm plantations has caused many negative effects (WWF, 2005). The removal or destruction of significant areas of forest has resulted in ecology instability to the natural habitat of the forests. For instance, animal species like Asian elephants, Sumatran rhinos and Sumatran tigers, which can only be found in Sumatran and Borneo Island, are facing extinctions due to the high rate of tropical forests being converted to oil palm plantations. When their natural habitats are destroyed, these animals would not be able to survive and become endangered (Tan et al., 2009).
Glastra et al. (2002) claim that most of the deforestation in South East Asia has been carried out using land burning where large scale clearance caused numerous, large and
persistent fires in Sumatra. For example, it is claimed that the 1997 haze around South East Asia region was caused by this activity. Apart from that, it was also reported that from 5 million hectares of former forest in Indonesia, 3 million hectares are now covered with oil palm (Glastra et al., 2002).
Palm oil has been shown to be the most suitable candidate among all vegetable oils as the source of biodiesel production. High yield and low production cost are two of the major factors that made this vegetable oil attractive in terms of economic and environment. However, issues concerning this crop are damaging its image as an environment friendly vegetable oil. Besides, it is obvious that there is a need to introduce policies/strategies that will guide palm oil producers towards sustainable production and development. Hence, all parties involved with palm oil, from growers to consumer product manufacturers, should work closely to ensure that sustainable production is to be realized. Consequently, palm oil can become the major source of biodiesel in the world (Tan et al., 2009).
Even though the economic literature suggests a positive correlation between labour productivity and wages, there is still considerable missing evidence as to be able to define under which concrete circumstances this positive technological changes directly translate into replicable and widespread pro-poor income gains. It is therefore the aim of this study to bridge the gap between theory and practice by looking at the impact of a standard and concrete technological leap forward’s contribution on income variables in Cameroonian rural selected communities. In other words, this study aims at bringing clarity on to what extent a 2-ton per hour palm oil mechanized processing technology installed in a concrete rural district, and under a clear management and regulatory structure and environment, outperforms in terms of productivity (tons of palm oil produced), quality (price of the crude palm oil) and income generation, the existing traditional manual processing palm oil producing system.
If it is successfully proven that a new technology increases production and marketability through better quality and productivity, assisting in alleviating poverty within the rural areas of Cameroon, then, this result could be used in the design of better development policies, and favour economic growth creation, poverty reduction and youth employment. Hence, if the treatment results are positive by enhancing the economic status of livelihoods within the selected areas for the intervention, then this treatment could be recommended to the Government of Cameroon as an effective tool towards pro-poor income generation, tax revenue expansion, economic structural change and job creation in these rural areas.
Income in this case indicates salaries of the workers within the installed 2-ton per hour palm oil mills.
The specific objective is to measure the effect on income generation capacity in selected rural communities of
51
AGRICULTURA TROPICA ET SUBTROPICA VOL. 47 (2) 2014
Cameroon through the establishment of a 2-ton per hour palm oil processing technique and compare this with the income produced with the existing processing system.
MATERIALS AND METHODS
Theoretical background
The literature on the determinants of household income and poverty is well established, dating back from the literature on human capital development, economic growth, and poverty reduction (e.g. Schultz, 1961; Welch, 1970) to more recent analyses of household data (e.g. Hassan and Alhamdan, 1991; Lanjouw and Ravallion, 1995; Simler, 2004; Otsuka and Yamano, 2006). The main determinants include household size, the age and gender composition of the household, education, health, social capital, assets and endowments, and employment, among others.
Purpose of the study
To determine whether an improved palm oil processing technology has a positive effect on productivity (FFB processed and crude palm oil produced per worker), efficiency (palm oil extraction rate), and profitability (output price) of crude palm oil processing units and whether this ultimately improves the income level of its related workers. Results are compared against traditional processing centres.
To quantify the impact in terms of income of processing capacity, productivity and efficiency with respect to traditional centres.
To determine which processing equipment is more determinant in increasing the income of the workers
To issue recommendations regarding the adoption of a particular technology / processing equipment, in order to maximize income for processor workers.
Methodology
The methodology applied within this study consists of comparing key indicators across populations of small scale palm oil processors with different work environment, production capacity, socio-economic status and income levels (cross-sectional statistical analysis). The main advantage of this methodology relies on its practical feasibility and limited cost as compared to other methods. Given the regional context (Sub-Saharan Africa) it seems a prudent and rational option.
Two categories were defined for data collection at the processing level:
Traditional method: This is the method used by old traditional centres using primitive manual oil processing
techniques which are to be considered artisanal. Modern method: This is the method used by more advanced
centres with mechanized oil processing techniques. The palm oil processing machinery with capacity of at least 2– tons per hour together with auxiliary technology.
The research method
The following steps were provided for this study: Data collection (questionnaire); data analysis and comparison; presentation of the results; prediction, estimation and inference; limitations and assumptions.
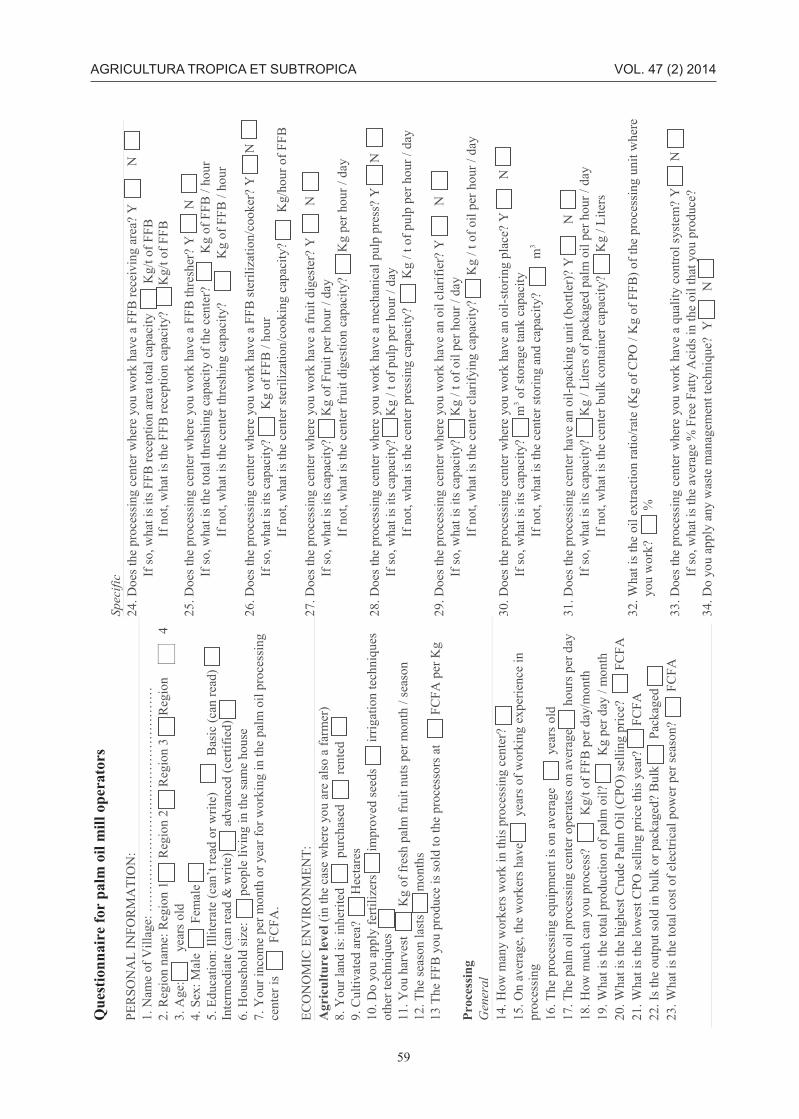
Data collection (see questionnaire, p. 59):Data were collected directly in the field from primary
sources for a selected representative sample. - Data collection methods contend: - Surveys through
questionnaires which were conducted by professional surveyors. - Interviews. - 480 questionnaires with 32 questions each were collected in 4 different rural regions of Cameroon namely, the regions are: Sombo, Mkpot, Misaje and Edea. - Out of the 480 a total of 240 questionnaires were collected from community-level processing units (Traditional) and 240 from more advanced processing centers (Modern) - Statistical analysis (descriptive, estimation and post-estimation) was conducted with the statistical software: Stata/IC 12.0 for Windows (32-bit)
- The target groups were: - Direct workers and entrepreneurs within the processing mills.
The key indicators were identified and included in the surveys. Suggested indicators of reported perceptions are as follows: - Income level per palm oil processing worker or entrepreneur, - Worker productivity (unit output/unit input), - Total CPO production, -FFB pulp press capacity, and other 25 factors listed in the questionnaire (p. 59).
Data analysis and description:The collected data were transferred from the questionnaires
and inserted into an excel spread sheet and imported to the Stata software. To do so, quantitative and qualitative (dummy variables) were created, for mutually exclusive categories (sex, education, region among others).
Data were analyzed using Stata software and is presented through descriptive, inferential and predictive statistics. Visual tools such as tables, graphs, scatter plots, or tables were used. The predictive part utilized simple and multiple regression models and parametric ordinary least squares for estimating variables. In order to avoid misleading results typical tests were performed (e.g. heteroskedasticity, endogeneity, or multicollinearity). Additionally, the research study explored different models to attempt to find conclusive and significant relationships.
Limitations and assumptions:The limitations of our study will be determined by: -
Size of the sample, - The representativeness of the sample
52
AGRICULTURA TROPICA ET SUBTROPICA VOL. 47 (2) 2014
(whether or not our sample has similar characteristics as the population in which we want to make inference in), - The particular socio-cultural context, - Problem of attribution in isolating the changing factor (was it really the technology
that increased the income of the workers, or could there be other explanations?), - Lack of treatment group and control group data (even though we will be able to collect data on a sample before and after the treatment, we will not be able
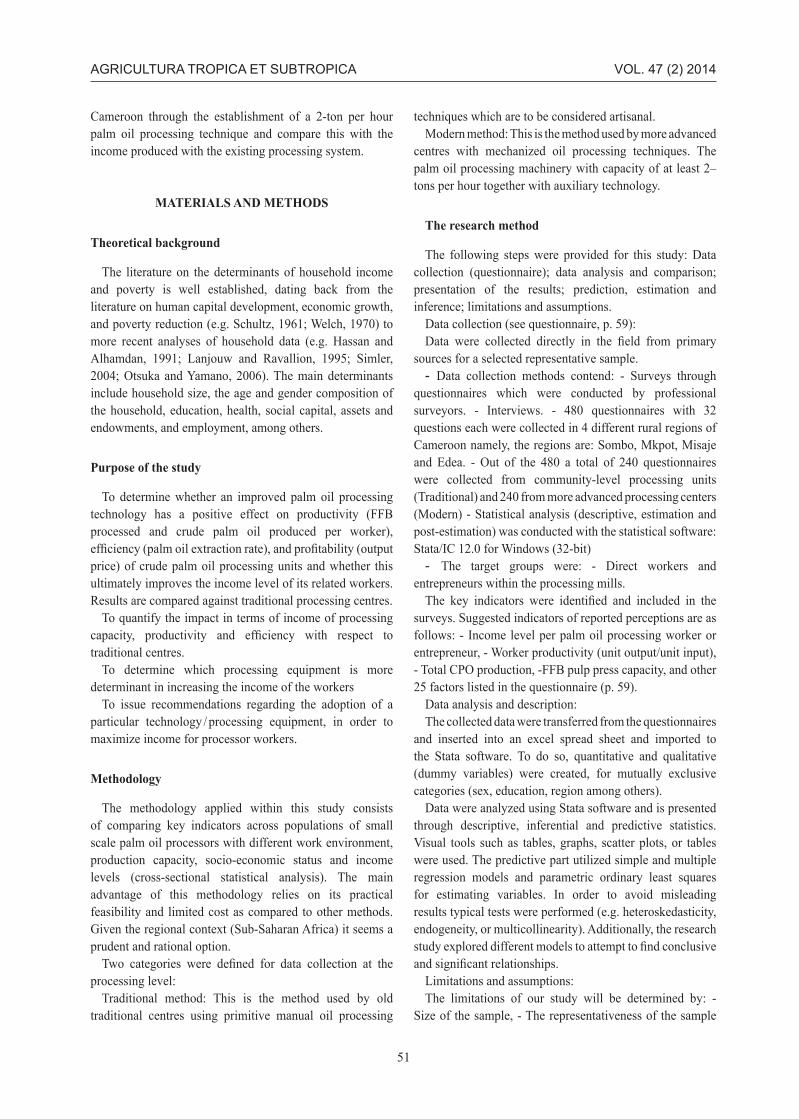
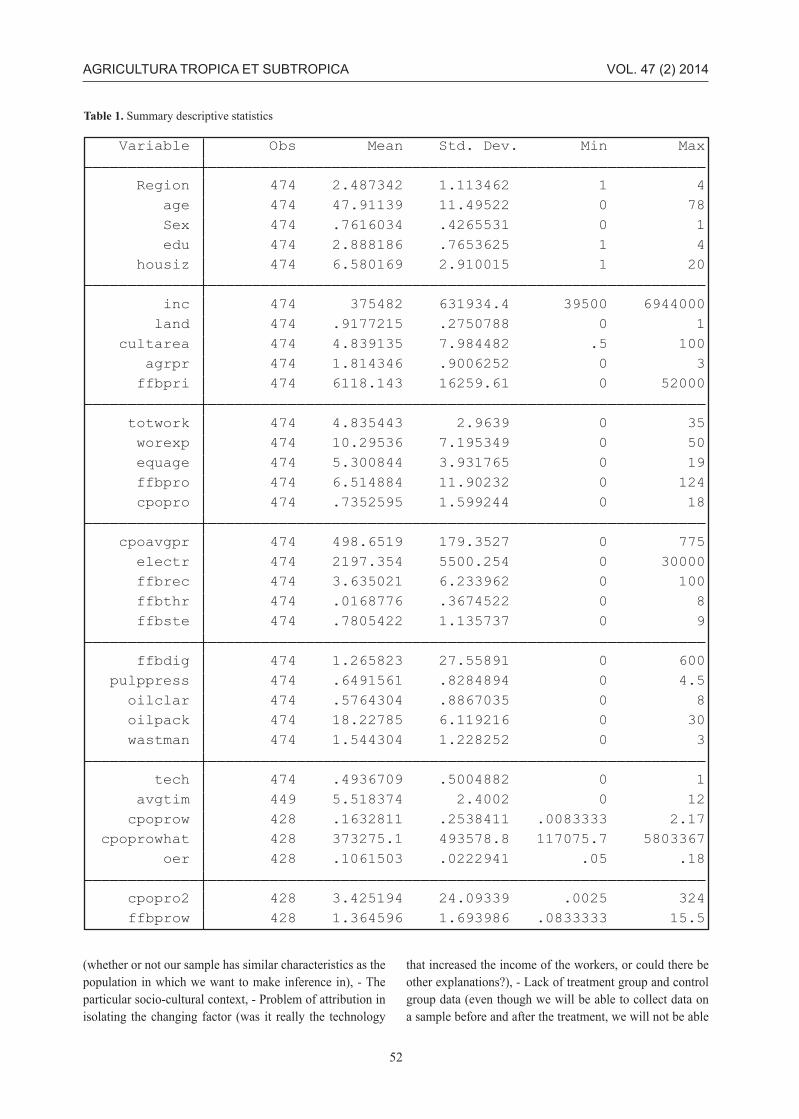
Table 1. Summary descriptive statistics
Table 1. Summary descriptive statistics
ffbprow 428 1.364596 1.693986 .0833333 15.5
cpopro2 428 3.425194 24.09339 .0025 324
oer 428 .1061503 .0222941 .05 .18
cpoprowhat 428 373275.1 493578.8 117075.7 5803367
cpoprow 428 .1632811 .2538411 .0083333 2.17
avgtim 449 5.518374 2.4002 0 12
tech 474 .4936709 .5004882 0 1
wastman 474 1.544304 1.228252 0 3
oilpack 474 18.22785 6.119216 0 30
oilclar 474 .5764304 .8867035 0 8
pulppress 474 .6491561 .8284894 0 4.5
ffbdig 474 1.265823 27.55891 0 600
ffbste 474 .7805422 1.135737 0 9
ffbthr 474 .0168776 .3674522 0 8
ffbrec 474 3.635021 6.233962 0 100
electr 474 2197.354 5500.254 0 30000
cpoavgpr 474 498.6519 179.3527 0 775
cpopro 474 .7352595 1.599244 0 18
ffbpro 474 6.514884 11.90232 0 124
equage 474 5.300844 3.931765 0 19
worexp 474 10.29536 7.195349 0 50
totwork 474 4.835443 2.9639 0 35
ffbpri 474 6118.143 16259.61 0 52000
agrpr 474 1.814346 .9006252 0 3
cultarea 474 4.839135 7.984482 .5 100
land 474 .9177215 .2750788 0 1
inc 474 375482 631934.4 39500 6944000
housiz 474 6.580169 2.910015 1 20
edu 474 2.888186 .7653625 1 4
Sex 474 .7616034 .4265531 0 1
age 474 47.91139 11.49522 0 78
Region 474 2.487342 1.113462 1 4
Variable Obs Mean Std. Dev. Min Max
53
AGRICULTURA TROPICA ET SUBTROPICA VOL. 47 (2) 2014
to compare it with a control group who did not suffer the treatment)
Assumptions: - Data are acceptably reliable (people are not lying, etc.), - Processing units are running and operational
A questionnaire for palm oil mill operators was created (see Annex)
RESULTS
Selected results
Table 1 presents the summary descriptive statistics collected during the survey. The following list provides the abbreviations used in the forthcoming tables and graphs.
Productivity
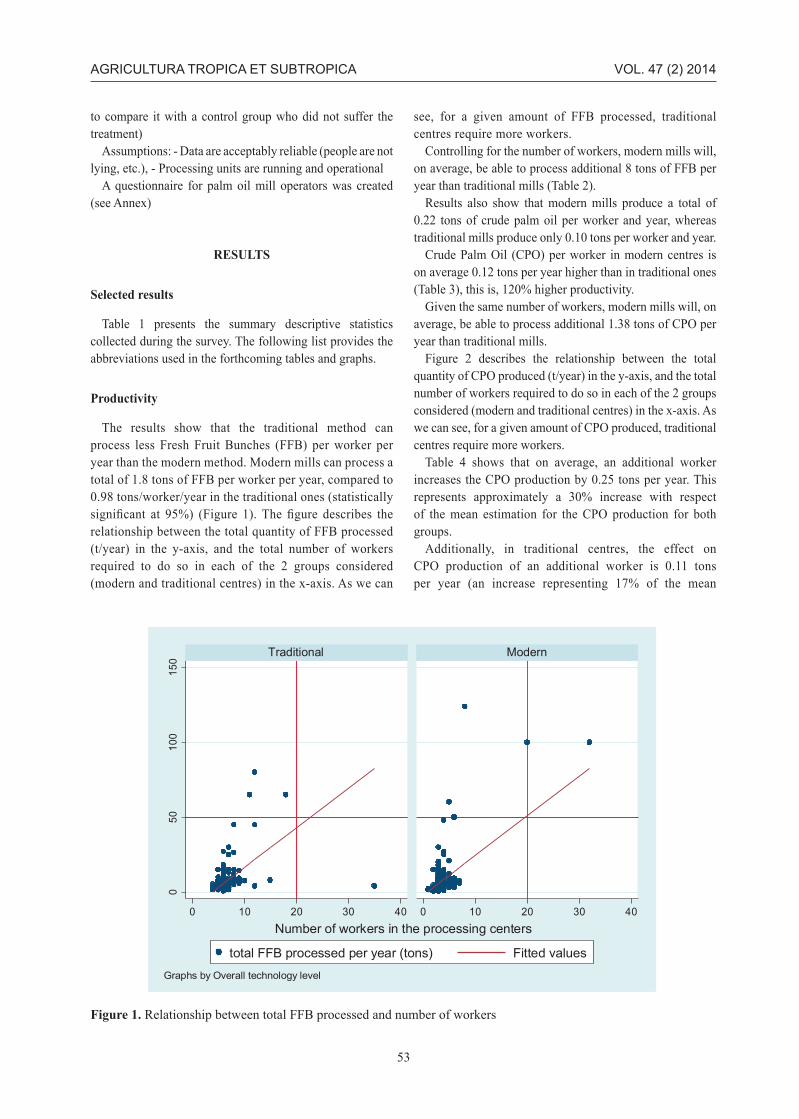
The results show that the traditional method can process less Fresh Fruit Bunches (FFB) per worker per year than the modern method. Modern mills can process a total of 1.8 tons of FFB per worker per year, compared to 0.98 tons/worker/year in the traditional ones (statistically significant at 95%) (Figure 1). The figure describes the relationship between the total quantity of FFB processed (t/year) in the y-axis, and the total number of workers required to do so in each of the 2 groups considered (modern and traditional centres) in the x-axis. As we can
see, for a given amount of FFB processed, traditional centres require more workers.
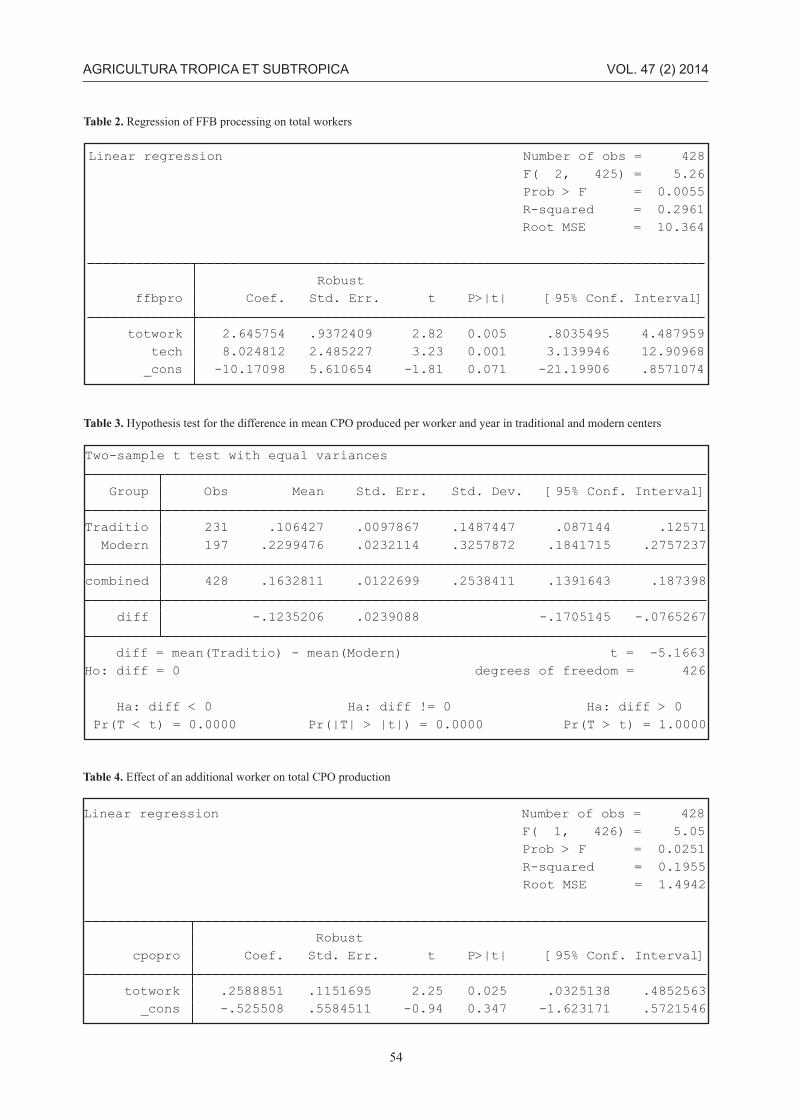
Controlling for the number of workers, modern mills will, on average, be able to process additional 8 tons of FFB per year than traditional mills (Table 2).
Results also show that modern mills produce a total of 0.22 tons of crude palm oil per worker and year, whereas traditional mills produce only 0.10 tons per worker and year.
Crude Palm Oil (CPO) per worker in modern centres is on average 0.12 tons per year higher than in traditional ones (Table 3), this is, 120% higher productivity.
Given the same number of workers, modern mills will, on average, be able to process additional 1.38 tons of CPO per year than traditional mills.
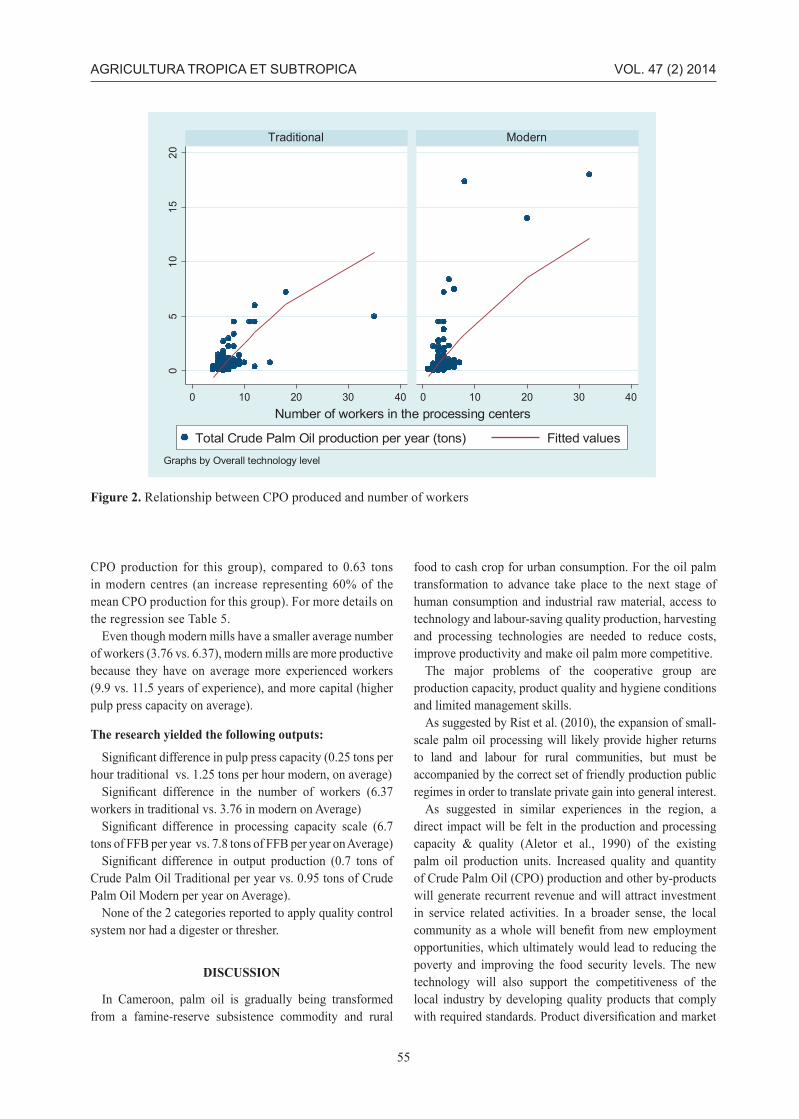
Figure 2 describes the relationship between the total quantity of CPO produced (t/year) in the y-axis, and the total number of workers required to do so in each of the 2 groups considered (modern and traditional centres) in the x-axis. As we can see, for a given amount of CPO produced, traditional centres require more workers.
Table 4 shows that on average, an additional worker increases the CPO production by 0.25 tons per year. This represents approximately a 30% increase with respect of the mean estimation for the CPO production for both groups.
Additionally, in traditional centres, the effect on CPO production of an additional worker is 0.11 tons per year (an increase representing 17% of the mean
05
01
00
15
0
0 10 20 30 40 0 10 20 30 40
Traditional Modern
total FFB processed per year (tons) Fitted values
Number of workers in the processing centers
Graphs by Overall technology level
Figure 1. Relationship between total FFB processed and number of workers
54
AGRICULTURA TROPICA ET SUBTROPICA VOL. 47 (2) 2014
Table 2. Regression of FFB processing on total workers
Table 2. Regression of FFB processing on total workers
_cons -10.17098 5.610654 -1.81 0.071 -21.19906 .8571074
tech 8.024812 2.485227 3.23 0.001 3.139946 12.90968
totwork 2.645754 .9372409 2.82 0.005 .8035495 4.487959
ffbpro Coef. Std. Err. t P>|t| [95% Conf. Interval]
Robust
Root MSE = 10.364
R-squared = 0.2961
Prob > F = 0.0055
F( 2, 425) = 5.26
Linear regression Number of obs = 428
Table 3. Hypothesis test for the difference in mean CPO produced per worker and year in traditional and modern centers
Table 3. Hypothesis test for the difference in mean CPO produced per worker and year in
traditional and modern centers
Pr(T < t) = 0.0000 Pr(|T| > |t|) = 0.0000 Pr(T > t) = 1.0000
Ha: diff < 0 Ha: diff != 0 Ha: diff > 0
Ho: diff = 0 degrees of freedom = 426
diff = mean(Traditio) - mean(Modern) t = -5.1663
diff -.1235206 .0239088 -.1705145 -.0765267
combined 428 .1632811 .0122699 .2538411 .1391643 .187398
Modern 197 .2299476 .0232114 .3257872 .1841715 .2757237
Traditio 231 .106427 .0097867 .1487447 .087144 .12571
Group Obs Mean Std. Err. Std. Dev. [95% Conf. Interval]
Two-sample t test with equal variances
Table 4. Effect of an additional worker on total CPO production
Table 4. Effect of an additional worker on total CPO production
_cons -.525508 .5584511 -0.94 0.347 -1.623171 .5721546
totwork .2588851 .1151695 2.25 0.025 .0325138 .4852563
cpopro Coef. Std. Err. t P>|t| [95% Conf. Interval]
Robust
Root MSE = 1.4942
R-squared = 0.1955
Prob > F = 0.0251
F( 1, 426) = 5.05
Linear regression Number of obs = 428
55
AGRICULTURA TROPICA ET SUBTROPICA VOL. 47 (2) 2014
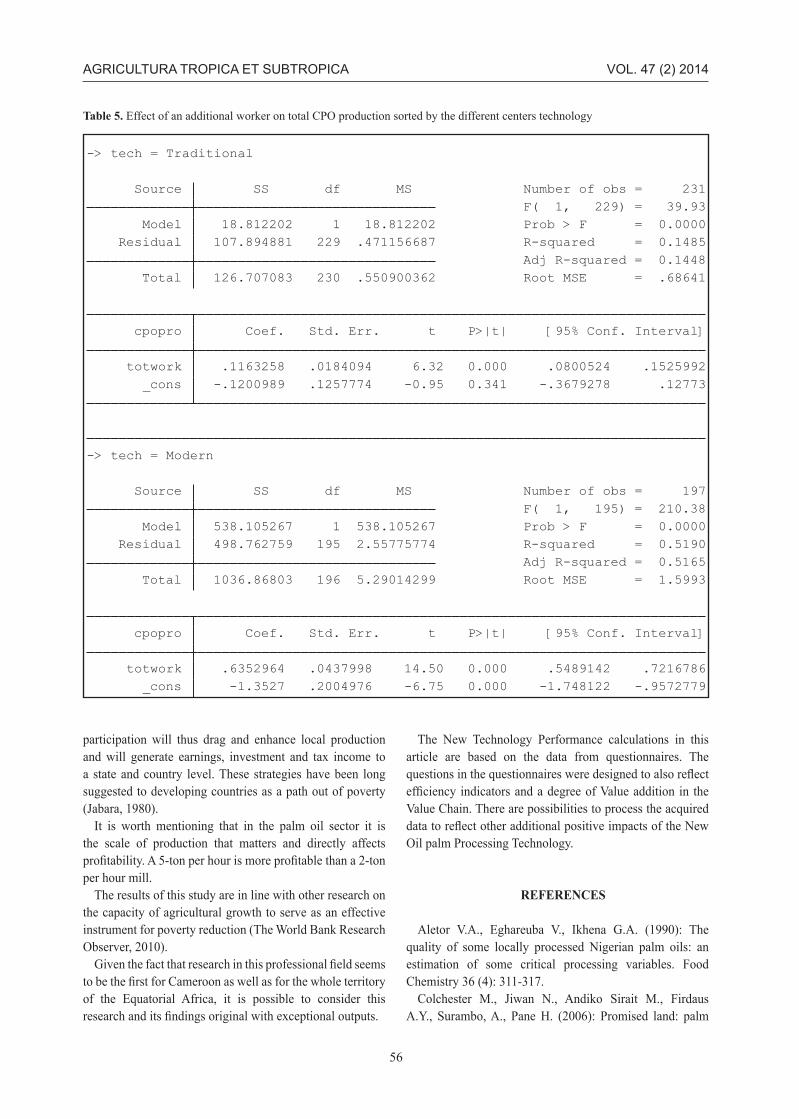
CPO production for this group), compared to 0.63 tons in modern centres (an increase representing 60% of the mean CPO production for this group). For more details on the regression see Table 5.
Even though modern mills have a smaller average number of workers (3.76 vs. 6.37), modern mills are more productive because they have on average more experienced workers (9.9 vs. 11.5 years of experience), and more capital (higher pulp press capacity on average).
The research yielded the following outputs:
Significant difference in pulp press capacity (0.25 tons per hour traditional vs. 1.25 tons per hour modern, on average)
Significant difference in the number of workers (6.37 workers in traditional vs. 3.76 in modern on Average)
Significant difference in processing capacity scale (6.7 tons of FFB per year vs. 7.8 tons of FFB per year on Average)
Significant difference in output production (0.7 tons of Crude Palm Oil Traditional per year vs. 0.95 tons of Crude Palm Oil Modern per year on Average).
None of the 2 categories reported to apply quality control system nor had a digester or thresher.
DISCUSSION
In Cameroon, palm oil is gradually being transformed from a famine-reserve subsistence commodity and rural
food to cash crop for urban consumption. For the oil palm transformation to advance take place to the next stage of human consumption and industrial raw material, access to technology and labour-saving quality production, harvesting and processing technologies are needed to reduce costs, improve productivity and make oil palm more competitive.
The major problems of the cooperative group are production capacity, product quality and hygiene conditions and limited management skills.
As suggested by Rist et al. (2010), the expansion of small-scale palm oil processing will likely provide higher returns to land and labour for rural communities, but must be accompanied by the correct set of friendly production public regimes in order to translate private gain into general interest.
As suggested in similar experiences in the region, a direct impact will be felt in the production and processing capacity & quality (Aletor et al., 1990) of the existing palm oil production units. Increased quality and quantity of Crude Palm Oil (CPO) production and other by-products will generate recurrent revenue and will attract investment in service related activities. In a broader sense, the local community as a whole will benefit from new employment opportunities, which ultimately would lead to reducing the poverty and improving the food security levels. The new technology will also support the competitiveness of the local industry by developing quality products that comply with required standards. Product diversification and market
05
10
15
20
0 10 20 30 40 0 10 20 30 40
Traditional Modern
Total Crude Palm Oil production per year (tons) Fitted values
Number of workers in the processing centers
Graphs by Overall technology level
Figure 2. Relationship between CPO produced and number of workers
56
AGRICULTURA TROPICA ET SUBTROPICA VOL. 47 (2) 2014
participation will thus drag and enhance local production and will generate earnings, investment and tax income to a state and country level. These strategies have been long suggested to developing countries as a path out of poverty (Jabara, 1980).
It is worth mentioning that in the palm oil sector it is the scale of production that matters and directly affects profitability. A 5-ton per hour is more profitable than a 2-ton per hour mill.
The results of this study are in line with other research on the capacity of agricultural growth to serve as an effective instrument for poverty reduction (The World Bank Research Observer, 2010).
Given the fact that research in this professional field seems to be the first for Cameroon as well as for the whole territory of the Equatorial Africa, it is possible to consider this research and its findings original with exceptional outputs.
The New Technology Performance calculations in this article are based on the data from questionnaires. The questions in the questionnaires were designed to also reflect efficiency indicators and a degree of Value addition in the Value Chain. There are possibilities to process the acquired data to reflect other additional positive impacts of the New Oil palm Processing Technology.
REFERENCES
Aletor V.A., Eghareuba V., Ikhena G.A. (1990): The quality of some locally processed Nigerian palm oils: an estimation of some critical processing variables. Food Chemistry 36 (4): 311-317.
Colchester M., Jiwan N., Andiko Sirait M., Firdaus A.Y., Surambo, A., Pane H. (2006): Promised land: palm
Table 5. Effect of an additional worker on total CPO production sorted by the different centers technology
Table 5. Effect of an additional worker on total CPO production sorted by the different centers
technology
_cons -1.3527 .2004976 -6.75 0.000 -1.748122 -.9572779
totwork .6352964 .0437998 14.50 0.000 .5489142 .7216786
cpopro Coef. Std. Err. t P>|t| [95% Conf. Interval]
Total 1036.86803 196 5.29014299 Root MSE = 1.5993
Adj R-squared = 0.5165
Residual 498.762759 195 2.55775774 R-squared = 0.5190
Model 538.105267 1 538.105267 Prob > F = 0.0000
F( 1, 195) = 210.38
Source SS df MS Number of obs = 197
-> tech = Modern
_cons -.1200989 .1257774 -0.95 0.341 -.3679278 .12773
totwork .1163258 .0184094 6.32 0.000 .0800524 .1525992
cpopro Coef. Std. Err. t P>|t| [95% Conf. Interval]
Total 126.707083 230 .550900362 Root MSE = .68641
Adj R-squared = 0.1448
Residual 107.894881 229 .471156687 R-squared = 0.1485
Model 18.812202 1 18.812202 Prob > F = 0.0000
F( 1, 229) = 39.93
Source SS df MS Number of obs = 231
-> tech = Traditional

57
AGRICULTURA TROPICA ET SUBTROPICA VOL. 47 (2) 2014
oil and land acquisition in Indonesia - implications for local communities and indigenous peoples. Forest People Programme, Sawit Watch and World Agroforestry Centre, Bogor, Indonesia. 197 p..
Glastra R., Wakker E., Richert W. (2002): Oil Palm Plantations and Deforestation in Indonesia. What Role Do Europe and Germany Play? WWF Germany in collaboration with WWF Indonesia and WWF Switzerland, Update of the 1998 “Lipsticks from the Rainforest” Report.
Hassan H., Alhamdan A.M. (1991): Water sorption isotherms of date pastes. The Journal of Food Engineering 39 (3): 301-306.
Jabara C.L. (1980): Terms of trade for developing countries: a commodity and regional analysis. Foreign agricultural economic report - U.S. Department of Agriculture, Economics, Statistics and Cooperatives Service 161: 30
Koh L.P., Wilcove D.S. (2007): Cashing in palm oil for conservation. Nature 448: 993–994.
Lanjouw P., Ravallion M. (1995): Poverty and household size. The Economic Journal 105 (433): 1415-1434.
Laurance W.F., Koh L.P., Butler R.A., Sodhi N.S., Bradshaw C.J.A., Neidel J.D., Consunji H. Mateo-Vega J. (2010): Improving the performance of the Roundtable on Sustainable Palm Oil for nature conservation. Conservation Biology 24: 377-381.
Lopez G.P. (2008): Biofuels, at what cost? Government support for biodiesel in Malaysia. International Institute
for Sustainable Development, Global Subsidies Initiative, Geneva, Switzerland.
Otsuka K., Yamano T. (2006): Skills for Improved Productivity /book/ ISBN 978-92-2-119489-7.
Rist L., Levang P., Feintrenie L. (2010): The livelihood impacts of oil palm: smallholders in Indonesia. Biodiversity and Conservation 19 (4): 1009-1024.
RSPO 2013. http://www.cleaningproductseurope.com/interview-with-
edi-suhardi-director-sustainability-at-pt-agro-harapan-lestari-and-vice-president-ii.aspx
Schultz T.W. (1961): Investment in human capital. The American Economic Review 51 (1): 1-17.
Simler K. (2004): Micro-level determinations of poverty reduction in Mozambique /book/ ISBN 0-89629-135-9.
Tan K.T., Lee K.T., Mohamed A.R., Bhatia S. (2009): Palm oil: Addressing issues and towards sustainable development. Renewable and Sustainable Energy Reviews 13 (2): 420-427.
Welch F. (1970): Education in production. The Journal of Political Economy 78 (1): 35-59.
Wilcove D. S., Koh L. P. (2010): Addressing the threats to biodiversity from oil-palm agriculture. Biodiversity Conservation 19: 999-1007.
WWF (2005): Annual Report.
Received: March 4, 2014Accepted after revisions: June 9, 2014
Corresponding author:
Bassel El KhatibCzech University of Life Sciences PragueFaculty of Forestry and Wood SciencesDepartment of Forestry Economics and ManagementKamýcká 129, 165 21, Prague 6, Czech RepublicE-mail: [email protected]@unido.org

58
AGRICULTURA TROPICA ET SUBTROPICA VOL. 47 (2) 2014
58
VARIABLE LABEL VARIABLE DESCRIPTION Region Sombo (1), Mkpot (2), Edea (3), Misaje (4) age Age (years) sex Male (1), Female (0) edu Education level: illiterate (1), Basic (2), Intermediate (3), Advanced (4) housiz House hold size (number of persons) inc Income (Central African Franc - FCFA, per year) land Land: inherited (1), Purchased (0) cultarea Total palm oil cultivated area (ha) agrpr Applies fertilizer (1), improved seeds (2), Both (3), None (0) ffbpri Price of Fresh Fruit Bunches (FFB) sold to processors (FCFA/t) totwork Number of workers in the processing centers (# of workers) worexp Working experience (years) equage Age of the equipment (years) avgtim Hours per day the center operates (hours) ffbpro Total FFB processed per year (tons) cpopro Total Crude Palm Oil production per year (tons) cpoavgpr Crude Palm oil average selling price (FCFA) electrc Total cost of electrical power per month (FCFA) ffbrec FFB receiving area capacity (surface area, meters) ffbthr FFB threshing capacity (tons/year) ffbste FFB sterilization capacity (tons/hr) ffbdig FFB fruit digestion capacity (tons/year) pulppress Pulp pressing capacity (tons per hour) oilclar Oil clarification capacity (tons per hour) tech Overall technology level: Traditional (0), Modern (1) oilpack Oil packaging capacity (CPO liters) oer Oil extraction rate measured as CPO (t/year) divided by FFB (t/year), expressed in percentage (%) wastman Waste management technique applied: manure (1), biomass (2), other (3)cpoprow Crude palm oil per worker and year (tons per year)cpoprowhat Predicted -or fitted- values for cpoprowcpopro2 Experimental variable for cpopro to test different hypothesisffbprow FFB produced per worker (tons of FFB per year)
Annex
59
AGRICULTURA TROPICA ET SUBTROPICA VOL. 47 (2) 2014
Qu
est
ion
nair
e f
or p
alm
oil
mil
l op
erato
rs
PE
RS
ON
AL
IN
FO
RM
AT
ION
:
1. N
ame o
f V
illa
ge:
……
……
……
……
……
……
……
……
…
2. R
egio
n n
ame:
Reg
ion
1 R
egio
n 2
R
egio
n 3
R
egio
n4
3. A
ge:
y
ears
old
4. S
ex:
Mal
e
F
emal
e
5. E
du
cati
on
: Il
lite
rate
(ca
n’t
rea
d o
r w
rite
)
B
asic
(ca
n r
ead
)
Inte
rmed
iate
(ca
n r
ead
& w
rite
)
advan
ced
(ce
rtif
ied
)
6. H
ou
seh
old
siz
e:
peo
ple
liv
ing
in t
he
sam
e h
ou
se
7. Y
ou
r in
com
e per
mon
th o
r yea
r fo
r w
ork
ing
in
th
e p
alm
oil
pro
cess
ing
cen
ter
is
FC
FA
.
EC
ON
OM
IC E
NV
IRO
NM
EN
T:
Ag
ric
ult
ure l
evel
(in
the
case
wher
e yo
u a
re a
lso
a f
arm
er)
8. Y
ou
r la
nd
is:
inher
ited
purc
has
ed
r
ente
d
9. C
ult
ivat
ed a
rea?
Hec
tare
s
10
. D
o y
ou
ap
ply
fer
tili
zers
i
mpro
ved
see
ds
i
rrig
atio
n t
ech
niq
ues
oth
er t
ech
niq
ues
11
. Y
ou
har
ves
t
K
g o
f fr
esh p
alm
fru
it n
uts
per
mo
nth
/ s
easo
n
12
. T
he
seas
on l
asts
m
onth
s
13
Th
e F
FB
you
pro
duce
is
sold
to t
he
pro
cess
ors
at
F
CF
A p
er K
g
Pro
cess
ing
General
14
. H
ow
man
y w
ork
ers
work
in
this
pro
cess
ing
cen
ter?
15
. O
n a
ver
age,
the
work
ers
hav
e
yea
rs o
f w
ork
ing
ex
per
ien
ce i
n
pro
cess
ing
16
. T
he
pro
cess
ing e
quip
men
t is
on a
ver
age
y
ears
old
17
. T
he
pal
m o
il p
roce
ssin
g c
ente
r oper
ates
on
av
erag
e h
ou
rs p
er d
ay
18
. H
ow
mu
ch c
an y
ou
pro
cess
?
Kg/t
of
FF
B p
er d
ay/m
on
th
19
. W
hat
is
the
tota
l pro
duct
ion
of
pal
m o
il?
K
g p
er d
ay /
mo
nth
20
. W
hat
is
the
hig
hes
t C
rude
Pal
m O
il (
CP
O)
sell
ing
pri
ce?
F
CF
A
21
. W
hat
is
the
low
est
CP
O s
elli
ng
pri
ce t
his
yea
r?
F
CF
A
22
. Is
th
e o
utp
ut
sold
in
bulk
or
pac
kag
ed?
Bulk
Pac
kag
ed
23
. W
hat
is
the
tota
l co
st o
f el
ectr
ical
pow
er p
er s
easo
n? F
CF
A
Specific
24
. D
oes
th
e p
roce
ssin
g c
ente
r w
her
e yo
u w
ork
hav
e a
FF
B r
ecei
vin
g a
rea?
Y N
If s
o, w
hat
is
its
FF
B r
ecep
tion
are
a to
tal
capac
ity K
g/t
of
FF
B
If n
ot,
wh
at i
s th
e F
FB
rec
epti
on
cap
acit
y?
K
g/t
of
FF
B
25
. D
oes
th
e p
roce
ssin
g c
ente
r w
her
e yo
u w
ork
hav
e a
FF
B t
hre
sher
? Y
N
If s
o, w
hat
is
the
tota
l th
resh
ing
cap
acit
y o
f th
e ce
nte
r? K
g o
f F
FB
/ h
our
If n
ot,
wh
at i
s th
e ce
nte
r th
resh
ing c
apac
ity?
Kg o
f F
FB
/ h
our
26
. D
oes
th
e p
roce
ssin
g c
ente
r w
her
e yo
u w
ork
hav
e a
FF
B s
teri
liza
tion/c
ook
er?
Y N
If s
o, w
hat
is
its
cap
acit
y?
K
g o
f F
FB
/ h
our
If n
ot,
wh
at i
s th
e ce
nte
r st
eril
izat
ion
/cookin
g c
apac
ity?
K
g/h
our
of
FF
B
27
. D
oes
th
e p
roce
ssin
g c
ente
r w
her
e yo
u w
ork
hav
e a
fruit
dig
este
r? Y
N
If s
o, w
hat
is
its
cap
acit
y?
K
g o
f F
ruit
per
hour
/ day
If n
ot,
wh
at i
s th
e ce
nte
r fr
uit
dig
esti
on
cap
acit
y?
K
g p
er h
our
/ day
28
. D
oes
th
e p
roce
ssin
g c
ente
r w
her
e yo
u w
ork
hav
e a
mec
han
ical
pulp
pre
ss?
Y N
If s
o, w
hat
is
its
cap
acit
y? K
g /
t o
f pulp
per
hour
/ day
If n
ot,
wh
at i
s th
e ce
nte
r pre
ssin
g c
apac
ity?
K
g /
t o
f pulp
per
hour
/ day
29
. D
oes
th
e p
roce
ssin
g c
ente
r w
her
e yo
u w
ork
hav
e an
oil
cla
rifi
er? Y
N
If s
o, w
hat
is
its
cap
acit
y?
K
g /
t o
f oil
per
hour
/ day
If n
ot,
wh
at i
s th
e ce
nte
r cl
arif
yin
g c
apac
ity?
K
g /
t o
f oil
per
hour
/ day
30
. D
oes
th
e p
roce
ssin
g c
ente
r w
her
e yo
u w
ork
hav
e an
oil
-sto
ring p
lace
? Y
N
If s
o, w
hat
is
its
cap
acit
y? m
3 o
f st
ora
ge
tank
cap
acit
y
If n
ot,
wh
at i
s th
e ce
nte
r st
ori
ng a
nd c
apac
ity?
m3
31
. D
oes
th
e p
roce
ssin
g c
ente
r h
ave
an o
il-p
ackin
g u
nit
(bott
ler)
? Y
N
If s
o, w
hat
is
its
cap
acit
y? K
g /
Lit
ers
of
pac
kag
ed p
alm
oil
per
hour
/ day
If n
ot,
wh
at i
s th
e ce
nte
r bulk
conta
iner
cap
acit
y?
K
g /
Lit
ers
32
. W
hat
is
the
oil
ex
trac
tio
n r
atio
/rat
e (K
g o
f C
PO
/ K
g o
f F
FB
) of
the
pro
cess
ing
unit
wher
e
yo
u w
ork
? %
33
. D
oes
th
e p
roce
ssin
g c
ente
r w
her
e yo
u w
ork
hav
e a
qual
ity
contr
ol
syst
em? Y
N
If s
o, w
hat
is
the
aver
age
% F
ree
Fat
ty A
cids
in t
he
oil
that
you
pro
duce
?
34
. D
o y
ou
ap
ply
an
y w
aste
man
agem
ent
tech
niq
ue?
Y
N