Electrocoagulation for Treatment of Industrial Effluents and Hydrogen Production

IRCAB Journal of Science and Technology: June 2012, Vol. 2. No. 1 1
SAFETY ANALYSIS OF DYNAMIC PILES LOADS CARRYING CAPACITY USING HILEY, JANBU AND GATES FORMULAE
OPEYEMI, A.O.
Department of Civil Engineering Technology Rufus Giwa Polytechnic
PMB 1019, Owo, Ondo State, Nigeria [email protected]; [email protected]
Abstract
The safety analysis of the load carrying capacities of piles based on dynamic approach using Hiley, Janbu and Gates formulae is reported in this paper, this has become necessary because pile capacities determined from dynamic formulae have shown poor correlations and wide scatter when statistically compared with static load test results. In practice, uncertainties are common phenomena in engineering, therefore all the interrelated variables in the load carrying capacities of piles should be treated as random variables. Assuming practical probability density functions, the concept of the First-Order Reliability Method (FORM) as a powerful tool for estimating nominal probability level of failure associated with uncertainties is therefore adopted for estimating the implied safetyindex associated with the formulae of Hiley, Janbu and Gates. The results show that there is a good correlation between the implied safety levels in Hiley and Janbu formulae, while those associated with Gates are exceptionally different and grossly conservative.
Keywords: Safety analysis, load carrying capacities of piles, dynamic pile formulae, safety index, probability level of failure.
Introduction The well-known dynamic formula has been criticized in many publications.
Unsatisfactory prediction in pile capacity by dynamic formulae is well characterized in the recent published Manual for Design and Construction of Driven Pile Foundations (Hannigan et. al, 1996), in which it was
concluded: “Whether simple or more comprehensive dynamic formulas are used, pile capacities determined from dynamic formulae have shown poor
correlations and wide scatter when statistically compared with static load test results. Therefore, except where well supported empirical correlations under a given set of physical and geological conditions are available,
dynamic formulas should not be used.”
There are two attempts to breathe new life into dynamic formulae. First, Paikowsky and Chernauskas (1992) and Paikowsky, et al (1994), have suggested one more simplified energy approach using dynamic
measurements for the capacity evaluation of driven piles. Liang and Zhou (1997), have concluded regarding this method: “Although the delivered
energy is much more exactly evaluated, this method still suffers similar drawbacks of Engineering News (ENR)”. Criticizing the simplified energy approach, Liang and Zhou (1997), have developed a probabilistic energy
approach as an alternative to the signal matching technique for effective

IRCAB Journal of Science and Technology: June 2012, Vol. 2. No. 1 2
pile-driving control in the field. Both attempts to improve dynamic formulas, comparison of pile capacity determined by the simplified and
probabilistic energy methods with the results of Static Load Tests, are incorrect. Dynamic formulas, including their two new representations, using
maximum energy, pile set and maximum displacement from Dynamic Pile Testing do not take into account the time between Static Load Tests and Dynamic Pile Testing (Svinkin,1997).
The purpose of design is the achievement of acceptable probabilities that the structure being designed will not become unfit in any way for the use for
which it is intended. Engineering problems of this structure, however, often involve multiple failure modes; that is, there may be several potential modes
of failure, in which the occurrence of any one of the potential failure modes will constitute non- performance of the system or component. Recent researches in the area of structural reliability and probabilistic analysis
have centered on the development of probabilistic-based design procedures. These include load modeling, ultimate and service load performance and
evaluation of current levels of safety/reliability in design (e.g., Farid Uddim, 2000; Afolayan and Opeyemi, 2008).
In this paper,the safety analysis of the load carrying capacities of piles based on dynamic approach using Hiley, Janbu and Gates formulae is reported, which is being carried out by first-order reliability assessment; precisely,the
concept of the First-Order Reliability Method (FORM).
Materials and Methods Estimating the ultimate capacity of a pile while it is being driven in the ground at the site has resulted in numerous equations being presented to
the engineering profession. Unfortunately, none of the equations is consistently reliable or reliable over an extended range of pile capacity. Because of this, the best means for predicting pile capacity by dynamic
means consists in driving a pile, recording the driving history, and load testing the pile. It would be reasonable to assume that other piles with a
similar driving history at that site would develop approximately the same load capacity.
Dynamic formulae have been widely used to predict pile capacity. Some means is needed in the field to determine when a pile has reached a
satisfactory bearing value other than by simply driving it to some predetermined depth. Driving the pile to a predetermined depth may or may not obtain the required bearing value because of normal soil variations both
laterally and vertically. The basic dynamic pile-capacity formula termed the rational pile formula
depends upon impulse – momentum principles (Bowles, 1988). The available dynamic pile capacity predictions include:
(a) Canadian National Building Code (use a safety factor, SF = 3)

IRCAB Journal of Science and Technology: June 2012, Vol. 2. No. 1 3
1
2 3
h hu
e E CP
s C C
(1)
In which
2
1
(0.5 )r p
r p
W n WC
W W
2
3
2
uPC
A
And
3 0.0001L
CE
(b) Danish formula (use SF = 6 )
1
h hu
e EP
s C
(2)
Where
12
h he E LC
AE
(c) Gates formula (use SF = 3)
( log )u h hP a e E b s (3)
(d) Janbu (use SF = 3 to 6)
h hu
u
e EP
k s
(4) In which
(1 1 )u d
d
k CC
Where
0.75 0.15p
d
r
WC
W
And
2
h he E L
AEs
(e) Modified ENR formula (use SF = 6)
21.25
0.1
r ph hu
r p
W n We EP
s W W
(5)
(f) Pacific Coast Uniform Building Code (PCUBC) (use SF = 4)
(6)

IRCAB Journal of Science and Technology: June 2012, Vol. 2. No. 1 4
Where,
1r P
r p
W kWC
W W
In which,
k = 0.25 for steel piles k = 0.10 for all others And,
2uP L
CAE
(g) Hiley
2
1 2 3
1( )
2
ph hu
p
W n We EP
W Ws k k k
(7)
Where: A = Pile cross-sectional area
E = Modulus of Elasticity eh = Hammer efficiency Eh = Manufacturers’ hammer-energy rating
h = Height of all of ram K1 = Elastic compression of capblock and pile cap and is a
form of PuL/AE
K2 = Elastic compression of pile and is of a form of PuL/AE K3 = Elastic compression of soil, also termed quake for wave-
equation. L = Pile length n = Co-efficient of restitution
Pu = Ultimate pile capacity s = Amount of point penetration per blow.
Wp = Weight of pile including weight of pile, cap, driving Shoe, and capblock (also
includes anvil for double-acting steam hammers)
Wr = Weight of ram (for double-acting hammers include weight of casing).
The general problem to which FORM provides an approximate solution is as follows: The state of a system is a function of many variables some of which
are uncertain. These uncertain variables are random with joint distribution
function 1
( ) ( { })n
x i i
i
F x P X x
defining the stochastic model. For FORM, it is
required that XF (x), is at least locally continuously differentiable, i. e., that
probability densities exist. The random variables X 1( ,... )T
nX X are called
basic variables. The locally sufficiently smooth (at least once differentiable) state function is denoted by g(X). It is defined such that g(X)>0 corresponds
to favourable (safe, intact, acceptable) state. g(X)=0 denotes the so-called limit state or the failure boundary. Therefore, g(X) <0 (sometimes also g(X) 0)
IRCAB Journal of Science and Technology: June 2012, Vol. 2. No. 1 5
defines the failure (unacceptable, adverse) domain, F. The function g(X) can be defined as an analytic function or an algorithm (e.g., a finite element
code). In the context of FORM it is convenient but necessary only locally that g(X) is a monotonic function in each component of X. Among other useful
information FORM produces an approximation to
( ) 0
( ) ( ( ) 0) ( )f X
g x
P P X F P g X dF x
= ( )R (8)
In which R = the safety index, (Melchers, 2002).
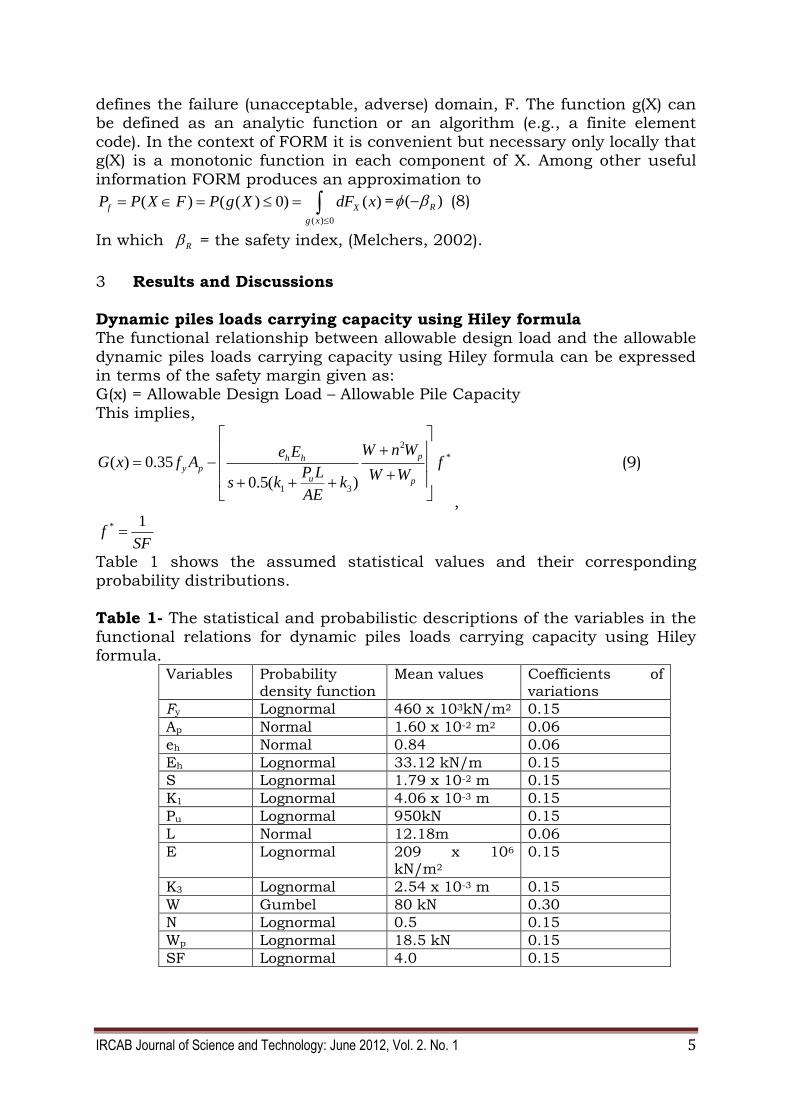
3 Results and Discussions
Dynamic piles loads carrying capacity using Hiley formula The functional relationship between allowable design load and the allowable
dynamic piles loads carrying capacity using Hiley formula can be expressed in terms of the safety margin given as: G(x) = Allowable Design Load – Allowable Pile Capacity
This implies,
2
*
1 3
( ) 0.35
0.5( )
ph hy p
u p
W n We EG x f A f
P L W Ws k k
AE
,
(9)
* 1f
SF
Table 1 shows the assumed statistical values and their corresponding
probability distributions.
Table 1- The statistical and probabilistic descriptions of the variables in the functional relations for dynamic piles loads carrying capacity using Hiley formula.
Variables Probability density function
Mean values Coefficients of variations
Fy Lognormal 460 x 103kN/m2 0.15
Ap Normal 1.60 x 10⁻² m2 0.06
eh Normal 0.84 0.06
Eh Lognormal 33.12 kN/m 0.15
S Lognormal 1.79 x 10⁻² m 0.15
K1 Lognormal 4.06 x 10⁻³ m 0.15
Pu Lognormal 950kN 0.15
L Normal 12.18m 0.06
E Lognormal 209 x 106 kN/m2
0.15
K3 Lognormal 2.54 x 10⁻³ m 0.15
W Gumbel 80 kN 0.30
N Lognormal 0.5 0.15
Wp Lognormal 18.5 kN 0.15
SF Lognormal 4.0 0.15

IRCAB Journal of Science and Technology: June 2012, Vol. 2. No. 1 6
Dynamic piles loads carrying capacity using Janbu Formula For the dynamic piles loads carrying capacity predicted by Janbu, the level
of safety margin may be given as:
2
( ) 0.35 1 1 *
(0.75 0.15 ) 0.75 0.15
h h
h hy p
p p
r r
e E L
e E AEsG x f A s fW W
W W
(10)
From equation (10), the statistical and probabilistic descriptions of the
variables in the functional relations are presented in Table 2. Table 2- The statistical and probabilistic descriptions of the variables in the
functional relations for dynamic piles load carrying capacity using Janbu formula.
Variables Probability density function
Mean values Coefficient of variations
Fy Lognormal 460 x 103kN/m2 0.15
Ap Normal 1.60 x 10⁻² m2 0.06
eh Normal 0.84 0.06
Eh Lognormal 33.12 kN/m 0.15
Wp Lognormal 18.5 kN 0.15
Wr Gumbel 35.58 kN 0.30
L Normal 12.18m 0.15
E Lognormal 209 x 106 kN/m2 0.06
Dynamic piles loads carrying capacity using Gates Formula
Similar to Hiley and Janbu, the functional relationship between the allowable design load and the allowable dynamic piles loads carrying capacity using Gates formula can be expressed as:
*( ) 0.35 ( log )y p h hG x f A a e E b s f
(11)
The statistical and probabilistic descriptions of the variables in the functional relations are presented in Table 3.
Table 3- The statistical and probabilistic descriptions of the variables in the functional relations for dynamic piles loads carrying capacity using Gates
formula. Variables Probability
density functions
Mean values Coefficients of variables
Fy LN 460 x 103kN/m2 0.15
Ap N 1.60 x 10⁻² m2 0.06
a N 1.05 x 10⁻¹ 0.06
eh N 0.85 0.06
Eh LN 33.12 kNm 0.15
b N 2.4 x 10⁻³ m 0.06
S LN 1.79 x 10⁻² m 0.15
SF LN 3.0 0.15

IRCAB Journal of Science and Technology: June 2012, Vol. 2. No. 1 7
As is common in practice, the areas of piles, hammer efficiency, hammer energy rating and point penetration per blow are subjected to variations and
the results of the assessment are as depicted in Figures 1to5. While considering equations (9), (10) and (11) together with the statistical and
probabilistic descriptions of the variables in the functional relations in Tables 1, 3 and 3, the safety levels associated with the predictions of Hiley, Janbu and Gates for dynamic piles loads carrying capacities are estimated.
Hiley formula generally and grossly provides a very conservative pile capacity as illustrated in Figures 1 to 5. Nevertheless, the safety level does
not change with area of pile as seen in Figure 1 and the point penetration per blow in Figure 4. The safety level reduces significantly as shown in
Figures 2 and 3 respectively, as hammer efficiency and hammer energy rating increase. As normally expected, which also is a check for a functioning engineering system, in Figure 5, the safety level increases with
increasing factor of safety.
Janbu formula leads to a grossly conservative pile capacity. However, Janbu’s prediction is not as conservative as Hiley’s with respect to hammer efficiency and hammer-energy rating. The implied safety level associated
with piles loads carrying capacity using Gates’ formula is grossly conservative, even much more than Hiley and Janbu formulae. In Figures 1 to 4, the safety level remains constant with the area of pile, hammer
efficiency, hammer-energy rating and point penetration per blow.Generally Gates’ formula yields the most grossly conservative prediction compared to
Hiley and Janbu.
Fig.1 - Safety index against Area of pile.

IRCAB Journal of Science and Technology: June 2012, Vol. 2. No. 1 8
Fig.2 - Safety index against Hammer efficiency.
Fig 3 - Safety index against Hammer- energy.
Fig 4 - Safety index against Point penetration per blow.
Safe
ty i
nd
ex
Hammer efficiency
HILEY
Safe
ty i
nd
ex
Hammer-energy rating (kNm)
HILEY
Safe
ty i
nd
ex
Point penetration per blow (m)
HILEY

IRCAB Journal of Science and Technology: June 2012, Vol. 2. No. 1 9
Fig.5 - Safety index against Factor of safety.
Conclusion
The First-Order Reliability Method has been employed to rate dynamic piles loads carrying capacity using Hiley, Janbu and Gates formulae. All relevant variables are considered random with assumed probability density
distributions. From the results, it can be concluded that there is a correlation between the implied safety levels in Hiley and Janbu formulae.
The dynamic piles loads carrying capacity predictions of Hiley and Janbu lead to similar safety level while Gates’ results in totally different implied safety levels.
References Afolayan, J. O. and Opeyemi, D. A. (2008). Reliability Analysis of Static Pile
Capacity of Concrete in Cohesive and Cohesionless Soil. Research Journal of Applied Sciences. 3(5):407-411.
Bowles, J. E. (1988). Foundation Analysis and Design. 4th ed., McGraw-Hill
Book Company, Singapore. Farid Uddin, A. K. M. (2000). Risk and Reliability Based Structural and
Foundation Design of a Water Reservoir (capacity: 10 million gallon) on the top of Bukit Permatha Hill in Malaysia. 8th ASCE Specialty Conference on Probabilistic Mechanics and Structural Reliability.
Hannigan P.L.J, Goble G.G., Thendean G., Likins G.E. and Rausche F. (1996). Design and Construction of Driven Pile Foundations.
Workshop manual. Publication No.FHWA-HI-97-014. Liang R.Y. and Zhou J. (1997). Probability Method Applied to Dynamic Pile-
Driving Control. Journal of Geotechnical Engineering, ASCE, 123:(2),137-144.
Safe
ty i
nd
ex
Factor of Safety
HILEY

IRCAB Journal of Science and Technology: June 2012, Vol. 2. No. 1 10
Melchers, R.E. (2002). Structural Reliability, and Prediction.2nd ed. John Wiley, England.
Paikowsky S.G. and Chernauskas L.R.(1992). Energy approach for capacity evaluation of driven piles. F. Barends (ed.), Proceedings of Fourth International Conference on the Application of Stress- Wave Theory to Piles, A.A. Balkema, The Hague, 595-601.
Svinkin M.R. (1997). Time-Dependent Capacity of Piles in Clayey Soils by Dynamic Methods.Proceedings of the XIVth International Conference on Soil Mechanics and Foundation Engineering, Hamburg, Germany,
September, Vol. 2, 1045-1048.

IRCAB Journal of Science and Technology: June 2012, Vol. 2. No. 1 11
INDIGENOUS KNOWLEDGE OF RESTORING AND MAINTAINING SOIL FERTILITY IN ONDO STATE, NIGERIA
1ADEGBITE, B.A, 1AROWOLO, A.D, 1AJIBOYE, J.A., 1OSUOLALE, T.O,
2MAKINDE, A.F 1Department of Agric., Sc.
Osun State College of Education. Ilesa – Nigeria [email protected]
2Rubber Research Institute of Nigeria. P.M.B. 1049, Iyanomo
Benin City, Edo State – Nigeria Abstract
An understanding of good farming begins with an understanding of and respect for the soil; through understanding of how poor soil could be made better just as careless use of soil might lower the value. This study assessed the indigenous knowledge of soil restoration and management of soil fertility in Ondo state. Data were collected using interview schedule in 3 Local Government Areas (Akure South, Akure North, and Owo) where 150 respondents were randomly selected. Data collected were analyzed using descriptive and inferential statistical tools and the findings reveals that male farmers (81.4%) were more active in the management of soil than women (18.6%). Youth activities were rated at 4.1% while adult (82.7%) were more prominent and 13.1% respondents were very old farmers who engaged the use of indigenous practices of soil management. Also, majority -(68.3%) of farmers were educated while 13.7% were not literate but found to be highly experienced. It was observed that 66.2% of the respondents were small-farm holders as they cultivate less than 2 hectares of land. Indigenous practices of soil management uses in the study area are application of compost, farm residue, green manure, fallowing and crop rotation are among others. Chi-square analysis shows no significant relationship between socio-economic characteristics of farmers and the use of indigenous knowledge by the respondents. In addition, there is no significant relationship between male
and female respondents(X2cal 1.680 < X2
tab 1.960) and the use of indigenous knowledge of soil management is significant to soil output. Finally, multiple regression analysis reveals that 82.4% of variations in the use of indigenous knowledge of soil fertility management were explained by level of education, extension contact and farming experience. Introduction Restoring and maintaining soil fertility is a vital prerequisite for increasing
output, especially given the current food crisis. Soils are fragile, when they are used for intensive cultivation, they quickly become degraded especially in the mountain of high land areas where they are subject to severe erosion.
A study of Food and Agricultural Organization FAO reveals that soils in Africa lose an annual average of 48kg/ha of nutrients. To compensate for
this loss, they receive an average of just 10kg of mineral fertilizer, compared with a global average of 90kg (Score, 2009). The food crisis and rise in fertilizer prices make this a good time to consider incorporating indigenous

IRCAB Journal of Science and Technology: June 2012, Vol. 2. No. 1 12
knowledge into general practices of soil conservation and improvement techniques that have long been developed but are still not given wider
consideration. To ensure permanent cover for the soil crop residues left after harvesting, straw, compost, waste from wood or other products can help
protect precious soil from wind, extreme heat and heavy rainfall which leach nutrients and compact the soil. Also, a light forking of the earth is sufficient, this will not disturb the top layer of the soil by working it too vigorously and
the practice of crop rotation enables farmers to alternate leguminous plants which enrich the soil with more intensive crops such as cereals. An understanding of good farming begins with an understanding of and respect
for the soil through understanding of how poor soil could be made better (Peter, 1979).
Nigeria is predominantly an agrarian state, as over 70% of its population engages in one form of agricultural activity or the other. The nation has
comparative advantages of growing cash crops, such as Cocoa, Kola, Coffee, Oil palm and staple food crops such as cereal crops, plantain, tuber crops
and vegetables for the growing population and raw materials for continuous growth of her industries. The importance of agriculture to the Nigerian economy cannot over emphasized. Prior to the discovery of crude oil in
commercial quantity, share of agriculture to total Gross Domestic Products (GDP) was 70% but neglect of agricultural sector has made its contribution decline. Share of agriculture to total GDP has been 40.6% in 2000, 41.1% in
2001 and 41.2% in 2002 (CBN, 2003).
A number of major programmes aimed at restoring soil fertility have been launched recently; these include a partnership between main UN agencies, the New Partnership for Africa’s Development (NEPAD), the EU and a wide
range of regional and international organization as well as the Alliance for a Green Revolution in Africa (AGRA) which has set the goal of regenerating 6.3 million ha of agricultural land.
Indigenous Knowledge System (IKS) is described as a body of knowledge
acquired by local people through accumulation of experiences and informal experiments in an effort to cope with their agro-ecological and socio-economic environment (Warren, 1993; Fernandez, 1994; and Mar, 2000).
Ngwasiri (1993), argued that neither indigenous knowledge nor the modern
knowledge of soil management provide sustainable solutions to meet future demand of food crops. It uses must be combined with other techniques for conserving and improving land and these must be adapted to the ecological
and economic conditions of each region (Agbamo, 1993). Atteh (1990) and Adeyemo (1996), reported that there is a reservoir of
valuable and largely untapped natural resources and indigenous knowledge that could be developed and its uses will reduce aggressive cultivation that
will improve soil fertility, pests and diseases in Nigeria.

IRCAB Journal of Science and Technology: June 2012, Vol. 2. No. 1 13
Objectives of the Study Sustaining soil fertility has become a major issue for agricultural research
and development in Sub-Sahara Africa (SSA). Hence, this study will determine the socio-economic characteristics of small holding farmers, their
economically attractive indigenous soil management techniques and their contact with extension agents will be identified.
Research Methodology The study was carried out in Ondo state, Nigeria. This state is located in South West of Nigeria between longitude 40E and 60E of the Greenwich and
Latitude 50 N and 80N of the equator. The state enjoys 7-9 months of rainfall. Bulk of food and cash crops produced in the region comes from the
state; these include cassava, plantain, yam, cocoa and oil palm. Three Local Government Areas were purposively selected from eighteen
Local Government Areas because their soil is fertile with humus and varying aggregates of loamy, clay and sand. These include Akure South, Akure
North, and Owo Local Government Areas. Five communities were randomly selected from each of these Local Government Areas, making a total of fifteen communities. Each community was divided into two wards making a
total of thirty wards. Five farmers were randomly chosen given that ten farmers were considered for the study from each selected wards which resulted to a sample population of 150 respondents.
Results and Discussion
About 145 copies of survey instrument used were safely returned and the discussion was based on the returned copies (n = 145).
Table 1: Socio-economic characteristics of the Respondents
Age (year) F %
> 30 30-40
41-50 51-60 < 60
Total Sex Female
Male Total
6 54
27 39 19
145
27
118 145
4.1 37.2
18.6 26.9 13.1
100.0
18.6
81.4 100.0
Education attainment f %

IRCAB Journal of Science and Technology: June 2012, Vol. 2. No. 1 14
No formal education
Adult education Primary Secondary
NCE/ND HND/B.Sc Total
Farm size (ha) > 2
2-4 5-7 8-10
< 10 Total
Farming experience (year)
> 10 10-20 21-30
31-40 < 40
Total Source of Information Extension agent
Parents Experience
Others Total
46
23 38 20
9 9
145
96
26 11 7
5 145
61
56 19 4
5 145
27 70
24 24
145
31.7
15.9 26.2 13.8
6.2 6.2
100.0
66.2
17.9 7.6 4.8
3.4 100.0
42.1
38.6 13.1 2.8
3.4 100.0
18.6 48.3
16.6 16.6
100.0
I.K on soil output F %

IRCAB Journal of Science and Technology: June 2012, Vol. 2. No. 1 15
Outstanding
Satisfactory Average Below average
Unsatisfactory Total Extension Contact
Yes No
Total Use of N.P.K Yes
No Total
Years of adoption, I.K > 10 10-20
21-30 31-40 < 40
No response Total
29
60 33 17
6 145
36 109
145
56
89 145
44 36
14 3 3
45 145
20.0
41.4 22.8 11.7
4.1 100.0
24.8 75.2
100.0
38.6
61.4 100.0
30.3 24.8
9.7 2.1 2.1
31.0 100.0
Source: Field Survey, 2011 I.K. – Indigenous Knowledge
The finding in the above Table 1 shows that 4.1% of the respondents were young/youth farmers while 82.7% were between the age bracket of 30 and
60 years which characterized them as adult farmers and 13.1% were in the age category of above 60 years old. This category is characterized as very old and weak farmers. It implies that majority of respondents were in their
active and productive age which is best required for farming activities. About 81.4% were male farmers while 18.6% were female; this is an indication that
male farmers were more prominent in farming than their women counterparts.
It was also observed that majority (68.3%) of the respondents were literates while 31.7% were not literate but characterized as highly experienced farmers. About 66.2% engaged less than 2 hectares of farmland, this implies
that majority of them were small farm holders and subsistence farmers. Majority of farmers have less than 10 years of farming experience and 38.6%
of them having between 10-20 years experience in farming. Some (54.5%) having between 10 and 40 years experience is an indication that farming has been a popular and long aged occupation in the study area. About
48.3% of the respondents know about indigenous knowledge of soil management through transmission of knowledge from generation to
generation by their parents while 18.6% of them aware through activities of extension agents and 16.6% of them depended on their experience and informal experiments. On the effectiveness of uses of indigenous knowledge
of soil management, majority (41.4%) rated it as satisfactory, 22.8%

IRCAB Journal of Science and Technology: June 2012, Vol. 2. No. 1 16
described it as average while 4.1% were unsatisfied with the use of indigenous knowledge.
It also revealed that majority (61.4%) of respondents preferred the use of
indigenous practices of soil management to the use of NPK fertilizer where only 38.6% apply the use of synthetic fertilizer. Over 70.0% of the respondents have had contact with extension agents, this could be linked
with the high level of literacy among the respondents. Table 2: User Categories of Indigenous Knowledge of Soil Fertility
Method
Category
Compos
t
Crop
rotation
Farm
residue
Green
manure
Inter
cropping
Fallowin
g
F % f % f % f % f % f %
Adopter
Non- adopter
25
120
17.
2 82.8
79
66
54.
5 45.5
41
104
28.
3 71.7
13
6 9
93.
8 6.2
26
119
17.
9 82.1
31
114
21.
4 78.6
Total 145
100.0
145 100.0
145
100.0
145
100.0
145
100.0
145
100.0
Source: Field Survey, 2011
The result in theTable 2 reveals that majority (93.8%) of the respondents use the application of green manure, followed by crop rotation with record of 54.5% users. The least adopted indigenous practice was application of
compost having record of 17.2%. This is an indication that many respondents are familiar with the application of one form of indigenous
knowledge of soil management or the other. But the most popularly embraced practice is application of green manure probably because it attracts no financial implication,
Table 3: Analysis of Chi-Square on Socio-economic characteristic of respondents
Demographic X2cal X2
tab df decision
Age Gender Education
Farm size
7.577 2.987 11.830
8.784
15.51 5.99 21.03
9.49
8 2 12
4
NS NS NS
NS
It is observed from Table 3 that, there is no significant relationship between socio-economic characteristics (Age, sex, educational level and farm size) of respondents and application of indigenous knowledge of improving soil
fertility.

IRCAB Journal of Science and Technology: June 2012, Vol. 2. No. 1 17
Table 4: t-test analysis of the difference in the sex of respondents
Independent Variable
t-value (cal)
t-value (tab)
df sig decision
Use of 1kg 1.680 1.960 143 0.095 NS
Significant at <0.05
There is no significant difference between male and female farmers who have
adopted use of any form of indigenous knowledge of restoration and management of soil fertility in the study area.
Table 5: Chi-Square analysis of the relationship between the uses of indigenous knowledge and soil output
Independen
t Variable
Use of Indigenous knowledge
t-value X2 (cal)
t-value X2 (tab)
df decision
Soil output 22.626 11.07 5 S*
Significant at <0.05
The result shows a significant relationship between the application/adoption of indigenous knowledge of soil management and the output. It implies that
application of any of these local practices enhances soil output in terms of yield.
Table 6: Multiple Stepwise Regression Analysis
Variables Regression Coefficient
Standard Error
Wald Sig Decision
Farm size
Age Education
Extension contact Farming
experience Constant
3.304
- 1.419 7.269
5.102 8.266 8.054
2.182
1.386 1.971
2.047 2.554 1.723
2.294
1.049 13.604
6.215 10.478 21.848
0.130
0.306 0.000
0.013 0.001 0.000
NS
NS NS
NS NS NS
Significant at 0.05 R2 = 0.824
The result in Table 6 shows that three independent variables (education
level, extension contact and farming experience) were able to predict up to 82.4% of the total variation in indigenous knowledge used to restore and manage soil fertility. It implies that the level of education of respondents
predicts the use of indigenous knowledge of soil conservation. It means that the higher the level of education the less the use of local practices. Also, the more the contact with extension agent, the less the tendency to continue
with the use of indigenous practices. Finally, the more experienced the

IRCAB Journal of Science and Technology: June 2012, Vol. 2. No. 1 18
respondents are, the higher the tendency to continue the use of any of the indigenous practices. Indigenous knowledge is generated through a
systematic process of experimenting with solution to modify environmental, socio-economic and technological situation (Brouwers, 1993).
Summary, Conclusion and Recommendation The study focused on indigenous strategies and approaches of farmers to
improve soil fertility conditions in their communities. The study concludes that farmers understand the concept of soil fertility through their localized means and informal experiments that have yielded good results. It is
therefore recommended that, proper documentation of indigenous based technologies used by farmers which were formally transmitted from one
generation to another over time will enhance potential future role of indigenous knowledge of restoring and maintaining soil fertility.
REFERENCES Adeyemo, R (1996) Biotechnological Development: Building Indigenous
Knowledge Workshop proceeding on Indigenous Knowledge and
Biotechnology. P67-74 Agbamo, J.A (1993) Analysis Characteristics Associated With Adopt of Soil
Management Innovations in Ikorodu L.G. of Lagos State.
Atteh, D.O (1990) Participatory Research and Development. The route to Sustaining Agriculture and Rural Development in Nigeria. Paper
Presented at the Workshop on Farmers Participatory Research Experience and Future. Abeokuta. November, P4-25.
Brouwers, J.H (1993) Rural People Response to Soil fertility decline. The
Adja case, Benin. Wagenigen, Agricultural University Paper P93-94 Central Bank of Nigeria (2003) Statistical Bulletin. Vol.6, No 2 P111-115
Fernandez, M.E (1994) Gender and Indigenous Knowledge in Indigenous
Knowledge Monitor Akke, W.T. (ed.) Vol 2, December. P6 – 7 Mar, C. Abebe, S, Mikitu, H (2000) Farmers Knowledge of Soil fertility and
Local Management Strategies in Tigras, February. P4 -13 Ngwasiri, C.N. (1995) Knowledge is of two kinds, Bulletin of Technical Centre
for Agriculture and Rural Cooperation. No 60, December, P7-9
Peter, M (1979) West African Soils. University Press Oxford, P. 254 – 256
Spore, (2009) CTA’s Monthly Bulletin of the Information for Agricultural
Development in ACP countries. No 139 February, CTA Wageninges Netherlands. P12-13
Warren, D.M, Rajasekeran, B (1993) Putting Local Knowledge to Good Use
International Agricultural Development. July/August, P8 – 10

IRCAB Journal of Science and Technology: June 2012, Vol. 2. No. 1 19
EFFECT OF COMPUTER DRILL ON AUTOMOBILE TECHNOLOGY STUDENTS ACHIEVEMENT IN LAGOS STATE TECHNICAL COLLEGES
1FAKOREDE, S. O. A. (Ph.D), 2LEMO, O. & 3ADEGBENJO, A.
1Department of Science and Technology Education, University of Lagos, Akoka, Lagos, Nigeria.
2Department of Technical Education Tai Solarin University of Education, Ogun state.
3School of Technical Education, Federal College of Education Akoka Yaba, Lagos. [email protected] & [email protected]
Abstract
The study sought to determine the effect of computer drill on automobile technology students’ achievements. High failure rate was observed to be pronounced and persistent in National Business and Technical Examination Board (NABTEB) examinations for the past ten years. This study aimed at seeking a student- teacher friendly method in aiding learning and thus reduce failure rate. Quasi experimental design was adopted for the study. The population for the study comprised 204 Automobile technology students in the six state Technical colleges. The entire population was used due to the relatively small and manageable size. The instrument used for data collection was the Automobile Technology Computer Drill Achievement Test (ATCDAT). The three research questions in the study were analyzed with the use of mean and standard deviation while Analysis of Covariance (ANCOVA) was used in analyzing the two hypotheses at 0.05 level of significance. The study found that students taught Automobile technology using the ATCDAT have a higher mean score than students taught using the conventional method in the achievement test, the study also found that geographical location has no hindrance on students’ response and finally the study found as well that gender has no inhibiting effect on the students’ recall ability in the achievement test when taught using the ATCDAT. The study recommended
that Automobile technical; Teachers should adopt the use of Computer Drill in teaching, and that government and school administrator should equipped school with functional and well equipped Computer laboratory.
Introduction
Technology is dynamic the world over. With advancement in technology, electronic gadgets and other products that are imported or assembled in Nigeria are coming with new devices to such an extent that technological development
is in a constant state of flux and change. The influence of technological development in electronic industries has rendered traditional skills inadequate for work while creating the need for new and often sophisticated skills. These
technological developments and technological products being brought with them have forced traditional education systems to be changed and new ones
added to the means and tools used (Kara and Kachraman, 2008).

IRCAB Journal of Science and Technology: June 2012, Vol. 2. No. 1 20
In addition, technological developments have resulted in a big gap between teaching methods at school and the way students are getting information in
society. Capri, Ozseevgee, Sayilkan and Emre (2004), noted that because most students get their information via visual content sources like the computer
which is used in daily life very much, it is becoming increasingly difficult to teach something to students by traditional means. Teaching according to Akudolu (1998), is a deliberate effort by a mature or experienced person to
impart information, knowledge, skills, and so on to an immature or less experienced person through a process that is morally and pedagogically acceptable. Traditional teaching method therefore involves the setting up of
activities such as lecture, demonstration, project, use of lesson plans and talk-chalk to enable the student learn something which can improve the
person's knowledge, skills, attitudes and values. Conventional method is a teacher centered method of teaching.
Computer drill refers to the use of computer as a tool in teaching and learning. It includes drill and practice, tutorials, simulations, instructional
management, supplementary exercise, data base management, word processing and other types of computer applications. Kulik (1983), defines Computer Drill as instruction or remediation presented on a computer.
computer drill is also the use of computer and component electronics in providing learning experiences and self directed instructions to a learner using tutorial and simulation packages with little or no assistance from instructors.
Kulik, Beingert and Williams (1983), opine that computer drill improves instruction for students with disabilities because students receive immediate
feedback and do not continue to practice the wrong skills. computer drill moves at the students' pace and usually does not move ahead until they have mastered the skill. Most importantly, computer drill is interactive and can
illustrate a concept through attractive animation, sound and demonstration (Nweke, 2007).
Statement of the Problem There is a general concern over the apparent low performance of technical
college graduates, most especially those of motor vehicle mechanic works who cannot cope with the world of work. The goal of motor vehicle mechanics works in technical colleges in Nigeria according to NBTE (2009)
is to produce skilled craftsmen with good knowledge of the working principles of motor vehicle and the techniques and safety practices involved
in its maintenance. Technical college graduates have prospects of either being employed in the industries or set-up their own automobile workshop and become self-employed. Better still, the technical college products on
graduation should have the opportunity of furthering their education in higher institutions. However, contrary to achieving the above goal, majority of students have been completing the programme with very poor academic
performance and inadequate skills incapable of earning them a living (Okoro, 1991).
All these may be as a result of deficiency in methods of teaching used by their teachers. Kann (1987), observes that during classroom instruction, many

IRCAB Journal of Science and Technology: June 2012, Vol. 2. No. 1 21
traditional methods have been used in the past for teaching Automobile technologyat the senior secondary school level but still poor achievement
persists. Ogwo (2006), opines that Nigeria is saddled with educational problems of great magnitude that learning cannot solve. This is why it is
necessary to determine the effect of Computer drill on academic achievement of Automobile technology students in senior secondary schools in Lagos State, Nigeria.
Research Questions As a result of the problem stated above the following research questions were
formulated to guide the study: What are the mean score and standard deviation of experimental and control
groups on computer drill in Automobile Technology achievement test? 1. What are the mean score and standard deviation of experimental and
control groups’ gender on computer drill in Automobile Technology
achievement test? 2. What is the effect of using computer drill on students’ retention in
Automobile Technology achievement test? Hypotheses
The following null hypotheses which were tested at 0.5 level of significance, guided the study. HO 1: There is no significant difference between the mean scores of students
taught with the computer drill and those taught with the conventional methods in Automobile Technology achievement test
HO 2: There is no significant difference between the mean scores of male and
female students exposed to the computer drill.
Methodology The design adopted for the study was the quasi-experimental pre-test, post-test
experimental non equivalent control group. The two groups (made up of six technical colleges) experimental and control groups were randomly assigned to
the methods of teaching. Intact classes were also randomly assigned to different treatment conditions. This implies that intact classes (non- randomized groups) participated in the study. According to Ofo (2002), quasi experimental research
design permits the use of intact classes. This design was adopted because it was not possible for the researcher to randomly sample the students and
assign them to groups without disrupting the academic programme and the time table of the schools involved in the study.
Area of Study This study was carried out in Lagos State; the study covered the six technical colleges in the state. These schools were selected because they
offered Automobile technology trade course and they have the basic requirements to run the programme

IRCAB Journal of Science and Technology: June 2012, Vol. 2. No. 1 22
Population The population for this study was six technical colleges in the state offering
Automobile technology consisting of 204 students offering Automobile Technology in the six Technical colleges in the state. This is made up of 1168
boys and 36 girls. The entire population was used due to the relative small and manageable size of the population, hence no sampling was made.
Sampling Techniques A two stage random sampling technique was used. This involved randomly assigning three technical colleges each to Experimental and control group
each. This Technical colleges have Information Communication Technology Centre with computers and ICT laboratory assistants.
Instrument for Data Collection Automobile Technology Achievement Test (ATAT) was used for data collection.
ATAT package was used to teach the experimental group while the traditional lesson plans were employed to teach control group. ATAT has fifty multiple
choice items based on SSCE Automobile technology curriculum content for year one students but forty five items survived screening. The developed ATAT by the researcher was subjected to content and face validation by nine experts
which include; three lecturers from Universities offering Technical education, three Automobile technology teachers from Osun state technical college (an area different from the area under study) and three computer specialists. In
the course of face validation, the experts subjected the 50 items to criticism and vetting with respect to relevance, suitability, repetition, set objectives,
use of language, ambiguity as demanded by the researcher. Based on the expert's corrections and suggestions, forty five items survived the screening. The trial test for determining the coefficient of stability of the ATAT was carried
out using test re-test reliability technique. The instrument was administered on Year II Automobile technology students in Ekiti state Technical College. A reliability coefficient of the ATAT instrument was computed using Pearson
product moment correlation coefficient and a value of 0.89 was found.
Method of data collection Two groups (experimental and control) were subjected to pre testing and post testing. The scores in the two groups during the pre test and post test
of the experiment were recorded at three weeks interval and compared. The subject administered the same post test items two weeks after the post test
on the group to extent of achievement of the materials and the scores were also compared. Experimental condition such as experimental bias and teachers’ variability were controlled. As regular class teachers taught and
administered the instrument on the student, the researcher only prepares all the teaching instruments. Moreover the researcher organized seminar for the participating teachers.
Method of Data Analysis
The data collected from the students were analyzed using mean scores and mean gain for answering research questions while Analysis of Covariance (ANCOVA) was used to test the hypotheses of no significant difference.

IRCAB Journal of Science and Technology: June 2012, Vol. 2. No. 1 23
Research Question 1 What are the mean score and standard deviation of experimental and control
groups on computer drill in Automobile Technology achievement test?
Table 1 Respondents’ distribution on Mean and standard deviation scores of Pre - test and Post - test Scores of Experimental and Control Groups in
the computer drill in Automobile Technology Achievement Test
Group N Pre-test Post-test Mean gain
X SD X SD
Experimental 168 24.50 2,75 43.59 1.26 19.09 Control 36 7.20 5.27 9.37 6.36 2.17
The data presented in Table 1 shows that the experimental group taught
Automobile technology with Computer Drill had a mean achievement score of 24.50 in the pre - test and a mean achievement score of 43.59 in the post-test making a pre-test, post-test mean gain in experimental group to be 19.09. The
control group taught Automobile technology with conventional method had a mean achievement score of 7.20 in the pre-test and a post - test mean achievement score of 9.37 with a pre-test, post-test mean gain of 2.17. With
this result, the experimental group had a higner academic achievement than the achievement of the students in the control group. The standard deviation
score variability shows the closeness and skewness of the mean scores,
Research Question 2
What are the mean scores and standard deviation of experimental and control groups gender on computer drill in Automobile Technology achievement test?
Table 2 Respondents’ distribution on Mean and standard deviation scores of
male and female Automobile technology students taught with computer drill computer drill in Automobile Technology Achievement Test
Gender N Pre-test Post-test Mean gain
X SD X SD
Male 146 13.40 8.17 28.59 1.45 11.19
Female 22 6.63 4.89 18.53 6.10 10.90
The data presented in Table 2 shows that boys taught Automobile technology with Computer Drill had a mean achievement score of 13.40 in the pre-test and mean achievement score of 28.59 in the post-test making a pre-test, post
- test mean gain of 11.19, while the girls taught Automobile technology with Computer Drill had a mean score of 6.63 in the pre-test and a mean score of
18.53 in the post-test, making a pre-test, post-test mean gain of 10.90. With this result, boys taught Automobile technology with Computer and Drill
IRCAB Journal of Science and Technology: June 2012, Vol. 2. No. 1 24
performed better than girls taught Automobile technology with the same Computer Drill in the achievement test. The standard deviation distribution
shows the closeness of the skew distribution from the centre.
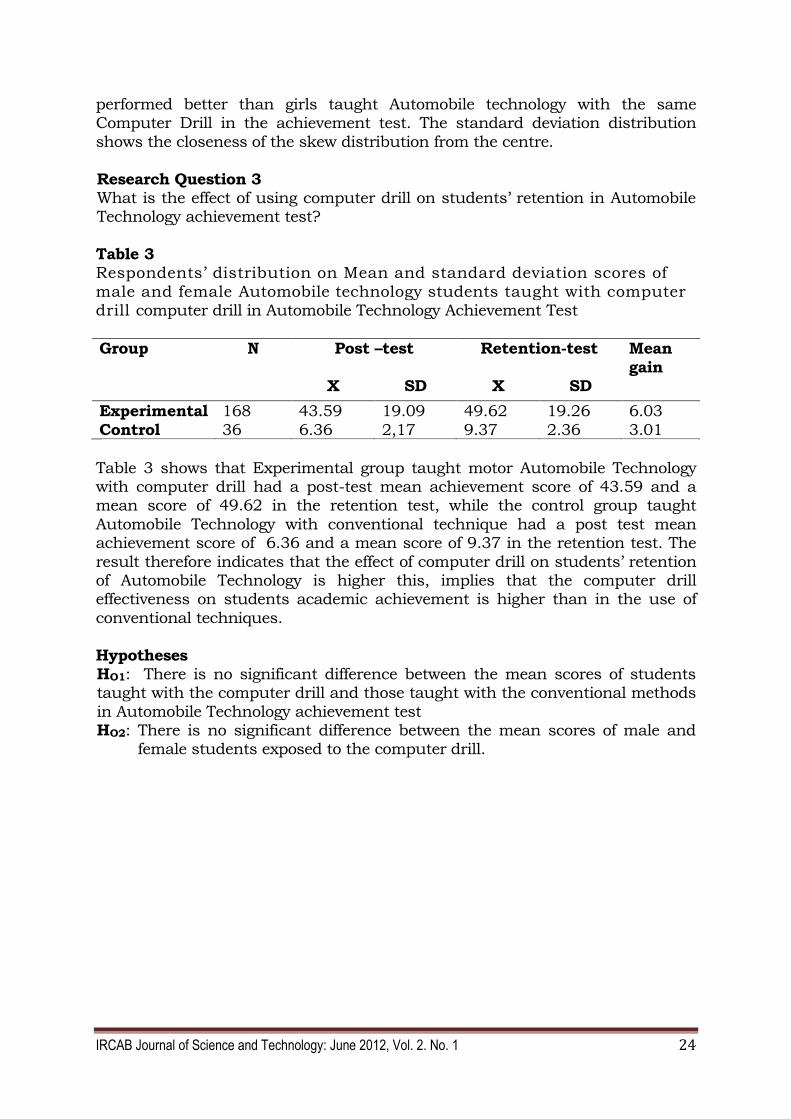
Research Question 3 What is the effect of using computer drill on students’ retention in Automobile Technology achievement test?
Table 3 Respondents’ distribution on Mean and standard deviation scores of
male and female Automobile technology students taught with computer drill computer drill in Automobile Technology Achievement Test
Group N Post –test Retention-test Mean
gain X SD X SD
Experimental 168 43.59 19.09 49.62 19.26 6.03
Control 36 6.36 2,17 9.37 2.36 3.01
Table 3 shows that Experimental group taught motor Automobile Technology with computer drill had a post-test mean achievement score of 43.59 and a mean score of 49.62 in the retention test, while the control group taught
Automobile Technology with conventional technique had a post test mean achievement score of 6.36 and a mean score of 9.37 in the retention test. The
result therefore indicates that the effect of computer drill on students’ retention of Automobile Technology is higher this, implies that the computer drill effectiveness on students academic achievement is higher than in the use of
conventional techniques.
Hypotheses HO1: There is no significant difference between the mean scores of students taught with the computer drill and those taught with the conventional methods
in Automobile Technology achievement test HO2: There is no significant difference between the mean scores of male and
female students exposed to the computer drill.

IRCAB Journal of Science and Technology: June 2012, Vol. 2. No. 1 25
Table 4 Summary of Analysis of Covariance (ANCOVA) for Test of Significance of
Three Effects: Treatments Gender and Interaction of Treatment and Gender on Students’ Interest in Motor Vehicle Mechanics Work
Source of Variation
Sum of Square
s
DF Mean Square
F Sig of F
Covariates 8.826 1 8.826 1.279 .260 Pre-test 8.826 1 8.826 1.279 .260
Main Effects 44.165 2 22.082 3.200 .043 Treatment
1419.413
1
1419.413
216.559
.000
Gender 44.140 1 44.140 6.396 .012 2-way Interactions
2.136 1 2.136 .310 .579
Treatment*Gender
2.136 1 2.136 .310 .579
Explained 60.606 4 15.151 2.196 .071 Residual 1311.20
9 190 6.901
TOTAL 1371.815
194 7.071
*Significant at sig of F< .05
Table 6 shows F-calculated for three effects: treatment, gender and interaction of treatment and gender on students’ interest in Automobile
Technology achievement. The F-calculated value for treatment (computer drill) is 216.559 with a significance of F at .000 which is less than .05. The null-hypothesis is therefore rejected at .05 level of significance. Hence, the
null hypothesis of no significant difference between the mean scores of students taught with the computer drill and those taught with the conventional
methods in Automobile Technology achievement test is rejected at .05 level of significance. The F-calculated for gender stood at 6.396 with a significance of F at .012 which is less than .05. The null-hypothesis is therefore rejected
at .05 level of significance. With this result there is a significant effect of gender (male and female) on students’ interest in motor vehicle mechanics
work. The interaction effect of treatment and gender has F-calculated value of .310 with significance of F of .579 which is greater than .05. This result means that there is no significant interaction effect of treatments given to
students taught motor vehicle mechanics work with inquiry techniques and their gender with respect to their mean scores in the Interest Inventory
Discussion The data presented in Table 1 provided answers to research question one.
Finding revealed that students taught Automobile technology with Computer drill had a higher mean achievement score than those students taught using the conventional teaching method in the achievement test. In the same vein,
analysis of covariance was used to test the first hypothesis, Table 3, at the

IRCAB Journal of Science and Technology: June 2012, Vol. 2. No. 1 26
calculated F-value (2082.000), significance of F(.OOO) and confidence level of .0.05 there was a statistically significant difference between the mean scores of
the group taught with Computer Drill and those students taught by using the conventional teaching methods in the achievement test. The implication
of this finding therefore is that Computer Drill is more effective than conventional teaching methods in enhancing students' achievement in Applied Electricity. This finding is similar to the finding of Ogunbote (2004) who
discovered that there was a significant difference in the physics achievement of experimental group taught with computer drill and control taught with conventional method in their study. The finding is also in line with that of
Basaga, Geban & Tekkay (1994).
Furthermore, the study found out that the students had more opportunities to conduct their own fault diagnostic exercise to communicate their ideas and data with peers right from the onset of the class. Thus, active
involvement in learning process using cooperative learning and interactive strategies, hand-on-activities and awakening of critical thinking skill in the
experimental group taught with computer drill technique as against the near passiveness of the conventional group who need to be initially lectured.
Summary of Findings 1. Students taught Automobile technology with Computer drill had a higher
mean achievement score than those students taught using the
conventional teaching method in the achievement test.
2. The study revealed that male students taught Automobile technology with Computer drill had a higher mean achievement score than female students taught with the same Computer drill in the Achievement test.
3. There was significant difference between the mean scores of students taught Automobile Technology with Computer drill and those taught using conventional teaching method in the achievement test
4. There was significant difference between the mean achievement scores of boys and girls taught Automobile technology with Computer drill
in the achievement test. Conclusions
Application of computer technology to all aspects of human endeavour coupled with the need to create student-centred classroom to engage learners in their
learning tasks, improve learners' interest and consequently achievement in the school subjects has necessitated the use of computer in teaching. This study has found out that computer drill improved students' achievement in
Automobile technology than the conventional teaching methods. Also, the study found out significant interaction effect of treatments given to students and their gender in the Automobile technology achievement. This simply
means that the effectiveness of computer drill on students' achievement in Automobile technology does not depend on the gender of students. Hence,
irrespective of gender, students studying Automobile technology will record improved performance in their achievement in Automobile technology when computer drill is used for teaching. These results therefore revealed that

IRCAB Journal of Science and Technology: June 2012, Vol. 2. No. 1 27
computer drill is a viable alternative to the conventional teaching methods in teaching Automobile technology. Moreover, computer drill provides powerful
tools to support the shift to student-centred learning and is capable of creating a more interactive and engaging learning environment for teachers and
learners. Since, the use of computer packages is clearly a strategy that reflects modern business and industry practices and provides students with a learnable tool for creative thinking and problem solving abilities, it is hoped
therefore that if computer tutorial and drill is employed for teaching Automobile technology to the students in the technical colleges in Lagos state in Lagos State, the students will improve on their learning and pass their
National Business And Technical Examination Board (NABTEB) with better grades and be able to contribute their own quota to industrial development of
this nation Recommendations
Based on the findings of this study, the following recommendations are made; 1. Technical teachers of Automobile technology in Lagos State should
adopt the use of the computer drill in teaching Automobile Technology students.
2. Curriculum planners such as Nigerian Educational Research and
Development Council (NERDC) should consider the review of curriculum to include basic electronic for secondary schools with a view to incorporating the computer technique.
3. Lagos State Government should provide well equipped computer laboratory in all the Technical colleges
4. Ministry of Education and school principals should organize seminars, conferences and workshops to sensitize technical teachers on the use of computer tutorial and drill.
References
Akudolu, L. R. (1998). Computer Assisted Language Learning as a Teaching Mode for Promoting Students' Interest in French Language. Technology
and Research Journal. (TERJ) December. 1998, 2(1) 40 - 46. Cepri, S., Ozsevgec, T., Saydkan, F. and Emre, F. B. (2004). The Comparism
of Achievement Levels of Science Teaching Program Students at two
Universities. V. International Science and Mathematics Education Congress report H, 1241 - 1246.
Kann, I. K. (1987) Effects of Computer Assisted Instruction on Selected Interaction Skills Related to Responsible Quality. Journal of School Health 57(7):282 - 287.
Kulik, J, A., Bangert, R. L. and Williams, G. W. (1983). Effects of Computer Based Teaching on Secondary School Students. Journal of Educational Psychology 75(1)19-26.
Kulik, J. A. (1983). Synthesis of Research on Computer Based Instruction.
Educational Leadership, 41(1) 19-21. Ofo, J. O. (2002). Research Methods and Statistics in Education and Social
Sciences, Lagos. Jojo Educational Research Publishers Limited

IRCAB Journal of Science and Technology: June 2012, Vol. 2. No. 1 28
Ogbuanya, T. C., Igweh A. U. and Bakare, J. A.A (2009). Reciprocal Peer Tutoring and Academic Achievement of Students in Electronics in
Technical Colleges in South -western States, Nigeria. Nigerian Conventional Journal. 14(1): 98 - 106.
Ogunbote, S. (2006) The impact of computer applications in Vocational education for sustainable Nation Building. Journal of Multi disciplinary education. 2(1):45-51
Ogwo, B. A. (1996). Effects of Metal Learning Instructional Strategies on Students' Achievement in Metal Work Technology. An unpublished Ph.D
thesis, University of Nigeria,, Nsukka.

IRCAB Journal of Science and Technology: June 2012, Vol. 2. No. 1 29
THE POLITICS OF HEALTH CARE DELIVERY IN AFRICA: NIGERIA IN FOCUS
OKOKHERE, O.F.
Department of Political Science Faculty of Social Sciences
Ambrose Alli University, Ekpoma, Nigeria
OKOKHERE, O.P. Department of Internal Medicine
Faculty of Clinical Sciences College of Medicine
Ambrose Alli University, Ekpoma, Nigeria
Abstract
The politicization of health care delivery in Africa is endemic. The situation is so bad that the health care security of Africans is gradually becoming endangered. Nigeria, Africa’s most populated country and one of the most richly endowed with natural resources is among the worse culprits in poor health care delivery. For several decades and counting, various governments have either paid lip service to health care delivery or neglected the sector all together. Budgetary allocations are grossly inadequate while health care facilities are mostly dysfunctional, thus resulting to decay in the health sector. Some observers attribute the problem to official ineptitude and corruption while others blame the misplaced priorities of government at all levels, as the primary reasons for the decay. This paper critically examines both arguments through available data and concludes that Africa; and Nigeria in particular, must wake up towards the challenges of ensuring the provision of adequate health care services for the people. In achieving this, the paper recommends steps in that direction.
Introduction The components of good Health include the physical, mental and social well-
being of the individual, and not just the absence of diseases (WHO, 1946). However, the economic status of an individual greatly influences that individual’s ability to access good health care in an environment where
health care is not free or paid for by health insurance. According to information available in the paper “Health workforce country profile for
Nigeria” by Labiran et al (2008), in Nigeria, private total health expenditure (THE), mostly out of pocket expenditure), represented 72% (113.0billion Naira) of the total health expenditure of the nation in 1998; household share
of THE was as high as 69.21%), and spending on curative care accounted for 68.49% (175.5billionnaira) of THE; only 2.2 billion Naira ( 0.9% of THE) was available for preventive care. (Labiran et al (2008).
The gross domestic product (GDP) of a country is an indicator of the
performance of the economy of that Country, and therefore, an indicator of what the per capita income might be. Between 1999 and 2004 the GDP rose progressively from 2.7% to 7.1%, but declined steadily thereafter, getting to
Assessing the Impact of Oil and Gas Industry on the Development of Nigerian

IRCAB Journal of Science and Technology: June 2012, Vol. 2. No. 1 30
5.3% in 2007; in 1998, the Total Health Expenditure (THE) was 157.1 billion Naira, which represented 5.45% of the GDP, but the government’s
contribution to total health expenditure was a paltry 23.5billion (15% of THE) or 0.82% of the GDP (Labiran et al (2008). Though per capita health
expenditure showed an increase from 1,445.95 Naira in 1998 to 2,565.77 Naira in 2002, generally the expenditure on health is still less than 8 US dollar per capita, a figure much less than the $34 recommended by the
commission of Microeconomics and Health (Labiran et al 2008).
Funding for health care delivery is provided by government at all levels
(Federal, State and Local government), insurances companies, other companies, households and other partners. Even though the government is
expected to be a major source of funding for health in developing countries, the total worth of health services and goods provided by government facilities in Nigeria, according to the 2001 estimates, was 39.7 billion or
14.27% of THE (Labiran et al 2008). This shows that in reality, the government is not a significant provider of health care services and goods in
Nigeria. The insurance companies’ contribution is to the formal sector, providing only about 4.96% (in 2002) of funding. In 2007, the proportion of the annual budget spent on health was 4.3% (Labiran et al 2008).
Nigeria is the 4th largest country in Africa with a land mass of 923,768 square kilometres, and a population of over 140million people according to
data available through the December, 2006 National Census. It is the 12th largest producer and 8th largest exporter of oil in the world (Labiran et al
2008). The revenue from oil provides over 80% of Federal government revenue and is the main source of funds (Labiran et al 2008). With the huge funds accruing from oil, the budget allocated to health is grossly inadequate.
The proportion of people living below poverty line was 60% in 2007, more than the 56.8% and 58% in 2005 and 2006 respectively (Labiran et al 2008). As mentioned earlier, 72% of the THE is contributed by the private health
expenditure, a sector that has mostly people who are poor.
The other tiers of government, States and Local governments, draw their financial sustenance from the federation accounts, and the funds these other tiers of government allocate to health are also inadequate. It is not
surprising, therefore, that the health system is not performing satisfactorily.
The health system performance of Nigeria was ranked 187th in the world by the 2000 World Heath Report, only better than 4 other member nations among them Democratic Republic of Congo, Central African Republic and
Myanmar (WHO, 2000). This poor health system performance in Nigeria is due to many factors, chiefly among which are the politicization of health care delivery and the long Military involvement in Nigerian politics. The
political factor, especially as it influences the health care delivery will be the focus of this write-up.

IRCAB Journal of Science and Technology: June 2012, Vol. 2. No. 1 31
Theoretical Framework: Social Policy: Social policy is a state intervention that directly affects social
welfare, social institutions and social relations. It involves overarching concerns with redistribution, production, reproduction and protection, and
work in tandem with economic policy in pursuit of national social and economic goals. It should be stressed that social policy does not merely deal with the ‘causalities’ of social changes and processes, but also contributes to
the welfare of society as a whole.
Social policy may be embedded in economic policy explicitly aimed at direct
government provision of social welfare, in part through broad-based social services and subsidies, provision of education and health services, social
security, and pensions, land reforms, incidence of taxation, labour market interventions, redistributive policies and so on.
The role and stature of social policy has changed dramatically over the years in Africa. In the early post-colonial phase, social policy was a central part of
the nation-building project. A number of measures were adopted, the variation in policy tending to exhibit both ‘path dependence’ (the colonial heritage and the adoption of polices and administration practices borrowed
from the erstwhile colonizers) and the ideological and political choices of individual countries.
In settler economies, such as those of Zambia, Zimbabwe, Namibia and South Africa, the situation was more fraught. The colonial regimes had fairly
comprehensive social insurance schemes for the white population, whose jobs were protected from outside competition: pension schemes, freely or highly subsidized, including education and medical services and so on. The
post-colonial regimes had to abolish or at least lessen the racial divide. Social policy was a major instrument for redressing some of the injustice of the colonial order. The difficult choice has been whether to simply abolish
the segmented welfare schemes altogether or to maintain them and make them applicable to everyone. The latter option has, in the case of Zambia,
posed several fiscal challenges.
The political coalitions that had been forged during the colonial period
exhibited great variation in terms of social base. Not surprisingly the ideologies behind social policy initiatives ranged from unbridled capitalist
ones to idiosyncratic forms of socialism. The authoritarian rule that become the default mode of African governments meant that social policy was top down and highly paternalistic. Education was given a central position in
social policy (though not sustained) to further enhance nation building. It was supposed not only to contribute to national cohesion but also to produce the necessary ‘manpower’ for both the indigenization of the public
sector and the human skills necessary for development. In some countries most governments intervened in labour markets and introduced social
policies that often guaranteed minimum wages and free health services.

IRCAB Journal of Science and Technology: June 2012, Vol. 2. No. 1 32
Social policy is about the moral consciousness of a society, embedded in its laws. It is a society’s ability and willingness to carry the sick, poor, weak,
elderly, the down trodden the child, and every one in need, along. In Africa however, the moral
conception of society in many respects is reflected in the existing arrangements of its various societies. However, the lack of adequate social policy is evident in the political, social and economic reality of African
societies. Social policy ought to be a sort of welfare or affirmative action of state where distributive and redistributive justice holds sway. On the contrary, all the socio-economic evils, promoted through liberal economic
theories and practice, have been wrongly adopted in Africa. According to John Stuart Mills, in his “Principles of Political Economy, people forget that
wherever competition is not, monopoly is; and that monopoly, in all its forms, is the taxation of the industrious for the support of the indolence, if not of plunder.
Africa’s past and current political leadership has plundered the continents
wealth to the detriment of the hardworking people of Africa. These ruling elite (political class) travel abroad for most of their needs, including medical checkups. Healthcare services in Africa are comatose while preventable
diseases ravage the entire landscape.
Social policy is the only way out and not market economy. Yegor Ligachev,
Prava puts it this way “there is no talk and there will be no talk of a market economy, which always and everywhere brings with it social injustice and
social inequality. We need as much socialism as possible, a maximum of socialism”.Considerable progress was made in the number of social indicators, especially in terms of school enrolment and health. There were
however, a number of problems with social policy in Africa.
The first of these was the segmented nature of some of its key components.
While education and health tended to be more universal, a number of social welfare measures applied only to the workers in the formal sector-referred to
as ‘the labour aristocracy’- and failed to address the poverty of the majority in the rural areas and the rapidly swelling ranks of the ‘working poor’ in the informal sector. Second, social policy was not explicitly linked to
development, except perhaps through the ‘human capital’ component.
Thus, for instance, the ‘forced savings’ from pensions were often used to support the current budgets of governments rather than used for long-term investment. Third, social policies were unable to cope with the rapid social
differentiation that took place once the cap on economic opportunities placed on the colonized peoples was removed. In many cases such differentiation led to the undermining of the ‘social pacts’ that had informed
social policy thinking in the early years. Fourth, many social polices lacked the fiscal basis for their sustainability as governments engaged in
expenditures without taking into account their financial implications. And finally, many social policy initiatives eventually went under, together with the developmental strategies to which they were tethered. In response to

IRCAB Journal of Science and Technology: June 2012, Vol. 2. No. 1 33
these failures, there was a flurry of social policy initiatives in the 1970s at both the national and international levels. The ILO introduced ‘Basic Needs
Strategies’ which had both distributive and employment implications. The strategies also implied that social policy would universalize access to
services that would enable citizens to meet their basic needs. The World Bank also proposed ‘growth with equity’ strategies, which were much less explicit as to the underling social policy, but were focused on rural poverty.
The crises of the late 1970s brought all these initiatives to a sudden halt as stabilization and structural adjustment took ascendancy in policy making
and the aid agencies’ agendas. The first victim of the SAPs was the claim by states that they would intervene in the economy not only to ensure
economic performance but also to ensure certain economic outcomes. Together with the disappearance of poverty from the policy agenda was the disappearance of development as something that state policies deliberately
pursued beyond simply overseeing the spontaneous market processes. ‘Adjustment’ became the key word. Expenditures were judged entirely in
terms of immediate, fiscal or financial needs, while the long-term developmental implications were rejected or downplayed. This in itself would have sufficed to undermine social policy making, which is rooted in the real
economy. During the adjustment years, many social policies were reversed, deemed
guilty by association with the beleaguered development strategies. The new strategies argued for private provision of many services that the state had
hitherto provided and urged user charges for any services that the state might provide. These included a whole range of services that African governments had been inclined to provide, albeit not always successfully.
The new strategies also clearly spoke against labour market legislation that would distort markets. Most significantly, ‘poverty eradication’ was removed from the policy agenda.The dethroning of the state as the driver of
development led to greater reliance on social provision by social actors. Increasingly, service provision is being transferred to NGOs.
Politics and Health Care Delivery in Nigeria For many years, the health indicators of Nigeria have been among the worst
in the world (Labiran et al 2008, World Bank, 2011). In 2007, the life expectancy of the Nigerian was 44 years; crude birth rate, 43 per 1000 live
births];crude mortality rate was 14.7% ; under-five mortality 201 per 1000 live births; maternal mortality rate was 800 per 100,000 live births; HIV/AIDS prevalence rate was 3.9%; percentage safe water access was 72%
urban, 49% rural (Labiran et al 2008). The major contributors to poor health burden in Nigeria are essentially preventable diseases like malaria, tuberculosis and HIV/AIDS (Labiran et al 2008, World Bank, 2011). Politics
has played a major role in the poor state of Nigeria’s health care system (Hargreaves 2002, Nnamuchi 2008).
Politics is the authoritative allocation of power and resources. Politics is what defines the relationship between power, resources, its allocation and

IRCAB Journal of Science and Technology: June 2012, Vol. 2. No. 1 34
ultimately, the beneficiaries of the resources. In Nigeria the federal government holds too much political power, and controls most of the
resources in the country. This has led to the unhealthy jostling for political power at the centre. The military demonstrated the authoritative use of
politics in the allocation of power and distribution of resources during the long period of military adventurism.
Colonial, military and civilians have held the reins of government at one time or the other, thus influencing the course of health care delivery in Nigeria. Since the attainment of independence in 1960, the military has held
political power (29 years out of 51 years of independence) longer than the civilian democratic governments, and that during the military dictatorship,
especially between 1983 - 1998, the healthcare delivery in Nigeria deteriorated significantly ; this period also witnessed severe economic decline. A UN report released just before the return of civilian administration
in 1999 (Sorabjee, 1999), implicated the military government, which was characterised by unbridled corruption and gross mismanagement of the
abundant resources at their disposal, as the main culprit in the deficiencies and continued deterioration in the health sector, the impact of which the country is still reeling from (Nnamuchi, 2008). This was further
compounded by sanctions imposed on undemocratic regimes by western countries that saw the need to prevent funds from international donor agencies from reaching Africa. Services (including health) which would have
benefited the poor were lost. However, the present civilian administration has not made significant impact on the health care delivery system in
Nigeria, because as shown earlier using 2007 statistics, 8 years after being in control of government, the healthy indicators are still appalling. The health indicators of Nigeria are still among the worst in the world even today
(World Bank, 2011).
As is well known, health care delivery is inextricably related to politics all
over the world. Even in the USA, with a very advanced health care delivery system, the Obama administration is still battling with the politics of his
historic healthcare bill, even after many months of its passage by both arms of the legislature. In Nigeria, the politics of health care delivery has done great harm to the health of the people as evidenced by the poor statistics of
the health indicators. All stake holders in Nigeria play politics with health care delivery, and share in the blame for the abysmal state of health. The
stakeholders include the Federal government, the state governments, the Local governments, health care workers and religious bodies.
The Federal government has a very significant role to play in health care delivery. Nigeria is a signatory to many International treaties which recognise the right to health of all citizens. These treaties include the African
Charter on Human and People‘s Rights (African Charter), the African Charter on the Rights and Welfare of the Child, the Protocol to the African
Charter on Human Rights of Women in Africa, Convention on the Elimination of all Forms of Discrimination (CERD), the International Covenant on Economic, Social and Cultural Rights( ICESCR), the

IRCAB Journal of Science and Technology: June 2012, Vol. 2. No. 1 35
Convention on the Rights of The Child (CRC) and the Convention on the Elimination of all Forms of Discrimination against Women(CEDAW), to
name a few. As a party to these treaties, the government of Nigeria is expected to protect the rights of her citizen to health through commitment to
carrying out the obligations under these treaties, and to cause appropriate domestic legislations to be put in place to ensure the attainment of these rights by the individuals within her country’s borders. These treaties require
domestic legislation to give them the legal force to become operational in countries that have ratified them. The enormity of the obligations under these treaties may discourage governments who are not capable of adhering
to the tenets of the treaties to shy away from enacting the necessary domestic enabling laws. It may be politically convenient on the one hand, to
‘look good’ among the committee of nations by ratifying the treaties, but politically inconvenient on the other hand, to enact the enabling laws at home probably because of fear of litigation and unpopularity which may lead
to loss of peoples’ votes, that may arise for non-adherence to the treaties. Only the African Charter has had the necessary domestic legislation in
Nigeria, and has been incorporated into the laws of the land (AU Charter, Nigeria Federal Laws 1990). Article 16 (1) of the Charter states that: ‘‘every individual shall have the right to enjoy the best attainable state of physical
and mental health’’. Unfortunately, majority of Nigerians do not enjoy this right to health as enshrined in the constitution, and there is little in terms of litigation against the government for this gross failure to give the people
good health care.
The main nucleus of the revised National Health Policy of Nigeria 2004 is a health system based on the primary health care (PHC). The PHC is supposed to address the main causes of the poor health indicators of Nigeria, which
are mainly due to diseases that are easily preventable and treatable. The policy adopts the WHO’s strategy for achieving PHC objectives as contained in the declaration of Alma Ata in 1978. The implementation of this policy
has not achieved the desired health objectives. According to the initial assessment of the Social and Economic Rights Action Centre (SERAC) on the
success of the PHC programme in Nigeria, using the standards of achievement based on availability, accessibility and acceptability of health care facilities in selected communities in the six geopolitical zones of the
country, ‘’the Nigerian governments have failed to give adequate attention to the primary health care system, even though it defines it as the thrust of the
national health programme. The PHCs are poorly funded, understaffed and ill-equipped’’.
The SERAC evaluation particularly singles out the Local government as demonstrating an obvious lack of political will, with consequent near neglect of the health sector at this level of governance. It is estimated that the
National Primary Health Care Development Agency (NPHCDA), established in 1992 and given the responsibility of assisting government in achieving the
goals of the PHC programme, has only succeeded in about 5% to 10 % of the potential capacity. The main reason for this ineffectiveness is insufficient government support in terms of poor government funding.

IRCAB Journal of Science and Technology: June 2012, Vol. 2. No. 1 36
Adequate funding is a major determinant of the success of the PHC and
other components of the health delivery system. From the 2006 UNDP Human Development Report, government expenditure on health was low. As
a percentage of the GDP, the expenditure was 2.2% in 2000 and even declined to 1.3% in 2003. The report also showed that Nigeria was far behind many African countries similarly classified as low income economies
by the World Bank in terms of government expenditure on health. The Nigerian government’s contribution to the total health expenditure fell from 29.1% in 1999 to 25.5% in 2003 (WHO, 2007). During the same period that
of Senegal, Sierra Leone and Ethiopia improved to 41.8%, 58.3% and 58.4 % respectively. Furthermore, per capita spending on health is between $2 and
$5 in different parts of Nigeria. This is far short of the $34 recommended by the Macroeconomics Commission Report for low income countries by the WHO. This amount of government spending is grossly inadequate to make
any meaningful impact on health care delivery. Also, it is not impossible that this little amount budgeted for health is not even spent completely on what
it was meant for, as there are indications that there are differences between the amount budgeted and the amount actually spent. For mainly political reasons, most of the culprits involved in embezzlement of funds meant for
health and other sectors are not brought to justice. Therefore most Nigerians are left to provide for their health care from their very lean pockets. Considering that about 60 to 70.8% of Nigerians live on less than $1 a day
according to Labiran et al 2008, and the UNDP 2006 report, most Nigerians are unable to afford the high cost of health care provided by private health
institutions, hence the continued appalling health care indicators that have been associated with the country for decades. See Table 1 below:
Table 1. 2011 Nigerian Human Development Index HDI Rank ( Out of 187 countries) 156 Life Expectancy at birth( Years) 51.9
GNI per capita in PPP* terms( constant 2005) 2,069 Educational Index( Expected and mean years of schooling) 0.442
Multidimensional poverty index (%) 0.310 Population ( Thousands) 162,470.7 • PPP: Purchasing Power Parity
Nigerian governments have shown gross indifference to the adequate
funding of health care delivery as evidenced by the paltry sum budgeted each year for health. Many top government functionaries in the Legislative, Judicial and Executive arms of government prefer to go abroad on medical
tourism even for trivial health matters, spending scarce resource that could have been used to develop the health system at home. To develop the health system at home may mean reduced opportunities to make these trips
overseas. Thus, there appears to be a lack of political will to develop the health sector.
Almost all sectors of the Nigerian political and economic systems depend largely on the monies from the federation accounts. Hence there is intense

IRCAB Journal of Science and Technology: June 2012, Vol. 2. No. 1 37
lobbying for monetary allocations. Lobbying of the National Assembly members and the presidency plays a significant role in the final allocation to
each sector. The success of getting a particular budget passed, especially at the legislative arm of government, may depend largely on how well you
lobby. There have been accusations against some members of the National Assembly for demanding money to facilitate the passage of budgets of some ministries and government agencies.
Health is on the concurrent list in the Nigerian Constitution, and its funding is largely influenced by the lobbying efforts of concerned stakeholders and
not due to the genuine desire of the government of the day to improve on the poor health indices of the country by providing enough funding. Even
though tertiary health care delivery is supposed to be the responsibility of the Federal government, there is no law enacted to make the Federal government accountable for this tier of health care delivery. This leaves the
Federal government with the opportunity not to take this duty seriously, since there is no law under which it can be held accountable if this level of
health care delivery is not functional to the satisfaction of the people. Also it has led to the situation where some State governments have ventured into the expensive provision of tertiary health care, to the detriment of secondary
care.
The heads of the Ministry for health, parastatals, and other agencies,
responsible for health care delivery are political appointees. In some instances, these appointments are not based solely on merit or ability to
perform, but on recommendations of political mentors or ‘‘godfathers’’. There is usually rigorous lobbying by aspiring candidates for these positions.
There is a disproportionate representation in the number of Health Ministers from the Northern and Southern Nigeria. The Southern Nigeria has produced more Health Ministers than the Northern part, while the
presidency has had more occupants from the Northern part of the country than the South. One consequence of this is the political constraints the
Minster of Health may have in getting the desired funding for effective health care delivery. Some ministerial port folios are ceded to certain parts of the country for no other reason than political. This has the effect of robbing the
country of the best hands to run the affairs of the health sector.
Nigeria is bedevilled with the monstrous problem of fake and adulterated drugs. At the 29th annual conference of the Association of Community Pharmacist in Nigeria [ACPN] held in Osogbo, Nigeria, in June, 2010, Dr.
Uwaga U.N, stated in his key note address, that retrogressive politics contributes significantly to poor health care delivery in Nigeria. He was of the opinion that undue interference from ‘higher authorities’ because of
intense political lobbying, monetary inducement and pressures from operators of these open markets where these fake or adulterated drugs are
sold keep the markets functioning. According to him, these unlawful markets are well known, and despite the obvious health hazards they pose to the public, they have not been shut down according to the dictates of the

IRCAB Journal of Science and Technology: June 2012, Vol. 2. No. 1 38
provisions of the relevant laws of the country. At that conference, the President of the Pharmaceutical Society of Nigeria expressed the opinion
that appointments of heads of some health agencies were political (Odesola, 2010).
For mainly political reasons the Federal government, a few years ago, established more tertiary health institutions, called Federal Medical Centres,
such that each state and the Federal capital territory would have at least one tertiary health facility. This would have been laudable, but the pre-existing tertiary health facilities were largely dysfunctional before the
establishment of more, because of poor funding. The logical course of action would have been to put these in good functional states before embarking on
building new facilities. It is only recently that efforts are being made by the government to upgrade the facilities of some of these tertiary institutions. The selection criteria for the location of the federal medical centres were
influenced in many instances by geopolitics. Even the location of the ‘’first generation’’ tertiary hospitals in Ibadan, Kaduna, Lagos, Nsukka and Ile-Ife
were greatly influenced by the main political actors at that time, and by regional politics.
The distribution of health workers is greatly skewed in favour of the urban, tertiary health care service delivery, the southern part of the country and curative care (Labiran et al 2008, Ademiluyi and Aluko-Arowolo 2009). The
government has not shown enough political will to address this gross imbalance. Despite the fact that many health workers from Nigeria have
migrated to western countries in search of greener pastures, the country still possesses one of the largest stocks of health care workers in Africa, comparable to Egypt and South Africa according to Labiran et al (2008), but
has far more worse heath indicator than either of them (World Bank, 2011).
Nigeria has sent many health care workers to some less endowed countries under the auspices of the technical aid programme apparently for political reasons, even though the needs at home have not been met. In 2007, there
were 52,408 doctors and 128, 918 nurses registered with their respective professional medical/ health regulatory bodies (Labiran et al 2008). The health worker per 100,000 population ratio was 37 for doctors and 91 for
nurses. These ratios have not shown any significant difference over the years (Labiran et al 2008).
All the health workers have organised themselves into associations along professional lines for the main purpose of bettering their financial
situations, and demonstrating their indispensability or relevance in the scheme of things. These groups have become highly political in the ways
they organise themselves, lobby for better remunerations and jostle for relevance in the health sector. Their activities have paralysed health service delivery on many occasions, especially when the government is slow or
reluctant to accede to their demands or fail to implement mutually agreed terms from negotiations.

IRCAB Journal of Science and Technology: June 2012, Vol. 2. No. 1 39
The role of politics in the provision of health care delivery is exemplified by the situation in the states of Nigeria. The study by Oyekanmi et al, using the
geopolitics of the state in assessing the distribution of health care facilities (HCF) in Kogi State clearly illustrates this assertion. Kogi State was created
in 1991, and is located in North Central Nigeria. The population, from the 1991 National census was, 2,147,756, with 395,389 households. The population increased to 3,314,052 in the 2006 census. There are three main
ethnic groups-the Igalas in the Eastern part, the Igbiras in the Kogi central part and Okun- Yorubas in the Western part of the state. The state is divided, politically, into three senatorial districts. These are Kogi central,
east and west respectively.
However, this political arrangement is not taken into reckoning in the sharing of political power. Instead, sharing of political power is based apparently on whether the individual comes from Kogi east of the Niger River
or Kogi west of the Niger. Kogi west of the Niger has 2 of the senatorial districts, 2 of the 3 major and most of the minority ethnic groups. It also has
the greater percentage population at 55.4% compared to 44.6% for Kogi east. But Kogi east senatorial district has produced all the Governors and most other key public figures since the creation of the state in 19991; this
senatorial district allocates to itself 50-60% of whatever is to be shared. The study found inequalities in the distribution of health care facilities in
the 3 senatorial zones. Kogi east has the greatest concentration (66.3%) of both PHC and secondary care facilities. The government owns the majority
of HCF in the state, but its ownership of HCFs is greatest in Kogi east, where it owns about 93% of HCFs, and least in Kogi central where it owns only 70%. The reason given by the authors for this inequality is political, because
the senatorial district that has benefitted most from the distribution of government owned HCFs has always produced the state governor. It is the opinion of the authors that the political scenario may not change any time
soon.
It is possible that the situation in Kogi state may not be too different from other states where political dominance by an ethnic or geopolitical group persists for a long period of time.
As is the case in the country, the health indicators in the states are very
poor. For instance, in Akwa Ibom state, the infant and maternal mortality rates as at 2001 were 67 per 1000 live births and 800/ 100,000 respectively (Akwa Ibom State Government, 2007). Religion is sometimes used as a
political tool in health matters. In some states in the North, some individuals, in their quest to gain political recognition, used religious sentiments to dissuade people from allowing their children to be vaccinated
against the polio virus. Local government councils are statutorily mandated to finance and operate the PHC programme across the legally recognised
774 LGAs in the country. They should be assisted in carrying out this task by the state governments. However, as stated earlier, they are not adequately financially empowered to do so. Also, this 3rd tier of government

IRCAB Journal of Science and Technology: June 2012, Vol. 2. No. 1 40
is not politically autonomous, as it is supervised by the state government. They do not have financial independence; their budgetary allocations from
the federation account are paid into their respective state governments’ account. Often times, some state governments force them to finance
programmes that are not their primary responsibilities, to the detriment of health care delivery.
The health indicators for sub-Saharan Africa in general and Nigeria in particular, have remained perpetually poor over the years as shown in Table 2 below.
Table 2. Comparison between Human Development Index (HDI) of Nigeria,
Sub-Saharan Africa and the World from 2005 – 2011. Year Low HDI Nigeria Sub-Saharan Africa World
2011 0.456 0.459 0.463 0.682
2010 0.453 0.454 0.460 0.679 2009 0.448 0.449 0.456 0.676
2008 0.443 0.446 0.451 0.674 2007 0.437 0.441 0.445 0.670 2006 0.430 0.438 0.438 0.664
2005 0.422 0.429 0.431 0.660
These poor health development indexes are arguably a direct result of the
poor leadership qualities often associated with Sub-Saharan Africa rulers coupled with institutionalised corruption, and made worse by the pervasive
poverty endemic in most sub-Saharan African countries.
Unfortunately, the current appalling state of health delivery may not change
in the nearest future because of the obvious lack of political will of sub-Saharan leaders at different levels of governance. However, the steady improvement in the health indicators of Ghana as Table 3 shows might offer
a ray of hope for Nigeria and other sub- Saharan African countries. The exemplary political situation in Ghana may be partly responsible for the
gains observed in their health care delivery system.
Table2. Comparison of some Human Development Indices between Nigeria
and Ghana Index Nigeria Ghana
Rank (2011) 156 135 Life Expectancy at Birth(2011) 51.9 64.2
Under five Mortality per 1000 live births (2009) 138 69
Maternal mortality per 100,000 live births ( 2008) 840 350
In conclusion, all stake holders in health-related matters in Nigeria play
politics with health care delivery for their selfish interest, thus perpetuating the decay in the health sector which started with military adventurism,
particularly in the mid 1980s There is lack of political will to tackle the challenges in the health sector by all tiers of govt in this democratic
IRCAB Journal of Science and Technology: June 2012, Vol. 2. No. 1 41
dispensation.There is lack of transparency and accountability in the way the health sector is run.
Recommendations
Recommendations that may a help address the appalling health situation in sub-Saharan Africa and Nigeria in particular include:
• That the people should begin to demand for accountability and transparency
from their political leaders
• That the negative role politics play in the health care delivery system should
be greatly minimized, if not completely stopped • That funding for health care should be scaled upwards, at least to meet the
minimum recommendations of the relevant world bodies on health • That government should improve the remunerations of health care
workers and provide the necessary work environment that would encourage highly skilled health care workers to remain and not emigrate
• That PHC should be properly implemented so that the benchmarks for the MDGs as they pertain to health will be attained by the year 2015
• That concerted efforts should be made by all concerned to improve the economies of the sub-Saharan countries as this may impact
significantly on the health of all. References
Ademiluyi, I.A, Aluko-Arowolo (2009). Infrastural distribution of health care services in Nigeria: An overview. Journal of Geography and Regional Planning;2(5):104-110.
Akwa Ibom State Government of Nigeria ( 2007). “News: Health development during Attah’s administration and expectations under Akpabio”.
Babatimehin ,O., Ayande, A., Babatimehin, M., Yusuf, J.O.(2011). Geopolitical Patterns of Health Care Facilities in Kogi State Nigeria. The Open Geography Journal; 4; 141-147.
Declaration of Alma- Ata, Principle VII. 1978. Report of the International Conference on Population and Development, Cairo. UN publication,
sales No. E.95.XIII.18) Federal Ministry of Health. (2004). National Health Policy and Strategy to
Achieve Health for all Nigerians; Revised National Health Policy,
Abuja, Nigeria. Federal Ministry of Health. (2004). Health Sector Reform Programme: Strategic thrust with a logical framework and a plan of action
2004-2007. Hargreaves, S. (2002). “Time to Right the Wrongs: Improving Basic Health
Care in Nigeria”. Lancet; 359:2030.

IRCAB Journal of Science and Technology: June 2012, Vol. 2. No. 1 42
Labiran, A. Mafe M, Onajole B, Lambo E. (2008) .Health Workforce Country Profile for Nigeria. African Health Workforce Observatory.
Mill, S.J. “Principles of Political Economy”, in John Richards (1991) “Painful Truth” in Social Democracy without Illusion: Renewal of the Canadian
Left. Richards, J; Cains, R.D; and Pratt, L; (eds) (1991).McClelland and Stewart Inc. Toronto, Canada. National Census. (2006). National population Commission, Abuja Nigeria.
Nnamuchi, O. (2008).“ Kleptocracy and its Many Faces: The challenges of Justiciability of the Right to Health care in Nigeria. Journal of African Law;52(1):12-18.
Odesola T. (2010) Retrogressive Politics, Bane of Efficient Health Care Delivery-ACPN. Future News, 30 June.
Prava, Y.V. in John Richards (1991) “Painful Truth” in Social Democracy Without Illusion: Renewal of the Canadian Left. Richards, J; Cains,
R.D; and Pratt, L; (eds) (1991).McClelland and Stewart Inc. Toronto, Canada.
Sorabjee S.J. (1999) “Question of the Violation of Human Rights and Fundamental Freedoms in Any Part of the World: Situation of Human
Rights in Nigeria” A Report Submitted to the UN Commission on Human Rights (E/CN/4/1999/36); Para(s) 61 & 62.
Social and Economic Rights Action Centre. www.serac.org/pulications.
Assessed 03/06/2012. [S. 12 (1) & (2) of the Constitution; African Charter on Human and People’s Rights( Ratification and Enforcement) Act, Chapter 10, Laws of the Federation of Nigeria] 1990.
UNDP, Human Development Report 2006(Geneva: Palgrave Macmillan/UNDP, (2006) 303.
WHO, (1946). Official records of WHO, number 2, page 100. WHO, World Health Report, (2000)-Health systems: Improving performance. WHO/44, 21 June 2000.
WHO Country Cooperation Strategy: Federal Republic of Nigeria, 2002-2007. World Bank ( 2011). “World Development Indicator 2011” Washington DC.
http://date.world bank.org (Assessed 15/05/2011).

IRCAB Journal of Science and Technology: June 2012, Vol. 2. No. 1 43
SUSTAINABLE MANAGEMENT AND UTILIZATION OF EMPTY FRUIT BUNCHES AND PALM OIL MILL EFFLUENTS THROUGH COMPOSTING
AT THE CAMEROON DEVELOPMENT CORPORATION
Yinda G.S.1, Monono A.N.1, and Tabi F.O.2
1Dept of Environmental Science, Faculty of Science , University of Buea, Cameroon 2Faculté d’Agronomie et Science Agricole,
Université de Dschang, Cameroun [email protected]
Abstract
This study, at Idenau Oil Mill, Cameroon Development Corporation (CDC), evaluates the management and utilization of waste generated during palm oil production, assesses the quantity and quality of waste generated during palm oil production, and tested the performance of the composts and fortified composts from the wastes generated in enhancing crop growth. Using CDC’s production data from 1998-2008, waste (empty fruit bunches-EFB and Palm oil mill effluents-POME) estimates were made and the waste management strategy evaluated by observations and interviews. EFB was shredded manually and composted in windrows as follows; 𝐶1 = 𝐸𝐹𝐵 alone, 𝐶2 = 𝐸𝐹𝐵 +
𝑃𝑂𝑀𝐸, 𝐶3 = 𝐸𝐹𝐵 + 𝑃𝑜𝑢𝑙𝑡𝑟𝑦 𝑚𝑎𝑛𝑢𝑟𝑒 + 𝑃𝑂𝑀𝐸, and 𝐶4 = 𝐸𝐹𝐵 + 𝑃𝑜𝑢𝑙𝑡𝑟𝑦 𝑚𝑎𝑛𝑢𝑟𝑒. Soils and compost were analyzed for N, P, K, before a nutrient uptake experiment using maize as test crop with 6 treatments: Sa=soil alone, Sf = soil+fertilizer, Sfc = soil+fertilizer+compost, Sc20 = Compost at 20t/ha, Sc40 = compost at 40t/ha and Sc60 = compost at 60t/ha was performed. Data on growth (plant height, leaf length) and nutrient uptake were collected. CDC produces averagely, 37,269 tons/year solid waste (EFB, shells and fibre) and 36,926 m2 of POME a year. Only 22% solid waste generated is reused and 49% is discarded. The management strategies are environmentally unfriendly and waste produced is poorly managed. Compost produced had an average of 3.2, 4.7 and 0.87 % of N, P, and K, respectively but there were no significant
differences between compost types. Compost treatments were significantly higher (p<0.05) in leaf length and plant height relative to the control. Nutrient uptake was higher in compost than the control for N, P, and K (0.97, 1.63 and 1.67%). Using composted EFB as fertilizer will save CDC palm estates more than 2.5 million francs/ha/year as substitute for urea and will eliminate the problem of waste disposal. Composting of EFB and POME is recommended. Keywords: Compost, oil Palm Empty Fruit Bunch, Palm Oil Mill Effluents,
Plantation Waste Management
Introduction Sustainable management is undoubtedly one of the biggest challenges facing many African countries. The Palm Oil industry has recognized the
importance of these challenges and is working to adopt these principles. The potentials of composting which turns on-farm waste material into farm
resources make it an attractive proposition, offering several benefits

IRCAB Journal of Science and Technology: June 2012, Vol. 2. No. 1 44
(enhanced soil fertility and soil health) which increase agricultural productivity, improve soil biodiversity, reduce ecological risks and enhance
sustainable management of the environment. Tons of wastes Empty Fruit Bunches (EFBs) and Palm Oil Mill Effluent (POME) are generated at the oil
mills daily but are improperly managed causing harm to the environment and distorting its aesthetic beauty. The EFBs are often disposed of in any available open area, while POME is sent to the open waters without any
treatment. The POME emits greenhouse gases that contribute to global warming (Hassan et al 2004). These waste, if properly managed, could become a resource which help cut down on cost of fertilization in the same
plantations were they are produced. In Cameroon no studies have been carried out to ascertain the possible use of EFBs and POME as compost
materials. Nkongho (2005) studied the effect of EFB mulch on oil palm yields in PAMOL plantations but the constraints involved in using EFB as mulch were many.
The present study was carried out at the Cameroon Development
Cooperation (CDC) plantations at Idenau, South West Region Cameroon, which hosts the Idenau Oil Mill with an operating capacity of 25tons/hr, processing over 4000 tons of Fresh Fruit Bunches (FFB)/day. Waste
generated from palm oil production is in tens of tons/day. The 3Ps (Peope, Planet, Profit) principle of sustainability, (zero burning techniques, soil and water conservation, and waste minimization) includes composting of EFBs
and POME from the oil mill.
The processing of fresh fruit bunches of oil palm results in the generation of different types of residue. Among the waste generated, Palm Oil Mill Effluent (POME) is considered the most harmful waste for the environment if
discharged untreated (Rupani et al., 2010). The use of oil palm wastes, particularly the Empty Fruit Bunch (EFB), frond and trunk as compost are
now receiving greater attention by researchers (kala et al., 2009). Due to the presence of high total solids in POME, attempts have been made to convert this waste into valuable products such as feed stock and organic fertilizer
(Rupani et al., 2010).When oil palm wastes are combined with sewage sludge and composted, the final compost could release on a long-term basis high
amounts of nutrients (Kala et al., 2009). Composting is a very popular process in the management of organic solid wastes because (a) it reduces the volume (b) microorganisms are destroyed during composting and (c) the
end product is rich in nutrients content (Kulhman et al. 1989).
The main objective of this study was to evaluate sustainable management of EFBs and POME generated during palm oil production for use as soil fertility amendments in plantations. Specific objectives were; to assess
quantity and quality of waste generated during palm oil production in the Idenau Oil Mill, to evaluate management of waste produced in the oil mill
factory, to produce fortified composts from the wastes generated and test the value of composts produced as a soil amendment. Materials And Methods

IRCAB Journal of Science and Technology: June 2012, Vol. 2. No. 1 45
Idenau (Fig 1) has a warm equatorial climate with the average daily minimum temperatures of 20.4 ºC and average daily maximum
temperatures of 31.6 ºC (CDC Weather Station, 2008). Average daily relative humidity is 84.24 % and rainfall is usually continuous throughout the year.
Fig 1: Location map of Idenau area showing the CDC Idenau Oil Mill Past and present mill operations statistics were used for estimating rate of
EFB and POME production. According to Ma et al., (1999) 1.5 m3 of water is used per ton of FFB produced. Fifty percent of this is sent out as POME (i.e.
0.75m3);
𝑃𝑂𝑀𝐸 = (𝑇𝑜𝑡𝑎𝑙 𝐹𝐹𝐵) × 0.75 The pH of POME was measured using HANNA instrument.
Composting of Empty Fruit Bunches (EFBs) Composting was carried out using four combinations to compare rate of composting and effectiveness of different composts produced (Table 1).
Table 1: Waste combinations from EFBs and POME used for composting
Compost name
Abbreviations Components of compost
Compost 1 C1 Shredded EFB alone/water as moisture control
Compost 2 C2 Shredded EFB + POME as moisture
control Compost 3 C3 Shredded EFB + Poultry manure+
POME Compost 4 C4 Shredded EFB + Poultry manure + water
Windrows prepared were in 1 m3 plywood holding boxes, with 7 cm diameter holes bored through for ventilation. Watering was done every day, for the
first two weeks, before first manual turning occurred. After the initial two-week period, watering was carried out to control moisture levels but turning
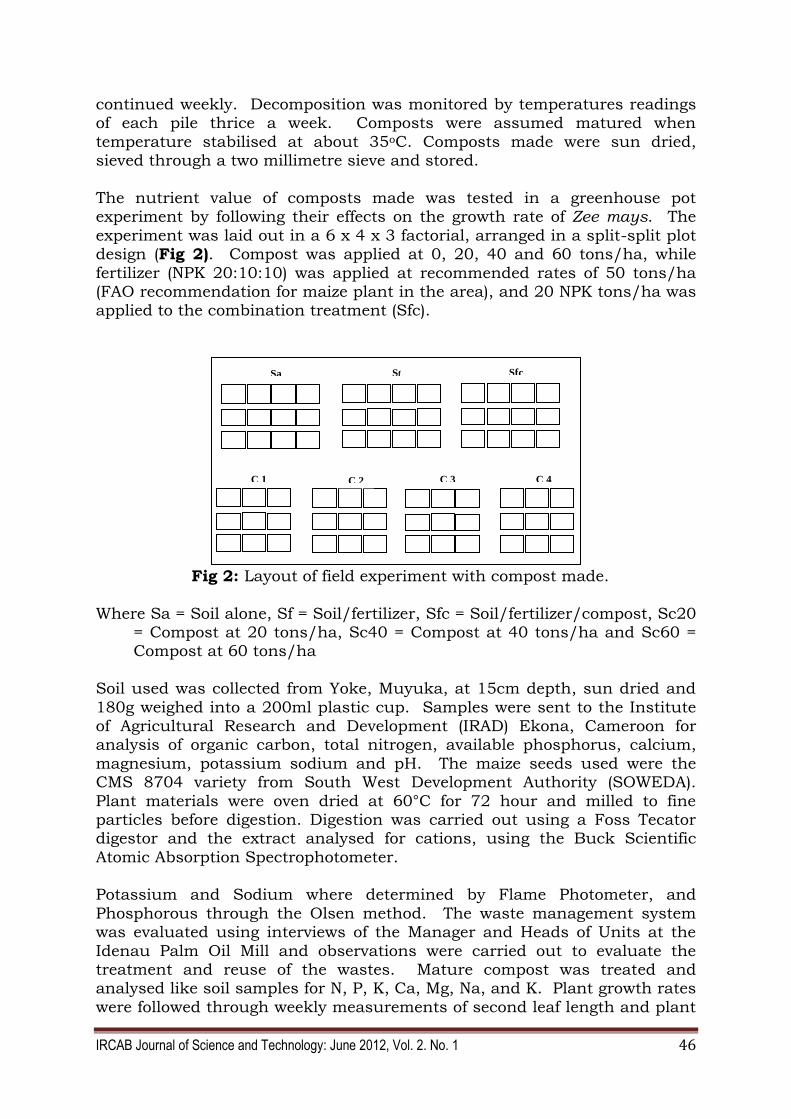
IRCAB Journal of Science and Technology: June 2012, Vol. 2. No. 1 46
continued weekly. Decomposition was monitored by temperatures readings of each pile thrice a week. Composts were assumed matured when
temperature stabilised at about 35oC. Composts made were sun dried, sieved through a two millimetre sieve and stored.
The nutrient value of composts made was tested in a greenhouse pot experiment by following their effects on the growth rate of Zee mays. The
experiment was laid out in a 6 x 4 x 3 factorial, arranged in a split-split plot design (Fig 2). Compost was applied at 0, 20, 40 and 60 tons/ha, while
fertilizer (NPK 20:10:10) was applied at recommended rates of 50 tons/ha (FAO recommendation for maize plant in the area), and 20 NPK tons/ha was applied to the combination treatment (Sfc).
Fig 2: Layout of field experiment with compost made.
Where Sa = Soil alone, Sf = Soil/fertilizer, Sfc = Soil/fertilizer/compost, Sc20 = Compost at 20 tons/ha, Sc40 = Compost at 40 tons/ha and Sc60 = Compost at 60 tons/ha
Soil used was collected from Yoke, Muyuka, at 15cm depth, sun dried and
180g weighed into a 200ml plastic cup. Samples were sent to the Institute of Agricultural Research and Development (IRAD) Ekona, Cameroon for analysis of organic carbon, total nitrogen, available phosphorus, calcium,
magnesium, potassium sodium and pH. The maize seeds used were the CMS 8704 variety from South West Development Authority (SOWEDA).
Plant materials were oven dried at 60°C for 72 hour and milled to fine particles before digestion. Digestion was carried out using a Foss Tecator digestor and the extract analysed for cations, using the Buck Scientific
Atomic Absorption Spectrophotometer. Potassium and Sodium where determined by Flame Photometer, and
Phosphorous through the Olsen method. The waste management system was evaluated using interviews of the Manager and Heads of Units at the
Idenau Palm Oil Mill and observations were carried out to evaluate the treatment and reuse of the wastes. Mature compost was treated and analysed like soil samples for N, P, K, Ca, Mg, Na, and K. Plant growth rates
were followed through weekly measurements of second leaf length and plant
Sa Sf Sfc
C 1 C 2 C 3 C 4
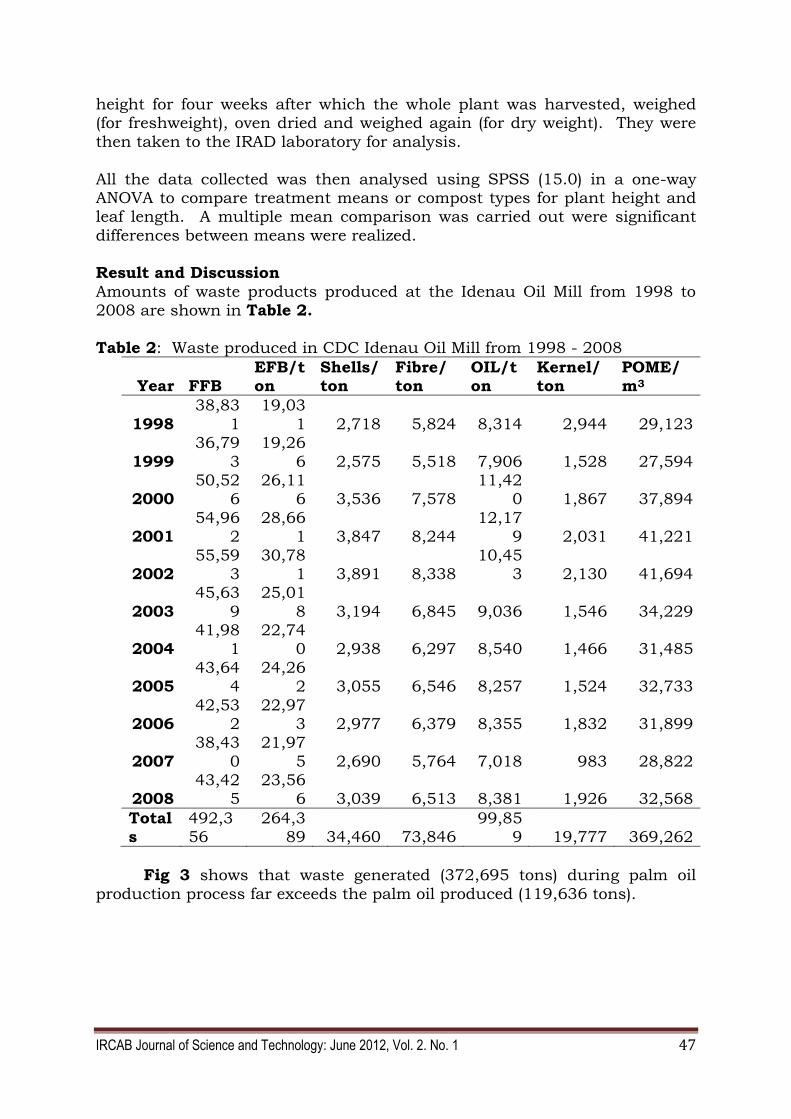
IRCAB Journal of Science and Technology: June 2012, Vol. 2. No. 1 47
height for four weeks after which the whole plant was harvested, weighed (for freshweight), oven dried and weighed again (for dry weight). They were
then taken to the IRAD laboratory for analysis.
All the data collected was then analysed using SPSS (15.0) in a one-way ANOVA to compare treatment means or compost types for plant height and leaf length. A multiple mean comparison was carried out were significant
differences between means were realized. Result and Discussion
Amounts of waste products produced at the Idenau Oil Mill from 1998 to 2008 are shown in Table 2.
Table 2: Waste produced in CDC Idenau Oil Mill from 1998 - 2008
Year FFB EFB/ton
Shells/ton
Fibre/ ton
OIL/ton
Kernel/ton
POME/m3
1998
38,83
1
19,03
1 2,718 5,824 8,314 2,944 29,123
1999
36,79
3
19,26
6 2,575 5,518 7,906 1,528 27,594
2000 50,52
6 26,11
6 3,536 7,578 11,42
0 1,867 37,894
2001 54,96
2 28,66
1 3,847 8,244 12,17
9 2,031 41,221
2002 55,59
3 30,78
1 3,891 8,338 10,45
3 2,130 41,694
2003
45,63
9
25,01
8 3,194 6,845 9,036 1,546 34,229
2004 41,98
1 22,74
0 2,938 6,297 8,540 1,466 31,485
2005 43,64
4 24,26
2 3,055 6,546 8,257 1,524 32,733
2006 42,53
2 22,97
3 2,977 6,379 8,355 1,832 31,899
2007
38,43
0
21,97
5 2,690 5,764 7,018 983 28,822
2008 43,42
5 23,56
6 3,039 6,513 8,381 1,926 32,568
Totals
492,356
264,389 34,460 73,846
99,859 19,777 369,262
Fig 3 shows that waste generated (372,695 tons) during palm oil
production process far exceeds the palm oil produced (119,636 tons).

IRCAB Journal of Science and Technology: June 2012, Vol. 2. No. 1 48
Fig 3: Total Wastes Produced in the Idenau Oil Mill (1998-2008)
The produce, in terms of oil and kernel, is only 29 % while the rest (71 %) is
waste in the form of EFB, POME, fibre and shell. CDC uses the shells and fibre to power boilers, but the greater portion of the input (FFB), in terms of
weight, is considered waste. Of about 492,356 tons FFB processed, only 119,636 tons of product (oil and kernel) were produced. The total solid wastes produced, in the form of EFB is 264,389 tons, shells are 34,460
tons, and fibres 73,846 tons, making a total weight of 372,695 tons (approximately 75.5 % of total input of FFB), an average of 37,269 tons a year.
Approximately 369,262 tons of waste water/POME has been produced in the
past 10 years, at approximately 36,926m2 of POME/year. According to Ma and Ong (1986) 7% FFB (by weight) ends up as shells and 15% as fibre. This is also confirmed by Maksum et al (2004) who estimated shells from
FFB to be 6-7% and fibre to be 11-15%. The total product of oil and kernel (119,636 tons) is much lower than waste generated, and includes EFB,
shells and fibre (372,695 tons) approximately 37,269 tons/year (solid waste alone). This waste production rate fits with the global average from Oil Mill factories. Large production means more waste will be generated, however,
in Malaysia these wastes are transformed into usable products like organic fertilizer for crop growth with companies like Golden Hope using all their waste to a point of zero discharge and save money. Golden Hope saved up to
67% by cutting down on inorganic fertilizer use and substituting it with composted EFB and POME. They also cut down on their GHG emissions by
minimum 77,872 tons CO2 equivalent, annually (Golden Hope report, 2008). Transforming wastes in CDC would save not only money but available resources now used to acquire inorganic fertilizer. The soil organic matter
will also be enhanced, increasing the soils ability to produce more while extending its ability to sustain crop growth through enhanced soil texture and other properties (Hoitink and Fay, 1986). According to Larson et al.
(1978), tons of wastes processed saved thousands of dollars and improve on the soil and the environment at large, by increasing the water holding
capacity of sandy soils, nutrient levels, soil pH and organic matter.
During the past 10 years in CDC, the shells (34,460), and fibre (73,846 tons)
are used as fuel to power the boilers but the EFBs are dumped along the
49%
7%
15%
21%
8%
EFB/ton
Shells/ton
Fibre/ton
OIL/ton
Kernel/ton

IRCAB Journal of Science and Technology: June 2012, Vol. 2. No. 1 49
.
roads side, by homes and at the various dump sites indicated on the map (Fig 4).
Fig 4:A schematic representation of the Idenau Oil Mill Waste Management system
Pictures of these dumped EFB at various sites are also shown in Plate 1 in
contradiction to Law No 96/12 of 5th August 1996, relating to Environmental Management in Cameroon (the Cameroon Environmental
Code) which prohibits dumping of waste without proper treatment.
Plate 1: Burning of EFB at the major open dump site (D1), behind the
Idenau oil Mill.
Since implementation of this law has been slow, nothing is done about it.
After dumping, the EFB is burnt during the dry season to create more space for further dumping, another practice against the Law. This burning also
increases GHG in the atmosphere. According to Golden Hope report (2008), the composting using EFB and POME has reduced methane emissions by 77,872 tons (CO2) equivalent/year. The adverse effects of these dumping of
EFB include ground water contamination, pollution of water bodies and distortion of the aesthetic beauty of Idenau town. The POME from the factory is discharged directly into the ocean, through a channel from the
factory without any treatment (Fig 4). The average pH of the POME was 4.8 (acidic) just like that measured at the Golden Hope Company, Malaysia at

IRCAB Journal of Science and Technology: June 2012, Vol. 2. No. 1 50
4.0. According to Ma et al (1999) and Golden Hope report (2003), POME has a high BOD and COD of 25,000-40,000 mg/L and 50,000mg/L respectively.
High BOD in POME is likely to affect some aquatic organisms (e.g.
phytoplankton) which live at the surface of the euphotic zone. These organisms are deprived of oxygen depleted by the breaking down POME, as reported by Ahmad et al (2003). The odour emission from POME is offensive
and those living around the POME pathway complained bitterly of this discomfort. The dumping and discharge of these wastes is a nuisance to the people and an environmental hazard.
The atmospheric pollution caused by burning is an issue since burning sends GHG to the atmosphere (Hamdan et al., 1998) in violation of the local
Environmental Laws of Cameroon. Road side dumping has become common practice in Idenau as seen in Plate 2, destroying the natural beauty of the environment and even occupying sidewalks used by pedestrians.
Plate 2: Road side dumping of EFBs on the Idenau highway
Wilting of plants and destroyed vegetation are found along the pathway of
released POME, (Plate 3).
Plate 3: Wilting in plants on the POME pathway to the ocean
POME with a pH of <5, when added to acid soils of the humid tropics will
negatively affect plant growth (Brady, 1984). The euphotic zone which depends on the clarity of water is distorted due to colour variations caused
by the discharge of this POME as seen in Plate 3. The EFB and POME are both major resources to the villagers. The EFB is used for smoking fish and as mulch in farms and gardens, while leftover oil is collected from the POME

IRCAB Journal of Science and Technology: June 2012, Vol. 2. No. 1 51
in a pond, where the ditch carrying POME to the ocean has been dammed (Plate 4).
Plate 4:POME trapped in a pond and boiled for local oil production before release by Women in Idenau
This waste water is then channelled to the ocean water. According to Ojonoma and Nnomaya (2007), the soils of POME dump site are altered due
to the acidic nature of POME. Methane and CO2 are emitted into the atmosphere contributing to global warming (Hassan et al., 2004).
Ma et al. (1999) estimated the methane/carbon dioxide ratio in anaerobic ponds to be 65:35 and approximately 28m3 CO2 emitted for each tone of
POME implying that the palm oil industry is greatly contributing to global warming. The soil nutrient status analysed are presented in Table 3.
Table 3: Available nutrients in the soil before compost application
Nutrient Org.C Tot.N %
C/N ratio %
Av.P %
Ca %
Mg %
K % Na % pH
Amount 1.1 0.13 8.46 0.02 0.01 0.1 0.1 0.1 5.5
Nitrogen values for the soil used in the experiment were 0.13, a range for N considered as medium. Phosphorus and K (0.02 and 0.1% respectively)
were low. These standards are the same with the soil survey staff standards set up in Malaysia, (Soil Survey Staff, 1997). The soil used was chosen because continuous cropping at the site is causing severe nutrient
depletion, making it suitable for such a study
Ndigui et al. (2001) had reported N and P values before decomposition as 0.16%, and 0.08% respectively, suggesting that EFB has nutrients that could be exploited for soil amendments. Averagely, N and P values for
decomposed compost were 3.2% and 4.7% respectively indicating that the POME has increased the nutrient value in the compost (concluded from the
nutrient content of POME in Table 4).

IRCAB Journal of Science and Technology: June 2012, Vol. 2. No. 1 52
Table 4: Nutrient content of POME before being used in compost
Nutrient Wet basis % Dry basis%
Total N 0.41 2.07
Total P(P2O5) 0.19 0.96 Total K(k2O) 1.29 6.51
Total Ca(CaO)
0.023 0.12
Total
Mg(MgO)
0.396 2.0
Total Na 80.0 0.02
Source: Maksum et al. (2004)
High N values (0.41% and 2.07% for both wet and dry POME) and K values (1.29 and 6.51 respectively) suggest that POME has contributed to increase the N (5.58%) and K (1.08%) values reported by the lab analysis for compost
C3 (Table 5). Zakaria et al. (1994), also found POME rich in nutrients and suggested its use for soil amendments after treatment. The Golden Hope
composting project also utilizes POME to enhance the nutrient value of compost (Golden Hope, 2003).
Table 5: Macro Nutrient Composition of Different EFB compost
Nutrient
Kg/ton
Compost types nutrient analysis
C1 C2 C3 C4 S0
Org.C (%) 8.85 11.36 10.17 8.78 1.1 Total N (%) 0.46 3.25 5.58 3.69 0.13
C/N 19.24 13.5 11.82 12.38 8.46 Av. P (%) 2.17 0.86 13.5 2.49 0.02
Ex. Ca+ (cmol+/kg)
0.42 0.42 0.05 0.59 0.01
Ex. Mg+
(cmol+/kg 1.1 0.98 1.12 0.63 0.1
Ex. K+ (c cmol+/kg)
0.75 1.08 1.08 0.6 0.1
Ex. Na+ cmol+/kg)
0.03 0.04 0.09 0.08 0.1
pH(H2O) 1:2.5 8.61 9.02 8.82 8.08 5.55
Mature compost was ready in three months with considerable reduction in weight and volume, (weight results read 31.3kg, 41.8kg, 38.4kg, and 50.0kg for compost 1-4 respectively). Results from lab analysis of mature compost
show composts from EFB and POME containing N, P, K+, Ca2+, Mg2+ and Na+ , which are the necessary macro and micro nutrients for plant growth. C3, with 5.58 kg/ton N suggests that EFB and POME combined will produce
composts rich in N. Results show generally that combining EFB and POME gives a richer outcome in conformity with Chang and Goh (1978), when
mulching with EFB and with Nkongho (2005). In both cases the growth and fresh weight of bunches were higher in the areas were EFB mulching was applied than the control, suggesting that EFB has good nutrient value.
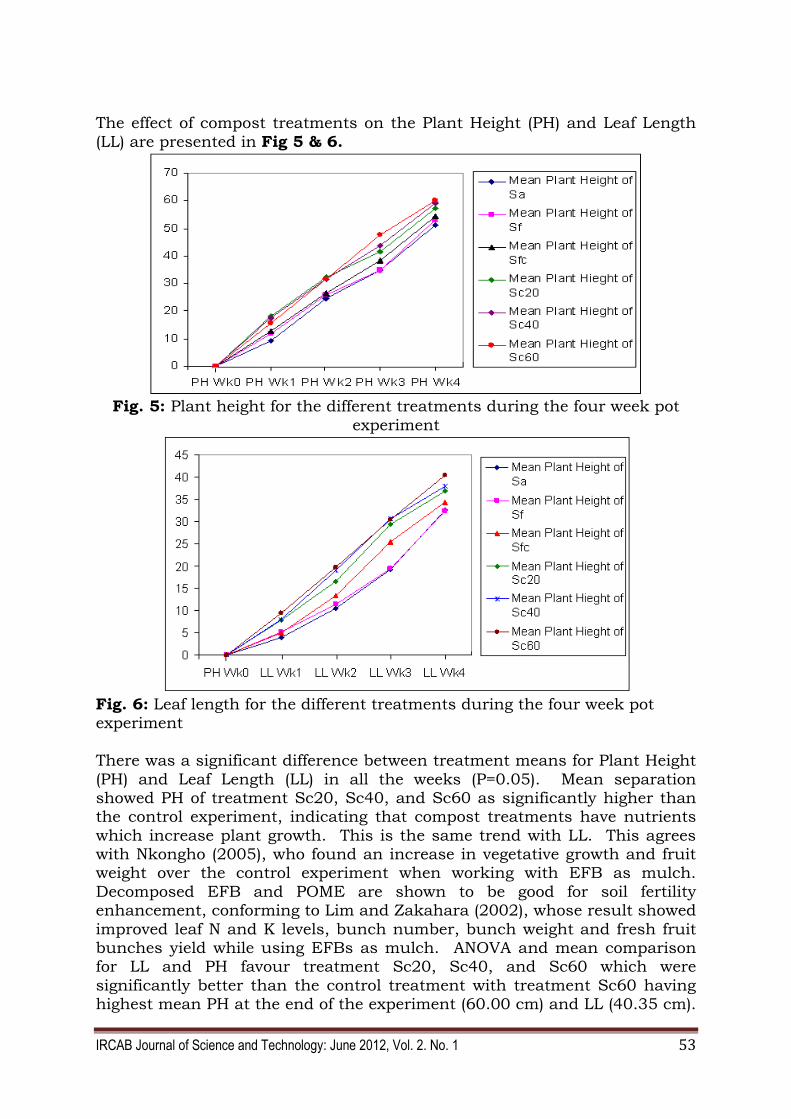
IRCAB Journal of Science and Technology: June 2012, Vol. 2. No. 1 53
The effect of compost treatments on the Plant Height (PH) and Leaf Length
(LL) are presented in Fig 5 & 6.
Fig. 5: Plant height for the different treatments during the four week pot
experiment
Fig. 6: Leaf length for the different treatments during the four week pot experiment
There was a significant difference between treatment means for Plant Height
(PH) and Leaf Length (LL) in all the weeks (P=0.05). Mean separation showed PH of treatment Sc20, Sc40, and Sc60 as significantly higher than the control experiment, indicating that compost treatments have nutrients
which increase plant growth. This is the same trend with LL. This agrees with Nkongho (2005), who found an increase in vegetative growth and fruit weight over the control experiment when working with EFB as mulch.
Decomposed EFB and POME are shown to be good for soil fertility enhancement, conforming to Lim and Zakahara (2002), whose result showed
improved leaf N and K levels, bunch number, bunch weight and fresh fruit bunches yield while using EFBs as mulch. ANOVA and mean comparison for LL and PH favour treatment Sc20, Sc40, and Sc60 which were
significantly better than the control treatment with treatment Sc60 having highest mean PH at the end of the experiment (60.00 cm) and LL (40.35 cm).
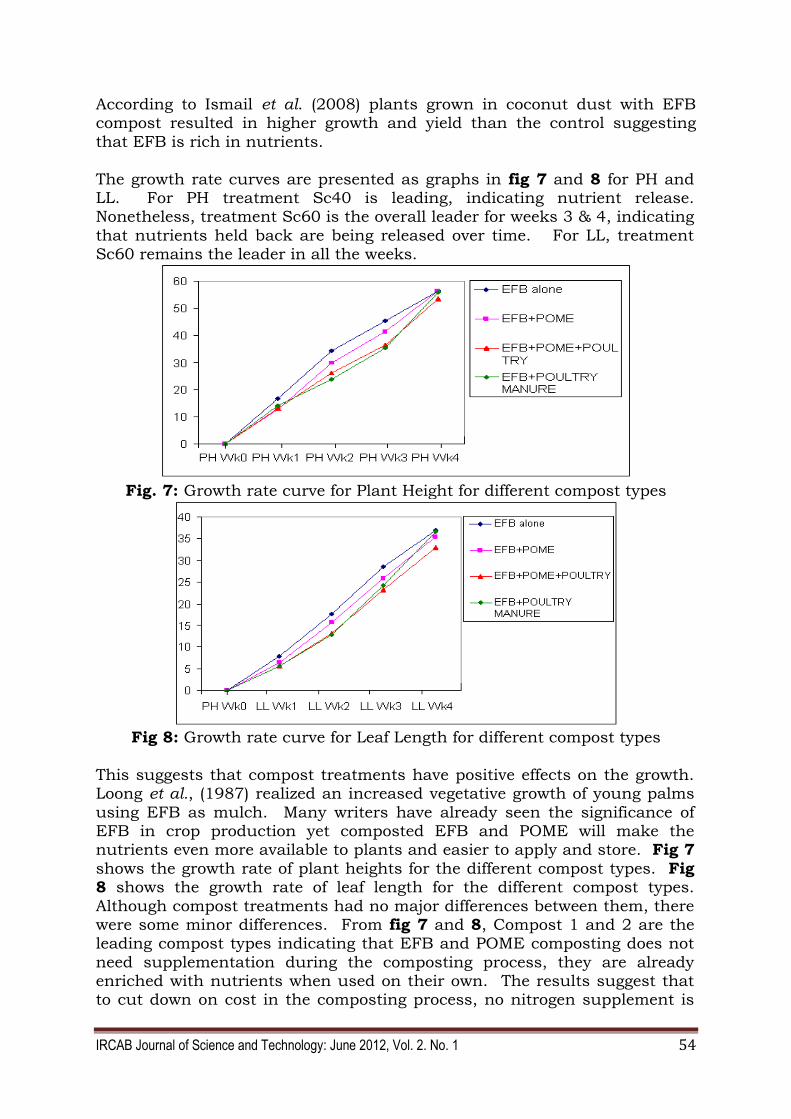
IRCAB Journal of Science and Technology: June 2012, Vol. 2. No. 1 54
According to Ismail et al. (2008) plants grown in coconut dust with EFB compost resulted in higher growth and yield than the control suggesting
that EFB is rich in nutrients.
The growth rate curves are presented as graphs in fig 7 and 8 for PH and LL. For PH treatment Sc40 is leading, indicating nutrient release. Nonetheless, treatment Sc60 is the overall leader for weeks 3 & 4, indicating
that nutrients held back are being released over time. For LL, treatment Sc60 remains the leader in all the weeks.
Fig. 7: Growth rate curve for Plant Height for different compost types
Fig 8: Growth rate curve for Leaf Length for different compost types
This suggests that compost treatments have positive effects on the growth. Loong et al., (1987) realized an increased vegetative growth of young palms
using EFB as mulch. Many writers have already seen the significance of EFB in crop production yet composted EFB and POME will make the nutrients even more available to plants and easier to apply and store. Fig 7
shows the growth rate of plant heights for the different compost types. Fig 8 shows the growth rate of leaf length for the different compost types.
Although compost treatments had no major differences between them, there were some minor differences. From fig 7 and 8, Compost 1 and 2 are the leading compost types indicating that EFB and POME composting does not
need supplementation during the composting process, they are already enriched with nutrients when used on their own. The results suggest that to cut down on cost in the composting process, no nitrogen supplement is
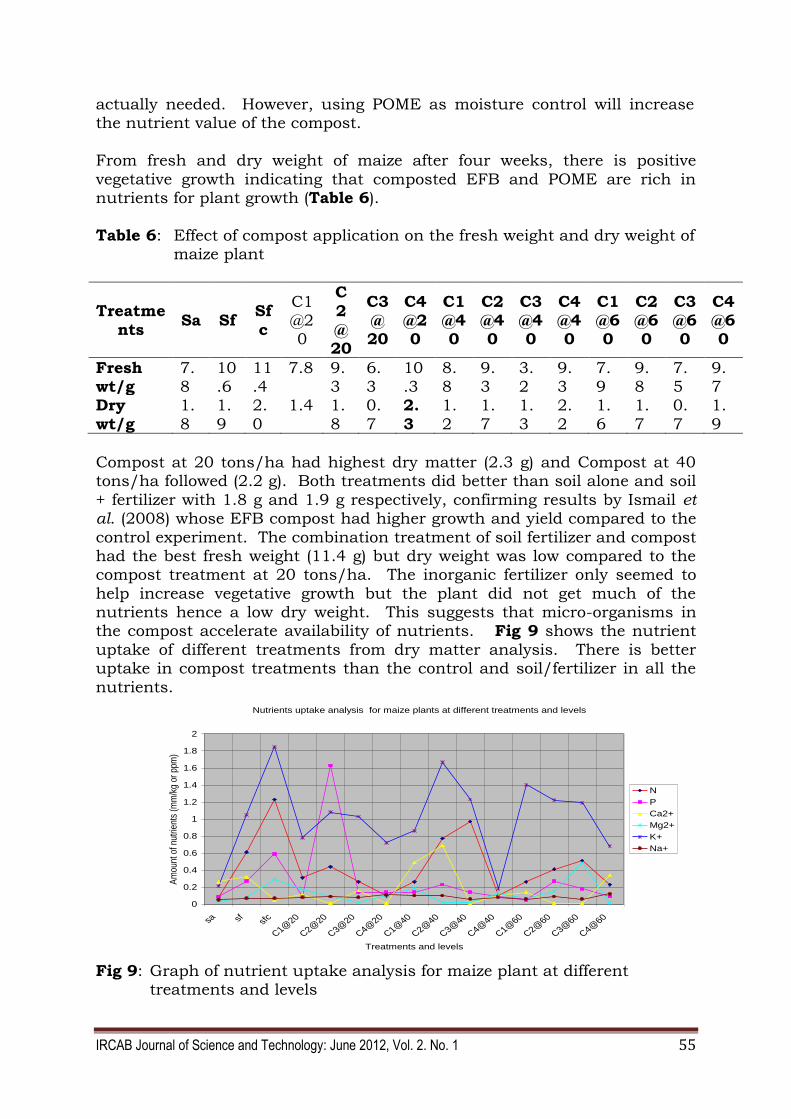
IRCAB Journal of Science and Technology: June 2012, Vol. 2. No. 1 55
actually needed. However, using POME as moisture control will increase the nutrient value of the compost.
From fresh and dry weight of maize after four weeks, there is positive
vegetative growth indicating that composted EFB and POME are rich in nutrients for plant growth (Table 6).
Table 6: Effect of compost application on the fresh weight and dry weight of maize plant
Treatme
nts Sa Sf
Sf
c
C1@20
C2
@20
C3@20
C4@20
C1@40
C2@40
C3@40
C4@40
C1@60
C2@60
C3@60
C4@60
Fresh wt/g
7.8
10.6
11.4
7.8 9.3
6.3
10.3
8.8
9.3
3.2
9.3
7.9
9.8
7.5
9.7
Dry
wt/g
1.
8
1.
9
2.
0
1.4 1.
8
0.
7
2.
3
1.
2
1.
7
1.
3
2.
2
1.
6
1.
7
0.
7
1.
9
Compost at 20 tons/ha had highest dry matter (2.3 g) and Compost at 40 tons/ha followed (2.2 g). Both treatments did better than soil alone and soil
+ fertilizer with 1.8 g and 1.9 g respectively, confirming results by Ismail et al. (2008) whose EFB compost had higher growth and yield compared to the
control experiment. The combination treatment of soil fertilizer and compost had the best fresh weight (11.4 g) but dry weight was low compared to the compost treatment at 20 tons/ha. The inorganic fertilizer only seemed to
help increase vegetative growth but the plant did not get much of the nutrients hence a low dry weight. This suggests that micro-organisms in the compost accelerate availability of nutrients. Fig 9 shows the nutrient
uptake of different treatments from dry matter analysis. There is better uptake in compost treatments than the control and soil/fertilizer in all the
nutrients.
Fig 9: Graph of nutrient uptake analysis for maize plant at different
treatments and levels
Nutrients uptake analysis for maize plants at different treatments and levels
0
0.2
0.4
0.6
0.8
1
1.2
1.4
1.6
1.8
2
sa sf sfc
C1@20
C2@20
C3@20
C4@20
C1@40
C2@40
C3@40
C4@40
C1@60
C2@60
C3@60
C4@60
Treatments and levels
Am
ount
of n
utrie
nts
(mm
/kg
or p
pm)
N
P
Ca2+
Mg2+
K+
Na+

IRCAB Journal of Science and Technology: June 2012, Vol. 2. No. 1 56
Yinda (1995) had revealed that minimum compost application of 20 tons/ha, without inorganic fertilizer was superior to inorganic fertilizer
alone. According to Sridhar and Adeoye (2003) inorganic fertilizer is more easily leached than organic fertilizer. In the sandy soils used it becomes
more obvious that compost treatments have increased water holding capacity and key biotic groups such as N-fixing bacteria and mycorrhrizal fungi, earth worms and termites (which are all important regulators of
nutrient cycling and good soil physical properties). The increased water holding capacity aided by compost has augmented the plants’ ability to take up nutrients in the compost treatments while nutrients in the control have
been more rapidly leached because of the soil’s porosity. Highest N uptake was realized at treatment Sfc (1.23 % N) suggesting that compost treatment
positively affected the uptake. The N uptake of soil and fertilizer was quite low (0.61 % N) indicating that compost in Sfc has definitely augmented the uptake in the combination treatment. A similar situation is found in usually
mobile K+, where the uptake (1.85 % K) was also increased by compost as the Sf (1.05% K) alone showed lower uptake than the C40 with 1.67 % K.
The result indicates that compost has a positive effect on plant uptake in combination with inorganic fertilizer. Highest P uptake was at treatment
C2@20 tons/ha with 1.63 % P, in agreement with Maksum (2008). The results (fig 9) show high P values for POME treatment (a combination of POME and EFB) indicating that both are rich in Phosphorus. The highest
Ca2+ uptake was observed with treatment C2@40 ton/ha with 0.69 % Ca followed by treatment C1@40 with 0.49 % Ca. Best uptake of Mg2+ was with
treatment C3@60 with 0.49 % Mg followed by the combination treatment Sfc with 0.29 % Mg. The highest Na+ uptake was with treatment C4@60 tons/ha (0.12 % Na) followed by C4@ 20 (0.11 % Na). All results show
compost treatments affecting uptake positively and confirming results of Olumuyiwa et al., (2004). Urea was used for the estimates made in this
study. CDC Palm Estates applies Urea fertilizer biannually at 1.5kg/tree. At 143 trees/ha CDC applies 215.5 kg/ha Urea, an equivalent of approximately 4 bags of Urea/ha. Present cost of a 50 kg bag of urea is
15,000 FRS CFA locally meaning the cost of fertilizing in the plantations with urea is 60,000 FRS CFA/ha. At the stated present rate of application used by CDC, they are applying 99.83kg N/ha.
The composts from EFB contain an average of 3.2% N. Therefore Compost
at 20ton/ha will produce 600kg of N (an equivalence of 279.9kg of urea) which is approximately 360,600 FRS. This represents three times the amount of nitrogen applied as urea. Organic fertilizer releases its nutrients
slowly and thus the residual effects of its application will remain for a second year (Sridhar and Adeoye, 2003). Multiplying this amount by the
16,000 ha in CDC Palms Estates (CDC 2006 Report), will give more than 5.7 billion FRS CFA saved for urea alone. One ton Compost/ha application at CDC will therefore save about 289 million FRS CFA for one application
alone. Table 7 shows the nitrogen value for the compost and urea.
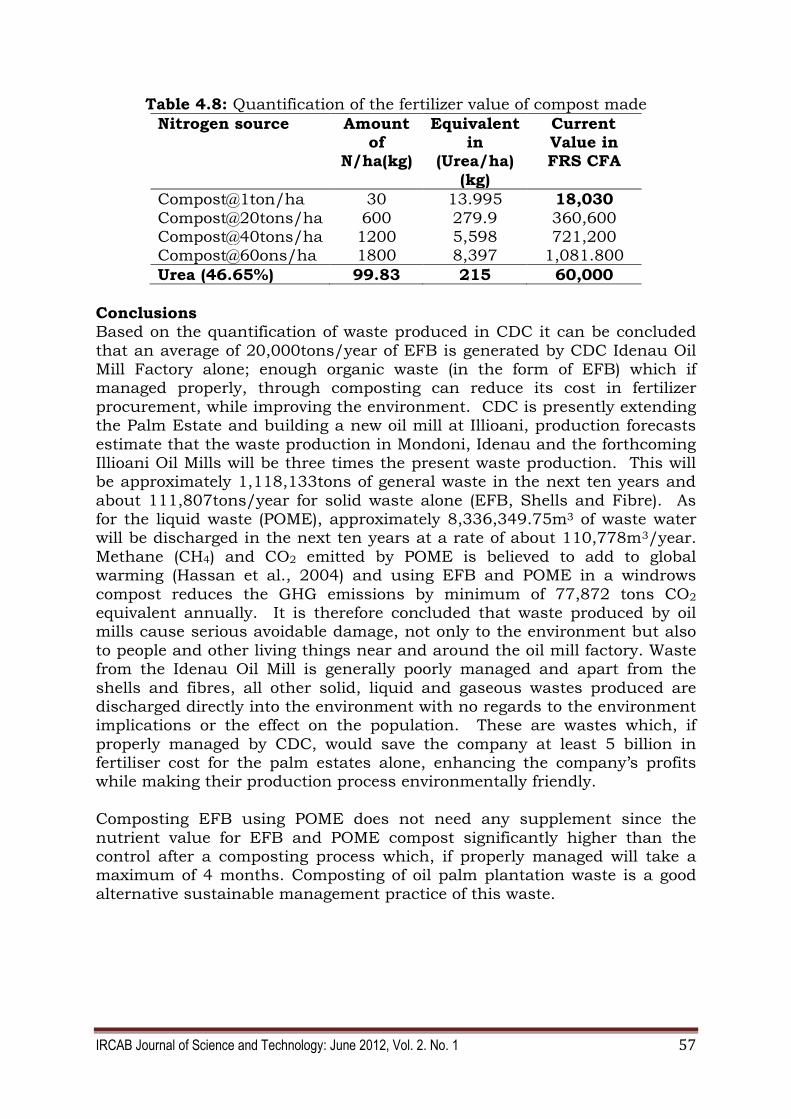
IRCAB Journal of Science and Technology: June 2012, Vol. 2. No. 1 57
Table 4.8: Quantification of the fertilizer value of compost made
Nitrogen source Amount of
N/ha(kg)
Equivalent in
(Urea/ha)
(kg)
Current Value in FRS CFA
Compost@1ton/ha 30 13.995 18,030
Compost@20tons/ha 600 279.9 360,600 Compost@40tons/ha 1200 5,598 721,200 Compost@60ons/ha 1800 8,397 1,081.800
Urea (46.65%) 99.83 215 60,000
Conclusions Based on the quantification of waste produced in CDC it can be concluded
that an average of 20,000tons/year of EFB is generated by CDC Idenau Oil Mill Factory alone; enough organic waste (in the form of EFB) which if managed properly, through composting can reduce its cost in fertilizer
procurement, while improving the environment. CDC is presently extending the Palm Estate and building a new oil mill at Illioani, production forecasts
estimate that the waste production in Mondoni, Idenau and the forthcoming Illioani Oil Mills will be three times the present waste production. This will be approximately 1,118,133tons of general waste in the next ten years and
about 111,807tons/year for solid waste alone (EFB, Shells and Fibre). As for the liquid waste (POME), approximately 8,336,349.75m3 of waste water will be discharged in the next ten years at a rate of about 110,778m3/year.
Methane (CH4) and CO2 emitted by POME is believed to add to global warming (Hassan et al., 2004) and using EFB and POME in a windrows
compost reduces the GHG emissions by minimum of 77,872 tons CO2 equivalent annually. It is therefore concluded that waste produced by oil mills cause serious avoidable damage, not only to the environment but also
to people and other living things near and around the oil mill factory. Waste from the Idenau Oil Mill is generally poorly managed and apart from the
shells and fibres, all other solid, liquid and gaseous wastes produced are discharged directly into the environment with no regards to the environment implications or the effect on the population. These are wastes which, if
properly managed by CDC, would save the company at least 5 billion in fertiliser cost for the palm estates alone, enhancing the company’s profits while making their production process environmentally friendly.
Composting EFB using POME does not need any supplement since the
nutrient value for EFB and POME compost significantly higher than the control after a composting process which, if properly managed will take a maximum of 4 months. Composting of oil palm plantation waste is a good
alternative sustainable management practice of this waste.

IRCAB Journal of Science and Technology: June 2012, Vol. 2. No. 1 58
References Brady, N.C. (1984) - The nature and properties of soils. Macmillan publishing
Company, New York. 750pp Cameroon Development Corporation, CDC (2006). Annual Report and
Accounts for the year ended 31st December 2006. Golden Hope (2008). Golden Hope Composting Project. Golden Hope
Plantations Berhad 2008 Annual Report. Golden Hope Plantations
Berhad, Kuala Lumpur. Hassan, M.A, Yacob, S. and Shirai, Y. (2004). Treatment of palm oil
wastewaters. In: Wang, L.K, Hung, Y. Lo, H.H. and Yapijakis C, eds. Handbook of industrial and hazardous wastes treatment. New York 7
Marcel. Hoitink, H.A.S and Fay, P.C. (1986). Basis for the control of soil borne
plant pathogens with composts. Ann. Rev. Phytopathol 24:93-114.
Ismail, M.R., Sze, L.Y., Poulus, P. and Ibrahim, H. (2008).The use of Oil Palm Fruit Bunch (EFB) Compost as additive in coconut dust soilless system for vegetable crop production. Abstract. URL http://www.acatahort.org/Hosted by K.U.leuven.
Kala, D.R., Rosenani, A.B., Fauziah, C.I. and Thohirah, L.A. (2009). Composting oil palm wastes and sewage slidge for use in potting media of ornamental plants. Malaysian Journal of Soil Science. 13(77-
91). Kulhman, L.R., B. Dale, A.C. Groenhof and T.F.E. Young. 1989. Windrow
Composting of sewage sludge and other wastes. Lim, K.C. and Zaharah, A. R. (2002) - The effects oil Palm Empty fruit
Bunches on Oil Palm nutrition and yield, and soil chemical properties. Journal of Oil Palm Research 14(2):1-9.
Loong, S.G., Mohd, N. and Letchumanan, A. (1987). Optimizing the use of
EFB mulching on oil palm on two different soils. Paper presented at the International Palm Oil Development Conference. Kuala
Lumpur.15pp. Ma, A.N. and Ong A.S.H. (1986). Biomass energy from Palm Oil industry.
Palm Oil Research Institute in Malaysia (PORIM) Kuala Lumpur, Malaysia.
Ma, A.N.,Toh, T.S. and Chua, N.S. (1999). Renewable energy from oil palm
industry. In: Singh G, Lim K.H, Leng T, David L.K, (eds). Oil palm and the environment: a Malaysian perspective. Kuala Lumpur Malaysia Oil Palm Growers’ Council. pp.113– 26.
Maksun E., Agricinal, P.T. and Bengkulu, U. (2004). Liquid Waste Utilization (POME) of Palm Oil. Palm Oil Research Institute in Malaysia (PORIM),
Kuala Lumpur, Malaysia. Ndigui, B., Rafflegeau. S. and Dubois, B. (2001). Effect d’un amendement
organique sur le dévelopment de juenes palmier a huile (Elais guineeasis jac) sur sable tertiaires : Cas des rafles des regimes de
palmes epandunes 16 a 18 mois avant replantation. Biosciences Proceedings. 8:401- 406.
Nkongho, R. N. (2005). The effects of Empty Fruit Bunches (EFB) mulch on
oil palm yields. Unpublished MSc Thesis, University of Buea.

IRCAB Journal of Science and Technology: June 2012, Vol. 2. No. 1 59
Ojonoma, L.O. and Nnennaya, I.R. (2007). The environmental impact of palm oil mill effluent (POME) on some physico-chemical parameters
and total aerobic bioload of soil at a dump site in Anyigba, Kogi State, Nigeria.
Rupani, P.F., Singh, R.P., Ibrahim, M.H. and Esa, N. (2010). Review of Current Palm Oil Mill Effluent (POME) Treatment Methods:V
Sridhar, M.K.C. and Adeoye, G. O. (2003) - Organic mineral Fertilizers from
urban wastes: The Nigerian Field. 68:91-111. Yinda G.S. and Adeoye G.O. (1995). A comparative study of two composting
methods. 3rd All African Soil Science Society Conference, Ibadan,
Nigeria. 19th – 26th August 1995.

IRCAB Journal of Science and Technology: June 2012, Vol. 2. No. 1 60
ASSESSING THE IMPACT OF OIL AND GAS INDUSTRY ON THE DEVELOPMENT OF NIGERIAN ECONOMY
ORBUNDE, B.B.
Department of Accounting Bingham University Karu, Nasarawa State
Abstract
Assessing the impact of the oil and gas industry on the development of Nigerian economy is the topic of this research. The research aimed at critically assessing the contribution of the industry, since its discovery over fifty years despite problems and challenges the industry is facing. The study adopts secondary source of data collection from CBN statistical bulletin and NNPC publications, the study tested one hypothesis and employed spearman rank order correlation as tool of data analysis and test of hypothesis. The result revealed 8.0926 positive correlation and t 8.829 table value of 2.160 at the df 13 and critical values for T is 0.05. Ho was rejected Ha accepted implying that crude oil production has impacted positively on the GDP as a measure of economic development. The study recommends that government should invest more in the industry by way of expansion and development of the industry to provide employment, infrastructure such as good roads, pipe borne water and electricity to enhance the country’s profile at OPEC, foreign exchange revenue generation and accelerate economic growth and development in general.
Keywords: Oil and Gas, Economic Development, Foreign Exchange, Petroleum, Revenue, Gross Domestic Product.
Introduction The Nigerian economy, up to the 21st century has remained an oil producing
economy, as it forms well over 60% of our Gross Domestic Product (GDP) until recently, when the Nigerian government, under various leaderships, are making moves towards developing other sectors of the economy, such as
agriculture (which had been the mainstay of the economy before the discovery of oil and gas), solid minerals and industries. It is the economy under which other economic activities revolve. The Nigeria economy, one
could conclude without mincing words that it is an oil-push economy, Labara (2009).
According to NNPC (2008), the Nigerian oil and gas industry has been in existence for more than 50 years since 1958, when the discovery was made
in ulaibiri which is now in Bayelsa State, Nigeria. Nigeria is the sixth largest producers of petroleum in the world and has altogether four refineries. The
petroleum industry occupies a very strategic position in the Nigerian economy as the nation’s major provider of foreign income. The industry plays a dominant role to the economy as 90% of the total revenue is from oil
and gas production, which over 80% of the nation’s foreign exchange earnings come from crude oil sales, NNPC (2008).

IRCAB Journal of Science and Technology: June 2012, Vol. 2. No. 1 61
Oil is of special importance to Nigeria since its discovery. Nigeria’s oil has impacted greatly on the world’s economy; the country is not just seen as a
third world country. Oil is a major resource endowment and accounts for a very high percentage of the country’s GDP, government revenue and foreign
exchange. Oil exploration in Nigeria is done both onshore and offshore, the critical area
for extraction is in the Niger Delta Basin. Oil sector activities are divided into two; the upstream and downstream.
The urban unemployment rate rose to 28% in 1992, and crime also increased at 31.4% especially in rural areas. A collapse of basic
infrastructure and social services since the early 1980s accompanied this trend, by 2002 Nigeria’s per capital income had plunged to about one quarter of mid-1970s high, below the level at independence. Along with the
endemic malaise of Nigeria’s non-oil sectors, the economy continued to witness massive growth of informal sector’s economic activities, estimated by
some to be as high as 75% of the total economy (NNPC 2008). The problem of this study is identified based on the fact that, although
Nigeria is endowed with oil, and gas deposit, the industry still faces a lot of problems. These include: the development of the industry, which is fragmented due to poor management and interference by inconsistent
government and bureaucratic policies; Nigeria’s relatively total dependence on the industry for revenue; environmental hazards, extreme poverty and
underdevelopment in oil producing areas and vandalization in Niger Delta. The objectives of the study are to examine the contribution of the oil and gas
industry to the development of the Nigerian economy (i.e. GDP); to enumerate the role of the industry; to evaluate the rate of improvements in the Nigerian economy and the importance of the sector in future
development and above all to examine the challenges of the industry in Nigeria.
The significance of this study is to provide an insight to the level of development in the Nigerian economy; it shows the importance of the sector
and the need to improve the infrastructural facilities, management and technology of the sector so as to boost the Nigerian economy. The study will
also project the economic growth and development in the country in the nearest future.
Methodology This study is based on some basic research questions, amongst which are; what is the importance of the industry (Oil and Gas) to the development of
Nigeria? How efficient are the activities of the industry in the development of Nigerian economy?
The study formulates the following hypothesis to assess the impact of oil and gas industry to the development of Nigerian economy.
Assessing the Impact of Oil and Gas Industry on the Development of Nigerian

IRCAB Journal of Science and Technology: June 2012, Vol. 2. No. 1 62
Ho: oil and gas petroleum production has no significant impact on Nigerian
economy: Ha: oil and gas petroleum production activity has significant impact on
Nigerian economy. This study is limited to the contribution of oil and gas petroleum production activities as to gross domestic product (GDP) growth in the Nigerian
economy from the period 1990-2010 obtained from CBN statistical bulletin and Nigerian National Petroleum Corporation (NNPC).
The study adopted secondary sources of data, using CBN statistical Bulletin and NNPC publication and websites to obtain data on the petroleum
production activities and GDP percentage contribution to the period under study, Spearmen rank. Other correlations were used as statistical tool for Data analysis by the researcher and to test the hypothesis.
Literature Review The Oxford dictionary of ecology (1998) defines petroleum (crude oil) as the naturally occurring liquid hydro carbon formed by the anaerobic decay of
organic matter. Oil is formed at its original site of formation but migrates to a suitable structural or lithological trap. On the other hand, Oxford Advanced Learner Dictionary (2000), defines petroleum as a mineral oil that
is found under the ground or sea and is used to produce petrol gas, paraffin, diesel oil etc.
Jaccard (2005), also defines petroleum as a term applied to a group of materials naturally formed within the upper strats of the earth crust. The
minerals are composed of hydro-carbon together with valid amounts of oxygen, Sulful, Nitrogen, as well as traces of metals. Petroleum is found in liquid and gaseous states and less frequently-as solid in its liquid state it is
known as crude oil or crude petroleum, in its gaseous state, as natural gas and its solid state by a number of terms e.g. asphalt, bitumen etc.
Labara (2009), describes petroleum as a compound word which in Latin language is called petra (meaning Rock) and Leum (meaning Oil), by this one
will not be wrong if petroleum is referred to as Rock Oil. Petroleum could also be formed from debris of forest fossil and it is also not wrong to call this
oil formation as offshore oil while the rock oil can be called onshore oil. According to Labara (2009) the oil and gas operation has two major activities
which encompasses the umbrella of major activities from searching of the oil to final consumption. These activities are, upstream and downstream activities. The upstream activities include exploration and appraisal,
acquisition development and production while the downstream activity involves transportation, refining (Manufacturing) distribution and
marketing.

IRCAB Journal of Science and Technology: June 2012, Vol. 2. No. 1 63
According to Statement of Accounting Standard (SAS) 14, the petroleum (oil and gas) industry occupies a very strategic position in the Nigerian economy
as the nation’s major provider of foreign income; it also plays a major role in financing the economic development of the nation.
Nigeria is blessed with abundant natural energy resources. The developments of these enormous resources have been uneven, having been
dominated by oil and gas to the neglect of other resources. Oil and gas has been developed largely to earn foreign exchange and for providing the bulk of the total commercial energy consumption in the country.
Nigeria first exported crude oil in 1959, since then the petroleum (oil and
gas) industry has become the centre piece of the country’s economy. The sector (oil and gas) has created employment opportunities, local expenditure on goods and services, contribution to government revenue and its Gross
Domestic Product (GDP) and foreign exchange reserves.
The Role Of The Oil And Gas Industry In The Nigeria Economy 1. Contribution to the Gross Domestic Product (GDP): According to
the (NNPC 2008) the Oil and gas industry plays a vital role on Gross
Domestic Product (GDP) which is measured by its Gross output less the cost of input, materials, equipment and services purchased industries.
ii. Contribution in Employment Opportunities: The oil and gas
industry is capital intensive and hence requires a labour intensive setting. This sector requires labour of all kinds, whether unskilled, semiskilled or skilled, all such services are needed in this sector. It
cuts across all types of labour and because of this it creates high rates of employment, ranging from accountants, economist, engineers, drivers, security personnels, etc.
The passing of the Nigerian oil and gas Industry Content Development
Bill 2010 is expected to create many jobs among other forms of empowerment for indigenous personnel and operators as it is expected to generate over 30,000 jobs in the next 5 years. The new law has far -
reaching implications for the issues of technological advancement, long term cost effectiveness, post amnesty programs in the Niger Delta
and the improved impact of the oil and gas industry on national growth, (Nigeria Energy Intelligence, 2010).
iii. Contribution to Government Revenues: The capital-intensive oil sector provides 95 percent of Nigerian foreign exchange earnings and about 65 percent of its budgetary revenues. The oil and gas industry
contributes to the payment of substantial revenues to the government. The significant increase in the government receipt in the recent years
are as the result of the huge increase in crude oil prices and the more favourable fiscal arrangements obtained by the government as a result of its improved bargaining position over the years (NNPC 2008).

IRCAB Journal of Science and Technology: June 2012, Vol. 2. No. 1 64
iv. Promote Country’s Profile: With production of petroleum, Nigeria has been able to identify with various organizations such, as World
Petroleum Congress (WPC), Oil Producing Export Countries (OPEC) and African Petroleum Producers Association (APPA). This has led to
increased countries in the global domain.
v. Surge in Income and Foreign Exchange: Petroleum has been the
source of income and foreign exchange for Nigeria since its commercial production on January, 2005 Nigeria earned a total of US $2.6 billion, an equivalent of N345.8 billion from the sale of crude oil
alone, at an average of US $46.86 per barrel and with an estimated daily sales of 1.79 million barrels (www.mbwndi.com).
vi. Transfer of technology: oil and gas industry is one of the sectors in
which, the much desired transfer of technology has to some extent
been achieved in areas of exploration and production. However, despite this huge benefit and contribution of oil and gas production on
economic development in Nigeria, Okubote (2001), is of the view that it is regrettable that after 40 years of oil and gas exploitation in Nigeria, the country has not been able to effectively develop other resources to
complement the role oil and gas plays in the economy. Agriculture which used to be the mainstay of the economy at independence has since been neglected while social and economic infrastructures have
been unprofessionally maintained. The inability to diversify and the death of productive capacities have been the bane of our economy.
The near total reliance and dependence on crude oil has led to utter neglect of other sector.
Okoye et al (2010 and NNPC 2008), also revealed that over reliance on crude oil has caused decline in development of agriculture, hence
reduces employment opportunities and thereby resulting into: i. Conflict in the oil producing areas (i.e. host communities) ii. Environmental hazard, oil spills
iii. Natural gas flaring iv. Under-development and poverty, corruption etc.
Expectation has shown that the nations cannot continue to rely on a single resource for its economic development, Okubote (2001). The
unpredictable and cyclical nature of the crude oil market with its attendant adverse impact on the country’s economic and socio-political well being attest to the danger of over reliance on crude oil.
Therefore, the challenge facing us in this sector as a nation is how to
develop appropriate strategies for judicious and efficient harnessing of the potentials of Nigeria’s hydrocarbon resources for stimulating the entire economy and for sustainable development.

IRCAB Journal of Science and Technology: June 2012, Vol. 2. No. 1 65
Data Presentation, Analysis and Interpretation This research is carried out using secondary sources of data obtained
from CBN statistical Bulletin and NNPC 2006 and 2008 publications. The data collected for analysis and test of hypothesis formulated
include crude oil production as independent variable and Gross Domestic Product (GDP) as dependent variable. To enable the researcher assess the impact or level of contribution of oil and gas
industry to the development of the Nigerian economy, the researcher formulate a null hypothesis that Ho oil and gas production has no significant impact on the development of Nigerian Economy.
Spearman Rank order correlation was used as tool for test of
hypothesis, rs = 1-6∑d2 and T = rs n-2 n-(n2-1) 1-rs
2
The T statistic can be used only when the number of sample spear is =
or > 10 other wise only spearman rank correlation will be used. The data collected for analysis and test of hypothesis is for the period
1990-2005 for both crude oil production and GDP representing independent and dependent variable (X and y) respectively. To enable the researcher manage the data whose figures are in millions, the data
is converted to percentage of crude oil production and GDP for the period under study.
Data Presentation In this research, data is presented and analyzed by first converting the
crude oil production and GDP values for 1990 – 2005 into percentage, analyzing the data and testing the hypothesis using spearman rank order correlation.
Table 3.1: Crude Oil Production bpd (1990-2005)
YEAR CRUDE OIL PRODUCTION (bpd)
% CRUDE OIL PRODUCTION
(bpd) X
1990 1,810.00 5.37
1991 1,891.80 5.61
1992 1,943.00 5.76
1993 1,960.00 5.81
1994 1,930.90 5.73
1995 1,992.75 5.91
1996 2,000.53 5.93
1997 2,132.45 6.32
1998 2,153.46 6.39
1999 2,129.86 6.32
2000 2,165.00 6.42
2001 2,256.16 6.69

IRCAB Journal of Science and Technology: June 2012, Vol. 2. No. 1 66
2002 2,117.86 6.28
2003 2,275.00 6.75
2004 2,328.96 6.91
2005 2,627.44 7.79
Total 33,715.17 100
Source: 2011 Index Mudi
Table 3.1 shows a tremendous increase in Nigeria’s oil production, inspite of the fluctuation. Here the percentage of crude oil production is included to ease the researcher in finding the correlation values with the values of (x)
independent variables.
Table 3.2: Real GDP From 1990-2005
YEAR GDP GDP% (Y)
1990 267,550.00 4.83
1991 265,379.10 4.79
1992 271.265.50 4.90
1993 274,833.30 4.96
1994 275,450.6 4.97
1995 281,407.4 5.08
1996 293,745.4 5.30
1997 302,022.5 5.45
1998 310,890.1 5.61
1999 312,183.5 5.63
2000 329,179.7 5.94
2001 256,994.3 6.44
2002 433,203.5 7.82
2003 477,533.0 8.62
2004 527,576.0 9.52
2005 561,931.4 10.14
Total 5,541,244.3 100
Source: CBN Statistical Bulletin, 2008
Table 3.2 shows the GDP of Nigeria for the duration of 16 years. From indication it shows a consistent rise in the rate of the GDP of the country.
Included in the data above is the percentage rate of the GDP as calculated for the purpose of the analysis which Dependent Variable (y).
Data Analysis and Test Of Hypothesis Having computed the percentages of the two values of crude oil production (x) and GDP (y), it is necessary to test the hypothesis. The summary of the
percentage is presented below; spearman rank order correlation and T test were applied, testing the hypothesis stated below.
Ho: Oil and gas petroleum production has no significant impact on the development of Nigerian economy (GDP).
Ha: Oil and gas petroleum production has significant impact on the
development of Nigerian economy (GDP). Table 3.3: Percentage of Crude Oil Production

IRCAB Journal of Science and Technology: June 2012, Vol. 2. No. 1 67
YEAR % PRODUCTION (X) %GDP ( Y)
1990 5.37 4.83
1991 5.61 4.79
1992 5.76 4.90
1993 5.81 4.96
1994 5.73 4.97
1995 5.91 5.08
1996 5.93 5.30
1997 6.32 5.45
1998 6.39 5.61
1999 6.32 5.63
2000 6.42 5.94
2001 6.69 6.44
2002 6.28 7.82
2003 6.75 8.62
2004 6.91 9.52
2005 7.79 10.14
Source: Computed by the Researcher. The table above represents the percentages of crude oil production and GDP
for 1990-2005 which is used to calculate the values of rank order correlation. Test of Hypothesis
Correlations
VAR00001 VAR00002
Spearman’s VAR00001 Sig. (1-tailed) N
16
000
16
VAR00002 correlation coefficient Sig. (1
tailed) N
939
.000
16
1.000
16
**Correlation is significant at the 0.01 (1-tailed).
VAR00001 VAR00002
VAR00001 Pearson Correlation Sig. 1 (tailed)
N
1
16
.878** .000 16
VAR00002 Pearson
Correlation Sig. (1 –tailed) N
.878**
.000 16
1
16
**Correlation is Significant at the 0.01 level (1-tailed).

IRCAB Journal of Science and Technology: June 2012, Vol. 2. No. 1 68
NONPARAMETRIC CORRELATION
VAR00001 VAR00002
Spearman’s rho VAR00001 Correlation Coefficient
1.000 .939**
** Correlation is significant at the 0.01 level (1-tailed).
The result of rs = 0.939 shows almost a perfect correlation between the Crude oil and production and GDP, reject Ho and accept Ha that crude oil
production has significant impact on the GDP which is on e of the variables used for measuring economic development of any country.
The researcher examined the strength of this highly positive correlation by converting the rs value to T S test
T = rs n-2 = t = 0.92 15-2 l-rs
2 1-0.9262
T = 0.926 13 0.143
T = 8.829: the discount factor (df) df = n-2 = 15-2 = 13
The critical value for T is 0.05 at 13 degree of freedom, is 2.160 using the distribution table.
Reject Ho since the calculated value 8.829>table value 2.160.
The result of t test also confirms the highly positive correlation that GDP growth rate is dependent on the crude oil production in the Nigerian economic development. The tests are significant at about 1%, 5%, and 10%
significant levels
Discussion of Finding From the analysis of data and test of hypothesis, it is evident that the GDP rate depends on crude oil production in the development of Nigerian
economy. This is consistent with Okubote (2001). The question here is that, is the oil and gas industry doing its best to develop the Nigerian economy? It
is obvious that the oil and gas industry has indeed impacted on the GDP rates of Nigeria positively, which means, the industry has contributed to the development of the Nigerian economy as a whole which is at variance to the
findings of Okoye et al (2010), that the oil and gas industry has affected the socio-economic and political lives of Niger Delta (the host community) negatively through environmental hazard, oil spill, natural gas flaring etc.
NNPC 2008 report is also consistent with the researcher findings that, the consistent rise in the level of the rate of GDP, implies a rising level of the
country’s GDP in the foreseeable future. This implies all things being equal the petroleum sector will continue to contribute to the development of the Nigerian economy.
Okubote (2011), Okoye et al, (2010) & NNPC (2008) both agree with the
researcher that oil is of special importance to Nigeria. As a result of the discovery of oil in Nigeria and critical impact of Nigeria’s oil on the world’s

IRCAB Journal of Science and Technology: June 2012, Vol. 2. No. 1 69
economy, the country is not just seen as a third world country. Oil is a major resource endowment and accounts for a very high percentage of the
country’s GDP, Government revenue and foreign exchange earnings.
Conclusion Nigeria is well endowed with oil and gas and from discovery the industry has since been given a lot of attention compated to other sectors of the economy
in Nigeria. It has widely been developed and expanded compared to other sectors of the economy. Also because of this attention, other sectors that have a large capacity of generating revenue for the government like
agriculture has been neglected and therefore totally depending on the petroleum industry for revenue, GDP and foreign earnings.
The study concludes that the petroleum industry has a major and significant impact on the development of the Nigerian economy. Findings
were proved mathematically using crude oil production rates and GDP rates as our variable to calculate the effect of the industry to the Nigerian
economy using GDP as economic variable, the hypothesis was tested using rank order correlation and T test statistical techniques.
Recommendations The recommendations put forth are based on the limitations, problems and challenges the industry is facing and compliance to these recommendations
will enhance efficient and effective management of the oil and gas industry and will in turn accelerate the economic growth and development in Nigeria.
The following recommendations are worth while:
i. It is generally appreciated that development can only thrive in
an atmosphere of industrial peace and harmony. In the past few years, there has been increasing unrest in the oil producing area because of the long neglect in terms of development.
Flaring of associated gas, other forms of pollution arising from oil activities have done a lot of damage to lives and properties as
well as ecology of the oil producing areas. Government should put up measures to eliminate the above outlined problems and challenges as well as conflicts in oil producing areas (Niger
Delta). Provide basic amenities like pipe bone water, electricity road network etc.
ii. Government should enforce and monitor the activities of the Niger Delta Commission (NDDC) and oil and gas companies in both the up stream and down stream sectors to provide job
opportunities to the Nigerian youths and the host communities in particular to eradicate poverty and unemployment.
iii. The ministry of petroleum resources should set up skills
acquisition centres for training of Nigerian youths on different skills for self employed jobs and establishment of agencies and
commissions to provide more employment opportunities to Nigerian graduate in related disciplines.

IRCAB Journal of Science and Technology: June 2012, Vol. 2. No. 1 70
iv. Corruption is a major set back in the development of any economy, Nigeria is not an exception. Government should
strengthen the EFCC and ICPC to fight corruption in the oil and gas industry to enable Nigeria have the desired impact of the
industry on the development of Nigerian economy. The removal of the oil subsidy is a welcome development if the policy is properly managed and implemented. It will reduce corruption in
the oil and gas sector and contribute positively to the development of urban and rural infrastructures and economy as a whole.
v. Government should revive the agricultural sector which was the mainstay of Nigerian economy before petroleum sector was
discovered, this will reduce over dependence on the oil and gas production activities as well as compliment and strengthen the sector (oil and gas) for sound economic development in Nigeria.
vi. The investment of government to the oil and gas industry is not commensurate to the benefits derival it productive activities.
Government should establish more refineries and peto-chemical industries to boost productions in order to meet with demand in the market which will in turn accelerate the economy.
Above all, oil and gas industry has become the mainstay of the Nigerian economy, therefore it should be given adequate attention and investment to
develop and expand it activities to meet up with demand in the Nigerian society and the world in general.
REFERENCES Akpan F.E. Annual on Oil and Gas Accounting, Jos.
Amnesty International (2006), Nigeria Oil, Poverty and Violence. Central Bank of Nigeria (CBN) (2008). Statistical Bulletin.
Boele, R; Fabig H.; Wheeler D. (2001); Shell Nigeria and the Ogoni: A Study in Unsustainable Development. The Story of Shell, Nigeria and the Ogoni People-Environment, Economic, Relationships; Conflict and
Prospects for Resolution. Sustainable Development. 9: 74-86. Carter P (2007) U.S. Department of State Remarks on US and International
Cooperation in Niger-Delta. Environmental Resources Managers Ltd., Niger – delta Environmental
Survey Final Report Phase 7 vol. 1.
Environmental and Socio-Economic Characteristic Lagos, Niger-Detal Environmental Samuel 1997.
Financial Time of London (1991) Greenspan A. (2002). Stock Options and Related Matter. The Federal Reserve
Board, Retrieval June 23rd 2009.
Jaecard M. (2005) Sustainable Fossil Fuels. Cambridge University. Joy A. ( 2009). The Role of Oil in Nigerian Economy. Nigeria.
Junger S. (2007). Blood Oil Vanity Kecin B.H and Toshi Y. (2001) Vutnain” Boosting Foreign Investment in Oil
& Gas Industry For Economic Development Being a paper Presented
at the Annual Conference Organized by CBN (Research Department)

IRCAB Journal of Science and Technology: June 2012, Vol. 2. No. 1 71
with the Theme “Resource Endowment, Growth and Macro Economic Management in Nigeria (NNPC May 2001).
Labara A.S (2009). Petroleum Resources Accounting Oil and Gas. Abkish Press Josh.
Mclenman J. and Stewart W. (2005). Deep Water Africa Reaches Turning Point. Oil & Gas Journal 1(6)03. Pg 18.
Okoye E.I; Akaubi C.O. & Enalme SQ; (2010); Oil & Gas Production and the
Social Economic Development of Niger-Delta Region in Nigeria. International Journal of Sustainable Development. 3(5).
Oxford Advanced Learners Dictionary (2000) Robert M. S. Solow (1956). A Contribution to the Theory of Economic
Growth. Quarterly Journal of Economics. 70(1):65-94.
Shell International Petroleum Company Development in Nigeria London March 1995.
Statement of Accounting Standards (SAS) 1417. The Price of Oil; Corporation Responsibility and Human Rights Violations in
Nigeria Oil Producing Communities. Human Rights Watch, 1999.
Uche R.U. & Adebiyi K.A. Petroleum Accounting and Taxation in Nigeria, Ibadan.
U.S Energy Information Administration (US ETA); Nigeria Country Analysis Brief. December, 1997.

IRCAB Journal of Science and Technology: June 2012, Vol. 2. No. 1 72
ENVIRONMENTAL RESEARCH AND CAPACITY BUILDING FOR POLICY FORMULATION IN NIGERIA
1LADIPO, M.K, & 2ADELANA, S. O.
1Department of Polymer and Textile Technology, Yaba College of Technology
2Department of Mechanical Engineering, Yaba College of Technology
E-mail: [email protected]
Abstract This paper is a typical innovative description of research and capacity building in the management of resources and environmental dynamics. The context of study was Nigeria which is a microcosm of the sub- Saharan Africa. . It is noteworthy to state that this region of the world is richly endowed with both natural resources (water and land based) and environmental variables that are of global interest. However, it is a disadvantaged region because of poor analytical, monitoring and management technology of these resources and the environment. Poverty, environmental pollution (water, oil and gas pollution etc) and biodiversity degradation (change in climatic conditions, global warming etc), poor livelihood, insecurity and disasters characterise this third world region. The impact of these indices of underdevelopment in this region jeopardises the realisation of neo-liberalization, sustainable development, globalisation, Millennium Development Goals and global security.The paper looked on the inherent tensions between the role of science in informing Public Policy development and the role of scientists in influencing what that policy should be. The paper concluded on the value of research and capacity building in environmental science and public policy in Nigeria. The National Policy on the environment was launched by the then Head of State in Abuja on 27th November 1989 (FEPA, 1989). The goal of that policy was to achieve sustainable development in Nigeria. Nigeria is located approximately between latitude 40 & 1400N of the equator and between long 20020” & 140 30” East if the Green wich meridian
Keywords: resources, environmental variable, sustainable development, public policy, globalisation research and capacity building. Introduction
Towards the end of the 1980’s Nigeria began to place a high priority on environmental matters, particularly water-related issues. This is reflected in
recent environmental policy, legislation, action plans and programmes introduced by the Government. In all these programmes, environmental monitoring activities, especially water quality aspects are given strong
consideration with the creation of the FEPA as the Central co-coordinating body for all environmental matters under the Federal Ministry of environment within the country, the new integrated water resources
management concept adopted by the Government will improve all aspects of water use and conservation within the conservation within the country if the

IRCAB Journal of Science and Technology: June 2012, Vol. 2. No. 1 73
political will and financial will resources for the implementation are sustained.
The US Environmental protection agency (USEPA) reported that in the 20th
Century ten warmest years occurred in the last 15 years of the Century (Awake 2003a). Average global temperature could rise to between 1.4 and 5.80C in the 21 Century (Awake 2003b) and lead to problems such as snow
cover in the Northern Hemisphere which has been decreasing as well as collapse of 3,250 – sqkm2 – ice shelf in Antarctica in early 2002. From some stations in Nigeria, Fasheun et al (1994) obtained a general increase in
means minimum temperature of 300C per decade based on data for 40 years. The rate of change exhibited latitudinal variations with highest of 60C
per decade occurring at the fringes of the Sahelian region and 20C per decade at the Coast. Their results also indicate marked down ward trends in the northern part of the country.
Study Area
Nigeria lies approximately between long 30 and 150 E and Lat. 40 and 140N. It is bordered in the north by the Niger Republic, east by Cameroon and west by Benin Republic. The Gulf of Guinea forms the southern boundary.
The longest distance from east to west is approximately 1,300km, and from North to South about 1,100km. Nigeria is about 923,300sq km.
Policy Issues A national body was created to coordinate all environmental protection
activities in Nigeria (The National policy on Environment). The National water supply and Sanitation Policy (2000) stipulated the following consumption standards; Rural water supply 30 liters per capital per day,
semi-urban (Small towns) 60 liters per capital per day while Urban water supply 120 Liters / C/d. Based on the foregoing, the following consumption
standard was adopted. The strategies put forward for effective environmental resources management in Nigeria include: (1) Promulgation of a national environmental resources law to coordinate
environmental resources development. (2) Formulation of an environmental resources master plan. (3) Improvement of environmental use efficiency for sustainable
development. (4) Implementation of environmental conservation measures.
(5) Establishment and enforcement of national environmental quality and emission standards to protect human health and aquatic ecosystems and spices.
(6) Continuous data collection for resource monitoring and management. (7) Introduction of economic incentives.
Results Some of these problems hinder the environment and the public in
Nigeria:

IRCAB Journal of Science and Technology: June 2012, Vol. 2. No. 1 74
(a) The ill-defined and uncoordinated roles of the Federal State and Local Government agencies responsible for environmental resources
development. (b) Unnecessary duplication and overlap in organizational structures and
functions of the relevant bodies in environmental issues. (c) The deficiency of the environmental resources itself. (d) Lack of effective environmental protection laws and the means to
enforce the already existing laws. (e) Lack of ability to maintain complete objectivity to present the science
in informing public policy development.
Research
This is where training, re-training, re-tooling and redeployment to both environmental scientist and policy experts become important. The lack of technical expertise, especially in information and communications
technology, has led a situation whereby national security equipment and facilities are manned by foreigners and we rely on these foreigners to collect
and analyze sensitive data. Adeniyi (2006) recommends that earth and environmental scientists and professionals should possess geospatial education and knowledge. While this responsibility is within the mandate of
universities and research institutes, professional associations need to incorporate modern technology training into compulsory continuing education training for all members.
Research deals with issues, activities and strategies relating to exploration,
documentation, conservation, improvement, sustainable utilization, processing, marketing, monitoring and analysis of resources of different kinds, distribution, scope and size. In this context, research presentation
will include the consideration of the use and values of indigenous knowledge and local participation especially in the area of satellite training.
Capacity Building The need for close co-operation among the various disciplines and
professions cannot be over-emphasized. The concepts, problems and relationships involved in the interaction between the built environment and climate are very complex and seemingly indeterminate. Only a multi-
disciplinary approach can expand our understanding of these constantly evolving phenomena.
In any institutional reform such as communication, meteorology, land building, spatial data infrastructure, military and every other aspect of
human endeavours,capacity building is a pivotal and as well as an essential component .The term Capacity literarily means the ability (power) to contain
or accommodate. It generally states the mental function or character of a being. Capacity building then incorporates the building/development of the concept, Capacity.
The term Capacity building has many different meanings and interpretations. Groot and van der Molens (2002), defined it as the
IRCAB Journal of Science and Technology: June 2012, Vol. 2. No. 1 75
development of knowledge, skills and attitudes in individuals and groups of people relevant in design, development, management and maintenance of
institutional and operational infrastructures and processes that are locally meaningful. The definition however takes a smaller context but still focused
on education, training and human resources development. A broader content was however defined in a United Nation publication on Capacity Assessment and Development (UNDP, 1998) as the ability of individuals and
organization or organizational unit to perform function effectively, efficiently and sustainably. In other words, Capacity building is the power/ability of a
system, an organization or a person to perform and produce properly. According to the same publication, Capacity building can be viewed at these three different levels (models): Health, Research and Community.
Conclusion and Recommendations This paper proposes a simple and low cost environmental science and public
policy scheme for Nigeria. It also made recommendations towards disaster management and public policy risk reduction strategies in Nigeria.
Recommendation for Policy – Makers
• Streamline the approval and implementation process for the
proposed integrated structure for the documentation of environmental science and public policy in the country.
• Allocate more funding to responsible agencies for environmental
science and public policy mitigation work, including recruitment
and training of staff, equipment and materials for implementation
• Enact policies that encourage and promote research community
participation in environmental science and public management.
Recommendation for Environmental Scientist and Researcher • Sensitizes the major stakeholders on the need for and benefits of
establishing a national environmental science and public policy
inventory. • Form interdisciplinary collaboration to create educational materials
and training programs on the effective use of environmental science and public policy to meet subsistence needs.
• Develop guidelines on environmental science and public policy risk
reduction strategies, safety and management procedures.
• Research mitigation measures to evaluate their efficiencies.
References
Ahmed A. Balogun et al (2007). Extreme Weather and Climate Events. Proceedings of Nigerian Meteorological Society. 11-15 November, 2007,
Akure, Nigeria ,Pages 233 – 236.

IRCAB Journal of Science and Technology: June 2012, Vol. 2. No. 1 76
Awokola O.S. and Akinhanmi (2004). Climate and Water Resources in the 21st century. Proceedings of Nigerian Meteorological Society. 16 – 18
November, 2004. Audu, H.O. et al (2004). Global Warming in Nigeria; Evidence in Southern
Eastern Nigeria Proceedings of Nigeria Meteorological Society, Page 37 – 38.
WMO (2006). Flooding and Sustainable development, WMO bulletin. 55(3) –
July 2006 Page 196. Ediang O. Archibong et al (2005). 11th World Lakes Conference, Nairobi,
Kenya, 31st October to 4th November 2005, proceedings Volume 1, Pages 10 – 12.
Ogunsote, O.O. and Pruenal-Ogunsote, B. (2007). Extreme Weather and Climate Events. Proceedings of Nigerian Meteorological Society. November, 2007, Akure, Nigeria.
Guardian newspaper (2006). New Development plan for the Niger Delta. Retrieved on 25th April, 2006 from http://www.ngrguardiannews.com

IRCAB Journal of Science and Technology: June 2012, Vol. 2. No. 1 77
COST PLANNING OF BUILDINGS – AN ADVANTAGE FOR THE POOR AND A NECESSITY FOR THE RICH IN PROJECT DEVELOPMENTS
AYODELE, E.O.
Department of Quantity Surveying Rufus Giwa Polytechnic
Owo – Nigeria [email protected]
Abstract
The paper examined the elemental and comparative methods of cost planning. This was carried out by the qualitative analysis of the two methods. This study showed in elemental cost plans that the client is made to be aware of the preliminary estimate and cost of each element of the project before designs are committed to paper, and these are accompanied with the following advantages: feasibility study made possible, time overrun of project minimized, cost overrun of project minimized, good quality job emerges, abandonment of project reduced, building collapse minimized. The study also showed, in comparative cost plans, that the client is made aware of the preliminary estimate and cost of each element of the project before designs are made apart from the fact that the client is able select from alternative design options, for the project. This is accompanied by the following advantages: client satisfaction on designs produced, because he chose from the alternatives, feasibility study made possible, time overrun minimized, cost overrun minimized, good quality job emerges, probability of abandonment of project is highly reduced, building collapse is also minimized; and cost planning technique operated by the Quantity Surveyor, which is an advantage to the poor and a necessity to the rich is recommended to clients of all categories in the building project developments, not only in Africa but in the continents of the world.
Keywords: Elemental cost Plan; comparative cost plan; preliminary estimate; time overrun, cost overrun; building collapse; project abandonment
Introduction A study of the up-to-date development of Quantity Surveying with respect to
functions exposes three related stages: i) Before and up till the 18th century when the Quantity Surveyor, then
referred to as measurer were invited to measure and cost the already executed work, in order to appropriately determine the money due to tradesmen from client.
ii) Early 19th century when Quantity Surveyors then called Measurers were invited to measure and cost the already made designs before
project execution commenced. The cost determined enabled the client to receive tender quotations on a rational basis from where only one is selected to execute the project (Seeley, 1990).
iii) From mid-19th century up-to-date when Quantity Surveyors are invited into the project development process at the inception and before any design is made (Ayodele, 2008).

IRCAB Journal of Science and Technology: June 2012, Vol. 2. No. 1 78
The third stage presupposes that Quantity Surveyors perform their cost duty
before design commences, and the cost duty continues as design process progresses to design completion.
The costing before design is referred to as approximate estimating while costing during design processes is referred to as cost planning. (Seeley, 1990; Ashworth, 1992; Ayodele, 2005; Aqua Group, 1990).
Literature Review Cost planning has been described as a process of pre-design costing which
attempts to represent the total picture of an anticipated cost in a way which provides a clear statement on issues and isolates the courses of action and
their relative cost, so as to provide a guide to decision making (Seeley, 1990). Cost planning defined at RICS Post Graduate Cost Planning course at
Brixton is that; it is a systematic application of cost criteria to the design process so as to maintain in the first place, a sensible and economic relation
between cost, quality and appearance, and in the second place, such an overall control of proposed expenditures as circumstances might dictate (Seeley, 1990).
Cost Planning can be aptly defined as a cost control process of ascertaining the probable cost of project and splitting the pre-determined sum into the
elements that make up the project, at the design stage (Ayodele, 2005). When the approximate estimate of a project is reasonably and
proportionately split into project elements, a cost plan results. (Ayodele, 2008). Cost plan helps the architects in designing economically (Aqua Group, 1990). In a survey conducted in Nigeria, result showed that the
usage of cost planning technique is zero and this has been due to: Quantity Surveyors not being commissioned into the design process. - Client in a hurry to get his project started.
- Client not aware of the cost planning technique and its advantages. - Cost index not readily available
- Nigerian Architects do not want their design to be cost monitored - Low utilization of information technology affect the use of cost index - Regional variation affects the use of cost data in Nigeria (Ayodele,
2008). -
It is the opinion of Ogunsemi (2002), that the absence of full practice of cost control with a base of cost planning, is a major source of building collapse in Nigeria. This is because Clients will not be aware of the probable cost of is
proposed building project before he commences the building operation. As the fund is about to get exhausted he is tempted to make use of sub-standard materials and workmanship which may lead to collapse of the
structure in no time.
Background to the Problem The number of abandoned projects comprising of residential, commercial and industrial buildings scattered across the nation of Nigeria is quite

IRCAB Journal of Science and Technology: June 2012, Vol. 2. No. 1 79
alarming and one imagines what edifices they would have become if only they had been completed – there is hardly any state in Nigeria today that is
not dotted with abandoned projects, which have been over-grown with weeds and equipment left behind, by the contractors that once handled them,
(Aluko, 2008). Osemenan (1987) reported that Nigeria has become the “world’s junk-yard” of abandoned project worth billions of naira and its greatly unthinkable that Nigeria blessed with so great potentials in the
construction industry can experience such magnitude of project abandonment. According to Kotangora (2003) in Nigerian Tribune Newspaper of 17th November 1993, there are about 4000 uncompleted or
abandoned projects belonging to the Federal Government with an estimated cost of about N300 billion, which will take 30 years to complete at the
present execution capacity of government; the issue of abandonment have been left without adequate attention for too long and is now having a multiplier effect on the construction industry in particular and the national
economy as a whole.
Effects of abandonment of projects are unemployment, reduction in government revenue, reduction in economic activities, low standard of living among others (Aluko, 2008). The number one and strong reason for project
abandonment is inadequate financial planning, (Aluko, 2008); this is corroborated by Odeyinka and Yusuf (1997), and Ezenwa (2004). According to Akindoyeni (1989), planning, which includes financial planning is the
foremost thing to be done if projects are to be completely executed.
Ogunsemi (2006), asserts that the successful completion of a project depends on financial planning. Adequate financial planning cannot be done by the client if he does not know the cost of the proposed project at
inception and so the building design is aesthetically and outrageously loaded.
In a survey conducted by Ayodele (2008), in South Western States of Nigeria; 11.5% of projects studied passed through preliminary estimating process,
while none passed through cost planning process. The zero utilization of cost planning technique in the Nigerian building industry has resulted into the production of uneconomic designs which the clients have not been able
to completely finance and execute on ground – i.e. project abandonment is the order of the day, because the client has not prepared his purse for it.
Cost plan is the very basis of, and the means to economic designs of building projects (Ayodele, 2005). According to Seeley (1990), Jagboro,
(1995) and Ayodele (2005), the purpose of cost planning is to produce economic design which takes into consideration the client’s financial ability and allows the client to be aware of the financial implication of the proposed
project at the design stage.
In Nigeria, the utilization of cost plan is zero, even though the methods and processes of cost planning had been published in books and journals for more than sixty years (Ayodele, 2008). The United Kingdom is an exception.

IRCAB Journal of Science and Technology: June 2012, Vol. 2. No. 1 80
There is therefore the urgent need to emphasize the types of cost planning to the clients and policy makers; be they public, corporate and private, at both
local national and international levels. There is also the need to remind the professionals Architects, Engineers and Quantity Surveyors about the
existing methods of cost planning which when put to use, economic design of building results, which will be advantages to the poor client and a necessity to the rich client be they public, corporate and private, at local,
national and international levels. Methodology
The methodology adopted for this work is quantitative analysis of methods of cost planning. The circumstances that lead to the utilization of the two
methods; i.e. elemental cost planning and comparative cost planning are analyzed.
Qualitative Analysis of Cost Planning Methods Two methods of Cost Planning exist: elemental cost planning and
comparative cost planning (Seeley, 1990; Ashworth, 1992; Jagboro, 1995, and Ayodele, 2005). Either of the methods will result into the production of cost plan which guides the Architects in designs.
Cost Plan is the pre-design financial statement which shows the distribution of money on elements that constitute the project.
Elemental Cost Plan (Design to Cost)
This method of preparing cost plan is usually referred to as designing to cost. This presupposes that cost is rigid and the design is made to match the cost. The cost limit (client’s financial ability is proportionally splitted on
the basis of elements that constitute the project. What results is the pre-design financial statement which shows the distribution of money on elements that constitute the project, i.e. cost plan. This can be referred to
as economy cost plan; because the design is dictated by the available fund. Qualitative Analysis of Cost Plan refers to the characteristics of the cost plan
that makes it advantageous to users and beneficiaries. Qualitative Analysis of Elemental Cost Plan
Elemental cost plan therefore posses the following in-built characteristics that makes it advantageous, necessary and essential in the construction
industry. 1. It reveals the preliminary estimate of proposed project, 2. It reveals cost target of each of the elements that constitute the
proposed project. All these help the client to prepare his purse for the proposed project.
When a local, national or international construction economy, either poor or rich administered by either public, corporate or private client, utilize cost
plan the following advantages emerge:

IRCAB Journal of Science and Technology: June 2012, Vol. 2. No. 1 81
i) Feasibility studies: The client is able to utilize the preliminary estimate to undergo feasibility study on his proposed business
venture. If the proposed project is viable and feasible, he may go ahead; otherwise, further effort on the project stops at this point,
since no design has been done and therefore no need to commit further effort and fund to design.
ii) Time overrun is minimized. Since the client has prepared his
purse for the proposed project, delay as per lack of fund is eradicated.
iii) Cost overrun is minimized. Lost time produces lost cost
(Nwachukwu, 1999). Cost overrun is minimized to the extent that time overrun is minimized.
iv) Good quality job. Since there is enough funds for the project, there will be no need for either the client and contractor to employ the use of inferior materials. Good quality job results.
v) Abandonment of project. Since there is enough money in the purse, abandonment of project that is the vogue of the moment will
vanish. Projects can now commence and be completed without abandonment.
vi) Building collapse. The presence of adequate project fund will not
allow either the client or contractor to utilize inferior materials and labour that may result to building collapse. Building collapse is therefore reduced to the barest minimum.
Elemental Cost Plan ( Economy Cost Plan )
S/N Elements Cost Limit
1 Substructure 1,200,000
2 Blockwork 400,000
3 Concrete work 500,000
4 Roofing 1,300,000
5 Wood work 400,000
6 Glassing 450,000
7 Metal work 250,000
8 Electrical works 250,000
9 Plumbing and Drainage 150,000
10 Plastering 300,000
11 Finishing 600,000
12 Painting 300,000
13 External Works 500,000
14 Total 6,700,000
Comparative Cost Plan (Costing to Design) This is referred to costing to design. Design and its elements are of prime
importance to the client, i.e. design is rigid and costing is made for the design. To arrive at the design: (1) Alternative design solutions for each of the elements that constitute the project are listed e.g. Roof covering – iron
sheet, aluzinc, alumaco; walls – blocks, wood, glass; painting – emulsion,

IRCAB Journal of Science and Technology: June 2012, Vol. 2. No. 1 82
texcorte, and etc (2) the client or through his advisers, Architect and or Quantity Surveyor chooses his options on the available alternatives. The
client may choose a costly or cheap alternative depending on his taste. (3) The Quantity Surveyor does the costing to each of the elements that make
up the proposed project. What results is the pre-design allocation of fund to each of the elements that
constitute the proposed project i.e comparative cost plan. Comparative Cost Plan can be regarded as Taste Cost Plan; because its main
feature is taking care of the taste (high or low) of the client, i.e. taste of client is of prime importance.
Table 2: Alternative design options in Comparative Cost Plan
S/N
Elements
Alternative Design Options
1 2 3 4 5
Chosen Option
1 Substructure * - * - - 2
2 Block Work * * - - - 2
3 Concrete Work * - - - - 1
4 Roofing - * * - * 3
5 Wood Work - * - - - 1
6 Glassing * - * - - 2
7 Metal Work - - - * - 1
8 Electrical Work - - * * - 2
9 Plumbing Work - * * - - 2
10 Plastering * - - - - 1
11 Finishing * - - * - 2
12 Painting * - * - - 2
13 External Works - * - - - 1
14 Total

IRCAB Journal of Science and Technology: June 2012, Vol. 2. No. 1 83
Table 3: Plan of Alternative Options in Comparative
S/N
Elements
Alternative Design Options
1 2 3 4 5
Chosen Option
1 Substructure - - * - - 1,400,000
2 Block Work * - - - - 400,000
3 Concrete Work * - - - - 500,000
4 Roofing - * - - - 1,500,000
5 Wood Work - * - - - 550,000
6 Glassing * - - - - 450,000
7 Metal Work - - - * - 400,000
8 Electrical Work - - - * - 350,000
9 Plumbing Works - * - - - 300,000
10 Plastering * - - - - 350,000
11 Finishing * - - - - 750,000
12 Painting - - * - - 350,000
13 External Works - * - - - 700,000
14 Total 8,000,000
Table 4: Comparative Cost Plan (Taste Cost Plan)
S/N
Elements
Amount N
1 Substructure 1,400,000
2 Block Work 400,000
3 Concrete Work 500,000
4 Roofing 1,500,000
5 Wood work 550,000
6 Glassing 450,000
7 Metal Work 400,000
8 Electrical Work 350,000
9 Plumbing Work 300,000
10 Plastering 350,000
11 Finishing 750,000
12 Painting 350,000
13 External Works 700,000
14 Total 8,000,000
Qualitative Analysis of Comparative Cost Plan The quality factors or characteristics that make comparative cost plan
advantageous, necessary, and essential in project developments; 1. Choice from alternative options. Comparative cost plan gives
room for the clients to choose from the available alternative design options. The client may decide to choose cheap (but of good quality) or costly options, either according to his taste or desire.

IRCAB Journal of Science and Technology: June 2012, Vol. 2. No. 1 84
2. Preliminary estimate of the proposed project is known before serious designs are committed to paper.
3. Estimate of each of the elements that constitute the project is also known before serious designs are committed to paper
When a local, national or International construction economy either poor or rich, and administered by either public, corporate or private client, utilizes
comparative cost plan, for project design, the following are the advantages: i) Satisfaction. The client is satisfied with both the design and the
entire project even after execution this is because he chose design
options and specifications by himself, i.e. design was not imposed on him by the Architect.
All the other advantages derived from the use of elemental cost plan, also emerge under comparative cost plan, for example:
Feasibility can easily be carried out
Time overrun of project is minimized
Cost overrun of project is also minimized
Good quality job emerges
Probability of abandonment of project is zero
Probability of collapse of the building project is eradicated.
Discussion The quality characteristics of elemental cost plan i.e the emergence of preliminary estimate and the elemental cost targets, and that of the
comparative cost plan – choice of design options by client, the emergence of preliminary estimate and the elemental cost target; are in agreement with the advantages of cost plan as put forward by Ashworth, (1992) and Seeley,
(1990). The current situation in Nigeria does not romance with cost planning practice and according to Adegbamigbe, (2003), clients are in hurry
to get their project started and even that Nigerian Architects and Engineers believe that cost planning process erode their freedom in design and therefore are unwilling to cooperate.
Conclusion
Both methods of producing cost plan result into reduction in the incidences of cost overrun, time overrun, project abandonment, building collapse and the emergence of good quality job. The current situation in Nigeria
discourages clients from investing in construction because the triplet monster of time overrun, cost overrun and poor quality job dominates.
Recommendation Clients in the construction industry are pleased and want to invest in
constructing when feasibility can be easily carried out, time over run is minimized, cost over run of project is also minimized, good quality job emerges, probability of abandoned project is zero, and probability of collapse
of the building project is eradicated and are satisfied with the final product. Therefore, clients at what ever level are strongly advised to make use of cost planning by commissioning Quantity Surveyors at the design stage of their
project developments and making them to cost plan designs.

IRCAB Journal of Science and Technology: June 2012, Vol. 2. No. 1 85
It is also recommended that cost planning clause should be included in the Conditions of contract and National Building Code at local and international
levels.
REFERENCES
Adegbamigbe H. A. (2003) Relevance of Building design and design supervision in the imoprovement of building quality in Nigeria. Technology and sustainable Development in gthe 21st Centrury.
Alabi-Eyo Ltd, Akure. Pp 580-589. Akindoyeni A. (1989) The management of abandoned project. Journal of the
Nigerian Institute f Building 1 (2), 2 – 7 Aluko O.O. (2008) Construction project abandonment in Nigeria: A threat to
national economy. Knowledge Review. 16 (3), 18 - 23
Ashworth A.A. (1992) Cost Studies of Buildings 1st edition. Longman Scientific and Technical. England
Aqua Group (1990) Tender and Contracts for Building. 2nd edition. Oxford Blackwell Scientific Publications. England
Ayodele E.O. (2005) Construction Economics. Double Birth Production
Owo. Ayodele E.O. (2008) An appraisal of Cost Planning Technique as a tool for
economic design of building project. Journal of Research and
Production. 12 (2), 165 – 172 Ezenwa F.O. (2004) Project procurement method in due process or how to
execute capital projects efficiently. Department of Physical Planning and Development. National Univerisities Commission. Abuja Nigeria
Jagboro G.O. (1995) Techniques and procedure for Building Economics.
Fancy Publications. Lagos Kotangora M (1993) Housing for all by the year 2000. Nigerian Tribune,
Friday 17th November, 1993.
Nwachukwu J.C (1999) Introduction to Engineering Economics and Administration – Human Resources, Time and money. Ambik Press.
Benin Odeyinka H.A.S. Yusuf A. (1997) The causes and effects of construction
delays on completion cost of housing project. Journal of financial
management of property and construction. 2, 31 – 41. Ogunsemi D.R. (2006) Predicting the final cost of building projects in
Nigeria. The Quantity Surveyor 54, (4), 3 – 6. Seeley I.H. (1990) Building Economics. 3rd edition. Macmillian Press
Limited London.
Ogunseni D. R. (2002) Cost Control and Quality Standard of Building Project. In Ogunseni D. R. ed. Building Collapse: Causes, Prevention and remedies. Proceedings of Seminar of Nigerian Institute of
Building Ondo State Chapter, Akure Pp 88-94.

IRCAB Journal of Science and Technology: June 2012, Vol. 2. No. 1 86
MICROBIOLOGY OF KUNUN-ZAKI ON RETAIL AND POSSIBLE CONTROL OF ISOLATES WITH SPICES
*UZEH ROSELINE EKIOMADO & OPARA HARRISON OSITADIMA
Department of Microbiology, University of Lagos, Lagos, Nigeria * e-mail: [email protected]
Abstract
Commercially prepared non-alcoholic beverage, kunun-zaki was purchased from three different locations; Lagos Island (sample A), Idia-araba (sample B), and University road (sample C) in Lagos, Nigeria. The microbial quality of kunun-zaki and antimicrobial activity of ginger (Zingibor officinales), garlic (Allium sativum) and red pepper (Capsicum annum) on the isolates obtained from kunun-zaki were investigated. The bacteria isolated include Staphylococcus aureus, Micrococcus variance, Bacillus spp., Escherichia coli, Klebsiella spp., Enterobacter claocae and Lactobacillus spp. Aspergillus niger was the only fungal isolate. The pH of the beverage from the three locations were slightly different but result from the methylene blue reductase test showed difference in their microbial quality and this is also reflected in the microbial count. Sample B exhibited the best quality while sample A had the least quality. The total bacterial counts for samples A, B and C were 1.5 × 10⁹, 3.1 × 10⁴ and 2.4 × 10⁵ cfu/ml respectively. The coliform counts were 3.1 × 10⁹ and 2.3 × 10⁴ cfu/ml for samples A and C respectively. No coliform was detected in sample B. The mould counts were 3.0 × 10³, 6.0 × 10³ and 1.0 × 10⁴ cfu/ml for samples A, B and C respectively. From the antimicrobial susceptibility pattern of the isolates to the spices, garlic produced the largest zones of inhibition while red pepper produced the smallest zones of inhibition. Staphylococcus aureus, Micrococcus variance, Escherichia coli and Klebsiella spp. were the most sensitive to extract of the spices. The spices particularly garlic can help in improving the safety and preservation of kunun-zaki. They are already being used in the preparation of kunun-zaki. We therefore recommend adjusting the concentration of the spices to relatively higher
amount without affecting the organoleptic value of the beverage. KEYWORDS: Kunun-zaki, microbial quality, isolates, spices, antimicrobial activity
Introduction Kunun-zaki is a cereal based non-alcoholic beverage in Africa which plays a
very important role in the diet of consumers. It is one of the various types of kunun, others of which include kunun-gyada, kunun-akamu, kunun-
isamiya, kunun-baule, kunun-jiko, kunun-gayambe among others, depending on the locality and with the names based on the major ingredient used or any secondary ingredient or a sensory attribute of these kunun.
Kunun-zaki is the most preferred which is reflected in its relatively high demand (Gaffa et al., 2002). It is taken usually afters meal as refreshing
drink in place of the more expensive conventional carbonated soft drinks.

IRCAB Journal of Science and Technology: June 2012, Vol. 2. No. 1 87
The beverage has a wide-spread level of consumption and popularity which cut across all classes of people regardless of social status. As a result of the
non-alcoholic nature it is readily consumed by Christians and muslims alike as a substitute for alcoholic drinks (Osuntogun and Aboaba, 2004).
The production of kunun-zaki is a common process in many homes in the rural communities and more recently in the urban areas. The cereals used
in its production are millet, (Pennisetum typhoideum), sorghum (Sorghum vulgaris) and maize (Zea mays) in decreasing order of preference. Sometimes
the cereals are used in composite form and this is more common with millet and sorghum. The preferred ratio of mixing is 1:2 (weight per weight) sorghum/millet (Gaffa et al., 2002). It involves steeping the grains in
utensils such as buckets, calabashes or earthenwares, vessels or even drums. The steeping duration depends on the cereal used but may vary
between twelve and seventy-two hours for millet/sorghum and maize respectively (Gaffa et al., 2002). The steeped grains which may or may not be
mixed with spices (ginger, clove, red and or black pepper, garlic) are milled, and part of the slurry (3/4 volume) is gelatinized with boiling hot water (Onuorah et al., 1987). The remaining slurry containing liquefying agents,
sweet potato (Ipomea batatas), tuber paste, malted rice (Oryza sativa) or extract of Cadaba farinosa stem is mixed with the gelatinized slurry at 60-
70oC to liquefy and bring about saccharification. The mixture is allowed to ferment (chance fermentation) overnight and filtered with a sieve. Sugar may be added as a sweetner. The whole process takes about 24hrs. Packaging is
done in transparent polyethylene sachet or bottles (Gaffa and Ayo, 2002). The production of the beverage is however confronted with many problems
ranging from inconsistent quality, poor hygiene to short shelf life. Starter cultures are not used in its fermentation while spontaneous and back-slopping fermentation is a common practice (Olukoya et al., 1993; Olasupo
et al., 2000).
There is increasing concern about the safety of our local foods in Africa. This is because consumption of such foods in most cases causes food poisonings
probably due to their unhygienic preparation. The aim of this research therefore is to: (1) Isolate and identify microorganisms especially those of public health importance associated with kunun-zaki on retail. (2)
Determine the antimicrobial activity of some selected spices used in the preparation of the beverage; ginger (Zingibor officinales), garlic (Allium sativum), and red pepper (Capsicum annum). Materials and methods
Collection of samples Samples of kunun-zaki were collected from street hawkers in three locations
in Lagos state, Nigeria. Samples were collected from Lagos Island (A), Idia-araba (B) and University road (C). Spices known to be used in its preparation (ginger, garlic and red pepper) were also collected from retailers
in Lagos state. The samples were transported immediately to the laboratory for analyses.

IRCAB Journal of Science and Technology: June 2012, Vol. 2. No. 1 88
Comparative quality assessment The quality of kunun-zaki from three locations was determined and
compared using reductase test (Benson, 2002). From each sample, 10ml was introduced into sterile test tubes in duplicates. Onto each tube 1ml of
methylene blue was added, rubber stoppers were used to plug the mouth of the tubes and the tubes were inverted many times to mix. Tubes were placed in water bath at 35oC. The tubes were removed from the water bath after 30
mins. to check if the blue colour has turned white. This was done every half hour until at least four fifth of the tubes have turned white, the end-point of reduction. The methylene blue reduction time (MBRT) was calculated. A
short MBRT indicates lower quality.
Determination of pH The pH values of samples were determined by using a pH meter (Mettler-Toledo, Essex M3509 Type 340) which was standardized using buffer
solutions of pH 4 and 7. Duplicate determinations were made in all cases and the average recorded.
Isolation and enumeration of microorganisms Serial dilution (10 fold) of the sample was prepared using distilled water as
diluents. From the kunun sample 10ml was measured and added to 90ml of distilled water. Further dilutions were made up to 10ˉ10 dilution. Plates of nutrient agar, de Man Rogosa Sharpe (MRS) agar, MacConkey agar and
potatoe dextrose agar were inoculated with 1ml from appropriate dilutions using the spread plate method. Nutrient and MacConkey agar plates were
incubated at 37oC for 24hrs, MRS agar plates were incubated anaerobically at 30o C for 24-48hrs. The potatoe dextrose agar plates were incubated at 28oC for 72-120hrs. Developed colonies were counted from plates and
recorded. Pure cultures were obtained by sub culturing on fresh agar plates. Identification of isolates
Identification of bacteria was based on cultural, morphological and biochemical characterization. Among the tests used were methyl-red, Voges-
Proskauer, catalase, coagulase, oxidase, nitrate reduction, citrate utilization, and sugar fermentation. Fungi were identified based on cultural and morphological characteristics.
Determination of antimicrobial activity of spices
Extraction of active constituents The extraction of active constituents in ginger, garlic and red pepper was done by soxhlet extraction method of A.O.A.C. (1996) by using absolute
ethanol (95 %). Antimicrobial sensitivity test
The extract concentrate of ginger, garlic and red pepper were screened for antimicrobial activity by in vitro cup plate method of agar diffusion
technique. From each of the semi solid extract 5g and 2g were weighed and dissolved in 10ml of the extracting solvent (95% ethanol) to give 50% and 20% (w/v) respectively. From a 16 hour broth cultures of the test isolates

IRCAB Journal of Science and Technology: June 2012, Vol. 2. No. 1 89
from kunun-zaki 1ml was spread on Mueller Hinton agar, wells of 4mm in diameter sufficiently spaced to prevent the resulting zones of inhibition from
overlapping were made on each agar plate using a cork borer. Respective wells were filled with 0.2ml of the dilutions of the extract. The extracting
solvent was used as control. The plates were left on the bench for 30mins. after which they were incubated at 37oC for 18-24hrs for bacteria, 28-30oC (72 hrs) for molds. The diameter of zones of inhibition that developed was
measured. The degree of sensitivity was expressed as a measure of the diameter of inhibition of growth in millimeters (mm).
Results The pH of the beverage from the three locations varied slightly but the
reductase test revealed difference in their quality. The sample obtained from Idi-araba (B) exhibited the best quality while that from Lagos Island (A) showed the least quality (Table 1).The bacteria isolated from kunun-zaki
include Staphylococcus aureus, Bacillus spp., Enterobacter cloacae, Micrococcus variance, Escherichia coli, Klebsiella and Lactobacillus spp. Aspergillus niger was the only mold isolated. The total bacterial counts were 1.5×10⁹, 3.1×10⁴ and 2.4×10⁵ cfu/ml for samples A, B and C respectively
while the coliform counts were 3.1×10⁹, 0 and 2.3×10⁴ cfu/ml respectively (Table 2).
From the different spices tested for antibacterial activity, garlic (Allum sativum) exhibited the largest zones of inhibition while pepper (Capsicum annum) exhibited the least zones of inhibition. Staphylococcus aureus, Escherichia coli, and Klebsiella spp. were the most susceptible of all bacteria
isolated while Lactobacillus spp. showed least susceptibility (Table 3). All spices exhibited antimicrobial effect on Aspergillus niger with ginger
producing the largest zones of inhibition while garlic and pepper revealed similar zones of inhibition (Table 3). Increased concentration resulted in the production of larger zones of inhibition by all the spices.
Discussion
Kunun-zaki samples revealed varying qualities which was indicative of different conditions of preparation and hygiene level. This is because the preparation is not standardized and it is done at household level. In Africa
most of our traditional foods are processed without microbiological control and laid down standards. The quality of the samples corresponded with the bacterial count. Sample B was not decolorized in 8hrs which means it was of
excellent quality and this also reflected in the total bacterial and coliform counts which were lowest compared to those of the other samples. Sample A
which was of lowest and fair quality (decolorized in 4hrs) had the highest bacterial count. Sample C was of good quality and was decolorized in 6hrs. Generally, Staphylococcus aureus, Bacillus spp., Enterobacter cloacae,
Micrococcus variance, Escherichia coli, Klebsiella spp., Lactobacillus spp. and the mold Aspergillus niger were isolated from kunun-zaki and they are of
public health significance. Some of these organisms have been isolated from kunun by previous workers (Olasupo et al. 2002). Field study of kunun-zaki
revealed that sample A did not receive any post processing treatment before

IRCAB Journal of Science and Technology: June 2012, Vol. 2. No. 1 90
hawking, sample B was boiled while sample C was refrigerated before hawking. This data was resourceful in corroborating the presence of Bacillus spp. as the only bacterial isolate in sample B. Bacillus spp. are spore formers and can therefore survive boiling temperatures. The Bacillus spp.
may have been present in the cereals and/or spices used in preparing kunun. Kunun is rich in carbohydrate, the presence of Lactobacillus
therefore is not surprising as this organism thrive in medium rich in fermentable substrates such as sugars which they degrade with the production of organic acids.
This may be responsible for the pH of kunun which is about 5. Bacteria
prefer neutral pH for growth. Lactobacillus helps in food preservation by reducing pH of food with the organic acids they produce which inhibit spoilage bacteria. However, the increased acidity of the beverage which may
be unacceptable to consumers aid fungal growth because they prefer low pH for growth. Osuntogun and Aboaba (2004) also isolated Lactobacillus from
kunun-zaki. The occurrence of Enterobacter cloacae, E. coli, and Klebsiella spp. could be due to poor hygiene by the food handlers especially during
hawking. Staphylococcus aureus is a ubiquitous microorganism. It can enter food from different sources such as the skin, nose or throat (Omoregbe and Igbinovia, 1992) of healthy carriers or handlers with acute pyogenic
infections. The presence of this organism in food calls for concern because of its ability to cause food poisoning. The occurrence of Staphylococcus aureus in kunun-zaki was also reported by Olasupo et al. (2002). Aspergillus niger may have been present in the cereals or spices. The high survival rates of its
spores could also explain their presence in kunun samples. For microbial control in kunun-zaki Osuntogun and Aboaba (2004) applied storage at refrigeration temperature and pasteurization of the beverage.
Despite these methods post-processing contamination can occur and this will aid growth of pathogens which will be subsequently transmitted to
consumers. Therefore there was need to use spices which will be part of the constituents of kunun. Several spices have been used for thousands of
centuries by many cultures to enhance the flavor and aroma of foods. Early cultures also recognized the value of using spices in preservation of foods and for their medicinal values. Scientific experiments since the late 19th
century have documented the antimicrobial properties of some spices and their components (Shelef, 1983). He observed that higher concentration of
spices are necessary to inhibit microbial growth in food. An appreciable antimicrobial property was exhibited by spices in this study,
the higher the concentration of the spices the greater their antimicrobial effect, but it should be noted however that as opposed to laboratory observations, spices make up 1% or less of the total constituent of kunun.
This is so, probably because of the pungent nature of spices. However, from our present study, we will like to recommend relative increase in the
concentration of spices in kunun-zaki.

IRCAB Journal of Science and Technology: June 2012, Vol. 2. No. 1 91
References A.O.A.C. (1996)- Association of Official Analytical Chemists. Washington
D.C. USA Benson H.Y (2002)- Microbiological applications. Laboratory Manual in
General Microbiology, 8th ed. McGraw Hill Publishers Gaffa, T. and Ayo, J.A. (2002)- Innovation in the traditional kunu-zaki
production process. Pakistan Journal of Nutrition. 1(5), 202-205
Gaffa, T., Jideani, I.A. and Nkama, I. (2002)- Traditional production, consumption and storage of kunun a non-alcoholic cereal beverage.
Plant Foods for Human Nutrition. 57, 73-81 Olasupo, N.A., Odunfa, S.A., Kuboye, A.O. and Olatunji, O. (2000)- An
investigation on the preservation of kunun-zaki, an African fermented cereal- based food drink. Acta Alment. 29, 385-392
Olasupo, N.A., Smith, S.I. and Akinsinde, K.A. (2002)- Examination of the
microbial status of selected indigenous fermented foods in Nigeria. Journal of Food Safety. 22, 85-93
Olukoya, D.K., Tichaczek, P.S., Butsch, A., Vigel, R.F. and Hammers, W.P. (1993)- Characterization of the bacteriocins produced by Lactobacillus pentosus DK7 isolated from ogi and Lactobacillus plantarum DK9
isolated from fufu. Chemical and Microbiological Technology Lebensm. 15, 675-678
Omoregbe, R.E. and Igbinovia, O. (1992)- Prevalence of Staphylococcus and Streptococcus species among food handlers in Edo state University,
Ekpoma, Nigeria. Journal of Experimental Biology. 4, 76-80 Onuorah, S.T., Adesiyun, A.A. and Adekeye, J.O. (1987)- Occurrence of
staphylococci and coliform in kunun-zaki and food utensils used in its preparation in Samaru, Zaria. Journal of Food Agriculture. 1, 31-34
Osuntogun, B. and Aboaba, O.O. (2004)- Microbiological and physico-chemical evaluation of some non alcoholic beverages. Pakistan Journal of Nutrition. 3(3), 188-192
Shelef, L.A. (1983)- Antimicrobial effects of spices and herbs. Journal of Food Safety 6, 29-44
Table 1: Hydrogen ion concentration and quality of kunun-zaki
Sample pH Methylene blue reduction time (MBRT) in hrs
A 5.0 4
B 5.1 > 8
C 4.9 6
MBRT:
Excellent – not decolorized in 8 hrs. Good – decolorized in less than 8 hrs but not less than 6 hrs. Fair – decolorized in less than 6 hrs, but not less
than 2 hrs. Poor – decolorized in less than 2 hrs

IRCAB Journal of Science and Technology: June 2012, Vol. 2. No. 1 92
Table 2: Bacterial counts in kunun-zaki
Sample Viable bacterial counts (cfu/ml)
Total bacterial count Coliform count __________________________________________________________________________________
A 1.5 × 10⁹ 3.1 × 10⁹
B 3.1 × 10⁴ 0 C 2.4 × 10⁵ 2.3 ×
104
Table 3: Antimicrobial activity of extracts of ginger, garlic and red pepper
Isolate Zone of inhibition (mm)
Control Ginger garlic red pepper 95% ethanol 20% 50%
20% 50% 20% 50%
Staphylococcus aureus 7 22 36 42 55 - -
Micrococcus variance 7 25 46 50 52 - -
Enterobacter cloacae 7 17 35 32 33 12 12
Bacillus brevis 7 20 32 42 48 15 17 Bacillus megaterium 7 11 32 34
32 17 17 Bacillus subtilis 7 24 32 32
32 - - Bacillus laterosporus 7 21 34 30
33 12 18 Escherichia coli 7 28 38 30
51 - 17 Klebsiella liquefaciens 7 22 37 32 60 - 34
Klebsiella aerogenes 7 17 31 32 34 - 17
Lactobacillus plantarum 7 - 14 16 30 - - Aspergillus niger 6 22 51 10
33 14 30

IRCAB Journal of Science and Technology: June 2012, Vol. 2. No. 1 93
THE EFFECTS OF ALTERATION OF PHYTOTELMATA PHYSICOCHEMICAL PARAMETERS ON THE BREEDING
CHARACTERISTICS OF MOSQUITOES IN ZARIA, NORTHERN NIGERIA.
AFOLABI O.J., (M.Sc) Department of Biology,
College of Natural and Applied Sciences, Salem University, Lokoja, Kogi State.
NDAMS I.S., (PhD) Department of Biological Sciences,
Faculty of Science Ahmadu Bello University Zaria. Abstract
In this paper, a study was carried out on the effects of alteration of phytotelmata physicochemical parameters on the breeding characteristics of mosquitoes from April to October 2006 in Ahmadu Bello University, Zaria. The study site was in three locations with five replications including the control experiment. Habitat evacuation methods as described by Service (1993), was adopted to sample immature stages in all locations, and the larvae and pupae collected were concentrated on a fine linen muslin cloth in a white container, and the number of these immature stages were counted using entomological forceps. After counting, they were carefully returned into the tree holes. The physicochemical parameters such as temperature, electrical conductivity (EC), total dissolved solids (TDS) and pH were measured before and after alteration of the habitat using portable HANNA meter (Model HI 98311). The habitat was altered using dilute 0.1M HCL and 0.1 M Na2CO3 into pH 3, 4, 8 and 10 successively. At each pH, mortality and change in physicochemical parameters were monitored at 24 and 48hours for six weeks intervals. Measurement of physicochemical parameters showed pH range of 5.3-7.4, temperature range (24.7-28.3oC), high conductivity range (548.6-1793.0µs) and total dissolved solids range (354.4-1018.8ppm). At these ranges breeding
was found in all locations. Alteration of the habitat using dilute acid and base shows increase in conductivity (818-2763 µs) and total dissolved solids (500.4-1429.0ppm), at these ranges mortality was recorded in all locations. Two-way ANOVA showed no significant difference in mortality among mosquito species (p>0.05) while significant difference was shown among pH (p<0.05). Likewise significant difference was found in mortality among the altered EC and TDS (p<0.05). This implies that alteration of these physicochemical parameters using dilute acid and base can serve as index for controlling mosquito immature stages and subsequently used to reduce adult population and the incidence of mosquito borne diseases in the study area.
Keywords: Phytotelmata, mosquito, alteration, physicochemical parameters, Mortality

IRCAB Journal of Science and Technology: June 2012, Vol. 2. No. 1 94
Introduction For mosquito-control programmes, a good knowledge of the biology and
ecology of mosquitoes is of paramount importance. This is because mosquito breeding generally occurs in a wide range of habitats with different types of
water, among such habitats are phytotelmata. Phytotelmata are used to describe bodies of ‘water impounded by plants,
(Varga, 1928).’ They are also described as structures formed by non aquatic plants that impound water such as modified leaves, leaf axils, flowers, stem holes or depressions, open fruits and fallen leaves (Maguire, B.Jr., Belk, D &
Wells, G. (1968). According to Fish (1983),’ over 1500 different plant species from at least 26 families have been reported to impound water’. Trees that
are positive for phytotelmata include Albizia lebbeck (India walnut), Drmiopsis barterer (Barter’s squill) and Delonix regia (flamboyant tree).
Among these plant species, tree holes in hardwood trees are the most widespread and long-lived phytotelmata.
Tree holes are phytotelmata created by collections of rainwater in tree cavities and serve as breeding site for several neotropical pest species and disease vectors. As a result, most tree hole research has focused in the
biology and economically significant groups especially mosquitoes (Stephen, 1999). Species inhabiting natural tree holes also colonise artificial container
habitats (Primm and Kitching, 1987, Finckle et al. 1997, Yanoviak, 1999). Anthropogenic activities in the study area encourage the growth of Delonix regia as ornamental plants. These flamboyant trees according to this
research and previous work by Adebote, D.A., Oniye, S.J & Iheme, F.I. (2004) have the capacity to store water during the rainy season. Despite the
economic importance of these trees, they have led to creation of breeding grounds for mosquitoes in the study area. About 40% of the over 3000 species of mosquitoes have phytotelmata as larval habitats (Kitching, 2001).
Mosquitoes are specific and selective in their breeding sites and the physico-
chemical parameters of the breeding sites, play a vital role in the selection of the oviposition and subsequent growth, development and population density during aquatic stage (Sinha, 1976). The relationship between mosquitoes
and phytotelmata, where the pre-emerginal life is spent is important in habitat and control studies. It is also of epidemiological interest because the abundance of this vector (mosquito) depends primarily on the number of
suitable phytotelmata and the condition under which larval development may be accomplished (Sinha, 1976).
The distribution and abundance of mosquito larvae actually reflect the oviposition preferences of adult females and the ability of immature stages
to tolerate the conditions that prevail in aquatic habitat (Reisen, W.K., Siddiqui Aslamkhan, M & Malik, J.M. (1981)). Sinha (1976) and Adebote,
D.A., Oniye, S.J., Ndams, I.S & Nache, K.M. (2006) gave evidence that the chemical factors of the breeding sites of mosquitoes have a distinct bearing on the growth and development of immature stages of mosquitoes.

IRCAB Journal of Science and Technology: June 2012, Vol. 2. No. 1 95
The chemical factors which seem to account for high density of mosquitoes include high percentage of free ammonia, organic carbon, nitrate and high
concentration of available salts with slightly alkaline pH. The physical factors include favourable temperature, rainfall and high relative humidity.
Although, the physicochemical parameters of water bodies are complicated and determine their composition and fauna are paramount to ecological studies of vector. In addition, the study of mosquitoes’ biology and ecology of
phytotelmata becomes essential because of their great medical and socio economic importance as vectors of numerous disease- causing parasites and pathogens (Service, 1993). Mosquitoes vector diseases such as malaria,
filariasis and yellow fever, which affect hundreds of millions of people every year, causing immense suffering and hindering development (Godal T.,
Harvard, C.,Goodman & Adetokunbo L. 1998). Malaria alone account for up to 25% or more of all hospital attendance, with
young children under five years accounting for about 40% in Africa (WHO, 2002). Globally, malaria causes 3,000 mortality per day, an annual total
exceeds one million deaths worldwide (WHO, 2002). Filariasis also has been shown to be a public health problem in Africa, particularly in the northern savanna and in the south-western coastal parts of Africa (Dunyo, S.K.,
Appawu, M., Nkrumah, F.k., Baffoe Wilmot, H., Perdersen, E.M & Simonsen, P.E.1996). Yellow fever transmission is under control in many parts of Africa as a result of mass immunisation undertaken in the countries. The Aedes
mosquito is therefore, considered more of a nuisance than a public health risk.
The literatures on mosquitoes inhabiting phytotelmata is relatively extensive, particularly due to bromeliad-breeding species and their public
health significance in tropical regions (e.g Olano, V., Carrasquilla, G & Mendez, F.1997; Forattini, O.P., Marques, G. R.A.M., Kakitani, I., Brito, M., Sallum, M.A.M.1998; Cunha, S.P., Alves, J.R.C., Lima, M.M., Duarte, J.R.,
Barros, L.C.V., Silva, J.L., Gammaro, A.T., Filho, O.S.M., Wanzeler, A.R. 2002; Adebote et al., 2004 and 2006 ). This study therefore, aimed at using
habitat alteration as means of controlling mosquito population and reduce the incidence of mosquito borne diseases in the study area.
Materials and Methods The study was conducted in Ahmadu Bello University Samaru (11o10IN,
07o39IE) Zaria, Nigeria located within the northern Guinea Savannah. Samaru is characterised by an open wooded savannah with the total and mean annual rainfall falling between June and October. The temperature
ranges from 15.2oC to 37.4oC with relative humidity range of 56% to 66% and the mean sunshine hour for the area is 6.5 (Adebote et al., 2004).The sites were in three locations with five replications each. In each site, five
Delonix regia trees with phytotelmata including the control were randomly selected. The choice of locations was guided by the availability of positive
phytotelmata in selected trees. Habitat evacuation methods as described by Service (1993) were followed. This involves the use of oral aspirator and a brass soup ladle dipper (9cm in diameter and holding 138ml of water), to

IRCAB Journal of Science and Technology: June 2012, Vol. 2. No. 1 96
sample mosquito larvae and pupae in all the locations. The water obtained from the phytotelmata was poured through a fine sieve in a white enamel
bowl to concentrate the larvae and pupae. The larvae and pupae were carefully returned into the habitat with the water while the physicochemical
parameters such as temperature (oC), pH, electrical conductivity (EC(µs/cm) and total dissolved solids (TDS(ppm)) were measured in situ before and after alteration using portable HANNA pH meter. Alteration of the habitat was
achieved by adding drops of 0.1M HCL and 0.1M Na2CO3 to the phytotelmata except the controls and stirred to pH 3, 4, 8 and 10 successively (at six weeks interval).
The number of dead larvae and pupae (mortality) was estimated after 24 and
48 hours respectively. The dead larvae collected from the three locations at 24 and 48 hours were transferred in insect bottles containing 99% ethyl alcohol to the Department of Biological sciences A.B.U Zaria Laboratory
where they were identified to species level using X50 light microscope and Hopkins manual. The compositions of species in the three locations were
expressed as percentages and the difference in species compositions and locations was analysed using two-way ANOVA. In addition, difference in species compositions and locations was analysed using the same two-way
ANOVA. Difference in average mortality was analysed using least significant difference (LSD).Carl Pearson correlation coefficient was used to determine the association between pH and mortality
Results and Discussion
Table 1: Percentage Composition and Distribution of Mosquito Species in Delonix regia
Mosquito species
Location 1
Location 2 Location 3 Total Average
Aedes Aegypti
463
(45.0%)
840
(50.9%)
844
(49.1%)
2147
(48.8%)
715.7a
Aedes
Fraseri
206
(20.0%)
317
(19.2%)
374
(21.8%)
897
(20.4%)
224.3b
Aedes simpsoni
124 (12.1%)
165 (9.9%) 184 (10.7%)
473 (10.8%)
118.3b
Culex Horidus
154 (15.0%)
214 (12.9%)
229 (13.3%)
597 (13.6%)
124.3b
Culex nebulosus
63 (6.1%) 98 (15.9%)
71 (4.1%) 232 (5.3%)
77.3bc
Toxorhynchite brevipalpis
19 (1.8%) 18
(1.1%)
17 (0.9%) 54
(1.2%)
13.5c
Total 1029 1652 1619 4400 1466.7 Average 147ab 236a 231a 614
From the table 1 above a total of 4400 larvae were collected and identified, 2147 of which are Aedes aegypti which form 48.8% of the total collected, 54 Toxorhychite brevipalpis were collected which form 1.2% of the total

IRCAB Journal of Science and Technology: June 2012, Vol. 2. No. 1 97
population. In addition, the percentage composition of Aedes aegypti in location 1, 2 and 3 were higher than that of Toxorhynchite brevipalpis in all
the locations. This shows that Aedes aegypti is predominant in the study area. This study was in accordance with other works such as Adebote et
al.(2004 and 2008). Two-ways ANOVA showed significant difference (p<0.05) in composition and distribution of mosquito species among the locations
and least significant difference of the average shows that the means of Aedes aegypti is significantly different from that of other species (this is shown by
superscript a) while the average of others except Toxorhynchite brevipalpis were not significantly different from one another (this is shown with superscript b). The least average was found in Toxorhynchite brevipalpis
(which is shown with superscript c). The presence of Toxorhychite brevipalpis suggests carnivorous feeding as earlier purported by the earlier
work of Adebote et al. (2004 and 2006).The absence of Anopheline species suggests that these mosquitoes are probably not tree hole breeders. This is because Anopheline species are known to be ground pool breeders, although
large numbers have been observed in gutters, peridomestic run off and domestic containers (Mafiana, C.F., Annaeema, L.O & Olatunde, G.O.1998).
Table 2: Alteration of physicochemical parameters in the study area
Location pH before
pH after
Temperature Before (oC)
Temperature After (oC)
EC (µs/cm) before
EC(µs/cm) After
TDS Before (ppm)
TDS After (ppm)
1 6.8 3.0 25.5 25.2 1662.6 2541.0 1004.6 1429.0 Control 5.9 5.9 25.5 25.5 905.0 905.0 607.0 607.0 5.3 4.0 28.0 27.0 1456.0 2763.0 1001.7 1415.0 Control 4.1 4.1 28.3 28.3 1628.0 1628.0 813.0 813.0 7.4 8.0 25.2 24.6 1456.0 2763.0 1001.7 1415.0 Control 7.4 7.4 25.2 25.2 579.0 579.0 588.0 588.0 6.8 10.0 26.1 25.3 1312.6 2011.2 660.2 1023.8 Control 6.6 6.6 27.6 27.6 585.0 585.0 543.0 543.0 2 7.0 3.0 25.9 25.5 1793.6 2388.6 990.8 1223.0 Control 8.1 8.1 25.0 25.0 915.0 915.0 1001.0 1001.0 6.3 4.0 27.1 26.8 1562.2 2225.8 818.8 1102.2 Control 8.1 8.1 27.7 27.7 1399.0 2199.0 1000.0 1000.0
7.4 8.0 24.9 24.5 1179.4 1479.4 650.4 855.0 Control 7.8 7.8 24.8 24.8 1180.0 1180.0 721.0 721.0 6.9 10.0 25.6 24.9 1591.2 2577.2 790.2 1261.0 Control 7.5 7.5 24.7 24.7 1376.0 1376.0 1011.0 1011.0 3 6.3 3.0 25.5 25.3 1370.8 1878.8 734.8 1065.2 Control 6.1 6.1 25.2 25.2 1469.0 1469.0 763.0 763.0 7.0 4.0 27.7 27.2 1010.4 2580.0 1018.8 1323.4 Control 7.7 7.7 27.9 27.9 1567.0 1567.0 1004.0 1004.0 7.2 8.0 25.9 25.5 548.6 818.0 554.4 617.4 Control 7.4 7.4 25.7 25.7 868.0 868.0 500.4 500.4 6.6 10.0 25.6 24.7 968.2 1748.6 526.8 894.2 Control 6.5 6.5 25.1 25.1 1211.0 1211.0 547.2 547.2
TDS: Total Dissolved Solids EC : Electrical Conductivity

IRCAB Journal of Science and Technology: June 2012, Vol. 2. No. 1 98
From table 2 above, the pH range for mosquitoes breeding in location 1is
4.1-7.4 while higher pH ranges of 6.3-8.1 and 6.1- 7.7 were observed in location 2 and 3 respectively. This suggests that most tree hole mosquitoes
prefer slightly alkaline habitat than an acidic habitat. Similarly, previous reports have shown that mosquito larvae can survive well in neutral or slightly alkaline water habitat (MacGregor, 1929; Abdullah and Merden,
1995; Pelizza, S.A., Lopez Lastra, C.C., Becne, J.J., Bisara, V., Garcia, J.J. 2007). Other physicochemical parameters associated with growth and survival of larvae and pupae include temperature range of 24.7oC-28.0oC,
conductivity range of 548.6-1793µs/cm and total dissolved solids range of 354.4-1018ppm. Alteration of the physicochemical parameters using dilute
acid and base changed the pH range from 5.3-7.4 to pH 3, 4, 8 and 10 as shown in the table 2, increased the conductivity range to 818-2763µs/cm and the total dissolved solids range to 500.4-1429ppm.
Table 3: Mosquito Species Mortality at altered pH (48hours)
Location pH A.e A.f A.s C.h C.n T.b 1 3.0 73.0% 73.0% 73.1% 72.8% 72.9% 72.5% 4.0 60.6% 61.1% 60.5% 61.3% 60.5% 58.3% 8.0 78.6% 78.8% 78.3% 78.3% 78.6% 79.1% 10.0 79.0% 79.2% 79.0% 79.4% 79.7% 79.1% 2 3.0 71.0% 72.4% 73.0% 72.1% 72.7% 71.4% 4.0 60.2% 61.8% 61.6% 61.1% 61.5% 62.3% 8.0 78.0% 78.2% 78.3% 78.6% 78.9% 79.2% 10.0 79.2% 79.1% 79.7% 78.9% 79.0% 78.3%
3 3.0 73.2% 72.9% 73.3% 73.7% 73.3% 72.0% 4.0 61.3% 60.7% 60.7% 61.1% 60.6% 61.9% 8.0 78.7% 78.4% 78.1% 78.6% 78.3% 77.8% 10.0 79.4% 79.6% 79.3% 79.5% 79.8% 80.9% Note: A.e = Aedes aegypti, A.f = Aedes fraseri, A.s = Aedes simpsoni C.h = Culex horridus, C.n = Culex nebulosus, T.b = Toxorhychite brevipalpis
Fcalculated rows = 712.58* Fcalculated columns = 0.1004NS Ftable at P<0.05= 3.29

IRCAB Journal of Science and Technology: June 2012, Vol. 2. No. 1 99
From table 3, mortality range was 72.8%-73.1% for all the species in location 1 while at location 2, the mortality range at pH 3 was 71.0%-73.0%
for all the species in that location. The mortality range of 72.0%-73.7% was recorded in location at pH 3. The highest mortality (73.7%) at pH 3 was
recorded for Culex horridus in location 3 while the lowest mortality (71.0%) was recorded for Aedes aegypti in location 2.
At pH 4, mortality ranges for locations are 58.3%-61.1%, 60.2%-62.3% and 60.6%-61.9% for all the species in location 1,2 and 3 respectively. The
highest mortality (61.9%) in location 3 was recorded at pH 4 for Toxorhychite brevipalpis while the lowest mortality (58.3%) was also recorded for thesame
species at location 3. At pH 8, mortality ranges for locations are 78.3%-79.1%, 78.0%-79.2% and
77.8%-78.7% for all the species in location 1, 2 and 3 respectively. But the highest mortality (79.2%) was observed at location 2 for Toxorhychite brevipalpis which also has the lowest mortality (77.8%) at location 3. At pH 10, mortality ranges for location are 79.0%-79.7%, 79.0%-79.7% and
79.3%-80.9% for all the species in location 1, 2 and 3 respectively. The highest mortality (80.9%) was recorded at pH 10 for Toxorhychite brevipalpis. This mortality (80.9%) also happen to be the highest mortality in all the locations. In contrary, the lowest mortality (79.0%) was observed at location 1 and 2 for Aedes aegypti and Culex nebulosus. Although, two-way ANOVA
showed no significant difference in mortality among species (p>0.05) while significant difference was shown in mortality among pH (p<0.05). Carl
Pearson correlation showed strong association between pH and mortality (t=15.92, r=0.997, p<0.005.
Conclusion Generally it was observed that the survival of mosquito in phytotelmata was
inversely related to increase in acidity, alkalinity and temperature. In addition, species mortality shows that Aedes aegypti and Culex species can
tolerate less acidic medium and have low tolerance to alkaline medium. This is supported by the work of Carpenter (1982) and Clarke and Kitching (2000), which stated that the survival of Culex and Aedes mosquitoes
breeding in tree holes is inversely proportional to increase in acidity and increase in alkalinity. The high mortality recorded at various pH suggested
that alteration of phytotelmata pH using an acid and alkali can serve as a means of reducing mosquito population in their habitat, and also mosquito borne diseases.
References
Abdullah, M.A.,Merden,A.I.(1995)-Distribution and ecology of the mosquito fauna in South Western Saudi Arabia. Journal of Egypt Society of Parasitology. 25(3).815-837.

IRCAB Journal of Science and Technology: June 2012, Vol. 2. No. 1 100
Adebote,D.A.,Oniye, S.J & Iheme, F.I. (2004)- Phytotelmata supportive of mosquitoes breeding in Zaria, Northern Nigeria. Journal of Pest Disease and Vector Management .5. 348-355.
Adebote, D.A., Oniye, S.J., Ndams, I.S & Nache, K.M. (2006)- The breeding
of mosquitoes (dipteral: culicidae) in peridomestic containers and implication in yellow fever transmission in villages around Zaria, Northern Nigeria. Journal of entomology. 3(2). 180-188.
Adebote, D.A., Oniye, S.J & Muhammed, Y.A. (2008)- Studies of mosquitoes breeding in rock pools on inselbergs around Zaria, northern Nigeria.
Journal of Vector Borne Diseases. 45. 21-28. Carpenter, S.R. (1982)- Stenflow chemistry: Effects on Population dynamics
of detritivorous mosquitoes in tree-hole ecosystems. Oecologia 53. 1-6. Clarke, C.M & Kitching, R.L. (1993)- The metazoan foodwebs of six Bornean
Nepenthes species. Ecology of Entomology. 18.7-16. Cunha, S.P., Alves, J.R.C., Lima, M.M., Duarte, J.R., Barros, L.C.V., Silva,
J.L., Gammaro, A.T., Filho, O.S.M., Wanzeler, A.R. (2002)- Presence of
Aedes aegypti in bromeliaceae and plant breeding places in Brazil. Revista de Saude Publica 36. 244-245.
Dunyo, S.K., Appawu, M., Nkrumah, F.k., Baffoe Wilmot, H., Perdersen, E.M & Simonsen, P.E. (1996)- Lymphatic filariasis on the coast of Ghana.
Trans. R. Soc. Trop. Med. Hyg. 90. 634-638. Finckle, O.M. (1992a)- Interspecific competition for tree holes. Consequences
for mating systems and coexistence in neotropical damselflies. Am. Nat. 139. 80-101.
Fish, D. (1983)- Phytotelmata: Flora and fauna. In: Frank, J.H., Lounibos,
L.P. (editors). Phytotelmata: terrestrial plants as hosts for aquatic insect communities, pp 1-27. Plexus Publishing, Medford, U.S.A.
Forattini, O.P., Marques, G. R.A.M., Kakitani, I., Brito, M., Sallum, M.A.M. (1998)- Significance of Aedes albopictus in bromeliads. Revista de Saude Publica 32. 186-188.
Godal T., Harvard, C.,Goodman & Adetokunbo L. (1998)- Research and training in tropical disease. In World Health Forum. 19(4). 377-381.
Kitching, R.L. (2001)- Foodweb in phytotelmata. ‘’Bottom-up’’ and ‘’Top-down’’ Explanation for community structure. Annual review of entomology. 731-749.
MacGregor, M.E. (1929)- The significant of pH in the development of
mosquito larvae. Parasitology.21.132-157 Mafiana, C.F., Annaeema, L.O & Olatunde, G.O. (1998)- Breeding sites of
larval mosquitoes in Abeokuta, Nigeria. Nigerian Journal of Entomology. 15. 136-143.
Maguire, B.Jr., Belk, D & Wells, G. (1968)- Control of community structure
by mosquito larva. Ecology. 49. 207-210. Olano, V., Carrasquilla, G & Mendez, F. (1997)- Transmission de malaria
urbana en Buinaventura, Colombia. Aspectos Entomologicos. Revista Panamerica de Salud Publica. 1. 287-294.
Pelizza, S.A., Lopez Lastra, C.C., Becne, J.J., Bisara, V., Garcia, J.J. (2007)- Effect of temperature, pH and salinity on the infection of Leptolegnia capmany Seymour (Peronosporomycetes) in mosquito larvae. Journal of Invertebrate Pathology. 96(2). 133-137.
IRCAB Journal of Science and Technology: June 2012, Vol. 2. No. 1 101
Primm, S.L & Kitching, R.L. (1987)- The determinants of food chain lengths. Oikos 50. 302-307.
Reisen, W.K., Siddiqui Aslamkhan, M & Malik, J.M. (1981)- Larval interspecific associations and physicochemical relationship of the
groundwater breeding mosquitoes of Lahore, Pakistan. Journal of Scientific Research. 33.1-23.
Service, M.W. (1993)- Mosquito (culicidae). In: Medical insects and
arachnids (Eds. Lane R.P and Crosskey, R.W). Chapter 5, Chapman and Hall, London. 120-240.
Sinha,V.P. (1976).- Further observations on the physicochemical factors of the breeding places of Culex quinquefasciatus SAY= Culex fatigans WIELDMANN. Mosquito news. 36. 358-360.
Stephen, P.Y. (1999)- Effect of leaf litter species on microinvertebrate community properties and mosquito yield in neotropical tree hole
microcosms. Oecology. 120. 147-155. Varga, L. (1928)- Ein interessanter Biotop der Bioconose von
Wasserorganismen. Biologisches Zentralblatt 48. 143-162. World Health Organisation (2002)- The global malaria situation: current tools
for prevention and control. Global fund to fight AIDS, tuberculosis and
malaria. 55 world assembly, WHO, document no. A551. INF. Doc.16. Yanoviak, S.P. (1999)- Community structure in water-filled tree holes of
Panama. Effects of hole height and size. Selbyana 20.106-115.

IRCAB Journal of Science and Technology: June 2012, Vol. 2. No. 1 102
INVESTIGATIONS INTO THE PROCESSING CHARACTERISTICS OF “PUPURU” (A FERMENTED CASSAVA PRODUCT)
1 OLORUNWA, S.L.,2 IKUJENLOLA, A.V. 3ADEFEMI, .O. & 1AYODEJI, M.J
1Department of Agricultural Engineering Technology, Rufus Giwa Polytechnic, Owo. Ondo-State, Nigeria.
2Department of Food Science Technology, Obafemi Awolowo University Osun - State, Nigeria.
3Department of Agricultural Technology, Rufus Giwa Polytechnic, Owo, Ondo-State, Nigeria.
Abstract Pupuru (a fermented cassava product) is one of the major staple foods amongst the Yoruba, Ilaje and Ijaw speaking people in the south-south and south-western region of Nigeria. The traditional method of processing cassava tubers into pupuru involve, cassava tuber harvesting, peeling, washing, soaking and dewatering. The pressed and mashed cassava tubers are then rolled or molded into a ball shape and dried by smoking: it was observed that the pupuru produced by this method is infested with unpleasant odour and cannot be stored for a long period. Hence, this paper investigates in detail an improved method that will eliminate the deficiencies associated with the traditional method of pupuru production. The proximate composition, sensory evaluation, PH and hydro cyanide content of the resulted pupuru from the improved method were determined. The moisture content ranges between 7.22% and 18.71% which was lower than the moisture content of the traditionally produced pupuru which is 24.01%. Also, the HCN content which ranges from 0.86mg/kg to 1.41mg/kg was found to be lower to the traditionally produced pupuru which was 1.45mg/kg. With the introduction of improved techniques and modern equipment, this study has led to the production of improved pupuru with better organoleptic qualities such as colour, odour, mouldability, stickiness and texture. Keywords: “Pupuru”, Smoking, toasting, Proximate composition, Moisture content Introduction Cassava (Manihot Esculenta Crantz) is a dicotyledonous plant belonging to
the botanical family Emphorbiacea. Cassava is primarily a source of carbohydrates and contains very little protein or fat. It is a staple food for
over 500 million people in the developing world, (FAO, 2005). Cassava tubers are highly perishable and cannot be kept in fresh condition
for more than a few days after harvest without serious deterioration in quality. In order to extend its shelf life, cassava is being processed into dried
products in a variety of ways in different parts of the world to meet the local needs, taste and storage.

IRCAB Journal of Science and Technology: June 2012, Vol. 2. No. 1 103
The major process and form of cassava tuber fall into four general categories: meal, flour, chips and starch. (FAO, 2005). Traditionally, cassava
roots are processed by various methods into numerous products, such as, Garri, fufu, lafun, abacha, pupuru e.t.c.
Cassava is widely used for both human consumption, livestock feed and various forms of Industrial uses, (FAO, 2006). It can be prepared by boiling,
baking, frying and roasting. The young leaves of sweet cassava are used as vegetable greens and they are more wholesome than the roots since they contain high amount of protein, the leaves are also valuable food for
particular goats, (Ihekoronye and Ngoddy, 1995). Also, there is an increase in the use of cassava in industrial fermentation for alcohol production and
for microbial protein production for animal feed (FAO, 2005). About 19% of the world production of cassava is used in the manufacture of industrial starch products (such as in laundry, gums and adhesive). And in the
preparation of pharmaceuticals and in production of alcoholics, (Agbo-Egbe and Mbome, 2006)
The cassava used for the “pupuru” is the bitter variety. The use of cassava as a food is limited by its perishability, protein content and potential
toxicity. Processing methods have been devised to reduce their toxicity and at the same time convert the highly perishable roots to more stable products. These processes include, soaking, fermentation, drying and
roasting. The toxicity is due to the cyanogenic glycoside. Fermentation is one method by which cyanogenic glycoside in “pupuru” can be reduced and also
result in the production of volatile compounds that give “pupuru” its unique flavor and colour. Most of the juice from the cassava pulp is expressed during this period.
The time allowed for fermentation is critical, if too short, detoxication process will be incomplete, resulting in a potential toxic product and if it is
too long, the product will have a strong sour taste and the texture will be coarse (Azam Ali, Judge, Fellows and Battcock, 2003).
Pupuru is probably the most important staple food in riverine area of Nigeria (Ihekoronye and Ngoddy, 1995) and development of any real significance in
cassava processing has been concentrated on its production. (Akinrele,1964).However, because of the problems associated with the
traditional method of pupuru production such as offensive odour, poor shelf life and poor acceptability by the consumers, this study is aimed to come out with improved method of pupuru production that will reduce to
minimum the problems associated with the local method as stated above. According to Olowoyo et al., (2000) and Ikujenlola and Lawson (2005),
process modifications and the use of modern technology (machine) led to the production of improved Pupuru of better organoleptic qualities. The
production technique involves the use of simple machines such as; fermentation tank, conditioned water for soaking, hydraulic pressing, kiln oven, rotary dryer and better packaging practices. These helped reduce the

IRCAB Journal of Science and Technology: June 2012, Vol. 2. No. 1 104
production and reconstitution time by 45 and 65% respectively (Ikujenlola and Lawson, 2005). The improved Pupuru will have a longer shelf life.
Materials and methods
The cassava tubers used for this study were obtained in a farm located in Emure town in Ondo State, Nigeria.
Methods: Traditional Method of Pupuru Production: The fresh cassava tubers were peeled, washed, sliced and packed into sack
and soaked in a flowing stream from 3 – 4 days to soften the root. The softened cassava tubers are then defibered followed by de-watering process
which was achieved by placing a heavy stone or concrete slab on the bag containing the defibered cassava pulp. The de-watered cassava pulps are moulded into a ball shape and were placed on a wooden platform called
“aka” and smoked for three days. The smoked pupuru can be further processed to make pupuru flour.
The disadvantages of traditional methods of pupuru production include poor shelf-life and the offensive odour which is caused by the fermentation
process used. The local farmers in the rural areas may sometimes soak the cassava tubers with the peels in the stream inside a traditional pot for a good number of days. These local methods do not promote ease of
production and at the same time large scale production is hindered. The above constraints are overcome by construction of a fermentation tank (100
x 100 x 85cm3) using galvanized iron sheet. The tank is capable of processing 90kg of fresh cassava roots at a time. Hence, the issue of offensive odour is reduced to minimum.
The improved/modern method of pupuru production involves peeling with knife, washing in a clean tap water and slicing. The sliced cassava tubers
are soaked inside the constructed galvanized fermentation tank for 3 – 4 days. The soaking is done with warm water (about 450c) which aids
fermentation and softening process. The water is drained after which the fibre and shaft are removed and the resulting pulp packed inside a bag and pressed by the use of hydraulic press as against the use of stone or concrete
slab in the traditional process. With the use of hydraulic, the pressing is completed within 30 – 35 minutes. The dewatered mass is then spread in
the sun for few hours to further reduce the moisture content; this is done instead of smoking in the traditional method. The relatively dried cassava mass is then sieved, fried, milled into pupuru flour.
The frying process is carried out in different drying temperatures e.g. 60, 70, 80 and 90ºc and these were used to determine the best drying temperatures.
The fried pupuru was packaged in high-density polyethylene bag in order to prevent increase in moisture level. Fig 1and 2 show improved and tradition
methods of pupuru production with the corresponding equipment respectively.

IRCAB Journal of Science and Technology: June 2012, Vol. 2. No. 1 105
Fresh cassava tubers Knife
Peeling Tap water
Washing Knife
Slicing
Fermentation tank Soaking/fermentation (3-4days)
Hydraulic press
Dewatering Rotary dryer
Drying Milling machine
Milling
(30 mesh) Sieving
(HDPE & LDPE) Packaging
Improved pupuru
Fig. 1: Improved method of Pupuru production
Fresh cassava tubers Knife/cutlass
Peeling
Stream water. Washing
Knife/cutlass
Slicing Stream/water in Pots
Soaking/fermentation (3-4days) Stone or concrete slab
Dewatering
Hand Moulding
Firewood under a platform Smoking (3 days)
Pounding
Milling Locally made sieve
Sieving
(HDPE & LDPE) Packaging
Traditional pupuru
Fig. 2: Traditional method of Pupuru production

IRCAB Journal of Science and Technology: June 2012, Vol. 2. No. 1 106
Chemical analysis; The following chemical analysis was carried out according to the method of Association of Official Analytical Chemist
A.OA.C, (2000). Moisture content, ash content, Titrable acidity, Hydrogen cyanide content, and the Ph level. Also determined is the bulk density and
the water absorption capacity pupuru produced. Table 1: Chemical Composition of Milled Pupuru
Table 2: Sensory Evaluation of Pupuru Flour
Sample A B C D Locally
produced
Colour 6.10a 6.21a 6.20a 6.00a 5.60b
Stickiness /Mouldabil
ity
6.30a 5.65b 6.25a 6.00ab 6.12a
Taste 6.15a 6.35ab 6.85a 6.20b 7.20a Texture 6.30a 6.45a 6.90a 6.65a 5.60b
Overall acceptance
6.70ab 6.77ab 7.21a 6.55b 6.30c
Mean Scores with the same letters in a role are not significantly different (P
< 0.05)
Table 3: Bulk Density and Water Absorption Capacity (WAC)
Sample A B C D Locally produced
Bulk density (g/m)
1.00 1.00 0.96 0.92 1.13
Water
Absorption Capacity (%)
67.00 70.00 72.00 75.00 62.00
Sample A B C D Locally produced
Drying
temperature (ºC)
60 70 80 90 Smoked
Moisture content (%)
18.71 12.40 10.21 7.22 24.01
Ash content (%) 2.4 2.0 1.9 1.5 2.41 PH level 4.30 4.00 4.35 4.31 4.15 Titrated Acidity
(%)
0.26 0.24 0.20 0.24 0.24
HCN mg/kg 1.41 1.25 0.91 0.86 1.45

IRCAB Journal of Science and Technology: June 2012, Vol. 2. No. 1 107
Table 4: Crude fibre, Protein, Carbohydrate and energy level of Traditional and Improved Pupuru Production
Chemical Properties
Constituents value (%) of Traditionally
produced pupuru
Constituent’s value (%) of improved method of pupuru
production.
Fat 1.45 1.45 Crude fibre 0.42 0.42 Protein 0.95 1.0
Carbohydrate 74.97 70.97 Energy value (Kcal)
338 330
Results and Discussion The results of the chemical analysis of the samples were as presented in the tables. From table 1; drying temperatures ranges between 60ºc and 90ºc;
however, temperature between 70ºc and 80ºc give the best moisture level and physical appearance. The PH and titratable acidity level values ranges
from 4.00 to 4.30 and 0.20 and 0.26 respectively. There was no significant difference (P > 0.05) between the PH and Titratable acidity values for all the samples.
The hydrogen cyanide content decreased from 1.41 to 0.86 (mg/100g). It was observed that frying and fermentation have a reducing effect on cyanide
content of the samples. This agrees with the view of Ikujenlola and Lawson, (2005), Almazan (1992), Aalbersberg and Limalevu (1991), Bothast et al.,
(1991) and Akinrele, (1964) who discovered that drying, soaking and fermentation can be a means of detoxifying cyanide in cassava products.
The ash content ranges from 1.5 to 2.0 for all the samples and this falls within the stipulated value of less or equal to 2%. A low crude fibre content of 0.42% was observed for both the traditional and improved method of
Pupuru production; this may be due to various operations such as sieving in which many of the shafts have been removed (table 4). Higher protein
content (1.0%), lower carbohydrate and energy values of 70.97% and 330Kcal respectively was also observed in the improved method as against protein value, 0.95% carbohydrate and energy value of 74.97% and 338Kcal
respectively observed in traditional method of Pupuru production (see table 4).
Table 2 shows the result of Sensory evaluation of Pupuru, Sample C that was dried at 80°c was the best amongst the improved pupuru samples
considered. The improved pupuru samples were better rated compared to the traditionally produced pupuru in respect of the colour, texture, odour and overall acceptability. The mouldability and stickiness of the samples
were acceptable to the panelist.
Furthermore, the water absorption capacities of the samples were carried out (table 3). The improved pupuru has a higher water absorption capacity. This shows that it can retain and uptake more water and consequently swell

IRCAB Journal of Science and Technology: June 2012, Vol. 2. No. 1 108
better than traditionally produced pupuru. This agreed with the findings of Ikujenlola and Lawson (2005).
Conclusion The traditionally produced pupuru is characterized by offensive odour, poor
shelf life and poor acceptability to the intending consumers. However, with the introduction of the improved technique and modern equipment such as fermentation tank, hydraulic press, fryer, etc.; This study has led to the
production of improved Pupuru of better organoleptic qualities such as colour, odour, mouldability, stickiness and texture.
Recommendation The fermented cassava product (Pupuru) produced through the modern
technique is of high quality and nutritional value than the locally produced one, hence it is recommended for intending consumers. This improved
technique is also recommended for small and medium scale pupuru producers.
References Aalbersberg, W.G.L and Limalevu, L. (1991) - Cyanide Content in Fresh and
Processed Fijian Cassava (Manihot Esculenta) Cultivars. Tropical Science; 31, 249 – 256.
A.O.A.C (2000) - Official Methods of Analysis. Association of Official Analytical Chemists, 12th ed. Washington, D.C., Pg 885 – 900.
Azam Ali, S.E., Judge, E., Fellows, P. and Battcock, M. (2003) - Small Scale Food Processing. A directory of equipment and methods, second
edition, NOG publishing, 256pp.S Bothast, R.J., Anderson, R.A., Warmer, K., Kwolek, W.E. (1991) - Effect of
Moisture and Temperature on microbiological and sensory properties
of ‘Pupuru’ flour during storage. Tuber Chem. 42 (3) 187 – 190. Ihekoronye, A. I. and Ngoddy, P.O. (1995) - Integrated Food Science and
Technology for tropic. 1st Edition Macmillan Publisher Ltd. London, 272 – 273pp.
Ngoddy, P.O and Kaplinsky, R. (1990) - Operational Instruments in Agro – Industrial Planning Choice of Technology in Garri Manufacturing in Nigeria International Technical Cooperation Centre (ITCC) Reviews, 8
(2): 56 – 70. Agbo-Egbe, T. Mbome, I. Z. (2006) - “The effect of processing techniques in
reducing Cyanogens levels during the production of some
Cameroonian cassava foods” Journal of Food Composition and Analysis 19 (4), 354 – 363.
Akinrele, L.A (1964) - Fermentation of Cassava. Journal of Science Education in Agric.; 15 (9), 589 – 594.
Ikujenlola A.V and Lawson O.S (2005) - Improving the Traditional Processing technique of Pupuru (A fermented cassava product). The Nigerian Journal of Research and Production; Vol. 6 (3), 103 – 111pp

IRCAB Journal of Science and Technology: June 2012, Vol. 2. No. 1 109
Almazan, A.M. (1992) - Lowering Cyanide levels in Cassava, Association of African Universities Food and Nutrition Project, Res. Newsletter 1, (8
& 9), 18 – 19. FAO (2005) - A review of Cassava in Africa with country case study on
Nigeria, Ghana, the United Republic of Tanzania, Uganda and Benin, Proceedings of the validation forum on the global cassava development Food and Agricultural Organization of the United Nations Rome.
http://ftp.fao.org/decrep/fao/009/ao154e.Retrieved 11/01/2012.
Copyright © 2022 FDOKUMEN