Comparison of Aerosol Single Scattering Albedos Derived by Diverse Techniques in Two North Atlantic...
11
1FEBRUARY 2002 609 RUSSELL ET AL. Comparison of Aerosol Single Scattering Albedos Derived by Diverse Techniques in Two North Atlantic Experiments P. B. RUSSELL, a J. REDEMANN, b B. SCHMID, b R. W. BERGSTROM, b J. M. LIVINGSTON, c D. M. MCINTOSH, d S. A. RAMIREZ, d S. HARTLEY, e P. V. HOBBS, e P. K. QUINN, f C. M. CARRICO, g,k M. J. ROOD, g E. O ¨ STRO ¨ M, h,l K. J. NOONE, h W. VON HOYNINGEN-HUENE, i AND L. REMER j a NASA Ames Research Center, Moffett Field, California b Bay Area Environmental Research Institute, San Francisco, California c SRI International, Menlo Park, California d Symtech Corporation, Moffett Field, California e University of Washington, Seattle, Washington f NOAA/PMEL, Seattle, Washington g University of Illinois at Urbana–Champaign, Urbana, Illinois h Stockholm University, Stockholm, Sweden i Bremen University, Bremen, Germany j NASA Goddard Space Flight Center, Greenbelt, Maryland (Manuscript received 9 January 2001, in final form 18 June 2001) ABSTRACT Aerosol single scattering albedo v (the ratio of scattering to extinction) is important in determining aerosol climatic effects, in explaining relationships between calculated and measured radiative fluxes, and in retrieving aerosol optical depths from satellite radiances. Recently, two experiments in the North Atlantic region, the Tropospheric Aerosol Radiative Forcing Observational Experiment (TARFOX) and the Second Aerosol Char- acterization Experiment (ACE-2), determined aerosol v by a variety of techniques. The techniques included fitting of calculated to measured radiative fluxes; retrievals of v from skylight radiances; best fits of complex refractive index to profiles of backscatter, extinction, and size distribution; and in situ measurements of scattering and absorption at the surface and aloft. Both TARFOX and ACE-2 found a fairly wide range of values for v at midvisible wavelengths (;550 nm), with 0.85 # v midvis # 0.99 for the marine aerosol impacted by continental pollution. Frequency distributions of v could usually be approximated by lognormals in v max 2 v, with some occurrence of bimodality, suggesting the influence of different aerosol sources or processing. In both TARFOX and ACE-2, closure tests between measured and calculated radiative fluxes yielded best-fit values of v midvis of 0.90 6 0.04 for the polluted boundary layer. Although these results have the virtue of describing the column aerosol unperturbed by sampling, they are subject to questions about representativeness and other uncertainties (e.g., thermal offsets, unknown gas absorption). The other techniques gave larger values for v midvis for the polluted boundary layer, with a typical result of v midvis 5 0.95 6 0.04. Current uncertainties in v are large in terms of climate effects. More tests are needed of the consistency among different methods and of humidification effects on v. 1. Introduction Aerosol single scattering albedo (SSA) v (the fraction of intercepted light that is scattered, rather than ab- sorbed) is important in R determining aerosol climatic effects (e.g., Hansen et k Current affiliation: Georgia Institute of Technology, Atlanta, Georgia. l Current affiliation: Met Office, Bracknell, Berkshire, United King- dom. Corresponding author address: Philip B. Russell, Atmospheric Chemistry and Dynamics Branch, NASA Ames Research Center, MS 245-5, Moffett Field, CA 94035-1000. E-mail: [email protected] al. 1998; Haywood and Shine 1995; Chylek and Wong 1995), R explaining differences between calculated and mea- sured downwelling radiative fluxes (e.g., Halthore et al. 1998; Kato et al. 1997; Mlawer et al. 2000), and R determining the relationship between satellite-mea- sured radiance and aerosol optical depth (e.g., Stowe et al. 1997; King et al. 1999; Mishchenko et al. 1999; Durkee et al. 2000). Because of growing interest in all these topics, two ex- periments in the North Atlantic region devoted consid- erable effort to determining aerosol v. This paper sum- marizes and compares v results from these experiments: the 1996 Tropospheric Aerosol Radiative Forcing Ob- servational Experiment [TARFOX (Russell et al.
-
Upload
independent -
Category
Documents
-
view
0 -
download
0
Transcript of Comparison of Aerosol Single Scattering Albedos Derived by Diverse Techniques in Two North Atlantic...

1 FEBRUARY 2002 609R U S S E L L E T A L .
Comparison of Aerosol Single Scattering Albedos Derived by Diverse Techniques inTwo North Atlantic Experiments
P. B. RUSSELL,a J. REDEMANN,b B. SCHMID,b R. W. BERGSTROM,b J. M. LIVINGSTON,c D. M. MCINTOSH,d
S. A. RAMIREZ,d S. HARTLEY,e P. V. HOBBS,e P. K. QUINN,f C. M. CARRICO,g,k M. J. ROOD,g E. OSTROM,h,l
K. J. NOONE,h W. VON HOYNINGEN-HUENE,i AND L. REMERj
aNASA Ames Research Center, Moffett Field, CaliforniabBay Area Environmental Research Institute, San Francisco, California
cSRI International, Menlo Park, CaliforniadSymtech Corporation, Moffett Field, CaliforniaeUniversity of Washington, Seattle, Washington
fNOAA/PMEL, Seattle, WashingtongUniversity of Illinois at Urbana–Champaign, Urbana, Illinois
hStockholm University, Stockholm, SwedeniBremen University, Bremen, Germany
jNASA Goddard Space Flight Center, Greenbelt, Maryland
(Manuscript received 9 January 2001, in final form 18 June 2001)
ABSTRACT
Aerosol single scattering albedo v (the ratio of scattering to extinction) is important in determining aerosolclimatic effects, in explaining relationships between calculated and measured radiative fluxes, and in retrievingaerosol optical depths from satellite radiances. Recently, two experiments in the North Atlantic region, theTropospheric Aerosol Radiative Forcing Observational Experiment (TARFOX) and the Second Aerosol Char-acterization Experiment (ACE-2), determined aerosol v by a variety of techniques. The techniques includedfitting of calculated to measured radiative fluxes; retrievals of v from skylight radiances; best fits of complexrefractive index to profiles of backscatter, extinction, and size distribution; and in situ measurements of scatteringand absorption at the surface and aloft. Both TARFOX and ACE-2 found a fairly wide range of values for vat midvisible wavelengths (;550 nm), with 0.85 # vmidvis # 0.99 for the marine aerosol impacted by continentalpollution. Frequency distributions of v could usually be approximated by lognormals in vmax 2 v, with someoccurrence of bimodality, suggesting the influence of different aerosol sources or processing. In both TARFOXand ACE-2, closure tests between measured and calculated radiative fluxes yielded best-fit values of vmidvis of0.90 6 0.04 for the polluted boundary layer. Although these results have the virtue of describing the columnaerosol unperturbed by sampling, they are subject to questions about representativeness and other uncertainties(e.g., thermal offsets, unknown gas absorption). The other techniques gave larger values for vmidvis for the pollutedboundary layer, with a typical result of vmidvis 5 0.95 6 0.04. Current uncertainties in v are large in terms ofclimate effects. More tests are needed of the consistency among different methods and of humidification effectson v.
1. Introduction
Aerosol single scattering albedo (SSA) v (the fractionof intercepted light that is scattered, rather than ab-sorbed) is important in
R determining aerosol climatic effects (e.g., Hansen et
k Current affiliation: Georgia Institute of Technology, Atlanta,Georgia.
l Current affiliation: Met Office, Bracknell, Berkshire, United King-dom.
Corresponding author address: Philip B. Russell, AtmosphericChemistry and Dynamics Branch, NASA Ames Research Center, MS245-5, Moffett Field, CA 94035-1000.E-mail: [email protected]
al. 1998; Haywood and Shine 1995; Chylek and Wong1995),
R explaining differences between calculated and mea-sured downwelling radiative fluxes (e.g., Halthore etal. 1998; Kato et al. 1997; Mlawer et al. 2000), and
R determining the relationship between satellite-mea-sured radiance and aerosol optical depth (e.g., Stoweet al. 1997; King et al. 1999; Mishchenko et al. 1999;Durkee et al. 2000).
Because of growing interest in all these topics, two ex-periments in the North Atlantic region devoted consid-erable effort to determining aerosol v. This paper sum-marizes and compares v results from these experiments:the 1996 Tropospheric Aerosol Radiative Forcing Ob-servational Experiment [TARFOX (Russell et al.

610 VOLUME 59J O U R N A L O F T H E A T M O S P H E R I C S C I E N C E S
FIG. 1. (a) Aerosol-induced change in top-of-atmosphere upwelling flux DaF↑. Results are from Eq. (1) usingAOD 5 0.1, aerosol upscatter fraction ba 5 0.17, no clouds (Ac 5 0), and atmospheric transmission T 5 0.76.(b) Ratio of flux change for given aerosol v to flux change for v 5 1.
1999a)] and the 1997 North Atlantic Aerosol Charac-terization Experiment [ACE-2 (Raes et al. 2000; Russelland Heintzenberg 2000)]. We focus on results for theatmospheric boundary layer in different situations (e.g.,marine versus continental flows, ‘‘clean’’ versus pol-luted conditions). Results in the presence of African dustare not discussed here. We consider the strengths andlimitations of the different techniques used, includingwhether they describe the aerosol in its ambient stateor as perturbed by sampling processes; whether theydescribe the aerosol at the surface, as a function ofaltitude, or integrated over a column; the ease of ac-quiring representative datasets; results obtained in testsof consistency with radiative flux changes; and the like-lihood of various artifacts and errors.
2. Importance of aerosol single scattering albedo
To illustrate the importance of aerosol v, we explorebriefly the sensitivity of aerosol climate effects and sat-ellite retrievals to assumed values of v. As an example,Bergstrom and Russell (1999) showed that, over theocean, for fixed aerosol optical depth (AOD), a changeof 0.07 in v produced a change of 21% in the aerosol-induced radiative flux change at the tropopause. Thesensitivity over common land surfaces can be muchlarger. This is illustrated in Fig. 1, which uses the diurnalaverage flux-change approximation of Haywood and
Shine (1995), Chylek and Wong (1995), and Russell etal. (1997):
12D F↑ 5 F T (1 2 A )a T c2
23 [vb (1 2 R ) 2 2(1 2 v)R ]AOD. (1)a s s
Here DaF↑ is the aerosol-induced change in upwellingflux at the top of atmosphere, FT is the solar constant,T is the atmospheric transmission, AC is the cloud frac-tion, ba is the aerosol upscatter fraction, and RS is thesurface albedo. Figure 1 shows that, over dark vege-tation, changing v from 1.0 to 0.9 can reduce DaF↑ by50% or more. Over deserts and snow fields the samechange in v can reduce DaF↑ by more than 100%, thuschanging the sign of the aerosol effect from cooling toheating (see also Sokolik and Toon 1997). Also, fluxchanges within and below the aerosol layer, which canaffect atmospheric stability, heating rates, surface tem-peratures, and cloud formation and persistence, can beeven more sensitive to aerosol v (e.g., Hansen et al.1997, 1998; Ackerman et al. 2000; Podgorny et al.2000). This increased sensitivity can cause the criticalsingle scatter albedo, where cooling shifts to warming,to exceed the values implied by Fig. 1 (which does notconsider cloud effects, for example).
The dependence of satellite-retrieved AOD on v canbe illustrated by using the linearized single scattering

1 FEBRUARY 2002 611R U S S E L L E T A L .
FIG. 2. Column values of aerosol single scattering albedo fromTARFOX measurements. Histograms give number of occurrences ofaerosol column single scattering albedo values derived from neph-elometer and absorption photometer measurements on UW C-131A.He97 5 Hegg et al. (1997); Ha00 5 Hartley et al. (2000). Data pointslabeled Ru99 and B&R99 are from best fits to radiative flux mea-surements (Russell et al. 1999b; Bergstrom and Russell 1999). Datapoints labeled R&K98 are retrieved from skylight radiance measure-ments (Remer and Kaufman 1998). Data points labeled Re00 are frombest-fit complex refractive indices obtained by Redemann et al.(2000b) by combining vertical profiles of lidar backscatter, sun pho-tometer extinction, and relative particle size distribution. Re00 results,originally given for the 200–700-nm band, were recalculated at 550nm for this paper.
approximation (e.g., Stowe et al. 1997; King et al.1999),
LaAOD 5 4m m , (2)SAT 0 y vP (C)a
where La is the aerosol contribution to satellite-mea-sured radiance, m0 and my are the cosines of the sunand view zenith angles, Pa is the aerosol scattering phasefunction, and C is the scattering angle. Assessing thefull sensitivity of AODSAT to aerosol absorption requiresaccounting for the fact that v and Pa are highly cor-related, and that changing the aerosol complex refractiveindex m to change v can produce even larger changesin Pa(C) at satellite view angles. For example, Stoweet al. (1997) reported that increasing the imaginary partof the aerosol refractive index mi from 0 to 0.01 in theaerosol model of Ignatov et al. (1995) decreased v byonly 10% but simultaneously decreased Pa(C) by;30%, thus decreasing their product by ;37% and in-creasing AODSAT by ;59% [cf. Eq. (2)].
When assessing flux changes by starting with a givensatellite radiance La, the effect of changing v (or Pa)on both AODSAT and DaF↑ must be handled in a self-consistent way. This can be illustrated by substituting(2) in (1), yielding
2D F↑ 5 2F T (1 2 A )a T c
23 [vb (1 2 R ) 2 2(1 2 v)R ]m ma s s 0 y
La3 . (3)vP (C)a
Investigating the sensitivity of (3) to coupled changesin v and Pa for realistic aerosol models is beyond thescope of this paper. Nevertheless, the above discussionillustrates the importance of the magnitude of aerosolv in a variety of applications.
3. TARFOX techniques and results
Four techniques were used in TARFOX to determineaerosol v. One of these techniques derives values forv as a best-fit parameter when comparing flux changesmeasured by airborne pyranometer to those computedfrom aerosol properties (Hignett et al. 1999; Russell etal. 1999b). The computed v values are wavelength-de-pendent, deriving from wavelength-dependent complexrefractive indices for aqueous sulfate plus a variableimaginary component (see Russell et al. 1999b; Bergs-trom and Russell 1999, for details). Calculated fluxchanges cover the band 300–3000 nm, to match the bandof the flux measurements. The best-fit values for v(550nm) thus obtained are listed in Table 1a and shown bythe data points labeled Ru99, B&R99 in Fig. 2. Someof the strengths of this technique are that it describesthe aerosol both in the column (vertically integrated)and in its ambient state, unperturbed by sampling. Also,since the v values are derived from measured radiative
flux changes, these values should be successful in com-puting realistic flux changes—as required by climatecalculations. However, this also makes the techniquedependent on the quality of the flux-change measure-ments (including such problems as thermal offsets (e.g.,Bush et al. 2000; Haeffelin et al. 2001), and on theaccuracy of calculations used to separate the effects ofaerosols from the effects of any absorbing gases (e.g.,water vapor) in the flux-change measurements. Thus,errors in either flux measurements or gas spectroscopycan produce errors in the derived values of aerosol v.Also, the technique requires special conditions (e.g.,little or no clouds) to isolate the aerosol effect. Fur-thermore, having the pyranometers on an aircraft withother aerosol instruments is desirable to tighten closure(e.g., reduce effects of radiometer offsets by differenc-ing altitudes, provide in situ aerosol chemistry, size, andother properties). The requirement for cloud-free con-ditions and the desirability of integrated airborne mea-surements have caused the number of results generatedto date to be relatively small. The representativeness ofthese few results is unknown.
A second technique used in TARFOX retrieved aero-sol v from sun and sky radiance measurements (Remeret al. 1999; Remer and Kaufman 1998), yielding theresult labeled R&K98 in Fig. 2 and listed in Table 1a.We obtained the uncertainty of 60.03 from Fig. 7c of

612 VOLUME 59J O U R N A L O F T H E A T M O S P H E R I C S C I E N C E S
TA
BL
E1a
.A
eros
olsi
ngle
scat
teri
ngal
bedo
sde
rive
dfr
omT
AR
FO
Xda
ta.
Met
hod
Alt
itud
e(k
mM
SL
)W
avel
engt
h(n
m)
Rel
ativ
ehu
mid
ity
Num
ber
ofca
ses
orda
tapo
ints
Aer
osol
v
Res
ult
orm
ean
Std
dev
(SD
)or
unce
rtai
nty
(U)
Ref
eren
ce
Flu
xbe
stfi
tL
ayer
,0
to;
355
0A
mbi
ent
(;30
%–
98%
)2
0.89
50.
905
0.02
5(U
)0.
045
(U)
Rus
sell
etal
.(1
999b
);B
ergs
trom
and
Rus
sell
(199
9)S
un–s
kyra
dian
cere
trie
val
Col
umn
440,
670
Am
bien
t(;
30%
–99
%)
52a
0.96
0.03
(U)
Rem
eret
al.
(199
9);
Rem
eran
dK
aufm
an(1
998)
Lid
ar–s
unph
otom
eter
–siz
ebe
stfi
tL
ayer
,0
to;
3b20
0–7
0020
0–7
0055
055
0
Am
bien
t,63
%c
Am
bien
t,69
%c
Am
bien
t,63
%c
Am
bien
t,69
%c
20.
974
0.96
90.
977
0.96
9
0.01
2(U
)0.
009
(U)
0.01
0(U
)0.
010
(U)
Red
eman
net
al.
(200
0b)
Nep
helo
met
er–a
bsor
ptio
nph
oto-
met
erL
ayer
,0
to;
3b;
550
Dry
(,30
%)
Wet
scat
,dr
yab
sd
14 140.
900.
940.
04(S
D)
0.04
(SD
)H
egg
etal
.(1
997)
Nep
helo
met
er–a
bsor
ptio
nph
oto-
met
erL
ayer
,0
to;
3b55
0W
etsc
at,
est
wet
abs
120.
950.
03(S
D)
Har
tley
etal
.(2
000)
a52
case
sfr
omT
AR
FO
Xan
dth
eS
ulfa
te,
Clo
uds,
and
Rad
iati
on–A
tlan
tic
(SC
AR
-A)
expe
rim
ent,
com
pari
ngm
easu
red
and
com
pute
dsk
ylig
htat
scat
teri
ngan
gles
858,
1208
,an
d15
68.
bM
etho
dal
soyi
elds
heig
ht-r
esol
ved
aero
sol
v;
see
refe
renc
es.
cL
ayer
aver
age,
exti
ncti
onw
eigh
ted.
dT
heco
mbi
nati
onof
wet
scat
teri
ng(s
cat)
and
dry
abso
rpti
on(a
bs)
give
san
uppe
rbo
und
for
ambi
ent
aero
sol
v,
for
near
lyal
lca
ses
(e.g
.,R
edem
ann
etal
.20
01).
Remer and Kaufman (1998), which shows that, at boththe 440- and 670-nm wavelengths, v 5 0.96 gives thebest fit to measured radiance, but v 5 0.93 and v 50.99 are well within the scatter of the data. Like theflux-fitting technique, sun–sky radiance retrievals havethe advantage of describing the column aerosol in itsunperturbed state. Moreover, sun–sky radiance retriev-als are probably less subject to errors caused by inac-curate treatment of absorbing gases. For example, theretrievals use narrowband measurements at 440 and 670nm—two wavelengths relatively unaffected by gas ab-sorption.
A third technique obtained aerosol v from best-fitcomplex refractive indices and aerosol size distributions(0.1 , D , 47.0 mm) measured in situ (Redemann etal. 2000b). The refractive indices were first derived asthose that best reproduced lidar-derived aerosol back-scatter profiles (at wavelength 815 nm) and then com-pared to sun photometer–derived aerosol optical depths(at 4 wavelengths, 380–1020 nm) in a given layer (Re-demann et al. 2000a). In this process, the aerosol sizedistributions were adjusted iteratively to yield three-wayclosure between the lidar-derived aerosol backscatter,the sun photometer–derived aerosol optical depth spec-tra and the same quantities calculated from the adjustedsize distributions and refractive indices. To achieve thisclosure, the adjustment to the aerosol size distributionsentailed an iterative increase of the particle sizes in therange of the composite size distributions that used theForward Scattering Spectrometer Probe–300 particleprobe data (i.e., 0.4 , D , 3.2 mm) by 20% to 68%(independent of size within that range). Redemann etal. (2000a) showed that refractive indices independentof wavelength over the range 380–1020 nm reproducedmeasured optical depth over that range. These wave-length-independent refractive indices were used to cal-culate wavelength-dependent values of aerosol v, whichwere then averaged over bands of a radiative transfermodel. Column-average results for the 200–700-nmband are listed in Table 1a. (This technique also yieldsvertically resolved v; see below.) For this paper we havemade analogous calculations for the single 550-nmwavelength. These results are also listed in Table 1a andshown by the data points labeled Re00 in Fig. 2. Theuncertainties listed and shown are based on a sensitivityanalysis that considered the range of real and imaginaryrefractive indices that produced calculated backscatterand extinction values consistent with measured valuesand their uncertainties (630% for backscatter and ex-tinction), plus a range of size distributions that includedboth the adjusted and unadjusted ones described above.
The Redemann et al. (2000a,b) technique combinesresults of in situ size distribution measurements witheffects of ambient aerosols on backscatter and extinctionmeasurements. Thus, it is somewhat subject to samplingeffects on the in situ size distribution measurements;however, these effects are minimized by using only rel-ative size distributions. Another possible concern is that
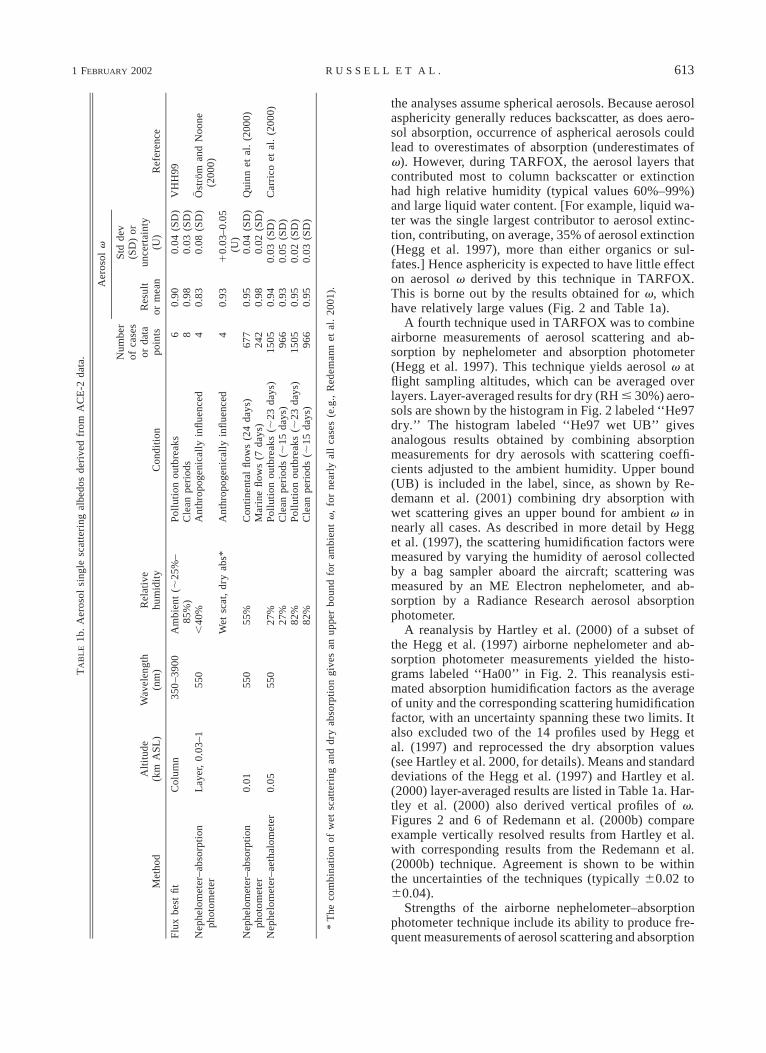
1 FEBRUARY 2002 613R U S S E L L E T A L .T
AB
LE
1b.
Aer
osol
sing
lesc
atte
ring
albe
dos
deri
ved
from
AC
E-2
data
.
Met
hod
Alt
itud
e(k
mA
SL
)W
avel
engt
h(n
m)
Rel
ativ
ehu
mid
ity
Con
diti
on
Num
ber
ofca
ses
orda
tapo
ints
Aer
osol
v
Res
ult
orm
ean
Std
dev
(SD
)or
unce
rtai
nty
(U)
Ref
eren
ce
Flu
xbe
stfi
tC
olum
n35
0–3
900
Am
bien
t(;
25%
–85
%)
Pol
luti
onou
tbre
aks
Cle
anpe
riod
s6 8
0.90
0.98
0.04
(SD
)0.
03(S
D)
VH
H99
Nep
helo
met
er–a
bsor
ptio
nph
otom
eter
Lay
er,
0.03
–155
0,
40%
Ant
hrop
ogen
ical
lyin
flue
nced
40.
830.
08(S
D)
Ost
rom
and
Noo
ne(2
000)
Wet
scat
,dr
yab
s*A
nthr
opog
enic
ally
infl
uenc
ed4
0.93
10.
03–0
.05
(U)
Nep
helo
met
er–a
bsor
ptio
nph
otom
eter
0.01
550
55%
Con
tine
ntal
flow
s(2
4da
ys)
Mar
ine
flow
s(7
days
)67
724
20.
950.
980.
04(S
D)
0.02
(SD
)Q
uinn
etal
.(2
000)
Nep
helo
met
er–a
etha
lom
eter
0.05
550
27%
27%
82%
82%
Pol
luti
onou
tbre
aks
(;23
days
)C
lean
peri
ods
(;15
days
)P
ollu
tion
outb
reak
s(;
23da
ys)
Cle
anpe
riod
s(;
15da
ys)
1505 966
1505 966
0.94
0.93
0.95
0.95
0.03
(SD
)0.
05(S
D)
0.02
(SD
)0.
03(S
D)
Car
rico
etal
.(2
000)
*T
heco
mbi
nati
onof
wet
scat
teri
ngan
ddr
yab
sorp
tion
give
san
uppe
rbo
und
for
ambi
ent
v,
for
near
lyal
lca
ses
(e.g
.,R
edem
ann
etal
.20
01).
the analyses assume spherical aerosols. Because aerosolasphericity generally reduces backscatter, as does aero-sol absorption, occurrence of aspherical aerosols couldlead to overestimates of absorption (underestimates ofv). However, during TARFOX, the aerosol layers thatcontributed most to column backscatter or extinctionhad high relative humidity (typical values 60%–99%)and large liquid water content. [For example, liquid wa-ter was the single largest contributor to aerosol extinc-tion, contributing, on average, 35% of aerosol extinction(Hegg et al. 1997), more than either organics or sul-fates.] Hence asphericity is expected to have little effecton aerosol v derived by this technique in TARFOX.This is borne out by the results obtained for v, whichhave relatively large values (Fig. 2 and Table 1a).
A fourth technique used in TARFOX was to combineairborne measurements of aerosol scattering and ab-sorption by nephelometer and absorption photometer(Hegg et al. 1997). This technique yields aerosol v atflight sampling altitudes, which can be averaged overlayers. Layer-averaged results for dry (RH # 30%) aero-sols are shown by the histogram in Fig. 2 labeled ‘‘He97dry.’’ The histogram labeled ‘‘He97 wet UB’’ givesanalogous results obtained by combining absorptionmeasurements for dry aerosols with scattering coeffi-cients adjusted to the ambient humidity. Upper bound(UB) is included in the label, since, as shown by Re-demann et al. (2001) combining dry absorption withwet scattering gives an upper bound for ambient v innearly all cases. As described in more detail by Hegget al. (1997), the scattering humidification factors weremeasured by varying the humidity of aerosol collectedby a bag sampler aboard the aircraft; scattering wasmeasured by an ME Electron nephelometer, and ab-sorption by a Radiance Research aerosol absorptionphotometer.
A reanalysis by Hartley et al. (2000) of a subset ofthe Hegg et al. (1997) airborne nephelometer and ab-sorption photometer measurements yielded the histo-grams labeled ‘‘Ha00’’ in Fig. 2. This reanalysis esti-mated absorption humidification factors as the averageof unity and the corresponding scattering humidificationfactor, with an uncertainty spanning these two limits. Italso excluded two of the 14 profiles used by Hegg etal. (1997) and reprocessed the dry absorption values(see Hartley et al. 2000, for details). Means and standarddeviations of the Hegg et al. (1997) and Hartley et al.(2000) layer-averaged results are listed in Table 1a. Har-tley et al. (2000) also derived vertical profiles of v.Figures 2 and 6 of Redemann et al. (2000b) compareexample vertically resolved results from Hartley et al.with corresponding results from the Redemann et al.(2000b) technique. Agreement is shown to be withinthe uncertainties of the techniques (typically 60.02 to60.04).
Strengths of the airborne nephelometer–absorptionphotometer technique include its ability to produce fre-quent measurements of aerosol scattering and absorption

614 VOLUME 59J O U R N A L O F T H E A T M O S P H E R I C S C I E N C E S
FIG. 3. Histograms and fitted curves give frequency of occurrenceof aerosol single scattering albedo values derived from nephelometerand absorption photometer measurements on R/V Vodyanitsky inACE-2 (Jun–Jul 1997, z 5 10 m MSL, RH 5 55%, D50,aero 5 10 mm,l 5 550 nm) by Quinn et al. (2000). Data points labeled O&N00are from nephelometer and absorption photometer measurements onPelican A/C by Ostrom and Noone (2000).
at flight altitudes, which can yield vertical profiles orlayer-averaged values for aerosol v. Also, the resultingmeasurements of light scattering and absorption (the twocomponents used to calculate SSA) provide a more di-rect measurement of SSA than the preceding techniques.Limitations result from the fact that aerosols are sampledthrough an inlet at aircraft speeds, generally resultingin some aerosol loss. The most common losses are 1)aerodynamic separation of large particles from the sam-pling stream and 2) possible evaporation of volatilecomponents, such as water, organics, and nitrates. Aero-dynamic separation can be minimized by designing theinlet to have negligible losses for the particle sizes thatdominate extinction. Effects of water loss on the neph-elometer scattering measurements can be compensatedby measuring RH in the scattering chamber and usingmeasured scattering humidification factors to adjust re-sults to ambient RH (e.g., Hegg et al. 1997; Hartley etal. 2000). More difficult to quantify and allow for arethe effects of organic and nitrate loss on scattering; andthe effect of water, organic, and nitrate loss on absorp-tion. As a consequence these effects are usually nottaken into account; however, Bergin et al. (1997) havedescribed ammonium nitrate aerosol evaporation in aheated nephelometer. A disadvantage of the measure-ment of light absorption by the absorption photometersused in TARFOX and ACE-2 is that they measure at-tenuation of a filter-deposited sample rather than theaerosol in its freely suspended state (e.g., Bond et al.1999).
4. ACE-2 techniques and results
In ACE-2 aerosol v was determined both as a best-fit parameter when comparing measured and calculatedflux changes at the surface (von Hoyningen-Huene,1999, personal communication; hereafter VHH99) andby combining nephelometer and absorption photometermeasurements. The nephelometer–absorption photom-eter results were obtained on the ACE-2 ship (10 mASL), at the Sagres, Portugal site (50 m MSL), and onthe Pelican aircraft (;30–3900 m MSL).
The nephelometer–absorption photometer resultsfrom the ACE-2 ship (Quinn et al. 2000) are shown bythe histograms in Fig. 3 and are listed in Table 1b.Results are given for the measurement RH, 55%. Per-formance characteristics of the Thermo Systems, Inc.(TSI) nephelometer used by Quinn et al. (and also byCarrico et al. 2000, see below) are described by An-derson et al. (1996). Absorption coefficients, determinedwith a particle soot absorption photometer (PSAP, Ra-diance Research) were corrected by Quinn et al. for asmall (1%–1.5%) positive artifact caused by instrumen-tal interpretation of scattering as absorption using themethod of Bond et al. (1999). Measurements were madeon particles with aerodynamic diameters less than 10mm.
Analogous results from the Sagres, Portugal, site
(Carrico et al. 2000) are shown in Fig. 4 and listed inTable 1b. In this case the measurement RH for scatteringcoefficients ssp was varied from 27% to 82%. Absorp-tion coefficients sap were measured with an aethalo-meter assuming a black carbon specific absorption of10 m2 g21 at 550 nm. Because scattering effects in theaethalometer have not been characterized (like the Bondet al. 1999 study for the PSAP), Carrico et al. did notapply a scattering correction to absorption. However,they included this effect in their uncertainty analyses.The aethalometer sampled particles with aerodynamicdiameters less than 10 mm at RH # 40%.
Results from airborne nephelometer–absorption pho-tometer measurements (Ostrom and Noone 2000) onfour Pelican flight legs within the anthropogenically in-fluenced boundary layer are shown by the data pointslabeled ‘‘O&N00’’ in Fig. 3 and are listed in Table 1b.Ostrom and Noone determined absorption coefficientswith a PSAP and corrected for the scattering artifactusing the factors determined by Bond et al. (1999). Airwas sampled through an isokinetic inlet and cyclonicimpactors that rejected larger particles, with a nominal50% cutoff at aerodynamic diameter Da 5 2.5 mm. Aftersampling, air was heated to maintain RH below 40%

1 FEBRUARY 2002 615R U S S E L L E T A L .
FIG. 4. Histograms and fitted curves give frequency of occurrenceof aerosol single scattering albedo values derived from nephelometerand aethalometer measurements at Sagres, Portugal, in ACE-2 (Jun–Jul 1997, z 5 50 m MSL, RH 5 27%, l 5 550 nm) by Carrico etal. (2000). Data points labeled vHH99 are best fits from flux-changeanalyses by von Hoyningen-Huene et al. (VHH99).
(below 30% for most measurements). The data pointlabeled ‘‘U.B. Amb.’’ in Fig. 3 combines ‘‘dry’’ ab-sorption coefficients (i.e., at measurement RH) withmeasured scattering coefficients multiplied by a scat-tering humidification factor, ssp(80%)/ssp(30%). Asnoted above, Redemann et al. (2001) show that thistechnique gives an upper bound for ambient aerosol vin nearly all cases. Ostrom and Noone (2000) used theapproximation s sp (80%)/s sp (30%) 5 [D(80%)/D(30%)]2 5 GF2, where GF is the diameter growthfactor. The data point and upper uncertainty bar in Fig.3 use GF 5 1.7 (i.e., ssp(80%)/ssp(30%) 5 2.9), oneof the largest values reported for the anthropogenicallyinfluenced marine boundary layer in several studies(e.g., Kotchenruther et al. 1999; Swietlicki et al. 2000).The lower uncertainty bar uses GF 5 1.43, the valueobtained from the mean ssp(80%)/ssp(30%) 5 2.04found by Gasso et al. (2000) on Pelican flight legs withinthe polluted marine boundary layer in ACE-2. Note thatCarrico et al. (2000) found even smaller values duringboth polluted and clean periods at the Sagres site. Spe-cifically, they found ssp(82%)/ssp(27%) 5 1.46 6 0.10(corresponding to GF(82%, 27%) 5 1.21 6 0.04) duringpolluted periods and ssp(82%)/ssp(27%) 5 1.69 6 0.16(corresponding to GF(82%, 27%) 5 1.30 6 0.06) duringclean periods.
The flux best-fit results of VHH99 for the six pollutedand eight clean cases are shown by the data points la-beled ‘‘vHH99’’ in Fig. 4. Means and standard devia-tions for all are listed in Table 1b. The effective wave-length of the von Hoyningen-Huene results bears dis-cussion, because these results are from broadband pyr-anometers (covering 350–3900 nm; cf. Table 1b), and,unlike the TARFOX flux-fitting results (Hignett et al.1999; Russell et al. 1999b), von Hoyningen-Huene didnot derive spectrally resolved best-fit v using an aerosolmodel. Nevertheless, we argue that the effective wave-length of the von Hoyningen-Huene flux-fit result isclose to 550 nm. The solar energy spectrum peaks at550 nm. It does have a long infrared tail, which putshalf of solar energy longward of ;700 nm, both at thesurface and above the atmosphere (Blanchet 1982; Kiehland Briegleb 1993; Russell et al. 1997). However, thislonger-wavelength solar energy is scattered and ab-sorbed by aerosols less than solar energy shortward of700 nm, because aerosol scattering and absorption de-crease with wavelength in this region. To quantify thiseffect, we have run simulations taking into account theshape of the solar energy spectrum and a realistic rangeof wavelength dependences for aerosol scattering andabsorption. Results of these simulations show that, fora broadband pyranometer covering 350–3900 nm, theeffective wavelength for extinction rarely differs from550 nm by more than 100 nm. In turn, the single scat-tering albedo at this effective wavelength rarely differsfrom that at 550 nm by more than 0.01. For example,the seven models of absorbing sulfate aerosols used byRussell et al. (1999b) had v(550 nm) 2 v(650 nm) 50.004 6 0.003. The weak wavelength dependence of vfor polluted boundary layer aerosols in this spectral re-gion is also borne out by the Remer measurements at440 and 670 nm (Table 1a) and by the small differencebetween the Redemann results at 550 nm and averagedover the 200–700-nm band (Table 1a). Thus we arguethat the effective wavelength for all v reported in thispaper is in the midvisible (;550 nm) and we adopt thesymbol vmidvis to describe them.
Curves drawn over the histograms in Figs. 3 and 4are lognormals in vmax 2 v; that is,
2N 1 lna 2 lnagn(a) 5 exp 2 , (4)1 2[ ]2 sas Ï2p gg
where
a [ v 2 v,max (5)
N is the number of observations, ag and sg are the geo-metric mean and standard deviation defined by
N1lna [ lna , and (6a)Og iN i51
s [ Ï2[lna 2 lna ], (6b)g g
and is the arithmetic mean of a. The parameters ofathe distributions are given in Table 2.

616 VOLUME 59J O U R N A L O F T H E A T M O S P H E R I C S C I E N C E S
FIG. 5. Comparison of aerosol single scattering albedo distributionsand data points for ACE-2 anthropogenically influenced boundarylayer cases and for TARFOX columns.
TABLE 2a. Parameters of lognormals used to approximatehistograms for TARFOX data.
Histogram N vmax ag sg
He97 wet UB UnimodalBimodal, small vBimodal, large v
1477
111
0.0520.0990.027
0.6620.2030.268
Ha00 wet UnimodalBimodal, small vBimodal, large v
1239
111
0.0440.1010.034
0.6170.0460.482
Because the histogram for ‘‘clean periods’’ in Fig. 4appears bimodal, we have also derived lognormal pa-rameters for each mode. These parameters are also givenin Table 2, and the bimodal curve is shown in Fig. 4.It captures the bimodal shape of the clean periods his-togram fairly well. The TARFOX histograms in Fig. 2also suggest bimodality. For completeness we show thecorresponding bimodal lognormal parameters in Table2. However, because the numbers of cases are small forthese TARFOX column results (14 for Hegg et al. 1997;12 for Hartley et al. 2000), the apparent bimodality islikely to be a statistical artifact. Therefore, we use onlythe unimodal parameters for these TARFOX cases.
For the ACE-2 anthropogenically influenced bound-ary layer cases, lognormal distribution curves are shownin the upper frame of Fig. 5 to facilitate comparison tothe TARFOX results, which are shown in the bottomframe. The curve labeled ‘‘Qu00’’ is the same as thatshown in Fig. 3. The curve labeled ‘‘Ca00’’ in Fig. 5has the same width sg as that in Fig. 4, but its geometricmean ag has been decreased [i.e., peak v increased; cf.Eq. (5)] by 0.01 to reflect the 0.01 difference betweenthe Carrico et al. (2000) results for polluted conditionsat RH of 27% and 82%, respectively (see Table 1b).
5. Discussion and conclusionsPerhaps the most fundamental result of the above
comparisons is that both TARFOX and ACE-2 found
the range of aerosol single scattering albedo to be broad.For the ambient, anthropogenically influenced aerosol,both experiments found aerosol single scattering albe-dos at midvisible wavelengths (;550 nm) distributedthroughout the range 0.85 # vmidvis # 0.99 (cf. Fig. 5).When measurements were made in sufficient numbers,distributions could usually be well approximated by log-normals in vmax 2 v, with some occurrence of bimo-dality, suggesting the influence of different sources and/or processes.
A striking result is the tendency of both the TARFOXand ACE-2 results for the polluted boundary layer tocluster into two groups depending on the technique usedto derive aerosol v. Specifically, in both experiments,closure tests between measured and calculated broad-band radiative fluxes yielded best-fit values of vmidvis of0.90 6 0.04 for the polluted boundary layer. All theother techniques (skylight retrieval, refractive index fit-ting to lidar–sun photometer–size profiles, nephelome-ter–absorption photometer measurements) gave largervmidvis for the polluted boundary layer. For example, inTARFOX, the column- or layer-averaged results were0.96 6 0.03 for skylight retrievals (Remer et al. 1999;Remer and Kaufman 1998), 0.97 6 0.01 for lidar–sunphotometer–size fitting (Redemann et al. 2000a,b), 0.946 0.04 for humidified nephelometer–absorption pho-tometer measurements (Hegg et al. 1997), and 0.95 60.03 for a reanalysis (Hartley et al. 2000) of 12 of the14 profiles analyzed by Hegg et al. (1997). In ACE-2,the anthropogenically influenced boundary layer resultsfrom airborne nephelometer and absorption photometeryielded 0.93 6 0.05 (or 10.03, 20.06) (Ostrom andNoone 2000). Measurements by ship- and ground-basednephelometer and absorption photometer yielded 0.956 0.04 at RH 55% (Quinn et al. 2000) and 0.95 6 0.03at RH 82% (Carrico et al. 2000).
In assessing the significance of this difference (0.906 0.04 for the flux-based results, ;0.95 6 0.04 for theothers) it is instructive to consider both the range oruncertainty within each group and the strengths and lim-itations of each technique. First note that, since the val-ues to the right of the 6 sign are either 1 standarddeviation or 1s uncertainties, there is a significant over-lap and hence a significant chance that the two groupsof results could have been drawn from the same pop-ulation. In other words, the difference between the twogroups may not be significant at all. In part this reflects

1 FEBRUARY 2002 617R U S S E L L E T A L .
TABLE 2b. Parameters of lognormals used to approximate histograms for ACE-2 data.
Histogram N vmax ag sg
Qu00, continental flowsQu00, marine flowsCa00, pollution outbreaksCa00, clean periods Unimodal
Bimodal, small vBimodal, large v
677242
1506966586380
0.99610.9850.9950.9950.995
0.0370.0200.0410.0510.0910.021
0.7280.6230.6030.7480.3660.376
the small number of results from the flux-fitting tech-nique (two for the polluted boundary layer in TARFOX;six for the polluted column in ACE-2) and the consid-erable range of results from the other techniques. (Infact, the frequent skewness of the v histograms meansthat the std dev by itself can give a mistaken impressionof the extent of the small-v tail of the distribution; cf.Figs. 3 and 4.)
Nevertheless, it is instructive to consider possible rea-sons for the difference among techniques, assuming thatit is significant. One possible reason, mentioned in sec-tion 3, is the influence of assumed gaseous absorptionon best-fit v. If gas absorption is underestimated whencalculating flux changes, aerosol absorption will beoverestimated when calculated fluxes are adjusted tomatch measured fluxes. In fact, the subject of gas ab-sorption spectroscopy and its role in comparing calcu-lated to measured fluxes is the focus of very activeresearch now, with a wide range of results reported (e.g.,Halthore et al. 1998; Giver et al. 2000; Pilewskie et al.2000; Belmiloud et al. 2000; Mlawer et al. 2000). Theaccuracy of radiative flux measurements, including cor-rections for thermal offsets (e.g., Bush et al. 2000; Haef-felin et al. 2001) is also the focus of active research.The magnitude of such corrections (;5 to ;20 W m22)is large enough that they might influence aerosol v val-ues derived by the flux-fitting technique. However, sincefluxes input to this technique are differences betweenfluxes with and without aerosols (either measured ormodeled—e.g., Hignett et al. 1999; VHH99), carefulconsideration of the difference in thermal offsets isneeded for specific experimental conditions and pro-cedures (e.g., comparing fluxes measured at differentaltitudes, comparing fluxes measured on different days,or comparing measured fluxes to model calculations).For example, the fact that VHH99 found v 5 0.98 60.03 for clean periods (Table 1b, Fig. 3) suggests thatthermal offsets have been accounted for appropriately,since thermal offsets significantly larger than they usedwould yield v . 1 (negative aerosol absorption).
There are also reasons for potential biases in the othertechniques. For example, as mentioned above, absorp-tion is often assumed independent of humidity whenambient aerosol v is estimated from nephelometer andabsorption photometer measurements made at reducedhumidity. In fact, as recently emphasized by Redemannet al. (2001), when aerosol black carbon occurs as aninclusion in a sulfate shell, humidity increases can in-
crease absorption. This occurs because the shell focusesthe electromagnetic field on the carbon, and shell growthin rising humidity increases the focused field strength.Calculations of this effect for realistic size distributions,humidities, and carbon–sulfate ratios show that, for therange of v found in TARFOX and ACE-2 (i.e., 0.85 #vmidvis # 0.99), the assumption that absorption is hu-midity-independent may overestimate v by ;0.02(more for smaller dry particles in narrow size distri-butions, less for larger particles in broad distributions).Fuller et al. (1999) pointed out that shell–core particlemorphology as assumed by Redemann et al. (2001) canlead to an overestimate of aerosol light absorption byup to 15% in comparison to calculations assuming ran-dom placement of soot agglomerates within the hostparticles. However, since Redemann et al. (2001) quan-tified relative statements such as the increase in ab-sorption of a humidified particle relative to its dry stateand since the potential overestimate in particle absorp-tion applies to both the dry and the wet particles, theerror in single scattering albedo estimates induced byassuming the shell–core particle morphology is proba-bly negligible. As noted in Tables 1a and 1b, this as-sumption was used in nephelometer–absorption pho-tometer results reported by Hegg et al. (1997), Ostromand Noone (2000), and Carrico et al (2000). Reducingthose results by ;0.02 does indeed move them signif-icantly toward the flux-fit results of 0.90 6 0.04 for thepolluted boundary layer.
Sampling-inlet effects should also be considered. Forexample, the inlet on the ACE-2 Pelican aircraft, usedby Ostrom and Noone (2000), rejected larger particles,with a nominal 50% cutoff at aerodynamic diameter Da
5 2.5 mm. For typical boundary layer aerosol densitiesof 1.3 g cm23 (at RH ;80%), this aerodynamic diametercorresponds to a geometric diameter of 2.2 mm. In con-trast, the inlet on the ship that produced the Quinn etal. (2000) results in Fig. 3 had an aerodynamic cutoffof 10 mm. Thus, it is highly likely that the aerosol sam-pled by Ostrom and Noone had a smaller salt fractionthan that sampled by Quinn et al. On the other hand,the salt fraction at the 10-m altitude sampled by Quinnet al. is likely to exceed that averaged over the boundarylayer, because of gravitational sedimentation of the larg-est particles.
6. Implications for future studiesIt is worth emphasizing that the difference between
the two clusters of results (flux-based and all others) is
618 VOLUME 59J O U R N A L O F T H E A T M O S P H E R I C S C I E N C E S
large in terms of climate effects. As shown by Fig. 1,changing the value of aerosol v from 0.95 to 0.90 canreduce tropospheric cooling by ;40% over dark veg-etation, and can change the sign of the aerosol effectfrom cooling to heating over some desert surfaces andover snow fields. Effects on radiant fluxes at the surfaceand within the boundary layer—which influence con-vection, cloud formation and persistence, and other pro-cesses—can be even larger. Thus further research is war-ranted to determine whether the difference (between0.90 6 0.04 and 0.95 6 0.04) is indeed significant and,if so, the reasons for it.
One promising avenue is to conduct comparisons be-tween the different techniques that are both more nu-merous (to cover a representative range of atmosphericconditions and achieve statistical significance) and morecarefully controlled. An important criterion is that theaerosols sampled, probed, or described by the differenttechniques be 1) the same and 2) as close as possibleto their ambient state (unperturbed by sampling pro-cesses). Thus, in situ results that are compared to flux-change results must describe the aerosol 1) throughoutthe same layer or column that determines the fluxchange, and 2) in its ambient state (using accurate cor-rection procedures as necessary). The first requirementpoints to a need for airborne in situ sampling. In turn,the increased importance of inlet effects (including aero-dynamic size separation and evaporation) at aircraftspeeds calls for increased effort to understand and min-imize these effects, as well as to quantify correctionfactors. Conversely, care must be taken that the flux-change and optical-depth measurements span the samelayer or column as is sampled in situ. This can beachieved by flying a vertical profile using a single air-borne platform for in situ sampling, flux radiometry,and solar beam transmissometry; or by careful coordi-nation among two or more airborne platforms. Neces-sary quality control of the airborne flux radiometer mea-surements includes careful calibration as well as mini-mization and measurement of radiometer tilt and tem-perature effects. Control of radiometer tilt has definiteimplications for the type of vertical profiles flown (e.g.,horizontal legs and ramps versus spirals). Related con-siderations apply to the airborne solar beam transmis-sion measurements, depending on technique (e.g., track-ing sun photometer versus shadowband radiometer). Asmentioned in sections 3 and 5, there is also a need forrenewed attention to the gas spectroscopy that is usedto separate aerosol and gas effects on measured fluxes.Spectrally resolved flux closure tests could provide mul-tiple benefits, including reducing dependence on gasspectroscopy, testing for and isolating other perturbingfactors (e.g., clouds, surface albedo), and producingwavelength-dependent values of v.
Another area worthy of increased attention is quan-tifying the effects of humidity changes on aerosol ab-sorption. Measuring these effects is difficult, if not im-possible, with many current instruments. However, pho-
toacoustic measurements (e.g., Bruce 1991; Moosmulleret al. 1998) may offer promise here. Although vibrationsensitivity may preclude airborne photoacoustic mea-surements, surface measurements may be useful to re-veal the important effects and provide data for com-parison with, for example, shell-and-core calculations(e.g., Redemann et al. 2001).
Acknowledgments. This research was conducted aspart of the Global Aerosol Climatology Program(GACP), the Tropospheric Aerosol Radiative ForcingObservational Experiment (TARFOX), and the secondAerosol Characterization Experiment (ACE-2). TAR-FOX and ACE-2 are contributions to the InternationalGlobal Atmospheric Chemistry (IGAC) core project ofthe International Geosphere-Biosphere Programme(IGBP), and are parts of the IGAC Focus on Atmo-spheric Aerosols (FAA). GACP is supported by the Ra-diation Science Program Office of the U.S. NationalAeronautics and Space Administration. Other supportwas provided by the U.S. National Oceanographic andAtmospheric Administration Office of Global Programs,and the U.S. National Science Foundation.
REFERENCES
Ackerman, A. S., O. B. Toon, D. E. Stevens, A. J. Heymsfield, V.Ramanathan, and E. J. Welton, 2000: Reduction of tropicalcloudiness by soot. Science, 288, 1042–1047.
Anderson, T. L., and Coauthors, 1996: Performance characteristicsof a high sensitivity, three wavelength, total scatter/backscatternephelometer. J. Atmos. Oceanic Technol., 13, 967–986.
Belmiloud, D., R. Schermaul, K. Smith, N. Zobov, J. W. Brault, R.C. M. Learner, D. A. Newnham, and J. Tennyson, 2000: Newstudies of the visible and near-infrared absorption by water vaporand some problems with the HITRAN database. Geophys. Res.Lett., 27, 3703–3706.
Bergin, M. H., J. A. Ogren, S. E. Schwartz, and L. M. McInnes, 1997:Evaporation of ammonium nitrate aerosol in a heated nephelom-eter: Implications for field measurements. Environ. Sci. Technol.,31, 2878–2883.
Bergstrom, R. W., and P. B. Russell, 1999: Estimation of aerosolradiative effects over the mid-latitude North Atlantic region fromsatellite and in situ measurements. Geophys. Res. Lett., 26, 1731–1734.
Blanchet, J. P., 1982: Application of Chandrasekhar mean to aerosoloptical properties. Atmos.–Ocean, 20, 189–206.
Bond, T. C., T. L. Anderson, and D. Campbell, 1999: Calibration andintercomparison of filter-based measurements of visible light ab-sorption by aerosols. Aerosol Sci. Technol., 30, 582–600.
Bruce, C. W., T. F. Stromberg, K. P. Gurton, and J. B. Mozer, 1991:Trans-spectral absorption and scattering of electromagnetic ra-diation by diesel soot. Appl. Opt., 30, 1537–1546.
Bush, B. C., F. P. J. Valero, A. S. Simpson, and L. Bignone, 2000:Characterization of thermal effects in pyranometers: A data cor-rection algorithm for improved measurement of surface inso-lation. J. Atmos. Oceanic Technol., 17, 165–175.
Carrico, C. M., M. J. Rood, J. A. Ogren, C. Neusuß, A. Wiedensohler,and J. Heintzenberg, 2000: Aerosol light scattering propertiesmeasured at Sagres, Portugal, during ACE-2. Tellus, 52B, 694–715.
Chylek, P., and J. Wong, 1995: Effect of absorbing aerosols on globalradiation budget. Geophys. Res. Lett., 22, 929–931.
Durkee, P. A., and Coauthors, 2000: Regional aerosol properties from

1 FEBRUARY 2002 619R U S S E L L E T A L .
satellite observation: ACE-1, TARFOX and ACE-2 results. Tel-lus, 52B, 484–497.
Fuller, K. A., W. C. Malm, and S. M. Kreidenweis, 1999: Effects ofmixing on extinction by carbonaceous particles. J. Geophys.Res., 104, 15 941–15 954.
Gasso, S., and Coauthors, 2000: Influence of humidity on the aerosolscattering coefficient and its effect on the upwelling radianceduring ACE-2. Tellus, 52B, 546–567.
Giver, L. P., C. Chackerian Jr., and P. Varanasi, 2000: Visible andnear-infrared H2
16O line intensity corrections for HITRAN-96.J. Quant. Spectrosc. Radiat. Transfer, 66, 101–105.
Haeffelin, M., S. Kato, A. M. Smith, C. K. Rutledge, T. P. Charlock,and J. R. Mahan, 2001: Determination of the thermal offset ofthe Eppley precision spectral pyranometer. Appl. Opt., 40, 472–484.
Halthore, R. N., S. Nemesure, S. E. Schwartz, D. G. Imre, A. Berk,E. G. Dutton, and M. H. Bergin, 1998: Models overestimatediffuse clear-sky surface irradiance: A case for excess atmo-spheric absorption. Geophys. Res. Lett., 25, 3591–3594.
Hansen, J., M. Sato, and R. Ruedy, 1997: Radiative forcing andclimate response. J. Geophys. Res., 102, 6831–6864.
——, ——, A. Lacis, R. Ruedy, I. Tegen, and E. Matthews, 1998:Climate forcings in the industrial era. Proc. Natl. Acad. Sci. USA,95, 12 753–12 758.
Hartley, W. S., P. V. Hobbs, J. L. Ross, P. B. Russell, and J. M.Livingston, 2000: Properties of aerosols aloft relevant to directradiative forcing off the mid-Atlantic coast of the United States.J. Geophys. Res., 105, 9859–9885.
Haywood, J. M., and K. P. Shine, 1995: The effect of anthropogenicsulfate and soot aerosol on the clear sky planetary radiationbudget. Geophys. Res. Lett., 22, 603–606.
Hegg, D. A., J. Livingston, P. V. Hobbs, T. Novakov, and P. Russell,1997: Chemical apportionment of aerosol column optical depthoff the mid-Atlantic coast of the United States. J. Geophys. Res.,102, 25 293–25 303.
Hignett, P., J. P. Taylor, P. N. Francis, and M. D. Glew, 1999: Com-parison of observed and modelled direct aerosol forcing duringTARFOX. J. Geophys. Res., 104, 2279–2288.
Ignatov, A., L. Stowe, S. Sakherin, and G. Korotaev, 1995: Validationof the NOAA/NESDIS satellite aerosol product over the NorthAtlantic in 1989. J. Geophys. Res., 100, 5123–5132.
Kato, S., T. P. Ackerman, E. E. Clothiaux, J. H. Mather, G. G. Mace,M. L. Wesely, F. Murcray, and J. Michalsky, 1997: Uncertaintiesin modeled and measured clear-sky surface shortwave irradi-ances. J. Geophys. Res., 102, 25 881–25 898.
Kiehl, J. T., and B. P. Briegleb, 1993: The relative roles of sulfateaerosols and greenhouse gases in climate forcing. Science, 260,311–314.
King, M. D., Y. J. Kaufman, D. Tanre, and T. Nakajima, 1999: Remotesensing of tropospheric aerosols from space: Past, present, andfuture. Bull. Amer. Meteor. Soc., 80, 2229–2259.
Kotchenruther, R. A., P. V. Hobbs, and D. A. Hegg, 1999: Humidi-fication factors for atmospheric aerosol off the mid-Atlantic coastof United States. J. Geophys. Res., 104, 2239–2251.
Mishchenko, M. I., I. G. Geogdzhayev, B. Cairns, W. B. Rossow,and A. A. Lacis, 1999: Aerosol retrievals over the ocean usingchannel 1 and 2 AVHRR data: A sensitivity analysis and pre-liminary results. Appl. Opt., 38, 7325–7341.
Mlawer, E. J., P. D. Brown, S. A. Clough, L. C. Harrison, J. J. Mich-alsky, P. W. Kiedron, and T. Shippert, 2000: Comparison of spec-tral direct and diffuse solar irradiance measurements and cal-culations for cloud-free conditions. Geophys. Res. Lett., 27,2653–2656.
Moosmuller, H., W. P. Arnott, C. F. Rogers, J. C. Chow, L. E. Sherman,
and D. L. Dietrich, 1998: Photoacoustic and filter measurementsrelated to aerosol light absorption during the Northern FrontRange Air Quality Study. J. Geophys. Res., 103, 28 149–28 157.
Ostrom, E., and K. J. Noone, 2000: Vertical profiles of aerosol scat-tering and absorption measured in situ during the North AtlanticAerosol Characterization Experiment ACE-2. Tellus, 52B, 526–545.
Pilewskie, P., M. Rabbette, R. Bergstrom, J. Marquez, B. Schmid,and P. B. Russell, 2000: The discrepancy between measured andmodeled downwelling solar irradiance at the ground: Depen-dence on water vapor. Geophys. Res. Lett., 27, 137–140.
Podgorny, I. A., W. Conant, V. Ramanathan, and S. K. Satheesh,2000: Aerosol modulation of atmospheric and surface solar heat-ing over the tropical Indian Ocean. Tellus, 52B, 947–958.
Quinn, P., and Coauthors, 2000: A comparison of aerosol chemicaland optical properties from the 1st and 2nd Aerosol Character-ization Experiments. Tellus, 52B, 239–257.
Raes, F., T. Bates, F. McGovern, M. van Liedekerke, 2000: The 2ndAerosol Characterization Experiment (ACE-2): General over-view and main results. Tellus, 52B, 111–125.
Redemann, J., and Coauthors, 2000a: Retrieving the vertical structureof the effective aerosol complex index of refraction from a com-bination of aerosol in situ and remote sensing measurementsduring TARFOX. J. Geophys. Res., 105, 9949–9970.
——, R. P. Turco, K. N. Liou, P. V. Hobbs, R. W. Bergstrom, E. V.Browell, and P. B. Russell, 2000b: Case studies of the verticalstructure of the shortwave direct aerosol radiative forcing duringTARFOX. J. Geophys. Res., 105, 9971–9979.
——, P. B. Russell, and P. Hamill, 2001: Dependence of aerosol lightabsorption and single scattering albedo on ambient relative hu-midity for sulfate aerosols with black carbon cores. J. Geophys.Res., 106, 27 485–27 495.
Remer, L. A., and Y. Kaufman, 1998: Dynamic aerosol model: Urban/industrial aerosol. J. Geophys. Res., 103, 13 859–13 871.
——, ——, and B. N. Holben, 1999: Interannual variation of ambientaerosol characteristics on the east coast of the United States. J.Geophys. Res., 104, 2223–2231.
Russell, P. B., and J. Heintzenberg, 2000: An overview of the ACE-2 Clear Sky Column Closure Experiment (CLEARCOLUMN).Tellus, 52B, 463–483.
——, S. Kinne, and R. Bergstrom, 1997: Aerosol climate effects:Local radiative forcing and column closure experiments. J. Geo-phys. Res., 102, 9397–9407.
——, P. V. Hobbs, and L. L. Stowe, 1999a: Aerosol properties andradiative effects in the United States east coast haze plume: Anoverview of the Tropospheric Aerosol Radiative Forcing Ob-servational Experiment (TARFOX). J. Geophys. Res., 104,2213–2222.
——, and Coauthors, 1999b: Aerosol-induced radiative flux changesoff the United States mid-Atlantic coast: Comparison of valuescalculated from sun photometer and in situ data with those mea-sured by airborne pyranometer. J. Geophys. Res., 104, 2289–2307.
Sokolik, I., and O. B. Toon, 1997: Direct radiative forcing by an-thropogenic airborne mineral aerosols. Nature, 381, 681–685.
Stowe, L. I., A. M. Ignatov, and R. R. Singh, 1997: Development,validation, and potential enhancements to the second-generationoperational aerosol product at the National Environmental Sat-ellite, Data, and Information Service of the National Oceanicand Atmospheric Administration. J. Geophys. Res., 102, 16 923–16 934.
Swietlicki, E., andand Coauthors, 2000: Hygroscopic properties ofaerosol particles in the north-eastern Atlantic during ACE-2.Tellus, 52B, 201–227 .