Replacing 30 % chemical fertilizer with organic ... - SciELO
Hortscience Journal of Suez Canal University, 2013
Volume 1:357- 367
Comparison Between Two Methods of Fertilizer Applications and Fertilizer
Rates for Young Urban Tree Ficus retusa, Linn. Implanted in Sandy Soil
Abo El-Soud I.H; Koriesh, E. M.; Moghazy I. M and Hefni M. M.
Hort. Dep. Suez Canal Univ. Ismailia, Egypt, 41522
ABSTRACT: This study was a trial to evaluate the growth of the urban tree Ficus retusa Linn.,as affected by
fertilization methods with different rates of NPK fertilizers (solid or liquid fertilizers) with a ratio 3:1:2 by using
conventional surface application method compared to deep root fertilizer application, in order to correct the poor growth
problems in young trees planted under high stress conditions. After covariance analyzing (ANCOVA) for both seasons
separately, the results showed that the injection of liquid fertilizer under pressure into the feeder root zone, equal or
sometimes more effective than the surface application of fertilizer in solid form, with respect to measurements of trunk
diameter; length of selected branch; number of new leaves; chlorophyll a and b; carotenoids; N%; P% and K%, in
addition, it is economical and environmentally friendly. Generally, surface or deep root fertilization with the low or
medium rate (38-13-25 or 76-26-50 N: P2O5:K2O g tree-1
year-1
respectively) was the better overall.
INTRODUCTION
Fertilizing street trees is more an art than a science; because there is so little scientific research to base
recommendations for fertilization street tree .Trees fertilization may be helpful, especially for correcting the problems
of poor growth in urban trees. Urban trees require nutrients to function and flourish. The correct amount of nutrients
will keep trees healthy without physiological and biological diseases (Clement, and Malinoski, 2011), enhances their
beauty of appearance, increase tree efficiency in reducing air pollutants (Beedlow, et al., 2004), increase wood quality
and finally tree functional life (Jozsa, and Brix, 1989). Unfertilized trees will exhibit one or more of the following
symptoms: light green or yellow leaves which related to the low efficiency in reducing air pollutants (Singh and Rao,
1983); leaves with dead spots; smaller leaves; fewer leaves; poor annual twig growth; dying back of branches at the
tips; wilting of foliage and infection with pests, if a tree is under stress from other factors, infestations of insects can be
damaging. These symptoms may be caused by environmental stresses as some air pollutants inadequate soil aeration,
lack of moisture or nutrients; adverse climatic conditions; incorrect soil pH and biotic or abiotic diseases; competition
from turf and nearby trees and shrubs; toxic metals in soil and direct human action (Day et al., 2010 and Lu et al.,
2010)
According to Watkins, (1998) fertilization of street trees is often based on traditional forestry objectives, these
objectives and resultant attributes may not be desired in urban street trees. Lack of water, fertilizers and inadequate soil
volumes are responsible for many of the problems that beset urban trees. Watkins, (1998) and Van de Werken, (1984)
concluded that for every inch (2.54 cm) of trunk diameter at breast height, it can be use 2 lbs (907.185 g) from the 5-10-
5 NPK fertilizer. Overall tree growth, particularly root and shoot elongation, leaf color and leaf size, can be enhanced
with additions of nitrogen. A modest recommendation is to apply 1 to 2 lbs. (450 to 910 g) of nitrogen per 1000 ft2 (93
m2) (Coder, 1997). Some authorities and arborists relate the amount of fertilizer to be applied to trunk diameter –
usually 907 g of complete fertilizer for every inch of trunk diameter per year at breast height (Smith et al., 1992).
Trees along a street have to be able to tolerate harsh urban conditions especially in soil. Generally the soil has a high
pH level so the trees must be able to tolerate alkaline soil. Also, irrigation is sometimes not adequate enough, for this
reason, street trees should be able to tolerate periods of drought. High pollution levels in streets can cause problems to
the trees (Bloniarz, 1995).
According to El-Hadidi and Boulos, (1989), Ficus retusa Linn. (nitida), family Moraceae is one of the most
widespread tree in Egypt, but it is not the more beneficial or useful for humans, whereas, this genus produces harmful
volatile organic compounds in environment (Padhy and Varshney, 2005). F. retusa is widely used as street trees in
warm climates around the world (Abo-Shanab, 2011 and Riffle, 1998). Other than being a dense tree, and can also be
in the form of a dense rounded canopy with its globe-shaped top looking dense and heavy with its beautiful leaves
(Johnson et al., 2006). F. retusa trees have been play an important role in capture particulates and can reduce pollutant
from air in urban areas, especially the heavy metals (Roy and Datta 2004 and Smith et al., 2004). This genus had
several medicinal properties characterized by its constituents of coumarins, phytosterols, triterpenes, flavonoids as well
as alkaloids and tannins (Zunoliza et al., 2009; Backheet et al., 2001 and Jeong et al., 1999).
Fertilizing trees is influenced by spacing of plants, time of application, fertilizer types and balance, soil characters,
and may be the methods of application. Singh, (1991) concluded that there are several methods of application
fertilizers to trees as surface addition of solid fertilizers; liquid soil injection; foliar spraying, banding; trunk injection
etc. The method selected depends upon soil characteristics, site factors, cost, and type of nutrients to be
applied (Kujawski and Ryan, 2011). In the sandy soils, trees need an adequate of Nitrogen (N), Phosphorus (P) and
potassium (K) to stimulates leaf, root, and shoot growth (Abbas and Fares, 2009 and Zekri and Obreza, 2003).
Liquid fertilizers can be applied with different methods including spraying on leaves; or soil drench or injection to
either tree trunk or soil. Soil injection or deep root injection are the better distribution and rapid uptake of fertilizers
especially there are a scarce water (Lilly, 1993). While the primary and secondary roots can be found rather deep in the
soil, the tertiary and feeder roots will be relatively close to the soil surface and grow horizontally; this is where we must

Comparison Between Two Methods of Fertilizer Applications and Fertilizer Rates for Young Urban Tree
Ficus retusa, Linn. Implanted in Sandy Soil
358
concentrate applying fertilizer for the trees to benefit the most. Evans, (2000) said that do not assume that an
application of fertilizer will quickly remedy any problem which is encountered; in many cases it can make existing
problems worse. You should attempt to determine the specific cause in each situation and apply corrective measures.
Urban trees are form a continuously challenge, it's being expensive to plant and maintain new tree in urban location
so we should keep on the new planted trees. Transplanting new trees from the container grown nursery stock to
sidewalks and other paved areas lead to poor quality root system. Many criteria affect survival, growth rate and final
growth of trees as plant species and maintenance procedures. The objective of this study is to evaluate the growth of
Ficus retusa Linn. as young urban tree fertilized with different doses of NPK fertilizer at the ration of 3:1:2 either as
solid or liquid fertilizers by using the conventional surface application method compared to deep root fertilizer
application, in order to correct the poor growth problems in urban trees planted under high stress conditions.
MATERIALS AND METHODS
This work was carried out during the two successive growing seasons 2009/2010 and 2010/2011 at Suez Canal
University Hospital (SCUH) in Ismailia Governorate, Egypt. The aim of this work is to evaluate the growth of about 5
years old Ficus retusa, Linn. trees, cultivated in SCUH road as affected by different rates of NPK fertilize at the ratio
of 3:1:2 in either solid or liquid form by using the conventional surface application method and deep root fertilizer
application method, respectively.
F. retusa, Linn. trees were cultivated at (SCUH) roads and planted at 7.5 m distance along a roads and 0.75 m from
street border and irrigated every one week. The average height of trees was 225 cm. Generally, there was some
variability in the cultivated tress including tree height, canopy components and trunk diameter, so analyses of
(ANCOVA). The physical and chemical properties of soil samples taken from every hall of tree before beginning of the
experiment shown in Table (1) and the hydrogen ion concentration (pH) and electrical conductivity (EC) of soil samples
also taken from in the end of the experiment (After 24 month) as shown in the Table (2)
Methods of fertilizer applications and fertilizer rates (doses):
Solid fertilizers were placed into shallow hole around tree trunk , while liquid fertilizer were injected under pressure
into the root zone, where the expected feeder roots area, using 20L modified compression sprayer (up to 6 bar =88 psi)
NPK fertilizer at the ratio of 3:1:2 in two forms (solid and liquid) were prepared and applied in five different
combinations as 0-0-0 control, 38-13-25 low rate, 76-26-50 medium rate, 113-39-75 high rate, and 225-78-150 very
high rate g NPK tree-1
. Fertilizers were divided equally and added in March; June; September and December. Fertilizer
distributed in different places through the addition of successive doses (Kujawski and Ryan, 2011). Preparation of
solid and liquid fertilizer and cost at the Egyptian market for all treatments viewed in Table (3)
Data collected every three months during 24 months and analyzed according to Mazumdar and Majumder,
(2003). The vegetative and chemical Characteristics in this study are tree height of (cm), trunk diameter at 20 cm from
soil surface, trunk diameter at 110 cm (diameter at breast height or DBH), number of new shoot or branches per tree,
length of selected branch (cm), number of new leaves on the selected branch, pigments content, and leaf contents of N,
P and K% .
Statistical analysis:
A factorial experiment with six replicates was laid in a completely randomized design. An analysis of covariance
(ANCOVA) was used to adjust the means of the dependent variables (Observation,) for variation in the covariate (x).
Covariate (X) was measured before the experiment (Miller and Chapman, 2001). Statistical differences between the
means using LSD at 5% level of probability. Data were subjected to analyses by SPSS programs according to
McDonald, (2008).
RESULTS AND DISCUSSION
1-The vegetative characteristics
It is known that the multi-factor studies are important in that they more appropriately mimic the conditions found
outside of the experiment. The running of factorial experiments and the interpretations of the outputs responses of the
process to such combination is the essence of factorial experiment. It allows understanding which factors affect the
process most.
The main effects of fertilizer rates
Concerning the Table (4b), the main effects of fertilizer rates can be interpreted as the difference between the
average response of the studied five fertilizer rates (0-0-0, 38-13-25, 76-26-50, 113-39-75, and 225-78-150 g NPK tree-1
year-1
),the dependent variable, tree height and trunk diameter at 20cm did not respond to fertilization rates in both
seasons, but trunk diameter at110 cm was significantly changed in the second season. The high NPK rate (113-39-75 g
NPK tree-1
year-1
) significantly increased the trunk diameter at breast height 110 cm when compared to either of control
or the low rate (38-13-25 g NPK tree-1
year-1
).
On the other hand, data in Table (5b) demonstrates the number of new shoots; length of selected branch and number
of leaves as affected by fertilizer rates over the two seasons. The medium fertilizer rate (76-26-50 g NPK tree-1
year-1
)
significantly produced the greatest values of number of new shoot; length of selected branch and number of leaves in
both seasons. With regard to number of new shoot and number of leaves on the selected branch, the recorded values
surpassed in first season when compared to the second season.

359 Abo El-Soud et al., 2013
The main effects of fertilizer application methods
Generally, the differences between surface application and deep root fertilizer application methods did not attain the
statistical significance concerning the effect on plant height and trunk diameter (at 20 or 110 cm) in first season.
Meanwhile, in the second season, it was observed that superiority on the tree height and trunk diameter at 110 cm as a
result of the impact of surface application (Table 4b)
Over the two seasons, fertilizer application methods did not affect all studies traits significantly except the number
of new shoots per tree which was affected significantly in second season, this was recorded as result of using the surface
application method (Table 5b).
The interaction effects between fertilizer rates and fertilizer application methods There was no statistically significant differences for the interaction between the rates of fertilizers and fertilizer
application methods on all dependent variables displayed in the Table (4a) and (5a).For this reason, the reliance on the
interpretation of the previous results of the main impact acceptable.
2- The chemical characteristics
The main effects of fertilizer rates
Data in Table (6b) indicate that, the medium NPK rate (76-26-50 g NPK tree-1
year-1
) significantly increased the
studied pigments, chlorophyll a and b and the carotenoids when compared to either control or low rate (38-13-25 g NPK
tree-1
year-1
) but without significant differences with the high rate (113-39-75 g NPK tree-1
year-1
)
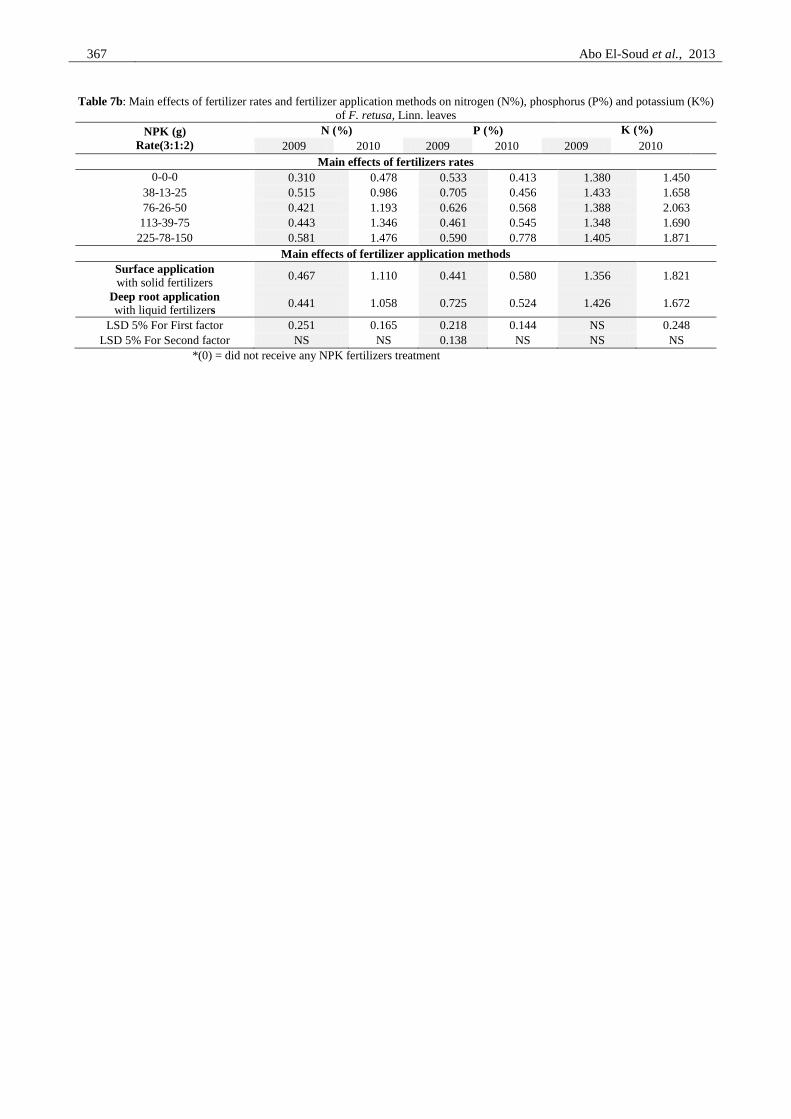
Results in table (7b) illustrate that the dependent variables such as N, P, and K % dry weight were differed as a
results of the NPK fertilizer rates but the main effects cannot be interpreted and give misleading findings because the
interaction effect showed a significant effect, however the recorded values of N, P, and K % surpassed in second season
when compared to the first season for the individual tree, that was true also in the control. It can be concluded that the
Addition continuous amounts of NPK fertilizers resulted in the increase of K and P contents and decrease the N content.
The lowest percentage values as N, P, and K percentages in the leaves were noticed by in the control level (not NPK
applied).
The main effects of fertilizer application methods
The differences between two fertilizer application methods (surface application and deep root application) did not
attain the statistical significance concerning the effect on chlorophyll b in the tow seasons and on carotenoids in second
season. On the other hand, deep root fertilization application method with liquid fertilizer was the best way to improve
pigments in leaves of F. retusa, Linn. trees where it showed in general superiority in the amount of chlorophyll a and b
and carotenoids in two seasons especially chlorophyll a (Table 6 b)
The statistical analysis revealed that the fertilizer application methods not had any significant effect on N, P, and
K% in both seasons, except P% in the first season with a significant increase when using deep root fertilizer application
method (table 7b)
The interaction effects between fertilizer rates and fertilizer application methods
Data in Table (6a) shows that the combinations of the five NPK rates and the tow fertilizer application method, were
significantly affected chlorophyll a and b and carotenoids content of F. retusa leaves during both seasons. In the case of
surface fertilizer application method, increasing NPK rates up to medium rate (76-26-50 g NPK tree-1
year-1
) over
control, increased chlorophyll a and b and carotenoids contents.. It was clearly that injection the liquid fertilizer into the
feeder root zone increased chlorophyll a and b and carotenoids contents as compared to using solid fertilizer.
Concerning the leaves contents of N, P, and K percentage, the interactions between fertilizer application methods
and NPK rates was significant during both seasons, except P% in second season and K% in first season. In general,
increasing NPK fertilizer rate form low rate (38-13-25g NPK tree-1
) to high (113-39-75 g NPK tree-1
year-1
) or very high
rate (225-78-150 g NPK tree-1
year-1
) induced significantly increases in the percentage of N, in the leaves of trees in two
seasons. This was true with two fertilizer application methods. The greatest N% (0.737 first season too) or P%, were
recorded by using deep root fertilizer application with very high rate (113-39-75 g NPK tree-1
year-1
).
Overall outlook shows that this is the best treatment (Table 7a).On the other hand, the control treatments that have
not been fertilized had the least percentages from the studied elements N, P and K, sometimes without significant
differences than other treatments.
DISCUSSION
In this study, many factors affect the health of young transplanting trees to sidewalks which may lead to high
mortality, it exposed to environmental stresses such as, poor aeration; moisture deficiency; toxic metals; low fertility;
poor and salinity of soil; girdling roots; soil bulk density and atmospheric condition, in addition, improper planting
techniques and maintenance procedures. (Day et al., 2010; Lu et al., 2010; Roman, 2006 and Ferrini et al., 2000).
Table (1) shows that the nutritionally poor soil in this study; in terms of the organic matter not exceed than 0.05% and
nitrogen 0.2 (mg kg-1
) These conditions as main reason that may alter the growth dynamics, morphology, and
physiology of roots and plant growth in first season. The chemical properties of a soil are easily altered by the addition
of fertilizers as shown in Table (2) as agreed by Bloomberg and White, (2013)
Trees at the Suez Canal University Hospital (SCUH) road as experiment field require an attention through
fertilization in terms of the methods used. This was checked through fertilization trees with complete fertilizers having a
ratio of 3:1:2 (Gill et al., 2011) and Kujawski and Ryan, (2011) with the amounts recommended by Da Luz et al.,
(2008) and Watkins, (1998) nitrogen is the nutrient that is depleted from the soil most quickly and needs regular
Comparison Between Two Methods of Fertilizer Applications and Fertilizer Rates for Young Urban Tree
Ficus retusa, Linn. Implanted in Sandy Soil
360
replenishment In balance with other nutrients .In general, the results indicated the trees did not respond to fertilization
as it is expected in growth measurements and chemical components (Tables 4,5,6 and 7). This was in parallel with the
results of researchers as Love-Myers et al., (2010); Bahat et al., (1999) and Perry and Hickman, (1998). Meanwhile,
other researchers as Sovu et al., (2012); Struve and Rose (1998); Rose, (1999) and Radwan et al., (1991) found that
fertilization street trees succeeded to obtain good growth.
The interaction effects of NPK fertilizer rates with fertilizer application methods were significant on chlorophyll a;
chlorophyll b; carotenoids (mg g-1
fresh wt) and N, P, and K (% dry wt) indicating that different NPK rates acted
differently under tow fertilizer application methods. The highest chlorophyll a; was recorded by applying low or
medium rate (38-13-25and76-26-50 g NPK tree-1years-1 respectively) which seems to be most suitable NPK rates
under environmental stresses and the soil conditions (Table 6). Similar trend was obtained by Cassman et al. (2002)
who reported that the maximum NPK fertilizer recovery was obtained by applying lower NPK fertilizer rates under
diverse soil conditions, while the lowest was recorded with the higher NPK fertilizer dose. This implies that applying
NPK fertilizer in higher rates might have resulted in more nutrient losses. Rehman et al. (2011) reported that yield of
the harvested portion of the crop per unit of fertilizer applied can be improved by providing a better environment to
growing roots, that is, deep root fertilization with pressure rather than surface fertilizer application method.
On the other hand, the Number of new shoot per tree of F. retusa Linn. increased linearly with increasing NPK rates
until medium rate as critical point (Table 5b). Rates of nitrogen application should also be adjusted according to levels
of soil organic matter. Applying high rates of nitrogen to soils low in organic matter will accelerate depletion of the
organic matter and in the long run reduce the fertility and structural integrity of the soil. Therefore, if the annual N
application rate was more than enough to maintain tree growth and high leaf N concentrations, it caused higher amount
of N removal by the crop and a greater impact on N budgets (Boughalleb, et al.,2011).
It is clear from the data (Tables 6b or 7b) that deep root fertilizer application method was significantly higher with
surface fertilizer application method, regarding to pigments and leaf mineral contents. Deep root fertilizer application
method can make a quick improvement in the appearance of trees; a deficiency of nutrients, and aeration of compact
soil with the economic cost and effort. Also, these response can be due to the acidic residual effects of the used
fertilizers as that easy decreases soil pH at the root zone and then young trees could be achieved their requirements from
the nutrient supply (Table 2and 3), this confirmed by (Follet et al., 1981).Also it is economical when compared to the
cost of same fertilizer dose price (Table 3)
CONCLUSIONS
It can be concluded from the economical point of view that under environmental stresses conditions with sandy
compact soil or pavement area bad cultivating holes soil, the most suitable fertilizer application method for the young
urban street tree Ficus retusa, Linn. is deep root fertilizer application method under pressure (up to 6 bar =88 psi), The
optimum fertilizer rates are low or medium rate (38-13-25 and 76-26-50 g NPK tree-1
years-1
respectively ) because it is
quick, easy, and also leads to rapid uptake of nutrients. Results confirmed that fertilization is a useful used mean
to improve growth, but may cause stress to trees if provided without adequate irrigation or excessive rates
It is recommended that in future research to studied types of slow-release forms of liquid injection fertilizers and
adequate irrigation in the country in order to develop an economic method.
REFERENCES
Abbas, F. and Fares,A. (2009). Best management practices in citrus production. Tree and
Forestry Science and Biotechnology. 3: 1-11
Abo-Shanab, A.S.H. (2011). Distribution of Citrus mealybug, Planococcus citri (Risso) (Hemiptera: Pseudococcidae)
Within Ficus tree Ficus microcarpa var. nitida (King) (family : Moraceae) J. Agric. Res. Kafer El-Sheikh Univ.,
37(3): 458-467.
Backheet, E.Y.; Ahmed, A.S. and Sayed, H.M. (2001). Phytochemical study of the constituents of the leaves of Ficus
infectoria Roxb. Bull.Pharm.Sci, Assiut Univ., 24(1): 21-27.
Bahat, N.R.; Taha, F.K.; Al-Manaie, H. and Al-Zalzaleh, M. (1999). Response of twenty-four landscape plant species
grown under the coastal arid climate of Kuwait to irrigation and fertilizer treatment. Agric. Res. Center KSA
univ. 82:5 –23.
Beedlow, P.A.; Tingey, D.T.; Phillips, D.L.; Hogsett, W.E and Olszyk, D.M., (2004). Rising
atmospheric CO2 and carbon sequestration in forests. Frontiers in Ecology and the Environment 2:315–322.
Bloniarz, D.V. (1995) Street Trees, Overhead Utility Distribution, and Physical Infrastructure: Design Implications,
Maintenance Costs and Proposed Alternatives. Amherst: University of Massachusetts.
Bloomberg, M.R. and White V.M. (2013). Tree Planting Standards. NYC Parks .Online.
www.nycgovparks.org/pagefiles/53/Tree-Planting-Standards.pdf
Boughalleb, F.; Mahmoud M. and Hajlaoui, H. (2011).Response of young citrus trees to NPK fertilization under
greenhouse and field conditions. Agricultural Journal 6(3): 66-73
Cassman, K.G.; Dobermann, A. and Walters, D. T. (2002). Agroecosystems, nitrogen use efficiency and nitrogen
management. AMBIO.331:132-140.
Clement, D. L. and Malinoski, M. K. (2011) Homeowner Landscape Series: Common Cultural and Environmental
Problems in Landscapes. University of Maryland Extension fact sheet. Online. HG 201

361 Abo El-Soud et al., 2013
http://extension.umd.edu/sites/default/files/_images/programs/hgic/Publications/HG201%20Homeowner%20Lan
dscape%20Series%20Common%20Cultural%20and%20Environmental%20Problems%20in%20Landscape.pdf
Coder, K.D. (1997). Tree Nutrition Series: Nitrogen Prescriptions for Trees (Fact sheet). University of Georgia
Extension Forest Resources FOR97-16. Athens, GA. p.9
Da Luz P.B.; Patr´ıcia Paiva D. de O. and Tavares A.R. (2008). Effect of foliar and substrate fertilization on lady palm
seedling growth and development. J. of Plant Nut. 31:1311-1318.
Day, S.D.; Wiseman, P.E.; Dickinson, S.B. and Harris, J. R. (2010). Tree Root Ecology in the Urban Environment and
Implications for a Sustainable Rhizosphere. Arboriculture and Urban Forestry. 36(5):193–205.
El-Hadidi, M.N and Boulos, L. (1989).The Street Trees in Egypt. Amer Univ in Press, Cairom Egypt (3):337-349.
Evans, E., (2000). A Gardener's Guide to Fertilizing Trees and Shrubs. North Carolina Cooperative Extension Service
North Carolina Cooperative Extension Service http://www.ces.ncsu.edu/depts/hort/consumer/factsheets/trees-
new/text/fertilizing.html
Ferrini, F.; Nicese, F.P.; Mancuso, S. and Giuntoli, A. (2000). Effect of nursery production method and planting
techniques on tree establishment in urban sites: preliminary results. J. of Arboriculture. 26(5): 281-284.
Follet, R.H.; Murphy, L.S.; and Donahue, R.L. (1981). Fertilizers and Soil Amendments. Prentice-Hall. Engelwood
Cliffs, pp. 393-422.
Gill, S.; Shrewsbury, P. and Davidson, J. (2011). Japanese Maple Scale (Lopholeucaspis japonica): A Pest of Nursery
and Landscape Trees and Shrubs. University of Maryland Extension fact sheet. Online.
http://ipmnet.umd.edu/landscape/docs/JapaneseMapleScale-UMD.pdf.
Jeong, S.; Trotochaud, A. E. and Clark, S. E.(1999). The Arabidopsis CLAVATA2 gene encodes a receptor-like protein
required for the stability of the CLAVATA1 receptor-like kinase. Plant Cell 11, 1925-1934.
Johnson, E. A.; Harbison, D. and Millard, S. (2006). Lush and efficient Landscape Gardening in the Coachella Valley
Ironwood press, Tucson, Arizona. ISBN:096282366X.
Jozsa, L. A. and Brix, H., (1989). The effects of fertilization and thinning on wood quality of a 24-year-old Douglas fir
stand. Canadian Journal of Forest Research 19(9):1137-1145
Kujawski, R. and Ryan, D. (2011). Fertilizing Trees and Shrubs. College of Natural Sciences, University of
Massachusetts Amherst, Center for Agriculture. Online http://extension.umass.edu/landscape/fact-
sheets/fertilizing-trees-and-shrubs
Lilly, S.J. (1993). Tree nutrition and fertilization. Arborists' certification study guide. Savoy, Illinois: International
Society of Arboriculture.
Love-Myers, K.R.; Alexander, C.; Schimleck, L.R.; Dougherty, P.M. and Daniels, R.F. (2010). The Effects of Irrigation
and Fertilization on Specific Gravity of Loblolly Pine. Forest Science, 56 (5):484-493.
Lu, J.W.T.; Svendsen, E.S.; Campbell, L.K.; Greenfeld, J.; Braden, J. K.L. and King, N. F.R. (2010). Biological, social,
and urban design factors affecting young street tree mortality in New York City. Cities and the Environment-
Online. 3(1):1-13. http://escholarship.bc.edu/cate/vol3/iss1/5.
Mazumdar, B. C. and Majumder, K. (2003). Methods of Physiochemical Analysis of Fruits. Daya Publishing House
Delhi, India.
McDonald, J (2008). Handbook of Biological Statistics. Sparky House Publishing, Baltimore, Maryland. Online edition
http://udel.edu/~mcdonald/
Miller, G. A., and Chapman, J. P. (2001). Misunderstanding analysis of covariance. Journal of Abnormal Psychology,
110, 40-48
Padhy, P. K. and Varshney, C. K.: (2005). Emission of volatile organic compounds (VOC) from tropical plant species
in India, Chemosphere, 59: 1643–1653.
Perry, E. and Hickman, G.W.(1998). Correlating foliar nitrogen levels with growth in two landscape tree species.
Journal of Arboriculture 24(3):149–153
Radwan, M.A.; Shumway, J.S.; DeBell, D.S. and Kraft, J.M. (1991). Variance in response of pole-sized trees and
seedlings of Douglas-fir and western hemlock to nitrogen and phosphorus fertilizers. Canadian Journal of Forest
Resources 21(10):1431-1438.
Rehman, A.; Saleem, M. F.; Safdar, M.E.; Hussain, S. and Akhtar, N. (2011). Grain quality, nutrient use efficiency and
bioeconomics of maize under different sowing methods and NPK levels., Chilean J. Agric., Res., 71 (4): 586-593
Riffle, R.L. (1998). The Tropical Look. An Encyclopedia of Dramatic Landscape Plants Timber Press, Inc., Portland,
OR.
Roman, L. (2006). Trends in street tree survival, Philadelphia, PA. Master’s Thesis. University of Pennsylvania,
Department of Earth and Environmental Science. p.31. http://repository.upenn.edu/mes_capstones/4.
Rose, M.A. (1999). Nutrient use patterns in woody perennials: Implications for increasing fertilizer efficiency in field-
grown and landscape ornamentals. Hort. Technology. 9:613–617.
Roy, R. K. and Datta, S. K. (2004). Collections and ex situ conservation of plant species of moraceae in nbri botanic
garden in lucknow (india). Bulletin of Botanical Gardens, 13: 215–218
Singh, S.K and Rao, D.N. (1983). Evaluation of the plants for their tolerance to air pollution. In: Proceeding of
Symposium on Air Pollution Control, Vol 1. Indian Association of Air Pollution Control, New Delhi, pp 218-
224.
Singh, SS. (1991). Principles and Practices of Agronomy. (3d) Kayla Publishers, New Delhi
Comparison Between Two Methods of Fertilizer Applications and Fertilizer Rates for Young Urban Tree
Ficus retusa, Linn. Implanted in Sandy Soil
362
Smith, F.P.H., Elkhatib, A.A. and Taylor, G. (2004). Capture of particulate pollution by trees: a comparison of species
typical of semi-arid areas (Ficus nitida and Eucalyptus globules) with European and North American species.
Water, Air and soil pollution. 155(1-4): 173 – 187.
Smith, R.C.; DeCock, D. and Hill, R. (1992). Fertilizing trees. North Dakota State University Extension Service
Publication H-1035.
Sovu, T.M.; Savadago, P. and Odén, P.C. (2012). Facilitation of forest landscape restoration on abandoned swidden
fallows in Laos using mixed-species planting and biochar application. Silva Fennica 46(1): 39–51.
Struve, D.K. and Rose, M.A. (1998). Early-season fertilization reduces fertilizer use without reducing plant growth. J.
Enviro. Hort. 16: 47-51.
Van de Werken, H. (1984). Fertilization practices as they influence the growth rate of young shade trees. J. Environ.
Hort. 2(2):64-69.
Watkins, J.R. (1998). Fertilization and Woody Plant Nutrition in the Context of the Urban Forest. M.Sc. in Forestry.
Faculty of the Virginia Polytechnic Institute and State University, USA.
Zekri,M. and Obreza, T.A. (2003). Plant Nutrients for Citrus Trees. Extension Service Fact Sheet SL 200, Florida
Cooperative Extension Service, Institute of Food and Agriculture Sciences. University of Florida Gainesville.
Zunoliza, A., Khalid, S.; Zhari, I.; Rasadah, M.A.; Mazura, P.; Fadzureena, J. and Rohana, S. (2009). Evaluation of
extracts of leaf of three Ficus deltoidea varieties for antioxidant activities and secondary metabolites.
Pharmacognosy Res., 4: 216-223.
كشجرة مدن حديثه الزراعة تنداللتسميد و بمعدالت سمادية مختلفة لشجرة الفيكس نمقارنة بين طريقتي
رض رمليةفي أ
إسماعيل مغازي ومحمود مختار حفني بو السعود وعيد محمد قريش وإيمانأسالم حسن إ
22544قسم البساتين كلية الزراعة جامعة قناة السويس باإلسماعيلية
كسيدأتلفة من مخلوط سمادي يحتوي علي النيتروجين و ثاني بمعدالت مخ يدهاسمتب وذلكس نتدا كشجرة مدن ، م نمو الفيكيي هذه الدراسة تم تقيف
للجذور ستخدام التسميد السطحي و مقارنته بالتسميد العميقباو سائلة أسمدة صلبة في صورة أ 2: 1: 3بالنسبة السمادية البوتاسيوم أكسيدو ثاني الفسفور
تم استخدام . ، ا لألشجارجهاد عاليسيئة تشكل إالعمر والمزروعة تحت ظروف ةشجار صغيرمشاكل ضعف نمو األ بهدف محاولة معالجةضغط و تحت
.لكل موسم زراعي علي حده لوجود اختالفات في نباتات التجربة حليل التغايرطريقة ت
التسميد طريقةالمغذية، كانت مساوية و في بعض األحيان أكثر في فعاليتها من استخدام الجذورأظهرت النتائج أن حقن األسمدة السائلة بضغط في منطقة
ب و والكلوروفيل أ الكلوروفيلوراق ،ل الفرع المختار ،عدد األقطر الجذع ،طوبصفات ، و ذلك فيما يتعلق سمدة صلبةأ او المستخدم فيهالسطحي
ةوصديق اقتصاديةوباإلضافة إلى ذلك فإن هذه الطريقة من التسميد ، % و البوتاسيوم الفسفوروراق من كال من النيتروجين و ات و محتوي األيدكاروتينال
. للبيئة
جم 67 و البوتاسيوم أ أكسيدجم ثاني 22و الفسفور أكسيدثاني جم 13و نيتروجين جم33متوسط والمحتوي عليو منخفض أسماد بمعدل مخلوط ال
حيث النتائج بصرف النظر عن طريقةفضل من األ اكانعلي التوالي البوتاسيوم للشجرة لكل سنة أكسيدثاني جم 25و الفسفور أكسيدثاني جم 27و نيتروجين
.لتسميد المستخدمة في هذه الدراسةا

363 Abo El-Soud et al., 2013
Table 1: The physical and chemical properties of the 0–30 cm soil layer before fertilizer application practices
Physical and Chemical properties
Sand (%) Silt (%) Clay (%) Textural class EC dSm-1
* pH Total organic matter %
88.2 9.4 2.4 Sand 2.1 8.6 0.05
Macronutrients (mg kg-1
) Cations (meq/l): Anions (meq/l):
Available
N
Available
P
Available
K Ca
2+ Mg
2+ Na
+ K
+ Cl
-
HCO3-
+ CO32-
SO4
2-
0.2 3 5 5.7 5.3 8.1 1.2 7.5 4.8 8.3
*Average of first year (60 soil samples) Electric conductivity= EC
Table 2: The hydrogen ion concentration (pH) and electrical conductivity (EC) of soil samples taken from different
treatment in the end of experiment (After 24 months).
Ch
ara
cter
s
Soil samples
surface application with solid fertilizers
NPK g tree-1
year-1
deep root fertilization with liquid fertilizers
NPK g tree-1
year-1
Control 38-13-
25
76-26-
50
113-
39-75
225-78-
150 Control
38-13-
25
76-26-
50
113-39-
75
225-78-
150
EC
dSm-1
14.55 12.17 12.37 14.27 25.82 14.64 7.60 7.69 9.01 16.19
pH 8.10 7.76 7.51 7.59 7.05 8.27 6.41 5.65 5.88 2.01
Fertilizer sample (dissolved in 5 L water)
EC 10.61 18.8 11.3 12.54 23.4 10.61 7.33 13.19 18.68 30.05
pH 7.5 6.61 6.17 5.97 4.13 7.5 1.84 1.57 1.35 1.01
Average of 3 sample taken from near fertilizer addition place
Table 3: List of factors and levels and their treatment combinations and cost of fertilizer.
Fertilizer
application
NPK rate
3:1:2
g/tree
NH4NO3
(33.5%N)
G
Ca(H2PO4)2
(15.5% P2O5)
g
K2SO4
(50%K2O)
G
Amount of
fertilizer≈*
(g tree-1
year-1
)
Cost
LE
Surface
application
with solid
fertilizer
0-0-0 0 0) 0) 0 0
38-13-25 113.5. 83.25 50) 250 0.65
76-26-50 227 166.5) 100) 500 1.30
113-39-75 340.5 249.8) 150) 750 1.95
225-78-150 681 499.5 300) 1500 3.9
HNO3
(60%N)
ml
H3PO4
(55% P2O5)
ml
KOH*
(76% K2O)
g
Amount of
fertilizer≈
(ml tree-1
year-1
)
Cost
LE
Deep root
application with liquid
fertilizer
0-0-0 0 0 0 0 0
38-13-25 17.4 4.5 3.3 25 0.50
76-26-50 34.8 9.9 6.5 50 1.0
113-39-75 51.7 13.5 9.8 75 1.5
225-78-150 102.9 27.0 19.6 150 3.0
* 4 doses/year – every dose dissolved in 5 L tap water % phosphorus (as P2O5) and % potassium (as K2O)

Comparison Between Two Methods of Fertilizer Applications and Fertilizer Rates for Young Urban Tree
Ficus retusa, Linn. Implanted in Sandy Soil
364
Table 4a: Interaction effects between fertilizer rates and fertilizer application methods on tree height, trunk diameter at 20 cm and trunk diameter at 110 cm of F. retusa, Linn. trees
(using analysis of covariance ANCOVA)
Fertilizer
application NPK (g)
Rate(3:1:2)
Tree height (cm) Trunk diameter at 20cm (mm) Trunk diameter at 110 cm (mm) 2009 2010 2009 2010 2009 2010
Original Adjusted Original Adjusted Original Adjusted Original Adjusted Original Adjusted Original Adjusted
Surface
application with
solid fertilizers
0-0-0 261 248 275 264 50.5 53.00 50.9 53.4 39.1 41.3 39.5 41.7 38-13-25 273 249 286 264 56.9 53.00 59.1 55.3 42.9 41.4 43.4 42.0
76-26-50 276 254 290 266 54.5 53.20 55.3 53.8 39.6 41.4 40.5 42.3 113-39-75 234 247 243 257 48.4 53.10 49.5 54.1 38.3 41.4 40.4 43.3
225-78-150 235 248 253 266 56.2 53.10 57.1 54.0 44.4 41.5 45.5 42.5
Deep root
application with
liquid fertilizers
0-0-0 258 250 262 254 63.4 53.00 63.8 53.7 47.4 41.4 47.6 41.7 38-13-25 266 251 271 257 50.2 53.10 50.9 53.7 39.2 41.4 39.7 41.8
76-26-50 235 252 245 258 49.3 53.10 50.5 54.3 38.3 41.3 38.9 41.9 113-39-75 241 255 247 255 49.8 53.10 50.9 54.1 39.1 41.4 39.7 41.9
225-78-150 219 248 230 258 51.8 53.30 52.7 54.0 45.6 41.4 46.1 42
LSD 5% 9.54 NS 12.385 NS 0.237 NS 1.546 NS 0.158 NS 0.904 NS *(0) = did not receive any NPK fertilizers treatment
Table 4b: Main effects of fertilizer rates and fertilizer application methods on tree height, trunk diameter at 20 cm and trunk diameter at 110 cm of Ficus retusa, Linn. trees (using
analysis of covariance ANCOVA)
NPK
(g)
Rate(3:1:2)
Tree height
(cm)
Trunk diameter at 20cm
(mm)
Trunk diameter at 110 cm
(mm)
2009 2010 2009 2010 2009 2010
Original Adjusted Original Adjusted Original Adjusted Original Adjusted Original Adjusted Original Adjusted
Main effects of fertilizers rates
0-0-0 260 248 269 259 56.9 53.0 57.4 53.5 43.3 41.4 43.5 41.7
38-13-25 269 249 279 261 53.6 53.1 54.9 54.5 41.1 41.41 41.6 41.9
76-26-50 255 252 267 262 51.9 53.1 52.9 54.1 39.0 41.39 39.8 42.1
113-39-75 237 251 245 256 49.1 53.1 50.2 54.1 38.8 41.45 40.1 42.6
225-78-150 227 248 241 262 54.0 53.2 54.9 54.0 45.0 41.47 45.8 42.3
Main effects of fertilizer application methods
Surface application
with solid fertilizers 256 249 269 264 53.3 53.1 54.3 54.1 40.9 41.44 41.8 42.4
Deep root application with liquid fertilizers
244 251 251 257 52.9 53.1 53.8 54.0 42.0 41.41 42.2 41.9
LSD 5% for First factor 6.74 NS 8.758 NS 0.167 NS 1.099 NS 0.111 NS
0.6
LSD 5% for Second factor 4.26 NS 5.539 5 0.106 NS 1.093 NS 0.071 NS 0.40 0.4
*(0) = did not receive any NPK fertilizers treatment

365 Abo El-Soud et al., 2013
Table 5a: Interaction effects between fertilizer rates and fertilizer application methods on number of shoots tree-1
, length of selected branch and number of leaves on the selected
branch of F. retusa, Linn. trees (using analysis of covariance ANCOVA)
Fertilizer
application
NPK (g)
Rate(3:1:2)
Number of new shoots per tree Length of selected branch (cm) Number of Leaves on the selected
branch
2009 2010 2009 2010 2009 2010 Original Adjusted Original Adjusted Original Adjusted Original Adjusted Original Adjusted Original Adjusted
Surface application
with solid fertilizers
0-0-0 40.8 54.2 20.5 21.6 43.6 43.0 45.5 44.9 41.0 41.0 50.6 46.8
38-13-25 59.8 57.0 28.9 28.7 48.4 48.3 48.3 48.7 60.0 60.0 50.6 50.2
76-26-50 59.3 68.6 50.7 50.5 45.0 44.4 62.4 62.1 75.0 75.0 71.6 73.8
113-39-75 65.3 60.8 29.0 28.3 42.5 41.9 56.5 55.7 70.1 70.2 102 104
225-78-150 59.5 64.0 24.5 24.3 50.5 50.2 50.1 50.8 80.8 80.7 45.3 48.6
Deep root
application with
liquid fertilizers
0-0-0 51.1 47.6 12.5 13.0 45.0 45.2 47.0 46.7 23.8 23.7 57.5 50.6
38-13-25 55.3 68.7 28.5 28.6 41.5 41.0 45.6 44.6 46.8 47.0 47.8 45.0
76-26-50 58.1 61.4 33.7 33.6 56.8 56.9 54.6 56.6 97.0 96.5 70.1 76.3
113-39-75 63.8 52.7 19.0 18.5 50.3 50.1 46.3 47.1 84.0 84.2 41.1 44.9
225-78-150 57.5 35.5 14.7 14.7 41.6 44.0 66.6 65.6 46.3 46.1 46.6 43.7
LSD 5% 17.88 NS 14.35 NS 13.159 NS 12.11 NS 40.708 NS 49.14 NS
Trees were irrigated every one week - NPK fertilizers were applied at 4 doses/year – Every dose dissolved in 5 L tap water
*(0) = did not receive any NPK fertilizers treatment
Table 5b: Main Effects of fertilizer rates and fertilizer application methods on number of shoots, length of selected branch and number of leaves on the selected branch of F.
retusa, Linn. trees (using analysis of covariance ANCOVA)
NPK
(g)
Rate(3:1:2)
Number of new shoots per tree
Length of selected branch
(cm)
Number of Leaves
on the selected branch
2009 2010 2009 2010 2009 2010
Original Adjusted Original Adjusted Original Adjusted Original Adjusted Original Adjusted Original Adjusted
Main effects of fertilizers rates
0-0-0 46.0 50.9 16.5 17.3 44.3 44.1 46.2 45.8 32.4 32.4 54.0 48.7
38-13-25 57.6 62.8 28.7 28.6 44.9 44.6 47.0 46.6 53.4 53.5 49.2 47.6
76-26-50 58.8 65.0 42.3 42.1 50.9 50.7 58.5 59.3 86.0 85.7 70.9 75.1
113-39-75 64.6 56.7 24.0 23.4 46.4 46.0 51.5 51.4 77.0 77.2 72.0 74.5
225-78-150 58.5 49.8 19.6 19.5 46.1 47.1 58.4 58.2 63.5 63.4 46.0 46.1
Main effects of fertilizer application methods
Surface application with solid fertilizers
56.9 60.9 30.7 30.7 46.0 45.6 52.6 52.5 65.4 65.4 64.2 64.7
Deep root application with liquid fertilizers
57.2 53.2 21.7 21.7 47.0 47.5 52.1 52.1 59.6 59.5 52.7 52.1
LSD 5% for First factor 12.646 12.6 10.145 10.1 9.305 NS 8.56 8.5 28.784 28.7 34.7 NS
LSD 5% for Second factor 7.998 NS 6.417 6.417 5.885 NS 5.41 NS 18.205 NS 21.97 NS
Trees were irrigated every one week - NPK fertilizers were applied at 4 doses/year – Every dose dissolved in 5 L tap water
*(0) = did not receive any NPK fertilizers treatment

Comparison Between Two Methods of Fertilizer Applications and Fertilizer Rates for Young Urban Tree
Ficus retusa, Linn. Implanted in Sandy Soil
366
Table 6a: Interaction effects between fertilizer rates and fertilizer application methods on chlorophyll a, chlorophyll b,
and carotenoids of F. retusa, Linn. leaves
Fertilizer
application
NPK (g)
Rate(3:1:2)
Chlorophyll a
(mg/g FW)
Chlorophyll b
(mg/g FW)
Carotenoids
(mg/g FW)
2009 2010 2009 2010 2009 2010
Surface
application
with solid
fertilizers
0-0-0 0.966 1.084 0.493 0.486 1.739 1.539
38-13-25 0.895 1.132 0.502 0.846 1.707 1.470
76-26-50 1.663 1.536 0.738 0.539 1.813 1.715
113-39-75 1.240 1.400 0.452 0.505 1.632 1.544
225-78-150 0.641 0.771 0.707 0.433 1.860 1.381
Deep root
application with liquid
fertilizers
0-0-0 1.627 1.572 0.504 0.594 1.741 1.447
38-13-25 1.608 1.786 0.744 0.590 1.933 1.538
76-26-50 1.730 1.461 0.594 0.571 1.912 1.383
113-39-75 1.423 1.626 0.684 0.489 1.795 1.308
225-78-150 1.357 1.582 0.527 0.475 1.798 1.529
0.165 0.293 0.230 0.254 0.181 Ns
F.W.=fresh weight
*(0) = did not receive any NPK fertilizers treatment
Table 6b: Main effects of fertilizer rates and fertilizer application methods on chlorophyll a, chlorophyll b, and
carotenoids of F. retusa, Linn. leaves
Table 7a: Interaction effects between fertilizer rates and fertilizer application methods on nitrogen (N %), phosphorus
(P %) and potassium (K %) of F. retusa, Linn. Leaves
Fertilizer
application
NPK (g)
Rate(3:1:2)
N (%) P (%) K (%)
2009 2010 2009 2010 2009 2010
Surface
application with
solid fertilizers
0-0-0 0.400 0.495 0.407 0.370 1.270 1.390
38-13-25 0.737 1.090 0.616 0.468 1.267 1.600
76-26-50 0.419 1.275 0.432 0.610 1.333 2.130
113-39-75 0.322 1.297 0.531 0.583 1.430 1.733
225-78-150 0.463 1.393 0.224 0.870 1.480 2.253
Deep root
application with
liquid fertilizers
0-0-0 0.221 0.460 0.660 0.457 1.507 1.510
38-13-25 0.297 0.882 0.791 0.446 1.600 1.717
76-26-50 0.426 1.108 0.817 0.525 1.427 1.995
113-39-75 0.566 1.397 0.396 0.507 1.267 1.647
225-78-150 0.699 1.440 0.959 0.687 1.330 1.490
LSD 5% 0.304 0.455 0.112 NS NS 1.391
*(0) = did not receive any NPK fertilizers treatment
NPK
(g)
Rate(3:1:2)
Chlorophyll a
(mg/ g FW)
Chlorophyll b
(mg/ g FW)
Carotenoids
(mg/ g FW)
2009 2010 2009 2010 2009 2010
Main effects of fertilizers rates
0-0-0 1.295 1.328 0.500 0.543 1.741 1.491
38-13-25 1.251 1.456 0.623 0.718 1.820 1.506
76-26-50 1.698 1.498 0.668 0.555 1.860 1.550
113-39-75 1.331 1.515 0.658 0.495 1.715 1.428
225-78-150 1.001 1.178 0.618 0.453 1.830 1.458
Main effects of fertilizer application methods
Surface application
with solid fertilizers 1.082 1.184 0.580 0.562 1.750 1.532
Deep root application with liquid fertilizers
1.548 1.607 0.611 0.543 1.836 1.442
LSD 5% For First factor 0.116 0.225 NS NS 0.127 NS
LSD 5% For Second factor 0.074 0.142 NS NS 0.081 NS
*(0) = did not receive any NPK fertilizers treatment
367 Abo El-Soud et al., 2013
Table 7b: Main effects of fertilizer rates and fertilizer application methods on nitrogen (N%), phosphorus (P%) and potassium (K%)
of F. retusa, Linn. leaves
NPK (g)
Rate(3:1:2)
N (%) P (%) K (%)
2009 2010 2009 2010 2009 2010
Main effects of fertilizers rates
0-0-0 0.310 0.478 0.533 0.413 1.380 1.450
38-13-25 0.515 0.986 0.705 0.456 1.433 1.658
76-26-50 0.421 1.193 0.626 0.568 1.388 2.063
113-39-75 0.443 1.346 0.461 0.545 1.348 1.690
225-78-150 0.581 1.476 0.590 0.778 1.405 1.871
Main effects of fertilizer application methods
Surface application
with solid fertilizers 0.467 1.110 0.441 0.580 1.356 1.821
Deep root application with liquid fertilizers
0.441 1.058 0.725 0.524 1.426 1.672
LSD 5% For First factor 0.251 0.165 0.218 0.144 NS 0.248
LSD 5% For Second factor NS NS 0.138 NS NS NS
*(0) = did not receive any NPK fertilizers treatment
Copyright © 2022 FDOKUMEN